Table of Contents

UNITED STATES
SECURITIES AND EXCHANGE COMMISSION
Washington, D.C. 20549
FORM N-CSR
CERTIFIED SHAREHOLDER REPORT OF REGISTERED
MANAGEMENT INVESTMENT COMPANIES
Investment Company Act file number: 811-09253
Wells Fargo Funds Trust
(Exact name of registrant as specified in charter)
525 Market St., San Francisco, CA 94105
(Address of principal executive offices) (Zip code)
Catherine Kennedy
Wells Fargo Funds Management, LLC
525 Market St., San Francisco, CA 94105
(Name and address of agent for service)
Registrant’s telephone number, including area code: 800-222-8222
Date of fiscal year end: October 31
Registrant is making a filing for 7 of its series:
Wells Fargo Diversified International Fund, Wells Fargo Emerging Markets Equity Fund, Wells Fargo Emerging Markets Equity Income Fund, Wells Fargo Global Small Cap Fund, Wells Fargo International Equity Fund, Wells Fargo Intrinsic World Equity Fund, and Wells Fargo Special International Small Cap Fund.
Date of reporting period: October 31, 2020
Table of Contents
ITEM 1. REPORT TO STOCKHOLDERS
Table of Contents

Annual Report
October 31, 2020
Wells Fargo
Diversified International Fund
Beginning on January 1, 2021, as permitted by new regulations adopted by the Securities and Exchange Commission, paper copies of the Wells Fargo Funds’ annual and semi-annual shareholder reports issued after this date will no longer be sent by mail, unless you specifically request paper copies of the reports. Instead, the reports will be made available on the Funds’ website, and you will be notified by mail each time a report is posted and provided with a website address to access the report.
If you already elected to receive shareholder reports electronically, you will not be affected by this change and you need not take any action. You may elect to receive shareholder reports and other communications from the Fund electronically at any time by contacting your financial intermediary (such as a broker-dealer or bank) or, if you are a direct investor, by calling 1-800-222-8222 or by enrolling at wellsfargo.com/advantagedelivery.
You may elect to receive all future reports in paper free of charge. If you invest through a financial intermediary, you can contact your financial intermediary to request that you continue to receive paper copies of your shareholder reports; if you invest directly with the Fund, you can call 1-800-222-8222. Your election to receive reports in paper will apply to all Wells Fargo Funds held in your account with your financial intermediary or, if you are a direct investor, to all Wells Fargo Funds that you hold.
Table of Contents
|
Reduce clutter. Save trees. |
Sign up for electronic delivery of prospectuses and shareholder reports at wellsfargo.com/ |
The views expressed and any forward-looking statements are as of October 31, 2020, unless otherwise noted, and are those of the Fund’s portfolio managers and/or Wells Fargo Asset Management. Discussions of individual securities, or the markets generally, or any Wells Fargo Fund are not intended as individual recommendations. Future events or results may vary significantly from those expressed in any forward-looking statements. The views expressed are subject to change at any time in response to changing circumstances in the market. Wells Fargo Asset Management and the Fund disclaim any obligation to publicly update or revise any views expressed or forward-looking statements.
INVESTMENT PRODUCTS: NOT FDIC INSURED ◾ NO BANK GUARANTEE ◾ MAY LOSE VALUE
Wells Fargo Diversified International Fund | 1
Table of Contents
Letter to shareholders (unaudited)

Andrew Owen
President
Wells Fargo Funds
Dear Shareholder:
We are pleased to offer you this annual report for the Wells Fargo Diversified International Fund for the 12-month period that ended October 31, 2020. Global stock markets saw earlier gains erased in March as governments around the world took unprecedented measures, attempting to stop the spread of COVID-19 at the expense of short-term economic output. However, markets rallied strongly from April through period-end to offset those short-term losses as central banks bolstered capital markets and confidence.
For the 12-month period, equities had generally positive total returns despite intense volatility in March. Non-U.S. developed market equities had weaker performance than emerging market and U.S. stocks. While gains from fixed-income securities were positive, they were more modest than equities. For the period, U.S. stocks, based on the S&P 500 Index,1 gained 9.71%. International stocks, as measured by the MSCI ACWI ex USA Index (Net),2 returned -2.61%, while the MSCI EM Index (Net)3 had stronger performance, with a 8.25% gain. Among bond indices, the Bloomberg Barclays U.S. Aggregate Bond Index4 returned 6.19%, the Bloomberg Barclays Global Aggregate ex-USD Index5 gained 4.96%, and the Bloomberg Barclays Municipal Bond Index6 returned 3.59% while the ICE BofA U.S. High Yield Index7 returned 2.54%.
The period began with buoyed investor confidence.
Equity markets rallied in November despite ongoing geopolitical risks. Hopes for a U.S.-China trade deal buoyed investor confidence. U.S. business sentiment improved slightly and manufacturing and services activity picked up. While consumer confidence and purchasing managers’ activity rose in the eurozone, China reported weakening manufacturing and consumer data. Bond yields rose marginally, leading to slightly negative returns for global government and investment-grade corporate bonds.
Financial markets ended 2019 boosted by the U.S. and China accord on a Phase One trade deal. That, along with the landslide election win by the pro-Brexit U.K. Conservative Party and ongoing central bank support, gave investors greater confidence. U.S. economic indicators were generally positive, with the exception of manufacturing activity and business confidence. Consumer confidence was fed by a robust labor market, tame inflation, and lower interest rates, which boosted housing affordability and stimulated homebuyer activity. The impeachment of President Trump had little market impact. Meanwhile, slowing Chinese economic activity, partly a result of the trade war, led to further government stimulus at year-end through lower reserve ratios, allowing banks to lend more money.
| 1 | The S&P 500 Index consists of 500 stocks chosen for market size, liquidity, and industry group representation. It is a market-value-weighted index with each stock’s weight in the index proportionate to its market value. You cannot invest directly in an index. |
| 2 | The Morgan Stanley Capital International (MSCI) All Country World Index (ACWI) ex USA Index (Net) is a free-float-adjusted market-capitalization-weighted index that is designed to measure the equity market performance of developed and emerging markets, excluding the United States. Source: MSCI. MSCI makes no express or implied warranties or representations and shall have no liability whatsoever with respect to any MSCI data contained herein. The MSCI data may not be further redistributed or used as a basis for other indices or any securities or financial products. This report is not approved, reviewed, or produced by MSCI. You cannot invest directly in an index. |
| 3 | The MSCI Emerging Markets (EM) Index (Net) is a free-float-adjusted market-capitalization-weighted index that is designed to measure equity market performance of emerging markets. You cannot invest directly in an index. |
| 4 | The Bloomberg Barclays U.S. Aggregate Bond Index is a broad-based benchmark that measures the investment-grade, U.S. dollar-denominated, fixed-rate taxable bond market, including Treasuries, government-related and corporate securities, mortgage-backed securities (agency fixed-rate and hybrid adjustable-rate mortgage pass-throughs), asset-backed securities, and commercial mortgage-backed securities. You cannot invest directly in an index. |
| 5 | The Bloomberg Barclays Global Aggregate ex-USD Index is an unmanaged index that provides a broad-based measure of the global investment-grade fixed-income markets excluding the U.S. dollar-denominated debt market. You cannot invest directly in an index. |
| 6 | The Bloomberg Barclays Municipal Bond Index is an unmanaged index composed of long-term tax-exempt bonds with a minimum credit rating of Baa. You cannot invest directly in an index. |
| 7 | The ICE BofA U.S. High Yield Index is a market-capitalization-weighted index of domestic and Yankee high-yield bonds. The index tracks the performance of high-yield securities traded in the U.S. bond market. You cannot invest directly in an index. Copyright 2020. ICE Data Indices, LLC. All rights reserved. |
2 | Wells Fargo Diversified International Fund
Table of Contents
Letter to shareholders (unaudited)
The 2019 year-end rally continued in early January 2020. However, capital market volatility spiked in late January on concerns over the potential impact of COVID-19 on the global economy and stock markets. With sentiment somewhat souring, perceived safe havens did well in January. The U.S. dollar and Japanese yen both rose and government bonds outperformed equities. While the S&P 500 Index held its ground, emerging market equities tumbled, including those in Asia.
In February, COVID-19 became the major market focus. Fears of the virus’s impact on global growth led to expectations of increased global central bank monetary policy support. That led the 10-year U.S. Treasury yield to fall to an all-time low of 1.1%. Although equity markets initially shrugged off concerns about the outbreak, focusing instead on strong fourth-quarter earnings and improving business confidence in January, market sentiment turned sharply lower and the S&P 500 Index lost 8.2% for the month. Oil prices tumbled as Russia and the Organization of the Petroleum Exporting Countries compounded a major decline in oil demand with a brutal price war, partly aimed at dissuading further U.S. shale production, causing the price of West Texas Intermediate crude oil to plummet.
The global spread of COVID-19 in March led country after country to clamp down on social- and business-related activity in order to contain the virus from causing even greater devastation and overwhelming health care systems. This abrupt stoppage of economic activity led to the sharp deceleration of global output, sending economies into a deep contraction. Central banks responded swiftly, slashing interest rates and expanding quantitative easing programs to restore liquidity and confidence in the markets. In the U.S., the Federal Reserve (Fed) introduced several new lending programs, funding investment-grade bonds, money market mutual funds, and commercial paper while purchasing Treasuries, mortgage-backed securities, and overnight repurchase agreements. Meanwhile, stock markets tumbled quickly into a bear market, ending the longest bull stock market in U.S. history.
Markets rebounded strongly in April, fueled by unprecedented government and central bank stimulus measures. The U.S. economy contracted by an annualized 5.0% pace in the first quarter of 2020, with 30 million new unemployment insurance claims in six weeks. In the eurozone, first-quarter real gross domestic product (GDP) shrank 3.8% with the composite April Flash Purchasing Managers’ Index (PMI), a monthly survey of purchasing managers, falling to an all-time low of 13.5. The European Central Bank expanded its quantitative easing to include the purchase of additional government bonds of countries with the greatest virus-related need, including Italy and Spain. China’s first-quarter GDP fell by 6.8% year over year. However, retail sales, production, and investment showed signs of recovery. Extreme oil-price volatility continued as global supply far exceeded demand.
The global equity market rebound continued in May, with widespread advances. Investors regained confidence on reports of early signs of success in human trials of a COVID-19 vaccine. Growth stocks continued to outperform value stocks while returns on global government bonds were generally flat. In the U.S., a gap grew between the stock market rebound and economic data, including an April unemployment rate of 14.7%, the highest level since World War II. Manufacturing and services purchasing managers’ indices reflected widespread weakening activity in May. U.S. corporate earnings reports indicated a 14% year-over-year contraction in earnings from the first quarter of 2019. However, high demand for technology, driven by remote activity, supported robust information technology sector earnings, which helped drive major technology stocks higher.
Financial markets posted widely positive returns in June despite ongoing economic weakness and high levels of uncertainty on the containment of COVID-19 and the timing of an effective vaccine. There were hopeful signs as economies reopened. Vitally important to market sentiment was the ongoing commitment by central banks globally
“The global spread of COVID-19 in March led country after country to clamp down on social- and business-related activity in order to contain the virus from causing even greater devastation and overwhelming health care systems.”
Wells Fargo Diversified International Fund | 3
Table of Contents
Letter to shareholders (unaudited)
“In October, capital markets took a step back from their six-month rally. Market volatility rose in advance of the U.S. election and amid a global increase in COVID-19 infections.”
to do all they can to provide economic support through liquidity and low borrowing costs. U.S. economic activity was aided by one-time $1,200 stimulus checks and $600 weekly bonus unemployment benefits that expired at the end of July. However, unemployment remained historically high, easing somewhat from 14.7% in April to 11.1% in June. By the end of June, numerous states reported increases of COVID-19 cases. China’s economic recovery picked up momentum in June, though it remained far from a full recovery.
July was broadly positive for both global equities and fixed income. However, economic data and a resurgence of COVID-19 cases pointed to the vulnerability of the global economy and the ongoing imperative to regain control of the pandemic. Second-quarter GDP shrank from the previous quarter by 9.5% and 12.1% in the U.S. and the eurozone, respectively. In contrast, China reported a 3.2% year-over-year expansion in its second-quarter GDP. U.S. unemployment remained high despite adding 1.8 million jobs in July, with a double-digit jobless rate persisting. However, manufacturing activity grew in both the U.S. and the eurozone. In Asia, while China’s manufacturing sector continued to expand, activity in Japan and South Korea contracted. A rising concern was the rapid and broad reemergence of COVID-19 infections.
The stock market continued to rally in August despite concerns over rising numbers of COVID-19 cases in the United States and several European countries, including France and Spain, as well as the July expiration of the $600 weekly bonus unemployment benefit. U.S. stocks had strong monthly gains, surpassing broadly positive overall global equity performance, while fixed-income market monthly returns were broadly flat. Generally stronger-than-expected second-quarter earnings boosted investor sentiment along with the Fed’s announcement of a policy shift that will likely lead to longer-term low interest rates and supportive monetary policy. U.S. indices measuring manufacturing and services activities beat expectations while the U.S. housing market maintained strength. In Europe, retail sales expanded and consumer confidence was steady. China’s economy continued to expand.
Stocks grew more volatile in September on mixed economic data. U.S. economic activity continued to grow. However, six months after the bottom fell out of the labor market in early spring, only half of the 22 million jobs lost had returned. The U.S. unemployment rate fell to 7.9% in September, reflecting steady improvement but far higher than the 3.5% pre-COVID-19 rate. Only 661,000 jobs were added for the month, down from 1.5 million in August. Meanwhile, a reported 2.3 million people have given up looking for work. With U.S. Congress failing to pass further fiscal relief and uncertainties surrounding a possible vaccine, doubts crept back into the financial markets. In the U.K., a lack of progress in Brexit talks with the European Union weighed on markets. China’s economy picked up steam, however, with growth fueled by increased global demand, and China’s services sector rallied.
In October, capital markets took a step back from their six-month rally. Market volatility rose in advance of the U.S. election and amid a global increase in COVID-19 infections. Europe responded with a new round of restrictions affecting economic activity. Meanwhile, Brexit remained unresolved as the European Union and the U.K. failed to strike a deal by a mid-October deadline. U.S. markets looked favorably at a possible Democratic sweep and control of the federal purse strings as that could lead to the passage of long-awaited additional fiscal stimulus, which could boost economic activity. Meanwhile, China continued to stand apart, reporting 4.9% third-quarter GDP growth year over year.
4 | Wells Fargo Diversified International Fund
Table of Contents
Letter to shareholders (unaudited)
Don’t let short-term uncertainty derail long-term investment goals.
Periods of investment uncertainty can present challenges, but experience has taught us that maintaining long-term investment goals can be an effective way to plan for the future. To help you create a sound strategy based on your personal goals and risk tolerance, Wells Fargo Funds offers more than 100 mutual funds spanning a wide range of asset classes and investment styles. Although diversification cannot guarantee an investment profit or prevent losses, we believe it can be an effective way to manage investment risk and potentially smooth out overall portfolio performance. We encourage investors to know their investments and to understand that appropriate levels of risk-taking may unlock opportunities.
Thank you for choosing to invest with Wells Fargo Funds. We appreciate your confidence in us and remain committed to helping you meet your financial needs.
Sincerely,

Andrew Owen
President
Wells Fargo Funds
|
For further information about your Fund, contact your investment professional, visit our website at wfam.com, or call us directly at 1-800-222-8222. |
Notice to Shareholders
At a meeting held on August 10-12, 2020, the Board of Trustees of the Fund approved a change to the Fund’s automatic conversion feature for Class C shares in order to shorten the required holding period from 10 to 8 years. As a result, on a monthly basis beginning November 5, 2020, Class C shares will convert automatically into Class A shares 8 years after the initial date of purchase or, if you acquired your Class C shares through an exchange or conversion from another share class, 8 years after the date you acquired your Class C shares. When Class C shares that you acquired through a purchase or exchange convert, any other Class C shares that you purchased with reinvested dividends and distributions also will convert into Class A shares on a pro rata basis.
Please note that a shorter holding period may apply depending on your intermediary. Please see “Appendix A—Sales Charge Reductions and Waivers for Certain Intermediaries” in the Fund’s prospectus for further information.
Wells Fargo Diversified International Fund | 5
Table of Contents
Performance highlights (unaudited)
Investment objective
The Fund seeks long-term capital appreciation.
Manager
Wells Fargo Funds Management, LLC
Subadvisers
Artisan Partners Limited Partnership
LSV Asset Management
Wells Capital Management Incorporated
Portfolio managers
Josef Lakonishok, Ph.D.
Venkateshwar (Venk) Lal
Puneet Mansharamani, CFA®‡
Menno Vermeulen, CFA®‡
Dale A. Winner, CFA®‡
Mark L. Yockey, CFA®‡
Average annual total returns (%) as of October 31, 2020
| Including sales charge | Excluding sales charge | Expense ratios1 (%) | ||||||||||||||||||||||||||||||||
| Inception date | 1 year | 5 year | 10 year | 1 year | 5 year | 10 year | Gross | Net2 | ||||||||||||||||||||||||||
| Class A (SILAX) | 9-24-1997 | -14.62 | 0.48 | 2.74 | -9.41 | 1.67 | 3.35 | 1.77 | 1.35 | |||||||||||||||||||||||||
| Class C (WFECX) | 4-1-1998 | -11.10 | 0.91 | 2.56 | -10.10 | 0.91 | 2.56 | 2.52 | 2.10 | |||||||||||||||||||||||||
| Class R6 (WDIRX)3 | 9-30-2015 | – | – | – | -9.05 | 2.14 | 3.67 | 1.34 | 0.89 | |||||||||||||||||||||||||
| Administrator Class (WFIEX) | 11-8-1999 | – | – | – | -9.37 | 1.76 | 3.48 | 1.69 | 1.25 | |||||||||||||||||||||||||
| Institutional Class (WFISX) | 8-31-2006 | – | – | – | -9.11 | 2.05 | 3.72 | 1.44 | 0.99 | |||||||||||||||||||||||||
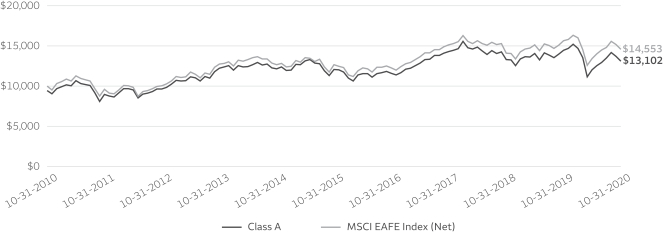
| MSCI EAFE Index (Net)4 | – | – | – | – | -6.86 | 2.85 | 3.82 | – | – | |||||||||||||||||||||||||
Figures quoted represent past performance, which is no guarantee of future results, and do not reflect taxes that a shareholder may pay on an investment in a fund. Investment return and principal value of an investment will fluctuate so that an investor’s shares, when redeemed, may be worth more or less than their original cost. Performance shown without sales charges would be lower if sales charges were reflected. Current performance may be lower or higher than the performance data quoted, which assumes the reinvestment of dividends and capital gains. Current month-end performance is available on the Fund’s website, wfam.com.
Index returns do not include transaction costs associated with buying and selling securities, any mutual fund fees or expenses, or any taxes. It is not possible to invest directly in an index.
For Class A shares, the maximum front-end sales charge is 5.75%. For Class C shares, the maximum contingent deferred sales charge is 1.00%. Performance including a contingent deferred sales charge assumes the sales charge for the corresponding time period. Class R6, Administrator Class, and Institutional Class shares are sold without a front-end sales charge or contingent deferred sales charge.
Stock values fluctuate in response to the activities of individual companies and general market and economic conditions. Foreign investments are especially volatile and can rise or fall dramatically due to differences in the political and economic conditions of the host country. These risks are generally intensified in emerging markets. The use of derivatives may reduce returns and/or increase volatility. Certain investment strategies tend to increase the total risk of an investment (relative to the broader market). The Fund is exposed to smaller-company securities risk. Consult the Fund’s prospectus for additional information on these and other risks.
Please see footnotes on page 7.
6 | Wells Fargo Diversified International Fund
Table of Contents
Performance highlights (unaudited)
| Growth of $10,000 investment as of October 31, 20205 |
|
| ‡ | CFA® and Chartered Financial Analyst® are trademarks owned by CFA Institute. |
| 1 | Reflects the expense ratios as stated in the most recent prospectuses. The expense ratios shown are subject to change and may differ from the annualized expense ratios shown in the financial highlights of this report. |
| 2 | The manager has contractually committed through February 28, 2021, to waive fees and/or reimburse expenses to the extent necessary to cap total annual fund operating expenses after fee waivers at 1.35% for Class A, 2.10% for Class C, 0.89% for Class R6, 1.25% for Administrator Class, and 0.99% for Institutional Class. Brokerage commissions, stamp duty fees, interest, taxes, acquired fund fees and expenses (if any), and extraordinary expenses are excluded from the expense caps. Prior to or after the commitment expiration date, the caps may be increased or the commitment to maintain the caps may be terminated only with the approval of the Board of Trustees. Without these caps, the Fund’s returns would have been lower. The expense ratio paid by an investor is the net expense ratio (the total annual fund operating expenses after fee waivers) as stated in the prospectuses. |
| 3 | Historical performance shown for Class R6 shares prior to their inception reflects the performance of the Administrator Class shares, and includes the higher expenses applicable to the Administrator Class shares. If these expenses had not been included, returns for the Class R6 shares would be higher. |
| 4 | The Morgan Stanley Capital International (MSCI) Europe, Australasia, Far East (EAFE) Index (Net) is a free-float-adjusted market-capitalization-weighted index that is designed to measure the equity market performance of developed markets, excluding the United States and Canada. Source: MSCI. MSCI makes no express or implied warranties or representations and shall have no liability whatsoever with respect to any MSCI data contained herein. The MSCI data may not be further redistributed or used as a basis for other indexes or any securities or financial products. This report is not approved, reviewed, or produced by MSCI. You cannot invest directly in an index. |
| 5 | The chart compares the performance of Class A shares for the most recent ten years with the MSCI EAFE Index (Net). The chart assumes a hypothetical investment of $10,000 in Class A shares and reflects all operating expenses and assumes the maximum initial sales charge of 5.75%. |
| 6 | The Morgan Stanley Capital International (MSCI) All Country World Index (ACWI) ex USA Index (Net) is a free-float-adjusted market-capitalization-weighted index that is designed to measure the equity market performance of developed and emerging markets, excluding the U.S. You cannot invest directly in an index. |
| 7 | The MSCI Emerging Markets (EM) Index (Net) is a free-float-adjusted market-capitalization-weighted index that is designed to measure equity market performance of emerging markets. You cannot invest directly in an index. |
| 8 | The MSCI World Index (Net) is a free-float-adjusted market-capitalization-weighted index that is designed to measure the equity market performance of developed markets. You cannot invest directly in an index. |
| 9 | The MSCI All Country World Index (ACWI) ex USA Value Index measures the equity market performance of large- and mid-cap securities exhibiting overall value style characteristics across developed and emerging market countries, excluding the U.S. The value investment style characteristics for index construction are defined using three variables: book value to price, 12-month forward earnings to price, and dividend yield. You cannot invest directly in an index. |
| 10 | The ten largest holdings, excluding cash, cash equivalents and any money markets, are calculated based on the value of the investments divided by total net assets of the Fund. Holdings are subject to change and may have changed since the date specified. |
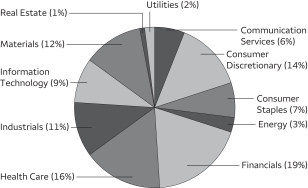
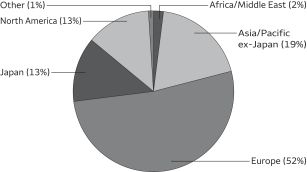
| 11 | Amounts are calculated based on the total long-term investments of the Fund. These amounts are subject to change and may have changed since the date specified. |
| 12 | The MSCI EAFE Growth Index is a free-float-adjusted market-capitalization-weighted index that is designed to measure the equity market performance of growth securities within developed equity markets, excluding the United States and Canada. You cannot invest directly in an index. |
| 13 | The MSCI EAFE Value Index is a free-float-adjusted market-capitalization-weighted index that is designed to measure the equity market performance of value securities within developed equity markets, excluding the United States and Canada. You cannot invest directly in an index. |
| * | This security was no longer held at the end of the reporting period. |
Wells Fargo Diversified International Fund | 7
Table of Contents
Performance highlights (unaudited)
MANAGERS’ DISCUSSION
Fund highlights
| ∎ | The Fund underperformed its benchmark, the MSCI EAFE Index (Net), for the 12-month period that ended October 31, 2020. |
| ∎ | For most of the reporting period, value stocks underperformed growth stocks, creating a more challenging investment climate for two of the Fund’s three subadvisors—LSV Asset Management (LSV) and Wells Capital Management (WellsCap). An underweight to Japan and lack of exposure to select high-performing Japanese stocks also weighed on results. From a sector perspective, stock selection within industrials, health care, and consumer staples detracted from relative performance. Amid a difficult oil price environment, energy holding Petroleo Brasileiro S.A.* was among the largest individual detractors. |
| ∎ | Stock selection in the consumer discretionary, financials, and materials sectors contributed to relative results. Among the top individual contributors were Amazon.com, Incorporated, and Alibaba Group Holding Limited. Both companies experienced strong organic growth in their core e-commerce businesses, driven by user growth and improving user engagement, as secular tailwinds accelerated due to the pandemic. Consumer discretionary holding Xinyi Glass Holdings Limited outperformed given a strong rebound in the float glass price, lower cost of goods sold, and capacity expansion. |
WellsCap
International equity markets recovered most of their year-to-date losses on a relief rally, driven by unprecedented monetary, fiscal, and health policy responses. This followed an initial panic sell-off from the COVID-19 pandemic and continued until the market reached a relapse correction phase in September. Belying this volatility, the MSCI ACWI ex USA Index (Net)6 returned -2.6% during the period. In this environment, the global purchasing managers’ index fell to 26.2 in April but rebounded strongly over the subsequent months, reaching a two-year high of 53.3 in October. Emerging market equities, represented by the MSCI EM Index (Net)7, returned 8.3% during the period, driven by North Asia, which exhibited better containment of COVID-19 than developed markets, which returned 4.4% (MSCI World Index (Net)8). Traditional value sectors underperformed growth stocks during the period, illustrated by the MSCI ACWI ex USA Value Index9, which returned -15.9% versus 11.4% for the comparable growth index.
| Ten largest holdings (%) as of October 31, 202010 | ||||
Roche Holding AG | 2.48 | |||
Linde plc | 1.99 | |||
Sanofi SA | 1.88 | |||
Deutsche Boerse AG | 1.78 | |||
Novartis AG | 1.69 | |||
Alibaba Group Holding Limited ADR | 1.61 | |||
Air Liquide SA | 1.50 | |||
Nestle SA | 1.43 | |||
Xinyi Glass Holdings Limited | 1.31 | |||
Koninklijke Philips NV | 1.30 | |||
Over the past 12 months, key detractors from relative performance included Greencore Group plc, Melrose Industries plc*, OCI NV, John Wood Group plc, and Keppel Corporation*. Greencore Group, a small-cap Irish-based food manufacturer specializing in convenience and fresh foods, reported a 34% year-over-year decline in revenues for the three-month period that ended June 28 as a result of dramatic changes in consumption patterns due to the pandemic. However, the company’s revenue losses steadily narrowed from -43% in April 2020 to -23% through the first three weeks of July as restrictions on population movements eased. The Fund’s WellsCap sleeve exited Melrose Industries, a U.K. domiciled investment company that seeks to buy good manufacturing businesses with strong fundamentals
(using low leverage), improves the business, sells them, and then returns proceeds to shareholders. While the self-help potential from cost-cutting, sale of non-core assets, and investment in underinvested divisions remains strong, it is more than offset by challenges in aerospace—civil aerospace, in particular—and automotive space. Accordingly, earnings revisions have been uniformly negative and shares are trading closer to fair value.
On the other hand, top contributors to performance came from Xinyi Glass, Midea Group, Lundin Mining Corporation, Fresnillo plc, and Oppein Home Group Incorporated*. Xinyi Glass, a Chinese float glass manufacturer benefiting from industry supply constraints, capacity expansion, and line extensions, outperformed given a strong rebound in the float glass price (up 48% since May) from demand improvement—particularly in the area of property completion and limited supply expansion; lower cost of goods sold from lower soda ash and liquefied natural gas, which should result in margin improvement; and capacity expansion from the acquisition of three float glass production lines, circumventing limitation on new float glass production construction. Midea Group, a Chinese producer of home appliances, announced better-than-expected second-quarter and first-half results, confirming well-above-peer results in net profits, cash flow, working capital, and dividends, as well as continued market share
Please see footnotes on page 7.
8 | Wells Fargo Diversified International Fund
Table of Contents
Performance highlights (unaudited)
gains. Demonstrating its best-in-class franchise value, product innovation, and channel efficiency, Midea expanded its market share and showed indications of revenue and net profit recovery despite the COVID-19 backdrop.
Artisan Partners
Non-U.S. equities declined during the period due to a historical sell-off in the first quarter of 2020 that was driven by the COVID-19 pandemic. Shutdowns and social distancing measures imposed by governments worldwide to slow transmission and thereby “flatten the curve” to avoid overwhelming health care systems produced a sudden shock to global supply chains and domestic demand around the world. The headlines that had dominated in prior months—the U.S.-China trade war, Brexit, and the U.S. impeachment—were immediately eclipsed by the emerging health crisis. The hardest-hit sectors were energy, financials, and real estate. The information technology and health care sectors led with positive returns, resisting the broader weakness.
Artisan’s biggest shifts in sector weightings were increases in health care, communication services, and consumer discretionary and decreases in financials and industrials. As always, sector positioning is a residual of bottom-up stock decisions.
Relative outperformance was driven by positive stock selection in the consumer discretionary, financials, and materials sectors. Top contributors in these sectors included e-commerce and web services companies Amazon.com, Incorporated, and Alibaba Group Holding Limited; financial services provider UBS Group AG; and industrial gases supplier Linde PLC.
On the downside, sector positioning was a headwind, due in part to our above-benchmark exposure to financials. Additionally, our industrials holdings detracted from relative results, driven by aerospace companies Airbus SE and Safran S.A.*
| Sector allocation as of October 31, 202011 |
 |
The current investment environment is unique in our experience in that economic and financial conditions are being driven by a public health crisis rather than endogenous financial system forces. This started as a global health issue, and we believe it will continue to play out as one. Although equities have staged a swift comeback following one of the greatest sell-offs in history, we believe the effects of COVID-19 will be felt for some time due to the “abundance of caution” many people will exhibit while progress continues on a vaccine. Hence, we expect the recovery will take longer than what we perceive is priced by markets. We believe companies will need staying power to survive this period and come out stronger on the other side.
LSV
Global equity markets finished 2019 on a strong note, rallying on positive economic data, reduced trade tensions, and continued accommodative central bank policies. The market advance was abruptly interrupted in the first quarter of 2020 as the COVID-19 pandemic prompted sweeping economic shutdowns. The economic impact of containment measures and worldwide recessionary fears sent equities sharply lower, particularly value stocks, which were punished in the sell-off. While markets recovered some of the lost ground, the MSCI EAFE Index (Net) declined 6.86% for the trailing 12 months. Growth stocks significantly outperformed over the 12 months as the MSCI EAFE Growth Index12 advanced 5.18% while the MSCI EAFE Value Index13 declined 18.42%. There was also a wide dispersion of sector returns as defensive sectors, including consumer staples and utilities, held up best while value-oriented sectors, including energy and financials, lagged.
The difficult environment for value stocks had a negative impact on results given the manager’s emphasis on deeper value stocks. While the LSV sleeve of the portfolio was able to outperform the value benchmark, it was difficult to keep up with a core benchmark given the extreme spread between growth and value stocks. The overweight to more value-oriented sectors of the market, including energy and financials, and underweight to information technology stocks had a negative impact on performance. In addition, poor stock selection among consumer discretionary, health care, and financials stocks also detracted in the period.
Changes to the portfolio are gradual given the low-turnover strategy. Over the past 12 months, LSV increased the exposure to health care and consumer staples and decreased the weight to energy stocks. The LSV portion of the Fund is overweight the energy, materials, and financials sectors and underweight industrials, consumer staples, information technology, and real estate.
Please see footnotes on page 7.
Wells Fargo Diversified International Fund | 9
Table of Contents
Performance highlights (unaudited)
While value stocks have suffered over the past few years, we have weathered previous tough periods for our approach. It has been our experience that difficult periods for value stocks have historically presented investors with some of the best buying opportunities in history, and this recent episode of value underperformance seems to be providing such opportunities.
| Geographic allocation as of October 31, 202011 |
 |
Please see footnotes on page 7.
10 | Wells Fargo Diversified International Fund
Table of Contents
As a shareholder of the Fund, you incur two types of costs: (1) transaction costs, including sales charges (loads) on purchase payments and contingent deferred sales charges (if any) on redemptions and (2) ongoing costs, including management fees, distribution (12b-1) and/or shareholder servicing fees, and other Fund expenses. This example is intended to help you understand your ongoing costs (in dollars) of investing in the Fund and to compare these costs with the ongoing costs of investing in other mutual funds.
The example is based on an investment of $1,000 invested at the beginning of the six-month period and held for the entire period from May 1, 2020 to October 31, 2020.
Actual expenses
The “Actual” line of the table below provides information about actual account values and actual expenses. You may use the information in this line, together with the amount you invested, to estimate the expenses that you paid over the period. Simply divide your account value by $1,000 (for example, an $8,600 account value divided by $1,000 = 8.6), then multiply the result by the number in the “Actual” line under the heading entitled “Expenses paid during period” for your applicable class of shares to estimate the expenses you paid on your account during this period.
Hypothetical example for comparison purposes
The “Hypothetical” line of the table below provides information about hypothetical account values and hypothetical expenses based on the Fund’s actual expense ratio and an assumed rate of return of 5% per year before expenses, which is not the Fund’s actual return. The hypothetical account values and expenses may not be used to estimate the actual ending account balance or expenses you paid for the period. You may use this information to compare the ongoing costs of investing in the Fund and other funds. To do so, compare this 5% hypothetical example with the 5% hypothetical examples that appear in the shareholder reports of the other funds.
Please note that the expenses shown in the table are meant to highlight your ongoing costs only and do not reflect any transactional costs, such as sales charges (loads) and contingent deferred sales charges. Therefore, the “Hypothetical” line of the table is useful in comparing ongoing costs only and will not help you determine the relative total costs of owning different funds. In addition, if these transactional costs were included, your costs would have been higher.
| Beginning account value 5-1-2020 | Ending account value 10-31-2020 | Expenses paid during the period1 | Annualized net expense ratio | |||||||||||||
Class A | ||||||||||||||||
Actual | $ | 1,000.00 | $ | 1,090.05 | $ | 6.99 | 1.33 | % | ||||||||
Hypothetical (5% return before expenses) | $ | 1,000.00 | $ | 1,018.45 | $ | 6.75 | 1.33 | % | ||||||||
Class C | ||||||||||||||||
Actual | $ | 1,000.00 | $ | 1,085.22 | $ | 11.01 | 2.10 | % | ||||||||
Hypothetical (5% return before expenses) | $ | 1,000.00 | $ | 1,014.58 | $ | 10.63 | 2.10 | % | ||||||||
Class R6 | ||||||||||||||||
Actual | $ | 1,000.00 | $ | 1,092.59 | $ | 4.68 | 0.89 | % | ||||||||
Hypothetical (5% return before expenses) | $ | 1,000.00 | $ | 1,020.66 | $ | 4.52 | 0.89 | % | ||||||||
Administrator Class | ||||||||||||||||
Actual | $ | 1,000.00 | $ | 1,090.23 | $ | 6.57 | 1.25 | % | ||||||||
Hypothetical (5% return before expenses) | $ | 1,000.00 | $ | 1,018.85 | $ | 6.34 | 1.25 | % | ||||||||
Institutional Class | ||||||||||||||||
Actual | $ | 1,000.00 | $ | 1,092.18 | $ | 5.21 | 0.99 | % | ||||||||
Hypothetical (5% return before expenses) | $ | 1,000.00 | $ | 1,020.16 | $ | 5.03 | 0.99 | % | ||||||||
| 1 | Expenses paid is equal to the annualized net expense ratio of each class multiplied by the average account value over the period, multiplied by the number of days in the most recent fiscal half-year divided by the number of days in the fiscal year (to reflect the one-half-year period). |
Wells Fargo Diversified International Fund | 11
Table of Contents
Portfolio of investments—October 31, 2020
| Shares | Value | |||||||||||||||
| Common Stocks: 96.52% |
| |||||||||||||||
Australia: 2.02% |
| |||||||||||||||
AGL Energy Limited (Utilities, Multi-Utilities) | 8,500 | $ | 74,499 | |||||||||||||
Beach Petroleum Limited (Energy, Oil, Gas & Consumable Fuels) | 85,000 | 70,484 | ||||||||||||||
Fortescue Metals Group Limited (Materials, Metals & Mining) | 21,200 | 259,350 | ||||||||||||||
Harvey Norman Holdings Limited (Consumer Discretionary, Multiline Retail) | 34,882 | 109,120 | ||||||||||||||
Lendlease Corporation Limited (Real Estate, Real Estate Management & Development) | 6,000 | 50,473 | ||||||||||||||
Metcash Limited (Consumer Staples, Food & Staples Retailing) | 28,500 | 59,117 | ||||||||||||||
Mineral Resources Limited (Materials, Metals & Mining) | 2,800 | 49,167 | ||||||||||||||
Qantas Airways Limited (Industrials, Airlines) † | 300,428 | 883,840 | ||||||||||||||
Rio Tinto Limited (Materials, Metals & Mining) | 1,800 | 117,097 | ||||||||||||||
| 1,673,147 | ||||||||||||||||
|
| |||||||||||||||
| Austria: 0.13% | ||||||||||||||||
OMV AG (Energy, Oil, Gas & Consumable Fuels) | 4,800 | 110,959 | ||||||||||||||
|
| |||||||||||||||
| Belgium: 0.59% | ||||||||||||||||
UCB SA (Health Care, Pharmaceuticals) | 4,979 | 491,783 | ||||||||||||||
|
| |||||||||||||||
| Brazil: 0.19% | ||||||||||||||||
Banco do Brasil SA (Financials, Banks) | 10,900 | 56,609 | ||||||||||||||
Companhia de Saneamento de Minas Gerais SA (Utilities, Water Utilities) | 5,300 | 39,533 | ||||||||||||||
JBS SA (Consumer Staples, Food Products) | 18,600 | 63,049 | ||||||||||||||
| 159,191 | ||||||||||||||||
|
| |||||||||||||||
| Canada: 2.68% | ||||||||||||||||
Canadian Pacific Railway Limited (Industrials, Road & Rail) | 1,300 | 388,488 | ||||||||||||||
Home Capital Group Incorporated (Financials, Thrifts & Mortgage Finance) † | 22,400 | 409,061 | ||||||||||||||
Loblaw Companies Limited (Consumer Staples, Food & Staples Retailing) | 3,800 | 189,159 | ||||||||||||||
Lundin Mining Corporation (Materials, Metals & Mining) | 97,635 | 589,929 | ||||||||||||||
Magna International Incorporated (Consumer Discretionary, Auto Components) | 7,300 | 372,753 | ||||||||||||||
TMX Group Limited (Financials, Capital Markets) | 2,700 | 262,360 | ||||||||||||||
| 2,211,750 | ||||||||||||||||
|
| |||||||||||||||
| Chile: 0.12% | ||||||||||||||||
Enel Americas SA (Utilities, Electric Utilities) | 730,853 | 96,961 | ||||||||||||||
|
| |||||||||||||||
| China: 6.58% | ||||||||||||||||
Alibaba Group Holding Limited (Consumer Discretionary, Internet & Direct Marketing Retail) † | 17,656 | 669,054 | ||||||||||||||
Alibaba Group Holding Limited ADR (Consumer Discretionary, Internet & Direct Marketing Retail) † | 4,355 | 1,326,925 | ||||||||||||||
China International Capital Corporation Limited (Financials, Capital Markets) 144A† | 102,800 | 240,201 | ||||||||||||||
China Petroleum & Chemical Corporation Class H (Energy, Oil, Gas & Consumable Fuels) | 218,000 | 85,123 | ||||||||||||||
China Railway Construction Corporation Limited Class H (Industrials, Construction & Engineering) | 117,500 | 79,595 | ||||||||||||||
China Resources Cement Holdings Limited (Materials, Construction Materials) | 168,000 | 219,984 | ||||||||||||||
China Telecom Corporation Limited Class H (Communication Services, Diversified Telecommunication Services) | 238,000 | 74,710 | ||||||||||||||
Dongfeng Motor Group Company Limited Class H (Consumer Discretionary, Automobiles) | 106,000 | 74,669 | ||||||||||||||
HollySys Automation Technologies Limited (Information Technology, Electronic Equipment, Instruments & Components) | 20,976 | 234,721 | ||||||||||||||
Midea Group Company Limited Class A (Consumer Discretionary, Household Durables) | 70,100 | 818,081 | ||||||||||||||
Nine Dragons Paper Holdings Limited (Materials, Paper & Forest Products) | 104,000 | 138,719 | ||||||||||||||
PICC Property & Casualty Company Limited Class H (Financials, Insurance) | 103,500 | 70,247 | ||||||||||||||
Shanghai Pharmaceuticals Holding Company Limited Class H (Health Care, Health Care Providers & Services) | 221,200 | 343,370 | ||||||||||||||
Tencent Holdings Limited (Communication Services, Interactive Media & Services) | 10,300 | 786,978 | ||||||||||||||
Topsports International Holdings Limited (Consumer Discretionary, Textiles, Apparel & Luxury Goods) 144A | 91,000 | 124,778 | ||||||||||||||
The accompanying notes are an integral part of these financial statements.
12 | Wells Fargo Diversified International Fund
Table of Contents
Portfolio of investments—October 31, 2020
| Shares | Value | |||||||||||||||
| China (continued) | ||||||||||||||||
WH Group Limited (Consumer Staples, Food Products) 144A | 135,500 | $ | 106,723 | |||||||||||||
Yantai Changyu Pioneer Wine Company Limited Class B (Consumer Staples, Beverages) | 23,400 | 41,876 | ||||||||||||||
| 5,435,754 | ||||||||||||||||
|
| |||||||||||||||
| Denmark: 2.78% | ||||||||||||||||
Ascendis Pharma AS ADR (Health Care, Biotechnology) † | 2,922 | 477,309 | ||||||||||||||
Danske Bank AS (Financials, Banks) † | 51,738 | 689,541 | ||||||||||||||
DSV Panalpina AS (Industrials, Air Freight & Logistics) | 999 | 162,079 | ||||||||||||||
Genmab AS (Health Care, Biotechnology) † | 2,419 | 808,006 | ||||||||||||||
Novo Nordisk AS Class B (Health Care, Pharmaceuticals) | 1,502 | 95,776 | ||||||||||||||
Sydbank AS (Financials, Banks) † | 4,000 | 68,407 | ||||||||||||||
| 2,301,118 | ||||||||||||||||
|
| |||||||||||||||
| Finland: 0.14% | ||||||||||||||||
Nordea Bank AB (Financials, Banks) † | 15,000 | 112,579 | ||||||||||||||
|
| |||||||||||||||
| France: 6.77% | ||||||||||||||||
Air Liquide SA (Materials, Chemicals) | 8,498 | 1,242,733 | ||||||||||||||
Amundi SA (Financials, Capital Markets) 144A† | 4,893 | 320,942 | ||||||||||||||
Arkema SA (Materials, Chemicals) | 910 | 89,125 | ||||||||||||||
AXA SA (Financials, Insurance) | 9,200 | 147,746 | ||||||||||||||
BNP Paribas SA (Financials, Banks) † | 4,400 | 153,449 | ||||||||||||||
Capgemini SE (Information Technology, IT Services) | 1,300 | 150,108 | ||||||||||||||
Compagnie de Saint-Gobain SA (Industrials, Building Products) † | 17,329 | 675,025 | ||||||||||||||
Compagnie Generale des Etablissements Michelin SCA (Consumer Discretionary, Auto Components) | 2,200 | 237,602 | ||||||||||||||
Credit Agricole SA (Financials, Banks) † | 13,900 | 109,956 | ||||||||||||||
Eiffage SA (Industrials, Construction & Engineering) † | 2,672 | 193,927 | ||||||||||||||
Engie SA (Utilities, Multi-Utilities) † | 6,900 | 83,452 | ||||||||||||||
Natixis SA (Financials, Capital Markets) † | 27,500 | 64,053 | ||||||||||||||
Sanofi SA (Health Care, Pharmaceuticals) | 17,192 | 1,552,323 | ||||||||||||||
Societe Generale SA (Financials, Banks) † | 3,700 | 50,275 | ||||||||||||||
Total SA (Energy, Oil, Gas & Consumable Fuels) | 8,900 | 269,641 | ||||||||||||||
Vinci SA (Industrials, Construction & Engineering) | 3,237 | 255,675 | ||||||||||||||
| 5,596,032 | ||||||||||||||||
|
| |||||||||||||||
| Germany: 8.89% | ||||||||||||||||
Allianz AG (Financials, Insurance) | 1,800 | 317,078 | ||||||||||||||
Aurubis AG (Materials, Metals & Mining) | 1,600 | 102,358 | ||||||||||||||
Bayer AG (Health Care, Pharmaceuticals) | 3,200 | 150,370 | ||||||||||||||
Bayerische Motoren Werke AG (Consumer Discretionary, Automobiles) | 2,200 | 150,345 | ||||||||||||||
Brenntag AG (Industrials, Trading Companies & Distributors) | 455 | 29,082 | ||||||||||||||
Daimler AG (Consumer Discretionary, Automobiles) | 4,100 | 211,923 | ||||||||||||||
Delivery Hero AG (Consumer Discretionary, Internet & Direct Marketing Retail) 144A† | 251 | 28,813 | ||||||||||||||
Deutsche Boerse AG (Financials, Capital Markets) | 9,974 | 1,469,704 | ||||||||||||||
Deutsche Post AG (Industrials, Air Freight & Logistics) | 8,300 | 368,005 | ||||||||||||||
Deutsche Telekom AG (Communication Services, Diversified Telecommunication Services) | 51,361 | 780,623 | ||||||||||||||
E.ON SE (Utilities, Multi-Utilities) | 27,556 | 286,973 | ||||||||||||||
Fresenius SE & Company KGaA (Health Care, Health Care Providers & Services) | 3,600 | 133,536 | ||||||||||||||
Metro AG (Consumer Staples, Food & Staples Retailing) | 20,829 | 204,257 | ||||||||||||||
Muenchener Rueckversicherungs Gesellschaft AG (Financials, Insurance) | 3,728 | 873,758 | ||||||||||||||
Rheinmetall AG (Industrials, Industrial Conglomerates) | 7,785 | 568,957 | ||||||||||||||
Siemens AG (Industrials, Industrial Conglomerates) | 7,755 | 909,786 | ||||||||||||||
Siemens Energy AG (Industrials, Electrical Equipment) † | 4,922 | 107,769 | ||||||||||||||
Symrise AG (Materials, Chemicals) | 2,274 | 280,408 | ||||||||||||||
United Internet AG (Communication Services, Diversified Telecommunication Services) | 3,600 | 126,247 | ||||||||||||||
The accompanying notes are an integral part of these financial statements.
Wells Fargo Diversified International Fund | 13
Table of Contents
Portfolio of investments—October 31, 2020
| Shares | Value | |||||||||||||||
| Germany (continued) | ||||||||||||||||
Volkswagen AG (Consumer Discretionary, Automobiles) | 1,600 | $ | 248,900 | |||||||||||||
| 7,348,892 | ||||||||||||||||
|
| |||||||||||||||
| Hong Kong: 3.46% | ||||||||||||||||
AIA Group Limited (Financials, Insurance) | 107,800 | 1,025,951 | ||||||||||||||
China Mobile Limited (Communication Services, Wireless Telecommunication Services) | 24,500 | 149,855 | ||||||||||||||
CK Hutchison Holdings Limited (Industrials, Industrial Conglomerates) | 22,300 | 134,691 | ||||||||||||||
Kingboard Laminates Holdings Limited (Information Technology, Electronic Equipment, Instruments & Components) | 129,500 | 206,979 | ||||||||||||||
Sinotruk Hong Kong Limited (Industrials, Machinery) | 59,500 | 152,192 | ||||||||||||||
Skyworth Digital Holdings Limited (Consumer Discretionary, Household Durables) † | 143,588 | 37,614 | ||||||||||||||
Xinyi Glass Holdings Limited (Consumer Discretionary, Auto Components) | 492,000 | 1,080,450 | ||||||||||||||
Yue Yuen Industrial Holdings Limited (Consumer Discretionary, Textiles, Apparel & Luxury Goods) | 42,000 | 68,410 | ||||||||||||||
| 2,856,142 | ||||||||||||||||
|
| |||||||||||||||
| Hungary: 0.09% | ||||||||||||||||
Richter Gedeon (Health Care, Pharmaceuticals) | 3,500 | 71,461 | ||||||||||||||
|
| |||||||||||||||
| India: 0.43% | ||||||||||||||||
Reliance Industries Limited (Energy, Oil, Gas & Consumable Fuels) | 12,786 | 354,489 | ||||||||||||||
|
| |||||||||||||||
| Ireland: 6.30% | ||||||||||||||||
Accenture plc Class A (Information Technology, IT Services) | 2,787 | 604,528 | ||||||||||||||
Aon plc Class A (Financials, Insurance) | 5,305 | 976,173 | ||||||||||||||
C&C Group plc (Consumer Staples, Beverages) | 12,300 | 25,771 | ||||||||||||||
CRH plc (Materials, Construction Materials) | 5,055 | 176,883 | ||||||||||||||
Greencore Group plc (Consumer Staples, Food Products) | 326,551 | 382,306 | ||||||||||||||
Linde plc (Materials, Chemicals) | 7,521 | 1,648,340 | ||||||||||||||
Medtronic plc (Health Care, Health Care Equipment & Supplies) | 7,048 | 708,817 | ||||||||||||||
Smurfit Kappa Group plc (Materials, Containers & Packaging) | 4,300 | 162,020 | ||||||||||||||
Willis Towers Watson plc (Financials, Insurance) | 2,858 | 521,528 | ||||||||||||||
| 5,206,366 | ||||||||||||||||
|
| |||||||||||||||
| Israel: 1.87% | ||||||||||||||||
Check Point Software Technologies Limited (Information Technology, Software) † | 6,309 | 716,450 | ||||||||||||||
Nice Systems Limited ADR (Information Technology, Software) † | 3,616 | 825,388 | ||||||||||||||
| 1,541,838 | ||||||||||||||||
|
| |||||||||||||||
| Italy: 1.58% | ||||||||||||||||
A2A SpA (Utilities, Multi-Utilities) | 104,600 | 132,841 | ||||||||||||||
Enel SpA (Utilities, Electric Utilities) | 40,200 | 319,610 | ||||||||||||||
Leonardo SpA (Industrials, Aerospace & Defense) | 9,300 | 44,344 | ||||||||||||||
Mediobanca SpA (Financials, Banks) | 23,400 | 166,133 | ||||||||||||||
Prysmian SpA (Industrials, Electrical Equipment) | 23,657 | 643,764 | ||||||||||||||
| 1,306,692 | ||||||||||||||||
|
| |||||||||||||||
| Japan: 13.17% | ||||||||||||||||
Adeka Corporation (Materials, Chemicals) | 13,000 | 168,113 | ||||||||||||||
AGC Incorporated (Industrials, Building Products) | 4,900 | 153,007 | ||||||||||||||
Alps Electric Company Limited (Information Technology, Electronic Equipment, Instruments & Components) | 54,700 | 789,175 | ||||||||||||||
Astellas Pharma Incorporated (Health Care, Pharmaceuticals) | 33,700 | 462,126 | ||||||||||||||
Daiwa House Industry Company Limited (Real Estate, Real Estate Management & Development) | 3,900 | 102,472 | ||||||||||||||
Daiwa Securities Group Incorporated (Financials, Capital Markets) | 189,200 | 766,604 | ||||||||||||||
Denka Company Limited (Materials, Chemicals) | 6,300 | 194,089 | ||||||||||||||
The accompanying notes are an integral part of these financial statements.
14 | Wells Fargo Diversified International Fund
Table of Contents
Portfolio of investments—October 31, 2020
| Shares | Value | |||||||||||||||
| Japan (continued) | ||||||||||||||||
DIC Incorporated (Materials, Chemicals) | 5,300 | $ | 129,033 | |||||||||||||
Hitachi Limited (Information Technology, Electronic Equipment, Instruments & Components) | 26,600 | 896,534 | ||||||||||||||
Honda Motor Company Limited (Consumer Discretionary, Automobiles) | 5,400 | 127,726 | ||||||||||||||
Hoya Corporation (Health Care, Health Care Equipment & Supplies) | 1,400 | 158,000 | ||||||||||||||
Isuzu Motors Limited (Consumer Discretionary, Automobiles) | 16,500 | 133,873 | ||||||||||||||
Itochu Corporation (Industrials, Trading Companies & Distributors) | 12,900 | 309,839 | ||||||||||||||
Japan Airlines Company Limited (Industrials, Airlines) † | 6,300 | 110,035 | ||||||||||||||
Kaken Pharmaceutical Company Limited (Health Care, Pharmaceuticals) | 700 | 27,570 | ||||||||||||||
KDDI Corporation (Communication Services, Wireless Telecommunication Services) | 20,000 | 541,100 | ||||||||||||||
Marubeni Corporation (Industrials, Trading Companies & Distributors) | 30,300 | 158,203 | ||||||||||||||
Mitsubishi Gas Chemical Company Incorporated (Materials, Chemicals) | 6,100 | 111,199 | ||||||||||||||
Mitsubishi UFJ Financial Group Incorporated (Financials, Banks) | 267,300 | 1,053,671 | ||||||||||||||
Mitsubishi UFJ Lease & Finance Company Limited (Financials, Diversified Financial Services) | 37,300 | 158,040 | ||||||||||||||
Mitsui Chemicals Incorporated (Materials, Chemicals) | 9,500 | 243,317 | ||||||||||||||
Mizuho Financial Group Incorporated (Financials, Banks) | 17,160 | 211,274 | ||||||||||||||
Nippon Shinyaku Company Limited (Health Care, Pharmaceuticals) | 5,300 | 378,717 | ||||||||||||||
Nippon Telegraph & Telephone Corporation (Communication Services, Diversified Telecommunication Services) | 25,000 | 525,896 | ||||||||||||||
Nomura Holdings Incorporated (Financials, Capital Markets) | 31,200 | 139,727 | ||||||||||||||
ORIX Corporation (Financials, Diversified Financial Services) | 16,500 | 192,971 | ||||||||||||||
Resona Holdings Incorporated (Financials, Banks) | 62,600 | 206,391 | ||||||||||||||
Sawai Pharmaceutical Company Limited (Health Care, Pharmaceuticals) | 2,100 | 101,219 | ||||||||||||||
Sojitz Corporation (Industrials, Trading Companies & Distributors) | 77,400 | 170,313 | ||||||||||||||
Sompo Holdings Incorporated (Financials, Insurance) | 3,200 | 119,475 | ||||||||||||||
Sony Corporation (Consumer Discretionary, Household Durables) | 3,600 | 300,119 | ||||||||||||||
Sumitomo Corporation (Industrials, Trading Companies & Distributors) | 9,400 | 102,841 | ||||||||||||||
Sumitomo Heavy Industries Limited (Industrials, Machinery) | 6,000 | 128,600 | ||||||||||||||
Sumitomo Mitsui Financial Group Incorporated (Financials, Banks) | 8,000 | 221,455 | ||||||||||||||
Taiyo Nippon Sanso Corporation (Materials, Chemicals) | 7,500 | 109,962 | ||||||||||||||
Takeda Pharmaceutical Company Limited (Health Care, Pharmaceuticals) | 23,100 | 713,850 | ||||||||||||||
Teijin Limited (Materials, Chemicals) | 5,700 | 87,312 | ||||||||||||||
The Yokohama Rubber Company Limited (Consumer Discretionary, Auto Components) | 7,600 | 109,169 | ||||||||||||||
Toyo Ink SC Holding Company Limited (Materials, Chemicals) | 7,360 | 136,751 | ||||||||||||||
UBE Industries Limited (Materials, Chemicals) | 7,900 | 135,627 | ||||||||||||||
| 10,885,395 | ||||||||||||||||
|
| |||||||||||||||
| Luxembourg: 0.64% | ||||||||||||||||
Samsonite International SA (Consumer Discretionary, Textiles, Apparel & Luxury Goods) † | 515,400 | 525,785 | ||||||||||||||
|
| |||||||||||||||
| Mexico: 0.38% | ||||||||||||||||
Fresnillo plc (Materials, Metals & Mining) | 20,771 | 313,279 | ||||||||||||||
|
| |||||||||||||||
| Netherlands: 5.44% | ||||||||||||||||
Aegon NV (Financials, Insurance) | 23,200 | 62,408 | ||||||||||||||
Airbus SE (Industrials, Aerospace & Defense) † | 2,684 | 196,378 | ||||||||||||||
Argenx SE ADR (Health Care, Biotechnology) † | 487 | 120,839 | ||||||||||||||
ING Groep NV (Financials, Banks) † | 15,800 | 108,226 | ||||||||||||||
Koninklijke Ahold Delhaize NV (Consumer Staples, Food & Staples Retailing) | 14,600 | 400,270 | ||||||||||||||
Koninklijke DSM NV (Materials, Chemicals) | 5,078 | 812,112 | ||||||||||||||
Koninklijke Philips NV (Health Care, Health Care Equipment & Supplies) † | 23,197 | 1,074,410 | ||||||||||||||
NN Group NV (Financials, Insurance) | 21,271 | 740,251 | ||||||||||||||
NXP Semiconductors NV (Information Technology, Semiconductors & Semiconductor Equipment) | 1,360 | 183,763 | ||||||||||||||
OCI NV (Materials, Chemicals) † | 39,719 | 475,506 | ||||||||||||||
Prosus NV (Consumer Discretionary, Internet & Direct Marketing Retail) | 3,238 | 323,269 | ||||||||||||||
| 4,497,432 | ||||||||||||||||
|
| |||||||||||||||
The accompanying notes are an integral part of these financial statements.
Wells Fargo Diversified International Fund | 15
Table of Contents
Portfolio of investments—October 31, 2020
| Shares | Value | |||||||||||||||
| Norway: 0.87% |
| |||||||||||||||
Adevinta ASA (Communication Services, Interactive Media & Services) † | 1,755 | $ | 27,116 | |||||||||||||
Den Norske Bank ASA (Financials, Banks) † | 51,014 | 688,933 | ||||||||||||||
| 716,049 | ||||||||||||||||
|
| |||||||||||||||
| Portugal: 0.38% | ||||||||||||||||
Energias de Portugal SA (Utilities, Electric Utilities) | 63,278 | 312,129 | ||||||||||||||
|
| |||||||||||||||
| Russia: 0.94% | ||||||||||||||||
Gazprom Neft ADR (Energy, Oil, Gas & Consumable Fuels) | 4,800 | 81,076 | ||||||||||||||
LUKOIL PJSC ADR (Energy, Oil, Gas & Consumable Fuels) | 4,200 | 214,578 | ||||||||||||||
Mobile TeleSystems PJSC ADR (Communication Services, Wireless Telecommunication Services) | 61,278 | 479,194 | ||||||||||||||
| 774,848 | ||||||||||||||||
|
| |||||||||||||||
| Singapore: 0.24% | ||||||||||||||||
DBS Group Holdings Limited (Financials, Banks) | 6,400 | 95,333 | ||||||||||||||
United Overseas Bank Limited (Financials, Banks) | 7,200 | 100,040 | ||||||||||||||
| 195,373 | ||||||||||||||||
|
| |||||||||||||||
| South Africa: 0.11% | ||||||||||||||||
Absa Group Limited (Financials, Banks) | 12,600 | 67,731 | ||||||||||||||
Imperial Holdings Limited (Consumer Discretionary, Distributors) | 5,500 | 11,629 | ||||||||||||||
Motus Holdings Limited (Consumer Discretionary, Specialty Retail) † | 5,500 | 14,160 | ||||||||||||||
| 93,520 | ||||||||||||||||
|
| |||||||||||||||
| South Korea: 3.64% | ||||||||||||||||
BNK Financial Group Incorporated (Financials, Banks) | 1,018 | 4,973 | ||||||||||||||
Coway Company Limited (Consumer Discretionary, Household Durables) † | 4,645 | 284,425 | ||||||||||||||
Hana Financial Group Incorporated (Financials, Banks) | 18,752 | 506,538 | ||||||||||||||
Hyundai Greenfood Company Limited (Consumer Staples, Food & Staples Retailing) | 14,600 | 93,910 | ||||||||||||||
Industrial Bank of Korea (Financials, Banks) | 12,900 | 93,662 | ||||||||||||||
JB Financial Group Company Limited (Financials, Banks) | 1,964 | 8,873 | ||||||||||||||
KT&G Corporation (Consumer Staples, Tobacco) | 2,300 | 164,230 | ||||||||||||||
LG Uplus Corporation (Communication Services, Diversified Telecommunication Services) | 9,600 | 93,980 | ||||||||||||||
Samsung Electronics Company Limited GDR (Information Technology, Technology Hardware, Storage & Peripherals) 144A | 740 | 933,562 | ||||||||||||||
SK Telecom Company Limited (Communication Services, Wireless Telecommunication Services) | 3,949 | 748,843 | ||||||||||||||
Woori Financial Group Incorporated (Financials, Banks) | 9,800 | 77,377 | ||||||||||||||
| 3,010,373 | ||||||||||||||||
|
| |||||||||||||||
| Spain: 0.48% | ||||||||||||||||
Banco Santander Central Hispano SA (Financials, Banks) | 29,500 | 59,075 | ||||||||||||||
Enagás SA (Utilities, Gas Utilities) | 5,600 | 120,869 | ||||||||||||||
Faes Farma SA (Health Care, Pharmaceuticals) | 25,800 | 97,229 | ||||||||||||||
International Consolidated Airlines Group SA (Industrials, Airlines) | 17,900 | 22,386 | ||||||||||||||
Repsol YPF SA (Energy, Oil, Gas & Consumable Fuels) | 16,200 | 101,705 | ||||||||||||||
| 401,264 | ||||||||||||||||
|
| |||||||||||||||
| Sweden: 1.39% | ||||||||||||||||
Boliden AB (Materials, Metals & Mining) | 6,700 | 182,703 | ||||||||||||||
Ericsson LM Class B (Information Technology, Communications Equipment) | 42,964 | 479,672 | ||||||||||||||
Securitas AB Class B (Industrials, Commercial Services & Supplies) † | 8,500 | 119,985 | ||||||||||||||
Volvo AB Class B (Industrials, Machinery) † | 18,800 | 365,419 | ||||||||||||||
| 1,147,779 | ||||||||||||||||
|
| |||||||||||||||
The accompanying notes are an integral part of these financial statements.
16 | Wells Fargo Diversified International Fund
Table of Contents
Portfolio of investments—October 31, 2020
| Shares | Value | |||||||||||||||
| Switzerland: 8.84% |
| |||||||||||||||
Baloise Holding AG (Financials, Insurance) | 1,400 | $ | 191,457 | |||||||||||||
Idorsia Limited (Health Care, Biotechnology) † | 9,447 | 247,913 | ||||||||||||||
LafargeHolcim Limited (Materials, Construction Materials) | 19,470 | 835,645 | ||||||||||||||
Lonza Group AG (Health Care, Life Sciences Tools & Services) | 750 | 454,433 | ||||||||||||||
Medacta Group SA (Health Care, Health Care Equipment & Supplies) 144A† | 1,838 | 155,876 | ||||||||||||||
Nestle SA (Consumer Staples, Food Products) | 10,513 | 1,182,480 | ||||||||||||||
Novartis AG (Health Care, Pharmaceuticals) | 17,955 | 1,399,100 | ||||||||||||||
Roche Holding AG (Health Care, Pharmaceuticals) | 6,371 | 2,047,199 | ||||||||||||||
Swiss Life Holding AG (Financials, Insurance) | 700 | 235,472 | ||||||||||||||
Temenos AG (Information Technology, Software) | 1,739 | 186,893 | ||||||||||||||
UBS Group AG (Financials, Capital Markets) | 10,600 | 123,405 | ||||||||||||||
Valiant Holding AG (Financials, Banks) | 600 | 48,138 | ||||||||||||||
Zurich Insurance Group AG (Financials, Insurance) | 600 | 199,287 | ||||||||||||||
| 7,307,298 | ||||||||||||||||
|
| |||||||||||||||
| Taiwan: 1.13% | ||||||||||||||||
Powertech Technology Incorporated (Information Technology, Semiconductors & Semiconductor Equipment) | 51,000 | 150,901 | ||||||||||||||
Taiwan Semiconductor Manufacturing Company Limited (Information Technology, Semiconductors & Semiconductor Equipment) | 33,000 | 499,279 | ||||||||||||||
Tripod Technology Corporation (Information Technology, Electronic Equipment, Instruments & Components) | 27,000 | 107,370 | ||||||||||||||
Zhen Ding Technology Holding (Information Technology, Electronic Equipment, Instruments & Components) | 42,000 | 178,002 | ||||||||||||||
| 935,552 | ||||||||||||||||
|
| |||||||||||||||
| Turkey: 0.13% | ||||||||||||||||
Coca-Cola Icecek Uretim AS (Consumer Staples, Beverages) | 19,900 | 106,905 | ||||||||||||||
|
| |||||||||||||||
| United Kingdom: 10.25% | ||||||||||||||||
3i Group plc (Financials, Capital Markets) | 18,800 | 234,806 | ||||||||||||||
Anglo American plc (Materials, Metals & Mining) | 11,100 | 260,441 | ||||||||||||||
AVEVA Group plc (Information Technology, Software) | 7,393 | 410,369 | ||||||||||||||
Aviva plc (Financials, Insurance) | 22,000 | 73,383 | ||||||||||||||
Babcock International Group plc (Industrials, Commercial Services & Supplies) | 2,100 | 5,916 | ||||||||||||||
BAE Systems plc (Industrials, Aerospace & Defense) | 56,500 | 290,432 | ||||||||||||||
Barratt Developments plc (Consumer Discretionary, Household Durables) | 17,200 | 107,510 | ||||||||||||||
Bellway plc (Consumer Discretionary, Household Durables) | 4,200 | 127,072 | ||||||||||||||
Bovis Homes Group plc (Consumer Discretionary, Household Durables) † | 9,181 | 64,781 | ||||||||||||||
BP plc (Energy, Oil, Gas & Consumable Fuels) | 14,200 | 36,220 | ||||||||||||||
British American Tobacco plc (Consumer Staples, Tobacco) | 5,700 | 180,664 | ||||||||||||||
BT Group plc (Communication Services, Diversified Telecommunication Services) | 33,500 | 43,997 | ||||||||||||||
Centrica plc (Utilities, Multi-Utilities) | 68,900 | 33,182 | ||||||||||||||
Coca-Cola European Partners plc (Consumer Staples, Beverages) | 6,150 | 219,617 | ||||||||||||||
ConvaTec Group plc (Health Care, Health Care Equipment & Supplies) 144A | 200,717 | 469,865 | ||||||||||||||
Crest Nicholson Holdings plc (Consumer Discretionary, Household Durables) † | 20,500 | 58,296 | ||||||||||||||
Diageo plc (Consumer Staples, Beverages) | 11,549 | 373,239 | ||||||||||||||
GlaxoSmithKline plc (Health Care, Pharmaceuticals) | 23,900 | 399,094 | ||||||||||||||
Imperial Brands plc (Consumer Staples, Tobacco) | 7,800 | 123,456 | ||||||||||||||
Inchcape plc (Consumer Discretionary, Distributors) † | 15,100 | 96,862 | ||||||||||||||
J Sainsbury plc (Consumer Staples, Food & Staples Retailing) | 37,300 | 97,361 | ||||||||||||||
John Wood Group plc (Energy, Energy Equipment & Services) † | 148,843 | 408,588 | ||||||||||||||
Kingfisher plc (Consumer Discretionary, Specialty Retail) † | 225,801 | 839,751 | ||||||||||||||
Legal & General Group plc (Financials, Insurance) | 48,900 | 117,243 | ||||||||||||||
Lloyds Banking Group plc (Financials, Banks) † | 134,900 | 49,118 | ||||||||||||||
Man Group plc (Financials, Capital Markets) | 190,348 | 265,624 | ||||||||||||||
The accompanying notes are an integral part of these financial statements.
Wells Fargo Diversified International Fund | 17
Table of Contents
Portfolio of investments—October 31, 2020
| Shares | Value | |||||||||||||||
| United Kingdom (continued) | ||||||||||||||||
Marks & Spencer Group plc (Consumer Discretionary, Multiline Retail) | 44,100 | $ | 50,807 | |||||||||||||
Nomad Foods Limited (Consumer Staples, Food Products) † | 37,917 | 919,487 | ||||||||||||||
QinetiQ Group plc (Industrials, Aerospace & Defense) | 22,000 | 67,382 | ||||||||||||||
Redrow plc (Consumer Discretionary, Household Durables) † | 23,047 | 124,261 | ||||||||||||||
RELX plc (Industrials, Professional Services) | 8,694 | 172,036 | ||||||||||||||
Royal Dutch Shell plc Class B (Energy, Oil, Gas & Consumable Fuels) | 21,300 | 256,864 | ||||||||||||||
Royal Mail plc (Industrials, Air Freight & Logistics) | 8,300 | 24,430 | ||||||||||||||
Sensata Technologies Holding plc (Industrials, Electrical Equipment) † | 9,144 | 399,684 | ||||||||||||||
Smiths Group plc (Industrials, Industrial Conglomerates) | 45,975 | 792,149 | ||||||||||||||
Tate & Lyle plc (Consumer Staples, Food Products) | 15,700 | 121,028 | ||||||||||||||
Tesco plc (Consumer Staples, Food & Staples Retailing) | 60,000 | 159,693 | ||||||||||||||
| 8,474,708 | ||||||||||||||||
|
| |||||||||||||||
| United States: 3.87% | ||||||||||||||||
Advance Auto Parts Incorporated (Consumer Discretionary, Specialty Retail) | 3,029 | 446,111 | ||||||||||||||
Alphabet Incorporated Class A (Communication Services, Interactive Media & Services) † | 296 | 478,369 | ||||||||||||||
Alphabet Incorporated Class C (Communication Services, Interactive Media & Services) † | 121 | 196,142 | ||||||||||||||
Amazon.com Incorporated (Consumer Discretionary, Internet & Direct Marketing Retail) † | 234 | 710,459 | ||||||||||||||
Berry Global Group Incorporated (Materials, Containers & Packaging) † | 9,189 | 428,483 | ||||||||||||||
Gentex Corporation (Consumer Discretionary, Auto Components) | 33,847 | 936,548 | ||||||||||||||
| 3,196,112 | ||||||||||||||||
|
| |||||||||||||||
Total Common Stocks (Cost $74,751,670) | 79,768,955 | |||||||||||||||
|
| |||||||||||||||
Expiration date | ||||||||||||||||
| Participation Notes: 0.76% | ||||||||||||||||
| United Kingdom: 0.76% | ||||||||||||||||
HSBC Bank plc (Ryanair Holdings plc) (Industrial, Airlines) †(a) | 10-29-2021 | 45,587 | 629,252 | |||||||||||||
|
| |||||||||||||||
Total Participation Notes (Cost $706,102) | 629,252 | |||||||||||||||
|
| |||||||||||||||
| Yield | ||||||||||||||||
| Short-Term Investments: 0.95% | ||||||||||||||||
| Investment Companies: 0.95% | ||||||||||||||||
Wells Fargo Government Money Market Fund Select Class (l)(u) | 0.03 | % | 784,981 | 784,981 | ||||||||||||
|
| |||||||||||||||
Total Short-Term Investments (Cost $784,981) | 784,981 | |||||||||||||||
|
| |||||||||||||||
| Total investments in securities (Cost $76,242,753) | 98.23 | % | 81,183,188 | |||||
Other assets and liabilities, net | 1.77 | 1,459,038 | ||||||
|
|
|
| |||||
| Total net assets | 100.00 | % | $ | 82,642,226 | ||||
|
|
|
| |||||
| † | Non-income-earning security |
| 144A | The security may be resold in transactions exempt from registration, normally to qualified institutional buyers, pursuant to Rule 144A under the Securities Act of 1933. |
| (a) | The security is fair valued in accordance with procedures approved by the Board of Trustees. |
| (l) | The issuer of the security is an affiliated person of the Fund as defined in the Investment Company Act of 1940. |
| (u) | The rate represents the 7-day annualized yield at period end. |
The accompanying notes are an integral part of these financial statements.
18 | Wells Fargo Diversified International Fund
Table of Contents
Portfolio of investments—October 31, 2020
Forward Foreign Currency Contracts
| Currency to be received | Currency to be delivered | Counterparty | Settlement date | Unrealized gains | Unrealized losses | |||||||||
| 526,909 USD | 402,000 GBP | Barclays Bank plc | 11-17-2020 | $ | 6,072 | $ | 0 | |||||||
Investments in Affiliates
An affiliated investment is an investment in which the Fund owns at least 5% of the outstanding voting shares of the issuer or as a result of other relationships, such as the Fund and the issuer having the same investment manager. Transactions with issuers that were either affiliated persons of the Fund at the beginning of the period or the end of the period were as follows:
| Value, beginning of period | Purchases | Sales proceeds | Net realized gains (losses) | Net change in unrealized gains (losses) | Value, end of period | % of net assets | Shares, end of period | Income from affiliated securities | ||||||||||||||||||||||||||||
| Short-Term Investments | ||||||||||||||||||||||||||||||||||||
Investment Companies | ||||||||||||||||||||||||||||||||||||
Securities Lending Cash Investments LLC * | $ | 1,463,656 | $ | 6,645,042 | $ | (8,108,841 | ) | $ | 142 | $ | 1 | $ | 0 | 0 | $ | 12,575 | # | |||||||||||||||||||
Wells Fargo Government Money Market Fund Select Class | 1,895,943 | 25,458,601 | (26,569,563 | ) | 0 | 0 | 784,981 | 784,981 | 15,975 | |||||||||||||||||||||||||||
|
|
|
|
|
|
|
|
|
| |||||||||||||||||||||||||||
| $ | 142 | $ | 1 | $ | 784,981 | 0.95 | % | $ | 28,550 | |||||||||||||||||||||||||||
|
|
|
|
|
|
|
|
|
| |||||||||||||||||||||||||||
| * | No longer held at end of period. |
| # | Amount shown represents income before fees and rebates. |
The accompanying notes are an integral part of these financial statements.
Wells Fargo Diversified International Fund | 19
Table of Contents
Statement of assets and liabilities—October 31, 2020
Assets | ||||
Investments in unaffiliated securities, at value (cost $75,457,772) | $ | 80,398,207 | ||
Investments in affiliated securities, at value (cost $784,981) | 784,981 | |||
Cash | 11,973 | |||
Foreign currency, at value (cost $167,438) | 167,001 | |||
Receivable for investments sold | 1,128,841 | |||
Receivable for Fund shares sold | 178,430 | |||
Receivable for dividends | 523,230 | |||
Receivable for securities lending income, net | 90 | |||
Unrealized gains on forward foreign currency contracts | 6,072 | |||
Prepaid expenses and other assets | 21,621 | |||
|
| |||
Total assets | 83,220,446 | |||
|
| |||
Liabilities | ||||
Payable for investments purchased | 280,678 | |||
Payable for Fund shares redeemed | 72,736 | |||
Management fee payable | 103,398 | |||
Administration fees payable | 11,096 | |||
Distribution fee payable | 494 | |||
Custody and accounting fees payable | 52,073 | |||
Trustees’ fees and expenses payable | 3,335 | |||
Accrued expenses and other liabilities | 54,410 | |||
|
| |||
Total liabilities | 578,220 | |||
|
| |||
Total net assets | $ | 82,642,226 | ||
|
| |||
Net assets consist of | ||||
Paid-in capital | $ | 86,923,345 | ||
Total distributable loss | (4,281,119 | ) | ||
|
| |||
Total net assets | $ | 82,642,226 | ||
|
| |||
Computation of net asset value and offering price per share | ||||
Net assets – Class A | $ | 43,916,449 | ||
Shares outstanding – Class A1 | 3,818,467 | |||
Net asset value per share – Class A | $11.50 | |||
Maximum offering price per share – Class A2 | $12.20 | |||
Net assets – Class C | $ | 682,489 | ||
Shares outstanding – Class C1 | 64,548 | |||
Net asset value per share – Class C | $10.57 | |||
Net assets – Class R6 | $ | 23,251,364 | ||
Shares outstanding – Class R61 | 1,970,088 | |||
Net asset value per share – Class R6 | $11.80 | |||
Net assets – Administrator Class | $ | 10,777,888 | ||
Shares outstanding – Administrator Class1 | 919,227 | |||
Net asset value per share – Administrator Class | $11.72 | |||
Net assets – Institutional Class | $ | 4,014,036 | ||
Shares outstanding – Institutional Class1 | 368,178 | |||
Net asset value per share – Institutional Class | $10.90 | |||
| 1 | The Fund has an unlimited number of authorized shares. |
| 2 | Maximum offering price is computed as 100/94.25 of net asset value. On investments of $50,000 or more, the offering price is reduced. |
The accompanying notes are an integral part of these financial statements.
20 | Wells Fargo Diversified International Fund
Table of Contents
Statement of operations—year ended October 31, 2020
Investment income | ||||
Dividends (net of foreign withholding taxes of $214,420) | $ | 2,071,156 | ||
Income from affiliated securities | 26,721 | |||
|
| |||
Total investment income | 2,097,877 | |||
|
| |||
Expenses | ||||
Management fee | 764,604 | |||
Administration fees | ||||
Class A | 101,786 | |||
Class C | 2,103 | |||
Class R6 | 7,189 | |||
Administrator Class | 15,695 | |||
Institutional Class | 5,782 | |||
Shareholder servicing fees | ||||
Class A | 121,032 | |||
Class C | 2,501 | |||
Administrator Class | 30,154 | |||
Distribution fee | ||||
Class C | 7,490 | |||
Custody and accounting fees | 147,822 | |||
Professional fees | 44,876 | |||
Registration fees | 55,465 | |||
Shareholder report expenses | 46,970 | |||
Trustees’ fees and expenses | 21,096 | |||
Other fees and expenses | 67,240 | |||
|
| |||
Total expenses | 1,441,805 | |||
Less: Fee waivers and/or expense reimbursements | ||||
Fund-level | (349,190 | ) | ||
Class A | (15,458 | ) | ||
Class R6 | (5,937 | ) | ||
Administrator Class | (1,857 | ) | ||
Institutional Class | (1,251 | ) | ||
|
| |||
Net expenses | 1,068,112 | |||
|
| |||
Net investment income | 1,029,765 | |||
|
| |||
Realized and unrealized gains (losses) on investments | ||||
Net realized gains (losses) on | ||||
Unaffiliated securities | (2,195,281 | ) | ||
Affiliated securities | 142 | |||
Forward foreign currency contracts | (252,693 | ) | ||
|
| |||
Net realized losses on investments | (2,447,832 | ) | ||
|
| |||
Net change in unrealized gains (losses) on | ||||
Unaffiliated securities | (7,281,042 | ) | ||
Affiliated securities | 1 | |||
Forward foreign currency contracts | 118,444 | |||
|
| |||
Net change in unrealized gains (losses) on investments | (7,162,597 | ) | ||
|
| |||
Net realized and unrealized gains (losses) on investments | (9,610,429 | ) | ||
|
| |||
Net decrease in net assets resulting from operations | $ | (8,580,664 | ) | |
|
| |||
The accompanying notes are an integral part of these financial statements.
Wells Fargo Diversified International Fund | 21
Table of Contents
Statement of changes in net assets
| Year ended October 31, 2020 | Year ended October 31, 2019 | |||||||||||||||
Operations | ||||||||||||||||
Net investment income | $ | 1,029,765 | $ | 2,013,938 | ||||||||||||
Net realized gains (losses) on investments | (2,447,832 | ) | 431,264 | |||||||||||||
Net change in unrealized gains (losses) on investments | (7,162,597 | ) | 6,134,831 | |||||||||||||
|
| |||||||||||||||
Net increase (decrease) in net assets resulting from operations | (8,580,664 | ) | 8,580,033 | |||||||||||||
|
| |||||||||||||||
Distributions to shareholders from net investment income and net realized gains |
| |||||||||||||||
Class A | (1,068,698 | ) | (1,117,631 | ) | ||||||||||||
Class C | (13,100 | ) | (23,783 | ) | ||||||||||||
Class R6 | (618,683 | ) | (716,722 | ) | ||||||||||||
Administrator Class | (270,064 | ) | (270,088 | ) | ||||||||||||
Institutional Class | (111,059 | ) | (126,725 | ) | ||||||||||||
|
| |||||||||||||||
Total distributions to shareholders | (2,081,604 | ) | (2,254,949 | ) | ||||||||||||
|
| |||||||||||||||
Capital share transactions | Shares | Shares | ||||||||||||||
Proceeds from shares sold | ||||||||||||||||
Class A | 113,408 | 1,327,063 | 111,229 | 1,356,596 | ||||||||||||
Class C | 10,419 | 112,161 | 6,717 | 72,885 | ||||||||||||
Class R6 | 71,928 | 749,300 | 57,338 | 686,446 | ||||||||||||
Administrator Class | 181,901 | 2,152,543 | 158,327 | 1,962,086 | ||||||||||||
Institutional Class | 171,062 | 1,707,442 | 76,896 | 887,473 | ||||||||||||
|
| |||||||||||||||
| 6,048,509 | 4,965,486 | |||||||||||||||
|
| |||||||||||||||
Reinvestment of distributions | ||||||||||||||||
Class A | 78,823 | 1,053,071 | 99,537 | 1,100,884 | ||||||||||||
Class C | 927 | 11,455 | 2,096 | 21,423 | ||||||||||||
Class R6 | 7,562 | 103,306 | 17,878 | 202,018 | ||||||||||||
Administrator Class | 19,811 | 269,633 | 23,957 | 269,756 | ||||||||||||
Institutional Class | 8,697 | 109,848 | 11,996 | 125,479 | ||||||||||||
|
| |||||||||||||||
| 1,547,313 | 1,719,560 | |||||||||||||||
|
| |||||||||||||||
Payment for shares redeemed | ||||||||||||||||
Class A | (558,146 | ) | (6,658,227 | ) | (500,862 | ) | (6,110,610 | ) | ||||||||
Class C | (53,787 | ) | (598,040 | ) | (112,305 | ) | (1,263,134 | ) | ||||||||
Class R6 | (32,060 | ) | (369,171 | ) | (372,557 | ) | (4,728,700 | ) | ||||||||
Administrator Class | (277,583 | ) | (3,332,480 | ) | (201,419 | ) | (2,495,504 | ) | ||||||||
Institutional Class | (178,643 | ) | (1,908,557 | ) | (119,836 | ) | (1,388,392 | ) | ||||||||
|
| |||||||||||||||
| (12,866,475 | ) | (15,986,340 | ) | |||||||||||||
|
| |||||||||||||||
Net decrease in net assets resulting from capital share transactions | (5,270,653 | ) | (9,301,294 | ) | ||||||||||||
|
| |||||||||||||||
Total decrease in net assets | (15,932,921 | ) | (2,976,210 | ) | ||||||||||||
|
| |||||||||||||||
Net assets | ||||||||||||||||
Beginning of period | 98,575,147 | 101,551,357 | ||||||||||||||
|
| |||||||||||||||
End of period | $ | 82,642,226 | $ | 98,575,147 | ||||||||||||
|
| |||||||||||||||
The accompanying notes are an integral part of these financial statements.
22 | Wells Fargo Diversified International Fund
Table of Contents
(For a share outstanding throughout each period)
| Year ended October 31 | ||||||||||||||||||||
| CLASS A | 2020 | 2019 | 2018 | 2017 | 2016 | |||||||||||||||
Net asset value, beginning of period | $12.94 | $12.15 | $13.39 | $11.08 | $11.65 | |||||||||||||||
Net investment income | 0.10 | 0.23 | 0.21 | 0.19 | 0.17 | |||||||||||||||
Net realized and unrealized gains (losses) on investments | (1.28 | ) | 0.81 | (1.12 | ) | 2.34 | (0.63 | ) | ||||||||||||
|
|
|
|
|
|
|
|
|
| |||||||||||
Total from investment operations | (1.18 | ) | 1.04 | (0.91 | ) | 2.53 | (0.46 | ) | ||||||||||||
Distributions to shareholders from | ||||||||||||||||||||
Net investment income | (0.26 | ) | (0.25 | ) | (0.33 | ) | (0.22 | ) | (0.11 | ) | ||||||||||
Net asset value, end of period | $11.50 | $12.94 | $12.15 | $13.39 | $11.08 | |||||||||||||||
Total return1 | (9.41 | )% | 8.94 | % | (7.00 | )% | 23.27 | % | (3.96 | )% | ||||||||||
Ratios to average net assets (annualized) | ||||||||||||||||||||
Gross expenses | 1.74 | % | 1.77 | % | 1.71 | % | 1.80 | % | 1.79 | % | ||||||||||
Net expenses | 1.32 | % | 1.35 | % | 1.35 | % | 1.35 | % | 1.35 | % | ||||||||||
Net investment income | 1.00 | % | 1.91 | % | 1.61 | % | 1.64 | % | 1.67 | % | ||||||||||
Supplemental data | ||||||||||||||||||||
Portfolio turnover rate | 48 | % | 28 | % | 39 | % | 42 | % | 50 | % | ||||||||||
Net assets, end of period (000s omitted) | $43,916 | $54,146 | $54,358 | $64,347 | $61,031 | |||||||||||||||
| 1 | Total return calculations do not include any sales charges. |
The accompanying notes are an integral part of these financial statements.
Wells Fargo Diversified International Fund | 23
Table of Contents
Financial highlights
(For a share outstanding throughout each period)
| Year ended October 31 | ||||||||||||||||||||
| CLASS C | 2020 | 2019 | 2018 | 2017 | 2016 | |||||||||||||||
Net asset value, beginning of period | $11.88 | $11.12 | $12.27 | $10.16 | $10.74 | |||||||||||||||
Net investment income | 0.02 | 1 | 0.12 | 1 | 0.10 | 1 | 0.10 | 1 | 0.10 | 1 | ||||||||||
Net realized and unrealized gains (losses) on investments | (1.20 | ) | 0.76 | (1.02 | ) | 2.15 | (0.60 | ) | ||||||||||||
|
|
|
|
|
|
|
|
|
| |||||||||||
Total from investment operations | (1.18 | ) | 0.88 | (0.92 | ) | 2.25 | (0.50 | ) | ||||||||||||
Distributions to shareholders from | ||||||||||||||||||||
Net investment income | (0.13 | ) | (0.12 | ) | (0.23 | ) | (0.14 | ) | (0.08 | ) | ||||||||||
Net asset value, end of period | $10.57 | $11.88 | $11.12 | $12.27 | $10.16 | |||||||||||||||
Total return2 | (10.10 | )% | 8.09 | % | (7.76 | )% | 22.51 | % | (4.72 | )% | ||||||||||
Ratios to average net assets (annualized) | ||||||||||||||||||||
Gross expenses | 2.49 | % | 2.51 | % | 2.46 | % | 2.55 | % | 2.54 | % | ||||||||||
Net expenses | 2.10 | % | 2.10 | % | 2.10 | % | 2.10 | % | 2.10 | % | ||||||||||
Net investment income | 0.21 | % | 1.08 | % | 0.81 | % | 0.92 | % | 1.01 | % | ||||||||||
Supplemental data | ||||||||||||||||||||
Portfolio turnover rate | 48 | % | 28 | % | 39 | % | 42 | % | 50 | % | ||||||||||
Net assets, end of period (000s omitted) | $682 | $1,271 | $2,340 | $4,066 | $4,351 | |||||||||||||||
| 1 | Calculated based upon average shares outstanding |
| 2 | Total return calculations do not include any sales charges. |
The accompanying notes are an integral part of these financial statements.
24 | Wells Fargo Diversified International Fund
Table of Contents
Financial highlights
(For a share outstanding throughout each period)
| Year ended October 31 | ||||||||||||||||||||
| CLASS R6 | 2020 | 2019 | 2018 | 2017 | 2016 | |||||||||||||||
Net asset value, beginning of period | $13.28 | $12.47 | $13.71 | $11.33 | $11.87 | |||||||||||||||
Net investment income | 0.19 | 0.31 | 0.31 | 0.30 | 1 | 0.26 | 1 | |||||||||||||
Net realized and unrealized gains (losses) on investments | (1.35 | ) | 0.82 | (1.18 | ) | 2.34 | (0.68 | ) | ||||||||||||
|
|
|
|
|
|
|
|
|
| |||||||||||
Total from investment operations | (1.16 | ) | 1.13 | (0.87 | ) | 2.64 | (0.42 | ) | ||||||||||||
Distributions to shareholders from | ||||||||||||||||||||
Net investment income | (0.32 | ) | (0.32 | ) | (0.37 | ) | (0.26 | ) | (0.12 | ) | ||||||||||
Net asset value, end of period | $11.80 | $13.28 | $12.47 | $13.71 | $11.33 | |||||||||||||||
Total return | (9.05 | )% | 9.52 | % | (6.61 | )% | 23.88 | % | (3.55 | )% | ||||||||||
Ratios to average net assets (annualized) | ||||||||||||||||||||
Gross expenses | 1.31 | % | 1.34 | % | 1.28 | % | 1.34 | % | 1.36 | % | ||||||||||
Net expenses | 0.89 | % | 0.89 | % | 0.89 | % | 0.89 | % | 0.89 | % | ||||||||||
Net investment income | 1.46 | % | 2.37 | % | 2.11 | % | 2.37 | % | 2.30 | % | ||||||||||
Supplemental data | ||||||||||||||||||||
Portfolio turnover rate | 48 | % | 28 | % | 39 | % | 42 | % | 50 | % | ||||||||||
Net assets, end of period (000s omitted) | $23,251 | $25,525 | $27,692 | $33,698 | $5,523 | |||||||||||||||
| 1 | Calculated based upon average shares outstanding |
The accompanying notes are an integral part of these financial statements.
Wells Fargo Diversified International Fund | 25
Table of Contents
Financial highlights
(For a share outstanding throughout each period)
| Year ended October 31 | ||||||||||||||||||||
| ADMINISTRATOR CLASS | 2020 | 2019 | 2018 | 2017 | 2016 | |||||||||||||||
Net asset value, beginning of period | $13.19 | $12.38 | $13.64 | $11.28 | $11.87 | |||||||||||||||
Net investment income | 0.13 | 1 | 0.25 | 1 | 0.23 | 1 | 0.22 | 1 | 0.20 | 1 | ||||||||||
Net realized and unrealized gains (losses) on investments | (1.33 | ) | 0.83 | (1.15 | ) | 2.37 | (0.66 | ) | ||||||||||||
|
|
|
|
|
|
|
|
|
| |||||||||||
Total from investment operations | (1.20 | ) | 1.08 | (0.92 | ) | 2.59 | (0.46 | ) | ||||||||||||
Distributions to shareholders from | ||||||||||||||||||||
Net investment income | (0.27 | ) | (0.27 | ) | (0.34 | ) | (0.23 | ) | (0.13 | ) | ||||||||||
Net asset value, end of period | $11.72 | $13.19 | $12.38 | $13.64 | $11.28 | |||||||||||||||
Total return | (9.37 | )% | 9.07 | % | (6.94 | )% | 23.46 | % | (3.90 | )% | ||||||||||
Ratios to average net assets (annualized) | ||||||||||||||||||||
Gross expenses | 1.66 | % | 1.69 | % | 1.63 | % | 1.72 | % | 1.71 | % | ||||||||||
Net expenses | 1.25 | % | 1.25 | % | 1.25 | % | 1.25 | % | 1.25 | % | ||||||||||
Net investment income | 1.08 | % | 2.01 | % | 1.73 | % | 1.79 | % | 1.83 | % | ||||||||||
Supplemental data | ||||||||||||||||||||
Portfolio turnover rate | 48 | % | 28 | % | 39 | % | 42 | % | 50 | % | ||||||||||
Net assets, end of period (000s omitted) | $10,778 | $13,125 | $12,557 | $13,714 | $12,334 | |||||||||||||||
| 1 | Calculated based upon average shares outstanding |
The accompanying notes are an integral part of these financial statements.
26 | Wells Fargo Diversified International Fund
Table of Contents
Financial highlights
(For a share outstanding throughout each period)
| Year ended October 31 | ||||||||||||||||||||
| INSTITUTIONAL CLASS | 2020 | 2019 | 2018 | 2017 | 2016 | |||||||||||||||
Net asset value, beginning of period | $12.28 | $11.57 | $12.84 | $10.61 | $11.14 | |||||||||||||||
Net investment income | 0.17 | 0.26 | 1 | 0.25 | 1 | 0.23 | 1 | 0.23 | 1 | |||||||||||
Net realized and unrealized gains (losses) on investments | (1.25 | ) | 0.76 | (1.07 | ) | 2.25 | (0.63 | ) | ||||||||||||
|
|
|
|
|
|
|
|
|
| |||||||||||
Total from investment operations | (1.08 | ) | 1.02 | (0.82 | ) | 2.48 | (0.40 | ) | ||||||||||||
Distributions to shareholders from | ||||||||||||||||||||
Net investment income | (0.30 | ) | (0.31 | ) | (0.45 | ) | (0.25 | ) | (0.13 | ) | ||||||||||
Net asset value, end of period | $10.90 | $12.28 | $11.57 | $12.84 | $10.61 | |||||||||||||||
Total return | (9.11 | )% | 9.30 | % | (6.68 | )% | 23.91 | % | (3.63 | )% | ||||||||||
Ratios to average net assets (annualized) | ||||||||||||||||||||
Gross expenses | 1.41 | % | 1.44 | % | 1.38 | % | 1.49 | % | 1.46 | % | ||||||||||
Net expenses | 0.99 | % | 0.99 | % | 0.99 | % | 0.99 | % | 0.99 | % | ||||||||||
Net investment income | 1.40 | % | 2.22 | % | 1.97 | % | 2.02 | % | 2.16 | % | ||||||||||
Supplemental data | ||||||||||||||||||||
Portfolio turnover rate | 48 | % | 28 | % | 39 | % | 42 | % | 50 | % | ||||||||||
Net assets, end of period (000s omitted) | $4,014 | $4,508 | $4,604 | $8,146 | $24,328 | |||||||||||||||
| 1 | Calculated based upon average shares outstanding |
The accompanying notes are an integral part of these financial statements.
Wells Fargo Diversified International Fund | 27
Table of Contents
1. ORGANIZATION
Wells Fargo Funds Trust (the “Trust”), a Delaware statutory trust organized on March 10, 1999, is an open-end management investment company registered under the Investment Company Act of 1940, as amended (the “1940 Act”). As an investment company, the Trust follows the accounting and reporting guidance in Financial Accounting Standards Board (“FASB”) Accounting Standards Codification Topic 946, Financial Services – Investment Companies. These financial statements report on the Wells Fargo Diversified International Fund (the “Fund”) which is a diversified series of the Trust.
2. SIGNIFICANT ACCOUNTING POLICIES
The following significant accounting policies, which are consistently followed in the preparation of the financial statements of the Fund, are in conformity with U.S. generally accepted accounting principles which require management to make estimates and assumptions that affect the reported amounts of assets and liabilities, disclosure of contingent assets and liabilities at the date of the financial statements, and the reported amounts of revenues and expenses during the reporting period. Actual results could differ from those estimates.
Securities valuation
All investments are valued each business day as of the close of regular trading on the New York Stock Exchange (generally 4 p.m. Eastern Time), although the Fund may deviate from this calculation time under unusual or unexpected circumstances.
Equity securities that are listed on a foreign or domestic exchange or market are valued at the official closing price or, if none, the last sales price. If no sale occurs on the principal exchange or market that day, a fair value price will be determined in accordance with the Fund’s Valuation Procedures.
Forward foreign currency contracts are recorded at the forward rate provided by an independent foreign currency pricing source at a time each business day specified by the Wells Fargo Asset Management Pricing Committee at Wells Fargo Funds Management, LLC (“Funds Management”).
The values of securities denominated in foreign currencies are translated into U.S. dollars at rates provided by an independent foreign currency pricing source at a time each business day specified by the Wells Fargo Asset Management Pricing Committee.
Many securities markets and exchanges outside the U.S. close prior to the close of the New York Stock Exchange and therefore may not fully reflect trading or events that occur after the close of the principal exchange in which the foreign securities are traded, but before the close of the New York Stock Exchange. If such trading or events are expected to materially affect the value of such securities, then fair value pricing procedures approved by the Board of Trustees of the Fund are applied. These procedures take into account multiple factors including movements in U.S. securities markets after foreign exchanges close. Foreign securities that are fair valued under these procedures are categorized as Level 2 and the application of these procedures may result in transfers between Level 1 and Level 2. Depending on market activity, such fair valuations may be frequent. Such fair value pricing may result in net asset values that are higher or lower than net asset values based on the last reported sales price or latest quoted bid price. On October 31, 2020, such fair value pricing was used in pricing certain foreign securities.
Investments in registered open-end investment companies are valued at net asset value. Interests in non-registered investment companies that are redeemable at net asset value are fair valued normally at net asset value.
Investments which are not valued using any of the methods discussed above are valued at their fair value, as determined in good faith by the Board of Trustees. The Board of Trustees has established a Valuation Committee comprised of the Trustees and has delegated to it the authority to take any actions regarding the valuation of portfolio securities that the Valuation Committee deems necessary or appropriate, including determining the fair value of portfolio securities, unless the determination has been delegated to the Wells Fargo Asset Management Pricing Committee. The Board of Trustees retains the authority to make or ratify any valuation decisions or approve any changes to the Valuation Procedures as it deems appropriate. On a quarterly basis, the Board of Trustees receives reports on any valuation actions taken by the Valuation Committee or the Wells Fargo Asset Management Pricing Committee which may include items for ratification.
Foreign currency translation
The accounting records of the Fund are maintained in U.S. dollars. The values of other assets and liabilities denominated in foreign currencies are translated into U.S. dollars at rates provided by an independent foreign currency pricing source at a time each business day specified by the Wells Fargo Asset Management Pricing Committee. Purchases and sales of securities, and income and expenses are converted at the rate of exchange on the respective dates of such transactions. Net realized foreign exchange gains or losses arise from sales of foreign currencies, currency gains or losses realized between the trade and settlement dates on securities transactions, and the difference between the amounts of dividends, interest and foreign withholding taxes recorded and the U.S. dollar equivalent of the amounts actually paid or received. Net unrealized foreign
28 | Wells Fargo Diversified International Fund
Table of Contents
Notes to financial statements
exchange gains and losses arise from changes in the fair value of assets and liabilities other than investments in securities resulting from changes in exchange rates. The changes in net assets arising from changes in exchange rates of securities and the changes in net assets resulting from changes in market prices of securities are not separately presented. Such changes are included in net realized and unrealized gains or losses from investments.
Participation notes
The Fund may invest in participation notes to gain exposure to securities in certain foreign markets. Participation notes are issued by banks or broker-dealers and are designed to offer a return linked to a particular underlying foreign security. Participation notes involve transaction costs, which may be higher than those applicable to the underlying foreign security. The holder of the participation note is entitled to receive from the bank or broker-dealer, an amount equal to the dividend paid by the issuer of the underlying foreign security; however, the holder is not entitled to the same rights (i.e. voting rights) as an owner of the underlying foreign security. Investments in participation notes involve risks beyond those normally associated with a direct investment in an underlying security. The Fund has no rights against the issuer of the underlying foreign security and participation notes expose the Fund to counterparty risk in the event the counterparty does not perform. There is also no assurance there will be a secondary trading market for the participation note or that the trading price of the participation note will equal the underlying value of the foreign security that it seeks to replicate.
Forward foreign currency contracts
A forward foreign currency contract is an agreement between two parties to purchase or sell a specific currency for an agreed-upon price at a future date. The Fund enters into forward foreign currency contracts to facilitate transactions in foreign-denominated securities and to attempt to minimize the risk to the Fund from adverse changes in the relationship between currencies. Forward foreign currency contracts are recorded at the forward rate and marked-to-market daily. When the contracts are closed, realized gains and losses arising from such transactions are recorded as realized gains or losses on forward foreign currency contracts. The Fund is subject to foreign currency risk and may be exposed to risks if the counterparties to the contracts are unable to meet the terms of their contracts or if the value of the foreign currency changes unfavorably. The Fund’s maximum risk of loss from counterparty credit risk is the unrealized gains on the contracts. This risk may be mitigated if there is a master netting arrangement between the Fund and the counterparty.
Securities lending
The Fund may lend its securities from time to time in order to earn additional income in the form of fees or interest on securities received as collateral or the investment of any cash received as collateral. When securities are on loan, the Fund receives interest or dividends on those securities. Cash collateral received in connection with its securities lending transactions is invested in Securities Lending Cash Investments, LLC (the “Securities Lending Fund”). Investments in Securities Lending Fund are valued at the evaluated bid price provided by an independent pricing service. Income earned from investment in the Securities Lending Fund (net of fees and rebates), if any, is included in income from affiliated securities on the Statement of Operations.
In a securities lending transaction, the net asset value of the Fund is affected by an increase or decrease in the value of the securities loaned and by an increase or decrease in the value of the instrument in which collateral is invested. The amount of securities lending activity undertaken by the Fund fluctuates from time to time. The Fund has the right under the lending agreement to recover the securities from the borrower on demand. In the event of default or bankruptcy by the borrower, the Fund may be prevented from recovering the loaned securities or gaining access to the collateral or may experience delays or costs in doing so. In such an event, the terms of the agreement allows the unaffiliated securities lending agent to use the collateral to purchase replacement securities on behalf of the Fund or pay the Fund the market value of the loaned securities. The Fund bears the risk of loss with respect to depreciation of its investment of the cash collateral.
Security transactions and income recognition
Securities transactions are recorded on a trade date basis. Realized gains or losses are recorded on the basis of identified cost.
Dividend income is recognized on the ex-dividend date, except for certain dividends from foreign securities, which are recorded as soon as the custodian verifies the ex-dividend date. Dividend income from foreign securities is recorded net of foreign taxes withheld where recovery of such taxes is not assured.
Distributions to shareholders
Distributions to shareholders from net investment income and any net realized gains are recorded on the ex-dividend date and paid at least annually. Such distributions are determined in accordance with income tax regulations and may differ from U.S. generally accepted accounting principles. Dividend sources are estimated at the time of declaration. The tax character of distributions is determined as of the Fund’s fiscal year end. Therefore, a portion of the Fund’s distributions made prior to the Fund’s fiscal year end may be categorized as a tax return of capital at year end.
Wells Fargo Diversified International Fund | 29
Table of Contents
Notes to financial statements
Federal and other taxes
The Fund intends to continue to qualify as a regulated investment company by distributing substantially all of its investment company taxable income and any net realized capital gains (after reduction for capital loss carryforwards) sufficient to relieve it from all, or substantially all, federal income taxes. Accordingly, no provision for federal income taxes was required.
The Fund’s income and federal excise tax returns and all financial records supporting those returns for the prior three fiscal years are subject to examination by the federal and Delaware revenue authorities. Management has analyzed the Fund’s tax positions taken on federal, state, and foreign tax returns for all open tax years and does not believe that there are any uncertain tax positions that require recognition of a tax liability.
As of October 31, 2020, the aggregate cost of all investments for federal income tax purposes was $77,767,655 and the unrealized gains (losses) consisted of:
Gross unrealized gains | $ | 13,284,710 | ||
Gross unrealized losses | (9,863,105 | ) | ||
Net unrealized gains | $ | 3,421,605 | ||
As of October 31, 2020, the Fund had capital loss carryforwards which consisted of $7,306,017 in short-term capital losses and $1,339,018 in long-term capital losses.
Class allocations
The separate classes of shares offered by the Fund differ principally in applicable sales charges, distribution, shareholder servicing, and administration fees. Class specific expenses are charged directly to that share class. Investment income, common fund-level expenses, and realized and unrealized gains (losses) on investments are allocated daily to each class of shares based on the relative proportion of net assets of each class.
3. FAIR VALUATION MEASUREMENTS
Fair value measurements of investments are determined within a framework that has established a fair value hierarchy based upon the various data inputs utilized in determining the value of the Fund’s investments. The three-level hierarchy gives the highest priority to unadjusted quoted prices in active markets for identical assets or liabilities (Level 1) and the lowest priority to unobservable inputs (Level 3). The Fund’s investments are classified within the fair value hierarchy based on the lowest level of input that is significant to the fair value measurement. The inputs are summarized into three broad levels as follows:
| ∎ | Level 1 – quoted prices in active markets for identical securities |
| ∎ | Level 2 – other significant observable inputs (including quoted prices for similar securities, interest rates, prepayment speeds, credit risk, etc.) |
| ∎ | Level 3 – significant unobservable inputs (including the Fund’s own assumptions in determining the fair value of investments) |
The inputs or methodologies used for valuing investments in securities are not necessarily an indication of the risk associated with investing in those securities.
30 | Wells Fargo Diversified International Fund
Table of Contents
Notes to financial statements
The following is a summary of the inputs used in valuing the Fund’s assets and liabilities as of October 31, 2020:
| Quoted prices (Level 1) | Other significant observable inputs (Level 2) | Significant (Level 3) | Total | |||||||||||||
Assets | ||||||||||||||||
Investments in: | ||||||||||||||||
Common stocks | ||||||||||||||||
Australia | $ | 0 | $ | 1,673,147 | $ | 0 | $ | 1,673,147 | ||||||||
Austria | 0 | 110,959 | 0 | 110,959 | ||||||||||||
Belgium | 0 | 491,783 | 0 | 491,783 | ||||||||||||
Brazil | 159,191 | 0 | 0 | 159,191 | ||||||||||||
Canada | 2,211,750 | 0 | 0 | 2,211,750 | ||||||||||||
Chile | 0 | 96,961 | 0 | 96,961 | ||||||||||||
China | 1,561,646 | 3,874,108 | 0 | 5,435,754 | ||||||||||||
Denmark | 477,309 | 1,823,809 | 0 | 2,301,118 | ||||||||||||
Finland | 0 | 112,579 | 0 | 112,579 | ||||||||||||
France | 0 | 5,596,032 | 0 | 5,596,032 | ||||||||||||
Germany | 312,026 | 7,036,866 | 0 | 7,348,892 | ||||||||||||
Hong Kong | 0 | 2,856,142 | 0 | 2,856,142 | ||||||||||||
Hungary | 0 | 71,461 | 0 | 71,461 | ||||||||||||
India | 0 | 354,489 | 0 | 354,489 | ||||||||||||
Ireland | 2,811,046 | 2,395,320 | 0 | 5,206,366 | ||||||||||||
Israel | 1,541,838 | 0 | 0 | 1,541,838 | ||||||||||||
Italy | 0 | 1,306,692 | 0 | 1,306,692 | ||||||||||||
Japan | 0 | 10,885,395 | 0 | 10,885,395 | ||||||||||||
Luxembourg | 0 | 525,785 | 0 | 525,785 | ||||||||||||
Mexico | 0 | 313,279 | 0 | 313,279 | ||||||||||||
Netherlands | 304,602 | 4,192,830 | 0 | 4,497,432 | ||||||||||||
Norway | 27,116 | 688,933 | 0 | 716,049 | ||||||||||||
Portugal | 0 | 312,129 | 0 | 312,129 | ||||||||||||
Russia | 693,772 | 81,076 | 0 | 774,848 | ||||||||||||
Singapore | 0 | 195,373 | 0 | 195,373 | ||||||||||||
South Africa | 11,629 | 81,891 | 0 | 93,520 | ||||||||||||
South Korea | 0 | 3,010,373 | 0 | 3,010,373 | ||||||||||||
Spain | 0 | 401,264 | 0 | 401,264 | ||||||||||||
Sweden | 0 | 1,147,779 | 0 | 1,147,779 | ||||||||||||
Switzerland | 0 | 7,307,298 | 0 | 7,307,298 | ||||||||||||
Taiwan | 0 | 935,552 | 0 | 935,552 | ||||||||||||
Turkey | 0 | 106,905 | 0 | 106,905 | ||||||||||||
United Kingdom | 1,538,788 | 6,935,920 | 0 | 8,474,708 | ||||||||||||
United States | 3,196,112 | 0 | 0 | 3,196,112 | ||||||||||||
Participation notes | ||||||||||||||||
United Kingdom | 0 | 629,252 | 0 | 629,252 | ||||||||||||
Short-term investments | ||||||||||||||||
Investment companies | 784,981 | 0 | 0 | 784,981 | ||||||||||||
| 15,631,806 | 65,551,382 | 0 | 81,183,188 | |||||||||||||
Forward foreign currency contracts | 0 | 6,072 | 0 | 6,072 | ||||||||||||
Total assets | $ | 15,631,806 | $ | 65,557,454 | $ | 0 | $ | 81,189,260 | ||||||||
Additional sector, industry or geographic detail is included in the Portfolio of Investments.
Forward foreign currency contracts are reported at their cumulative unrealized gains (losses) at measurement date as reported in the table following the Portfolio of Investments. All other assets and liabilities are reported at their market value at measurement date.
Wells Fargo Diversified International Fund | 31
Table of Contents
Notes to financial statements
For the year ended October 31, 2020, the Fund did not have any transfers into/out of Level 3.
4. TRANSACTIONS WITH AFFILIATES AND OTHER EXPENSES
Management fee
Funds Management, an indirect wholly owned subsidiary of Wells Fargo & Company (“Wells Fargo”), is the manager of the Fund and provides advisory and fund-level administrative services under an investment management agreement. Under the investment management agreement, Funds Management is responsible for, among other services, implementing the investment objectives and strategies of the Fund, supervising the subadvisers and providing fund-level administrative services in connection with the Fund’s operations. As compensation for its services under the investment management agreement, Funds Management is entitled to receive a management fee at the following annual rate based on the Fund’s average daily net assets:
| Average daily net assets | Management fee | |||
First $500 million | 0.850 | % | ||
Next $500 million | 0.800 | |||
Next $1 billion | 0.750 | |||
Next $2 billion | 0.725 | |||
Next $1 billion | 0.700 | |||
Next $5 billion | 0.690 | |||
Over $10 billion | 0.680 | |||
For the year ended October 31, 2020, the management fee was equivalent to an annual rate of 0.85% of the Fund’s average daily net assets.
Funds Management has retained the services of certain subadvisers to provide daily portfolio management to the Fund. The fee for subadvisory services is borne by Funds Management. Artisan Partners Limited Partnership, LSV Asset Management, and Wells Capital Management incorporated (“WellsCap”), an affiliate of Funds Management and an indirect wholly owned subsidiary of Wells Fargo, are the subadvisers to the Fund and are each entitled to receive a fee from Funds Management which is calculated based on the average daily net assets of the Fund. Artisan Partners Limited Partnership and LSV Asset Management are not affiliates of Funds Management.
| Annual subadvisory fee | ||||||||
| starting at | Declining to | |||||||
Artisan Partners Limited Partnership | 0.80 | % | 0.50 | % | ||||
LSV Asset Management | 0.35 | 0.30 | ||||||
WellsCap | 0.45 | 0.40 | ||||||
Administration fees
Under a class-level administration agreement, Funds Management provides class-level administrative services to the Fund, which includes paying fees and expenses for services provided by the transfer agent, sub-transfer agents, omnibus account servicers and record-keepers. As compensation for its services under the class-level administration agreement, Funds Management receives an annual fee which is calculated based on the average daily net assets of each class as follows:
| Class-level administration fee | ||||
Class A, Class C | 0.21 | % | ||
Class R6 | 0.03 | |||
Administrator Class, Institutional Class | 0.13 | |||
Waivers and/or expense reimbursements
Funds Management has contractually waived and/or reimbursed management and administration fees to the extent necessary to maintain certain net operating expense ratios for the Fund. When each class of the Fund has exceeded its expense cap, Funds
32 | Wells Fargo Diversified International Fund
Table of Contents
Notes to financial statements
Management has waived fees and/or reimbursed expenses from fund-level expenses on a proportionate basis and then from class specific expenses. When only certain classes exceed their expense caps, waivers and/or reimbursements are applied against class specific expenses before fund-level expenses. Funds Management has committed through February 28, 2021 to waive fees and/or reimburse expenses to the extent necessary to cap the Fund’s expenses at 1.35% for Class A shares, 2.10% for Class C shares, 0.89% for Class R6 shares, 1.25% for Administrator Class shares, and 0.99% for Institutional Class shares. Prior to or after the commitment expiration date, the cap may be increased or the commitment to maintain the cap may be terminated only with the approval of the Board of Trustees.
Distribution fee
The Trust has adopted a distribution plan for Class C shares of the Fund pursuant to Rule 12b-1 under the 1940 Act. A distribution fee is charged to Class C shares and paid to Wells Fargo Funds Distributor, LLC (“Funds Distributor”), the principal underwriter, at an annual rate of 0.75% of the average daily net assets of Class C shares.
In addition, Funds Distributor is entitled to receive the front-end sales charge from the purchase of Class A shares and a contingent deferred sales charge on the redemption of certain Class A shares. Funds Distributor is also entitled to receive the contingent deferred sales charges from redemptions of Class C shares. For the year ended October 31, 2020, Funds Distributor received $285 from the sale of Class A shares. No contingent deferred sales charges were incurred by Class A and Class C shares for the year ended October 31, 2020.
Shareholder servicing fees
The Trust has entered into contracts with one or more shareholder servicing agents, whereby Class A, Class C, and Administrator Class of the Fund are charged a fee at an annual rate of 0.25% of the average daily net assets of each respective class. A portion of these total shareholder servicing fees were paid to affiliates of Wells Fargo.
Interfund transactions
The Fund may purchase or sell portfolio investment securities to certain other Wells Fargo affiliates pursuant to Rule 17a-7 under the 1940 Act and under procedures adopted by the Board of Trustees. The procedures have been designed to ensure that these interfund transactions, which do not incur broker commissions, are effected at current market prices.
5. INVESTMENT PORTFOLIO TRANSACTIONS
Purchases and sales of investments, excluding U.S. government obligations (if any) and short-term securities, for the year ended October 31, 2020 were $41,008,101 and $47,343,181, respectively.
6. SECURITIES LENDING TRANSACTIONS
The Fund lends its securities through an unaffiliated securities lending agent and receives collateral in the form of cash or securities with a value at least equal to the value of the securities on loan. The value of the loaned securities is determined at the close of each business day and any increases or decreases in the required collateral are exchanged between the Fund and the counterparty on the next business day. Cash collateral received is invested in the Securities Lending Fund which seeks to provide a positive return compared to the daily Federal Funds Open Rate by investing in high-quality, U.S. dollar-denominated short-term money market instruments and is exempt from registration under Section 3(c)(7) of the 1940 Act. Securities Lending Fund is managed by Funds Management and is subadvised by WellsCap. Funds Management receives an advisory fee starting at 0.05% and declining to 0.01% as the average daily net assets of the Securities Lending Fund increase. All of the fees received by Funds Management are paid to WellsCap for its services as subadviser.
In the event of counterparty default or the failure of a borrower to return a loaned security, the Fund has the right to use the collateral to offset any losses incurred. As of October 31, 2020, the Fund did not have any securities on loan.
7. DERIVATIVE TRANSACTIONS
During the year ended October 31, 2020, the Fund entered into forward foreign currency contracts for economic hedging purposes. The Fund had average contract amounts of $726,709 and $2,082,327 in forward foreign currency contracts to buy and forward foreign currency contracts to sell, respectively, during the year ended October 31, 2020.
The fair value, realized gains or losses and change in unrealized gains or losses, if any, on derivative instruments are reflected in the corresponding financial statement captions.
For certain types of derivative transactions, the Fund has entered into International Swaps and Derivatives Association, Inc. master agreements (“ISDA Master Agreements”) or similar agreements with approved counterparties. The ISDA Master Agreements or similar agreements may have requirements to deliver/deposit securities or cash to/with an exchange or broker-dealer as collateral and allows the Fund to offset, with each counterparty, certain derivative financial instrument’s assets and/or
Wells Fargo Diversified International Fund | 33
Table of Contents
Notes to financial statements
liabilities with collateral held or pledged. Collateral requirements differ by type of derivative. Collateral or margin requirements are set by the broker or exchange clearinghouse for exchange traded derivatives while collateral terms are contract specific for over-the-counter traded derivatives. Cash collateral that has been pledged to cover obligations of the Fund under ISDA Master Agreements or similar agreements, if any, are reported separately in the Statement of Assets and Liabilities. Securities pledged as collateral, if any, are noted in the Portfolio of Investments. With respect to balance sheet offsetting, absent an event of default by the counterparty or a termination of the agreement, the reported amounts of financial assets and financial liabilities in the Statement of Assets and Liabilities are not offset across transactions between the Fund and the applicable counterparty. A reconciliation of the gross amounts on the Statement of Assets and Liabilities to the net amounts by counterparty, including any collateral exposure, for OTC derivatives is as follows:
| Counterparty | Gross amounts of assets in the Statement of Assets and Liabilities | Amounts subject to netting agreements | Collateral pledged | Net amount of assets | ||||||||||||
Barclays Bank plc | $ | 6,072 | $ | 0 | $ | 0 | $ | 6,072 | ||||||||
8. BANK BORROWINGS
The Trust (excluding the money market funds), Wells Fargo Master Trust and Wells Fargo Variable Trust are parties to a $350,000,000 revolving credit agreement whereby the Fund is permitted to use bank borrowings for temporary or emergency purposes, such as to fund shareholder redemption requests. Interest under the credit agreement is charged to the Fund based on a borrowing rate equal to the higher of the Federal Funds rate in effect on that day plus 1.25% or the overnight LIBOR rate in effect on that day plus 1.25%. In addition, an annual commitment fee equal to 0.25% of the unused balance is allocated to each participating fund.
For the year ended October 31, 2020, there were no borrowings by the Fund under the agreement.
9. DISTRIBUTIONS TO SHAREHOLDERS
The tax character of distributions paid was $2,081,604 and $2,254,949 of ordinary income for the years ended October 31, 2020 and October 31, 2019, respectively.
As of October 31, 2020, the components of distributable earnings on a tax basis were as follows:
Undistributed ordinary income | Unrealized gains | Capital loss carryforward | ||
| $930,905 | $3,433,011 | $(8,645,035) | ||
10. CONCENTRATION RISK
Concentration risks may result from significant investments in one or more country or geographic region. As of the end of the period, the Fund concentrated its portfolio in investments in Europe. A fund that invests a substantial portion of its assets in any country or geographic region will be more vulnerable than a fund that invests its assets more broadly to the economic, financial, political or other developments affecting that country or region. Such developments may have a significant impact on the Fund’s investment performance causing such performance to be more volatile than the investment performance of a more geographically diversified fund.
11. INDEMNIFICATION
Under the Fund’s organizational documents, the officers and Trustees have been granted certain indemnification rights against certain liabilities that may arise out of performance of their duties to the Fund. The Fund has entered into a separate agreement with each Trustee that converts indemnification rights currently existing under the Fund’s organizational documents into contractual rights that cannot be changed in the future without the consent of the Trustee. Additionally, in the normal course of business, the Fund may enter into contracts with service providers that contain a variety of indemnification clauses. The Fund’s maximum exposure under these arrangements is dependent on future claims that may be made against the Fund and, therefore, cannot be estimated.
34 | Wells Fargo Diversified International Fund
Table of Contents
Notes to financial statements
12. NEW ACCOUNTING PRONOUNCEMENT
In August 2018, FASB issued Accounting Standards Update (“ASU”) No. 2018-13, Fair Value Measurement (Topic 820) Disclosure Framework—Changes to the Disclosure Requirements for Fair Value Measurement. ASU 2018-13 updates the disclosure requirements on fair value measurements in Topic 820, Fair Value Measurements. The amendments are effective for fiscal years, and interim periods within those fiscal years, beginning after December 15, 2019. Management has adopted this guidance which did not have a material impact on the financial statements.
13. CORONAVIRUS (COVID-19) PANDEMIC
On March 11, 2020, the World Health Organization announced that it had made the assessment that coronavirus disease 2019 (“COVID-19”) is a pandemic. The impacts of COVID-19 are adversely affecting the entire global economy, individual companies and investment products, and the market in general. There is significant uncertainty around the extent and duration of business disruptions related to COVID-19 and the impacts may be short term or may last for an extended period of time. The risk of further spreading of COVID-19 has led to significant uncertainty and volatility in the financial markets.
14. SUBSEQUENT EVENT
At a regular meeting of the Board of Trustees held on November 17, 19-20, 2020, the Trustees of the Fund approved the merger of the Fund into Wells Fargo International Equity Fund. Wells Fargo International Equity Fund will acquire the assets and assume the liabilities of the Fund in exchange for shares of Wells Fargo International Equity Fund.
The merger does not require approval by the shareholders of the Fund. In January 2021, additional information, including a description of the merger and information about fees, expenses and risk factors will be provided in a prospectus/information statement that is expected to be mailed to shareholders of record on December 18, 2020.
Wells Fargo Diversified International Fund | 35
Table of Contents
Report of independent registered public accounting firm
To the Shareholders of the Fund and Board of Trustees
Wells Fargo Funds Trust:
Opinion on the Financial Statements
We have audited the accompanying statement of assets and liabilities of Wells Fargo Diversified International Fund (the Fund), one of the funds constituting Wells Fargo Funds Trust, including the portfolio of investments, as of October 31, 2020, the related statement of operations for the year then ended, the statements of changes in net assets for each of the years in the two-year period then ended, and the related notes (collectively, the financial statements) and the financial highlights for each of the years in the five-year period then ended. In our opinion, the financial statements and financial highlights present fairly, in all material respects, the financial position of the Fund as of October 31, 2020, the results of its operations for the year then ended, the changes in its net assets for each of the years in the two-year period then ended, and the financial highlights for each of the years in the five-year period then ended, in conformity with U.S. generally accepted accounting principles.
Basis for Opinion
These financial statements and financial highlights are the responsibility of the Fund’s management. Our responsibility is to express an opinion on these financial statements and financial highlights based on our audits. We are a public accounting firm registered with the Public Company Accounting Oversight Board (United States) (PCAOB) and are required to be independent with respect to the Fund in accordance with the U.S. federal securities laws and the applicable rules and regulations of the Securities and Exchange Commission and the PCAOB.
We conducted our audits in accordance with the standards of the PCAOB. Those standards require that we plan and perform the audit to obtain reasonable assurance about whether the financial statements and financial highlights are free of material misstatement, whether due to error or fraud. Our audits included performing procedures to assess the risks of material misstatement of the financial statements and financial highlights, whether due to error or fraud, and performing procedures that respond to those risks. Such procedures included examining, on a test basis, evidence regarding the amounts and disclosures in the financial statements and financial highlights. Such procedures also included confirmation of securities owned as of October 31, 2020, by correspondence with the custodian, transfer agent and brokers, or by other appropriate auditing procedures. Our audits also included evaluating the accounting principles used and significant estimates made by management, as well as evaluating the overall presentation of the financial statements and financial highlights. We believe that our audits provide a reasonable basis for our opinion.

We have not been able to determine the specific year that we began serving as the auditor of one or more Wells Fargo Funds investment companies; however we are aware that we have served as the auditor of one or more Wells Fargo Funds investment companies since at least 1955.
Boston, Massachusetts
December 22, 2020
36 | Wells Fargo Diversified International Fund
Table of Contents
TAX INFORMATION
Pursuant to Section 854 of the Internal Revenue Code, $2,081,604 of income dividends paid during the fiscal year ended October 31, 2020 has been designated as qualified dividend income (QDI).
For the fiscal year ended October 31, 2020, $29,350 has been designated as interest-related dividends for nonresident alien shareholders pursuant to Section 871 of the Internal Revenue Code.
Pursuant to Section 853 of the Internal Revenue Code, the Fund expects to designate amounts as foreign taxes paid for the fiscal year ended October 31, 2020. Additional details will be available in the next report to shareholders.
PROXY VOTING INFORMATION
A description of the policies and procedures used to determine how to vote proxies relating to portfolio securities is available, upon request, by calling 1-800-222-8222, visiting our website at wfam.com, or visiting the SEC website at sec.gov. Information regarding how the proxies related to portfolio securities were voted during the most recent 12-month period ended June 30 is available on the website at wfam.com or by visiting the SEC website at sec.gov.
QUARTERLY PORTFOLIO HOLDINGS INFORMATION
The Fund files its complete schedule of portfolio holdings with the SEC for the first and third quarters of each fiscal year as an exhibit to its reports on Form N-PORT. Shareholders may view the filed Form N-PORT by visiting the SEC website at sec.gov.
Wells Fargo Diversified International Fund | 37
Table of Contents
Other information (unaudited)
BOARD OF TRUSTEES AND OFFICERS
Each of the Trustees and Officers1 listed in the table below acts in identical capacities for each fund in the Wells Fargo family of funds, which consists of 144 mutual funds comprising the Wells Fargo Funds Trust, Wells Fargo Variable Trust, Wells Fargo Master Trust and four closed-end funds (collectively the “Fund Complex”). This table should be read in conjunction with the Prospectus and the Statement of Additional Information2. The mailing address of each Trustee and Officer is 525 Market Street, 12th Floor, San Francisco, CA 94105. Each Trustee and Officer serves an indefinite term, however, each Trustee serves such term until reaching the mandatory retirement age established by the Trustees.
Independent Trustees
Name and year of birth | Position held and length of service* | Principal occupations during past five years or longer | Current other public company or investment company directorships | |||
William R. Ebsworth (Born 1957) | Trustee, since 2015 | Retired. From 1984 to 2013, equities analyst, portfolio manager, research director and chief investment officer at Fidelity Management and Research Company in Boston, Tokyo, and Hong Kong, and retired in 2013 as Chief Investment Officer of Fidelity Strategic Advisers, Inc. where he led a team of investment professionals managing client assets. Prior thereto, Board member of Hong Kong Securities Clearing Co., Hong Kong Options Clearing Corp., the Thailand International Fund, Ltd., Fidelity Investments Life Insurance Company, and Empire Fidelity Investments Life Insurance Company. Audit Committee Chair and Investment Committee Chair of the Vincent Memorial Hospital Endowment (non-profit organization). Mr. Ebsworth is a CFA® charterholder. | N/A | |||
Jane A. Freeman (Born 1953) | Trustee, since 2015; Chair Liaison, since 2018 | Retired. From 2012 to 2014 and 1999 to 2008, Chief Financial Officer of Scientific Learning Corporation. From 2008 to 2012, Ms. Freeman provided consulting services related to strategic business projects. Prior to 1999, Portfolio Manager at Rockefeller & Co. and Scudder, Stevens & Clark. Board member of the Harding Loevner Funds from 1996 to 2014, serving as both Lead Independent Director and chair of the Audit Committee. Board member of the Russell Exchange Traded Funds Trust from 2011 to 2012 and the chair of the Audit Committee. Ms. Freeman is also an inactive Chartered Financial Analyst. | N/A | |||
Isaiah Harris, Jr. (Born 1952) | Trustee, since 2009; Audit Committee Chair, since 2019 | Retired. Chairman of the Board of CIGNA Corporation since 2009, and Director since 2005. From 2003 to 2011, Director of Deluxe Corporation. Prior thereto, President and CEO of BellSouth Advertising and Publishing Corp. from 2005 to 2007, President and CEO of BellSouth Enterprises from 2004 to 2005 and President of BellSouth Consumer Services from 2000 to 2003. Emeritus member of the Iowa State University Foundation Board of Governors. Emeritus Member of the Advisory Board of Iowa State University School of Business. Advisory Board Member, Palm Harbor Academy (private school). Mr. Harris is a certified public accountant (inactive status). | CIGNA Corporation | |||
Judith M. Johnson (Born 1949) | Trustee, since 2008 | Retired. Prior thereto, Chief Executive Officer and Chief Investment Officer of Minneapolis Employees Retirement Fund from 1996 to 2008. Ms. Johnson is an attorney, certified public accountant and a certified managerial accountant. | N/A | |||
David F. Larcker (Born 1950) | Trustee, since 2009 | James Irvin Miller Professor of Accounting at the Graduate School of Business (Emeritus), Stanford University, Director of the Corporate Governance Research Initiative and Senior Faculty of The Rock Center for Corporate Governance since 2006. From 2005 to 2008, Professor of Accounting at the Graduate School of Business, Stanford University. Prior thereto, Ernst & Young Professor of Accounting at The Wharton School, University of Pennsylvania from 1985 to 2005. | N/A | |||
38 | Wells Fargo Diversified International Fund
Table of Contents
Other information (unaudited)
Name and year of birth | Position held and length of service* | Principal occupations during past five years or longer | Current other public company or investment company directorships | |||
Olivia S. Mitchell (Born 1953) | Trustee, since 2006; Nominating and Governance Committee Chair, since 2018 | International Foundation of Employee Benefit Plans Professor, Wharton School of the University of Pennsylvania since 1993. Director of Wharton’s Pension Research Council and Boettner Center on Pensions & Retirement Research, and Research Associate at the National Bureau of Economic Research. Previously, Cornell University Professor from 1978 to 1993. | N/A | |||
Timothy J. Penny (Born 1951) | Trustee, since 1996; Chair, since 2018 | President and Chief Executive Officer of Southern Minnesota Initiative Foundation, a non-profit organization, since 2007. Member of the Board of Trustees of NorthStar Education Finance, Inc., a non-profit organization, since 2007. | N/A | |||
James G. Polisson (Born 1959) | Trustee, since 2018 | Retired. Chief Marketing Officer, Source (ETF) UK Services, Ltd, from 2015 to 2017. From 2012 to 2015, Principal of The Polisson Group, LLC, a management consulting, corporate advisory and principal investing company. Chief Executive Officer and Managing Director at Russell Investments, Global Exchange Traded Funds from 2010 to 2012. Managing Director of Barclays Global Investors from 1998 to 2010 and Global Chief Marketing Officer for iShares and Barclays Global Investors from 2000 to 2010. Trustee of the San Francisco Mechanics’ Institute, a non-profit organization, from 2013 to 2015. Board member of the Russell Exchange Traded Fund Trust from 2011 to 2012. Director of Barclays Global Investors Holdings Deutschland GmbH from 2006 to 2009. Mr. Polisson is an attorney and has a retired status with the Massachusetts and District of Columbia Bar Associations. | N/A | |||
Pamela Wheelock (Born 1959) | Trustee, since January 2020; previously Trustee from January 2018 to July 2019 | Board member of the Destination Medical Center Economic Development Agency, Rochester, Minnesota since 2019. Interim President of the McKnight Foundation from January to September 2020. Acting Commissioner, Minnesota Department of Human Services, July 2019 through September 2019. Human Services Manager (part-time), Minnesota Department of Human Services, October 2019 through December 2019. Chief Operating Officer, Twin Cities Habitat for Humanity from 2017 to 2019. Vice President of University Services, University of Minnesota from 2012 to 2016. Prior thereto, on the Board of Directors, Governance Committee and Finance Committee for the Minnesota Philanthropy Partners (Saint Paul Foundation) from 2012 to 2018, Interim Chief Executive Officer of Blue Cross Blue Shield of Minnesota from 2011 to 2012, Chairman of the Board from 2009 to 2012 and Board Director from 2003 to 2015. Vice President, Leadership and Community Engagement, Bush Foundation, Saint Paul, Minnesota (a private foundation) from 2009 to 2011. Executive Vice President and Chief Financial Officer, Minnesota Sports and Entertainment from 2004 to 2009 and Senior Vice President from 2002 to 2004. Executive Vice President of the Minnesota Wild Foundation from 2004 to 2008. Commissioner of Finance, State of Minnesota, from 1999 to 2002. Currently Board Chair of the Minnesota Wild Foundation since 2010. | N/A | |||
| * | Length of service dates reflect the Trustee’s commencement of service with the Trust’s predecessor entities, where applicable. |
Wells Fargo Diversified International Fund | 39
Table of Contents
Other information (unaudited)
Officers
Name and year of birth | Position held and length of service | Principal occupations during past five years or longer | ||
Andrew Owen (Born 1960) | President, since 2017 | Executive Vice President of Wells Fargo & Company and Head of Affiliated Managers, Wells Fargo Asset Management, since 2014. In addition, Mr. Owen is currently President, Chief Executive Officer and Director of Wells Fargo Funds Management, LLC since 2017. Prior thereto, Executive Vice President responsible for marketing, investments and product development for Wells Fargo Funds Management, LLC, from 2009 to 2014. | ||
Jeremy DePalma1 (Born 1974) | Treasurer, since 2012 | Senior Vice President of Wells Fargo Funds Management, LLC since 2009. Senior Vice President of Evergreen Investment Management Company, LLC from 2008 to 2010 and head of the Fund Reporting and Control Team within Fund Administration from 2005 to 2010. | ||
Michelle Rhee (Born 1966) | Chief Legal Officer, since 2019 | Secretary of Wells Fargo Funds Management, LLC and Chief Legal Counsel of Wells Fargo Asset Management since 2018. Deputy General Counsel of Wells Fargo Bank, N.A. since 2020 and Assistant General Counsel of Wells Fargo Bank, N.A. from 2018 to 2020. Associate General Counsel and Managing Director of Bank of America Corporation from 2004 to 2018. | ||
Catherine Kennedy (Born 1969) | Secretary, since 2019 | Vice President of Wells Fargo Funds Management, LLC and Senior Counsel of the Wells Fargo Legal Department since 2010. Vice President and Senior Counsel of Evergreen Investment Management Company, LLC from 1998 to 2010. | ||
Michael H. Whitaker (Born 1967) | Chief Compliance Officer, since 2016 | Chief Compliance Officer of Wells Fargo Asset Management since 2016. Senior Vice President and Chief Compliance Officer for Fidelity Investments from 2007 to 2016. | ||
| 1 | Jeremy DePalma acts as Treasurer of 77 funds in the Fund Complex. |
| 2 | The Statement of Additional Information includes additional information about the Trustees and is available, without charge, upon request, by calling 1-800-222-8222 or by visiting the website at wfam.com. |
40 | Wells Fargo Diversified International Fund
Table of Contents
Other information (unaudited)
BOARD CONSIDERATION OF INVESTMENT MANAGEMENT AND SUB-ADVISORY AGREEMENTS:
Wells Fargo Diversified International Fund
Under the Investment Company Act of 1940 (the “1940 Act”), the Board of Trustees (the “Board”) of Wells Fargo Funds Trust (the “Trust”) must determine annually whether to approve the continuation of the Trust’s investment management and sub-advisory agreements. In this regard, at a Board meeting held on May 26, 2020 and May 28, 2020 (together, the “Meeting”), the Board, all the members of which have no direct or indirect interest in the investment management and sub-advisory agreements and are not “interested persons” of the Trust, as defined in the 1940 Act (the “Independent Trustees”), reviewed and approved for Wells Fargo Diversified International Fund (the “Fund”): (i) an investment management agreement (the “Management Agreement”) with Wells Fargo Funds Management, LLC (“Funds Management”); (ii) an investment sub-advisory agreement with Wells Capital Management Incorporated (“WellsCap”), an affiliate of Funds Management; (iii) an investment sub-advisory agreement with Artisan Partners Limited Partnership (“Artisan”); and (iv) an investment sub-advisory agreement with LSV Asset Management (“LSV”). The sub-advisory agreements with WellsCap, Artisan, and LSV (the “Sub-Advisers”) are collectively referred to as the “Sub-Advisory Agreements,” and the Management Agreement and the Sub-Advisory Agreements are collectively referred to as the “Advisory Agreements.”
At the Meeting, the Board considered the factors and reached the conclusions described below relating to the selection of Funds Management and the Sub-Advisers and the approval of the Advisory Agreements. Prior to the Meeting, including at a Board meeting held in April 2020, the Trustees conferred extensively among themselves and with representatives of Funds Management about these matters. Also, the Board has adopted a team-based approach, with each team consisting of a sub-set of Trustees, to assist the full Board in the discharge of its duties in reviewing investment performance and other matters throughout the year. The Independent Trustees were assisted in their evaluation of the Advisory Agreements by independent legal counsel, from whom they received separate legal advice and with whom they met separately.
In providing information to the Board, Funds Management and the Sub-Advisers were guided by a detailed set of requests for information submitted to them by independent legal counsel on behalf of the Independent Trustees at the start of the Board’s annual contract renewal process earlier in 2020. In considering and approving the Advisory Agreements, the Trustees considered the information they believed relevant, including but not limited to the information discussed below. The Board considered not only the specific information presented in connection with the Meeting, but also the knowledge gained over time through interaction with Funds Management and the Sub-Advisers about various topics. In this regard, the Board reviewed reports of Funds Management at each of its quarterly meetings, which included, among other things, portfolio reviews and investment performance reports. In addition, the Board and the teams mentioned above confer with portfolio managers at various times throughout the year. The Board did not identify any particular information or consideration that was all-important or controlling, and each individual Trustee may have attributed different weights to various factors.
After its deliberations, the Board unanimously approved the continuation of the Advisory Agreements for a one-year term and determined that the compensation payable to Funds Management and the Sub-Advisers under each of the Advisory Agreements was reasonable. The Board considered the approval of the Advisory Agreements for the Fund as part of its consideration of agreements for funds across the complex, but its approvals were made on a fund-by-fund basis. The following summarizes a number of important, but not necessarily all, factors considered by the Board in support of its approvals.
Nature, extent and quality of services
The Board received and considered various information regarding the nature, extent and quality of services provided to the Fund by Funds Management and the Sub-Advisers under the Advisory Agreements. This information included a description of the investment advisory services and Fund-level administrative services covered by the Management Agreement, as well as, among other things, a summary of the background and experience of senior management of Wells Fargo Asset Management (“WFAM”), of which Funds Management and WellsCap are a part, and a summary of investments made in the business of WFAM. The Board also received a description of Funds Management’s and the Sub-Advisers’ business continuity plans and of their approaches to data privacy and cybersecurity, and related testing. The Board also received and reviewed information about Funds Management’s role as administrator of the Fund’s liquidity risk management program, Funds Management’s approach to risk management, and Funds Management’s intermediary and vendor oversight program.
The Board also considered the qualifications, background, tenure and responsibilities of each of the portfolio managers primarily responsible for the day-to-day portfolio management of the Fund. The Board evaluated the ability of Funds Management and the Sub-Advisers to attract and retain qualified investment professionals, including research, advisory and supervisory personnel. The Board further considered the compliance programs and compliance records of Funds Management and the Sub-Advisers. In addition, the Board took into account the full range of services provided to the Fund by Funds Management and its affiliates.
Wells Fargo Diversified International Fund | 41
Table of Contents
Other information (unaudited)
Fund investment performance and expenses
The Board considered the investment performance results for the Fund over various time periods ended December 31, 2019. The Board also considered more current results for various time periods ended March 31, 2020. The Board considered these results in comparison to the investment performance of funds in a universe that was determined by Broadridge Inc. (“Broadridge”) to be similar to the Fund (the “Universe”), and in comparison to the Fund’s benchmark index and to other comparative data. Broadridge is an independent provider of investment company data. The Board received a description of the methodology used by Broadridge to select the mutual funds in the performance Universe. The Board noted that the investment performance of the Fund (Administrator Class) was higher than the average investment performance of the Universe for the one-, three-, five- and ten-year periods ended December 31, 2019. The Board also noted that the investment performance of the Fund (Administrator Class) was higher than or in range of the average investment performance of the Universe for the three- and ten-year periods ended March 31, 2020, and lower than the average investment performance of the Universe for the one- and five-year periods ended March 31, 2020. The Board also noted that the investment performance of the Fund was in range of or higher than its benchmark index, the MSCI EAFE Index (Net), for the three- and ten-year periods ended December 31, 2019, and lower than its benchmark for the one- and five-year periods ended December 31, 2019. The Board also noted that the investment performance of the Fund was lower than its benchmark index, the MSCI EAFE Index (Net), for the one-, three- and five-year periods ended March 31, 2020, and in range of its benchmark for the ten-year period ended March 31, 2020.
The Board received information concerning, and discussed factors contributing to, the underperformance of the Fund relative to the Universe and benchmark for the periods identified above. The Board took note of the explanations for the relative underperformance during these periods, including with respect to investment decisions and market factors that affected the Fund’s investment performance. The Board also noted the Fund’s outperformance relative to the Universe over all periods ended December 31, 2019.
The Board also received and considered information regarding the Fund’s net operating expense ratios and their various components, including actual management fees, custodian and other non-management fees, and Rule 12b-1 and non-Rule 12b-1 shareholder service fees. The Board considered these ratios in comparison to the median ratios of funds in class-specific expense groups that were determined by Broadridge to be similar to the Fund (the “Groups”). The Board received a description of the methodology used by Broadridge to select the mutual funds in the expense Groups and an explanation of how funds comprising expense groups and their expense ratios may vary from year-to-year. Based on the Broadridge reports, the Board noted that the net operating expense ratios of the Fund were lower than, equal to or in range of the median net operating expense ratios of the expense Groups for each share class.
The Board took into account the Fund’s investment performance and expense information provided to it among the factors considered in deciding to re-approve the Advisory Agreements.
Investment management and sub-advisory fee rates
The Board reviewed and considered the contractual fee rates payable by the Fund to Funds Management under the Management Agreement, as well as the contractual fee rates payable by the Fund to Funds Management for class-level administrative services under a Class-Level Administration Agreement, which include, among other things, class-level transfer agency and sub-transfer agency costs (collectively, the “Management Rates”). The Board also reviewed and considered the contractual investment sub-advisory fee rates that are payable by Funds Management to each of the Sub-Advisers for investment sub-advisory services.
Among other information reviewed by the Board was a comparison of the Fund’s Management Rates with the average contractual investment management fee rates of funds in the expense Groups at a common asset level as well as transfer agency costs of the funds in the expense Groups. The Board noted that the Management Rates of the Fund were in range of the sum of these average rates for the Fund’s expense Groups for all share classes, except for the Administrator Class. The Board noted that the Management Rates of the Fund were higher than the sum of these average rates for the Fund’s expense Groups for the Administrator Class. However, the Board noted that the net operating expense ratios of the Fund were lower than, equal to or in range of the median net operating expense ratios of the expense Groups for each share class, and that the Fund’s expense ratio caps would be maintained.
The Board also received and considered information about the portion of the total management fee that was retained by Funds Management after payment of the fee to the Sub-Advisers for sub-advisory services. In assessing the reasonableness of this amount, the Board received and evaluated information about the nature and extent of responsibilities retained and risks assumed by Funds Management and not delegated to or assumed by the Sub-Advisers, and about Funds Management’s on-going oversight services. Given the affiliation between Funds Management and WellsCap, the Board ascribed limited relevance to the allocation of fees between them. The Board also considered that the sub-advisory fees paid to Artisan and LSV had been negotiated by Funds Management on an arm’s-length basis.
42 | Wells Fargo Diversified International Fund
Table of Contents
Other information (unaudited)
The Board also received and considered information about the nature and extent of services offered and fee rates charged by Funds Management and the Sub-Advisers to other types of clients with investment strategies similar to those of the Fund. In this regard, the Board received information about the significantly greater scope of services, and compliance, reporting and other legal burdens and risks of managing proprietary mutual funds compared with those associated with managing assets of other types of clients, including third-party sub-advised fund clients and non-mutual fund clients such as institutional separate accounts.
Based on its consideration of the factors and information it deemed relevant, including those described here, the Board determined that the compensation payable to Funds Management under the Management Agreement and to the Sub-Advisers under the Sub-Advisory Agreements was reasonable.
Profitability
The Board received and considered information concerning the profitability of Funds Management, as well as the profitability of both WFAM and Wells Fargo & Co. (“Wells Fargo”) from providing services to the fund family as a whole. The Board noted that WellsCap’s profitability information with respect to providing services to the Fund and other funds in the family was subsumed in the WFAM and Wells Fargo profitability analysis. The Board did not consider profitability with respect to Artisan or LSV, as the sub-advisory fees paid to Artisan and LSV had been negotiated by Funds Management on an arm’s-length basis.
Funds Management reported on the methodologies and estimates used in calculating profitability, including a description of the methodology used to allocate certain expenses. Among other things, the Board noted that the levels of profitability reported on a fund-by-fund basis varied widely, depending on factors such as the size, type and age of fund.
Based on its review, the Board did not deem the profits reported by Funds Management, WFAM or Wells Fargo from services provided to the Fund to be at a level that would prevent it from approving the continuation of the Advisory Agreements.
Economies of scale
The Board received and considered information about the potential for Funds Management to experience economies of scale in the provision of management services to the Fund, the difficulties of calculating economies of scale at an individual fund level, and the extent to which potential scale benefits are shared with shareholders. The Board noted the existence of breakpoints in the Fund’s management fee structure, which operate generally to reduce the Fund’s expense ratios as the Fund grows in size, and the size of the Fund in relation to such breakpoints. The Board considered that in addition to management fee breakpoints, Funds Management shares potential economies of scale from its management business in a variety of ways, including through fee waiver and expense reimbursement arrangements, services that benefit shareholders, competitive management fee rates set at the outset without regard to breakpoints, and investments in the business intended to enhance services available to shareholders.
The Board concluded that Funds Management’s arrangements with respect to the Fund, including contractual breakpoints, constituted a reasonable approach to sharing potential economies of scale with the Fund and its shareholders.
Other benefits to Funds Management and the Sub-Advisers
The Board received and considered information regarding potential “fall-out” or ancillary benefits received by Funds Management and its affiliates, including WellsCap, Artisan, and LSV, as a result of their relationships with the Fund. Ancillary benefits could include, among others, benefits directly attributable to other relationships with the Fund and benefits potentially derived from an increase in Funds Management’s and the Sub-Advisers’ business as a result of their relationships with the Fund. The Board noted that various affiliates of Funds Management may receive distribution-related fees, shareholder servicing payments and sub-transfer agency fees in respect of shares sold or held through them and services provided.
The Board also reviewed information about soft dollar credits earned and utilized by WellsCap and Artisan, fees earned by Funds Management and WellsCap from managing a private investment vehicle for the fund family’s securities lending collateral, and commissions earned by an affiliated broker from portfolio transactions.
Based on its consideration of the factors and information it deemed relevant, including those described here, the Board did not find that any ancillary benefits received by Funds Management and its affiliates, including WellsCap, or either Artisan or LSV, were unreasonable.
Conclusion
At the Meeting, after considering the above-described factors and based on its deliberations and its evaluation of the information described above, the Board unanimously approved the continuation of the Advisory Agreements for a one-year term and determined that the compensation payable to Funds Management and the Sub-Advisers under each of the Advisory Agreements was reasonable.
Wells Fargo Diversified International Fund | 43
Table of Contents
Other information (unaudited)
LIQUIDITY RISK MANAGEMENT PROGRAM
In accordance with Rule 22e-4 under the Investment Company Act of 1940, as amended (the “Liquidity Rule”), Wells Fargo Funds Trust (the “Trust”) has adopted and implemented a liquidity risk management program (the “Program”) on behalf of each of its series, including the Fund, which is reasonably designed to assess and manage the Fund’s liquidity risk. “Liquidity risk” is defined as the risk that the Fund is unable to meet redemption requests without significantly diluting remaining investors’ interests in the Fund. The Trust’s Board of Trustees (the “Board”) previously approved the designation of Wells Fargo Funds Management, LLC (“Funds Management”), the Fund’s investment manager, as the administrator of the Program, and Funds Management has established a Liquidity Risk Management Council composed of personnel from multiple departments within Funds Management and its affiliates to assist Funds Management in the implementation and on-going administration of the Program.
The Program is comprised of various components designed to support the assessment and/or management of liquidity risk, including: (1) the periodic assessment (no less frequently than annually) of certain factors that influence the Fund’s liquidity risk; (2) the periodic classification (no less frequently than monthly) of the Fund’s investments into one of four liquidity categories that reflect an estimate of their liquidity under current market conditions; (3) a 15% limit on the acquisition of “illiquid investments” (as defined under the Liquidity Rule); (4) to the extent the Fund does not invest primarily in “highly liquid investments” (as defined under the Liquidity Rule), the determination of a minimum percentage of the Fund’s assets that generally will be invested in highly liquid investments (an “HLIM”); (5) if the Fund has established an HLIM, the periodic review (no less frequently than annually) of the HLIM and the adoption of policies and procedures for responding to a shortfall of the Fund’s “highly liquid investments” below its HLIM; and (6) periodic reporting to the Board.
At a meeting of the Board held on May 26 and 28, 2020, the Board received a written report (the “Report”) from Funds Management that addressed the operation of the Program and assessed its adequacy and effectiveness of implementation. The Report covered the initial period from December 1, 2018 through December 31, 2019 (the “Reporting Period”). No significant liquidity events impacting the Fund were noted in the Report. There were no material changes to the Program during the Reporting Period. The Report concluded that the Program is operating effectively to assess and manage the Fund’s liquidity risk, and that the Program has been and continues to be adequately and effectively implemented to monitor and, as applicable, respond to the Fund’s liquidity developments.
There can be no assurance that the Program will achieve its objectives under all circumstances in the future. Please refer to the Fund’s prospectus for more information regarding the Fund’s exposure to liquidity risk and other risks to which an investment in the Fund may be subject.
44 | Wells Fargo Diversified International Fund
Table of Contents
For more information
More information about Wells Fargo Funds is available free upon request. To obtain literature, please write, visit the Fund’s website, or call:
Wells Fargo Funds
P.O. Box 219967
Kansas City, MO 64121-9967
Website: wfam.com
Individual investors: 1-800-222-8222
Retail investment professionals: 1-888-877-9275
Institutional investment professionals: 1-866-765-0778

This report and the financial statements contained herein are submitted for the general information of the shareholders of the Fund. If this report is used for promotional purposes, distribution of the report must be accompanied or preceded by a current prospectus. Before investing, please consider the investment objectives, risks, charges, and expenses of the investment. For a current prospectus and, if available, a summary prospectus, containing this information, call 1-800-222-8222 or visit the Fund’s website at wfam.com. Read the prospectus carefully before you invest or send money.
Wells Fargo Asset Management (WFAM) is the trade name for certain investment advisory/management firms owned by Wells Fargo & Company. These firms include but are not limited to Wells Capital Management Incorporated and Wells Fargo Funds Management, LLC. Certain products managed by WFAM entities are distributed by Wells Fargo Funds Distributor, LLC (a broker-dealer and Member FINRA).
This material is for general informational and educational purposes only and is NOT intended to provide investment advice or a recommendation of any kind—including a recommendation for any specific investment, strategy, or plan.
INVESTMENT PRODUCTS: NOT FDIC INSURED ◾ NO BANK GUARANTEE ◾ MAY LOSE VALUE
© 2020 Wells Fargo & Company. All rights reserved.
PAR-1120-00554 12-20
A237/AR237 10-20
Table of Contents

Annual Report
October 31, 2020
Wells Fargo
Emerging Markets Equity Fund
Beginning on January 1, 2021, as permitted by new regulations adopted by the Securities and Exchange Commission, paper copies of the Wells Fargo Funds’ annual and semi-annual shareholder reports issued after this date will no longer be sent by mail, unless you specifically request paper copies of the reports. Instead, the reports will be made available on the Funds’ website, and you will be notified by mail each time a report is posted and provided with a website address to access the report.
If you already elected to receive shareholder reports electronically, you will not be affected by this change and you need not take any action. You may elect to receive shareholder reports and other communications from the Fund electronically at any time by contacting your financial intermediary (such as a broker-dealer or bank) or, if you are a direct investor, by calling 1-800-222-8222 or by enrolling at wellsfargo.com/advantagedelivery.
You may elect to receive all future reports in paper free of charge. If you invest through a financial intermediary, you can contact your financial intermediary to request that you continue to receive paper copies of your shareholder reports; if you invest directly with the Fund, you can call 1-800-222-8222. Your election to receive reports in paper will apply to all Wells Fargo Funds held in your account with your financial intermediary or, if you are a direct investor, to all Wells Fargo Funds that you hold.
Table of Contents
|
Reduce clutter. Save trees. |
Sign up for electronic delivery of prospectuses and shareholder reports at wellsfargo.com/ |
The views expressed and any forward-looking statements are as of October 31, 2020, unless otherwise noted, and are those of the Fund’s portfolio managers and/or Wells Fargo Asset Management. Discussions of individual securities, or the markets generally, or any Wells Fargo Fund are not intended as individual recommendations. Future events or results may vary significantly from those expressed in any forward-looking statements. The views expressed are subject to change at any time in response to changing circumstances in the market. Wells Fargo Asset Management and the Fund disclaim any obligation to publicly update or revise any views expressed or forward-looking statements.
INVESTMENT PRODUCTS: NOT FDIC INSURED ◾ NO BANK GUARANTEE ◾ MAY LOSE VALUE
Wells Fargo Emerging Markets Equity Fund | 1
Table of Contents
Letter to shareholders (unaudited)

Andrew Owen
President
Wells Fargo Funds
Dear Shareholder:
We are pleased to offer you this annual report for the Wells Fargo Emerging Markets Equity Fund for the 12-month period that ended October 31, 2020. Global stock markets saw earlier gains erased in March as governments around the world took unprecedented measures, attempting to stop the spread of COVID-19 at the expense of short-term economic output. However, markets rallied strongly from April through period-end to offset those short-term losses as central banks bolstered capital markets and confidence.
For the 12-month period, equities had generally positive total returns despite intense volatility in March. Non-U.S. developed market equities had weaker performance than emerging market and U.S. stocks. While gains from fixed-income securities were positive, they were more modest than equities. For the period, U.S. stocks, based on the S&P 500 Index,1 gained 9.71%. International stocks, as measured by the MSCI ACWI ex USA Index (Net),2 returned -2.61%, while the MSCI EM Index (Net)3 had stronger performance, with a 8.25% gain. Among bond indices, the Bloomberg Barclays U.S. Aggregate Bond Index4 returned 6.19%, the Bloomberg Barclays Global Aggregate ex-USD Index5 gained 4.96%, and the Bloomberg Barclays Municipal Bond Index6 returned 3.59% while the ICE BofA U.S. High Yield Index7 returned 2.54%.
The period began with buoyed investor confidence.
Equity markets rallied in November despite ongoing geopolitical risks. Hopes for a U.S.-China trade deal buoyed investor confidence. U.S. business sentiment improved slightly and manufacturing and services activity picked up. While consumer confidence and purchasing managers’ activity rose in the eurozone, China reported weakening manufacturing and consumer data. Bond yields rose marginally, leading to slightly negative returns for global government and investment-grade corporate bonds.
Financial markets ended 2019 boosted by the U.S. and China accord on a Phase One trade deal. That, along with the landslide election win by the pro-Brexit U.K. Conservative Party and ongoing central bank support, gave investors greater confidence. U.S. economic indicators were generally positive, with the exception of manufacturing activity and business confidence. Consumer confidence was fed by a robust labor market, tame inflation, and lower interest rates, which boosted housing affordability and stimulated homebuyer activity. The impeachment of President Trump had little market impact. Meanwhile, slowing Chinese economic activity, partly a result of the trade war, led to further government stimulus at year-end through lower reserve ratios, allowing banks to lend more money.
| 1 | The S&P 500 Index consists of 500 stocks chosen for market size, liquidity, and industry group representation. It is a market-value-weighted index with each stock’s weight in the index proportionate to its market value. You cannot invest directly in an index. |
| 2 | The Morgan Stanley Capital International (MSCI) All Country World Index (ACWI) ex USA Index (Net) is a free-float-adjusted market-capitalization-weighted index that is designed to measure the equity market performance of developed and emerging markets, excluding the United States. Source: MSCI. MSCI makes no express or implied warranties or representations and shall have no liability whatsoever with respect to any MSCI data contained herein. The MSCI data may not be further redistributed or used as a basis for other indices or any securities or financial products. This report is not approved, reviewed, or produced by MSCI. You cannot invest directly in an index. |
| 3 | The MSCI Emerging Markets (EM) Index (Net) is a free-float-adjusted market-capitalization-weighted index that is designed to measure equity market performance of emerging markets. You cannot invest directly in an index. |
| 4 | The Bloomberg Barclays U.S. Aggregate Bond Index is a broad-based benchmark that measures the investment-grade, U.S. dollar-denominated, fixed-rate taxable bond market, including Treasuries, government-related and corporate securities, mortgage-backed securities (agency fixed-rate and hybrid adjustable-rate mortgage pass-throughs), asset-backed securities, and commercial mortgage-backed securities. You cannot invest directly in an index. |
| 5 | The Bloomberg Barclays Global Aggregate ex-USD Index is an unmanaged index that provides a broad-based measure of the global investment-grade fixed-income markets excluding the U.S. dollar-denominated debt market. You cannot invest directly in an index. |
| 6 | The Bloomberg Barclays Municipal Bond Index is an unmanaged index composed of long-term tax-exempt bonds with a minimum credit rating of Baa. You cannot invest directly in an index. |
| 7 | The ICE BofA U.S. High Yield Index is a market-capitalization-weighted index of domestic and Yankee high-yield bonds. The index tracks the performance of high-yield securities traded in the U.S. bond market. You cannot invest directly in an index. Copyright 2020. ICE Data Indices, LLC. All rights reserved. |
2 | Wells Fargo Emerging Markets Equity Fund
Table of Contents
Letter to shareholders (unaudited)
The 2019 year-end rally continued in early January 2020. However, capital market volatility spiked in late January on concerns over the potential impact of COVID-19 on the global economy and stock markets. With sentiment somewhat souring, perceived safe havens did well in January. The U.S. dollar and Japanese yen both rose and government bonds outperformed equities. While the S&P 500 Index held its ground, emerging market equities tumbled, including those in Asia.
In February, COVID-19 became the major market focus. Fears of the virus’s impact on global growth led to expectations of increased global central bank monetary policy support. That led the 10-year U.S. Treasury yield to fall to an all-time low of 1.1%. Although equity markets initially shrugged off concerns about the outbreak, focusing instead on strong fourth-quarter earnings and improving business confidence in January, market sentiment turned sharply lower and the S&P 500 Index lost 8.2% for the month. Oil prices tumbled as Russia and the Organization of the Petroleum Exporting Countries compounded a major decline in oil demand with a brutal price war, partly aimed at dissuading further U.S. shale production, causing the price of West Texas Intermediate crude oil to plummet.
The global spread of COVID-19 in March led country after country to clamp down on social- and business-related activity in order to contain the virus from causing even greater devastation and overwhelming health care systems. This abrupt stoppage of economic activity led to the sharp deceleration of global output, sending economies into a deep contraction. Central banks responded swiftly, slashing interest rates and expanding quantitative easing programs to restore liquidity and confidence in the markets. In the U.S., the Federal Reserve (Fed) introduced several new lending programs, funding investment-grade bonds, money market mutual funds, and commercial paper while purchasing Treasuries, mortgage-backed securities, and overnight repurchase agreements. Meanwhile, stock markets tumbled quickly into a bear market, ending the longest bull stock market in U.S. history.
Markets rebounded strongly in April, fueled by unprecedented government and central bank stimulus measures. The U.S. economy contracted by an annualized 5.0% pace in the first quarter of 2020, with 30 million new unemployment insurance claims in six weeks. In the eurozone, first-quarter real gross domestic product (GDP) shrank 3.8% with the composite April Flash Purchasing Managers’ Index (PMI), a monthly survey of purchasing managers, falling to an all-time low of 13.5. The European Central Bank expanded its quantitative easing to include the purchase of additional government bonds of countries with the greatest virus-related need, including Italy and Spain. China’s first-quarter GDP fell by 6.8% year over year. However, retail sales, production, and investment showed signs of recovery. Extreme oil-price volatility continued as global supply far exceeded demand.
The global equity market rebound continued in May, with widespread advances. Investors regained confidence on reports of early signs of success in human trials of a COVID-19 vaccine. Growth stocks continued to outperform value stocks while returns on global government bonds were generally flat. In the U.S., a gap grew between the stock market rebound and economic data, including an April unemployment rate of 14.7%, the highest level since World War II. Manufacturing and services purchasing managers’ indices reflected widespread weakening activity in May. U.S. corporate earnings reports indicated a 14% year-over-year contraction in earnings from the first quarter of 2019. However, high demand for technology, driven by remote activity, supported robust information technology sector earnings, which helped drive major technology stocks higher.
Financial markets posted widely positive returns in June despite ongoing economic weakness and high levels of uncertainty on the containment of COVID-19 and the timing of an effective vaccine. There were hopeful signs as economies reopened. Vitally important to market sentiment was the ongoing commitment by central banks globally
“The global spread of COVID-19 in March led country after country to clamp down on social- and business-related activity in order to contain the virus from causing even greater devastation and overwhelming health care systems.”
Wells Fargo Emerging Markets Equity Fund | 3
Table of Contents
Letter to shareholders (unaudited)
“In October, capital markets took a step back from their six-month rally. Market volatility rose in advance of the U.S. election and amid a global increase in COVID-19 infections.”
to do all they can to provide economic support through liquidity and low borrowing costs. U.S. economic activity was aided by one-time $1,200 stimulus checks and $600 weekly bonus unemployment benefits that expired at the end of July. However, unemployment remained historically high, easing somewhat from 14.7% in April to 11.1% in June. By the end of June, numerous states reported increases of COVID-19 cases. China’s economic recovery picked up momentum in June, though it remained far from a full recovery.
July was broadly positive for both global equities and fixed income. However, economic data and a resurgence of COVID-19 cases pointed to the vulnerability of the global economy and the ongoing imperative to regain control of the pandemic. Second-quarter GDP shrank from the previous quarter by 9.5% and 12.1% in the U.S. and the eurozone, respectively. In contrast, China reported a 3.2% year-over-year expansion in its second-quarter GDP. U.S. unemployment remained high despite adding 1.8 million jobs in July, with a double-digit jobless rate persisting. However, manufacturing activity grew in both the U.S. and the eurozone. In Asia, while China’s manufacturing sector continued to expand, activity in Japan and South Korea contracted. A rising concern was the rapid and broad reemergence of COVID-19 infections.
The stock market continued to rally in August despite concerns over rising numbers of COVID-19 cases in the United States and several European countries, including France and Spain, as well as the July expiration of the $600 weekly bonus unemployment benefit. U.S. stocks had strong monthly gains, surpassing broadly positive overall global equity performance, while fixed-income market monthly returns were broadly flat. Generally stronger-than-expected second-quarter earnings boosted investor sentiment along with the Fed’s announcement of a policy shift that will likely lead to longer-term low interest rates and supportive monetary policy. U.S. indices measuring manufacturing and services activities beat expectations while the U.S. housing market maintained strength. In Europe, retail sales expanded and consumer confidence was steady. China’s economy continued to expand.
Stocks grew more volatile in September on mixed economic data. U.S. economic activity continued to grow. However, six months after the bottom fell out of the labor market in early spring, only half of the 22 million jobs lost had returned. The U.S. unemployment rate fell to 7.9% in September, reflecting steady improvement but far higher than the 3.5% pre-COVID-19 rate. Only 661,000 jobs were added for the month, down from 1.5 million in August. Meanwhile, a reported 2.3 million people have given up looking for work. With U.S. Congress failing to pass further fiscal relief and uncertainties surrounding a possible vaccine, doubts crept back into the financial markets. In the U.K., a lack of progress in Brexit talks with the European Union weighed on markets. China’s economy picked up steam, however, with growth fueled by increased global demand, and China’s services sector rallied.
In October, capital markets took a step back from their six-month rally. Market volatility rose in advance of the U.S. election and amid a global increase in COVID-19 infections. Europe responded with a new round of restrictions affecting economic activity. Meanwhile, Brexit remained unresolved as the European Union and the U.K. failed to strike a deal by a mid-October deadline. U.S. markets looked favorably at a possible Democratic sweep and control of the federal purse strings as that could lead to the passage of long-awaited additional fiscal stimulus, which could boost economic activity. Meanwhile, China continued to stand apart, reporting 4.9% third-quarter GDP growth year over year.
4 | Wells Fargo Emerging Markets Equity Fund
Table of Contents
Letter to shareholders (unaudited)
Don’t let short-term uncertainty derail long-term investment goals.
Periods of investment uncertainty can present challenges, but experience has taught us that maintaining long-term investment goals can be an effective way to plan for the future. To help you create a sound strategy based on your personal goals and risk tolerance, Wells Fargo Funds offers more than 100 mutual funds spanning a wide range of asset classes and investment styles. Although diversification cannot guarantee an investment profit or prevent losses, we believe it can be an effective way to manage investment risk and potentially smooth out overall portfolio performance. We encourage investors to know their investments and to understand that appropriate levels of risk-taking may unlock opportunities.
Thank you for choosing to invest with Wells Fargo Funds. We appreciate your confidence in us and remain committed to helping you meet your financial needs.
Sincerely,

Andrew Owen
President
Wells Fargo Funds
|
For further information about your Fund, contact your investment professional, visit our website at wfam.com, or call us directly at 1-800-222-8222. |
Notice to Shareholders
At a meeting held on August 10-12, 2020, the Board of Trustees of the Fund approved a change to the Fund’s automatic conversion feature for Class C shares in order to shorten the required holding period from 10 to 8 years. As a result, on a monthly basis beginning November 5, 2020, Class C shares will convert automatically into Class A shares 8 years after the initial date of purchase or, if you acquired your Class C shares through an exchange or conversion from another share class, 8 years after the date you acquired your Class C shares. When Class C shares that you acquired through a purchase or exchange convert, any other Class C shares that you purchased with reinvested dividends and distributions also will convert into Class A shares on a pro rata basis.
Please note that a shorter holding period may apply depending on your intermediary. Please see “Appendix A—Sales Charge Reductions and Waivers for Certain Intermediaries” in the Fund’s prospectus for further information.
Wells Fargo Emerging Markets Equity Fund | 5
Table of Contents
Performance highlights (unaudited)
Investment objective
The Fund seeks long-term capital appreciation.
Manager
Wells Fargo Funds Management, LLC
Subadviser
Wells Capital Management Incorporated
Portfolio managers
Derrick Irwin, CFA®‡
Richard Peck, CFA®‡
Yi (Jerry) Zhang, Ph.D., CFA®‡
Average annual total returns (%) as of October 31, 2020
| Including sales charge | Excluding sales charge | Expense ratios1 (%) | ||||||||||||||||||||||||||||||||
| Inception date | 1 year | 5 year | 10 year | 1 year | 5 year | 10 year | Gross | Net2 | ||||||||||||||||||||||||||
| Class A (EMGAX) | 9-6-1994 | 2.77 | 7.90 | 2.32 | 9.03 | 9.18 | 2.93 | 1.59 | 1.56 | |||||||||||||||||||||||||
| Class C (EMGCX) | 9-6-1994 | 7.39 | 8.39 | 2.17 | 8.39 | 8.39 | 2.17 | 2.34 | 2.31 | |||||||||||||||||||||||||
| Class R6 (EMGDX)3 | 6-28-2013 | – | – | – | 9.49 | 9.65 | 3.38 | 1.16 | 1.14 | |||||||||||||||||||||||||
| Administrator Class (EMGYX) | 9-6-1994 | – | – | – | 10.25 | 9.52 | 3.17 | 1.51 | 1.43 | |||||||||||||||||||||||||
| Institutional Class (EMGNX) | 7-30-2010 | – | – | – | 9.42 | 9.58 | 3.34 | 1.26 | 1.18 | |||||||||||||||||||||||||
| MSCI EM Index (Net)4 | – | – | – | – | 8.25 | 7.92 | 2.42 | – | – | |||||||||||||||||||||||||
Figures quoted represent past performance, which is no guarantee of future results, and do not reflect taxes that a shareholder may pay on an investment in a fund. Investment return and principal value of an investment will fluctuate so that an investor’s shares, when redeemed, may be worth more or less than their original cost. Performance shown without sales charges would be lower if sales charges were reflected. Current performance may be lower or higher than the performance data quoted, which assumes the reinvestment of dividends and capital gains. Current month-end performance is available on the Fund’s website, wfam.com.
Index returns do not include transaction costs associated with buying and selling securities, any mutual fund fees or expenses, or any taxes. It is not possible to invest directly in an index.
For Class A shares, the maximum front-end sales charge is 5.75%. For Class C shares, the maximum contingent deferred sales charge is 1.00%. Performance including a contingent deferred sales charge assumes the sales charge for the corresponding time period. Class R6, Administrator Class, and Institutional Class shares are sold without a front-end sales charge or contingent deferred sales charge.
Stock values fluctuate in response to the activities of individual companies and general market and economic conditions. Foreign investments are especially volatile and can rise or fall dramatically due to differences in the political and economic conditions of the host country. These risks are generally intensified in emerging markets. The use of derivatives may reduce returns and/or increase volatility. Certain investment strategies tend to increase the total risk of an investment (relative to the broader market). The Fund is exposed to smaller-company securities risk. Consult the Fund’s prospectus for additional information on these and other risks.
Please see footnotes on page 7.
6 | Wells Fargo Emerging Markets Equity Fund
Table of Contents
Performance highlights (unaudited)
| Growth of $10,000 investment as of October 31, 20205 |
|
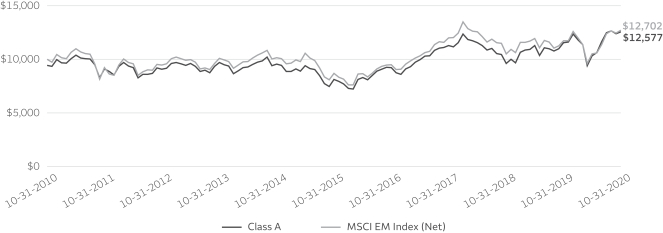
| ‡ | CFA® and Chartered Financial Analyst® are trademarks owned by CFA Institute. |
| 1 | Reflects the expense ratios as stated in the most recent prospectuses, which include the impact of 0.01% in acquired fund fees and expenses. The expense ratios shown are subject to change and may differ from the annualized expense ratios shown in the financial highlights of this report, which do not include acquired fund fees and expenses. |
| 2 | The manager has contractually committed through February 28, 2021, to waive fees and/or reimburse expenses to the extent necessary to cap total annual fund operating expenses after fee waivers at 1.55% for Class A, 2.30% for Class C, 1.13% for Class R6, 1.42% for Administrator Class, and 1.17% for Institutional Class. Brokerage commissions, stamp duty fees, interest, taxes, acquired fund fees and expenses (if any), and extraordinary expenses are excluded from the expense caps. Prior to or after the commitment expiration date, the caps may be increased or the commitment to maintain the caps may be terminated only with the approval of the Board of Trustees. Without these caps, the Fund’s returns would have been lower. The expense ratio paid by an investor is the net expense ratio (the total annual fund operating expenses after fee waivers) as stated in the prospectuses. |
| 3 | Historical performance shown for the Class R6 shares prior to their inception reflects the performance of the Institutional Class shares and includes the higher expenses applicable to the Institutional Class shares. If these expenses had not been included, returns for the Class R6 shares would have been higher. |
| 4 | The Morgan Stanley Capital International (MSCI) Emerging Markets (EM) Index (Net) is a free-float-adjusted market-capitalization-weighted index that is designed to measure the equity market performance of emerging markets. Source: MSCI. MSCI makes no express or implied warranties or representations and shall have no liability whatsoever with respect to any MSCI data contained herein. The MSCI data may not be further redistributed or used as a basis for other indices or any securities or financial products. This report is not approved, reviewed, or produced by MSCI. You cannot invest directly in an index. |
| 5 | The chart compares the performance of Class A shares for the most recent ten years with the MSCI EM Index (Net). The chart assumes a hypothetical investment of $10,000 in Class A shares and reflects all operating expenses and assumes the maximum initial sales charge of 5.75%. |
| 6 | The ten largest holdings, excluding cash, cash equivalents and any money market funds, are calculated based on the value of the investments divided by total net assets of the Fund. Holdings are subject to change and may have changed since the date specified. |
| 7 | Amounts are calculated based on the total long-term investments of the Fund. These amounts are subject to change and may have changed since the date specified. |
Wells Fargo Emerging Markets Equity Fund | 7
Table of Contents
Performance highlights (unaudited)
MANAGER’S DISCUSSION
Fund highlights
| ∎ | The Fund outperformed its benchmark, the MSCI EM Index (Net), for the 12-month period that ended October 31, 2020. |
| ∎ | Stock selection was the largest driver of outperformance. Primary sector contributors included energy and communication services and country contributors included China, Russia, and Taiwan. |
| ∎ | The primary sector detractors included consumer staples and health care and country detractors included Mexico, Chile, and India. |
Emerging market equities recover from the pandemic.
Emerging market equities rose overall during a volatile one-year period. Early optimism from a U.S.-China trade deal was quickly derailed in January by the COVID-19 pandemic and economic contraction, before massive economic stimulus supported markets. In the first quarter, COVID-19 and economic lockdowns quickly spread across the globe before aggressive stimulus, vaccine optimism, and a faster-than-expected rebound in some economic data contributed to a sharp recovery from the March low. Second-quarter performance was among the best in years and the third quarter continued the strong recovery trend as risk-on sentiment pushed the index higher. Monetary stimulus was a major support as the U.S. Federal Reserve and emerging market central banks kept rates at or near record lows. Although COVID-19 persisted and some emerging market countries, such as India and Brazil, remained hot spots, many emerging markets wrestled case levels lower and relaxed restrictions. China rebounded swiftly and other countries also began to recover. Growth momentum stumbled in September due to virus resurgence and mixed economic data. Some companies indicated signs of stabilization and appeared cautiously optimistic about the remainder of the year. Geopolitical issues included spikes in China-U.S. tension and U.S. election uncertainty. Commodity prices benefited from signs of economic recovery and China’s greater demand for base metals.
We emphasize high-quality companies in the Fund.
We continued to make changes to the Fund’s holdings to seek to own companies of the highest quality and to take advantage of valuation opportunities. During the period, the Fund increased its weight in China, Taiwan, consumer discretionary, and communication services and reduced exposure to Brazil, Thailand, financials, and consumer staples. Purchases during the period included India’s Axis Bank; Mexico’s America Movil and Fomento Economico Mexicano, S.A.B. de C.V. (FEMSA); and China’s Bilibili Incorporated. Sales during the period included China’s Hengan International Group Company Limited, Malaysia’s Genting Malaysia, and Brazil’s IRB Brasil Resseguros S.A.
| Ten largest holdings (%) as of October 31, 20206 | ||||
Tencent Holdings Limited | 5.44 | |||
Samsung Electronics Company Limited | 5.16 | |||
Taiwan Semiconductor Manufacturing Company Limited ADR | 4.02 | |||
Alibaba Group Holding Limited ADR | 3.51 | |||
Meituan Dianping | 3.18 | |||
Li Ning Company Limited | 3.11 | |||
Reliance Industries Limited GDR | 2.74 | |||
Bilibili Incorporated ADR | 2.64 | |||
Vipshop Holdings Limited ADR | 2.64 | |||
Naver Corporation | 2.40 | |||
Positive stock selection in China, Russia, and Taiwan was the primary driver of relative outperformance at the country level. China benefited from strong performance from Bilibili and Vipshop Holdings Limited. In Russia, Yandex N.V. and HeadHunter Group PLC were among leading performers. In Taiwan, performance was led by MediaTek, Incorporated, and Taiwan Semiconductor Manufacturing Company Limited. Among sectors, energy, communication services, and consumer discretionary were the leading performers due to stock selection in energy and communication services, while consumer discretionary benefited from an overweight position in the outperforming sector. Energy was led by India’s Reliance Industries Limited. In communication services, the aforementioned Bilibili and Korea’s Naver Corporation were among leading performers.
Please see footnotes on page 7.
8 | Wells Fargo Emerging Markets Equity Fund
Table of Contents
Performance highlights (unaudited)
| Sector allocation as of October 31, 20207 |
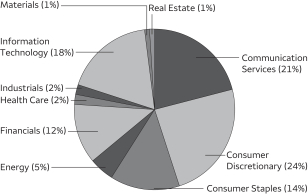 |
| Country allocation as of October 31, 20207 |
|
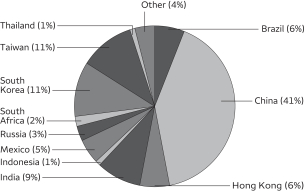
Detractors at the country level included Mexico, Chile, and India due to a combination of stock performance and relative weightings versus the benchmark. In Mexico, Fibra Uno Administracion S.A. de C.V. (FUNO) and FEMSA were leading detractors. In Chile, S.A.C.I. Falabella was an underperformer. In India, ITC Limited and IndusInd Bank Limited were the leading detractors. Leading sector detractors included consumer staples, health care, and real estate. In consumer staples, Brazil’s BRF S.A. and Mexico’s FEMSA were among leading detractors. In health care, Brazil’s Hapvida Participacoes e Investimentos S.A. was the leading detractor. In real estate, Mexico’s FUNO and Brazil’s Multiplan Empreendimentos Imobiliarios S.A. were the leading detractors.
Outlook
Investor focus appears to have shifted from exuberance over gradual economic normalization from the pandemic to the outlook for 2021 and beyond. The climb from here to full economic capacity and prior levels of earnings will be long, and the outlook is opaque, but we see reason for optimism. Although COVID-19 will be a market driver for the foreseeable future, many of the emerging markets have wrestled case levels lower and life is returning to normal. Massive global fiscal and monetary stimulus has stabilized economies and boosted markets, and low emerging market interest rates are likely to remain for an extended period. The U.S. dollar bull market, a long-term headwind to emerging market equities, appears tired, and emerging market equities would benefit from a reversal, or pause, in dollar strength.
The crisis accelerated trends and ignited new sources of growth, including e-commerce and digitalization. China-U.S. tension is a concern and a potential catalyst as competition drives innovation. Market distortions, including divergence between “growth” and “value” stocks and high market concentration, are also challenges. We manage this risk by maintaining a diversified portfolio of high-quality companies and believe our bottom-up, risk-adjusted approach helps reduce volatility and generate more consistent long-term performance.
Please see footnotes on page 7.
Wells Fargo Emerging Markets Equity Fund | 9
Table of Contents
As a shareholder of the Fund, you incur two types of costs: (1) transaction costs, including sales charges (loads) on purchase payments and contingent deferred sales charges (if any) on redemptions and (2) ongoing costs, including management fees, distribution (12b-1) and/or shareholder servicing fees, and other Fund expenses. This example is intended to help you understand your ongoing costs (in dollars) of investing in the Fund and to compare these costs with the ongoing costs of investing in other mutual funds.
The example is based on an investment of $1,000 invested at the beginning of the six-month period and held for the entire period from May 1, 2020 to October 31, 2020.
Actual expenses
The “Actual” line of the table below provides information about actual account values and actual expenses. You may use the information in this line, together with the amount you invested, to estimate the expenses that you paid over the period. Simply divide your account value by $1,000 (for example, an $8,600 account value divided by $1,000 = 8.6), then multiply the result by the number in the “Actual” line under the heading entitled “Expenses paid during period” for your applicable class of shares to estimate the expenses you paid on your account during this period.
Hypothetical example for comparison purposes
The “Hypothetical” line of the table below provides information about hypothetical account values and hypothetical expenses based on the Fund’s actual expense ratio and an assumed rate of return of 5% per year before expenses, which is not the Fund’s actual return. The hypothetical account values and expenses may not be used to estimate the actual ending account balance or expenses you paid for the period. You may use this information to compare the ongoing costs of investing in the Fund and other funds. To do so, compare this 5% hypothetical example with the 5% hypothetical examples that appear in the shareholder reports of the other funds.
Please note that the expenses shown in the table are meant to highlight your ongoing costs only and do not reflect any transactional costs, such as sales charges (loads) and contingent deferred sales charges. Therefore, the “Hypothetical” line of the table is useful in comparing ongoing costs only and will not help you determine the relative total costs of owning different funds. In addition, if these transactional costs were included, your costs would have been higher.
Beginning account value 5-1-2020 | Ending account value 10-31-2020 | Expenses paid during the period1 | Annualized net expense ratio | |||||||||||||
Class A | ||||||||||||||||
Actual | $ | 1,000.00 | $ | 1,218.42 | $ | 8.36 | 1.50 | % | ||||||||
Hypothetical (5% return before expenses) | $ | 1,000.00 | $ | 1,017.60 | $ | 7.61 | 1.50 | % | ||||||||
Class C | ||||||||||||||||
Actual | $ | 1,000.00 | $ | 1,215.96 | $ | 12.53 | 2.25 | % | ||||||||
Hypothetical (5% return before expenses) | $ | 1,000.00 | $ | 1,013.83 | $ | 11.39 | 2.25 | % | ||||||||
Class R6 | ||||||||||||||||
Actual | $ | 1,000.00 | $ | 1,220.75 | $ | 6.03 | 1.08 | % | ||||||||
Hypothetical (5% return before expenses) | $ | 1,000.00 | $ | 1,019.71 | $ | 5.48 | 1.08 | % | ||||||||
Administrator Class | ||||||||||||||||
Actual | $ | 1,000.00 | $ | 1,231.32 | $ | 7.91 | 1.41 | % | ||||||||
Hypothetical (5% return before expenses) | $ | 1,000.00 | $ | 1,018.05 | $ | 7.15 | 1.41 | % | ||||||||
Institutional Class | ||||||||||||||||
Actual | $ | 1,000.00 | $ | 1,220.42 | $ | 6.53 | 1.17 | % | ||||||||
Hypothetical (5% return before expenses) | $ | 1,000.00 | $ | 1,019.25 | $ | 5.94 | 1.17 | % | ||||||||
| 1 | Expenses paid is equal to the annualized net expense ratio of each class multiplied by the average account value over the period, multiplied by the number of days in the most recent fiscal half-year divided by the number of days in the fiscal year (to reflect the one-half-year period). |
10 | Wells Fargo Emerging Markets Equity Fund
Table of Contents
Portfolio of investments—October 31, 2020
| Shares | Value | |||||||||||||||
| Common Stocks: 94.69% |
| |||||||||||||||
| Argentina: 0.28% | ||||||||||||||||
MercadoLibre Incorporated (Consumer Discretionary, Internet & Direct Marketing Retail) † | 10,616 | $ | 12,888,355 | |||||||||||||
|
| |||||||||||||||
| Brazil: 5.08% | ||||||||||||||||
Ambev SA ADR (Consumer Staples, Beverages) | 4,164,500 | 8,912,030 | ||||||||||||||
Atacadao Distribuicao Comercio e Industria Limitada (Consumer Staples, Food & Staples Retailing) | 5,370,000 | 17,266,881 | ||||||||||||||
B2W Companhia Digital (Consumer Discretionary, Internet & Direct Marketing Retail) † | 4,674,634 | 61,297,059 | ||||||||||||||
B3 Brasil Bolsa Balcao SA (Financials, Capital Markets) | 4,553,005 | 40,507,656 | ||||||||||||||
Banco Bradesco SA ADR (Financials, Banks) | 4,748,163 | 16,618,571 | ||||||||||||||
BK Brasil Operacao e Assessoria a Restaurantes SA (Consumer Discretionary, Hotels, Restaurants & Leisure) | 2,735,794 | 4,643,929 | ||||||||||||||
BRF Brazil Foods SA ADR (Consumer Staples, Food Products) † | 8,793,392 | 26,028,440 | ||||||||||||||
Cogna Educacao (Consumer Discretionary, Diversified Consumer Services) | 3,346,000 | 2,501,650 | ||||||||||||||
Hapvida Participacoes e Investimentos SA (Health Care, Health Care Providers & Services) 144A | 1,994,507 | 22,374,962 | ||||||||||||||
Lojas Renner SA (Consumer Discretionary, Multiline Retail) | 3,120,175 | 20,364,512 | ||||||||||||||
Multiplan Empreendimentos Imobiliarios SA (Real Estate, Real Estate Management & Development) | 1,636,906 | 5,411,707 | ||||||||||||||
Raia Drogasil SA (Consumer Staples, Food & Staples Retailing) | 1,968,000 | 8,252,090 | ||||||||||||||
| 234,179,487 | ||||||||||||||||
|
| |||||||||||||||
| Chile: 0.94% | ||||||||||||||||
Banco Santander Chile SA ADR (Financials, Banks) | 1,130,492 | 15,691,229 | ||||||||||||||
S.A.C.I. Falabella (Consumer Discretionary, Multiline Retail) | 10,160,549 | 27,893,922 | ||||||||||||||
| 43,585,151 | ||||||||||||||||
|
| |||||||||||||||
| China: 39.22% | ||||||||||||||||
51job Incorporated ADR (Industrials, Professional Services) † | 536,541 | 37,611,524 | ||||||||||||||
Agora Incorporated ADR (Information Technology, Software) †« | 114,765 | 4,418,453 | ||||||||||||||
Alibaba Group Holding Limited (Consumer Discretionary, Internet & Direct Marketing Retail) † | 450,000 | 17,052,230 | ||||||||||||||
Alibaba Group Holding Limited ADR (Consumer Discretionary, Internet & Direct Marketing Retail) † | 530,837 | 161,740,726 | ||||||||||||||
Best Incorporated ADR (Industrials, Air Freight & Logistics) †« | 3,757,927 | 9,657,872 | ||||||||||||||
Bilibili Incorporated ADR (Communication Services, Entertainment) † | 2,727,345 | 121,830,501 | ||||||||||||||
China Distance Education ADR (Consumer Discretionary, Diversified Consumer Services) | 966,510 | 8,331,316 | ||||||||||||||
China Life Insurance Company Class H (Financials, Insurance) | 22,643,190 | 49,405,747 | ||||||||||||||
China Literature Limited (Communication Services, Media) 144A† | 2,569,968 | 21,113,392 | ||||||||||||||
China MeiDong Auto Holdings Limited (Consumer Discretionary, Specialty Retail) | 12,693,400 | 51,979,079 | ||||||||||||||
FinVolution Group ADR (Financials, Consumer Finance) | 4,401,985 | 8,936,030 | ||||||||||||||
Greentree Hospitality Group Limited (Consumer Discretionary, Hotels, Restaurants & Leisure) | 1,215,741 | 16,120,726 | ||||||||||||||
Hua Medicine Limited (Health Care, Pharmaceuticals) 144A† | 8,733,136 | 4,765,065 | ||||||||||||||
Huami Corporation ADR (Information Technology, Electronic Equipment, Instruments & Components) † | 2,119,291 | 24,753,319 | ||||||||||||||
IQIYI Incorporated ADR (Communication Services, Entertainment) † | 650,339 | 16,063,373 | ||||||||||||||
Jianpu Technology Incorporated ADR (Financials, Consumer Finance) † | 383,811 | 1,435,454 | ||||||||||||||
Koolearn Technology Holding Limited (Consumer Discretionary, Diversified Consumer Services) 144A†« | 7,483,215 | 24,228,870 | ||||||||||||||
Li Ning Company Limited (Consumer Discretionary, Textiles, Apparel & Luxury Goods) | 27,557,707 | 143,629,098 | ||||||||||||||
Meituan Dianping (Consumer Discretionary, Internet & Direct Marketing Retail) † | 3,935,100 | 146,697,214 | ||||||||||||||
New Oriental Education & Technology Group Incorporated ADR (Consumer Discretionary, Diversified Consumer Services) † | 563,789 | 90,420,480 | ||||||||||||||
Pinduoduo Incorporated ADR (Consumer Discretionary, Internet & Direct Marketing Retail) † | 224,441 | 20,195,201 | ||||||||||||||
Shandong Weigao Group Medical Polymer Company Limited Class H (Health Care, Health Care Equipment & Supplies) | 17,450,600 | 33,843,497 | ||||||||||||||
SINA Corporation (Communication Services, Interactive Media & Services) † | 774,207 | 33,174,770 | ||||||||||||||
Tencent Holdings Limited (Communication Services, Interactive Media & Services) | 3,283,400 | 250,870,174 | ||||||||||||||
Tongdao Liepin Group (Communication Services, Interactive Media & Services) † | 1,636,260 | 4,018,625 | ||||||||||||||
The accompanying notes are an integral part of these financial statements.
Wells Fargo Emerging Markets Equity Fund | 11
Table of Contents
Portfolio of investments—October 31, 2020
| Shares | Value | |||||||||||||||
| China (continued) | ||||||||||||||||
Trip.com Group Limited ADR (Consumer Discretionary, Internet & Direct Marketing Retail) † | 1,648,013 | $ | 47,396,854 | |||||||||||||
Tsingtao Brewery Company Limited Class H (Consumer Staples, Beverages) | 5,252,500 | 43,523,085 | ||||||||||||||
Uxin Limited ADR (Consumer Discretionary, Internet & Direct Marketing Retail) †« | 3,950,000 | 3,792,000 | ||||||||||||||
Uxin Limited Class A (Consumer Discretionary, Internet & Direct Marketing Retail) (a) | 23,979,831 | 7,673,544 | ||||||||||||||
Vipshop Holdings Limited ADR (Consumer Discretionary, Internet & Direct Marketing Retail) † | 5,689,921 | 121,764,309 | ||||||||||||||
Want Want China Holdings Limited (Consumer Staples, Food Products) | 57,025,800 | 37,764,445 | ||||||||||||||
Weibo Corporation ADR (Communication Services, Interactive Media & Services) † | 1,410,134 | 58,591,068 | ||||||||||||||
WH Group Limited (Consumer Staples, Food Products) 144A | 100,815,700 | 79,405,072 | ||||||||||||||
Xiaomi Corporation Class B (Information Technology, Technology Hardware, Storage & Peripherals) 144A† | 28,977,100 | 82,411,874 | ||||||||||||||
Zhou Hei Ya International Holding Company Limited (Consumer Staples, Food Products) 144A« | 25,612,726 | 24,928,191 | ||||||||||||||
| 1,809,543,178 | ||||||||||||||||
|
| |||||||||||||||
| Colombia: 0.28% | ||||||||||||||||
Bancolombia SA ADR (Financials, Banks) | 499,100 | 12,722,059 | ||||||||||||||
|
| |||||||||||||||
| Hong Kong: 5.58% | ||||||||||||||||
AIA Group Limited (Financials, Insurance) | 8,677,500 | 82,585,272 | ||||||||||||||
China Mobile Limited (Communication Services, Wireless Telecommunication Services) | 16,350,865 | 100,010,711 | ||||||||||||||
CNOOC Limited (Energy, Oil, Gas & Consumable Fuels) | 32,659,600 | 29,882,087 | ||||||||||||||
Johnson Electric Holdings Limited (Industrials, Electrical Equipment) | 4,183,050 | 8,655,166 | ||||||||||||||
Sun Art Retail Group Limited (Consumer Staples, Food & Staples Retailing) | 33,523,400 | 36,320,650 | ||||||||||||||
| 257,453,886 | ||||||||||||||||
|
| |||||||||||||||
| India: 8.75% | ||||||||||||||||
AU Small Finance Bank Limited (Financials, Banks) 144A† | 451,041 | 4,719,297 | ||||||||||||||
Axis Bank Limited (Financials, Banks) † | 4,251,923 | 28,184,403 | ||||||||||||||
Bajaj Finance Limited (Financials, Consumer Finance) | 420,281 | 18,748,080 | ||||||||||||||
Bandhan Bank Limited (Financials, Banks) 144A† | 1,416,131 | 5,506,562 | ||||||||||||||
Bharti Airtel Limited (Communication Services, Wireless Telecommunication Services) | 3,969,052 | 23,207,171 | ||||||||||||||
Bharti Infratel Limited (Communication Services, Diversified Telecommunication Services) | 1,973,851 | 4,938,862 | ||||||||||||||
Dalmia Bharat Limited (Materials, Construction Materials) | 624,658 | 7,095,832 | ||||||||||||||
Fortis Healthcare Limited (Health Care, Health Care Providers & Services) † | 5,634,970 | 9,546,898 | ||||||||||||||
HDFC Bank Limited ADR (Financials, Banks) † | 428,752 | 24,627,515 | ||||||||||||||
Housing Development Finance Corporation Limited (Financials, Thrifts & Mortgage Finance) | 1,115,700 | 28,944,866 | ||||||||||||||
IndusInd Bank Limited (Financials, Banks) † | 102,217 | 804,847 | ||||||||||||||
ITC Limited (Consumer Staples, Tobacco) | 14,733,960 | 32,926,388 | ||||||||||||||
JM Financial Limited (Financials, Capital Markets) | 11,571,429 | 12,390,258 | ||||||||||||||
Kotak Mahindra Bank Limited (Financials, Banks) † | 1,117,262 | 23,315,620 | ||||||||||||||
Max Financial Services Limited (Financials, Insurance) † | 925,389 | 7,371,059 | ||||||||||||||
Oberoi Realty Limited (Real Estate, Real Estate Management & Development) † | 1,064,750 | 6,361,373 | ||||||||||||||
Reliance Industries Limited (Energy, Oil, Gas & Consumable Fuels) | 200,000 | 5,544,953 | ||||||||||||||
Reliance Industries Limited GDR (Energy, Oil, Gas & Consumable Fuels) 144A | 2,297,274 | 126,530,610 | ||||||||||||||
SBI Life Insurance Company Limited (Financials, Insurance) 144A† | 964,273 | 10,002,973 | ||||||||||||||
SH Kelkar & Company Limited (Materials, Chemicals) | 1,244,001 | 1,430,211 | ||||||||||||||
Spandana Sphoorty Financial (Financials, Consumer Finance) † | 440,254 | 3,200,871 | ||||||||||||||
Ultra Tech Cement Limited (Materials, Construction Materials) | 296,000 | 18,254,861 | ||||||||||||||
| 403,653,510 | ||||||||||||||||
|
| |||||||||||||||
| Indonesia: 1.31% | ||||||||||||||||
PT Astra International Tbk (Consumer Discretionary, Automobiles) | 21,151,000 | 7,723,770 | ||||||||||||||
PT Bank Central Asia Tbk (Financials, Banks) | 11,949,500 | 23,512,503 | ||||||||||||||
PT Blue Bird Tbk (Industrials, Road & Rail) † | 13,605,309 | 769,587 | ||||||||||||||
PT Link Net Tbk (Communication Services, Diversified Telecommunication Services) | 38,278,161 | 5,464,220 | ||||||||||||||
The accompanying notes are an integral part of these financial statements.
12 | Wells Fargo Emerging Markets Equity Fund
Table of Contents
Portfolio of investments—October 31, 2020
| Shares | Value | |||||||||||||||
| Indonesia (continued) | ||||||||||||||||
PT Telekomunikasi Indonesia Persero Tbk ADR (Communication Services, Diversified Telecommunication Services) | 1,337,471 | $ | 22,857,379 | |||||||||||||
| 60,327,459 | ||||||||||||||||
|
| |||||||||||||||
| Mexico: 5.21% | ||||||||||||||||
America Movil SAB de CV ADR (Communication Services, Wireless Telecommunication Services) | 2,846,818 | 33,934,071 | ||||||||||||||
Banco Santander Mexico ADR (Financials, Banks) | 3,029,336 | 11,087,370 | ||||||||||||||
Banco Santander Mexico SA (Financials, Banks) | 2,977,800 | 2,194,235 | ||||||||||||||
Becle SAB de CV ADR (Consumer Staples, Beverages) | 12,667,225 | 26,736,047 | ||||||||||||||
Cemex SAB de CV ADR (Materials, Construction Materials) | 4,311,948 | 17,894,584 | ||||||||||||||
Fibra Uno Administracion SAB de CV (Real Estate, Equity REITs) | 50,840,122 | 38,660,687 | ||||||||||||||
Fomento Economico Mexicano SAB de CV ADR (Consumer Staples, Beverages) | 1,451,182 | 78,030,056 | ||||||||||||||
Grupo Financiero Banorte SAB de CV (Financials, Banks) † | 3,650,488 | 16,280,610 | ||||||||||||||
Walmart de Mexico SAB de CV (Consumer Staples, Food & Staples Retailing) | 6,342,900 | 15,358,242 | ||||||||||||||
| 240,175,902 | ||||||||||||||||
|
| |||||||||||||||
| Peru: 0.21% | ||||||||||||||||
Compania de Minas Buenaventura SA ADR (Materials, Metals & Mining) | 796,695 | 9,775,448 | ||||||||||||||
|
| |||||||||||||||
| Philippines: 0.71% | ||||||||||||||||
Ayala Corporation (Industrials, Industrial Conglomerates) | 787,624 | 12,413,738 | ||||||||||||||
San Miguel Food & Beverage Incorporated (Consumer Staples, Food Products) | 3,495,810 | 4,612,039 | ||||||||||||||
SM Investments Corporation (Industrials, Industrial Conglomerates) | 812,873 | 15,941,319 | ||||||||||||||
| 32,967,096 | ||||||||||||||||
|
| |||||||||||||||
| Russia: 2.53% | ||||||||||||||||
Headhunter Group plc ADR (Industrials, Professional Services) | 350,160 | 8,032,670 | ||||||||||||||
LUKOIL PJSC ADR (Energy, Oil, Gas & Consumable Fuels) | 443,149 | 22,672,895 | ||||||||||||||
Magnit PJSC (Consumer Staples, Food & Staples Retailing) | 152,816 | 9,090,466 | ||||||||||||||
Sberbank PJSC ADR (Financials, Banks) | 1,740,395 | 17,580,468 | ||||||||||||||
Yandex NV Class A (Communication Services, Interactive Media & Services) † | 1,035,406 | 59,608,323 | ||||||||||||||
| 116,984,822 | ||||||||||||||||
|
| |||||||||||||||
| South Africa: 1.67% | ||||||||||||||||
AngloGold Ashanti Limited ADR (Materials, Metals & Mining) | 228,308 | 5,283,047 | ||||||||||||||
MTN Group Limited (Communication Services, Wireless Telecommunication Services) | 3,978,543 | 14,205,429 | ||||||||||||||
Shoprite Holdings Limited (Consumer Staples, Food & Staples Retailing) | 3,211,500 | 25,439,402 | ||||||||||||||
Standard Bank Group Limited (Financials, Banks) | 2,007,090 | 13,124,144 | ||||||||||||||
Tiger Brands Limited (Consumer Staples, Food Products) | 1,531,933 | 18,967,305 | ||||||||||||||
| 77,019,327 | ||||||||||||||||
|
| |||||||||||||||
| South Korea: 10.61% | ||||||||||||||||
KT Corporation ADR (Communication Services, Diversified Telecommunication Services) | 4,384,713 | 42,180,939 | ||||||||||||||
KT&G Corporation (Consumer Staples, Tobacco) | 307,091 | 21,927,568 | ||||||||||||||
Naver Corporation (Communication Services, Interactive Media & Services) | 432,500 | 110,664,157 | ||||||||||||||
Samsung Electronics Company Limited (Information Technology, Technology Hardware, Storage & Peripherals) | 4,737,800 | 238,148,400 | ||||||||||||||
Samsung Life Insurance Company Limited (Financials, Insurance) | 642,337 | 35,952,970 | ||||||||||||||
SK Hynix Incorporated (Information Technology, Semiconductors & Semiconductor Equipment) | 575,500 | 40,827,609 | ||||||||||||||
| 489,701,643 | ||||||||||||||||
|
| |||||||||||||||
| Taiwan: 10.73% | ||||||||||||||||
104 Corporation (Industrials, Professional Services) | 1,655,000 | 8,431,207 | ||||||||||||||
Mediatek Incorporated (Information Technology, Semiconductors & Semiconductor Equipment) |
| 3,924,881 | 93,295,443 | |||||||||||||
President Chain Store Corporation (Consumer Staples, Food & Staples Retailing) |
| 2,620,000 | 23,647,717 | |||||||||||||
The accompanying notes are an integral part of these financial statements.
Wells Fargo Emerging Markets Equity Fund | 13
Table of Contents
Portfolio of investments—October 31, 2020
| Shares | Value | |||||||||||||||
| Taiwan (continued) | ||||||||||||||||
Taiwan Semiconductor Manufacturing Company Limited (Information Technology, Semiconductors & Semiconductor Equipment) |
| 7,035,224 | $ | 106,440,642 | ||||||||||||
Taiwan Semiconductor Manufacturing Company Limited ADR (Information Technology, Semiconductors & Semiconductor Equipment) |
| 2,212,552 | 185,566,736 | |||||||||||||
Uni-President Enterprises Corporation (Consumer Staples, Food Products) |
| 36,162,368 | 77,516,262 | |||||||||||||
| 494,898,007 | ||||||||||||||||
|
| |||||||||||||||
| Thailand: 1.39% | ||||||||||||||||
PTT Exploration & Production plc (Energy, Oil, Gas & Consumable Fuels) |
| 1,933,139 | 4,884,405 | |||||||||||||
PTT plc (Energy, Oil, Gas & Consumable Fuels) | 16,859,000 | 16,641,068 | ||||||||||||||
Siam Commercial Bank plc (Financials, Banks) | 8,405,100 | 17,528,884 | ||||||||||||||
Thai Beverage plc (Consumer Staples, Beverages) | 58,927,000 | 25,059,732 | ||||||||||||||
| 64,114,089 | ||||||||||||||||
|
| |||||||||||||||
| Turkey: 0.06% | ||||||||||||||||
Avivasa Emeklilik Ve Hayat AS (Financials, Insurance) | 1,901,979 | 2,941,342 | ||||||||||||||
|
| |||||||||||||||
| United Kingdom: 0.13% | ||||||||||||||||
Standard Chartered plc (Financials, Banks) † | 1,364,444 | 6,235,241 | ||||||||||||||
|
| |||||||||||||||
Total Common Stocks (Cost $3,090,370,902) | 4,369,166,002 | |||||||||||||||
|
| |||||||||||||||
Interest rate | Maturity date | Principal | ||||||||||||||
| Convertible Debentures: 0.00% | ||||||||||||||||
| Brazil: 0.00% | ||||||||||||||||
Lupatech SA (Energy, Energy Equipment & Services) †(a) | 6.50 | % | 4-15-2021 | $ | 303,000 | 0 | ||||||||||
|
| |||||||||||||||
Total Convertible Debentures (Cost $160,691) | 0 | |||||||||||||||
|
| |||||||||||||||
| Dividend yield | Shares | |||||||||||||||
| Preferred Stocks: 1.09% | ||||||||||||||||
| Brazil: 1.09% | ||||||||||||||||
Lojas Americanas SA (Consumer Discretionary, Multiline Retail) | 0.92 | 12,422,918 | 50,293,987 | |||||||||||||
|
| |||||||||||||||
Total Preferred Stocks (Cost $52,911,183) | 50,293,987 | |||||||||||||||
|
| |||||||||||||||
| Yield | ||||||||||||||||
| Short-Term Investments: 4.77% | ||||||||||||||||
| Investment Companies: 4.77% | ||||||||||||||||
Securities Lending Cash Investments LLC (l)(r)(u) | 0.12 | 20,105,794 | 20,105,794 | |||||||||||||
Wells Fargo Government Money Market Fund Select Class (l)(u) | 0.03 | 199,808,582 | 199,808,582 | |||||||||||||
Total Short-Term Investments (Cost $219,914,376) | 219,914,376 | |||||||||||||||
|
| |||||||||||||||
| Total investments in securities (Cost $3,363,357,152) | 100.55 | % | 4,639,374,365 | |||||
Other assets and liabilities, net | (0.55 | ) | (25,368,523 | ) | ||||
|
|
|
| |||||
| Total net assets | 100.00 | % | $ | 4,614,005,842 | ||||
|
|
|
| |||||
The accompanying notes are an integral part of these financial statements.
14 | Wells Fargo Emerging Markets Equity Fund
Table of Contents
Portfolio of investments—October 31, 2020
| † | Non-income-earning security |
| 144A | The security may be resold in transactions exempt from registration, normally to qualified institutional buyers, pursuant to Rule 144A under the Securities Act of 1933. |
| « | All or a portion of this security is on loan. |
| (a) | The security is fair valued in accordance with procedures approved by the Board of Trustees. |
| (l) | The issuer of the security is an affiliated person of the Fund as defined in the Investment Company Act of 1940. |
| (r) | The investment is a non-registered investment company purchased with cash collateral received from securities on loan. |
| (u) | The rate represents the 7-day annualized yield at period end. |
Abbreviations:
| ADR | American depositary receipt |
| GDR | Global depositary receipt |
| REIT | Real estate investment trust |
Investments in Affiliates
An affiliated investment is an investment in which the Fund owns at least 5% of the outstanding voting shares of the issuer or as a result of other relationships, such as the Fund and the issuer having the same investment manager. Transactions with issuers that were either affiliated persons of the Fund at the beginning of the period or the end of the period were as follows:
| Value, beginning of period | Purchases | Sales proceeds | Net realized gains (losses) | Net change in unrealized gains (losses) | Value, end of period | % of net assets | Shares, end of period | Income from affiliated securities | ||||||||||||||||||||||||||||
| Short-Term Investments | ||||||||||||||||||||||||||||||||||||
Investment Companies | ||||||||||||||||||||||||||||||||||||
Securities Lending Cash Investments LLC | $ | 150,295,631 | $ | 373,665,692 | $ | (503,867,071 | ) | $ | 11,521 | $ | 21 | $ | 20,105,794 | 20,105,794 | $ | 801,541 | # | |||||||||||||||||||
Wells Fargo Government Money Market Fund Select Class | 158,178,165 | 943,427,555 | (901,797,138 | ) | 0 | 0 | 199,808,582 | 199,808,582 | 684,646 | |||||||||||||||||||||||||||
|
|
|
|
|
|
|
|
|
| |||||||||||||||||||||||||||
| $ | 11,521 | $ | 21 | $ | 219,914,376 | 4.77 | % | $ | 1,486,187 | |||||||||||||||||||||||||||
|
|
|
|
|
|
|
|
|
| |||||||||||||||||||||||||||
| # | Amount shown represents income before fees and rebates. |
The accompanying notes are an integral part of these financial statements.
Wells Fargo Emerging Markets Equity Fund | 15
Table of Contents
Statement of assets and liabilities—October 31, 2020
Assets | ||||
Investments in unaffiliated securities (including $18,172,762 of securities loaned), at value (cost $3,143,442,776) | $ | 4,419,459,989 | ||
Investments in affiliated securities, at value (cost $219,914,376) | 219,914,376 | |||
Foreign currency, at value (cost $3,215,837) | 2,171,896 | |||
Receivable for investments sold | 377,768 | |||
Receivable for Fund shares sold | 6,384,507 | |||
Receivable for dividends | 3,567,331 | |||
Receivable for securities lending income, net | 50,154 | |||
Prepaid expenses and other assets | 183,854 | |||
|
| |||
Total assets | 4,652,109,875 | |||
|
| |||
Liabilities | ||||
Payable upon receipt of securities loaned | 20,104,794 | |||
Payable for investments purchased | 5,542,289 | |||
Payable for Fund shares redeemed | 4,933,048 | |||
Management fee payable | 5,436,592 | |||
Administration fees payable | 518,916 | |||
Distribution fee payable | 13,550 | |||
Trustees’ fees and expenses payable | 2,808 | |||
Accrued expenses and other liabilities | 1,552,036 | |||
|
| |||
Total liabilities | 38,104,033 | |||
|
| |||
Total net assets | $ | 4,614,005,842 | ||
|
| |||
Net assets consist of | ||||
Paid-in capital | $ | 3,496,290,080 | ||
Total distributable earnings | 1,117,715,762 | |||
|
| |||
Total net assets | $ | 4,614,005,842 | ||
|
| |||
Computation of net asset value and offering price per share | ||||
Net assets – Class A | $ | 210,392,721 | ||
Shares outstanding – Class A1 | 7,681,614 | |||
Net asset value per share – Class A | $27.39 | |||
Maximum offering price per share – Class A2 | $29.06 | |||
Net assets – Class C | $ | 20,148,811 | ||
Shares outstanding – Class C1 | 881,566 | |||
Net asset value per share – Class C | $22.86 | |||
Net assets – Class R6 | $ | 324,636,757 | ||
Shares outstanding – Class R61 | 11,355,052 | |||
Net asset value per share – Class R6 | $28.59 | |||
Net assets – Administrator Class | $ | 73,887,950 | ||
Shares outstanding – Administrator Class1 | 2,547,369 | |||
Net asset value per share – Administrator Class | $29.01 | |||
Net assets – Institutional Class | $ | 3,984,939,603 | ||
Shares outstanding – Institutional Class1 | 139,461,108 | |||
Net asset value per share – Institutional Class | $28.57 | |||
| 1 | The Fund has an unlimited number of authorized shares. |
| 2 | Maximum offering price is computed as 100/94.25 of net asset value. On investments of $50,000 or more, the offering price is reduced. |
The accompanying notes are an integral part of these financial statements.
16 | Wells Fargo Emerging Markets Equity Fund
Table of Contents
Statement of operations—year ended October 31, 2020
Investment income | ||||
Dividends (net of foreign withholding taxes of $9,304,290) | $ | 67,742,293 | ||
Income from affiliated securities | 1,608,046 | |||
Interest (net of foreign withholding taxes of $59,492) | 184,682 | |||
|
| |||
Total investment income | 69,535,021 | |||
|
| |||
Expenses | ||||
Management fee | 42,540,573 | |||
Administration fees |
| |||
Class A | 444,594 | |||
Class C | 50,949 | |||
Class R6 | 91,921 | |||
Administrator Class | 106,659 | |||
Institutional Class | 4,631,479 | |||
Shareholder servicing fees |
| |||
Class A | 528,511 | |||
Class C | 60,509 | |||
Administrator Class | 202,417 | |||
Distribution fee |
| |||
Class C | 181,116 | |||
Custody and accounting fees | 1,799,139 | |||
Professional fees | 62,678 | |||
Registration fees | 124,236 | |||
Shareholder report expenses | 610,380 | |||
Trustees’ fees and expenses | 21,096 | |||
Interest expense | 495 | |||
Other fees and expenses | 108,640 | |||
|
| |||
Total expenses | 51,565,392 | |||
Less: Fee waivers and/or expense reimbursements |
| |||
Fund-level | (312,969 | ) | ||
Class A | (23,191 | ) | ||
Class C | (64 | ) | ||
Administrator Class | (18,721 | ) | ||
Institutional Class | (989,676 | ) | ||
|
| |||
Net expenses | 50,220,771 | |||
|
| |||
Net investment income | 19,314,250 | |||
|
| |||
Payment from affiliate | 814,760 | |||
|
| |||
Realized and unrealized gains (losses) on investments | ||||
Net realized gains (losses) on |
| |||
Unaffiliated securities | 28,602,766 | |||
Affiliated securities | 11,521 | |||
Forward foreign currency contracts | (112,585 | ) | ||
|
| |||
Net realized gains on investments | 28,501,702 | |||
|
| |||
Net change in unrealized gains (losses) on |
| |||
Unaffiliated securities | 343,880,903 | |||
Affiiliated securities | 21 | |||
|
| |||
Net change in unrealized gains (losses) on investments | 343,880,924 | |||
|
| |||
Net realized and unrealized gains (losses) on investments | 372,382,626 | |||
|
| |||
Net increase in net assets resulting from operations | $ | 392,511,636 | ||
|
| |||
The accompanying notes are an integral part of these financial statements.
Wells Fargo Emerging Markets Equity Fund | 17
Table of Contents
Statement of changes in net assets
| Year ended October 31, 2020 | Year ended October 31, 2019 | |||||||||||||||
Operations |
| |||||||||||||||
Net investment income | $ | 19,314,250 | $ | 29,835,911 | ||||||||||||
Payment from affiliate | 814,760 | 0 | ||||||||||||||
Net realized gains on investments | 28,501,702 | 58,804,224 | ||||||||||||||
Net change in unrealized gains (losses) on investments | 343,880,924 | 621,646,983 | ||||||||||||||
|
| |||||||||||||||
Net increase in net assets resulting from operations | 392,511,636 | 710,287,118 | ||||||||||||||
|
| |||||||||||||||
Distributions to shareholders from net investment income and net realized gains | ||||||||||||||||
Class A | (1,592,205 | ) | (710,399 | ) | ||||||||||||
Class R6 | (3,433,287 | ) | (2,908,247 | ) | ||||||||||||
Administrator Class | (690,072 | ) | (528,015 | ) | ||||||||||||
Institutional Class | (37,764,049 | ) | (24,412,544 | ) | ||||||||||||
|
| |||||||||||||||
Total distributions to shareholders | (43,479,613 | ) | (28,559,205 | ) | ||||||||||||
|
| |||||||||||||||
Capital share transactions | Shares | Shares | ||||||||||||||
Proceeds from shares sold |
| |||||||||||||||
Class A | 865,603 | 22,093,065 | 1,832,949 | 42,913,694 | ||||||||||||
Class C | 62,810 | 1,341,561 | 155,464 | 2,968,853 | ||||||||||||
Class R6 | 3,888,578 | 97,521,245 | 4,297,288 | 100,909,236 | ||||||||||||
Administrator Class | 466,599 | 12,164,727 | 582,444 | 14,129,059 | ||||||||||||
Institutional Class | 55,315,223 | 1,422,431,335 | 34,734,070 | 844,578,848 | ||||||||||||
|
| |||||||||||||||
| 1,555,551,933 | 1,005,499,690 | |||||||||||||||
|
| |||||||||||||||
Reinvestment of distributions |
| |||||||||||||||
Class A | 54,378 | 1,460,585 | 30,235 | 636,746 | ||||||||||||
Class R6 | 89,034 | 2,487,612 | 88,834 | 1,945,455 | ||||||||||||
Administrator Class | 23,753 | 668,417 | 23,214 | 511,866 | ||||||||||||
Institutional Class | 1,335,293 | 37,308,081 | 1,100,826 | 24,108,081 | ||||||||||||
|
| |||||||||||||||
| 41,924,695 | 27,202,148 | |||||||||||||||
|
| |||||||||||||||
Payment for shares redeemed |
| |||||||||||||||
Class A | (2,247,714 | ) | (55,922,187 | ) | (2,378,845 | ) | (55,211,980 | ) | ||||||||
Class C | (579,377 | ) | (12,172,959 | ) | (1,529,459 | ) | (30,114,110 | ) | ||||||||
Class R6 | (5,956,259 | ) | (150,951,408 | ) | (5,807,534 | ) | (144,080,345 | ) | ||||||||
Administrator Class | (1,900,708 | ) | (50,457,674 | ) | (1,325,414 | ) | (32,354,466 | ) | ||||||||
Institutional Class | (48,926,107 | ) | (1,252,304,510 | ) | (30,356,079 | ) | (733,923,145 | ) | ||||||||
|
| |||||||||||||||
| (1,521,808,738 | ) | (995,684,046 | ) | |||||||||||||
|
| |||||||||||||||
Net increase in net assets resulting from capital share transactions | 75,667,890 | 37,017,792 | ||||||||||||||
|
| |||||||||||||||
Total increase in net assets | 424,699,913 | 718,745,705 | ||||||||||||||
|
| |||||||||||||||
Net assets | ||||||||||||||||
Beginning of period | 4,189,305,929 | 3,470,560,224 | ||||||||||||||
|
| |||||||||||||||
End of period | $ | 4,614,005,842 | $ | 4,189,305,929 | ||||||||||||
|
| |||||||||||||||
The accompanying notes are an integral part of these financial statements.
18 | Wells Fargo Emerging Markets Equity Fund
Table of Contents
(For a share outstanding throughout each period)
| Year ended October 31 | ||||||||||||||||||||
| CLASS A | 2020 | 2019 | 2018 | 2017 | 2016 | |||||||||||||||
Net asset value, beginning of period | $25.29 | $21.16 | $24.83 | $20.49 | $18.09 | |||||||||||||||
Net investment income (loss) | 0.00 | 1 | 0.10 | 0.07 | (0.03 | )2 | 0.12 | |||||||||||||
Payment from affiliate | 0.00 | 1 | 0.00 | 0.00 | 0.00 | 0.00 | ||||||||||||||
Net realized and unrealized gains (losses) on investments | 2.28 | 4.11 | (3.70 | ) | 4.50 | 2.38 | ||||||||||||||
|
|
|
|
|
|
|
|
|
| |||||||||||
Total from investment operations | 2.28 | 4.21 | (3.63 | ) | 4.47 | 2.50 | ||||||||||||||
Distributions to shareholders from | ||||||||||||||||||||
Net investment income | (0.18 | ) | (0.08 | ) | (0.04 | ) | (0.13 | ) | (0.10 | ) | ||||||||||
Net asset value, end of period | $27.39 | $25.29 | $21.16 | $24.83 | $20.49 | |||||||||||||||
Total return3 | 9.03 | %4 | 19.95 | % | (14.65 | )% | 21.99 | % | 13.93 | % | ||||||||||
Ratios to average net assets (annualized) | ||||||||||||||||||||
Gross expenses | 1.54 | % | 1.57 | % | 1.58 | % | 1.58 | % | 1.64 | % | ||||||||||
Net expenses | 1.52 | % | 1.57 | % | 1.57 | % | 1.58 | % | 1.60 | % | ||||||||||
Net investment income (loss) | 0.13 | % | 0.43 | % | 0.38 | % | (0.13 | )% | 0.64 | % | ||||||||||
Supplemental data | ||||||||||||||||||||
Portfolio turnover rate | 12 | % | 8 | % | 11 | % | 13 | % | 8 | % | ||||||||||
Net assets, end of period (000s omitted) | $210,393 | $227,811 | $201,515 | $268,384 | $874,625 | |||||||||||||||
| 1 | Amount is less than $0.005. |
| 2 | Calculated based upon average shares outstanding |
| 3 | Total return calculations do not include any sales charges. |
| 4 | During the year ended October 31, 2020, the Fund received a payment from an affiliate that had an impact of less than 0.005% on total return. See Note 4 in the Notes to Financial Statements for additional information. |
The accompanying notes are an integral part of these financial statements.
Wells Fargo Emerging Markets Equity Fund | 19
Table of Contents
Financial highlights
(For a share outstanding throughout each period)
| Year ended October 31 | ||||||||||||||||||||
| CLASS C | 2020 | 2019 | 2018 | 2017 | 2016 | |||||||||||||||
Net asset value, beginning of period | $21.09 | $17.71 | $20.92 | $17.28 | $15.28 | |||||||||||||||
Net investment loss | (0.14 | )1 | (0.07 | )1 | (0.08 | )1 | (0.08 | ) | (0.02 | )1 | ||||||||||
Payment from affiliate | 0.04 | 0.00 | 0.00 | 0.00 | 0.00 | |||||||||||||||
Net realized and unrealized gains (losses) on investments | 1.87 | 3.45 | (3.13 | ) | 3.72 | 2.02 | ||||||||||||||
|
|
|
|
|
|
|
|
|
| |||||||||||
Total from investment operations | 1.77 | 3.38 | (3.21 | ) | 3.64 | 2.00 | ||||||||||||||
Net asset value, end of period | $22.86 | $21.09 | $17.71 | $20.92 | $17.28 | |||||||||||||||
Total return2 | 8.39 | %3 | 19.09 | % | (15.34 | )% | 21.06 | % | 13.09 | % | ||||||||||
Ratios to average net assets (annualized) | ||||||||||||||||||||
Gross expenses | 2.29 | % | 2.32 | % | 2.33 | % | 2.31 | % | 2.39 | % | ||||||||||
Net expenses | 2.28 | % | 2.32 | % | 2.32 | % | 2.31 | % | 2.35 | % | ||||||||||
Net investment loss | (0.64 | )% | (0.37 | )% | (0.38 | )% | (0.43 | )% | (0.12 | )% | ||||||||||
Supplemental data | ||||||||||||||||||||
Portfolio turnover rate | 12 | % | 8 | % | 11 | % | 13 | % | 8 | % | ||||||||||
Net assets, end of period (000s omitted) | $20,149 | $29,484 | $49,103 | $69,845 | $71,900 | |||||||||||||||
| 1 | Calculated based upon average shares outstanding |
| 2 | Total return calculations do not include any sales charges. |
| 3 | During the year ended October 31, 2020, the Fund received a payment from an affiliate which had a 0.18% impact on the total return. See Note 4 in the Notes to Financial Statements for additional information. |
The accompanying notes are an integral part of these financial statements.
20 | Wells Fargo Emerging Markets Equity Fund
Table of Contents
Financial highlights
(For a share outstanding throughout each period)
| Year ended October 31 | ||||||||||||||||||||
| CLASS R6 | 2020 | 2019 | 2018 | 2017 | 2016 | |||||||||||||||
Net asset value, beginning of period | $26.39 | $22.10 | $26.00 | $21.46 | $19.00 | |||||||||||||||
Net investment income | 0.17 | 0.22 | 1 | 0.23 | 1 | 0.17 | 1 | 0.23 | 1 | |||||||||||
Net realized and unrealized gains (losses) on investments | 2.33 | 4.27 | (3.92 | ) | 4.59 | 2.46 | ||||||||||||||
|
|
|
|
|
|
|
|
|
| |||||||||||
Total from investment operations | 2.50 | 4.49 | (3.69 | ) | 4.76 | 2.69 | ||||||||||||||
Distributions to shareholders from | ||||||||||||||||||||
Net investment income | (0.30 | ) | (0.20 | ) | (0.21 | ) | (0.22 | ) | (0.23 | ) | ||||||||||
Net asset value, end of period | $28.59 | $26.39 | $22.10 | $26.00 | $21.46 | |||||||||||||||
Total return | 9.49 | % | 20.50 | % | (14.33 | )% | 22.53 | % | 14.43 | % | ||||||||||
Ratios to average net assets (annualized) | ||||||||||||||||||||
Gross expenses | 1.11 | % | 1.14 | % | 1.16 | % | 1.14 | % | 1.20 | % | ||||||||||
Net expenses | 1.11 | % | 1.14 | % | 1.15 | % | 1.14 | % | 1.17 | % | ||||||||||
Net investment income | 0.55 | % | 0.88 | % | 0.90 | % | 0.76 | % | 1.16 | % | ||||||||||
Supplemental data | ||||||||||||||||||||
Portfolio turnover rate | 12 | % | 8 | % | 11 | % | 13 | % | 8 | % | ||||||||||
Net assets, end of period (000s omitted) | $324,637 | $351,829 | $326,131 | $192,929 | $191,250 | |||||||||||||||
| 1 | Calculated based upon average shares outstanding |
The accompanying notes are an integral part of these financial statements.
Wells Fargo Emerging Markets Equity Fund | 21
Table of Contents
Financial highlights
(For a share outstanding throughout each period)
| Year ended October 31 | ||||||||||||||||||||
| ADMINISTRATOR CLASS | 2020 | 2019 | 2018 | 2017 | 2016 | |||||||||||||||
Net asset value, beginning of period | $26.50 | $22.18 | $26.08 | $21.53 | $18.99 | |||||||||||||||
Net investment income | 0.05 | 1 | 0.13 | 1 | 0.12 | 1 | 0.10 | 1 | 0.15 | 1 | ||||||||||
Payment from affiliate | 0.31 | 0.00 | 0.00 | 0.00 | 0.00 | |||||||||||||||
Net realized and unrealized gains (losses) on investments | 2.35 | 4.30 | (3.90 | ) | 4.61 | 2.50 | ||||||||||||||
|
|
|
|
|
|
|
|
|
| |||||||||||
Total from investment operations | 2.71 | 4.43 | (3.78 | ) | 4.71 | 2.65 | ||||||||||||||
Distributions to shareholders from | ||||||||||||||||||||
Net investment income | (0.20 | ) | (0.11 | ) | (0.12 | ) | (0.16 | ) | (0.11 | ) | ||||||||||
Net asset value, end of period | $29.01 | $26.50 | $22.18 | $26.08 | $21.53 | |||||||||||||||
Total return | 10.25 | %2 | 20.09 | % | (14.57 | )% | 22.10 | % | 14.07 | % | ||||||||||
Ratios to average net assets (annualized) | ||||||||||||||||||||
Gross expenses | 1.46 | % | 1.49 | % | 1.50 | % | 1.48 | % | 1.56 | % | ||||||||||
Net expenses | 1.43 | % | 1.46 | % | 1.46 | % | 1.46 | % | 1.49 | % | ||||||||||
Net investment income | 0.20 | % | 0.54 | % | 0.48 | % | 0.42 | % | 0.76 | % | ||||||||||
Supplemental data | ||||||||||||||||||||
Portfolio turnover rate | 12 | % | 8 | % | 11 | % | 13 | % | 8 | % | ||||||||||
Net assets, end of period (000s omitted) | $73,888 | $104,869 | $103,740 | $144,421 | $160,657 | |||||||||||||||
| 1 | Calculated based upon average shares outstanding |
| 2 | During the year ended October 31, 2020, the Fund received a payment from an affiliate which had a 1.16% impact on the total return. See Note 4 in the Notes to Financial Statements for additional information. |
The accompanying notes are an integral part of these financial statements.
22 | Wells Fargo Emerging Markets Equity Fund
Table of Contents
Financial highlights
(For a share outstanding throughout each period)
| Year ended October 31 | ||||||||||||||||||||
| INSTITUTIONAL CLASS | 2020 | 2019 | 2018 | 2017 | 2016 | |||||||||||||||
Net asset value, beginning of period | $26.38 | $22.10 | $25.99 | $21.46 | $18.99 | |||||||||||||||
Net investment income | 0.14 | 0.19 | 0.19 | 0.19 | 1 | 0.20 | 1 | |||||||||||||
Net realized and unrealized gains (losses) on investments | 2.34 | 4.28 | (3.89 | ) | 4.55 | 2.49 | ||||||||||||||
|
|
|
|
|
|
|
|
|
| |||||||||||
Total from investment operations | 2.48 | 4.47 | (3.70 | ) | 4.74 | 2.69 | ||||||||||||||
Distributions to shareholders from | ||||||||||||||||||||
Net investment income | (0.29 | ) | (0.19 | ) | (0.19 | ) | (0.21 | ) | (0.22 | ) | ||||||||||
Net asset value, end of period | $28.57 | $26.38 | $22.10 | $25.99 | $21.46 | |||||||||||||||
Total return | 9.42 | % | 20.40 | % | (14.35 | )% | 22.42 | % | 14.40 | % | ||||||||||
Ratios to average net assets (annualized) | ||||||||||||||||||||
Gross expenses | 1.21 | % | 1.25 | % | 1.25 | % | 1.23 | % | 1.31 | % | ||||||||||
Net expenses | 1.18 | % | 1.19 | % | 1.19 | % | 1.20 | % | 1.22 | % | ||||||||||
Net investment income | 0.49 | % | 0.81 | % | 0.75 | % | 0.82 | % | 1.04 | % | ||||||||||
Supplemental data | ||||||||||||||||||||
Portfolio turnover rate | 12 | % | 8 | % | 11 | % | 13 | % | 8 | % | ||||||||||
Net assets, end of period (000s omitted) | $3,984,940 | $3,475,314 | $2,790,071 | $3,423,366 | $1,826,097 | |||||||||||||||
| 1 | Calculated based upon average shares outstanding |
The accompanying notes are an integral part of these financial statements.
Wells Fargo Emerging Markets Equity Fund | 23
Table of Contents
1. ORGANIZATION
Wells Fargo Funds Trust (the “Trust”), a Delaware statutory trust organized on March 10, 1999, is an open-end management investment company registered under the Investment Company Act of 1940, as amended (the “1940 Act”). As an investment company, the Trust follows the accounting and reporting guidance in Financial Accounting Standards Board (“FASB”) Accounting Standards Codification Topic 946, Financial Services – Investment Companies. These financial statements report on the Wells Fargo Emerging Markets Equity Fund (the “Fund”) which is a diversified series of the Trust.
2. SIGNIFICANT ACCOUNTING POLICIES
The following significant accounting policies, which are consistently followed in the preparation of the financial statements of the Fund, are in conformity with U.S. generally accepted accounting principles which require management to make estimates and assumptions that affect the reported amounts of assets and liabilities, disclosure of contingent assets and liabilities at the date of the financial statements, and the reported amounts of revenues and expenses during the reporting period. Actual results could differ from those estimates.
Securities valuation
All investments are valued each business day as of the close of regular trading on the New York Stock Exchange (generally 4 p.m. Eastern Time), although the Fund may deviate from this calculation time under unusual or unexpected circumstances.
Equity securities that are listed on a foreign or domestic exchange or market are valued at the official closing price or, if none, the last sales price. If no sale occurs on the principal exchange or market that day, a fair value price will be determined in accordance with the Fund’s Valuation Procedures.
Forward foreign currency contracts are recorded at the forward rate provided by an independent foreign currency pricing source at a time each business day specified by the Wells Fargo Asset Management Pricing Committee at Wells Fargo Funds Management, LLC (“Funds Management”).
The values of securities denominated in foreign currencies are translated into U.S. dollars at rates provided by an independent foreign currency pricing source at a time each business day specified by the Wells Fargo Asset Management Pricing Committee.
Many securities markets and exchanges outside the U.S. close prior to the close of the New York Stock Exchange and therefore may not fully reflect trading or events that occur after the close of the principal exchange in which the foreign securities are traded, but before the close of the New York Stock Exchange. If such trading or events are expected to materially affect the value of such securities, then fair value pricing procedures approved by the Board of Trustees of the Fund are applied. These procedures take into account multiple factors including movements in U.S. securities markets after foreign exchanges close. Foreign securities that are fair valued under these procedures are categorized as Level 2 and the application of these procedures may result in transfers between Level 1 and Level 2. Depending on market activity, such fair valuations may be frequent. Such fair value pricing may result in net asset values that are higher or lower than net asset values based on the last reported sales price or latest quoted bid price. On October 31, 2020, such fair value pricing was used in pricing certain foreign securities.
Debt securities are valued at the evaluated bid price provided by an independent pricing service (e.g. taking into account various factors, including yields, maturities, or credit ratings) or, if a reliable price is not available, the quoted bid price from an independent broker-dealer.
Investments in registered open-end investment companies are valued at net asset value. Interests in non-registered investment companies that are redeemable at net asset value are fair valued normally at net asset value.
Investments which are not valued using any of the methods discussed above are valued at their fair value, as determined in good faith by the Board of Trustees. The Board of Trustees has established a Valuation Committee comprised of the Trustees and has delegated to it the authority to take any actions regarding the valuation of portfolio securities that the Valuation Committee deems necessary or appropriate, including determining the fair value of portfolio securities, unless the determination has been delegated to the Wells Fargo Asset Management Pricing Committee. The Board of Trustees retains the authority to make or ratify any valuation decisions or approve any changes to the Valuation Procedures as it deems appropriate. On a quarterly basis, the Board of Trustees receives reports on any valuation actions taken by the Valuation Committee or the Wells Fargo Asset Management Pricing Committee which may include items for ratification.
Foreign currency translation
The accounting records of the Fund are maintained in U.S. dollars. The values of other assets and liabilities denominated in foreign currencies are translated into U.S. dollars at rates provided by an independent foreign currency pricing source at a time each business day specified by the Wells Fargo Asset Management Pricing Committee. Purchases and sales of securities, and
24 | Wells Fargo Emerging Markets Equity Fund
Table of Contents
Notes to financial statements
income and expenses are converted at the rate of exchange on the respective dates of such transactions. Net realized foreign exchange gains or losses arise from sales of foreign currencies, currency gains or losses realized between the trade and settlement dates on securities transactions, and the difference between the amounts of dividends, interest and foreign withholding taxes recorded and the U.S. dollar equivalent of the amounts actually paid or received. Net unrealized foreign exchange gains and losses arise from changes in the fair value of assets and liabilities other than investments in securities resulting from changes in exchange rates. The changes in net assets arising from changes in exchange rates of securities and the changes in net assets resulting from changes in market prices of securities are not separately presented. Such changes are included in net realized and unrealized gains or losses from investments.
Forward foreign currency contracts
A forward foreign currency contract is an agreement between two parties to purchase or sell a specific currency for an agreed-upon price at a future date. The Fund enters into forward foreign currency contracts to facilitate transactions in foreign-denominated securities and to attempt to minimize the risk to the Fund from adverse changes in the relationship between currencies. Forward foreign currency contracts are recorded at the forward rate and marked-to-market daily. When the contracts are closed, realized gains and losses arising from such transactions are recorded as realized gains or losses on forward foreign currency contracts. The Fund is subject to foreign currency risk and may be exposed to risks if the counterparties to the contracts are unable to meet the terms of their contracts or if the value of the foreign currency changes unfavorably. The Fund’s maximum risk of loss from counterparty credit risk is the unrealized gains on the contracts. This risk may be mitigated if there is a master netting arrangement between the Fund and the counterparty.
Securities lending
The Fund may lend its securities from time to time in order to earn additional income in the form of fees or interest on securities received as collateral or the investment of any cash received as collateral. When securities are on loan, the Fund receives interest or dividends on those securities. Cash collateral received in connection with its securities lending transactions is invested in Securities Lending Cash Investments, LLC (the “Securities Lending Fund”). Investments in Securities Lending Fund are valued at the evaluated bid price provided by an independent pricing service. Income earned from investment in the Securities Lending Fund (net of fees and rebates), if any, is included in income from affiliated securities on the Statement of Operations.
In a securities lending transaction, the net asset value of the Fund is affected by an increase or decrease in the value of the securities loaned and by an increase or decrease in the value of the instrument in which collateral is invested. The amount of securities lending activity undertaken by the Fund fluctuates from time to time. The Fund has the right under the lending agreement to recover the securities from the borrower on demand. In the event of default or bankruptcy by the borrower, the Fund may be prevented from recovering the loaned securities or gaining access to the collateral or may experience delays or costs in doing so. In such an event, the terms of the agreement allow the unaffiliated securities lending agent to use the collateral to purchase replacement securities on behalf of the Fund or pay the Fund the market value of the loaned securities. The Fund bears the risk of loss with respect to depreciation of its investment of the cash collateral.
Security transactions and income recognition
Securities transactions are recorded on a trade date basis. Realized gains or losses are recorded on the basis of identified cost.
Dividend income is recognized on the ex-dividend date, except for certain dividends from foreign securities, which are recorded as soon as the custodian verifies the ex-dividend date.
Interest income is accrued daily and bond discounts are accreted and premiums are amortized daily. To the extent debt obligations are placed on non-accrual status, any related interest income may be reduced by writing off interest receivables when the collection of all or a portion of interest has been determined to be doubtful based on consistently applied procedures and the fair value has decreased. If the issuer subsequently resumes interest payments or when the collectability of interest is reasonably assured, the debt obligation is removed from non-accrual status.
Income from foreign securities is recorded net of foreign taxes withheld where recovery of such taxes is not assured.
Distributions to shareholders
Distributions to shareholders from net investment income and any net realized gains are recorded on the ex-dividend date and paid at least annually. Such distributions are determined in accordance with income tax regulations and may differ from U.S. generally accepted accounting principles. Dividend sources are estimated at the time of declaration. The tax character of distributions is determined as of the Fund’s fiscal year end. Therefore, a portion of the Fund’s distributions made prior to the Fund’s fiscal year end may be categorized as a tax return of capital at year end.
Wells Fargo Emerging Markets Equity Fund | 25
Table of Contents
Notes to financial statements
Federal and other taxes
The Fund intends to continue to qualify as a regulated investment company by distributing substantially all of its investment company taxable income and any net realized capital gains (after reduction for capital loss carryforwards) sufficient to relieve it from all, or substantially all, federal income taxes. Accordingly, no provision for federal income taxes was required.
The Fund’s income and federal excise tax returns and all financial records supporting those returns for the prior three fiscal years are subject to examination by the federal and Delaware revenue authorities. Management has analyzed the Fund’s tax positions taken on federal, state, and foreign tax returns for all open tax years and does not believe that there are any uncertain tax positions that require recognition of a tax liability.
As of October 31, 2020, the aggregate cost of all investments for federal income tax purposes was $3,403,110,565 and the unrealized gains (losses) consisted of:
Gross unrealized gains | $ | 1,881,693,039 | ||
Gross unrealized losses | (645,429,239 | ) | ||
Net unrealized gains | $ | 1,236,263,800 | ||
Reclassifications are made to the Fund’s capital accounts for permanent tax differences to reflect income and gains available for distribution (or available capital loss carryforwards) under federal income tax regulations. U.S. generally accepted accounting principles require that certain components of net assets be adjusted to reflect permanent differences between financial and tax reporting. These reclassifications have no effect on net assets or net asset values per share. The primary permanent difference causing such reclassification is due to redemptions in-kind. At October 31, 2020, as a result of permanent book-to-tax differences, the following reclassification adjustments were made on the Statement of Assets and Liabilities:
| Paid-in capital | Total distributable earnings | |
| $4,696,101 | $(4,696,101) | |
As of October 31, 2020, the Fund had capital loss carryforwards which consist of $136,193,719 in long-term capital losses.
Class allocations
The separate classes of shares offered by the Fund differ principally in applicable sales charges, distribution, shareholder servicing, and administration fees. Class specific expenses are charged directly to that share class. Investment income, common fund-level expenses, and realized and unrealized gains (losses) on investments are allocated daily to each class of shares based on the relative proportion of net assets of each class.
3. FAIR VALUATION MEASUREMENTS
Fair value measurements of investments are determined within a framework that has established a fair value hierarchy based upon the various data inputs utilized in determining the value of the Fund’s investments. The three-level hierarchy gives the highest priority to unadjusted quoted prices in active markets for identical assets or liabilities (Level 1) and the lowest priority to unobservable inputs (Level 3). The Fund’s investments are classified within the fair value hierarchy based on the lowest level of input that is significant to the fair value measurement. The inputs are summarized into three broad levels as follows:
| ∎ | Level 1 – quoted prices in active markets for identical securities |
| ∎ | Level 2 – other significant observable inputs (including quoted prices for similar securities, interest rates, prepayment speeds, credit risk, etc.) |
| ∎ | Level 3 – significant unobservable inputs (including the Fund’s own assumptions in determining the fair value of investments) |
The inputs or methodologies used for valuing investments in securities are not necessarily an indication of the risk associated with investing in those securities.
26 | Wells Fargo Emerging Markets Equity Fund
Table of Contents
Notes to financial statements
The following is a summary of the inputs used in valuing the Fund’s assets and liabilities as of October 31, 2020:
Quoted prices (Level 1) | Other significant observable inputs (Level 2) | Significant unobservable inputs (Level 3) | Total | |||||||||||||
Assets | ||||||||||||||||
Investments in: | ||||||||||||||||
Common stocks | ||||||||||||||||
Argentina | $ | 12,888,355 | $ | 0 | $ | 0 | $ | 12,888,355 | ||||||||
Brazil | 234,179,487 | 0 | 0 | 234,179,487 | ||||||||||||
Chile | 15,691,229 | 27,893,922 | 0 | 43,585,151 | ||||||||||||
China | 795,017,666 | 1,014,525,512 | 0 | 1,809,543,178 | ||||||||||||
Colombia | 12,722,059 | 0 | 0 | 12,722,059 | ||||||||||||
Hong Kong | 0 | 257,453,886 | 0 | 257,453,886 | ||||||||||||
India | 24,627,515 | 379,025,995 | 0 | 403,653,510 | ||||||||||||
Indonesia | 22,857,379 | 37,470,080 | 0 | 60,327,459 | ||||||||||||
Mexico | 240,175,902 | 0 | 0 | 240,175,902 | ||||||||||||
Peru | 9,775,448 | 0 | 0 | 9,775,448 | ||||||||||||
Philippines | 0 | 32,967,096 | 0 | 32,967,096 | ||||||||||||
Russia | 67,640,993 | 49,343,829 | 0 | 116,984,822 | ||||||||||||
South Africa | 49,689,754 | 27,329,573 | 0 | 77,019,327 | ||||||||||||
South Korea | 42,180,939 | 447,520,704 | 0 | 489,701,643 | ||||||||||||
Taiwan | 185,566,736 | 309,331,271 | 0 | 494,898,007 | ||||||||||||
Thailand | 22,413,289 | 41,700,800 | 0 | 64,114,089 | ||||||||||||
Turkey | 0 | 2,941,342 | 0 | 2,941,342 | ||||||||||||
United Kingdom | 0 | 6,235,241 | 0 | 6,235,241 | ||||||||||||
Convertible debentures | 0 | 0 | 0 | 0 | ||||||||||||
Preferred stocks | ||||||||||||||||
Brazil | 50,293,987 | 0 | 0 | 50,293,987 | ||||||||||||
Short-term investments | ||||||||||||||||
Investment companies | 219,914,376 | 0 | 0 | 219,914,376 | ||||||||||||
Total assets | $ | 2,005,635,114 | $ | 2,633,739,251 | $ | 0 | $ | 4,639,374,365 | ||||||||
Additional sector, industry or geographic detail is included in the Portfolio of Investments.
For the year ended October 31, 2020, the Fund did not have any transfers into/out of Level 3.
4. TRANSACTIONS WITH AFFILIATES
Management fee
Funds Management, an indirect wholly owned subsidiary of Wells Fargo & Company (“Wells Fargo”), is the manager of the Fund and provides advisory and fund-level administrative services under an investment management agreement. Under the investment management agreement, Funds Management is responsible for, among other services, implementing the investment objectives and strategies of the Fund, supervising the subadviser and providing fund-level administrative services in connection with the Fund’s operations. As compensation for its services under the investment management agreement, Funds Management is entitled to receive a management fee at the following annual rate based on the Fund’s average daily net assets:
| Average daily net assets | Management fee | |||
First $1 billion | 1.050 | % | ||
Next $1 billion | 1.025 | |||
Next $2 billion | 1.000 | |||
Next $1 billion | 0.975 | |||
Next $3 billion | 0.965 | |||
Next $2 billion | 0.955 | |||
Over $10 billion | 0.945 | |||
Wells Fargo Emerging Markets Equity Fund | 27
Table of Contents
Notes to financial statements
For the year ended October 31, 2020, the management fee was equivalent to an annual rate of 1.02% of the Fund’s average daily net assets.
Funds Management has retained the services of a subadviser to provide daily portfolio management to the Fund. The fee for subadvisory services is borne by Funds Management. Wells Capital Management Incorporated (“WellsCap”), an affiliate of Funds Management and an indirect wholly owned subsidiary of Wells Fargo, is the subadviser to the Fund and is entitled to receive a fee from Funds Management at an annual rate starting at 0.65% and declining to 0.45% as the average daily net assets of the Fund increase.
Administration fees
Under a class-level administration agreement, Funds Management provides class-level administrative services to the Fund, which includes paying fees and expenses for services provided by the transfer agent, sub-transfer agents, omnibus account servicers and record-keepers. As compensation for its services under the class-level administration agreement, Funds Management receives an annual fee which is calculated based on the average daily net assets of each class as follows:
Class-level administration fee | ||||
Class A, Class C | 0.21 | % | ||
Class R6 | 0.03 | |||
Administrator Class, Institutional Class | 0.13 | |||
Waivers and/or expense reimbursements
Funds Management has contractually waived and/or reimbursed management and administration fees to the extent necessary to maintain certain net operating expense ratios for the Fund. When each class of the Fund has exceeded its expense cap, Funds Management has waived fees and/or reimbursed expenses from fund-level expenses on a proportionate basis and then from class specific expenses. When only certain classes exceed their expense caps, waivers and/or reimbursements are applied against class specific expenses before fund-level expenses. Funds Management has committed through February 28, 2021 to waive fees and/or reimburse expenses to the extent necessary to cap the Fund’s expenses at 1.55% for Class A shares, 2.30% for Class C shares, 1.13% for Class R6 shares, 1.42% for Administrator Class shares, and 1.17% for Institutional Class shares. Prior to or after the commitment expiration date, the cap may be increased or the commitment to maintain the cap may be terminated only with the approval of the Board of Trustees. Prior to March 1, 2020, the Fund’s expenses were capped at 1.58% for Class A shares, 2.33% for Class C shares, 1.15% for Class R6 shares, 1.46% for Administrator Class shares, and 1.19% for Institutional Class shares.
Distribution fee
The Trust has adopted a distribution plan for Class C shares of the Fund pursuant to Rule 12b-1 under the 1940 Act. A distribution fees is charged to Class C shares and paid to Wells Fargo Funds Distributor, LLC (“Funds Distributor”), the principal underwriter, at an annual rate of 0.75% of the average daily net assets of Class C shares.
In addition, Funds Distributor is entitled to receive the front-end sales charge from the purchase of Class A shares and a contingent deferred sales charge on the redemption of certain Class A shares. Funds Distributor is also entitled to receive the contingent deferred sales charges from redemptions of Class C shares. For the year ended October 31, 2020, Funds Distributor received $6,371 from the sale of Class A shares. No contingent deferred sales charges were incurred by Class A and Class C shares for the year ended October 31, 2020.
Other transactions
On August 14, 2020 Class A, Class C, and Administrator Class of the Fund were reimbursed by Funds Management in the amount of $2,438, $778,933 and $33,389, respectively. The reimbursements were made in connection with resolving certain fee reimbursements.
Shareholder servicing fees
The Trust has entered into contracts with one or more shareholder servicing agents, whereby Class A, Class C, and Administrator Class of the Fund are charged a fee at an annual rate of 0.25% of the average daily net assets of each respective class. A portion of these total shareholder servicing fees were paid to affiliates of Wells Fargo.
28 | Wells Fargo Emerging Markets Equity Fund
Table of Contents
Notes to financial statements
Interfund transactions
The Fund may purchase or sell portfolio investment securities to certain other Wells Fargo affiliates pursuant to Rule 17a-7 under the 1940 Act and under procedures adopted by the Board of Trustees. The procedures have been designed to ensure that these interfund transactions, which do not incur broker commissions, are effected at current market prices.
5. INVESTMENT PORTFOLIO TRANSACTIONS
Purchases and sales of investments, excluding U.S. government obligations (if any) and short-term securities, for the year ended October 31, 2020 were $489,590,841 and $467,472,356, respectively.
6. SECURITIES LENDING TRANSACTIONS
The Fund lends its securities through an unaffiliated securities lending agent and receives collateral in the form of cash or securities with a value at least equal to the value of the securities on loan. The value of the loaned securities is determined at the close of each business day and any increases or decreases in the required collateral are exchanged between the Fund and the counterparty on the next business day. Cash collateral received is invested in the Securities Lending Fund which seeks to provide a positive return compared to the daily Federal Funds Open Rate by investing in high-quality, U.S. dollar-denominated short-term money market instruments and is exempt from registration under Section 3(c)(7) of the 1940 Act. Securities Lending Fund is managed by Funds Management and is subadvised by WellsCap. Funds Management receives an advisory fee starting at 0.05% and declining to 0.01% as the average daily net assets of the Securities Lending Fund increase. All of the fees received by Funds Management are paid to WellsCap for its services as subadviser.
In the event of counterparty default or the failure of a borrower to return a loaned security, the Fund has the right to use the collateral to offset any losses incurred. As of October 31, 2020, the Fund had securities lending transactions with the following counterparties which are subject to offset:
| Counterparty | Value of securities on loan | Collateral received1 | Net amount | |||||||||
Barclays Capital Inc. | $ | 4,671,377 | $ | (4,671,377 | ) | $ | 0 | |||||
Citigroup Global Markets Inc. | 8,083,637 | (8,083,637 | ) | 0 | ||||||||
Credit Suisse Securities LLC | 2,523,271 | (2,523,271 | ) | 0 | ||||||||
JPMorgan Securities LLC | 154,200 | (154,200 | ) | 0 | ||||||||
Morgan Stanley & Co. LLC | 46,944 | (46,944 | ) | 0 | ||||||||
SG Americas Securities, LLC | 111,650 | (111,650 | ) | 0 | ||||||||
UBS Securities LLC | 2,581,683 | (2,581,683 | ) | 0 | ||||||||
| 1 | Collateral received within this table is limited to the collateral for the net transaction with the counterparty. |
7. DERIVATIVE TRANSACTIONS
During the year ended October 31, 2020, the Fund entered into forward foreign currency contracts for hedging purposes. The Fund had average contract amounts of $97,098 and $7,579 in forward foreign currency contracts to buy and forward foreign currency contracts to sell, respectively, during the year ended October 31, 2020.
The fair value, realized gains or losses and change in unrealized gains or losses, if any, on derivative instruments are reflected in the corresponding financial statement captions.
8. BANK BORROWINGS
The Trust (excluding the money market funds), Wells Fargo Master Trust and Wells Fargo Variable Trust are parties to a $350,000,000 revolving credit agreement whereby the Fund is permitted to use bank borrowings for temporary or emergency purposes, such as to fund shareholder redemption requests. Interest under the credit agreement is charged to the Fund based on a borrowing rate equal to the higher of the Federal Funds rate in effect on that day plus 1.25% or the overnight LIBOR rate in effect on that day plus 1.25%. In addition, an annual commitment fee equal to 0.25% of the unused balance is allocated to each participating fund.
During the year ended October 31, 2020, the Fund had average borrowings outstanding of $34,859 at an average rate of 1.42% and paid interest in the amount of $495.
Wells Fargo Emerging Markets Equity Fund | 29
Table of Contents
Notes to financial statements
9. DISTRIBUTIONS TO SHAREHOLDERS
The tax character of distributions paid was $43,479,613 and $28,559,205 of ordinary income for the years ended October 31, 2020 and October 31, 2019, respectively.
As of October 31, 2020, the components of distributable earnings on a tax basis were as follows:
Undistributed ordinary income | Unrealized gains | Capital loss carryforward | ||
| $18,680,842 | $1,235,235,576 | $(136,193,719) | ||
10. CONCENTRATION RISK
Concentration risks may result from significant investments in one or more country or geographic region. As of the end of the period, the Fund concentrated its portfolio in investments in China. A fund that invests a substantial portion of its assets in any country or geographic region will be more vulnerable than a fund that invests its assets more broadly to the economic, financial, political or other developments affecting that country or region. Such developments may have a significant impact on the Fund’s investment performance causing such performance to be more volatile than the investment performance of a more geographically diversified fund.
11. INDEMNIFICATION
Under the Fund’s organizational documents, the officers and Trustees have been granted certain indemnification rights against certain liabilities that may arise out of performance of their duties to the Fund. The Fund has entered into a separate agreement with each Trustee that converts indemnification rights currently existing under the Fund’s organizational documents into contractual rights that cannot be changed in the future without the consent of the Trustee. Additionally, in the normal course of business, the Fund may enter into contracts with service providers that contain a variety of indemnification clauses. The Fund’s maximum exposure under these arrangements is dependent on future claims that may be made against the Fund and, therefore, cannot be estimated.
12. REDEMPTION IN-KIND
After the close of business on November 15, 2019, the Fund redeemed assets through an in-kind redemption. In the redemption transaction, the Fund distributed securities with a value of $19,129,463 and cash in the amount of $11,864,082. The Fund recognized gains in the amount of $4,713,737 which is reflected on the Statement of Operations. The redemption in-kind by a shareholder of the Class R6 represented 0.74% of the Fund and is reflected on the Statement of Changes in Net Assets.
13. NEW ACCOUNTING PRONOUNCEMENT
In August 2018, FASB issued Accounting Standards Update (“ASU”) No. 2018-13, Fair Value Measurement (Topic 820) Disclosure Framework—Changes to the Disclosure Requirements for Fair Value Measurement. ASU 2018-13 updates the disclosure requirements on fair value measurements in Topic 820, Fair Value Measurements. The amendments are effective for fiscal years, and interim periods within those fiscal years, beginning after December 15, 2019. Management has adopted this guidance which did not have a material impact on the financial statements.
14. CORONAVIRUS (COVID-19) PANDEMIC
On March 11, 2020, the World Health Organization announced that it had made the assessment that coronavirus disease 2019 (“COVID-19”) is a pandemic. The impacts of COVID-19 are adversely affecting the entire global economy, individual companies and investment products, and the market in general. There is significant uncertainty around the extent and duration of business disruptions related to COVID-19 and the impacts may be short term or may last for an extended period of time. The risk of further spreading of COVID-19 has led to significant uncertainty and volatility in the financial markets.
30 | Wells Fargo Emerging Markets Equity Fund
Table of Contents
Report of independent registered public accounting firm
To the Shareholders of the Fund and Board of Trustees
Wells Fargo Funds Trust:
Opinion on the Financial Statements
We have audited the accompanying statement of assets and liabilities of Wells Fargo Emerging Markets Equity Fund (the Fund), one of the funds constituting Wells Fargo Funds Trust, including the portfolio of investments, as of October 31, 2020, the related statement of operations for the year then ended, the statements of changes in net assets for each of the years in the two-year period then ended, and the related notes (collectively, the financial statements) and the financial highlights for each of the years in the five-year period then ended. In our opinion, the financial statements and financial highlights present fairly, in all material respects, the financial position of the Fund as of October 31, 2020, the results of its operations for the year then ended, the changes in its net assets for each of the years in the two-year period then ended, and the financial highlights for each of the years in the five-year period then ended, in conformity with U.S. generally accepted accounting principles.
Basis for Opinion
These financial statements and financial highlights are the responsibility of the Fund’s management. Our responsibility is to express an opinion on these financial statements and financial highlights based on our audits. We are a public accounting firm registered with the Public Company Accounting Oversight Board (United States) (PCAOB) and are required to be independent with respect to the Fund in accordance with the U.S. federal securities laws and the applicable rules and regulations of the Securities and Exchange Commission and the PCAOB.
We conducted our audits in accordance with the standards of the PCAOB. Those standards require that we plan and perform the audit to obtain reasonable assurance about whether the financial statements and financial highlights are free of material misstatement, whether due to error or fraud. Our audits included performing procedures to assess the risks of material misstatement of the financial statements and financial highlights, whether due to error or fraud, and performing procedures that respond to those risks. Such procedures included examining, on a test basis, evidence regarding the amounts and disclosures in the financial statements and financial highlights. Such procedures also included confirmation of securities owned as of October 31, 2020, by correspondence with the custodian, transfer agent and brokers, or by other appropriate auditing procedures. Our audits also included evaluating the accounting principles used and significant estimates made by management, as well as evaluating the overall presentation of the financial statements and financial highlights. We believe that our audits provide a reasonable basis for our opinion.

We have not been able to determine the specific year that we began serving as the auditor of one or more Wells Fargo Funds investment companies; however we are aware that we have served as the auditor of one or more Wells Fargo Funds investment companies since at least 1955.
Boston, Massachusetts
December 22, 2020
Wells Fargo Emerging Markets Equity Fund | 31
Table of Contents
TAX INFORMATION
Pursuant to Section 854 of the Internal Revenue Code, $43,479,613 of income dividends paid during the fiscal year ended October 31, 2020 has been designated as qualified dividend income (QDI).
For the fiscal year ended October 31, 2020, $1,896,485 has been designated as interest-related dividends for nonresident alien shareholders pursuant to Section 871 of the Internal Revenue Code.
Pursuant to Section 853 of the Internal Revenue Code, the Fund expects to designate amounts as foreign taxes paid for the fiscal year ended October 31, 2020. Additional details will be available in the semiannual report.
PROXY VOTING INFORMATION
A description of the policies and procedures used to determine how to vote proxies relating to portfolio securities is available, upon request, by calling 1-800-222-8222, visiting our website at wfam.com, or visiting the SEC website at sec.gov. Information regarding how the proxies related to portfolio securities were voted during the most recent 12-month period ended June 30 is available on the website at wfam.com or by visiting the SEC website at sec.gov.
QUARTERLY PORTFOLIO HOLDINGS INFORMATION
The Fund files its complete schedule of portfolio holdings with the SEC for the first and third quarters of each fiscal year as an exhibit to its reports on Form N-PORT. Shareholders may view the filed Form N-PORT by visiting the SEC website at sec.gov.
32 | Wells Fargo Emerging Markets Equity Fund
Table of Contents
Other information (unaudited)
BOARD OF TRUSTEES AND OFFICERS
Each of the Trustees and Officers1 listed in the table below acts in identical capacities for each fund in the Wells Fargo family of funds, which consists of 144 mutual funds comprising the Wells Fargo Funds Trust, Wells Fargo Variable Trust, Wells Fargo Master Trust and four closed-end funds (collectively the “Fund Complex”). This table should be read in conjunction with the Prospectus and the Statement of Additional Information2. The mailing address of each Trustee and Officer is 525 Market Street, 12th Floor, San Francisco, CA 94105. Each Trustee and Officer serves an indefinite term, however, each Trustee serves such term until reaching the mandatory retirement age established by the Trustees.
Independent Trustees
Name and year of birth | Position held and length of service* | Principal occupations during past five years or longer | Current other public company or investment company directorships | |||
William R. Ebsworth (Born 1957) | Trustee, since 2015 | Retired. From 1984 to 2013, equities analyst, portfolio manager, research director and chief investment officer at Fidelity Management and Research Company in Boston, Tokyo, and Hong Kong, and retired in 2013 as Chief Investment Officer of Fidelity Strategic Advisers, Inc. where he led a team of investment professionals managing client assets. Prior thereto, Board member of Hong Kong Securities Clearing Co., Hong Kong Options Clearing Corp., the Thailand International Fund, Ltd., Fidelity Investments Life Insurance Company, and Empire Fidelity Investments Life Insurance Company. Audit Committee Chair and Investment Committee Chair of the Vincent Memorial Hospital Endowment (non-profit organization). Mr. Ebsworth is a CFA® charterholder. | N/A | |||
Jane A. Freeman (Born 1953) | Trustee, since 2015; Chair Liaison, since 2018 | Retired. From 2012 to 2014 and 1999 to 2008, Chief Financial Officer of Scientific Learning Corporation. From 2008 to 2012, Ms. Freeman provided consulting services related to strategic business projects. Prior to 1999, Portfolio Manager at Rockefeller & Co. and Scudder, Stevens & Clark. Board member of the Harding Loevner Funds from 1996 to 2014, serving as both Lead Independent Director and chair of the Audit Committee. Board member of the Russell Exchange Traded Funds Trust from 2011 to 2012 and the chair of the Audit Committee. Ms. Freeman is also an inactive Chartered Financial Analyst. | N/A | |||
Isaiah Harris, Jr. (Born 1952) | Trustee, since 2009; Audit Committee Chair, since 2019 | Retired. Chairman of the Board of CIGNA Corporation since 2009, and Director since 2005. From 2003 to 2011, Director of Deluxe Corporation. Prior thereto, President and CEO of BellSouth Advertising and Publishing Corp. from 2005 to 2007, President and CEO of BellSouth Enterprises from 2004 to 2005 and President of BellSouth Consumer Services from 2000 to 2003. Emeritus member of the Iowa State University Foundation Board of Governors. Emeritus Member of the Advisory Board of Iowa State University School of Business. Advisory Board Member, Palm Harbor Academy (private school). Mr. Harris is a certified public accountant (inactive status). | CIGNA Corporation | |||
Judith M. Johnson (Born 1949) | Trustee, since 2008 | Retired. Prior thereto, Chief Executive Officer and Chief Investment Officer of Minneapolis Employees Retirement Fund from 1996 to 2008. Ms. Johnson is an attorney, certified public accountant and a certified managerial accountant. | N/A | |||
David F. Larcker (Born 1950) | Trustee, since 2009 | James Irvin Miller Professor of Accounting at the Graduate School of Business (Emeritus), Stanford University, Director of the Corporate Governance Research Initiative and Senior Faculty of The Rock Center for Corporate Governance since 2006. From 2005 to 2008, Professor of Accounting at the Graduate School of Business, Stanford University. Prior thereto, Ernst & Young Professor of Accounting at The Wharton School, University of Pennsylvania from 1985 to 2005. | N/A | |||
Wells Fargo Emerging Markets Equity Fund | 33
Table of Contents
Other information (unaudited)
Name and year of birth | Position held and length of service* | Principal occupations during past five years or longer | Current other public company or investment company directorships | |||
Olivia S. Mitchell (Born 1953) | Trustee, since 2006; Nominating and Governance Committee Chair, since 2018 | International Foundation of Employee Benefit Plans Professor, Wharton School of the University of Pennsylvania since 1993. Director of Wharton’s Pension Research Council and Boettner Center on Pensions & Retirement Research, and Research Associate at the National Bureau of Economic Research. Previously, Cornell University Professor from 1978 to 1993. | N/A | |||
Timothy J. Penny (Born 1951) | Trustee, since 1996; Chair, since 2018 | President and Chief Executive Officer of Southern Minnesota Initiative Foundation, a non-profit organization, since 2007. Member of the Board of Trustees of NorthStar Education Finance, Inc., a non-profit organization, since 2007. | N/A | |||
James G. Polisson (Born 1959) | Trustee, since 2018 | Retired. Chief Marketing Officer, Source (ETF) UK Services, Ltd, from 2015 to 2017. From 2012 to 2015, Principal of The Polisson Group, LLC, a management consulting, corporate advisory and principal investing company. Chief Executive Officer and Managing Director at Russell Investments, Global Exchange Traded Funds from 2010 to 2012. Managing Director of Barclays Global Investors from 1998 to 2010 and Global Chief Marketing Officer for iShares and Barclays Global Investors from 2000 to 2010. Trustee of the San Francisco Mechanics’ Institute, a non-profit organization, from 2013 to 2015. Board member of the Russell Exchange Traded Fund Trust from 2011 to 2012. Director of Barclays Global Investors Holdings Deutschland GmbH from 2006 to 2009. Mr. Polisson is an attorney and has a retired status with the Massachusetts and District of Columbia Bar Associations. | N/A | |||
Pamela Wheelock (Born 1959) | Trustee, since January 2020; previously Trustee from January 2018 to July 2019 | Board member of the Destination Medical Center Economic Development Agency, Rochester, Minnesota since 2019. Interim President of the McKnight Foundation from January to September 2020. Acting Commissioner, Minnesota Department of Human Services, July 2019 through September 2019. Human Services Manager (part-time), Minnesota Department of Human Services, October 2019 through December 2019. Chief Operating Officer, Twin Cities Habitat for Humanity from 2017 to 2019. Vice President of University Services, University of Minnesota from 2012 to 2016. Prior thereto, on the Board of Directors, Governance Committee and Finance Committee for the Minnesota Philanthropy Partners (Saint Paul Foundation) from 2012 to 2018, Interim Chief Executive Officer of Blue Cross Blue Shield of Minnesota from 2011 to 2012, Chairman of the Board from 2009 to 2012 and Board Director from 2003 to 2015. Vice President, Leadership and Community Engagement, Bush Foundation, Saint Paul, Minnesota (a private foundation) from 2009 to 2011. Executive Vice President and Chief Financial Officer, Minnesota Sports and Entertainment from 2004 to 2009 and Senior Vice President from 2002 to 2004. Executive Vice President of the Minnesota Wild Foundation from 2004 to 2008. Commissioner of Finance, State of Minnesota, from 1999 to 2002. Currently Board Chair of the Minnesota Wild Foundation since 2010. | N/A | |||
| * | Length of service dates reflect the Trustee’s commencement of service with the Trust’s predecessor entities, where applicable. |
34 | Wells Fargo Emerging Markets Equity Fund
Table of Contents
Other information (unaudited)
Officers
Name and year of birth | Position held and length of service | Principal occupations during past five years or longer | ||
Andrew Owen (Born 1960) | President, since 2017 | Executive Vice President of Wells Fargo & Company and Head of Affiliated Managers, Wells Fargo Asset Management, since 2014. In addition, Mr. Owen is currently President, Chief Executive Officer and Director of Wells Fargo Funds Management, LLC since 2017. Prior thereto, Executive Vice President responsible for marketing, investments and product development for Wells Fargo Funds Management, LLC, from 2009 to 2014. | ||
Jeremy DePalma1 (Born 1974) | Treasurer, since 2012 | Senior Vice President of Wells Fargo Funds Management, LLC since 2009. Senior Vice President of Evergreen Investment Management Company, LLC from 2008 to 2010 and head of the Fund Reporting and Control Team within Fund Administration from 2005 to 2010. | ||
Michelle Rhee (Born 1966) | Chief Legal Officer, since 2019 | Secretary of Wells Fargo Funds Management, LLC and Chief Legal Counsel of Wells Fargo Asset Management since 2018. Deputy General Counsel of Wells Fargo Bank, N.A. since 2020 and Assistant General Counsel of Wells Fargo Bank, N.A. from 2018 to 2020. Associate General Counsel and Managing Director of Bank of America Corporation from 2004 to 2018. | ||
Catherine Kennedy (Born 1969) | Secretary, since 2019 | Vice President of Wells Fargo Funds Management, LLC and Senior Counsel of the Wells Fargo Legal Department since 2010. Vice President and Senior Counsel of Evergreen Investment Management Company, LLC from 1998 to 2010. | ||
Michael H. Whitaker (Born 1967) | Chief Compliance Officer, since 2016 | Chief Compliance Officer of Wells Fargo Asset Management since 2016. Senior Vice President and Chief Compliance Officer for Fidelity Investments from 2007 to 2016. | ||
| 1 | Jeremy DePalma acts as Treasurer of 77 funds in the Fund Complex. |
| 2 | The Statement of Additional Information includes additional information about the Trustees and is available, without charge, upon request, by calling 1-800-222-8222 or by visiting the website at wfam.com. |
Wells Fargo Emerging Markets Equity Fund | 35
Table of Contents
Other information (unaudited)
BOARD CONSIDERATION OF INVESTMENT MANAGEMENT AND SUB-ADVISORY AGREEMENTS:
Wells Fargo Emerging Markets Equity Fund
Under the Investment Company Act of 1940 (the “1940 Act”), the Board of Trustees (the “Board”) of Wells Fargo Funds Trust (the “Trust”) must determine annually whether to approve the continuation of the Trust’s investment management and sub-advisory agreements. In this regard, at a Board meeting held on May 26, 2020 and May 28, 2020 (together, the “Meeting”), the Board, all the members of which have no direct or indirect interest in the investment management and sub-advisory agreements and are not “interested persons” of the Trust, as defined in the 1940 Act (the “Independent Trustees”), reviewed and approved for Wells Fargo Emerging Markets Equity Fund (the “Fund”): (i) an investment management agreement (the “Management Agreement”) with Wells Fargo Funds Management, LLC (“Funds Management”); and (ii) an investment sub-advisory agreement (the “Sub-Advisory Agreement”) with Wells Capital Management Incorporated (the “Sub-Adviser”), an affiliate of Funds Management. The Management Agreement and the Sub-Advisory Agreement are collectively referred to as the “Advisory Agreements.”
At the Meeting, the Board considered the factors and reached the conclusions described below relating to the selection of Funds Management and the Sub-Adviser and the approval of the Advisory Agreements. Prior to the Meeting, including at a Board meeting held in April 2020, the Trustees conferred extensively among themselves and with representatives of Funds Management about these matters. Also, the Board has adopted a team-based approach, with each team consisting of a sub-set of Trustees, to assist the full Board in the discharge of its duties in reviewing investment performance and other matters throughout the year. The Independent Trustees were assisted in their evaluation of the Advisory Agreements by independent legal counsel, from whom they received separate legal advice and with whom they met separately.
In providing information to the Board, Funds Management and the Sub-Adviser were guided by a detailed set of requests for information submitted to them by independent legal counsel on behalf of the Independent Trustees at the start of the Board’s annual contract renewal process earlier in 2020. In considering and approving the Advisory Agreements, the Trustees considered the information they believed relevant, including but not limited to the information discussed below. The Board considered not only the specific information presented in connection with the Meeting, but also the knowledge gained over time through interaction with Funds Management and the Sub-Adviser about various topics. In this regard, the Board reviewed reports of Funds Management at each of its quarterly meetings, which included, among other things, portfolio reviews and investment performance reports. In addition, the Board and the teams mentioned above confer with portfolio managers at various times throughout the year. The Board did not identify any particular information or consideration that was all-important or controlling, and each individual Trustee may have attributed different weights to various factors.
After its deliberations, the Board unanimously approved the continuation of the Advisory Agreements for a one-year term and determined that the compensation payable to Funds Management and the Sub-Adviser under each of the Advisory Agreements was reasonable. The Board considered the approval of the Advisory Agreements for the Fund as part of its consideration of agreements for funds across the complex, but its approvals were made on a fund-by-fund basis. The following summarizes a number of important, but not necessarily all, factors considered by the Board in support of its approvals.
Nature, extent and quality of services
The Board received and considered various information regarding the nature, extent and quality of services provided to the Fund by Funds Management and the Sub-Adviser under the Advisory Agreements. This information included a description of the investment advisory services and Fund-level administrative services covered by the Management Agreement, as well as, among other things, a summary of the background and experience of senior management of Wells Fargo Asset Management (“WFAM”), of which Funds Management and the Sub-Adviser are a part, and a summary of investments made in the business of WFAM. The Board also received a description of Funds Management’s and the Sub-Adviser’s business continuity plans and of their approaches to data privacy and cybersecurity, and related testing. The Board also received and reviewed information about Funds Management’s role as administrator of the Fund’s liquidity risk management program, Funds Management’s approach to risk management, and Funds Management’s intermediary and vendor oversight program.
The Board also considered the qualifications, background, tenure and responsibilities of each of the portfolio managers primarily responsible for the day-to-day portfolio management of the Fund. The Board evaluated the ability of Funds Management and the Sub-Adviser to attract and retain qualified investment professionals, including research, advisory and supervisory personnel. The Board further considered the compliance programs and compliance records of Funds Management and the Sub-Adviser. In addition, the Board took into account the full range of services provided to the Fund by Funds Management and its affiliates.
36 | Wells Fargo Emerging Markets Equity Fund
Table of Contents
Other information (unaudited)
Fund investment performance and expenses
The Board considered the investment performance results for the Fund over various time periods ended December 31, 2019. The Board also considered more current results for various time periods ended March 31, 2020. The Board considered these results in comparison to the investment performance of funds in a universe that was determined by Broadridge Inc. (“Broadridge”) to be similar to the Fund (the “Universe”), and in comparison to the Fund’s benchmark index and to other comparative data. Broadridge is an independent provider of investment company data. The Board received a description of the methodology used by Broadridge to select the mutual funds in the performance Universe. The Board noted that the investment performance of the Fund (Administrator Class) was higher than the average investment performance of the Universe for the one-, three-, five- and ten-year periods ended December 31, 2019. The Board also noted that the investment performance of the Fund (Administrator Class) was higher than the average investment performance of the Universe for all periods ended March 31, 2020. The Board also noted that the investment performance of the Fund was higher than its benchmark index, the MSCI Emerging Markets Index (Net), for all periods ended December 31, 2019. The Board also noted that the investment performance of the Fund was higher than its benchmark index, the MSCI Emerging Markets Index (Net), for all periods ended March 31, 2020.
The Board also received and considered information regarding the Fund’s net operating expense ratios and their various components, including actual management fees, custodian and other non-management fees, and Rule 12b-1 and non-Rule 12b-1 shareholder service fees. The Board considered these ratios in comparison to the median ratios of funds in class-specific expense groups that were determined by Broadridge to be similar to the Fund (the “Groups”). The Board received a description of the methodology used by Broadridge to select the mutual funds in the expense Groups and an explanation of how funds comprising expense groups and their expense ratios may vary from year-to-year. Based on the Broadridge reports, the Board noted that the net operating expense ratios of the Fund were higher than the median net operating expense ratios of the expense Groups for Class A and the Administrator Class, and in range of the median net operating expense ratios of the expense Groups for the Institutional Class and Class R6. The Board noted that the Fund’s expense ratio caps, including the expense ratio caps for Class A and the Administrator Class, would be maintained.
The Board took into account the Fund’s investment performance and expense information provided to it among the factors considered in deciding to re-approve the Advisory Agreements.
Investment management and sub-advisory fee rates
The Board reviewed and considered the contractual fee rates payable by the Fund to Funds Management under the Management Agreement, as well as the contractual fee rates payable by the Fund to Funds Management for class-level administrative services under a Class-Level Administration Agreement, which include, among other things, class-level transfer agency and sub-transfer agency costs (collectively, the “Management Rates”). The Board also reviewed and considered the contractual investment sub-advisory fee rates that are payable by Funds Management to the Sub-Adviser for investment sub-advisory services.
Among other information reviewed by the Board was a comparison of the Fund’s Management Rates with the average contractual investment management fee rates of funds in the expense Groups at a common asset level as well as transfer agency costs of the funds in the expense Groups. The Board noted that the Management Rates of the Fund were higher than the sum of these average rates for the Fund’s expense Groups for Class A and the Administrator Class, and in range of these average rates for the Fund’s expense Groups for the Institutional Class and Class R6. The Board noted that the Fund’s expense ratio caps, including the expense ratio caps for Class A and the Administrator Class, would be maintained..
The Board also received and considered information about the portion of the total management fee that was retained by Funds Management after payment of the fee to the Sub-Adviser for sub-advisory services. In assessing the reasonableness of this amount, the Board received and evaluated information about the nature and extent of responsibilities retained and risks assumed by Funds Management and not delegated to or assumed by the Sub-Adviser, and about Funds Management’s on-going oversight services. Given the affiliation between Funds Management and the Sub-Adviser, the Board ascribed limited relevance to the allocation of fees between them.
The Board also received and considered information about the nature and extent of services offered and fee rates charged by Funds Management and the Sub-Adviser to other types of clients with investment strategies similar to those of the Fund. In this regard, the Board received information about the significantly greater scope of services, and compliance, reporting and other legal burdens and risks of managing proprietary mutual funds compared with those associated with managing assets of other types of clients, including third-party sub-advised fund clients and non-mutual fund clients such as institutional separate accounts.
Based on its consideration of the factors and information it deemed relevant, including those described here, the Board determined that the compensation payable to Funds Management under the Management Agreement and to the Sub-Adviser under the Sub-Advisory Agreement was reasonable.
Wells Fargo Emerging Markets Equity Fund | 37
Table of Contents
Other information (unaudited)
Profitability
The Board received and considered information concerning the profitability of Funds Management, as well as the profitability of both WFAM and Wells Fargo & Co. (“Wells Fargo”) from providing services to the fund family as a whole. The Board noted that the Sub-Adviser’s profitability information with respect to providing services to the Fund and other funds in the family was subsumed in the WFAM and Wells Fargo profitability analysis.
Funds Management reported on the methodologies and estimates used in calculating profitability, including a description of the methodology used to allocate certain expenses. Among other things, the Board noted that the levels of profitability reported on a fund-by-fund basis varied widely, depending on factors such as the size, type and age of fund.
Based on its review, the Board did not deem the profits reported by Funds Management, WFAM or Wells Fargo from services provided to the Fund to be at a level that would prevent it from approving the continuation of the Advisory Agreements.
Economies of scale
The Board received and considered information about the potential for Funds Management to experience economies of scale in the provision of management services to the Fund, the difficulties of calculating economies of scale at an individual fund level, and the extent to which potential scale benefits are shared with shareholders. The Board noted the existence of breakpoints in the Fund’s management fee structure, which operate generally to reduce the Fund’s expense ratios as the Fund grows in size, and the size of the Fund in relation to such breakpoints. The Board considered that in addition to management fee breakpoints, Funds Management shares potential economies of scale from its management business in a variety of ways, including through fee waiver and expense reimbursement arrangements, services that benefit shareholders, competitive management fee rates set at the outset without regard to breakpoints, and investments in the business intended to enhance services available to shareholders.
The Board concluded that Funds Management’s arrangements with respect to the Fund, including contractual breakpoints, constituted a reasonable approach to sharing potential economies of scale with the Fund and its shareholders.
Other benefits to Funds Management and the Sub-Adviser
The Board received and considered information regarding potential “fall-out” or ancillary benefits received by Funds Management and its affiliates, including the Sub-Adviser, as a result of their relationships with the Fund. Ancillary benefits could include, among others, benefits directly attributable to other relationships with the Fund and benefits potentially derived from an increase in Funds Management’s and the Sub-Adviser’s business as a result of their relationships with the Fund. The Board noted that various affiliates of Funds Management may receive distribution-related fees, shareholder servicing payments and sub-transfer agency fees in respect of shares sold or held through them and services provided.
The Board also reviewed information about soft dollar credits earned and utilized by the Sub-Adviser, fees earned by Funds Management and the Sub-Adviser from managing a private investment vehicle for the fund family’s securities lending collateral, and commissions earned by an affiliated broker from portfolio transactions.
Based on its consideration of the factors and information it deemed relevant, including those described here, the Board did not find that any ancillary benefits received by Funds Management and its affiliates, including the Sub-Adviser, were unreasonable.
Conclusion
At the Meeting, after considering the above-described factors and based on its deliberations and its evaluation of the information described above, the Board unanimously approved the continuation of the Advisory Agreements for a one-year term and determined that the compensation payable to Funds Management and the Sub-Adviser under each of the Advisory Agreements was reasonable.
38 | Wells Fargo Emerging Markets Equity Fund
Table of Contents
Other information (unaudited)
LIQUIDITY RISK MANAGEMENT PROGRAM
In accordance with Rule 22e-4 under the Investment Company Act of 1940, as amended (the “Liquidity Rule”), Wells Fargo Funds Trust (the “Trust”) has adopted and implemented a liquidity risk management program (the “Program”) on behalf of each of its series, including the Fund, which is reasonably designed to assess and manage the Fund’s liquidity risk. “Liquidity risk” is defined as the risk that the Fund is unable to meet redemption requests without significantly diluting remaining investors’ interests in the Fund. The Trust’s Board of Trustees (the “Board”) previously approved the designation of Wells Fargo Funds Management, LLC (“Funds Management”), the Fund’s investment manager, as the administrator of the Program, and Funds Management has established a Liquidity Risk Management Council composed of personnel from multiple departments within Funds Management and its affiliates to assist Funds Management in the implementation and on-going administration of the Program.
The Program is comprised of various components designed to support the assessment and/or management of liquidity risk, including: (1) the periodic assessment (no less frequently than annually) of certain factors that influence the Fund’s liquidity risk; (2) the periodic classification (no less frequently than monthly) of the Fund’s investments into one of four liquidity categories that reflect an estimate of their liquidity under current market conditions; (3) a 15% limit on the acquisition of “illiquid investments” (as defined under the Liquidity Rule); (4) to the extent the Fund does not invest primarily in “highly liquid investments” (as defined under the Liquidity Rule), the determination of a minimum percentage of the Fund’s assets that generally will be invested in highly liquid investments (an “HLIM”); (5) if the Fund has established an HLIM, the periodic review (no less frequently than annually) of the HLIM and the adoption of policies and procedures for responding to a shortfall of the Fund’s “highly liquid investments” below its HLIM; and (6) periodic reporting to the Board.
At a meeting of the Board held on May 26 and 28, 2020, the Board received a written report (the “Report”) from Funds Management that addressed the operation of the Program and assessed its adequacy and effectiveness of implementation. The Report covered the initial period from December 1, 2018 through December 31, 2019 (the “Reporting Period”). No significant liquidity events impacting the Fund were noted in the Report. There were no material changes to the Program during the Reporting Period. The Report concluded that the Program is operating effectively to assess and manage the Fund’s liquidity risk, and that the Program has been and continues to be adequately and effectively implemented to monitor and, as applicable, respond to the Fund’s liquidity developments.
There can be no assurance that the Program will achieve its objectives under all circumstances in the future. Please refer to the Fund’s prospectus for more information regarding the Fund’s exposure to liquidity risk and other risks to which an investment in the Fund may be subject.
Wells Fargo Emerging Markets Equity Fund | 39
Table of Contents
This page is intentionally left blank.
Table of Contents
For more information
More information about Wells Fargo Funds is available free upon request. To obtain literature, please write, visit the Fund’s website, or call:
Wells Fargo Funds
P.O. Box 219967
Kansas City, MO 64121-9967
Website: wfam.com
Individual investors: 1-800-222-8222
Retail investment professionals: 1-888-877-9275
Institutional investment professionals: 1-866-765-0778

This report and the financial statements contained herein are submitted for the general information of the shareholders of the Fund. If this report is used for promotional purposes, distribution of the report must be accompanied or preceded by a current prospectus. Before investing, please consider the investment objectives, risks, charges, and expenses of the investment. For a current prospectus and, if available, a summary prospectus, containing this information, call 1-800-222-8222 or visit the Fund’s website at wfam.com. Read the prospectus carefully before you invest or send money.
Wells Fargo Asset Management (WFAM) is the trade name for certain investment advisory/management firms owned by Wells Fargo & Company. These firms include but are not limited to Wells Capital Management Incorporated and Wells Fargo Funds Management, LLC. Certain products managed by WFAM entities are distributed by Wells Fargo Funds Distributor, LLC (a broker-dealer and Member FINRA).
This material is for general informational and educational purposes only and is NOT intended to provide investment advice or a recommendation of any kind—including a recommendation for any specific investment, strategy, or plan.
INVESTMENT PRODUCTS: NOT FDIC INSURED ◾ NO BANK GUARANTEE ◾ MAY LOSE VALUE
© 2020 Wells Fargo & Company. All rights reserved.
PAR-1120-00555 12-20
A238/AR238 10-20
Table of Contents

Annual Report
October 31, 2020
Wells Fargo
Emerging Markets Equity Income Fund
Beginning on January 1, 2021, as permitted by new regulations adopted by the Securities and Exchange Commission, paper copies of the Wells Fargo Funds’ annual and semi-annual shareholder reports issued after this date will no longer be sent by mail, unless you specifically request paper copies of the reports. Instead, the reports will be made available on the Funds’ website, and you will be notified by mail each time a report is posted and provided with a website address to access the report.
If you already elected to receive shareholder reports electronically, you will not be affected by this change and you need not take any action. You may elect to receive shareholder reports and other communications from the Fund electronically at any time by contacting your financial intermediary (such as a broker-dealer or bank) or, if you are a direct investor, by calling 1-800-222-8222 or by enrolling at wellsfargo.com/advantagedelivery.
You may elect to receive all future reports in paper free of charge. If you invest through a financial intermediary, you can contact your financial intermediary to request that you continue to receive paper copies of your shareholder reports; if you invest directly with the Fund, you can call 1-800-222-8222. Your election to receive reports in paper will apply to all Wells Fargo Funds held in your account with your financial intermediary or, if you are a direct investor, to all Wells Fargo Funds that you hold.
Table of Contents
|
Reduce clutter. Save trees. |
Sign up for electronic delivery of prospectuses and shareholder reports at wellsfargo.com/ |
The views expressed and any forward-looking statements are as of October 31, 2020, unless otherwise noted, and are those of the Fund’s portfolio managers and/or Wells Fargo Asset Management. Discussions of individual securities, or the markets generally, or any Wells Fargo Fund are not intended as individual recommendations. Future events or results may vary significantly from those expressed in any forward-looking statements. The views expressed are subject to change at any time in response to changing circumstances in the market. Wells Fargo Asset Management and the Fund disclaim any obligation to publicly update or revise any views expressed or forward-looking statements.
INVESTMENT PRODUCTS: NOT FDIC INSURED ◾ NO BANK GUARANTEE ◾ MAY LOSE VALUE
Wells Fargo Emerging Markets Equity Income Fund | 1
Table of Contents
Letter to shareholders (unaudited)

Andrew Owen
President
Wells Fargo Funds
Dear Shareholder:
We are pleased to offer you this annual report for the Wells Fargo Emerging Markets Equity Income Fund for the 12-month period that ended October 31, 2020. Global stock markets saw earlier gains erased in March as governments around the world took unprecedented measures, attempting to stop the spread of COVID-19 at the expense of short-term economic output. However, markets rallied strongly from April through period-end to offset those short-term losses as central banks bolstered capital markets and confidence.
For the 12-month period, equities had generally positive total returns despite intense volatility in March. Non-U.S. developed market equities had weaker performance than emerging market and U.S. stocks. While gains from fixed-income securities were positive, they were more modest than equities. For the period, U.S. stocks, based on the S&P 500 Index,1 gained 9.71%. International stocks, as measured by the MSCI ACWI ex USA Index (Net),2 returned -2.61%, while the MSCI EM Index (Net)3 had stronger performance, with a 8.25% gain. Among bond indices, the Bloomberg Barclays U.S. Aggregate Bond Index4 returned 6.19%, the Bloomberg Barclays Global Aggregate ex-USD Index5 gained 4.96%, and the Bloomberg Barclays Municipal Bond Index6 returned 3.59% while the ICE BofA U.S. High Yield Index7 returned 2.54%.
The period began with buoyed investor confidence.
Equity markets rallied in November despite ongoing geopolitical risks. Hopes for a U.S.-China trade deal buoyed investor confidence. U.S. business sentiment improved slightly and manufacturing and services activity picked up. While consumer confidence and purchasing managers’ activity rose in the eurozone, China reported weakening manufacturing and consumer data. Bond yields rose marginally, leading to slightly negative returns for global government and investment-grade corporate bonds.
Financial markets ended 2019 boosted by the U.S. and China accord on a Phase One trade deal. That, along with the landslide election win by the pro-Brexit U.K. Conservative Party and ongoing central bank support, gave investors greater confidence. U.S. economic indicators were generally positive, with the exception of manufacturing activity and business confidence. Consumer confidence was fed by a robust labor market, tame inflation, and lower interest rates, which boosted housing affordability and stimulated homebuyer activity. The impeachment of President Trump had little market impact. Meanwhile, slowing Chinese economic activity, partly a result of the trade war, led to further government stimulus at year-end through lower reserve ratios, allowing banks to lend more money.
| 1 | The S&P 500 Index consists of 500 stocks chosen for market size, liquidity, and industry group representation. It is a market-value-weighted index with each stock’s weight in the index proportionate to its market value. You cannot invest directly in an index. |
| 2 | The Morgan Stanley Capital International (MSCI) All Country World Index (ACWI) ex USA Index (Net) is a free-float-adjusted market-capitalization-weighted index that is designed to measure the equity market performance of developed and emerging markets, excluding the United States. Source: MSCI. MSCI makes no express or implied warranties or representations and shall have no liability whatsoever with respect to any MSCI data contained herein. The MSCI data may not be further redistributed or used as a basis for other indices or any securities or financial products. This report is not approved, reviewed, or produced by MSCI. You cannot invest directly in an index. |
| 3 | The MSCI Emerging Markets (EM) Index (Net) is a free-float-adjusted market-capitalization-weighted index that is designed to measure equity market performance of emerging markets. You cannot invest directly in an index. |
| 4 | The Bloomberg Barclays U.S. Aggregate Bond Index is a broad-based benchmark that measures the investment-grade, U.S. dollar-denominated, fixed-rate taxable bond market, including Treasuries, government-related and corporate securities, mortgage-backed securities (agency fixed-rate and hybrid adjustable-rate mortgage pass-throughs), asset-backed securities, and commercial mortgage-backed securities. You cannot invest directly in an index. |
| 5 | The Bloomberg Barclays Global Aggregate ex-USD Index is an unmanaged index that provides a broad-based measure of the global investment-grade fixed-income markets excluding the U.S. dollar-denominated debt market. You cannot invest directly in an index. |
| 6 | The Bloomberg Barclays Municipal Bond Index is an unmanaged index composed of long-term tax-exempt bonds with a minimum credit rating of Baa. You cannot invest directly in an index. |
| 7 | The ICE BofA U.S. High Yield Index is a market-capitalization-weighted index of domestic and Yankee high-yield bonds. The index tracks the performance of high-yield securities traded in the U.S. bond market. You cannot invest directly in an index. Copyright 2020. ICE Data Indices, LLC. All rights reserved. |
2 | Wells Fargo Emerging Markets Equity Income Fund
Table of Contents
Letter to shareholders (unaudited)
The 2019 year-end rally continued in early January 2020. However, capital market volatility spiked in late January on concerns over the potential impact of COVID-19 on the global economy and stock markets. With sentiment somewhat souring, perceived safe havens did well in January. The U.S. dollar and Japanese yen both rose and government bonds outperformed equities. While the S&P 500 Index held its ground, emerging market equities tumbled, including those in Asia.
In February, COVID-19 became the major market focus. Fears of the virus’s impact on global growth led to expectations of increased global central bank monetary policy support. That led the 10-year U.S. Treasury yield to fall to an all-time low of 1.1%. Although equity markets initially shrugged off concerns about the outbreak, focusing instead on strong fourth-quarter earnings and improving business confidence in January, market sentiment turned sharply lower and the S&P 500 Index lost 8.2% for the month. Oil prices tumbled as Russia and the Organization of the Petroleum Exporting Countries compounded a major decline in oil demand with a brutal price war, partly aimed at dissuading further U.S. shale production, causing the price of West Texas Intermediate crude oil to plummet.
The global spread of COVID-19 in March led country after country to clamp down on social- and business-related activity in order to contain the virus from causing even greater devastation and overwhelming health care systems. This abrupt stoppage of economic activity led to the sharp deceleration of global output, sending economies into a deep contraction. Central banks responded swiftly, slashing interest rates and expanding quantitative easing programs to restore liquidity and confidence in the markets. In the U.S., the Federal Reserve (Fed) introduced several new lending programs, funding investment-grade bonds, money market mutual funds, and commercial paper while purchasing Treasuries, mortgage-backed securities, and overnight repurchase agreements. Meanwhile, stock markets tumbled quickly into a bear market, ending the longest bull stock market in U.S. history.
Markets rebounded strongly in April, fueled by unprecedented government and central bank stimulus measures. The U.S. economy contracted by an annualized 5.0% pace in the first quarter of 2020, with 30 million new unemployment insurance claims in six weeks. In the eurozone, first-quarter real gross domestic product (GDP) shrank 3.8% with the composite April Flash Purchasing Managers’ Index (PMI), a monthly survey of purchasing managers, falling to an all-time low of 13.5. The European Central Bank expanded its quantitative easing to include the purchase of additional government bonds of countries with the greatest virus-related need, including Italy and Spain. China’s first-quarter GDP fell by 6.8% year over year. However, retail sales, production, and investment showed signs of recovery. Extreme oil-price volatility continued as global supply far exceeded demand.
The global equity market rebound continued in May, with widespread advances. Investors regained confidence on reports of early signs of success in human trials of a COVID-19 vaccine. Growth stocks continued to outperform value stocks while returns on global government bonds were generally flat. In the U.S., a gap grew between the stock market rebound and economic data, including an April unemployment rate of 14.7%, the highest level since World War II. Manufacturing and services purchasing managers’ indices reflected widespread weakening activity in May. U.S. corporate earnings reports indicated a 14% year-over-year contraction in earnings from the first quarter of 2019. However, high demand for technology, driven by remote activity, supported robust information technology sector earnings, which helped drive major technology stocks higher.
Financial markets posted widely positive returns in June despite ongoing economic weakness and high levels of uncertainty on the containment of COVID-19 and the timing of an effective vaccine. There were hopeful signs as economies reopened. Vitally important to market sentiment was the ongoing commitment by central banks globally
“The global spread of COVID-19 in March led country after country to clamp down on social- and business-related activity in order to contain the virus from causing even greater devastation and overwhelming health care systems.”
Wells Fargo Emerging Markets Equity Income Fund | 3
Table of Contents
Letter to shareholders (unaudited)
“In October, capital markets took a step back from their six-month rally. Market volatility rose in advance of the U.S. election and amid a global increase in COVID-19 infections.”
to do all they can to provide economic support through liquidity and low borrowing costs. U.S. economic activity was aided by one-time $1,200 stimulus checks and $600 weekly bonus unemployment benefits that expired at the end of July. However, unemployment remained historically high, easing somewhat from 14.7% in April to 11.1% in June. By the end of June, numerous states reported increases of COVID-19 cases. China’s economic recovery picked up momentum in June, though it remained far from a full recovery.
July was broadly positive for both global equities and fixed income. However, economic data and a resurgence of COVID-19 cases pointed to the vulnerability of the global economy and the ongoing imperative to regain control of the pandemic. Second-quarter GDP shrank from the previous quarter by 9.5% and 12.1% in the U.S. and the eurozone, respectively. In contrast, China reported a 3.2% year-over-year expansion in its second-quarter GDP. U.S. unemployment remained high despite adding 1.8 million jobs in July, with a double-digit jobless rate persisting. However, manufacturing activity grew in both the U.S. and the eurozone. In Asia, while China’s manufacturing sector continued to expand, activity in Japan and South Korea contracted. A rising concern was the rapid and broad reemergence of COVID-19 infections.
The stock market continued to rally in August despite concerns over rising numbers of COVID-19 cases in the United States and several European countries, including France and Spain, as well as the July expiration of the $600 weekly bonus unemployment benefit. U.S. stocks had strong monthly gains, surpassing broadly positive overall global equity performance, while fixed-income market monthly returns were broadly flat. Generally stronger-than-expected second-quarter earnings boosted investor sentiment along with the Fed’s announcement of a policy shift that will likely lead to longer-term low interest rates and supportive monetary policy. U.S. indices measuring manufacturing and services activities beat expectations while the U.S. housing market maintained strength. In Europe, retail sales expanded and consumer confidence was steady. China’s economy continued to expand.
Stocks grew more volatile in September on mixed economic data. U.S. economic activity continued to grow. However, six months after the bottom fell out of the labor market in early spring, only half of the 22 million jobs lost had returned. The U.S. unemployment rate fell to 7.9% in September, reflecting steady improvement but far higher than the 3.5% pre-COVID-19 rate. Only 661,000 jobs were added for the month, down from 1.5 million in August. Meanwhile, a reported 2.3 million people have given up looking for work. With U.S. Congress failing to pass further fiscal relief and uncertainties surrounding a possible vaccine, doubts crept back into the financial markets. In the U.K., a lack of progress in Brexit talks with the European Union weighed on markets. China’s economy picked up steam, however, with growth fueled by increased global demand, and China’s services sector rallied.
In October, capital markets took a step back from their six-month rally. Market volatility rose in advance of the U.S. election and amid a global increase in COVID-19 infections. Europe responded with a new round of restrictions affecting economic activity. Meanwhile, Brexit remained unresolved as the European Union and the U.K. failed to strike a deal by a mid-October deadline. U.S. markets looked favorably at a possible Democratic sweep and control of the federal purse strings as that could lead to the passage of long-awaited additional fiscal stimulus, which could boost economic activity. Meanwhile, China continued to stand apart, reporting 4.9% third-quarter GDP growth year over year.
4 | Wells Fargo Emerging Markets Equity Income Fund
Table of Contents
Letter to shareholders (unaudited)
Don’t let short-term uncertainty derail long-term investment goals.
Periods of investment uncertainty can present challenges, but experience has taught us that maintaining long-term investment goals can be an effective way to plan for the future. To help you create a sound strategy based on your personal goals and risk tolerance, Wells Fargo Funds offers more than 100 mutual funds spanning a wide range of asset classes and investment styles. Although diversification cannot guarantee an investment profit or prevent losses, we believe it can be an effective way to manage investment risk and potentially smooth out overall portfolio performance. We encourage investors to know their investments and to understand that appropriate levels of risk-taking may unlock opportunities.
Thank you for choosing to invest with Wells Fargo Funds. We appreciate your confidence in us and remain committed to helping you meet your financial needs.
Sincerely,

Andrew Owen
President
Wells Fargo Funds
|
For further information about your Fund, contact your investment professional, visit our website at wfam.com, or call us directly at 1-800-222-8222. |
Notice to Shareholders
At a meeting held on August 10-12, 2020, the Board of Trustees of the Fund approved a change to the Fund’s automatic conversion feature for Class C shares in order to shorten the required holding period from 10 to 8 years. As a result, on a monthly basis beginning November 5, 2020, Class C shares will convert automatically into Class A shares 8 years after the initial date of purchase or, if you acquired your Class C shares through an exchange or conversion from another share class, 8 years after the date you acquired your Class C shares. When Class C shares that you acquired through a purchase or exchange convert, any other Class C shares that you purchased with reinvested dividends and distributions also will convert into Class A shares on a pro rata basis.
Please note that a shorter holding period may apply depending on your intermediary. Please see “Appendix A—Sales Charge Reductions and Waivers for Certain Intermediaries” in the Fund’s prospectus for further information.
Wells Fargo Emerging Markets Equity Income Fund | 5
Table of Contents
Performance highlights (unaudited)
Investment objective
The Fund seeks to achieve long-term capital appreciation and current income.
Manager
Wells Fargo Funds Management, LLC
Subadviser
Wells Capital Management Incorporated
Portfolio managers
Alison Shimada
Elaine Tse
Average annual total returns (%) as of October 31, 2020
| Including sales charge | Excluding sales charge | Expense ratios1 (%) | ||||||||||||||||||||||||||||||||
| Inception date | 1 year | 5 year | Since inception | 1 year | 5 year | Since inception | Gross | Net2 | ||||||||||||||||||||||||||
| Class A (EQIAX) | 5-31-2012 | -11.22 | 1.65 | 2.61 | -5.83 | 2.86 | 3.34 | 1.70 | 1.56 | |||||||||||||||||||||||||
| Class C (EQICX) | 5-31-2012 | -7.60 | 2.08 | 2.57 | -6.60 | * | 2.08 | 2.57 | 2.45 | 2.31 | ||||||||||||||||||||||||
| Class R (EQIHX)3 | 9-30-2015 | – | – | – | -5.82 | 2.68 | 3.12 | 1.95 | 1.81 | |||||||||||||||||||||||||
| Class R6 (EQIRX)4 | 9-30-2015 | – | – | – | -5.51 | * | 3.33 | 3.78 | 1.27 | 1.18 | ||||||||||||||||||||||||
| Administrator Class (EQIDX) | 5-31-2012 | – | – | – | -5.80 | * | 3.04 | 3.54 | 1.62 | 1.46 | ||||||||||||||||||||||||
| Institutional Class (EQIIX) | 5-31-2012 | – | – | – | -5.54 | * | 3.25 | 3.74 | 1.37 | 1.23 | ||||||||||||||||||||||||
| MSCI EM Index (Net)5 | – | – | – | – | 8.25 | 7.92 | 4.86 | ** | – | – | ||||||||||||||||||||||||
| MSCI EM High Dividend Yield Index (Net)6 | – | – | – | – | -15.17 | 1.96 | 0.42 | ** | – | – | ||||||||||||||||||||||||
| * | Total return differs from the return in the Financial Highlights in this report. The total return presented is calculated based on the NAV at which the shareholder transactions were processed. The NAV and total return presented in the Financial Highlights reflects certain adjustments made to the net assets of the Fund that are necessary under U.S. generally accepted accounting principles. |
| ** | Return is based on the inception date of the oldest Fund class. |
Figures quoted represent past performance, which is no guarantee of future results, and do not reflect taxes that a shareholder may pay on an investment in a fund. Investment return and principal value of an investment will fluctuate so that an investor’s shares, when redeemed, may be worth more or less than their original cost. Performance shown without sales charges would be lower if sales charges were reflected. Current performance may be lower or higher than the performance data quoted, which assumes the reinvestment of dividends and capital gains. Current month-end performance is available on the Fund’s website, wfam.com.
Index returns do not include transaction costs associated with buying and selling securities, any mutual fund fees or expenses, or any taxes. It is not possible to invest directly in an index.
For Class A shares, the maximum front-end sales charge is 5.75%. For Class C shares, the maximum contingent deferred sales charge is 1.00%. Performance including a contingent deferred sales charge assumes the sales charge for the corresponding time period. Class R, Class R6, Administrator Class, and Institutional Class shares are sold without a front-end sales charge or contingent deferred sales charge.
Stock values fluctuate in response to the activities of individual companies and general market and economic conditions. Foreign investments are especially volatile and can rise or fall dramatically due to differences in the political and economic conditions of the host country. These risks are generally intensified in emerging markets. The use of derivatives may reduce returns and/or increase volatility. Certain investment strategies tend to increase the total risk of investment (relative to the broader market). The Fund is exposed to smaller-company securities risk. Consult the Fund’s prospectus for additional information on these and other risks.
Please see footnotes on page 7.
6 | Wells Fargo Emerging Markets Equity Income Fund
Table of Contents
Performance highlights (unaudited)
| Growth of $10,000 investment as of October 31, 20207 |
|
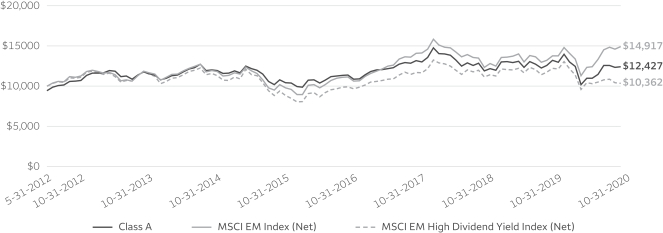
| 1 | Reflects the expense ratios as stated in the most recent prospectuses, which include the impact of 0.01% in acquired fund fees and expenses. The expense ratios shown are subject to change and may differ from the annualized expense ratios shown in the financial highlights of this report, which do not include acquired fund fees and expenses. |
| 2 | The manager has contractually committed through February 28, 2021, to waive fees and/or reimburse expenses to the extent necessary to cap total annual fund operating expenses after fee waivers at 1.55% for Class A, 2.30% for Class C, 1.80% for Class R, 1.17% for Class R6, 1.45% for Administrator Class, and 1.22% for Institutional Class. Brokerage commissions, stamp duty fees, interest, taxes, acquired fund fees and expenses (if any), and extraordinary expenses are excluded from the expense caps. Prior to or after the commitment expiration date, the caps may be increased or the commitment to maintain the caps may be terminated only with the approval of the Board of Trustees. Without these caps, the Fund’s returns would have been lower. The expense ratio paid by an investor is the net expense ratio (the total annual fund operating expenses after fee waivers) as stated in the prospectuses. |
| 3 | Historical performance shown for the Class R shares prior to their inception reflects the performance of the Administrator Class shares, adjusted to reflect the higher expenses applicable to the Class R shares. |
| 4 | Historical performance shown for the Class R6 shares prior to their inception reflects the performance of the Institutional Class shares, and includes the higher expenses applicable to Institutional Class shares. If these expenses had not been included, returns for Class R6 shares would be higher. |
| 5 | The Morgan Stanley Capital International (MSCI) Emerging Markets (EM) Index (Net) is a free-float-adjusted market-capitalization-weighted index that is designed to measure the equity market performance of emerging markets. Source: MSCI. MSCI makes no express or implied warranties or representations and shall have no liability whatsoever with respect to any MSCI data contained herein. The MSCI data may not be further redistributed or used as a basis for other indices or any securities or financial products. This report is not approved, reviewed, or produced by MSCI. You cannot invest directly in an index. |
| 6 | The MSCI EM High Dividend Yield Index (Net) is based on the MSCI EM Index, its parent index, and includes large and mid-cap stocks. The index is designed to reflect the performance of equities in the parent index (excluding REITs) with higher dividend income and quality characteristics than average dividend yields that are both sustainable and persistent. The index also applies quality screens and reviews 12-month past performance to omit stocks with potentially deteriorating fundamentals that could force them to cut or reduce dividends. You cannot invest directly in an index. |
| 7 | The chart compares the performance of Class A shares since its inception with the MSCI EM Index (Net) and the MSCI EM High Dividend Yield Index (Net). The chart assumes a hypothetical investment of $10,000 in Class A shares and reflects all operating expenses and assumes the maximum initial sales charge of 5.75%. |
| 8 | The MSCI EM Growth Index (Net) captures large and mid-cap securities exhibiting overall growth style characteristics. The growth investment style characteristics for index construction are defined using five variables: long-term forward Earnings Per Share (EPS) growth rate, short-term forward EPS growth rate, current internal growth rate and long-term historical EPS growth trend and long-term historical sales per share growth trend. You cannot invest directly in an index. |
| 9 | The MSCI EM Value Index (Net) captures large and mid-cap securities exhibiting overall value characteristics across emerging markets. The value investment style characteristics for index construction are defined using three variables: book value to price, 12-month forward earnings to price, and dividend yield. The index targets 50% coverage of the free float-adjusted market capitalization of the MSCI EM Index. You cannot invest directly in an index. |
| 10 | The ten largest holdings, excluding cash, cash equivalents and any money market funds, are calculated based on the value of the investments divided by total net assets of the Fund. Holdings are subject to change and may have changed since the date specified. |
| 11 | Amounts are calculated based on the total long-term investments of the Fund. These amounts are subject to change and may have changed since the date specified. |
Wells Fargo Emerging Markets Equity Income Fund | 7
Table of Contents
Performance highlights (unaudited)
MANAGER’S DISCUSSION
Fund highlights
| ∎ | The Fund underperformed the MSCI EM Index (Net) while outperforming the MSCI EM High Dividend Yield Index (Net) for the 12-month period that ended October 31, 2020. |
| ∎ | Stock selection within materials and real estate as well as an overweight position in information technology (IT) added value but were offset by unfavorable stock selection and underweight positions within the communication services and consumer discretionary sectors. |
| ∎ | Stock selection within Taiwan, the United Arab Emirates, and Russia drove positive performance during the period but was offset by positioning in China, Korea, and Mexico. |
The MSCI EM Index (Net) advanced 8.3% during a volatile 12-month period for emerging markets that saw the signing of a Phase One trade agreement between the U.S. and China. Volatility peaked in late winter with a 34% decline in the index as COVID-19 was declared a global health emergency, and an oil price war was initiated before the price of crude oil rebounded 48% through the end of October as economies reopened from lockdown. In this environment, country returns varied substantially, illustrated by a 36% return in Chinese equities versus a 44% decline in Greece. Sector returns also were divergent, with consumer discretionary stocks returning 48% versus energy stocks, which declined 30%. During the year, the MSCI EM Growth Index (Net)8 returned 26% versus -9% and -15% for the MSCI EM Value Index (Net)9 and MSCI EM High Dividend Yield Index (Net), respectively. Overall earnings declined 27% year over year for companies in the MSCI EM Index (Net), but that was offset by a rerating of the asset class and by currency gains versus the U.S. dollar.
During the period, the Fund’s largest shifts included an increase in consumer discretionary stock holdings and a decrease in financials. Within consumer discretionary, the team added new names, including Naspers (a South African media conglomerate), Kia Motors (a South Korean auto manufacturer), and Gree Electric Appliances (a leading air conditioner and home appliance manufacturer in China), areas where recovery is on track and spending remains relatively stable.
The team reduced its position in banks, including exits from Industrial and Commercial Bank of China (the largest state-owned enterprise bank in China), CIMB (the second-largest banking group in Malaysia by assets), and Grupo Bancolombia (the largest bank in Colombia) given concerns on asset quality, margins, and growth.
| Ten largest holdings (%) as of October 31, 202010 | ||||
Taiwan Semiconductor Manufacturing Company Limited | 7.73 | |||
Samsung Electronics Company Limited | 4.58 | |||
Midea Group Company Limited Class A | 2.53 | |||
Ping An Insurance Group Company Class H | 2.51 | |||
China Construction Bank Class H | 1.89 | |||
China Mobile Limited | 1.87 | |||
Infosys Limited | 1.78 | |||
Naspers Limited | 1.76 | |||
Samsung Electronics Company Limited | 1.66 | |||
Vale SA | 1.53 | |||
| Sector allocation as of October 31, 202011 |
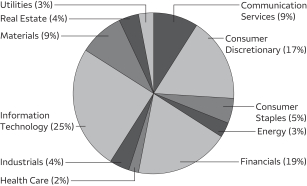 |
Please see footnotes on page 7.
8 | Wells Fargo Emerging Markets Equity Income Fund
Table of Contents
Performance highlights (unaudited)
| Geographic allocation as of October 31, 202011 |
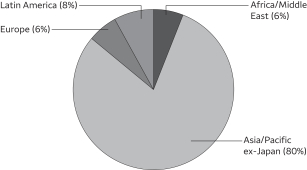 |
Communication services and consumer discretionary detracted from relative returns, primarily in China.
Within the communication services and consumer discretionary sectors, stock selection detracted from performance, led by securities not held in the portfolio, including Alibaba and Tencent, as they don’t pay a high enough dividend to qualify for inclusion in the portfolio and were the two leading contributors to index returns. Among names held in the portfolio, China Mobile, the world’s largest mobile operator, underperformed as investors continue to favor high-growth stocks over higher-dividend defensive
stocks as well as an overhang from 5G capital expenditures. We continue to hold the name as concerns are largely reflected in the valuations, industry competition is easing, and the company is exceeding target for new 5G customers.
On the other hand, positioning in the materials sector and Taiwan contributed to relative performance.
Materials underperformed, resulting in positive allocation effects given an average underweight, as did stock selection in names including Wanhua Chemical Group and Gold Fields. Wanhua Chemical, the largest methylene diphenyl isocyanate (MDI) producer in China with approximately 65% market share, was the leading contributor in the sector. MDI is primarily used in the production of rigid polyurethane foam, which is used in freezers and refrigerators. The company performed well as MDI prices rebounded from a recent trough in April and supply remains constrained with approximately 33% of capacity offline. Gold Fields, a South Africa–based gold miner with globally diversified operations, outperformed the overall market as the price of gold increased 26% during the period and reached an all-time high of $2,063 per ounce in early August. Taiwan Semiconductor Manufacturing Company (TSMC), the world’s largest semiconductor foundry, was the leading contributor in the portfolio, resulting in positive attribution in Taiwan. The company performed well as it reported strong second-quarter results driven by High Performance Computing (HPC)–related product launches and continued 5G infrastructure deployment. TSMC also benefited from the possibility that Intel may farm out production, breaking from a tradition of in-house manufacturing.
Outlook
We expect North Asia to continue to demonstrate the best containment of COVID-19 and near normalization of activity, supporting economic growth. China will focus on domestic self-sufficiency, technological innovation, and environmental protection under the 14th Five-Year Plan and will strive to achieve moderately developed country status by 2035. China’s path forward may be less supportive of emerging market commodity exporters as compared with past cycles of investment-driven growth.
Neighboring Taiwan and South Korea will similarly focus on advanced technology and high-quality “digital and green” development. South and Southeast Asia will expand manufacturing as the factory to the world. India in particular is expected to attract foreign direct investment. Mexico theoretically stands to replace Asia in key supply chain roles, though domestic and foreign investment confidence struggles to turn around under the current president’s policies. Brazil remains our preferred Latin American market with a medium-term reform story. Votes on reform may very likely be pushed out to 2021, but we have regained confidence in Brazil’s fiscal discipline and commitment to spending cap. We expect that smaller Andean countries will benefit from recovery in select commodity prices, while oil prices are unlikely to rise much above the mid-$40s on sluggish demand and looming exports from Libya. Performance of oil exporters in Emerging Europe, the Middle East, and Africa likewise will be capped, as well as countries with fiscal strains.
Russia faces additional uncertainty from the Azerbaijan and Armenia conflict on the heels of the Navalny poisoning and protests in Belarus, further pressuring the ruble. Following strong performance in the second and third quarters, we believe emerging markets are likely to consolidate and pull back.
Please see footnotes on page 7.
Wells Fargo Emerging Markets Equity Income Fund | 9
Table of Contents
Performance highlights (unaudited)
We expect some rotation to value and deep cyclicals from growth/momentum. We see opportunities in the reflation trade and for sustainable dividend yield to return to favor amid moderation in near-term equity gains and the worst of dividend cuts behind us. We believe the best strategy is a barbell approach with a mix of structural growth with strong balance sheet and high-quality, sustainable earnings coupled with deep value/cyclicals, including financials, which may benefit from more signs of economic stabilization and a rebound. We look to a vaccine (possibly from emerging markets) to declare successful containment of COVID-19 risks and for activity to recover to pre-pandemic levels in 2021+.
10 | Wells Fargo Emerging Markets Equity Income Fund
Table of Contents
As a shareholder of the Fund, you incur two types of costs: (1) transaction costs, including sales charges (loads) on purchase payments and contingent deferred sales charges (if any) on redemptions and (2) ongoing costs, including management fees, distribution (12b-1) and/or shareholder servicing fees, and other Fund expenses. This example is intended to help you understand your ongoing costs (in dollars) of investing in the Fund and to compare these costs with the ongoing costs of investing in other mutual funds.
The example is based on an investment of $1,000 invested at the beginning of the six-month period and held for the entire period from May 1, 2020 to October 31, 2020.
Actual expenses
The “Actual” line of the table below provides information about actual account values and actual expenses. You may use the information in this line, together with the amount you invested, to estimate the expenses that you paid over the period. Simply divide your account value by $1,000 (for example, an $8,600 account value divided by $1,000 = 8.6), then multiply the result by the number in the “Actual” line under the heading entitled “Expenses paid during period” for your applicable class of shares to estimate the expenses you paid on your account during this period.
Hypothetical example for comparison purposes
The “Hypothetical” line of the table below provides information about hypothetical account values and hypothetical expenses based on the Fund’s actual expense ratio and an assumed rate of return of 5% per year before expenses, which is not the Fund’s actual return. The hypothetical account values and expenses may not be used to estimate the actual ending account balance or expenses you paid for the period. You may use this information to compare the ongoing costs of investing in the Fund and other funds. To do so, compare this 5% hypothetical example with the 5% hypothetical examples that appear in the shareholder reports of the other funds.
Please note that the expenses shown in the table are meant to highlight your ongoing costs only and do not reflect any transactional costs, such as sales charges (loads) and contingent deferred sales charges. Therefore, the “Hypothetical” line of the table is useful in comparing ongoing costs only and will not help you determine the relative total costs of owning different funds. In addition, if these transactional costs were included, your costs would have been higher.
| Beginning account value 5-1-2020 | Ending account value 10-31-2020 | Expenses paid during the period1 | Annualized net expense ratio | |||||||||||||
Class A | ||||||||||||||||
Actual | $ | 1,000.00 | $ | 1,132.02 | $ | 8.20 | 1.53 | % | ||||||||
Hypothetical (5% return before expenses) | $ | 1,000.00 | $ | 1,017.44 | $ | 7.76 | 1.53 | % | ||||||||
Class C | ||||||||||||||||
Actual | $ | 1,000.00 | $ | 1,127.79 | $ | 12.30 | 2.30 | % | ||||||||
Hypothetical (5% return before expenses) | $ | 1,000.00 | $ | 1,013.57 | $ | 11.64 | 2.30 | % | ||||||||
Class R | ||||||||||||||||
Actual | $ | 1,000.00 | $ | 1,133.98 | $ | 9.44 | 1.76 | % | ||||||||
Hypothetical (5% return before expenses) | $ | 1,000.00 | $ | 1,016.29 | $ | 8.92 | 1.76 | % | ||||||||
Class R6 | ||||||||||||||||
Actual | $ | 1,000.00 | $ | 1,134.06 | $ | 6.12 | 1.14 | % | ||||||||
Hypothetical (5% return before expenses) | $ | 1,000.00 | $ | 1,019.41 | $ | 5.79 | 1.14 | % | ||||||||
Administrator Class | ||||||||||||||||
Actual | $ | 1,000.00 | $ | 1,132.70 | $ | 7.77 | 1.45 | % | ||||||||
Hypothetical (5% return before expenses) | $ | 1,000.00 | $ | 1,017.85 | $ | 7.35 | 1.45 | % | ||||||||
Institutional Class | ||||||||||||||||
Actual | $ | 1,000.00 | $ | 1,133.96 | $ | 6.54 | 1.22 | % | ||||||||
Hypothetical (5% return before expenses) | $ | 1,000.00 | $ | 1,019.00 | $ | 6.19 | 1.22 | % | ||||||||
| 1 | Expenses paid is equal to the annualized net expense ratio of each class multiplied by the average account value over the period, multiplied by the number of days in the most recent fiscal half-year divided by the number of days in the fiscal year (to reflect the one-half-year period). |
Wells Fargo Emerging Markets Equity Income Fund | 11
Table of Contents
Portfolio of investments—October 31, 2020
| Shares | Value | |||||||||||||||
| Common Stocks: 93.59% |
| |||||||||||||||
| Brazil: 4.30% | ||||||||||||||||
B3 Brasil Bolsa Balcao SA (Financials, Capital Markets) | 315,200 | $ | 2,804,305 | |||||||||||||
Banco BTG Pactual SA (Financials, Capital Markets) | 263,043 | 3,323,594 | ||||||||||||||
Cury Construtora e Incorporadora SA (Consumer Discretionary, Household Durables) † | 1,173,195 | 2,206,149 | ||||||||||||||
Petrobras Distribuidora SA (Consumer Discretionary, Specialty Retail) | 590,400 | 1,973,505 | ||||||||||||||
Vale SA (Materials, Metals & Mining) | 540,674 | 5,705,489 | ||||||||||||||
| 16,013,042 | ||||||||||||||||
|
| |||||||||||||||
| China: 34.17% | ||||||||||||||||
China Communications Services Corporation Limited Class H (Industrials, Construction & Engineering) | 2,728,000 | 1,589,486 | ||||||||||||||
China Construction Bank Class H (Financials, Banks) | 10,235,000 | 7,053,072 | ||||||||||||||
China Longyuan Power Group Corporation Class H (Utilities, Independent Power & Renewable Electricity Producers) | 2,549,000 | 1,747,110 | ||||||||||||||
China Merchants Bank Company Limited Class H (Financials, Banks) | 741,500 | 3,862,424 | ||||||||||||||
China Mobile Limited (Communication Services, Wireless Telecommunication Services) | 1,142,000 | 6,985,088 | ||||||||||||||
China Resources Land Limited (Real Estate, Real Estate Management & Development) | 1,272,000 | 5,202,054 | ||||||||||||||
China Telecom Corporation Limited Class H (Communication Services, Diversified Telecommunication Services) | 9,034,000 | 2,835,857 | ||||||||||||||
China Yongda Automobile Service Holding Company (Consumer Discretionary, Specialty Retail) | 2,941,500 | 4,191,186 | ||||||||||||||
CITIC Securities Company Limited Class H (Financials, Capital Markets) | 2,035,500 | 4,413,370 | ||||||||||||||
ENN Energy Holdings Limited (Utilities, Gas Utilities) | 354,500 | 4,486,588 | ||||||||||||||
Geely Automobile Holdings Limited (Consumer Discretionary, Automobiles) | 1,678,000 | 3,448,048 | ||||||||||||||
Gree Electric Appliances Incorporated Class A (Consumer Discretionary, Household Durables) | 566,440 | 4,965,986 | ||||||||||||||
Hengan International Group Company Limited (Consumer Staples, Personal Products) | 227,000 | 1,583,451 | ||||||||||||||
Inner Mongolia Yili Industrial Group Company Limited Class A (Consumer Staples, Food Products) | 627,778 | 3,730,611 | ||||||||||||||
Kunlun Energy Company Limited (Utilities, Gas Utilities) | 4,812,000 | 3,115,305 | ||||||||||||||
Lenovo Group Limited (Information Technology, Technology Hardware, Storage & Peripherals) | 5,662,000 | 3,555,020 | ||||||||||||||
Lomon Billions Group Company Limited Class A (Materials, Chemicals) | 933,375 | 3,456,789 | ||||||||||||||
Midea Group Company Limited Class A (Consumer Discretionary, Household Durables) | 808,755 | 9,438,335 | ||||||||||||||
Minth Group Limited (Consumer Discretionary, Auto Components) | 630,000 | 2,606,938 | ||||||||||||||
Nari Technology Company Limited (Industrials, Electrical Equipment) | 1,247,168 | 3,875,698 | ||||||||||||||
NetEase Incorporated (Communication Services, Entertainment) | 272,350 | 4,763,691 | ||||||||||||||
Nine Dragons Paper Holdings Limited (Materials, Paper & Forest Products) | 2,678,000 | 3,572,005 | ||||||||||||||
Ping An Insurance Group Company Class H (Financials, Insurance) | 904,000 | 9,347,065 | ||||||||||||||
Sands China Limited (Consumer Discretionary, Hotels, Restaurants & Leisure) | 427,600 | 1,500,705 | ||||||||||||||
Shimao Property Holding Limited (Real Estate, Real Estate Management & Development) | 936,500 | 3,317,376 | ||||||||||||||
Sinopharm Group Company Limited Class H (Health Care, Health Care Providers & Services) | 1,532,400 | 3,520,601 | ||||||||||||||
Suofeiya Home Collection Company Limited Class A (Consumer Discretionary, Household Durables) | 595,991 | 2,516,010 | ||||||||||||||
Tingyi Holding Corporation (Consumer Staples, Food Products) | 1,850,000 | 3,385,354 | ||||||||||||||
Topsports International Holdings Limited (Consumer Discretionary, Textiles, Apparel & Luxury Goods) 144A | 2,874,000 | 3,940,802 | ||||||||||||||
Wanhua Chemical Group Company Limited Class A (Materials, Chemicals) | 181,379 | 2,132,270 | ||||||||||||||
Weichai Power Company Limited Class H (Industrials, Machinery) | 1,754,000 | 3,326,080 | ||||||||||||||
Xinjiang Goldwind Science & Technology Company Limited H Shares (Industrials, Electrical Equipment) | 1,539,000 | 2,028,753 | ||||||||||||||
Yonghui Superstores Company Limited Class A (Consumer Staples, Food & Staples Retailing) | 1,538,157 | 1,796,773 | ||||||||||||||
| 127,289,901 | ||||||||||||||||
|
| |||||||||||||||
| Greece: 0.47% | ||||||||||||||||
Hellenic Telecommunications Organization SA (Communication Services, Diversified Telecommunication Services) | 132,881 | 1,762,229 | ||||||||||||||
|
| |||||||||||||||
| Hong Kong: 3.87% | ||||||||||||||||
ASM Pacific Technology (Information Technology, Semiconductors & Semiconductor Equipment) | 206,200 | 2,079,385 | ||||||||||||||
China Merchants Port Holdings Company Limited (Industrials, Transportation Infrastructure) | 1,810,000 | 1,923,985 | ||||||||||||||
Chow Tai Fook Jewellery Company Limited (Consumer Discretionary, Specialty Retail) | 2,735,600 | 3,496,235 | ||||||||||||||
The accompanying notes are an integral part of these financial statements.
12 | Wells Fargo Emerging Markets Equity Income Fund
Table of Contents
Portfolio of investments—October 31, 2020
| Shares | Value | |||||||||||||||
| Hong Kong (continued) | ||||||||||||||||
CNOOC Limited (Energy, Oil, Gas & Consumable Fuels) | 3,404,000 | $ | 3,114,509 | |||||||||||||
Hong Kong Exchanges & Clearing Limited (Financials, Capital Markets) | 79,100 | 3,790,370 | ||||||||||||||
| 14,404,484 | ||||||||||||||||
|
| |||||||||||||||
| India: 8.66% | ||||||||||||||||
Bharat Petroleum Corporation Limited (Energy, Oil, Gas & Consumable Fuels) | 775,724 | 3,708,361 | ||||||||||||||
Bharti Infratel Limited (Communication Services, Diversified Telecommunication Services) | 1,212,314 | 3,033,386 | ||||||||||||||
Embassy Office Parks REIT (Real Estate, Equity REITs) | 766,200 | 3,557,850 | ||||||||||||||
Hero Motorcorp Limited (Consumer Discretionary, Automobiles) | 49,138 | 1,853,858 | ||||||||||||||
Hindustan Petroleum Corporation Limited (Energy, Oil, Gas & Consumable Fuels) | 866,521 | 2,194,918 | ||||||||||||||
Infosys Limited (Information Technology, IT Services) | 462,820 | 6,630,888 | ||||||||||||||
Mahanagar Gas Limited (Utilities, Gas Utilities) | 243,173 | 2,673,270 | ||||||||||||||
Manappuram Finance Limited (Financials, Consumer Finance) | 2,432,655 | 5,096,594 | ||||||||||||||
Tech Mahindra Limited (Information Technology, IT Services) | 320,122 | 3,524,871 | ||||||||||||||
| 32,273,996 | ||||||||||||||||
|
| |||||||||||||||
| Indonesia: 1.43% | ||||||||||||||||
PT Bank Rakyat Indonesia Tbk (Financials, Banks) | 12,736,100 | 2,883,095 | ||||||||||||||
PT Telekomunikasi Indonesia Persero Tbk (Communication Services, Diversified Telecommunication Services) | 13,796,500 | 2,442,806 | ||||||||||||||
| 5,325,901 | ||||||||||||||||
|
| |||||||||||||||
| Malaysia: 1.28% | ||||||||||||||||
Bursa Malaysia Bhd (Financials, Capital Markets) | 965,400 | 1,871,668 | ||||||||||||||
Top Glove Corporation Bhd (Health Care, Health Care Equipment & Supplies) | 1,412,400 | 2,913,105 | ||||||||||||||
| 4,784,773 | ||||||||||||||||
|
| |||||||||||||||
| Mexico: 1.10% | ||||||||||||||||
America Movil SAB de CV ADR (Communication Services, Wireless Telecommunication Services) | 149,997 | 1,787,964 | ||||||||||||||
Kimberly-Clark de Mexico SAB de CV Class A (Consumer Staples, Household Products) | 108,475 | 162,011 | ||||||||||||||
Walmart de Mexico SAB de CV (Consumer Staples, Food & Staples Retailing) | 885,791 | 2,144,791 | ||||||||||||||
| 4,094,766 | ||||||||||||||||
|
| |||||||||||||||
| Poland: 0.56% | ||||||||||||||||
PKO Bank Polski SA (Financials, Banks) † | 431,119 | 2,068,164 | ||||||||||||||
|
| |||||||||||||||
| Russia: 3.63% | ||||||||||||||||
Detsky Mir PJSC (Consumer Discretionary, Multiline Retail) | 1,295,540 | 1,784,501 | ||||||||||||||
LUKOIL PJSC ADR (Energy, Oil, Gas & Consumable Fuels) | 28,801 | 1,473,550 | ||||||||||||||
Magnit PJSC (Consumer Staples, Food & Staples Retailing) | 30,675 | 1,824,744 | ||||||||||||||
MMC Norilsk Nickel PJSC (Materials, Metals & Mining) | 10,703 | 2,550,096 | ||||||||||||||
Mobile TeleSystems PJSC ADR (Communication Services, Wireless Telecommunication Services) | 311,972 | 2,439,621 | ||||||||||||||
Moscow Exchange MICEX-RTS PJSC (Financials, Capital Markets) | 975,790 | 1,652,840 | ||||||||||||||
Sberbank PJSC ADR (Financials, Banks) | 180,003 | 1,818,287 | ||||||||||||||
| 13,543,639 | ||||||||||||||||
|
| |||||||||||||||
| Saudi Arabia: 1.08% | ||||||||||||||||
Jarir Marketing Company (Consumer Discretionary, Specialty Retail) | 43,776 | 2,021,706 | ||||||||||||||
National Commercial Bank (Financials, Banks) | 194,197 | 2,016,279 | ||||||||||||||
| 4,037,985 | ||||||||||||||||
|
| |||||||||||||||
| Singapore: 0.69% | ||||||||||||||||
BOC Aviation Limited (Industrials, Trading Companies & Distributors) 144A | 414,500 | 2,566,644 | ||||||||||||||
|
| |||||||||||||||
The accompanying notes are an integral part of these financial statements.
Wells Fargo Emerging Markets Equity Income Fund | 13
Table of Contents
Portfolio of investments—October 31, 2020
| Shares | Value | |||||||||||||||
| South Africa: 3.70% | ||||||||||||||||
Gold Fields Limited ADR (Materials, Metals & Mining) | 230,410 | $ | 2,518,381 | |||||||||||||
MTN Group Limited (Communication Services, Wireless Telecommunication Services) | 545,515 | 1,947,767 | ||||||||||||||
Naspers Limited (Consumer Discretionary, Internet & Direct Marketing Retail) † | 33,650 | 6,569,403 | ||||||||||||||
Standard Bank Group Limited (Financials, Banks) | 420,159 | 2,747,374 | ||||||||||||||
| 13,782,925 | ||||||||||||||||
|
| |||||||||||||||
| South Korea: 11.18% | ||||||||||||||||
KB Financial Group Incorporated (Financials, Banks) | 91,465 | 3,271,684 | ||||||||||||||
Kia Motors Corporation (Consumer Discretionary, Automobiles) | 126,039 | 5,652,740 | ||||||||||||||
POSCO (Materials, Metals & Mining) | 30,161 | 5,567,846 | ||||||||||||||
Samsung Electronics Company Limited (Information Technology, Technology Hardware, Storage & Peripherals) | 339,230 | 17,051,602 | ||||||||||||||
Samsung Fire & Marine Insurance (Financials, Insurance) | 18,373 | 2,905,065 | ||||||||||||||
SK Hynix Incorporated (Information Technology, Semiconductors & Semiconductor Equipment) | 58,011 | 4,115,466 | ||||||||||||||
SK Telecom Company Limited (Communication Services, Wireless Telecommunication Services) | 16,416 | 3,112,944 | ||||||||||||||
| 41,677,347 | ||||||||||||||||
|
| |||||||||||||||
| Taiwan: 13.36% | ||||||||||||||||
Advantech Company Limited (Information Technology, Technology Hardware, Storage & Peripherals) | 303,000 | 3,067,528 | ||||||||||||||
ASE Technology Holding Company Limited (Information Technology, Semiconductors & Semiconductor Equipment) | 928,350 | 2,083,742 | ||||||||||||||
Delta Electronics Incorporated (Information Technology, Electronic Equipment, Instruments & Components) | 299,000 | 1,989,372 | ||||||||||||||
Giant Manufacturing Company Limited (Consumer Discretionary, Leisure Products) | 211,000 | 2,084,441 | ||||||||||||||
Hon Hai Precision Industry Company Limited (Information Technology, Electronic Equipment, Instruments & Components) | 1,486,704 | 4,032,135 | ||||||||||||||
Mediatek Incorporated (Information Technology, Semiconductors & Semiconductor Equipment) | 167,000 | 3,969,633 | ||||||||||||||
Novatek Microelectronics Corporation Limited (Information Technology, Semiconductors & Semiconductor Equipment) | 195,000 | 1,822,301 | ||||||||||||||
Realtek Semiconductor Corporation (Information Technology, Semiconductors & Semiconductor Equipment) | 155,000 | 1,930,902 | ||||||||||||||
Taiwan Semiconductor Manufacturing Company Limited (Information Technology, Semiconductors & Semiconductor Equipment) | 1,905,000 | 28,822,028 | ||||||||||||||
| 49,802,082 | ||||||||||||||||
|
| |||||||||||||||
| Thailand: 1.70% | ||||||||||||||||
Advanced Info Service PCL (Communication Services, Wireless Telecommunication Services) | 331,700 | 1,842,878 | ||||||||||||||
Bangkok Commercial Asset Management PCL (Financials, Capital Markets) | 2,538,200 | 1,645,035 | ||||||||||||||
Thai Beverage plc (Consumer Staples, Beverages) | 6,693,800 | 2,846,655 | ||||||||||||||
| 6,334,568 | ||||||||||||||||
|
| |||||||||||||||
| United Arab Emirates: 0.98% | ||||||||||||||||
Aldar Properties PJSC (Real Estate, Real Estate Management & Development) | 4,922,976 | 3,635,225 | ||||||||||||||
|
| |||||||||||||||
| United Kingdom: 0.79% | ||||||||||||||||
Polymetal International plc (Materials, Metals & Mining) | 139,248 | 2,959,646 | ||||||||||||||
|
| |||||||||||||||
| United States: 0.64% | ||||||||||||||||
Southern Copper Corporation (Materials, Metals & Mining) | 45,366 | 2,374,456 | ||||||||||||||
|
| |||||||||||||||
Total Common Stocks (Cost $294,093,059) | 348,731,773 | |||||||||||||||
|
| |||||||||||||||
The accompanying notes are an integral part of these financial statements.
14 | Wells Fargo Emerging Markets Equity Income Fund
Table of Contents
Portfolio of investments—October 31, 2020
| Dividend yield | Shares | Value | ||||||||||||||
| Preferred Stocks: 3.24% | ||||||||||||||||
| Brazil: 1.58% | ||||||||||||||||
Banco Bradesco SA (Financials, Banks) | 3.82 | % | 497,718 | $ | 1,748,707 | |||||||||||
Banco BTG Pactual SA (Financials, Capital Markets) | 0.89 | 70,904 | 207,845 | |||||||||||||
Itaúsa SA (Financials, Banks) | 5.87 | 1,355,219 | 2,146,924 | |||||||||||||
Petroleo Brasil SP ADR (Energy, Oil, Gas & Consumable Fuels) | 3.30 | 271,702 | 1,795,950 | |||||||||||||
| 5,899,426 | ||||||||||||||||
|
| |||||||||||||||
| South Korea: 1.66% | ||||||||||||||||
Samsung Electronics Company Limited (Information Technology, Technology Hardware, Storage & Peripherals) | 3.68 | 138,805 | 6,174,725 | |||||||||||||
|
| |||||||||||||||
Total Preferred Stocks (Cost $11,280,512) |
| 12,074,151 | ||||||||||||||
|
| |||||||||||||||
| Yield | ||||||||||||||||
| Short-Term Investments: 3.62% | ||||||||||||||||
| Investment Companies: 3.62% | ||||||||||||||||
Wells Fargo Government Money Market Fund Select Class (l)(u) | 0.03 | 13,498,167 | 13,498,167 | |||||||||||||
|
| |||||||||||||||
Total Short-Term Investments (Cost $13,498,167) | 13,498,167 | |||||||||||||||
|
| |||||||||||||||
| Total investments in securities (Cost $318,871,738) | 100.45 | % | 374,304,091 | |||||
Other assets and liabilities, net | (0.45 | ) | (1,662,298 | ) | ||||
|
|
|
| |||||
| Total net assets | 100.00 | % | $ | 372,641,793 | ||||
|
|
|
| |||||
| † | Non-income-earning security |
| 144A | The security may be resold in transactions exempt from registration, normally to qualified institutional buyers, pursuant to Rule 144A under the Securities Act of 1933. |
| (l) | The issuer of the security is an affiliated person of the Fund as defined in the Investment Company Act of 1940. |
| (u) | The rate represents the 7-day annualized yield at period end. |
Abbreviations:
| ADR | American depositary receipt |
| REIT | Real estate investment trust |
Investments in Affiliates
An affiliated investment is an investment in which the Fund owns at least 5% of the outstanding voting shares of the issuer or as a result of other relationships, such as the Fund and the issuer having the same investment manager. Transactions with issuers that were either affiliates of the Fund at the beginning of the period or the end of the period were as follows:
| Value, beginning of period | Purchases | Sales proceeds | Net realized gains (losses) | Net change in unrealized gains (losses) | Value, end of period | % of net assets | Shares, end of period | Income from affiliated securities | ||||||||||||||||||||||||||||
| Short-Term Investments | ||||||||||||||||||||||||||||||||||||
Investment Companies | ||||||||||||||||||||||||||||||||||||
Wells Fargo Government Money Market Fund Select Class | $ | 11,617,435 | $ | 373,988,648 | $ | (372,107,916 | ) | $ | 0 | $ | 0 | $ | 13,498,167 | 3.62 | % | 13,498,167 | $ | 119,118 | ||||||||||||||||||
The accompanying notes are an integral part of these financial statements.
Wells Fargo Emerging Markets Equity Income Fund | 15
Table of Contents
Statement of assets and liabilities—October 31, 2020
Assets | ||||
Investments in unaffiliated securities, at value (cost $305,373,571) | $ | 360,805,924 | ||
Investments in affiliated securities, at value (cost $13,498,167) | 13,498,167 | |||
Cash | 62,163 | |||
Foreign currency, at value (cost $2,084,023) | 2,079,607 | |||
Receivable for investments sold | 3,236,761 | |||
Receivable for Fund shares sold | 206,853 | |||
Receivable for dividends | 626,942 | |||
Prepaid expenses and other assets | 19,180 | |||
|
| |||
Total assets | 380,535,597 | |||
|
| |||
Liabilities | ||||
Payable for investments purchased | 4,973,989 | |||
Payable for Fund shares redeemed | 1,460,011 | |||
Management fee payable | 957,677 | |||
Contingent tax payable | 272,786 | |||
Administration fees payable | 43,867 | |||
Distribution fees payable | 5,588 | |||
Trustees’ fees and expenses payable | 2,810 | |||
Accrued expenses and other liabilities | 177,076 | |||
|
| |||
Total liabilities | 7,893,804 | |||
|
| |||
Total net assets | $ | 372,641,793 | ||
|
| |||
Net assets consist of | ||||
Paid-in capital | $ | 412,067,440 | ||
Total distributable loss | (39,425,647 | ) | ||
|
| |||
Total net assets | $ | 372,641,793 | ||
|
| |||
Computation of net asset value and offering price per share | ||||
Net assets – Class A | $ | 83,889,283 | ||
Shares outstanding – Class A1 | 8,123,441 | |||
Net asset value per share – Class A | $10.33 | |||
Maximum offering price per share – Class A2 | $10.96 | |||
Net assets – Class C | $ | 8,138,470 | ||
Shares outstanding – Class C1 | 792,979 | |||
Net asset value per share – Class C | $10.26 | |||
Net assets – Class R | $ | 98,491 | ||
Shares outstanding – Class R1 | 9,507 | |||
Net asset value per share – Class R | $10.36 | |||
Net assets – Class R6 | $ | 73,968,774 | ||
Shares outstanding – Class R61 | 7,158,123 | |||
Net asset value per share – Class R6 | $10.33 | |||
Net assets – Administrator Class | $ | 3,841,990 | ||
Shares outstanding – Administrator Class1 | 368,936 | |||
Net asset value per share – Administrator Class | $10.41 | |||
Net assets – Institutional Class | $ | 202,704,785 | ||
Shares outstanding – Institutional Class1 | 19,591,107 | |||
Net asset value per share – Institutional Class | $10.35 | |||
| 1 | The Fund has an unlimited number of authorized shares. |
| 2 | Maximum offering price is computed as 100/94.25 of net asset value. On investments of $50,000 or more, the offering price is reduced. |
The accompanying notes are an integral part of these financial statements.
16 | Wells Fargo Emerging Markets Equity Income Fund
Table of Contents
Statement of operations—year ended October 31, 2020
Investment income | ||||
Dividends (net of foreign withholding taxes of $1,984,446) | $ | 16,413,511 | ||
Income from affiliated securities | 119,118 | |||
|
| |||
Total investment income | 16,532,629 | |||
|
| |||
Expenses | ||||
Management fee | 5,395,160 | |||
Administration fees |
| |||
Class A | 176,363 | |||
Class C | 21,514 | |||
Class R | 195 | |||
Class R6 | �� | 22,968 | ||
Administrator Class | 5,643 | |||
Institutional Class | 440,186 | |||
Shareholder servicing fees |
| |||
Class A | 209,955 | |||
Class C | 25,575 | |||
Class R | 232 | |||
Administrator Class | 10,190 | |||
Distribution fees |
| |||
Class C | 76,676 | |||
Class R | 178 | |||
Custody and accounting fees | 483,205 | |||
Professional fees | 46,576 | |||
Registration fees | 96,808 | |||
Shareholder report expenses | 77,234 | |||
Trustees’ fees and expenses | 21,096 | |||
Other fees and expenses | 40,884 | |||
|
| |||
Total expenses | 7,150,638 | |||
Less: Fee waivers and/or expense reimbursements |
| |||
Fund-level | (307,992 | ) | ||
Class A | (57,075 | ) | ||
Class C | (3,999 | ) | ||
Administrator Class | (1,813 | ) | ||
Institutional Class | (182,023 | ) | ||
|
| |||
Net expenses | 6,597,736 | |||
|
| |||
Net investment income | 9,934,893 | |||
|
| |||
Payment from affiliate | 307 | |||
|
| |||
Realized and unrealized gains (losses) on investments | ||||
Net realized gains (losses) on |
| |||
Unaffiliated securities | (68,725,150 | ) | ||
Forward foreign currency contracts | 12,389 | |||
|
| |||
Net realized losses on investments | (68,712,761 | ) | ||
Net change in unrealized gains (losses) on investments | (850,161 | ) | ||
|
| |||
Net realized and unrealized gains (losses) on investments | (69,562,922 | ) | ||
|
| |||
Net decrease in net assets resulting from operations | $ | (59,627,722 | ) | |
|
| |||
The accompanying notes are an integral part of these financial statements.
Wells Fargo Emerging Markets Equity Income Fund | 17
Table of Contents
Statement of changes in net assets
| Year ended October 31, 2020 | Year ended October 31, 2019 | |||||||||||||||
Operations | ||||||||||||||||
Net investment income | $ | 9,934,893 | $ | 14,642,116 | ||||||||||||
Payment from affiliate | 307 | 0 | ||||||||||||||
Net realized losses on investments | (68,712,761 | ) | (17,671,623 | ) | ||||||||||||
Net change in unrealized gains (losses) on investments | (850,161 | ) | 62,604,509 | |||||||||||||
|
| |||||||||||||||
Net increase (decrease) in net assets resulting from operations | (59,627,722 | ) | 59,575,002 | |||||||||||||
|
| |||||||||||||||
Distributions to shareholders from net investment income and net realized gains | ||||||||||||||||
Class A | (1,690,538 | ) | (418,262 | ) | ||||||||||||
Class C | (134,238 | ) | (162,480 | ) | ||||||||||||
Class R | (1,874 | ) | (2,026 | ) | ||||||||||||
Class R6 | (1,983,911 | ) | (1,924,372 | ) | ||||||||||||
Administrator Class | (93,407 | ) | (96,365 | ) | ||||||||||||
Institutional Class | (6,887,065 | ) | (11,264,878 | ) | ||||||||||||
|
| |||||||||||||||
Total distributions to shareholders | (10,791,033 | ) | (13,868,383 | ) | ||||||||||||
|
| |||||||||||||||
Capital share transactions | Shares | Shares | ||||||||||||||
Proceeds from shares sold |
| |||||||||||||||
Class A | 945,688 | 9,718,414 | 890,759 | 9,653,613 | ||||||||||||
Class C | 45,343 | 480,559 | 187,678 | 2,023,175 | ||||||||||||
Class R | 2,230 | 22,366 | 2,473 | 27,033 | ||||||||||||
Class R6 | 867,814 | 8,492,106 | 4,899,992 | 51,938,484 | ||||||||||||
Administrator Class | 41,458 | 415,898 | 64,933 | 717,682 | ||||||||||||
Institutional Class | 9,817,292 | 95,360,951 | 12,066,746 | 132,238,601 | ||||||||||||
|
| |||||||||||||||
| 114,490,294 | 196,598,588 | |||||||||||||||
|
| |||||||||||||||
Reinvestment of distributions |
| |||||||||||||||
Class A | 157,763 | 1,629,799 | 36,560 | 397,529 | ||||||||||||
Class C | 11,657 | 121,723 | 13,107 | 141,943 | ||||||||||||
Class R | 126 | 1,312 | 136 | 1,481 | ||||||||||||
Class R6 | 161,975 | 1,682,407 | 148,340 | 1,620,864 | ||||||||||||
Administrator Class | 8,405 | 88,277 | 8,471 | 92,927 | ||||||||||||
Institutional Class | 609,531 | 6,435,859 | 961,076 | 10,479,060 | ||||||||||||
|
| |||||||||||||||
| 9,959,377 | 12,733,804 | |||||||||||||||
|
| |||||||||||||||
Payment for shares redeemed |
| |||||||||||||||
Class A | (2,941,319 | ) | (30,083,007 | ) | (1,047,749 | ) | (11,379,904 | ) | ||||||||
Class C | (430,818 | ) | (4,341,892 | ) | (481,016 | ) | (5,160,401 | ) | ||||||||
Class R | (1,347 | ) | (13,873 | ) | (3,032 | ) | (33,352 | ) | ||||||||
Class R6 | (1,305,123 | ) | (13,709,656 | ) | (1,153,400 | ) | (12,803,248 | ) | ||||||||
Administrator Class | (163,206 | ) | (1,666,880 | ) | (116,130 | ) | (1,269,026 | ) | ||||||||
Institutional Class | (34,467,483 | ) | (335,110,233 | ) | (14,855,796 | ) | (160,766,339 | ) | ||||||||
|
| |||||||||||||||
| (384,925,541 | ) | (191,412,270 | ) | |||||||||||||
|
| |||||||||||||||
Net asset value of shares issued in acquisition |
| |||||||||||||||
Class A | 8,175,872 | 91,018,144 | 0 | 0 | ||||||||||||
Class C | 94,417 | 1,044,435 | 0 | 0 | ||||||||||||
Administrator Class | 67,995 | 763,172 | 0 | 0 | ||||||||||||
Institutional Class | 1,739,066 | 19,405,947 | 0 | 0 | ||||||||||||
|
| |||||||||||||||
| 112,231,698 | 0 | |||||||||||||||
|
| |||||||||||||||
Net increase (decrease) in net assets resulting from capital share transactions | (148,244,172 | ) | 17,920,122 | |||||||||||||
|
| |||||||||||||||
Total increase (decrease) in net assets | (218,662,927 | ) | 63,626,741 | |||||||||||||
|
| |||||||||||||||
Net assets | ||||||||||||||||
Beginning of period | 591,304,720 | 527,677,979 | ||||||||||||||
|
| |||||||||||||||
End of period | $ | 372,641,793 | $ | 591,304,720 | ||||||||||||
|
| |||||||||||||||
The accompanying notes are an integral part of these financial statements.
18 | Wells Fargo Emerging Markets Equity Income Fund
Table of Contents
(For a share outstanding throughout each period)
| Year ended October 31 | ||||||||||||||||||||
| CLASS A | 2020 | 2019 | 2018 | 2017 | 2016 | |||||||||||||||
Net asset value, beginning of period | $11.21 | $10.33 | $11.68 | $10.27 | $9.97 | |||||||||||||||
Net investment income | 0.20 | 0.24 | 0.27 | 0.18 | 1 | 0.23 | 1 | |||||||||||||
Net realized and unrealized gains (losses) on investments | (0.85 | ) | 0.86 | (1.36 | ) | 1.43 | 0.29 | |||||||||||||
|
|
|
|
|
|
|
|
|
| |||||||||||
Total from investment operations | (0.65 | ) | 1.10 | (1.09 | ) | 1.61 | 0.52 | |||||||||||||
Distributions to shareholders from | ||||||||||||||||||||
Net investment income | (0.23 | ) | (0.22 | ) | (0.26 | ) | (0.20 | ) | (0.22 | ) | ||||||||||
Net asset value, end of period | $10.33 | $11.21 | $10.33 | $11.68 | $10.27 | |||||||||||||||
Total return2 | (5.83 | )% | 10.78 | % | (9.47 | )% | 15.79 | % | 5.29 | % | ||||||||||
Ratios to average net assets (annualized) | ||||||||||||||||||||
Gross expenses | 1.65 | % | 1.69 | % | 1.67 | % | 1.68 | % | 1.79 | % | ||||||||||
Net expenses | 1.52 | % | 1.62 | % | 1.62 | % | 1.63 | % | 1.65 | % | ||||||||||
Net investment income | 2.10 | % | 2.12 | % | 2.30 | % | 1.72 | % | 2.34 | % | ||||||||||
Supplemental data | ||||||||||||||||||||
Portfolio turnover rate | 92 | % | 73 | % | 69 | % | 80 | % | 64 | % | ||||||||||
Net assets, end of period (000s omitted) | $83,889 | $20,017 | $19,684 | $22,774 | $26,459 | |||||||||||||||
| 1 | Calculated based upon average shares outstanding |
| 2 | Total return calculations do not include any sales charges. |
The accompanying notes are an integral part of these financial statements.
Wells Fargo Emerging Markets Equity Income Fund | 19
Table of Contents
Financial highlights
(For a share outstanding throughout each period)
| Year ended October 31 | ||||||||||||||||||||
| CLASS C | 2020 | 2019 | 2018 | 2017 | 2016 | |||||||||||||||
Net asset value, beginning of period | $11.15 | $10.27 | $11.63 | $10.23 | $9.94 | |||||||||||||||
Net investment income | 0.11 | 0.15 | 0.18 | 0.13 | 0.16 | 1 | ||||||||||||||
Net realized and unrealized gains (losses) on investments | (0.85 | ) | 0.87 | (1.35 | ) | 1.39 | 0.28 | |||||||||||||
|
|
|
|
|
|
|
|
|
| |||||||||||
Total from investment operations | (0.74 | ) | 1.02 | (1.17 | ) | 1.52 | 0.44 | |||||||||||||
Distributions to shareholders from | ||||||||||||||||||||
Net investment income | (0.15 | ) | (0.14 | ) | (0.19 | ) | (0.12 | ) | (0.15 | ) | ||||||||||
Net asset value, end of period | $10.26 | $11.15 | $10.27 | $11.63 | $10.23 | |||||||||||||||
Total return2 | (6.69 | )% | 10.01 | % | (10.20 | )% | 14.91 | % | 4.53 | % | ||||||||||
Ratios to average net assets (annualized) | ||||||||||||||||||||
Gross expenses | 2.40 | % | 2.44 | % | 2.42 | % | 2.42 | % | 2.54 | % | ||||||||||
Net expenses | 2.31 | % | 2.37 | % | 2.37 | % | 2.38 | % | 2.40 | % | ||||||||||
Net investment income | 1.03 | % | 1.30 | % | 1.53 | % | 1.18 | % | 1.62 | % | ||||||||||
Supplemental data | ||||||||||||||||||||
Portfolio turnover rate | 92 | % | 73 | % | 69 | % | 80 | % | 64 | % | ||||||||||
Net assets, end of period (000s omitted) | $8,138 | $11,958 | $13,896 | $16,898 | $13,327 | |||||||||||||||
| 1 | Calculated based upon average shares outstanding |
| 2 | Total return calculations do not include any sales charges. |
The accompanying notes are an integral part of these financial statements.
20 | Wells Fargo Emerging Markets Equity Income Fund
Table of Contents
Financial highlights
(For a share outstanding throughout each period)
| Year ended October 31 | ||||||||||||||||||||
| CLASS R | 2020 | 2019 | 2018 | 2017 | 2016 | |||||||||||||||
Net asset value, beginning of period | $11.22 | $10.34 | $11.71 | $10.30 | $9.99 | |||||||||||||||
Net investment income | 0.17 | 0.20 | 0.24 | 0.18 | 0.20 | 1 | ||||||||||||||
Payment from affiliate | 0.03 | 0.00 | 0.00 | 0.00 | 0.00 | |||||||||||||||
Net realized and unrealized gains (losses) on investments | (0.85 | ) | 0.88 | (1.37 | ) | 1.40 | 0.30 | |||||||||||||
|
|
|
|
|
|
|
|
|
| |||||||||||
Total from investment operations | (0.65 | ) | 1.08 | (1.13 | ) | 1.58 | 0.50 | |||||||||||||
Distributions to shareholders from | ||||||||||||||||||||
Net investment income | (0.21 | ) | (0.20 | ) | (0.24 | ) | (0.17 | ) | (0.19 | ) | ||||||||||
Net asset value, end of period | $10.36 | $11.22 | $10.34 | $11.71 | $10.30 | |||||||||||||||
Total return | (5.82 | )%2 | 10.61 | % | (9.70 | )% | 15.39 | % | 5.13 | % | ||||||||||
Ratios to average net assets (annualized) | ||||||||||||||||||||
Gross expenses | 1.84 | % | 1.93 | % | 1.94 | % | 1.91 | % | 2.04 | % | ||||||||||
Net expenses | 1.78 | % | 1.87 | % | 1.87 | % | 1.87 | % | 1.90 | % | ||||||||||
Net investment income | 1.65 | % | 1.97 | % | 2.64 | % | 1.69 | % | 2.08 | % | ||||||||||
Supplemental data | ||||||||||||||||||||
Portfolio turnover rate | 92 | % | 73 | % | 69 | % | 80 | % | 64 | % | ||||||||||
Net assets, end of period (000s omitted) | $98 | $95 | $92 | $32 | $28 | |||||||||||||||
| 1 | Calculated based upon average shares outstanding |
| 2 | During the year ended October 31, 2020, the Fund received a payment from an affiliate which had a 0.29% impact on the total return. See Note 4 in the Notes to Financial Statements for additional information. |
The accompanying notes are an integral part of these financial statements.
Wells Fargo Emerging Markets Equity Income Fund | 21
Table of Contents
Financial highlights
(For a share outstanding throughout each period)
| Year ended October 31 | ||||||||||||||||||||
| CLASS R6 | 2020 | 2019 | 2018 | 2017 | 2016 | |||||||||||||||
Net asset value, beginning of period | $11.23 | $10.34 | $11.69 | $10.29 | $9.97 | |||||||||||||||
Net investment income | 0.24 | 0.31 | 1 | 0.32 | 0.33 | 1 | 0.30 | 1 | ||||||||||||
Net realized and unrealized gains (losses) on investments | (0.87 | ) | 0.85 | (1.35 | ) | 1.32 | 0.27 | |||||||||||||
|
|
|
|
|
|
|
|
|
| |||||||||||
Total from investment operations | (0.63 | ) | 1.16 | (1.03 | ) | 1.65 | 0.57 | |||||||||||||
Distributions to shareholders from | ||||||||||||||||||||
Net investment income | (0.27 | ) | (0.27 | ) | (0.32 | ) | (0.25 | ) | (0.25 | ) | ||||||||||
Net asset value, end of period | $10.33 | $11.23 | $10.34 | $11.69 | $10.29 | |||||||||||||||
Total return | (5.60 | )% | 11.34 | % | (9.05 | )% | 16.25 | % | 5.90 | % | ||||||||||
Ratios to average net assets (annualized) | ||||||||||||||||||||
Gross expenses | 1.22 | % | 1.26 | % | 1.24 | % | 1.20 | % | 1.36 | % | ||||||||||
Net expenses | 1.16 | % | 1.17 | % | 1.17 | % | 1.17 | % | 1.20 | % | ||||||||||
Net investment income | 2.27 | % | 2.81 | % | 2.58 | % | 2.96 | % | 3.03 | % | ||||||||||
Supplemental data | ||||||||||||||||||||
Portfolio turnover rate | 92 | % | 73 | % | 69 | % | 80 | % | 64 | % | ||||||||||
Net assets, end of period (000s omitted) | $73,969 | $83,481 | $36,597 | $57,765 | $2,592 | |||||||||||||||
| 1 | Calculated based upon average shares outstanding |
The accompanying notes are an integral part of these financial statements.
22 | Wells Fargo Emerging Markets Equity Income Fund
Table of Contents
Financial highlights
(For a share outstanding throughout each period)
| Year ended October 31 | ||||||||||||||||||||
| ADMINISTRATOR CLASS | 2020 | 2019 | 2018 | 2017 | 2016 | |||||||||||||||
Net asset value, beginning of period | $11.31 | $10.41 | $11.76 | $10.32 | $10.00 | |||||||||||||||
Net investment income | 0.20 | 1 | 0.25 | 1 | 0.22 | 1 | 0.18 | 1 | 0.25 | 1 | ||||||||||
Net realized and unrealized gains (losses) on investments | (0.87 | ) | 0.89 | (1.29 | ) | 1.46 | 0.29 | |||||||||||||
|
|
|
|
|
|
|
|
|
| |||||||||||
Total from investment operations | (0.67 | ) | 1.14 | (1.07 | ) | 1.64 | 0.54 | |||||||||||||
Distributions to shareholders from | ||||||||||||||||||||
Net investment income | (0.23 | ) | (0.24 | ) | (0.28 | ) | (0.20 | ) | (0.22 | ) | ||||||||||
Net asset value, end of period | $10.41 | $11.31 | $10.41 | $11.76 | $10.32 | |||||||||||||||
Total return | (5.89 | )% | 11.01 | % | (9.29 | )% | 15.99 | % | 5.56 | % | ||||||||||
Ratios to average net assets (annualized) | ||||||||||||||||||||
Gross expenses | 1.56 | % | 1.61 | % | 1.57 | % | 1.58 | % | 1.71 | % | ||||||||||
Net expenses | 1.45 | % | 1.45 | % | 1.45 | % | 1.45 | % | 1.45 | % | ||||||||||
Net investment income | 1.92 | % | 2.24 | % | 1.86 | % | 1.73 | % | 2.54 | % | ||||||||||
Supplemental data | ||||||||||||||||||||
Portfolio turnover rate | 92 | % | 73 | % | 69 | % | 80 | % | 64 | % | ||||||||||
Net assets, end of period (000s omitted) | $3,842 | $4,686 | $4,758 | $13,940 | $50,970 | |||||||||||||||
| 1 | Calculated based upon average shares outstanding |
The accompanying notes are an integral part of these financial statements.
Wells Fargo Emerging Markets Equity Income Fund | 23
Table of Contents
Financial highlights
(For a share outstanding throughout each period)
| Year ended October 31 | ||||||||||||||||||||
| INSTITUTIONAL CLASS | 2020 | 2019 | 2018 | 2017 | 2016 | |||||||||||||||
Net asset value, beginning of period | $11.24 | $10.35 | $11.70 | $10.30 | $9.98 | |||||||||||||||
Net investment income | 0.19 | 1 | 0.28 | 0.32 | 0.25 | 0.27 | 1 | |||||||||||||
Net realized and unrealized gains (losses) on investments | (0.82 | ) | 0.87 | (1.36 | ) | 1.39 | 0.30 | |||||||||||||
|
|
|
|
|
|
|
|
|
| |||||||||||
Total from investment operations | (0.63 | ) | 1.15 | (1.04 | ) | 1.64 | 0.57 | |||||||||||||
Distributions to shareholders from | ||||||||||||||||||||
Net investment income | (0.26 | ) | (0.26 | ) | (0.31 | ) | (0.24 | ) | (0.25 | ) | ||||||||||
Net asset value, end of period | $10.35 | $11.24 | $10.35 | $11.70 | $10.30 | |||||||||||||||
Total return | (5.63 | )% | 11.24 | % | (9.11 | )% | 16.11 | % | 5.84 | % | ||||||||||
Ratios to average net assets (annualized) | ||||||||||||||||||||
Gross expenses | 1.33 | % | 1.36 | % | 1.34 | % | 1.33 | % | 1.45 | % | ||||||||||
Net expenses | 1.22 | % | 1.22 | % | 1.22 | % | 1.23 | % | 1.25 | % | ||||||||||
Net investment income | 1.85 | % | 2.54 | % | 2.73 | % | 2.32 | % | 2.75 | % | ||||||||||
Supplemental data | ||||||||||||||||||||
Portfolio turnover rate | 92 | % | 73 | % | 69 | % | 80 | % | 64 | % | ||||||||||
Net assets, end of period (000s omitted) | $202,705 | $471,068 | $452,650 | $514,624 | $426,801 | |||||||||||||||
| 1 | Calculated based upon average shares outstanding |
The accompanying notes are an integral part of these financial statements.
24 | Wells Fargo Emerging Markets Equity Income Fund
Table of Contents
1. ORGANIZATION
Wells Fargo Funds Trust (the “Trust”), a Delaware statutory trust organized on March 10, 1999, is an open-end management investment company registered under the Investment Company Act of 1940, as amended (the “1940 Act”). As an investment company, the Trust follows the accounting and reporting guidance in Financial Accounting Standards Board (“FASB”) Accounting Standards Codification Topic 946, Financial Services – Investment Companies. These financial statements report on the Wells Fargo Emerging Markets Equity Income Fund (the “Fund”) which is a diversified series of the Trust.
2. SIGNIFICANT ACCOUNTING POLICIES
The following significant accounting policies, which are consistently followed in the preparation of the financial statements of the Fund, are in conformity with U.S. generally accepted accounting principles which require management to make estimates and assumptions that affect the reported amounts of assets and liabilities, disclosure of contingent assets and liabilities at the date of the financial statements, and the reported amounts of revenues and expenses during the reporting period. Actual results could differ from those estimates.
Securities valuation
All investments are valued each business day as of the close of regular trading on the New York Stock Exchange (generally 4 p.m. Eastern Time), although the Fund may deviate from this calculation time under unusual or unexpected circumstances.
Equity securities that are listed on a foreign or domestic exchange or market are valued at the official closing price or, if none, the last sales price. If no sale occurs on the principal exchange or market that day, a fair value price will be determined in accordance with the Fund’s Valuation Procedures.
Forward foreign currency contracts are recorded at the forward rate provided by an independent foreign currency pricing source at a time each business day specified by the Wells Fargo Asset Management Pricing Committee at Wells Fargo Funds Management, LLC (“Funds Management”).
The values of securities denominated in foreign currencies are translated into U.S. dollars at rates provided by an independent foreign currency pricing source at a time each business day specified by the Wells Fargo Asset Management Pricing Committee.
Many securities markets and exchanges outside the U.S. close prior to the close of the New York Stock Exchange and therefore may not fully reflect trading or events that occur after the close of the principal exchange in which the foreign securities are traded, but before the close of the New York Stock Exchange. If such trading or events are expected to materially affect the value of such securities, then fair value pricing procedures approved by the Board of Trustees of the Fund are applied. These procedures take into account multiple factors including movements in U.S. securities markets after foreign exchanges close. Foreign securities that are fair valued under these procedures are categorized as Level 2 and the application of these procedures may result in transfers between Level 1 and Level 2. Depending on market activity, such fair valuations may be frequent. Such fair value pricing may result in net asset values that are higher or lower than net asset values based on the last reported sales price or latest quoted bid price. On October 31, 2020, such fair value pricing was used in pricing certain foreign securities.
Investments in registered open-end investment companies are valued at net asset value.
Investments which are not valued using any of the methods discussed above are valued at their fair value, as determined in good faith by the Board of Trustees. The Board of Trustees has established a Valuation Committee comprised of the Trustees and has delegated to it the authority to take any actions regarding the valuation of portfolio securities that the Valuation Committee deems necessary or appropriate, including determining the fair value of portfolio securities, unless the determination has been delegated to the Wells Fargo Asset Management Pricing Committee. The Board of Trustees retains the authority to make or ratify any valuation decisions or approve any changes to the Valuation Procedures as it deems appropriate. On a quarterly basis, the Board of Trustees receives reports on any valuation actions taken by the Valuation Committee or the Wells Fargo Asset Management Pricing Committee which may include items for ratification.
Foreign currency translation
The accounting records of the Fund are maintained in U.S. dollars. The values of other assets and liabilities denominated in foreign currencies are translated into U.S. dollars at rates provided by an independent foreign currency pricing source at a time each business day specified by the Wells Fargo Asset Management Pricing Committee. Purchases and sales of securities, and income and expenses are converted at the rate of exchange on the respective dates of such transactions. Net realized foreign exchange gains or losses arise from sales of foreign currencies, currency gains or losses realized between the trade and settlement dates on securities transactions, and the difference between the amounts of dividends, interest and foreign withholding taxes recorded and the U.S. dollar equivalent of the amounts actually paid or received. Net unrealized foreign exchange gains and losses arise from changes in the fair value of assets and liabilities other than investments in securities resulting from changes in exchange rates. The changes in net assets arising from changes in exchange rates of securities and the changes in net assets resulting from changes in market prices of securities are not separately presented. Such changes are included in net realized and unrealized gains or losses from investments.
Wells Fargo Emerging Markets Equity Income Fund | 25
Table of Contents
Notes to financial statements
Forward foreign currency contracts
A forward foreign currency contract is an agreement between two parties to purchase or sell a specific currency for an agreed-upon price at a future date. The Fund enters into forward foreign currency contracts to facilitate transactions in foreign-denominated securities and to attempt to minimize the risk to the Fund from adverse changes in the relationship between currencies. Forward foreign currency contracts are recorded at the forward rate and marked-to-market daily. When the contracts are closed, realized gains and losses arising from such transactions are recorded as realized gains or losses on forward foreign currency contracts. The Fund is subject to foreign currency risk and may be exposed to risks if the counterparties to the contracts are unable to meet the terms of their contracts or if the value of the foreign currency changes unfavorably. The Fund’s maximum risk of loss from counterparty credit risk is the unrealized gains on the contracts. This risk may be mitigated if there is a master netting arrangement between the Fund and the counterparty.
Security transactions and income recognition
Securities transactions are recorded on a trade date basis. Realized gains or losses are recorded on the basis of identified cost.
Dividend income is recognized on the ex-dividend date, except for certain dividends from foreign securities, which are recorded as soon as the custodian verifies the ex-dividend date. Dividend income from foreign securities is recorded net of foreign taxes withheld where recovery of such taxes is not assured.
Distributions to shareholders
Distributions to shareholders are recorded on the ex-dividend date and paid from net investment income monthly and any net realized gains are paid at least annually. Such distributions are determined in accordance with income tax regulations and may differ from U.S. generally accepted accounting principles. Dividend sources are estimated at the time of declaration. The tax character of distributions is determined as of the Fund’s fiscal year end. Therefore, a portion of the Fund’s distributions made prior to the Fund’s fiscal year end may be categorized as a tax return of capital at year end.
Federal and other taxes
The Fund intends to continue to qualify as a regulated investment company by distributing substantially all of its investment company taxable income and any net realized capital gains (after reduction for capital loss carryforwards) sufficient to relieve it from all, or substantially all, federal income taxes. Accordingly, no provision for federal income taxes was required.
The Fund’s income and federal excise tax returns and all financial records supporting those returns for the prior three fiscal years are subject to examination by the federal and Delaware revenue authorities. Management has analyzed the Fund’s tax positions taken on federal, state, and foreign tax returns for all open tax years and does not believe that there are any uncertain tax positions that require recognition of a tax liability.
As of October 31, 2020, the aggregate cost of all investments for federal income tax purposes was $325,148,330 and the unrealized gains (losses) consisted of:
Gross unrealized gains | $ | 64,288,210 | ||
Gross unrealized losses | (15,132,449 | ) | ||
Net unrealized gains | $ | 49,155,761 | ||
Reclassifications are made to the Fund’s capital accounts for permanent tax differences to reflect income and gains available for distribution (or available capital loss carryforwards) under federal income tax regulations. U.S. generally accepted accounting principles require that certain components of net assets be adjusted to reflect permanent differences between financial and tax reporting. These reclassifications have no effect on net assets or net asset values per share. At October 31, 2020, as a result of permanent book-to-tax differences, the following reclassification adjustments were made on the Statement of Assets and Liabilities:
| Paid-in capital | Total distributable loss | |
| $9,152 | $(9,152) | |
As of October 31, 2020, the Fund had capital loss carryforwards which consist of $47,302,017 in short-term capital losses and $41,827,233 in long-term capital losses.
26 | Wells Fargo Emerging Markets Equity Income Fund
Table of Contents
Notes to financial statements
Class allocations
The separate classes of shares offered by the Fund differ principally in applicable sales charges, distribution, shareholder servicing, and administration fees. Class specific expenses are charged directly to that share class. Investment income, common fund-level expenses, and realized and unrealized gains (losses) on investments are allocated daily to each class of shares based on the relative proportion of net assets of each class.
3. FAIR VALUATION MEASUREMENTS
Fair value measurements of investments are determined within a framework that has established a fair value hierarchy based upon the various data inputs utilized in determining the value of the Fund’s investments. The three-level hierarchy gives the highest priority to unadjusted quoted prices in active markets for identical assets or liabilities (Level 1) and the lowest priority to unobservable inputs (Level 3). The Fund’s investments are classified within the fair value hierarchy based on the lowest level of input that is significant to the fair value measurement. The inputs are summarized into three broad levels as follows:
| ∎ | Level 1 – quoted prices in active markets for identical securities |
| ∎ | Level 2 – other significant observable inputs (including quoted prices for similar securities, interest rates, prepayment speeds, credit risk, etc.) |
| ∎ | Level 3 – significant unobservable inputs (including the Fund’s own assumptions in determining the fair value of investments) |
The inputs or methodologies used for valuing investments in securities are not necessarily an indication of the risk associated with investing in those securities.
The following is a summary of the inputs used in valuing the Fund’s assets and liabilities as of October 31, 2020:
| Quoted prices (Level 1) | Other significant observable inputs (Level 2) | Significant (Level 3) | Total | |||||||||||||
Assets | ||||||||||||||||
Investments in: | ||||||||||||||||
Common stocks | ||||||||||||||||
Brazil | $ | 16,013,042 | $ | 0 | $ | 0 | $ | 16,013,042 | ||||||||
China | 0 | 127,289,901 | 0 | 127,289,901 | ||||||||||||
Greece | 0 | 1,762,229 | 0 | 1,762,229 | ||||||||||||
Hong Kong | 0 | 14,404,484 | 0 | 14,404,484 | ||||||||||||
India | 0 | 32,273,996 | 0 | 32,273,996 | ||||||||||||
Indonesia | 0 | 5,325,901 | 0 | 5,325,901 | ||||||||||||
Malaysia | 0 | 4,784,773 | 0 | 4,784,773 | ||||||||||||
Mexico | 4,094,766 | 0 | 0 | 4,094,766 | ||||||||||||
Poland | 0 | 2,068,164 | 0 | 2,068,164 | ||||||||||||
Russia | 2,439,621 | 11,104,018 | 0 | 13,543,639 | ||||||||||||
Saudi Arabia | 2,021,706 | 2,016,279 | 0 | 4,037,985 | ||||||||||||
Singapore | 0 | 2,566,644 | 0 | 2,566,644 | ||||||||||||
South Africa | 2,518,381 | 11,264,544 | 0 | 13,782,925 | ||||||||||||
South Korea | 0 | 41,677,347 | 0 | 41,677,347 | ||||||||||||
Taiwan | 0 | 49,802,082 | 0 | 49,802,082 | ||||||||||||
Thailand | 1,645,035 | 4,689,533 | 0 | 6,334,568 | ||||||||||||
United Arab Emirates | 0 | 3,635,225 | 0 | 3,635,225 | ||||||||||||
United Kingdom | 0 | 2,959,646 | 0 | 2,959,646 | ||||||||||||
United States | 2,374,456 | 0 | 0 | 2,374,456 | ||||||||||||
Preferred stocks | ||||||||||||||||
Brazil | 5,899,426 | 0 | 0 | 5,899,426 | ||||||||||||
South Korea | 0 | 6,174,725 | 0 | 6,174,725 | ||||||||||||
Short-term investments | ||||||||||||||||
Investment companies | 13,498,167 | 0 | 0 | 13,498,167 | ||||||||||||
Total assets | $ | 50,504,600 | $ | 323,799,491 | $ | 0 | $ | 374,304,091 | ||||||||
Wells Fargo Emerging Markets Equity Income Fund | 27
Table of Contents
Notes to financial statements
Additional sector, industry or geographic detail is included in the Portfolio of Investments.
For the year ended October 31, 2020, the Fund did not have any transfers into/out of Level 3.
4. TRANSACTIONS WITH AFFILIATES
Management fee
Funds Management, an indirect wholly owned subsidiary of Wells Fargo & Company (“Wells Fargo”), is the manager of the Fund and provides advisory and fund-level administrative services under an investment management agreement. Under the investment management agreement, Funds Management is responsible for, among other services, implementing the investment objectives and strategies of the Fund, supervising the subadviser and providing fund-level administrative services in connection with the Fund’s operations. As compensation for its services under the investment management agreement, Funds Management is entitled to receive a management fee at the following annual rate based on the Fund’s average daily net assets:
| Average daily net assets | Management fee | |||
First $1 billion | 1.050 | % | ||
Next $1 billion | 1.025 | |||
Next $2 billion | 1.000 | |||
Next $1 billion | 0.975 | |||
Next $3 billion | 0.965 | |||
Next $2 billion | 0.955 | |||
Over $10 billion | 0.945 | |||
For the year ended October 31, 2020, the management fee was equivalent to an annual rate of 1.05% of the Fund’s average daily net assets.
Funds Management has retained the services of a subadviser to provide daily portfolio management to the Fund. The fee for subadvisory services is borne by Funds Management. Wells Capital Management Incorporated, an affiliate of Funds Management and an indirect wholly owned subsidiary of Wells Fargo, is the subadviser to the Fund and is entitled to receive a fee from Funds Management at an annual rate starting at 0.65% and declining to 0.45% as the average daily net assets of the Fund increase.
Administration fees
Under a class-level administration agreement, Funds Management provides class-level administrative services to the Fund, which includes paying fees and expenses for services provided by the transfer agent, sub-transfer agents, omnibus account servicers and record-keepers. As compensation for its services under the class-level administration agreement, Funds Management receives an annual fee which is calculated based on the average daily net assets of each class as follows:
| Class-level administration fee | ||||
Class A, Class C, Class R | 0.21 | % | ||
Class R6 | 0.03 | |||
Administrator Class, Institutional Class | 0.13 | |||
Waivers and/or expense reimbursements
Funds Management has contractually waived and/or reimbursed management and administration fees to the extent necessary to maintain certain net operating expense ratios for the Fund. When each class of the Fund has exceeded its expense cap, Funds Management has waived fees and/or reimbursed expenses from fund-level expenses on a proportionate basis and then from class specific expenses. When only certain classes exceed their expense caps, waivers and/or reimbursements are applied against class specific expenses before fund-level expenses. Funds Management has committed through February 28, 2021 to waive fees and/or reimburse expenses to the extent necessary to cap the Fund’s expenses at 1.55% for Class A shares, 2.30% for Class C shares, 1.80% for Class R shares, 1.17% for Class R6 shares, 1.45% for Administrator Class shares, and 1.22% for Institutional Class shares. Prior to or after the commitment expiration date, the cap may be increased or the commitment to maintain the cap may be terminated only with the approval of the Board of Trustees. Prior to December 7, 2019, the Fund’s expenses were capped at 1.62% for Class A shares, 2.37% for Class C shares, and 1.87% for Class R shares.
28 | Wells Fargo Emerging Markets Equity Income Fund
Table of Contents
Notes to financial statements
Distribution fees
The Trust has adopted a distribution plan for Class C and Class R shares of the Fund pursuant to Rule 12b-1 under the 1940 Act. Distribution fees are charged to Class C and Class R shares and paid to Wells Fargo Funds Distributor, LLC (“Funds Distributor”), the principal underwriter, at an annual rate of 0.75% of the average daily net assets of Class C shares and 0.25% of the average daily net assets of Class R shares.
In addition, Funds Distributor is entitled to receive the front-end sales charge from the purchase of Class A shares and a contingent deferred sales charge on the redemption of certain Class A shares. Funds Distributor is also entitled to receive the contingent deferred sales charges from redemptions of Class C shares. For the year ended October 31, 2020, Funds Distributor received $1,935 from the sale of Class A shares. No contingent deferred sales charges were incurred by Class A and Class C shares for the year ended October 31, 2020.
Shareholder servicing fees
The Trust has entered into contracts with one or more shareholder servicing agents, whereby Class A, Class C, Class R, and Administrator Class of the Fund are charged a fee at an annual rate of 0.25% of the average daily net assets of each respective class. A portion of these total shareholder servicing fees were paid to affiliates of Wells Fargo.
Interfund transactions
The Fund may purchase or sell portfolio investment securities to certain other Wells Fargo affiliates pursuant to Rule 17a-7 under the 1940 Act and under procedures adopted by the Board of Trustees. The procedures have been designed to ensure that these interfund transactions, which do not incur broker commissions, are effected at current market prices.
Other transactions
On August 14, 2020, Class R of the Fund was reimbursed by Funds Management in the amount of $307. The reimbursement was made in connection with resolving certain fee reimbursements.
5. INVESTMENT PORTFOLIO TRANSACTIONS
Purchases and sales of investments, excluding U.S. government obligations (if any) and short-term securities, for the year ended October 31, 2020 were $448,572,859 and $626,626,006, respectively.
6. DERIVATIVE TRANSACTIONS
During the year ended October 31, 2020, the Fund entered into forward foreign currency contracts for hedging purposes. The Fund had average contract amounts of $73,524 and $156,313 in forward foreign currency contracts to buy and forward foreign currency contracts to sell, respectively, during the year ended October 31, 2020.
The fair value, realized gains or losses and change in unrealized gains or losses, if any, on derivative instruments are reflected in the corresponding financial statement captions.
7. ACQUISITION
After the close of business on December 6, 2019, the Fund acquired the net assets of Wells Fargo Asia Pacific Fund. The purpose of the transaction was to combine two funds with similar investment objectives and strategies. Shareholders holding Class A, Class C, Administrator Class and Institutional Class shares of Wells Fargo Asia Pacific Fund received Class A, Class C, Administrator Class, and Institutional Class shares, respectively, of the Fund in the reorganization. The acquisition was accomplished by a tax-free exchange of all of the shares of Wells Fargo Asia Pacific Fund for 10,077,350 shares of the Fund valued at $112,231,698 at an exchange ratio of 1.01, 0.96, 0.99, and 0.98 for Class A, Class C, Administrator Class, and Institutional Class shares, respectively. The investment portfolio of Wells Fargo Asia Pacific Fund with a fair value of $112,424,413, identified cost of $111,732,421 and unrealized gains of $691,992 at December 6, 2019 were the principal assets acquired by the Fund. The aggregate net assets of Wells Fargo Asia Pacific Fund and the Fund immediately prior to the acquisition were $112,231,698 and $583,919,847, respectively. The aggregate net assets of the Fund immediately after the acquisition were $696,151,545. For financial reporting purposes, assets received and shares issued by the Fund were recorded at fair value; however, the cost basis of the investments received from Wells Fargo Asia Pacific Fund was carried forward to align with ongoing reporting of the Fund’s realized and unrealized gains and losses with amounts distributable to shareholders for tax purposes.
Wells Fargo Emerging Markets Equity Income Fund | 29
Table of Contents
Notes to financial statements
Assuming the acquisition had been completed November 1, 2019, the beginning of the annual reporting period for the Fund, the pro forma results of operations for the year ended October 31, 2020 would have been as follows (unaudited):
Net investment income | $ | 9,980,239 | ||
Net realized and unrealized gains (losses) on investments | (52,952,460 | ) | ||
Net decrease in net assets resulting from operations | $ | (42,972,221 | ) | |
Because the combined investment portfolios have been managed as a single integrated portfolio since the acquisition was completed, it is not practicable to separate the amounts of revenue and earnings of Wells Fargo Asia Pacific Fund that have been included in the Fund’s Statement of Operations since December 7, 2019.
8. BANK BORROWINGS
The Trust (excluding the money market funds), Wells Fargo Master Trust and Wells Fargo Variable Trust are parties to a $350,000,000 revolving credit agreement whereby the Fund is permitted to use bank borrowings for temporary or emergency purposes, such as to fund shareholder redemption requests. Interest under the credit agreement is charged to the Fund based on a borrowing rate equal to the higher of the Federal Funds rate in effect on that day plus 1.25% or the overnight LIBOR rate in effect on that day plus 1.25%. In addition, an annual commitment fee equal to 0.25% of the unused balance is allocated to each participating fund.
For the year ended October 31, 2020, there were no borrowings by the Fund under the agreement.
9. DISTRIBUTIONS TO SHAREHOLDERS
The tax character of distributions paid was $10,791,033 and $13,868,383 of ordinary income for the years ended October 31, 2020 and October 31, 2019, respectively.
As of October 31, 2020, the components of distributable earnings on a tax basis were as follows:
Undistributed ordinary income | Unrealized gains | Capital loss carryforward | ||
| $849,177 | $49,030,061 | $(89,129,250) | ||
10. CONCENTRATION RISKS
Concentration risks result from exposure to a limited number of sectors or geographic regions. As of the end of the period, the Fund concentrated its portfolio in investments related to the information technology sector and in the Asia/Pacific ex-Japan region. A fund that invests a substantial portion of its assets in any sector or geographic region may be more affected by changes in that sector or geographic region than would be a fund whose investments are not heavily weighted in any sector or geographic region.
11. INDEMNIFICATION
Under the Fund’s organizational documents, the officers and Trustees have been granted certain indemnification rights against certain liabilities that may arise out of performance of their duties to the Fund. The Fund has entered into a separate agreement with each Trustee that converts indemnification rights currently existing under the Fund’s organizational documents into contractual rights that cannot be changed in the future without the consent of the Trustee. Additionally, in the normal course of business, the Fund may enter into contracts with service providers that contain a variety of indemnification clauses. The Fund’s maximum exposure under these arrangements is dependent on future claims that may be made against the Fund and, therefore, cannot be estimated.
12. NEW ACCOUNTING PRONOUNCEMENT
In August 2018, FASB issued Accounting Standards Update (“ASU”) No. 2018-13, Fair Value Measurement (Topic 820) Disclosure Framework—Changes to the Disclosure Requirements for Fair Value Measurement. ASU 2018-13 updates the disclosure requirements on fair value measurements in Topic 820, Fair Value Measurements. The amendments are effective for fiscal years, and interim periods within those fiscal years, beginning after December 15, 2019. Management has adopted this guidance which did not have a material impact on the financial statements.
30 | Wells Fargo Emerging Markets Equity Income Fund
Table of Contents
Notes to financial statements
13. CORONAVIRUS (COVID-19) PANDEMIC
On March 11, 2020, the World Health Organization announced that it had made the assessment that coronavirus disease 2019 (“COVID-19”) is a pandemic. The impacts of COVID-19 are adversely affecting the entire global economy, individual companies and investment products, and the market in general. There is significant uncertainty around the extent and duration of business disruptions related to COVID-19 and the impacts may be short term or may last for an extended period of time. The risk of further spreading of COVID-19 has led to significant uncertainty and volatility in the financial markets.
Wells Fargo Emerging Markets Equity Income Fund | 31
Table of Contents
Report of independent registered public accounting firm
To the Shareholders of the Fund and Board of Trustees
Wells Fargo Funds Trust:
Opinion on the Financial Statements
We have audited the accompanying statement of assets and liabilities of Wells Fargo Emerging Markets Equity Income Fund (the Fund), one of the funds constituting Wells Fargo Funds Trust, including the portfolio of investments, as of October 31, 2020, the related statement of operations for the year then ended, the statements of changes in net assets for each of the years in the two-year period then ended, and the related notes (collectively, the financial statements) and the financial highlights for each of the years in the five-year period then ended. In our opinion, the financial statements and financial highlights present fairly, in all material respects, the financial position of the Fund as of October 31, 2020, the results of its operations for the year then ended, the changes in its net assets for each of the years in the two-year period then ended, and the financial highlights for each of the years in the five-year period then ended, in conformity with U.S. generally accepted accounting principles.
Basis for Opinion
These financial statements and financial highlights are the responsibility of the Fund’s management. Our responsibility is to express an opinion on these financial statements and financial highlights based on our audits. We are a public accounting firm registered with the Public Company Accounting Oversight Board (United States) (PCAOB) and are required to be independent with respect to the Fund in accordance with the U.S. federal securities laws and the applicable rules and regulations of the Securities and Exchange Commission and the PCAOB.
We conducted our audits in accordance with the standards of the PCAOB. Those standards require that we plan and perform the audit to obtain reasonable assurance about whether the financial statements and financial highlights are free of material misstatement, whether due to error or fraud. Our audits included performing procedures to assess the risks of material misstatement of the financial statements and financial highlights, whether due to error or fraud, and performing procedures that respond to those risks. Such procedures included examining, on a test basis, evidence regarding the amounts and disclosures in the financial statements and financial highlights. Such procedures also included confirmation of securities owned as of October 31, 2020, by correspondence with the custodian, transfer agent and brokers, or by other appropriate auditing procedures. Our audits also included evaluating the accounting principles used and significant estimates made by management, as well as evaluating the overall presentation of the financial statements and financial highlights. We believe that our audits provide a reasonable basis for our opinion.

We have not been able to determine the specific year that we began serving as the auditor of one or more Wells Fargo Funds investment companies; however we are aware that we have served as the auditor of one or more Wells Fargo Funds investment companies since at least 1955.
Boston, Massachusetts
December 22, 2020
32 | Wells Fargo Emerging Markets Equity Income Fund
Table of Contents
TAX INFORMATION
Pursuant to Section 854 of the Internal Revenue Code, $10,540,904 of income dividends paid during the fiscal year ended October 31, 2020 has been designated as qualified dividend income (QDI).
For the fiscal year ended October 31, 2020, $82,393 has been designated as interest-related dividends for nonresident alien shareholders pursuant to Section 871 of the Internal Revenue Code.
Pursuant to Section 853 of the Internal Revenue Code, the Fund expects to designate amounts as foreign taxes paid for the fiscal year ended October 31, 2020. Additional details will be available in the semiannual report.
PROXY VOTING INFORMATION
A description of the policies and procedures used to determine how to vote proxies relating to portfolio securities is available, upon request, by calling 1-800-222-8222, visiting our website at wfam.com, or visiting the SEC website at sec.gov. Information regarding how the proxies related to portfolio securities were voted during the most recent 12-month period ended June 30 is available on the website at wfam.com or by visiting the SEC website at sec.gov.
QUARTERLY PORTFOLIO HOLDINGS INFORMATION
The Fund files its complete schedule of portfolio holdings with the SEC for the first and third quarters of each fiscal year as an exhibit to its reports on Form N-PORT. Shareholders may view the filed Form N-PORT by visiting the SEC website at sec.gov.
Wells Fargo Emerging Markets Equity Income Fund | 33
Table of Contents
Other information (unaudited)
BOARD OF TRUSTEES AND OFFICERS
Each of the Trustees and Officers1 listed in the table below acts in identical capacities for each fund in the Wells Fargo family of funds, which consists of 144 mutual funds comprising the Wells Fargo Funds Trust, Wells Fargo Variable Trust, Wells Fargo Master Trust and four closed-end funds (collectively the “Fund Complex”). This table should be read in conjunction with the Prospectus and the Statement of Additional Information2. The mailing address of each Trustee and Officer is 525 Market Street, 12th Floor, San Francisco, CA 94105. Each Trustee and Officer serves an indefinite term, however, each Trustee serves such term until reaching the mandatory retirement age established by the Trustees.
Independent Trustees
Name and year of birth | Position held and length of service* | Principal occupations during past five years or longer | Current other public company or investment company directorships | |||
William R. Ebsworth (Born 1957) | Trustee, since 2015 | Retired. From 1984 to 2013, equities analyst, portfolio manager, research director and chief investment officer at Fidelity Management and Research Company in Boston, Tokyo, and Hong Kong, and retired in 2013 as Chief Investment Officer of Fidelity Strategic Advisers, Inc. where he led a team of investment professionals managing client assets. Prior thereto, Board member of Hong Kong Securities Clearing Co., Hong Kong Options Clearing Corp., the Thailand International Fund, Ltd., Fidelity Investments Life Insurance Company, and Empire Fidelity Investments Life Insurance Company. Audit Committee Chair and Investment Committee Chair of the Vincent Memorial Hospital Endowment (non-profit organization). Mr. Ebsworth is a CFA® charterholder. | N/A | |||
Jane A. Freeman (Born 1953) | Trustee, since 2015; Chair Liaison, since 2018 | Retired. From 2012 to 2014 and 1999 to 2008, Chief Financial Officer of Scientific Learning Corporation. From 2008 to 2012, Ms. Freeman provided consulting services related to strategic business projects. Prior to 1999, Portfolio Manager at Rockefeller & Co. and Scudder, Stevens & Clark. Board member of the Harding Loevner Funds from 1996 to 2014, serving as both Lead Independent Director and chair of the Audit Committee. Board member of the Russell Exchange Traded Funds Trust from 2011 to 2012 and the chair of the Audit Committee. Ms. Freeman is also an inactive Chartered Financial Analyst. | N/A | |||
Isaiah Harris, Jr. (Born 1952) | Trustee, since 2009; Audit Committee Chair, since 2019 | Retired. Chairman of the Board of CIGNA Corporation since 2009, and Director since 2005. From 2003 to 2011, Director of Deluxe Corporation. Prior thereto, President and CEO of BellSouth Advertising and Publishing Corp. from 2005 to 2007, President and CEO of BellSouth Enterprises from 2004 to 2005 and President of BellSouth Consumer Services from 2000 to 2003. Emeritus member of the Iowa State University Foundation Board of Governors. Emeritus Member of the Advisory Board of Iowa State University School of Business. Advisory Board Member, Palm Harbor Academy (private school). Mr. Harris is a certified public accountant (inactive status). | CIGNA Corporation | |||
Judith M. Johnson (Born 1949) | Trustee, since 2008 | Retired. Prior thereto, Chief Executive Officer and Chief Investment Officer of Minneapolis Employees Retirement Fund from 1996 to 2008. Ms. Johnson is an attorney, certified public accountant and a certified managerial accountant. | N/A | |||
David F. Larcker (Born 1950) | Trustee, since 2009 | James Irvin Miller Professor of Accounting at the Graduate School of Business (Emeritus), Stanford University, Director of the Corporate Governance Research Initiative and Senior Faculty of The Rock Center for Corporate Governance since 2006. From 2005 to 2008, Professor of Accounting at the Graduate School of Business, Stanford University. Prior thereto, Ernst & Young Professor of Accounting at The Wharton School, University of Pennsylvania from 1985 to 2005. | N/A | |||
34 | Wells Fargo Emerging Markets Equity Income Fund
Table of Contents
Other information (unaudited)
Name and year of birth | Position held and length of service* | Principal occupations during past five years or longer | Current other public company or investment company directorships | |||
Olivia S. Mitchell (Born 1953) | Trustee, since 2006; Nominating and Governance Committee Chair, since 2018 | International Foundation of Employee Benefit Plans Professor, Wharton School of the University of Pennsylvania since 1993. Director of Wharton’s Pension Research Council and Boettner Center on Pensions & Retirement Research, and Research Associate at the National Bureau of Economic Research. Previously, Cornell University Professor from 1978 to 1993. | N/A | |||
Timothy J. Penny (Born 1951) | Trustee, since 1996; Chair, since 2018 | President and Chief Executive Officer of Southern Minnesota Initiative Foundation, a non-profit organization, since 2007. Member of the Board of Trustees of NorthStar Education Finance, Inc., a non-profit organization, since 2007. | N/A | |||
James G. Polisson (Born 1959) | Trustee, since 2018 | Retired. Chief Marketing Officer, Source (ETF) UK Services, Ltd, from 2015 to 2017. From 2012 to 2015, Principal of The Polisson Group, LLC, a management consulting, corporate advisory and principal investing company. Chief Executive Officer and Managing Director at Russell Investments, Global Exchange Traded Funds from 2010 to 2012. Managing Director of Barclays Global Investors from 1998 to 2010 and Global Chief Marketing Officer for iShares and Barclays Global Investors from 2000 to 2010. Trustee of the San Francisco Mechanics’ Institute, a non-profit organization, from 2013 to 2015. Board member of the Russell Exchange Traded Fund Trust from 2011 to 2012. Director of Barclays Global Investors Holdings Deutschland GmbH from 2006 to 2009. Mr. Polisson is an attorney and has a retired status with the Massachusetts and District of Columbia Bar Associations. | N/A | |||
Pamela Wheelock (Born 1959) | Trustee, since January 2020; previously Trustee from January 2018 to July 2019 | Board member of the Destination Medical Center Economic Development Agency, Rochester, Minnesota since 2019. Interim President of the McKnight Foundation from January to September 2020. Acting Commissioner, Minnesota Department of Human Services, July 2019 through September 2019. Human Services Manager (part-time), Minnesota Department of Human Services, October 2019 through December 2019. Chief Operating Officer, Twin Cities Habitat for Humanity from 2017 to 2019. Vice President of University Services, University of Minnesota from 2012 to 2016. Prior thereto, on the Board of Directors, Governance Committee and Finance Committee for the Minnesota Philanthropy Partners (Saint Paul Foundation) from 2012 to 2018, Interim Chief Executive Officer of Blue Cross Blue Shield of Minnesota from 2011 to 2012, Chairman of the Board from 2009 to 2012 and Board Director from 2003 to 2015. Vice President, Leadership and Community Engagement, Bush Foundation, Saint Paul, Minnesota (a private foundation) from 2009 to 2011. Executive Vice President and Chief Financial Officer, Minnesota Sports and Entertainment from 2004 to 2009 and Senior Vice President from 2002 to 2004. Executive Vice President of the Minnesota Wild Foundation from 2004 to 2008. Commissioner of Finance, State of Minnesota, from 1999 to 2002. Currently Board Chair of the Minnesota Wild Foundation since 2010. | N/A | |||
| * | Length of service dates reflect the Trustee’s commencement of service with the Trust’s predecessor entities, where applicable. |
Wells Fargo Emerging Markets Equity Income Fund | 35
Table of Contents
Other information (unaudited)
Officers
Name and year of birth | Position held and length of service | Principal occupations during past five years or longer | ||
Andrew Owen (Born 1960) | President, since 2017 | Executive Vice President of Wells Fargo & Company and Head of Affiliated Managers, Wells Fargo Asset Management, since 2014. In addition, Mr. Owen is currently President, Chief Executive Officer and Director of Wells Fargo Funds Management, LLC since 2017. Prior thereto, Executive Vice President responsible for marketing, investments and product development for Wells Fargo Funds Management, LLC, from 2009 to 2014. | ||
Jeremy DePalma1 (Born 1974) | Treasurer, since 2012 | Senior Vice President of Wells Fargo Funds Management, LLC since 2009. Senior Vice President of Evergreen Investment Management Company, LLC from 2008 to 2010 and head of the Fund Reporting and Control Team within Fund Administration from 2005 to 2010. | ||
Michelle Rhee (Born 1966) | Chief Legal Officer, since 2019 | Secretary of Wells Fargo Funds Management, LLC and Chief Legal Counsel of Wells Fargo Asset Management since 2018. Deputy General Counsel of Wells Fargo Bank, N.A. since 2020 and Assistant General Counsel of Wells Fargo Bank, N.A. from 2018 to 2020. Associate General Counsel and Managing Director of Bank of America Corporation from 2004 to 2018. | ||
Catherine Kennedy (Born 1969) | Secretary, since 2019 | Vice President of Wells Fargo Funds Management, LLC and Senior Counsel of the Wells Fargo Legal Department since 2010. Vice President and Senior Counsel of Evergreen Investment Management Company, LLC from 1998 to 2010. | ||
Michael H. Whitaker (Born 1967) | Chief Compliance Officer, since 2016 | Chief Compliance Officer of Wells Fargo Asset Management since 2016. Senior Vice President and Chief Compliance Officer for Fidelity Investments from 2007 to 2016. | ||
| 1 | Jeremy DePalma acts as Treasurer of 77 funds in the Fund Complex. |
| 2 | The Statement of Additional Information includes additional information about the Trustees and is available, without charge, upon request, by calling 1-800-222-8222 or by visiting the website at wfam.com. |
36 | Wells Fargo Emerging Markets Equity Income Fund
Table of Contents
Other information (unaudited)
BOARD CONSIDERATION OF INVESTMENT MANAGEMENT AND SUB-ADVISORY AGREEMENTS:
Wells Fargo Emerging Markets Equity Income Fund
Under the Investment Company Act of 1940 (the “1940 Act”), the Board of Trustees (the “Board”) of Wells Fargo Funds Trust (the “Trust”) must determine annually whether to approve the continuation of the Trust’s investment management and sub-advisory agreements. In this regard, at a Board meeting held on May 26, 2020 and May 28, 2020 (together, the “Meeting”), the Board, all the members of which have no direct or indirect interest in the investment management and sub-advisory agreements and are not “interested persons” of the Trust, as defined in the 1940 Act (the “Independent Trustees”), reviewed and approved for Wells Fargo Emerging Markets Equity Income Fund (the “Fund”): (i) an investment management agreement (the “Management Agreement”) with Wells Fargo Funds Management, LLC (“Funds Management”); and (ii) an investment sub-advisory agreement (the “Sub-Advisory Agreement”) with Wells Capital Management Incorporated (the “Sub-Adviser”), an affiliate of Funds Management. The Management Agreement and the Sub-Advisory Agreement are collectively referred to as the “Advisory Agreements.”
At the Meeting, the Board considered the factors and reached the conclusions described below relating to the selection of Funds Management and the Sub-Adviser and the approval of the Advisory Agreements. Prior to the Meeting, including at a Board meeting held in April 2020, the Trustees conferred extensively among themselves and with representatives of Funds Management about these matters. Also, the Board has adopted a team-based approach, with each team consisting of a sub-set of Trustees, to assist the full Board in the discharge of its duties in reviewing investment performance and other matters throughout the year. The Independent Trustees were assisted in their evaluation of the Advisory Agreements by independent legal counsel, from whom they received separate legal advice and with whom they met separately.
In providing information to the Board, Funds Management and the Sub-Adviser were guided by a detailed set of requests for information submitted to them by independent legal counsel on behalf of the Independent Trustees at the start of the Board’s annual contract renewal process earlier in 2020. In considering and approving the Advisory Agreements, the Trustees considered the information they believed relevant, including but not limited to the information discussed below. The Board considered not only the specific information presented in connection with the Meeting, but also the knowledge gained over time through interaction with Funds Management and the Sub-Adviser about various topics. In this regard, the Board reviewed reports of Funds Management at each of its quarterly meetings, which included, among other things, portfolio reviews and investment performance reports. In addition, the Board and the teams mentioned above confer with portfolio managers at various times throughout the year. The Board did not identify any particular information or consideration that was all-important or controlling, and each individual Trustee may have attributed different weights to various factors.
After its deliberations, the Board unanimously approved the continuation of the Advisory Agreements for a one-year term and determined that the compensation payable to Funds Management and the Sub-Adviser under each of the Advisory Agreements was reasonable. The Board considered the approval of the Advisory Agreements for the Fund as part of its consideration of agreements for funds across the complex, but its approvals were made on a fund-by-fund basis. The following summarizes a number of important, but not necessarily all, factors considered by the Board in support of its approvals.
Nature, extent and quality of services
The Board received and considered various information regarding the nature, extent and quality of services provided to the Fund by Funds Management and the Sub-Adviser under the Advisory Agreements. This information included a description of the investment advisory services and Fund-level administrative services covered by the Management Agreement, as well as, among other things, a summary of the background and experience of senior management of Wells Fargo Asset Management (“WFAM”), of which Funds Management and the Sub-Adviser are a part, and a summary of investments made in the business of WFAM. The Board also received a description of Funds Management’s and the Sub-Adviser’s business continuity plans and of their approaches to data privacy and cybersecurity, and related testing. The Board also received and reviewed information about Funds Management’s role as administrator of the Fund’s liquidity risk management program, Funds Management’s approach to risk management, and Funds Management’s intermediary and vendor oversight program.
The Board also considered the qualifications, background, tenure and responsibilities of each of the portfolio managers primarily responsible for the day-to-day portfolio management of the Fund. The Board evaluated the ability of Funds Management and the Sub-Adviser to attract and retain qualified investment professionals, including research, advisory and supervisory personnel. The Board further considered the compliance programs and compliance records of Funds Management and the Sub-Adviser. In addition, the Board took into account the full range of services provided to the Fund by Funds Management and its affiliates.
Wells Fargo Emerging Markets Equity Income Fund | 37
Table of Contents
Other information (unaudited)
Fund investment performance and expenses
The Board considered the investment performance results for the Fund over various time periods ended December 31, 2019. The Board also considered more current results for various time periods ended March 31, 2020. The Board considered these results in comparison to the investment performance of funds in a universe that was determined by Broadridge Inc. (“Broadridge”) to be similar to the Fund (the “Universe”), and in comparison to the Fund’s benchmark index and to other comparative data. Broadridge is an independent provider of investment company data. The Board received a description of the methodology used by Broadridge to select the mutual funds in the performance Universe. The Board noted that the investment performance of the Fund (Administrator Class) was lower than the average investment performance of the Universe for the one-, three- and five-year periods ended December 31, 2019. The Board also noted that the investment performance of the Fund (Administrator Class) was lower than the average investment performance of the Universe for all periods ended March 31, 2020. The Board also noted that the investment performance of the Fund was lower than its benchmark index, the MSCI Emerging Markets Index (Net), for all periods ended December 31, 2019. The Board also noted that the investment performance of the Fund was lower than its benchmark index, the MSCI Emerging Markets Index (Net), for all periods ended March 31, 2020.
The Board received information concerning, and discussed factors contributing to, the underperformance of the Fund relative to the Universe and benchmark for the periods identified above. The Board took note of the explanations for the relative underperformance during these periods, including with respect to investment decisions and market factors that affected the Fund’s investment performance.
The Board also received and considered information regarding the Fund’s net operating expense ratios and their various components, including actual management fees, custodian and other non-management fees, and Rule 12b-1 and non-Rule 12b-1 shareholder service fees. The Board considered these ratios in comparison to the median ratios of funds in class-specific expense groups that were determined by Broadridge to be similar to the Fund (the “Groups”). The Board received a description of the methodology used by Broadridge to select the mutual funds in the expense Groups and an explanation of how funds comprising expense groups and their expense ratios may vary from year-to-year. Based on the Broadridge reports, the Board noted that the net operating expense ratios of the Fund were equal to or in range of the median net operating expense ratios of the expense Groups for each share class.
The Board took into account the Fund’s investment performance and expense information provided to it among the factors considered in deciding to re-approve the Advisory Agreements.
Investment management and sub-advisory fee rates
The Board reviewed and considered the contractual fee rates payable by the Fund to Funds Management under the Management Agreement, as well as the contractual fee rates payable by the Fund to Funds Management for class-level administrative services under a Class-Level Administration Agreement, which include, among other things, class-level transfer agency and sub-transfer agency costs (collectively, the “Management Rates”). The Board also reviewed and considered the contractual investment sub-advisory fee rates that are payable by Funds Management to the Sub-Adviser for investment sub-advisory services.
Among other information reviewed by the Board was a comparison of the Fund’s Management Rates with the average contractual investment management fee rates of funds in the expense Groups at a common asset level as well as transfer agency costs of the funds in the expense Groups. The Board noted that the Management Rates of the Fund were lower than, equal to or in range of the sum of these average rates for the Fund’s expense Groups for all share classes, except the Administrator Class. The Board noted that the Management Rate of the Fund was higher than the sum of these average rates for the Fund’s expense Group for the Administrator Class, and that the Fund’s expense ratio caps, including the expense ratio caps for the Administrator Class, would be maintained.
The Board also received and considered information about the portion of the total management fee that was retained by Funds Management after payment of the fee to the Sub-Adviser for sub-advisory services. In assessing the reasonableness of this amount, the Board received and evaluated information about the nature and extent of responsibilities retained and risks assumed by Funds Management and not delegated to or assumed by the Sub-Adviser, and about Funds Management’s on-going oversight services. Given the affiliation between Funds Management and the Sub-Adviser, the Board ascribed limited relevance to the allocation of fees between them.
The Board also received and considered information about the nature and extent of services offered and fee rates charged by Funds Management and the Sub-Adviser to other types of clients with investment strategies similar to those of the Fund. In this regard, the Board received information about the significantly greater scope of services, and compliance, reporting and other legal burdens and risks of managing proprietary mutual funds compared with those associated with managing assets of other types of clients, including third-party sub-advised fund clients and non-mutual fund clients such as institutional separate accounts.
38 | Wells Fargo Emerging Markets Equity Income Fund
Table of Contents
Other information (unaudited)
Based on its consideration of the factors and information it deemed relevant, including those described here, the Board determined that the compensation payable to Funds Management under the Management Agreement and to the Sub-Adviser under the Sub-Advisory Agreement was reasonable.
Profitability
The Board received and considered information concerning the profitability of Funds Management, as well as the profitability of both WFAM and Wells Fargo & Co. (“Wells Fargo”) from providing services to the fund family as a whole. The Board noted that the Sub-Adviser’s profitability information with respect to providing services to the Fund and other funds in the family was subsumed in the WFAM and Wells Fargo profitability analysis.
Funds Management reported on the methodologies and estimates used in calculating profitability, including a description of the methodology used to allocate certain expenses. Among other things, the Board noted that the levels of profitability reported on a fund-by-fund basis varied widely, depending on factors such as the size, type and age of fund.
Based on its review, the Board did not deem the profits reported by Funds Management, WFAM or Wells Fargo from services provided to the Fund to be at a level that would prevent it from approving the continuation of the Advisory Agreements.
Economies of scale
The Board received and considered information about the potential for Funds Management to experience economies of scale in the provision of management services to the Fund, the difficulties of calculating economies of scale at an individual fund level, and the extent to which potential scale benefits are shared with shareholders. The Board noted the existence of breakpoints in the Fund’s management fee structure, which operate generally to reduce the Fund’s expense ratios as the Fund grows in size, and the size of the Fund in relation to such breakpoints. The Board considered that in addition to management fee breakpoints, Funds Management shares potential economies of scale from its management business in a variety of ways, including through fee waiver and expense reimbursement arrangements, services that benefit shareholders, competitive management fee rates set at the outset without regard to breakpoints, and investments in the business intended to enhance services available to shareholders.
The Board concluded that Funds Management’s arrangements with respect to the Fund, including contractual breakpoints, constituted a reasonable approach to sharing potential economies of scale with the Fund and its shareholders.
Other benefits to Funds Management and the Sub-Adviser
The Board received and considered information regarding potential “fall-out” or ancillary benefits received by Funds Management and its affiliates, including the Sub-Adviser, as a result of their relationships with the Fund. Ancillary benefits could include, among others, benefits directly attributable to other relationships with the Fund and benefits potentially derived from an increase in Funds Management’s and the Sub-Adviser’s business as a result of their relationships with the Fund. The Board noted that various affiliates of Funds Management may receive distribution-related fees, shareholder servicing payments and sub-transfer agency fees in respect of shares sold or held through them and services provided.
The Board also reviewed information about soft dollar credits earned and utilized by the Sub-Adviser, fees earned by Funds Management and the Sub-Adviser from managing a private investment vehicle for the fund family’s securities lending collateral, and commissions earned by an affiliated broker from portfolio transactions.
Based on its consideration of the factors and information it deemed relevant, including those described here, the Board did not find that any ancillary benefits received by Funds Management and its affiliates, including the Sub-Adviser, were unreasonable.
Conclusion
At the Meeting, after considering the above-described factors and based on its deliberations and its evaluation of the information described above, the Board unanimously approved the continuation of the Advisory Agreements for a one-year term and determined that the compensation payable to Funds Management and the Sub-Adviser under each of the Advisory Agreements was reasonable.
Wells Fargo Emerging Markets Equity Income Fund | 39
Table of Contents
Other information (unaudited)
LIQUIDITY RISK MANAGEMENT PROGRAM
In accordance with Rule 22e-4 under the Investment Company Act of 1940, as amended (the “Liquidity Rule”), Wells Fargo Funds Trust (the “Trust”) has adopted and implemented a liquidity risk management program (the “Program”) on behalf of each of its series, including the Fund, which is reasonably designed to assess and manage the Fund’s liquidity risk. “Liquidity risk” is defined as the risk that the Fund is unable to meet redemption requests without significantly diluting remaining investors’ interests in the Fund. The Trust’s Board of Trustees (the “Board”) previously approved the designation of Wells Fargo Funds Management, LLC (“Funds Management”), the Fund’s investment manager, as the administrator of the Program, and Funds Management has established a Liquidity Risk Management Council composed of personnel from multiple departments within Funds Management and its affiliates to assist Funds Management in the implementation and on-going administration of the Program.
The Program is comprised of various components designed to support the assessment and/or management of liquidity risk, including: (1) the periodic assessment (no less frequently than annually) of certain factors that influence the Fund’s liquidity risk; (2) the periodic classification (no less frequently than monthly) of the Fund’s investments into one of four liquidity categories that reflect an estimate of their liquidity under current market conditions; (3) a 15% limit on the acquisition of “illiquid investments” (as defined under the Liquidity Rule); (4) to the extent the Fund does not invest primarily in “highly liquid investments” (as defined under the Liquidity Rule), the determination of a minimum percentage of the Fund’s assets that generally will be invested in highly liquid investments (an “HLIM”); (5) if the Fund has established an HLIM, the periodic review (no less frequently than annually) of the HLIM and the adoption of policies and procedures for responding to a shortfall of the Fund’s “highly liquid investments” below its HLIM; and (6) periodic reporting to the Board.
At a meeting of the Board held on May 26 and 28, 2020, the Board received a written report (the “Report”) from Funds Management that addressed the operation of the Program and assessed its adequacy and effectiveness of implementation. The Report covered the initial period from December 1, 2018 through December 31, 2019 (the “Reporting Period”). No significant liquidity events impacting the Fund were noted in the Report. There were no material changes to the Program during the Reporting Period. The Report concluded that the Program is operating effectively to assess and manage the Fund’s liquidity risk, and that the Program has been and continues to be adequately and effectively implemented to monitor and, as applicable, respond to the Fund’s liquidity developments.
There can be no assurance that the Program will achieve its objectives under all circumstances in the future. Please refer to the Fund’s prospectus for more information regarding the Fund’s exposure to liquidity risk and other risks to which an investment in the Fund may be subject.
40 | Wells Fargo Emerging Markets Equity Income Fund
Table of Contents
For more information
More information about Wells Fargo Funds is available free upon request. To obtain literature, please write, visit the Fund’s website, or call:
Wells Fargo Funds
P.O. Box 219967
Kansas City, MO 64121-9967
Website: wfam.com
Individual investors: 1-800-222-8222
Retail investment professionals: 1-888-877-9275
Institutional investment professionals: 1-866-765-0778

This report and the financial statements contained herein are submitted for the general information of the shareholders of the Fund. If this report is used for promotional purposes, distribution of the report must be accompanied or preceded by a current prospectus. Before investing, please consider the investment objectives, risks, charges, and expenses of the investment. For a current prospectus and, if available, a summary prospectus, containing this information, call 1-800-222-8222 or visit the Fund’s website at wfam.com. Read the prospectus carefully before you invest or send money.
Wells Fargo Asset Management (WFAM) is the trade name for certain investment advisory/management firms owned by Wells Fargo & Company. These firms include but are not limited to Wells Capital Management Incorporated and Wells Fargo Funds Management, LLC. Certain products managed by WFAM entities are distributed by Wells Fargo Funds Distributor, LLC (a broker-dealer and Member FINRA).
This material is for general informational and educational purposes only and is NOT intended to provide investment advice or a recommendation of any kind—including a recommendation for any specific investment, strategy, or plan.
INVESTMENT PRODUCTS: NOT FDIC INSURED ◾ NO BANK GUARANTEE ◾ MAY LOSE VALUE
© 2020 Wells Fargo & Company. All rights reserved.
PAR-1120-00556 12-20
A262/AR262 10-20
Table of Contents

Annual Report
October 31, 2020
Wells Fargo Global Small Cap Fund
Beginning on January 1, 2021, as permitted by new regulations adopted by the Securities and Exchange Commission, paper copies of the Wells Fargo Funds’ annual and semi-annual shareholder reports issued after this date will no longer be sent by mail, unless you specifically request paper copies of the reports. Instead, the reports will be made available on the Funds’ website, and you will be notified by mail each time a report is posted and provided with a website address to access the report.
If you already elected to receive shareholder reports electronically, you will not be affected by this change and you need not take any action. You may elect to receive shareholder reports and other communications from the Fund electronically at any time by contacting your financial intermediary (such as a broker-dealer or bank) or, if you are a direct investor, by calling 1-800-222-8222 or by enrolling at wellsfargo.com/advantagedelivery.
You may elect to receive all future reports in paper free of charge. If you invest through a financial intermediary, you can contact your financial intermediary to request that you continue to receive paper copies of your shareholder reports; if you invest directly with the Fund, you can call 1-800-222-8222. Your election to receive reports in paper will apply to all Wells Fargo Funds held in your account with your financial intermediary or, if you are a direct investor, to all Wells Fargo Funds that you hold.
Table of Contents
|
Reduce clutter. Save trees. |
Sign up for of prospectuses |
The views expressed and any forward-looking statements are as of October 31, 2020, unless otherwise noted, and are those of the Fund’s portfolio managers and/or Wells Fargo Asset Management. Discussions of individual securities, or the markets generally, or any Wells Fargo Fund are not intended as individual recommendations. Future events or results may vary significantly from those expressed in any forward-looking statements. The views expressed are subject to change at any time in response to changing circumstances in the market. Wells Fargo Asset Management and the Fund disclaim any obligation to publicly update or revise any views expressed or forward-looking statements.
INVESTMENT PRODUCTS: NOT FDIC INSURED ◾ NO BANK GUARANTEE ◾ MAY LOSE VALUE
Wells Fargo Global Small Cap Fund | 1
Table of Contents
Letter to shareholders (unaudited)

Andrew Owen
President
Wells Fargo Funds
Dear Shareholder:
We are pleased to offer you this annual report for the Wells Fargo Global Small Cap Fund for the 12-month period that ended October 31, 2020. Global stock markets saw earlier gains erased in March as governments around the world took unprecedented measures, attempting to stop the spread of COVID-19 at the expense of short-term economic output. However, markets rallied strongly from April through period-end to offset those short-term losses as central banks bolstered capital markets and confidence.
For the 12-month period, equities had generally positive total returns despite intense volatility in March. Non-U.S. developed market equities had weaker performance than emerging market and U.S. stocks. While gains from fixed-income securities were positive, they were more modest than equities. For the period, U.S. stocks, based on the S&P 500 Index,1 gained 9.71%. International stocks, as measured by the MSCI ACWI ex USA Index (Net),2 returned -2.61%, while the MSCI EM Index (Net)3 had stronger performance, with a 8.25% gain. Among bond indices, the Bloomberg Barclays U.S. Aggregate Bond Index4 returned 6.19%, the Bloomberg Barclays Global Aggregate ex-USD Index5 gained 4.96%, and the Bloomberg Barclays Municipal Bond Index6 returned 3.59% while the ICE BofA U.S. High Yield Index7 returned 2.54%.
The period began with buoyed investor confidence.
Equity markets rallied in November despite ongoing geopolitical risks. Hopes for a U.S.-China trade deal buoyed investor confidence. U.S. business sentiment improved slightly and manufacturing and services activity picked up. While consumer confidence and purchasing managers’ activity rose in the eurozone, China reported weakening manufacturing and consumer data. Bond yields rose marginally, leading to slightly negative returns for global government and investment-grade corporate bonds.
Financial markets ended 2019 boosted by the U.S. and China accord on a Phase One trade deal. That, along with the landslide election win by the pro-Brexit U.K. Conservative Party and ongoing central bank support, gave investors greater confidence. U.S. economic indicators were generally positive, with the exception of manufacturing activity and business confidence. Consumer confidence was fed by a robust labor market, tame inflation, and lower interest rates, which boosted housing affordability and stimulated homebuyer activity. The impeachment of President Trump had little market impact. Meanwhile, slowing Chinese economic activity, partly a result of the trade war, led to further government stimulus at year-end through lower reserve ratios, allowing banks to lend more money.
| 1 | The S&P 500 Index consists of 500 stocks chosen for market size, liquidity, and industry group representation. It is a market-value-weighted index with each stock’s weight in the index proportionate to its market value. You cannot invest directly in an index. |
| 2 | The Morgan Stanley Capital International (MSCI) All Country World Index (ACWI) ex USA Index (Net) is a free-float-adjusted market-capitalization-weighted index that is designed to measure the equity market performance of developed and emerging markets, excluding the United States. Source: MSCI. MSCI makes no express or implied warranties or representations and shall have no liability whatsoever with respect to any MSCI data contained herein. The MSCI data may not be further redistributed or used as a basis for other indices or any securities or financial products. This report is not approved, reviewed, or produced by MSCI. You cannot invest directly in an index. |
| 3 | The MSCI Emerging Markets (EM) Index (Net) is a free-float-adjusted market-capitalization-weighted index that is designed to measure equity market performance of emerging markets. You cannot invest directly in an index. |
| 4 | The Bloomberg Barclays U.S. Aggregate Bond Index is a broad-based benchmark that measures the investment-grade, U.S. dollar-denominated, fixed-rate taxable bond market, including Treasuries, government-related and corporate securities, mortgage-backed securities (agency fixed-rate and hybrid adjustable-rate mortgage pass-throughs), asset-backed securities, and commercial mortgage-backed securities. You cannot invest directly in an index. |
| 5 | The Bloomberg Barclays Global Aggregate ex-USD Index is an unmanaged index that provides a broad-based measure of the global investment-grade fixed-income markets excluding the U.S. dollar-denominated debt market. You cannot invest directly in an index. |
| 6 | The Bloomberg Barclays Municipal Bond Index is an unmanaged index composed of long-term tax-exempt bonds with a minimum credit rating of Baa. You cannot invest directly in an index. |
| 7 | The ICE BofA U.S. High Yield Index is a market-capitalization-weighted index of domestic and Yankee high-yield bonds. The index tracks the performance of high-yield securities traded in the U.S. bond market. You cannot invest directly in an index. Copyright 2020. ICE Data Indices, LLC. All rights reserved. |
2 | Wells Fargo Global Small Cap Fund
Table of Contents
Letter to shareholders (unaudited)
The 2019 year-end rally continued in early January 2020. However, capital market volatility spiked in late January on concerns over the potential impact of COVID-19 on the global economy and stock markets. With sentiment somewhat souring, perceived safe havens did well in January. The U.S. dollar and Japanese yen both rose and government bonds outperformed equities. While the S&P 500 Index held its ground, emerging market equities tumbled, including those in Asia.
In February, COVID-19 became the major market focus. Fears of the virus’s impact on global growth led to expectations of increased global central bank monetary policy support. That led the 10-year U.S. Treasury yield to fall to an all-time low of 1.1%. Although equity markets initially shrugged off concerns about the outbreak, focusing instead on strong fourth-quarter earnings and improving business confidence in January, market sentiment turned sharply lower and the S&P 500 Index lost 8.2% for the month. Oil prices tumbled as Russia and the Organization of the Petroleum Exporting Countries compounded a major decline in oil demand with a brutal price war, partly aimed at dissuading further U.S. shale production, causing the price of West Texas Intermediate crude oil to plummet.
The global spread of COVID-19 in March led country after country to clamp down on social- and business-related activity in order to contain the virus from causing even greater devastation and overwhelming health care systems. This abrupt stoppage of economic activity led to the sharp deceleration of global output, sending economies into a deep contraction. Central banks responded swiftly, slashing interest rates and expanding quantitative easing programs to restore liquidity and confidence in the markets. In the U.S., the Federal Reserve (Fed) introduced several new lending programs, funding investment-grade bonds, money market mutual funds, and commercial paper while purchasing Treasuries, mortgage-backed securities, and overnight repurchase agreements. Meanwhile, stock markets tumbled quickly into a bear market, ending the longest bull stock market in U.S. history.
Markets rebounded strongly in April, fueled by unprecedented government and central bank stimulus measures. The U.S. economy contracted by an annualized 5.0% pace in the first quarter of 2020, with 30 million new unemployment insurance claims in six weeks. In the eurozone, first-quarter real gross domestic product (GDP) shrank 3.8% with the composite April Flash Purchasing Managers’ Index (PMI), a monthly survey of purchasing managers, falling to an all-time low of 13.5. The European Central Bank expanded its quantitative easing to include the purchase of additional government bonds of countries with the greatest virus-related need, including Italy and Spain. China’s first-quarter GDP fell by 6.8% year over year. However, retail sales, production, and investment showed signs of recovery. Extreme oil-price volatility continued as global supply far exceeded demand.
The global equity market rebound continued in May, with widespread advances. Investors regained confidence on reports of early signs of success in human trials of a COVID-19 vaccine. Growth stocks continued to outperform value stocks while returns on global government bonds were generally flat. In the U.S., a gap grew between the stock market rebound and economic data, including an April unemployment rate of 14.7%, the highest level since World War II. Manufacturing and services purchasing managers’ indices reflected widespread weakening activity in May. U.S. corporate earnings reports indicated a 14% year-over-year contraction in earnings from the first quarter of 2019. However, high demand for technology, driven by remote activity, supported robust information technology sector earnings, which helped drive major technology stocks higher.
Financial markets posted widely positive returns in June despite ongoing economic weakness and high levels of uncertainty on the containment of COVID-19 and the timing of an effective vaccine. There were hopeful signs as economies reopened. Vitally important to market sentiment was the ongoing commitment by central banks globally
“The global spread of COVID-19 in March led country after country to clamp down on social- and business-related activity in order to contain the virus from causing even greater devastation and overwhelming health care systems.”
Wells Fargo Global Small Cap Fund | 3
Table of Contents
Letter to shareholders (unaudited)
“In October, capital markets took a step back from their six-month rally. Market volatility rose in advance of the U.S. election and amid a global increase in COVID-19 infections.”
to do all they can to provide economic support through liquidity and low borrowing costs. U.S. economic activity was aided by one-time $1,200 stimulus checks and $600 weekly bonus unemployment benefits that expired at the end of July. However, unemployment remained historically high, easing somewhat from 14.7% in April to 11.1% in June. By the end of June, numerous states reported increases of COVID-19 cases. China’s economic recovery picked up momentum in June, though it remained far from a full recovery.
July was broadly positive for both global equities and fixed income. However, economic data and a resurgence of COVID-19 cases pointed to the vulnerability of the global economy and the ongoing imperative to regain control of the pandemic. Second-quarter GDP shrank from the previous quarter by 9.5% and 12.1% in the U.S. and the eurozone, respectively. In contrast, China reported a 3.2% year-over-year expansion in its second-quarter GDP. U.S. unemployment remained high despite adding 1.8 million jobs in July, with a double-digit jobless rate persisting. However, manufacturing activity grew in both the U.S. and the eurozone. In Asia, while China’s manufacturing sector continued to expand, activity in Japan and South Korea contracted. A rising concern was the rapid and broad reemergence of COVID-19 infections.
The stock market continued to rally in August despite concerns over rising numbers of COVID-19 cases in the United States and several European countries, including France and Spain, as well as the July expiration of the $600 weekly bonus unemployment benefit. U.S. stocks had strong monthly gains, surpassing broadly positive overall global equity performance, while fixed-income market monthly returns were broadly flat. Generally stronger-than-expected second-quarter earnings boosted investor sentiment along with the Fed’s announcement of a policy shift that will likely lead to longer-term low interest rates and supportive monetary policy. U.S. indices measuring manufacturing and services activities beat expectations while the U.S. housing market maintained strength. In Europe, retail sales expanded and consumer confidence was steady. China’s economy continued to expand.
Stocks grew more volatile in September on mixed economic data. U.S. economic activity continued to grow. However, six months after the bottom fell out of the labor market in early spring, only half of the 22 million jobs lost had returned. The U.S. unemployment rate fell to 7.9% in September, reflecting steady improvement but far higher than the 3.5% pre-COVID-19 rate. Only 661,000 jobs were added for the month, down from 1.5 million in August. Meanwhile, a reported 2.3 million people have given up looking for work. With U.S. Congress failing to pass further fiscal relief and uncertainties surrounding a possible vaccine, doubts crept back into the financial markets. In the U.K., a lack of progress in Brexit talks with the European Union weighed on markets. China’s economy picked up steam, however, with growth fueled by increased global demand, and China’s services sector rallied.
In October, capital markets took a step back from their six-month rally. Market volatility rose in advance of the U.S. election and amid a global increase in COVID-19 infections. Europe responded with a new round of restrictions affecting economic activity. Meanwhile, Brexit remained unresolved as the European Union and the U.K. failed to strike a deal by a mid-October deadline. U.S. markets looked favorably at a possible Democratic sweep and control of the federal purse strings as that could lead to the passage of long-awaited additional fiscal stimulus, which could boost economic activity. Meanwhile, China continued to stand apart, reporting 4.9% third-quarter GDP growth year over year.
4 | Wells Fargo Global Small Cap Fund
Table of Contents
Letter to shareholders (unaudited)
Don’t let short-term uncertainty derail long-term investment goals.
Periods of investment uncertainty can present challenges, but experience has taught us that maintaining long-term investment goals can be an effective way to plan for the future. To help you create a sound strategy based on your personal goals and risk tolerance, Wells Fargo Funds offers more than 100 mutual funds spanning a wide range of asset classes and investment styles. Although diversification cannot guarantee an investment profit or prevent losses, we believe it can be an effective way to manage investment risk and potentially smooth out overall portfolio performance. We encourage investors to know their investments and to understand that appropriate levels of risk-taking may unlock opportunities.
Thank you for choosing to invest with Wells Fargo Funds. We appreciate your confidence in us and remain committed to helping you meet your financial needs.
Sincerely,

Andrew Owen
President
Wells Fargo Funds
|
For further information about your Fund, contact your investment professional, visit our website at wfam.com, or call us directly at 1-800-222-8222. |
Notice to Shareholders
At a meeting held on August 10-12, 2020, the Board of Trustees of the Fund approved a change to the Fund’s automatic conversion feature for Class C shares in order to shorten the required holding period from 10 to 8 years. As a result, on a monthly basis beginning November 5, 2020, Class C shares will convert automatically into Class A shares 8 years after the initial date of purchase or, if you acquired your Class C shares through an exchange or conversion from another share class, 8 years after the date you acquired your Class C shares. When Class C shares that you acquired through a purchase or exchange convert, any other Class C shares that you purchased with reinvested dividends and distributions also will convert into Class A shares on a pro rata basis.
Please note that a shorter holding period may apply depending on your intermediary. Please see “Appendix A—Sales Charge Reductions and Waivers for Certain Intermediaries” in the Fund’s prospectus for further information.
Wells Fargo Global Small Cap Fund | 5
Table of Contents
Performance highlights (unaudited)
Investment objective
The Fund seeks long-term capital appreciation.
Manager
Wells Fargo Funds Management, LLC
Subadviser
Wells Capital Management Incorporated
Portfolio managers
Stephen Giggie, CFA®‡*
Oleg Makhorine
Brian Martin, CFA®‡*
James M. Tringas, CFA®‡
Bryant VanCronkhite, CFA®‡, CPA
Average annual total returns (%) as of October 31, 2020
| Including sales charge | Excluding sales charge | Expense ratios1 (%) | ||||||||||||||||||||||||||||||||
| Inception date | 1 year | 5 year | 10 year | 1 year | 5 year | 10 year | Gross | Net2 | ||||||||||||||||||||||||||
| Class A (EKGAX) | 3-16-1988 | -9.35 | 6.23 | 6.63 | -3.81 | 7.49 | 7.27 | 1.54 | 1.54 | |||||||||||||||||||||||||
| Class C (EKGCX) | 2-1-1993 | -5.25 | 6.75 | 6.50 | -4.25 | 6.75 | 6.50 | 2.29 | 2.29 | |||||||||||||||||||||||||
| Administrator Class (EKGYX) | 1-13-1997 | – | – | – | -3.61 | 7.66 | 7.44 | 1.46 | 1.41 | |||||||||||||||||||||||||
| Institutional Class (EKGIX) | 7-30-2010 | – | – | – | -3.42 | 7.91 | 7.70 | 1.21 | 1.16 | |||||||||||||||||||||||||
| S&P Developed SmallCap Index3 | – | – | – | – | 0.05 | 6.65 | 8.42 | – | – | |||||||||||||||||||||||||
Figures quoted represent past performance, which is no guarantee of future results, and do not reflect taxes that a shareholder may pay on an investment in a fund. Investment return and principal value of an investment will fluctuate so that an investor’s shares, when redeemed, may be worth more or less than their original cost. Performance shown without sales charges would be lower if sales charges were reflected. Current performance may be lower or higher than the performance data quoted, which assumes the reinvestment of dividends and capital gains. Current month-end performance is available on the Fund’s website, wfam.com.
Index returns do not include transaction costs associated with buying and selling securities, any mutual fund fees or expenses, or any taxes. It is not possible to invest directly in an index.
For Class A shares, the maximum front-end sales charge is 5.75%. For Class C shares, the maximum contingent deferred sales charge is 1.00%. Performance including a contingent deferred sales charge assumes the sales charge for the corresponding time period. Administrator Class and Institutional Class shares are sold without a front-end sales charge or contingent deferred sales charge.
Stock values fluctuate in response to the activities of individual companies and general market and economic conditions. Foreign investments are especially volatile and can rise or fall dramatically due to differences in the political and economic conditions of the host country. These risks are generally intensified in emerging markets. The use of derivatives may reduce returns and/or increase volatility. Certain investment strategies tend to increase the total risk of an investment (relative to the broader market). The Fund is exposed to geographic risk and smaller-company securities risk. Consult the Fund’s prospectus for additional information on these and other risks.
Please see footnotes on page 7.
6 | Wells Fargo Global Small Cap Fund
Table of Contents
Performance highlights (unaudited)
| Growth of $10,000 investment as of October 31, 20204 |
|
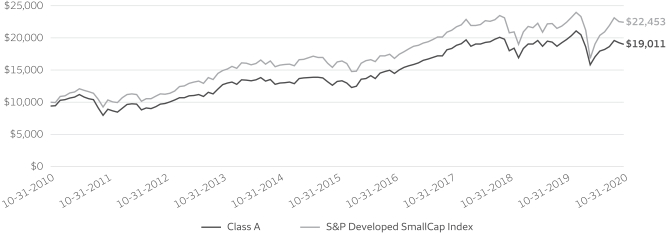
| ‡ | CFA® and Chartered Financial Analyst® are trademarks owned by CFA Institute. |
| * | Mr. Giggie and Mr. Martin became portfolio managers of the Fund on April 15, 2020. |
| 1 | Reflects the expense ratios as stated in the most recent prospectuses, which include the impact of 0.01% in acquired fund fees and expenses. The expense ratios shown are subject to change and may differ from the annualized expense ratios shown in the financial highlights of this report, which do not include acquired fund fees and expenses. |
| 2 | The manager has contractually committed through February 28, 2021, to waive fees and/or reimburse expenses to the extent necessary to cap total annual fund operating expenses after fee waivers at 1.55% for Class A, 2.30% for Class C, 1.40% for Administrator Class, and 1.15% for Institutional Class. Brokerage commissions, stamp duty fees, interest, taxes, acquired fund fees and expenses (if any), and extraordinary expenses are excluded from the expense caps. Prior to or after the commitment expiration date, the caps may be increased or the commitment to maintain the caps may be terminated only with the approval of the Board of Trustees. Without these caps, the Fund’s returns would have been lower. The expense ratio paid by an investor is the net expense ratio (the total annual fund operating expenses after fee waivers) as stated in the prospectuses. |
| 3 | The S&P Developed SmallCap Index is a free-float-adjusted market-capitalization-weighted index designed to measure the equity market performance of small-capitalization companies located in developed markets. The index is composed of companies within the bottom 15% of the cumulative market capitalization in developed markets. The index covers all publicly listed equities with float-adjusted market values of U.S. $100 million or more and annual dollar value traded of at least U.S. $50 million in all included countries. You cannot invest directly in an index. |
| 4 | The chart compares the performance of Class A shares for the most recent ten years with the S&P Developed SmallCap Index. The chart assumes a hypothetical investment of $10,000 in Class A shares and reflects all operating expenses and assumes the maximum initial sales charge of 5.75%. |
| 5 | The ten largest holdings, excluding cash, cash equivalents and any money market funds, are calculated based on the value of the investments divided by total net assets of the Fund. Holdings are subject to change and may have changed since the date specified. |
| 6 | Amounts are calculated based on the total long-term investments of the Fund. These amounts are subject to change and may have changed since the date specified. |
Wells Fargo Global Small Cap Fund | 7
Table of Contents
Performance highlights (unaudited)
MANAGER’S DISCUSSION
Fund highlights
| ∎ | The Fund underperformed its benchmark, the S&P Developed SmallCap Index, for the 12-month period that ended October 31, 2020. |
| ∎ | Stock selection in the information technology (IT) and health care sectors detracted from relative performance. |
| ∎ | Security selection in the U.S. and Japan detracted. |
| ∎ | Stock selection in the consumer staples sector and an underweight to the financials sector contributed to relative performance. |
| ∎ | Regionally, security selection in the U.K. and Asia ex-Japan contributed to performance. |
Global equity markets and the S&P Developed SmallCap Index saw a significant increase in volatility during the period as the COVID-19 virus pressured stocks and economies across geographies. Despite the steep drawdown in equity markets in March, global small-cap stocks experienced a sharp recovery over the pursuant six months as central banks stabilized markets and investors optimistically looked toward a global economic recovery. The U.K. was the worst-performing region as ongoing Brexit negotiations between Europe and the U.K. added to concerns surrounding the virus.
During the period, the team made modest changes to sector and regional exposures within the Fund based on our bottom-up reward/risk valuation process. As bottom-up investors, we evaluate how global macroeconomic events might affect the Fund’s holdings, but we don’t try to forecast the outcomes. The Fund’s security selection within the U.S. was the largest detractor, while stock selection in the U.K. was the largest contributor to relative returns. We aim to use market volatility opportunistically. We will seek to use any future volatility to our advantage through our bottom-up stock-selection process.
| Ten largest holdings (%) as of October 31, 20205 | ||||
Novanta Incorporated | 3.25 | |||
Innospec Incorporated | 3.15 | |||
CSW Industrials Incorporated | 3.14 | |||
Helen of Troy Limited | 2.63 | |||
CBIZ Incorporated | 2.57 | |||
CorVel Corporation | 2.51 | |||
Stepan Company | 2.47 | |||
CyberArk Software Limited | 2.29 | |||
Denny’s Corporation | 2.26 | |||
Mayville Engineering Company | 2.07 | |||
Stock selection in IT and health care detracted from relative performance.
Alten S.A. is a French-based engineering and technology consulting services firm. Alten’s customers faced headwinds during the pandemic that pressured the stock, but we believe the company provides vital research and development (R&D) services, which is the lifeline of many of its customers. We believe the recent market turmoil is likely to favor the decision to outsource R&D projects versus in-house development as management teams seek to optimize their cost structures. Alten has a strong financial profile and we believe it offers an attractive long-term reward/risk profile.
Natus Medical Incorporated is a medical device company specializing in screening products. The business suffered a COVID-19-related slowdown in hospital spending and screening volumes during the period, but we believe its capital-light business model, underused balance sheet, and strong cash generation should provide great flexibility if volumes were to continue to be affected by the virus.
Stock selection in the consumer staples sector and an underweight to the financials sector contributed to relative performance.
In the consumer staples sector, Central Garden & Pet Company was a significant contributor. The company produces and distributes products for the lawn and garden and pet supplies markets in the U.S. The company benefited from increased pet ownership and a shift toward e-commerce during the pandemic. Given the strong balance sheet, we continue to see opportunities for increased share repurchase and accretive bolt-on acquisitions in a highly fragmented industry.
The Fund’s underweight to financials contributed to relative results. The underweight is driven by the better reward/risk opportunities found in other sectors that possess stronger competitive advantages and can more freely deploy capital without regulatory constraints.
Please see footnotes on page 7.
8 | Wells Fargo Global Small Cap Fund
Table of Contents
Performance highlights (unaudited)
| Sector allocation as of October 31, 20206 |
|
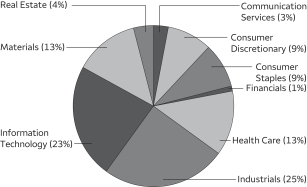
| Geographic allocation as of October 31, 20206 |
|
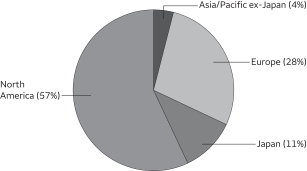
Our investment philosophy focuses on company-specific factors rather than on headline-dominating macroeconomic events.
As we look toward the end of 2020 and beyond, we see numerous market forces at play that could bring further volatility. Market participants continue to watch the post-COVID-19 recovery of global economic growth and central bank policy. We are not experts in forecasting macro or political events. However, we believe it is always prudent to protect downside risks and be opportunistic when short-term macro or political events create valuation dislocations from a company’s long-term fundamentals.
We believe our fundamental analysis, risk management, and active investment process are well suited to take advantage of new opportunities as the equity market evolves. While volatility may increase, we believe the strong balance sheets and stable cash flow of the companies in our portfolio should support consistent long-term performance.
Please see footnotes on page 7.
Wells Fargo Global Small Cap Fund | 9
Table of Contents
As a shareholder of the Fund, you incur two types of costs: (1) transaction costs, including sales charges (loads) on purchase payments and contingent deferred sales charges (if any) on redemptions and (2) ongoing costs, including management fees, distribution (12b-1) and/or shareholder servicing fees, and other Fund expenses. This example is intended to help you understand your ongoing costs (in dollars) of investing in the Fund and to compare these costs with the ongoing costs of investing in other mutual funds.
The example is based on an investment of $1,000 invested at the beginning of the six-month period and held for the entire period from May 1, 2020 to October 31, 2020.
Actual expenses
The “Actual” line of the table below provides information about actual account values and actual expenses. You may use the information in this line, together with the amount you invested, to estimate the expenses that you paid over the period. Simply divide your account value by $1,000 (for example, an $8,600 account value divided by $1,000 = 8.6), then multiply the result by the number in the “Actual” line under the heading entitled “Expenses paid during period” for your applicable class of shares to estimate the expenses you paid on your account during this period.
Hypothetical example for comparison purposes
The “Hypothetical” line of the table below provides information about hypothetical account values and hypothetical expenses based on the Fund’s actual expense ratio and an assumed rate of return of 5% per year before expenses, which is not the Fund’s actual return. The hypothetical account values and expenses may not be used to estimate the actual ending account balance or expenses you paid for the period. You may use this information to compare the ongoing costs of investing in the Fund and other funds. To do so, compare this 5% hypothetical example with the 5% hypothetical examples that appear in the shareholder reports of the other funds.
Please note that the expenses shown in the table are meant to highlight your ongoing costs only and do not reflect any transactional costs, such as sales charges (loads) and contingent deferred sales charges. Therefore, the “Hypothetical” line of the table is useful in comparing ongoing costs only and will not help you determine the relative total costs of owning different funds. In addition, if these transactional costs were included, your costs would have been higher.
| Beginning account value 5-1-2020 | Ending account value 10-31-2020 | Expenses paid during the period1 | Annualized net expense ratio | |||||||||||||
Class A | ||||||||||||||||
Actual | $ | 1,000.00 | $ | 1,113.22 | $ | 8.13 | 1.53 | % | ||||||||
Hypothetical (5% return before expenses) | $ | 1,000.00 | $ | 1,017.44 | $ | 7.76 | 1.53 | % | ||||||||
Class C | ||||||||||||||||
Actual | $ | 1,000.00 | $ | 1,112.32 | $ | 12.11 | 2.28 | % | ||||||||
Hypothetical (5% return before expenses) | $ | 1,000.00 | $ | 1,013.67 | $ | 11.54 | 2.28 | % | ||||||||
Administrator Class | ||||||||||||||||
Actual | $ | 1,000.00 | $ | 1,114.93 | $ | 7.44 | 1.40 | % | ||||||||
Hypothetical (5% return before expenses) | $ | 1,000.00 | $ | 1,018.10 | $ | 7.10 | 1.40 | % | ||||||||
Institutional Class | ||||||||||||||||
Actual | $ | 1,000.00 | $ | 1,115.78 | $ | 6.12 | 1.15 | % | ||||||||
Hypothetical (5% return before expenses) | $ | 1,000.00 | $ | 1,019.36 | $ | 5.84 | 1.15 | % | ||||||||
| 1 | Expenses paid is equal to the annualized net expense ratio of each class multiplied by the average account value over the period, multiplied by the number of days in the most recent fiscal half-year divided by the number of days in the fiscal year (to reflect the one-half-year period). |
10 | Wells Fargo Global Small Cap Fund
Table of Contents
Portfolio of investments—October 31, 2020
| Shares | Value | |||||||||||||||
| Common Stocks: 99.25% |
| |||||||||||||||
| Australia: 3.46% | ||||||||||||||||
Ansell Limited (Health Care, Health Care Equipment & Supplies) | 154,039 | $ | 4,355,772 | |||||||||||||
Domino’s Pizza Enterprises Limited (Consumer Discretionary, Hotels, Restaurants & Leisure) | 40,906 | 2,436,428 | ||||||||||||||
Inghams Group Limited (Consumer Staples, Food Products) | 197,330 | 397,064 | ||||||||||||||
Orora Limited (Materials, Containers & Packaging) | 348,480 | 631,557 | ||||||||||||||
| 7,820,821 | ||||||||||||||||
|
| |||||||||||||||
| Austria: 0.60% | ||||||||||||||||
Mayr-Melnhof Karton AG (Materials, Containers & Packaging) | 8,321 | 1,358,686 | ||||||||||||||
|
| |||||||||||||||
| Belgium: 1.08% | ||||||||||||||||
Barco NV (Information Technology, Electronic Equipment, Instruments & Components) | 156,331 | 2,452,371 | ||||||||||||||
|
| |||||||||||||||
| Canada: 5.22% | ||||||||||||||||
BlackBerry Limited NYSE (Information Technology, Software) †« | 330,627 | 1,484,515 | ||||||||||||||
Blackberry Limited TSX (Information Technology, Software) † | 225,300 | 1,011,254 | ||||||||||||||
Novanta Incorporated (Information Technology, Electronic Equipment, Instruments & Components) † | 67,619 | 7,351,538 | ||||||||||||||
Primo Water Corporation (Consumer Staples, Beverages) | 156,635 | 1,963,375 | ||||||||||||||
| 11,810,682 | ||||||||||||||||
|
| |||||||||||||||
| France: 2.58% | ||||||||||||||||
Alten SA (Information Technology, IT Services) † | 45,701 | 3,659,211 | ||||||||||||||
M6 Métropole Télévision SA (Communication Services, Media) † | 122,120 | 1,341,425 | ||||||||||||||
Mersen SA (Industrials, Electrical Equipment) † | 32,088 | 832,513 | ||||||||||||||
| 5,833,149 | ||||||||||||||||
|
| |||||||||||||||
| Germany: 4.55% | ||||||||||||||||
Cancom SE (Information Technology, IT Services) | 26,727 | 1,056,620 | ||||||||||||||
Gerresheimer AG (Health Care, Life Sciences Tools & Services) | 42,156 | 4,237,706 | ||||||||||||||
Krones AG (Industrials, Machinery) | 21,429 | 1,224,407 | ||||||||||||||
TAG Immobilien AG (Real Estate, Real Estate Management & Development) | 128,183 | 3,777,505 | ||||||||||||||
| 10,296,238 | ||||||||||||||||
|
| |||||||||||||||
| Hong Kong: 0.14% | ||||||||||||||||
iClick Interactive Asia Group Limited (Communication Services, Media) † | 39,000 | 310,830 | ||||||||||||||
|
| |||||||||||||||
| Ireland: 0.85% | ||||||||||||||||
Irish Residential Properties REIT plc (Real Estate, Equity REITs) | 1,202,337 | 1,918,414 | ||||||||||||||
|
| |||||||||||||||
| Italy: 2.89% | ||||||||||||||||
De’Longhi SpA (Consumer Discretionary, Household Durables) † | 53,397 | 1,707,727 | ||||||||||||||
GVS SpA (Health Care, Health Care Equipment & Supplies) † | 171,271 | 2,413,596 | ||||||||||||||
Interpump Group SpA (Industrials, Machinery) | 64,156 | 2,423,265 | ||||||||||||||
| 6,544,588 | ||||||||||||||||
|
| |||||||||||||||
| Japan: 10.61% | ||||||||||||||||
Aeon Delight Company Limited (Industrials, Commercial Services & Supplies) | 95,200 | 2,506,223 | ||||||||||||||
Daiseki Company Limited (Industrials, Commercial Services & Supplies) | 94,800 | 2,413,212 | ||||||||||||||
DTS Corporation (Information Technology, IT Services) | 159,900 | 3,109,893 | ||||||||||||||
Fuji Seal International Incorporated (Materials, Containers & Packaging) | 125,600 | 2,346,060 | ||||||||||||||
Horiba Limited (Information Technology, Electronic Equipment, Instruments & Components) | 24,800 | 1,219,947 | ||||||||||||||
Meitec Corporation (Industrials, Professional Services) | 51,400 | 2,548,163 | ||||||||||||||
Nihon Parkerizing Company Limited (Materials, Chemicals) | 258,600 | 2,548,521 | ||||||||||||||
ORIX JREIT Incorporated (Real Estate, Equity REITs) | 1,747 | 2,455,250 | ||||||||||||||
Paramount Bed Holdings Company Limited (Health Care, Health Care Equipment & Supplies) | 13,800 | 531,684 | ||||||||||||||
San-A Company Limited (Consumer Staples, Food & Staples Retailing) | 30,600 | 1,274,509 | ||||||||||||||
The accompanying notes are an integral part of these financial statements.
Wells Fargo Global Small Cap Fund | 11
Table of Contents
Portfolio of investments—October 31, 2020
| Shares | Value | |||||||||||||||
| Japan (continued) | ||||||||||||||||
Sumitomo Warehouse Company Limited (Industrials, Transportation Infrastructure) | 170,800 | $ | 1,997,839 | |||||||||||||
Taikisha Limited (Industrials, Construction & Engineering) | 40,400 | 1,052,127 | ||||||||||||||
| 24,003,428 | ||||||||||||||||
|
| |||||||||||||||
| Luxembourg: 0.27% | ||||||||||||||||
Stabilus SA (Industrials, Machinery) | 10,914 | 618,751 | ||||||||||||||
|
| |||||||||||||||
| Netherlands: 1.14% | ||||||||||||||||
Brunel International NV (Industrials, Professional Services) † | 69,533 | 493,178 | ||||||||||||||
IMCD Group NV (Industrials, Trading Companies & Distributors) | 14,462 | 1,673,846 | ||||||||||||||
TKH Group NV (Industrials, Electrical Equipment) | 12,645 | 407,153 | ||||||||||||||
| 2,574,177 | ||||||||||||||||
|
| |||||||||||||||
| Norway: 0.41% | ||||||||||||||||
Atea ASA (Information Technology, IT Services) | 80,475 | 935,023 | ||||||||||||||
|
| |||||||||||||||
| Singapore: 0.50% | ||||||||||||||||
CapitaLand Mall Trust (Real Estate, Equity REITs) | 900,216 | 1,141,075 | ||||||||||||||
|
| |||||||||||||||
| Spain: 2.02% | ||||||||||||||||
Vidrala SA (Materials, Containers & Packaging) | 14,064 | 1,343,130 | ||||||||||||||
Viscofan SA (Consumer Staples, Food Products) | 47,795 | 3,225,755 | ||||||||||||||
| 4,568,885 | ||||||||||||||||
|
| |||||||||||||||
| Sweden: 1.30% | ||||||||||||||||
AAK AB (Consumer Staples, Food Products) † | 102,574 | 1,996,315 | ||||||||||||||
Hexpol AB (Materials, Chemicals) † | 106,559 | 938,505 | ||||||||||||||
| 2,934,820 | ||||||||||||||||
|
| |||||||||||||||
| Switzerland: 1.02% | ||||||||||||||||
Bossard Holding AG (Industrials, Trading Companies & Distributors) | 4,487 | 728,948 | ||||||||||||||
Bucher Industries AG (Industrials, Machinery) | 4,112 | 1,585,267 | ||||||||||||||
| 2,314,215 | ||||||||||||||||
|
| |||||||||||||||
| United Kingdom: 8.83% | ||||||||||||||||
Britvic plc (Consumer Staples, Beverages) | 328,116 | 3,135,356 | ||||||||||||||
Domino’s Pizza Group plc (Consumer Discretionary, Hotels, Restaurants & Leisure) | 511,093 | 2,194,375 | ||||||||||||||
Elementis plc (Materials, Chemicals) † | 926,635 | 893,139 | ||||||||||||||
Lancashire Holdings Limited (Financials, Insurance) | 83,139 | 686,105 | ||||||||||||||
Mears Group plc (Industrials, Commercial Services & Supplies) † | 140,070 | 191,229 | ||||||||||||||
Morgan Advanced Materials plc (Industrials, Machinery) | 296,619 | 961,122 | ||||||||||||||
NCC Group plc (Information Technology, IT Services) | 409,452 | 971,682 | ||||||||||||||
S4 Capital plc (Communication Services, Media) † | 842,287 | 4,364,730 | ||||||||||||||
Spectris plc (Information Technology, Electronic Equipment, Instruments & Components) | 101,635 | 3,262,003 | ||||||||||||||
Tate & Lyle plc (Consumer Staples, Food Products) | 160,285 | 1,235,601 | ||||||||||||||
THG Holdings plc (Consumer Discretionary, Internet & Direct Marketing Retail) † | 245,048 | 2,093,963 | ||||||||||||||
| 19,989,305 | ||||||||||||||||
|
| |||||||||||||||
| United States: 51.78% | ||||||||||||||||
ACI Worldwide Incorporated (Information Technology, Software) † | 157,100 | 4,582,607 | ||||||||||||||
Ajax I Unit (Financials, Consumer Finance) † | 62,675 | 631,764 | ||||||||||||||
Apogee Enterprises Incorporated (Industrials, Building Products) |
| 20,600 | 492,134 | |||||||||||||
Balchem Corporation (Materials, Chemicals) |
| 41,600 | 4,157,920 | |||||||||||||
BJ’s Wholesale Club Holdings Incorporated (Consumer Staples, Food & Staples Retailing) † |
| 61,800 | 2,366,322 | |||||||||||||
Blackbaud Incorporated (Information Technology, Software) |
| 59,000 | 2,911,060 | |||||||||||||
Bottomline Technologies (DE) Incorporated (Information Technology, Software) † |
| 60,100 | 2,387,172 | |||||||||||||
The accompanying notes are an integral part of these financial statements.
12 | Wells Fargo Global Small Cap Fund
Table of Contents
Portfolio of investments—October 31, 2020
| Shares | Value | |||||||||||||||
| United States (continued) | ||||||||||||||||
CBIZ Incorporated (Industrials, Professional Services) † |
| 256,639 | $ | 5,818,006 | ||||||||||||
Central Garden & Pet Company Class A (Consumer Staples, Household Products) † |
| 109,946 | 3,890,989 | |||||||||||||
CorVel Corporation (Health Care, Health Care Providers & Services) † |
| 62,200 | 5,673,884 | |||||||||||||
CSW Industrials Incorporated (Industrials, Building Products) |
| 83,163 | 7,112,931 | |||||||||||||
CyberArk Software Limited (Information Technology, Software) † |
| 52,300 | 5,185,545 | |||||||||||||
Denny’s Corporation (Consumer Discretionary, Hotels, Restaurants & Leisure) † |
| 571,154 | 5,117,540 | |||||||||||||
EnPro Industries Incorporated (Industrials, Machinery) |
| 65,700 | 3,877,614 | |||||||||||||
Euronet Worldwide Incorporated (Information Technology, IT Services) † |
| 44,300 | 3,935,612 | |||||||||||||
Freshpet Incorporated (Consumer Staples, Food Products) † |
| 3,800 | 435,100 | |||||||||||||
Gibraltar Industries Incorporated (Industrials, Building Products) † |
| 75,000 | 4,308,750 | |||||||||||||
Healthcare Services Group Incorporated (Industrials, Commercial Services & Supplies) |
| 184,800 | 4,228,224 | |||||||||||||
Helen of Troy Limited (Consumer Discretionary, Household Durables) † |
| 31,400 | 5,953,440 | |||||||||||||
ICU Medical Incorporated (Health Care, Health Care Equipment & Supplies) † |
| 14,900 | 2,649,071 | |||||||||||||
Ingevity Corporation (Materials, Chemicals) † |
| 59,300 | 3,254,384 | |||||||||||||
Innospec Incorporated (Materials, Chemicals) |
| 107,716 | 7,124,336 | |||||||||||||
Mayville Engineering Company (Industrials, Machinery) † |
| 526,200 | 4,688,442 | |||||||||||||
Natus Medical Incorporated (Health Care, Health Care Equipment & Supplies) † |
| 171,900 | 3,130,299 | |||||||||||||
Neogen Corporation (Health Care, Health Care Equipment & Supplies) † |
| 36,100 | 2,517,614 | |||||||||||||
NuVasive Incorporated (Health Care, Health Care Equipment & Supplies) † |
| 7,700 | 342,111 | |||||||||||||
PAE Incorporated (Industrials, Aerospace & Defense) † |
| 171,600 | 1,359,072 | |||||||||||||
Progress Software Corporation (Information Technology, Software) |
| 95,400 | 3,469,698 | |||||||||||||
Rogers Corporation (Information Technology, Electronic Equipment, Instruments & Components) † |
| 26,400 | 3,200,208 | |||||||||||||
Standex International Corporation (Industrials, Machinery) |
| 27,551 | 1,710,642 | |||||||||||||
Stepan Company (Materials, Chemicals) |
| 48,000 | 5,589,120 | |||||||||||||
Tupperware Brands Corporation (Consumer Discretionary, Household Durables) † |
| 62,607 | 1,985,894 | |||||||||||||
Varex Imaging Corporation (Health Care, Health Care Equipment & Supplies) † |
| 186,700 | 2,501,780 | |||||||||||||
Vital Farms Incorporated (Consumer Staples, Food Products) † |
| 16,909 | 584,375 | |||||||||||||
| 117,173,660 | ||||||||||||||||
|
| |||||||||||||||
Total Common Stocks (Cost $205,947,101) |
| 224,599,118 | ||||||||||||||
|
| |||||||||||||||
| Expiration date | ||||||||||||||||
| Rights: 0.03% |
| |||||||||||||||
| Spain: 0.03% | ||||||||||||||||
Vidrala SA (Materials, Containers & Packaging) † | 11-5-2020 | 14,064 | 67,075 | |||||||||||||
|
| |||||||||||||||
Total Rights (Cost $0) |
| 67,075 | ||||||||||||||
|
| |||||||||||||||
| Yield | ||||||||||||||||
| Short-Term Investments: 1.34% | ||||||||||||||||
| Investment Companies: 1.34% | ||||||||||||||||
Securities Lending Cash Investments LLC (l)(r)(u) | 0.12 | % | 1,400,775 | 1,400,775 | ||||||||||||
Wells Fargo Government Money Market Fund Select Class (l)(u) | 0.03 | 1,627,131 | 1,627,131 | |||||||||||||
Total Short-Term Investments (Cost $3,027,906) |
| 3,027,906 | ||||||||||||||
|
| |||||||||||||||
| Total investments in securities (Cost $208,975,007) | 100.62 | % | 227,694,099 | |||||
Other assets and liabilities, net | (0.62 | ) | (1,413,791 | ) | ||||
|
|
|
| |||||
| Total net assets | 100.00 | % | $ | 226,280,308 | ||||
|
|
|
| |||||
The accompanying notes are an integral part of these financial statements.
Wells Fargo Global Small Cap Fund | 13
Table of Contents
Portfolio of investments—October 31, 2020
| † | Non-income-earning security |
| « | All or a portion of this security is on loan. |
| (l) | The issuer of the security is an affiliated person of the Fund as defined in the Investment Company Act of 1940. |
| (r) | The investment is a non-registered investment company purchased with cash collateral received from securities on loan. |
| (u) | The rate represents the 7-day annualized yield at period end. |
Abbreviations:
| REIT | Real estate investment trust |
Investments in Affiliates
An affiliated investment is an investment in which the Fund owns at least 5% of the outstanding voting shares of the issuer or as a result of other relationships, such as the Fund and the issuer having the same investment manager. Transactions with issuers that were either affiliated persons of the Fund at the beginning of the period or the end of the period were as follows:
Value, beginning of period | Purchases | Sale proceeds | Net realized gains (losses) | Net change in unrealized gains (losses) | Value, end of | % of net assets | Shares end of | Income from affiliated securities | ||||||||||||||||||||||||||||
| Short-Term Investments | ||||||||||||||||||||||||||||||||||||
Investment Companies | ||||||||||||||||||||||||||||||||||||
Securities Lending Cash Investments LLC | $ | 9,480,677 | $ | 43,117,152 | $ | (51,196,932 | ) | $ | (277 | ) | $ | 155 | $ | 1,400,775 | 1,400,775 | $ | 52,257 | # | ||||||||||||||||||
Wells Fargo Government Money Market Fund Select Class | 14,798,744 | 115,577,504 | (128,749,117 | ) | 0 | 0 | 1,627,131 | 1,627,131 | 72,986 | |||||||||||||||||||||||||||
|
|
|
|
|
|
|
|
|
| |||||||||||||||||||||||||||
| $ | (277 | ) | $ | 155 | $ | 3,027,906 | 1.34 | % | $ | 125,243 | ||||||||||||||||||||||||||
|
|
|
|
|
|
|
|
|
| |||||||||||||||||||||||||||
| # | Amount shown represents income before fees and rebates. |
The accompanying notes are an integral part of these financial statements.
14 | Wells Fargo Global Small Cap Fund
Table of Contents
Statement of assets and liabilities—October 31, 2020
Assets | ||||
Investments in unaffiliated securities (including $1,324,101 of securities loaned), at value (cost $205,947,101) | $ | 224,666,193 | ||
Investments in affiliated securities, at value (cost $3,027,906) | 3,027,906 | |||
Foreign currency, at value (cost $262,326) | 261,238 | |||
Receivable for investments sold | 353,342 | |||
Receivable for Fund shares sold | 106,787 | |||
Receivable for dividends | 525,399 | |||
Receivable for securities lending income, net | 715 | |||
Prepaid expenses and other assets | 154,736 | |||
|
| |||
Total assets | 229,096,316 | |||
|
| |||
Liabilities | ||||
Payable upon receipt of securities loaned | 1,398,148 | |||
Payable for investments purchased | 767,719 | |||
Payable for Fund shares redeemed | 275,458 | |||
Management fee payable | 233,760 | |||
Administration fees payable | 35,133 | |||
Distribution fee payable | 3,870 | |||
Trustees’ fees and expenses payable | 2,883 | |||
Accrued expenses and other liabilities | 99,037 | |||
|
| |||
Total liabilities | 2,816,008 | |||
|
| |||
Total net assets | $ | 226,280,308 | ||
|
| |||
Net assets consist of | ||||
Paid-in capital | $ | 211,936,404 | ||
Total distributable earnings | 14,343,904 | |||
|
| |||
Total net assets | $ | 226,280,308 | ||
|
| |||
Computation of net asset value and offering price per share |
| |||
Net assets – Class A | $ | 113,234,213 | ||
Shares outstanding – Class A1 | 3,070,851 | |||
Net asset value per share – Class A | $36.87 | |||
Maximum offering price per share – Class A2 | $39.12 | |||
Net assets – Class C | $ | 5,576,427 | ||
Shares outstanding – Class C1 | 228,014 | |||
Net asset value per share – Class C | $24.46 | |||
Net assets – Administrator Class | $ | 20,157,077 | ||
Shares outstanding – Administrator Class1 | 518,152 | |||
Net asset value per share – Administrator Class | $38.90 | |||
Net assets – Institutional Class | $ | 87,312,591 | ||
Shares outstanding – Institutional Class1 | 2,253,935 | |||
Net asset value per share – Institutional Class | $38.74 | |||
| 1 | The Fund has an unlimited number of authorized shares. |
| 2 | Maximum offering price is computed as 100/94.25 of net asset value. On investments of $50,000 or more, the offering price is reduced. |
The accompanying notes are an integral part of these financial statements.
Wells Fargo Global Small Cap Fund | 15
Table of Contents
Statement of operations—year ended October 31, 2020
Investment income | ||||
Dividends (net of foreign withholding taxes of $239,002) | $ | 2,964,638 | ||
Income from affiliated securities | 97,310 | |||
|
| |||
Total investment income | 3,061,948 | |||
|
| |||
Expenses | ||||
Management fee | 2,302,002 | |||
Administration fees | ||||
Class A | 260,612 | |||
Class C | 13,704 | |||
Administrator Class | 29,058 | |||
Institutional Class | 116,138 | |||
Shareholder servicing fees | ||||
Class A | 309,722 | |||
Class C | 16,294 | |||
Administrator Class | 55,666 | |||
Distribution fee | ||||
Class C | 48,835 | |||
Custody and accounting fees | 95,117 | |||
Professional fees | 59,677 | |||
Registration fees | 71,695 | |||
Shareholder report expenses | 47,629 | |||
Trustees’ fees and expenses | 21,096 | |||
Other fees and expenses | 25,804 | |||
|
| |||
Total expenses | 3,473,049 | |||
Less: Fee waivers and/or expense reimbursements | ||||
Fund-level | (17,783 | ) | ||
Class A | (2,312 | ) | ||
Class C | (41 | ) | ||
Administrator Class | (12,258 | ) | ||
Institutional Class | (48,328 | ) | ||
|
| |||
Net expenses | 3,392,327 | |||
|
| |||
Net investment loss | (330,379 | ) | ||
|
| |||
Payment from affiliate | 31,816 | |||
|
| |||
Realized and unrealized gains (losses) on investments | ||||
Net realized losses on | ||||
Unaffiliated securities | (2,457,721 | ) | ||
Affiliated securities | (277 | ) | ||
|
| |||
Net realized losses on investments | (2,457,998 | ) | ||
|
| |||
Net change in unrealized gains (losses) on | ||||
Unaffiliated securities | (10,036,811 | ) | ||
Affiliated securities | 155 | |||
|
| |||
Net change in unrealized gains (losses) on investments | (10,036,656 | ) | ||
|
| |||
Net realized and unrealized gains (losses) on investments | (12,494,654 | ) | ||
|
| |||
Net decrease in net assets resulting from operations | $ | (12,793,217 | ) | |
|
| |||
The accompanying notes are an integral part of these financial statements.
16 | Wells Fargo Global Small Cap Fund
Table of Contents
Statement of changes in net assets
| Year ended October 31, 2020 | Year ended October 31, 2019 | |||||||||||||||
Operations | ||||||||||||||||
Net investment income (loss) | $ | (330,379 | ) | $ | 1,734,804 | |||||||||||
Payment from affiliate | 31,816 | 0 | ||||||||||||||
Net realized gains (losses) on investments | (2,457,998 | ) | 8,227,354 | |||||||||||||
Net change in unrealized gains (losses) on investments | (10,036,656 | ) | 16,847,695 | |||||||||||||
|
| |||||||||||||||
Net increase (decrease) in net assets resulting from operations | (12,793,217 | ) | 26,809,853 | |||||||||||||
|
| |||||||||||||||
Distributions to shareholders from net investment income and net realized gains | ||||||||||||||||
Class A | (6,017,486 | ) | (11,274,268 | ) | ||||||||||||
Class C | (322,666 | ) | (3,147,113 | ) | ||||||||||||
Administrator Class | (1,051,538 | ) | (2,341,670 | ) | ||||||||||||
Institutional Class | (4,699,341 | ) | (9,652,016 | ) | ||||||||||||
|
| |||||||||||||||
Total distributions to shareholders | (12,091,031 | ) | (26,415,067 | ) | ||||||||||||
|
| |||||||||||||||
Capital share transactions | Shares | Shares | ||||||||||||||
Proceeds from shares sold | ||||||||||||||||
Class A | 99,738 | 3,668,097 | 576,819 | 21,721,631 | ||||||||||||
Class C | 38,536 | 1,005,317 | 51,591 | 1,282,247 | ||||||||||||
Administrator Class | 77,261 | 2,930,808 | 84,145 | 3,339,231 | ||||||||||||
Institutional Class | 638,138 | 25,177,197 | 582,827 | 22,915,443 | ||||||||||||
|
| |||||||||||||||
| 32,781,419 | 49,258,552 | |||||||||||||||
|
| |||||||||||||||
Reinvestment of distributions | ||||||||||||||||
Class A | 138,110 | 5,585,707 | 292,824 | 10,332,358 | ||||||||||||
Class C | 11,409 | 301,552 | 129,340 | 3,066,652 | ||||||||||||
Administrator Class | 24,314 | 1,036,690 | 62,335 | 2,314,119 | ||||||||||||
Institutional Class | 107,830 | 4,582,469 | 244,000 | 9,022,788 | ||||||||||||
|
| |||||||||||||||
| 11,506,418 | 24,735,917 | |||||||||||||||
|
| |||||||||||||||
Payment for shares redeemed | ||||||||||||||||
Class A | (704,685 | ) | (25,380,114 | ) | (657,034 | ) | (25,025,424 | ) | ||||||||
Class C | (105,548 | ) | (2,603,717 | ) | (831,182 | ) | (20,927,562 | ) | ||||||||
Administrator Class | (171,844 | ) | (6,616,175 | ) | (225,448 | ) | (9,166,433 | ) | ||||||||
Institutional Class | (973,251 | ) | (36,235,708 | ) | (1,183,246 | ) | (47,220,970 | ) | ||||||||
|
| |||||||||||||||
| (70,835,714 | ) | (102,340,389 | ) | |||||||||||||
|
| |||||||||||||||
Net decrease in net assets resulting from capital share transactions | (26,547,877 | ) | (28,345,920 | ) | ||||||||||||
|
| |||||||||||||||
Total decrease in net assets | (51,432,125 | ) | (27,951,134 | ) | ||||||||||||
|
| |||||||||||||||
Net assets | ||||||||||||||||
Beginning of period | 277,712,433 | 305,663,567 | ||||||||||||||
|
| |||||||||||||||
End of period | $ | 226,280,308 | $ | 277,712,433 | ||||||||||||
|
| |||||||||||||||
The accompanying notes are an integral part of these financial statements.
Wells Fargo Global Small Cap Fund | 17
Table of Contents
(For a share outstanding throughout each period)
| Year ended October 31 | ||||||||||||||||||||
| CLASS A | 2020 | 2019 | 2018 | 2017 | 2016 | |||||||||||||||
Net asset value, beginning of period | $39.97 | $39.97 | $45.81 | $38.61 | $37.23 | |||||||||||||||
Net investment income (loss) | (0.10 | )1 | 0.18 | 1 | 0.10 | 0.21 | 1 | 0.26 | 1 | |||||||||||
Net realized and unrealized gains (losses) on investments | (1.29 | ) | 3.26 | (0.72 | ) | 9.68 | 2.92 | |||||||||||||
|
|
|
|
|
|
|
|
|
| |||||||||||
Total from investment operations | (1.39 | ) | 3.44 | (0.62 | ) | 9.89 | 3.18 | |||||||||||||
Distributions to shareholders from | ||||||||||||||||||||
Net investment income | (0.54 | ) | (0.03 | ) | (0.22 | ) | (0.34 | ) | (0.21 | ) | ||||||||||
Net realized gains | (1.17 | ) | (3.41 | ) | (5.00 | ) | (2.35 | ) | (1.59 | ) | ||||||||||
|
|
|
|
|
|
|
|
|
| |||||||||||
Total distributions to shareholders | (1.71 | ) | (3.44 | ) | (5.22 | ) | (2.69 | ) | (1.80 | ) | ||||||||||
Net asset value, end of period | $36.87 | $39.97 | $39.97 | $45.81 | $38.61 | |||||||||||||||
Total return2 | (3.81 | )% | 9.75 | % | (1.82 | )% | 26.90 | % | 9.12 | % | ||||||||||
Ratios to average net assets (annualized) | ||||||||||||||||||||
Gross expenses | 1.54 | % | 1.53 | % | 1.54 | % | 1.54 | % | 1.55 | % | ||||||||||
Net expenses | 1.53 | % | 1.53 | % | 1.54 | % | 1.54 | % | 1.55 | % | ||||||||||
Net investment income (loss) | (0.27 | )% | 0.47 | % | 0.16 | % | 0.52 | % | 0.73 | % | ||||||||||
Supplemental data | ||||||||||||||||||||
Portfolio turnover rate | 65 | % | 62 | % | 51 | % | 70 | % | 70 | % | ||||||||||
Net assets, end of period (000s omitted) | $113,234 | $141,388 | $132,906 | $155,828 | $138,805 | |||||||||||||||
| 1 | Calculated based upon average shares outstanding |
| 2 | Total return calculations do not include any sales charges. |
The accompanying notes are an integral part of these financial statements.
18 | Wells Fargo Global Small Cap Fund
Table of Contents
Financial highlights
(For a share outstanding throughout each period)
| Year ended October 31 | ||||||||||||||||||||
| CLASS C | 2020 | 2019 | 2018 | 2017 | 2016 | |||||||||||||||
Net asset value, beginning of period | $26.68 | $28.02 | $33.65 | $28.98 | $28.39 | |||||||||||||||
Net investment loss | (0.25 | )1 | (0.07 | )1 | (0.20 | ) | (0.06 | )1 | (0.01 | )1 | ||||||||||
Payment from affiliate | 0.07 | 0.00 | 0.00 | 0.00 | 0.00 | |||||||||||||||
Net realized and unrealized gains (losses) on investments | (0.87 | ) | 2.14 | (0.43 | ) | 7.15 | 2.19 | |||||||||||||
|
|
|
|
|
|
|
|
|
| |||||||||||
Total from investment operations | (1.05 | ) | 2.07 | (0.63 | ) | 7.09 | 2.18 | |||||||||||||
Distributions to shareholders from | ||||||||||||||||||||
Net investment income | 0.00 | 0.00 | 0.00 | (0.07 | ) | 0.00 | ||||||||||||||
Net realized gains | (1.17 | ) | (3.41 | ) | (5.00 | ) | (2.35 | ) | (1.59 | ) | ||||||||||
|
|
|
|
|
|
|
|
|
| |||||||||||
Total distributions to shareholders | (1.17 | ) | (3.41 | ) | (5.00 | ) | (2.42 | ) | (1.59 | ) | ||||||||||
Net asset value, end of period | $24.46 | $26.68 | $28.02 | $33.65 | $28.98 | |||||||||||||||
Total return2 | (4.25 | )%3 | 8.90 | % | (2.56 | )% | 25.95 | % | 8.31 | % | ||||||||||
Ratios to average net assets (annualized) | ||||||||||||||||||||
Gross expenses | 2.29 | % | 2.28 | % | 2.29 | % | 2.29 | % | 2.30 | % | ||||||||||
Net expenses | 2.28 | % | 2.28 | % | 2.29 | % | 2.29 | % | 2.30 | % | ||||||||||
Net investment loss | (1.00 | )% | (0.26 | )% | (0.59 | )% | (0.20 | )% | (0.02 | )% | ||||||||||
Supplemental data | ||||||||||||||||||||
Portfolio turnover rate | 65 | % | 62 | % | 51 | % | 70 | % | 70 | % | ||||||||||
Net assets, end of period (000s omitted) | $5,576 | $7,567 | $26,167 | $31,487 | $32,863 | |||||||||||||||
| 1 | Calculated based upon average shares outstanding |
| 2 | Total return calculations do not include any sales charges. |
| 3 | During the year ended October 31, 2020, the Fund received a payment from an affiliate which had a 0.28% impact on the total return. See Note 4 in the Notes to Financial Statements for additional information. |
The accompanying notes are an integral part of these financial statements.
Wells Fargo Global Small Cap Fund | 19
Table of Contents
Financial highlights
(For a share outstanding throughout each period)
| Year ended October 31 | ||||||||||||||||||||
| ADMINISTRATOR CLASS | 2020 | 2019 | 2018 | 2017 | 2016 | |||||||||||||||
Net asset value, beginning of period | $42.06 | $41.90 | $47.78 | $40.15 | $38.65 | |||||||||||||||
Net investment income (loss) | (0.05 | )1 | 0.25 | 1 | 0.14 | 1 | 0.29 | 1 | 0.41 | |||||||||||
Payment from affiliate | 0.03 | 0.00 | 0.00 | 0.00 | 0.00 | |||||||||||||||
Net realized and unrealized gains (losses) on investments | (1.36 | ) | 3.42 | (0.73 | ) | 10.07 | 2.95 | |||||||||||||
|
|
|
|
|
|
|
|
|
| |||||||||||
Total from investment operations | (1.38 | ) | 3.67 | (0.59 | ) | 10.36 | 3.36 | |||||||||||||
Distributions to shareholders from | ||||||||||||||||||||
Net investment income | (0.61 | ) | (0.10 | ) | (0.29 | ) | (0.38 | ) | (0.27 | ) | ||||||||||
Net realized gains | (1.17 | ) | (3.41 | ) | (5.00 | ) | (2.35 | ) | (1.59 | ) | ||||||||||
|
|
|
|
|
|
|
|
|
| |||||||||||
Total distributions to shareholders | (1.78 | ) | (3.51 | ) | (5.29 | ) | (2.73 | ) | (1.86 | ) | ||||||||||
Net asset value, end of period | $38.90 | $42.06 | $41.90 | $47.78 | $40.15 | |||||||||||||||
Total return | (3.61 | )%2 | 9.90 | % | (1.68 | )% | 27.04 | % | 9.30 | % | ||||||||||
Ratios to average net assets (annualized) | ||||||||||||||||||||
Gross expenses | 1.46 | % | 1.45 | % | 1.46 | % | 1.46 | % | 1.47 | % | ||||||||||
Net expenses | 1.40 | % | 1.40 | % | 1.40 | % | 1.40 | % | 1.40 | % | ||||||||||
Net investment income (loss) | (0.13 | )% | 0.63 | % | 0.30 | % | 0.68 | % | 0.90 | % | ||||||||||
Supplemental data | ||||||||||||||||||||
Portfolio turnover rate | 65 | % | 62 | % | 51 | % | 70 | % | 70 | % | ||||||||||
Net assets, end of period (000s omitted) | $20,157 | $24,746 | $27,965 | $30,327 | $30,832 | |||||||||||||||
| 1 | Calculated based upon average shares outstanding |
| 2 | During the year ended October 31, 2020, the Fund received a payment from an affiliate which had a 0.08% impact on the total return. See Note 4 in the Notes to Financial Statements for additional information. |
The accompanying notes are an integral part of these financial statements.
20 | Wells Fargo Global Small Cap Fund
Table of Contents
Financial highlights
(For a share outstanding throughout each period)
| Year ended October 31 | ||||||||||||||||||||
| INSTITUTIONAL CLASS | 2020 | 2019 | 2018 | 2017 | 2016 | |||||||||||||||
Net asset value, beginning of period | $41.92 | $41.80 | $47.68 | $40.08 | $38.63 | |||||||||||||||
Net investment income | 0.02 | 0.36 | 0.25 | 0.38 | 0.45 | |||||||||||||||
Net realized and unrealized gains (losses) on investments | (1.31 | ) | 3.39 | (0.74 | ) | 10.06 | 3.00 | |||||||||||||
|
|
|
|
|
|
|
|
|
| |||||||||||
Total from investment operations | (1.29 | ) | 3.75 | (0.49 | ) | 10.44 | 3.45 | |||||||||||||
Distributions to shareholders from | ||||||||||||||||||||
Net investment income | (0.72 | ) | (0.22 | ) | (0.39 | ) | (0.49 | ) | (0.41 | ) | ||||||||||
Net realized gains | (1.17 | ) | (3.41 | ) | (5.00 | ) | (2.35 | ) | (1.59 | ) | ||||||||||
|
|
|
|
|
|
|
|
|
| |||||||||||
Total distributions to shareholders | (1.89 | ) | (3.63 | ) | (5.39 | ) | (2.84 | ) | (2.00 | ) | ||||||||||
Net asset value, end of period | $38.74 | $41.92 | $41.80 | $47.68 | $40.08 | |||||||||||||||
Total return | (3.42 | )% | 10.17 | % | (1.45 | )% | 27.38 | % | 9.56 | % | ||||||||||
Ratios to average net assets (annualized) | ||||||||||||||||||||
Gross expenses | 1.21 | % | 1.20 | % | 1.21 | % | 1.21 | % | 1.22 | % | ||||||||||
Net expenses | 1.15 | % | 1.15 | % | 1.15 | % | 1.15 | % | 1.15 | % | ||||||||||
Net investment income | 0.11 | % | 0.86 | % | 0.54 | % | 1.01 | % | 1.20 | % | ||||||||||
Supplemental data | ||||||||||||||||||||
Portfolio turnover rate | 65 | % | 62 | % | 51 | % | 70 | % | 70 | % | ||||||||||
Net assets, end of period (000s omitted) | $87,313 | $104,011 | $118,625 | $41,087 | $12,531 | |||||||||||||||
The accompanying notes are an integral part of these financial statements.
Wells Fargo Global Small Cap Fund | 21
Table of Contents
1. ORGANIZATION
Wells Fargo Funds Trust (the “Trust”), a Delaware statutory trust organized on March 10, 1999, is an open-end management investment company registered under the Investment Company Act of 1940, as amended (the “1940 Act”). As an investment company, the Trust follows the accounting and reporting guidance in Financial Accounting Standards Board (“FASB”) Accounting Standards Codification Topic 946, Financial Services – Investment Companies. These financial statements report on the Wells Fargo Global Small Cap Fund (the “Fund”) which is a diversified series of the Trust.
2. SIGNIFICANT ACCOUNTING POLICIES
The following significant accounting policies, which are consistently followed in the preparation of the financial statements of the Fund, are in conformity with U.S. generally accepted accounting principles which require management to make estimates and assumptions that affect the reported amounts of assets and liabilities, disclosure of contingent assets and liabilities at the date of the financial statements, and the reported amounts of revenues and expenses during the reporting period. Actual results could differ from those estimates.
Securities valuation
All investments are valued each business day as of the close of regular trading on the New York Stock Exchange (generally 4 p.m. Eastern Time), although the Fund may deviate from this calculation time under unusual or unexpected circumstances.
Equity securities that are listed on a foreign or domestic exchange or market are valued at the official closing price or, if none, the last sales price. If no sale occurs on the principal exchange or market that day, a fair value price will be determined in accordance with the Fund’s Valuation Procedures.
The values of securities denominated in foreign currencies are translated into U.S. dollars at rates provided by an independent foreign currency pricing source at a time each business day specified by the Wells Fargo Asset Management Pricing Committee at Wells Fargo Funds Management, LLC (“Funds Management”).
Many securities markets and exchanges outside the U.S. close prior to the close of the New York Stock Exchange and therefore may not fully reflect trading or events that occur after the close of the principal exchange in which the foreign securities are traded, but before the close of the New York Stock Exchange. If such trading or events are expected to materially affect the value of such securities, then fair value pricing procedures approved by the Board of Trustees of the Fund are applied. These procedures take into account multiple factors including movements in U.S. securities markets after foreign exchanges close. Foreign securities that are fair valued under these procedures are categorized as Level 2 and the application of these procedures may result in transfers between Level 1 and Level 2. Depending on market activity, such fair valuations may be frequent. Such fair value pricing may result in net asset values that are higher or lower than net asset values based on the last reported sales price or latest quoted bid price. On October 31, 2020, such fair value pricing was used in pricing certain foreign securities.
Investments in registered open-end investment companies are valued at net asset value. Interests in non-registered investment companies that are redeemable at net asset value are fair valued normally at net asset value.
Investments which are not valued using any of the methods discussed above are valued at their fair value, as determined in good faith by the Board of Trustees. The Board of Trustees has established a Valuation Committee comprised of the Trustees and has delegated to it the authority to take any actions regarding the valuation of portfolio securities that the Valuation Committee deems necessary or appropriate, including determining the fair value of portfolio securities, unless the determination has been delegated to the Wells Fargo Asset Management Pricing Committee. The Board of Trustees retains the authority to make or ratify any valuation decisions or approve any changes to the Valuation Procedures as it deems appropriate. On a quarterly basis, the Board of Trustees receives reports on any valuation actions taken by the Valuation Committee or the Wells Fargo Asset Management Pricing Committee which may include items for ratification.
Foreign currency translation
The accounting records of the Fund are maintained in U.S. dollars. The values of other assets and liabilities denominated in foreign currencies are translated into U.S. dollars at rates provided by an independent foreign currency pricing source at a time each business day specified by the Wells Fargo Asset Management Pricing Committee. Purchases and sales of securities, and income and expenses are converted at the rate of exchange on the respective dates of such transactions. Net realized foreign exchange gains or losses arise from sales of foreign currencies, currency gains or losses realized between the trade and settlement dates on securities transactions, and the difference between the amounts of dividends, interest and foreign withholding taxes recorded and the U.S. dollar equivalent of the amounts actually paid or received. Net unrealized foreign exchange gains and losses arise from changes in the fair value of assets and liabilities other than investments in securities resulting from changes in exchange rates. The changes in net assets arising from changes in exchange rates of securities and the changes in net assets resulting from changes in market prices of securities are not separately presented. Such changes are included in net realized and unrealized gains or losses from investments.
22 | Wells Fargo Global Small Cap Fund
Table of Contents
Notes to financial statements
Securities lending
The Fund may lend its securities from time to time in order to earn additional income in the form of fees or interest on securities received as collateral or the investment of any cash received as collateral. When securities are on loan, the Fund receives interest or dividends on those securities. Cash collateral received in connection with its securities lending transactions is invested in Securities Lending Cash Investments, LLC (the “Securities Lending Fund”). Investments in Securities Lending Fund are valued at the evaluated bid price provided by an independent pricing service. Income earned from investment in the Securities Lending Fund (net of fees and rebates), if any, is included in income from affiliated securities on the Statement of Operations.
In a securities lending transaction, the net asset value of the Fund is affected by an increase or decrease in the value of the securities loaned and by an increase or decrease in the value of the instrument in which collateral is invested. The amount of securities lending activity undertaken by the Fund fluctuates from time to time. The Fund has the right under the lending agreement to recover the securities from the borrower on demand. In the event of default or bankruptcy by the borrower, the Fund may be prevented from recovering the loaned securities or gaining access to the collateral or may experience delays or costs in doing so. In such an event, the terms of the agreement allows the unaffiliated securities lending agent to use the collateral to purchase replacement securities on behalf of the Fund or pay the Fund the market value of the loaned securities. The Fund bears the risk of loss with respect to depreciation of its investment of the cash collateral.
Security transactions and income recognition
Securities transactions are recorded on a trade date basis. Realized gains or losses are recorded on the basis of identified cost.
Dividend income is recognized on the ex-dividend date, except for certain dividends from foreign securities, which are recorded as soon as the custodian verifies the ex-dividend date. Dividend income from foreign securities is recorded net of foreign taxes withheld where recovery of such taxes is not assured.
Distributions to shareholders
Distributions to shareholders from net investment income and any net realized gains are recorded on the ex-dividend date and paid at least annually. Such distributions are determined in accordance with income tax regulations and may differ from U.S. generally accepted accounting principles. Dividend sources are estimated at the time of declaration. The tax character of distributions is determined as of the Fund’s fiscal year end. Therefore, a portion of the Fund’s distributions made prior to the Fund’s fiscal year end may be categorized as a tax return of capital at year end.
Federal and other taxes
The Fund intends to continue to qualify as a regulated investment company by distributing substantially all of its investment company taxable income and any net realized capital gains (after reduction for capital loss carryforwards) sufficient to relieve it from all, or substantially all, federal income taxes. Accordingly, no provision for federal income taxes was required.
The Fund’s income and federal excise tax returns and all financial records supporting those returns for the prior three fiscal years are subject to examination by the federal and Delaware revenue authorities. Management has analyzed the Fund’s tax positions taken on federal, state, and foreign tax returns for all open tax years and does not believe that there are any uncertain tax positions that require recognition of a tax liability.
As of October 31, 2020, the aggregate cost of all investments for federal income tax purposes was $211,570,929 and the unrealized gains (losses) consisted of:
Gross unrealized gains | $ | 37,388,674 | ||
Gross unrealized losses | (21,265,504 | ) | ||
Net unrealized gains | $ | 16,123,170 | ||
Reclassifications are made to the Fund’s capital accounts for permanent tax differences to reflect income and gains available for distribution (or available capital loss carryforwards) under federal income tax regulations. U.S. generally accepted accounting principles require that certain components of net assets be adjusted to reflect permanent differences between financial and tax reporting. These reclassifications have no effect on net assets or net asset values per share. The primary permanent difference causing such reclassification is due to net operating losses. At October 31, 2020, as a result of permanent book-to-tax differences, the following reclassification adjustments were made on the Statement of Assets and Liabilities:
| Paid-in capital | Total distributable earnings | |
| $(2,489,841) | $2,489,841 | |
As of October 31, 2020, the Fund had capital loss carryforwards which consist of $1,581,392 in long-term capital losses.
As of October 31, 2020, the Fund had a qualified late-year ordinary loss of $201,332 which will be recognized on the first day of the following fiscal year.
Wells Fargo Global Small Cap Fund | 23
Table of Contents
Notes to financial statements
Class allocations
The separate classes of shares offered by the Fund differ principally in applicable sales charges, distribution, shareholder servicing, and administration fees. Class specific expenses are charged directly to that share class. Investment income, common fund-level expenses, and realized and unrealized gains (losses) on investments are allocated daily to each class of shares based on the relative proportion of net assets of each class.
3. FAIR VALUATION MEASUREMENTS
Fair value measurements of investments are determined within a framework that has established a fair value hierarchy based upon the various data inputs utilized in determining the value of the Fund’s investments. The three-level hierarchy gives the highest priority to unadjusted quoted prices in active markets for identical assets or liabilities (Level 1) and the lowest priority to unobservable inputs (Level 3). The Fund’s investments are classified within the fair value hierarchy based on the lowest level of input that is significant to the fair value measurement. The inputs are summarized into three broad levels as follows:
| ∎ | Level 1 – quoted prices in active markets for identical securities |
| ∎ | Level 2 – other significant observable inputs (including quoted prices for similar securities, interest rates, prepayment speeds, credit risk, etc.) |
| ∎ | Level 3 – significant unobservable inputs (including the Fund’s own assumptions in determining the fair value of investments) |
The inputs or methodologies used for valuing investments in securities are not necessarily an indication of the risk associated with investing in those securities.
The following is a summary of the inputs used in valuing the Fund’s assets and liabilities as of October 31, 2020:
| Quoted prices (Level 1) | Other significant observable inputs (Level 2) | Significant (Level 3) | Total | |||||||||||||
Assets | ||||||||||||||||
Investments in: | ||||||||||||||||
Common stocks | ||||||||||||||||
Australia | $ | 0 | $ | 7,820,821 | $ | 0 | $ | 7,820,821 | ||||||||
Austria | 1,358,686 | 0 | 0 | 1,358,686 | ||||||||||||
Belgium | 0 | 2,452,371 | 0 | 2,452,371 | ||||||||||||
Canada | 11,810,682 | 0 | 0 | 11,810,682 | ||||||||||||
France | 0 | 5,833,149 | 0 | 5,833,149 | ||||||||||||
Germany | 0 | 10,296,238 | 0 | 10,296,238 | ||||||||||||
Hong Kong | 310,830 | 0 | 0 | 310,830 | ||||||||||||
Ireland | 1,918,414 | 0 | 0 | 1,918,414 | ||||||||||||
Italy | 2,413,596 | 4,130,992 | 0 | 6,544,588 | ||||||||||||
Japan | 0 | 24,003,428 | 0 | 24,003,428 | ||||||||||||
Luxembourg | 0 | 618,751 | 0 | 618,751 | ||||||||||||
Netherlands | 493,178 | 2,080,999 | 0 | 2,574,177 | ||||||||||||
Norway | 0 | 935,023 | 0 | 935,023 | ||||||||||||
Singapore | 0 | 1,141,075 | 0 | 1,141,075 | ||||||||||||
Spain | 4,568,885 | 0 | 0 | 4,568,885 | ||||||||||||
Sweden | 0 | 2,934,820 | 0 | 2,934,820 | ||||||||||||
Switzerland | 0 | 2,314,215 | 0 | 2,314,215 | ||||||||||||
United Kingdom | 7,351,832 | 12,637,473 | 0 | 19,989,305 | ||||||||||||
United States | 117,173,660 | 0 | 0 | 117,173,660 | ||||||||||||
Rights | ||||||||||||||||
Spain | 0 | 67,075 | 0 | 67,075 | ||||||||||||
Short-term investments | ||||||||||||||||
Investment companies | 3,027,906 | 0 | 0 | 3,027,906 | ||||||||||||
Total assets | $ | 150,427,669 | $ | 77,266,430 | $ | 0 | $ | 227,694,099 | ||||||||
Additional sector, industry or geographic detail is included in the Portfolio of Investments.
For the year ended October 31, 2020, the Fund did not have any transfers into/out of Level 3.
24 | Wells Fargo Global Small Cap Fund
Table of Contents
Notes to financial statements
4. TRANSACTIONS WITH AFFILIATES
Management fee
Funds Management, an indirect wholly owned subsidiary of Wells Fargo & Company (“Wells Fargo”), is the manager of the Fund and provides advisory and fund-level administrative services under an investment management agreement. Under the investment management agreement, Funds Management is responsible for, among other services, implementing the investment objectives and strategies of the Fund, supervising the subadviser and providing fund-level administrative services in connection with the Fund’s operations. As compensation for its services under the investment management agreement, Funds Management is entitled to receive a management fee at the following annual rate based on the Fund’s average daily net assets:
| Average daily net assets | Management fee | |||
First $500 million | 0.950 | % | ||
Next $500 million | 0.925 | |||
Next $1 billion | 0.900 | |||
Next $2 billion | 0.875 | |||
Next $1 billion | 0.850 | |||
Next $5 billion | 0.840 | |||
Over $10 billion | 0.830 | |||
For the year ended October 31, 2020, the management fee was equivalent to an annual rate of 0.95% of the Fund’s average daily net assets.
Funds Management has retained the services of a subadviser to provide daily portfolio management to the Fund. The fee for subadvisory services is borne by Funds Management. Wells Capital Management Incorporated (“WellsCap”), an affiliate of Funds Management and an indirect wholly owned subsidiary of Wells Fargo, is the subadviser to the Fund and is entitled to receive a fee from Funds Management at an annual rate starting at 0.55% and declining to 0.40% as the average daily net assets of the Fund increase.
Administration fees
Under a class-level administration agreement, Funds Management provides class-level administrative services to the Fund, which includes paying fees and expenses for services provided by the transfer agent, sub-transfer agents, omnibus account servicers and record-keepers. As compensation for its services under the class-level administration agreement, Funds Management receives an annual fee which is calculated based on the average daily net assets of each class as follows:
| Class-level administration fee | ||||
Class A, Class C | 0.21 | % | ||
Administrator Class, Institutional Class | 0.13 | |||
Waivers and/or expense reimbursements
Funds Management has contractually waived and/or reimbursed management and administration fees to the extent necessary to maintain certain net operating expense ratios for the Fund. When each class of the Fund has exceeded its expense cap, Funds Management has waived fees and/or reimbursed expenses from fund-level expenses on a proportionate basis and then from class specific expenses. When only certain classes exceed their expense caps, waivers and/or reimbursements are applied against class specific expenses before fund-level expenses. Funds Management has committed through February 28, 2021 to waive fees and/or reimburse expenses to the extent necessary to cap the Fund’s expenses at 1.55% for Class A shares, 2.30% for Class C shares, 1.40% for Administrator Class shares, and 1.15% for Institutional Class shares. Prior to or after the commitment expiration date, the cap may be increased or the commitment to maintain the cap may be terminated only with the approval of the Board of Trustees.
Distribution fee
The Trust has adopted a distribution plan for Class C shares of the Fund pursuant to Rule 12b-1 under the 1940 Act. A distribution fee is charged to Class C shares and paid to Wells Fargo Funds Distributor, LLC (“Funds Distributor”), the principal underwriter, at an annual rate of 0.75% of the average daily net assets of Class C shares.
Wells Fargo Global Small Cap Fund | 25
Table of Contents
Notes to financial statements
In addition, Funds Distributor is entitled to receive the front-end sales charge from the purchase of Class A shares and a contingent deferred sales charge on the redemption of certain Class A shares. Funds Distributor is also entitled to receive the contingent deferred sales charges from redemptions of Class C shares. For the year ended October 31, 2020, Funds Distributor received $2,363 from the sale of Class A shares. No contingent deferred sales charges were incurred by Class A and Class C shares for the year ended October 31, 2020.
Shareholder servicing fees
The Trust has entered into contracts with one or more shareholder servicing agents, whereby Class A, Class C, and Administrator Class of the Fund are charged a fee at an annual rate of 0.25% of the average daily net assets of each respective class. A portion of these total shareholder servicing fees were paid to affiliates of Wells Fargo.
Interfund transactions
The Fund may purchase or sell portfolio investment securities to certain other Wells Fargo affiliates pursuant to Rule 17a-7 under the 1940 Act and under procedures adopted by the Board of Trustees. The procedures have been designed to ensure that these interfund transactions, which do not incur broker commissions, are effected at current market prices.
Other transactions
On August 14, 2020, Class C and Administrator Class of the Fund were reimbursed by Funds Management in the amount of $16,192 and $15,624, respectively. The reimbursement was made in connection with resolving certain fee reimbursements.
5. INVESTMENT PORTFOLIO TRANSACTIONS
Purchases and sales of investments, excluding U.S. government obligations (if any) and short-term securities, for the year ended October 31, 2020 were $152,893,015 and $177,143,544, respectively.
6. SECURITIES LENDING TRANSACTIONS
The Fund lends its securities through an unaffiliated securities lending agent and receives collateral in the form of cash or securities with a value at least equal to the value of the securities on loan. The value of the loaned securities is determined at the close of each business day and any increases or decreases in the required collateral are exchanged between the Fund and the counterparty on the next business day. Cash collateral received is invested in the Securities Lending Fund which seeks to provide a positive return compared to the daily Fed Funds Open Rate by investing in high-quality, U.S. dollar-denominated short-term money market instruments and is exempt from registration under Section 3(c)(7) of the 1940 Act. Securities Lending Fund is managed by Funds Management and is subadvised by WellsCap. Funds Management receives an advisory fee starting at 0.05% and declining to 0.01% as the average daily net assets of the Securities Lending Fund increase. All of the fees received by Funds Management are paid to WellsCap for its services as subadviser.
In the event of counterparty default or the failure of a borrower to return a loaned security, the Fund has the right to use the collateral to offset any losses incurred. As of October 31, 2020, the Fund had securities lending transactions with the following counterparties which are subject to offset:
| Counterparty | Value of securities on loan | Collateral received1 | Net amount | |||||
UBS Securities LLC | $1,324,101 | $(1,324,101) | $ | 0 | ||||
| 1 | Collateral received within this table is limited to the collateral for the net transaction with the counterparty. |
7. BANK BORROWINGS
The Trust (excluding the money market funds), Wells Fargo Master Trust and Wells Fargo Variable Trust are parties to a $350,000,000 revolving credit agreement whereby the Fund is permitted to use bank borrowings for temporary or emergency purposes, such as to fund shareholder redemption requests. Interest under the credit agreement is charged to the Fund based on a borrowing rate equal to the higher of the Federal Funds rate in effect on that day plus 1.25% or the overnight LIBOR rate in effect on that day plus 1.25%. In addition, an annual commitment fee equal to 0.25% of the unused balance is allocated to each participating fund.
For the year ended October 31, 2020, there were no borrowings by the Fund under the agreement.
26 | Wells Fargo Global Small Cap Fund
Table of Contents
Notes to financial statements
8. DISTRIBUTIONS TO SHAREHOLDERS
The tax character of distributions paid during the years ended October 31, 2020 and October 31, 2019 were as follows:
| Year ended October 31 | ||||||||
| 2020 | 2019 | |||||||
Ordinary income | $ | 5,687,755 | $ | 4,835,730 | ||||
Long-term capital gain | 6,403,276 | 21,579,337 | ||||||
As of October 31, 2020, the components of distributable earnings on a tax basis were as follows:
Late-year | Capital loss | Unrealized gains | ||
| $(201,332) | $(1,581,392) | $16,132,255 | ||
9. CONCENTRATION RISK
Concentration risks result from exposure to a limited number of sectors. As of the end of the period, the Fund concentrated its portfolio in investments related to the industrials sector. A fund that invests a substantial portion of its assets in any sector may be more affected by changes in that sector than would be a fund whose investments are not heavily weighted in any sector.
10. INDEMNIFICATION
Under the Fund’s organizational documents, the officers and Trustees have been granted certain indemnification rights against certain liabilities that may arise out of performance of their duties to the Fund. The Fund has entered into a separate agreement with each Trustee that converts indemnification rights currently existing under the Fund’s organizational documents into contractual rights that cannot be changed in the future without the consent of the Trustee. Additionally, in the normal course of business, the Fund may enter into contracts with service providers that contain a variety of indemnification clauses. The Fund’s maximum exposure under these arrangements is dependent on future claims that may be made against the Fund and, therefore, cannot be estimated.
11. NEW ACCOUNTING PRONOUNCEMENT
In August 2018, FASB issued Accounting Standards Update (“ASU”) No. 2018-13, Fair Value Measurement (Topic 820) Disclosure Framework—Changes to the Disclosure Requirements for Fair Value Measurement. ASU 2018-13 updates the disclosure requirements on fair value measurements in Topic 820, Fair Value Measurements. The amendments are effective for fiscal years, and interim periods within those fiscal years, beginning after December 15, 2019. Management has adopted this guidance which did not have a material impact on the financial statements.
12. CORONAVIRUS (COVID-19) PANDEMIC
On March 11, 2020, the World Health Organization announced that it had made the assessment that coronavirus disease 2019 (“COVID-19”) is a pandemic. The impacts of COVID-19 are adversely affecting the entire global economy, individual companies and investment products, and the market in general. There is significant uncertainty around the extent and duration of business disruptions related to COVID-19 and the impacts may be short term or may last for an extended period of time. The risk of further spreading of COVID-19 has led to significant uncertainty and volatility in the financial markets.
Wells Fargo Global Small Cap Fund | 27
Table of Contents
Report of independent registered public accounting firm
To the Shareholders of the Fund and Board of Trustees
Wells Fargo Funds Trust:
Opinion on the Financial Statements
We have audited the accompanying statement of assets and liabilities of Wells Fargo Global Small Cap Fund (the Fund), one of the funds constituting Wells Fargo Funds Trust, including the portfolio of investments, as of October 31, 2020, the related statement of operations for the year then ended, the statements of changes in net assets for each of the years in the two-year period then ended, and the related notes (collectively, the financial statements) and the financial highlights for each of the years in the five-year period then ended. In our opinion, the financial statements and financial highlights present fairly, in all material respects, the financial position of the Fund as of October 31, 2020, the results of its operations for the year then ended, the changes in its net assets for each of the years in the two-year period then ended, and the financial highlights for each of the years in the five-year period then ended, in conformity with U.S. generally accepted accounting principles.
Basis for Opinion
These financial statements and financial highlights are the responsibility of the Fund’s management. Our responsibility is to express an opinion on these financial statements and financial highlights based on our audits. We are a public accounting firm registered with the Public Company Accounting Oversight Board (United States) (PCAOB) and are required to be independent with respect to the Fund in accordance with the U.S. federal securities laws and the applicable rules and regulations of the Securities and Exchange Commission and the PCAOB.
We conducted our audits in accordance with the standards of the PCAOB. Those standards require that we plan and perform the audit to obtain reasonable assurance about whether the financial statements and financial highlights are free of material misstatement, whether due to error or fraud. Our audits included performing procedures to assess the risks of material misstatement of the financial statements and financial highlights, whether due to error or fraud, and performing procedures that respond to those risks. Such procedures included examining, on a test basis, evidence regarding the amounts and disclosures in the financial statements and financial highlights. Such procedures also included confirmation of securities owned as of October 31, 2020, by correspondence with the custodian, transfer agent and brokers, or by other appropriate auditing procedures. Our audits also included evaluating the accounting principles used and significant estimates made by management, as well as evaluating the overall presentation of the financial statements and financial highlights. We believe that our audits provide a reasonable basis for our opinion.

We have not been able to determine the specific year that we began serving as the auditor of one or more Wells Fargo Funds investment companies; however we are aware that we have served as the auditor of one or more Wells Fargo Funds investment companies since at least 1955.
Boston, Massachusetts
December 22, 2020
28 | Wells Fargo Global Small Cap Fund
Table of Contents
TAX INFORMATION
For corporate shareholders, pursuant to Section 854 of the Internal Revenue Code, 26.08% of ordinary income dividends qualify for the corporate dividends-received deduction for the fiscal year ended October 31, 2020.
Pursuant to Section 852 of the Internal Revenue Code, $6,403,276 was designated as a 20% rate gain distribution for the fiscal year ended October 31, 2020.
Pursuant to Section 854 of the Internal Revenue Code, $4,543,896 of income dividends paid during the fiscal year ended October 31, 2020 has been designated as qualified dividend income (QDI).
For the fiscal year ended October 31, 2020, $187,061 has been designated as interest-related dividends for nonresident alien shareholders pursuant to Section 871 of the Internal Revenue Code.
For the fiscal year ended October 31, 2020, $1,585,469 has been designated as short-term capital gain dividends for nonresident alien shareholders pursuant to Section 871 of the Internal Revenue Code.
PROXY VOTING INFORMATION
A description of the policies and procedures used to determine how to vote proxies relating to portfolio securities is available, upon request, by calling 1-800-222-8222, visiting our website at wfam.com, or visiting the SEC website at sec.gov. Information regarding how the proxies related to portfolio securities were voted during the most recent 12-month period ended June 30 is available on the website at wfam.com or by visiting the SEC website at sec.gov.
QUARTERLY PORTFOLIO HOLDINGS INFORMATION
The Fund files its complete schedule of portfolio holdings with the SEC for the first and third quarters of each fiscal year as an exhibit to its reports on Form N-PORT. Shareholders may view the filed Form N-PORT by visiting the SEC website at sec.gov.
Wells Fargo Global Small Cap Fund | 29
Table of Contents
Other information (unaudited)
BOARD OF TRUSTEES AND OFFICERS
Each of the Trustees and Officers1 listed in the table below acts in identical capacities for each fund in the Wells Fargo family of funds, which consists of 144 mutual funds comprising the Wells Fargo Funds Trust, Wells Fargo Variable Trust, Wells Fargo Master Trust and four closed-end funds (collectively the “Fund Complex”). This table should be read in conjunction with the Prospectus and the Statement of Additional Information2. The mailing address of each Trustee and Officer is 525 Market Street, 12th Floor, San Francisco, CA 94105. Each Trustee and Officer serves an indefinite term, however, each Trustee serves such term until reaching the mandatory retirement age established by the Trustees.
Independent Trustees
| Name and year of birth | Position held and length of service* | Principal occupations during past five years or longer | Current other public company or investment company directorships | |||
| William R. Ebsworth (Born 1957) | Trustee, since 2015 | Retired. From 1984 to 2013, equities analyst, portfolio manager, research director and chief investment officer at Fidelity Management and Research Company in Boston, Tokyo, and Hong Kong, and retired in 2013 as Chief Investment Officer of Fidelity Strategic Advisers, Inc. where he led a team of investment professionals managing client assets. Prior thereto, Board member of Hong Kong Securities Clearing Co., Hong Kong Options Clearing Corp., the Thailand International Fund, Ltd., Fidelity Investments Life Insurance Company, and Empire Fidelity Investments Life Insurance Company. Audit Committee Chair and Investment Committee Chair of the Vincent Memorial Hospital Endowment (non-profit organization). Mr. Ebsworth is a CFA® charterholder. | N/A | |||
| Jane A. Freeman (Born 1953) | Trustee, since 2015; Chair Liaison, since 2018 | Retired. From 2012 to 2014 and 1999 to 2008, Chief Financial Officer of Scientific Learning Corporation. From 2008 to 2012, Ms. Freeman provided consulting services related to strategic business projects. Prior to 1999, Portfolio Manager at Rockefeller & Co. and Scudder, Stevens & Clark. Board member of the Harding Loevner Funds from 1996 to 2014, serving as both Lead Independent Director and chair of the Audit Committee. Board member of the Russell Exchange Traded Funds Trust from 2011 to 2012 and the chair of the Audit Committee. Ms. Freeman is also an inactive Chartered Financial Analyst. | N/A | |||
| Isaiah Harris, Jr. (Born 1952) | Trustee, since 2009; Audit Committee Chair, since 2019 | Retired. Chairman of the Board of CIGNA Corporation since 2009, and Director since 2005. From 2003 to 2011, Director of Deluxe Corporation. Prior thereto, President and CEO of BellSouth Advertising and Publishing Corp. from 2005 to 2007, President and CEO of BellSouth Enterprises from 2004 to 2005 and President of BellSouth Consumer Services from 2000 to 2003. Emeritus member of the Iowa State University Foundation Board of Governors. Emeritus Member of the Advisory Board of Iowa State University School of Business. Advisory Board Member, Palm Harbor Academy (private school). Mr. Harris is a certified public accountant (inactive status). | CIGNA Corporation | |||
| Judith M. Johnson (Born 1949) | Trustee, since 2008 | Retired. Prior thereto, Chief Executive Officer and Chief Investment Officer of Minneapolis Employees Retirement Fund from 1996 to 2008. Ms. Johnson is an attorney, certified public accountant and a certified managerial accountant. | N/A | |||
| David F. Larcker (Born 1950) | Trustee, since 2009 | James Irvin Miller Professor of Accounting at the Graduate School of Business (Emeritus), Stanford University, Director of the Corporate Governance Research Initiative and Senior Faculty of The Rock Center for Corporate Governance since 2006. From 2005 to 2008, Professor of Accounting at the Graduate School of Business, Stanford University. Prior thereto, Ernst & Young Professor of Accounting at The Wharton School, University of Pennsylvania from 1985 to 2005. | N/A | |||
30 | Wells Fargo Global Small Cap Fund
Table of Contents
Other information (unaudited)
| Name and year of birth | Position held and length of service* | Principal occupations during past five years or longer | Current other public company or investment company directorships | |||
| Olivia S. Mitchell (Born 1953) | Trustee, since 2006; Nominating and Governance Committee Chair, since 2018 | International Foundation of Employee Benefit Plans Professor, Wharton School of the University of Pennsylvania since 1993. Director of Wharton’s Pension Research Council and Boettner Center on Pensions & Retirement Research, and Research Associate at the National Bureau of Economic Research. Previously, Cornell University Professor from 1978 to 1993. | N/A | |||
| Timothy J. Penny (Born 1951) | Trustee, since 1996; Chair, since 2018 | President and Chief Executive Officer of Southern Minnesota Initiative Foundation, a non-profit organization, since 2007. Member of the Board of Trustees of NorthStar Education Finance, Inc., a non-profit organization, since 2007. | N/A | |||
| James G. Polisson (Born 1959) | Trustee, since 2018 | Retired. Chief Marketing Officer, Source (ETF) UK Services, Ltd, from 2015 to 2017. From 2012 to 2015, Principal of The Polisson Group, LLC, a management consulting, corporate advisory and principal investing company. Chief Executive Officer and Managing Director at Russell Investments, Global Exchange Traded Funds from 2010 to 2012. Managing Director of Barclays Global Investors from 1998 to 2010 and Global Chief Marketing Officer for iShares and Barclays Global Investors from 2000 to 2010. Trustee of the San Francisco Mechanics’ Institute, a non-profit organization, from 2013 to 2015. Board member of the Russell Exchange Traded Fund Trust from 2011 to 2012. Director of Barclays Global Investors Holdings Deutschland GmbH from 2006 to 2009. Mr. Polisson is an attorney and has a retired status with the Massachusetts and District of Columbia Bar Associations. | N/A | |||
| Pamela Wheelock (Born 1959) | Trustee, since January 2020; previously Trustee from January 2018 to July 2019 | Board member of the Destination Medical Center Economic Development Agency, Rochester, Minnesota since 2019. Interim President of the McKnight Foundation from January to September 2020. Acting Commissioner, Minnesota Department of Human Services, July 2019 through September 2019. Human Services Manager (part-time), Minnesota Department of Human Services, October 2019 through December 2019. Chief Operating Officer, Twin Cities Habitat for Humanity from 2017 to 2019. Vice President of University Services, University of Minnesota from 2012 to 2016. Prior thereto, on the Board of Directors, Governance Committee and Finance Committee for the Minnesota Philanthropy Partners (Saint Paul Foundation) from 2012 to 2018, Interim Chief Executive Officer of Blue Cross Blue Shield of Minnesota from 2011 to 2012, Chairman of the Board from 2009 to 2012 and Board Director from 2003 to 2015. Vice President, Leadership and Community Engagement, Bush Foundation, Saint Paul, Minnesota (a private foundation) from 2009 to 2011. Executive Vice President and Chief Financial Officer, Minnesota Sports and Entertainment from 2004 to 2009 and Senior Vice President from 2002 to 2004. Executive Vice President of the Minnesota Wild Foundation from 2004 to 2008. Commissioner of Finance, State of Minnesota, from 1999 to 2002. Currently Board Chair of the Minnesota Wild Foundation since 2010. | N/A | |||
| * | Length of service dates reflect the Trustee’s commencement of service with the Trust’s predecessor entities, where applicable. |
Wells Fargo Global Small Cap Fund | 31
Table of Contents
Other information (unaudited)
Officers
| Name and year of birth | Position held and length of service | Principal occupations during past five years or longer | ||
| Andrew Owen (Born 1960) | President, since 2017 | Executive Vice President of Wells Fargo & Company and Head of Affiliated Managers, Wells Fargo Asset Management, since 2014. In addition, Mr. Owen is currently President, Chief Executive Officer and Director of Wells Fargo Funds Management, LLC since 2017. Prior thereto, Executive Vice President responsible for marketing, investments and product development for Wells Fargo Funds Management, LLC, from 2009 to 2014. | ||
| Jeremy DePalma1 (Born 1974) | Treasurer, since 2012 | Senior Vice President of Wells Fargo Funds Management, LLC since 2009. Senior Vice President of Evergreen Investment Management Company, LLC from 2008 to 2010 and head of the Fund Reporting and Control Team within Fund Administration from 2005 to 2010. | ||
| Michelle Rhee (Born 1966) | Chief Legal Officer, since 2019 | Secretary of Wells Fargo Funds Management, LLC and Chief Legal Counsel of Wells Fargo Asset Management since 2018. Deputy General Counsel of Wells Fargo Bank, N.A. since 2020 and Assistant General Counsel of Wells Fargo Bank, N.A. from 2018 to 2020. Associate General Counsel and Managing Director of Bank of America Corporation from 2004 to 2018. | ||
| Catherine Kennedy (Born 1969) | Secretary, since 2019 | Vice President of Wells Fargo Funds Management, LLC and Senior Counsel of the Wells Fargo Legal Department since 2010. Vice President and Senior Counsel of Evergreen Investment Management Company, LLC from 1998 to 2010. | ||
| Michael H. Whitaker (Born 1967) | Chief Compliance Officer, since 2016 | Chief Compliance Officer of Wells Fargo Asset Management since 2016. Senior Vice President and Chief Compliance Officer for Fidelity Investments from 2007 to 2016. | ||
| 1 | Jeremy DePalma acts as Treasurer of 77 funds in the Fund Complex. |
| 2 | The Statement of Additional Information includes additional information about the Trustees and is available, without charge, upon request, by calling 1-800-222-8222 or by visiting the website at wfam.com. |
32 | Wells Fargo Global Small Cap Fund
Table of Contents
Other information (unaudited)
BOARD CONSIDERATION OF INVESTMENT MANAGEMENT AND SUB-ADVISORY AGREEMENTS:
Wells Fargo Global Small Cap Fund
Under the Investment Company Act of 1940 (the “1940 Act”), the Board of Trustees (the “Board”) of Wells Fargo Funds Trust (the “Trust”) must determine annually whether to approve the continuation of the Trust’s investment management and sub-advisory agreements. In this regard, at a Board meeting held on May 26, 2020 and May 28, 2020 (together, the “Meeting”), the Board, all the members of which have no direct or indirect interest in the investment management and sub-advisory agreements and are not “interested persons” of the Trust, as defined in the 1940 Act (the “Independent Trustees”), reviewed and approved for Wells Fargo Global Small Cap Fund (the “Fund”): (i) an investment management agreement (the “Management Agreement”) with Wells Fargo Funds Management, LLC (“Funds Management”); and (ii) an investment sub-advisory agreement (the “Sub-Advisory Agreement”) with Wells Capital Management Incorporated (the “Sub-Adviser”), an affiliate of Funds Management. The Management Agreement and the Sub-Advisory Agreement are collectively referred to as the “Advisory Agreements.”
At the Meeting, the Board considered the factors and reached the conclusions described below relating to the selection of Funds Management and the Sub-Adviser and the approval of the Advisory Agreements. Prior to the Meeting, including at a Board meeting held in April 2020, the Trustees conferred extensively among themselves and with representatives of Funds Management about these matters. Also, the Board has adopted a team-based approach, with each team consisting of a sub-set of Trustees, to assist the full Board in the discharge of its duties in reviewing investment performance and other matters throughout the year. The Independent Trustees were assisted in their evaluation of the Advisory Agreements by independent legal counsel, from whom they received separate legal advice and with whom they met separately.
In providing information to the Board, Funds Management and the Sub-Adviser were guided by a detailed set of requests for information submitted to them by independent legal counsel on behalf of the Independent Trustees at the start of the Board’s annual contract renewal process earlier in 2020. In considering and approving the Advisory Agreements, the Trustees considered the information they believed relevant, including but not limited to the information discussed below. The Board considered not only the specific information presented in connection with the Meeting, but also the knowledge gained over time through interaction with Funds Management and the Sub-Adviser about various topics. In this regard, the Board reviewed reports of Funds Management at each of its quarterly meetings, which included, among other things, portfolio reviews and investment performance reports. In addition, the Board and the teams mentioned above confer with portfolio managers at various times throughout the year. The Board did not identify any particular information or consideration that was all-important or controlling, and each individual Trustee may have attributed different weights to various factors.
After its deliberations, the Board unanimously approved the continuation of the Advisory Agreements for a one-year term and determined that the compensation payable to Funds Management and the Sub-Adviser under each of the Advisory Agreements was reasonable. The Board considered the approval of the Advisory Agreements for the Fund as part of its consideration of agreements for funds across the complex, but its approvals were made on a fund-by-fund basis. The following summarizes a number of important, but not necessarily all, factors considered by the Board in support of its approvals.
Nature, extent and quality of services
The Board received and considered various information regarding the nature, extent and quality of services provided to the Fund by Funds Management and the Sub-Adviser under the Advisory Agreements. This information included a description of the investment advisory services and Fund-level administrative services covered by the Management Agreement, as well as, among other things, a summary of the background and experience of senior management of Wells Fargo Asset Management (“WFAM”), of which Funds Management and the Sub-Adviser are a part, and a summary of investments made in the business of WFAM. The Board also received a description of Funds Management’s and the Sub-Adviser’s business continuity plans and of their approaches to data privacy and cybersecurity, and related testing. The Board also received and reviewed information about Funds Management’s role as administrator of the Fund’s liquidity risk management program, Funds Management’s approach to risk management, and Funds Management’s intermediary and vendor oversight program.
The Board also considered the qualifications, background, tenure and responsibilities of each of the portfolio managers primarily responsible for the day-to-day portfolio management of the Fund. The Board evaluated the ability of Funds Management and the Sub-Adviser to attract and retain qualified investment professionals, including research, advisory and supervisory personnel. The Board further considered the compliance programs and compliance records of Funds Management and the Sub-Adviser. In addition, the Board took into account the full range of services provided to the Fund by Funds Management and its affiliates.
Wells Fargo Global Small Cap Fund | 33
Table of Contents
Other information (unaudited)
Fund investment performance and expenses
The Board considered the investment performance results for the Fund over various time periods ended December 31, 2019. The Board also considered more current results for various time periods ended March 31, 2020. The Board considered these results in comparison to the investment performance of funds in a universe that was determined by Broadridge Inc. (“Broadridge”) to be similar to the Fund (the “Universe”), and in comparison to the Fund’s benchmark index and to other comparative data. Broadridge is an independent provider of investment company data. The Board received a description of the methodology used by Broadridge to select the mutual funds in the performance Universe. The Board noted that the investment performance of the Fund (Administrator Class) was higher than or in range of the average investment performance of the Universe for the three-, five- and ten-year periods ended December 31, 2019, and lower than the average investment performance of the Universe for the one-year period ended December 31, 2019. The Board also noted that the investment performance of the Fund (Administrator Class) was higher than the average investment performance of the Universe for all periods ended March 31, 2020. The Board also noted that the investment performance of the Fund was lower than its benchmark index, the S&P Developed SmallCap Index, for the one-year period ended December 31, 2019, and higher than or in range of its benchmark for the three-, five- and ten-year periods ended December 31, 2019. The Board also noted that the investment performance of the Fund was higher than its benchmark index, the S&P Developed SmallCap Index, for all periods ended March 31, 2020.
The Board also received and considered information regarding the Fund’s net operating expense ratios and their various components, including actual management fees, custodian and other non-management fees, and Rule 12b-1 and non-Rule 12b-1 shareholder service fees. The Board considered these ratios in comparison to the median ratios of funds in class-specific expense groups that were determined by Broadridge to be similar to the Fund (the “Groups”). The Board received a description of the methodology used by Broadridge to select the mutual funds in the expense Groups and an explanation of how funds comprising expense groups and their expense ratios may vary from year-to-year. Based on the Broadridge reports, the Board noted that the net operating expense ratios of the Fund were equal to or in range of the median net operating expense ratios of the expense Groups for each share class.
The Board took into account the Fund’s investment performance and expense information provided to it among the factors considered in deciding to re-approve the Advisory Agreements.
Investment management and sub-advisory fee rates
The Board reviewed and considered the contractual fee rates payable by the Fund to Funds Management under the Management Agreement, as well as the contractual fee rates payable by the Fund to Funds Management for class-level administrative services under a Class-Level Administration Agreement, which include, among other things, class-level transfer agency and sub-transfer agency costs (collectively, the “Management Rates”). The Board also reviewed and considered the contractual investment sub-advisory fee rates that are payable by Funds Management to the Sub-Adviser for investment sub-advisory services.
Among other information reviewed by the Board was a comparison of the Fund’s Management Rates with the average contractual investment management fee rates of funds in the expense Groups at a common asset level as well as transfer agency costs of the funds in the expense Groups. The Board noted that the Management Rates of the Fund were lower than or in range of the sum of these average rates for the Fund’s expense Groups for each share class.
The Board also received and considered information about the portion of the total management fee that was retained by Funds Management after payment of the fee to the Sub-Adviser for sub-advisory services. In assessing the reasonableness of this amount, the Board received and evaluated information about the nature and extent of responsibilities retained and risks assumed by Funds Management and not delegated to or assumed by the Sub-Adviser, and about Funds Management’s on-going oversight services. Given the affiliation between Funds Management and the Sub-Adviser, the Board ascribed limited relevance to the allocation of fees between them.
The Board also received and considered information about the nature and extent of services offered and fee rates charged by Funds Management and the Sub-Adviser to other types of clients with investment strategies similar to those of the Fund. In this regard, the Board received information about the significantly greater scope of services, and compliance, reporting and other legal burdens and risks of managing proprietary mutual funds compared with those associated with managing assets of other types of clients, including third-party sub-advised fund clients and non-mutual fund clients such as institutional separate accounts.
Based on its consideration of the factors and information it deemed relevant, including those described here, the Board determined that the compensation payable to Funds Management under the Management Agreement and to the Sub-Adviser under the Sub-Advisory Agreement was reasonable.
34 | Wells Fargo Global Small Cap Fund
Table of Contents
Other information (unaudited)
Profitability
The Board received and considered information concerning the profitability of Funds Management, as well as the profitability of both WFAM and Wells Fargo & Co. (“Wells Fargo”) from providing services to the fund family as a whole. The Board noted that the Sub-Adviser’s profitability information with respect to providing services to the Fund and other funds in the family was subsumed in the WFAM and Wells Fargo profitability analysis.
Funds Management reported on the methodologies and estimates used in calculating profitability, including a description of the methodology used to allocate certain expenses. Among other things, the Board noted that the levels of profitability reported on a fund-by-fund basis varied widely, depending on factors such as the size, type and age of fund.
Based on its review, the Board did not deem the profits reported by Funds Management, WFAM or Wells Fargo from services provided to the Fund to be at a level that would prevent it from approving the continuation of the Advisory Agreements.
Economies of scale
The Board received and considered information about the potential for Funds Management to experience economies of scale in the provision of management services to the Fund, the difficulties of calculating economies of scale at an individual fund level, and the extent to which potential scale benefits are shared with shareholders. The Board noted the existence of breakpoints in the Fund’s management fee structure, which operate generally to reduce the Fund’s expense ratios as the Fund grows in size, and the size of the Fund in relation to such breakpoints. The Board considered that in addition to management fee breakpoints, Funds Management shares potential economies of scale from its management business in a variety of ways, including through fee waiver and expense reimbursement arrangements, services that benefit shareholders, competitive management fee rates set at the outset without regard to breakpoints, and investments in the business intended to enhance services available to shareholders.
The Board concluded that Funds Management’s arrangements with respect to the Fund, including contractual breakpoints, constituted a reasonable approach to sharing potential economies of scale with the Fund and its shareholders.
Other benefits to Funds Management and the Sub-Adviser
The Board received and considered information regarding potential “fall-out” or ancillary benefits received by Funds Management and its affiliates, including the Sub-Adviser, as a result of their relationships with the Fund. Ancillary benefits could include, among others, benefits directly attributable to other relationships with the Fund and benefits potentially derived from an increase in Funds Management’s and the Sub-Adviser’s business as a result of their relationships with the Fund. The Board noted that various affiliates of Funds Management may receive distribution-related fees, shareholder servicing payments and sub-transfer agency fees in respect of shares sold or held through them and services provided.
The Board also reviewed information about soft dollar credits earned and utilized by the Sub-Adviser, fees earned by Funds Management and the Sub-Adviser from managing a private investment vehicle for the fund family’s securities lending collateral, and commissions earned by an affiliated broker from portfolio transactions.
Based on its consideration of the factors and information it deemed relevant, including those described here, the Board did not find that any ancillary benefits received by Funds Management and its affiliates, including the Sub-Adviser, were unreasonable.
Conclusion
At the Meeting, after considering the above-described factors and based on its deliberations and its evaluation of the information described above, the Board unanimously approved the continuation of the Advisory Agreements for a one-year term and determined that the compensation payable to Funds Management and the Sub-Adviser under each of the Advisory Agreements was reasonable.
Wells Fargo Global Small Cap Fund | 35
Table of Contents
Other information (unaudited)
LIQUIDITY RISK MANAGEMENT PROGRAM
In accordance with Rule 22e-4 under the Investment Company Act of 1940, as amended (the “Liquidity Rule”), Wells Fargo Funds Trust (the “Trust”) has adopted and implemented a liquidity risk management program (the “Program”) on behalf of each of its series, including the Fund, which is reasonably designed to assess and manage the Fund’s liquidity risk. “Liquidity risk” is defined as the risk that the Fund is unable to meet redemption requests without significantly diluting remaining investors’ interests in the Fund. The Trust’s Board of Trustees (the “Board”) previously approved the designation of Wells Fargo Funds Management, LLC (“Funds Management”), the Fund’s investment manager, as the administrator of the Program, and Funds Management has established a Liquidity Risk Management Council composed of personnel from multiple departments within Funds Management and its affiliates to assist Funds Management in the implementation and on-going administration of the Program.
The Program is comprised of various components designed to support the assessment and/or management of liquidity risk, including: (1) the periodic assessment (no less frequently than annually) of certain factors that influence the Fund’s liquidity risk; (2) the periodic classification (no less frequently than monthly) of the Fund’s investments into one of four liquidity categories that reflect an estimate of their liquidity under current market conditions; (3) a 15% limit on the acquisition of “illiquid investments” (as defined under the Liquidity Rule); (4) to the extent the Fund does not invest primarily in “highly liquid investments” (as defined under the Liquidity Rule), the determination of a minimum percentage of the Fund’s assets that generally will be invested in highly liquid investments (an “HLIM”); (5) if the Fund has established an HLIM, the periodic review (no less frequently than annually) of the HLIM and the adoption of policies and procedures for responding to a shortfall of the Fund’s “highly liquid investments” below its HLIM; and (6) periodic reporting to the Board.
At a meeting of the Board held on May 26 and 28, 2020, the Board received a written report (the “Report”) from Funds Management that addressed the operation of the Program and assessed its adequacy and effectiveness of implementation. The Report covered the initial period from December 1, 2018 through December 31, 2019 (the “Reporting Period”). No significant liquidity events impacting the Fund were noted in the Report. There were no material changes to the Program during the Reporting Period. The Report concluded that the Program is operating effectively to assess and manage the Fund’s liquidity risk, and that the Program has been and continues to be adequately and effectively implemented to monitor and, as applicable, respond to the Fund’s liquidity developments.
There can be no assurance that the Program will achieve its objectives under all circumstances in the future. Please refer to the Fund’s prospectus for more information regarding the Fund’s exposure to liquidity risk and other risks to which an investment in the Fund may be subject.
36 | Wells Fargo Global Small Cap Fund
Table of Contents
For more information
More information about Wells Fargo Funds is available free upon request. To obtain literature, please write, visit the Fund’s website, or call:
Wells Fargo Funds
P.O. Box 219967
Kansas City, MO 64121-9967
Website: wfam.com
Individual investors: 1-800-222-8222
Retail investment professionals: 1-888-877-9275
Institutional investment professionals: 1-866-765-0778

This report and the financial statements contained herein are submitted for the general information of the shareholders of the Fund. If this report is used for promotional purposes, distribution of the report must be accompanied or preceded by a current prospectus. Before investing, please consider the investment objectives, risks, charges, and expenses of the investment. For a current prospectus and, if available, a summary prospectus, containing this information, call 1-800-222-8222 or visit the Fund’s website at wfam.com. Read the prospectus carefully before you invest or send money.
Wells Fargo Asset Management (WFAM) is the trade name for certain investment advisory/management firms owned by Wells Fargo & Company. These firms include but are not limited to Wells Capital Management Incorporated and Wells Fargo Funds Management, LLC. Certain products managed by WFAM entities are distributed by Wells Fargo Funds Distributor, LLC (a broker-dealer and Member FINRA).
This material is for general informational and educational purposes only and is NOT intended to provide investment advice or a recommendation of any kind—including a recommendation for any specific investment, strategy, or plan.
INVESTMENT PRODUCTS: NOT FDIC INSURED ◾ NO BANK GUARANTEE ◾ MAY LOSE VALUE
© 2020 Wells Fargo & Company. All rights reserved.
PAR-1120-00558 12-20
A239/AR239 10-20
Table of Contents

Annual Report
October 31, 2020
Wells Fargo
International Equity Fund
Beginning on January 1, 2021, as permitted by new regulations adopted by the Securities and Exchange Commission, paper copies of the Wells Fargo Funds’ annual and semi-annual shareholder reports issued after this date will no longer be sent by mail, unless you specifically request paper copies of the reports. Instead, the reports will be made available on the Funds’ website, and you will be notified by mail each time a report is posted and provided with a website address to access the report.
If you already elected to receive shareholder reports electronically, you will not be affected by this change and you need not take any action. You may elect to receive shareholder reports and other communications from the Fund electronically at any time by contacting your financial intermediary (such as a broker-dealer or bank) or, if you are a direct investor, by calling 1-800-222-8222 or by enrolling at wellsfargo.com/advantagedelivery.
You may elect to receive all future reports in paper free of charge. If you invest through a financial intermediary, you can contact your financial intermediary to request that you continue to receive paper copies of your shareholder reports; if you invest directly with the Fund, you can call 1-800-222-8222. Your election to receive reports in paper will apply to all Wells Fargo Funds held in your account with your financial intermediary or, if you are a direct investor, to all Wells Fargo Funds that you hold.
Table of Contents
|
Reduce clutter. Save trees. |
Sign up for electronic delivery of prospectuses and shareholder reports at wellsfargo.com/ |
The views expressed and any forward-looking statements are as of October 31, 2020, unless otherwise noted, and are those of the Fund’s portfolio managers and/or Wells Fargo Asset Management. Discussions of individual securities, or the markets generally, or any Wells Fargo Fund are not intended as individual recommendations. Future events or results may vary significantly from those expressed in any forward-looking statements. The views expressed are subject to change at any time in response to changing circumstances in the market. Wells Fargo Asset Management and the Fund disclaim any obligation to publicly update or revise any views expressed or forward-looking statements.
INVESTMENT PRODUCTS: NOT FDIC INSURED ◾ NO BANK GUARANTEE ◾ MAY LOSE VALUE
Wells Fargo International Equity Fund | 1
Table of Contents
Letter to shareholders (unaudited)

Andrew Owen
President
Wells Fargo Funds
Dear Shareholder:
We are pleased to offer you this annual report for the Wells Fargo International Equity Fund for the 12-month period that ended October 31, 2020. Global stock markets saw earlier gains erased in March as governments around the world took unprecedented measures, attempting to stop the spread of COVID-19 at the expense of short-term economic output. However, markets rallied strongly from April through period-end to offset those short-term losses as central banks bolstered capital markets and confidence.
For the 12-month period, equities had generally positive total returns despite intense volatility in March. Non-U.S. developed market equities had weaker performance than emerging market and U.S. stocks. While gains from fixed-income securities were positive, they were more modest than equities. For the period, U.S. stocks, based on the S&P 500 Index,1 gained 9.71%. International stocks, as measured by the MSCI ACWI ex USA Index (Net),2 returned -2.61%, while the MSCI EM Index (Net)3 had stronger performance, with a 8.25% gain. Among bond indices, the Bloomberg Barclays U.S. Aggregate Bond Index4 returned 6.19%, the Bloomberg Barclays Global Aggregate ex-USD Index5 gained 4.96%, and the Bloomberg Barclays Municipal Bond Index6 returned 3.59% while the ICE BofA U.S. High Yield Index7 returned 2.54%.
The period began with buoyed investor confidence.
Equity markets rallied in November despite ongoing geopolitical risks. Hopes for a U.S.-China trade deal buoyed investor confidence. U.S. business sentiment improved slightly and manufacturing and services activity picked up. While consumer confidence and purchasing managers’ activity rose in the eurozone, China reported weakening manufacturing and consumer data. Bond yields rose marginally, leading to slightly negative returns for global government and investment-grade corporate bonds.
Financial markets ended 2019 boosted by the U.S. and China accord on a Phase One trade deal. That, along with the landslide election win by the pro-Brexit U.K. Conservative Party and ongoing central bank support, gave investors greater confidence. U.S. economic indicators were generally positive, with the exception of manufacturing activity and business confidence. Consumer confidence was fed by a robust labor market, tame inflation, and lower interest rates, which boosted housing affordability and stimulated homebuyer activity. The impeachment of President Trump had little market impact. Meanwhile, slowing Chinese economic activity, partly a result of the trade war, led to further government stimulus at year-end through lower reserve ratios, allowing banks to lend more money.
| 1 | The S&P 500 Index consists of 500 stocks chosen for market size, liquidity, and industry group representation. It is a market-value-weighted index with each stock’s weight in the index proportionate to its market value. You cannot invest directly in an index. |
| 2 | The Morgan Stanley Capital International (MSCI) All Country World Index (ACWI) ex USA Index (Net) is a free-float-adjusted market-capitalization-weighted index that is designed to measure the equity market performance of developed and emerging markets, excluding the United States. Source: MSCI. MSCI makes no express or implied warranties or representations and shall have no liability whatsoever with respect to any MSCI data contained herein. The MSCI data may not be further redistributed or used as a basis for other indices or any securities or financial products. This report is not approved, reviewed, or produced by MSCI. You cannot invest directly in an index. |
| 3 | The MSCI Emerging Markets (EM) Index (Net) is a free-float-adjusted market-capitalization-weighted index that is designed to measure equity market performance of emerging markets. You cannot invest directly in an index. |
| 4 | The Bloomberg Barclays U.S. Aggregate Bond Index is a broad-based benchmark that measures the investment-grade, U.S. dollar-denominated, fixed-rate taxable bond market, including Treasuries, government-related and corporate securities, mortgage-backed securities (agency fixed-rate and hybrid adjustable-rate mortgage pass-throughs), asset-backed securities, and commercial mortgage-backed securities. You cannot invest directly in an index. |
| 5 | The Bloomberg Barclays Global Aggregate ex-USD Index is an unmanaged index that provides a broad-based measure of the global investment-grade fixed-income markets excluding the U.S. dollar-denominated debt market. You cannot invest directly in an index. |
| 6 | The Bloomberg Barclays Municipal Bond Index is an unmanaged index composed of long-term tax-exempt bonds with a minimum credit rating of Baa. You cannot invest directly in an index. |
| 7 | The ICE BofA U.S. High Yield Index is a market-capitalization-weighted index of domestic and Yankee high-yield bonds. The index tracks the performance of high-yield securities traded in the U.S. bond market. You cannot invest directly in an index. Copyright 2020. ICE Data Indices, LLC. All rights reserved. |
2 | Wells Fargo International Equity Fund
Table of Contents
Letter to shareholders (unaudited)
The 2019 year-end rally continued in early January 2020. However, capital market volatility spiked in late January on concerns over the potential impact of COVID-19 on the global economy and stock markets. With sentiment somewhat souring, perceived safe havens did well in January. The U.S. dollar and Japanese yen both rose and government bonds outperformed equities. While the S&P 500 Index held its ground, emerging market equities tumbled, including those in Asia.
In February, COVID-19 became the major market focus. Fears of the virus’s impact on global growth led to expectations of increased global central bank monetary policy support. That led the 10-year U.S. Treasury yield to fall to an all-time low of 1.1%. Although equity markets initially shrugged off concerns about the outbreak, focusing instead on strong fourth-quarter earnings and improving business confidence in January, market sentiment turned sharply lower and the S&P 500 Index lost 8.2% for the month. Oil prices tumbled as Russia and the Organization of the Petroleum Exporting Countries compounded a major decline in oil demand with a brutal price war, partly aimed at dissuading further U.S. shale production, causing the price of West Texas Intermediate crude oil to plummet.
The global spread of COVID-19 in March led country after country to clamp down on social- and business-related activity in order to contain the virus from causing even greater devastation and overwhelming health care systems. This abrupt stoppage of economic activity led to the sharp deceleration of global output, sending economies into a deep contraction. Central banks responded swiftly, slashing interest rates and expanding quantitative easing programs to restore liquidity and confidence in the markets. In the U.S., the Federal Reserve (Fed) introduced several new lending programs, funding investment-grade bonds, money market mutual funds, and commercial paper while purchasing Treasuries, mortgage-backed securities, and overnight repurchase agreements. Meanwhile, stock markets tumbled quickly into a bear market, ending the longest bull stock market in U.S. history.
Markets rebounded strongly in April, fueled by unprecedented government and central bank stimulus measures. The U.S. economy contracted by an annualized 5.0% pace in the first quarter of 2020, with 30 million new unemployment insurance claims in six weeks. In the eurozone, first-quarter real gross domestic product (GDP) shrank 3.8% with the composite April Flash Purchasing Managers’ Index (PMI), a monthly survey of purchasing managers, falling to an all-time low of 13.5. The European Central Bank expanded its quantitative easing to include the purchase of additional government bonds of countries with the greatest virus-related need, including Italy and Spain. China’s first-quarter GDP fell by 6.8% year over year. However, retail sales, production, and investment showed signs of recovery. Extreme oil-price volatility continued as global supply far exceeded demand.
The global equity market rebound continued in May, with widespread advances. Investors regained confidence on reports of early signs of success in human trials of a COVID-19 vaccine. Growth stocks continued to outperform value stocks while returns on global government bonds were generally flat. In the U.S., a gap grew between the stock market rebound and economic data, including an April unemployment rate of 14.7%, the highest level since World War II. Manufacturing and services purchasing managers’ indices reflected widespread weakening activity in May. U.S. corporate earnings reports indicated a 14% year-over-year contraction in earnings from the first quarter of 2019. However, high demand for technology, driven by remote activity, supported robust information technology sector earnings, which helped drive major technology stocks higher.
Financial markets posted widely positive returns in June despite ongoing economic weakness and high levels of uncertainty on the containment of COVID-19 and the timing of an effective vaccine. There were hopeful signs as economies reopened. Vitally important to market sentiment was the ongoing commitment by central banks globally
“The global spread of COVID-19 in March led country after country to clamp down on social- and business-related activity in order to contain the virus from causing even greater devastation and overwhelming health care systems.”
Wells Fargo International Equity Fund | 3
Table of Contents
Letter to shareholders (unaudited)
“In October, capital markets took a step back from their six-month rally. Market volatility rose in advance of the U.S. election and amid a global increase in COVID-19 infections.”
to do all they can to provide economic support through liquidity and low borrowing costs. U.S. economic activity was aided by one-time $1,200 stimulus checks and $600 weekly bonus unemployment benefits that expired at the end of July. However, unemployment remained historically high, easing somewhat from 14.7% in April to 11.1% in June. By the end of June, numerous states reported increases of COVID-19 cases. China’s economic recovery picked up momentum in June, though it remained far from a full recovery.
July was broadly positive for both global equities and fixed income. However, economic data and a resurgence of COVID-19 cases pointed to the vulnerability of the global economy and the ongoing imperative to regain control of the pandemic. Second-quarter GDP shrank from the previous quarter by 9.5% and 12.1% in the U.S. and the eurozone, respectively. In contrast, China reported a 3.2% year-over-year expansion in its second-quarter GDP. U.S. unemployment remained high despite adding 1.8 million jobs in July, with a double-digit jobless rate persisting. However, manufacturing activity grew in both the U.S. and the eurozone. In Asia, while China’s manufacturing sector continued to expand, activity in Japan and South Korea contracted. A rising concern was the rapid and broad reemergence of COVID-19 infections.
The stock market continued to rally in August despite concerns over rising numbers of COVID-19 cases in the United States and several European countries, including France and Spain, as well as the July expiration of the $600 weekly bonus unemployment benefit. U.S. stocks had strong monthly gains, surpassing broadly positive overall global equity performance, while fixed-income market monthly returns were broadly flat. Generally stronger-than-expected second-quarter earnings boosted investor sentiment along with the Fed’s announcement of a policy shift that will likely lead to longer-term low interest rates and supportive monetary policy. U.S. indices measuring manufacturing and services activities beat expectations while the U.S. housing market maintained strength. In Europe, retail sales expanded and consumer confidence was steady. China’s economy continued to expand.
Stocks grew more volatile in September on mixed economic data. U.S. economic activity continued to grow. However, six months after the bottom fell out of the labor market in early spring, only half of the 22 million jobs lost had returned. The U.S. unemployment rate fell to 7.9% in September, reflecting steady improvement but far higher than the 3.5% pre-COVID-19 rate. Only 661,000 jobs were added for the month, down from 1.5 million in August. Meanwhile, a reported 2.3 million people have given up looking for work. With U.S. Congress failing to pass further fiscal relief and uncertainties surrounding a possible vaccine, doubts crept back into the financial markets. In the U.K., a lack of progress in Brexit talks with the European Union weighed on markets. China’s economy picked up steam, however, with growth fueled by increased global demand, and China’s services sector rallied.
In October, capital markets took a step back from their six-month rally. Market volatility rose in advance of the U.S. election and amid a global increase in COVID-19 infections. Europe responded with a new round of restrictions affecting economic activity. Meanwhile, Brexit remained unresolved as the European Union and the U.K. failed to strike a deal by a mid-October deadline. U.S. markets looked favorably at a possible Democratic sweep and control of the federal purse strings as that could lead to the passage of long-awaited additional fiscal stimulus, which could boost economic activity. Meanwhile, China continued to stand apart, reporting 4.9% third-quarter GDP growth year over year.
4 | Wells Fargo International Equity Fund
Table of Contents
Letter to shareholders (unaudited)
Don’t let short-term uncertainty derail long-term investment goals.
Periods of investment uncertainty can present challenges, but experience has taught us that maintaining long-term investment goals can be an effective way to plan for the future. To help you create a sound strategy based on your personal goals and risk tolerance, Wells Fargo Funds offers more than 100 mutual funds spanning a wide range of asset classes and investment styles. Although diversification cannot guarantee an investment profit or prevent losses, we believe it can be an effective way to manage investment risk and potentially smooth out overall portfolio performance. We encourage investors to know their investments and to understand that appropriate levels of risk-taking may unlock opportunities.
Thank you for choosing to invest with Wells Fargo Funds. We appreciate your confidence in us and remain committed to helping you meet your financial needs.
Sincerely,

Andrew Owen
President
Wells Fargo Funds
|
For further information about your Fund, contact your investment professional, visit our website at wfam.com, or call us directly at 1-800-222-8222. |
Notice to Shareholders
At a meeting held on August 10-12, 2020, the Board of Trustees of the Fund approved a change to the Fund’s automatic conversion feature for Class C shares in order to shorten the required holding period from 10 to 8 years. As a result, on a monthly basis beginning November 5, 2020, Class C shares will convert automatically into Class A shares 8 years after the initial date of purchase or, if you acquired your Class C shares through an exchange or conversion from another share class, 8 years after the date you acquired your Class C shares. When Class C shares that you acquired through a purchase or exchange convert, any other Class C shares that you purchased with reinvested dividends and distributions also will convert into Class A shares on a pro rata basis.
Please note that a shorter holding period may apply depending on your intermediary. Please see “Appendix A—Sales Charge Reductions and Waivers for Certain Intermediaries” in the Fund’s prospectus for further information.
Wells Fargo International Equity Fund | 5
Table of Contents
Performance highlights (unaudited)
Investment objective
The Fund seeks long-term capital appreciation.
Manager
Wells Fargo Funds Management, LLC
Subadviser
Wells Capital Management Incorporated
Portfolio managers
Venkateshwar (Venk) Lal
Dale A. Winner, CFA®‡
Average annual total returns (%) as of October 31, 2020
| Including sales charge | Excluding sales charge | Expense ratios1 (%) | ||||||||||||||||||||||||||||||||
| Inception date | 1 year | 5 year | 10 year | 1 year | 5 year | 10 year | Gross | Net2 | ||||||||||||||||||||||||||
| Class A (WFEAX) | 1-20-1998 | -12.82 | -0.52 | 1.94 | -7.54 | 0.66 | 2.55 | 1.45 | 1.15 | |||||||||||||||||||||||||
| Class C (WFEFX) | 3-6-1998 | -9.22 | -0.08 | 1.79 | -8.22 | -0.08 | 1.79 | 2.20 | 1.90 | |||||||||||||||||||||||||
| Class R (WFERX) | 10-10-2003 | – | – | – | -7.84 | 0.42 | 2.30 | 1.70 | 1.40 | |||||||||||||||||||||||||
| Class R6 (WFEHX)3 | 9-30-2015 | – | – | – | -7.15 | 0.99 | 2.82 | 1.02 | 0.80 | |||||||||||||||||||||||||
| Administrator Class (WFEDX) | 7-16-2010 | – | – | – | -7.54 | 0.68 | 2.56 | 1.37 | 1.15 | |||||||||||||||||||||||||
| Institutional Class (WFENX) | 3-9-1998 | – | – | – | -7.28 | 0.93 | 2.81 | 1.12 | 0.85 | |||||||||||||||||||||||||
| MSCI ACWI ex USA Index (Net)4 | – | – | – | – | -2.61 | 4.26 | 3.43 | – | – | |||||||||||||||||||||||||
| MSCI ACWI ex USA Value Index (Net)5 | – | – | – | – | -15.94 | 0.18 | 0.88 | – | – | |||||||||||||||||||||||||
Figures quoted represent past performance, which is no guarantee of future results, and do not reflect taxes that a shareholder may pay on an investment in a fund. Investment return and principal value of an investment will fluctuate so that an investor’s shares, when redeemed, may be worth more or less than their original cost. Performance shown without sales charges would be lower if sales charges were reflected. Current performance may be lower or higher than the performance data quoted, which assumes the reinvestment of dividends and capital gains. Current month-end performance is available on the Fund’s website, wfam.com.
Index returns do not include transaction costs associated with buying and selling securities, any mutual fund fees or expenses, or any taxes. It is not possible to invest directly in an index.
For Class A shares, the maximum front-end sales charge is 5.75%. For Class C shares, the maximum contingent deferred sales charge is 1.00%. Performance including a contingent deferred sales charge assumes the sales charge for the corresponding time period. Class R, Class R6, Administrator Class, and Institutional Class shares are sold without a front-end sales charge or contingent deferred sales charge.
Stock values fluctuate in response to the activities of individual companies and general market and economic conditions. Foreign investments are especially volatile and can rise or fall dramatically due to differences in the political and economic conditions of the host country. These risks are generally intensified in emerging markets. The use of derivatives may reduce returns and/or increase volatility. Certain investment strategies tend to increase the total risk of an investment (relative to the broader market). The Fund is exposed to smaller-company securities risk. Consult the Fund’s prospectus for additional information on these and other risks.
Please see footnotes on page 7.
6 | Wells Fargo International Equity Fund
Table of Contents
Performance highlights (unaudited)
| Growth of $10,000 investment as of October 31, 20206 |
|
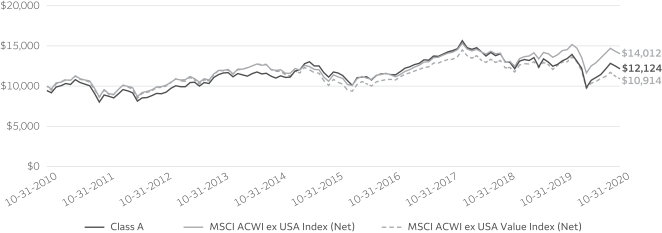
| ‡ | CFA® and Chartered Financial Analyst® are trademarks owned by CFA Institute. |
| 1 | Reflects the expense ratios as stated in the most recent prospectuses, which include the impact of 0.01% in acquired fund fees and expenses. The expense ratios shown are subject to change and may differ from the annualized expense ratios shown in the financial highlights of this report, which do not include acquired fund fees and expenses. |
| 2 | The manager has contractually committed through February 28, 2021, to waive fees and/or reimburse expenses to the extent necessary to cap total annual fund operating expenses after fee waivers at 1.14% for Class A, 1.89% for Class C, 1.39% for Class R, 0.79% for Class R6, 1.14% for Administrator Class, and 0.84% for Institutional Class. Brokerage commissions, stamp duty fees, interest, taxes, acquired fund fees and expenses (if any), and extraordinary expenses are excluded from the expense caps. Prior to or after the commitment expiration date, the caps may be increased or the commitment to maintain the caps may be terminated only with the approval of the Board of Trustees. Without these caps, the Fund’s returns would have been lower. The expense ratio paid by an investor is the net expense ratio (the total annual fund operating expenses after fee waivers) as stated in the prospectuses. |
| 3 | Historical performance shown for the Class R6 shares prior to their inception reflects the performance of the Institutional Class shares and includes the higher expenses applicable to the Institutional Class shares. If these expenses had not been included, returns for the Class R6 shares would be higher. |
| 4 | The Morgan Stanley Capital International (MSCI) All Country World Index (ACWI) ex USA Index (Net) is a free-float-adjusted market capitalization-weighted index that is designed to measure the equity market performance of developed and emerging markets, excluding the United States. Source: MSCI. MSCI makes no express or implied warranties or representations and shall have no liability whatsoever with respect to any MSCI data contained herein. The MSCI data may not be further redistributed or used as a basis for other indexes or any securities or financial products. This report is not approved, reviewed, or produced by MSCI. You cannot invest directly in an index. |
| 5 | The MSCI ACWI ex USA Value Index (Net) captures large and mid-cap securities exhibiting overall value style characteristics across developed and emerging markets countries excluding the United States. The value investment style characteristics for index construction are defined using three variables: book value to price, 12-month forward earnings to price, and dividend yield. You cannot invest directly in an index. |
| 6 | The chart compares the performance of Class A shares for the most recent ten years with the MSCI ACWI ex USA Index (Net) and the MSCI ACWI ex USA Value Index (Net). The chart assumes a hypothetical investment of $10,000 in Class A shares and reflects all operating expenses and assumes the maximum initial sales charge of 5.75%. |
| 7 | The ten largest holdings, excluding cash, cash equivalents and any money market funds, are calculated based on the value of the investments divided by total net assets of the Fund. Holdings are subject to change and may have changed since the date specified. |
| 8 | Amounts are calculated based on the total long-term investments of the Fund. These amounts are subject to change and may have changed since the date specified. |
| 9 | The S&P 500 Index consists of 500 stocks chosen for market size, liquidity, and industry group representation. It is a market-value-weighted index with each stock’s weight in the index proportionate to its market value. You cannot invest directly in an index. |
Wells Fargo International Equity Fund | 7
Table of Contents
Performance highlights (unaudited)
MANAGER’S DISCUSSION
Fund highlights
| ∎ | The Fund underperformed the MSCI ACWI ex USA Index (Net) while outperforming the MSCI ACWI ex USA Value Index (Net) for the 12-month period that ended October 31, 2020. |
| ∎ | Information technology (IT), communication services, industrials, consumer staples, health care, and materials stocks were relative performance laggards due to a combination of negative allocation and selection effects. Positioning within consumer discretionary, financials, and energy resulted in notable contributions to performance. The portfolio’s relative performance also benefited from not having any exposure to the real estate or utilities sectors, both of which underperformed the index. |
| ∎ | The Fund remained overweight Europe, including overweights to the Netherlands, Norway, and the U.K., which were offset by underweights to France, Switzerland, and Germany. The Fund was underweight Asia on a regional basis, including underweights to Japan, Australia, and Singapore, offset by overweights to Korea, China/Hong Kong, and Thailand. |
Our investment and risk management process of finding non-consensus undervalued equities, marrying core micro stock picking with macro risk management in each region of the globe, resulted in shifts to sector and country allocations, including an increase in exposure to consumer discretionary, health care, IT, Korea, the U.S., and China/Hong Kong, which was offset by reduced allocations to energy, communication services, industrials, Italy, the U.K., and Singapore. Notable position changes during the period included the addition of Sanofi S.A. (a leading global health care company based in France), Nomad Foods Limited (Europe’s leading frozen-food company), and Coway (a leading South Korean home appliance manufacturer). The Fund notably exited BP p.l.c. (a UK oil company), Eni S.p.A. (an Italian energy company), and Keppel Corporation (a Singapore-based conglomerate).
| Ten largest holdings (%) as of October 31, 20207 | ||||
Alibaba Group Holding Limited ADR | 3.03 | |||
Hitachi Limited | 2.97 | |||
Koninklijke Philips NV | 2.95 | |||
Midea Group Company Limited Class A | 2.95 | |||
Sanofi SA | 2.87 | |||
Xinyi Glass Holdings Limited | 2.80 | |||
Nomad Foods Limited | 2.79 | |||
Novartis AG | 2.77 | |||
Samsung Electronics Company Limited GDR | 2.76 | |||
Coway Company Limited | 2.65 | |||
| Sector allocation as of October 31, 20208 |
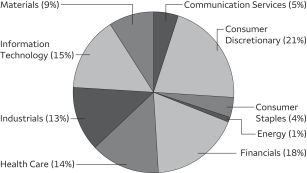 |
Weakness in the IT, communication services, industrials, and consumer staples sectors offset annual gains.
Weakest performers included Greencore Group plc, Melrose Industries plc, OCI, John Wood Group, and Keppel Corporation. Greencore Group, a small-cap Irish-based food manufacturer specializing in convenience and fresh foods, reported a 34% year-over-year decline in revenues for the three-month period that ended June 28, 2020 as a result of dramatic changes in consumption patterns due to the pandemic. However, the company’s revenue losses steadily narrowed from -43% in April 2020 to -23% through the first three weeks of July as restrictions on population movements eased. We exited Melrose Industries, a U.K.-domiciled investment company that seeks to buy good manufacturing businesses with strong fundamentals (using low leverage), improves the business, sells them, and then returns proceeds to shareholders. While the self-help potential from cost-cutting, sale of non-core assets, and investment in underinvested divisions remains strong, it is more than offset by challenges in aerospace—civil aerospace, in particular—and automotive space. Accordingly, earnings revisions have been uniformly negative and shares traded closer to fair value.
Please see footnotes on page 7.
8 | Wells Fargo International Equity Fund
Table of Contents
Performance highlights (unaudited)
| Geographic allocation as of October 31, 20208 |
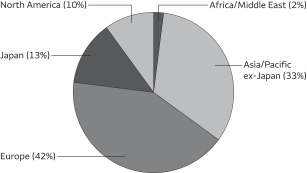 |
Over the past 12 months, contributions to performance were driven largely by stock selection.
Top contributors included Xinyi Glass, Midea Group, Lundin Mining Corporation, Fresnillo plc, and Oppein Home Group Incorporated. Xinyi Glass, a Chinese float glass manufacturer benefiting from industry supply constraints, capacity expansion, and line extensions, outperformed given a strong rebound in the float glass price (up 48% since May) from demand improvement—particularly in the area of property completion and limited supply expansion; lower cost of goods sold from lower soda ash and liquefied natural gas, which should result in margin improvement; and capacity
expansion from the acquisition of three float glass production lines, circumventing limitation on new float glass production construction. Midea Group, a Chinese producer of home appliances, announced better-than-expected second-quarter and first-half results, confirming well-above-peer results in net profits, cash flow, working capital, and dividends, as well as continued market share gains. Demonstrating its best-in-class franchise value, product innovation, and channel efficiency, Midea expanded its market share and showed indications of revenue and net profit recovery despite the COVID-19 backdrop.
Outlook
Our short-term outlook is neutral. The market has traversed the initial panic sell-off and relief rally phases and is now in the relapse correction phase characterized by a V-shaped recovery being priced in but many cyclicals may not see a full V, particularly those that are structurally challenged; a plateauing in economic data, including PMI, employment, and consumer confidence; a range-bound U.S. Treasury 10-year yield of 60 to 80 basis points (bps; 100 bps equal 1.00%), implying low growth prospects; rising U.S. election uncertainty, including the potential for a contested election or higher taxes; worsening U.S.-China trade rhetoric; and virus resurgence and risk of delayed reopenings.
We have experienced the magnitude of the relapse correction as the S&P 500 Index9 experienced two corrections (-10% in September and -7.5% in October), but not the typical duration as the corrections occurred over short two- to three-week periods. Volatility spiked in October on concerns of virus resurgence and the potential for additional lockdowns but eased somewhat in October. However, we expect volatility to remain elevated leading into the U.S. election in November, including during the aftermath of Election Day, as mail-in votes are tallied.
We recently upgraded our longer-term outlook from neutral to constructive. The COVID-19-induced recession and bear market is likely over as the MSCI ACWI surpassed its previous high on February 12, 2020, and a new economic recovery began, supported by aggressive monetary, fiscal, and health care responses. First, the U.S. Federal Reserve’s pivot to targeting average 2% inflation will allow inflation to run higher and aid a recovery in employment. This will anchor short-term rates close to zero for two to three years and potentially steepen yield curves as longer-term rates start to forecast economic normalization. Other central banks could follow suit. Second, fiscal stimulus continues with the historic €750 billion European Union recovery fund and likely increased fiscal spending in the U.S. and globally on infrastructure and green technology post-election. Third, the COVID-19 health care response has been improving, with recent approval of Abbott Laboratories’ rapid test and multiple large-scale vaccine trials with preliminary data available as soon as the fourth quarter. Finally, global growth prospects have been improving as the Organisation for Economic Co-operation and Development recently upgraded global gross domestic product forecasts for 2020, from -6.0% in June to -4.5% in September, and is forecasting +5.0% for 2021.
Please see footnotes on page 7.
Wells Fargo International Equity Fund | 9
Table of Contents
As a shareholder of the Fund, you incur two types of costs: (1) transaction costs, including sales charges (loads) on purchase payments and contingent deferred sales charges (if any) on redemptions and (2) ongoing costs, including management fees, distribution (12b-1) and/or shareholder servicing fees, and other Fund expenses. This example is intended to help you understand your ongoing costs (in dollars) of investing in the Fund and to compare these costs with the ongoing costs of investing in other mutual funds.
The example is based on an investment of $1,000 invested at the beginning of the six-month period and held for the entire period from May 1, 2020 to October 31, 2020.
Actual expenses
The “Actual” line of the table below provides information about actual account values and actual expenses. You may use the information in this line, together with the amount you invested, to estimate the expenses that you paid over the period. Simply divide your account value by $1,000 (for example, an $8,600 account value divided by $1,000 = 8.6), then multiply the result by the number in the “Actual” line under the heading entitled “Expenses paid during period” for your applicable class of shares to estimate the expenses you paid on your account during this period.
Hypothetical example for comparison purposes
The “Hypothetical” line of the table below provides information about hypothetical account values and hypothetical expenses based on the Fund’s actual expense ratio and an assumed rate of return of 5% per year before expenses, which is not the Fund’s actual return. The hypothetical account values and expenses may not be used to estimate the actual ending account balance or expenses you paid for the period. You may use this information to compare the ongoing costs of investing in the Fund and other funds. To do so, compare this 5% hypothetical example with the 5% hypothetical examples that appear in the shareholder reports of the other funds.
Please note that the expenses shown in the table are meant to highlight your ongoing costs only and do not reflect any transactional costs, such as sales charges (loads) and contingent deferred sales charges. Therefore, the “Hypothetical” line of the table is useful in comparing ongoing costs only and will not help you determine the relative total costs of owning different funds. In addition, if these transactional costs were included, your costs would have been higher.
| Beginning account value 5-1-2020 | Ending account value 10-31-2020 | Expenses paid during the period1 | Annualized net expense ratio | |||||||||||||
Class A | ||||||||||||||||
Actual | $ | 1,000.00 | $ | 1,131.85 | $ | 6.11 | 1.14 | % | ||||||||
Hypothetical (5% return before expenses) | $ | 1,000.00 | $ | 1,019.41 | $ | 5.79 | 1.14 | % | ||||||||
Class C | ||||||||||||||||
Actual | $ | 1,000.00 | $ | 1,128.01 | $ | 10.11 | 1.89 | % | ||||||||
Hypothetical (5% return before expenses) | $ | 1,000.00 | $ | 1,015.63 | $ | 9.58 | 1.89 | % | ||||||||
Class R | ||||||||||||||||
Actual | $ | 1,000.00 | $ | 1,130.57 | $ | 7.44 | 1.39 | % | ||||||||
Hypothetical (5% return before expenses) | $ | 1,000.00 | $ | 1,018.15 | $ | 7.05 | 1.39 | % | ||||||||
Class R6 | ||||||||||||||||
Actual | $ | 1,000.00 | $ | 1,133.96 | $ | 4.24 | 0.79 | % | ||||||||
Hypothetical (5% return before expenses) | $ | 1,000.00 | $ | 1,021.17 | $ | 4.01 | 0.79 | % | ||||||||
Administrator Class | ||||||||||||||||
Actual | $ | 1,000.00 | $ | 1,131.70 | $ | 6.11 | 1.14 | % | ||||||||
Hypothetical (5% return before expenses) | $ | 1,000.00 | $ | 1,019.41 | $ | 5.79 | 1.14 | % | ||||||||
Institutional Class | ||||||||||||||||
Actual | $ | 1,000.00 | $ | 1,132.96 | $ | 4.50 | 0.84 | % | ||||||||
Hypothetical (5% return before expenses) | $ | 1,000.00 | $ | 1,020.91 | $ | 4.27 | 0.84 | % | ||||||||
| 1 | Expenses paid is equal to the annualized net expense ratio of each class multiplied by the average account value over the period, multiplied by the number of days in the most recent fiscal half-year divided by the number of days in the fiscal year (to reflect the one-half-year period). |
10 | Wells Fargo International Equity Fund
Table of Contents
Portfolio of investments—October 31, 2020
| Shares | Value | |||||||||||||||
| Common Stocks: 95.51% |
| |||||||||||||||
Australia: 2.10% |
| |||||||||||||||
Qantas Airways Limited (Industrials, Airlines) † | 1,336,389 | $ | 3,931,570 | |||||||||||||
|
| |||||||||||||||
| Canada: 3.01% | ||||||||||||||||
Home Capital Group Incorporated (Financials, Thrifts & Mortgage Finance) † | 124,100 | 2,266,271 | ||||||||||||||
Lundin Mining Corporation (Materials, Metals & Mining) | 558,293 | 3,373,308 | ||||||||||||||
| 5,639,579 | ||||||||||||||||
|
| |||||||||||||||
| China: 10.80% | ||||||||||||||||
Alibaba Group Holding Limited ADR (Consumer Discretionary, Internet & Direct Marketing Retail) † | 149,816 | 5,677,104 | ||||||||||||||
HollySys Automation Technologies Limited (Information Technology, Electronic Equipment, Instruments & Components) | 120,046 | 1,343,315 | ||||||||||||||
LONGi Green Energy Technology Company Limited Class A (Information Technology, Semiconductors & Semiconductor Equipment) | 107,501 | 1,222,280 | ||||||||||||||
Midea Group Company Limited Class A (Consumer Discretionary, Household Durables) | 473,951 | 5,531,104 | ||||||||||||||
Oppein Home Group Incorporated Class A (Consumer Discretionary, Household Durables) | 138,031 | 2,537,956 | ||||||||||||||
Shanghai Pharmaceuticals Holding Company Limited Class H (Health Care, Health Care Providers & Services) | 2,039,900 | 3,166,548 | ||||||||||||||
Topsports International Holdings Limited (Consumer Discretionary, Textiles, Apparel & Luxury Goods) 144A | 566,000 | 776,094 | ||||||||||||||
| 20,254,401 | ||||||||||||||||
|
| |||||||||||||||
| Denmark: 1.86% | ||||||||||||||||
Danske Bank AS (Financials, Banks) † | 261,323 | 3,482,800 | ||||||||||||||
|
| |||||||||||||||
| France: 4.90% | ||||||||||||||||
Compagnie de Saint-Gobain SA (Industrials, Building Products) † | 97,817 | 3,810,315 | ||||||||||||||
Sanofi SA (Health Care, Pharmaceuticals) | 59,513 | 5,373,628 | ||||||||||||||
| 9,183,943 | ||||||||||||||||
|
| |||||||||||||||
| Germany: 4.74% | ||||||||||||||||
Muenchener Rueckversicherungs Gesellschaft AG (Financials, Insurance) | 15,291 | 3,583,861 | ||||||||||||||
Rheinmetall AG (Industrials, Industrial Conglomerates) | 45,120 | 3,297,538 | ||||||||||||||
Siemens AG (Industrials, Industrial Conglomerates) | 15,543 | 1,823,443 | ||||||||||||||
Siemens Energy AG (Industrials, Electrical Equipment) † | 8,090 | 177,134 | ||||||||||||||
| 8,881,976 | ||||||||||||||||
|
| |||||||||||||||
| Hong Kong: 3.79% | ||||||||||||||||
China Mobile Limited (Communication Services, Wireless Telecommunication Services) | 304,500 | 1,862,486 | ||||||||||||||
Xinyi Glass Holdings Limited (Consumer Discretionary, Auto Components) | 2,390,000 | 5,248,528 | ||||||||||||||
| 7,111,014 | ||||||||||||||||
|
| |||||||||||||||
| India: 2.56% | ||||||||||||||||
Tech Mahindra Limited (Information Technology, IT Services) | 436,445 | 4,805,706 | ||||||||||||||
|
| |||||||||||||||
| Ireland: 0.95% | ||||||||||||||||
Greencore Group plc (Consumer Staples, Food Products) | 1,524,279 | 1,784,535 | ||||||||||||||
|
| |||||||||||||||
| Israel: 2.16% | ||||||||||||||||
Check Point Software Technologies Limited (Information Technology, Software) † | 35,716 | 4,055,908 | ||||||||||||||
|
| |||||||||||||||
| Italy: 1.93% | ||||||||||||||||
Prysmian SpA (Industrials, Electrical Equipment) | 132,923 | 3,617,154 | ||||||||||||||
|
| |||||||||||||||
The accompanying notes are an integral part of these financial statements.
Wells Fargo International Equity Fund | 11
Table of Contents
Portfolio of investments—October 31, 2020
| Shares | Value | |||||||||||||||
| Japan: 12.20% | ||||||||||||||||
Alps Electric Company Limited (Information Technology, Electronic Equipment, Instruments & Components) | 302,200 | $ | 4,359,940 | |||||||||||||
Daiwa Securities Group Incorporated (Financials, Capital Markets) | 1,061,300 | 4,300,194 | ||||||||||||||
Hitachi Limited (Information Technology, Electronic Equipment, Instruments & Components) | 165,300 | 5,571,320 | ||||||||||||||
Mitsubishi UFJ Financial Group Incorporated (Financials, Banks) | 1,199,000 | 4,726,344 | ||||||||||||||
Takeda Pharmaceutical Company Limited (Health Care, Pharmaceuticals) | 127,100 | 3,927,719 | ||||||||||||||
| 22,885,517 | ||||||||||||||||
|
| |||||||||||||||
| Luxembourg: 1.69% | ||||||||||||||||
Samsonite International SA (Consumer Discretionary, Textiles, Apparel & Luxury Goods) † | 3,110,100 | 3,172,767 | ||||||||||||||
|
| |||||||||||||||
| Mexico: 1.01% | ||||||||||||||||
Fresnillo plc (Materials, Metals & Mining) | 126,313 | 1,905,116 | ||||||||||||||
|
| |||||||||||||||
| Netherlands: 6.59% | ||||||||||||||||
Koninklijke Philips NV (Health Care, Health Care Equipment & Supplies) † | 119,469 | 5,533,416 | ||||||||||||||
NN Group NV (Financials, Insurance) | 130,796 | 4,551,822 | ||||||||||||||
OCI NV (Materials, Chemicals) † | 189,498 | 2,268,625 | ||||||||||||||
| 12,353,863 | ||||||||||||||||
|
| |||||||||||||||
| Norway: 1.85% | ||||||||||||||||
Den Norske Bank ASA (Financials, Banks) † | 257,130 | 3,472,486 | ||||||||||||||
|
| |||||||||||||||
| Russia: 1.43% | ||||||||||||||||
Mobile TeleSystems PJSC ADR (Communication Services, Wireless Telecommunication Services) | 342,138 | 2,675,519 | ||||||||||||||
|
| |||||||||||||||
| South Korea: 9.35% | ||||||||||||||||
Coway Company Limited (Consumer Discretionary, Household Durables) † | 81,061 | 4,963,567 | ||||||||||||||
Hana Financial Group Incorporated (Financials, Banks) | 131,515 | 3,552,544 | ||||||||||||||
Samsung Electronics Company Limited GDR (Information Technology, Technology Hardware, Storage & Peripherals) 144A | 4,102 | 5,174,961 | ||||||||||||||
SK Telecom Company Limited (Communication Services, Wireless Telecommunication Services) | 20,275 | 3,844,721 | ||||||||||||||
| 17,535,793 | ||||||||||||||||
|
| |||||||||||||||
| Switzerland: 5.29% | ||||||||||||||||
LafargeHolcim Limited (Materials, Construction Materials) | 110,205 | 4,729,958 | ||||||||||||||
Novartis AG (Health Care, Pharmaceuticals) | 66,629 | 5,191,904 | ||||||||||||||
| 9,921,862 | ||||||||||||||||
|
| |||||||||||||||
| Thailand: 0.75% | ||||||||||||||||
Siam Commercial Bank plc (Financials, Banks) | 676,500 | 1,410,845 | ||||||||||||||
|
| |||||||||||||||
| United Kingdom: 10.99% | ||||||||||||||||
ConvaTec Group plc (Health Care, Health Care Equipment & Supplies) 144A | 1,239,804 | 2,902,296 | ||||||||||||||
John Wood Group plc (Energy, Energy Equipment & Services) † | 930,233 | 2,553,577 | ||||||||||||||
Kingfisher plc (Consumer Discretionary, Specialty Retail) † | 677,084 | 2,518,065 | ||||||||||||||
Man Group plc (Financials, Capital Markets) | 578,313 | 807,015 | ||||||||||||||
Nomad Foods Limited (Consumer Staples, Food Products) † | 215,829 | 5,233,853 | ||||||||||||||
Sensata Technologies Holding plc (Industrials, Electrical Equipment) † | 51,221 | 2,238,870 | ||||||||||||||
Smiths Group plc (Industrials, Industrial Conglomerates) | 253,009 | 4,359,342 | ||||||||||||||
| 20,613,018 | ||||||||||||||||
|
| |||||||||||||||
The accompanying notes are an integral part of these financial statements.
12 | Wells Fargo International Equity Fund
Table of Contents
Portfolio of investments—October 31, 2020
| Shares | Value | |||||||||||||||
| United States: 5.56% | ||||||||||||||||
Advance Auto Parts Incorporated (Consumer Discretionary, Specialty Retail) | 16,185 | $ | 2,383,727 | |||||||||||||
Berry Global Group Incorporated (Materials, Containers & Packaging) † | 71,493 | 3,333,719 | ||||||||||||||
Gentex Corporation (Consumer Discretionary, Auto Components) | 170,276 | 4,711,537 | ||||||||||||||
| 10,428,983 | ||||||||||||||||
|
| |||||||||||||||
Total Common Stocks (Cost $157,588,971) |
| 179,124,355 | ||||||||||||||
|
| |||||||||||||||
| Yield | ||||||||||||||||
| Short-Term Investments: 1.24% | ||||||||||||||||
| Investment Companies: 1.24% | ||||||||||||||||
Wells Fargo Government Money Market Fund Select Class (l)(u) | 0.03 | % | 2,330,238 | 2,330,238 | ||||||||||||
|
| |||||||||||||||
Total Short-Term Investments (Cost $2,330,238) | 2,330,238 | |||||||||||||||
|
| |||||||||||||||
| Total investments in securities (Cost $159,919,209) | 96.75 | % | 181,454,593 | |||||
Other assets and liabilities, net | 3.25 | 6,087,940 | ||||||
|
|
|
| |||||
| Total net assets | 100.00 | % | $ | 187,542,533 | ||||
|
|
|
| |||||
| † | Non-income-earning security |
| 144A | The security may be resold in transactions exempt from registration, normally to qualified institutional buyers, pursuant to Rule 144A under the Securities Act of 1933. |
| (l) | The issuer of the security is an affiliated person of the Fund as defined in the Investment Company Act of 1940. |
| (u) | The rate represents the 7-day annualized yield at period end. |
Abbreviations:
| ADR | American depositary receipt |
| GDR | Global depositary receipt |
Forward Foreign Currency Contracts
| Currency to be received | Currency to be delivered | Counterparty | Settlement date | Unrealized gains | Unrealized losses | |||||||||
| 2,878,341 USD | 2,196,000 GBP | Barclay Bank plc | 11-17-2020 | $ | 33,172 | $ | 0 | |||||||
Investments in Affiliates
An affiliated investment is an investment in which the Fund owns at least 5% of the outstanding voting shares of the issuer or as a result of other relationships, such as the Fund and the issuer having the same investment manager. Transactions with issuers that were either affiliated persons of the Fund at the beginning of the period or the end of the period were as follows:
| Value, beginning of period | Purchases | Sales proceeds | Net realized gains (losses) | Net change in unrealized gains (losses) | Value, end of priod | % of net assets | Shares, end of period | Income from affiliated securities | ||||||||||||||||||||||||||||
| Short-Term Investments | ||||||||||||||||||||||||||||||||||||
Investment Companies | ||||||||||||||||||||||||||||||||||||
Securities Lending Cash Investments LLC* | $ | 0 | $ | 13,055,294 | $ | (13,055,600 | ) | $ | 306 | $ | 0 | $ | 0 | 0 | $ | 6,298 | # | |||||||||||||||||||
Wells Fargo Government Money Market Fund Select Class | 2,779,280 | 118,292,490 | (118,741,532 | ) | 0 | 0 | 2,330,238 | 2,330,238 | 37,583 | |||||||||||||||||||||||||||
|
|
|
|
|
|
|
|
|
| |||||||||||||||||||||||||||
| $ | 306 | $ | 0 | $ | 2,330,238 | 1.24 | % | $ | 43,881 | |||||||||||||||||||||||||||
|
|
|
|
|
|
|
|
|
| |||||||||||||||||||||||||||
| * | No longer held at the end of the period |
| # | Amount shown represents income before fees and rebates. |
The accompanying notes are an integral part of these financial statements.
Wells Fargo International Equity Fund | 13
Table of Contents
Statement of assets and liabilities—October 31, 2020
Assets | ||||
Investments in unaffiliated securities, at value (cost $157,588,971) | $ | 179,124,355 | ||
Investments in affiliated securities, at value (cost $2,330,238) | 2,330,238 | |||
Cash | 69,592 | |||
Foreign currency, at value (cost $151,417) | 122,996 | |||
Receivable for investments sold | 6,361,831 | |||
Receivable for Fund shares sold | 25,000 | |||
Receivable for dividends | 1,686,698 | |||
Unrealized gains on forward foreign currency contracts | 33,172 | |||
Prepaid expenses and other assets | 10,696 | |||
|
| |||
Total assets | 189,764,578 | |||
|
| |||
Liabilities | ||||
Payable for investments purchased | 1,500,478 | |||
Payable for Fund shares redeemed | 367,834 | |||
Management fee payable | 188,160 | |||
Administration fees payable | 24,951 | |||
Distribution fees payable | 4,119 | |||
Trustees’ fees and expenses payable | 2,689 | |||
Accrued expenses and other liabilities | 133,814 | |||
|
| |||
Total liabilities | 2,222,045 | |||
|
| |||
Total net assets | $ | 187,542,533 | ||
|
| |||
Net assets consist of | ||||
Paid-in capital | $ | 209,520,194 | ||
Total distributable loss | (21,977,661 | ) | ||
|
| |||
Total net assets | $ | 187,542,533 | ||
|
| |||
Computation of net asset value and offering price per share | ||||
Net assets – Class A | $ | 62,800,487 | ||
Shares outstanding – Class A1 | 6,020,930 | |||
Net asset value per share – Class A | $10.43 | |||
Maximum offering price per share – Class A2 | $11.07 | |||
Net assets – Class C | $ | 5,793,585 | ||
Shares outstanding – Class C1 | 562,045 | |||
Net asset value per share – Class C | $10.31 | |||
Net assets – Class R | $ | 296,674 | ||
Shares outstanding – Class R1 | 27,847 | |||
Net asset value per share – Class R | $10.65 | |||
Net assets – Class R6 | $ | 32,010,743 | ||
Shares outstanding – Class R61 | 3,091,081 | |||
Net asset value per share – Class R6 | $10.36 | |||
Net assets – Administrator Class | $ | 589,239 | ||
Shares outstanding – Administrator Class1 | 57,335 | |||
Net asset value per share – Administrator Class | $10.28 | |||
Net assets – Institutional Class | $ | 86,051,805 | ||
Shares outstanding – Institutional Class1 | 8,319,999 | |||
Net asset value per share – Institutional Class | $10.34 | |||
| 1 | The Fund has an unlimited number of authorized shares. |
| 2 | Maximum offering price is computed as 100/94.25 of net asset value. On investments of $50,000 or more, the offering price is reduced. |
The accompanying notes are an integral part of these financial statements.
14 | Wells Fargo International Equity Fund
Table of Contents
Statement of operations—year ended October 31, 2020
Investment income | ||||
Dividends (net of foreign withholding taxes of $578,682) | $ | 4,969,943 | ||
Income from affiliated securities | 44,866 | |||
|
| |||
Total investment income | 5,014,809 | |||
|
| |||
Expenses | ||||
Management fee | 1,924,894 | |||
Administration fees |
| |||
Class A | 146,358 | |||
Class C | 16,651 | |||
Class R | 1,014 | |||
Class R6 | 10,251 | |||
Administrator Class | 1,082 | |||
Institutional Class | 147,354 | |||
Shareholder servicing fees |
| |||
Class A | 173,816 | |||
Class C | 19,767 | |||
Class R | 1,118 | |||
Administrator Class | 2,073 | |||
Distribution fees |
| |||
Class C | 59,173 | |||
Class R | 1,033 | |||
Custody and accounting fees | 103,143 | |||
Professional fees | 64,457 | |||
Registration fees | 88,631 | |||
Shareholder report expenses | 71,395 | |||
Trustees’ fees and expenses | 21,096 | |||
Other fees and expenses | 30,785 | |||
|
| |||
Total expenses | 2,884,091 | |||
Less: Fee waivers and/or expense reimbursements |
| |||
Fund-level | (577,919 | ) | ||
Class A | (61,751 | ) | ||
Class C | (6,310 | ) | ||
Class R | (135 | ) | ||
Administrator Class | (2 | ) | ||
Institutional Class | (58,913 | ) | ||
|
| |||
Net expenses | 2,179,061 | |||
|
| |||
Net investment income | 2,835,748 | |||
|
| |||
Realized and unrealized gains (losses) on investments | ||||
Net realized gains (losses) on |
| |||
Unaffiliated securities | (27,474,966 | ) | ||
Affiliated securities | 306 | |||
Forward foreign currency contracts | (2,084,831 | ) | ||
|
| |||
Net realized losses on investments | (29,559,491 | ) | ||
|
| |||
Net change in unrealized gains (losses) on |
| |||
Unaffiliated securities | 3,200,306 | |||
Forward foreign currency contracts | 1,072,356 | |||
|
| |||
Net change in unrealized gains (losses) on investments | 4,272,662 | |||
|
| |||
Net realized and unrealized gains (losses) on investments | (25,286,829 | ) | ||
|
| |||
Net decrease in net assets resulting from operations | $ | (22,451,081 | ) | |
|
| |||
The accompanying notes are an integral part of these financial statements.
Wells Fargo International Equity Fund | 15
Table of Contents
Statement of changes in net assets
| Year ended October 31, 2020 | Year ended October 31, 2019 | |||||||||||||||
Operations |
| |||||||||||||||
Net investment income | $ | 2,835,748 | $ | 7,158,795 | ||||||||||||
Net realized losses on investments | (29,559,491 | ) | (8,056,815 | ) | ||||||||||||
Net change in unrealized gains (losses) on investments | 4,272,662 | (662,309 | ) | |||||||||||||
|
| |||||||||||||||
Net decrease in net assets resulting from operations | (22,451,081 | ) | (1,560,329 | ) | ||||||||||||
|
| |||||||||||||||
Distributions to shareholders from net investment income and net realized gains | ||||||||||||||||
Class A | (662,605 | ) | (3,814,733 | ) | ||||||||||||
Class C | (43,116 | ) | (465,349 | ) | ||||||||||||
Class R | (3,818 | ) | (49,381 | ) | ||||||||||||
Class R6 | (474,234 | ) | (1,911,254 | ) | ||||||||||||
Administrator Class | (8,337 | ) | (181,829 | ) | ||||||||||||
Institutional Class | (1,471,021 | ) | (9,669,266 | ) | ||||||||||||
|
| |||||||||||||||
Total distributions to shareholders | (2,663,131 | ) | (16,091,812 | ) | ||||||||||||
|
| |||||||||||||||
Capital share transactions | Shares | Shares | ||||||||||||||
Proceeds from shares sold |
| |||||||||||||||
Class A | 441,187 | 4,609,759 | 1,147,071 | 13,224,286 | ||||||||||||
Class C | 18,948 | 217,660 | 86,880 | 957,728 | ||||||||||||
Class R | 9,052 | 93,509 | 25,185 | 292,558 | ||||||||||||
Class R6 | 50,929 | 509,198 | 21,094 | 236,894 | ||||||||||||
Administrator Class | 2,257 | 25,149 | 120,528 | 1,364,756 | ||||||||||||
Institutional Class | 1,376,623 | 14,425,401 | 3,668,728 | 41,620,881 | ||||||||||||
|
| |||||||||||||||
| 19,880,676 | 57,697,103 | |||||||||||||||
|
| |||||||||||||||
Reinvestment of distributions |
| |||||||||||||||
Class A | 55,305 | 622,252 | 321,829 | 3,507,776 | ||||||||||||
Class C | 3,189 | 38,076 | 39,404 | 419,685 | ||||||||||||
Class R | 128 | 1,574 | 1,096 | 12,180 | ||||||||||||
Class R6 | 20,969 | 225,470 | 83,623 | 906,082 | ||||||||||||
Administrator Class | 705 | 7,903 | 16,761 | 179,650 | ||||||||||||
Institutional Class | 118,415 | 1,298,339 | 718,102 | 7,759,106 | ||||||||||||
|
| |||||||||||||||
| 2,193,614 | 12,784,479 | |||||||||||||||
|
| |||||||||||||||
Payment for shares redeemed |
| |||||||||||||||
Class A | (1,601,924 | ) | (16,539,389 | ) | (2,065,116 | ) | (23,490,494 | ) | ||||||||
Class C | (408,619 | ) | (4,212,540 | ) | (1,162,599 | ) | (13,124,506 | ) | ||||||||
Class R | (49,772 | ) | (546,039 | ) | (74,982 | ) | (874,682 | ) | ||||||||
Class R6 | (207,377 | ) | (2,240,668 | ) | (2,255,062 | ) | (24,783,491 | ) | ||||||||
Administrator Class | (51,651 | ) | (501,027 | ) | (474,737 | ) | (5,303,913 | ) | ||||||||
Institutional Class | (6,523,658 | ) | (66,426,216 | ) | (11,722,793 | ) | (131,578,072 | ) | ||||||||
|
| |||||||||||||||
| (90,465,879 | ) | (199,155,158 | ) | |||||||||||||
|
| |||||||||||||||
Net decrease in net assets resulting from capital share transactions | (68,391,589 | ) | (128,673,576 | ) | ||||||||||||
|
| |||||||||||||||
Total decrease in net assets | (93,505,801 | ) | (146,325,717 | ) | ||||||||||||
|
| |||||||||||||||
Net assets | ||||||||||||||||
Beginning of period | 281,048,334 | 427,374,051 | ||||||||||||||
|
| |||||||||||||||
End of period | $ | 187,542,533 | $ | 281,048,334 | ||||||||||||
|
| |||||||||||||||
The accompanying notes are an integral part of these financial statements.
16 | Wells Fargo International Equity Fund
Table of Contents
(For a share outstanding throughout each period)
| Year ended October 31 | ||||||||||||||||||||
| CLASS A | 2020 | 2019 | 2018 | 2017 | 2016 | |||||||||||||||
Net asset value, beginning of period | $11.38 | $11.81 | $13.43 | $11.07 | $11.53 | |||||||||||||||
Net investment income | 0.12 | 0.24 | 1 | 0.27 | 0.22 | 0.22 | ||||||||||||||
Net realized and unrealized gains (losses) on investments | (0.97 | ) | (0.16 | ) | (1.40 | ) | 2.47 | (0.54 | ) | |||||||||||
|
|
|
|
|
|
|
|
|
| |||||||||||
Total from investment operations | (0.85 | ) | 0.08 | (1.13 | ) | 2.69 | (0.32 | ) | ||||||||||||
Distributions to shareholders from | ||||||||||||||||||||
Net investment income | (0.10 | ) | (0.51 | ) | (0.49 | ) | (0.33 | ) | (0.14 | ) | ||||||||||
Net asset value, end of period | $10.43 | $11.38 | $11.81 | $13.43 | $11.07 | |||||||||||||||
Total return2 | (7.54 | )% | 0.93 | % | (8.81 | )% | 24.91 | % | (2.76 | )% | ||||||||||
Ratios to average net assets (annualized) | ||||||||||||||||||||
Gross expenses | 1.48 | % | 1.45 | % | 1.39 | % | 1.47 | % | 1.47 | % | ||||||||||
Net expenses | 1.13 | % | 1.14 | % | 1.14 | % | 1.14 | % | 1.12 | % | ||||||||||
Net investment income | 1.12 | % | 2.13 | % | 1.97 | % | 1.82 | % | 2.04 | % | ||||||||||
Supplemental data | ||||||||||||||||||||
Portfolio turnover rate | 73 | % | 49 | % | 62 | % | 59 | % | 65 | % | ||||||||||
Net assets, end of period (000s omitted) | $62,800 | $81,110 | $91,206 | $109,655 | $122,248 | |||||||||||||||
| 1 | Calculated based upon average shares outstanding |
| 2 | Total return calculations do not include any sales charges. |
The accompanying notes are an integral part of these financial statements.
Wells Fargo International Equity Fund | 17
Table of Contents
Financial highlights
(For a share outstanding throughout each period)
| Year ended October 31 | ||||||||||||||||||||
| CLASS C | 2020 | 2019 | 2018 | 2017 | 2016 | |||||||||||||||
Net asset value, beginning of period | $11.28 | $11.57 | $13.13 | $10.82 | $11.30 | |||||||||||||||
Net investment income | 0.03 | 1 | 0.12 | 1 | 0.15 | 0.14 | 0.14 | |||||||||||||
Net realized and unrealized gains (losses) on investments | (0.95 | ) | (0.12 | ) | (1.35 | ) | 2.40 | (0.53 | ) | |||||||||||
|
|
|
|
|
|
|
|
|
| |||||||||||
Total from investment operations | (0.92 | ) | (0.00 | ) | (1.20 | ) | 2.54 | (0.39 | ) | |||||||||||
Distributions to shareholders from | ||||||||||||||||||||
Net investment income | (0.05 | ) | (0.29 | ) | (0.36 | ) | (0.23 | ) | (0.09 | ) | ||||||||||
Net asset value, end of period | $10.31 | $11.28 | $11.57 | $13.13 | $10.82 | |||||||||||||||
Total return2 | (8.22 | )% | 0.16 | % | (9.47 | )% | 23.91 | % | (3.43 | )% | ||||||||||
Ratios to average net assets (annualized) | ||||||||||||||||||||
Gross expenses | 2.22 | % | 2.19 | % | 2.14 | % | 2.22 | % | 2.22 | % | ||||||||||
Net expenses | 1.89 | % | 1.89 | % | 1.89 | % | 1.89 | % | 1.87 | % | ||||||||||
Net investment income | 0.28 | % | 1.07 | % | 1.22 | % | 1.26 | % | 1.33 | % | ||||||||||
Supplemental data | ||||||||||||||||||||
Portfolio turnover rate | 73 | % | 49 | % | 62 | % | 59 | % | 65 | % | ||||||||||
Net assets, end of period (000s omitted) | $5,794 | $10,700 | $22,963 | $28,919 | $27,508 | |||||||||||||||
| 1 | Calculated based upon average shares outstanding |
| 2 | Total return calculations do not include any sales charges. |
The accompanying notes are an integral part of these financial statements.
18 | Wells Fargo International Equity Fund
Table of Contents
Financial highlights
(For a share outstanding throughout each period)
| Year ended October 31 | ||||||||||||||||||||
| CLASS R | 2020 | 2019 | 2018 | 2017 | 2016 | |||||||||||||||
Net asset value, beginning of period | $11.61 | $11.98 | $13.58 | $11.20 | $11.66 | |||||||||||||||
Net investment income | 0.07 | 1 | 0.22 | 1 | 0.23 | 1 | 0.20 | 1 | 0.19 | 1 | ||||||||||
Net realized and unrealized gains (losses) on investments | (0.97 | ) | (0.15 | ) | (1.41 | ) | 2.48 | (0.53 | ) | |||||||||||
|
|
|
|
|
|
|
|
|
| |||||||||||
Total from investment operations | (0.90 | ) | 0.07 | (1.18 | ) | 2.68 | (0.34 | ) | ||||||||||||
Distributions to shareholders from | ||||||||||||||||||||
Net investment income | (0.06 | ) | (0.44 | ) | (0.42 | ) | (0.30 | ) | (0.12 | ) | ||||||||||
Net asset value, end of period | $10.65 | $11.61 | $11.98 | $13.58 | $11.20 | |||||||||||||||
Total return | (7.84 | )% | 0.79 | % | (9.03 | )% | 24.47 | % | (2.94 | )% | ||||||||||
Ratios to average net assets (annualized) | ||||||||||||||||||||
Gross expenses | 1.67 | % | 1.64 | % | 1.64 | % | 1.72 | % | 1.72 | % | ||||||||||
Net expenses | 1.39 | % | 1.37 | % | 1.39 | % | 1.39 | % | 1.37 | % | ||||||||||
Net investment income | 0.64 | % | 1.88 | % | 1.72 | % | 1.66 | % | 1.77 | % | ||||||||||
Supplemental data | ||||||||||||||||||||
Portfolio turnover rate | 73 | % | 49 | % | 62 | % | 59 | % | 65 | % | ||||||||||
Net assets, end of period (000s omitted) | $297 | $794 | $1,404 | $1,996 | $2,029 | |||||||||||||||
| 1 | Calculated based upon average shares outstanding |
The accompanying notes are an integral part of these financial statements.
Wells Fargo International Equity Fund | 19
Table of Contents
Financial highlights
(For a share outstanding throughout each period)
| Year ended October 31 | ||||||||||||||||||||
| CLASS R6 | 2020 | 2019 | 2018 | 2017 | 2016 | |||||||||||||||
Net asset value, beginning of period | $11.31 | $11.79 | $13.44 | $11.06 | $11.49 | |||||||||||||||
Net investment income | 0.16 | 0.35 | 0.31 | 0.45 | 1 | 0.24 | ||||||||||||||
Net realized and unrealized gains (losses) on investments | (0.96 | ) | (0.23 | ) | (1.40 | ) | 2.27 | (0.52 | ) | |||||||||||
|
|
|
|
|
|
|
|
|
| |||||||||||
Total from investment operations | (0.80 | ) | 0.12 | (1.09 | ) | 2.72 | (0.28 | ) | ||||||||||||
Distributions to shareholders from | ||||||||||||||||||||
Net investment income | (0.15 | ) | (0.60 | ) | (0.56 | ) | (0.34 | ) | (0.15 | ) | ||||||||||
Net asset value, end of period | $10.36 | $11.31 | $11.79 | $13.44 | $11.06 | |||||||||||||||
Total return | (7.15 | )% | 1.27 | % | (8.57 | )% | 25.30 | % | (2.46 | )% | ||||||||||
Ratios to average net assets (annualized) | ||||||||||||||||||||
Gross expenses | 1.05 | % | 1.01 | % | 0.96 | % | 1.03 | % | 1.04 | % | ||||||||||
Net expenses | 0.79 | % | 0.81 | % | 0.84 | % | 0.84 | % | 0.85 | % | ||||||||||
Net investment income | 1.51 | % | 2.23 | % | 2.23 | % | 3.55 | % | 2.31 | % | ||||||||||
Supplemental data | ||||||||||||||||||||
Portfolio turnover rate | 73 | % | 49 | % | 62 | % | 59 | % | 65 | % | ||||||||||
Net assets, end of period (000s omitted) | $32,011 | $36,505 | $63,414 | $74,405 | $26 | |||||||||||||||
| 1 | Calculated based upon average shares outstanding |
The accompanying notes are an integral part of these financial statements.
20 | Wells Fargo International Equity Fund
Table of Contents
Financial highlights
(For a share outstanding throughout each period)
| Year ended October 31 | ||||||||||||||||||||
| ADMINISTRATOR CLASS | 2020 | 2019 | 2018 | 2017 | 2016 | |||||||||||||||
Net asset value, beginning of period | $11.22 | $11.62 | $13.20 | $10.88 | $11.33 | |||||||||||||||
Net investment income | 0.10 | 1 | 0.23 | 1 | 0.20 | 1 | 0.21 | 1 | 0.22 | |||||||||||
Net realized and unrealized gains (losses) on investments | (0.94 | ) | (0.14 | ) | (1.31 | ) | 2.43 | (0.53 | ) | |||||||||||
|
|
|
|
|
|
|
|
|
| |||||||||||
Total from investment operations | (0.84 | ) | 0.09 | (1.11 | ) | 2.64 | (0.31 | ) | ||||||||||||
Distributions to shareholders from | ||||||||||||||||||||
Net investment income | (0.10 | ) | (0.49 | ) | (0.47 | ) | (0.32 | ) | (0.14 | ) | ||||||||||
Net asset value, end of period | $10.28 | $11.22 | $11.62 | $13.20 | $10.88 | |||||||||||||||
Total return | (7.54 | )% | 0.98 | % | (8.79 | )% | 24.84 | % | (2.71 | )% | ||||||||||
Ratios to average net assets (annualized) | ||||||||||||||||||||
Gross expenses | 1.39 | % | 1.36 | % | 1.31 | % | 1.39 | % | 1.38 | % | ||||||||||
Net expenses | 1.14 | % | 1.14 | % | 1.14 | % | 1.14 | % | 1.12 | % | ||||||||||
Net investment income | 0.98 | % | 2.00 | % | 1.53 | % | 1.79 | % | 1.93 | % | ||||||||||
Supplemental data | ||||||||||||||||||||
Portfolio turnover rate | 73 | % | 49 | % | 62 | % | 59 | % | 65 | % | ||||||||||
Net assets, end of period (000s omitted) | $589 | $1,189 | $5,152 | $18,174 | $36,032 | |||||||||||||||
| 1 | Calculated based upon average shares outstanding |
The accompanying notes are an integral part of these financial statements.
Wells Fargo International Equity Fund | 21
Table of Contents
Financial highlights
(For a share outstanding throughout each period)
| Year ended October 31 | ||||||||||||||||||||
| INSTITUTIONAL CLASS | 2020 | 2019 | 2018 | 2017 | 2016 | |||||||||||||||
Net asset value, beginning of period | $11.29 | $11.76 | $13.40 | $11.05 | $11.49 | |||||||||||||||
Net investment income | 0.14 | 1 | 0.33 | 0.30 | 1 | 0.28 | 1 | 0.23 | ||||||||||||
Net realized and unrealized gains (losses) on investments | (0.96 | ) | (0.22 | ) | (1.39 | ) | 2.43 | (0.52 | ) | |||||||||||
|
|
|
|
|
|
|
|
|
| |||||||||||
Total from investment operations | (0.82 | ) | 0.11 | (1.09 | ) | 2.71 | (0.29 | ) | ||||||||||||
Distributions to shareholders from | ||||||||||||||||||||
Net investment income | (0.13 | ) | (0.58 | ) | (0.55 | ) | (0.36 | ) | (0.15 | ) | ||||||||||
Net asset value, end of period | $10.34 | $11.29 | $11.76 | $13.40 | $11.05 | |||||||||||||||
Total return | (7.28 | )% | 1.19 | % | (8.56 | )% | 25.21 | % | (2.48 | )% | ||||||||||
Ratios to average net assets (annualized) | ||||||||||||||||||||
Gross expenses | 1.15 | % | 1.11 | % | 1.06 | % | 1.14 | % | 1.14 | % | ||||||||||
Net expenses | 0.84 | % | 0.86 | % | 0.89 | % | 0.89 | % | 0.87 | % | ||||||||||
Net investment income | 1.33 | % | 2.27 | % | 2.31 | % | 2.28 | % | 2.27 | % | ||||||||||
Supplemental data | ||||||||||||||||||||
Portfolio turnover rate | 73 | % | 49 | % | 62 | % | 59 | % | 65 | % | ||||||||||
Net assets, end of period (000s omitted) | $86,052 | $150,749 | $243,235 | $236,946 | $182,639 | |||||||||||||||
| 1 | Calculated based upon average shares outstanding |
The accompanying notes are an integral part of these financial statements.
22 | Wells Fargo International Equity Fund
Table of Contents
1. ORGANIZATION
Wells Fargo Funds Trust (the “Trust”), a Delaware statutory trust organized on March 10, 1999, is an open-end management investment company registered under the Investment Company Act of 1940, as amended (the “1940 Act”). As an investment company, the Trust follows the accounting and reporting guidance in Financial Accounting Standards Board (“FASB”) Accounting Standards Codification Topic 946, Financial Services – Investment Companies. These financial statements report on the Wells Fargo International Equity Fund (the “Fund”) which is a diversified series of the Trust.
2. SIGNIFICANT ACCOUNTING POLICIES
The following significant accounting policies, which are consistently followed in the preparation of the financial statements of the Fund, are in conformity with U.S. generally accepted accounting principles which require management to make estimates and assumptions that affect the reported amounts of assets and liabilities, disclosure of contingent assets and liabilities at the date of the financial statements, and the reported amounts of revenues and expenses during the reporting period. Actual results could differ from those estimates.
Securities valuation
All investments are valued each business day as of the close of regular trading on the New York Stock Exchange (generally 4 p.m. Eastern Time), although the Fund may deviate from this calculation time under unusual or unexpected circumstances.
Equity securities that are listed on a foreign or domestic exchange or market are valued at the official closing price or, if none, the last sales price. If no sale occurs on the principal exchange or market that day, a fair value price will be determined in accordance with the Fund’s Valuation Procedures.
Forward foreign currency contracts are recorded at the forward rate provided by an independent foreign currency pricing source at a time each business day specified by the Wells Fargo Asset Management Pricing Committee at Wells Fargo Funds Management, LLC (“Funds Management”).
The values of securities denominated in foreign currencies are translated into U.S. dollars at rates provided by an independent foreign currency pricing source at a time each business day specified by the Wells Fargo Asset Management Pricing Committee.
Many securities markets and exchanges outside the U.S. close prior to the close of the New York Stock Exchange and therefore may not fully reflect trading or events that occur after the close of the principal exchange in which the foreign securities are traded, but before the close of the New York Stock Exchange. If such trading or events are expected to materially affect the value of such securities, then fair value pricing procedures approved by the Board of Trustees of the Fund are applied. These procedures take into account multiple factors including movements in U.S. securities markets after foreign exchanges close. Foreign securities that are fair valued under these procedures are categorized as Level 2 and the application of these procedures may result in transfers between Level 1 and Level 2. Depending on market activity, such fair valuations may be frequent. Such fair value pricing may result in net asset values that are higher or lower than net asset values based on the last reported sales price or latest quoted bid price. On October 31, 2020, such fair value pricing was used in pricing certain foreign securities.
Investments in registered open-end investment companies are valued at net asset value. Interests in non-registered investment companies that are redeemable at net asset value are fair valued normally at net asset value.
Investments which are not valued using any of the methods discussed above are valued at their fair value, as determined in good faith by the Board of Trustees. The Board of Trustees has established a Valuation Committee comprised of the Trustees and has delegated to it the authority to take any actions regarding the valuation of portfolio securities that the Valuation Committee deems necessary or appropriate, including determining the fair value of portfolio securities, unless the determination has been delegated to the Wells Fargo Asset Management Pricing Committee. The Board of Trustees retains the authority to make or ratify any valuation decisions or approve any changes to the Valuation Procedures as it deems appropriate. On a quarterly basis, the Board of Trustees receives reports on any valuation actions taken by the Valuation Committee or the Wells Fargo Asset Management Pricing Committee which may include items for ratification.
Foreign currency translation
The accounting records of the Fund are maintained in U.S. dollars. The values of other assets and liabilities denominated in foreign currencies are translated into U.S. dollars at rates provided by an independent foreign currency pricing source at a time each business day specified by the Wells Fargo Asset Management Pricing Committee. Purchases and sales of securities, and income and expenses are converted at the rate of exchange on the respective dates of such transactions. Net realized foreign exchange gains or losses arise from sales of foreign currencies, currency gains or losses realized between the trade and settlement dates on securities transactions, and the difference between the amounts of dividends, interest and foreign withholding taxes recorded and the U.S. dollar equivalent of the amounts actually paid or received. Net unrealized foreign
Wells Fargo International Equity Fund | 23
Table of Contents
Notes to financial statements
exchange gains and losses arise from changes in the fair value of assets and liabilities other than investments in securities resulting from changes in exchange rates. The changes in net assets arising from changes in exchange rates of securities and the changes in net assets resulting from changes in market prices of securities are not separately presented. Such changes are included in net realized and unrealized gains or losses from investments.
Forward foreign currency contracts
A forward foreign currency contract is an agreement between two parties to purchase or sell a specific currency for an agreed-upon price at a future date. The Fund enters into forward foreign currency contracts to facilitate transactions in foreign-denominated securities and to attempt to minimize the risk to the Fund from adverse changes in the relationship between currencies. Forward foreign currency contracts are recorded at the forward rate and marked-to-market daily. When the contracts are closed, realized gains and losses arising from such transactions are recorded as realized gains or losses on forward foreign currency contracts. The Fund is subject to foreign currency risk and may be exposed to risks if the counterparties to the contracts are unable to meet the terms of their contracts or if the value of the foreign currency changes unfavorably. The Fund’s maximum risk of loss from counterparty credit risk is the unrealized gains on the contracts. This risk may be mitigated if there is a master netting arrangement between the Fund and the counterparty.
Securities lending
The Fund may lend its securities from time to time in order to earn additional income in the form of fees or interest on securities received as collateral or the investment of any cash received as collateral. When securities are on loan, the Fund receives interest or dividends on those securities. Cash collateral received in connection with its securities lending transactions is invested in Securities Lending Cash Investments, LLC (the “Securities Lending Fund”). Investments in Securities Lending Fund are valued at the evaluated bid price provided by an independent pricing service. Income earned from investment in the Securities Lending Fund (net of fees and rebates), if any, is included in income from affiliated securities on the Statement of Operations.
In a securities lending transaction, the net asset value of the Fund is affected by an increase or decrease in the value of the securities loaned and by an increase or decrease in the value of the instrument in which collateral is invested. The amount of securities lending activity undertaken by the Fund fluctuates from time to time. The Fund has the right under the lending agreement to recover the securities from the borrower on demand. In the event of default or bankruptcy by the borrower, the Fund may be prevented from recovering the loaned securities or gaining access to the collateral or may experience delays or costs in doing so. In such an event, the terms of the agreement allow the unaffiliated securities lending agent to use the collateral to purchase replacement securities on behalf of the Fund or pay the Fund the market value of the loaned securities. The Fund bears the risk of loss with respect to depreciation of its investment of the cash collateral.
Security transactions and income recognition
Securities transactions are recorded on a trade date basis. Realized gains or losses are recorded on the basis of identified cost.
Dividend income is recognized on the ex-dividend date, except for certain dividends from foreign securities, which are recorded as soon as the custodian verifies the ex-dividend date. Dividend income from foreign securities is recorded net of foreign taxes withheld where recovery of such taxes is not assured.
Distributions to shareholders
Distributions to shareholders are recorded on the ex-dividend date and paid from net investment income quarterly and any net realized gains are paid at least annually. Such distributions are determined in accordance with income tax regulations and may differ from U.S. generally accepted accounting principles. Dividend sources are estimated at the time of declaration. The tax character of distributions is determined as of the Fund’s fiscal year end. Therefore, a portion of the Fund’s distributions made prior to the Fund’s fiscal year end may be categorized as a tax return of capital at year end.
Federal and other taxes
The Fund intends to continue to qualify as a regulated investment company by distributing substantially all of its investment company taxable income and any net realized capital gains (after reduction for capital loss carryforwards) sufficient to relieve it from all, or substantially all, federal income taxes. Accordingly, no provision for federal income taxes was required.
The Fund’s income and federal excise tax returns and all financial records supporting those returns for the prior three fiscal years are subject to examination by the federal and Delaware revenue authorities. Management has analyzed the Fund’s tax positions taken on federal, state, and foreign tax returns for all open tax years and does not believe that there are any uncertain tax positions that require recognition of a tax liability.
24 | Wells Fargo International Equity Fund
Table of Contents
Notes to financial statements
As of October 31, 2020, the aggregate cost of all investments for federal income tax purposes was $166,557,043 and the unrealized gains (losses) consisted of:
Gross unrealized gains | $ | 27,682,482 | ||
Gross unrealized losses | (12,751,760 | ) | ||
Net unrealized gains | $ | 14,930,722 | ||
As of October 31, 2020, the Fund had capital loss carryforwards which consist of $16,636,686 in short-term capital losses and $21,103,800 in long-term capital losses.
Class allocations
The separate classes of shares offered by the Fund differ principally in applicable sales charges, distribution, shareholder servicing, and administration fees. Class specific expenses are charged directly to that share class. Investment income, common fund-level expenses, and realized and unrealized gains (losses) on investments are allocated daily to each class of shares based on the relative proportion of net assets of each class.
3. FAIR VALUATION MEASUREMENTS
Fair value measurements of investments are determined within a framework that has established a fair value hierarchy based upon the various data inputs utilized in determining the value of the Fund’s investments. The three-level hierarchy gives the highest priority to unadjusted quoted prices in active markets for identical assets or liabilities (Level 1) and the lowest priority to unobservable inputs (Level 3). The Fund’s investments are classified within the fair value hierarchy based on the lowest level of input that is significant to the fair value measurement. The inputs are summarized into three broad levels as follows:
| ∎ | Level 1 – quoted prices in active markets for identical securities |
| ∎ | Level 2 – other significant observable inputs (including quoted prices for similar securities, interest rates, prepayment speeds, credit risk, etc.) |
| ∎ | Level 3 – significant unobservable inputs (including the Fund’s own assumptions in determining the fair value of investments) |
The inputs or methodologies used for valuing investments in securities are not necessarily an indication of the risk associated with investing in those securities.
Wells Fargo International Equity Fund | 25
Table of Contents
Notes to financial statements
The following is a summary of the inputs used in valuing the Fund’s assets and liabilities as of October 31, 2020:
| Quoted prices (Level 1) | Other significant observable inputs (Level 2) | Significant (Level 3) | Total | |||||||||||||
Assets | ||||||||||||||||
Investments in: | ||||||||||||||||
Common stocks | ||||||||||||||||
Australia | $ | 0 | $ | 3,931,570 | $ | 0 | $ | 3,931,570 | ||||||||
Canada | 5,639,579 | 0 | 0 | 5,639,579 | ||||||||||||
China | 1,343,315 | 18,911,086 | 0 | 20,254,401 | ||||||||||||
Denmark | 0 | 3,482,800 | 0 | 3,482,800 | ||||||||||||
France | 0 | 9,183,943 | 0 | 9,183,943 | ||||||||||||
Germany | 177,134 | 8,704,842 | 0 | 8,881,976 | ||||||||||||
Hong Kong | 0 | 7,111,014 | 0 | 7,111,014 | ||||||||||||
India | 0 | 4,805,706 | 0 | 4,805,706 | ||||||||||||
Ireland | 0 | 1,784,535 | 0 | 1,784,535 | ||||||||||||
Israel | 4,055,908 | 0 | 0 | 4,055,908 | ||||||||||||
Italy | 0 | 3,617,154 | 0 | 3,617,154 | ||||||||||||
Japan | 0 | 22,885,517 | 0 | 22,885,517 | ||||||||||||
Luxembourg | 0 | 3,172,767 | 0 | 3,172,767 | ||||||||||||
Mexico | 0 | 1,905,116 | 0 | 1,905,116 | ||||||||||||
Netherlands | 0 | 12,353,863 | 0 | 12,353,863 | ||||||||||||
Norway | 0 | 3,472,486 | 0 | 3,472,486 | ||||||||||||
Russia | 2,675,519 | 0 | 0 | 2,675,519 | ||||||||||||
South Korea | 0 | 17,535,793 | 0 | 17,535,793 | ||||||||||||
Switzerland | 0 | 9,921,862 | 0 | 9,921,862 | ||||||||||||
Thailand | 1,410,845 | 0 | 0 | 1,410,845 | ||||||||||||
United Kingdom | 7,472,723 | 13,140,295 | 0 | 20,613,018 | ||||||||||||
United States | 10,428,983 | 0 | 0 | 10,428,983 | ||||||||||||
Short-term investments | ||||||||||||||||
Investment companies | 2,330,238 | 0 | 0 | 2,330,238 | ||||||||||||
| 35,534,244 | 145,920,349 | 0 | 181,454,593 | |||||||||||||
Forward foreign currency contracts | 0 | 33,172 | 0 | 33,172 | ||||||||||||
Total assets | $ | 35,534,244 | $ | 145,953,521 | $ | 0 | $ | 181,487,765 | ||||||||
Additional sector, industry or geographic detail is included in the Portfolio of Investments.
Forward foreign currency contracts are reported at their cumulative unrealized gains (losses) at measurement date as reported in the table following the Portfolio of Investments. All other assets and liabilities are reported at their market value at measurement date.
For the year ended October 31, 2020, the Fund did not have any transfers into/out of Level 3.
4. TRANSACTIONS WITH AFFILIATES
Management fee
Funds Management, an indirect wholly owned subsidiary of Wells Fargo & Company (“Wells Fargo”), is the manager of the Fund and provides advisory and fund-level administrative services under an investment management agreement. Under the investment management agreement, Funds Management is responsible for, among other services, implementing the investment objectives and strategies of the Fund, supervising the subadviser and providing fund-level administrative services in
26 | Wells Fargo International Equity Fund
Table of Contents
Notes to financial statements
connection with the Fund’s operations. As compensation for its services under the investment management agreement, Funds Management is entitled to receive a management fee at the following annual rate based on the Fund’s average daily net assets:
| Average daily net assets | Management fee | |||
First $500 million | 0.850 | % | ||
Next $500 million | 0.800 | |||
Next $1 billion | 0.750 | |||
Next $2 billion | 0.725 | |||
Next $1 billion | 0.700 | |||
Next $5 billion | 0.690 | |||
Over $10 billion | 0.680 | |||
For the year ended October 31, 2020, the management fee was equivalent to an annual rate of 0.85% of the Fund’s average daily net assets.
Funds Management has retained the services of a subadviser to provide daily portfolio management to the Fund. The fee for subadvisory services is borne by Funds Management. Wells Capital Management Incorporated (“WellsCap”), an affiliate of Funds Management and an indirect wholly owned subsidiary of Wells Fargo, is the subadviser to the Fund and is entitled to receive a fee from Funds Management at an annual rate starting at 0.45% and declining to 0.40% as the average daily net assets of the Fund increase.
Administration fees
Under a class-level administration agreement, Funds Management provides class-level administrative services to the Fund, which includes paying fees and expenses for services provided by the transfer agent, sub-transfer agents, omnibus account servicers and record-keepers. As compensation for its services under the class-level administration agreement, Funds Management receives an annual fee which is calculated based on the average daily net assets of each class as follows:
| Class-level administration fee | ||||
Class A, Class C, Class R | 0.21 | % | ||
Class R6 | 0.03 | |||
Administrator Class, Institutional Class | 0.13 | |||
Waivers and/or expense reimbursements
Funds Management has contractually waived and/or reimbursed management and administration fees to the extent necessary to maintain certain net operating expense ratios for the Fund. When each class of the Fund has exceeded its expense cap, Funds Management has waived fees and/or reimbursed expenses from fund-level expenses on a proportionate basis and then from class specific expenses. When only certain classes exceed their expense caps, waivers and/or reimbursements are applied against class specific expenses before fund-level expenses. Funds Management has committed through February 28, 2021 to waive fees and/or reimburse expenses to the extent necessary to cap the Fund’s expenses at 1.14% for Class A shares, 1.89% for Class C shares, 1.39% for Class R shares, 0.79% for Class R6 shares, 1.14% for Administrator Class shares, and 0.84% for Institutional Class shares. Prior to or after the commitment expiration date, the cap may be increased or the commitment to maintain the cap may be terminated only with the approval of the Board of Trustees.
Distribution fees
The Trust has adopted a distribution plan for Class C and Class R shares of the Fund pursuant to Rule 12b-1 under the 1940 Act. Distribution fees are charged to Class C and Class R shares and paid to Wells Fargo Funds Distributor, LLC (“Funds Distributor”), the principal underwriter, at an annual rate of 0.75% of the average daily net assets of Class C shares and 0.25% of the average daily net assets of Class R shares.
In addition, Funds Distributor is entitled to receive the front-end sales charge from the purchase of Class A shares and a contingent deferred sales charge on the redemption of certain Class A shares. Funds Distributor is also entitled to receive the contingent deferred sales charges from redemptions of Class C shares. For the year ended October 31, 2020, Funds Distributor received $1,382 from the sale of Class A shares. No contingent deferred sales charges were incurred by Class A and Class C shares for the year ended October 31, 2020.
Wells Fargo International Equity Fund | 27
Table of Contents
Notes to financial statements
Shareholder servicing fees
The Trust has entered into contracts with one or more shareholder servicing agents, whereby Class A, Class C, Class R, and Administrator Class of the Fund are charged a fee at an annual rate of 0.25% of the average daily net assets of each respective class. A portion of these total shareholder servicing fees were paid to affiliates of Wells Fargo.
Interfund transactions
The Fund may purchase or sell portfolio investment securities to certain other Wells Fargo affiliates pursuant to Rule 17a-7 under the 1940 Act and under procedures adopted by the Board of Trustees. The procedures have been designed to ensure that these interfund transactions, which do not incur broker commissions, are effected at current market prices.
5. INVESTMENT PORTFOLIO TRANSACTIONS
Purchases and sales of investments, excluding U.S. government obligations (if any) and short-term securities, for the year ended October 31, 2020 were $160,047,365 and $231,054,358, respectively.
6. SECURITIES LENDING TRANSACTIONS
The Fund lends its securities through an unaffiliated securities lending agent and receives collateral in the form of cash or securities with a value at least equal to the value of the securities on loan. The value of the loaned securities is determined at the close of each business day and any increases or decreases in the required collateral are exchanged between the Fund and the counterparty on the next business day. Cash collateral received is invested in the Securities Lending Fund which seeks to provide a positive return compared to the daily Federal Funds Open Rate by investing in high-quality, U.S. dollar-denominated short-term money market instruments and is exempt from registration under Section 3(c)(7) of the 1940 Act. Securities Lending Fund is managed by Funds Management and is subadvised by WellsCap. Funds Management receives an advisory fee starting at 0.05% and declining to 0.01% as the average daily net assets of the Securities Lending Fund increase. All of the fees received by Funds Management are paid to WellsCap for its services as subadviser.
In the event of counterparty default or the failure of a borrower to return a loaned security, the Fund has the right to use the collateral to offset any losses incurred. As of October 31, 2020, the Fund did not have any securities on loan.
7. DERIVATIVE TRANSACTIONS
During the year ended October 31, 2020, the Fund entered into forward foreign currency contracts for economic hedging purposes. The Fund had average contract amounts of $5,963,953 and $16,099,051 in forward foreign currency contracts to buy and forward foreign currency contracts to sell, respectively, during the year ended October 31, 2020.
The fair value, realized gains or losses and change in unrealized gains or losses, if any, on derivative instruments are reflected in the corresponding financial statement captions.
For certain types of derivative transactions, the Fund has entered into International Swaps and Derivatives Association, Inc. master agreements (“ISDA Master Agreements”) or similar agreements with approved counterparties. The ISDA Master Agreements or similar agreements may have requirements to deliver/deposit securities or cash to/with an exchange or broker-dealer as collateral and allows the Fund to offset, with each counterparty, certain derivative financial instrument’s assets and/or liabilities with collateral held or pledged. Collateral requirements differ by type of derivative. Collateral or margin requirements are set by the broker or exchange clearinghouse for exchange traded derivatives while collateral terms are contract specific for over-the-counter traded derivatives. Cash collateral that has been pledged to cover obligations of the Fund under ISDA Master Agreements or similar agreements, if any, are reported separately in the Statement of Assets and Liabilities. Securities pledged as collateral, if any, are noted in the Portfolio of Investments. With respect to balance sheet offsetting, absent an event of default by the counterparty or a termination of the agreement, the reported amounts of financial assets and financial liabilities in the Statement of Assets and Liabilities are not offset across transactions between the Fund and the applicable counterparty. A reconciliation of the gross amounts on the Statement of Assets and Liabilities to the net amounts by counterparty, including any collateral exposure, for OTC derivatives is as follows:
| Counterparty | Gross amounts of assets in the Statement of Assets and Liabilities | Amounts subject to netting agreements | Collateral received | Net amount of assets | ||||||||||||
Barclay Bank plc | $ | 33,172 | $ | 0 | $ | 0 | $ | 33,172 | ||||||||
28 | Wells Fargo International Equity Fund
Table of Contents
Notes to financial statements
8. BANK BORROWINGS
The Trust (excluding the money market funds), Wells Fargo Master Trust and Wells Fargo Variable Trust are parties to a $350,000,000 revolving credit agreement whereby the Fund is permitted to use bank borrowings for temporary or emergency purposes, such as to fund shareholder redemption requests. Interest under the credit agreement is charged to the Fund based on a borrowing rate equal to the higher of the Federal Funds rate in effect on that day plus 1.25% or the overnight LIBOR rate in effect on that day plus 1.25%. In addition, an annual commitment fee equal to 0.25% of the unused balance is allocated to each participating fund.
For the year ended October 31, 2020, there were no borrowings by the Fund under the agreement.
9. DISTRIBUTIONS TO SHAREHOLDERS
The tax character of distributions paid was $2,663,131 and $16,091,812 of ordinary income for the years ended October 31, 2020 and October 31, 2019, respectively.
As of October 31, 2020, the components of distributable earnings on a tax basis were as follows:
| Undistributed ordinary income | Unrealized gains | Capital loss carryforward | ||
| $851,988 | $14,941,222 | $(37,740,486) | ||
10. CONCENTRATION RISK
Concentration risks may result from significant investments in one or more country or geographic region. As of the end of the period, the Fund concentrated its portfolio in investments in Europe and Asia/Pacific ex-Japan. A fund that invests a substantial portion of its assets in any country or geographic region will be more vulnerable than a fund that invests its assets more broadly to the economic, financial, political or other developments affecting that country or region. Such developments may have a significant impact on the Fund’s investment performance causing such performance to be more volatile than the investment performance of a more geographically diversified fund.
11. INDEMNIFICATION
Under the Fund’s organizational documents, the officers and Trustees have been granted certain indemnification rights against certain liabilities that may arise out of performance of their duties to the Fund. The Fund has entered into a separate agreement with each Trustee that converts indemnification rights currently existing under the Fund’s organizational documents into contractual rights that cannot be changed in the future without the consent of the Trustee. Additionally, in the normal course of business, the Fund may enter into contracts with service providers that contain a variety of indemnification clauses. The Fund’s maximum exposure under these arrangements is dependent on future claims that may be made against the Fund and, therefore, cannot be estimated.
12. NEW ACCOUNTING PRONOUNCEMENT
In August 2018, FASB issued Accounting Standards Update (“ASU”) No. 2018-13, Fair Value Measurement (Topic 820) Disclosure Framework—Changes to the Disclosure Requirements for Fair Value Measurement. ASU 2018-13 updates the disclosure requirements on fair value measurements in Topic 820, Fair Value Measurements. The amendments are effective for fiscal years, and interim periods within those fiscal years, beginning after December 15, 2019. Management has adopted this guidance which did not have a material impact on the financial statements.
13. CORONAVIRUS (COVID-19) PANDEMIC
On March 11, 2020, the World Health Organization announced that it had made the assessment that coronavirus disease 2019 (“COVID-19”) is a pandemic. The impacts of COVID-19 are adversely affecting the entire global economy, individual companies and investment products, and the market in general. There is significant uncertainty around the extent and duration of business disruptions related to COVID-19 and the impacts may be short term or may last for an extended period of time. The risk of further spreading of COVID-19 has led to significant uncertainty and volatility in the financial markets.
Wells Fargo International Equity Fund | 29
Table of Contents
Report of independent registered public accounting firm
To the Shareholders of the Fund and Board of Trustees
Wells Fargo Funds Trust:
Opinion on the Financial Statements
We have audited the accompanying statement of assets and liabilities of Wells Fargo International Equity Fund (the Fund), one of the funds constituting Wells Fargo Funds Trust, including the portfolio of investments, as of October 31, 2020, the related statement of operations for the year then ended, the statements of changes in net assets for each of the years in the two-year period then ended, and the related notes (collectively, the financial statements) and the financial highlights for each of the years in the five-year period then ended. In our opinion, the financial statements and financial highlights present fairly, in all material respects, the financial position of the Fund as of October 31, 2020, the results of its operations for the year then ended, the changes in its net assets for each of the years in the two-year period then ended, and the financial highlights for each of the years in the five-year period then ended, in conformity with U.S. generally accepted accounting principles.
Basis for Opinion
These financial statements and financial highlights are the responsibility of the Fund’s management. Our responsibility is to express an opinion on these financial statements and financial highlights based on our audits. We are a public accounting firm registered with the Public Company Accounting Oversight Board (United States) (PCAOB) and are required to be independent with respect to the Fund in accordance with the U.S. federal securities laws and the applicable rules and regulations of the Securities and Exchange Commission and the PCAOB.
We conducted our audits in accordance with the standards of the PCAOB. Those standards require that we plan and perform the audit to obtain reasonable assurance about whether the financial statements and financial highlights are free of material misstatement, whether due to error or fraud. Our audits included performing procedures to assess the risks of material misstatement of the financial statements and financial highlights, whether due to error or fraud, and performing procedures that respond to those risks. Such procedures included examining, on a test basis, evidence regarding the amounts and disclosures in the financial statements and financial highlights. Such procedures also included confirmation of securities owned as of October 31, 2020, by correspondence with the custodian, transfer agent and brokers, or by other appropriate auditing procedures. Our audits also included evaluating the accounting principles used and significant estimates made by management, as well as evaluating the overall presentation of the financial statements and financial highlights. We believe that our audits provide a reasonable basis for our opinion.

We have not been able to determine the specific year that we began serving as the auditor of one or more Wells Fargo Funds investment companies; however we are aware that we have served as the auditor of one or more Wells Fargo Funds investment companies since at least 1955.
Boston, Massachusetts
December 22, 2020
30 | Wells Fargo International Equity Fund
Table of Contents
TAX INFORMATION
For corporate shareholders, pursuant to Section 854 of the Internal Revenue Code, 2.33% of ordinary income dividends qualify for the corporate dividends-received deduction for the fiscal year ended October 31, 2020.
Pursuant to Section 854 of the Internal Revenue Code, $2,663,131 of income dividends paid during the fiscal year ended October 31, 2020 has been designated as qualified dividend income (QDI).
For the fiscal year ended October 31, 2020, $34,910 has been designated as interest-related dividends for nonresident alien shareholders pursuant to Section 871 of the Internal Revenue Code.
Pursuant to Section 853 of the Internal Revenue Code, the Fund expects to designate amounts as foreign taxes paid for the fiscal year ended October 31, 2020. Additional details will be available in the semiannual report.
PROXY VOTING INFORMATION
A description of the policies and procedures used to determine how to vote proxies relating to portfolio securities is available, upon request, by calling 1-800-222-8222, visiting our website at wfam.com, or visiting the SEC website at sec.gov. Information regarding how the proxies related to portfolio securities were voted during the most recent 12-month period ended June 30 is available on the website at wfam.com or by visiting the SEC website at sec.gov.
QUARTERLY PORTFOLIO HOLDINGS INFORMATION
The Fund files its complete schedule of portfolio holdings with the SEC for the first and third quarters of each fiscal year as an exhibit to its reports on Form N-PORT. Shareholders may view the filed Form N-PORT by visiting the SEC website at sec.gov.
Wells Fargo International Equity Fund | 31
Table of Contents
Other information (unaudited)
BOARD OF TRUSTEES AND OFFICERS
Each of the Trustees and Officers1 listed in the table below acts in identical capacities for each fund in the Wells Fargo family of funds, which consists of 144 mutual funds comprising the Wells Fargo Funds Trust, Wells Fargo Variable Trust, Wells Fargo Master Trust and four closed-end funds (collectively the “Fund Complex”). This table should be read in conjunction with the Prospectus and the Statement of Additional Information2. The mailing address of each Trustee and Officer is 525 Market Street, 12th Floor, San Francisco, CA 94105. Each Trustee and Officer serves an indefinite term, however, each Trustee serves such term until reaching the mandatory retirement age established by the Trustees.
Independent Trustees
| Name and year of birth | Position held and length of service* | Principal occupations during past five years or longer | Current other public company or investment company directorships | |||
William R. Ebsworth (Born 1957) | Trustee, since 2015 | Retired. From 1984 to 2013, equities analyst, portfolio manager, research director and chief investment officer at Fidelity Management and Research Company in Boston, Tokyo, and Hong Kong, and retired in 2013 as Chief Investment Officer of Fidelity Strategic Advisers, Inc. where he led a team of investment professionals managing client assets. Prior thereto, Board member of Hong Kong Securities Clearing Co., Hong Kong Options Clearing Corp., the Thailand International Fund, Ltd., Fidelity Investments Life Insurance Company, and Empire Fidelity Investments Life Insurance Company. Audit Committee Chair and Investment Committee Chair of the Vincent Memorial Hospital Endowment (non-profit organization). Mr. Ebsworth is a CFA® charterholder. | N/A | |||
Jane A. Freeman (Born 1953) | Trustee, since 2015; Chair Liaison, since 2018 | Retired. From 2012 to 2014 and 1999 to 2008, Chief Financial Officer of Scientific Learning Corporation. From 2008 to 2012, Ms. Freeman provided consulting services related to strategic business projects. Prior to 1999, Portfolio Manager at Rockefeller & Co. and Scudder, Stevens & Clark. Board member of the Harding Loevner Funds from 1996 to 2014, serving as both Lead Independent Director and chair of the Audit Committee. Board member of the Russell Exchange Traded Funds Trust from 2011 to 2012 and the chair of the Audit Committee. Ms. Freeman is also an inactive Chartered Financial Analyst. | N/A | |||
Isaiah Harris, Jr. (Born 1952) | Trustee, since 2009; Audit Committee Chair, since 2019 | Retired. Chairman of the Board of CIGNA Corporation since 2009, and Director since 2005. From 2003 to 2011, Director of Deluxe Corporation. Prior thereto, President and CEO of BellSouth Advertising and Publishing Corp. from 2005 to 2007, President and CEO of BellSouth Enterprises from 2004 to 2005 and President of BellSouth Consumer Services from 2000 to 2003. Emeritus member of the Iowa State University Foundation Board of Governors. Emeritus Member of the Advisory Board of Iowa State University School of Business. Advisory Board Member, Palm Harbor Academy (private school). Mr. Harris is a certified public accountant (inactive status). | CIGNA Corporation | |||
Judith M. Johnson (Born 1949) | Trustee, since 2008 | Retired. Prior thereto, Chief Executive Officer and Chief Investment Officer of Minneapolis Employees Retirement Fund from 1996 to 2008. Ms. Johnson is an attorney, certified public accountant and a certified managerial accountant. | N/A | |||
David F. Larcker (Born 1950) | Trustee, since 2009 | James Irvin Miller Professor of Accounting at the Graduate School of Business (Emeritus), Stanford University, Director of the Corporate Governance Research Initiative and Senior Faculty of The Rock Center for Corporate Governance since 2006. From 2005 to 2008, Professor of Accounting at the Graduate School of Business, Stanford University. Prior thereto, Ernst & Young Professor of Accounting at The Wharton School, University of Pennsylvania from 1985 to 2005. | N/A | |||
32 | Wells Fargo International Equity Fund
Table of Contents
Other information (unaudited)
| Name and year of birth | Position held and length of service* | Principal occupations during past five years or longer | Current other public company or investment company directorships | |||
Olivia S. Mitchell (Born 1953) | Trustee, since 2006; Nominating and Governance Committee Chair, since 2018 | International Foundation of Employee Benefit Plans Professor, Wharton School of the University of Pennsylvania since 1993. Director of Wharton’s Pension Research Council and Boettner Center on Pensions & Retirement Research, and Research Associate at the National Bureau of Economic Research. Previously, Cornell University Professor from 1978 to 1993. | N/A | |||
Timothy J. Penny (Born 1951) | Trustee, since 1996; Chair, since 2018 | President and Chief Executive Officer of Southern Minnesota Initiative Foundation, a non-profit organization, since 2007. Member of the Board of Trustees of NorthStar Education Finance, Inc., a non-profit organization, since 2007. | N/A | |||
James G. Polisson (Born 1959) | Trustee, since 2018 | Retired. Chief Marketing Officer, Source (ETF) UK Services, Ltd, from 2015 to 2017. From 2012 to 2015, Principal of The Polisson Group, LLC, a management consulting, corporate advisory and principal investing company. Chief Executive Officer and Managing Director at Russell Investments, Global Exchange Traded Funds from 2010 to 2012. Managing Director of Barclays Global Investors from 1998 to 2010 and Global Chief Marketing Officer for iShares and Barclays Global Investors from 2000 to 2010. Trustee of the San Francisco Mechanics’ Institute, a non-profit organization, from 2013 to 2015. Board member of the Russell Exchange Traded Fund Trust from 2011 to 2012. Director of Barclays Global Investors Holdings Deutschland GmbH from 2006 to 2009. Mr. Polisson is an attorney and has a retired status with the Massachusetts and District of Columbia Bar Associations. | N/A | |||
Pamela Wheelock (Born 1959) | Trustee, since January 2020; previously Trustee from January 2018 to July 2019 | Board member of the Destination Medical Center Economic Development Agency, Rochester, Minnesota since 2019. Interim President of the McKnight Foundation from January to September 2020. Acting Commissioner, Minnesota Department of Human Services, July 2019 through September 2019. Human Services Manager (part-time), Minnesota Department of Human Services, October 2019 through December 2019. Chief Operating Officer, Twin Cities Habitat for Humanity from 2017 to 2019. Vice President of University Services, University of Minnesota from 2012 to 2016. Prior thereto, on the Board of Directors, Governance Committee and Finance Committee for the Minnesota Philanthropy Partners (Saint Paul Foundation) from 2012 to 2018, Interim Chief Executive Officer of Blue Cross Blue Shield of Minnesota from 2011 to 2012, Chairman of the Board from 2009 to 2012 and Board Director from 2003 to 2015. Vice President, Leadership and Community Engagement, Bush Foundation, Saint Paul, Minnesota (a private foundation) from 2009 to 2011. Executive Vice President and Chief Financial Officer, Minnesota Sports and Entertainment from 2004 to 2009 and Senior Vice President from 2002 to 2004. Executive Vice President of the Minnesota Wild Foundation from 2004 to 2008. Commissioner of Finance, State of Minnesota, from 1999 to 2002. Currently Board Chair of the Minnesota Wild Foundation since 2010. | N/A | |||
| * | Length of service dates reflect the Trustee’s commencement of service with the Trust’s predecessor entities, where applicable. |
Wells Fargo International Equity Fund | 33
Table of Contents
Other information (unaudited)
Officers
| Name and year of birth | Position held and length of service | Principal occupations during past five years or longer | ||
Andrew Owen (Born 1960) | President, since 2017 | Executive Vice President of Wells Fargo & Company and Head of Affiliated Managers, Wells Fargo Asset Management, since 2014. In addition, Mr. Owen is currently President, Chief Executive Officer and Director of Wells Fargo Funds Management, LLC since 2017. Prior thereto, Executive Vice President responsible for marketing, investments and product development for Wells Fargo Funds Management, LLC, from 2009 to 2014. | ||
Jeremy DePalma1 (Born 1974) | Treasurer, since 2012 | Senior Vice President of Wells Fargo Funds Management, LLC since 2009. Senior Vice President of Evergreen Investment Management Company, LLC from 2008 to 2010 and head of the Fund Reporting and Control Team within Fund Administration from 2005 to 2010. | ||
Michelle Rhee (Born 1966) | Chief Legal Officer, since 2019 | Secretary of Wells Fargo Funds Management, LLC and Chief Legal Counsel of Wells Fargo Asset Management since 2018. Deputy General Counsel of Wells Fargo Bank, N.A. since 2020 and Assistant General Counsel of Wells Fargo Bank, N.A. from 2018 to 2020. Associate General Counsel and Managing Director of Bank of America Corporation from 2004 to 2018. | ||
Catherine Kennedy (Born 1969) | Secretary, since 2019 | Vice President of Wells Fargo Funds Management, LLC and Senior Counsel of the Wells Fargo Legal Department since 2010. Vice President and Senior Counsel of Evergreen Investment Management Company, LLC from 1998 to 2010. | ||
Michael H. Whitaker (Born 1967) | Chief Compliance Officer, since 2016 | Chief Compliance Officer of Wells Fargo Asset Management since 2016. Senior Vice President and Chief Compliance Officer for Fidelity Investments from 2007 to 2016. | ||
| 1 | Jeremy DePalma acts as Treasurer of 77 funds in the Fund Complex. |
| 2 | The Statement of Additional Information includes additional information about the Trustees and is available, without charge, upon request, by calling 1-800-222-8222 or by visiting the website at wfam.com. |
34 | Wells Fargo International Equity Fund
Table of Contents
Other information (unaudited)
BOARD CONSIDERATION OF INVESTMENT MANAGEMENT AND SUB-ADVISORY AGREEMENTS:
Wells Fargo International Equity Fund
Under the Investment Company Act of 1940 (the “1940 Act”), the Board of Trustees (the “Board”) of Wells Fargo Funds Trust (the “Trust”) must determine annually whether to approve the continuation of the Trust’s investment management and sub-advisory agreements. In this regard, at a Board meeting held on May 26, 2020 and May 28, 2020 (together, the “Meeting”), the Board, all the members of which have no direct or indirect interest in the investment management and sub-advisory agreements and are not “interested persons” of the Trust, as defined in the 1940 Act (the “Independent Trustees”), reviewed and approved for Wells Fargo International Equity Fund (the “Fund”): (i) an investment management agreement (the “Management Agreement”) with Wells Fargo Funds Management, LLC (“Funds Management”); and (ii) an investment sub-advisory agreement (the “Sub-Advisory Agreement”) with Wells Capital Management Incorporated (the “Sub-Adviser”), an affiliate of Funds Management. The Management Agreement and the Sub-Advisory Agreement are collectively referred to as the “Advisory Agreements.”
At the Meeting, the Board considered the factors and reached the conclusions described below relating to the selection of Funds Management and the Sub-Adviser and the approval of the Advisory Agreements. Prior to the Meeting, including at a Board meeting held in April 2020, the Trustees conferred extensively among themselves and with representatives of Funds Management about these matters. Also, the Board has adopted a team-based approach, with each team consisting of a sub-set of Trustees, to assist the full Board in the discharge of its duties in reviewing investment performance and other matters throughout the year. The Independent Trustees were assisted in their evaluation of the Advisory Agreements by independent legal counsel, from whom they received separate legal advice and with whom they met separately.
In providing information to the Board, Funds Management and the Sub-Adviser were guided by a detailed set of requests for information submitted to them by independent legal counsel on behalf of the Independent Trustees at the start of the Board’s annual contract renewal process earlier in 2020. In considering and approving the Advisory Agreements, the Trustees considered the information they believed relevant, including but not limited to the information discussed below. The Board considered not only the specific information presented in connection with the Meeting, but also the knowledge gained over time through interaction with Funds Management and the Sub-Adviser about various topics. In this regard, the Board reviewed reports of Funds Management at each of its quarterly meetings, which included, among other things, portfolio reviews and investment performance reports. In addition, the Board and the teams mentioned above confer with portfolio managers at various times throughout the year. The Board did not identify any particular information or consideration that was all-important or controlling, and each individual Trustee may have attributed different weights to various factors.
After its deliberations, the Board unanimously approved the continuation of the Advisory Agreements for a one-year term and determined that the compensation payable to Funds Management and the Sub-Adviser under each of the Advisory Agreements was reasonable. The Board considered the approval of the Advisory Agreements for the Fund as part of its consideration of agreements for funds across the complex, but its approvals were made on a fund-by-fund basis. The following summarizes a number of important, but not necessarily all, factors considered by the Board in support of its approvals.
Nature, extent and quality of services
The Board received and considered various information regarding the nature, extent and quality of services provided to the Fund by Funds Management and the Sub-Adviser under the Advisory Agreements. This information included a description of the investment advisory services and Fund-level administrative services covered by the Management Agreement, as well as, among other things, a summary of the background and experience of senior management of Wells Fargo Asset Management (“WFAM”), of which Funds Management and the Sub-Adviser are a part, and a summary of investments made in the business of WFAM. The Board also received a description of Funds Management’s and the Sub-Adviser’s business continuity plans and of their approaches to data privacy and cybersecurity, and related testing. The Board also received and reviewed information about Funds Management’s role as administrator of the Fund’s liquidity risk management program, Funds Management’s approach to risk management, and Funds Management’s intermediary and vendor oversight program.
The Board also considered the qualifications, background, tenure and responsibilities of each of the portfolio managers primarily responsible for the day-to-day portfolio management of the Fund. The Board evaluated the ability of Funds Management and the Sub-Adviser to attract and retain qualified investment professionals, including research, advisory and supervisory personnel. The Board further considered the compliance programs and compliance records of Funds Management and the Sub-Adviser. In addition, the Board took into account the full range of services provided to the Fund by Funds Management and its affiliates.
Wells Fargo International Equity Fund | 35
Table of Contents
Other information (unaudited)
Fund investment performance and expenses
The Board considered the investment performance results for the Fund over various time periods ended December 31, 2019. The Board also considered more current results for various time periods ended March 31, 2020. The Board considered these results in comparison to the investment performance of funds in a universe that was determined by Broadridge Inc. (“Broadridge”) to be similar to the Fund (the “Universe”), and in comparison to the Fund’s benchmark index and to other comparative data. Broadridge is an independent provider of investment company data. The Board received a description of the methodology used by Broadridge to select the mutual funds in the performance Universe. The Board noted that the investment performance of the Fund (Class A) was higher than the average investment performance of the Universe for the five- and ten-year periods ended December 31, 2019, but lower than the average investment performance of the Universe for the one- and three-year periods ended December 31, 2019. The Board also noted that the investment performance of the Fund (Administrator Class) was in range of or higher than the average investment performance of the Universe for the five- and ten-year periods ended March 31, 2020, and lower than the average investment performance of the Universe for the one- and three-year periods ended March 31, 2020. The Board also noted that the investment performance of the Fund was lower than its benchmark index, the MSCI ACWI ex USA Index (Net), for the one-, three- and five-year periods ended December 31, 2019, but higher than its benchmark for the ten-year period ended December 31, 2019. The Board also noted that the investment performance of the Fund was lower than its benchmark index, the MSCI ACWI ex USA Index (Net), for all periods ended March 31, 2020.
The Board received information concerning, and discussed factors contributing to, the underperformance of the Fund relative to the Universe and benchmark for the periods identified above. The Board took note of the explanations for the relative underperformance during these periods, including with respect to investment decisions that affected the Fund’s investment performance.
The Board also received and considered information regarding the Fund’s net operating expense ratios and their various components, including actual management fees, custodian and other non-management fees, and Rule 12b-1 and non-Rule 12b-1 shareholder service fees. The Board considered these ratios in comparison to the median ratios of funds in class-specific expense groups that were determined by Broadridge to be similar to the Fund (the “Groups”). The Board received a description of the methodology used by Broadridge to select the mutual funds in the expense Groups and an explanation of how funds comprising expense groups and their expense ratios may vary from year-to-year. Based on the Broadridge reports, the Board noted that the net operating expense ratios of the Fund were in range of or lower than the median net operating expense ratios of the expense Groups for each share class.
The Board took into account the Fund’s investment performance and expense information provided to it among the factors considered in deciding to re-approve the Advisory Agreements.
Investment management and sub-advisory fee rates
The Board reviewed and considered the contractual fee rates payable by the Fund to Funds Management under the Management Agreement, as well as the contractual fee rates payable by the Fund to Funds Management for class-level administrative services under a Class-Level Administration Agreement, which include, among other things, class-level transfer agency and sub-transfer agency costs (collectively, the “Management Rates”). The Board also reviewed and considered the contractual investment sub-advisory fee rates that are payable by Funds Management to the Sub-Adviser for investment sub-advisory services.
Among other information reviewed by the Board was a comparison of the Fund’s Management Rates with the average contractual investment management fee rates of funds in the expense Groups at a common asset level as well as transfer agency costs of the funds in the expense Groups. The Board noted that the Management Rates of the Fund were in range of the sum of these average rates for the Fund’s expense Groups for all share classes except for Class R and the Administrator Class. The Board noted that the Management Rates of the Fund were higher than the sum of these average rates for the Fund’s expense Groups for Class R and the Administrator Class. The Board noted that the Fund’s expense ratio cap for Class R was lowered in 2018. The Board also noted that the peer group for the Administrator Class had a limited number of funds.
The Board also received and considered information about the portion of the total management fee that was retained by Funds Management after payment of the fee to the Sub-Adviser for sub-advisory services. In assessing the reasonableness of this amount, the Board received and evaluated information about the nature and extent of responsibilities retained and risks assumed by Funds Management and not delegated to or assumed by the Sub-Adviser, and about Funds Management’s on-going oversight services. Given the affiliation between Funds Management and the Sub-Adviser, the Board ascribed limited relevance to the allocation of fees between them.
36 | Wells Fargo International Equity Fund
Table of Contents
Other information (unaudited)
The Board also received and considered information about the nature and extent of services offered and fee rates charged by Funds Management and the Sub-Adviser to other types of clients with investment strategies similar to those of the Fund. In this regard, the Board received information about the significantly greater scope of services, and compliance, reporting and other legal burdens and risks of managing proprietary mutual funds compared with those associated with managing assets of other types of clients, including third-party sub-advised fund clients and non-mutual fund clients such as institutional separate accounts.
Based on its consideration of the factors and information it deemed relevant, including those described here, the Board determined that the compensation payable to Funds Management under the Management Agreement and to the Sub-Adviser under the Sub-Advisory Agreement was reasonable.
Profitability
The Board received and considered information concerning the profitability of Funds Management, as well as the profitability of both WFAM and Wells Fargo & Co. (“Wells Fargo”) from providing services to the fund family as a whole. The Board noted that the Sub-Adviser’s profitability information with respect to providing services to the Fund and other funds in the family was subsumed in the WFAM and Wells Fargo profitability analysis.
Funds Management reported on the methodologies and estimates used in calculating profitability, including a description of the methodology used to allocate certain expenses. Among other things, the Board noted that the levels of profitability reported on a fund-by-fund basis varied widely, depending on factors such as the size, type and age of fund.
Based on its review, the Board did not deem the profits reported by Funds Management, WFAM or Wells Fargo from services provided to the Fund to be at a level that would prevent it from approving the continuation of the Advisory Agreements.
Economies of scale
The Board received and considered information about the potential for Funds Management to experience economies of scale in the provision of management services to the Fund, the difficulties of calculating economies of scale at an individual fund level, and the extent to which potential scale benefits are shared with shareholders. The Board noted the existence of breakpoints in the Fund’s management fee structure, which operate generally to reduce the Fund’s expense ratios as the Fund grows in size, and the size of the Fund in relation to such breakpoints. The Board considered that in addition to management fee breakpoints, Funds Management shares potential economies of scale from its management business in a variety of ways, including through fee waiver and expense reimbursement arrangements, services that benefit shareholders, competitive management fee rates set at the outset without regard to breakpoints, and investments in the business intended to enhance services available to shareholders.
The Board concluded that Funds Management’s arrangements with respect to the Fund, including contractual breakpoints, constituted a reasonable approach to sharing potential economies of scale with the Fund and its shareholders.
Other benefits to Funds Management and the Sub-Adviser
The Board received and considered information regarding potential “fall-out” or ancillary benefits received by Funds Management and its affiliates, including the Sub-Adviser, as a result of their relationships with the Fund. Ancillary benefits could include, among others, benefits directly attributable to other relationships with the Fund and benefits potentially derived from an increase in Funds Management’s and the Sub-Adviser’s business as a result of their relationships with the Fund. The Board noted that various affiliates of Funds Management may receive distribution-related fees, shareholder servicing payments and sub-transfer agency fees in respect of shares sold or held through them and services provided.
The Board also reviewed information about soft dollar credits earned and utilized by the Sub-Adviser, fees earned by Funds Management and the Sub-Adviser from managing a private investment vehicle for the fund family’s securities lending collateral, and commissions earned by an affiliated broker from portfolio transactions.
Based on its consideration of the factors and information it deemed relevant, including those described here, the Board did not find that any ancillary benefits received by Funds Management and its affiliates, including the Sub-Adviser, were unreasonable.
Conclusion
At the Meeting, after considering the above-described factors and based on its deliberations and its evaluation of the information described above, the Board unanimously approved the continuation of the Advisory Agreements for a one-year term and determined that the compensation payable to Funds Management and the Sub-Adviser under each of the Advisory Agreements was reasonable.
Wells Fargo International Equity Fund | 37
Table of Contents
Other information (unaudited)
LIQUIDITY RISK MANAGEMENT PROGRAM
In accordance with Rule 22e-4 under the Investment Company Act of 1940, as amended (the “Liquidity Rule”), Wells Fargo Funds Trust (the “Trust”) has adopted and implemented a liquidity risk management program (the “Program”) on behalf of each of its series, including the Fund, which is reasonably designed to assess and manage the Fund’s liquidity risk. “Liquidity risk” is defined as the risk that the Fund is unable to meet redemption requests without significantly diluting remaining investors’ interests in the Fund. The Trust’s Board of Trustees (the “Board”) previously approved the designation of Wells Fargo Funds Management, LLC (“Funds Management”), the Fund’s investment manager, as the administrator of the Program, and Funds Management has established a Liquidity Risk Management Council composed of personnel from multiple departments within Funds Management and its affiliates to assist Funds Management in the implementation and on-going administration of the Program.
The Program is comprised of various components designed to support the assessment and/or management of liquidity risk, including: (1) the periodic assessment (no less frequently than annually) of certain factors that influence the Fund’s liquidity risk; (2) the periodic classification (no less frequently than monthly) of the Fund’s investments into one of four liquidity categories that reflect an estimate of their liquidity under current market conditions; (3) a 15% limit on the acquisition of “illiquid investments” (as defined under the Liquidity Rule); (4) to the extent the Fund does not invest primarily in “highly liquid investments” (as defined under the Liquidity Rule), the determination of a minimum percentage of the Fund’s assets that generally will be invested in highly liquid investments (an “HLIM”); (5) if the Fund has established an HLIM, the periodic review (no less frequently than annually) of the HLIM and the adoption of policies and procedures for responding to a shortfall of the Fund’s “highly liquid investments” below its HLIM; and (6) periodic reporting to the Board.
At a meeting of the Board held on May 26 and 28, 2020, the Board received a written report (the “Report”) from Funds Management that addressed the operation of the Program and assessed its adequacy and effectiveness of implementation. The Report covered the initial period from December 1, 2018 through December 31, 2019 (the “Reporting Period”). No significant liquidity events impacting the Fund were noted in the Report. There were no material changes to the Program during the Reporting Period. The Report concluded that the Program is operating effectively to assess and manage the Fund’s liquidity risk, and that the Program has been and continues to be adequately and effectively implemented to monitor and, as applicable, respond to the Fund’s liquidity developments.
There can be no assurance that the Program will achieve its objectives under all circumstances in the future. Please refer to the Fund’s prospectus for more information regarding the Fund’s exposure to liquidity risk and other risks to which an investment in the Fund may be subject.
38 | Wells Fargo International Equity Fund
Table of Contents
This page is intentionally left blank.
Table of Contents
This page is intentionally left blank.
Table of Contents
For more information
More information about Wells Fargo Funds is available free upon request. To obtain literature, please write, visit the Fund’s website, or call:
Wells Fargo Funds
P.O. Box 219967
Kansas City, MO 64121-9967
Website: wfam.com
Individual investors: 1-800-222-8222
Retail investment professionals: 1-888-877-9275
Institutional investment professionals: 1-866-765-0778

This report and the financial statements contained herein are submitted for the general information of the shareholders of the Fund. If this report is used for promotional purposes, distribution of the report must be accompanied or preceded by a current prospectus. Before investing, please consider the investment objectives, risks, charges, and expenses of the investment. For a current prospectus and, if available, a summary prospectus, containing this information, call 1-800-222-8222 or visit the Fund’s website at wfam.com. Read the prospectus carefully before you invest or send money.
Wells Fargo Asset Management (WFAM) is the trade name for certain investment advisory/management firms owned by Wells Fargo & Company. These firms include but are not limited to Wells Capital Management Incorporated and Wells Fargo Funds Management, LLC. Certain products managed by WFAM entities are distributed by Wells Fargo Funds Distributor, LLC (a broker-dealer and Member FINRA).
This material is for general informational and educational purposes only and is NOT intended to provide investment advice or a recommendation of any kind—including a recommendation for any specific investment, strategy, or plan.
INVESTMENT PRODUCTS: NOT FDIC INSURED ◾ NO BANK GUARANTEE ◾ MAY LOSE VALUE
© 2020 Wells Fargo & Company. All rights reserved.
PAR-1120-00559 12-20
A240/AR240 10-20
Table of Contents

Annual Report
October 31, 2020
Wells Fargo
Intrinsic World Equity Fund
Beginning on January 1, 2021, as permitted by new regulations adopted by the Securities and Exchange Commission, paper copies of the Wells Fargo Funds’ annual and semi-annual shareholder reports issued after this date will no longer be sent by mail, unless you specifically request paper copies of the reports. Instead, the reports will be made available on the Funds’ website, and you will be notified by mail each time a report is posted and provided with a website address to access the report.
If you already elected to receive shareholder reports electronically, you will not be affected by this change and you need not take any action. You may elect to receive shareholder reports and other communications from the Fund electronically at any time by contacting your financial intermediary (such as a broker-dealer or bank) or, if you are a direct investor, by calling 1-800-222-8222 or by enrolling at wellsfargo.com/advantagedelivery.
You may elect to receive all future reports in paper free of charge. If you invest through a financial intermediary, you can contact your financial intermediary to request that you continue to receive paper copies of your shareholder reports; if you invest directly with the Fund, you can call 1-800-222-8222. Your election to receive reports in paper will apply to all Wells Fargo Funds held in your account with your financial intermediary or, if you are a direct investor, to all Wells Fargo Funds that you hold.
Table of Contents
|
Reduce clutter. Save trees. |
Sign up for electronic delivery of prospectuses and shareholder reports at wellsfargo.com/ |
The views expressed and any forward-looking statements are as of October 31, 2020, unless otherwise noted, and are those of the Fund’s portfolio managers and/or Wells Fargo Asset Management. Discussions of individual securities, or the markets generally, or any Wells Fargo Fund are not intended as individual recommendations. Future events or results may vary significantly from those expressed in any forward-looking statements. The views expressed are subject to change at any time in response to changing circumstances in the market. Wells Fargo Asset Management and the Fund disclaim any obligation to publicly update or revise any views expressed or forward-looking statements.
INVESTMENT PRODUCTS: NOT FDIC INSURED ◾ NO BANK GUARANTEE ◾ MAY LOSE VALUE
Wells Fargo Intrinsic World Equity Fund | 1
Table of Contents
Letter to shareholders (unaudited)

Andrew Owen
President
Wells Fargo Funds
Dear Shareholder:
We are pleased to offer you this annual report for the Wells Fargo Intrinsic World Equity Fund for the 12-month period that ended October 31, 2020. Global stock markets saw earlier gains erased in March as governments around the world took unprecedented measures, attempting to stop the spread of COVID-19 at the expense of short-term economic output. However, markets rallied strongly from April through period-end to offset those short-term losses as central banks bolstered capital markets and confidence.
For the 12-month period, equities had generally positive total returns despite intense volatility in March. Non-U.S. developed market equities had weaker performance than emerging market and U.S. stocks. While gains from fixed-income securities were positive, they were more modest than equities. For the period, U.S. stocks, based on the S&P 500 Index,1 gained 9.71%. International stocks, as measured by the MSCI ACWI ex USA Index (Net),2 returned -2.61%, while the MSCI EM Index (Net)3 had stronger performance, with a 8.25% gain. Among bond indices, the Bloomberg Barclays U.S. Aggregate Bond Index4 returned 6.19%, the Bloomberg Barclays Global Aggregate ex-USD Index5 gained 4.96%, and the Bloomberg Barclays Municipal Bond Index6 returned 3.59% while the ICE BofA U.S. High Yield Index7 returned 2.54%.
The period began with buoyed investor confidence.
Equity markets rallied in November despite ongoing geopolitical risks. Hopes for a U.S.-China trade deal buoyed investor confidence. U.S. business sentiment improved slightly and manufacturing and services activity picked up. While consumer confidence and purchasing managers’ activity rose in the eurozone, China reported weakening manufacturing and consumer data. Bond yields rose marginally, leading to slightly negative returns for global government and investment-grade corporate bonds.
Financial markets ended 2019 boosted by the U.S. and China accord on a Phase One trade deal. That, along with the landslide election win by the pro-Brexit U.K. Conservative Party and ongoing central bank support, gave investors greater confidence. U.S. economic indicators were generally positive, with the exception of manufacturing activity and business confidence. Consumer confidence was fed by a robust labor market, tame inflation, and lower interest rates, which boosted housing affordability and stimulated homebuyer activity. The impeachment of President Trump had little market impact. Meanwhile, slowing Chinese economic activity, partly a result of the trade war, led to further government stimulus at year-end through lower reserve ratios, allowing banks to lend more money.
| 1 | The S&P 500 Index consists of 500 stocks chosen for market size, liquidity, and industry group representation. It is a market-value-weighted index with each stock’s weight in the index proportionate to its market value. You cannot invest directly in an index. |
| 2 | The Morgan Stanley Capital International (MSCI) All Country World Index (ACWI) ex USA Index (Net) is a free-float-adjusted market-capitalization-weighted index that is designed to measure the equity market performance of developed and emerging markets, excluding the United States. Source: MSCI. MSCI makes no express or implied warranties or representations and shall have no liability whatsoever with respect to any MSCI data contained herein. The MSCI data may not be further redistributed or used as a basis for other indices or any securities or financial products. This report is not approved, reviewed, or produced by MSCI. You cannot invest directly in an index. |
| 3 | The MSCI Emerging Markets (EM) Index (Net) is a free-float-adjusted market-capitalization-weighted index that is designed to measure equity market performance of emerging markets. You cannot invest directly in an index. |
| 4 | The Bloomberg Barclays U.S. Aggregate Bond Index is a broad-based benchmark that measures the investment-grade, U.S. dollar-denominated, fixed-rate taxable bond market, including Treasuries, government-related and corporate securities, mortgage-backed securities (agency fixed-rate and hybrid adjustable-rate mortgage pass-throughs), asset-backed securities, and commercial mortgage-backed securities. You cannot invest directly in an index. |
| 5 | The Bloomberg Barclays Global Aggregate ex-USD Index is an unmanaged index that provides a broad-based measure of the global investment-grade fixed-income markets excluding the U.S. dollar-denominated debt market. You cannot invest directly in an index. |
| 6 | The Bloomberg Barclays Municipal Bond Index is an unmanaged index composed of long-term tax-exempt bonds with a minimum credit rating of Baa. You cannot invest directly in an index. |
| 7 | The ICE BofA U.S. High Yield Index is a market-capitalization-weighted index of domestic and Yankee high-yield bonds. The index tracks the performance of high-yield securities traded in the U.S. bond market. You cannot invest directly in an index. Copyright 2020. ICE Data Indices, LLC. All rights reserved. |
2 | Wells Fargo Intrinsic World Equity Fund
Table of Contents
Letter to shareholders (unaudited)
The 2019 year-end rally continued in early January 2020. However, capital market volatility spiked in late January on concerns over the potential impact of COVID-19 on the global economy and stock markets. With sentiment somewhat souring, perceived safe havens did well in January. The U.S. dollar and Japanese yen both rose and government bonds outperformed equities. While the S&P 500 Index held its ground, emerging market equities tumbled, including those in Asia.
In February, COVID-19 became the major market focus. Fears of the virus’s impact on global growth led to expectations of increased global central bank monetary policy support. That led the 10-year U.S. Treasury yield to fall to an all-time low of 1.1%. Although equity markets initially shrugged off concerns about the outbreak, focusing instead on strong fourth-quarter earnings and improving business confidence in January, market sentiment turned sharply lower and the S&P 500 Index lost 8.2% for the month. Oil prices tumbled as Russia and the Organization of the Petroleum Exporting Countries compounded a major decline in oil demand with a brutal price war, partly aimed at dissuading further U.S. shale production, causing the price of West Texas Intermediate crude oil to plummet.
The global spread of COVID-19 in March led country after country to clamp down on social- and business-related activity in order to contain the virus from causing even greater devastation and overwhelming health care systems. This abrupt stoppage of economic activity led to the sharp deceleration of global output, sending economies into a deep contraction. Central banks responded swiftly, slashing interest rates and expanding quantitative easing programs to restore liquidity and confidence in the markets. In the U.S., the Federal Reserve (Fed) introduced several new lending programs, funding investment-grade bonds, money market mutual funds, and commercial paper while purchasing Treasuries, mortgage-backed securities, and overnight repurchase agreements. Meanwhile, stock markets tumbled quickly into a bear market, ending the longest bull stock market in U.S. history.
Markets rebounded strongly in April, fueled by unprecedented government and central bank stimulus measures. The U.S. economy contracted by an annualized 5.0% pace in the first quarter of 2020, with 30 million new unemployment insurance claims in six weeks. In the eurozone, first-quarter real gross domestic product (GDP) shrank 3.8% with the composite April Flash Purchasing Managers’ Index (PMI), a monthly survey of purchasing managers, falling to an all-time low of 13.5. The European Central Bank expanded its quantitative easing to include the purchase of additional government bonds of countries with the greatest virus-related need, including Italy and Spain. China’s first-quarter GDP fell by 6.8% year over year. However, retail sales, production, and investment showed signs of recovery. Extreme oil-price volatility continued as global supply far exceeded demand.
The global equity market rebound continued in May, with widespread advances. Investors regained confidence on reports of early signs of success in human trials of a COVID-19 vaccine. Growth stocks continued to outperform value stocks while returns on global government bonds were generally flat. In the U.S., a gap grew between the stock market rebound and economic data, including an April unemployment rate of 14.7%, the highest level since World War II. Manufacturing and services purchasing managers’ indices reflected widespread weakening activity in May. U.S. corporate earnings reports indicated a 14% year-over-year contraction in earnings from the first quarter of 2019. However, high demand for technology, driven by remote activity, supported robust information technology sector earnings, which helped drive major technology stocks higher.
Financial markets posted widely positive returns in June despite ongoing economic weakness and high levels of uncertainty on the containment of COVID-19 and the timing of an effective vaccine. There were hopeful signs as economies reopened. Vitally important to market sentiment was the ongoing commitment by central banks globally
“The global spread of COVID-19 in March led country after country to clamp down on social- and business-related activity in order to contain the virus from causing even greater devastation and overwhelming health care systems.”
Wells Fargo Intrinsic World Equity Fund | 3
Table of Contents
Letter to shareholders (unaudited)
“In October, capital markets took a step back from their six-month rally. Market volatility rose in advance of the U.S. election and amid a global increase in COVID-19 infections.”
to do all they can to provide economic support through liquidity and low borrowing costs. U.S. economic activity was aided by one-time $1,200 stimulus checks and $600 weekly bonus unemployment benefits that expired at the end of July. However, unemployment remained historically high, easing somewhat from 14.7% in April to 11.1% in June. By the end of June, numerous states reported increases of COVID-19 cases. China’s economic recovery picked up momentum in June, though it remained far from a full recovery.
July was broadly positive for both global equities and fixed income. However, economic data and a resurgence of COVID-19 cases pointed to the vulnerability of the global economy and the ongoing imperative to regain control of the pandemic. Second-quarter GDP shrank from the previous quarter by 9.5% and 12.1% in the U.S. and the eurozone, respectively. In contrast, China reported a 3.2% year-over-year expansion in its second-quarter GDP. U.S. unemployment remained high despite adding 1.8 million jobs in July, with a double-digit jobless rate persisting. However, manufacturing activity grew in both the U.S. and the eurozone. In Asia, while China’s manufacturing sector continued to expand, activity in Japan and South Korea contracted. A rising concern was the rapid and broad reemergence of COVID-19 infections.
The stock market continued to rally in August despite concerns over rising numbers of COVID-19 cases in the United States and several European countries, including France and Spain, as well as the July expiration of the $600 weekly bonus unemployment benefit. U.S. stocks had strong monthly gains, surpassing broadly positive overall global equity performance, while fixed-income market monthly returns were broadly flat. Generally stronger-than-expected second-quarter earnings boosted investor sentiment along with the Fed’s announcement of a policy shift that will likely lead to longer-term low interest rates and supportive monetary policy. U.S. indices measuring manufacturing and services activities beat expectations while the U.S. housing market maintained strength. In Europe, retail sales expanded and consumer confidence was steady. China’s economy continued to expand.
Stocks grew more volatile in September on mixed economic data. U.S. economic activity continued to grow. However, six months after the bottom fell out of the labor market in early spring, only half of the 22 million jobs lost had returned. The U.S. unemployment rate fell to 7.9% in September, reflecting steady improvement but far higher than the 3.5% pre-COVID-19 rate. Only 661,000 jobs were added for the month, down from 1.5 million in August. Meanwhile, a reported 2.3 million people have given up looking for work. With U.S. Congress failing to pass further fiscal relief and uncertainties surrounding a possible vaccine, doubts crept back into the financial markets. In the U.K., a lack of progress in Brexit talks with the European Union weighed on markets. China’s economy picked up steam, however, with growth fueled by increased global demand, and China’s services sector rallied.
In October, capital markets took a step back from their six-month rally. Market volatility rose in advance of the U.S. election and amid a global increase in COVID-19 infections. Europe responded with a new round of restrictions affecting economic activity. Meanwhile, Brexit remained unresolved as the European Union and the U.K. failed to strike a deal by a mid-October deadline. U.S. markets looked favorably at a possible Democratic sweep and control of the federal purse strings as that could lead to the passage of long-awaited additional fiscal stimulus, which could boost economic activity. Meanwhile, China continued to stand apart, reporting 4.9% third-quarter GDP growth year over year.
4 | Wells Fargo Intrinsic World Equity Fund
Table of Contents
Letter to shareholders (unaudited)
Don’t let short-term uncertainty derail long-term investment goals.
Periods of investment uncertainty can present challenges, but experience has taught us that maintaining long-term investment goals can be an effective way to plan for the future. To help you create a sound strategy based on your personal goals and risk tolerance, Wells Fargo Funds offers more than 100 mutual funds spanning a wide range of asset classes and investment styles. Although diversification cannot guarantee an investment profit or prevent losses, we believe it can be an effective way to manage investment risk and potentially smooth out overall portfolio performance. We encourage investors to know their investments and to understand that appropriate levels of risk-taking may unlock opportunities.
Thank you for choosing to invest with Wells Fargo Funds. We appreciate your confidence in us and remain committed to helping you meet your financial needs.
Sincerely,

Andrew Owen
President
Wells Fargo Funds
|
For further information about your Fund, contact your investment professional, visit our website at wfam.com, or call us directly at 1-800-222-8222. |
Notice to Shareholders
At a meeting held on August 10-12, 2020, the Board of Trustees of the Fund approved a change to the Fund’s automatic conversion feature for Class C shares in order to shorten the required holding period from 10 to 8 years. As a result, on a monthly basis beginning November 5, 2020, Class C shares will convert automatically into Class A shares 8 years after the initial date of purchase or, if you acquired your Class C shares through an exchange or conversion from another share class, 8 years after the date you acquired your Class C shares. When Class C shares that you acquired through a purchase or exchange convert, any other Class C shares that you purchased with reinvested dividends and distributions also will convert into Class A shares on a pro rata basis.
Please note that a shorter holding period may apply depending on your intermediary. Please see “Appendix A—Sales Charge Reductions and Waivers for Certain Intermediaries” in the Fund’s prospectus for further information.
Wells Fargo Intrinsic World Equity Fund | 5
Table of Contents
Performance highlights (unaudited)
Investment objective
The Fund seeks long-term capital appreciation.
Manager
Wells Fargo Funds Management, LLC
Subadviser
Wells Capital Management Incorporated
Portfolio managers
Miguel E. Giaconi, CFA®‡
Amit Kumar
Jean-Baptiste Nadal, CFA®‡
Average annual total returns (%) as of October 31, 2020
| Including sales charge | Excluding sales charge | Expense ratios1 (%) | ||||||||||||||||||||||||||||||||
| Inception date | 1 year | 5 year | 10 year | 1 year | 5 year | 10 year | Gross | Net2 | ||||||||||||||||||||||||||
| Class A (EWEAX) | 4-30-1996 | -10.55 | 4.58 | 7.27 | -5.08 | 5.83 | 7.91 | 1.47 | 1.35 | |||||||||||||||||||||||||
| Class C (EWECX) | 5-18-2007 | -6.74 | 5.05 | 7.11 | -5.74 | 5.05 | 7.11 | 2.22 | 2.10 | |||||||||||||||||||||||||
| Administrator Class (EWEIX) | 5-18-2007 | – | – | – | -4.99 | 5.94 | 8.10 | 1.39 | 1.25 | |||||||||||||||||||||||||
| Institutional Class (EWENX) | 7-30-2010 | – | – | – | -4.68 | 6.26 | 8.37 | 1.14 | 0.95 | |||||||||||||||||||||||||
| MSCI World Index (Net)3 | – | – | – | – | 4.36 | 8.13 | 8.64 | – | – | |||||||||||||||||||||||||
Figures quoted represent past performance, which is no guarantee of future results, and do not reflect taxes that a shareholder may pay on an investment in a fund. Investment return and principal value of an investment will fluctuate so that an investor’s shares, when redeemed, may be worth more or less than their original cost. Performance shown without sales charges would be lower if sales charges were reflected. Current performance may be lower or higher than the performance data quoted, which assumes the reinvestment of dividends and capital gains. Current month-end performance is available on the Fund’s website, wfam.com.
Index returns do not include transaction costs associated with buying and selling securities, any mutual fund fees or expenses, or any taxes. It is not possible to invest directly in an index.
For Class A shares, the maximum front-end sales charge is 5.75%. For Class C shares, the maximum contingent deferred sales charge is 1.00%. Performance including a contingent deferred sales charge assumes the sales charge for the corresponding time period. Administrator Class and Institutional Class shares are sold without a front-end sales charge or contingent deferred sales charge.
Stock values fluctuate in response to the activities of individual companies and general market and economic conditions. Foreign investments are especially volatile and can rise or fall dramatically due to differences in the political and economic conditions of the host country. These risks are generally intensified in emerging markets. The use of derivatives may reduce returns and/or increase volatility. Certain investment strategies tend to increase the total risk of an investment (relative to the broader market). The Fund is exposed to focused portfolio risk, geographic risk, and smaller company securities risk. Consult the Fund’s prospectus for additional information on these and other risks.
Please see footnotes on page 7.
6 | Wells Fargo Intrinsic World Equity Fund
Table of Contents
Performance highlights (unaudited)
| Growth of $10,000 investment as of October 31, 20204 |
|
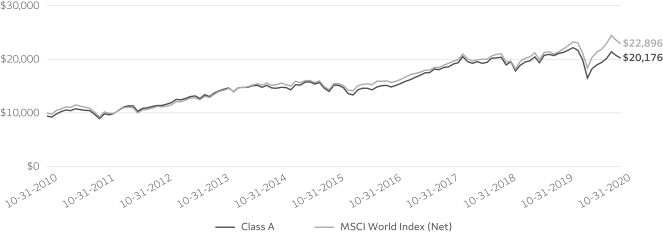
| ‡ | CFA® and Chartered Financial Analyst® are trademarks owned by CFA Institute. |
| 1 | Reflects the expense ratios as stated in the most recent prospectuses. The expense ratios shown are subject to change and may differ from the annualized expense ratios shown in the financial highlights of this report. |
| 2 | The manager has contractually committed through February 28, 2021, to waive fees and/or reimburse expenses to the extent necessary to cap total annual fund operating expenses after fee waivers at 1.35% for Class A, 2.10% for Class C, 1.25% for Administrator Class, and 0.95% for Institutional Class. Brokerage commissions, stamp duty fees, interest, taxes, acquired fund fees and expenses (if any), and extraordinary expenses are excluded from the expense caps. Prior to or after the commitment expiration date, the caps may be increased or the commitment to maintain the caps may be terminated only with the approval of the Board of Trustees. Without these caps, the Fund’s returns would have been lower. The expense ratio paid by an investor is the net expense ratio (the total annual fund operating expenses after fee waivers) as stated in the prospectuses. |
| 3 | The Morgan Stanley Capital International (MSCI) World Index (Net) is a free-float-adjusted market-capitalization-weighted index that is designed to measure the equity market performance of developed markets. Source: MSCI. MSCI makes no express or implied warranties or representations and shall have no liability whatsoever with respect to any MSCI data contained herein. The MSCI data may not be further redistributed or used as a basis for other indices or any securities or financial products. This report is not approved, reviewed, or produced by MSCI. You cannot invest directly in an index. |
| 4 | The chart compares the performance of Class A shares for the most recent ten years with the MSCI World Index (Net). The chart assumes a hypothetical investment of $10,000 in Class A shares and reflects all operating expenses and assumes the maximum initial sales charge of 5.75%. |
| 5 | The ten largest holdings, excluding cash, cash equivalents and any money market funds, are calculated based on the value of the investments divided by total net assets of the Fund. Holdings are subject to change and may have changed since the date specified. |
| 6 | Amounts are calculated based on the total long-term investments of the Fund. These amounts are subject to change and may have changed since the date specified. |
Wells Fargo Intrinsic World Equity Fund | 7
Table of Contents
Performance highlights (unaudited)
MANAGER’S DISCUSSION
Fund highlights
| ∎ | The Fund underperformed its benchmark, the MSCI World Index (Net), for the 12-month period that ended October 31, 2020. |
| ∎ | Stock selection in the information technology (IT), industrials, financials, communication services, consumer discretionary, and health care sectors detracted from the Fund’s relative return. |
| ∎ | An underweight to the underperforming real estate sector contributed. Relative sector weightings, which are a by-product of our bottom-up stock selection process, had a net positive effect. |
Global markets were volatile during the period.
The Fund underperformed due to a market environment where a few large companies dominated equity markets and growth-style investing outperformed value. As value managers with a focus on risk control, we cannot build sufficient positions in these few large companies without exceeding our risk parameters. Equity markets demonstrated the continued euphoria and strength of the fourth quarter of 2019, optimistic about accelerating global growth. The outbreak and propagation of the new coronavirus, which arose late in the fourth quarter, infected global markets in February 2020. The virus’s acceleration created significant fear and tremendous uncertainty, driving the growth of large companies that benefited from coronavirus trends of sheltering and remote work and learning. As the first half of 2020 ended, there were growing signs of a global economic rebound and developments in the third quarter of 2020 demonstrated that these sanguine signs of recovery were indeed valid.
We adhered to the same intrinsic value investment philosophy and process and consistently applied it to investment selection for the Fund. We define intrinsic value as the present discounted value of future cash streams. Our fundamental analysis involves identifying the stocks that we believe are high-quality, value-creating businesses selling at a discount to our estimate of intrinsic or true value and that possess what we believe are identifiable catalysts that could close the valuation gap over our investment time horizon. Over the long term, we seek to add value primarily through stock selection due to our research-intensive, bottom-up investment process.
| Ten largest holdings (%) as of October 31, 20205 | ||||
Microsoft Corporation | 5.19 | |||
Alphabet Incorporated Class C | 4.20 | |||
Amazon.com Incorporated | 3.95 | |||
Visa Incorporated Class A | 3.52 | |||
ON Semiconductor Corporation | 3.35 | |||
Sony Corporation | 2.97 | |||
Motorola Solutions Incorporated | 2.75 | |||
Honeywell International Incorporated | 2.51 | |||
Medtronic plc | 2.50 | |||
Renesas Electronics Corporation | 2.48 | |||
Our long-term investment process typically has resulted in low portfolio turnover as we seek to invest in businesses over a three- to five-year investment horizon. During the reporting period, we opportunistically took advantage of the market volatility to upgrade the Fund’s position. We replaced one company with another in a similar business that offers more upside potential after it became attractively valued during the sell-off on short-term news. We also invested in certain businesses where we expect capital expenditures to decline over our three- to five-year investment horizon, enabling the company to return the increased free cash flow to shareholders in different ways. All buy and sell decisions were driven by company-specific, fundamental analysis rather than top-down, sector-allocation considerations.
| Sector allocation as of October 31, 20206 |
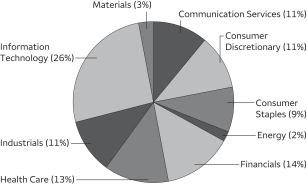 |
| Geographic allocation as of October 31, 20206 |
|
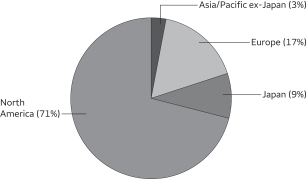
Please see footnotes on page 7.
8 | Wells Fargo Intrinsic World Equity Fund
Table of Contents
Performance highlights (unaudited)
Stock selection in several sectors hindered performance.
The Fund’s relative weakness was due to our focus on risk control and the difficulty in building active positions in those few large companies, as well as short-term negative impacts from the coronavirus pandemic. Market winners were technology-related names that participate in cloud solutions and those companies that help with accelerating long-term technology trends, such as employees working from home, factory automation, and distance learning. Some health care companies that are helping directly with the coronavirus benefited, while health care companies providing elective services and equipment have trailed. Within consumer staples, there was a dichotomy of outcomes due to stay-at-home orders. Some companies benefited from pantry- and bathroom-loading and cleaning products, while other companies were disadvantaged as demand declined for beauty products and beverages sold primarily at restaurants and bars.
An underweight in real estate was positive.
The real estate sector underperformed during the period as uncertainty from the coronavirus pandemic weighed on the sector.
We remain confident in our investment process.
The continued rebound in global equity markets reflects investors’ positive anticipation about the pace and strength of the economic recovery. We have positioned the Fund for the next two to three years and have maintained our risk profile to participate in the recovery. There are signs of recovery across the globe. However, this recovery is not smooth, nor is it as rapid as the decline was. We still consider a U-shaped recovery the most likely scenario, with economic activity improving in the fourth quarter. Portfolio turnover has been more consistent with our five-year time horizon and with elevated valuation levels, comparable with 2019, creating challenges in finding sufficient margins of safety.
The intrinsic value philosophy and process reflect our willingness to buy a high-quality company’s intrinsic value at a substantive discount and to do so where we can identify internally driven catalysts that will close this value gap over a long time horizon. Our primary focus is allowing company management teams to identify the most appropriate uses of free cash. These uses may include balance sheet restructuring, share repurchases, new products, acquisitions, or marketing. We believe company management teams have superior knowledge of their markets, competitors, and customers, enabling them to identify the most effective uses of free cash.
There are some potential risks that could affect short-term returns, including coronavirus propagation prolonging quarantines or slowing reopenings; human behavior shifts away from city centers, travel, and mass public events and gatherings; U.S. political conflict, 2020 elections, and impacts on tax policy—especially capital gains; trade implementation with China deteriorating and tariff increases; and geopolitical events, including U.S. reactions to Iran and North Korea aggression. We remain cautious in our positioning and believe the Fund is positioned to perform well in this environment. The Fund could further benefit from a shift from growth to value leadership, a modest normalization of interest rates, stability in the energy markets, continued market volatility, accelerated earnings growth in Europe, and further economic reforms in Continental Europe.
Please see footnotes on page 7.
Wells Fargo Intrinsic World Equity Fund | 9
Table of Contents
As a shareholder of the Fund, you incur two types of costs: (1) transaction costs, including sales charges (loads) on purchase payments and contingent deferred sales charges (if any) on redemptions and (2) ongoing costs, including management fees, distribution (12b-1) and/or shareholder servicing fees, and other Fund expenses. This example is intended to help you understand your ongoing costs (in dollars) of investing in the Fund and to compare these costs with the ongoing costs of investing in other mutual funds.
The example is based on an investment of $1,000 invested at the beginning of the six-month period and held for the entire period from May 1, 2020 to October 31, 2020.
Actual expenses
The “Actual” line of the table below provides information about actual account values and actual expenses. You may use the information in this line, together with the amount you invested, to estimate the expenses that you paid over the period. Simply divide your account value by $1,000 (for example, an $8,600 account value divided by $1,000 = 8.6), then multiply the result by the number in the “Actual” line under the heading entitled “Expenses paid during period” for your applicable class of shares to estimate the expenses you paid on your account during this period.
Hypothetical example for comparison purposes
The “Hypothetical” line of the table below provides information about hypothetical account values and hypothetical expenses based on the Fund’s actual expense ratio and an assumed rate of return of 5% per year before expenses, which is not the Fund’s actual return. The hypothetical account values and expenses may not be used to estimate the actual ending account balance or expenses you paid for the period. You may use this information to compare the ongoing costs of investing in the Fund and other funds. To do so, compare this 5% hypothetical example with the 5% hypothetical examples that appear in the shareholder reports of the other funds.
Please note that the expenses shown in the table are meant to highlight your ongoing costs only and do not reflect any transactional costs, such as sales charges (loads) and contingent deferred sales charges. Therefore, the “Hypothetical” line of the table is useful in comparing ongoing costs only and will not help you determine the relative total costs of owning different funds. In addition, if these transactional costs were included, your costs would have been higher.
| Beginning account value 5-1-2020 | Ending account value 10-31-2020 | Expenses paid during the period1 | Annualized net expense ratio | |||||||||||||
Class A | ||||||||||||||||
Actual | $ | 1,000.00 | $ | 1,107.73 | $ | 7.15 | 1.35 | % | ||||||||
Hypothetical (5% return before expenses) | $ | 1,000.00 | $ | 1,018.35 | $ | 6.85 | 1.35 | % | ||||||||
Class C | ||||||||||||||||
Actual | $ | 1,000.00 | $ | 1,103.70 | $ | 11.10 | 2.10 | % | ||||||||
Hypothetical (5% return before expenses) | $ | 1,000.00 | $ | 1,014.58 | $ | 10.63 | 2.10 | % | ||||||||
Administrator Class | ||||||||||||||||
Actual | $ | 1,000.00 | $ | 1,108.26 | $ | 6.52 | 1.23 | % | ||||||||
Hypothetical (5% return before expenses) | $ | 1,000.00 | $ | 1,018.95 | $ | 6.24 | 1.23 | % | ||||||||
Institutional Class | ||||||||||||||||
Actual | $ | 1,000.00 | $ | 1,110.20 | $ | 5.04 | 0.95 | % | ||||||||
Hypothetical (5% return before expenses) | $ | 1,000.00 | $ | 1,020.36 | $ | 4.82 | 0.95 | % | ||||||||
| 1 | Expenses paid is equal to the annualized net expense ratio of each class multiplied by the average account value over the period, multiplied by the number of days in the most recent fiscal half-year divided by the number of days in the fiscal year (to reflect the one-half-year period). |
10 | Wells Fargo Intrinsic World Equity Fund
Table of Contents
Portfolio of investments—October 31, 2020
| Shares | Value | |||||||||||||||
| Common Stocks: 99.55% | ||||||||||||||||
France: 4.57% | ||||||||||||||||
Air Liquide SA (Materials, Chemicals) | 19,400 | $ | 2,837,023 | |||||||||||||
Capgemini SE (Information Technology, IT Services) | 27,100 | 3,129,177 | ||||||||||||||
| 5,966,200 | ||||||||||||||||
|
| |||||||||||||||
| Germany: 2.71% | ||||||||||||||||
Deutsche Telekom AG (Communication Services, Diversified Telecommunication Services) | 154,300 | 2,345,167 | ||||||||||||||
SAP SE (Information Technology, Software) | 11,200 | 1,194,867 | ||||||||||||||
| 3,540,034 | ||||||||||||||||
|
| |||||||||||||||
| Hong Kong: 3.06% | ||||||||||||||||
AIA Group Limited (Financials, Insurance) | 297,200 | 2,828,504 | ||||||||||||||
Samsonite International SA (Consumer Discretionary, Textiles, Apparel & Luxury Goods) 144A† | 1,143,690 | 1,166,735 | ||||||||||||||
| 3,995,239 | ||||||||||||||||
|
| |||||||||||||||
| Ireland: 2.49% | ||||||||||||||||
Medtronic plc (Health Care, Health Care Equipment & Supplies) | 32,400 | 3,258,468 | ||||||||||||||
|
| |||||||||||||||
| Japan: 8.73% | ||||||||||||||||
Nidec Corporation (Industrials, Electrical Equipment) | 24,600 | 2,484,649 | ||||||||||||||
ORIX Corporation (Financials, Diversified Financial Services) | 154,000 | 1,801,066 | ||||||||||||||
Renesas Electronics Corporation (Information Technology, Semiconductors & Semiconductor Equipment) † | 391,700 | 3,233,345 | ||||||||||||||
Sony Corporation (Consumer Discretionary, Household Durables) | 46,540 | 3,879,873 | ||||||||||||||
| 11,398,933 | ||||||||||||||||
|
| |||||||||||||||
| Netherlands: 4.42% | ||||||||||||||||
AerCap Holdings NV (Industrials, Trading Companies & Distributors) † | 51,400 | 1,276,262 | ||||||||||||||
Airbus SE (Industrials, Aerospace & Defense) † | 23,400 | 1,712,085 | ||||||||||||||
Unilever NV (Consumer Staples, Personal Products) | 49,200 | 2,782,752 | ||||||||||||||
| 5,771,099 | ||||||||||||||||
|
| |||||||||||||||
| Switzerland: 5.21% | ||||||||||||||||
Nestle SA (Consumer Staples, Food Products) | 24,100 | 2,710,717 | ||||||||||||||
Novartis AG ADR (Health Care, Pharmaceuticals) | 27,200 | 2,123,776 | ||||||||||||||
Roche Holding AG (Health Care, Pharmaceuticals) | 6,150 | 1,976,188 | ||||||||||||||
| 6,810,681 | ||||||||||||||||
|
| |||||||||||||||
| United States: 68.36% | ||||||||||||||||
Advance Auto Parts Incorporated (Consumer Discretionary, Specialty Retail) | 16,500 | 2,430,120 | ||||||||||||||
Alphabet Incorporated Class C (Communication Services, Interactive Media & Services) † | 3,380 | 5,479,014 | ||||||||||||||
Amazon.com Incorporated (Consumer Discretionary, Internet & Direct Marketing Retail) † | 1,700 | 5,161,455 | ||||||||||||||
American International Group Incorporated (Financials, Insurance) | 65,900 | 2,075,191 | ||||||||||||||
Apple Incorporated (Information Technology, Technology Hardware, Storage & Peripherals) | 25,000 | 2,721,500 | ||||||||||||||
Bank of America Corporation (Financials, Banks) | 106,700 | 2,528,790 | ||||||||||||||
Chevron Corporation (Energy, Oil, Gas & Consumable Fuels) | 24,500 | 1,702,750 | ||||||||||||||
Cigna Corporation (Health Care, Health Care Providers & Services) | 18,200 | 3,038,854 | ||||||||||||||
Comcast Corporation Class A (Communication Services, Media) | 76,500 | 3,231,360 | ||||||||||||||
Dollar Tree Incorporated (Consumer Discretionary, Multiline Retail) † | 25,300 | 2,285,096 | ||||||||||||||
Eli Lilly & Company (Health Care, Pharmaceuticals) | 9,800 | 1,278,508 | ||||||||||||||
EOG Resources Incorporated (Energy, Oil, Gas & Consumable Fuels) | 20,000 | 684,800 | ||||||||||||||
Fiserv Incorporated (Information Technology, IT Services) † | 28,200 | 2,692,254 | ||||||||||||||
Honeywell International Incorporated (Industrials, Industrial Conglomerates) | 19,900 | 3,282,505 | ||||||||||||||
Intercontinental Exchange Incorporated (Financials, Capital Markets) | 33,000 | 3,115,200 | ||||||||||||||
The accompanying notes are an integral part of these financial statements.
Wells Fargo Intrinsic World Equity Fund | 11
Table of Contents
Portfolio of investments—October 31, 2020
| Shares | Value | |||||||||||||||
| United States (continued) | ||||||||||||||||
Marsh & McLennan Companies Incorporated (Financials, Insurance) | 22,500 | $ | 2,327,850 | |||||||||||||
Merck & Company Incorporated (Health Care, Pharmaceuticals) | 39,800 | 2,993,358 | ||||||||||||||
Microsoft Corporation (Information Technology, Software) | 33,500 | 6,782,745 | ||||||||||||||
Mondelez International Incorporated Class A (Consumer Staples, Food Products) | 54,100 | 2,873,792 | ||||||||||||||
Motorola Solutions Incorporated (Information Technology, Communications Equipment) | 22,700 | 3,587,962 | ||||||||||||||
Northrop Grumman Corporation (Industrials, Aerospace & Defense) | 10,900 | 3,159,038 | ||||||||||||||
ON Semiconductor Corporation (Information Technology, Semiconductors & Semiconductor Equipment) † | 174,400 | 4,375,696 | ||||||||||||||
PTC Incorporated (Information Technology, Software) † | 19,700 | 1,652,436 | ||||||||||||||
Stryker Corporation (Health Care, Health Care Equipment & Supplies) | 11,800 | 2,383,718 | ||||||||||||||
The Coca-Cola Company (Consumer Staples, Beverages) | 56,500 | 2,715,390 | ||||||||||||||
The Goldman Sachs Group Incorporated (Financials, Capital Markets) | 6,650 | 1,257,116 | ||||||||||||||
The Walt Disney Company (Communication Services, Entertainment) | 22,500 | 2,728,125 | ||||||||||||||
Truist Financial Corporation (Financials, Banks) | 51,000 | 2,148,120 | ||||||||||||||
Visa Incorporated Class A (Information Technology, IT Services) | 25,300 | 4,597,263 | ||||||||||||||
Vulcan Materials Company (Materials, Construction Materials) | 11,800 | 1,709,112 | ||||||||||||||
Waste Management Incorporated (Industrials, Commercial Services & Supplies) | 21,100 | 2,276,901 | ||||||||||||||
| 89,276,019 | ||||||||||||||||
|
| |||||||||||||||
Total Common Stocks (Cost $95,687,635) |
| 130,016,673 | ||||||||||||||
|
| |||||||||||||||
| Yield | ||||||||||||||||
| Short-Term Investments: 0.18% | ||||||||||||||||
Investment Companies: 0.18% |
| |||||||||||||||
Wells Fargo Government Money Market Fund Select Class (l)(u) | 0.03 | % | 232,422 | 232,422 | ||||||||||||
|
| |||||||||||||||
Total Short-Term Investments (Cost $232,422) |
| 232,422 | ||||||||||||||
|
| |||||||||||||||
| Total investments in securities (Cost $95,920,057) | 99.73 | % | 130,249,095 | |||||
Other assets and liabilities, net | 0.27 | 347,014 | ||||||
|
|
|
| |||||
| Total net assets | 100.00 | % | $ | 130,596,109 | ||||
|
|
|
| |||||
| 144A | The security may be resold in transactions exempt from registration, normally to qualified institutional buyers, pursuant to Rule 144A under the Securities Act of 1933. |
| † | Non-income-earning security |
| (l) | The issuer of the security is an affiliated person of the Fund as defined in the Investment Company Act of 1940. |
| (u) | The rate represents the 7-day annualized yield at period end. |
Abbreviations:
| ADR | American depositary receipt |
The accompanying notes are an integral part of these financial statements.
12 | Wells Fargo Intrinsic World Equity Fund
Table of Contents
Portfolio of investments—October 31, 2020
Investments in Affiliates
An affiliated investment is an investment in which the Fund owns at least 5% of the outstanding voting shares of the issuer or as a result of other relationships, such as the Fund and the issuer having the same investment manager. Transactions with issuers that were either affiliated persons of the Fund at the beginning of the period or the end of the period were as follows:
| Value, beginning of period | Purchases | Sales proceeds | Net realized gains (losses) | Net change in unrealized gains (losses) | Value, end of period | % of net assets | Shares, end of period | Income from affiliated securities | ||||||||||||||||||||||||||||
| Short-Term Investments | ||||||||||||||||||||||||||||||||||||
Investment Companies | ||||||||||||||||||||||||||||||||||||
Securities Lending Cash Investments LLC * | $ | 1,698,178 | $ | 15,784,730 | $ | (17,482,752 | ) | $ | (156 | ) | $ | 0 | $ | 0 | 0 | $ | 16,392 | # | ||||||||||||||||||
Wells Fargo Government Money Market Fund Select Class | 1,542,025 | 21,643,907 | (22,953,510 | ) | 0 | 0 | 232,422 | 232,422 | 4,530 | |||||||||||||||||||||||||||
|
|
|
|
|
|
|
|
|
| |||||||||||||||||||||||||||
| $ | (156 | ) | $ | 0 | $ | 232,422 | 0.18 | % | $ | 20,922 | ||||||||||||||||||||||||||
|
|
|
|
|
|
|
|
|
| |||||||||||||||||||||||||||
| * | No longer held at the end of the period |
| # | Amount shown represents income before fees and rebates. |
The accompanying notes are an integral part of these financial statements.
Wells Fargo Intrinsic World Equity Fund | 13
Table of Contents
Statement of assets and liabilities—October 31, 2020
Assets | ||||
Investments in unaffiliated securities, at value (cost $95,687,635) | $ | 130,016,673 | ||
Investments in affiliated securities, at value (cost $232,422) | 232,422 | |||
Foreign currency, at value (cost $78) | 81 | |||
Receivable for investments sold | 618,774 | |||
Receivable for Fund shares sold | 65,909 | |||
Receivable for dividends | 240,897 | |||
Prepaid expenses and other assets | 5,711 | |||
|
| |||
Total assets | 131,180,467 | |||
|
| |||
Liabilities | ||||
Payable for investments purchased | 312,539 | |||
Payable for Fund shares redeemed | 3,642 | |||
Overdraft due to custodian bank | 68,681 | |||
Management fee payable | 107,978 | |||
Administration fees payable | 24,442 | |||
Distribution fee payable | 486 | |||
Trustees’ fees and expenses payable | 2,817 | |||
Accrued expenses and other liabilities | 63,773 | |||
|
| |||
Total liabilities | 584,358 | |||
|
| |||
Total net assets | $ | 130,596,109 | ||
|
| |||
Net assets consist of | ||||
Paid-in capital | $ | 97,998,513 | ||
Total distributable earnings | 32,597,596 | |||
|
| |||
Total net assets | $ | 130,596,109 | ||
|
| |||
Computation of net asset value and offering price per share | ||||
Net assets – Class A | $ | 120,313,821 | ||
Shares outstanding – Class A1 | 5,907,749 | |||
Net asset value per share – Class A | $20.37 | |||
Maximum offering price per share – Class A2 | $21.61 | |||
Net assets – Class C | $ | 688,030 | ||
Shares outstanding – Class C1 | 35,528 | |||
Net asset value per share – Class C | $19.37 | |||
Net assets – Administrator Class | $ | 1,319,747 | ||
Shares outstanding – Administrator Class1 | 65,092 | |||
Net asset value per share – Administrator Class | $20.28 | |||
Net assets – Institutional Class | $ | 8,274,511 | ||
Shares outstanding – Institutional Class1 | 406,580 | |||
Net asset value per share – Institutional Class | $20.35 | |||
| 1 | The Fund has an unlimited number of authorized shares. |
| 2 | Maximum offering price is computed as 100/94.25 of net asset value. On investments of $50,000 or more, the offering price is reduced. |
The accompanying notes are an integral part of these financial statements.
14 | Wells Fargo Intrinsic World Equity Fund
Table of Contents
Statement of operations—year ended October 31, 2020
Investment income | ||||
Dividends (net of foreign withholding taxes of $127,815) | $ | 2,432,231 | ||
Income from affiliated securities | 10,715 | |||
|
| |||
Total investment income | 2,442,946 | |||
|
| |||
Expenses | ||||
Management fee | 1,174,126 | |||
Administration fees | ||||
Class A | 266,096 | |||
Class C | 1,858 | |||
Administrator Class | 1,878 | |||
Institutional Class | 11,818 | |||
Shareholder servicing fees | ||||
Class A | 316,395 | |||
Class C | 2,202 | |||
Administrator Class | 3,507 | |||
Distribution fee | ||||
Class C | 6,581 | |||
Custody and accounting fees | 33,571 | |||
Professional fees | 48,674 | |||
Registration fees | 64,615 | |||
Shareholder report expenses | 37,655 | |||
Trustees’ fees and expenses | 21,096 | |||
Other fees and expenses | 18,926 | |||
|
| |||
Total expenses | 2,008,998 | |||
Less: Fee waivers and/or expense reimbursements | ||||
Fund-level | (157,908 | ) | ||
Class A | (18,074 | ) | ||
Class C | (11 | ) | ||
Administrator Class | (652 | ) | ||
Institutional Class | (7,138 | ) | ||
|
| |||
Net expenses | 1,825,215 | |||
|
| |||
Net investment income | 617,731 | |||
|
| |||
Realized and unrealized gains (losses) on investments | ||||
Net realized losses on | ||||
Unaffiliated securities | (1,203,616 | ) | ||
Affiliated securities | (156 | ) | ||
|
| |||
Net realized losses on investments | (1,203,772 | ) | ||
Net change in unrealized gains (losses) on investments | (7,246,234 | ) | ||
|
| |||
Net realized and unrealized gains (losses) on investments | (8,450,006 | ) | ||
|
| |||
Net decrease in net assets resulting from operations | $ | (7,832,275 | ) | |
|
| |||
The accompanying notes are an integral part of these financial statements.
Wells Fargo Intrinsic World Equity Fund | 15
Table of Contents
Statement of changes in net assets
| Year ended October 31, 2020 | Year ended October 31, 2019 | |||||||||||||||
Operations | ||||||||||||||||
Net investment income | $ | 617,731 | $ | 1,199,906 | ||||||||||||
Net realized losses on investments | (1,203,772 | ) | (425,308 | ) | ||||||||||||
Net change in unrealized gains (losses) on investments | (7,246,234 | ) | 15,848,146 | |||||||||||||
|
| |||||||||||||||
Net increase (decrease) in net assets resulting from operations | (7,832,275 | ) | 16,622,744 | |||||||||||||
|
| |||||||||||||||
Distributions to shareholders from net investment income and net realized gains | ||||||||||||||||
Class A | (796,359 | ) | (14,576,126 | ) | ||||||||||||
Class C | 0 | (592,441 | ) | |||||||||||||
Administrator Class | (11,384 | ) | (175,917 | ) | ||||||||||||
Institutional Class | (97,694 | ) | (858,807 | ) | ||||||||||||
|
| |||||||||||||||
Total distributions to shareholders | (905,437 | ) | (16,203,291 | ) | ||||||||||||
|
| |||||||||||||||
Capital share transactions | Shares | Shares | ||||||||||||||
Proceeds from shares sold | ||||||||||||||||
Class A | 124,793 | 2,532,707 | 290,011 | 5,707,019 | ||||||||||||
Class C | 4,786 | 90,428 | 13,297 | 265,090 | ||||||||||||
Administrator Class | 3,569 | 77,486 | 1,768 | 36,870 | ||||||||||||
Institutional Class | 78,258 | 1,590,880 | 191,017 | 3,930,471 | ||||||||||||
|
| |||||||||||||||
| 4,291,501 | 9,939,450 | |||||||||||||||
|
| |||||||||||||||
Reinvestment of distributions | ||||||||||||||||
Class A | 34,667 | 776,905 | 748,086 | 14,204,308 | ||||||||||||
Class C | 0 | 0 | 30,481 | 552,615 | ||||||||||||
Administrator Class | 486 | 10,838 | 8,882 | 167,765 | ||||||||||||
Institutional Class | 2,761 | 61,615 | 33,977 | 643,675 | ||||||||||||
|
| |||||||||||||||
| 849,358 | 15,568,363 | |||||||||||||||
|
| |||||||||||||||
Payment for shares redeemed | ||||||||||||||||
Class A | (685,542 | ) | (13,844,519 | ) | (696,508 | ) | (14,099,229 | ) | ||||||||
Class C | (29,143 | ) | (549,471 | ) | (251,793 | ) | (4,719,953 | ) | ||||||||
Administrator Class | (10,868 | ) | (208,031 | ) | (14,119 | ) | (284,467 | ) | ||||||||
Institutional Class | (125,339 | ) | (2,482,104 | ) | (117,795 | ) | (2,393,973 | ) | ||||||||
|
| |||||||||||||||
| (17,084,125 | ) | (21,497,622 | ) | |||||||||||||
|
| |||||||||||||||
Net increase (decrease) in net assets resulting from capital share transactions | (11,943,266 | ) | 4,010,191 | |||||||||||||
|
| |||||||||||||||
Total increase (decrease) in net assets | (20,680,978 | ) | 4,429,644 | |||||||||||||
|
| |||||||||||||||
Net assets | ||||||||||||||||
Beginning of period | 151,277,087 | 146,847,443 | ||||||||||||||
|
| |||||||||||||||
End of period | $ | 130,596,109 | $ | 151,277,087 | ||||||||||||
|
| |||||||||||||||
The accompanying notes are an integral part of these financial statements.
16 | Wells Fargo Intrinsic World Equity Fund
Table of Contents
(For a share outstanding throughout each period)
| Year ended October 31 | ||||||||||||||||||||
| CLASS A | 2020 | 2019 | 2018 | 2017 | 2016 | |||||||||||||||
Net asset value, beginning of period | $21.57 | $21.70 | $23.08 | $19.53 | $22.82 | |||||||||||||||
Net investment income | 0.09 | 0.17 | 1 | 0.16 | 0.19 | 0.20 | ||||||||||||||
Net realized and unrealized gains (losses) on investments | (1.16 | ) | 2.09 | 0.35 | 4.54 | (0.83 | ) | |||||||||||||
|
|
|
|
|
|
|
|
|
| |||||||||||
Total from investment operations | (1.07 | ) | 2.26 | 0.51 | 4.73 | (0.63 | ) | |||||||||||||
Distributions to shareholders from | ||||||||||||||||||||
Net investment income | (0.13 | ) | (0.18 | ) | (0.20 | ) | (0.23 | ) | (0.20 | ) | ||||||||||
Net realized gains | 0.00 | (2.21 | ) | (1.69 | ) | (0.95 | ) | (2.46 | ) | |||||||||||
|
|
|
|
|
|
|
|
|
| |||||||||||
Total distributions to shareholders | (0.13 | ) | (2.39 | ) | (1.89 | ) | (1.18 | ) | (2.66 | ) | ||||||||||
Net asset value, end of period | $20.37 | $21.57 | $21.70 | $23.08 | $19.53 | |||||||||||||||
Total return2 | (5.08 | )% | 12.02 | % | 2.10 | % | 25.44 | % | (2.54 | )% | ||||||||||
Ratios to average net assets (annualized) | ||||||||||||||||||||
Gross expenses | 1.47 | % | 1.47 | % | 1.47 | % | 1.47 | % | 1.46 | % | ||||||||||
Net expenses | 1.34 | % | 1.35 | % | 1.35 | % | 1.35 | % | 1.37 | % | ||||||||||
Net investment income | 0.42 | % | 0.81 | % | 0.73 | % | 0.88 | % | 1.09 | % | ||||||||||
Supplemental data | ||||||||||||||||||||
Portfolio turnover rate | 32 | % | 13 | % | 20 | % | 21 | % | 23 | % | ||||||||||
Net assets, end of period (000s omitted) | $120,314 | $138,784 | $132,207 | $141,831 | $127,428 | |||||||||||||||
| 1 | Calculated based upon average shares outstanding |
| 2 | Total return calculations do not include any sales charges. |
The accompanying notes are an integral part of these financial statements.
Wells Fargo Intrinsic World Equity Fund | 17
Table of Contents
Financial highlights
(For a share outstanding throughout each period)
| Year ended October 31 | ||||||||||||||||||||
| CLASS C | 2020 | 2019 | 2018 | 2017 | 2016 | |||||||||||||||
Net asset value, beginning of period | $20.55 | $20.74 | $22.15 | $18.77 | $21.99 | |||||||||||||||
Net investment income (loss) | (0.06 | )1 | (0.04 | )1 | (0.00 | )1,2 | 0.03 | 1 | 0.05 | |||||||||||
Net realized and unrealized gains (losses) on investments | (1.12 | ) | 2.06 | 0.33 | 4.38 | (0.80 | ) | |||||||||||||
|
|
|
|
|
|
|
|
|
| |||||||||||
Total from investment operations | (1.18 | ) | 2.02 | 0.33 | 4.41 | (0.75 | ) | |||||||||||||
Distributions to shareholders from | ||||||||||||||||||||
Net investment income | 0.00 | (0.00 | )3 | (0.05 | ) | (0.08 | ) | (0.01 | ) | |||||||||||
Net realized gains | 0.00 | (2.21 | ) | (1.69 | ) | (0.95 | ) | (2.46 | ) | |||||||||||
|
|
|
|
|
|
|
|
|
| |||||||||||
Total distributions to shareholders | 0.00 | (2.21 | ) | (1.74 | ) | (1.03 | ) | (2.47 | ) | |||||||||||
Net asset value, end of period | $19.37 | $20.55 | $20.74 | $22.15 | $18.77 | |||||||||||||||
Total return4 | (5.74 | )% | 11.19 | % | 1.33 | % | 24.54 | % | (3.26 | )% | ||||||||||
Ratios to average net assets (annualized) | ||||||||||||||||||||
Gross expenses | 2.21 | % | 2.22 | % | 2.22 | % | 2.22 | % | 2.21 | % | ||||||||||
Net expenses | 2.10 | % | 2.10 | % | 2.10 | % | 2.10 | % | 2.12 | % | ||||||||||
Net investment income (loss) | (0.32 | )% | (0.18 | )% | (0.01 | )% | 0.13 | % | 0.32 | % | ||||||||||
Supplemental data | ||||||||||||||||||||
Portfolio turnover rate | 32 | % | 13 | % | 20 | % | 21 | % | 23 | % | ||||||||||
Net assets, end of period (000s omitted) | $688 | $1,231 | $5,556 | $7,015 | $7,252 | |||||||||||||||
| 1 | Calculated based upon average shares outstanding |
| 2 | Amount is more than $(0.005). |
| 3 | Amount is less than $0.005. |
| 4 | Total return calculations do not include any sales charges. |
The accompanying notes are an integral part of these financial statements.
18 | Wells Fargo Intrinsic World Equity Fund
Table of Contents
Financial highlights
(For a share outstanding throughout each period)
| Year ended October 31 | ||||||||||||||||||||
| ADMINISTRATOR CLASS | 2020 | 2019 | 2018 | 2017 | 2016 | |||||||||||||||
Net asset value, beginning of period | $21.48 | $21.60 | $22.98 | $19.43 | $22.76 | |||||||||||||||
Net investment income | 0.11 | 1 | 0.19 | 1 | 0.15 | 1 | 0.20 | 1 | 0.24 | 1 | ||||||||||
Net realized and unrealized gains (losses) on investments | (1.16 | ) | 2.08 | 0.39 | 4.54 | (0.84 | ) | |||||||||||||
|
|
|
|
|
|
|
|
|
| |||||||||||
Total from investment operations | (1.05 | ) | 2.27 | 0.54 | 4.74 | (0.60 | ) | |||||||||||||
Distributions to shareholders from | ||||||||||||||||||||
Net investment income | (0.15 | ) | (0.18 | ) | (0.23 | ) | (0.24 | ) | (0.27 | ) | ||||||||||
Net realized gains | 0.00 | (2.21 | ) | (1.69 | ) | (0.95 | ) | (2.46 | ) | |||||||||||
|
|
|
|
|
|
|
|
|
| |||||||||||
Total distributions to shareholders | (0.15 | ) | (2.39 | ) | (1.92 | ) | (1.19 | ) | (2.73 | ) | ||||||||||
Net asset value, end of period | $20.28 | $21.48 | $21.60 | $22.98 | $19.43 | |||||||||||||||
Total return | (4.99 | )% | 12.13 | % | 2.22 | % | 25.60 | % | (2.43 | )% | ||||||||||
Ratios to average net assets (annualized) | ||||||||||||||||||||
Gross expenses | 1.39 | % | 1.39 | % | 1.38 | % | 1.38 | % | 1.37 | % | ||||||||||
Net expenses | 1.23 | % | 1.25 | % | 1.25 | % | 1.25 | % | 1.22 | % | ||||||||||
Net investment income | 0.54 | % | 0.92 | % | 0.65 | % | 0.95 | % | 1.27 | % | ||||||||||
Supplemental data | ||||||||||||||||||||
Portfolio turnover rate | 32 | % | 13 | % | 20 | % | 21 | % | 23 | % | ||||||||||
Net assets, end of period (000s omitted) | $1,320 | $1,544 | $1,628 | $4,727 | $4,735 | |||||||||||||||
| 1 | Calculated based upon average shares outstanding |
The accompanying notes are an integral part of these financial statements.
Wells Fargo Intrinsic World Equity Fund | 19
Table of Contents
Financial highlights
(For a share outstanding throughout each period)
| Year ended October 31 | ||||||||||||||||||||
| INSTITUTIONAL CLASS | 2020 | 2019 | 2018 | 2017 | 2016 | |||||||||||||||
Net asset value, beginning of period | $21.55 | $21.69 | $23.05 | $19.51 | $22.83 | |||||||||||||||
Net investment income | 0.17 | 1 | 0.27 | 0.25 | 1 | 0.27 | 0.26 | |||||||||||||
Net realized and unrealized gains (losses) on investments | (1.16 | ) | 2.06 | 0.35 | 4.53 | (0.80 | ) | |||||||||||||
|
|
|
|
|
|
|
|
|
| |||||||||||
Total from investment operations | (0.99 | ) | 2.33 | 0.60 | 4.80 | (0.54 | ) | |||||||||||||
Distributions to shareholders from | ||||||||||||||||||||
Net investment income | (0.21 | ) | (0.26 | ) | (0.27 | ) | (0.31 | ) | (0.32 | ) | ||||||||||
Net realized gains | 0.00 | (2.21 | ) | (1.69 | ) | (0.95 | ) | (2.46 | ) | |||||||||||
|
|
|
|
|
|
|
|
|
| |||||||||||
Total distributions to shareholders | (0.21 | ) | (2.47 | ) | (1.96 | ) | (1.26 | ) | (2.78 | ) | ||||||||||
Net asset value, end of period | $20.35 | $21.55 | $21.69 | $23.05 | $19.51 | |||||||||||||||
Total return | (4.68 | )% | 12.49 | % | 2.52 | % | 25.92 | % | (2.13 | )% | ||||||||||
Ratios to average net assets (annualized) | ||||||||||||||||||||
Gross expenses | 1.14 | % | 1.14 | % | 1.14 | % | 1.14 | % | 1.13 | % | ||||||||||
Net expenses | 0.95 | % | 0.95 | % | 0.95 | % | 0.95 | % | 0.95 | % | ||||||||||
Net investment income | 0.83 | % | 1.21 | % | 1.10 | % | 1.28 | % | 1.47 | % | ||||||||||
Supplemental data | ||||||||||||||||||||
Portfolio turnover rate | 32 | % | 13 | % | 20 | % | 21 | % | 23 | % | ||||||||||
Net assets, end of period (000s omitted) | $8,275 | $9,718 | $7,456 | $6,681 | $4,357 | |||||||||||||||
| 1 | Calculated based upon average shares outstanding |
The accompanying notes are an integral part of these financial statements.
20 | Wells Fargo Intrinsic World Equity Fund
Table of Contents
1. ORGANIZATION
Wells Fargo Funds Trust (the “Trust”), a Delaware statutory trust organized on March 10, 1999, is an open-end management investment company registered under the Investment Company Act of 1940, as amended (the “1940 Act”). As an investment company, the Trust follows the accounting and reporting guidance in Financial Accounting Standards Board (“FASB”) Accounting Standards Codification Topic 946, Financial Services – Investment Companies. These financial statements report on the Wells Fargo Intrinsic World Equity Fund (the “Fund”) which is a diversified series of the Trust.
2. SIGNIFICANT ACCOUNTING POLICIES
The following significant accounting policies, which are consistently followed in the preparation of the financial statements of the Fund, are in conformity with U.S. generally accepted accounting principles which require management to make estimates and assumptions that affect the reported amounts of assets and liabilities, disclosure of contingent assets and liabilities at the date of the financial statements, and the reported amounts of revenues and expenses during the reporting period. Actual results could differ from those estimates.
Securities valuation
All investments are valued each business day as of the close of regular trading on the New York Stock Exchange (generally 4 p.m. Eastern Time), although the Fund may deviate from this calculation time under unusual or unexpected circumstances.
Equity securities that are listed on a foreign or domestic exchange or market are valued at the official closing price or, if none, the last sales price. If no sale occurs on the principal exchange or market that day, a fair value price will be determined in accordance with the Fund’s Valuation Procedures.
The values of securities denominated in foreign currencies are translated into U.S. dollars at rates provided by an independent foreign currency pricing source at a time each business day specified by the Wells Fargo Asset Management Pricing Committee at Wells Fargo Funds Management, LLC (“Funds Management”).
Many securities markets and exchanges outside the U.S. close prior to the close of the New York Stock Exchange and therefore may not fully reflect trading or events that occur after the close of the principal exchange in which the foreign securities are traded, but before the close of the New York Stock Exchange. If such trading or events are expected to materially affect the value of such securities, then fair value pricing procedures approved by the Board of Trustees of the Fund are applied. These procedures take into account multiple factors including movements in U.S. securities markets after foreign exchanges close. Foreign securities that are fair valued under these procedures are categorized as Level 2 and the application of these procedures may result in transfers between Level 1 and Level 2. Depending on market activity, such fair valuations may be frequent. Such fair value pricing may result in net asset values that are higher or lower than net asset values based on the last reported sales price or latest quoted bid price. On October 31, 2020, such fair value pricing was used in pricing certain foreign securities.
Investments in registered open-end investment companies are valued at net asset value. Interests in non-registered investment companies that are redeemable at net asset value are fair valued normally at net asset value.
Investments which are not valued using any of the methods discussed above are valued at their fair value, as determined in good faith by the Board of Trustees. The Board of Trustees has established a Valuation Committee comprised of the Trustees and has delegated to it the authority to take any actions regarding the valuation of portfolio securities that the Valuation Committee deems necessary or appropriate, including determining the fair value of portfolio securities, unless the determination has been delegated to the Wells Fargo Asset Management Pricing Committee. The Board of Trustees retains the authority to make or ratify any valuation decisions or approve any changes to the Valuation Procedures as it deems appropriate. On a quarterly basis, the Board of Trustees receives reports on any valuation actions taken by the Valuation Committee or the Wells Fargo Asset Management Pricing Committee which may include items for ratification.
Foreign currency translation
The accounting records of the Fund are maintained in U.S. dollars. The values of other assets and liabilities denominated in foreign currencies are translated into U.S. dollars at rates provided by an independent foreign currency pricing source at a time each business day specified by the Wells Fargo Asset Management Pricing Committee. Purchases and sales of securities, and income and expenses are converted at the rate of exchange on the respective dates of such transactions. Net realized foreign exchange gains or losses arise from sales of foreign currencies, currency gains or losses realized between the trade and settlement dates on securities transactions, and the difference between the amounts of dividends, interest and foreign withholding taxes recorded and the U.S. dollar equivalent of the amounts actually paid or received. Net unrealized foreign exchange gains and losses arise from changes in the fair value of assets and liabilities other than investments in securities resulting from changes in exchange rates. The changes in net assets arising from changes in exchange rates of securities and the changes in net assets resulting from changes in market prices of securities are not separately presented. Such changes are included in net realized and unrealized gains or losses from investments.
Wells Fargo Intrinsic World Equity Fund | 21
Table of Contents
Notes to financial statements
Securities lending
The Fund may lend its securities from time to time in order to earn additional income in the form of fees or interest on securities received as collateral or the investment of any cash received as collateral. When securities are on loan, the Fund receives interest or dividends on those securities. Cash collateral received in connection with its securities lending transactions is invested in Securities Lending Cash Investments, LLC (the “Securities Lending Fund”). Investments in Securities Lending Fund are valued at the evaluated bid price provided by an independent pricing service. Income earned from investment in the Securities Lending Fund (net of fees and rebates), if any, is included in income from affiliated securities on the Statement of Operations.
In a securities lending transaction, the net asset value of the Fund is affected by an increase or decrease in the value of the securities loaned and by an increase or decrease in the value of the instrument in which collateral is invested. The amount of securities lending activity undertaken by the Fund fluctuates from time to time. The Fund has the right under the lending agreement to recover the securities from the borrower on demand. In the event of default or bankruptcy by the borrower, the Fund may be prevented from recovering the loaned securities or gaining access to the collateral or may experience delays or costs in doing so. In such an event, the terms of the agreement allow the unaffiliated securities lending agent to use the collateral to purchase replacement securities on behalf of the Fund or pay the Fund the market value of the loaned securities. The Fund bears the risk of loss with respect to depreciation of its investment of the cash collateral.
Security transactions and income recognition
Securities transactions are recorded on a trade date basis. Realized gains or losses are recorded on the basis of identified cost.
Dividend income is recognized on the ex-dividend date, except for certain dividends from foreign securities, which are recorded as soon as the custodian verifies the ex-dividend date. Dividend income from foreign securities is recorded net of foreign taxes withheld where recovery of such taxes is not assured.
Distributions to shareholders
Distributions to shareholders from net investment income and any net realized gains are recorded on the ex-dividend date and paid at least annually. Such distributions are determined in accordance with income tax regulations and may differ from U.S. generally accepted accounting principles. Dividend sources are estimated at the time of declaration. The tax character of distributions is determined as of the Fund’s fiscal year end. Therefore, a portion of the Fund’s distributions made prior to the Fund’s fiscal year end may be categorized as a tax return of capital at year end.
Federal and other taxes
The Fund intends to continue to qualify as a regulated investment company by distributing substantially all of its investment company taxable income and any net realized capital gains (after reduction for capital loss carryforwards) sufficient to relieve it from all, or substantially all, federal income taxes. Accordingly, no provision for federal income taxes was required.
The Fund’s income and federal excise tax returns and all financial records supporting those returns for the prior three fiscal years are subject to examination by the federal and Delaware revenue authorities. Management has analyzed the Fund’s tax positions taken on federal, state, and foreign tax returns for all open tax years and does not believe that there are any uncertain tax positions that require recognition of a tax liability.
As of October 31, 2020, the aggregate cost of all investments for federal income tax purposes was $96,027,329 and the unrealized gains (losses) consisted of:
Gross unrealized gains | $ | 41,669,155 | ||
Gross unrealized losses | (7,447,389 | ) | ||
Net unrealized gains | $ | 34,221,766 | ||
As of October 31, 2020, the Fund had capital loss carryforwards which consist of $1,765,120 in short-term capital losses.
Class allocations
The separate classes of shares offered by the Fund differ principally in applicable sales charges, distribution, shareholder servicing, and administration fees. Class specific expenses are charged directly to that share class. Investment income, common fund-level expenses, and realized and unrealized gains (losses) on investments are allocated daily to each class of shares based on the relative proportion of net assets of each class.
22 | Wells Fargo Intrinsic World Equity Fund
Table of Contents
Notes to financial statements
3. FAIR VALUATION MEASUREMENTS
Fair value measurements of investments are determined within a framework that has established a fair value hierarchy based upon the various data inputs utilized in determining the value of the Fund’s investments. The three-level hierarchy gives the highest priority to unadjusted quoted prices in active markets for identical assets or liabilities (Level 1) and the lowest priority to unobservable inputs (Level 3). The Fund’s investments are classified within the fair value hierarchy based on the lowest level of input that is significant to the fair value measurement. The inputs are summarized into three broad levels as follows:
| ∎ | Level 1 – quoted prices in active markets for identical securities |
| ∎ | Level 2 – other significant observable inputs (including quoted prices for similar securities, interest rates, prepayment speeds, credit risk, etc.) |
| ∎ | Level 3 – significant unobservable inputs (including the Fund’s own assumptions in determining the fair value of investments) |
The inputs or methodologies used for valuing investments in securities are not necessarily an indication of the risk associated with investing in those securities.
The following is a summary of the inputs used in valuing the Fund’s assets and liabilities as of October 31, 2020:
Quoted prices (Level 1) | Other significant observable inputs (Level 2) | Significant unobservable inputs (Level 3) | Total | |||||||||||||
Assets | ||||||||||||||||
Investments in: | ||||||||||||||||
Common stocks | ||||||||||||||||
France | $ | 0 | $ | 5,966,200 | $ | 0 | $ | 5,966,200 | ||||||||
Germany | 0 | 3,540,034 | 0 | 3,540,034 | ||||||||||||
Hong Kong | 0 | 3,995,239 | 0 | 3,995,239 | ||||||||||||
Ireland | 3,258,468 | 0 | 0 | 3,258,468 | ||||||||||||
Japan | 0 | 11,398,933 | 0 | 11,398,933 | ||||||||||||
Netherlands | 4,059,014 | 1,712,085 | 0 | 5,771,099 | ||||||||||||
Switzerland | 2,123,776 | 4,686,905 | 0 | 6,810,681 | ||||||||||||
United States | 89,276,019 | 0 | 0 | 89,276,019 | ||||||||||||
Short-term investments | ||||||||||||||||
Investment companies | 232,422 | 0 | 0 | 232,422 | ||||||||||||
Total assets | $ | 98,949,699 | $ | 31,299,396 | $ | 0 | $ | 130,249,095 | ||||||||
Additional sector, industry or geographic detail is included in the Portfolio of Investments.
For the year ended October 31, 2020, the Fund did not have any transfers into/out of Level 3.
4. TRANSACTIONS WITH AFFILIATES
Management fee
Funds Management, an indirect wholly owned subsidiary of Wells Fargo & Company (“Wells Fargo”), is the manager of the Fund and provides advisory and fund-level administrative services under an investment management agreement. Under the investment management agreement, Funds Management is responsible for, among other services, implementing the investment objectives and strategies of the Fund, supervising the subadviser and providing fund-level administrative services in connection with the Fund’s operations. As compensation for its services under the investment management agreement, Funds Management is entitled to receive a management fee at the following annual rate based on the Fund’s average daily net assets:
| Average daily net assets | Management fee | |||
First $500 million | 0.850 | % | ||
Next $500 million | 0.800 | |||
Next $1 billion | 0.750 | |||
Next $2 billion | 0.725 | |||
Next $1 billion | 0.700 | |||
Next $5 billion | 0.690 | |||
Over $10 billion | 0.680 | |||
Wells Fargo Intrinsic World Equity Fund | 23
Table of Contents
Notes to financial statements
For the year ended October 31, 2020, the management fee was equivalent to an annual rate of 0.85% of the Fund’s average daily net assets.
Funds Management has retained the services of a subadviser to provide daily portfolio management to the Fund. The fee for subadvisory services is borne by Funds Management. Wells Capital Management Incorporated (“WellsCap”), an affiliate of Funds Management and an indirect wholly owned subsidiary of Wells Fargo, is the subadviser to the Fund and is entitled to receive a fee from Funds Management at an annual rate starting at 0.35% and declining to 0.20% as the average daily net assets of the Fund increase.
Administration fees
Under a class-level administration agreement, Funds Management provides class-level administrative services to the Fund, which includes paying fees and expenses for services provided by the transfer agent, sub-transfer agents, omnibus account servicers and record-keepers. As compensation for its services under the class-level administration agreement, Funds Management receives an annual fee which is calculated based on the average daily net assets of each class as follows:
Class-level administration fee | ||||
Class A, Class C | 0.21 | % | ||
Administrator Class, Institutional Class | 0.13 | |||
Waivers and/or expense reimbursements
Funds Management has contractually waived and/or reimbursed management and administration fees to the extent necessary to maintain certain net operating expense ratios for the Fund. When each class of the Fund has exceeded its expense cap, Funds Management has waived fees and/or reimbursed expenses from fund-level expenses on a proportionate basis and then from class specific expenses. When only certain classes exceed their expense caps, waivers and/or reimbursements are applied against class specific expenses before fund-level expenses. Funds Management has committed through February 28, 2021 to waive fees and/or reimburse expenses to the extent necessary to cap the Fund’s expenses at 1.35% for Class A shares, 2.10% for Class C shares, 1.25% for Administrator Class shares, and 0.95% for Institutional Class shares. Prior to or after the commitment expiration date, the cap may be increased or the commitment to maintain the cap may be terminated only with the approval of the Board of Trustees.
Distribution fee
The Trust has adopted a distribution plan for Class C shares of the Fund pursuant to Rule 12b-1 under the 1940 Act. A distribution fee is charged to Class C shares and paid to Wells Fargo Funds Distributor, LLC (“Funds Distributor”), the principal underwriter, at an annual rate of 0.75% of the average daily net assets of Class C shares.
In addition, Funds Distributor is entitled to receive the front-end sales charge from the purchase of Class A shares and a contingent deferred sales charge on the redemption of certain Class A shares. Funds Distributor is also entitled to receive the contingent deferred sales charges from redemptions of Class C shares. For the year ended October 31, 2020, Funds Distributor received $2,857 from the sale of Class A shares and $52 in contingent deferred sales charges from redemptions of Class A shares, respectively. No contingent deferred sales charges were incurred by Class C shares for the year ended October 31, 2020.
Shareholder servicing fees
The Trust has entered into contracts with one or more shareholder servicing agents, whereby Class A, Class C, and Administrator Class of the Fund are charged a fee at an annual rate of 0.25% of the average daily net assets of each respective class. A portion of these total shareholder servicing fees were paid to affiliates of Wells Fargo.
Interfund transactions
The Fund may purchase or sell portfolio investment securities to certain other Wells Fargo affiliates pursuant to Rule 17a-7 under the 1940 Act and under procedures adopted by the Board of Trustees. The procedures have been designed to ensure that these interfund transactions, which do not incur broker commissions, are effected at current market prices.
5. INVESTMENT PORTFOLIO TRANSACTIONS
Purchases and sales of investments, excluding U.S. government obligations (if any) and short-term securities, for the year ended October 31, 2020 were $43,815,089 and $55,031,974, respectively.
24 | Wells Fargo Intrinsic World Equity Fund
Table of Contents
Notes to financial statements
6. SECURITIES LENDING TRANSACTIONS
The Fund lends its securities through an unaffiliated securities lending agent and receives collateral in the form of cash or securities with a value at least equal to the value of the securities on loan. The value of the loaned securities is determined at the close of each business day and any increases or decreases in the required collateral are exchanged between the Fund and the counterparty on the next business day. Cash collateral received is invested in the Securities Lending Fund which seeks to provide a positive return compared to the daily Federal Funds Open Rate by investing in high-quality, U.S. dollar-denominated short-term money market instruments and is exempt from registration under Section 3(c)(7) of the 1940 Act. Securities Lending Fund is managed by Funds Management and is subadvised by WellsCap. Funds Management receives an advisory fee starting at 0.05% and declining to 0.01% as the average daily net assets of the Securities Lending Fund increase. All of the fees received by Funds Management are paid to WellsCap for its services as subadviser.
In the event of counterparty default or the failure of a borrower to return a loaned security, the Fund has the right to use the collateral to offset any losses incurred. As of October 31, 2020, the Fund did not have any securities on loan.
7. BANK BORROWINGS
The Trust (excluding the money market funds), Wells Fargo Master Trust and Wells Fargo Variable Trust are parties to a $350,000,000 revolving credit agreement whereby the Fund is permitted to use bank borrowings for temporary or emergency purposes, such as to fund shareholder redemption requests. Interest under the credit agreement is charged to the Fund based on a borrowing rate equal to the higher of the Federal Funds rate in effect on that day plus 1.25% or the overnight LIBOR rate in effect on that day plus 1.25%. In addition, an annual commitment fee equal to 0.25% of the unused balance is allocated to each participating fund.
For the year ended October 31, 2020, there were no borrowings by the Fund under the agreement.
8. DISTRIBUTIONS TO SHAREHOLDERS
The tax character of distributions paid during the years ended October 31, 2020 and October 31, 2019 were as follows:
| Year ended October 31 | ||||||||
| 2020 | 2019 | |||||||
Ordinary income | $ | 905,437 | $ | 1,827,305 | ||||
Long-term capital gain | 0 | 14,375,986 | ||||||
As of October 31, 2020, the components of distributable earnings on a tax basis were as follows:
| Undistributed ordinary income | Unrealized gains | Capital loss carryforward | ||
$139,044 | $34,230,542 | $(1,765,120) | ||
9. CONCENTRATION RISK
Concentration risks result from exposure to a limited number of sectors. As of the end of the period, the Fund concentrated its portfolio in investments related to the information technology sector. A fund that invests a substantial portion of its assets in any sector may be more affected by changes in that sector than would be a fund whose investments are not heavily weighted in any sector.
10. INDEMNIFICATION
Under the Fund’s organizational documents, the officers and Trustees have been granted certain indemnification rights against certain liabilities that may arise out of performance of their duties to the Fund. The Fund has entered into a separate agreement with each Trustee that converts indemnification rights currently existing under the Fund’s organizational documents into contractual rights that cannot be changed in the future without the consent of the Trustee. Additionally, in the normal course of business, the Fund may enter into contracts with service providers that contain a variety of indemnification clauses. The Fund’s maximum exposure under these arrangements is dependent on future claims that may be made against the Fund and, therefore, cannot be estimated.
Wells Fargo Intrinsic World Equity Fund | 25
Table of Contents
Notes to financial statements
11. NEW ACCOUNTING PRONOUNCEMENT
In August 2018, FASB issued Accounting Standards Update (“ASU”) No. 2018-13, Fair Value Measurement (Topic 820) Disclosure Framework—Changes to the Disclosure Requirements for Fair Value Measurement. ASU 2018-13 updates the disclosure requirements on fair value measurements in Topic 820, Fair Value Measurements. The amendments are effective for fiscal years, and interim periods within those fiscal years, beginning after December 15, 2019. Management has adopted this guidance which did not have a material impact on the financial statements.
12. CORONAVIRUS (COVID-19) PANDEMIC
On March 11, 2020, the World Health Organization announced that it had made the assessment that coronavirus disease 2019 (“COVID-19”) is a pandemic. The impacts of COVID-19 are adversely affecting the entire global economy, individual companies and investment products, and the market in general. There is significant uncertainty around the extent and duration of business disruptions related to COVID-19 and the impacts may be short term or may last for an extended period of time. The risk of further spreading of COVID-19 has led to significant uncertainty and volatility in the financial markets.
26 | Wells Fargo Intrinsic World Equity Fund
Table of Contents
Report of independent registered public accounting firm
To the Shareholders of the Fund and Board of Trustees
Wells Fargo Funds Trust:
Opinion on the Financial Statements
We have audited the accompanying statement of assets and liabilities of Wells Fargo Intrinsic World Equity Fund (the Fund), one of the funds constituting Wells Fargo Funds Trust, including the portfolio of investments, as of October 31, 2020, the related statement of operations for the year then ended, the statements of changes in net assets for each of the years in the two-year period then ended, and the related notes (collectively, the financial statements) and the financial highlights for each of the years in the five-year period then ended. In our opinion, the financial statements and financial highlights present fairly, in all material respects, the financial position of the Fund as of October 31, 2020, the results of its operations for the year then ended, the changes in its net assets for each of the years in the two-year period then ended, and the financial highlights for each of the years in the five-year period then ended, in conformity with U.S. generally accepted accounting principles.
Basis for Opinion
These financial statements and financial highlights are the responsibility of the Fund’s management. Our responsibility is to express an opinion on these financial statements and financial highlights based on our audits. We are a public accounting firm registered with the Public Company Accounting Oversight Board (United States) (PCAOB) and are required to be independent with respect to the Fund in accordance with the U.S. federal securities laws and the applicable rules and regulations of the Securities and Exchange Commission and the PCAOB.
We conducted our audits in accordance with the standards of the PCAOB. Those standards require that we plan and perform the audit to obtain reasonable assurance about whether the financial statements and financial highlights are free of material misstatement, whether due to error or fraud. Our audits included performing procedures to assess the risks of material misstatement of the financial statements and financial highlights, whether due to error or fraud, and performing procedures that respond to those risks. Such procedures included examining, on a test basis, evidence regarding the amounts and disclosures in the financial statements and financial highlights. Such procedures also included confirmation of securities owned as of October 31, 2020, by correspondence with the custodian, transfer agent and brokers, or by other appropriate auditing procedures. Our audits also included evaluating the accounting principles used and significant estimates made by management, as well as evaluating the overall presentation of the financial statements and financial highlights. We believe that our audits provide a reasonable basis for our opinion.

We have not been able to determine the specific year that we began serving as the auditor of one or more Wells Fargo Funds investment companies; however we are aware that we have served as the auditor of one or more Wells Fargo Funds investment companies since at least 1955.
Boston, Massachusetts
December 22, 2020
Wells Fargo Intrinsic World Equity Fund | 27
Table of Contents
TAX INFORMATION
For corporate shareholders, pursuant to Section 854 of the Internal Revenue Code, 100% of ordinary income dividends qualify for the corporate dividends-received deduction for the fiscal year ended October 31, 2020.
Pursuant to Section 854 of the Internal Revenue Code, $905,437 of income dividends paid during the fiscal year ended October 31, 2020 has been designated as qualified dividend income (QDI).
PROXY VOTING INFORMATION
A description of the policies and procedures used to determine how to vote proxies relating to portfolio securities is available, upon request, by calling 1-800-222-8222, visiting our website at wfam.com, or visiting the SEC website at sec.gov. Information regarding how the proxies related to portfolio securities were voted during the most recent 12-month period ended June 30 is available on the website at wfam.com or by visiting the SEC website at sec.gov.
QUARTERLY PORTFOLIO HOLDINGS INFORMATION
The Fund files its complete schedule of portfolio holdings with the SEC for the first and third quarters of each fiscal year as an exhibit to its reports on Form N-PORT. Shareholders may view the filed Form N-PORT by visiting the SEC website at sec.gov.
28 | Wells Fargo Intrinsic World Equity Fund
Table of Contents
Other information (unaudited)
BOARD OF TRUSTEES AND OFFICERS
Each of the Trustees and Officers1 listed in the table below acts in identical capacities for each fund in the Wells Fargo family of funds, which consists of 144 mutual funds comprising the Wells Fargo Funds Trust, Wells Fargo Variable Trust, Wells Fargo Master Trust and four closed-end funds (collectively the “Fund Complex”). This table should be read in conjunction with the Prospectus and the Statement of Additional Information2. The mailing address of each Trustee and Officer is 525 Market Street, 12th Floor, San Francisco, CA 94105. Each Trustee and Officer serves an indefinite term, however, each Trustee serves such term until reaching the mandatory retirement age established by the Trustees.
Independent Trustees
Name and year of birth | Position held and length of service* | Principal occupations during past five years or longer | Current other public company or investment company directorships | |||
William R. Ebsworth (Born 1957) | Trustee, since 2015 | Retired. From 1984 to 2013, equities analyst, portfolio manager, research director and chief investment officer at Fidelity Management and Research Company in Boston, Tokyo, and Hong Kong, and retired in 2013 as Chief Investment Officer of Fidelity Strategic Advisers, Inc. where he led a team of investment professionals managing client assets. Prior thereto, Board member of Hong Kong Securities Clearing Co., Hong Kong Options Clearing Corp., the Thailand International Fund, Ltd., Fidelity Investments Life Insurance Company, and Empire Fidelity Investments Life Insurance Company. Audit Committee Chair and Investment Committee Chair of the Vincent Memorial Hospital Endowment (non-profit organization). Mr. Ebsworth is a CFA® charterholder. | N/A | |||
Jane A. Freeman (Born 1953) | Trustee, since 2015; Chair Liaison, since 2018 | Retired. From 2012 to 2014 and 1999 to 2008, Chief Financial Officer of Scientific Learning Corporation. From 2008 to 2012, Ms. Freeman provided consulting services related to strategic business projects. Prior to 1999, Portfolio Manager at Rockefeller & Co. and Scudder, Stevens & Clark. Board member of the Harding Loevner Funds from 1996 to 2014, serving as both Lead Independent Director and chair of the Audit Committee. Board member of the Russell Exchange Traded Funds Trust from 2011 to 2012 and the chair of the Audit Committee. Ms. Freeman is also an inactive Chartered Financial Analyst. | N/A | |||
Isaiah Harris, Jr. (Born 1952) | Trustee, since 2009; Audit Committee Chair, since 2019 | Retired. Chairman of the Board of CIGNA Corporation since 2009, and Director since 2005. From 2003 to 2011, Director of Deluxe Corporation. Prior thereto, President and CEO of BellSouth Advertising and Publishing Corp. from 2005 to 2007, President and CEO of BellSouth Enterprises from 2004 to 2005 and President of BellSouth Consumer Services from 2000 to 2003. Emeritus member of the Iowa State University Foundation Board of Governors. Emeritus Member of the Advisory Board of Iowa State University School of Business. Advisory Board Member, Palm Harbor Academy (private school). Mr. Harris is a certified public accountant (inactive status). | CIGNA Corporation | |||
Judith M. Johnson (Born 1949) | Trustee, since 2008 | Retired. Prior thereto, Chief Executive Officer and Chief Investment Officer of Minneapolis Employees Retirement Fund from 1996 to 2008. Ms. Johnson is an attorney, certified public accountant and a certified managerial accountant. | N/A | |||
David F. Larcker (Born 1950) | Trustee, since 2009 | James Irvin Miller Professor of Accounting at the Graduate School of Business (Emeritus), Stanford University, Director of the Corporate Governance Research Initiative and Senior Faculty of The Rock Center for Corporate Governance since 2006. From 2005 to 2008, Professor of Accounting at the Graduate School of Business, Stanford University. Prior thereto, Ernst & Young Professor of Accounting at The Wharton School, University of Pennsylvania from 1985 to 2005. | N/A | |||
Wells Fargo Intrinsic World Equity Fund | 29
Table of Contents
Other information (unaudited)
Name and year of birth | Position held and length of service* | Principal occupations during past five years or longer | Current other public company or investment company directorships | |||
Olivia S. Mitchell (Born 1953) | Trustee, since 2006; Nominating and Governance Committee Chair, since 2018 | International Foundation of Employee Benefit Plans Professor, Wharton School of the University of Pennsylvania since 1993. Director of Wharton’s Pension Research Council and Boettner Center on Pensions & Retirement Research, and Research Associate at the National Bureau of Economic Research. Previously, Cornell University Professor from 1978 to 1993. | N/A | |||
Timothy J. Penny (Born 1951) | Trustee, since 1996; Chair, since 2018 | President and Chief Executive Officer of Southern Minnesota Initiative Foundation, a non-profit organization, since 2007. Member of the Board of Trustees of NorthStar Education Finance, Inc., a non-profit organization, since 2007. | N/A | |||
James G. Polisson (Born 1959) | Trustee, since 2018 | Retired. Chief Marketing Officer, Source (ETF) UK Services, Ltd, from 2015 to 2017. From 2012 to 2015, Principal of The Polisson Group, LLC, a management consulting, corporate advisory and principal investing company. Chief Executive Officer and Managing Director at Russell Investments, Global Exchange Traded Funds from 2010 to 2012. Managing Director of Barclays Global Investors from 1998 to 2010 and Global Chief Marketing Officer for iShares and Barclays Global Investors from 2000 to 2010. Trustee of the San Francisco Mechanics’ Institute, a non-profit organization, from 2013 to 2015. Board member of the Russell Exchange Traded Fund Trust from 2011 to 2012. Director of Barclays Global Investors Holdings Deutschland GmbH from 2006 to 2009. Mr. Polisson is an attorney and has a retired status with the Massachusetts and District of Columbia Bar Associations. | N/A | |||
Pamela Wheelock (Born 1959) | Trustee, since January 2020; previously Trustee from January 2018 to July 2019 | Board member of the Destination Medical Center Economic Development Agency, Rochester, Minnesota since 2019. Interim President of the McKnight Foundation from January to September 2020. Acting Commissioner, Minnesota Department of Human Services, July 2019 through September 2019. Human Services Manager (part-time), Minnesota Department of Human Services, October 2019 through December 2019. Chief Operating Officer, Twin Cities Habitat for Humanity from 2017 to 2019. Vice President of University Services, University of Minnesota from 2012 to 2016. Prior thereto, on the Board of Directors, Governance Committee and Finance Committee for the Minnesota Philanthropy Partners (Saint Paul Foundation) from 2012 to 2018, Interim Chief Executive Officer of Blue Cross Blue Shield of Minnesota from 2011 to 2012, Chairman of the Board from 2009 to 2012 and Board Director from 2003 to 2015. Vice President, Leadership and Community Engagement, Bush Foundation, Saint Paul, Minnesota (a private foundation) from 2009 to 2011. Executive Vice President and Chief Financial Officer, Minnesota Sports and Entertainment from 2004 to 2009 and Senior Vice President from 2002 to 2004. Executive Vice President of the Minnesota Wild Foundation from 2004 to 2008. Commissioner of Finance, State of Minnesota, from 1999 to 2002. Currently Board Chair of the Minnesota Wild Foundation since 2010. | N/A | |||
| * | Length of service dates reflect the Trustee’s commencement of service with the Trust’s predecessor entities, where applicable. |
30 | Wells Fargo Intrinsic World Equity Fund
Table of Contents
Other information (unaudited)
Officers
Name and year of birth | Position held and length of service | Principal occupations during past five years or longer | ||
Andrew Owen (Born 1960) | President, since 2017 | Executive Vice President of Wells Fargo & Company and Head of Affiliated Managers, Wells Fargo Asset Management, since 2014. In addition, Mr. Owen is currently President, Chief Executive Officer and Director of Wells Fargo Funds Management, LLC since 2017. Prior thereto, Executive Vice President responsible for marketing, investments and product development for Wells Fargo Funds Management, LLC, from 2009 to 2014. | ||
Jeremy DePalma1 (Born 1974) | Treasurer, since 2012 | Senior Vice President of Wells Fargo Funds Management, LLC since 2009. Senior Vice President of Evergreen Investment Management Company, LLC from 2008 to 2010 and head of the Fund Reporting and Control Team within Fund Administration from 2005 to 2010. | ||
Michelle Rhee (Born 1966) | Chief Legal Officer, since 2019 | Secretary of Wells Fargo Funds Management, LLC and Chief Legal Counsel of Wells Fargo Asset Management since 2018. Deputy General Counsel of Wells Fargo Bank, N.A. since 2020 and Assistant General Counsel of Wells Fargo Bank, N.A. from 2018 to 2020. Associate General Counsel and Managing Director of Bank of America Corporation from 2004 to 2018. | ||
Catherine Kennedy (Born 1969) | Secretary, since 2019 | Vice President of Wells Fargo Funds Management, LLC and Senior Counsel of the Wells Fargo Legal Department since 2010. Vice President and Senior Counsel of Evergreen Investment Management Company, LLC from 1998 to 2010. | ||
Michael H. Whitaker (Born 1967) | Chief Compliance Officer, since 2016 | Chief Compliance Officer of Wells Fargo Asset Management since 2016. Senior Vice President and Chief Compliance Officer for Fidelity Investments from 2007 to 2016. | ||
| 1 | Jeremy DePalma acts as Treasurer of 77 funds in the Fund Complex. |
| 2 | The Statement of Additional Information includes additional information about the Trustees and is available, without charge, upon request, by calling 1-800-222-8222 or by visiting the website at wfam.com. |
Wells Fargo Intrinsic World Equity Fund | 31
Table of Contents
Other information (unaudited)
BOARD CONSIDERATION OF INVESTMENT MANAGEMENT AND SUB-ADVISORY AGREEMENTS:
Wells Fargo Intrinsic World Equity Fund
Under the Investment Company Act of 1940 (the “1940 Act”), the Board of Trustees (the “Board”) of Wells Fargo Funds Trust (the “Trust”) must determine annually whether to approve the continuation of the Trust’s investment management and sub-advisory agreements. In this regard, at a Board meeting held on May 26, 2020 and May 28, 2020 (together, the “Meeting”), the Board, all the members of which have no direct or indirect interest in the investment management and sub-advisory agreements and are not “interested persons” of the Trust, as defined in the 1940 Act (the “Independent Trustees”), reviewed and approved for Wells Fargo Intrinsic World Equity Fund (the “Fund”): (i) an investment management agreement (the “Management Agreement”) with Wells Fargo Funds Management, LLC (“Funds Management”); and (ii) an investment sub-advisory agreement (the “Sub-Advisory Agreement”) with Wells Capital Management Incorporated (the “Sub-Adviser”), an affiliate of Funds Management. The Management Agreement and the Sub-Advisory Agreement are collectively referred to as the “Advisory Agreements.”
At the Meeting, the Board considered the factors and reached the conclusions described below relating to the selection of Funds Management and the Sub-Adviser and the approval of the Advisory Agreements. Prior to the Meeting, including at a Board meeting held in April 2020, the Trustees conferred extensively among themselves and with representatives of Funds Management about these matters. Also, the Board has adopted a team-based approach, with each team consisting of a sub-set of Trustees, to assist the full Board in the discharge of its duties in reviewing investment performance and other matters throughout the year. The Independent Trustees were assisted in their evaluation of the Advisory Agreements by independent legal counsel, from whom they received separate legal advice and with whom they met separately.
In providing information to the Board, Funds Management and the Sub-Adviser were guided by a detailed set of requests for information submitted to them by independent legal counsel on behalf of the Independent Trustees at the start of the Board’s annual contract renewal process earlier in 2020. In considering and approving the Advisory Agreements, the Trustees considered the information they believed relevant, including but not limited to the information discussed below. The Board considered not only the specific information presented in connection with the Meeting, but also the knowledge gained over time through interaction with Funds Management and the Sub-Adviser about various topics. In this regard, the Board reviewed reports of Funds Management at each of its quarterly meetings, which included, among other things, portfolio reviews and investment performance reports. In addition, the Board and the teams mentioned above confer with portfolio managers at various times throughout the year. The Board did not identify any particular information or consideration that was all-important or controlling, and each individual Trustee may have attributed different weights to various factors.
After its deliberations, the Board unanimously approved the continuation of the Advisory Agreements for a one-year term and determined that the compensation payable to Funds Management and the Sub-Adviser under each of the Advisory Agreements was reasonable. The Board considered the approval of the Advisory Agreements for the Fund as part of its consideration of agreements for funds across the complex, but its approvals were made on a fund-by-fund basis. The following summarizes a number of important, but not necessarily all, factors considered by the Board in support of its approvals.
Nature, extent and quality of services
The Board received and considered various information regarding the nature, extent and quality of services provided to the Fund by Funds Management and the Sub-Adviser under the Advisory Agreements. This information included a description of the investment advisory services and Fund-level administrative services covered by the Management Agreement, as well as, among other things, a summary of the background and experience of senior management of Wells Fargo Asset Management (“WFAM”), of which Funds Management and the Sub-Adviser are a part, and a summary of investments made in the business of WFAM. The Board also received a description of Funds Management’s and the Sub-Adviser’s business continuity plans and of their approaches to data privacy and cybersecurity, and related testing. The Board also received and reviewed information about Funds Management’s role as administrator of the Fund’s liquidity risk management program, Funds Management’s approach to risk management, and Funds Management’s intermediary and vendor oversight program.
The Board also considered the qualifications, background, tenure and responsibilities of each of the portfolio managers primarily responsible for the day-to-day portfolio management of the Fund. The Board evaluated the ability of Funds Management and the Sub-Adviser to attract and retain qualified investment professionals, including research, advisory and supervisory personnel. The Board further considered the compliance programs and compliance records of Funds Management and the Sub-Adviser. In addition, the Board took into account the full range of services provided to the Fund by Funds Management and its affiliates.
32 | Wells Fargo Intrinsic World Equity Fund
Table of Contents
Other information (unaudited)
Fund investment performance and expenses
The Board considered the investment performance results for the Fund over various time periods ended December 31, 2019. The Board also considered more current results for various time periods ended March 31, 2020. The Board considered these results in comparison to the investment performance of funds in a universe that was determined by Broadridge Inc. (“Broadridge”) to be similar to the Fund (the “Universe”), and in comparison to the Fund’s benchmark index and to other comparative data. Broadridge is an independent provider of investment company data. The Board received a description of the methodology used by Broadridge to select the mutual funds in the performance Universe. The Board noted that the investment performance of the Fund (Administrator Class) was higher than the average investment performance of the Universe for the one-, three-, five- and ten-year periods ended December 31, 2019. The Board also noted that the investment performance of the Fund (Administrator Class) was higher than the average investment performance of the Universe for all periods ended March 31, 2020. The Board also noted that the investment performance of the Fund was lower than its benchmark index, the MSCI World Index (Net), for the one-year period ended December 31, 2019, and higher than or in range of its benchmark for the three-, five- and ten-year periods ended December 31, 2019. The Board also noted that the investment performance of the Fund was lower than its benchmark index, the MSCI World Index (Net), for the one-, three- and five-year periods ended March 31, 2020, and in range of its benchmark for the ten-year period ended March 31, 2020.
The Board received information concerning, and discussed factors contributing to, the underperformance of the Fund relative to the benchmark for the periods identified above. The Board took note of the explanations for the relative underperformance during these periods, including with respect to investment decisions that affected the Fund’s investment performance.
The Board also received and considered information regarding the Fund’s net operating expense ratios and their various components, including actual management fees, custodian and other non-management fees, and Rule 12b-1 and non-Rule 12b-1 shareholder service fees. The Board considered these ratios in comparison to the median ratios of funds in class-specific expense groups that were determined by Broadridge to be similar to the Fund (the “Groups”). The Board received a description of the methodology used by Broadridge to select the mutual funds in the expense Groups and an explanation of how funds comprising expense groups and their expense ratios may vary from year-to-year. Based on the Broadridge reports, the Board noted that the net operating expense ratios of the Fund were in range of, lower than or equal to the median net operating expense ratios of the expense Groups for each share class.
The Board took into account the Fund’s investment performance and expense information provided to it among the factors considered in deciding to re-approve the Advisory Agreements.
Investment management and sub-advisory fee rates
The Board reviewed and considered the contractual fee rates payable by the Fund to Funds Management under the Management Agreement, as well as the contractual fee rates payable by the Fund to Funds Management for class-level administrative services under a Class-Level Administration Agreement, which include, among other things, class-level transfer agency and sub-transfer agency costs (collectively, the “Management Rates”). The Board also reviewed and considered the contractual investment sub-advisory fee rates that are payable by Funds Management to the Sub-Adviser for investment sub-advisory services.
Among other information reviewed by the Board was a comparison of the Fund’s Management Rates with the average contractual investment management fee rates of funds in the expense Groups at a common asset level as well as transfer agency costs of the funds in the expense Groups. The Board noted that the Management Rates of the Fund were in range of the sum of these average rates for the Fund’s expense Groups for each share classes.
The Board also received and considered information about the portion of the total management fee that was retained by Funds Management after payment of the fee to the Sub-Adviser for sub-advisory services. In assessing the reasonableness of this amount, the Board received and evaluated information about the nature and extent of responsibilities retained and risks assumed by Funds Management and not delegated to or assumed by the Sub-Adviser, and about Funds Management’s on-going oversight services. Given the affiliation between Funds Management and the Sub-Adviser, the Board ascribed limited relevance to the allocation of fees between them.
The Board also received and considered information about the nature and extent of services offered and fee rates charged by Funds Management and the Sub-Adviser to other types of clients with investment strategies similar to those of the Fund. In this regard, the Board received information about the significantly greater scope of services, and compliance, reporting and other legal burdens and risks of managing proprietary mutual funds compared with those associated with managing assets of other types of clients, including third-party sub-advised fund clients and non-mutual fund clients such as institutional separate accounts.
Based on its consideration of the factors and information it deemed relevant, including those described here, the Board determined that the compensation payable to Funds Management under the Management Agreement and to the Sub-Adviser under the Sub-Advisory Agreement was reasonable.
Wells Fargo Intrinsic World Equity Fund | 33
Table of Contents
Other information (unaudited)
Profitability
The Board received and considered information concerning the profitability of Funds Management, as well as the profitability of both WFAM and Wells Fargo & Co. (“Wells Fargo”) from providing services to the fund family as a whole. The Board noted that the Sub-Adviser’s profitability information with respect to providing services to the Fund and other funds in the family was subsumed in the WFAM and Wells Fargo profitability analysis.
Funds Management reported on the methodologies and estimates used in calculating profitability, including a description of the methodology used to allocate certain expenses. Among other things, the Board noted that the levels of profitability reported on a fund-by-fund basis varied widely, depending on factors such as the size, type and age of fund.
Based on its review, the Board did not deem the profits reported by Funds Management, WFAM or Wells Fargo from services provided to the Fund to be at a level that would prevent it from approving the continuation of the Advisory Agreements.
Economies of scale
The Board received and considered information about the potential for Funds Management to experience economies of scale in the provision of management services to the Fund, the difficulties of calculating economies of scale at an individual fund level, and the extent to which potential scale benefits are shared with shareholders. The Board noted the existence of breakpoints in the Fund’s management fee structure, which operate generally to reduce the Fund’s expense ratios as the Fund grows in size, and the size of the Fund in relation to such breakpoints. The Board considered that in addition to management fee breakpoints, Funds Management shares potential economies of scale from its management business in a variety of ways, including through fee waiver and expense reimbursement arrangements, services that benefit shareholders, competitive management fee rates set at the outset without regard to breakpoints, and investments in the business intended to enhance services available to shareholders.
The Board concluded that Funds Management’s arrangements with respect to the Fund, including contractual breakpoints, constituted a reasonable approach to sharing potential economies of scale with the Fund and its shareholders.
Other benefits to Funds Management and the Sub-Adviser
The Board received and considered information regarding potential “fall-out” or ancillary benefits received by Funds Management and its affiliates, including the Sub-Adviser, as a result of their relationships with the Fund. Ancillary benefits could include, among others, benefits directly attributable to other relationships with the Fund and benefits potentially derived from an increase in Funds Management’s and the Sub-Adviser’s business as a result of their relationships with the Fund. The Board noted that various affiliates of Funds Management may receive distribution-related fees, shareholder servicing payments and sub-transfer agency fees in respect of shares sold or held through them and services provided.
The Board also reviewed information about soft dollar credits earned and utilized by the Sub-Adviser, fees earned by Funds Management and the Sub-Adviser from managing a private investment vehicle for the fund family’s securities lending collateral, and commissions earned by an affiliated broker from portfolio transactions.
Based on its consideration of the factors and information it deemed relevant, including those described here, the Board did not find that any ancillary benefits received by Funds Management and its affiliates, including the Sub-Adviser, were unreasonable.
Conclusion
At the Meeting, after considering the above-described factors and based on its deliberations and its evaluation of the information described above, the Board unanimously approved the continuation of the Advisory Agreements for a one-year term and determined that the compensation payable to Funds Management and the Sub-Adviser under each of the Advisory Agreements was reasonable.
34 | Wells Fargo Intrinsic World Equity Fund
Table of Contents
Other information (unaudited)
LIQUIDITY RISK MANAGEMENT PROGRAM
In accordance with Rule 22e-4 under the Investment Company Act of 1940, as amended (the “Liquidity Rule”), Wells Fargo Funds Trust (the “Trust”) has adopted and implemented a liquidity risk management program (the “Program”) on behalf of each of its series, including the Fund, which is reasonably designed to assess and manage the Fund’s liquidity risk. “Liquidity risk” is defined as the risk that the Fund is unable to meet redemption requests without significantly diluting remaining investors’ interests in the Fund. The Trust’s Board of Trustees (the “Board”) previously approved the designation of Wells Fargo Funds Management, LLC (“Funds Management”), the Fund’s investment manager, as the administrator of the Program, and Funds Management has established a Liquidity Risk Management Council composed of personnel from multiple departments within Funds Management and its affiliates to assist Funds Management in the implementation and on-going administration of the Program.
The Program is comprised of various components designed to support the assessment and/or management of liquidity risk, including: (1) the periodic assessment (no less frequently than annually) of certain factors that influence the Fund’s liquidity risk; (2) the periodic classification (no less frequently than monthly) of the Fund’s investments into one of four liquidity categories that reflect an estimate of their liquidity under current market conditions; (3) a 15% limit on the acquisition of “illiquid investments” (as defined under the Liquidity Rule); (4) to the extent the Fund does not invest primarily in “highly liquid investments” (as defined under the Liquidity Rule), the determination of a minimum percentage of the Fund’s assets that generally will be invested in highly liquid investments (an “HLIM”); (5) if the Fund has established an HLIM, the periodic review (no less frequently than annually) of the HLIM and the adoption of policies and procedures for responding to a shortfall of the Fund’s “highly liquid investments” below its HLIM; and (6) periodic reporting to the Board.
At a meeting of the Board held on May 26 and 28, 2020, the Board received a written report (the “Report”) from Funds Management that addressed the operation of the Program and assessed its adequacy and effectiveness of implementation. The Report covered the initial period from December 1, 2018 through December 31, 2019 (the “Reporting Period”). No significant liquidity events impacting the Fund were noted in the Report. There were no material changes to the Program during the Reporting Period. The Report concluded that the Program is operating effectively to assess and manage the Fund’s liquidity risk, and that the Program has been and continues to be adequately and effectively implemented to monitor and, as applicable, respond to the Fund’s liquidity developments.
There can be no assurance that the Program will achieve its objectives under all circumstances in the future. Please refer to the Fund’s prospectus for more information regarding the Fund’s exposure to liquidity risk and other risks to which an investment in the Fund may be subject.
Wells Fargo Intrinsic World Equity Fund | 35
Table of Contents
This page is intentionally left blank.
Table of Contents
For more information
More information about Wells Fargo Funds is available free upon request. To obtain literature, please write, visit the Fund’s website, or call:
Wells Fargo Funds
P.O. Box 219967
Kansas City, MO 64121-9967
Website: wfam.com
Individual investors: 1-800-222-8222
Retail investment professionals: 1-888-877-9275
Institutional investment professionals: 1-866-765-0778

This report and the financial statements contained herein are submitted for the general information of the shareholders of the Fund. If this report is used for promotional purposes, distribution of the report must be accompanied or preceded by a current prospectus. Before investing, please consider the investment objectives, risks, charges, and expenses of the investment. For a current prospectus and, if available, a summary prospectus, containing this information, call 1-800-222-8222 or visit the Fund’s website at wfam.com. Read the prospectus carefully before you invest or send money.
Wells Fargo Asset Management (WFAM) is the trade name for certain investment advisory/management firms owned by Wells Fargo & Company. These firms include but are not limited to Wells Capital Management Incorporated and Wells Fargo Funds Management, LLC. Certain products managed by WFAM entities are distributed by Wells Fargo Funds Distributor, LLC (a broker-dealer and Member FINRA).
This material is for general informational and educational purposes only and is NOT intended to provide investment advice or a recommendation of any kind—including a recommendation for any specific investment, strategy, or plan.
INVESTMENT PRODUCTS: NOT FDIC INSURED ◾ NO BANK GUARANTEE ◾ MAY LOSE VALUE
© 2020 Wells Fargo & Company. All rights reserved.
PAR-1120-00560 12-20
A241/AR241 10-20
Table of Contents

Annual Report
October 31, 2020
Wells Fargo
Special International Small Cap Fund
Beginning on January 1, 2021, as permitted by new regulations adopted by the Securities and Exchange Commission, paper copies of the Wells Fargo Funds’ annual and semi-annual shareholder reports issued after this date will no longer be sent by mail, unless you specifically request paper copies of the reports. Instead, the reports will be made available on the Funds’ website, and you will be notified by mail each time a report is posted and provided with a website address to access the report.
If you already elected to receive shareholder reports electronically, you will not be affected by this change and you need not take any action. You may elect to receive shareholder reports and other communications from the Fund electronically at any time by contacting your financial intermediary (such as a broker-dealer or bank) or, if you are a direct investor, by calling 1-800-222-8222 or by enrolling at wellsfargo.com/advantagedelivery.
You may elect to receive all future reports in paper free of charge. If you invest through a financial intermediary, you can contact your financial intermediary to request that you continue to receive paper copies of your shareholder reports; if you invest directly with the Fund, you can call 1-800-222-8222. Your election to receive reports in paper will apply to all Wells Fargo Funds held in your account with your financial intermediary or, if you are a direct investor, to all Wells Fargo Funds that you hold.
Table of Contents
|
Reduce clutter. Save trees. |
Sign up for |
The views expressed and any forward-looking statements are as of October 31, 2020, unless otherwise noted, and are those of the Fund’s portfolio managers and/or Wells Fargo Asset Management. Discussions of individual securities, or the markets generally, or any Wells Fargo Fund are not intended as individual recommendations. Future events or results may vary significantly from those expressed in any forward-looking statements. The views expressed are subject to change at any time in response to changing circumstances in the market. Wells Fargo Asset Management and the Fund disclaim any obligation to publicly update or revise any views expressed or forward-looking statements.
INVESTMENT PRODUCTS: NOT FDIC INSURED ◾ NO BANK GUARANTEE ◾ MAY LOSE VALUE
Wells Fargo Special International Small Cap Fund | 1
Table of Contents
Letter to shareholders (unaudited)

Andrew Owen
President
Wells Fargo Funds
Dear Shareholder:
We are pleased to offer you this annual report for the Wells Fargo Special International Small Cap Fund for the 12-month period that ended October 31, 2020. Global stock markets saw earlier gains erased in March as governments around the world took unprecedented measures, attempting to stop the spread of COVID-19 at the expense of short-term economic output. However, markets rallied strongly from April through period-end to offset those short-term losses as central banks bolstered capital markets and confidence.
For the 12-month period, equities had generally positive total returns despite intense volatility in March. Non-U.S. developed market equities had weaker performance than emerging market and U.S. stocks. While gains from fixed-income securities were positive, they were more modest than equities. For the period, U.S. stocks, based on the S&P 500 Index,1 gained 9.71%. International stocks, as measured by the MSCI ACWI ex USA Index (Net),2 returned -2.61%, while the MSCI EM Index (Net)3 had stronger performance, with a 8.25% gain. Among bond indices, the Bloomberg Barclays U.S. Aggregate Bond Index4 returned 6.19%, the Bloomberg Barclays Global Aggregate ex-USD Index5 gained 4.96%, and the Bloomberg Barclays Municipal Bond Index6 returned 3.59% while the ICE BofA U.S. High Yield Index7 returned 2.54%.
The period began with buoyed investor confidence.
Equity markets rallied in November despite ongoing geopolitical risks. Hopes for a U.S.-China trade deal buoyed investor confidence. U.S. business sentiment improved slightly and manufacturing and services activity picked up. While consumer confidence and purchasing managers’ activity rose in the eurozone, China reported weakening manufacturing and consumer data. Bond yields rose marginally, leading to slightly negative returns for global government and investment-grade corporate bonds.
Financial markets ended 2019 boosted by the U.S. and China accord on a Phase One trade deal. That, along with the landslide election win by the pro-Brexit U.K. Conservative Party and ongoing central bank support, gave investors greater confidence. U.S. economic indicators were generally positive, with the exception of manufacturing activity and business confidence. Consumer confidence was fed by a robust labor market, tame inflation, and lower interest rates, which boosted housing affordability and stimulated homebuyer activity. The impeachment of President Trump had little market impact. Meanwhile, slowing Chinese economic activity, partly a result of the trade war, led to further government stimulus at year-end through lower reserve ratios, allowing banks to lend more money.
| 1 | The S&P 500 Index consists of 500 stocks chosen for market size, liquidity, and industry group representation. It is a market-value-weighted index with each stock’s weight in the index proportionate to its market value. You cannot invest directly in an index. |
| 2 | The Morgan Stanley Capital International (MSCI) All Country World Index (ACWI) ex USA Index (Net) is a free-float-adjusted market-capitalization-weighted index that is designed to measure the equity market performance of developed and emerging markets, excluding the United States. Source: MSCI. MSCI makes no express or implied warranties or representations and shall have no liability whatsoever with respect to any MSCI data contained herein. The MSCI data may not be further redistributed or used as a basis for other indices or any securities or financial products. This report is not approved, reviewed, or produced by MSCI. You cannot invest directly in an index. |
| 3 | The MSCI Emerging Markets (EM) Index (Net) is a free-float-adjusted market-capitalization-weighted index that is designed to measure equity market performance of emerging markets. You cannot invest directly in an index. |
| 4 | The Bloomberg Barclays U.S. Aggregate Bond Index is a broad-based benchmark that measures the investment-grade, U.S. dollar-denominated, fixed-rate taxable bond market, including Treasuries, government-related and corporate securities, mortgage-backed securities (agency fixed-rate and hybrid adjustable-rate mortgage pass-throughs), asset-backed securities, and commercial mortgage-backed securities. You cannot invest directly in an index. |
| 5 | The Bloomberg Barclays Global Aggregate ex-USD Index is an unmanaged index that provides a broad-based measure of the global investment-grade fixed-income markets excluding the U.S. dollar-denominated debt market. You cannot invest directly in an index. |
| 6 | The Bloomberg Barclays Municipal Bond Index is an unmanaged index composed of long-term tax-exempt bonds with a minimum credit rating of Baa. You cannot invest directly in an index. |
| 7 | The ICE BofA U.S. High Yield Index is a market-capitalization-weighted index of domestic and Yankee high-yield bonds. The index tracks the performance of high-yield securities traded in the U.S. bond market. You cannot invest directly in an index. Copyright 2020. ICE Data Indices, LLC. All rights reserved. |
2 | Wells Fargo Special International Small Cap Fund
Table of Contents
Letter to shareholders (unaudited)
The 2019 year-end rally continued in early January 2020. However, capital market volatility spiked in late January on concerns over the potential impact of COVID-19 on the global economy and stock markets. With sentiment somewhat souring, perceived safe havens did well in January. The U.S. dollar and Japanese yen both rose and government bonds outperformed equities. While the S&P 500 Index held its ground, emerging market equities tumbled, including those in Asia.
In February, COVID-19 became the major market focus. Fears of the virus’s impact on global growth led to expectations of increased global central bank monetary policy support. That led the 10-year U.S. Treasury yield to fall to an all-time low of 1.1%. Although equity markets initially shrugged off concerns about the outbreak, focusing instead on strong fourth-quarter earnings and improving business confidence in January, market sentiment turned sharply lower and the S&P 500 Index lost 8.2% for the month. Oil prices tumbled as Russia and the Organization of the Petroleum Exporting Countries compounded a major decline in oil demand with a brutal price war, partly aimed at dissuading further U.S. shale production, causing the price of West Texas Intermediate crude oil to plummet.
The global spread of COVID-19 in March led country after country to clamp down on social- and business-related activity in order to contain the virus from causing even greater devastation and overwhelming health care systems. This abrupt stoppage of economic activity led to the sharp deceleration of global output, sending economies into a deep contraction. Central banks responded swiftly, slashing interest rates and expanding quantitative easing programs to restore liquidity and confidence in the markets. In the U.S., the Federal Reserve (Fed) introduced several new lending programs, funding investment-grade bonds, money market mutual funds, and commercial paper while purchasing Treasuries, mortgage-backed securities, and overnight repurchase agreements. Meanwhile, stock markets tumbled quickly into a bear market, ending the longest bull stock market in U.S. history.
Markets rebounded strongly in April, fueled by unprecedented government and central bank stimulus measures. The U.S. economy contracted by an annualized 5.0% pace in the first quarter of 2020, with 30 million new unemployment insurance claims in six weeks. In the eurozone, first-quarter real gross domestic product (GDP) shrank 3.8% with the composite April Flash Purchasing Managers’ Index (PMI), a monthly survey of purchasing managers, falling to an all-time low of 13.5. The European Central Bank expanded its quantitative easing to include the purchase of additional government bonds of countries with the greatest virus-related need, including Italy and Spain. China’s first-quarter GDP fell by 6.8% year over year. However, retail sales, production, and investment showed signs of recovery. Extreme oil-price volatility continued as global supply far exceeded demand.
The global equity market rebound continued in May, with widespread advances. Investors regained confidence on reports of early signs of success in human trials of a COVID-19 vaccine. Growth stocks continued to outperform value stocks while returns on global government bonds were generally flat. In the U.S., a gap grew between the stock market rebound and economic data, including an April unemployment rate of 14.7%, the highest level since World War II. Manufacturing and services purchasing managers’ indices reflected widespread weakening activity in May. U.S. corporate earnings reports indicated a 14% year-over-year contraction in earnings from the first quarter of 2019. However, high demand for technology, driven by remote activity, supported robust information technology sector earnings, which helped drive major technology stocks higher.
Financial markets posted widely positive returns in June despite ongoing economic weakness and high levels of uncertainty on the containment of COVID-19 and the timing of an effective vaccine. There were hopeful signs as economies reopened. Vitally important to market sentiment was the ongoing commitment by central banks globally
“The global spread of COVID-19 in March led country after country to clamp down on social- and business-related activity in order to contain the virus from causing even greater devastation and overwhelming health care systems.”
Wells Fargo Special International Small Cap Fund | 3
Table of Contents
Letter to shareholders (unaudited)
“In October, capital markets took a step back from their six-month rally. Market volatility rose in advance of the U.S. election and amid a global increase in COVID-19 infections.”
to do all they can to provide economic support through liquidity and low borrowing costs. U.S. economic activity was aided by one-time $1,200 stimulus checks and $600 weekly bonus unemployment benefits that expired at the end of July. However, unemployment remained historically high, easing somewhat from 14.7% in April to 11.1% in June. By the end of June, numerous states reported increases of COVID-19 cases. China’s economic recovery picked up momentum in June, though it remained far from a full recovery.
July was broadly positive for both global equities and fixed income. However, economic data and a resurgence of COVID-19 cases pointed to the vulnerability of the global economy and the ongoing imperative to regain control of the pandemic. Second-quarter GDP shrank from the previous quarter by 9.5% and 12.1% in the U.S. and the eurozone, respectively. In contrast, China reported a 3.2% year-over-year expansion in its second-quarter GDP. U.S. unemployment remained high despite adding 1.8 million jobs in July, with a double-digit jobless rate persisting. However, manufacturing activity grew in both the U.S. and the eurozone. In Asia, while China’s manufacturing sector continued to expand, activity in Japan and South Korea contracted. A rising concern was the rapid and broad reemergence of COVID-19 infections.
The stock market continued to rally in August despite concerns over rising numbers of COVID-19 cases in the United States and several European countries, including France and Spain, as well as the July expiration of the $600 weekly bonus unemployment benefit. U.S. stocks had strong monthly gains, surpassing broadly positive overall global equity performance, while fixed-income market monthly returns were broadly flat. Generally stronger-than-expected second-quarter earnings boosted investor sentiment along with the Fed’s announcement of a policy shift that will likely lead to longer-term low interest rates and supportive monetary policy. U.S. indices measuring manufacturing and services activities beat expectations while the U.S. housing market maintained strength. In Europe, retail sales expanded and consumer confidence was steady. China’s economy continued to expand.
Stocks grew more volatile in September on mixed economic data. U.S. economic activity continued to grow. However, six months after the bottom fell out of the labor market in early spring, only half of the 22 million jobs lost had returned. The U.S. unemployment rate fell to 7.9% in September, reflecting steady improvement but far higher than the 3.5% pre-COVID-19 rate. Only 661,000 jobs were added for the month, down from 1.5 million in August. Meanwhile, a reported 2.3 million people have given up looking for work. With U.S. Congress failing to pass further fiscal relief and uncertainties surrounding a possible vaccine, doubts crept back into the financial markets. In the U.K., a lack of progress in Brexit talks with the European Union weighed on markets. China’s economy picked up steam, however, with growth fueled by increased global demand, and China’s services sector rallied.
In October, capital markets took a step back from their six-month rally. Market volatility rose in advance of the U.S. election and amid a global increase in COVID-19 infections. Europe responded with a new round of restrictions affecting economic activity. Meanwhile, Brexit remained unresolved as the European Union and the U.K. failed to strike a deal by a mid-October deadline. U.S. markets looked favorably at a possible Democratic sweep and control of the federal purse strings as that could lead to the passage of long-awaited additional fiscal stimulus, which could boost economic activity. Meanwhile, China continued to stand apart, reporting 4.9% third-quarter GDP growth year over year.
4 | Wells Fargo Special International Small Cap Fund
Table of Contents
Letter to shareholders (unaudited)
Don’t let short-term uncertainty derail long-term investment goals.
Periods of investment uncertainty can present challenges, but experience has taught us that maintaining long-term investment goals can be an effective way to plan for the future. To help you create a sound strategy based on your personal goals and risk tolerance, Wells Fargo Funds offers more than 100 mutual funds spanning a wide range of asset classes and investment styles. Although diversification cannot guarantee an investment profit or prevent losses, we believe it can be an effective way to manage investment risk and potentially smooth out overall portfolio performance. We encourage investors to know their investments and to understand that appropriate levels of risk-taking may unlock opportunities.
Thank you for choosing to invest with Wells Fargo Funds. We appreciate your confidence in us and remain committed to helping you meet your financial needs.
Sincerely,

Andrew Owen
President
Wells Fargo Funds
|
For further information about your Fund, contact your investment professional, visit our website at wfam.com, or call us directly at 1-800-222-8222. |
Wells Fargo Special International Small Cap Fund | 5
Table of Contents
Performance highlights (unaudited)
Investment objective
The Fund seeks long-term capital appreciation.
Manager
Wells Fargo Funds Management, LLC
Subadviser
Wells Capital Management Incorporated
Portfolio managers
Stephen Giggie, CFA®‡*
Oleg Makhorine
James Tringas, CFA®‡
Bryant VanCronkhite, CFA®‡, CPA
Average annual total returns (%) as of October 31, 2020
| Expense ratios1 (%) | ||||||||||||||
| Inception date | 1 year | Since inception | Gross | Net2 | ||||||||||
| Class R6 (WICRX) | 5-31-2019 | 0.42 | 4.36 | 7.81 | 0.95 | |||||||||
| Institutional Class (WICIX) | 5-31-2019 | 0.35 | 4.24 | 7.91 | 1.05 | |||||||||
| MSCI World ex USA Small Cap Index (Net)3 | – | -0.65 | 5.46* | – | – | |||||||||
| * | Return is based on the inception date of the oldest Fund class. |
Figures quoted represent past performance, which is no guarantee of future results, and do not reflect taxes that a shareholder may pay on an investment in a fund. Investment return and principal value of an investment will fluctuate so that an investor’s shares, when redeemed, may be worth more or less than their original cost. Current performance may be lower or higher than the performance data quoted, which assumes the reinvestment of dividends and capital gains. Current month-end performance is available on the Fund’s website, wfam.com.
Index returns do not include transaction costs associated with buying and selling securities, any mutual fund fees or expenses, or any taxes. It is not possible to invest directly in an index.
Class R6 and Institutional Class shares are sold without a front-end sales charge or contingent deferred sales charge.
Stock values fluctuate in response to the activities of individual companies and general market and economic conditions. Foreign investments are especially volatile and can rise or fall dramatically due to differences in the political and economic conditions of the host country. These risks are generally intensified in emerging markets. The use of derivatives may reduce returns and/or increase volatility. Certain investment strategies tend to increase the total risk of an investment (relative to the broader market). The Fund is exposed to geographic risk and smaller-company securities risk. Consult the Fund’s prospectus for additional information on these and other risks.
Please see footnotes on page 7.
6 | Wells Fargo Special International Small Cap Fund
Table of Contents
Performance highlights (unaudited)
| Growth of $1,000,000 investment as of October 31, 20204 |
|
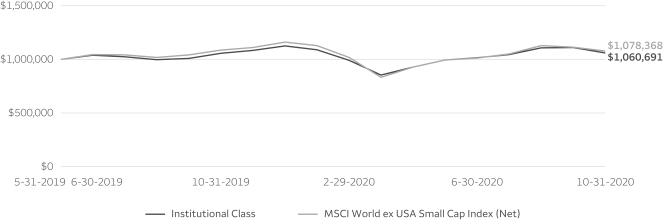
| ‡ | CFA® and Chartered Financial Analyst® are trademarks owned by CFA Institute. |
| * | Mr. Giggie became a portfolio manager of the Fund on April 15, 2020. |
| 1 | Reflects the expense ratios as stated in the most recent prospectuses. The expense ratios shown are subject to change and may differ from the annualized expense ratios shown in the financial highlights of this report. |
| 2 | The manager has contractually committed through February 28, 2021, to waive fees and/or reimburse expenses to the extent necessary to cap total annual fund operating expenses after fee waivers at 0.95% for Class R6 and 1.05% for Institutional Class. Brokerage commissions, stamp duty fees, interest, taxes, acquired fund fees and expenses (if any), and extraordinary expenses are excluded from the expense caps. Prior to or after the commitment expiration date, the caps may be increased or the commitment to maintain the caps may be terminated only with the approval of the Board of Trustees. Without these caps, the Fund’s returns would have been lower. The expense ratio paid by an investor is the net expense ratio (the total annual fund operating expenses after fee waivers) as stated in the prospectuses. |
| 3 | The Morgan Stanley Capital International (MSCI) World ex USA Small Cap Index (Net) is a free-float-adjusted market-capitalization-weighted index that is designed to measure the equity market performance of developed markets excluding the United States. You cannot invest directly in an index. |
| 4 | The chart compares the performance of the Institutional Class shares since inception with the MSCI World ex USA Small Cap Index (Net). The chart assumes a hypothetical investment of $1,000,000 in Institutional Class shares and reflects all operating expenses. |
| 5 | The ten largest holdings, excluding cash, cash equivalents and any money market funds, are calculated based on the value of the investments divided by total net assets of the Fund. Holdings are subject to change and may have changed since the date specified. |
| 6 | Amounts are calculated based on the total long-term investments of the Fund. These amounts are subject to change and may have changed since the date specified. |
Wells Fargo Special International Small Cap Fund | 7
Table of Contents
Performance highlights (unaudited)
MANAGER’S DISCUSSION
Fund highlights
| ∎ | The Fund outperformed its benchmark, the MSCI World ex USA Small Cap Index (Net), over the trailing one-year period, as of October 31, 2020. |
| ∎ | Stock selection in the consumer discretionary and health care sectors contributed to relative performance. |
| ∎ | Regionally, security selection in Asia ex-Japan and the U.K. contributed while security selection in Japan and Canada detracted. |
| ∎ | Stock selection in the information technology (IT) and materials sectors detracted from relative performance. |
International equity markets and the MSCI World ex USA Small Cap Index (Net) saw a significant increase in volatility during the period as the COVID-19 virus pressured stocks and economies across geographies. Despite the steep drawdown in equity markets in March, international small-cap stocks experienced a sharp recovery over the pursuant six months as central banks stepped in to stabilize markets and investors optimistically looked toward a global economic recovery. The U.K. was the worst-performing region as ongoing Brexit negotiations between Europe and the U.K. added to COVID-19 concerns. The Fund outperformed during the volatile period as the team’s focus on competitive advantages, flexible balance sheets, and sustainable free cash flow was rewarded.
During the period, the team made modest changes to sector and regional exposures within the Fund based on our bottom-up reward/risk valuation process. As bottom-up investors, we evaluate how global macroeconomic events might affect the Fund’s holdings, but we do not try to forecast the outcomes. The Fund’s security selection within Japan was the largest detractor, while stock selection in the U.K. was the largest contributor to relative returns. We aim to use market volatility opportunistically. We will seek to use any future volatility to our advantage through our bottom-up stock-selection process.
| Ten largest holdings (%) as of October 31, 20205 | ||||
Gerresheimer AG | 3.97 | |||
Ansell Limited | 3.95 | |||
TAG Immobilien AG | 3.48 | |||
Alten SA | 3.33 | |||
Spectris plc | 3.32 | |||
Viscofan SA | 3.31 | |||
S4 Capital plc | 3.19 | |||
Aeon Delight Company Limited | 3.14 | |||
Britvic plc | 2.95 | |||
Nomad Foods Limited | 2.94 | |||
| Sector allocation as of October 31, 20206 | ||
| ||
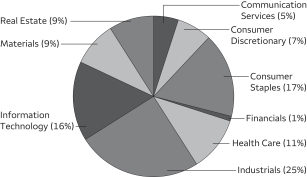
| Geographic allocation as of October 31, 20206 | ||
| ||
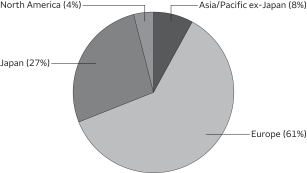
Stock selection in the consumer discretionary and health care sectors contributed to relative performance.
In the consumer discretionary sector, Australia-based Domino’s Pizza Enterprises is one of the largest franchisees of the Domino’s brand in Australia, New Zealand, Japan, and several European countries. The company’s delivery and take-out business saw strong demand as other restaurants were forced to close due to the virus. The company generates strong free cash flow and has a tremendous amount of balance sheet flexibility.
Please see footnotes on page 7.
8 | Wells Fargo Special International Small Cap Fund
Table of Contents
Performance highlights (unaudited)
Security selection in the health care sector contributed to relative performance. Ansell Limited is an Australian-based manufacturer and distributor of personal safety equipment, such as protective gloves, for health care and industrial uses. The company has seen strong demand for its safety products as a result of COVID-19. We believe Ansell’s strong customer relationships, financial flexibility, and healthy free cash flow should allow the company to remain offensive in a time where many companies are acting very defensively.
Stock selection in the IT and materials sectors detracted from relative performance.
Barco N.V. is a Belgian-based provider of visualization products. The company has a dominant market share in movie theater projectors and has recently seen success selling into adjacent venues. The stock was under pressure as many theaters were forced to temporarily close due to the virus. Given the company’s net cash balance sheet and innovative products, we believe it should be able to weather further volatility.
In the materials sector, Elementis plc is a U.K.-based specialty chemical company. We are attracted to the high barriers to entry in the company’s coatings business and the strategy to diversify toward less cyclical end markets in the personal care space. The stock underperformed as the economic slowdown affected volumes and the company suspended its dividend. We believe Elementis has strong financial flexibility and we expect it to continue to diversify its end markets via bolt-on acquisitions.
Our investment philosophy focuses on company-specific factors rather than headline-dominating macroeconomic events.
As we look toward the end of 2020 and beyond, we see numerous market forces at play that could bring further volatility. Market participants continue to gauge the economic impact of the virus. We are not experts in forecasting macro or political events. However, we believe it is always prudent to protect downside risks and be opportunistic when short-term macro or political events create valuation dislocations from a company’s long-term fundamentals.
We believe our fundamental analysis, risk management, and active investment process are well suited to take advantage of new opportunities as the equity market evolves. While volatility may increase, we believe the strong balance sheets and stable cash flows of the companies in our portfolio should support consistent long-term performance.
Wells Fargo Special International Small Cap Fund | 9
Table of Contents
As a shareholder of the Fund, you incur ongoing costs including management fees and other Fund expenses. This example is intended to help you understand your ongoing costs (in dollars) of investing in the Fund and to compare these costs with the ongoing costs of investing in other mutual funds.
The example is based on an investment of $1,000 invested at the beginning of the six-month period and held for the entire period from May 1, 2020 to October 31, 2020.
Actual expenses
The “Actual” line of the table below provides information about actual account values and actual expenses. You may use the information in this line, together with the amount you invested, to estimate the expenses that you paid over the period. Simply divide your account value by $1,000 (for example, an $8,600 account value divided by $1,000 = 8.6), then multiply the result by the number in the “Actual” line under the heading entitled “Expenses paid during period” for your applicable class of shares to estimate the expenses you paid on your account during this period.
Hypothetical example for comparison purposes
The “Hypothetical” line of the table below provides information about hypothetical account values and hypothetical expenses based on the Fund’s actual expense ratio and an assumed rate of return of 5% per year before expenses, which is not the Fund’s actual return. The hypothetical account values and expenses may not be used to estimate the actual ending account balance or expenses you paid for the period. You may use this information to compare the ongoing costs of investing in the Fund and other funds. To do so, compare this 5% hypothetical example with the 5% hypothetical examples that appear in the shareholder reports of the other funds.
Please note that the expenses shown in the table are meant to highlight your ongoing costs only. Therefore, the “Hypothetical” line of the table is useful in comparing ongoing costs only and will not help you determine the relative total costs of owning different funds.
| Beginning account value 5-1-2020 | Ending account value 10-31-2020 | Expenses paid during the period1 | Annualized net expense ratio | |||||||||||||
Class R6 | ||||||||||||||||
Actual | $ | 1,000.00 | $ | 1,145.70 | $ | 5.12 | 0.95 | % | ||||||||
Hypothetical (5% return before expenses) | $ | 1,000.00 | $ | 1,020.36 | $ | 4.82 | 0.95 | % | ||||||||
Institutional Class | ||||||||||||||||
Actual | $ | 1,000.00 | $ | 1,144.43 | $ | 5.66 | 1.05 | % | ||||||||
Hypothetical (5% return before expenses) | $ | 1,000.00 | $ | 1,019.86 | $ | 5.33 | 1.05 | % | ||||||||
| 1 | Expenses paid is equal to the annualized net expense ratio of each class multiplied by the average account value over the period, multiplied by the number of days in the most recent fiscal half-year divided by the number of days in the fiscal year (to reflect the one-half-year period). |
10 | Wells Fargo Special International Small Cap Fund
Table of Contents
Portfolio of investments—October 31, 2020
| Shares | Value | |||||||||||||||
| Common Stocks: 99.55% | ||||||||||||||||
Australia: 7.14% | ||||||||||||||||
Ansell Limited (Health Care, Health Care Equipment & Supplies) | 7,269 | $ | 205,548 | |||||||||||||
Domino’s Pizza Enterprises Limited (Consumer Discretionary, Hotels, Restaurants & Leisure) | 1,510 | 89,938 | ||||||||||||||
Inghams Group Limited (Consumer Staples, Food Products) | 15,196 | 30,577 | ||||||||||||||
Orora Limited (Materials, Containers & Packaging) | 25,066 | 45,428 | ||||||||||||||
| 371,491 | ||||||||||||||||
|
| |||||||||||||||
| Austria: 1.41% | ||||||||||||||||
Mayr-Melnhof Karton AG (Materials, Containers & Packaging) | 448 | 73,151 | ||||||||||||||
|
| |||||||||||||||
| Belgium: 1.64% | ||||||||||||||||
Barco NV (Information Technology, Electronic Equipment, Instruments & Components) | 5,425 | 85,102 | ||||||||||||||
|
| |||||||||||||||
| Canada: 3.48% | ||||||||||||||||
Blackberry Limited TSX (Information Technology, Software) † | 13,800 | 61,941 | ||||||||||||||
Parex Resources Incorporated (Energy, Oil, Gas & Consumable Fuels) † | 1,800 | 17,523 | ||||||||||||||
Primo Water Corporation (Consumer Staples, Beverages) | 8,100 | 101,531 | ||||||||||||||
| 180,995 | ||||||||||||||||
|
| |||||||||||||||
| France: 5.33% | ||||||||||||||||
Alten SA (Information Technology, IT Services) † | 2,160 | 172,948 | ||||||||||||||
M6 Métropole Télévision SA (Communication Services, Media) † | 5,500 | 60,415 | ||||||||||||||
Mersen SA (Industrials, Electrical Equipment) † | 1,693 | 43,924 | ||||||||||||||
| 277,287 | ||||||||||||||||
|
| |||||||||||||||
| Germany: 9.60% | ||||||||||||||||
Cancom SE (Information Technology, IT Services) | 1,384 | 54,715 | ||||||||||||||
Gerresheimer AG (Health Care, Life Sciences Tools & Services) | 2,052 | 206,276 | ||||||||||||||
Krones AG (Industrials, Machinery) | 1,010 | 57,709 | ||||||||||||||
TAG Immobilien AG (Real Estate, Real Estate Management & Development) | 6,135 | 180,796 | ||||||||||||||
| 499,496 | ||||||||||||||||
|
| |||||||||||||||
| Ireland: 1.75% | ||||||||||||||||
Irish Residential Properties REIT plc (Real Estate, Equity REITs) | 57,117 | 91,134 | ||||||||||||||
|
| |||||||||||||||
| Italy: 6.16% | ||||||||||||||||
De’Longhi SpA (Consumer Discretionary, Household Durables) † | 2,492 | 79,698 | ||||||||||||||
GVS SpA (Health Care, Health Care Equipment & Supplies) † | 8,721 | 122,899 | ||||||||||||||
Interpump Group SpA (Industrials, Machinery) | 3,112 | 117,545 | ||||||||||||||
| 320,142 | ||||||||||||||||
|
| |||||||||||||||
| Japan: 26.73% | ||||||||||||||||
Aeon Delight Company Limited (Industrials, Commercial Services & Supplies) | 6,200 | 163,220 | ||||||||||||||
BML Incorporated (Health Care, Health Care Providers & Services) | 700 | 19,680 | ||||||||||||||
Daiseki Company Limited (Industrials, Commercial Services & Supplies) | 5,500 | 140,007 | ||||||||||||||
DTS Corporation (Information Technology, IT Services) | 7,100 | 138,088 | ||||||||||||||
Fuji Seal International Incorporated (Materials, Containers & Packaging) | 5,500 | 102,734 | ||||||||||||||
Horiba Limited (Information Technology, Electronic Equipment, Instruments & Components) | 1,500 | 73,787 | ||||||||||||||
Kamigumi Company Limited (Industrials, Transportation Infrastructure) | 1,500 | 26,836 | ||||||||||||||
Meitec Corporation (Industrials, Professional Services) | 2,800 | 138,810 | ||||||||||||||
Nihon Parkerizing Company Limited (Materials, Chemicals) | 10,200 | 100,522 | ||||||||||||||
ORIX JREIT Incorporated (Real Estate, Equity REITs) | 107 | 150,379 | ||||||||||||||
Paramount Bed Holdings Company Limited (Health Care, Health Care Equipment & Supplies) | 700 | 26,969 | ||||||||||||||
San-A Company Limited (Consumer Staples, Food & Staples Retailing) | 1,800 | 74,971 | ||||||||||||||
Sohgo Security Services Company Limited (Industrials, Commercial Services & Supplies) | 700 | 32,616 | ||||||||||||||
The accompanying notes are an integral part of these financial statements.
Wells Fargo Special International Small Cap Fund | 11
Table of Contents
Portfolio of investments—October 31, 2020
| Shares | Value | |||||||||||||||
| Japan (continued) | ||||||||||||||||
Sumitomo Warehouse Company Limited (Industrials, Transportation Infrastructure) | 9,000 | $ | 105,273 | |||||||||||||
Taikisha Limited (Industrials, Construction & Engineering) | 3,700 | 96,358 | ||||||||||||||
| 1,390,250 | ||||||||||||||||
|
| |||||||||||||||
| Luxembourg: 0.91% | ||||||||||||||||
Stabilus SA (Industrials, Machinery) | 832 | 47,169 | ||||||||||||||
|
| |||||||||||||||
| Netherlands: 2.78% | ||||||||||||||||
Brunel International NV (Industrials, Professional Services) † | 3,874 | 27,477 | ||||||||||||||
IMCD NV (Industrials, Trading Companies & Distributors) | 689 | 79,746 | ||||||||||||||
TKH Group NV (Industrials, Electrical Equipment) | 1,160 | 37,351 | ||||||||||||||
| 144,574 | ||||||||||||||||
|
| |||||||||||||||
| Norway: 0.85% | ||||||||||||||||
Atea ASA (Information Technology, IT Services) | 3,804 | 44,198 | ||||||||||||||
|
| |||||||||||||||
| Singapore: 1.01% | ||||||||||||||||
CapitaLand Integrated Commercial Trust (Real Estate, Equity REITs) | 41,544 | 52,659 | ||||||||||||||
|
| |||||||||||||||
| Spain: 4.65% | ||||||||||||||||
Vidrala SA (Materials, Containers & Packaging) | 730 | 69,716 | ||||||||||||||
Viscofan SA (Consumer Staples, Food Products) | 2,552 | 172,238 | ||||||||||||||
| 241,954 | ||||||||||||||||
|
| |||||||||||||||
| Sweden: 2.55% | ||||||||||||||||
AAK AB (Consumer Staples, Food Products) † | 5,053 | 98,342 | ||||||||||||||
Hexpol AB (Materials, Chemicals) † | 3,907 | 34,410 | ||||||||||||||
| 132,752 | ||||||||||||||||
|
| |||||||||||||||
| Switzerland: 1.99% | ||||||||||||||||
Bossard Holding AG (Industrials, Trading Companies & Distributors) | 119 | 19,332 | ||||||||||||||
Bucher Industries AG (Industrials, Machinery) | 218 | 84,044 | ||||||||||||||
| 103,376 | ||||||||||||||||
|
| |||||||||||||||
| United Kingdom: 21.57% | ||||||||||||||||
Britvic plc (Consumer Staples, Beverages) | 16,068 | 153,540 | ||||||||||||||
Domino’s Pizza Group plc (Consumer Discretionary, Hotels, Restaurants & Leisure) | 21,443 | 92,065 | ||||||||||||||
Elementis plc (Materials, Chemicals) † | 49,356 | 47,572 | ||||||||||||||
JD Wetherspoon plc (Consumer Discretionary, Hotels, Restaurants & Leisure) | 1,612 | 18,018 | ||||||||||||||
Lancashire Holdings Limited (Financials, Insurance) | 6,615 | 54,590 | ||||||||||||||
Mears Group plc (Industrials, Commercial Services & Supplies) † | 6,869 | 9,378 | ||||||||||||||
Morgan Advanced Materials plc (Industrials, Machinery) | 15,293 | 49,553 | ||||||||||||||
NCC Group plc (Information Technology, IT Services) | 18,650 | 44,259 | ||||||||||||||
Nomad Foods Limited (Consumer Staples, Food Products) † | 6,312 | 153,066 | ||||||||||||||
S4 Capital plc (Communication Services, Media) † | 31,976 | 165,700 | ||||||||||||||
Spectris plc (Information Technology, Electronic Equipment, Instruments & Components) | 5,375 | 172,512 | ||||||||||||||
Tate & Lyle plc (Consumer Staples, Food Products) | 9,120 | 70,304 | ||||||||||||||
THG Holdings plc (Consumer Discretionary, Internet & Direct Marketing Retail) † | 10,707 | 91,493 | ||||||||||||||
| 1,122,050 | ||||||||||||||||
|
| |||||||||||||||
Total Common Stocks (Cost $5,007,356) | 5,177,780 | |||||||||||||||
|
| |||||||||||||||
The accompanying notes are an integral part of these financial statements.
12 | Wells Fargo Special International Small Cap Fund
Table of Contents
Portfolio of investments—October 31, 2020
| Expiration date | Shares | Value | ||||||||||||||
| Rights: 0.06% | ||||||||||||||||
| Spain: 0.06% | ||||||||||||||||
Vidrala SA (Materials, Containers & Packaging) † | 11-5-2020 | 730 | $ | 3,482 | ||||||||||||
|
| |||||||||||||||
Total Rights (Cost $0) |
| 3,482 | ||||||||||||||
|
| |||||||||||||||
| Total investments in securities (Cost $5,007,356) | 99.61 | % | 5,181,262 | |||||
Other assets and liabilities, net | 0.39 | 20,066 | ||||||
|
|
|
| |||||
| Total net assets | 100.00 | % | $ | 5,201,328 | ||||
|
|
|
| |||||
| † | Non-income-earning security |
Abbreviations:
| REIT | Real estate investment trust |
Investments in Affiliates
An affiliated investment is an investment in which the Fund owns at least 5% of the outstanding voting shares of the issuer or as a result of other relationships, such as the Fund and the issuer having the same investment manager. Transactions with issuers that were either affiliated persons of the Fund at the beginning of the period or the end of the period were as follows:
| Value, beginning of period | Purchases | Sales proceeds | Net realized gains (losses) | Net change in unrealized gains (losses) | Value, end of period | % of net assets | Shares, end of period | Income from affiliated securities | ||||||||||||||||||||||||||||
| Short-Term Investments | ||||||||||||||||||||||||||||||||||||
Investment Companies | ||||||||||||||||||||||||||||||||||||
Wells Fargo Government Money Market Fund Select Class * | $ | 263,637 | $ | 1,302,777 | $ | (1,566,414 | ) | $ | 0 | $ | 0 | $ | 0 | 0.00 | % | 0 | $ | 1,302 | ||||||||||||||||||
| * | No longer held at the end of the period. |
The accompanying notes are an integral part of these financial statements.
Wells Fargo Special International Small Cap Fund | 13
Table of Contents
Statement of assets and liabilities—October 31, 2020
Assets | ||||
Investments in unaffiliated securities, at value (cost $5,007,356) | $ | 5,181,262 | ||
Foreign currency, at value (cost $130,499) | 130,104 | |||
Receivable for dividends | 20,626 | |||
Prepaid expenses and other assets | 1,852 | |||
|
| |||
Total assets | 5,333,844 | |||
|
| |||
Liabilities | ||||
Payable for investments purchased | 6,473 | |||
Overdraft due to custodian bank | 48,160 | |||
Due to manager | 59,247 | |||
Administration fees payable | 154 | |||
Custody and accounting fees payable | 14,949 | |||
Trustees’ fees and expenses payable | 760 | |||
Accrued expenses and other liabilities | 2,773 | |||
|
| |||
Total liabilities | 132,516 | |||
|
| |||
Total net assets | $ | 5,201,328 | ||
|
| |||
Net assets consist of | ||||
Paid-in capital | $ | 5,011,233 | ||
Total distributable earnings | 190,095 | |||
|
| |||
Total net assets | $ | 5,201,328 | ||
|
| |||
Computation of net asset value per share | ||||
Net assets – Class R6 | $ | 5,085,869 | ||
Shares outstanding – Class R61 | 490,000 | |||
Net asset value per share – Class R6 | $10.38 | |||
Net assets – Institutional Class | $ | 115,459 | ||
Shares outstanding – Institutional Class1 | 11,121 | |||
Net asset value per share – Institutional Class | $10.38 | |||
| 1 | The Fund has an unlimited number of authorized shares. |
The accompanying notes are an integral part of these financial statements.
14 | Wells Fargo Special International Small Cap Fund
Table of Contents
Statement of operations—year ended October 31, 2020
Investment income | ||||
Dividends (net of foreign withholding taxes of $11,772) | $ | 94,572 | ||
Income from affiliated securities | 1,302 | |||
|
| |||
Total investment income | 95,874 | |||
|
| |||
Expenses | ||||
Management fee | 48,424 | |||
Administration fees | ||||
Class R6 | 1,496 | |||
Institutional Class | 143 | |||
Custody and accounting fees | 61,585 | |||
Professional fees | 54,179 | |||
Registration fees | 60,939 | |||
Shareholder report expenses | 20,283 | |||
Trustees’ fees and expenses | 20,466 | |||
Other fees and expenses | 22,452 | |||
|
| |||
Total expenses | 289,967 | |||
Less: Fee waivers and/or expense reimbursements | ||||
Fund-level | (239,937 | ) | ||
Class R6 | (1,496 | ) | ||
|
| |||
Net expenses | 48,534 | |||
|
| |||
Net investment income | 47,340 | |||
|
| |||
Realized and unrealized gains (losses) on investments | ||||
Net realized gains on investments | 11,607 | |||
Net change in unrealized gains (losses) on investments | (28,658 | ) | ||
|
| |||
Net realized and unrealized gains (losses) on investments | (17,051 | ) | ||
|
| |||
Net increase in net assets resulting from operations | $ | 30,289 | ||
|
| |||
The accompanying notes are an integral part of these financial statements.
Wells Fargo Special International Small Cap Fund | 15
Table of Contents
Statement of changes in net assets
| Year ended October 31, 2020 | Year ended October 31, 20191 | |||||||||||||||
Operations | ||||||||||||||||
Net investment income | $ | 47,340 | $ | 26,127 | ||||||||||||
Net realized gains on investments | 11,607 | 59,852 | ||||||||||||||
Net change in unrealized gains (losses) on investments | (28,658 | ) | 202,492 | |||||||||||||
|
| |||||||||||||||
Net increase in net assets resulting from operations | 30,289 | 288,471 | ||||||||||||||
|
| |||||||||||||||
Distributions to shareholders from net investment income and net realized gains | ||||||||||||||||
Class R6 | (126,151 | ) | 0 | |||||||||||||
Institutional Class | (2,514 | ) | 0 | |||||||||||||
|
| |||||||||||||||
Total distributions to shareholders | (128,665 | ) | 0 | |||||||||||||
|
| |||||||||||||||
Capital share transactions | Shares | Shares | ||||||||||||||
Proceeds from shares sold | ||||||||||||||||
Class R6 | 0 | 0 | 490,000 | 4,900,000 | ||||||||||||
Institutional Class | 1,121 | 11,233 | 10,000 | 100,000 | ||||||||||||
|
| |||||||||||||||
| 11,233 | 5,000,000 | |||||||||||||||
|
| |||||||||||||||
Reinvestment of distributions | ||||||||||||||||
Institutional Class | 12 | 128 | 0 | 0 | ||||||||||||
|
| |||||||||||||||
Payment for shares redeemed | ||||||||||||||||
Institutional Class | (12 | ) | (128 | ) | 0 | 0 | ||||||||||
|
| |||||||||||||||
Net increase in net assets resulting from capital share transactions | 11,233 | 5,000,000 | ||||||||||||||
|
| |||||||||||||||
Total increase (decrease) in net assets | �� | (87,143 | ) | 5,288,471 | ||||||||||||
|
| |||||||||||||||
Net assets | ||||||||||||||||
Beginning of period | 5,288,471 | 0 | ||||||||||||||
|
| |||||||||||||||
End of period | $ | 5,201,328 | $ | 5,288,471 | ||||||||||||
|
| |||||||||||||||
| 1 | For the period from May 31, 2019 (commencement of operations) to October 31, 2019 |
The accompanying notes are an integral part of these financial statements.
16 | Wells Fargo Special International Small Cap Fund
Table of Contents
(For a share outstanding throughout each period)
| Year ended October 31 | ||||||||
| CLASS R6 | 2020 | 20191 | ||||||
Net asset value, beginning of period | $10.58 | $10.00 | ||||||
Net investment income | 0.09 | 0.05 | ||||||
Net realized and unrealized gains (losses) on investments | (0.03 | ) | 0.53 | |||||
|
|
|
| |||||
Total from investment operations | 0.06 | 0.58 | ||||||
Distributions to shareholders from | ||||||||
Net investment income | (0.15 | ) | 0.00 | |||||
Net realized gains | (0.11 | ) | 0.00 | |||||
|
|
|
| |||||
Total distributions to shareholders | (0.26 | ) | 0.00 | |||||
Net asset value, end of period | $10.38 | $10.58 | ||||||
Total return2 | 0.42 | % | 5.80 | % | ||||
Ratios to average net assets (annualized) | ||||||||
Gross expenses | 5.69 | % | 7.81 | % | ||||
Net expenses | 0.95 | % | 0.95 | % | ||||
Net investment income | 0.93 | % | 1.24 | % | ||||
Supplemental data | ||||||||
Portfolio turnover rate | 45 | % | 14 | % | ||||
Net assets, end of period (000s omitted) | $5,086 | $5,183 | ||||||
| 1 | For the period from May 31, 2019 (commencement of class operations) to October 31, 2019 |
| 2 | Returns for periods of less than one year are not annualized. |
The accompanying notes are an integral part of these financial statements.
Wells Fargo Special International Small Cap Fund | 17
Table of Contents
Financial highlights
(For a share outstanding throughout each period)
| Year ended October 31 | ||||||||
| INSTITUTIONAL CLASS | 2020 | 20191 | ||||||
Net asset value, beginning of period | $10.57 | $10.00 | ||||||
Net investment income | 0.08 | 0.05 | ||||||
Net realized and unrealized gains (losses) on investments | (0.03 | ) | 0.52 | |||||
|
|
|
| |||||
Total from investment operations | 0.05 | 0.57 | ||||||
Distributions to shareholders from | ||||||||
Net investment income | (0.13 | ) | 0.00 | |||||
Net realized gains | (0.11 | ) | 0.00 | |||||
|
|
|
| |||||
Total distributions to shareholders | (0.24 | ) | 0.00 | |||||
Net asset value, end of period | $10.38 | $10.57 | ||||||
Total return2 | 0.35 | % | 5.70 | % | ||||
Ratios to average net assets (annualized) | ||||||||
Gross expenses | 5.76 | % | 7.91 | % | ||||
Net expenses | 1.05 | % | 1.05 | % | ||||
Net investment income | 0.83 | % | 1.14 | % | ||||
Supplemental data | ||||||||
Portfolio turnover rate | 45 | % | 14 | % | ||||
Net assets, end of period (000s omitted) | $115 | $106 | ||||||
| 1 | For the period from May 31, 2019 (commencement of class operations) to October 31, 2019 |
| 2 | Returns for periods of less than one year are not annualized. |
The accompanying notes are an integral part of these financial statements.
18 | Wells Fargo Special International Small Cap Fund
Table of Contents
1. ORGANIZATION
Wells Fargo Fund Trust (the “Trust”), a Delaware statutory trust organized on March 10, 1999, is an open-end management investment company registered under the Investment Company Act of 1940, as amended (the “1940 Act”). As an investment company, the Trust follows the accounting and reporting guidance in Financial Accounting Standards Board (“FASB”) Accounting Standards Codification Topic 946, Financial Services – Investment Companies. These financial statements report on the Wells Fargo Special International Small Cap Fund (the “Fund”) which is a diversified series of the Trust.
2. SIGNIFICANT ACCOUNTING POLICIES
The following significant accounting policies, which are consistently followed in the preparation of the financial statements of the Fund, are in conformity with U.S. generally accepted accounting principles which require management to make estimates and assumptions that affect the reported amounts of assets and liabilities, disclosure of contingent assets and liabilities at the date of the financial statements, and the reported amounts of revenues and expenses during the reporting period. Actual results could differ from those estimates.
Securities valuation
All investments are valued each business day as of the close of regular trading on the New York Stock Exchange (generally 4 p.m. Eastern Time), although the Fund may deviate from this calculation time under unusual or unexpected circumstances.
Equity securities that are listed on a foreign or domestic exchange or market are valued at the official closing price or, if none, the last sales price. If no sale occurs on the principal exchange or market that day, a fair value price will be determined in accordance with the Fund’s Valuation Procedures.
The values of securities denominated in foreign currencies are translated into U.S. dollars at rates provided by an independent foreign currency pricing source at a time each business day specified by the Wells Fargo Asset Management Pricing Committee at Wells Fargo Funds Management, LLC (“Funds Management”).
Many securities markets and exchanges outside the U.S. close prior to the close of the New York Stock Exchange and therefore may not fully reflect trading or events that occur after the close of the principal exchange in which the foreign securities are traded, but before the close of the New York Stock Exchange. If such trading or events are expected to materially affect the value of such securities, then fair value pricing procedures approved by the Board of Trustees of the Fund are applied. These procedures take into account multiple factors including movements in U.S. securities markets after foreign exchanges close. Foreign securities that are fair valued under these procedures are categorized as Level 2 and the application of these procedures may result in transfers between Level 1 and Level 2. Depending on market activity, such fair valuations may be frequent. Such fair value pricing may result in net asset values that are higher or lower than net asset values based on the last reported sales price or latest quoted bid price. On October 31, 2020, such fair value pricing was used in pricing certain foreign securities.
Investments in registered open-end investment companies are valued at net asset value.
Investments which are not valued using any of the methods discussed above are valued at their fair value, as determined in good faith by the Board of Trustees. The Board of Trustees has established a Valuation Committee comprised of the Trustees and has delegated to it the authority to take any actions regarding the valuation of portfolio securities that the Valuation Committee deems necessary or appropriate, including determining the fair value of portfolio securities, unless the determination has been delegated to the Wells Fargo Asset Management Pricing Committee. The Board of Trustees retains the authority to make or ratify any valuation decisions or approve any changes to the Valuation Procedures as it deems appropriate. On a quarterly basis, the Board of Trustees receives reports on any valuation actions taken by the Valuation Committee or the Wells Fargo Asset Management Pricing Committee which may include items for ratification.
Foreign currency translation
The accounting records of the Fund are maintained in U.S. dollars. The values of other assets and liabilities denominated in foreign currencies are translated into U.S. dollars at rates provided by an independent foreign currency pricing source at a time each business day specified by the Wells Fargo Asset Management Pricing Committee. Purchases and sales of securities, and income and expenses are converted at the rate of exchange on the respective dates of such transactions. Net realized foreign exchange gains or losses arise from sales of foreign currencies, currency gains or losses realized between the trade and settlement dates on securities transactions, and the difference between the amounts of dividends, interest and foreign withholding taxes recorded and the U.S. dollar equivalent of the amounts actually paid or received. Net unrealized foreign exchange gains and losses arise from changes in the fair value of assets and liabilities other than investments in securities resulting from changes in exchange rates. The changes in net assets arising from changes in exchange rates of securities and the changes in net assets resulting from changes in market prices of securities are not separately presented. Such changes are included in net realized and unrealized gains or losses from investments.
Wells Fargo Special International Small Cap Fund | 19
Table of Contents
Notes to financial statements
Security transactions and income recognition
Securities transactions are recorded on a trade date basis. Realized gains or losses are recorded on the basis of identified cost.
Dividend income is recognized on the ex-dividend date, except for certain dividends from foreign securities, which are recorded as soon as the custodian verifies the ex-dividend date. Dividend income from foreign securities is recorded net of foreign taxes withheld where recovery of such taxes is not assured.
Distributions to shareholders
Distributions to shareholders from net investment income and any net realized gains are recorded on the ex-dividend date and paid at least annually. Such distributions are determined in accordance with income tax regulations and may differ from U.S. generally accepted accounting principles. Dividend sources are estimated at the time of declaration. The tax character of distributions is determined as of the Fund’s fiscal year end. Therefore, a portion of the Fund’s distributions made prior to the Fund’s fiscal year end may be categorized as a tax return of capital at year end.
Federal and other taxes
The Fund intends to continue to qualify as a regulated investment company by distributing substantially all of its investment company taxable income and any net realized capital gains (after reduction for capital loss carryforwards) sufficient to relieve it from all, or substantially all, federal income taxes. Accordingly, no provision for federal income taxes was required.
The Fund’s income and federal excise tax returns and all financial records supporting those returns for the fiscal years since commencement of operations are subject to examination by the federal and Delaware revenue authorities. Management has analyzed the Fund’s tax positions taken on federal, state, and foreign tax returns for all open tax years and does not believe that there are any uncertain tax positions that require recognition of a tax liability.
As of October 31, 2020, the aggregate cost of all investments for federal income tax purposes was $5,027,913 and the unrealized gains (losses) consisted of:
Gross unrealized gains | $ | 604,657 | ||
Gross unrealized losses | (451,308 | ) | ||
Net unrealized gains | $ | 153,349 | ||
Class allocations
The separate classes of shares offered by the Fund differ principally in administration fees. Class specific expenses are charged directly to that share class. Investment income, common fund-level expenses, and realized and unrealized gains (losses) on investments are allocated daily to each class of shares based on the relative proportion of net assets of each class.
3. FAIR VALUATION MEASUREMENTS
Fair value measurements of investments are determined within a framework that has established a fair value hierarchy based upon the various data inputs utilized in determining the value of the Fund’s investments. The three-level hierarchy gives the highest priority to unadjusted quoted prices in active markets for identical assets or liabilities (Level 1) and the lowest priority to unobservable inputs (Level 3). The Fund’s investments are classified within the fair value hierarchy based on the lowest level of input that is significant to the fair value measurement. The inputs are summarized into three broad levels as follows:
| ∎ | Level 1 – quoted prices in active markets for identical securities |
| ∎ | Level 2 – other significant observable inputs (including quoted prices for similar securities, interest rates, prepayment speeds, credit risk, etc.) |
| ∎ | Level 3 – significant unobservable inputs (including the Fund’s own assumptions in determining the fair value of investments) |
The inputs or methodologies used for valuing investments in securities are not necessarily an indication of the risk associated with investing in those securities.
20 | Wells Fargo Special International Small Cap Fund
Table of Contents
Notes to financial statements
The following is a summary of the inputs used in valuing the Fund’s assets and liabilities as of October 31, 2020:
| Quoted prices (Level 1) | Other significant observable inputs (Level 2) | Significant (Level 3) | Total | |||||||||||||
Assets | ||||||||||||||||
Investments in: | ||||||||||||||||
Common stocks | ||||||||||||||||
Australia | $ | 0 | $ | 371,491 | $ | 0 | $ | 371,491 | ||||||||
Austria | 73,151 | 0 | 0 | 73,151 | ||||||||||||
Belgium | 0 | 85,102 | 0 | 85,102 | ||||||||||||
Canada | 180,995 | 0 | 0 | 180,995 | ||||||||||||
France | 0 | 277,287 | 0 | 277,287 | ||||||||||||
Germany | 0 | 499,496 | 0 | 499,496 | ||||||||||||
Ireland | 91,134 | 0 | 0 | 91,134 | ||||||||||||
Italy | 122,899 | 197,243 | 0 | 320,142 | ||||||||||||
Japan | 0 | 1,390,250 | 0 | 1,390,250 | ||||||||||||
Luxembourg | 0 | 47,169 | 0 | 47,169 | ||||||||||||
Netherlands | 27,477 | 117,097 | 0 | 144,574 | ||||||||||||
Norway | 0 | 44,198 | 0 | 44,198 | ||||||||||||
Singapore | 0 | 52,659 | 0 | 52,659 | ||||||||||||
Spain | 241,954 | 0 | 0 | 241,954 | ||||||||||||
Sweden | 0 | 132,752 | 0 | 132,752 | ||||||||||||
Switzerland | 0 | 103,376 | 0 | 103,376 | ||||||||||||
United Kingdom | 457,831 | 664,219 | 0 | 1,122,050 | ||||||||||||
Rights | ||||||||||||||||
Spain | 0 | 3,482 | 0 | 3,482 | ||||||||||||
Total assets | $ | 1,195,441 | $ | 3,985,821 | $ | 0 | $ | 5,181,262 | ||||||||
Additional sector, industry or geographic detail is included in the Portfolio of Investments.
For the year ended October 31, 2020, the Fund did not have any transfers into/out of Level 3.
4. TRANSACTIONS WITH AFFILIATES
Management fee
Funds Management, an indirect wholly owned subsidiary of Wells Fargo & Company (“Wells Fargo”), is the manager of the Fund and provides advisory and fund-level administrative services under an investment management agreement. Under the investment management agreement, Funds Management is responsible for, among other services, implementing the investment objectives and strategies of the Fund, supervising the subadviser and providing fund-level administrative services in connection with the Fund’s operations. As compensation for its services under the investment management agreement, Funds Management is entitled to receive a management fee at the following annual rate based on the Fund’s average daily net assets:
| Average daily net assets | Management fee | |||
First $500 million | 0.950 | % | ||
Next $500 million | 0.925 | |||
Next $1 billion | 0.900 | |||
Next $2 billion | 0.875 | |||
Next $1 billion | 0.850 | |||
Next $5 billion | 0.840 | |||
Over $10 billion | 0.830 | |||
For the year ended October 31, 2020, the management fee was equivalent to an annual rate of 0.95% of the Fund’s average daily net assets.
Wells Fargo Special International Small Cap Fund | 21
Table of Contents
Notes to financial statements
Funds Management has retained the services of a subadviser to provide daily portfolio management to the Fund. The fee for subadvisory services is borne by Funds Management. Wells Capital Management Incorporated, an affiliate of Funds Management and an indirect wholly owned subsidiary of Wells Fargo, is the subadviser to the Fund and is entitled to receive a fee from Funds Management at an annual rate starting at 0.55% and declining to 0.40% as the average daily net assets of the Fund increase.
Administration fees
Under a class-level administration agreement, Funds Management provides class-level administrative services to the Fund, which includes paying fees and expenses for services provided by the transfer agent, sub-transfer agents, omnibus account servicers and record-keepers. As compensation for its services under the class-level administration agreement, Funds Management receives an annual fee which is calculated based on the average daily net assets of each class as follows:
| Class-level administration fee | ||||
Class R6 | 0.03 | % | ||
Institutional Class | 0.13 | |||
Waivers and/or expense reimbursements
Funds Management has contractually waived and/or reimbursed management and administration fees to the extent necessary to maintain certain net operating expense ratios for the Fund. When each class of the Fund has exceeded its expense cap, Funds Management has waived fees and/or reimbursed expenses from fund-level expenses on a proportionate basis and then from class specific expenses. When only certain classes exceed their expense caps, waivers and/or reimbursements are applied against class specific expenses before fund-level expenses. Funds Management has committed through February 28, 2021 to waive fees and/or reimburse expenses to the extent necessary to cap the Fund’s expenses at 0.95% for Class R6 shares and 1.05% for Institutional Class shares. Prior to or after the commitment expiration date, the cap may be increased or the commitment to maintain the cap may be terminated only with the approval of the Board of Trustees.
Interfund transactions
The Fund may purchase or sell portfolio investment securities to certain other Wells Fargo affiliates pursuant to Rule 17a-7 under the 1940 Act and under procedures adopted by the Board of Trustees. The procedures have been designed to ensure that these interfund transactions, which do not incur broker commissions, are effected at current market prices.
5. INVESTMENT PORTFOLIO TRANSACTIONS
Purchases and sales of investments, excluding U.S. government obligations (if any) and short-term securities, for the year ended October 31, 2020 were $2,381,215 and $2,217,404, respectively.
6. BANK BORROWINGS
The Trust (excluding the money market funds), Wells Fargo Master Trust and Wells Fargo Variable Trust are parties to a $350,000,000 revolving credit agreement whereby the Fund is permitted to use bank borrowings for temporary or emergency purposes, such as to fund shareholder redemption requests. Interest under the credit agreement is charged to the Fund based on a borrowing rate equal to the higher of the Federal Funds rate in effect on that day plus 1.25% or the overnight LIBOR rate in effect on that day plus 1.25%. In addition, an annual commitment fee equal to 0.25% of the unused balance is allocated to each participating fund.
For the year ended October 31, 2020, there were no borrowings by the Fund under the agreement.
7. DISTRIBUTIONS TO SHAREHOLDERS
The tax character of distributions paid for the year ended October 31, 2020 was $128,665 of ordinary income. For the year ended October 31, 2019, the Fund did not pay any distributions to shareholders.
As of October 31, 2020, the components of distributable earnings on a tax basis were as follows:
Undistributed ordinary income | Undistributed long-term gain | Unrealized gains | ||
| $16,807 | $20,011 | $153,277 | ||
22 | Wells Fargo Special International Small Cap Fund
Table of Contents
Notes to financial statements
8. CONCENTRATION RISKS
Concentration risks result from exposure to a limited number of sectors or geographic regions. As of the end of the period, the Fund concentrated its portfolio in investments in the industrials sector and in Europe and Japan. A fund that invests a substantial portion of its assets in any sector or geographic region may be more affected by changes in that sector or geographic region than would be a fund whose investments are not heavily weighted in any sector or geographic region.
9. INDEMNIFICATION
Under the Fund’s organizational documents, the officers and Trustees have been granted certain indemnification rights against certain liabilities that may arise out of performance of their duties to the Fund. The Fund has entered into a separate agreement with each Trustee that converts indemnification rights currently existing under the Fund’s organizational documents into contractual rights that cannot be changed in the future without the consent of the Trustee. Additionally, in the normal course of business, the Fund may enter into contracts with service providers that contain a variety of indemnification clauses. The Fund’s maximum exposure under these arrangements is dependent on future claims that may be made against the Fund and, therefore, cannot be estimated.
10. NEW ACCOUNTING PRONOUNCEMENT
In August 2018, FASB issued Accounting Standards Update (“ASU”) No. 2018-13, Fair Value Measurement (Topic 820) Disclosure Framework—Changes to the Disclosure Requirements for Fair Value Measurement. ASU 2018-13 updates the disclosure requirements on fair value measurements in Topic 820, Fair Value Measurements. The amendments are effective for fiscal years, and interim periods within those fiscal years, beginning after December 15, 2019. Management has adopted this guidance which did not have a material impact on the financial statements.
11. CORONAVIRUS (COVID-19) PANDEMIC
On March 11, 2020, the World Health Organization announced that it had made the assessment that coronavirus disease 2019 (“COVID-19”) is a pandemic. The impacts of COVID-19 are adversely affecting the entire global economy, individual companies and investment products, and the market in general. There is significant uncertainty around the extent and duration of business disruptions related to COVID-19 and the impacts may be short term or may last for an extended period of time. The risk of further spreading of COVID-19 has led to significant uncertainty and volatility in the financial markets.
Wells Fargo Special International Small Cap Fund | 23
Table of Contents
Report of independent registered public accounting firm
To the Shareholders of the Fund and Board of Trustees
Wells Fargo Funds Trust:
Opinion on the Financial Statements
We have audited the accompanying statement of assets and liabilities of Wells Fargo Special International Small Cap Fund (the Fund), one of the funds constituting Wells Fargo Funds Trust, including the portfolio of investments, as of October 31, 2020, the related statement of operations for the year then ended, the statements of changes in net assets for the year then ended and for the period from May 31, 2019 (commencement of operations) to October 31, 2019, and the related notes (collectively, the financial statements) and the financial highlights for the year then ended and for the period from the commencement of operations to October 31, 2019. In our opinion, the financial statements and financial highlights present fairly, in all material respects, the financial position of the Fund as of October 31, 2020, the results of its operations for the year then ended, the changes in its net assets and the financial highlights for the year then ended and for the period from the commencement of operations to October 31, 2019, in conformity with U.S. generally accepted accounting principles.
Basis for Opinion
These financial statements and financial highlights are the responsibility of the Fund’s management. Our responsibility is to express an opinion on these financial statements and financial highlights based on our audits. We are a public accounting firm registered with the Public Company Accounting Oversight Board (United States) (PCAOB) and are required to be independent with respect to the Fund in accordance with the U.S. federal securities laws and the applicable rules and regulations of the Securities and Exchange Commission and the PCAOB.
We conducted our audits in accordance with the standards of the PCAOB. Those standards require that we plan and perform the audit to obtain reasonable assurance about whether the financial statements and financial highlights are free of material misstatement, whether due to error or fraud. Our audits included performing procedures to assess the risks of material misstatement of the financial statements and financial highlights, whether due to error or fraud, and performing procedures that respond to those risks. Such procedures included examining, on a test basis, evidence regarding the amounts and disclosures in the financial statements and financial highlights. Such procedures also included confirmation of securities owned as of October 31, 2020, by correspondence with the custodian, transfer agent and brokers, or by other appropriate auditing procedures. Our audits also included evaluating the accounting principles used and significant estimates made by management, as well as evaluating the overall presentation of the financial statements and financial highlights. We believe that our audits provide a reasonable basis for our opinion.

We have not been able to determine the specific year that we began serving as the auditor of one or more Wells Fargo Funds investment companies; however we are aware that we have served as the auditor of one or more Wells Fargo Funds investment companies since at least 1955.
Boston, Massachusetts
December 22, 2020
24 | Wells Fargo Special International Small Cap Fund
Table of Contents
TAX INFORMATION
Pursuant to Section 854 of the Internal Revenue Code, $39,003 of income dividends paid during the fiscal year ended October 31, 2020 has been designated as qualified dividend income (QDI).
PROXY VOTING INFORMATION
A description of the policies and procedures used to determine how to vote proxies relating to portfolio securities is available, upon request, by calling 1-800-222-8222, visiting our website at wfam.com, or visiting the SEC website at sec.gov. Information regarding how the proxies related to portfolio securities were voted during the most recent 12-month period ended June 30 is available on the website at wfam.com or by visiting the SEC website at sec.gov.
QUARTERLY PORTFOLIO HOLDINGS INFORMATION
The Fund files its complete schedule of portfolio holdings with the SEC for the first and third quarters of each fiscal year as an exhibit to its reports on Form N-PORT. Shareholders may view the filed Form N-PORT by visiting the SEC website at sec.gov.
Wells Fargo Special International Small Cap Fund | 25
Table of Contents
Other information (unaudited)
BOARD OF TRUSTEES AND OFFICERS
Each of the Trustees and Officers1 listed in the table below acts in identical capacities for each fund in the Wells Fargo family of funds, which consists of 144 mutual funds comprising the Wells Fargo Funds Trust, Wells Fargo Variable Trust, Wells Fargo Master Trust and four closed-end funds (collectively the “Fund Complex”). This table should be read in conjunction with the Prospectus and the Statement of Additional Information2. The mailing address of each Trustee and Officer is 525 Market Street, 12th Floor, San Francisco, CA 94105. Each Trustee and Officer serves an indefinite term, however, each Trustee serves such term until reaching the mandatory retirement age established by the Trustees.
Independent Trustees
| Name and year of birth | Position held and length of service* | Principal occupations during past five years or longer | Current other public company or investment company directorships | |||
| William R. Ebsworth (Born 1957) | Trustee, since 2015 | Retired. From 1984 to 2013, equities analyst, portfolio manager, research director and chief investment officer at Fidelity Management and Research Company in Boston, Tokyo, and Hong Kong, and retired in 2013 as Chief Investment Officer of Fidelity Strategic Advisers, Inc. where he led a team of investment professionals managing client assets. Prior thereto, Board member of Hong Kong Securities Clearing Co., Hong Kong Options Clearing Corp., the Thailand International Fund, Ltd., Fidelity Investments Life Insurance Company, and Empire Fidelity Investments Life Insurance Company. Audit Committee Chair and Investment Committee Chair of the Vincent Memorial Hospital Endowment (non-profit organization). Mr. Ebsworth is a CFA® charterholder. | N/A | |||
| Jane A. Freeman (Born 1953) | Trustee, since 2015; Chair Liaison, since 2018 | Retired. From 2012 to 2014 and 1999 to 2008, Chief Financial Officer of Scientific Learning Corporation. From 2008 to 2012, Ms. Freeman provided consulting services related to strategic business projects. Prior to 1999, Portfolio Manager at Rockefeller & Co. and Scudder, Stevens & Clark. Board member of the Harding Loevner Funds from 1996 to 2014, serving as both Lead Independent Director and chair of the Audit Committee. Board member of the Russell Exchange Traded Funds Trust from 2011 to 2012 and the chair of the Audit Committee. Ms. Freeman is also an inactive Chartered Financial Analyst. | N/A | |||
| Isaiah Harris, Jr. (Born 1952) | Trustee, since 2009; Audit Committee Chair, since 2019 | Retired. Chairman of the Board of CIGNA Corporation since 2009, and Director since 2005. From 2003 to 2011, Director of Deluxe Corporation. Prior thereto, President and CEO of BellSouth Advertising and Publishing Corp. from 2005 to 2007, President and CEO of BellSouth Enterprises from 2004 to 2005 and President of BellSouth Consumer Services from 2000 to 2003. Emeritus member of the Iowa State University Foundation Board of Governors. Emeritus Member of the Advisory Board of Iowa State University School of Business. Advisory Board Member, Palm Harbor Academy (private school). Mr. Harris is a certified public accountant (inactive status). | CIGNA Corporation | |||
| Judith M. Johnson (Born 1949) | Trustee, since 2008 | Retired. Prior thereto, Chief Executive Officer and Chief Investment Officer of Minneapolis Employees Retirement Fund from 1996 to 2008. Ms. Johnson is an attorney, certified public accountant and a certified managerial accountant. | N/A | |||
| David F. Larcker (Born 1950) | Trustee, since 2009 | James Irvin Miller Professor of Accounting at the Graduate School of Business (Emeritus), Stanford University, Director of the Corporate Governance Research Initiative and Senior Faculty of The Rock Center for Corporate Governance since 2006. From 2005 to 2008, Professor of Accounting at the Graduate School of Business, Stanford University. Prior thereto, Ernst & Young Professor of Accounting at The Wharton School, University of Pennsylvania from 1985 to 2005. | N/A | |||
26 | Wells Fargo Special International Small Cap Fund
Table of Contents
Other information (unaudited)
| Name and year of birth | Position held and length of service* | Principal occupations during past five years or longer | Current other public company or investment company directorships | |||
| Olivia S. Mitchell (Born 1953) | Trustee, since 2006; Nominating and Governance Committee Chair, since 2018 | International Foundation of Employee Benefit Plans Professor, Wharton School of the University of Pennsylvania since 1993. Director of Wharton’s Pension Research Council and Boettner Center on Pensions & Retirement Research, and Research Associate at the National Bureau of Economic Research. Previously, Cornell University Professor from 1978 to 1993. | N/A | |||
| Timothy J. Penny (Born 1951) | Trustee, since 1996; Chair, since 2018 | President and Chief Executive Officer of Southern Minnesota Initiative Foundation, a non-profit organization, since 2007. Member of the Board of Trustees of NorthStar Education Finance, Inc., a non-profit organization, since 2007. | N/A | |||
| James G. Polisson (Born 1959) | Trustee, since 2018 | Retired. Chief Marketing Officer, Source (ETF) UK Services, Ltd, from 2015 to 2017. From 2012 to 2015, Principal of The Polisson Group, LLC, a management consulting, corporate advisory and principal investing company. Chief Executive Officer and Managing Director at Russell Investments, Global Exchange Traded Funds from 2010 to 2012. Managing Director of Barclays Global Investors from 1998 to 2010 and Global Chief Marketing Officer for iShares and Barclays Global Investors from 2000 to 2010. Trustee of the San Francisco Mechanics’ Institute, a non-profit organization, from 2013 to 2015. Board member of the Russell Exchange Traded Fund Trust from 2011 to 2012. Director of Barclays Global Investors Holdings Deutschland GmbH from 2006 to 2009. Mr. Polisson is an attorney and has a retired status with the Massachusetts and District of Columbia Bar Associations. | N/A | |||
| Pamela Wheelock (Born 1959) | Trustee, since January 2020; previously Trustee from January 2018 to July 2019 | Board member of the Destination Medical Center Economic Development Agency, Rochester, Minnesota since 2019. Interim President of the McKnight Foundation from January to September 2020. Acting Commissioner, Minnesota Department of Human Services, July 2019 through September 2019. Human Services Manager (part-time), Minnesota Department of Human Services, October 2019 through December 2019. Chief Operating Officer, Twin Cities Habitat for Humanity from 2017 to 2019. Vice President of University Services, University of Minnesota from 2012 to 2016. Prior thereto, on the Board of Directors, Governance Committee and Finance Committee for the Minnesota Philanthropy Partners (Saint Paul Foundation) from 2012 to 2018, Interim Chief Executive Officer of Blue Cross Blue Shield of Minnesota from 2011 to 2012, Chairman of the Board from 2009 to 2012 and Board Director from 2003 to 2015. Vice President, Leadership and Community Engagement, Bush Foundation, Saint Paul, Minnesota (a private foundation) from 2009 to 2011. Executive Vice President and Chief Financial Officer, Minnesota Sports and Entertainment from 2004 to 2009 and Senior Vice President from 2002 to 2004. Executive Vice President of the Minnesota Wild Foundation from 2004 to 2008. Commissioner of Finance, State of Minnesota, from 1999 to 2002. Currently Board Chair of the Minnesota Wild Foundation since 2010. | N/A | |||
| * | Length of service dates reflect the Trustee’s commencement of service with the Trust’s predecessor entities, where applicable. |
Wells Fargo Special International Small Cap Fund | 27
Table of Contents
Other information (unaudited)
Officers
| Name and year of birth | Position held and length of service | Principal occupations during past five years or longer | ||
| Andrew Owen (Born 1960) | President, since 2017 | Executive Vice President of Wells Fargo & Company and Head of Affiliated Managers, Wells Fargo Asset Management, since 2014. In addition, Mr. Owen is currently President, Chief Executive Officer and Director of Wells Fargo Funds Management, LLC since 2017. Prior thereto, Executive Vice President responsible for marketing, investments and product development for Wells Fargo Funds Management, LLC, from 2009 to 2014. | ||
| Jeremy DePalma1 (Born 1974) | Treasurer, since 2012 | Senior Vice President of Wells Fargo Funds Management, LLC since 2009. Senior Vice President of Evergreen Investment Management Company, LLC from 2008 to 2010 and head of the Fund Reporting and Control Team within Fund Administration from 2005 to 2010. | ||
| Michelle Rhee (Born 1966) | Chief Legal Officer, since 2019 | Secretary of Wells Fargo Funds Management, LLC and Chief Legal Counsel of Wells Fargo Asset Management since 2018. Deputy General Counsel of Wells Fargo Bank, N.A. since 2020 and Assistant General Counsel of Wells Fargo Bank, N.A. from 2018 to 2020. Associate General Counsel and Managing Director of Bank of America Corporation from 2004 to 2018. | ||
| Catherine Kennedy (Born 1969) | Secretary, since 2019 | Vice President of Wells Fargo Funds Management, LLC and Senior Counsel of the Wells Fargo Legal Department since 2010. Vice President and Senior Counsel of Evergreen Investment Management Company, LLC from 1998 to 2010. | ||
| Michael H. Whitaker (Born 1967) | Chief Compliance Officer, since 2016 | Chief Compliance Officer of Wells Fargo Asset Management since 2016. Senior Vice President and Chief Compliance Officer for Fidelity Investments from 2007 to 2016. | ||
| 1 | Jeremy DePalma acts as Treasurer of 77 funds in the Fund Complex. |
| 2 | The Statement of Additional Information includes additional information about the Trustees and is available, without charge, upon request, by calling 1-800-222-8222 or by visiting the website at wfam.com. |
28 | Wells Fargo Special International Small Cap Fund
Table of Contents
Other information (unaudited)
BOARD CONSIDERATION OF INVESTMENT MANAGEMENT AND SUB-ADVISORY AGREEMENTS:
Wells Fargo Special International Small Cap Fund
Under the Investment Company Act of 1940 (the “1940 Act”), the Board of Trustees (the “Board”) of Wells Fargo Funds Trust (the “Trust”) must determine annually whether to approve the continuation of the Trust’s investment management and sub-advisory agreements. In this regard, at a Board meeting held on May 26, 2020 and May 28, 2020 (together, the “Meeting”), the Board, all the members of which have no direct or indirect interest in the investment management and sub-advisory agreements and are not “interested persons” of the Trust, as defined in the 1940 Act (the “Independent Trustees”), reviewed and approved for Wells Fargo Special International Small Cap Fund (the “Fund”): (i) an investment management agreement (the “Management Agreement”) with Wells Fargo Funds Management, LLC (“Funds Management”); and (ii) an investment sub-advisory agreement (the “Sub-Advisory Agreement”) with Wells Capital Management Incorporated (the “Sub-Adviser”), an affiliate of Funds Management. The Management Agreement and the Sub-Advisory Agreement are collectively referred to as the “Advisory Agreements.”
At the Meeting, the Board considered the factors and reached the conclusions described below relating to the selection of Funds Management and the Sub-Adviser and the approval of the Advisory Agreements. Prior to the Meeting, including at a Board meeting held in April 2020, the Trustees conferred extensively among themselves and with representatives of Funds Management about these matters. Also, the Board has adopted a team-based approach, with each team consisting of a sub-set of Trustees, to assist the full Board in the discharge of its duties in reviewing investment performance and other matters throughout the year. The Independent Trustees were assisted in their evaluation of the Advisory Agreements by independent legal counsel, from whom they received separate legal advice and with whom they met separately.
In providing information to the Board, Funds Management and the Sub-Adviser were guided by a detailed set of requests for information submitted to them by independent legal counsel on behalf of the Independent Trustees at the start of the Board’s annual contract renewal process earlier in 2020. In considering and approving the Advisory Agreements, the Trustees considered the information they believed relevant, including but not limited to the information discussed below. The Board considered not only the specific information presented in connection with the Meeting, but also the knowledge gained over time through interaction with Funds Management and the Sub-Adviser about various topics. In this regard, the Board reviewed reports of Funds Management at each of its quarterly meetings, which included, among other things, portfolio reviews and investment performance reports. In addition, the Board and the teams mentioned above confer with portfolio managers at various times throughout the year. The Board did not identify any particular information or consideration that was all-important or controlling, and each individual Trustee may have attributed different weights to various factors.
After its deliberations, the Board unanimously approved the continuation of the Advisory Agreements for a one-year term and determined that the compensation payable to Funds Management and the Sub-Adviser under each of the Advisory Agreements was reasonable. The Board considered the approval of the Advisory Agreements for the Fund as part of its consideration of agreements for funds across the complex, but its approvals were made on a fund-by-fund basis. The following summarizes a number of important, but not necessarily all, factors considered by the Board in support of its approvals.
Nature, extent and quality of services
The Board received and considered various information regarding the nature, extent and quality of services provided to the Fund by Funds Management and the Sub-Adviser under the Advisory Agreements. This information included a description of the investment advisory services and Fund-level administrative services covered by the Management Agreement, as well as, among other things, a summary of the background and experience of senior management of Wells Fargo Asset Management (“WFAM”), of which Funds Management and the Sub-Adviser are a part, and a summary of investments made in the business of WFAM. The Board also received a description of Funds Management’s and the Sub-Adviser’s business continuity plans and of their approaches to data privacy and cybersecurity, and related testing. The Board also received and reviewed information about Funds Management’s role as administrator of the Fund’s liquidity risk management program, Funds Management’s approach to risk management, and Funds Management’s intermediary and vendor oversight program.
The Board also considered the qualifications, background, tenure and responsibilities of each of the portfolio managers primarily responsible for the day-to-day portfolio management of the Fund. The Board evaluated the ability of Funds Management and the Sub-Adviser to attract and retain qualified investment professionals, including research, advisory and supervisory personnel. The Board further considered the compliance programs and compliance records of Funds Management and the Sub-Adviser. In addition, the Board took into account the full range of services provided to the Fund by Funds Management and its affiliates.
Wells Fargo Special International Small Cap Fund | 29
Table of Contents
Other information (unaudited)
Fund investment performance and expenses
The Board noted that the Fund had recently commenced operations and had no performance history to review. The Board noted that it would have the opportunity to review the Fund’s performance history in connection with the Board’s future review and approval of the Fund’s Advisory Agreements.
The Board received and considered information regarding the Fund’s net operating expense ratios and their various components, including actual management fees, custodian and other non-management fees, and Rule 12b-1 and non-Rule 12b-1 shareholder service fees. The Board considered these ratios in comparison to the median ratios of funds in class-specific expense groups that were determined by Broadridge Inc. (“Broadridge”) to be similar to the Fund (the “Groups”). The Board received a description of the methodology used by Broadridge to select the mutual funds in the expense Groups and an explanation of how funds comprising expense groups and their expense ratios may vary from year-to-year. Based on the Broadridge reports, the Board noted that the net operating expense ratios of the Fund were equal to or lower than the median net operating expense ratios of the expense Groups for each share class.
The Board took into account the Fund’s expense information provided to it among the factors considered in deciding to re-approve the Advisory Agreements. The Board noted, however, that it would receive and review investment performance information for the Fund at future Board meetings, and that it would continue to review the Fund’s investment performance relative to that of funds in a universe determined by Broadridge to be similar to the Fund, and in comparison to the Fund’s benchmark index and to other comparative data.
Investment management and sub-advisory fee rates
The Board reviewed and considered the contractual fee rates payable by the Fund to Funds Management under the Management Agreement, as well as the contractual fee rates payable by the Fund to Funds Management for class-level administrative services under a Class-Level Administration Agreement, which include, among other things, class-level transfer agency and sub-transfer agency costs (collectively, the “Management Rates”). The Board also reviewed and considered the contractual investment sub-advisory fee rates that are payable by Funds Management to the Sub-Adviser for investment sub-advisory services.
Among other information reviewed by the Board was a comparison of the Fund’s Management Rates with the average contractual investment management fee rates of funds in the expense Groups at a common asset level as well as transfer agency costs of the funds in the expense Groups. The Board noted that the Management Rates of the Fund were in range of the sum of these average rates for the Fund’s expense Groups for each share class.
The Board also received and considered information about the portion of the total management fee that was retained by Funds Management after payment of the fee to the Sub-Adviser for sub-advisory services. In assessing the reasonableness of this amount, the Board received and evaluated information about the nature and extent of responsibilities retained and risks assumed by Funds Management and not delegated to or assumed by the Sub-Adviser, and about Funds Management’s on-going oversight services. Given the affiliation between Funds Management and the Sub-Adviser, the Board ascribed limited relevance to the allocation of fees between them.
The Board also received and considered information about the nature and extent of services offered and fee rates charged by Funds Management and the Sub-Adviser to other types of clients with investment strategies similar to those of the Fund. In this regard, the Board received information about the significantly greater scope of services, and compliance, reporting and other legal burdens and risks of managing proprietary mutual funds compared with those associated with managing assets of other types of clients, including third-party sub-advised fund clients and non-mutual fund clients such as institutional separate accounts.
Based on its consideration of the factors and information it deemed relevant, including those described here, the Board determined that the compensation payable to Funds Management under the Management Agreement and to the Sub-Adviser under the Sub-Advisory Agreement was reasonable.
Profitability
The Board received and considered information concerning the profitability of Funds Management, as well as the profitability of both WFAM and Wells Fargo & Co. (“Wells Fargo”) from providing services to the fund family as a whole. The Board noted that the Sub-Adviser’s profitability information with respect to providing services to the Fund and other funds in the family was subsumed in the WFAM and Wells Fargo profitability analysis.
Funds Management reported on the methodologies and estimates used in calculating profitability, including a description of the methodology used to allocate certain expenses. Among other things, the Board noted that the levels of profitability reported on a fund-by-fund basis varied widely, depending on factors such as the size, type and age of fund.
30 | Wells Fargo Special International Small Cap Fund
Table of Contents
Other information (unaudited)
Based on its review, the Board did not deem the profits reported by Funds Management, WFAM or Wells Fargo from services provided to the Fund to be at a level that would prevent it from approving the continuation of the Advisory Agreements.
Economies of scale
The Board received and considered information about the potential for Funds Management to experience economies of scale in the provision of management services to the Fund, the difficulties of calculating economies of scale at an individual fund level, and the extent to which potential scale benefits are shared with shareholders. The Board noted the existence of breakpoints in the Fund’s management fee structure, which operate generally to reduce the Fund’s expense ratios as the Fund grows in size, and the size of the Fund in relation to such breakpoints. The Board considered that in addition to management fee breakpoints, Funds Management shares potential economies of scale from its management business in a variety of ways, including through fee waiver and expense reimbursement arrangements, services that benefit shareholders, competitive management fee rates set at the outset without regard to breakpoints, and investments in the business intended to enhance services available to shareholders.
The Board concluded that Funds Management’s arrangements with respect to the Fund, including contractual breakpoints, constituted a reasonable approach to sharing potential economies of scale with the Fund and its shareholders.
Other benefits to Funds Management and the Sub-Adviser
The Board received and considered information regarding potential “fall-out” or ancillary benefits received by Funds Management and its affiliates, including the Sub-Adviser, as a result of their relationships with the Fund. Ancillary benefits could include, among others, benefits directly attributable to other relationships with the Fund and benefits potentially derived from an increase in Funds Management’s and the Sub-Adviser’s business as a result of their relationships with the Fund. The Board noted that various affiliates of Funds Management may receive distribution-related fees, shareholder servicing payments and sub-transfer agency fees in respect of shares sold or held through them and services provided.
The Board also reviewed information about soft dollar credits earned and utilized by the Sub-Adviser, fees earned by Funds Management and the Sub-Adviser from managing a private investment vehicle for the fund family’s securities lending collateral, and commissions earned by an affiliated broker from portfolio transactions.
Based on its consideration of the factors and information it deemed relevant, including those described here, the Board did not find that any ancillary benefits received by Funds Management and its affiliates, including the Sub-Adviser, were unreasonable.
Conclusion
At the Meeting, after considering the above-described factors and based on its deliberations and its evaluation of the information described above, the Board unanimously approved the continuation of the Advisory Agreements for a one-year term and determined that the compensation payable to Funds Management and the Sub-Adviser under each of the Advisory Agreements was reasonable.
Wells Fargo Special International Small Cap Fund | 31
Table of Contents
Other information (unaudited)
LIQUIDITY RISK MANAGEMENT PROGRAM
In accordance with Rule 22e-4 under the Investment Company Act of 1940, as amended (the “Liquidity Rule”), Wells Fargo Funds Trust (the “Trust”) has adopted and implemented a liquidity risk management program (the “Program”) on behalf of each of its series, including the Fund, which is reasonably designed to assess and manage the Fund’s liquidity risk. “Liquidity risk” is defined as the risk that the Fund is unable to meet redemption requests without significantly diluting remaining investors’ interests in the Fund. The Trust’s Board of Trustees (the “Board”) previously approved the designation of Wells Fargo Funds Management, LLC (“Funds Management”), the Fund’s investment manager, as the administrator of the Program, and Funds Management has established a Liquidity Risk Management Council composed of personnel from multiple departments within Funds Management and its affiliates to assist Funds Management in the implementation and on-going administration of the Program.
The Program is comprised of various components designed to support the assessment and/or management of liquidity risk, including: (1) the periodic assessment (no less frequently than annually) of certain factors that influence the Fund’s liquidity risk; (2) the periodic classification (no less frequently than monthly) of the Fund’s investments into one of four liquidity categories that reflect an estimate of their liquidity under current market conditions; (3) a 15% limit on the acquisition of “illiquid investments” (as defined under the Liquidity Rule); (4) to the extent the Fund does not invest primarily in “highly liquid investments” (as defined under the Liquidity Rule), the determination of a minimum percentage of the Fund’s assets that generally will be invested in highly liquid investments (an “HLIM”); (5) if the Fund has established an HLIM, the periodic review (no less frequently than annually) of the HLIM and the adoption of policies and procedures for responding to a shortfall of the Fund’s “highly liquid investments” below its HLIM; and (6) periodic reporting to the Board.
At a meeting of the Board held on May 26 and 28, 2020, the Board received a written report (the “Report”) from Funds Management that addressed the operation of the Program and assessed its adequacy and effectiveness of implementation. The Report covered the initial period from December 1, 2018 through December 31, 2019 (the “Reporting Period”). No significant liquidity events impacting the Fund were noted in the Report. There were no material changes to the Program during the Reporting Period. The Report concluded that the Program is operating effectively to assess and manage the Fund’s liquidity risk, and that the Program has been and continues to be adequately and effectively implemented to monitor and, as applicable, respond to the Fund’s liquidity developments.
There can be no assurance that the Program will achieve its objectives under all circumstances in the future. Please refer to the Fund’s prospectus for more information regarding the Fund’s exposure to liquidity risk and other risks to which an investment in the Fund may be subject.
32 | Wells Fargo Special International Small Cap Fund
Table of Contents
For more information
More information about Wells Fargo Funds is available free upon request. To obtain literature, please write, visit the Fund’s website, or call:
Wells Fargo Funds
P.O. Box 219967
Kansas City, MO 64121-9967
Website: wfam.com
Individual investors: 1-800-222-8222
Retail investment professionals: 1-888-877-9275
Institutional investment professionals: 1-866-765-0778

This report and the financial statements contained herein are submitted for the general information of the shareholders of the Fund. If this report is used for promotional purposes, distribution of the report must be accompanied or preceded by a current prospectus. Before investing, please consider the investment objectives, risks, charges, and expenses of the investment. For a current prospectus and, if available, a summary prospectus, containing this information, call 1-800-222-8222 or visit the Fund’s website at wfam.com. Read the prospectus carefully before you invest or send money.
Wells Fargo Asset Management (WFAM) is the trade name for certain investment advisory/management firms owned by Wells Fargo & Company. These firms include but are not limited to Wells Capital Management Incorporated and Wells Fargo Funds Management, LLC. Certain products managed by WFAM entities are distributed by Wells Fargo Funds Distributor, LLC (a broker-dealer and Member FINRA).
This material is for general informational and educational purposes only and is NOT intended to provide investment advice or a recommendation of any kind—including a recommendation for any specific investment, strategy, or plan.
INVESTMENT PRODUCTS: NOT FDIC INSURED ◾ NO BANK GUARANTEE ◾ MAY LOSE VALUE
© 2020 Wells Fargo & Company. All rights reserved.
PAR-1120-00561 12-20
A296/AR296 10-20
Table of Contents
ITEM 2. CODE OF ETHICS
(a) As of the end of the period covered by the report, Wells Fargo Funds Trust has adopted a code of ethics that applies to its President and Treasurer. A copy of the code of ethics is filed as an exhibit to this Form N-CSR.
(c) During the period covered by this report, there were no amendments to the provisions of the code of ethics adopted in Item 2(a) above.
(d) During the period covered by this report, there were no implicit or explicit waivers to the provisions of the code of ethics adopted in Item 2(a) above.
ITEM 3. AUDIT COMMITTEE FINANCIAL EXPERT
The Board of Trustees of Wells Fargo Funds Trust has determined that Judith Johnson is an audit committee financial expert, as defined in Item 3 of Form N-CSR. Mrs. Johnson is independent for purposes of Item 3 of Form N-CSR.
ITEM 4. PRINCIPAL ACCOUNTANT FEES AND SERVICES
(a), (b), (c), (d) The following table presents aggregate fees billed in each of the last two fiscal years for services rendered to the Registrant by the Registrant’s principal accountant. These fees were billed to the registrant and were approved by the Registrant’s audit committee.
| Fiscal year ended October 31, 2020 | Fiscal year ended October 31, 2019 | |||||||
Audit fees | $ | 255,990 | $ | 296,285 | ||||
Audit-related fees | 7,220 | 38,700 | ||||||
Tax fees (1) | 39,270 | 44,750 | ||||||
All other fees | — | — | ||||||
|
|
|
| |||||
| $ | 302,480 | $ | 379,735 | |||||
|
|
|
| |||||
(1) Tax fees consist of fees for tax compliance, tax advice, tax planning and excise tax.
(e) The Chair of the Audit Committees is authorized to pre-approve: (1) audit services for the mutual funds of Wells Fargo Funds Trust; (2) non-audit tax or compliance consulting or training services provided to the Funds by the independent auditors (“Auditors”) if the fees for any particular engagement are not anticipated to exceed $50,000; and (3) non-audit tax or compliance consulting or training services provided by the Auditors to a Fund’s investment adviser and its controlling entities (where pre-approval is required because the engagement relates directly to the operations and financial reporting of the Fund) if the fee to the Auditors for any particular engagement is not anticipated to exceed $50,000. For any such pre-approval sought from the Chair, Management shall prepare a brief description of the proposed services.
If the Chair approves of such service, he or she shall sign the statement prepared by Management.
Such written statement shall be presented to the full Committees at their next regularly scheduled meetings.
Table of Contents
(f) Not applicable
(g) Not applicable
(h) Not applicable
ITEM 5. AUDIT COMMITTEE OF LISTED REGISTRANTS
Not applicable.
ITEM 6. INVESTMENTS
A Portfolio of Investments for each series of Wells Fargo Funds Trust is included as part of the report to shareholders filed under Item 1 of this Form.
ITEM 7. DISCLOSURE OF PROXY VOTING POLICIES AND PROCEDURES FOR CLOSED-END MANAGEMENT INVESTMENT COMPANIES
Not applicable.
ITEM 8. PORTFOLIO MANAGERS OF CLOSED-END MANAGEMENT INVESTMENT COMPANIES
Not applicable.
ITEM 9. PURCHASES OF EQUITY SECURITIES BY CLOSED-END MANAGEMENT INVESTMENT COMPANY AND AFFILIATED PURCHASERS
Not applicable.
ITEM 10. SUBMISSION OF MATTERS TO A VOTE OF SECURITY HOLDERS
There have been no material changes to the procedures by which shareholders may recommend nominees to the registrant’s Board of Trustees that have been implemented since the registrant’s last provided disclosure in response to the requirements of this Item.
ITEM 11. CONTROLS AND PROCEDURES
(a) The President and Treasurer have concluded that the Wells Fargo Funds Trust disclosure controls and procedures (as defined in Rule 30a-3(c) under the Investment Company Act of 1940) provide reasonable assurances that material information relating to the registrant is made known to them by the appropriate persons based on their evaluation of these controls and procedures as of a date within 90 days of the filing of this report.
Table of Contents
(b) There were no significant changes in the registrant’s internal controls over financial reporting (as defined in Rule 30a-3(d) under the Investment Company Act of 1940) that occurred during the most recent fiscal half-year of the period covered by this report that materially affected, or is reasonably likely to materially affect, the registrant’s internal control over financial reporting.
ITEM 12. DISCLOSURES OF SECURITIES LENDING ACTIVITIES FOR CLOSED-END MANAGEMENT INVESTMENT COMPANIES
Not applicable.
ITEM 13. EXHIBITS
| (a)(1) | Code of Ethics. | |
| (a)(2) | Certifications pursuant to Section 302 of the Sarbanes-Oxley Act of 2002. | |
| (b) | Certifications pursuant to Section 906 of the Sarbanes-Oxley Act of 2002. | |
Table of Contents
SIGNATURES
Pursuant to the requirements of the Securities Exchange Act of 1934 and the Investment Company Act of 1940, the registrant has duly caused this report to be signed on its behalf by the undersigned, thereunto duly authorized.
| Wells Fargo Funds Trust | ||
| By: | ||
| /s/ Andrew Owen | ||
Andrew Owen President | ||
| Date: | December 22, 2020 | |
Pursuant to the requirements of the Securities Exchange Act of 1934 and the Investment Company Act of 1940, this report has been signed below by the following persons on behalf of the registrant and in the capacities and on the date indicated.
| Wells Fargo Funds Trust | ||
| By: | ||
| /s/ Andrew Owen | ||
Andrew Owen President | ||
| Date: | December 22, 2020 | |
| By: | ||
| /s/ Jeremy DePalma | ||
Jeremy DePalma Treasurer | ||
| Date: | December 22, 2020 | |