UNITED STATES
SECURITIES AND EXCHANGE COMMISSION
Washington, D.C. 20549
FORM N-CSRS
CERTIFIED SHAREHOLDER REPORT OF REGISTERED
MANAGEMENT INVESTMENT COMPANIES
Investment Company Act file number: 811-09253
Wells Fargo Funds Trust
(Exact name of registrant as specified in charter)
525 Market St., San Francisco, CA 94105
(Address of principal executive offices) (Zip code)
Matthew Prasse
Wells Fargo Funds Management, LLC
525 Market St., San Francisco, CA 94105
(Name and address of agent for service)
Registrant’s telephone number, including area code: 800-222-8222
Date of fiscal year end: March 31
Registrant is making a filing for 7 of its series:
Wells Fargo Small Cap Fund, Wells Fargo Disciplined Small Cap Fund, Wells Fargo Special Small Cap Value Fund, Wells Fargo Fundamental Small Cap Growth Fund, Wells Fargo Precious Metals Fund, Wells Fargo Specialized Technology Fund, and Wells Fargo Utility and Telecommunications Fund.
Date of reporting period: September 30, 2021
ITEM 1. REPORT TO STOCKHOLDERS
Semi-Annual Report
September 30, 2021
Wells Fargo
Disciplined Small Cap Fund
The views expressed and any forward-looking statements are as of September 30, 2021, unless otherwise noted, and are those of the Fund's portfolio managers and/or Allspring Global Investments. Discussions of individual securities or the markets generally are not intended as individual recommendations. Future events or results may vary significantly from those expressed in any forward-looking statements. The views expressed are subject to change at any time in response to changing circumstances in the market. Allspring Global Investments disclaims any obligation to publicly update or revise any views expressed or forward-looking statements.
Wells Fargo Disciplined Small Cap Fund | 1
Letter to shareholders (unaudited)
Andrew Owen
President
Wells Fargo Funds
Dear Shareholder:
We are pleased to offer you this semi-annual report for Wells Fargo Disciplined Small Cap Fund for the six-month period that ended September 30, 2021. Global stocks continued to rally as the global economy continued to emerge from the haze of COVID-19. Tailwinds were provided by global stimulus programs, a rapid vaccination rollout, and recovering consumer and corporate sentiment. Bonds were mixed during the period, with municipal bonds and high-yield bonds delivering positive returns.
For the six-month period, U.S. stocks, based on the S&P 500 Index,1 gained 9.18%. International stocks, as measured by the MSCI ACWI ex USA Index (Net),2 returned 2.32%, while the MSCI EM Index (Net),3 trailed its developed market counterparts with a 3.45% loss. Among bond indexes, the Bloomberg U.S. Aggregate Bond Index,4 returned 1.88%, the Bloomberg Global Aggregate ex-USD Index (unhedged),5 returned -0.69%, the Bloomberg Municipal Bond Index6 returned 1.15%, and the ICE BofA U.S. High Yield Index,7 gained 3.74%.
Vaccination rollout drove the stock markets to new highs.
Equity markets produced another strong showing in April. Domestically, the continued reopening of the economy had a strong impact on positive equity performance, as people started leaving their households and jobless claims continued to fall. Domestic corporate bonds performed well and the U.S. dollar weakened. Meanwhile, the U.S. government continued to seek to invest in the recovery, this time by outlining a package of over $2 trillion to improve infrastructure. The primary headwind in April was inflation, as investors tried to determine the breadth and longevity of recent price increases. Developed Europe has been supported by a meaningful increase in the pace of vaccinations. Unfortunately many emerging market countries have not been as successful. India in particular saw COVID-19 cases surge, serving as an example of the need to get vaccinations rolled out to less developed nations.
| 1 | The S&P 500 Index consists of 500 stocks chosen for market size, liquidity, and industry group representation. It is a market-value-weighted index with each stock's weight in the index proportionate to its market value. You cannot invest directly in an index. |
| 2 | The Morgan Stanley Capital International (MSCI) All Country World Index (ACWI) ex USA Index (Net) is a free-float-adjusted market-capitalization-weighted index that is designed to measure the equity market performance of developed and emerging markets, excluding the U.S. Source: MSCI. MSCI makes no express or implied warranties or representations and shall have no liability whatsoever with respect to any MSCI data contained herein. The MSCI data may not be further redistributed or used as a basis for other indexes or any securities or financial products. This report is not approved, reviewed, or produced by MSCI. You cannot invest directly in an index. |
| 3 | The MSCI Emerging Markets (EM) Index (Net) is a free-float-adjusted market-capitalization-weighted index that is designed to measure equity market performance of emerging markets. You cannot invest directly in an index. |
| 4 | The Bloomberg U.S. Aggregate Bond Index is a broad-based benchmark that measures the investment-grade, U.S.-dollar-denominated, fixed-rate taxable bond market, including Treasuries, government-related and corporate securities, mortgage-backed securities (agency fixed-rate and hybrid adjustable-rate mortgage pass-throughs), asset-backed securities, and commercial mortgage-backed securities. You cannot invest directly in an index. |
| 5 | The Bloomberg Global Aggregate ex-USD Index (unhedged) is an unmanaged index that provides a broad-based measure of the global investment-grade fixed-income markets excluding the U.S.-dollar-denominated debt market. You cannot invest directly in an index. |
| 6 | The Bloomberg Municipal Bond Index is an unmanaged index composed of long-term tax-exempt bonds with a minimum credit rating of Baa. You cannot invest directly in an index. |
| 7 | The ICE BofA U.S. High Yield Index is a market-capitalization-weighted index of domestic and Yankee high-yield bonds. The index tracks the performance of high-yield securities traded in the U.S. bond market. You cannot invest directly in an index. Copyright 2021. ICE Data Indices, LLC. All rights reserved. |
2 | Wells Fargo Disciplined Small Cap Fund
Letter to shareholders (unaudited)
Vaccine rollouts continued in May, leading to loosened restrictions globally. As a result, equity markets in general saw a minor increase in returns. Concerns that the continued economic rebound could result in inflation increases becoming more than transitory were supported by the higher input costs businesses were experiencing. Meanwhile, those inflation concerns were tempered by the U.S. Federal Reserve (Fed), which stayed steady on its view of the economy and eased fears of a sudden and substantial policy change. Positive performance in the emerging market equity space was supported this month by steady consumer demand and strong commodity prices. Fixed-income markets were also slightly positive for the month, driven by inflation uncertainty and a softer U.S. dollar.
June witnessed the S&P 500 Index reach a new all-time high. 2021 economic growth and inflation forecasts were revised higher to reflect a strong economic recovery and some supply and demand imbalances. Late June saw a deal reached on a U.S. infrastructure package of approximately $1 trillion for road, bridge, and broadband network upgrades over the next eight years. The Fed’s June meeting yielded no change to policy, but its projections pointed to a possible interest rate rise in 2023. This, combined with a rebound in economic activity and investors searching for yield, led to U.S. Treasury yields being down for the month. Many European and Asian countries saw vaccination momentum increase, while the U.K. dealt with a rise in COVID-19 infections, specifically the Delta variant. Meanwhile, crude oil jumped over 10% in June on the back of the pickup in global economic activity and the Organization of the Petroleum Exporting Countries’ (OPEC) slow pace of supply growth.
July began the month seeing vaccinations making progress, as several major developed countries eased restrictions, only to be threatened again by the spread of COVID-19’s Delta variant. Inflation continued to climb, aided by the continued supply bottleneck in the face of high demand. As it pertains to the equity area of the market, U.S. equities led the way in positive return territory, followed by international developed markets. In contrast, emerging markets were well in negative territory for the month, hindered by China’s plans for new regulations on a number of sectors, specifically education and technology. The U.S. 10-Year Treasury bond yield continued to decline, as strong demand swallowed up supply. After hitting a multi-year high earlier in the month, oil prices leveled off following an agreement by OPEC to raise oil production starting in August.
The Delta variant of COVID-19 produced outbreaks globally in August, increasing the potential for increased market volatility and bringing into question the ongoing economic recovery. Domestically, the U.S. economy continued to stay strong in the face of the Delta variant, continued inflationary pressures, and worries over Hurricane Ida. Emerging market equities experienced elevated volatility, largely influenced by China’s regulatory stance. Emerging market equities started the month with poor performance but rebounded to end the month in positive territory. Municipal debt experienced its first monthly performance drop since February of this year, slowing a rally that made it one of the best-performing sectors of the bond market. In the commodity segment of the market, crude oil fell sharply during the month on the back of dampened expectations as a result of the Delta variant but was still a leading asset class performer for the year.
Global markets suffered their broadest retreat in a year during September, with the exception of commodities. Concerns over inflation and the interest rate outlook depressed investor confidence and hurt performance. Emerging markets declined on concerns over the continued supply chain disruptions and worries over higher energy and food prices. Meanwhile, the Fed indicated it would slow the pace of asset purchases in the near future (pointing towards November). All eyes domestically are fixed on the raising of the debt ceiling, the 2022 budget plan, and the ongoing debate over the infrastructure package. Contrary to most asset classes, commodities thrived in September, driven by sharply higher energy prices.
“ 2021 economic growth and inflation forecasts were revised higher to reflect a strong economic recovery and some supply and demand imbalances.”
“ Municipal debt experienced its first monthly performance drop since February of this year, slowing a rally that made it one of the best-performing sectors of the bond market.”
Wells Fargo Disciplined Small Cap Fund | 3
Letter to shareholders (unaudited)
Don’t let short-term uncertainty derail long-term investment goals.
Periods of investment uncertainty can present challenges, but experience has taught us that maintaining long-term investment goals can be an effective way to plan for the future. To help you create a sound strategy based on your personal goals and risk tolerance, Wells Fargo Funds offers more than 100 mutual funds spanning a wide range of asset classes and investment styles. Although diversification cannot guarantee an investment profit or prevent losses, we believe it can be an effective way to manage investment risk and potentially smooth out overall portfolio performance. We encourage investors to know their investments and to understand that appropriate levels of risk-taking may unlock opportunities.
On November 1, 2021, GTCR LLC and Reverence Capital Partners, L.P., announced the beginning of Allspring Global Investments™, with the close of the transaction to acquire Wells Fargo Funds Management, LLC; Wells Capital Management LLC; Galliard Capital Management LLC.; Wells Fargo Asset Management (International) Ltd.; Wells Fargo Asset Management Luxembourg S.A.; and Wells Fargo Funds Distributor, LLC, as well as Wells Fargo Bank, N.A.’s business of acting as trustee to its collective investment trusts and all related Wells Fargo Asset Management legal entities. The transaction closed on November 1, 2021, forming Allspring Global Investments, LLC, a privately held asset management firm with $587 billion in AUM1 as of September 30, 2021.
Allspring Global Investments™ is a leading independent asset management firm with a full breadth of investment capabilities across diverse asset classes, serving the needs of its institutional and wealth management clients around the world. Allspring operates across 18 offices globally supported by more than 480 investment professionals. Allspring and its investment teams provide a broad range of differentiated investment products and solutions to help its diverse range of clients meet their investment objectives.
As part of this transition, all mutual funds within the Wells Fargo Funds family will be rebranded as Allspring Funds. Each individual fund will have “Wells Fargo” removed from its fund name to be replaced with “Allspring.” The fund name changes are expected to take place on December 6, 2021.
Allspring Global Investments is the trade name for the asset management firms of Allspring Global Investments Holdings, LLC, a holding company indirectly owned by certain private funds of GTCR LLC and Reverence Capital Partners, L.P.
Thank you for choosing to invest with Wells Fargo Funds. We appreciate your confidence in us and remain committed to helping you meet your financial needs.
Sincerely,
Andrew Owen
President
Wells Fargo Funds
For further information about your Fund, contact your investment professional, visit our website at allspringglobal.com, or call us directly at 1-800-222-8222.
| 1 | As of September 30, 2021, assets under management (AUM) includes $93 billion from Galliard Capital Management, an investment advisor that is not part of the Allspring trade name/GIPS firm. |
4 | Wells Fargo Disciplined Small Cap Fund
This page is intentionally left blank.
Performance highlights (unaudited)
| Investment objective | The Fund seeks long-term capital appreciation. |
| Manager | Allspring Funds Management, LLC |
| Subadviser | Allspring Global Investments, LLC |
| Portfolio managers | Justin P. Carr, CFA®‡, Robert M. Wicentowski, CFA®‡ |
| Average annual total returns (%) as of September 30, 2021 |
| | | Including sales charge | | Excluding sales charge | | Expense ratios1 (%) |
| | Inception date | 1 year | 5 year | 10 year | | 1 year | 5 year | 10 year | | Gross | Net 2 |
| Class A (WDSAX)3 | 7-31-2018 | 40.37 | 8.77 | 12.09 | | 48.94 | 10.07 | 12.75 | | 1.84 | 0.93 |
| Class R6 (WSCJX)4 | 10-31-2016 | – | – | – | | 49.20 | 10.18 | 12.87 | | 1.41 | 0.50 |
| Administrator Class (NVSOX) | 8-1-1993 | – | – | – | | 48.66 | 9.89 | 12.67 | | 1.76 | 0.85 |
| Institutional Class (WSCOX)5 | 10-31-2014 | – | – | – | | 48.95 | 10.16 | 12.86 | | 1.51 | 0.60 |
| Russell 2000® Index6 | – | – | – | – | | 47.68 | 13.45 | 14.63 | | – | – |
Figures quoted represent past performance, which is no guarantee of future results, and do not reflect taxes that a shareholder may pay on an investment in a fund. Investment return and principal value of an investment will fluctuate so that an investor’s shares, when redeemed, may be worth more or less than their original cost. Performance shown without sales charges would be lower if sales charges were reflected. Current performance may be lower or higher than the performance data quoted, which assumes the reinvestment of dividends and capital gains. Current month-end performance is available on the Fund’s website, allspringglobal.com.
Please keep in mind that high double-digit returns were primarily achieved during favorable market conditions. You should not expect that such favorable returns can be consistently achieved. A fund’s performance, especially for short time periods, should not be the sole factor in making your investment decision.
Index returns do not include transaction costs associated with buying and selling securities, any mutual fund fees or expenses, or any taxes. It is not possible to invest directly in an index.
For Class A shares, the maximum front-end sales charge is 5.75%. Class R6, Administrator Class and Institutional Class shares are sold without a front-end sales charge or contingent deferred sales charge.
| 1 | Reflects the expense ratios as stated in the most recent prospectuses. The expense ratios shown are subject to change and may differ from the annualized expense ratios shown in the financial highlights of this report. |
| 2 | The manager has contractually committed through July 31, 2022, to waive fees and/or reimburse expenses to the extent necessary to cap total annual fund operating expenses after fee waivers at 0.93% for Class A, 0.50% for Class R6, 0.85% for Administrator Class, and 0.60% for Institutional Class. Brokerage commissions, stamp duty fees, interest, taxes, acquired fund fees and expenses (if any), and extraordinary expenses are excluded from the expense caps. Prior to or after the commitment expiration date, the caps may be increased or the commitment to maintain the caps may be terminated only with the approval of the Board of Trustees. Without these caps, the Fund’s returns would have been lower. The expense ratio paid by an investor is the net expense ratio (the total annual fund operating expenses after fee waivers) as stated in the prospectuses. |
| 3 | Historical performance shown for the Class A shares prior to their inception reflects the performance of the Administrator Class shares, and is adjusted to reflect the higher expenses and sales charges of the Class A shares. |
| 4 | Historical performance shown for the Class R6 shares prior to their inception reflects the performance of the Institutional Class shares, and includes the higher expenses applicable to the Institutional Class shares. If these expenses had not been included, returns for the Class R6 shares would be higher. |
| 5 | Historical performance shown for the Institutional Class shares prior to their inception reflects the performance of the Administrator Class shares, and includes the higher expenses applicable to the Administrator Class shares. If these expenses had not been included, returns for the Institutional Class shares would be higher. |
| 6 | The Russell 2000® Index measures the performance of the 2,000 smallest companies in the Russell 3000® Index, which represents approximately 8% of the total market capitalization of the Russell 3000® Index. You cannot invest directly in an index. |
Stock values fluctuate in response to the activities of individual companies and general market and economic conditions. Smaller-company stocks tend to be more volatile and less liquid than those of larger companies. The use of derivatives may reduce returns and/or increase volatility. Consult the Fund’s prospectus for additional information on these and other risks.
| ‡ | CFA® and Chartered Financial Analyst® are trademarks owned by CFA Institute. |
6 | Wells Fargo Disciplined Small Cap Fund
Performance highlights (unaudited)
| Ten largest holdings (%) as of September 30, 20211 |
| SPS Commerce Incorporated | 0.95 |
| Apollo Medical Holdings Incorporated | 0.76 |
| Tenet Healthcare Corporation | 0.74 |
| Magnolia Oil & Gas Corporation | 0.73 |
| EMCOR Group Incorporated | 0.71 |
| Arcbest Corporation | 0.71 |
| Rimini Street Incorporated | 0.69 |
| Mimecast Limited | 0.68 |
| Hillenbrand Incorporated | 0.62 |
| Atkore International Incorporated | 0.62 |
| 1 | Figures represent the percentage of the Fund's net assets. Holdings are subject to change and may have changed since the date specified. |
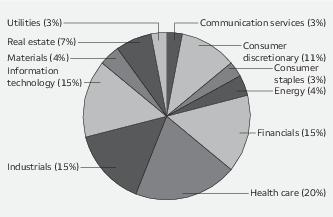
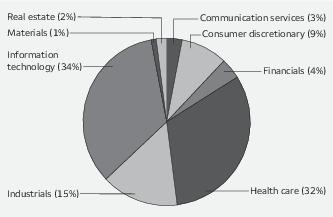
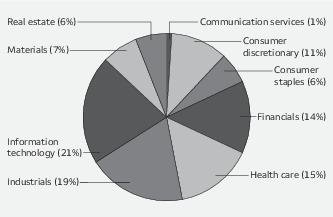
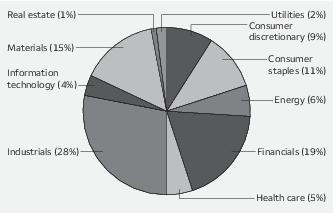
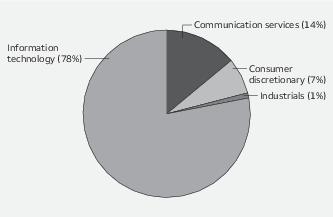
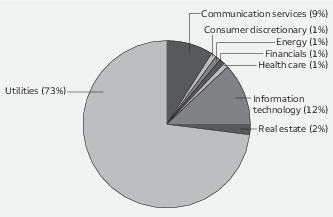
| Sector allocation as of September 30, 20211 |
| 1 | Figures represent the percentage of the Fund's long-term investments. These amounts are subject to change and may have changed since the date specified. |
Wells Fargo Disciplined Small Cap Fund | 7
Fund expenses (unaudited)
As a shareholder of the Fund, you incur two types of costs: (1) transaction costs, including sales charges (loads) on purchase payments and contingent deferred sales charges (if any) on redemptions and (2) ongoing costs, including management fees, shareholder servicing fees, and other Fund expenses. This example is intended to help you understand your ongoing costs (in dollars) of investing in the Fund and to compare these costs with the ongoing costs of investing in other mutual funds.
The example is based on an investment of $1,000 invested at the beginning of the six-month period and held for the entire period from April 1, 2021 to September 30, 2021.
Actual expenses
The “Actual” line of the table below provides information about actual account values and actual expenses. You may use the information in this line, together with the amount you invested, to estimate the expenses that you paid over the period. Simply divide your account value by $1,000 (for example, an $8,600 account value divided by $1,000 = 8.6), then multiply the result by the number in the “Actual” line under the heading entitled “Expenses paid during period” for your applicable class of shares to estimate the expenses you paid on your account during this period.
Hypothetical example for comparison purposes
The “Hypothetical” line of the table below provides information about hypothetical account values and hypothetical expenses based on the Fund’s actual expense ratio and an assumed rate of return of 5% per year before expenses, which is not the Fund’s actual return. The hypothetical account values and expenses may not be used to estimate the actual ending account balance or expenses you paid for the period. You may use this information to compare the ongoing costs of investing in the Fund and other funds. To do so, compare this 5% hypothetical example with the 5% hypothetical examples that appear in the shareholder reports of the other funds.
Please note that the expenses shown in the table are meant to highlight your ongoing costs only and do not reflect any transactional costs, such as sales charges (loads) and contingent deferred sales charges. Therefore, the “Hypothetical” line of the table is useful in comparing ongoing costs only, and will not help you determine the relative total costs of owning different funds. In addition, if these transactional costs were included, your costs would have been higher.
| | Beginning
account value
4-1-2021 | Ending
account value
9-30-2021 | Expenses
paid during
the period1 | Annualized net
expense ratio |
| Class A | | | | |
| Actual | $1,000.00 | $1,022.28 | $4.66 | 0.92% |
| Hypothetical (5% return before expenses) | $1,000.00 | $1,020.46 | $4.66 | 0.92% |
| Class R6 | | | | |
| Actual | $1,000.00 | $1,025.33 | $2.54 | 0.50% |
| Hypothetical (5% return before expenses) | $1,000.00 | $1,022.56 | $2.54 | 0.50% |
| Administrator Class | | | | |
| Actual | $1,000.00 | $1,023.30 | $4.31 | 0.85% |
| Hypothetical (5% return before expenses) | $1,000.00 | $1,020.81 | $4.31 | 0.85% |
| Institutional Class | | | | |
| Actual | $1,000.00 | $1,025.00 | $3.05 | 0.60% |
| Hypothetical (5% return before expenses) | $1,000.00 | $1,022.06 | $3.04 | 0.60% |
1 Expenses paid is equal to the annualized net expense ratio of each class multiplied by the average account value over the period, multiplied by the number of days in the most recent fiscal half-year divided by the number of days in the fiscal year (to reflect the one-half-year period).
8 | Wells Fargo Disciplined Small Cap Fund
Portfolio of investments—September 30, 2021 (unaudited)
| | | | | Shares | Value |
| Common stocks: 98.16% | | | | | |
| Communication services: 2.85% | | | | | |
| Diversified telecommunication services: 0.20% | | | | | |
| Ooma Incorporated † | | | | 2,814 | $ 52,369 |
| Interactive media & services: 0.45% | | | | | |
| Liberty TripAdvisor Holdings Incorporated Class A † | | | | 16,771 | 51,822 |
| QuinStreet Incorporated † | | | | 3,691 | 64,814 |
| | | | | | 116,636 |
| Media: 1.91% | | | | | |
| AMC Networks Incorporated Class A † | | | | 375 | 17,471 |
| Entravision Communications Corporation Class A | | | | 19,970 | 141,787 |
| Gray Television Incorporated | | | | 4,903 | 111,886 |
| Hemisphere Media Group Incorporated † | | | | 2,446 | 29,792 |
| Magnite Incorporated † | | | | 1,545 | 43,260 |
| National CineMedia Incorporated | | | | 5,958 | 21,210 |
| Nexstar Media Group Incorporated Class A | | | | 865 | 131,445 |
| | | | | | 496,851 |
| Wireless telecommunication services: 0.29% | | | | | |
| Gogo Incorporated † | | | | 4,304 | 74,459 |
| Consumer discretionary: 11.20% | | | | | |
| Auto components: 0.98% | | | | | |
| Dana Incorporated | | | | 5,223 | 116,160 |
| Gentherm Incorporated † | | | | 473 | 38,280 |
| Standard Motor Products Incorporated | | | | 1,156 | 50,529 |
| The Goodyear Tire & Rubber Company † | | | | 2,753 | 48,728 |
| | | | | | 253,697 |
| Diversified consumer services: 0.71% | | | | | |
| Grand Canyon Education Incorporated † | | | | 370 | 32,545 |
| Perdoceo Education Corporation † | | | | 5,652 | 59,685 |
| Stride Incorporated † | | | | 1,922 | 69,077 |
| Vivint Smart Home Incorporated † | | | | 2,480 | 23,436 |
| | | | | | 184,743 |
| Hotels, restaurants & leisure: 2.60% | | | | | |
| Bloomin' Brands Incorporated † | | | | 4,214 | 105,350 |
| Boyd Gaming Corporation † | | | | 1,058 | 66,929 |
| Brinker International Incorporated † | | | | 1,328 | 65,138 |
| Del Taco Restaurants Incorporated | | | | 6,754 | 58,962 |
| International Game Technology plc † | | | | 5,388 | 141,812 |
| Marriott Vacations Worldwide Corporation | | | | 643 | 101,163 |
| Penn National Gaming Incorporated † | | | | 1,314 | 95,212 |
| Wingstop Incorporated | | | | 250 | 40,983 |
| | | | | | 675,549 |
| Household durables: 2.63% | | | | | |
| Beazer Homes Incorporated † | | | | 3,503 | 60,427 |
| Helen of Troy Limited † | | | | 415 | 93,242 |
| Installed Building Products | | | | 415 | 44,467 |
| iRobot Corporation † | | | | 393 | 30,851 |
The accompanying notes are an integral part of these financial statements.
Wells Fargo Disciplined Small Cap Fund | 9
Portfolio of investments—September 30, 2021 (unaudited)
| | | | | Shares | Value |
| Household durables (continued) | | | | | |
| KB Home Incorporated | | | | 1,580 | $ 61,494 |
| M/I Homes Incorporated † | | | | 1,368 | 79,070 |
| Meritage Corporation † | | | | 878 | 85,166 |
| Taylor Morrison Home Corporation † | | | | 3,973 | 102,424 |
| TopBuild Corporation † | | | | 341 | 69,840 |
| Universal Electronics Incorporated † | | | | 1,165 | 57,376 |
| | | | | | 684,357 |
| Internet & direct marketing retail: 0.79% | | | | | |
| 1-800-Flowers.com Incorporated Class A † | | | | 1,991 | 60,745 |
| Overstock.com Incorporated † | | | | 1,299 | 101,218 |
| Stitch Fix Incorporated Class A † | | | | 1,075 | 42,946 |
| | | | | | 204,909 |
| Multiline retail: 0.40% | | | | | |
| Big Lots Stores Incorporated | | | | 2,381 | 103,240 |
| Specialty retail: 2.36% | | | | | |
| American Eagle Outfitters Incorporated | | | | 1,935 | 49,923 |
| Asbury Automotive Group Incorporated † | | | | 800 | 157,392 |
| Bed Bath & Beyond Incorporated † | | | | 2,236 | 38,627 |
| Big 5 Sporting Goods Corporation « | | | | 2,880 | 66,355 |
| Hibbett Sports Incorporated | | | | 1,705 | 120,612 |
| ODP Corporation † | | | | 1,391 | 55,863 |
| Zumiez Incorporated † | | | | 3,162 | 125,721 |
| | | | | | 614,493 |
| Textiles, apparel & luxury goods: 0.73% | | | | | |
| Deckers Outdoor Corporation † | | | | 332 | 119,586 |
| Steven Madden Limited | | | | 1,760 | 70,682 |
| | | | | | 190,268 |
| Consumer staples: 3.19% | | | | | |
| Beverages: 0.24% | | | | | |
| Boston Beer Company Incorporated Class A † | | | | 39 | 19,880 |
| National Beverage Corporation | | | | 817 | 42,884 |
| | | | | | 62,764 |
| Food & staples retailing: 1.03% | | | | | |
| Performance Food Group Company † | | | | 1,473 | 68,436 |
| Rite Aid Corporation † | | | | 1,109 | 15,748 |
| The Andersons Incorporated | | | | 3,776 | 116,414 |
| United Natural Foods Incorporated † | | | | 1,402 | 67,885 |
| | | | | | 268,483 |
| Food products: 0.86% | | | | | |
| Fresh Del Monte Produce Incorporated | | | | 1,518 | 48,910 |
| John B. Sanfilippo & Son Incorporated | | | | 494 | 40,370 |
| Sanderson Farms Incorporated | | | | 294 | 55,331 |
| The Simply Good Foods Company † | | | | 2,285 | 78,810 |
| | | | | | 223,421 |
The accompanying notes are an integral part of these financial statements.
10 | Wells Fargo Disciplined Small Cap Fund
Portfolio of investments—September 30, 2021 (unaudited)
| | | | | Shares | Value |
| Personal products: 1.06% | | | | | |
| Medifast Incorporated | | | | 712 | $ 137,160 |
| USANA Health Sciences Incorporated † | | | | 1,484 | 136,825 |
| | | | | | 273,985 |
| Energy: 4.11% | | | | | |
| Energy equipment & services: 0.78% | | | | | |
| Nabors Industries Limited † | | | | 415 | 40,039 |
| Nextier Oilfield Solutions Incorporated † | | | | 16,166 | 74,364 |
| Oceaneering International Incorporated † | | | | 6,576 | 87,592 |
| | | | | | 201,995 |
| Oil, gas & consumable fuels: 3.33% | | | | | |
| Bonanza Creek Energy Incorporated | | | | 3,238 | 155,100 |
| Magnolia Oil & Gas Corporation | | | | 10,676 | 189,926 |
| PDC Energy Incorporated | | | | 2,321 | 109,992 |
| Penn Virginia Corporation † | | | | 5,808 | 154,899 |
| Renewable Energy Group Incorporated † | | | | 1,485 | 74,547 |
| Scorpio Tankers Incorporated | | | | 2,163 | 40,102 |
| SM Energy Company | | | | 3,057 | 80,644 |
| World Fuel Services Corporation | | | | 1,829 | 61,491 |
| | | | | | 866,701 |
| Financials: 15.17% | | | | | |
| Banks: 7.85% | | | | | |
| BancFirst Corporation | | | | 1,065 | 64,028 |
| BankUnited Incorporated | | | | 3,131 | 130,938 |
| Brookline Bancorp Incorporated | | | | 5,526 | 84,327 |
| CNB Financial Corporation | | | | 2,324 | 56,566 |
| Customers Bancorp Incorporated † | | | | 2,161 | 92,966 |
| Enterprise Financial Service | | | | 1,268 | 57,415 |
| First Bancorp of North Carolina | | | | 2,206 | 94,880 |
| First Bancorp of Puerto Rico | | | | 8,219 | 108,080 |
| First Interstate BancSystem Class A | | | | 2,021 | 81,365 |
| First Merchants Corporation | | | | 1,862 | 77,906 |
| Great Southern Bancorp Incorporated | | | | 1,435 | 78,652 |
| Hancock Holding Company | | | | 1,883 | 88,727 |
| Hilltop Holdings Incorporated | | | | 3,258 | 106,439 |
| Independent Bank Corporation | | | | 3,349 | 71,937 |
| Investors Bancorp Incorporated | | | | 4,656 | 70,352 |
| Metropolitan Bank Holding Corporation † | | | | 416 | 35,069 |
| NBT Bancorp Incorporated | | | | 3,064 | 110,672 |
| OFG Bancorp | | | | 4,807 | 121,233 |
| Preferred Bank | | | | 1,737 | 115,823 |
| Sterling Bancorp | | | | 2,780 | 69,389 |
| The Bancorp Incorporated † | | | | 4,463 | 113,583 |
| TriCo Bancshares | | | | 2,433 | 105,592 |
| Westamerica Bancorporation | | | | 1,858 | 104,531 |
| | | | | | 2,040,470 |
| Capital markets: 2.17% | | | | | |
| Artisan Partners Asset Management Incorporated Class A | | | | 1,742 | 85,219 |
| Cowen Incorporated Class A | | | | 1,832 | 62,856 |
| Evercore Partners Incorporated Class A | | | | 968 | 129,393 |
| Federated Investors Incorporated Class B | | | | 1,824 | 59,280 |
The accompanying notes are an integral part of these financial statements.
Wells Fargo Disciplined Small Cap Fund | 11
Portfolio of investments—September 30, 2021 (unaudited)
| | | | | Shares | Value |
| Capital markets (continued) | | | | | |
| Gamco Investors Incorporated Class A | | | | 955 | $ 25,193 |
| PJT Partners Incorporated Class A | | | | 801 | 63,367 |
| Stifel Financial Corporation | | | | 2,037 | 138,435 |
| | | | | | 563,743 |
| Consumer finance: 1.60% | | | | | |
| Curo Group Holdings Corporation | | | | 1,824 | 31,610 |
| Enova International Incorporated † | | | | 3,009 | 103,961 |
| Green Dot Corporation Class A † | | | | 2,339 | 117,722 |
| Navient Corporation | | | | 1,041 | 20,539 |
| PROG Holdings Incorporated | | | | 2,279 | 95,741 |
| World Acceptance Corporation † | | | | 244 | 46,258 |
| | | | | | 415,831 |
| Insurance: 1.98% | | | | | |
| American Equity Investment Life Holding Company | | | | 2,420 | 71,559 |
| CNO Financial Group Incorporated | | | | 6,710 | 157,953 |
| Genworth Financial Incorporated Class A † | | | | 20,330 | 76,238 |
| Kemper Corporation | | | | 665 | 44,415 |
| Selective Insurance Group Incorporated | | | | 876 | 66,164 |
| Stewart Information Services Corporation | | | | 1,541 | 97,484 |
| | | | | | 513,813 |
| Thrifts & mortgage finance: 1.57% | | | | | |
| Essent Group Limited | | | | 2,406 | 105,888 |
| MGIC Investment Corporation | | | | 5,542 | 82,908 |
| NMI Holdings Incorporated Class A † | | | | 801 | 18,111 |
| PennyMac Financial Services Incorporated | | | | 1,159 | 70,850 |
| Radian Group Incorporated | | | | 3,083 | 70,046 |
| Walker & Dunlop Incorporated | | | | 539 | 61,177 |
| | | | | | 408,980 |
| Health care: 19.68% | | | | | |
| Biotechnology: 8.88% | | | | | |
| Aduro Biotech Incorporated ♦ | | | | 4,415 | 0 |
| Amicus Therapeutics Incorporated † | | | | 4,983 | 47,588 |
| Arena Pharmaceuticals Incorporated † | | | | 1,196 | 71,222 |
| Arrowhead Pharmaceuticals Incorporated † | | | | 929 | 57,997 |
| Atara Biotherapeutics Incorporated † | | | | 5,786 | 103,569 |
| AVROBIO Incorporated † | | | | 3,587 | 20,015 |
| Beam Therapeutics Incorporated † | | | | 242 | 21,056 |
| Biocryst Pharmaceuticals Incorporated † | | | | 6,056 | 87,025 |
| Black Diamond Therapeutics Incorporated † | | | | 3,940 | 33,332 |
| Blueprint Medicines Corporation † | | | | 708 | 72,789 |
| Cabaletta Bio Incorporated † | | | | 6,775 | 82,384 |
| Chinook Therapeutics Incorporated † | | | | 3,656 | 46,651 |
| Concert Pharmaceuticals Incorporated † | | | | 9,144 | 29,901 |
| Cytokinetics Incorporated † | | | | 3,009 | 107,542 |
| Exelixis Incorporated † | | | | 2,122 | 44,859 |
| Fate Therapeutics Incorporated † | | | | 844 | 50,024 |
| Fibrogen Incorporated † | | | | 1,461 | 14,931 |
| Forma Therapeutics Holdings † | | | | 2,210 | 51,250 |
| Gossamer Bio Incorporated † | | | | 4,562 | 57,344 |
| Halozyme Therapeutics Incorporated † | | | | 2,718 | 110,568 |
The accompanying notes are an integral part of these financial statements.
12 | Wells Fargo Disciplined Small Cap Fund
Portfolio of investments—September 30, 2021 (unaudited)
| | | | | Shares | Value |
| Biotechnology (continued) | | | | | |
| Heron Therapeutics Incorporated † | | | | 2,889 | $ 30,883 |
| Horizon Therapeutics plc † | | | | 695 | 76,130 |
| Intellia Therapeutics Incorporated † | | | | 975 | 130,796 |
| Jounce Therapeutics Incorporated † | | | | 4,784 | 35,545 |
| Kezar Life Sciences Incorporated † | | | | 13,067 | 112,899 |
| Kiniksa Pharmaceuticals Limited Class A † | | | | 5,465 | 62,246 |
| Kodiak Sciences Incorporated † | | | | 697 | 66,898 |
| Kymera Therapeutics Incorporated † | | | | 1,071 | 62,911 |
| Ligand Pharmaceuticals Incorporated † | | | | 370 | 51,548 |
| Mei Pharma Incorporated † | | | | 24,246 | 66,919 |
| Novavax Incorporated † | | | | 96 | 19,902 |
| Organogenesis Holdings Incorporated Class A † | | | | 4,785 | 68,138 |
| Pfenex Incorporated ♦ | | | | 5,162 | 0 |
| Protagonist Therapeutics Incorporated † | | | | 2,012 | 35,653 |
| Rigel Pharmaceuticals Incorporated † | | | | 16,921 | 61,423 |
| Rubius Therapeutics Incorporated † | | | | 635 | 11,354 |
| Sangamo Therapeutics Incorporated † | | | | 4,791 | 43,167 |
| Selecta Biosciences Incorporated † | | | | 16,065 | 66,830 |
| Sigilon Therapeutics Incorporated † | | | | 4,881 | 27,578 |
| TCR2 Therapeutics Incorporated † | | | | 2,531 | 21,539 |
| Ultragenyx Pharmaceutical Incorporated † | | | | 764 | 68,905 |
| Vanda Pharmaceuticals Incorporated † | | | | 4,407 | 75,536 |
| | | | | | 2,306,847 |
| Health care equipment & supplies: 3.54% | | | | | |
| Accuray Incorporated † | | | | 15,983 | 63,133 |
| Apyx Medical Corporation † | | | | 5,033 | 69,707 |
| Globus Medical Incorporated Class A † | | | | 1,632 | 125,044 |
| Haemonetics Corporation † | | | | 762 | 53,790 |
| Lantheus Holdings Incorporated † | | | | 2,368 | 60,810 |
| Novocure Limited † | | | | 347 | 40,311 |
| Outset Medical Incorporated † | | | | 1,179 | 58,290 |
| Seaspine Holdings Corporation † | | | | 4,608 | 72,484 |
| STAAR Surgical Company † | | | | 989 | 127,116 |
| Surmodics Incorporated † | | | | 2,143 | 119,151 |
| ViewRay Incorporated † | | | | 11,172 | 80,550 |
| Zynex Incorporated †« | | | | 4,425 | 50,401 |
| | | | | | 920,787 |
| Health care providers & services: 4.09% | | | | | |
| Amedisys Incorporated † | | | | 415 | 61,877 |
| AMN Healthcare Services Incorporated † | | | | 348 | 39,933 |
| Apollo Medical Holdings Incorporated †« | | | | 2,175 | 198,034 |
| Centene Corporation † | | | | 1,031 | 64,242 |
| Modivcare Incorporated † | | | | 670 | 121,685 |
| Owens & Minor Incorporated | | | | 2,265 | 70,872 |
| R1 RCM Incorporated † | | | | 3,124 | 68,759 |
| Select Medical Holdings Corporation | | | | 3,457 | 125,040 |
| Tenet Healthcare Corporation † | | | | 2,896 | 192,410 |
| The Ensign Group Incorporated | | | | 1,617 | 121,097 |
| | | | | | 1,063,949 |
| Health care technology: 0.64% | | | | | |
| NextGen Healthcare Incorporated † | | | | 2,724 | 38,408 |
The accompanying notes are an integral part of these financial statements.
Wells Fargo Disciplined Small Cap Fund | 13
Portfolio of investments—September 30, 2021 (unaudited)
| | | | | Shares | Value |
| Health care technology (continued) | | | | | |
| Omnicell Incorporated † | | | | 735 | $ 109,096 |
| Simulations Plus Incorporated | | | | 468 | 18,486 |
| | | | | | 165,990 |
| Life sciences tools & services: 0.52% | | | | | |
| Repligen Corporation † | | | | 285 | 82,362 |
| Seer Incorporated † | | | | 1,491 | 51,484 |
| | | | | | 133,846 |
| Pharmaceuticals: 2.01% | | | | | |
| Amneal Pharmaceuticals Incorporated † | | | | 21,938 | 117,149 |
| Antares Pharma Incorporated † | | | | 10,419 | 37,925 |
| Catalent Incorporated † | | | | 1,045 | 139,058 |
| Endo International plc † | | | | 6,667 | 21,601 |
| Intra-Cellular Therapies Incorporated † | | | | 2,384 | 88,876 |
| Pacira Pharmaceuticals Incorporated † | | | | 610 | 34,160 |
| Supernus Pharmaceuticals Incorporated † | | | | 1,988 | 53,020 |
| Tarsus Pharmaceuticals Incorporated † | | | | 1,431 | 30,838 |
| | | | | | 522,627 |
| Industrials: 14.57% | | | | | |
| Aerospace & defense: 0.30% | | | | | |
| Moog Incorporated Class A | | | | 1,027 | 78,288 |
| Air freight & logistics: 0.37% | | | | | |
| Atlas Air Worldwide Holdings Incorporated † | | | | 1,174 | 95,892 |
| Building products: 0.86% | | | | | |
| Builders FirstSource Incorporated † | | | | 2,701 | 139,750 |
| Simpson Manufacturing Company Incorporated | | | | 781 | 83,544 |
| | | | | | 223,294 |
| Commercial services & supplies: 0.84% | | | | | |
| Ennis Incorporated | | | | 2,619 | 49,368 |
| Pitney Bowes Incorporated | | | | 2,912 | 20,996 |
| Tetra Tech Incorporated | | | | 705 | 105,285 |
| Viad Corporation † | | | | 944 | 42,867 |
| | | | | | 218,516 |
| Construction & engineering: 2.08% | | | | | |
| Comfort Systems Incorporated | | | | 1,042 | 74,315 |
| EMCOR Group Incorporated | | | | 1,594 | 183,916 |
| MasTec Incorporated † | | | | 1,312 | 113,199 |
| MYR Group Incorporated † | | | | 1,258 | 125,171 |
| Primoris Services Corporation | | | | 1,798 | 44,033 |
| | | | | | 540,634 |
| Electrical equipment: 1.69% | | | | | |
| Atkore International Incorporated † | | | | 1,858 | 161,497 |
| Bloom Energy Corporation Class A † | | | | 850 | 15,912 |
| Encore Wire Corporation | | | | 1,682 | 159,504 |
| Fuelcell Energy Incorporated † | | | | 1,969 | 13,173 |
The accompanying notes are an integral part of these financial statements.
14 | Wells Fargo Disciplined Small Cap Fund
Portfolio of investments—September 30, 2021 (unaudited)
| | | | | Shares | Value |
| Electrical equipment (continued) | | | | | |
| Generac Holdings Incorporated † | | | | 148 | $ 60,483 |
| Plug Power Incorporated † | | | | 1,082 | 27,634 |
| | | | | | 438,203 |
| Machinery: 3.13% | | | | | |
| Alamo Group Incorporated | | | | 520 | 72,556 |
| Hillenbrand Incorporated | | | | 3,811 | 162,539 |
| Meritor Incorporated † | | | | 4,223 | 89,992 |
| Mueller Industries Incorporated | | | | 3,595 | 147,755 |
| Nikola Corporation † | | | | 872 | 9,304 |
| Park Ohio Holdings Corporation | | | | 4,305 | 109,864 |
| Watts Water Technologies Incorporated | | | | 717 | 120,521 |
| Welbilt Incorporated † | | | | 4,356 | 101,233 |
| | | | | | 813,764 |
| Professional services: 1.96% | | | | | |
| CACI International Incorporated Class A † | | | | 248 | 65,001 |
| CBIZ Incorporated † | | | | 1,787 | 57,792 |
| Insperity Incorporated | | | | 700 | 77,518 |
| Kelly Services Incorporated Class A | | | | 5,582 | 105,388 |
| Science Applications International Corporation | | | | 653 | 55,871 |
| TriNet Group Incorporated † | | | | 1,555 | 147,072 |
| | | | | | 508,642 |
| Road & rail: 0.81% | | | | | |
| Arcbest Corporation | | | | 2,247 | 183,737 |
| Universal Truckload Services | | | | 1,326 | 26,626 |
| | | | | | 210,363 |
| Trading companies & distributors: 2.53% | | | | | |
| Applied Industrial Technologies Incorporated | | | | 1,360 | 122,577 |
| Boise Cascade Company | | | | 2,108 | 113,790 |
| GMS Incorporated † | | | | 1,186 | 51,947 |
| McGrath RentCorp | | | | 663 | 47,703 |
| Rush Enterprises Incorporated Class A | | | | 3,198 | 144,422 |
| Titan Machinery Incorporated † | | | | 3,408 | 88,301 |
| WESCO International Incorporated † | | | | 773 | 89,142 |
| | | | | | 657,882 |
| Information technology: 14.31% | | | | | |
| Communications equipment: 0.27% | | | | | |
| Ciena Corporation † | | | | 1,378 | 70,760 |
| Electronic equipment, instruments & components: 1.98% | | | | | |
| Advanced Energy Industries Incorporated | | | | 769 | 67,480 |
| Fabrinet † | | | | 708 | 72,577 |
| Insight Enterprises Incorporated † | | | | 1,336 | 120,347 |
| Plexus Corporation † | | | | 690 | 61,693 |
| Sanmina Corporation † | | | | 3,133 | 120,746 |
| SYNNEX Corporation | | | | 677 | 70,476 |
| | | | | | 513,319 |
| IT services: 3.13% | | | | | |
| BM Technologies Incorporated † | | | | 471 | 4,192 |
The accompanying notes are an integral part of these financial statements.
Wells Fargo Disciplined Small Cap Fund | 15
Portfolio of investments—September 30, 2021 (unaudited)
| | | | | Shares | Value |
| IT services (continued) | | | | | |
| EPAM Systems Incorporated † | | | | 221 | $ 126,076 |
| Evertec Incorporated | | | | 3,308 | 151,242 |
| ExlService Holdings Incorporated † | | | | 674 | 82,983 |
| GreenBox POS †« | | | | 5,566 | 46,142 |
| Hackett Group Incorporated | | | | 4,041 | 79,284 |
| Maximus Incorporated | | | | 864 | 71,885 |
| Perficient Incorporated † | | | | 979 | 113,270 |
| TTEC Holdings Incorporated | | | | 1,484 | 138,799 |
| | | | | | 813,873 |
| Semiconductors & semiconductor equipment: 2.66% | | | | | |
| Diodes Incorporated † | | | | 1,512 | 136,972 |
| Enphase Energy Incorporated † | | | | 463 | 69,436 |
| FormFactor Incorporated † | | | | 1,331 | 49,686 |
| Ichor Holdings Limited † | | | | 2,882 | 118,421 |
| MKS Instruments Incorporated | | | | 352 | 53,120 |
| Smart Global Holdings Incorporated † | | | | 2,696 | 119,972 |
| SunPower Corporation † | | | | 886 | 20,094 |
| Ultra Clean Holdings Incorporated † | | | | 2,907 | 123,838 |
| | | | | | 691,539 |
| Software: 6.27% | | | | | |
| A10 Networks Incorporated † | | | | 8,247 | 111,170 |
| ACI Worldwide Incorporated † | | | | 923 | 28,364 |
| Arlo Technologies Incorporated † | | | | 9,340 | 59,869 |
| Cloudera Incorporated † | | | | 9,238 | 147,531 |
| Digital Turbine Incorporated † | | | | 831 | 57,131 |
| InterDigital Incorporated | | | | 1,287 | 87,284 |
| J2 Global Incorporated † | | | | 970 | 132,521 |
| Mimecast Limited † | | | | 2,780 | 176,808 |
| Rimini Street Incorporated † | | | | 18,687 | 180,330 |
| SailPoint Technologies Holdings Incorporated † | | | | 824 | 35,333 |
| SPS Commerce Incorporated † | | | | 1,535 | 247,613 |
| Tenable Holdings Incorporated † | | | | 1,086 | 50,108 |
| Upland Software Incorporated † | | | | 2,716 | 90,823 |
| Verint Systems Incorporated | | | | 1,294 | 57,958 |
| Veritone Incorporated † | | | | 929 | 22,194 |
| Workiva Incorporated † | | | | 442 | 62,304 |
| Xperi Holding Corporation | | | | 4,253 | 80,127 |
| | | | | | 1,627,468 |
| Materials: 4.06% | | | | | |
| Chemicals: 1.68% | | | | | |
| Advansix Incorporated † | | | | 4,047 | 160,868 |
| Avient Corporation | | | | 549 | 25,446 |
| Chase Corporation | | | | 237 | 24,210 |
| Futurefuel Corporation | | | | 1,561 | 11,130 |
| Kooper Holdings Incorporated † | | | | 1,598 | 49,953 |
| Sensient Technologies Corporation | | | | 328 | 29,874 |
| Tronox Holdings plc Class A | | | | 5,495 | 135,452 |
| | | | | | 436,933 |
| Construction materials: 0.16% | | | | | |
| Forterra Incorporated † | | | | 1,747 | 41,159 |
The accompanying notes are an integral part of these financial statements.
16 | Wells Fargo Disciplined Small Cap Fund
Portfolio of investments—September 30, 2021 (unaudited)
| | | | | Shares | Value |
| Containers & packaging: 1.08% | | | | | |
| Berry Global Group Incorporated † | | | | 971 | $ 59,114 |
| Greif Incorporated Class A | | | | 1,908 | 123,257 |
| Myers Industries Incorporated | | | | 5,013 | 98,104 |
| | | | | | 280,475 |
| Metals & mining: 1.14% | | | | | |
| Arconic Corporation † | | | | 1,990 | 62,765 |
| Cleveland Cliffs Incorporated † | | | | 2,275 | 45,068 |
| Commercial Metals Company | | | | 2,396 | 72,982 |
| Schnitzer Steel Industries Incorporated Class A | | | | 1,192 | 52,222 |
| Suncoke Energy Incorporated | | | | 10,250 | 64,370 |
| | | | | | 297,407 |
| Real estate: 6.44% | | | | | |
| Equity REITs: 5.83% | | | | | |
| Armada Hoffler Properties Incorporated | | | | 4,729 | 63,227 |
| Ashford Hospitality Trust Incorporated †« | | | | 2,250 | 33,120 |
| CareTrust REIT Incorporated | | | | 3,111 | 63,216 |
| Catchmark Timber Trust Incorporated Class A | | | | 6,076 | 72,122 |
| CorePoint Lodging Incorporated † | | | | 6,862 | 106,361 |
| CyrusOne Incorporated | | | | 800 | 61,928 |
| Diversified Healthcare Trust | | | | 28,547 | 96,774 |
| Easterly Government Properties Incorporated | | | | 3,396 | 70,161 |
| First Industrial Realty Trust Incorporated | | | | 2,321 | 120,878 |
| Getty Realty Corporation | | | | 1,389 | 40,712 |
| Global Medical REIT Incorporated | | | | 6,457 | 94,918 |
| Global Net Lease Incorporated | | | | 8,049 | 128,945 |
| Industrial Logistics Properties Trust | | | | 1,577 | 40,072 |
| National Health Investors Incorporated | | | | 702 | 37,557 |
| NexPoint Residential Trust Incorporated | | | | 2,285 | 141,396 |
| Piedmont Office Realty Trust Incorporated Class A | | | | 5,680 | 99,002 |
| STAG Industrial Incorporated | | | | 3,084 | 121,047 |
| Uniti Group Incorporated | | | | 4,639 | 57,384 |
| Urban Edge Properties | | | | 3,537 | 64,762 |
| | | | | | 1,513,582 |
| Real estate management & development: 0.61% | | | | | |
| Newmark Group Incorporated Class A | | | | 11,073 | 158,455 |
| Utilities: 2.58% | | | | | |
| Electric utilities: 0.94% | | | | | |
| IDACORP Incorporated | | | | 561 | 57,996 |
| Otter Tail Corporation | | | | 377 | 21,101 |
| Portland General Electric Company | | | | 2,255 | 105,962 |
| Via Renewables Incorporated | | | | 5,805 | 59,153 |
| | | | | | 244,212 |
| Gas utilities: 0.44% | | | | | |
| Southwest Gas Holdings Incorporated | | | | 1,683 | 112,559 |
The accompanying notes are an integral part of these financial statements.
Wells Fargo Disciplined Small Cap Fund | 17
Portfolio of investments—September 30, 2021 (unaudited)
| | | | | Shares | Value |
| Independent power & renewable electricity producers: 0.64% | | | | | |
| Brookfield Renewable Corporation Class A | | | | 2,212 | $ 85,848 |
| Clearway Energy Incorporated Class A | | | | 2,866 | 80,821 |
| | | | | | 166,669 |
| Multi-utilities: 0.52% | | | | | |
| Black Hills Corporation | | | | 758 | 47,572 |
| Northwestern Corporation | | | | 1,528 | 87,554 |
| | | | | | 135,126 |
| Water utilities: 0.04% | | | | | |
| Cadiz Incorporated † | | | | 1,511 | 10,637 |
| Total Common stocks (Cost $19,260,325) | | | | | 25,505,454 |
| | | Yield | | | |
| Short-term investments: 2.76% | | | | | |
| Investment companies: 2.76% | | | | | |
| Securities Lending Cash Investments LLC ♠∩∞ | | 0.02% | | 338,450 | 338,450 |
| Wells Fargo Government Money Market Fund Select Class ♠∞ | | 0.03 | | 379,092 | 379,092 |
| Total Short-term investments (Cost $717,542) | | | | | 717,542 |
| Total investments in securities (Cost $19,977,867) | 100.92% | | | | 26,222,996 |
| Other assets and liabilities, net | (0.92) | | | | (240,057) |
| Total net assets | 100.00% | | | | $25,982,939 |
| † | Non-income earning security |
| ♦ | The security is fair valued in accordance with procedures approved by the Board of Trustees. |
| « | All or a portion of this security is on loan. |
| ♠ | The issuer of the security is an affiliated person of the Fund as defined in the Investment Company Act of 1940. |
| ∩ | The investment is a non-registered investment company purchased with cash collateral received from securities on loan. |
| ∞ | The rate represents the 7-day annualized yield at period end. |
| Abbreviations: |
| REIT | Real estate investment trust |
The accompanying notes are an integral part of these financial statements.
18 | Wells Fargo Disciplined Small Cap Fund
Portfolio of investments—September 30, 2021 (unaudited)
Investments in affiliates
An affiliated investment is an investment in which the Fund owns at least 5% of the outstanding voting shares of the issuer or as a result of other relationships, such as the Fund and the issuer having the same investment manager. Transactions with issuers that were either affiliates of the Fund at the beginning of the period or the end of the period were as follows:
| | Value,
beginning of
period | Purchases | Sales
proceeds | Net
realized
gains
(losses) | | Net
change in
unrealized
gains
(losses) | | Value,
end of
period | Shares,
end
of period | Income
from
affiliated
securities |
| Short-term investments | | | | | | | | | |
| Securities Lending Cash Investments LLC | $ 121,125 | $1,453,975 | $(1,236,650) | $0 | | $0 | | $ 338,450 | 338,450 | $17 # |
| Wells Fargo Government Money Market Fund Select Class | 1,082,139 | 2,085,107 | (2,788,154) | 0 | | 0 | | 379,092 | 379,092 | 82 |
| | | | | $0 | | $0 | | $717,542 | | $99 |
| # | Amount shown represents income before fees and rebates. |
Futures contracts
| Description | Number of
contracts | Expiration
date | Notional
cost | Notional
value | Unrealized
gains | Unrealized
losses |
| Long | | | | | | |
| E-Mini Russell 2000 Index | 3 | 12-17-2021 | $336,863 | $330,120 | $0 | $(6,743) |
The accompanying notes are an integral part of these financial statements.
Wells Fargo Disciplined Small Cap Fund | 19
Statement of assets and liabilities—September 30, 2021 (unaudited)
| | |
| Assets | |
Investments in unaffiliated securities (including $330,158 of securities loaned), at value (cost $19,260,325)
| $ 25,505,454 |
Investments in affiliated securites, at value (cost $717,542)
| 717,542 |
Cash
| 780 |
Cash at broker segregated for futures contracts
| 91,000 |
Receivable for dividends
| 13,707 |
Receivable from manager
| 7,013 |
Receivable for Fund shares sold
| 2,048 |
Receivable for securities lending income, net
| 191 |
Prepaid expenses and other assets
| 32,208 |
Total assets
| 26,369,943 |
| Liabilities | |
Payable upon receipt of securities loaned
| 338,450 |
Payable for Fund shares redeemed
| 10,677 |
Payable for daily variation margin on open futures contracts
| 3,165 |
Administration fees payable
| 2,869 |
Accrued expenses and other liabilities
| 31,843 |
Total liabilities
| 387,004 |
Total net assets
| $25,982,939 |
| Net assets consist of | |
Paid-in capital
| $ 21,034,055 |
Total distributable earnings
| 4,948,884 |
Total net assets
| $25,982,939 |
| Computation of net asset value and offering price per share | |
Net assets – Class A
| $ 806,437 |
Shares outstanding – Class A1
| 67,589 |
Net asset value per share – Class A
| $11.93 |
Maximum offering price per share – Class A2
| $12.66 |
Net assets – Class R6
| $ 231,414 |
Shares outstanding – Class R61
| 19,715 |
Net asset value per share – Class R6
| $11.74 |
Net assets – Administrator Class
| $ 23,579,712 |
Shares outstanding – Administrator Class1
| 1,988,059 |
Net asset value per share – Administrator Class
| $11.86 |
Net assets – Institutional Class
| $ 1,365,376 |
Shares outstanding – Institutional Class1
| 114,848 |
Net asset value per share – Institutional Class
| $11.89 |
| 1 | The Fund has an unlimited number of authorized shares |
| 2 | Maximum offering price is computed as 100/94.25 of net asset value. On investments of $50,000 or more, the offering price is reduced. |
The accompanying notes are an integral part of these financial statements.
20 | Wells Fargo Disciplined Small Cap Fund
Statement of operations—six months ended September 30, 2021 (unaudited)
| | |
| Investment income | |
Dividends (net of foreign withholdings taxes of $407)
| $ 128,821 |
Income from affiliated securities
| 554 |
Total investment income
| 129,375 |
| Expenses | |
Management fee
| 67,532 |
| Administration fees | |
Class A
| 969 |
Class R6
| 26 |
Administrator Class
| 15,851 |
Institutional Class
| 995 |
| Shareholder servicing fees | |
Class A
| 1,153 |
Administrator Class
| 30,483 |
Custody and accounting fees
| 16,501 |
Professional fees
| 25,537 |
Registration fees
| 31,043 |
Shareholder report expenses
| 15,315 |
Trustees’ fees and expenses
| 9,662 |
Other fees and expenses
| 7,663 |
Total expenses
| 222,730 |
| Less: Fee waivers and/or expense reimbursements | |
Fund-level
| (69,173) |
Class A
| (1,457) |
Class R6
| (26) |
Administrator Class
| (38,239) |
Institutional Class
| (995) |
Net expenses
| 112,840 |
Net investment income
| 16,535 |
| Realized and unrealized gains (losses) on investments | |
| Net realized gains (losses) on | |
Unaffiliated securities
| 1,781,749 |
Futures contracts
| (59,362) |
Net realized gains on investments
| 1,722,387 |
| Net change in unrealized gains (losses) on | |
Unaffiliated securities
| (1,157,812) |
Futures contracts
| 53,007 |
Net change in unrealized gains (losses) on investments
| (1,104,805) |
Net realized and unrealized gains (losses) on investments
| 617,582 |
Net increase in net assets resulting from operations
| $ 634,117 |
The accompanying notes are an integral part of these financial statements.
Wells Fargo Disciplined Small Cap Fund | 21
Statement of changes in net assets
| | | | | |
| | Six months ended
September 30, 2021
(unaudited) | Year ended
March 31, 2021 |
| Operations | | | | |
Net investment income
| | $ 16,535 | | $ 45,561 |
Net realized gains on investments
| | 1,722,387 | | 1,536,209 |
Net change in unrealized gains (losses) on investments
| | (1,104,805) | | 13,460,022 |
Net increase in net assets resulting from operations
| | 634,117 | | 15,041,792 |
| Distributions to shareholders from | | | | |
| Net investment income and net realized gains | | | | |
Class R6
| | 0 | | (2,550) |
Administrator Class
| | 0 | | (5,441) |
Institutional Class
| | 0 | | (1,918) |
Total distributions to shareholders
| | 0 | | (9,909) |
| Capital share transactions | Shares | | Shares | |
| Proceeds from shares sold | | | | |
Class A
| 22,239 | 266,212 | 99,181 | 1,109,960 |
Class R6
| 7,320 | 86,010 | 7,526 | 72,031 |
Administrator Class
| 54,116 | 643,408 | 158,113 | 1,489,240 |
Institutional Class
| 10,646 | 127,658 | 40,317 | 328,237 |
| | | 1,123,288 | | 2,999,468 |
| Reinvestment of distributions | | | | |
Class R6
| 0 | 0 | 223 | 2,252 |
Administrator Class
| 0 | 0 | 529 | 5,411 |
Institutional Class
| 0 | 0 | 161 | 1,647 |
| | | 0 | | 9,310 |
| Payment for shares redeemed | | | | |
Class A
| (39,636) | (468,881) | (30,780) | (318,521) |
Class R6
| (1,139) | (13,428) | (17,224) | (135,223) |
Administrator Class
| (163,965) | (1,951,421) | (856,001) | (7,874,576) |
Institutional Class
| (43,007) | (513,731) | (153,506) | (1,418,005) |
| | | (2,947,461) | | (9,746,325) |
Net decrease in net assets resulting from capital share transactions
| | (1,824,173) | | (6,737,547) |
Total increase (decrease) in net assets
| | (1,190,056) | | 8,294,336 |
| Net assets | | | | |
Beginning of period
| | 27,172,995 | | 18,878,659 |
End of period
| | $25,982,939 | | $27,172,995 |
The accompanying notes are an integral part of these financial statements.
22 | Wells Fargo Disciplined Small Cap Fund
Financial highlights
(For a share outstanding throughout each period)
| | | Year ended March 31 |
| Class A | Six months ended
September 30, 2021
(unaudited) | 2021 | 2020 | 2019 1 |
Net asset value, beginning of period
| $11.67 | $6.12 | $8.39 | $23.70 |
Net investment income (loss)
| 0.00 2,3 | (0.05) 3 | (0.00) 3,4 | 0.02 |
Net realized and unrealized gains (losses) on investments
| 0.26 | 5.60 | (2.22) | (3.37) |
Total from investment operations
| 0.26 | 5.55 | (2.22) | (3.35) |
| Distributions to shareholders from | | | | |
Net investment income
| 0.00 | 0.00 | (0.05) | (0.04) |
Net realized gains
| 0.00 | 0.00 | 0.00 | (11.92) |
Total distributions to shareholders
| 0.00 | 0.00 | (0.05) | (11.96) |
Net asset value, end of period
| $11.93 | $11.67 | $6.12 | $8.39 |
Total return5
| 2.23% | 90.69% | (26.67)% | (11.52)% |
| Ratios to average net assets (annualized) | | | | |
Gross expenses
| 1.74% | 1.81% | 1.40% | 1.14% |
Net expenses
| 0.92% | 0.93% | 0.93% | 0.92% |
Net investment income (loss)
| 0.03% | (0.53)% | (0.05)% | 0.16% |
| Supplemental data | | | | |
Portfolio turnover rate
| 22% | 48% | 67% | 176% |
Net assets, end of period (000s omitted)
| $806 | $991 | $102 | $34 |
| 1 | For the period from July 31, 2018 (commencement of class operations) to March 31, 2019 |
| 2 | Amount is less than $0.005. |
| 3 | Calculated based upon average shares outstanding |
| 4 | Amount is more than $(0.005) |
| 5 | Total return calculations do not include any sales charges. Returns for periods of less than one year are not annualized. |
The accompanying notes are an integral part of these financial statements.
Wells Fargo Disciplined Small Cap Fund | 23
Financial highlights
(For a share outstanding throughout each period)
| | | Year ended March 31 |
| Class R6 | Six months ended
September 30, 2021
(unaudited) | 2021 | 2020 | 2019 | 2018 | 2017 1 |
Net asset value, beginning of period
| $11.45 | $6.15 | $8.50 | $22.63 | $23.82 | $22.43 |
Net investment income
| 0.03 2 | 0.04 2 | 0.08 2 | 0.06 | 0.07 | 0.14 |
Net realized and unrealized gains (losses) on investments
| 0.26 | 5.51 | (2.35) | (2.19) | 2.08 | 3.32 |
Total from investment operations
| 0.29 | 5.55 | (2.27) | (2.13) | 2.15 | 3.46 |
| Distributions to shareholders from | | | | | | |
Net investment income
| 0.00 | (0.25) | (0.08) | (0.08) | (0.06) | (0.14) |
Net realized gains
| 0.00 | 0.00 | 0.00 | (11.92) | (3.28) | (1.93) |
Total distributions to shareholders
| 0.00 | (0.25) | (0.08) | (12.00) | (3.34) | (2.07) |
Net asset value, end of period
| $11.74 | $11.45 | $6.15 | $8.50 | $22.63 | $23.82 |
Total return3
| 2.53% | 90.71% | (27.03)% | (6.75)% | 8.95% | 15.63% |
| Ratios to average net assets (annualized) | | | | | | |
Gross expenses
| 1.31% | 1.42% | 0.89% | 0.82% | 1.06% | 0.92% |
Net expenses
| 0.50% | 0.50% | 0.50% | 0.64% | 0.85% | 0.85% |
Net investment income
| 0.49% | 0.51% | 0.95% | 0.48% | 0.14% | 0.67% |
| Supplemental data | | | | | | |
Portfolio turnover rate
| 22% | 48% | 67% | 176% | 48% | 73% |
Net assets, end of period (000s omitted)
| $231 | $155 | $141 | $4,014 | $23,871 | $1,626 |
| 1 | For the period from October 31, 2016 (commencement of class operations) to March 31, 2017 |
| 2 | Calculated based upon average shares outstanding |
| 3 | Returns for periods of less than one year are not annualized. |
The accompanying notes are an integral part of these financial statements.
24 | Wells Fargo Disciplined Small Cap Fund
Financial highlights
(For a share outstanding throughout each period)
| | | Year ended March 31 |
| Administrator Class | Six months ended
September 30, 2021
(unaudited) | 2021 | 2020 | 2019 | 2018 | 2017 |
Net asset value, beginning of period
| $11.59 | $6.10 | $8.40 | $22.53 | $23.79 | $21.15 |
Net investment income
| 0.01 | 0.02 | 0.02 1 | 0.03 1 | 0.06 | 0.08 1 |
Net realized and unrealized gains (losses) on investments
| 0.26 | 5.47 | (2.27) | (2.21) | 2.00 | 4.56 |
Total from investment operations
| 0.27 | 5.49 | (2.25) | (2.18) | 2.06 | 4.64 |
| Distributions to shareholders from | | | | | | |
Net investment income
| 0.00 | (0.00) 2 | (0.05) | (0.03) | (0.04) | (0.07) |
Net realized gains
| 0.00 | 0.00 | 0.00 | (11.92) | (3.28) | (1.93) |
Total distributions to shareholders
| 0.00 | (0.00) 2 | (0.05) | (11.95) | (3.32) | (2.00) |
Net asset value, end of period
| $11.86 | $11.59 | $6.10 | $8.40 | $22.53 | $23.79 |
Total return3
| 2.33% | 90.04% | (26.99)% | (7.01)% | 8.52% | 22.13% |
| Ratios to average net assets (annualized) | | | | | | |
Gross expenses
| 1.66% | 1.75% | 1.25% | 1.13% | 1.30% | 1.28% |
Net expenses
| 0.85% | 0.85% | 0.85% | 0.95% | 1.20% | 1.20% |
Net investment income
| 0.11% | 0.17% | 0.27% | 0.16% | 0.12% | 0.36% |
| Supplemental data | | | | | | |
Portfolio turnover rate
| 22% | 48% | 67% | 176% | 48% | 73% |
Net assets, end of period (000s omitted)
| $23,580 | $24,318 | $17,049 | $49,911 | $91,506 | $231,039 |
| 1 | Calculated based upon average shares outstanding |
| 2 | Amount is less than $0.005. |
| 3 | Returns for periods of less than one year are not annualized. |
The accompanying notes are an integral part of these financial statements.
Wells Fargo Disciplined Small Cap Fund | 25
Financial highlights
(For a share outstanding throughout each period)
| | | Year ended March 31 |
| Institutional Class | Six months ended
September 30, 2021
(unaudited) | 2021 | 2020 | 2019 | 2018 | 2017 |
Net asset value, beginning of period
| $11.60 | $6.10 | $8.48 | $22.61 | $23.82 | $21.18 |
Net investment income
| 0.02 1 | 0.04 1 | 0.06 1 | 0.07 1 | 0.09 | 0.09 |
Net realized and unrealized gains (losses) on investments
| 0.27 | 5.47 | (2.28) | (2.22) | 2.03 | 4.61 |
Total from investment operations
| 0.29 | 5.51 | (2.22) | (2.15) | 2.12 | 4.70 |
| Distributions to shareholders from | | | | | | |
Net investment income
| 0.00 | (0.01) | (0.16) | (0.06) | (0.05) | (0.13) |
Net realized gains
| 0.00 | 0.00 | 0.00 | (11.92) | (3.28) | (1.93) |
Total distributions to shareholders
| 0.00 | (0.01) | (0.16) | (11.98) | (3.33) | (2.06) |
Net asset value, end of period
| $11.89 | $11.60 | $6.10 | $8.48 | $22.61 | $23.82 |
Total return2
| 2.50% | 90.34% | (26.80)% | (6.79)% | 8.81% | 22.43% |
| Ratios to average net assets (annualized) | | | | | | |
Gross expenses
| 1.41% | 1.51% | 0.94% | 0.89% | 1.07% | 1.03% |
Net expenses
| 0.60% | 0.60% | 0.60% | 0.71% | 0.95% | 0.95% |
Net investment income
| 0.34% | 0.47% | 0.69% | 0.41% | 0.37% | 0.56% |
| Supplemental data | | | | | | |
Portfolio turnover rate
| 22% | 48% | 67% | 176% | 48% | 73% |
Net assets, end of period (000s omitted)
| $1,365 | $1,708 | $1,586 | $25,658 | $67,798 | $54,375 |
| 1 | Calculated based upon average shares outstanding |
| 2 | Returns for periods of less than one year are not annualized. |
The accompanying notes are an integral part of these financial statements.
26 | Wells Fargo Disciplined Small Cap Fund
Notes to financial statements (unaudited)
1. ORGANIZATION
Wells Fargo Funds Trust (the "Trust"), a Delaware statutory trust organized on March 10, 1999, is an open-end management investment company registered under the Investment Company Act of 1940, as amended (the "1940 Act"). As an investment company, the Trust follows the accounting and reporting guidance in Financial Accounting Standards Board ("FASB") Accounting Standards Codification Topic 946, Financial Services – Investment Companies. These financial statements report on the Wells Fargo Disciplined Small Cap Fund (the "Fund") which is a diversified series of the Trust.
On February 23, 2021, Wells Fargo & Company announced that it has entered into a definitive agreement to sell Wells Fargo Asset Management ("WFAM") to GTCR LLC and Reverence Capital Partners, L.P. WFAM is the trade name used by the asset management businesses of Wells Fargo & Company and includes Wells Fargo Funds Management, LLC, the investment manager to the Fund, Wells Capital Management, LLC and Wells Fargo Asset Management (International) Limited, both registered investment advisers providing subadvisory services to certain funds, and Wells Fargo Funds Distributor, LLC, the Fund's principal underwriter. As part of the transaction, Wells Fargo & Company will own a 9.9% equity interest and will continue to serve as an important client and distribution partner.
Consummation of the transaction will result in the automatic termination of the Fund’s investment management agreement and subadvisory agreement. The Fund’s Board of Trustees approved a new investment management agreement and a new subadvisory agreement which were submitted to the Fund’s shareholders for approval at a Special Meeting of Shareholders held on August 16, 2021. Shareholders of record of the Fund at the close of business on May 28, 2021 approved the new agreements which will take effect upon the closing of the transaction.
As more fully discussed in Note 11, the transaction closed on November 1, 2021 and the investment manager, sub-advisers and distributor changed their names to Allspring Funds Management, LLC, Allspring Global Investments, LLC, Allspring Global Investments (UK) Limited and Allspring Funds Distributor, LLC. While these name changes occurred after the end of the period, throughout this report, the new names have been used.
The Board of Trustees of the Wells Fargo Funds voted on July 15, 2021 to approve a change to the Fund's name to remove "Wells Fargo" from the name and replace it with "Allspring", effective December 6, 2021.
2. SIGNIFICANT ACCOUNTING POLICIES
The following significant accounting policies, which are consistently followed in the preparation of the financial statements of the Fund, are in conformity with U.S. generally accepted accounting principles which require management to make estimates and assumptions that affect the reported amounts of assets and liabilities, disclosure of contingent assets and liabilities at the date of the financial statements, and the reported amounts of income and expenses during the reporting period. Actual results could differ from those estimates.
Securities valuation
All investments are valued each business day as of the close of regular trading on the New York Stock Exchange (generally 4 p.m. Eastern Time), although the Fund may deviate from this calculation time under unusual or unexpected circumstances.
Equity securities and futures contracts that are listed on a foreign or domestic exchange or market are valued at the official closing price or, if none, the last sales price. If no sale occurs on the principal exchange or market that day, a fair value price will be determined in accordance with the Fund’s Valuation Procedures.
Debt securities are valued at the evaluated bid price provided by an independent pricing service (e.g. taking into account various factors, including yields, maturities, or credit ratings) or, if a reliable price is not available, the quoted bid price from an independent broker-dealer.
Investments in registered open-end investment companies are valued at net asset value. Interests in non-registered investment companies that are redeemable at net asset value are fair valued normally at net asset value.
Investments which are not valued using any of the methods discussed above are valued at their fair value, as determined in good faith by the Board of Trustees. The Board of Trustees has established a Valuation Committee comprised of the Trustees and has delegated to it the authority to take any actions regarding the valuation of portfolio securities that the Valuation Committee deems necessary or appropriate, including determining the fair value of portfolio securities, unless the determination has been delegated to the Allspring Global Investments Pricing Committee at Allspring Funds Management, LLC ("Allspring Funds Management"). The Board of Trustees retains the authority to make or ratify any valuation decisions or approve any changes to the Valuation Procedures as it deems appropriate. On a quarterly basis, the Board of Trustees receives reports on any valuation actions taken by the Valuation Committee or the Allspring Global Investments Pricing Committee which may include items for ratification.
Wells Fargo Disciplined Small Cap Fund | 27
Notes to financial statements (unaudited)
Securities lending
The Fund may lend its securities from time to time in order to earn additional income in the form of fees or interest on securities received as collateral or the investment of any cash received as collateral. When securities are on loan, the Fund receives interest or dividends on those securities. Cash collateral received in connection with its securities lending transactions is invested in Securities Lending Cash Investments, LLC (the "Securities Lending Fund"). Investments in Securities Lending Fund are valued at the evaluated bid price provided by an independent pricing service. Income earned from investment in the Securities Lending Fund (net of fees and rebates), if any, is included in income from affiliated securities on the Statement of Operations.
In a securities lending transaction, the net asset value of the Fund is affected by an increase or decrease in the value of the securities loaned and by an increase or decrease in the value of the instrument in which collateral is invested. The amount of securities lending activity undertaken by the Fund fluctuates from time to time. The Fund has the right under the lending agreement to recover the securities from the borrower on demand. In the event of default or bankruptcy by the borrower, the Fund may be prevented from recovering the loaned securities or gaining access to the collateral or may experience delays or costs in doing so. In such an event, the terms of the agreement allow the unaffiliated securities lending agent to use the collateral to purchase replacement securities on behalf of the Fund or pay the Fund the market value of the loaned securities. The Fund bears the risk of loss with respect to depreciation of its investment of the cash collateral.
Futures contracts
Futures contracts are agreements between the Fund and a counterparty to buy or sell a specific amount of a commodity, financial instrument or currency at a specified price on a specified date. The Fund may buy and sell futures contracts in order to gain exposure to, or protect against, changes in security values and is subject to equity price risk. The primary risks associated with the use of futures contracts are the imperfect correlation between changes in market values of securities held by the Fund and the prices of futures contracts, and the possibility of an illiquid market. Futures contracts are generally entered into on a regulated futures exchange and cleared through a clearinghouse associated with the exchange. With futures contracts, there is minimal counterparty risk to the Fund since futures contracts are exchange traded and the exchange’s clearinghouse, as the counterparty to all exchange traded futures, guarantees the futures contracts against default.
Upon entering into a futures contract, the Fund is required to deposit either cash or securities (initial margin) with the broker in an amount equal to a certain percentage of the contract value. Subsequent payments (variation margin) are paid to or from the broker each day equal to the daily changes in the contract value. Such payments are recorded as unrealized gains or losses and, if any, shown as variation margin receivable (payable) in the Statement of Assets and Liabilities. Should the Fund fail to make requested variation margin payments, the broker can gain access to the initial margin to satisfy the Fund’s payment obligations. When the contracts are closed, a realized gain or loss is recorded in the Statement of Operations.
Security transactions and income recognition
Securities transactions are recorded on a trade date basis. Realized gains or losses are recorded on the basis of identified cost.
Dividend income is recognized on the ex-dividend date.
Interest income is accrued daily and bond discounts are accreted and premiums are amortized daily. To the extent debt obligations are placed on non-accrual status, any related interest income may be reduced by writing off interest receivables when the collection of all or a portion of interest has been determined to be doubtful based on consistently applied procedures and the fair value has decreased. If the issuer subsequently resumes interest payments or when the collectability of interest is reasonably assured, the debt obligation is removed from non-accrual status.
Income is recorded net of foreign taxes withheld where recovery of such taxes is not assured.
Distributions to shareholders
Distributions to shareholders from net investment income and any net realized gains are recorded on the ex-dividend date and paid at least annually. Such distributions are determined in accordance with income tax regulations and may differ from U.S. generally accepted accounting principles. Dividend sources are estimated at the time of declaration. The tax character of distributions is determined as of the Fund's fiscal year end. Therefore, a portion of the Fund's distributions made prior to the Fund’s fiscal year end may be categorized as a tax return of capital at year end.
Federal and other taxes
The Fund intends to continue to qualify as a regulated investment company by distributing substantially all of its investment company taxable income and any net realized capital gains (after reduction for capital loss carryforwards) sufficient to relieve it from all, or substantially all, federal income taxes. Accordingly, no provision for federal income taxes was required.
28 | Wells Fargo Disciplined Small Cap Fund
Notes to financial statements (unaudited)
The Fund’s income and federal excise tax returns and all financial records supporting those returns for the prior three fiscal years are subject to examination by the federal and Delaware revenue authorities. Management has analyzed the Fund's tax positions taken on federal, state, and foreign tax returns for all open tax years and does not believe that there are any uncertain tax positions that require recognition of a tax liability.
As of September 30, 2021, the aggregate cost of all investments for federal income tax purposes was $20,020,750 and the unrealized gains (losses) consisted of:
| Gross unrealized gains | $ 7,239,983 |
| Gross unrealized losses | (1,044,480) |
| Net unrealized gains | $ 6,195,503 |
As of March 31, 2021, the Fund had capital loss carryforwards which consisted of $2,667,954 in short-term capital losses.
Class allocations
The separate classes of shares offered by the Fund differ principally in applicable sales charges, shareholder servicing and administration fees. Class specific expenses are charged directly to that share class. Investment income, common fund-level expenses, and realized and unrealized gains (losses) on investments are allocated daily to each class of shares based on the relative proportion of net assets of each class.
3. FAIR VALUATION MEASUREMENTS
Fair value measurements of investments are determined within a framework that has established a fair value hierarchy based upon the various data inputs utilized in determining the value of the Fund’s investments. The three-level hierarchy gives the highest priority to unadjusted quoted prices in active markets for identical assets or liabilities (Level 1) and the lowest priority to unobservable inputs (Level 3). The Fund’s investments are classified within the fair value hierarchy based on the lowest level of input that is significant to the fair value measurement. The inputs are summarized into three broad levels as follows:
| ■ | Level 1 – quoted prices in active markets for identical securities |
| ■ | Level 2 – other significant observable inputs (including quoted prices for similar securities, interest rates, prepayment speeds, credit risk, etc.) |
| ■ | Level 3 – significant unobservable inputs (including the Fund’s own assumptions in determining the fair value of investments) |
The inputs or methodologies used for valuing investments in securities are not necessarily an indication of the risk associated with investing in those securities.
Wells Fargo Disciplined Small Cap Fund | 29
Notes to financial statements (unaudited)
The following is a summary of the inputs used in valuing the Fund’s assets and liabilities as of September 30, 2021:
| | Quoted prices
(Level 1) | Other significant
observable inputs
(Level 2) | Significant
unobservable inputs
(Level 3) | Total |
| Assets | | | | |
| Investments in: | | | | |
| Common stocks | | | | |
| Communication services | $ 740,315 | $0 | $0 | $ 740,315 |
| Consumer discretionary | 2,911,256 | 0 | 0 | 2,911,256 |
| Consumer staples | 828,653 | 0 | 0 | 828,653 |
| Energy | 1,068,696 | 0 | 0 | 1,068,696 |
| Financials | 3,942,837 | 0 | 0 | 3,942,837 |
| Health care | 5,114,046 | 0 | 0 | 5,114,046 |
| Industrials | 3,785,478 | 0 | 0 | 3,785,478 |
| Information technology | 3,716,959 | 0 | 0 | 3,716,959 |
| Materials | 1,055,974 | 0 | 0 | 1,055,974 |
| Real estate | 1,672,037 | 0 | 0 | 1,672,037 |
| Utilities | 669,203 | 0 | 0 | 669,203 |
| Short-term investments | | | | |
| Investment companies | 717,542 | 0 | 0 | 717,542 |
| Total assets | $26,222,996 | $0 | $0 | $26,222,996 |
| Liabilities | | | | |
| Futures contracts | $ 6,743 | $0 | $0 | $ 6,743 |
| Total liabilities | $ 6,743 | $0 | $0 | $ 6,743 |
Futures contracts are reported at their cumulative unrealized gains (losses) at measurement date as reported in the table following the Portfolio of Investments. For futures contracts, the current day’s variation margin is reported on the Statement of Assets and Liabilities. All other assets and liabilities are reported at their market value at measurement date.
Additional sector, industry or geographic detail, if any, is included in the Portfolio of Investments.
For the six months ended September 30, 2021, the Fund did not have any transfers into/out of Level 3.
4. TRANSACTIONS WITH AFFILIATES
Management fee
Allspring Funds Management, a wholly owned subsidiary of Allspring Global Investments Holdings, LLC, a holding company indirectly owned by Wells Fargo & Company as of September 30, 2021, is the manager of the Fund and provides advisory and fund-level administrative services under an investment management agreement. Under the investment management agreement, Allspring Funds Management is responsible for, among other services, implementing the investment objectives and strategies of the Fund, supervising the subadviser and providing fund-level administrative services in connection with the Fund’s operations. As compensation for its services under the investment management agreement, Allspring Funds Management is entitled to receive a management fee at the following annual rate based on the Fund’s average daily net assets:
| Average daily net assets | Management fee |
| First $1 billion | 0.500% |
| Next $4 billion | 0.475 |
| Next $5 billion | 0.440 |
| Over $10 billion | 0.430 |
For the six months ended September 30, 2021, the management fee was equivalent to an annual rate of 0.50% of the Fund’s average daily net assets.
30 | Wells Fargo Disciplined Small Cap Fund
Notes to financial statements (unaudited)
Allspring Funds Management has retained the services of a subadviser to provide daily portfolio management to the Fund. The fee for subadvisory services is borne by Allspring Funds Management. Allspring Global Investments, LLC ("Allspring Investments"), an affiliate of Allspring Funds Management and wholly owned subsidiary of Allspring Global Investments Holdings, LLC, is the subadviser to the Fund and is entitled to receive a fee from Allspring Funds Management at an annual rate starting at 0.35% and declining to 0.25% as the average daily net assets of the Fund increase.
Administration fees
Under a class-level administration agreement, Allspring Funds Management provides class-level administrative services to the Fund, which includes paying fees and expenses for services provided by the transfer agent, sub-transfer agents, omnibus account servicers and record-keepers. As compensation for its services under the class-level administration agreement, Allspring Funds Management receives an annual fee which is calculated based on the average daily net assets of each class as follows:
| | Class-level
administration fee |
| Class A | 0.21% |
| Class R6 | 0.03 |
| Administrator Class | 0.13 |
| Institutional Class | 0.13 |
Waivers and/or expense reimbursements
Allspring Funds Management has contractually committed to waive and/or reimburse management and administration fees to the extent necessary to maintain certain net operating expense ratios for the Fund. When each class of the Fund has exceeded its expense cap, Allspring Funds Management will waive fees and/or reimburse expenses from fund-level expenses on a proportionate basis and then from class specific expenses. When only certain classes exceed their expense caps, waivers and/or reimbursements are applied against class specific expenses before fund-level expenses. Allspring Funds Management has contractually committed through July 31, 2022 to waive fees and/or reimburse expenses to the extent necessary to cap expenses. Prior to or after the commitment expiration date, the caps may be increased or the commitment to maintain the caps may be terminated only with the approval of the Board of Trustees. The contractual expense caps are as follows:
| | Expense ratio caps |
| Class A | 0.93% |
| Class R6 | 0.50 |
| Administrator Class | 0.85 |
| Institutional Class | 0.60 |
Sales charges
Allspring Funds Distributor, LLC ("Allspring Funds Distributor"), the principal underwriter, is entitled to receive the front-end sales charge from the purchase of Class A shares and a contingent deferred sales charge on the redemption of certain Class A shares. Allspring Funds Distributor did not receive any front-end or contingent deferred sales charges from Class A shares for the six months ended September 30, 2021.
Shareholder servicing fees
The Trust has entered into contracts with one or more shareholder servicing agents, whereby Class A and Administrator Class of the Fund are charged a fee at an annual rate of 0.25% of the average daily net assets of each respective class. A portion of these total shareholder servicing fees were paid to affiliates.
Interfund transactions
The Fund may purchase or sell portfolio investment securities to certain affiliates pursuant to Rule 17a-7 under the 1940 Act and under procedures adopted by the Board of Trustees. The procedures have been designed to ensure that these interfund transactions, which do not incur broker commissions, are effected at current market prices.
Wells Fargo Disciplined Small Cap Fund | 31
Notes to financial statements (unaudited)
5. INVESTMENT PORTFOLIO TRANSACTIONS
Purchases and sales of investments, excluding U.S. government obligations (if any) and short-term securities, for the six months ended September 30, 2021 were $5,679,083 and $6,386,744, respectively.
6. SECURITIES LENDING TRANSACTIONS
The Fund lends its securities through an unaffiliated securities lending agent and receives collateral in the form of cash or securities with a value at least equal to the value of the securities on loan. The value of the loaned securities is determined at the close of each business day and any increases or decreases in the required collateral are exchanged between the Fund and the counterparty on the next business day. Cash collateral received is invested in the Securities Lending Fund which seeks to provide a positive return compared to the daily Federal Funds Open Rate by investing in high-quality, U.S. dollar-denominated short-term money market instruments and is exempt from registration under Section 3(c)(7) of the 1940 Act. Securities Lending Fund is managed by Allspring Funds Management and is subadvised by Allspring Investments. Allspring Funds Management receives an advisory fee starting at 0.05% and declining to 0.01% as the average daily net assets of the Securities Lending Fund increase. All of the fees received by Allspring Funds Management are paid to Allspring Investments for its services as subadviser.
In the event of counterparty default or the failure of a borrower to return a loaned security, the Fund has the right to use the collateral to offset any losses incurred. As of September 30, 2021, the Fund had securities lending transactions with the following counterparties which are subject to offset:
| Counterparty | Value of
securities on
loan | Collateral
received1 | Net amount |
| Barclays Capital Incorporated | $ 31,395 | $ (31,395) | 0 |
| Morgan Stanley & Co. LLC | 201,020 | (201,020) | 0 |
| National Financial Services LLC | 97,743 | (97,743) | 0 |
1 Collateral received within this table is limited to the collateral for the net transaction with the counterparty.
7. DERIVATIVE TRANSACTIONS
During the six months ended September 30, 2021, the Fund entered into futures contracts for economic hedging purposes. The Fund had an average notional amount of $633,304 in long futures contracts during the six months ended September 30, 2021.
8. BANK BORROWINGS
The Trust (excluding the money market funds), Wells Fargo Master Trust and Wells Fargo Variable Trust are parties to a $350,000,000 revolving credit agreement whereby the Fund is permitted to use bank borrowings for temporary or emergency purposes, such as to fund shareholder redemption requests. Interest under the credit agreement is charged to the Fund based on a borrowing rate equal to the higher of the Federal Funds rate in effect on that day plus 1.25% or the overnight bank funding rate in effect on that day plus 1.25%. In addition, an annual commitment fee equal to 0.25% of the unused balance is allocated to each participating fund.
For the six months ended September 30, 2021, there were no borrowings by the Fund under the agreement.
9. INDEMNIFICATION
Under the Fund's organizational documents, the officers and Trustees have been granted certain indemnification rights against certain liabilities that may arise out of performance of their duties to the Fund. The Fund has entered into a separate agreement with each Trustee that converts indemnification rights currently existing under the Fund’s organizational documents into contractual rights that cannot be changed in the future without the consent of the Trustee. Additionally, in the normal course of business, the Fund may enter into contracts with service providers that contain a variety of indemnification clauses. The Fund’s maximum exposure under these arrangements is dependent on future claims that may be made against the Fund and, therefore, cannot be estimated.
10. CORONAVIRUS (COVID-19) PANDEMIC
On March 11, 2020, the World Health Organization announced that it had made the assessment that coronavirus disease 2019 (“COVID-19”) is a pandemic. The impacts of COVID-19 are affecting the entire global economy, individual companies and
32 | Wells Fargo Disciplined Small Cap Fund
Notes to financial statements (unaudited)
investment products, the funds, and the market in general. There is significant uncertainty around the extent and duration of business disruptions related to COVID-19 and the impacts may last for an extended period of time. COVID-19 has led to significant uncertainty and volatility in the financial markets.
11. SUBSEQUENT EVENTS
Effective after the close of business on November 1, 2021, the sale transaction of Wells Fargo Asset Management by Wells Fargo & Company to GTCR LLC and Reverence Capital Partners, L.P. was closed. In connection with the closing of the transaction, Wells Fargo Asset Management became known as Allspring Global Investments (“Allspring”) and various entities that provide services to the Fund changed their names to “Allspring”, including Allspring Funds Management, LLC (formerly Wells Fargo Funds Management, LLC), the investment manager to the Fund, Allspring Global Investments, LLC (formerly Wells Capital Management, LLC) and Allspring Global Investments (UK) Limited (formerly Wells Fargo Asset Management (International) Limited), both registered investment advisers providing sub-advisory services to certain funds, and Allspring Funds Distributor, LLC (formerly Wells Fargo Funds Distributor, LLC), the Fund's principal underwriter. These name changes have been reflected within this report.
Wells Fargo Disciplined Small Cap Fund | 33
Other information (unaudited)
PROXY VOTING INFORMATION
A description of the policies and procedures used to determine how to vote proxies relating to portfolio securities is available without charge, upon request, by calling 1-800-222-8222, visiting our website at allspringglobal.com, or visiting the SEC website at sec.gov. Information regarding how the proxies related to portfolio securities were voted during the most recent 12-month period ended June 30 is available on the website at allspringglobal.com or by visiting the SEC website at sec.gov.
SPECIAL MEETING OF SHAREHOLDERS
On August 16, 2021, a Special Meeting of Shareholders for the Fund was held to consider the following proposals. The results of the proposals are indicated below.
Proposal 1 – To consider and approve a new investment management agreement with Wells Fargo Funds Management, LLC*.
| Shares voted “For” | | 1,282,314 |
| Shares voted “Against” | | 10,456 |
| Shares voted “Abstain” | | 36,704 |
Proposal 2 – To consider and approve a new investment subadvisory agreement with Wells Capital Management, LLC**.
| Shares voted “For” | | 1,279,642 |
| Shares voted “Against” | | 10,605 |
| Shares voted “Abstain” | | 39,227 |
* Effective November 1, 2021, known as Allspring Funds Management, LLC.
** Effective November 1, 2021, known as Allspring Global Investments, LLC.
QUARTERLY PORTFOLIO HOLDINGS INFORMATION
The Fund files its complete schedule of portfolio holdings with the SEC for the first and third quarters of each fiscal year as an exhibit to its reports on Form N-PORT. Shareholders may view the filed Form N-PORT by visiting the SEC website at sec.gov.
34 | Wells Fargo Disciplined Small Cap Fund
Other information (unaudited)
BOARD OF TRUSTEES AND OFFICERS
Each of the Trustees and Officers listed in the table below acts in identical capacities for each fund in the Wells Fargo family of funds, which consists of 139 mutual funds comprising the Wells Fargo Funds Trust, Wells Fargo Variable Trust, Wells Fargo Master Trust and four closed-end funds (collectively the “Fund Complex”). This table should be read in conjunction with the Prospectus and the Statement of Additional Information1. The mailing address of each Trustee and Officer is 525 Market Street, 12th Floor, San Francisco, CA 94105. Each Trustee and Officer serves an indefinite term, however, each Trustee serves such term until reaching the mandatory retirement age established by the Trustees.
Independent Trustees
Name and
year of birth | Position held and
length of service* | Principal occupations during past five years or longer | Current other
public company or
investment
company
directorships |
William R. Ebsworth
(Born 1957) | Trustee,
since 2015 | Retired. From 1984 to 2013, equities analyst, portfolio manager, research director and chief investment officer at Fidelity Management and Research Company in Boston, Tokyo, and Hong Kong, and retired in 2013 as Chief Investment Officer of Fidelity Strategic Advisers, Inc. where he led a team of investment professionals managing client assets. Prior thereto, Board member of Hong Kong Securities Clearing Co., Hong Kong Options Clearing Corp., the Thailand International Fund, Ltd., Fidelity Investments Life Insurance Company, and Empire Fidelity Investments Life Insurance Company. Audit Committee Chair and Investment Committee Chair of the Vincent Memorial Hospital Endowment (non-profit organization). Mr. Ebsworth is a CFA® charterholder. | N/A |
Jane A. Freeman
(Born 1953) | Trustee,
since 2015;
Chair Liaison,
since 2018 | Retired. From 2012 to 2014 and 1999 to 2008, Chief Financial Officer of Scientific Learning Corporation. From 2008 to 2012, Ms. Freeman provided consulting services related to strategic business projects. Prior to 1999, Portfolio Manager at Rockefeller & Co. and Scudder, Stevens & Clark. Board member of the Harding Loevner Funds from 1996 to 2014, serving as both Lead Independent Director and chair of the Audit Committee. Board member of the Russell Exchange Traded Funds Trust from 2011 to 2012 and the chair of the Audit Committee. Ms. Freeman is also an inactive Chartered Financial Analyst. | N/A |
Isaiah Harris, Jr.
(Born 1952) | Trustee,
since 2009; Audit
Committee
Chair,
since 2019 | Retired. Chairman of the Board of CIGNA Corporation since 2009, and Director since 2005. From 2003 to 2011, Director of Deluxe Corporation. Prior thereto, President and CEO of BellSouth Advertising and Publishing Corp. from 2005 to 2007, President and CEO of BellSouth Enterprises from 2004 to 2005 and President of BellSouth Consumer Services from 2000 to 2003. Emeritus member of the Iowa State University Foundation Board of Governors. Emeritus Member of the Advisory Board of Iowa State University School of Business. Advisory Board Member, Palm Harbor Academy (private school). Mr. Harris is a certified public accountant (inactive status). | CIGNA Corporation |
Judith M. Johnson
(Born 1949) | Trustee,
since 2008 | Retired. Prior thereto, Chief Executive Officer and Chief Investment Officer of Minneapolis Employees Retirement Fund from 1996 to 2008. Ms. Johnson is an attorney, certified public accountant and a certified managerial accountant. | N/A |
David F. Larcker
(Born 1950) | Trustee,
since 2009 | James Irvin Miller Professor of Accounting at the Graduate School of Business (Emeritus), Stanford University, Director of the Corporate Governance Research Initiative and Senior Faculty of The Rock Center for Corporate Governance since 2006. From 2005 to 2008, Professor of Accounting at the Graduate School of Business, Stanford University. Prior thereto, Ernst & Young Professor of Accounting at The Wharton School, University of Pennsylvania from 1985 to 2005. | N/A |
Wells Fargo Disciplined Small Cap Fund | 35
Other information (unaudited)
Name and
year of birth | Position held and
length of service* | Principal occupations during past five years or longer | Current other
public company or
investment
company
directorships |
Olivia S. Mitchell
(Born 1953) | Trustee,
since 2006;
Nominating and
Governance
Committee Chair,
since 2018 | International Foundation of Employee Benefit Plans Professor, Wharton School of the University of Pennsylvania since 1993. Director of Wharton’s Pension Research Council and Boettner Center on Pensions & Retirement Research, and Research Associate at the National Bureau of Economic Research. Previously, Cornell University Professor from 1978 to 1993. | N/A |
Timothy J. Penny
(Born 1951) | Trustee,
since 1996;
Chair,
since 2018 | President and Chief Executive Officer of Southern Minnesota Initiative Foundation, a non-profit organization, since 2007. Member of the Board of Trustees of NorthStar Education Finance, Inc., a non-profit organization, since 2007. | N/A |
James G. Polisson
(Born 1959) | Trustee,
since 2018 | Retired. Chief Marketing Officer, Source (ETF) UK Services, Ltd, from 2015 to 2017. From 2012 to 2015, Principal of The Polisson Group, LLC, a management consulting, corporate advisory and principal investing company. Chief Executive Officer and Managing Director at Russell Investments, Global Exchange Traded Funds from 2010 to 2012. Managing Director of Barclays Global Investors from 1998 to 2010 and Global Chief Marketing Officer for iShares and Barclays Global Investors from 2000 to 2010. Trustee of the San Francisco Mechanics’ Institute, a non-profit organization, from 2013 to 2015. Board member of the Russell Exchange Traded Fund Trust from 2011 to 2012. Director of Barclays Global Investors Holdings Deutschland GmbH from 2006 to 2009. Mr. Polisson is an attorney and has a retired status with the Massachusetts and District of Columbia Bar Associations. | N/A |
Pamela Wheelock
(Born 1959) | Trustee,
since January
2020; previously
Trustee from
January 2018 to
July 2019 | Board member of the Destination Medical Center Economic Development Agency, Rochester, Minnesota since 2019. Interim President of the McKnight Foundation from January to September 2020. Acting Commissioner, Minnesota Department of Human Services, July 2019 through September 2019. Human Services Manager (part-time), Minnesota Department of Human Services, October 2019 through December 2019. Chief Operating Officer, Twin Cities Habitat for Humanity from 2017 to 2019. Vice President of University Services, University of Minnesota from 2012 to 2016. Prior thereto, on the Board of Directors, Governance Committee and Finance Committee for the Minnesota Philanthropy Partners (Saint Paul Foundation) from 2012 to 2018, Interim Chief Executive Officer of Blue Cross Blue Shield of Minnesota from 2011 to 2012, Chairman of the Board from 2009 to 2012 and Board Director from 2003 to 2015. Vice President, Leadership and Community Engagement, Bush Foundation, Saint Paul, Minnesota (a private foundation) from 2009 to 2011. Executive Vice President and Chief Financial Officer, Minnesota Sports and Entertainment from 2004 to 2009 and Senior Vice President from 2002 to 2004. Executive Vice President of the Minnesota Wild Foundation from 2004 to 2008. Commissioner of Finance, State of Minnesota, from 1999 to 2002. Currently Board Chair of the Minnesota Wild Foundation since 2010. | N/A |
* Length of service dates reflect the Trustee’s commencement of service with the Trust’s predecessor entities, where applicable.
36 | Wells Fargo Disciplined Small Cap Fund
Other information (unaudited)
Officers2
Name and
year of birth | Position held and
length of service | Principal occupations during past five years or longer |
Andrew Owen
(Born 1960) | President,
since 2017 | President, Chief Executive Officer and Director of Allspring Funds Management, LLC since 2017 and co-president of Galliard Capital Management, LLC, an affiliate of Allspring Funds Management, LLC, since 2019. Prior thereto, Head of Affiliated Managers, Allspring Global Investments, from 2014 to 2019 and Executive Vice President responsible for marketing, investments and product development for Allspring Funds Management, LLC, from 2009 to 2014. In addition, Mr. Owen was an Executive Vice President of Wells Fargo & Company from 2014 to 2021. |
Jeremy DePalma
(Born 1974) | Treasurer,
since 2012
(for certain funds in
the Fund Complex);
since 2021 (for
the remaining funds in the
Fund Complex) | Senior Vice President of Allspring Funds Management, LLC since 2009. Senior Vice President of Evergreen Investment Management Company, LLC from 2008 to 2010 and head of the Fund Reporting and Control Team within Fund Administration. |
Kate McKinley
(Born 1977) | Chief Legal Officer and Chief Compliance Officer,
since 2021 | Chief Legal Officer of Allspring Global Investments since 2021. Prior thereto, held various roles at State Street Global Advisors, Inc. beginning in 2010, including serving as Senior Vice President and General Counsel from 2019 to 2021. Previously served as Assistant General Counsel for Bank of America Corporation from 2005 to 2010 and as an Associate at WilmerHale from 2002 to 2005. |
Matthew Prasse
(Born 1983) | Secretary,
since 2021 | Senior Counsel of the Allspring Legal Department since 2021. Senior Counsel of the Wells Fargo Legal Department from 2018 to 2021. Previously, Counsel for Barings LLC from 2015 to 2018. Prior to joining Barings, Associate at Morgan, Lewis & Bockius LLP from 2008 to 2015. |
1 The Statement of Additional Information includes additional information about the Trustees and is available, without charge, upon request, by calling 1-800-222-8222 or by visiting the website at allspringglobal.com.
2 For those Officers with tenures at Allspring Global Investments and/or Allspring Funds Management, LLC that began prior to 2021, such tenures include years of service during which these businesses/entities were known as Wells Fargo Asset Management and Wells Fargo Funds Management, LLC, respectively.
Wells Fargo Disciplined Small Cap Fund | 37
Board considerations (unaudited)
BOARD CONSIDERATION OF INVESTMENT MANAGEMENT AND SUB-ADVISORY AGREEMENTS:
Board Considerations – Current Agreements
Under the Investment Company Act of 1940 (the “1940 Act”), the Board of Trustees (the “Board”) of Wells Fargo Funds Trust (the “Trust”) must determine annually whether to approve the continuation of the Trust’s investment management and sub-advisory agreements. In this regard, at a Board meeting held on May 17-19, 2021 (the “Meeting”), the Board, all the members of which have no direct or indirect interest in the investment management and sub-advisory agreements and are not “interested persons” of the Trust, as defined in the 1940 Act (the “Independent Trustees”), reviewed and approved for Wells Fargo Disciplined Small Cap Fund (the “Fund”): (i) an investment management agreement (the “Management Agreement”) with Wells Fargo Funds Management, LLC (“Funds Management”); and (ii) an investment sub-advisory agreement (the “Sub-Advisory Agreement”) with Wells Capital Management Incorporated (the “Sub-Adviser”), an affiliate of Funds Management. The Management Agreement and the Sub-Advisory Agreement are collectively referred to as the “Advisory Agreements.”
The Board noted that Wells Fargo & Company recently announced that it had entered into a definitive agreement to sell Wells Fargo Asset Management (“WFAM”), which includes Funds Management and the Sub-Adviser, to GTCR LLC and Reverence Capital Partners, L.P. and/or their affiliates (the “Transaction”). The Board further noted that the Transaction would result in a change-of-control of Funds Management and the Sub-Adviser, which would be considered to be an assignment that would result in the termination of the Advisory Agreements. In light of the Transaction, the Board separately considered for approval a new investment management agreement with Funds Management and a new sub-advisory agreement with the Sub-Adviser (the “New Agreements”) that would replace the Advisory Agreements upon consummation of the Transaction, subject to approval of the New Agreements by the Fund’s shareholders. The Board also considered for approval interim agreements to go into effect in the event shareholders do not approve the New Agreements before the Transaction is completed. The interim agreements would allow the Manager and the Sub-Adviser to continue providing services to the Fund while the Fund continues to seek shareholder approval of the New Agreements. The Board noted that the terms of the interim agreements would be identical to those of the current Advisory Agreements, except for the term and certain escrow provisions.
At the Meeting, the Board considered the factors and reached the conclusions described below relating to the selection of Funds Management and the Sub-Adviser and the approval of the Advisory Agreements. Prior to the Meeting, including at Board meetings held in April and May 2021, the Trustees conferred extensively among themselves and with representatives of Funds Management about these matters. Also, the Board has adopted a team-based approach, with each team consisting of a sub-set of Trustees, to assist the full Board in the discharge of its duties in reviewing investment performance and other matters throughout the year. The Independent Trustees were assisted in their evaluation of the Advisory Agreements by independent legal counsel, from whom they received separate legal advice and with whom they met separately.
In providing information to the Board, Funds Management and the Sub-Adviser were guided by a detailed set of requests for information submitted to them by independent legal counsel on behalf of the Independent Trustees at the start of the Board’s annual contract renewal process earlier in 2021. In considering and approving the Advisory Agreements, the Trustees considered the information they believed relevant, including but not limited to the information discussed below. The Board considered not only the specific information presented in connection with the Meeting, but also the knowledge gained over time through interaction with Funds Management and the Sub-Adviser about various topics. In this regard, the Board reviewed reports of Funds Management at each of its quarterly meetings, which included, among other things, portfolio reviews and investment performance reports. In addition, the Board and the teams mentioned above confer with portfolio managers at various times throughout the year. The Board did not identify any particular information or consideration that was all-important or controlling, and each individual Trustee may have attributed different weights to various factors.
After its deliberations, the Board unanimously determined that the compensation payable to Funds Management and the Sub-Adviser under each of the Advisory Agreements was reasonable, and approved the continuation of the Advisory Agreements for a one-year term. The Board considered the approval of the Advisory Agreements for the Fund as part of its consideration of agreements for funds across the complex, but its approvals were made on a fund-by-fund basis. The following summarizes a number of important, but not necessarily all, factors considered by the Board in support of its approvals.
Nature, extent and quality of services
The Board received and considered various information regarding the nature, extent and quality of services provided to the Fund by Funds Management and the Sub-Adviser under the Advisory Agreements. This information included a description of the investment advisory services and Fund-level administrative services covered by the Management Agreement, as well as, among other things, a summary of the background and experience of senior management of WFAM, of which Funds Management and the Sub-Adviser are a part, and a summary of investments made in the business of WFAM. The Board also received a description of
38 | Wells Fargo Disciplined Small Cap Fund
Board considerations (unaudited)
Funds Management’s and the Sub-Adviser’s business continuity plans, including a summary of the performance of such plans and any changes thereto during the COVID-19 pandemic, and of their approaches to data privacy and cybersecurity. The Board also received and reviewed information about Funds Management’s role as administrator of the Fund’s liquidity risk management program, Funds Management’s approach to risk management, and Funds Management’s intermediary and vendor oversight program.
The Board also considered the qualifications, background, tenure and responsibilities of each of the portfolio managers primarily responsible for the day-to-day portfolio management of the Fund. The Board evaluated the ability of Funds Management and the Sub-Adviser to attract and retain qualified investment professionals, including research, advisory and supervisory personnel.
The Board further considered the compliance programs and compliance records of Funds Management and the Sub-Adviser. In addition, the Board took into account the full range of services provided to the Fund by Funds Management and its affiliates. The Board also considered information about retention and back-up arrangements that have been put into place with respect to key personnel of WFAM in connection with the anticipated Transaction, noting that WFAM provided assurances that the announcement and eventual culmination of the Transaction is not expected to result in any diminution in the nature or quality of services provided to the Fund.
Fund investment performance and expenses
The Board considered the investment performance results for the Fund over various time periods ended December 31, 2020. The Board considered these results in comparison to the investment performance of funds in a universe that was determined by Broadridge Inc. (“Broadridge”) to be similar to the Fund (the “Universe”), and in comparison to the Fund’s benchmark index and to other comparative data. Broadridge is an independent provider of investment company data. The Board received a description of the methodology used by Broadridge to select the mutual funds in the performance Universe. The Board noted that the investment performance of the Fund (Administrator Class) was higher than the average investment performance of the Universe for the one-year period, was in range of the average investment performance of the Universe for the ten-year period, and was lower than the average investment performance of the Universe for the three- and five-year periods. The Board also noted that the investment performance of the Fund was lower than its benchmark index, the Russell 2000® Index, for all periods under review.
The Board received information concerning, and discussed factors contributing to, the underperformance of the Fund relative to the Universe and benchmark for the periods identified above. The Board took note of the explanations for the relative underperformance during these periods, including with respect to investment decisions and market factors that affected the Fund’s investment performance. The Board also took note of the Fund’s outperformance relative to the Universe over the recent one-year period.
The Board also received and considered information regarding the Fund’s net operating expense ratios and their various components, including actual management fees, custodian and other non-management fees, and Rule 12b-1 and non-Rule 12b-1 shareholder service fees. The Board considered these ratios in comparison to the median ratios of funds in class-specific expense groups that were determined by Broadridge to be similar to the Fund (the “Groups”). The Board received a description of the methodology used by Broadridge to select the mutual funds in the expense Groups and an explanation of how funds comprising expense groups and their expense ratios may vary from year-to-year. Based on the Broadridge reports, the Board noted that the net operating expense ratios of the Fund were lower than or equal to the median net operating expense ratios of the expense Groups for each share class.
The Board took into account the Fund’s investment performance and expense information provided to it among the factors considered in deciding to re-approve the Advisory Agreements.
Investment management and sub-advisory fee rates
The Board reviewed and considered the contractual fee rates payable by the Fund to Funds Management under the Management Agreement, as well as the contractual fee rates payable by the Fund to Funds Management for class-level administrative services under a Class-Level Administration Agreement, which include, among other things, class-level transfer agency and sub-transfer agency costs (collectively, the “Management Rates”). The Board also reviewed and considered the contractual investment sub-advisory fee rates that are payable by Funds Management to the Sub-Adviser for investment sub-advisory services.
Among other information reviewed by the Board was a comparison of the Fund’s Management Rates with the average contractual investment management fee rates of funds in the expense Groups at a common asset level as well as transfer agency costs of the funds in the expense Groups. The Board noted that the Management Rates of the Fund were in range of the sum of these average rates for the Fund’s expense Groups for the Administrator Class and Class R6 shares, and were higher than the sum of these average rates for the Fund’s expense Groups for the Class A and Institutional Class shares.
Wells Fargo Disciplined Small Cap Fund | 39
Board considerations (unaudited)
The Board also received and considered information about the portion of the total management fee that was retained by Funds Management after payment of the fee to the Sub-Adviser for sub-advisory services. In assessing the reasonableness of this amount, the Board received and evaluated information about the nature and extent of responsibilities retained and risks assumed by Funds Management and not delegated to or assumed by the Sub-Adviser, and about Funds Management’s on-going oversight services. Given the affiliation between Funds Management and the Sub-Adviser, the Board ascribed limited relevance to the allocation of fees between them.
The Board also received and considered information about the nature and extent of services offered and fee rates charged by Funds Management and the Sub-Adviser to other types of clients with investment strategies similar to those of the Fund. In this regard, the Board received information about the significantly greater scope of services, and compliance, reporting and other legal burdens and risks of managing proprietary mutual funds compared with those associated with managing assets of other types of clients, including third-party sub-advised fund clients and non-mutual fund clients such as institutional separate accounts.
Based on its consideration of the factors and information it deemed relevant, including those described here, the Board determined that the compensation payable to Funds Management under the Management Agreement and to the Sub-Adviser under the Sub-Advisory Agreement was reasonable.
Profitability
The Board received and considered information concerning the profitability of Funds Management, as well as the profitability of both WFAM and Wells Fargo & Co. (“Wells Fargo”) from providing services to the fund family as a whole. The Board noted that the Sub-Adviser’s profitability information with respect to providing services to the Fund and other funds in the family was subsumed in the WFAM and Wells Fargo profitability analysis.
Funds Management reported on the methodologies and estimates used in calculating profitability, including a description of the methodology used to allocate certain expenses. Among other things, the Board noted that the levels of profitability reported on a fund-by-fund basis varied widely, depending on factors such as the size, type and age of fund.
Based on its review, the Board did not deem the profits reported by Funds Management, WFAM or Wells Fargo from services provided to the Fund to be at a level that would prevent it from approving the continuation of the Advisory Agreements.
Economies of scale
The Board received and considered information about the potential for Funds Management to experience economies of scale in the provision of management services to the Fund, the difficulties of calculating economies of scale at an individual fund level, and the extent to which potential scale benefits are shared with Fund shareholders. The Board noted the existence of breakpoints in the Fund’s management fee structure, which operate generally to reduce the Fund’s expense ratios as the Fund grows in size, and the size of the Fund in relation to such breakpoints. The Board considered that in addition to management fee breakpoints, Funds Management shares potential economies of scale from its management business in a variety of ways, including through fee waiver and expense reimbursement arrangements, competitive management fee rates set at the outset without regard to breakpoints, and investments in the business intended to enhance services available to shareholders.
The Board concluded that Funds Management’s arrangements with respect to the Fund, including contractual breakpoints, constituted a reasonable approach to sharing potential economies of scale with the Fund and its shareholders.
Other benefits to Funds Management and the Sub-Adviser
The Board received and considered information regarding potential “fall-out” or ancillary benefits received by Funds Management and its affiliates, including the Sub-Adviser, as a result of their relationships with the Fund. Ancillary benefits could include, among others, benefits directly attributable to other relationships with the Fund and benefits potentially derived from an increase in Funds Management’s and the Sub-Adviser’s business as a result of their relationships with the Fund. The Board noted that various affiliates of Funds Management may receive distribution-related fees, shareholder servicing payments and sub-transfer agency fees in respect of shares sold or held through them and services provided.
The Board also reviewed information about soft dollar credits earned and utilized by the Sub-Adviser, fees earned by Funds Management and the Sub-Adviser from managing a private investment vehicle for the fund family’s securities lending collateral and commissions earned by an affiliated broker from portfolio transactions.
Based on its consideration of the factors and information it deemed relevant, including those described here, the Board did not find that any ancillary benefits received by Funds Management and its affiliates, including the Sub-Adviser, were unreasonable.
40 | Wells Fargo Disciplined Small Cap Fund
Board considerations (unaudited)
Conclusion
At the Meeting, after considering the above-described factors and based on its deliberations and its evaluation of the information described above, the Board unanimously determined that the compensation payable to Funds Management and the Sub-Adviser under each of the Advisory Agreements was reasonable, and approved the continuation of the Advisory Agreements for a one-year term.
Wells Fargo Disciplined Small Cap Fund | 41
Board considerations (unaudited)
Board Considerations – New Agreements
Overview of the Board evaluation process
At a meeting held on May 17-19, 2021 (the “Board Meeting”), the Board of Trustees (the “Board”) of Wells Fargo Funds Trust (the “Trust”, and the series identified below, the “Funds”) approved the continuation of each Fund’s current Investment Management Agreement (the “Current Investment Management Agreement”) and the current Sub-Advisory Agreements (the “Current Sub-Advisory Agreements”, and collectively, the “Current Agreements”).
| Wells Fargo C&B Mid Cap Value Fund |
| Wells Fargo California Limited-Term Tax-Free Fund |
| Wells Fargo California Tax-Free Fund |
| Wells Fargo Classic Value Fund |
| Wells Fargo Common Stock Fund |
| Wells Fargo Disciplined Small Cap Fund |
| Wells Fargo Disciplined U.S. Core Fund |
| Wells Fargo Discovery Fund |
| Wells Fargo Diversified Equity Fund |
| Wells Fargo Endeavor Select Fund |
| Wells Fargo Enterprise Fund |
| Wells Fargo Fundamental Small Cap Growth Fund |
| Wells Fargo Growth Fund |
| Wells Fargo High Yield Municipal Bond Fund |
| Wells Fargo Intermediate Tax/AMT-Free Fund |
| Wells Fargo Large Cap Core Fund |
| Wells Fargo Large Cap Growth Fund |
| Wells Fargo Large Company Value Fund |
| Wells Fargo Minnesota Tax-Free Fund |
| Wells Fargo Municipal Bond Fund |
| Wells Fargo Omega Growth Fund |
| Wells Fargo Opportunity Fund |
| Wells Fargo Pennsylvania Tax-Free Fund |
| Wells Fargo Premier Large Company Growth Fund |
| Wells Fargo Short-Term Municipal Bond Fund |
| Wells Fargo Small Cap Fund |
| Wells Fargo Special Mid Cap Value Fund |
| Wells Fargo Special Small Cap Value Fund |
| Wells Fargo Strategic Municipal Bond Fund |
| Wells Fargo Ultra Short-Term Municipal Income Fund |
| Wells Fargo Wisconsin Tax-Free Fund |
Each Trustee on the Board is not an “interested person” (as defined in the Investment Company Act of 1940 (the “1940 Act”)) of the Funds (collectively, the “Independent Trustees”). The process followed by the Board in considering and approving the continuation of the Current Agreements is referred to herein as the “2021 Annual Approval Process.”
As noted above, the closing of the sale of Wells Fargo Asset Management (“WFAM”) to a holding company (“NewCo”) affiliated with private funds of GTCR LLC (“GTCR”) and of Reverence Capital Partners, L.P. (“Reverence Capital”, and such transaction, the “Transaction”) will result in a change of control of Wells Fargo Funds Management LLC (“Funds Management”) and Wells Capital Management Incorporated (“Wells Capital”, and together with Funds Management, the “Advisers”), which will be considered to be an “assignment” of each Fund’s Current Agreements under the 1940 Act that will result in the automatic termination of each Fund’s Current Agreements. In light of the expected termination of each Fund’s Current Agreements upon the closing, at the Board Meeting the Board also considered and approved the New Agreements, which are: (i) a new Investment Management Agreement (the “New Investment Management Agreement”) between the Trust, on behalf of each Fund, and Funds Management; (ii) a new Sub-Advisory Agreement (the “New Wells Capital Sub-Advisory Agreement”) among the Trust, Funds Management and Wells Capital with respect to each Fund other than C& B Mid Cap Value Fund and Diversified Equity Fund; and (iii) a new Sub-Advisory Agreement (the “New C&B Sub-Advisory Agreement”, and collectively, the “New Agreements”) among the Trust, with respect to the C&B Mid Cap Value Fund, Funds Management and Cooke & Bieler, L.P. (“C&B”, and together with Wells Capital, the “Sub-Advisers”), each of which is intended to go into effect upon the closing. The process followed by the Board in reviewing and approving the New Agreements is referred to herein as the “New Agreement Approval Process.”
42 | Wells Fargo Disciplined Small Cap Fund
Board considerations (unaudited)
At a series of meetings held in April and May 2021 (collectively, “April and May 2021 Meetings”) and at the Board Meeting, the Trustees conferred extensively among themselves and with senior representatives of Funds Management, GTCR and Reverence Capital about the New Agreements and related matters. The Board reviewed and discussed information furnished by Funds Management, GTCR and Reverence Capital that the Board considered reasonably necessary to evaluate the terms of the New Agreements and the services to be provided. At these meetings, senior representatives from Funds Management, GTCR and Reverence Capital made presentations to, and responded to questions from, the Board.
In providing information to the Board in connection with the 2021 annual approval process (the “2021 Annual Approval Process”) and the New Agreement Approval Process, Funds Management, GTCR and Reverence Capital (as applicable) were guided by requests for information submitted by independent legal counsel on behalf of the Independent Trustees. In considering and approving the New Agreements, the Trustees considered the information they believed relevant, including but not limited to the information discussed herein. The Board considered not only the specific information presented in connection with the April and May 2021 Meetings as well as the Board Meeting, but also the knowledge gained over time through interaction with Funds Management and the Sub-Advisers about various topics. In this regard, the Board reviews reports of Funds Management at each of its regular Board meetings, which includes, among other things, portfolio reviews and investment performance reports. In addition, the Board confers with portfolio managers at various times throughout the year. The Board was assisted in its evaluation of the New Agreements by independent legal counsel, from whom the Independent Trustees received separate legal advice and with whom the Independent Trustees met separately. The Board did not identify any particular information or consideration that was all-important or controlling, and each individual Trustee may have attributed different weights to various factors.
Among other information considered by the Board in connection with the Transaction was:
| ■ | Information regarding the Transaction: information about the structure, financing sources and material terms and conditions of the Transaction, including the expected impact on the businesses conducted by the Advisers and by Wells Fargo Funds Distributor LLC, as the distributor of Fund shares. |
| ■ | Information regarding NewCo, GTCR and Reverence Capital: (i) information about NewCo, including information about its expected financial condition and access to capital, and senior leadership team; (ii) the experience of senior management at GTCR and Reverence Capital in acquiring portfolio companies; (iii) the plan to operationalize NewCo, including the transition of necessary infrastructure services through a transition services agreement with Wells Fargo under which Wells Fargo will continue to provide NewCo with certain services for a specified period of time after the closing; and (iv) information regarding regulatory matters, compliance, and risk management functions at NewCo, including resources to be dedicated thereto. |
| ■ | Impact of the Transaction on WFAM and Service Providers: (i) information regarding any changes to personnel and/or other resources of the Advisers as a result of the Transaction, including assurances regarding comparable and competitive compensation arrangements to attract and retain highly qualified personnel; and (ii) information about the organizational and operating structure with respect to NewCo, the Advisers and the Funds. |
| ■ | Impact of the Transaction on the Funds and their Shareholders: (i) information regarding anticipated benefits to the Funds as a result of the Transaction; (ii) a commitment that the Funds would not bear any expenses, directly or indirectly, in connection with the Transaction; (iii) confirmation that the Advisers intend to continue to manage the Funds in a manner consistent with each Fund’s current investment objectives and principal investments strategies; and (iv) a commitment that neither NewCo nor WFAM will take any steps that would impose any “unfair burden” (as that term is used in section 15(f)(1)(B) of the 1940 Act) on the Funds as a result of the Transaction. |
With respect to the New Agreements, the Board considered: (i) a representation that, after the closing, all of the Funds will continue to be managed and advised by their current Advisers and for C&B Mid Cap Value Fund, C&B, and that the same portfolio managers of the Sub-Advisers are expected to continue to manage the Funds after the Transaction; (ii) information regarding the terms of the New Agreements, including changes as compared to the Current Agreements; (iii) information confirming that the fee rates payable under the New Agreements will not increase as a result of the Transaction as compared to the rates under the Current Agreements; and (iv) assurances that the Transaction is not expected to cause any diminution with respect to the nature, extent and quality of any of the services currently provided to the Funds by the Advisers as a result of the Transaction.
In addition to considering information furnished specifically to evaluate the impact of the Transaction on the Funds and their respective shareholders in connection with the New Agreement Approval Process, the Board considered information furnished at prior meetings of the Board and its committees, including detailed information provided in connection with the 2021 Annual Approval Process. In this regard, in connection with the 2021 Annual Approval Process, the Board received information about complex-wide and individual Fund performance, fees and expenses, including: (i) a report from an independent data provider comparing the investment performance of each Fund to the investment performance of comparable funds and benchmark indices, over various time periods; (ii) a report from an independent data provider comparing each Fund’s total expense ratio (and
Wells Fargo Disciplined Small Cap Fund | 43
Board considerations (unaudited)
its components) to those of comparable funds; (iii) comparative information concerning the fees charged and services provided by Funds Management and the Sub-Advisers to each Fund in managing other accounts (which may include other mutual funds, collective investment funds and institutional accounts), if any, that employ investment strategies and techniques similar to those used in managing such Fund(s); and (iv) profitability analyses of Funds Management, as well as the profitability of both WFAM and Wells Fargo from providing services to the fund family as a whole.
After its deliberations, the Board unanimously determined that the compensation payable to Funds Management and the Sub-Advisers under the New Agreements is reasonable, approved the New Agreements for a two-year term, and voted to recommend that Fund shareholders approve the New Agreements. The Board considered the approval of the New Agreements as part of its consideration of agreements for funds across the complex, but its approvals were made on a fund-by-fund basis. The following summarizes a number of important, but not necessarily all, factors considered by the Board in support of its approvals.
Nature, extent and quality of services
In connection with the 2021 Annual Approval Process, the Board received and considered various information regarding the nature, extent and quality of services provided to the Fund by Funds Management and the Sub-Advisers under the Advisory Agreements. This information included a description of the investment advisory services and Fund-level administrative services covered by the Current Management Agreement, as well as, among other things, a summary of the background and experience of senior management of WFAM, of which Funds Management and Wells Capital are a part, and a summary of investments made in the business of WFAM. The Board also received a description of Funds Management’s and the Sub-Advisers’ business continuity plans, including a summary of the performance of such plans and any changes thereto during the COVID-19 pandemic, and of their approaches to data privacy and cybersecurity. The Board also received and reviewed information about Funds Management’s role as administrator of the Funds’ liquidity risk management program, Funds Management’s approach to risk management, and Funds Management’s intermediary and vendor oversight program.
In connection with the 2021 Annual Approval Process, the Board also considered the qualifications, background, tenure and responsibilities of each of the portfolio managers primarily responsible for the day-to-day portfolio management of the Funds. The Board evaluated the ability of Funds Management and the Sub-Advisers to attract and retain qualified investment professionals, including research, advisory and supervisory personnel.
In connection with the 2021 Annual Approval Process, the Board further considered the compliance programs and compliance records of Funds Management and the Sub-Advisers. In addition, the Board took into account the full range of services provided to the Fund by Funds Management and its affiliates.
In connection with the New Agreement Approval Process, the Board considered, among other information, the structure of the Transaction and expected impact, if any, of the Transaction on the operations, facilities, organization and personnel of Funds Management and the Sub-Advisers. The Board received assurances from Funds Management that each Fund will continue to be advised by its current Sub-Adviser after the closing, and that the same individual portfolio managers are expected to continue to manage the Funds after the closing. With respect to the recruitment and retention of key personnel, the Board noted information from GTCR, Reverence Capital and the Advisers regarding the potential benefits for employees of joining NewCo. The Board recognized that the personnel who had been extended offers may not accept such offers and personnel changes may occur in the future in the ordinary course.
In addition, the Board considered information regarding the infrastructure, operational capabilities and support staff in place to assist in the portfolio management and operations of the Funds, including the provision of administrative services, and the anticipated impact of the Transaction on such matters. The Board also considered the business-related and other risks to which the Advisers may be subject in managing the Funds and in connection with the Transaction. The Board also considered the transition and integration plans as a result of the change in ownership of the Advisers from Wells Fargo to NewCo. The Board considered the resources and infrastructure that NewCo intends to devote to its compliance program to ensure compliance with applicable laws and regulations, as well as its risk management program and cybersecurity program. The Board also took into account assurances received from the Advisers, GTCR and Reverence Capital that the Transaction is not expected to cause any diminution in the nature, extent and quality of services provided by Funds Management and the Sub-Advisers to the Funds and their shareholders.
Fund investment performance and expenses
In connection with the 2021 Annual Approval Process, the Board considered the investment performance results for each Fund over various time periods ended December 31, 2020. The Board considered these results in comparison to the investment performance of funds in a universe that was determined by Broadridge Inc. (“Broadridge”) to be similar to each Fund (the “Universe”), and in comparison to each Fund’s benchmark index and to other comparative data. Broadridge is an independent provider of investment company data. The Board received a description of the methodology used by Broadridge to select the
44 | Wells Fargo Disciplined Small Cap Fund
Board considerations (unaudited)
mutual funds in the performance Universe. Where applicable, the Board received information concerning, and discussed factors contributing to, underperformance of Funds relative to the Universe and benchmark for any underperformance periods.
In connection with the 2021 Annual Approval Process, the Board also received and considered information regarding each Fund’s net operating expense ratios and their various components, including actual management fees, custodian and other non-management fees, and Rule 12b-1 and non-Rule 12b-1 shareholder service fees. The Board considered these ratios in comparison to the median ratios of funds in class-specific expense groups that were determined by Broadridge to be similar to the Fund (the “Groups”). The Board received a description of the methodology used by Broadridge to select the mutual funds in the expense Groups and an explanation of how funds comprising expense groups and their expense ratios may vary from year-to-year.
In connection with the New Agreement Approval Process, the Board received a commitment that WFAM will maintain fee and expense commitments for at least two years after the closing. The Board took into account each Fund’s investment performance and expense information among the factors considered in deciding to approve the New Agreements.
Investment management and sub-advisory fee rates
In connection with the 2021 Annual Approval Process, the Board reviewed and considered the contractual fee rates payable by each Fund to Funds Management under the Current Management Agreement, as well as the contractual fee rates payable by each Fund to Funds Management for class-level administrative services under a Class-Level Administration Agreement, which include, among other things, class-level transfer agency and sub-transfer agency costs (collectively, the “Management Rates”). The Board also reviewed and considered the contractual investment sub-advisory fee rates that are payable by Funds Management to each of the Sub-Advisers under the Current Sub-Advisory Agreements for investment sub-advisory services (the “Sub-Advisory Fee Rates”).
Among other information reviewed by the Board in connection with the 2021 Annual Approval Process, was a comparison of each Fund’s Management Rates with the average contractual investment management fee rates of funds in the expense Groups at a common asset level as well as transfer agency costs of the funds in the expense Groups.
In connection with the 2021 Annual Approval Process, the Board also received and considered information about the portion of the total management fee that was retained by Funds Management after payment of the Sub-Advisory Fee Rates. In assessing the reasonableness of this amount, the Board received and evaluated information about the nature and extent of responsibilities retained and risks assumed by Funds Management and not delegated to or assumed by the Sub-Advisers, and about Funds Management’s on-going oversight services. With respect to C&B, the Board also considered this amount in comparison to the median amount retained by advisers to funds in a sub-advised expense universe that was determined by Broadridge to be similar to the Specialized Technology Fund. In this regard, the Board noted the small size of the sub-advised expense universe. The Board also considered that the sub-advisory fees paid to C&B had been negotiated by Funds Management on an arm’s length basis. Given the affiliation between Funds Management and Wells Capital, the Board ascribed limited relevance to the allocation of fees between them.
In connection with the 2021 Annual Approval Process, the Board also received and considered information about the nature and extent of services offered and fee rates charged by Funds Management and the Sub-Advisers to other types of clients, if any, with investment strategies similar to those of each Fund. In this regard, the Board received information about the significantly greater scope of services, and compliance, reporting and other legal burdens and risks of managing proprietary mutual funds compared with those associated with managing assets of other types of clients, including third-party sub-advised fund clients and non-mutual fund clients such as institutional separate accounts.
In connection with the New Agreement Approval Process, the Board noted the assurances received by it that there would be no increases to any of the Management Rates or the Sub-Advisory Fee Rates as a result of the Transaction. The Board also considered that the New Agreements do not change the computation method for calculating such fees, and there is no present intention to reduce expense waiver and reimbursement arrangements that are currently in effect. Based on its consideration of the factors and information it deemed relevant, including those described here, the Board determined that the compensation payable to Funds Management under the New Management Agreement and to each of the Sub-Advisers under the New Sub-Advisory Agreements was reasonable.
Profitability
In connection with the 2021 Annual Approval Process, the Board received and considered information concerning the profitability of Funds Management, as well as the profitability of both WFAM and Wells Fargo from providing services to the fund family as a whole. The Board noted that Wells Capital’s profitability information with respect to providing services to each Fund Wells Capital
Wells Fargo Disciplined Small Cap Fund | 45
Board considerations (unaudited)
sub-advises and other funds in the family was subsumed in the WFAM and Wells Fargo profitability analysis. The Board did not consider profitability with respect to C&B, as the sub-advisory fees paid to C&B had been negotiated by Funds Management on an arm’s-length basis.
Funds Management reported on the methodologies and estimates used in calculating profitability in connection with the 2021 Annual Approval Process, including a description of the methodology used to allocate certain expenses. Among other things, the Board noted that the levels of profitability reported on a fund-by-fund basis varied widely, depending on factors such as the size, type and age of fund.
In connection with the New Agreement Approval Process, the Board received certain information about NewCo’s projected financial condition, and reviewed with senior representatives of Funds Management, GTCR and Reverence Capital the underlying assumptions on which such information was based. The Board considered that NewCo is a newly formed entity, with no historical operations, revenues or expenses, and that it is difficult to predict with any degree of certainty the future profitability of NewCo and the Advisers from advisory activities under the New Agreements. The Board considered that the fee rates payable under the New Agreements will not increase as a result of the Transaction as compared to the rates under the Current Agreements, and that the current contractual expense limitations applicable to each Fund will not increase. The Board noted that if the New Agreements are approved by shareholders and the Transaction closes, the Board will have the opportunity in the future to review the profitability of NewCo and the Advisers from advisory activities under the New Agreements.
Economies of scale
In connection with the 2021 Annual Approval Process, the Board received and considered information about the potential for Funds Management to experience economies of scale in the provision of management services to the Funds, the difficulties of calculating economies of scale at an individual fund level, and the extent to which potential scale benefits are shared with Fund shareholders. The Board noted the existence of breakpoints in each Fund’s management fee structure, which operate generally to reduce the Fund’s expense ratios as the Fund grows in size, and the size of the Fund in relation to such breakpoints. The Board considered that, in addition to management fee breakpoints, Funds Management shares potential economies of scale from its management business in a variety of ways, including through fee waiver and expense reimbursement arrangements, competitive management fee rates set at the outset without regard to breakpoints, and investments in the business intended to enhance services available to shareholders.
In connection with the New Agreement Approval Process, the Board noted that NewCo and the Advisers may benefit from possible growth of the Funds resulting from enhanced distribution capabilities. However, the Board noted that other factors could also affect the potential for economies of scale, and that it was not possible to quantify any potential future economies of scale. Based upon the information furnished to the Board in connection with the 2021 Annual Approval Process and the New Agreement Approval Process, the Board concluded that Funds Management’s arrangements with respect to each Fund, including contractual breakpoints and expense limitation arrangements, constituted a reasonable approach to sharing potential economies of scale with the Fund and its shareholders.
“Fall-out” benefits to Funds Management and the Sub-Advisers
In connection with the 2021 Annual Approval Process, the Board received and considered information regarding potential “fall-out” or ancillary benefits received by Funds Management and its affiliates, including Wells Capital, and C&B as a result of their relationships with the Funds. Ancillary benefits could include, among others, benefits directly attributable to other relationships with the Funds and benefits potentially derived from an increase in Funds Management’s and the Sub-Advisers’ business as a result of their relationships with the Funds. The Board noted that various current affiliates of Funds Management may receive distribution-related fees, shareholder servicing payments and sub-transfer agency fees in respect of shares sold or held through them and services provided.
In connection with the 2021 Annual Approval Process, the Board also reviewed information about soft dollar credits earned and utilized by the Sub-Advisers, fees earned by Funds Management and Wells Capital from managing a private investment vehicle for the fund family’s securities lending collateral, and commissions earned by an affiliated broker of Wells Fargo from portfolio transactions.
In connection with the New Agreement Approval Process, the Board received information to the effect that the Transaction is not expected to have a material impact on the fall-out benefits currently realized by Funds Management and its affiliates, including Wells Capital, and C&B. The information reviewed by the Board also noted that several of the ancillary benefits identified for WFAM would be potential ancillary benefits for NewCo, including that the scale and reputation of the Funds might benefit NewCo’s broader reputation, product initiatives, technology investment and talent acquisition. Based on its consideration of the
46 | Wells Fargo Disciplined Small Cap Fund
Board considerations (unaudited)
factors and information it deemed relevant, including those described here, the Board did not find that any ancillary benefits expected to be received by Funds Management and its affiliates, including NewCo and Wells Capital, and C&B under the New Agreements were unreasonable.
Conclusion
At the Board Meeting, after considering the above-described factors and based on its deliberations and its evaluation of the information described above, the Board unanimously determined that the compensation payable to Funds Management and to each of the Sub-Advisers under the New Agreements is reasonable, approved the New Agreements for a two-year term, and voted to recommend that Fund shareholders approve the New Agreements.
Wells Fargo Disciplined Small Cap Fund | 47
Board considerations (unaudited)
Board Considerations - Interim Agreements
At a meeting held on May 17-19, 2021 (the “Board Meeting”), the Boards of Trustees (each, a “Board”, and collectively, the “Boards”) of Wells Fargo Funds Trust, Wells Fargo Master Trust, Wells Fargo Variable Trust, Wells Fargo Global Dividend Opportunity Fund, Wells Fargo Income Opportunities Fund, Wells Fargo Multi-Sector Income Fund and Wells Fargo Utilities and High Income Fund (each a “Trust”, and the series thereof, a “Fund”) reviewed and approved for the Trusts and Funds, as applicable: (i) interim investment management agreements (the “Interim Management Agreements”) with Wells Fargo Funds Management, LLC (“Funds Management”); (ii) interim investment advisory agreements (the “Interim Advisory Agreements”) with Funds Management; and (iii) interim sub-advisory agreements (the “Interim Sub-Advisory Agreements”) with each of Cooke & Bieler, L.P., Galliard Capital Management LLC (“Galliard”), Peregrine Capital Management Inc., Wells Capital Management, LLC (“WellsCap”), and Wells Fargo Asset Management (International) Limited (“WFAMI”, and collectively, the “Sub-Advisers”). Each Trustee on the Board is not an “interested person” (as defined in the Investment Company Act of 1940 (the “1940 Act”) of the Funds (collectively, the “Independent Trustees”). The Interim Management Agreements, Interim Advisory Agreements, and Interim Sub-Advisory Agreements are collectively referred to as the “Interim Advisory Agreements.”
At the Board Meeting, the Boards reviewed and approved the continuation of existing investment management, advisory and sub-advisory agreements (the “Current Advisory Agreements”) for each Trust and Fund, as applicable. The factors considered and conclusions reached by the Boards in approving the Current Advisory Agreements are summarized in the section entitled “Board Considerations – Current Agreements” of this shareholder report. The Boards noted that Wells Fargo & Company has entered into a definitive agreement to sell Wells Fargo Asset Management (“WFAM”), which includes Funds Management, Galliard, WellsCap and WFAMI (the “Affiliated Sub-Advisers”), to a holding company affiliated with private funds of GTCR LLC and Reverence Capital Partners, L.P. (the “Transaction”). The Boards further noted that the Transaction would result in a change-of-control of Funds Management and the Affiliated Sub-Advisers, which would be considered to be an “assignment” under the 1940 Act that would terminate the Current Advisory Agreements. At the Board Meeting, the Boards also reviewed and approved new investment management, advisory and sub-advisory agreements (the “New Advisory Agreements”) for each Trust and Fund, as applicable, that would replace the Current Advisory Agreements upon consummation of the Transaction, subject to approval of the New Advisory Agreements by the applicable Trust’s or Fund’s shareholders. The factors considered and conclusions reached by the Boards in approving the New Advisory Agreements are summarized in the section entitled “Board Considerations – New Agreements” of this shareholder report.
At the Board Meeting, the Boards also approved the Interim Advisory Agreements, which will go into effect for a Trust or Fund only in the event that shareholders of such Trust or Fund do not approve the New Advisory Agreement(s) for the Trust or Fund by the closing date of the Transaction, when the Current Advisory Agreements will terminate. The Board noted that, in such a circumstance, the Interim Advisory Agreements will permit continuity of management by allowing Funds Management and the Sub-Advisers to continue providing services to the Trust or Fund pursuant to the Interim Advisory Agreements while the Trust or Fund continues to solicit shareholder approval of such New Advisory Agreement(s). The Boards noted that the terms of the Interim Advisory Agreements are identical to those of the Current Advisory Agreements, except for the term and the addition of escrow provisions with respect to the advisory fees. The Boards also noted that the entities that would service the Funds and Trusts under the Interim Advisory Agreements are identical to those that provide services under the Current Advisory Agreements and those that will provide services under the New Advisory Agreements.
In approving the Interim Advisory Agreements, the Boards considered the same factors and reached the same conclusions as they considered and reached with respect to the Boards’ approvals of the Current Advisory Agreements and New Advisory Agreements, as applicable, which are described in separate Board Consideration sections within this shareholder report. Prior to the Board Meeting, including at a series of meetings held in April and May 2021, the Trustees conferred extensively among themselves and with senior representatives of Funds Management, GTCR LLC and Reverence Capital Partners, L.P. about the Interim Advisory Agreements and related matters. The Independent Trustees were assisted in their evaluation of the Interim Advisory Agreements by independent legal counsel, from whom they received separate legal advice and with whom they met separately.
At the Board Meeting, after considering the factors and reaching the conclusions described in the separate Board Consideration sections within this shareholder report, the Boards unanimously determined that the compensation payable to Funds Management and to each Sub-Adviser under each of the Interim Advisory Agreements was reasonable, and approved the Interim Advisory Agreements.
48 | Wells Fargo Disciplined Small Cap Fund
For more information
More information about Wells Fargo Funds is available free upon request. To obtain literature, please write, visit the Fund's website, or call:
Wells Fargo Funds
P.O. Box 219967
Kansas City, MO 64121-9967
Website: allspringglobal.com
Individual investors: 1-800-222-8222
Retail investment professionals: 1-888-877-9275
Institutional investment professionals: 1-866-765-0778
This report and the financial statements contained herein are submitted for the general information of the shareholders of the Fund. If this report is used for promotional purposes, distribution of the report must be accompanied or preceded by a current prospectus. Before investing, please consider the investment objectives, risks, charges, and expenses of the investment. For a current prospectus and, if available, a summary prospectus, containing this information, call
1-800-222-8222 or visit the Fund's website at allspringglobal.com. Read the prospectus carefully before you invest or send money.
Allspring Global InvestmentsTM is the trade name for the asset management firms of Allspring Global Investments Holdings, LLC, a holding company indirectly owned by certain private funds of GTCR LLC and Reverence Capital Partners, L.P. These firms include but are not limited to Allspring Global Investments, LLC, and Allspring Funds Management, LLC. Certain products managed by Allspring entities are distributed by Allspring Funds Distributor, LLC (a broker-dealer and Member FINRA/SIPC).
This material is for general informational and educational purposes only and is NOT intended to provide investment advice or a recommendation of any kind - including a recommendation for any specific investment, strategy, or plan.
© 2021 Allspring Global Investments. All rights reserved.
PAR-1121-00199 09-21
SA243/SAR243 09-21
Semi-Annual Report
September 30, 2021
Wells Fargo Fundamental
Small Cap Growth Fund
The views expressed and any forward-looking statements are as of September 30, 2021, unless otherwise noted, and are those of the Fund's portfolio managers and/or Allspring Global Investments. Discussions of individual securities or the markets generally are not intended as individual recommendations. Future events or results may vary significantly from those expressed in any forward-looking statements. The views expressed are subject to change at any time in response to changing circumstances in the market. Allspring Global Investments disclaims any obligation to publicly update or revise any views expressed or forward-looking statements.
Wells Fargo Fundamental Small Cap Growth Fund | 1
Letter to shareholders (unaudited)
Andrew Owen
President
Wells Fargo Funds
Dear Shareholder:
We are pleased to offer you this semi-annual report for Wells Fargo Fundamental Small Cap Growth Fund for the six-month period that ended September 30, 2021. Global stocks continued to rally as the global economy continued to emerge from the haze of COVID-19. Tailwinds were provided by global stimulus programs, a rapid vaccination rollout, and recovering consumer and corporate sentiment. Bonds were mixed during the period, with municipal bonds and high-yield bonds delivering positive returns.
For the six-month period, U.S. stocks, based on the S&P 500 Index,1 gained 9.18%. International stocks, as measured by the MSCI ACWI ex USA Index (Net),2 returned 2.32%, while the MSCI EM Index (Net),3 trailed its developed market counterparts with a 3.45% loss. Among bond indexes, the Bloomberg U.S. Aggregate Bond Index,4 returned 1.88%, the Bloomberg Global Aggregate ex-USD Index (unhedged),5 returned -0.69%, the Bloomberg Municipal Bond Index6 returned 1.15%, and the ICE BofA U.S. High Yield Index,7 gained 3.74%.
Vaccination rollout drove the stock markets to new highs.
Equity markets produced another strong showing in April. Domestically, the continued reopening of the economy had a strong impact on positive equity performance, as people started leaving their households and jobless claims continued to fall. Domestic corporate bonds performed well and the U.S. dollar weakened. Meanwhile, the U.S. government continued to seek to invest in the recovery, this time by outlining a package of over $2 trillion to improve infrastructure. The primary headwind in April was inflation, as investors tried to determine the breadth and longevity of recent price increases. Developed Europe has been supported by a meaningful increase in the pace of vaccinations. Unfortunately many emerging market countries have not been as successful. India in particular saw COVID-19 cases surge, serving as an example of the need to get vaccinations rolled out to less developed nations.
| 1 | The S&P 500 Index consists of 500 stocks chosen for market size, liquidity, and industry group representation. It is a market-value-weighted index with each stock's weight in the index proportionate to its market value. You cannot invest directly in an index. |
| 2 | The Morgan Stanley Capital International (MSCI) All Country World Index (ACWI) ex USA Index (Net) is a free-float-adjusted market-capitalization-weighted index that is designed to measure the equity market performance of developed and emerging markets, excluding the U.S. Source: MSCI. MSCI makes no express or implied warranties or representations and shall have no liability whatsoever with respect to any MSCI data contained herein. The MSCI data may not be further redistributed or used as a basis for other indexes or any securities or financial products. This report is not approved, reviewed, or produced by MSCI. You cannot invest directly in an index. |
| 3 | The MSCI Emerging Markets (EM) Index (Net) is a free-float-adjusted market-capitalization-weighted index that is designed to measure equity market performance of emerging markets. You cannot invest directly in an index. |
| 4 | The Bloomberg U.S. Aggregate Bond Index is a broad-based benchmark that measures the investment-grade, U.S.-dollar-denominated, fixed-rate taxable bond market, including Treasuries, government-related and corporate securities, mortgage-backed securities (agency fixed-rate and hybrid adjustable-rate mortgage pass-throughs), asset-backed securities, and commercial mortgage-backed securities. You cannot invest directly in an index. |
| 5 | The Bloomberg Global Aggregate ex-USD Index (unhedged) is an unmanaged index that provides a broad-based measure of the global investment-grade fixed-income markets excluding the U.S.-dollar-denominated debt market. You cannot invest directly in an index. |
| 6 | The Bloomberg Municipal Bond Index is an unmanaged index composed of long-term tax-exempt bonds with a minimum credit rating of Baa. You cannot invest directly in an index. |
| 7 | The ICE BofA U.S. High Yield Index is a market-capitalization-weighted index of domestic and Yankee high-yield bonds. The index tracks the performance of high-yield securities traded in the U.S. bond market. You cannot invest directly in an index. Copyright 2021. ICE Data Indices, LLC. All rights reserved. |
2 | Wells Fargo Fundamental Small Cap Growth Fund
Letter to shareholders (unaudited)
Vaccine rollouts continued in May, leading to loosened restrictions globally. As a result, equity markets in general saw a minor increase in returns. Concerns that the continued economic rebound could result in inflation increases becoming more than transitory were supported by the higher input costs businesses were experiencing. Meanwhile, those inflation concerns were tempered by the U.S. Federal Reserve (Fed), which stayed steady on its view of the economy and eased fears of a sudden and substantial policy change. Positive performance in the emerging market equity space was supported this month by steady consumer demand and strong commodity prices. Fixed-income markets were also slightly positive for the month, driven by inflation uncertainty and a softer U.S. dollar.
June witnessed the S&P 500 Index reach a new all-time high. 2021 economic growth and inflation forecasts were revised higher to reflect a strong economic recovery and some supply and demand imbalances. Late June saw a deal reached on a U.S. infrastructure package of approximately $1 trillion for road, bridge, and broadband network upgrades over the next eight years. The Fed’s June meeting yielded no change to policy, but its projections pointed to a possible interest rate rise in 2023. This, combined with a rebound in economic activity and investors searching for yield, led to U.S. Treasury yields being down for the month. Many European and Asian countries saw vaccination momentum increase, while the U.K. dealt with a rise in COVID-19 infections, specifically the Delta variant. Meanwhile, crude oil jumped over 10% in June on the back of the pickup in global economic activity and the Organization of the Petroleum Exporting Countries’ (OPEC) slow pace of supply growth.
July began the month seeing vaccinations making progress, as several major developed countries eased restrictions, only to be threatened again by the spread of COVID-19’s Delta variant. Inflation continued to climb, aided by the continued supply bottleneck in the face of high demand. As it pertains to the equity area of the market, U.S. equities led the way in positive return territory, followed by international developed markets. In contrast, emerging markets were well in negative territory for the month, hindered by China’s plans for new regulations on a number of sectors, specifically education and technology. The U.S. 10-Year Treasury bond yield continued to decline, as strong demand swallowed up supply. After hitting a multi-year high earlier in the month, oil prices leveled off following an agreement by OPEC to raise oil production starting in August.
The Delta variant of COVID-19 produced outbreaks globally in August, increasing the potential for increased market volatility and bringing into question the ongoing economic recovery. Domestically, the U.S. economy continued to stay strong in the face of the Delta variant, continued inflationary pressures, and worries over Hurricane Ida. Emerging market equities experienced elevated volatility, largely influenced by China’s regulatory stance. Emerging market equities started the month with poor performance but rebounded to end the month in positive territory. Municipal debt experienced its first monthly performance drop since February of this year, slowing a rally that made it one of the best-performing sectors of the bond market. In the commodity segment of the market, crude oil fell sharply during the month on the back of dampened expectations as a result of the Delta variant but was still a leading asset class performer for the year.
Global markets suffered their broadest retreat in a year during September, with the exception of commodities. Concerns over inflation and the interest rate outlook depressed investor confidence and hurt performance. Emerging markets declined on concerns over the continued supply chain disruptions and worries over higher energy and food prices. Meanwhile, the Fed indicated it would slow the pace of asset purchases in the near future (pointing towards November). All eyes domestically are fixed on the raising of the debt ceiling, the 2022 budget plan, and the ongoing debate over the infrastructure package. Contrary to most asset classes, commodities thrived in September, driven by sharply higher energy prices.
“ 2021 economic growth and inflation forecasts were revised higher to reflect a strong economic recovery and some supply and demand imbalances.”
“ Municipal debt experienced its first monthly performance drop since February of this year, slowing a rally that made it one of the best-performing sectors of the bond market.”
Wells Fargo Fundamental Small Cap Growth Fund | 3
Letter to shareholders (unaudited)
Don’t let short-term uncertainty derail long-term investment goals.
Periods of investment uncertainty can present challenges, but experience has taught us that maintaining long-term investment goals can be an effective way to plan for the future. To help you create a sound strategy based on your personal goals and risk tolerance, Wells Fargo Funds offers more than 100 mutual funds spanning a wide range of asset classes and investment styles. Although diversification cannot guarantee an investment profit or prevent losses, we believe it can be an effective way to manage investment risk and potentially smooth out overall portfolio performance. We encourage investors to know their investments and to understand that appropriate levels of risk-taking may unlock opportunities.
On November 1, 2021, GTCR LLC and Reverence Capital Partners, L.P., announced the beginning of Allspring Global Investments™, with the close of the transaction to acquire Wells Fargo Funds Management, LLC; Wells Capital Management LLC; Galliard Capital Management LLC.; Wells Fargo Asset Management (International) Ltd.; Wells Fargo Asset Management Luxembourg S.A.; and Wells Fargo Funds Distributor, LLC, as well as Wells Fargo Bank, N.A.’s business of acting as trustee to its collective investment trusts and all related Wells Fargo Asset Management legal entities. The transaction closed on November 1, 2021, forming Allspring Global Investments, LLC, a privately held asset management firm with $587 billion in AUM1as of September 30, 2021.
Allspring Global Investments™ is a leading independent asset management firm with a full breadth of investment capabilities across diverse asset classes, serving the needs of its institutional and wealth management clients around the world. Allspring operates across 18 offices globally supported by more than 480 investment professionals. Allspring and its investment teams provide a broad range of differentiated investment products and solutions to help its diverse range of clients meet their investment objectives.
As part of this transition, all mutual funds within the Wells Fargo Funds family will be rebranded as Allspring Funds. Each individual fund will have “Wells Fargo” removed from its fund name to be replaced with “Allspring.” The fund name changes are expected to take place on December 6, 2021.
Allspring Global Investments is the trade name for the asset management firms of Allspring Global Investments Holdings, LLC, a holding company indirectly owned by certain private funds of GTCR LLC and Reverence Capital Partners, L.P.
Thank you for choosing to invest with Wells Fargo Funds. We appreciate your confidence in us and remain committed to helping you meet your financial needs.
Sincerely,
Andrew Owen
President
Wells Fargo Funds
For further information about your Fund, contact your investment professional, visit our website at allspringglobal.com, or call us directly at 1-800-222-8222.
| 1 | As of September 30, 2021, assets under management (AUM) includes $93 billion from Galliard Capital Management, an investment advisor that is not part of the Allspring trade name/GIPS firm. |
4 | Wells Fargo Fundamental Small Cap Growth Fund
This page is intentionally left blank.
Performance highlights (unaudited)
| Investment objective | The Fund seeks long-term capital appreciation. |
| Manager | Allspring Funds Management, LLC |
| Subadviser | Allspring Global Investments, LLC |
| Portfolio managers | Michael T. Smith, CFA®‡, Christopher J. Warner, CFA®‡ |
| Average annual total returns (%) as of September 30, 2021 |
| | | Including sales charge | | Excluding sales charge | | Expense ratios1 (%) |
| | Inception date | 1 year | 5 year | 10 year | | 1 year | 5 year | 10 year | | Gross | Net 2 |
| Class A (EGWAX) | 6-5-1995 | 22.88 | 21.23 | 17.19 | | 30.36 | 22.68 | 17.88 | | 1.47 | 1.23 |
| Class C (EGWCX) | 7-30-2010 | 28.47 | 21.80 | 17.02 | | 29.47 | 21.80 | 17.02 | | 2.22 | 1.98 |
| Class R6 (EGWRX)3 | 5-29-2020 | – | – | – | | 30.98 | 23.12 | 18.30 | | 1.04 | 0.80 |
| Administrator Class (EGWDX) | 7-30-2010 | – | – | – | | 30.53 | 23.13 | 18.19 | | 1.39 | 1.15 |
| Institutional Class (EGRYX) | 11-19-1997 | – | – | – | | 30.86 | 23.09 | 18.28 | | 1.14 | 0.90 |
| Russell 2000® Growth Index4 | – | – | – | – | | 33.27 | 15.34 | 15.74 | | – | – |
Figures quoted represent past performance, which is no guarantee of future results, and do not reflect taxes that a shareholder may pay on an investment in a fund. Investment return and principal value of an investment will fluctuate so that an investor’s shares, when redeemed, may be worth more or less than their original cost. Performance shown without sales charges would be lower if sales charges were reflected. Current performance may be lower or higher than the performance data quoted, which assumes the reinvestment of dividends and capital gains. Current month-end performance is available on the Fund’s website, allspringglobal.com.
Please keep in mind that high double-digit returns were primarily achieved during favorable market conditions. You should not expect that such favorable returns can be consistently achieved. A fund’s performance, especially for short time periods, should not be the sole factor in making your investment decision.
Index returns do not include transaction costs associated with buying and selling securities, any mutual fund fees or expenses, or any taxes. It is not possible to invest directly in an index.
For Class A shares, the maximum front-end sales charge is 5.75%. For Class C shares, the maximum contingent deferred sales charge is 1.00%. Performance including a contingent deferred sales charge assumes the sales charge for the corresponding time period. Class R6, Administrator Class and Institutional Class shares are sold without a front-end sales charge or contingent deferred sales charge.
| 1 | Reflects the expense ratios as stated in the most recent prospectuses. The expense ratios shown are subject to change and may differ from the annualized expense ratios shown in the financial highlights of this report. |
| 2 | The manager has contractually committed through July 31, 2022, to waive fees and/or reimburse expenses to the extent necessary to cap total annual fund operating expenses after fee waivers at 1.23% for Class A, 1.98% for Class C, 0.80% for Class R6, 1.15% for Administrator Class, and 0.90% for Institutional Class. Brokerage commissions, stamp duty fees, interest, taxes, acquired fund fees and expenses (if any), and extraordinary expenses are excluded from the expense caps. Prior to or after the commitment expiration date, the caps may be increased or the commitment to maintain the caps may be terminated only with the approval of the Board of Trustees. Without these caps, the Fund’s returns would have been lower. The expense ratio paid by an investor is the net expense ratio (the total annual fund operating expenses after fee waivers) as stated in the prospectuses. |
| 3 | Historical performance shown for the Class R6 shares prior to their inception reflects the performance of the Institutional Class shares, and includes the higher expenses applicable to the Institutional Class shares. If these expenses had not been included, returns for the Class R6 shares would be higher. |
| 4 | The Russell 2000® Growth Index measures the performance of those Russell 2000 companies with higher price/book ratios and higher forecasted growth values. You cannot invest directly in an index. |
Stock values fluctuate in response to the activities of individual companies and general market and economic conditions. Smaller company stocks tend to be more volatile and less liquid than those of larger companies. Consult the Fund’s prospectus for additional information on these and other risks.
| ‡ | CFA® and Chartered Financial Analyst® are trademarks owned by CFA Institute. |
6 | Wells Fargo Fundamental Small Cap Growth Fund
Performance highlights (unaudited)
| Ten largest holdings (%) as of September 30, 20211 |
| Workiva Incorporated | 2.48 |
| SiteOne Landscape Supply Incorporated | 2.41 |
| Casella Waste Systems Incorporated Class A | 2.34 |
| Shockwave Medical Incorporated | 2.26 |
| Sprout Social Incorporated Class A | 2.18 |
| Bill.com Holdings Incorporated | 2.06 |
| Option Care Health Incorporated | 2.06 |
| WNS Holdings Limited ADR | 1.98 |
| Tetra Tech Incorporated | 1.96 |
| Goosehead Insurance Incorporated Class A | 1.90 |
| 1 | Figures represent the percentage of the Fund's net assets. Holdings are subject to change and may have changed since the date specified. |
| Sector allocation as of September 30, 20211 |
| 1 | Figures represent the percentage of the Fund's long-term investments. These amounts are subject to change and may have changed since the date specified. |
Wells Fargo Fundamental Small Cap Growth Fund | 7
Fund expenses (unaudited)
As a shareholder of the Fund, you incur two types of costs: (1) transaction costs, including sales charges (loads) on purchase payments and contingent deferred sales charges (if any) on redemptions and (2) ongoing costs, including management fees, distribution (12b-1) and/or shareholder servicing fees, and other Fund expenses. This example is intended to help you understand your ongoing costs (in dollars) of investing in the Fund and to compare these costs with the ongoing costs of investing in other mutual funds.
The example is based on an investment of $1,000 invested at the beginning of the six-month period and held for the entire period from April 1, 2021 to September 30, 2021.
Actual expenses
The “Actual” line of the table below provides information about actual account values and actual expenses. You may use the information in this line, together with the amount you invested, to estimate the expenses that you paid over the period. Simply divide your account value by $1,000 (for example, an $8,600 account value divided by $1,000 = 8.6), then multiply the result by the number in the “Actual” line under the heading entitled “Expenses paid during period” for your applicable class of shares to estimate the expenses you paid on your account during this period.
Hypothetical example for comparison purposes
The “Hypothetical” line of the table below provides information about hypothetical account values and hypothetical expenses based on the Fund’s actual expense ratio and an assumed rate of return of 5% per year before expenses, which is not the Fund’s actual return. The hypothetical account values and expenses may not be used to estimate the actual ending account balance or expenses you paid for the period. You may use this information to compare the ongoing costs of investing in the Fund and other funds. To do so, compare this 5% hypothetical example with the 5% hypothetical examples that appear in the shareholder reports of the other funds.
Please note that the expenses shown in the table are meant to highlight your ongoing costs only and do not reflect any transactional costs, such as sales charges (loads) and contingent deferred sales charges. Therefore, the “Hypothetical” line of the table is useful in comparing ongoing costs only, and will not help you determine the relative total costs of owning different funds. In addition, if these transactional costs were included, your costs would have been higher.
| | Beginning
account value
4-1-2021 | Ending
account value
9-30-2021 | Expenses
paid during
the period1 | Annualized net
expense ratio |
| Class A | | | | |
| Actual | $1,000.00 | $1,054.23 | $ 6.33 | 1.23% |
| Hypothetical (5% return before expenses) | $1,000.00 | $1,018.90 | $ 6.23 | 1.23% |
| Class C | | | | |
| Actual | $1,000.00 | $1,050.33 | $10.18 | 1.98% |
| Hypothetical (5% return before expenses) | $1,000.00 | $1,015.14 | $10.00 | 1.98% |
| Class R6 | | | | |
| Actual | $1,000.00 | $1,056.68 | $ 4.12 | 0.80% |
| Hypothetical (5% return before expenses) | $1,000.00 | $1,021.06 | $ 4.05 | 0.80% |
| Administrator Class | | | | |
| Actual | $1,000.00 | $1,054.82 | $ 5.92 | 1.15% |
| Hypothetical (5% return before expenses) | $1,000.00 | $1,019.30 | $ 5.82 | 1.15% |
| Institutional Class | | | | |
| Actual | $1,000.00 | $1,056.36 | $ 4.64 | 0.90% |
| Hypothetical (5% return before expenses) | $1,000.00 | $1,020.56 | $ 4.56 | 0.90% |
1 Expenses paid is equal to the annualized net expense ratio of each class multiplied by the average account value over the period, multiplied by the number of days in the most recent fiscal half-year divided by the number of days in the fiscal year (to reflect the one-half-year period).
8 | Wells Fargo Fundamental Small Cap Growth Fund
Portfolio of investments—September 30, 2021 (unaudited)
| | | | | Shares | Value |
| Common stocks: 96.48% | | | | | |
| Communication services: 3.06% | | | | | |
| Interactive media & services: 1.25% | | | | | |
| Bumble Incorporated Class A † | | | | 46,671 | $ 2,332,617 |
| Media: 1.81% | | | | | |
| Cardlytics Incorporated † | | | | 17,656 | 1,482,045 |
| Magnite Incorporated † | | | | 67,525 | 1,890,700 |
| | | | | | 3,372,745 |
| Consumer discretionary: 8.56% | | | | | |
| Diversified consumer services: 2.95% | | | | | |
| Chegg Incorporated † | | | | 29,569 | 2,011,283 |
| Duolingo †« | | | | 7,129 | 1,185,980 |
| Mister Car Wash Incorporated † | | | | 125,889 | 2,297,474 |
| | | | | | 5,494,737 |
| Hotels, restaurants & leisure: 0.76% | | | | | |
| Playa Hotels & Resorts NV † | | | | 171,400 | 1,420,906 |
| Internet & direct marketing retail: 2.38% | | | | | |
| Etsy Incorporated † | | | | 13,014 | 2,706,391 |
| Redbubble Limited † | | | | 555,871 | 1,734,748 |
| | | | | | 4,441,139 |
| Leisure products: 2.47% | | | | | |
| Callaway Golf Company † | | | | 87,455 | 2,416,382 |
| Games Workshop Group plc | | | | 15,877 | 2,197,028 |
| | | | | | 4,613,410 |
| Financials: 4.23% | | | | | |
| Banks: 0.99% | | | | | |
| Silvergate Capital Corporation Class A † | | | | 15,969 | 1,844,420 |
| Capital markets: 1.34% | | | | | |
| Open Lending Corporation Class A † | | | | 69,162 | 2,494,673 |
| Insurance: 1.90% | | | | | |
| Goosehead Insurance Incorporated Class A | | | | 23,332 | 3,553,230 |
| Health care: 30.49% | | | | | |
| Biotechnology: 10.16% | | | | | |
| Ascendis Pharma AS ADR † | | | | 8,566 | 1,365,335 |
| CareDx Incorporated † | | | | 44,106 | 2,794,997 |
| Chimerix Incorporated † | | | | 105,140 | 650,817 |
| CRISPR Therapeutics AG † | | | | 7,761 | 868,689 |
| Deciphera Pharmaceuticals Incorporated † | | | | 23,401 | 795,166 |
| Fate Therapeutics Incorporated † | | | | 9,937 | 588,966 |
| MaxCyte Incorporated †« | | | | 113,840 | 1,389,986 |
| Mirati Therapeutics Incorporated † | | | | 6,142 | 1,086,581 |
| Natera Incorporated † | | | | 30,486 | 3,397,360 |
| ORIC Pharmaceuticals Incorporated † | | | | 30,548 | 638,759 |
| Turning Point Therapeutics Incorporated † | | | | 13,441 | 892,886 |
The accompanying notes are an integral part of these financial statements.
Wells Fargo Fundamental Small Cap Growth Fund | 9
Portfolio of investments—September 30, 2021 (unaudited)
| | | | | Shares | Value |
| Biotechnology (continued) | | | | | |
| Twist Bioscience Corporation † | | | | 16,435 | $ 1,758,052 |
| Veracyte Incorporated † | | | | 35,991 | 1,671,782 |
| Zentalis Pharmaceuticals Incorporated † | | | | 15,948 | 1,062,775 |
| | | | | | 18,962,151 |
| Health care equipment & supplies: 10.52% | | | | | |
| Axonics Modulation Technologies Incorporated † | | | | 29,631 | 1,928,682 |
| Cryoport Incorporated † | | | | 36,276 | 2,412,717 |
| Establishment Labs Holdings Incorporated † | | | | 12,859 | 920,447 |
| Figs Incorporated Class A †« | | | | 35,187 | 1,306,845 |
| Heska Corporation † | | | | 12,413 | 3,209,257 |
| Inari Medical Incorporated † | | | | 34,966 | 2,835,743 |
| Pulmonx Corporation † | | | | 38,760 | 1,394,585 |
| Shockwave Medical Incorporated † | | | | 20,447 | 4,209,628 |
| Treace Medical Concepts Incorporated † | | | | 52,053 | 1,400,226 |
| | | | | | 19,618,130 |
| Health care providers & services: 4.47% | | | | | |
| Amedisys Incorporated † | | | | 8,609 | 1,283,602 |
| HealthEquity Incorporated † | | | | 49,516 | 3,206,656 |
| Option Care Health Incorporated † | | | | 158,286 | 3,840,018 |
| | | | | | 8,330,276 |
| Health care technology: 3.97% | | | | | |
| Inspire Medical Systems Incorporated † | | | | 14,601 | 3,400,281 |
| Phreesia Incorporated † | | | | 43,260 | 2,669,142 |
| Schrodinger Incorporated † | | | | 24,438 | 1,336,270 |
| | | | | | 7,405,693 |
| Life sciences tools & services: 0.67% | | | | | |
| Inotiv Incorporated † | | | | 5,233 | 153,013 |
| Rapid Micro Biosystems Incorporated Class A †« | | | | 59,802 | 1,104,543 |
| | | | | | 1,257,556 |
| Pharmaceuticals: 0.70% | | | | | |
| Arvinas Incorporated † | | | | 15,946 | 1,310,442 |
| Industrials: 14.41% | | | | | |
| Building products: 2.93% | | | | | |
| Advanced Drainage Systems Incorporated | | | | 28,103 | 3,039,902 |
| Trex Company Incorporated † | | | | 23,827 | 2,428,686 |
| | | | | | 5,468,588 |
| Commercial services & supplies: 4.30% | | | | | |
| Casella Waste Systems Incorporated Class A † | | | | 57,548 | 4,370,195 |
| Tetra Tech Incorporated | | | | 24,458 | 3,652,558 |
| | | | | | 8,022,753 |
| Construction & engineering: 1.37% | | | | | |
| Construction Partners Incorporated Class A † | | | | 76,894 | 2,565,953 |
| Electrical equipment: 1.22% | | | | | |
| Allied Motion Technologies | | | | 72,541 | 2,269,082 |
The accompanying notes are an integral part of these financial statements.
10 | Wells Fargo Fundamental Small Cap Growth Fund
Portfolio of investments—September 30, 2021 (unaudited)
| | | | | Shares | Value |
| Machinery: 0.32% | | | | | |
| Desktop Metal Incorporated †« | | | | 83,352 | $ 597,634 |
| Road & rail: 1.86% | | | | | |
| Saia Incorporated † | | | | 14,601 | 3,475,476 |
| Trading companies & distributors: 2.41% | | | | | |
| SiteOne Landscape Supply Incorporated † | | | | 22,543 | 4,496,652 |
| Information technology: 32.70% | | | | | |
| Electronic equipment, instruments & components: 4.82% | | | | | |
| Littelfuse Incorporated | | | | 9,268 | 2,532,666 |
| Nayax Limited † | | | | 256,639 | 1,014,095 |
| Nlight Incorporated † | | | | 73,488 | 2,071,627 |
| Novanta Incorporated † | | | | 21,805 | 3,368,873 |
| | | | | | 8,987,261 |
| IT services: 11.34% | | | | | |
| Euronet Worldwide Incorporated † | | | | 14,175 | 1,804,194 |
| Globant SA † | | | | 12,036 | 3,382,236 |
| Keywords Studios plc † | | | | 70,520 | 2,766,943 |
| MongoDB Incorporated † | | | | 6,598 | 3,111,023 |
| Paymentus Holdings Incorporated A † | | | | 57,024 | 1,405,071 |
| Repay Holdings Corporation † | | | | 103,327 | 2,379,621 |
| Shift4 Payments Incorporated Class A † | | | | 33,662 | 2,609,478 |
| WNS Holdings Limited ADR † | | | | 45,214 | 3,698,505 |
| | | | | | 21,157,071 |
| Semiconductors & semiconductor equipment: 1.69% | | | | | |
| MKS Instruments Incorporated | | | | 13,807 | 2,083,614 |
| Universal Display Corporation | | | | 6,293 | 1,075,851 |
| | | | | | 3,159,465 |
| Software: 14.85% | | | | | |
| Avalara Incorporated † | | | | 15,924 | 2,783,037 |
| Bill.com Holdings Incorporated † | | | | 14,419 | 3,849,152 |
| Cerence Incorporated † | | | | 26,208 | 2,518,851 |
| Jamf Holding Corporation † | | | | 70,749 | 2,725,251 |
| Lightspeed Commerce Incorporated † | | | | 25,062 | 2,416,729 |
| Model N Incorporated † | | | | 68,885 | 2,307,648 |
| Olo Incorporated Class A † | | | | 80,414 | 2,414,832 |
| Sprout Social Incorporated Class A † | | | | 33,345 | 4,066,423 |
| Workiva Incorporated † | | | | 32,868 | 4,633,073 |
| | | | | | 27,714,996 |
| Materials: 1.54% | | | | | |
| Containers & packaging: 1.54% | | | | | |
| Ranpak Holdings Corporation † | | | | 107,152 | 2,873,817 |
| Real estate: 1.49% | | | | | |
| Equity REITs: 1.49% | | | | | |
| Rexford Industrial Realty Incorporated | | | | 48,874 | 2,773,600 |
| Total Common stocks (Cost $123,764,466) | | | | | 180,014,473 |
The accompanying notes are an integral part of these financial statements.
Wells Fargo Fundamental Small Cap Growth Fund | 11
Portfolio of investments—September 30, 2021 (unaudited)
| | | Yield | | Shares | Value |
| Short-term investments: 5.40% | | | | | |
| Investment companies: 5.40% | | | | | |
| Securities Lending Cash Investments LLC ♠∩∞ | | 0.02% | | 4,255,925 | $ 4,255,925 |
| Wells Fargo Government Money Market Fund Select Class ♠∞ | | 0.03 | | 5,813,195 | 5,813,195 |
| Total Short-term investments (Cost $10,069,120) | | | | | 10,069,120 |
| Total investments in securities (Cost $133,833,586) | 101.88% | | | | 190,083,593 |
| Other assets and liabilities, net | (1.88) | | | | (3,502,078) |
| Total net assets | 100.00% | | | | $186,581,515 |
| † | Non-income earning security |
| « | All or a portion of this security is on loan. |
| ♠ | The issuer of the security is an affiliated person of the Fund as defined in the Investment Company Act of 1940. |
| ∩ | The investment is a non-registered investment company purchased with cash collateral received from securities on loan. |
| ∞ | The rate represents the 7-day annualized yield at period end. |
| Abbreviations: |
| ADR | American depositary receipt |
| REIT | Real estate investment trust |
Investments in affiliates
An affiliated investment is an investment in which the Fund owns at least 5% of the outstanding voting shares of the issuer or as a result of other relationships, such as the Fund and the issuer having the same investment manager. Transactions with issuers that were either affiliates of the Fund at the beginning of the period or the end of the period were as follows:
| | Value,
beginning of
period | Purchases | Sales
proceeds | Net
realized
gains
(losses) | | Net
change in
unrealized
gains
(losses) | | Value,
end of
period | Shares,
end
of period | Income
from
affiliated
securities |
| Short-term investments | | | | | | | | | |
| Securities Lending Cash Investments LLC | $5,017,845 | $24,018,536 | $(24,780,456) | $0 | | $0 | | $ 4,255,925 | 4,255,925 | $371 # |
| Wells Fargo Government Money Market Fund Select Class | 672,531 | 42,681,785 | (37,541,121) | 0 | | 0 | | 5,813,195 | 5,813,195 | 550 |
| | | | | $0 | | $0 | | $10,069,120 | | $921 |
| # | Amount shown represents income before fees and rebates. |
The accompanying notes are an integral part of these financial statements.
12 | Wells Fargo Fundamental Small Cap Growth Fund
Statement of assets and liabilities—September 30, 2021 (unaudited)
| | |
| Assets | |
Investments in unaffiliated securities (including $4,144,097 of securities loaned), at value (cost $123,764,466)
| $ 180,014,473 |
Investments in affiliated securites, at value (cost $10,069,120)
| 10,069,120 |
Foreign currency, at value (cost $215,656)
| 215,992 |
Receivable for investments sold
| 3,100,952 |
Receivable for Fund shares sold
| 225,611 |
Receivable for dividends
| 17,409 |
Receivable for securities lending income, net
| 3,949 |
Prepaid expenses and other assets
| 71,802 |
Total assets
| 193,719,308 |
| Liabilities | |
Payable upon receipt of securities loaned
| 4,255,925 |
Payable for investments purchased
| 2,593,837 |
Payable for Fund shares redeemed
| 105,110 |
Management fee payable
| 104,457 |
Administration fees payable
| 30,521 |
Distribution fee payable
| 1,066 |
Accrued expenses and other liabilities
| 46,877 |
Total liabilities
| 7,137,793 |
Total net assets
| $186,581,515 |
| Net assets consist of | |
Paid-in capital
| $ 105,086,921 |
Total distributable earnings
| 81,494,594 |
Total net assets
| $186,581,515 |
| Computation of net asset value and offering price per share | |
Net assets – Class A
| $ 138,312,378 |
Shares outstanding – Class A1
| 6,132,603 |
Net asset value per share – Class A
| $22.55 |
Maximum offering price per share – Class A2
| $23.93 |
Net assets – Class C
| $ 1,653,902 |
Shares outstanding – Class C1
| 87,096 |
Net asset value per share – Class C
| $18.99 |
Net assets – Class R6
| $ 2,039,016 |
Shares outstanding – Class R61
| 73,405 |
Net asset value per share – Class R6
| $27.78 |
Net assets – Administrator Class
| $ 561,235 |
Shares outstanding – Administrator Class1
| 20,835 |
Net asset value per share – Administrator Class
| $26.94 |
Net assets – Institutional Class
| $ 44,014,984 |
Shares outstanding – Institutional Class1
| 1,586,837 |
Net asset value per share – Institutional Class
| $27.74 |
| 1 | The Fund has an unlimited number of authorized shares |
| 2 | Maximum offering price is computed as 100/94.25 of net asset value. On investments of $50,000 or more, the offering price is reduced. |
The accompanying notes are an integral part of these financial statements.
Wells Fargo Fundamental Small Cap Growth Fund | 13
Statement of operations—six months ended September 30, 2021 (unaudited)
| | |
| Investment income | |
Dividends (net of foreign withholdings taxes of $397)
| $ 154,223 |
Securities lending income from affiliates, net
| 18,577 |
Income from affiliated securities
| 555 |
Total investment income
| 173,355 |
| Expenses | |
Management fee
| 755,974 |
| Administration fees | |
Class A
| 146,458 |
Class C
| 1,753 |
Class R6
| 115 |
Administrator Class
| 286 |
Institutional Class
| 23,091 |
| Shareholder servicing fees | |
Class A
| 174,355 |
Class C
| 2,083 |
Administrator Class
| 550 |
| Distribution fee | |
Class C
| 6,181 |
Custody and accounting fees
| 11,793 |
Professional fees
| 27,906 |
Registration fees
| 37,281 |
Shareholder report expenses
| 24,783 |
Trustees’ fees and expenses
| 9,662 |
Other fees and expenses
| 5,572 |
Total expenses
| 1,227,843 |
| Less: Fee waivers and/or expense reimbursements | |
Class A
| (178,994) |
Class C
| (8,111) |
Class R6
| (33) |
Administrator Class
| (24) |
Institutional Class
| (1,854) |
Net expenses
| 1,038,827 |
Net investment loss
| (865,472) |
| Realized and unrealized gains (losses) on investments | |
Net realized gains on investments
| 11,938,858 |
Net change in unrealized gains (losses) on investments
| (1,840,304) |
Net realized and unrealized gains (losses) on investments
| 10,098,554 |
Net increase in net assets resulting from operations
| $ 9,233,082 |
The accompanying notes are an integral part of these financial statements.
14 | Wells Fargo Fundamental Small Cap Growth Fund
Statement of changes in net assets
| | | | | |
| | Six months ended
September 30, 2021
(unaudited) | Year ended
March 31, 2021 |
| Operations | | | | |
Net investment loss
| | $ (865,472) | | $ (1,196,806) |
Payment from affiliate
| | 0 | | 2,422 |
Net realized gains on investments
| | 11,938,858 | | 18,310,286 |
Net change in unrealized gains (losses) on investments
| | (1,840,304) | | 55,783,989 |
Net increase in net assets resulting from operations
| | 9,233,082 | | 72,899,891 |
| Distributions to shareholders from | | | | |
| Net investment income and net realized gains | | | | |
Class A
| | 0 | | (2,946,281) |
Class C
| | 0 | | (25,513) |
Class R6
| | 0 | | (982) 1 |
Administrator Class
| | 0 | | (4,445) |
Institutional Class
| | 0 | | (385,274) |
Total distributions to shareholders
| | 0 | | (3,362,495) |
| Capital share transactions | Shares | | Shares | |
| Proceeds from shares sold | | | | |
Class A
| 187,402 | 4,161,103 | 851,445 | 18,597,612 |
Class C
| 7,256 | 132,366 | 52,448 | 945,378 |
Class R6
| 58,142 | 1,657,768 | 18,616 1 | 480,290 1 |
Administrator Class
| 7,762 | 205,832 | 12,658 | 329,154 |
Institutional Class
| 1,042,370 | 27,821,371 | 316,411 | 7,406,047 |
| | | 33,978,440 | | 27,758,481 |
| Reinvestment of distributions | | | | |
Class A
| 0 | 0 | 139,563 | 2,880,580 |
Class C
| 0 | 0 | 1,415 | 24,733 |
Class R6
| 0 | 0 | 10 1 | 262 1 |
Administrator Class
| 0 | 0 | 138 | 3,389 |
Institutional Class
| 0 | 0 | 13,426 | 339,942 |
| | | 0 | | 3,248,906 |
| Payment for shares redeemed | | | | |
Class A
| (269,571) | (6,010,714) | (821,662) | (15,585,066) |
Class C
| (6,972) | (132,234) | (9,108) | (150,170) |
Class R6
| (1,988) | (51,491) | (1,375) 1 | (36,477) 1 |
Administrator Class
| (2,230) | (56,046) | (4,715) | (109,842) |
Institutional Class
| (190,877) | (5,041,507) | (190,256) | (4,941,582) |
| | | (11,291,992) | | (20,823,137) |
Net increase in net assets resulting from capital share transactions
| | 22,686,448 | | 10,184,250 |
Total increase in net assets
| | 31,919,530 | | 79,721,646 |
| Net assets | | | | |
Beginning of period
| | 154,661,985 | | 74,940,339 |
End of period
| | $186,581,515 | | $154,661,985 |
| 1 | For the period from May 29, 2020 (commencement of class operations) to March 31, 2021 |
The accompanying notes are an integral part of these financial statements.
Wells Fargo Fundamental Small Cap Growth Fund | 15
Financial highlights
(For a share outstanding throughout each period)
| | | Year ended March 31 |
| Class A | Six months ended
September 30, 2021
(unaudited) | 2021 | 2020 | 2019 | 2018 | 2017 |
Net asset value, beginning of period
| $21.39 | $11.00 | $13.28 | $15.32 | $14.08 | $12.05 |
Net investment loss
| (0.14) | (0.18) 1 | (0.10) 1 | (0.11) 1 | (0.12) 1 | (0.10) 1 |
Net realized and unrealized gains (losses) on investments
| 1.30 | 11.09 | (1.27) | 2.17 | 2.35 | 2.51 |
Total from investment operations
| 1.16 | 10.91 | (1.37) | 2.06 | 2.23 | 2.41 |
| Distributions to shareholders from | | | | | | |
Net realized gains
| 0.00 | (0.52) | (0.91) | (4.10) | (0.99) | (0.38) |
Net asset value, end of period
| $22.55 | $21.39 | $11.00 | $13.28 | $15.32 | $14.08 |
Total return2
| 5.42% | 99.31% | (11.52)% | 17.46% | 16.08% | 20.10% |
| Ratios to average net assets (annualized) | | | | | | |
Gross expenses
| 1.44% | 1.47% | 1.52% | 1.51% | 1.52% | 1.51% |
Net expenses
| 1.23% | 1.23% | 1.23% | 1.23% | 1.33% | 1.33% |
Net investment loss
| (1.04)% | (0.99)% | (0.74)% | (0.74)% | (0.79)% | (0.77)% |
| Supplemental data | | | | | | |
Portfolio turnover rate
| 25% | 55% | 63% | 155% | 44% | 113% |
Net assets, end of period (000s omitted)
| $138,312 | $132,937 | $66,472 | $86,006 | $84,738 | $82,734 |
| 1 | Calculated based upon average shares outstanding |
| 2 | Total return calculations do not include any sales charges. Returns for periods of less than one year are not annualized. |
The accompanying notes are an integral part of these financial statements.
16 | Wells Fargo Fundamental Small Cap Growth Fund
Financial highlights
(For a share outstanding throughout each period)
| | | Year ended March 31 |
| Class C | Six months ended
September 30, 2021
(unaudited) | 2021 | 2020 | 2019 | 2018 | 2017 |
Net asset value, beginning of period
| $18.08 | $9.39 | $11.55 | $13.94 | $12.99 | $11.22 |
Net investment loss
| (0.17) | (0.28) 1 | (0.18) 1 | (0.20) 1 | (0.21) 1 | (0.18) 1 |
Payment from affiliate
| 0.00 | 0.01 | 0.00 | 0.00 | 0.00 | 0.00 |
Net realized and unrealized gains (losses) on investments
| 1.08 | 9.48 | (1.07) | 1.91 | 2.15 | 2.33 |
Total from investment operations
| 0.91 | 9.21 | (1.25) | 1.71 | 1.94 | 2.15 |
| Distributions to shareholders from | | | | | | |
Net realized gains
| 0.00 | (0.52) | (0.91) | (4.10) | (0.99) | (0.38) |
Net asset value, end of period
| $18.99 | $18.08 | $9.39 | $11.55 | $13.94 | $12.99 |
Total return2
| 5.03% | 98.22% 3 | (12.30)% | 16.69% | 15.17% | 19.26% |
| Ratios to average net assets (annualized) | | | | | | |
Gross expenses
| 2.18% | 2.20% | 2.26% | 2.26% | 2.27% | 2.26% |
Net expenses
| 1.98% | 1.98% | 1.98% | 1.98% | 2.08% | 2.08% |
Net investment loss
| (1.79)% | (1.74)% | (1.49)% | (1.48)% | (1.54)% | (1.52)% |
| Supplemental data | | | | | | |
Portfolio turnover rate
| 25% | 55% | 63% | 155% | 44% | 113% |
Net assets, end of period (000s omitted)
| $1,654 | $1,569 | $395 | $349 | $274 | $225 |
| 1 | Calculated based upon average shares outstanding |
| 2 | Total return calculations do not include any sales charges. Returns for periods of less than one year are not annualized. |
| 3 | During the year ended March 31, 2021, the Fund received a payment from an affiliate which had an impact of 0.09% on the total return. See Note 4 in the Notes to Financial Statement for additional information. |
The accompanying notes are an integral part of these financial statements.
Wells Fargo Fundamental Small Cap Growth Fund | 17
Financial highlights
(For a share outstanding throughout each period)
| | | Year ended March 31 |
| Class R6 | Six months ended
September 30, 2021
(unaudited) | 2021 1 |
Net asset value, beginning of period
| $26.29 | $17.87 |
Net investment loss
| (0.05) | (0.11) 2 |
Net realized and unrealized gains (losses) on investments
| 1.54 | 9.05 |
Total from investment operations
| 1.49 | 8.94 |
| Distributions to shareholders from | | |
Net realized gains
| 0.00 | (0.52) |
Net asset value, end of period
| $27.78 | $26.29 |
Total return3
| 5.67% | 50.11% |
| Ratios to average net assets (annualized) | | |
Gross expenses
| 1.01% | 1.03% |
Net expenses
| 0.80% | 0.80% |
Net investment loss
| (0.59)% | (0.54)% |
| Supplemental data | | |
Portfolio turnover rate
| 25% | 55% |
Net assets, end of period (000s omitted)
| $2,039 | $454 |
| 1 | For the period from May 29, 2020 (commencement of class operations) to March 31, 2021 |
| 2 | Calculated based upon average shares outstanding |
| 3 | Returns for periods of less than one year are not annualized. |
The accompanying notes are an integral part of these financial statements.
18 | Wells Fargo Fundamental Small Cap Growth Fund
Financial highlights
(For a share outstanding throughout each period)
| | | Year ended March 31 |
| Administrator Class | Six months ended
September 30, 2021
(unaudited) | 2021 | 2020 | 2019 | 2018 | 2017 |
Net asset value, beginning of period
| $25.54 | $12.91 | $15.43 | $17.14 | $15.63 | $13.29 |
Net investment loss
| (0.13) 1 | (0.20) 1 | (0.11) 1 | (0.11) 1 | (0.11) 1 | (0.09) 1 |
Payment from affiliate
| 0.00 | 0.11 | 0.00 | 0.00 | 0.00 | 0.00 |
Net realized and unrealized gains (losses) on investments
| 1.53 | 13.24 | (1.50) | 2.50 | 2.61 | 2.81 |
Total from investment operations
| 1.40 | 13.15 | (1.61) | 2.39 | 2.50 | 2.72 |
| Distributions to shareholders from | | | | | | |
Net realized gains
| 0.00 | (0.52) | (0.91) | (4.10) | (0.99) | (0.38) |
Net asset value, end of period
| $26.94 | $25.54 | $12.91 | $15.43 | $17.14 | $15.63 |
Total return2
| 5.48% | 101.97% 3 | (11.52)% | 17.59% | 16.21% | 20.56% |
| Ratios to average net assets (annualized) | | | | | | |
Gross expenses
| 1.36% | 1.39% | 1.44% | 1.43% | 1.44% | 1.43% |
Net expenses
| 1.15% | 1.15% | 1.15% | 1.15% | 1.20% | 1.20% |
Net investment loss
| (0.95)% | (0.90)% | (0.66)% | (0.62)% | (0.66)% | (0.64)% |
| Supplemental data | | | | | | |
Portfolio turnover rate
| 25% | 55% | 63% | 155% | 44% | 113% |
Net assets, end of period (000s omitted)
| $561 | $391 | $93 | $104 | $133 | $174 |
| 1 | Calculated based upon average shares outstanding |
| 2 | Returns for periods of less than one year are not annualized. |
| 3 | During the year ended March 31, 2021, the Fund received a payment from an affiliate which had an impact of 0.89% on the total return. See Note 4 in the Notes to Financial Statement for additional information. |
The accompanying notes are an integral part of these financial statements.
Wells Fargo Fundamental Small Cap Growth Fund | 19
Financial highlights
(For a share outstanding throughout each period)
| | | Year ended March 31 |
| Institutional Class | Six months ended
September 30, 2021
(unaudited) | 2021 | 2020 | 2019 | 2018 | 2017 |
Net asset value, beginning of period
| $26.26 | $13.39 | $15.94 | $17.53 | $15.94 | $13.54 |
Net investment loss
| (0.10) 1 | (0.15) 1 | (0.07) 1 | (0.07) 1 | (0.08) 1 | (0.06) 1 |
Net realized and unrealized gains (losses) on investments
| 1.58 | 13.54 | (1.57) | 2.58 | 2.66 | 2.84 |
Total from investment operations
| 1.48 | 13.39 | (1.64) | 2.51 | 2.58 | 2.78 |
| Distributions to shareholders from | | | | | | |
Net realized gains
| 0.00 | (0.52) | (0.91) | (4.10) | (0.99) | (0.38) |
Net asset value, end of period
| $27.74 | $26.26 | $13.39 | $15.94 | $17.53 | $15.94 |
Total return2
| 5.64% | 100.11% | (11.29)% | 17.85% | 16.40% | 20.62% |
| Ratios to average net assets (annualized) | | | | | | |
Gross expenses
| 1.11% | 1.14% | 1.19% | 1.18% | 1.19% | 1.18% |
Net expenses
| 0.90% | 0.90% | 0.90% | 0.90% | 0.98% | 0.98% |
Net investment loss
| (0.69)% | (0.66)% | (0.41)% | (0.41)% | (0.44)% | (0.43)% |
| Supplemental data | | | | | | |
Portfolio turnover rate
| 25% | 55% | 63% | 155% | 44% | 113% |
Net assets, end of period (000s omitted)
| $44,015 | $19,311 | $7,980 | $9,695 | $8,878 | $8,001 |
| 1 | Calculated based upon average shares outstanding |
| 2 | Returns for periods of less than one year are not annualized. |
The accompanying notes are an integral part of these financial statements.
20 | Wells Fargo Fundamental Small Cap Growth Fund
Notes to financial statements (unaudited)
1. ORGANIZATION
Wells Fargo Funds Trust (the "Trust"), a Delaware statutory trust organized on March 10, 1999, is an open-end management investment company registered under the Investment Company Act of 1940, as amended (the "1940 Act"). As an investment company, the Trust follows the accounting and reporting guidance in Financial Accounting Standards Board ("FASB") Accounting Standards Codification Topic 946, Financial Services – Investment Companies. These financial statements report on the Wells Fargo Fundamental Small Cap Growth Fund (the "Fund") which is a diversified series of the Trust.
On February 23, 2021, Wells Fargo & Company announced that it has entered into a definitive agreement to sell Wells Fargo Asset Management ("WFAM") to GTCR LLC and Reverence Capital Partners, L.P. WFAM is the trade name used by the asset management businesses of Wells Fargo & Company and includes Wells Fargo Funds Management, LLC, the investment manager to the Fund, Wells Capital Management, LLC and Wells Fargo Asset Management (International) Limited, both registered investment advisers providing subadvisory services to certain funds, and Wells Fargo Funds Distributor, LLC, the Fund's principal underwriter. As part of the transaction, Wells Fargo & Company will own a 9.9% equity interest and will continue to serve as an important client and distribution partner.
Consummation of the transaction will result in the automatic termination of the Fund's investment management agreement and subadvisory agreement. The Fund's Board of Trustees approved a new investment management agreement and a new subadvisory agreement which were submitted to the Fund's shareholders for approval at a Special Meeting of Shareholders scheduled for October 15, 2021. Shareholders of record of the Fund at the close of business on May 28, 2021 are entitled to vote at the meeting. If shareholders approve the new agreements, they will take effect upon the closing of the transaction.
As more fully discussed in Note 11, the transaction closed on November 1, 2021 and the investment manager, sub-advisers and distributor changed their names to Allspring Funds Management, LLC, Allspring Global Investments, LLC, Allspring Global Investments (UK) Limited and Allspring Funds Distributor, LLC. While these name changes occurred after the end of the period, throughout this report, the new names have been used.
The Board of Trustees of the Wells Fargo Funds voted on July 15, 2021 to approve a change to the Fund's name to remove "Wells Fargo" from the name and replace it with "Allspring", effective December 6, 2021.
2. SIGNIFICANT ACCOUNTING POLICIES
The following significant accounting policies, which are consistently followed in the preparation of the financial statements of the Fund, are in conformity with U.S. generally accepted accounting principles which require management to make estimates and assumptions that affect the reported amounts of assets and liabilities, disclosure of contingent assets and liabilities at the date of the financial statements, and the reported amounts of income and expenses during the reporting period. Actual results could differ from those estimates.
Securities valuation
All investments are valued each business day as of the close of regular trading on the New York Stock Exchange (generally 4 p.m. Eastern Time), although the Fund may deviate from this calculation time under unusual or unexpected circumstances.
Equity securities that are listed on a foreign or domestic exchange or market are valued at the official closing price or, if none, the last sales price. If no sale occurs on the principal exchange or market that day, a fair value price will be determined in accordance with the Fund’s Valuation Procedures.
The values of securities denominated in foreign currencies are translated into U.S. dollars at rates provided by an independent foreign currency pricing source at a time each business day specified by the Allspring Global Investments Pricing Committee at Allspring Funds Mangement, LLC ("Allspring Funds Management").
Many securities markets and exchanges outside the U.S. close prior to the close of the New York Stock Exchange and therefore may not fully reflect trading or events that occur after the close of the principal exchange in which the foreign securities are traded, but before the close of the New York Stock Exchange. If such trading or events are expected to materially affect the value of such securities, then fair value pricing procedures approved by the Board of Trustees of the Fund are applied. These procedures take into account multiple factors including movements in U.S. securities markets after foreign exchanges close. Foreign securities that are fair valued under these procedures are categorized as Level 2 and the application of these procedures may result in transfers between Level 1 and Level 2. Depending on market activity, such fair valuations may be frequent. Such fair value pricing may result in net asset values that are higher or lower than net asset values based on the last reported sales price or latest quoted bid price. On September 30, 2021, such fair value pricing was used in pricing certain foreign securities.
Wells Fargo Fundamental Small Cap Growth Fund | 21
Notes to financial statements (unaudited)
Investments in registered open-end investment companies are valued at net asset value. Interests in non-registered investment companies that are redeemable at net asset value are fair valued normally at net asset value.
Investments which are not valued using any of the methods discussed above are valued at their fair value, as determined in good faith by the Board of Trustees. The Board of Trustees has established a Valuation Committee comprised of the Trustees and has delegated to it the authority to take any actions regarding the valuation of portfolio securities that the Valuation Committee deems necessary or appropriate, including determining the fair value of portfolio securities, unless the determination has been delegated to the Allspring Global Investments Pricing Committee. The Board of Trustees retains the authority to make or ratify any valuation decisions or approve any changes to the Valuation Procedures as it deems appropriate. On a quarterly basis, the Board of Trustees receives reports on any valuation actions taken by the Valuation Committee or the Allspring Global Investments Pricing Committee which may include items for ratification.
Foreign currency translation
The accounting records of the Fund are maintained in U.S. dollars. The values of other assets and liabilities denominated in foreign currencies are translated into U.S. dollars at rates provided by an independent foreign currency pricing source at a time each business day specified by the Allspring Global Investments Pricing Committee. Purchases and sales of securities, and income and expenses are converted at the rate of exchange on the respective dates of such transactions. Net realized foreign exchange gains or losses arise from sales of foreign currencies, currency gains or losses realized between the trade and settlement dates on securities transactions, and the difference between the amounts of dividends, interest and foreign withholding taxes recorded and the U.S. dollar equivalent of the amounts actually paid or received. Net unrealized foreign exchange gains and losses arise from changes in the fair value of assets and liabilities other than investments in securities resulting from changes in exchange rates. The changes in net assets arising from changes in exchange rates of securities and the changes in net assets resulting from changes in market prices of securities are not separately presented. Such changes are included in net realized and unrealized gains or losses from investments.
Securities lending
The Fund may lend its securities from time to time in order to earn additional income in the form of fees or interest on securities received as collateral or the investment of any cash received as collateral. When securities are on loan, the Fund receives interest or dividends on those securities. Cash collateral received in connection with its securities lending transactions is invested in Securities Lending Cash Investments, LLC (the "Securities Lending Fund"). Investments in Securities Lending Fund are valued at the evaluated bid price provided by an independent pricing service. Income earned from investment in the Securities Lending Fund, if any, is included in securities lending income from affiliates (net of fees and rebates) on the Statement of Operations.
In a securities lending transaction, the net asset value of the Fund is affected by an increase or decrease in the value of the securities loaned and by an increase or decrease in the value of the instrument in which collateral is invested. The amount of securities lending activity undertaken by the Fund fluctuates from time to time. The Fund has the right under the lending agreement to recover the securities from the borrower on demand. In the event of default or bankruptcy by the borrower, the Fund may be prevented from recovering the loaned securities or gaining access to the collateral or may experience delays or costs in doing so. In such an event, the terms of the agreement allow the unaffiliated securities lending agent to use the collateral to purchase replacement securities on behalf of the Fund or pay the Fund the market value of the loaned securities. The Fund bears the risk of loss with respect to depreciation of its investment of the cash collateral.
Security transactions and income recognition
Securities transactions are recorded on a trade date basis. Realized gains or losses are recorded on the basis of identified cost.
Dividend income is recognized on the ex-dividend date, except for certain dividends from foreign securities, which are recorded as soon as the custodian verifies the ex-dividend date. Dividend income is recorded net of foreign taxes withheld where recovery of such taxes is not assured.
Distributions to shareholders
Distributions to shareholders from net investment income and any net realized gains are recorded on the ex-dividend date and paid at least annually. Such distributions are determined in accordance with income tax regulations and may differ from U.S. generally accepted accounting principles. Dividend sources are estimated at the time of declaration. The tax character of distributions is determined as of the Fund's fiscal year end. Therefore, a portion of the Fund's distributions made prior to the Fund’s fiscal year end may be categorized as a tax return of capital at year end.
22 | Wells Fargo Fundamental Small Cap Growth Fund
Notes to financial statements (unaudited)
Federal and other taxes
The Fund intends to continue to qualify as a regulated investment company by distributing substantially all of its investment company taxable income and any net realized capital gains (after reduction for capital loss carryforwards) sufficient to relieve it from all, or substantially all, federal income taxes. Accordingly, no provision for federal income taxes was required.
The Fund’s income and federal excise tax returns and all financial records supporting those returns for the prior three fiscal years are subject to examination by the federal and Delaware revenue authorities. Management has analyzed the Fund's tax positions taken on federal, state, and foreign tax returns for all open tax years and does not believe that there are any uncertain tax positions that require recognition of a tax liability.
As of September 30, 2021, the aggregate cost of all investments for federal income tax purposes was $133,987,701 and the unrealized gains (losses) consisted of:
| Gross unrealized gains | $63,606,047 |
| Gross unrealized losses | (7,510,155) |
| Net unrealized gains | $56,095,892 |
Class allocations
The separate classes of shares offered by the Fund differ principally in applicable sales charges, distribution, shareholder servicing, and administration fees. Class specific expenses are charged directly to that share class. Investment income, common fund-level expenses, and realized and unrealized gains (losses) on investments are allocated daily to each class of shares based on the relative proportion of net assets of each class.
3. FAIR VALUATION MEASUREMENTS
Fair value measurements of investments are determined within a framework that has established a fair value hierarchy based upon the various data inputs utilized in determining the value of the Fund’s investments. The three-level hierarchy gives the highest priority to unadjusted quoted prices in active markets for identical assets or liabilities (Level 1) and the lowest priority to unobservable inputs (Level 3). The Fund’s investments are classified within the fair value hierarchy based on the lowest level of input that is significant to the fair value measurement. The inputs are summarized into three broad levels as follows:
| ■ | Level 1 – quoted prices in active markets for identical securities |
| ■ | Level 2 – other significant observable inputs (including quoted prices for similar securities, interest rates, prepayment speeds, credit risk, etc.) |
| ■ | Level 3 – significant unobservable inputs (including the Fund’s own assumptions in determining the fair value of investments) |
The inputs or methodologies used for valuing investments in securities are not necessarily an indication of the risk associated with investing in those securities.
Wells Fargo Fundamental Small Cap Growth Fund | 23
Notes to financial statements (unaudited)
The following is a summary of the inputs used in valuing the Fund’s assets and liabilities as of September 30, 2021:
| | Quoted prices
(Level 1) | Other significant
observable inputs
(Level 2) | Significant
unobservable inputs
(Level 3) | Total |
| Assets | | | | |
| Investments in: | | | | |
| Common stocks | | | | |
| Communication services | $ 5,705,362 | $ 0 | $0 | $ 5,705,362 |
| Consumer discretionary | 14,235,444 | 1,734,748 | 0 | 15,970,192 |
| Financials | 7,892,323 | 0 | 0 | 7,892,323 |
| Health care | 56,884,248 | 0 | 0 | 56,884,248 |
| Industrials | 26,896,138 | 0 | 0 | 26,896,138 |
| Information technology | 60,004,698 | 1,014,095 | 0 | 61,018,793 |
| Materials | 2,873,817 | 0 | 0 | 2,873,817 |
| Real estate | 2,773,600 | 0 | 0 | 2,773,600 |
| Short-term investments | | | | |
| Investment companies | 10,069,120 | 0 | 0 | 10,069,120 |
| Total assets | $187,334,750 | $2,748,843 | $0 | $190,083,593 |
Additional sector, industry or geographic detail, if any, is included in the Portfolio of Investments.
For the six months ended September 30, 2021, the Fund did not have any transfers into/out of Level 3.
4. TRANSACTIONS WITH AFFILIATES
Management fee
Allspring Funds Management, a wholly owned subsidiary of Allspring Global Investments Holdings, LLC, a holding company indirectly owned by Wells Fargo & Company as of September 30, 2021, is the manager of the Fund and provides advisory and fund-level administrative services under an investment management agreement. Under the investment management agreement, Allspring Funds Management is responsible for, among other services, implementing the investment objectives and strategies of the Fund, supervising the subadviser and providing fund-level administrative services in connection with the Fund’s operations. As compensation for its services under the investment management agreement, Allspring Funds Management is entitled to receive a management fee at the following annual rate based on the Fund’s average daily net assets:
| Average daily net assets | Management fee |
| First $500 million | 0.850% |
| Next $500 million | 0.825 |
| Next $1 billion | 0.800 |
| Next $1 billion | 0.775 |
| Next $1 billion | 0.750 |
| Next $1 billion | 0.730 |
| Next $5 billion | 0.720 |
| Over $10 billion | 0.710 |
For the six months ended September 30, 2021, the management fee was equivalent to an annual rate of 0.85% of the Fund’s average daily net assets.
Allspring Funds Management has retained the services of a subadviser to provide daily portfolio management to the Fund. The fee for subadvisory services is borne by Allspring Funds Management. Allspring Global Investments, LLC ("Allspring Investments"), an affiliate of Allspring Funds Management and wholly owned subsidiary of Allspring Global Investments Holdings, LLC, is the subadviser to the Fund and is entitled to receive a fee from Allspring Funds Management at an annual rate starting at 0.55% and declining to 0.40% as the average daily net assets of the Fund increase.
24 | Wells Fargo Fundamental Small Cap Growth Fund
Notes to financial statements (unaudited)
Administration fees
Under a class-level administration agreement, Allspring Funds Management provides class-level administrative services to the Fund, which includes paying fees and expenses for services provided by the transfer agent, sub-transfer agents, omnibus account servicers and record-keepers. As compensation for its services under the class-level administration agreement, Allspring Funds Management receives an annual fee which is calculated based on the average daily net assets of each class as follows:
| | Class-level
administration fee |
| Class A | 0.21% |
| Class C | 0.21 |
| Class R6 | 0.03 |
| Administrator Class | 0.13 |
| Institutional Class | 0.13 |
Waivers and/or expense reimbursements
Allspring Funds Management has contractually committed to waive and/or reimburse management and administration fees to the extent necessary to maintain certain net operating expense ratios for the Fund. When each class of the Fund has exceeded its expense cap, Allspring Funds Management will waive fees and/or reimburse expenses from fund-level expenses on a proportionate basis and then from class specific expenses. When only certain classes exceed their expense caps, waivers and/or reimbursements are applied against class specific expenses before fund-level expenses. Allspring Funds Management has contractually committed through July 31, 2022 to waive fees and/or reimburse expenses to the extent necessary to cap expenses. Prior to or after the commitment expiration date, the caps may be increased or the commitment to maintain the caps may be terminated only with the approval of the Board of Trustees. The contractual expense caps are as follows:
| | Expense ratio caps |
| Class A | 1.23% |
| Class C | 1.98 |
| Class R6 | 0.80 |
| Administrator Class | 1.15 |
| Institutional Class | 0.90 |
Distribution fee
The Trust has adopted a distribution plan for Class C shares of the Fund pursuant to Rule 12b-1 under the 1940 Act. A distribution fee is charged to Class C shares and paid to Allspring Funds Distributor, LLC ("Allspring Funds Distributor"), an affiliate of Allspring Funds Management, the principal underwriter, at an annual rate of 0.75% of the average daily net assets of Class C shares.
In addition, Allspring Funds Distributor is entitled to receive the front-end sales charge from the purchase of Class A shares and a contingent deferred sales charge on the redemption of certain Class A shares. Allspring Funds Distributor is also entitled to receive the contingent deferred sales charges from redemptions of Class C shares. For the six months ended September 30, 2021, Allspring Funds Distributor received $1,918 from the sale of Class A shares. No contingent deferred sales charges were incurred by Class A and Class C shares for the six months ended September 30, 2021.
Shareholder servicing fees
The Trust has entered into contracts with one or more shareholder servicing agents, whereby Class A, Class C, and Administrator Class of the Fund are charged a fee at an annual rate of 0.25% of the average daily net assets of each respective class. A portion of these total shareholder servicing fees were paid to affiliates.
Interfund transactions
The Fund may purchase or sell portfolio investment securities to certain affiliates pursuant to Rule 17a-7 under the 1940 Act and under procedures adopted by the Board of Trustees. The procedures have been designed to ensure that these interfund transactions, which do not incur broker commissions, are effected at current market prices.
Wells Fargo Fundamental Small Cap Growth Fund | 25
Notes to financial statements (unaudited)
Other transactions
On August 14, 2020, Class C and Administrator Class of the Fund was reimbursed by Allspring Funds Management in the amount of $698 and $1,724, respectively. The reimbursements were made in connection with resolving certain fee reimbursements.
5. INVESTMENT PORTFOLIO TRANSACTIONS
Purchases and sales of investments, excluding U.S. government obligations (if any) and short-term securities, for the six months ended September 30, 2021 were $59,528,921 and $43,245,974, respectively.
6. SECURITIES LENDING TRANSACTIONS
The Fund lends its securities through an unaffiliated securities lending agent and receives collateral in the form of cash or securities with a value at least equal to the value of the securities on loan. The value of the loaned securities is determined at the close of each business day and any increases or decreases in the required collateral are exchanged between the Fund and the counterparty on the next business day. Cash collateral received is invested in the Securities Lending Fund which seeks to provide a positive return compared to the daily Federal Funds Open Rate by investing in high-quality, U.S. dollar-denominated short-term money market instruments and is exempt from registration under Section 3(c)(7) of the 1940 Act. Securities Lending Fund is managed by Allspring Funds Management and is subadvised by Allspring Investments. Allspring Funds Management receives an advisory fee starting at 0.05% and declining to 0.01% as the average daily net assets of the Securities Lending Fund increase. All of the fees received by Allspring Funds Management are paid to Allspring Investments for its services as subadviser.
In the event of counterparty default or the failure of a borrower to return a loaned security, the Fund has the right to use the collateral to offset any losses incurred. As of September 30, 2021, the Fund had securities lending transactions with the following counterparties which are subject to offset:
| Counterparty | Value of
securities on
loan | Collateral
received1 | Net amount |
| Bank of America Securities Incorporated | $2,109,563 | $(2,109,563) | 0 |
| Barclays Capital Incorporated | 179,600 | (179,600) | 0 |
| BNP Paribas Securities Corporation | 186,816 | (186,816) | 0 |
| Deutsche Bank Securities Incorporated | 309,309 | (309,309) | 0 |
| Morgan Stanley & Co. LLC | 1,101,530 | (1,101,530) | 0 |
| Nomura Securities International Incorporated | 257,279 | (257,279) | 0 |
1 Collateral received within this table is limited to the collateral for the net transaction with the counterparty.
7. BANK BORROWINGS
The Trust (excluding the money market funds), Wells Fargo Master Trust and Wells Fargo Variable Trust are parties to a $350,000,000 revolving credit agreement whereby the Fund is permitted to use bank borrowings for temporary or emergency purposes, such as to fund shareholder redemption requests. Interest under the credit agreement is charged to the Fund based on a borrowing rate equal to the higher of the Federal Funds rate in effect on that day plus 1.25% or the overnight bank funding rate in effect on that day plus 1.25%. In addition, an annual commitment fee equal to 0.25% of the unused balance is allocated to each participating fund.
For the six months ended September 30, 2021, there were no borrowings by the Fund under the agreement.
8. CONCENTRATION RISKS
As of the end of the period, the Fund concentrated its portfolio of investments in the health care and information technology sectors. A fund that invests a substantial portion of its assets in any sector may be more affected by changes in that sector than would be a fund whose investments are not heavily weighted in any sector.
9. INDEMNIFICATION
Under the Fund's organizational documents, the officers and Trustees have been granted certain indemnification rights against certain liabilities that may arise out of performance of their duties to the Fund. The Fund has entered into a separate
26 | Wells Fargo Fundamental Small Cap Growth Fund
Notes to financial statements (unaudited)
agreement with each Trustee that converts indemnification rights currently existing under the Fund’s organizational documents into contractual rights that cannot be changed in the future without the consent of the Trustee. Additionally, in the normal course of business, the Fund may enter into contracts with service providers that contain a variety of indemnification clauses. The Fund’s maximum exposure under these arrangements is dependent on future claims that may be made against the Fund and, therefore, cannot be estimated.
10. CORONAVIRUS (COVID-19) PANDEMIC
On March 11, 2020, the World Health Organization announced that it had made the assessment that coronavirus disease 2019 (“COVID-19”) is a pandemic. The impacts of COVID-19 are affecting the entire global economy, individual companies and investment products, the funds, and the market in general. There is significant uncertainty around the extent and duration of business disruptions related to COVID-19 and the impacts may last for an extended period of time. COVID-19 has led to significant uncertainty and volatility in the financial markets.
11. SUBSEQUENT EVENTS
Effective after the close of business on November 1, 2021, the sale transaction of Wells Fargo Asset Management by Wells Fargo & Company to GTCR LLC and Reverence Capital Partners, L.P. was closed. In connection with the closing of the transaction, Wells Fargo Asset Management became known as Allspring Global Investments (“Allspring”) and various entities that provide services to the Fund changed their names to “Allspring”, including Allspring Funds Management, LLC (formerly Wells Fargo Funds Management, LLC), the investment manager to the Fund, Allspring Global Investments, LLC (formerly Wells Capital Management, LLC) and Allspring Global Investments (UK) Limited (formerly Wells Fargo Asset Management (International) Limited), both registered investment advisers providing sub-advisory services to certain funds, and Allspring Funds Distributor, LLC (formerly Wells Fargo Funds Distributor, LLC), the Fund's principal underwriter. These name changes have been reflected within this report.
At a Special Meeting of Shareholders held on October 15, 2021, shareholders of the Fund approved a new investment management and a new subadvisory agreement that was effective on November 1, 2021. The management and subadisory fee rates remained the same under the new agreements.
Wells Fargo Fundamental Small Cap Growth Fund | 27
Other information (unaudited)
PROXY VOTING INFORMATION
A description of the policies and procedures used to determine how to vote proxies relating to portfolio securities is available without charge, upon request, by calling 1-800-222-8222, visiting our website at allspringglobal.com, or visiting the SEC website at sec.gov. Information regarding how the proxies related to portfolio securities were voted during the most recent 12-month period ended June 30 is available on the website at allspringglobal.com or by visiting the SEC website at sec.gov.
SPECIAL MEETING OF SHAREHOLDERS
On October 15, 2021, a Special Meeting of Shareholders for the Fund was held to consider the following proposals. The results of the proposals are indicated below.
Proposal 1 – To consider and approve a new investment management agreement with Wells Fargo Funds Management, LLC*.
| Shares voted “For” | | 2,852,854 |
| Shares voted “Against” | | 133,475 |
| Shares voted “Abstain” | | 665,169 |
Proposal 2 – To consider and approve a new investment subadvisory agreement with Wells Capital Management, LLC**.
| Shares voted “For” | | 2,848,422 |
| Shares voted “Withhold” | | 137,047 |
| Shares voted “Abstain” | | 666,029 |
* Effective November 1, 2021, known as Allspring Funds Management, LLC.
** Effective November 1, 2021, known as Allspring Global Investments, LLC.
QUARTERLY PORTFOLIO HOLDINGS INFORMATION
The Fund files its complete schedule of portfolio holdings with the SEC for the first and third quarters of each fiscal year as an exhibit to its reports on Form N-PORT. Shareholders may view the filed Form N-PORT by visiting the SEC website at sec.gov.
28 | Wells Fargo Fundamental Small Cap Growth Fund
Other information (unaudited)
BOARD OF TRUSTEES AND OFFICERS
Each of the Trustees and Officers listed in the table below acts in identical capacities for each fund in the Wells Fargo family of funds, which consists of 139 mutual funds comprising the Wells Fargo Funds Trust, Wells Fargo Variable Trust, Wells Fargo Master Trust and four closed-end funds (collectively the “Fund Complex”). This table should be read in conjunction with the Prospectus and the Statement of Additional Information1. The mailing address of each Trustee and Officer is 525 Market Street, 12th Floor, San Francisco, CA 94105. Each Trustee and Officer serves an indefinite term, however, each Trustee serves such term until reaching the mandatory retirement age established by the Trustees.
Independent Trustees
Name and
year of birth | Position held and
length of service* | Principal occupations during past five years or longer | Current other
public company or
investment
company
directorships |
William R. Ebsworth
(Born 1957) | Trustee,
since 2015 | Retired. From 1984 to 2013, equities analyst, portfolio manager, research director and chief investment officer at Fidelity Management and Research Company in Boston, Tokyo, and Hong Kong, and retired in 2013 as Chief Investment Officer of Fidelity Strategic Advisers, Inc. where he led a team of investment professionals managing client assets. Prior thereto, Board member of Hong Kong Securities Clearing Co., Hong Kong Options Clearing Corp., the Thailand International Fund, Ltd., Fidelity Investments Life Insurance Company, and Empire Fidelity Investments Life Insurance Company. Audit Committee Chair and Investment Committee Chair of the Vincent Memorial Hospital Endowment (non-profit organization). Mr. Ebsworth is a CFA® charterholder. | N/A |
Jane A. Freeman
(Born 1953) | Trustee,
since 2015;
Chair Liaison,
since 2018 | Retired. From 2012 to 2014 and 1999 to 2008, Chief Financial Officer of Scientific Learning Corporation. From 2008 to 2012, Ms. Freeman provided consulting services related to strategic business projects. Prior to 1999, Portfolio Manager at Rockefeller & Co. and Scudder, Stevens & Clark. Board member of the Harding Loevner Funds from 1996 to 2014, serving as both Lead Independent Director and chair of the Audit Committee. Board member of the Russell Exchange Traded Funds Trust from 2011 to 2012 and the chair of the Audit Committee. Ms. Freeman is also an inactive Chartered Financial Analyst. | N/A |
Isaiah Harris, Jr.
(Born 1952) | Trustee,
since 2009; Audit
Committee
Chair,
since 2019 | Retired. Chairman of the Board of CIGNA Corporation since 2009, and Director since 2005. From 2003 to 2011, Director of Deluxe Corporation. Prior thereto, President and CEO of BellSouth Advertising and Publishing Corp. from 2005 to 2007, President and CEO of BellSouth Enterprises from 2004 to 2005 and President of BellSouth Consumer Services from 2000 to 2003. Emeritus member of the Iowa State University Foundation Board of Governors. Emeritus Member of the Advisory Board of Iowa State University School of Business. Advisory Board Member, Palm Harbor Academy (private school). Mr. Harris is a certified public accountant (inactive status). | CIGNA Corporation |
Judith M. Johnson
(Born 1949) | Trustee,
since 2008 | Retired. Prior thereto, Chief Executive Officer and Chief Investment Officer of Minneapolis Employees Retirement Fund from 1996 to 2008. Ms. Johnson is an attorney, certified public accountant and a certified managerial accountant. | N/A |
David F. Larcker
(Born 1950) | Trustee,
since 2009 | James Irvin Miller Professor of Accounting at the Graduate School of Business (Emeritus), Stanford University, Director of the Corporate Governance Research Initiative and Senior Faculty of The Rock Center for Corporate Governance since 2006. From 2005 to 2008, Professor of Accounting at the Graduate School of Business, Stanford University. Prior thereto, Ernst & Young Professor of Accounting at The Wharton School, University of Pennsylvania from 1985 to 2005. | N/A |
Wells Fargo Fundamental Small Cap Growth Fund | 29
Other information (unaudited)
Name and
year of birth | Position held and
length of service* | Principal occupations during past five years or longer | Current other
public company or
investment
company
directorships |
Olivia S. Mitchell
(Born 1953) | Trustee,
since 2006;
Nominating and
Governance
Committee Chair,
since 2018 | International Foundation of Employee Benefit Plans Professor, Wharton School of the University of Pennsylvania since 1993. Director of Wharton’s Pension Research Council and Boettner Center on Pensions & Retirement Research, and Research Associate at the National Bureau of Economic Research. Previously, Cornell University Professor from 1978 to 1993. | N/A |
Timothy J. Penny
(Born 1951) | Trustee,
since 1996;
Chair,
since 2018 | President and Chief Executive Officer of Southern Minnesota Initiative Foundation, a non-profit organization, since 2007. Member of the Board of Trustees of NorthStar Education Finance, Inc., a non-profit organization, since 2007. | N/A |
James G. Polisson
(Born 1959) | Trustee,
since 2018 | Retired. Chief Marketing Officer, Source (ETF) UK Services, Ltd, from 2015 to 2017. From 2012 to 2015, Principal of The Polisson Group, LLC, a management consulting, corporate advisory and principal investing company. Chief Executive Officer and Managing Director at Russell Investments, Global Exchange Traded Funds from 2010 to 2012. Managing Director of Barclays Global Investors from 1998 to 2010 and Global Chief Marketing Officer for iShares and Barclays Global Investors from 2000 to 2010. Trustee of the San Francisco Mechanics’ Institute, a non-profit organization, from 2013 to 2015. Board member of the Russell Exchange Traded Fund Trust from 2011 to 2012. Director of Barclays Global Investors Holdings Deutschland GmbH from 2006 to 2009. Mr. Polisson is an attorney and has a retired status with the Massachusetts and District of Columbia Bar Associations. | N/A |
Pamela Wheelock
(Born 1959) | Trustee,
since January
2020; previously
Trustee from
January 2018 to
July 2019 | Board member of the Destination Medical Center Economic Development Agency, Rochester, Minnesota since 2019. Interim President of the McKnight Foundation from January to September 2020. Acting Commissioner, Minnesota Department of Human Services, July 2019 through September 2019. Human Services Manager (part-time), Minnesota Department of Human Services, October 2019 through December 2019. Chief Operating Officer, Twin Cities Habitat for Humanity from 2017 to 2019. Vice President of University Services, University of Minnesota from 2012 to 2016. Prior thereto, on the Board of Directors, Governance Committee and Finance Committee for the Minnesota Philanthropy Partners (Saint Paul Foundation) from 2012 to 2018, Interim Chief Executive Officer of Blue Cross Blue Shield of Minnesota from 2011 to 2012, Chairman of the Board from 2009 to 2012 and Board Director from 2003 to 2015. Vice President, Leadership and Community Engagement, Bush Foundation, Saint Paul, Minnesota (a private foundation) from 2009 to 2011. Executive Vice President and Chief Financial Officer, Minnesota Sports and Entertainment from 2004 to 2009 and Senior Vice President from 2002 to 2004. Executive Vice President of the Minnesota Wild Foundation from 2004 to 2008. Commissioner of Finance, State of Minnesota, from 1999 to 2002. Currently Board Chair of the Minnesota Wild Foundation since 2010. | N/A |
* Length of service dates reflect the Trustee’s commencement of service with the Trust’s predecessor entities, where applicable.
30 | Wells Fargo Fundamental Small Cap Growth Fund
Other information (unaudited)
Officers2
Name and
year of birth | Position held and
length of service | Principal occupations during past five years or longer |
Andrew Owen
(Born 1960) | President,
since 2017 | President, Chief Executive Officer and Director of Allspring Funds Management, LLC since 2017 and co-president of Galliard Capital Management, LLC, an affiliate of Allspring Funds Management, LLC, since 2019. Prior thereto, Head of Affiliated Managers, Allspring Global Investments, from 2014 to 2019 and Executive Vice President responsible for marketing, investments and product development for Allspring Funds Management, LLC, from 2009 to 2014. In addition, Mr. Owen was an Executive Vice President of Wells Fargo & Company from 2014 to 2021. |
Jeremy DePalma
(Born 1974) | Treasurer,
since 2012
(for certain funds in
the Fund Complex);
since 2021 (for
the remaining funds in the
Fund Complex) | Senior Vice President of Allspring Funds Management, LLC since 2009. Senior Vice President of Evergreen Investment Management Company, LLC from 2008 to 2010 and head of the Fund Reporting and Control Team within Fund Administration. |
Kate McKinley
(Born 1977) | Chief Legal Officer and Chief Compliance Officer,
since 2021 | Chief Legal Officer of Allspring Global Investments since 2021. Prior thereto, held various roles at State Street Global Advisors, Inc. beginning in 2010, including serving as Senior Vice President and General Counsel from 2019 to 2021. Previously served as Assistant General Counsel for Bank of America Corporation from 2005 to 2010 and as an Associate at WilmerHale from 2002 to 2005. |
Matthew Prasse
(Born 1983) | Secretary,
since 2021 | Senior Counsel of the Allspring Legal Department since 2021. Senior Counsel of the Wells Fargo Legal Department from 2018 to 2021. Previously, Counsel for Barings LLC from 2015 to 2018. Prior to joining Barings, Associate at Morgan, Lewis & Bockius LLP from 2008 to 2015. |
1 The Statement of Additional Information includes additional information about the Trustees and is available, without charge, upon request, by calling 1-800-222-8222 or by visiting the website at allspringglobal.com.
2 For those Officers with tenures at Allspring Global Investments and/or Allspring Funds Management, LLC that began prior to 2021, such tenures include years of service during which these businesses/entities were known as Wells Fargo Asset Management and Wells Fargo Funds Management, LLC, respectively.
Wells Fargo Fundamental Small Cap Growth Fund | 31
Board considerations (unaudited)
BOARD CONSIDERATION OF INVESTMENT MANAGEMENT AND SUB-ADVISORY AGREEMENTS:
Board Considerations – Current Agreements
Under the Investment Company Act of 1940 (the “1940 Act”), the Board of Trustees (the “Board”) of Wells Fargo Funds Trust (the “Trust”) must determine annually whether to approve the continuation of the Trust’s investment management and sub-advisory agreements. In this regard, at a Board meeting held on May 17-19, 2021 (the “Meeting”), the Board, all the members of which have no direct or indirect interest in the investment management and sub-advisory agreements and are not “interested persons” of the Trust, as defined in the 1940 Act (the “Independent Trustees”), reviewed and approved for Wells Fargo Fundamental Small Cap Growth Fund (the “Fund”): (i) an investment management agreement (the “Management Agreement”) with Wells Fargo Funds Management, LLC (“Funds Management”); and (ii) an investment sub-advisory agreement (the “Sub-Advisory Agreement”) with Wells Capital Management Incorporated (the “Sub-Adviser”), an affiliate of Funds Management. The Management Agreement and the Sub-Advisory Agreement are collectively referred to as the “Advisory Agreements.”
The Board noted that Wells Fargo & Company recently announced that it had entered into a definitive agreement to sell Wells Fargo Asset Management (“WFAM”), which includes Funds Management and the Sub-Adviser, to GTCR LLC and Reverence Capital Partners, L.P. and/or their affiliates (the “Transaction”). The Board further noted that the Transaction would result in a change-of-control of Funds Management and the Sub-Adviser, which would be considered to be an assignment that would result in the termination of the Advisory Agreements. In light of the Transaction, the Board separately considered for approval a new investment management agreement with Funds Management and a new sub-advisory agreement with the Sub-Adviser (the “New Agreements”) that would replace the Advisory Agreements upon consummation of the Transaction, subject to approval of the New Agreements by the Fund’s shareholders. The Board also considered for approval interim agreements to go into effect in the event shareholders do not approve the New Agreements before the Transaction is completed. The interim agreements would allow the Manager and the Sub-Adviser to continue providing services to the Fund while the Fund continues to seek shareholder approval of the New Agreements. The Board noted that the terms of the interim agreements would be identical to those of the current Advisory Agreements, except for the term and certain escrow provisions.
At the Meeting, the Board considered the factors and reached the conclusions described below relating to the selection of Funds Management and the Sub-Adviser and the approval of the Advisory Agreements. Prior to the Meeting, including at Board meetings held in April and May 2021, the Trustees conferred extensively among themselves and with representatives of Funds Management about these matters. Also, the Board has adopted a team-based approach, with each team consisting of a sub-set of Trustees, to assist the full Board in the discharge of its duties in reviewing investment performance and other matters throughout the year. The Independent Trustees were assisted in their evaluation of the Advisory Agreements by independent legal counsel, from whom they received separate legal advice and with whom they met separately.
In providing information to the Board, Funds Management and the Sub-Adviser were guided by a detailed set of requests for information submitted to them by independent legal counsel on behalf of the Independent Trustees at the start of the Board’s annual contract renewal process earlier in 2021. In considering and approving the Advisory Agreements, the Trustees considered the information they believed relevant, including but not limited to the information discussed below. The Board considered not only the specific information presented in connection with the Meeting, but also the knowledge gained over time through interaction with Funds Management and the Sub-Adviser about various topics. In this regard, the Board reviewed reports of Funds Management at each of its quarterly meetings, which included, among other things, portfolio reviews and investment performance reports. In addition, the Board and the teams mentioned above confer with portfolio managers at various times throughout the year. The Board did not identify any particular information or consideration that was all-important or controlling, and each individual Trustee may have attributed different weights to various factors.
After its deliberations, the Board unanimously determined that the compensation payable to Funds Management and the Sub-Adviser under each of the Advisory Agreements was reasonable, and approved the continuation of the Advisory Agreements for a one-year term. The Board considered the approval of the Advisory Agreements for the Fund as part of its consideration of agreements for funds across the complex, but its approvals were made on a fund-by-fund basis. The following summarizes a number of important, but not necessarily all, factors considered by the Board in support of its approvals.
Nature, extent and quality of services
The Board received and considered various information regarding the nature, extent and quality of services provided to the Fund by Funds Management and the Sub-Adviser under the Advisory Agreements. This information included a description of the investment advisory services and Fund-level administrative services covered by the Management Agreement, as well as, among other things, a summary of the background and experience of senior management of WFAM, of which Funds Management and the Sub-Adviser are a part, and a summary of investments made in the business of WFAM. The Board also received a description of
32 | Wells Fargo Fundamental Small Cap Growth Fund
Board considerations (unaudited)
Funds Management’s and the Sub-Adviser’s business continuity plans, including a summary of the performance of such plans and any changes thereto during the COVID-19 pandemic, and of their approaches to data privacy and cybersecurity. The Board also received and reviewed information about Funds Management’s role as administrator of the Fund’s liquidity risk management program, Funds Management’s approach to risk management, and Funds Management’s intermediary and vendor oversight program.
The Board also considered the qualifications, background, tenure and responsibilities of each of the portfolio managers primarily responsible for the day-to-day portfolio management of the Fund. The Board evaluated the ability of Funds Management and the Sub-Adviser to attract and retain qualified investment professionals, including research, advisory and supervisory personnel.
The Board further considered the compliance programs and compliance records of Funds Management and the Sub-Adviser. In addition, the Board took into account the full range of services provided to the Fund by Funds Management and its affiliates. The Board also considered information about retention and back-up arrangements that have been put into place with respect to key personnel of WFAM in connection with the anticipated Transaction, noting that WFAM provided assurances that the announcement and eventual culmination of the Transaction is not expected to result in any diminution in the nature or quality of services provided to the Fund.
Fund investment performance and expenses
The Board considered the investment performance results for the Fund over various time periods ended December 31, 2020. The Board considered these results in comparison to the investment performance of funds in a universe that was determined by Broadridge Inc. (“Broadridge”) to be similar to the Fund (the “Universe”), and in comparison to the Fund’s benchmark index and to other comparative data. Broadridge is an independent provider of investment company data. The Board received a description of the methodology used by Broadridge to select the mutual funds in the performance Universe. The Board noted that the investment performance of the Fund (Class A) was higher than the average investment performance of the Universe for all periods under review. The Board also noted that the investment performance of the Fund was higher than its benchmark index, the Russell 1000® Growth Index, for all periods under review.
The Board also received and considered information regarding the Fund’s net operating expense ratios and their various components, including actual management fees, custodian and other non-management fees, and Rule 12b-1 and non-Rule 12b-1 shareholder service fees. The Board considered these ratios in comparison to the median ratios of funds in class-specific expense groups that were determined by Broadridge to be similar to the Fund (the “Groups”). The Board received a description of the methodology used by Broadridge to select the mutual funds in the expense Groups and an explanation of how funds comprising expense groups and their expense ratios may vary from year-to-year. Based on the Broadridge reports, the Board noted that the net operating expense ratios of the Fund were lower than or equal to the median net operating expense ratios of the expense Groups for each share class.
The Board took into account the Fund’s investment performance and expense information provided to it among the factors considered in deciding to re-approve the Advisory Agreements.
Investment management and sub-advisory fee rates
The Board reviewed and considered the contractual fee rates payable by the Fund to Funds Management under the Management Agreement, as well as the contractual fee rates payable by the Fund to Funds Management for class-level administrative services under a Class-Level Administration Agreement, which include, among other things, class-level transfer agency and sub-transfer agency costs (collectively, the “Management Rates”). The Board also reviewed and considered the contractual investment sub-advisory fee rates that are payable by Funds Management to the Sub-Adviser for investment sub-advisory services.
Among other information reviewed by the Board was a comparison of the Fund’s Management Rates with the average contractual investment management fee rates of funds in the expense Groups at a common asset level as well as transfer agency costs of the funds in the expense Groups. The Board noted that the Management Rates of the Fund were in range of the sum of these average rates for the Fund’s expense Groups for all share classes except for the Administrator Class, which was higher than the sum of these average rates for the Fund’s expense Groups.
The Board also received and considered information about the portion of the total management fee that was retained by Funds Management after payment of the fee to the Sub-Adviser for sub-advisory services. In assessing the reasonableness of this amount, the Board received and evaluated information about the nature and extent of responsibilities retained and risks assumed by Funds Management and not delegated to or assumed by the Sub-Adviser, and about Funds Management’s on-going oversight services. Given the affiliation between Funds Management and the Sub-Adviser, the Board ascribed limited relevance to the allocation of fees between them.
Wells Fargo Fundamental Small Cap Growth Fund | 33
Board considerations (unaudited)
The Board also received and considered information about the nature and extent of services offered and fee rates charged by Funds Management and the Sub-Adviser to other types of clients with investment strategies similar to those of the Fund. In this regard, the Board received information about the significantly greater scope of services, and compliance, reporting and other legal burdens and risks of managing proprietary mutual funds compared with those associated with managing assets of other types of clients, including third-party sub-advised fund clients and non-mutual fund clients such as institutional separate accounts.
Based on its consideration of the factors and information it deemed relevant, including those described here, the Board determined that the compensation payable to Funds Management under the Management Agreement and to the Sub-Adviser under the Sub-Advisory Agreement was reasonable.
Profitability
The Board received and considered information concerning the profitability of Funds Management, as well as the profitability of both WFAM and Wells Fargo & Co. (“Wells Fargo”) from providing services to the fund family as a whole. The Board noted that the Sub-Adviser’s profitability information with respect to providing services to the Fund and other funds in the family was subsumed in the WFAM and Wells Fargo profitability analysis.
Funds Management reported on the methodologies and estimates used in calculating profitability, including a description of the methodology used to allocate certain expenses. Among other things, the Board noted that the levels of profitability reported on a fund-by-fund basis varied widely, depending on factors such as the size, type and age of fund.
Based on its review, the Board did not deem the profits reported by Funds Management, WFAM or Wells Fargo from services provided to the Fund to be at a level that would prevent it from approving the continuation of the Advisory Agreements.
Economies of scale
The Board received and considered information about the potential for Funds Management to experience economies of scale in the provision of management services to the Fund, the difficulties of calculating economies of scale at an individual fund level, and the extent to which potential scale benefits are shared with Fund shareholders. The Board noted the existence of breakpoints in the Fund’s management fee structure, which operate generally to reduce the Fund’s expense ratios as the Fund grows in size, and the size of the Fund in relation to such breakpoints. The Board considered that in addition to management fee breakpoints, Funds Management shares potential economies of scale from its management business in a variety of ways, including through fee waiver and expense reimbursement arrangements, competitive management fee rates set at the outset without regard to breakpoints, and investments in the business intended to enhance services available to shareholders.
The Board concluded that Funds Management’s arrangements with respect to the Fund, including contractual breakpoints, constituted a reasonable approach to sharing potential economies of scale with the Fund and its shareholders.
Other benefits to Funds Management and the Sub-Adviser
The Board received and considered information regarding potential “fall-out” or ancillary benefits received by Funds Management and its affiliates, including the Sub-Adviser, as a result of their relationships with the Fund. Ancillary benefits could include, among others, benefits directly attributable to other relationships with the Fund and benefits potentially derived from an increase in Funds Management’s and the Sub-Adviser’s business as a result of their relationships with the Fund. The Board noted that various affiliates of Funds Management may receive distribution-related fees, shareholder servicing payments and sub-transfer agency fees in respect of shares sold or held through them and services provided.
The Board also reviewed information about soft dollar credits earned and utilized by the Sub-Adviser, fees earned by Funds Management and the Sub-Adviser from managing a private investment vehicle for the fund family’s securities lending collateral and commissions earned by an affiliated broker from portfolio transactions.
Based on its consideration of the factors and information it deemed relevant, including those described here, the Board did not find that any ancillary benefits received by Funds Management and its affiliates, including the Sub-Adviser, were unreasonable.
Conclusion
At the Meeting, after considering the above-described factors and based on its deliberations and its evaluation of the information described above, the Board unanimously determined that the compensation payable to Funds Management and the Sub-Adviser under each of the Advisory Agreements was reasonable, and approved the continuation of the Advisory Agreements for a one-year term.
34 | Wells Fargo Fundamental Small Cap Growth Fund
Board considerations (unaudited)
Board Considerations – New Agreements
Overview of the Board evaluation process
At a meeting held on May 17-19, 2021 (the “Board Meeting”), the Board of Trustees (the “Board”) of Wells Fargo Funds Trust (the “Trust”, and the series identified below, the “Funds”) approved the continuation of each Fund’s current Investment Management Agreement (the “Current Investment Management Agreement”) and the current Sub-Advisory Agreements (the “Current Sub-Advisory Agreements”, and collectively, the “Current Agreements”).
| Wells Fargo C&B Mid Cap Value Fund |
| Wells Fargo California Limited-Term Tax-Free Fund |
| Wells Fargo California Tax-Free Fund |
| Wells Fargo Classic Value Fund |
| Wells Fargo Common Stock Fund |
| Wells Fargo Disciplined Small Cap Fund |
| Wells Fargo Disciplined U.S. Core Fund |
| Wells Fargo Discovery Fund |
| Wells Fargo Diversified Equity Fund |
| Wells Fargo Endeavor Select Fund |
| Wells Fargo Enterprise Fund |
| Wells Fargo Fundamental Small Cap Growth Fund |
| Wells Fargo Growth Fund |
| Wells Fargo High Yield Municipal Bond Fund |
| Wells Fargo Intermediate Tax/AMT-Free Fund |
| Wells Fargo Large Cap Core Fund |
| Wells Fargo Large Cap Growth Fund |
| Wells Fargo Large Company Value Fund |
| Wells Fargo Minnesota Tax-Free Fund |
| Wells Fargo Municipal Bond Fund |
| Wells Fargo Omega Growth Fund |
| Wells Fargo Opportunity Fund |
| Wells Fargo Pennsylvania Tax-Free Fund |
| Wells Fargo Premier Large Company Growth Fund |
| Wells Fargo Short-Term Municipal Bond Fund |
| Wells Fargo Small Cap Fund |
| Wells Fargo Special Mid Cap Value Fund |
| Wells Fargo Special Small Cap Value Fund |
| Wells Fargo Strategic Municipal Bond Fund |
| Wells Fargo Ultra Short-Term Municipal Income Fund |
| Wells Fargo Wisconsin Tax-Free Fund |
Each Trustee on the Board is not an “interested person” (as defined in the Investment Company Act of 1940 (the “1940 Act”)) of the Funds (collectively, the “Independent Trustees”). The process followed by the Board in considering and approving the continuation of the Current Agreements is referred to herein as the “2021 Annual Approval Process.”
As noted above, the closing of the sale of Wells Fargo Asset Management (“WFAM”) to a holding company (“NewCo”) affiliated with private funds of GTCR LLC (“GTCR”) and of Reverence Capital Partners, L.P. (“Reverence Capital”, and such transaction, the “Transaction”) will result in a change of control of Wells Fargo Funds Management LLC (“Funds Management”) and Wells Capital Management Incorporated (“Wells Capital”, and together with Funds Management, the “Advisers”), which will be considered to be an “assignment” of each Fund’s Current Agreements under the 1940 Act that will result in the automatic termination of each Fund’s Current Agreements. In light of the expected termination of each Fund’s Current Agreements upon the closing, at the Board Meeting the Board also considered and approved the New Agreements, which are: (i) a new Investment Management Agreement (the “New Investment Management Agreement”) between the Trust, on behalf of each Fund, and Funds Management; (ii) a new Sub-Advisory Agreement (the “New Wells Capital Sub-Advisory Agreement”) among the Trust, Funds Management and Wells Capital with respect to each Fund other than C& B Mid Cap Value Fund and Diversified Equity Fund; and (iii) a new Sub-Advisory Agreement (the “New C&B Sub-Advisory Agreement”, and collectively, the “New Agreements”) among the Trust, with respect to the C&B Mid Cap Value Fund, Funds Management and Cooke & Bieler, L.P. (“C&B”, and together with Wells Capital, the “Sub-Advisers”), each of which is intended to go into effect upon the closing. The process followed by the Board in reviewing and approving the New Agreements is referred to herein as the “New Agreement Approval Process.”
Wells Fargo Fundamental Small Cap Growth Fund | 35
Board considerations (unaudited)
At a series of meetings held in April and May 2021 (collectively, “April and May 2021 Meetings”) and at the Board Meeting, the Trustees conferred extensively among themselves and with senior representatives of Funds Management, GTCR and Reverence Capital about the New Agreements and related matters. The Board reviewed and discussed information furnished by Funds Management, GTCR and Reverence Capital that the Board considered reasonably necessary to evaluate the terms of the New Agreements and the services to be provided. At these meetings, senior representatives from Funds Management, GTCR and Reverence Capital made presentations to, and responded to questions from, the Board.
In providing information to the Board in connection with the 2021 annual approval process (the “2021 Annual Approval Process”) and the New Agreement Approval Process, Funds Management, GTCR and Reverence Capital (as applicable) were guided by requests for information submitted by independent legal counsel on behalf of the Independent Trustees. In considering and approving the New Agreements, the Trustees considered the information they believed relevant, including but not limited to the information discussed herein. The Board considered not only the specific information presented in connection with the April and May 2021 Meetings as well as the Board Meeting, but also the knowledge gained over time through interaction with Funds Management and the Sub-Advisers about various topics. In this regard, the Board reviews reports of Funds Management at each of its regular Board meetings, which includes, among other things, portfolio reviews and investment performance reports. In addition, the Board confers with portfolio managers at various times throughout the year. The Board was assisted in its evaluation of the New Agreements by independent legal counsel, from whom the Independent Trustees received separate legal advice and with whom the Independent Trustees met separately. The Board did not identify any particular information or consideration that was all-important or controlling, and each individual Trustee may have attributed different weights to various factors.
Among other information considered by the Board in connection with the Transaction was:
| ■ | Information regarding the Transaction: information about the structure, financing sources and material terms and conditions of the Transaction, including the expected impact on the businesses conducted by the Advisers and by Wells Fargo Funds Distributor LLC, as the distributor of Fund shares. |
| ■ | Information regarding NewCo, GTCR and Reverence Capital: (i) information about NewCo, including information about its expected financial condition and access to capital, and senior leadership team; (ii) the experience of senior management at GTCR and Reverence Capital in acquiring portfolio companies; (iii) the plan to operationalize NewCo, including the transition of necessary infrastructure services through a transition services agreement with Wells Fargo under which Wells Fargo will continue to provide NewCo with certain services for a specified period of time after the closing; and (iv) information regarding regulatory matters, compliance, and risk management functions at NewCo, including resources to be dedicated thereto. |
| ■ | Impact of the Transaction on WFAM and Service Providers: (i) information regarding any changes to personnel and/or other resources of the Advisers as a result of the Transaction, including assurances regarding comparable and competitive compensation arrangements to attract and retain highly qualified personnel; and (ii) information about the organizational and operating structure with respect to NewCo, the Advisers and the Funds. |
| ■ | Impact of the Transaction on the Funds and their Shareholders: (i) information regarding anticipated benefits to the Funds as a result of the Transaction; (ii) a commitment that the Funds would not bear any expenses, directly or indirectly, in connection with the Transaction; (iii) confirmation that the Advisers intend to continue to manage the Funds in a manner consistent with each Fund’s current investment objectives and principal investments strategies; and (iv) a commitment that neither NewCo nor WFAM will take any steps that would impose any “unfair burden” (as that term is used in section 15(f)(1)(B) of the 1940 Act) on the Funds as a result of the Transaction. |
With respect to the New Agreements, the Board considered: (i) a representation that, after the closing, all of the Funds will continue to be managed and advised by their current Advisers and for C&B Mid Cap Value Fund, C&B, and that the same portfolio managers of the Sub-Advisers are expected to continue to manage the Funds after the Transaction; (ii) information regarding the terms of the New Agreements, including changes as compared to the Current Agreements; (iii) information confirming that the fee rates payable under the New Agreements will not increase as a result of the Transaction as compared to the rates under the Current Agreements; and (iv) assurances that the Transaction is not expected to cause any diminution with respect to the nature, extent and quality of any of the services currently provided to the Funds by the Advisers as a result of the Transaction.
In addition to considering information furnished specifically to evaluate the impact of the Transaction on the Funds and their respective shareholders in connection with the New Agreement Approval Process, the Board considered information furnished at prior meetings of the Board and its committees, including detailed information provided in connection with the 2021 Annual Approval Process. In this regard, in connection with the 2021 Annual Approval Process, the Board received information about complex-wide and individual Fund performance, fees and expenses, including: (i) a report from an independent data provider comparing the investment performance of each Fund to the investment performance of comparable funds and benchmark indices, over various time periods; (ii) a report from an independent data provider comparing each Fund’s total expense ratio (and
36 | Wells Fargo Fundamental Small Cap Growth Fund
Board considerations (unaudited)
its components) to those of comparable funds; (iii) comparative information concerning the fees charged and services provided by Funds Management and the Sub-Advisers to each Fund in managing other accounts (which may include other mutual funds, collective investment funds and institutional accounts), if any, that employ investment strategies and techniques similar to those used in managing such Fund(s); and (iv) profitability analyses of Funds Management, as well as the profitability of both WFAM and Wells Fargo from providing services to the fund family as a whole.
After its deliberations, the Board unanimously determined that the compensation payable to Funds Management and the Sub-Advisers under the New Agreements is reasonable, approved the New Agreements for a two-year term, and voted to recommend that Fund shareholders approve the New Agreements. The Board considered the approval of the New Agreements as part of its consideration of agreements for funds across the complex, but its approvals were made on a fund-by-fund basis. The following summarizes a number of important, but not necessarily all, factors considered by the Board in support of its approvals.
Nature, extent and quality of services
In connection with the 2021 Annual Approval Process, the Board received and considered various information regarding the nature, extent and quality of services provided to the Fund by Funds Management and the Sub-Advisers under the Advisory Agreements. This information included a description of the investment advisory services and Fund-level administrative services covered by the Current Management Agreement, as well as, among other things, a summary of the background and experience of senior management of WFAM, of which Funds Management and Wells Capital are a part, and a summary of investments made in the business of WFAM. The Board also received a description of Funds Management’s and the Sub-Advisers’ business continuity plans, including a summary of the performance of such plans and any changes thereto during the COVID-19 pandemic, and of their approaches to data privacy and cybersecurity. The Board also received and reviewed information about Funds Management’s role as administrator of the Funds’ liquidity risk management program, Funds Management’s approach to risk management, and Funds Management’s intermediary and vendor oversight program.
In connection with the 2021 Annual Approval Process, the Board also considered the qualifications, background, tenure and responsibilities of each of the portfolio managers primarily responsible for the day-to-day portfolio management of the Funds. The Board evaluated the ability of Funds Management and the Sub-Advisers to attract and retain qualified investment professionals, including research, advisory and supervisory personnel.
In connection with the 2021 Annual Approval Process, the Board further considered the compliance programs and compliance records of Funds Management and the Sub-Advisers. In addition, the Board took into account the full range of services provided to the Fund by Funds Management and its affiliates.
In connection with the New Agreement Approval Process, the Board considered, among other information, the structure of the Transaction and expected impact, if any, of the Transaction on the operations, facilities, organization and personnel of Funds Management and the Sub-Advisers. The Board received assurances from Funds Management that each Fund will continue to be advised by its current Sub-Adviser after the closing, and that the same individual portfolio managers are expected to continue to manage the Funds after the closing. With respect to the recruitment and retention of key personnel, the Board noted information from GTCR, Reverence Capital and the Advisers regarding the potential benefits for employees of joining NewCo. The Board recognized that the personnel who had been extended offers may not accept such offers and personnel changes may occur in the future in the ordinary course.
In addition, the Board considered information regarding the infrastructure, operational capabilities and support staff in place to assist in the portfolio management and operations of the Funds, including the provision of administrative services, and the anticipated impact of the Transaction on such matters. The Board also considered the business-related and other risks to which the Advisers may be subject in managing the Funds and in connection with the Transaction. The Board also considered the transition and integration plans as a result of the change in ownership of the Advisers from Wells Fargo to NewCo. The Board considered the resources and infrastructure that NewCo intends to devote to its compliance program to ensure compliance with applicable laws and regulations, as well as its risk management program and cybersecurity program. The Board also took into account assurances received from the Advisers, GTCR and Reverence Capital that the Transaction is not expected to cause any diminution in the nature, extent and quality of services provided by Funds Management and the Sub-Advisers to the Funds and their shareholders.
Fund investment performance and expenses
In connection with the 2021 Annual Approval Process, the Board considered the investment performance results for each Fund over various time periods ended December 31, 2020. The Board considered these results in comparison to the investment performance of funds in a universe that was determined by Broadridge Inc. (“Broadridge”) to be similar to each Fund (the “Universe”), and in comparison to each Fund’s benchmark index and to other comparative data. Broadridge is an independent provider of investment company data. The Board received a description of the methodology used by Broadridge to select the
Wells Fargo Fundamental Small Cap Growth Fund | 37
Board considerations (unaudited)
mutual funds in the performance Universe. Where applicable, the Board received information concerning, and discussed factors contributing to, underperformance of Funds relative to the Universe and benchmark for any underperformance periods.
In connection with the 2021 Annual Approval Process, the Board also received and considered information regarding each Fund’s net operating expense ratios and their various components, including actual management fees, custodian and other non-management fees, and Rule 12b-1 and non-Rule 12b-1 shareholder service fees. The Board considered these ratios in comparison to the median ratios of funds in class-specific expense groups that were determined by Broadridge to be similar to the Fund (the “Groups”). The Board received a description of the methodology used by Broadridge to select the mutual funds in the expense Groups and an explanation of how funds comprising expense groups and their expense ratios may vary from year-to-year.
In connection with the New Agreement Approval Process, the Board received a commitment that WFAM will maintain fee and expense commitments for at least two years after the closing. The Board took into account each Fund’s investment performance and expense information among the factors considered in deciding to approve the New Agreements.
Investment management and sub-advisory fee rates
In connection with the 2021 Annual Approval Process, the Board reviewed and considered the contractual fee rates payable by each Fund to Funds Management under the Current Management Agreement, as well as the contractual fee rates payable by each Fund to Funds Management for class-level administrative services under a Class-Level Administration Agreement, which include, among other things, class-level transfer agency and sub-transfer agency costs (collectively, the “Management Rates”). The Board also reviewed and considered the contractual investment sub-advisory fee rates that are payable by Funds Management to each of the Sub-Advisers under the Current Sub-Advisory Agreements for investment sub-advisory services (the “Sub-Advisory Fee Rates”).
Among other information reviewed by the Board in connection with the 2021 Annual Approval Process, was a comparison of each Fund’s Management Rates with the average contractual investment management fee rates of funds in the expense Groups at a common asset level as well as transfer agency costs of the funds in the expense Groups.
In connection with the 2021 Annual Approval Process, the Board also received and considered information about the portion of the total management fee that was retained by Funds Management after payment of the Sub-Advisory Fee Rates. In assessing the reasonableness of this amount, the Board received and evaluated information about the nature and extent of responsibilities retained and risks assumed by Funds Management and not delegated to or assumed by the Sub-Advisers, and about Funds Management’s on-going oversight services. With respect to C&B, the Board also considered this amount in comparison to the median amount retained by advisers to funds in a sub-advised expense universe that was determined by Broadridge to be similar to the Specialized Technology Fund. In this regard, the Board noted the small size of the sub-advised expense universe. The Board also considered that the sub-advisory fees paid to C&B had been negotiated by Funds Management on an arm’s length basis. Given the affiliation between Funds Management and Wells Capital, the Board ascribed limited relevance to the allocation of fees between them.
In connection with the 2021 Annual Approval Process, the Board also received and considered information about the nature and extent of services offered and fee rates charged by Funds Management and the Sub-Advisers to other types of clients, if any, with investment strategies similar to those of each Fund. In this regard, the Board received information about the significantly greater scope of services, and compliance, reporting and other legal burdens and risks of managing proprietary mutual funds compared with those associated with managing assets of other types of clients, including third-party sub-advised fund clients and non-mutual fund clients such as institutional separate accounts.
In connection with the New Agreement Approval Process, the Board noted the assurances received by it that there would be no increases to any of the Management Rates or the Sub-Advisory Fee Rates as a result of the Transaction. The Board also considered that the New Agreements do not change the computation method for calculating such fees, and there is no present intention to reduce expense waiver and reimbursement arrangements that are currently in effect. Based on its consideration of the factors and information it deemed relevant, including those described here, the Board determined that the compensation payable to Funds Management under the New Management Agreement and to each of the Sub-Advisers under the New Sub-Advisory Agreements was reasonable.
Profitability
In connection with the 2021 Annual Approval Process, the Board received and considered information concerning the profitability of Funds Management, as well as the profitability of both WFAM and Wells Fargo from providing services to the fund family as a whole. The Board noted that Wells Capital’s profitability information with respect to providing services to each Fund Wells Capital
38 | Wells Fargo Fundamental Small Cap Growth Fund
Board considerations (unaudited)
sub-advises and other funds in the family was subsumed in the WFAM and Wells Fargo profitability analysis. The Board did not consider profitability with respect to C&B, as the sub-advisory fees paid to C&B had been negotiated by Funds Management on an arm’s-length basis.
Funds Management reported on the methodologies and estimates used in calculating profitability in connection with the 2021 Annual Approval Process, including a description of the methodology used to allocate certain expenses. Among other things, the Board noted that the levels of profitability reported on a fund-by-fund basis varied widely, depending on factors such as the size, type and age of fund.
In connection with the New Agreement Approval Process, the Board received certain information about NewCo’s projected financial condition, and reviewed with senior representatives of Funds Management, GTCR and Reverence Capital the underlying assumptions on which such information was based. The Board considered that NewCo is a newly formed entity, with no historical operations, revenues or expenses, and that it is difficult to predict with any degree of certainty the future profitability of NewCo and the Advisers from advisory activities under the New Agreements. The Board considered that the fee rates payable under the New Agreements will not increase as a result of the Transaction as compared to the rates under the Current Agreements, and that the current contractual expense limitations applicable to each Fund will not increase. The Board noted that if the New Agreements are approved by shareholders and the Transaction closes, the Board will have the opportunity in the future to review the profitability of NewCo and the Advisers from advisory activities under the New Agreements.
Economies of scale
In connection with the 2021 Annual Approval Process, the Board received and considered information about the potential for Funds Management to experience economies of scale in the provision of management services to the Funds, the difficulties of calculating economies of scale at an individual fund level, and the extent to which potential scale benefits are shared with Fund shareholders. The Board noted the existence of breakpoints in each Fund’s management fee structure, which operate generally to reduce the Fund’s expense ratios as the Fund grows in size, and the size of the Fund in relation to such breakpoints. The Board considered that, in addition to management fee breakpoints, Funds Management shares potential economies of scale from its management business in a variety of ways, including through fee waiver and expense reimbursement arrangements, competitive management fee rates set at the outset without regard to breakpoints, and investments in the business intended to enhance services available to shareholders.
In connection with the New Agreement Approval Process, the Board noted that NewCo and the Advisers may benefit from possible growth of the Funds resulting from enhanced distribution capabilities. However, the Board noted that other factors could also affect the potential for economies of scale, and that it was not possible to quantify any potential future economies of scale. Based upon the information furnished to the Board in connection with the 2021 Annual Approval Process and the New Agreement Approval Process, the Board concluded that Funds Management’s arrangements with respect to each Fund, including contractual breakpoints and expense limitation arrangements, constituted a reasonable approach to sharing potential economies of scale with the Fund and its shareholders.
“Fall-out” benefits to Funds Management and the Sub-Advisers
In connection with the 2021 Annual Approval Process, the Board received and considered information regarding potential “fall-out” or ancillary benefits received by Funds Management and its affiliates, including Wells Capital, and C&B as a result of their relationships with the Funds. Ancillary benefits could include, among others, benefits directly attributable to other relationships with the Funds and benefits potentially derived from an increase in Funds Management’s and the Sub-Advisers’ business as a result of their relationships with the Funds. The Board noted that various current affiliates of Funds Management may receive distribution-related fees, shareholder servicing payments and sub-transfer agency fees in respect of shares sold or held through them and services provided.
In connection with the 2021 Annual Approval Process, the Board also reviewed information about soft dollar credits earned and utilized by the Sub-Advisers, fees earned by Funds Management and Wells Capital from managing a private investment vehicle for the fund family’s securities lending collateral, and commissions earned by an affiliated broker of Wells Fargo from portfolio transactions.
In connection with the New Agreement Approval Process, the Board received information to the effect that the Transaction is not expected to have a material impact on the fall-out benefits currently realized by Funds Management and its affiliates, including Wells Capital, and C&B. The information reviewed by the Board also noted that several of the ancillary benefits identified for WFAM would be potential ancillary benefits for NewCo, including that the scale and reputation of the Funds might benefit NewCo’s broader reputation, product initiatives, technology investment and talent acquisition. Based on its consideration of the
Wells Fargo Fundamental Small Cap Growth Fund | 39
Board considerations (unaudited)
factors and information it deemed relevant, including those described here, the Board did not find that any ancillary benefits expected to be received by Funds Management and its affiliates, including NewCo and Wells Capital, and C&B under the New Agreements were unreasonable.
Conclusion
At the Board Meeting, after considering the above-described factors and based on its deliberations and its evaluation of the information described above, the Board unanimously determined that the compensation payable to Funds Management and to each of the Sub-Advisers under the New Agreements is reasonable, approved the New Agreements for a two-year term, and voted to recommend that Fund shareholders approve the New Agreements.
40 | Wells Fargo Fundamental Small Cap Growth Fund
Board considerations (unaudited)
Board Considerations - Interim Agreements
At a meeting held on May 17-19, 2021 (the “Board Meeting”), the Boards of Trustees (each, a “Board”, and collectively, the “Boards”) of Wells Fargo Funds Trust, Wells Fargo Master Trust, Wells Fargo Variable Trust, Wells Fargo Global Dividend Opportunity Fund, Wells Fargo Income Opportunities Fund, Wells Fargo Multi-Sector Income Fund and Wells Fargo Utilities and High Income Fund (each a “Trust”, and the series thereof, a “Fund”) reviewed and approved for the Trusts and Funds, as applicable: (i) interim investment management agreements (the “Interim Management Agreements”) with Wells Fargo Funds Management, LLC (“Funds Management”); (ii) interim investment advisory agreements (the “Interim Advisory Agreements”) with Funds Management; and (iii) interim sub-advisory agreements (the “Interim Sub-Advisory Agreements”) with each of Cooke & Bieler, L.P., Galliard Capital Management LLC (“Galliard”), Peregrine Capital Management Inc., Wells Capital Management, LLC (“WellsCap”), and Wells Fargo Asset Management (International) Limited (“WFAMI”, and collectively, the “Sub-Advisers”). Each Trustee on the Board is not an “interested person” (as defined in the Investment Company Act of 1940 (the “1940 Act”) of the Funds (collectively, the “Independent Trustees”). The Interim Management Agreements, Interim Advisory Agreements, and Interim Sub-Advisory Agreements are collectively referred to as the “Interim Advisory Agreements.”
At the Board Meeting, the Boards reviewed and approved the continuation of existing investment management, advisory and sub-advisory agreements (the “Current Advisory Agreements”) for each Trust and Fund, as applicable. The factors considered and conclusions reached by the Boards in approving the Current Advisory Agreements are summarized in the section entitled “Board Considerations – Current Agreements” of this shareholder report. The Boards noted that Wells Fargo & Company has entered into a definitive agreement to sell Wells Fargo Asset Management (“WFAM”), which includes Funds Management, Galliard, WellsCap and WFAMI (the “Affiliated Sub-Advisers”), to a holding company affiliated with private funds of GTCR LLC and Reverence Capital Partners, L.P. (the “Transaction”). The Boards further noted that the Transaction would result in a change-of-control of Funds Management and the Affiliated Sub-Advisers, which would be considered to be an “assignment” under the 1940 Act that would terminate the Current Advisory Agreements. At the Board Meeting, the Boards also reviewed and approved new investment management, advisory and sub-advisory agreements (the “New Advisory Agreements”) for each Trust and Fund, as applicable, that would replace the Current Advisory Agreements upon consummation of the Transaction, subject to approval of the New Advisory Agreements by the applicable Trust’s or Fund’s shareholders. The factors considered and conclusions reached by the Boards in approving the New Advisory Agreements are summarized in the section entitled “Board Considerations – New Agreements” of this shareholder report.
At the Board Meeting, the Boards also approved the Interim Advisory Agreements, which will go into effect for a Trust or Fund only in the event that shareholders of such Trust or Fund do not approve the New Advisory Agreement(s) for the Trust or Fund by the closing date of the Transaction, when the Current Advisory Agreements will terminate. The Board noted that, in such a circumstance, the Interim Advisory Agreements will permit continuity of management by allowing Funds Management and the Sub-Advisers to continue providing services to the Trust or Fund pursuant to the Interim Advisory Agreements while the Trust or Fund continues to solicit shareholder approval of such New Advisory Agreement(s). The Boards noted that the terms of the Interim Advisory Agreements are identical to those of the Current Advisory Agreements, except for the term and the addition of escrow provisions with respect to the advisory fees. The Boards also noted that the entities that would service the Funds and Trusts under the Interim Advisory Agreements are identical to those that provide services under the Current Advisory Agreements and those that will provide services under the New Advisory Agreements.
In approving the Interim Advisory Agreements, the Boards considered the same factors and reached the same conclusions as they considered and reached with respect to the Boards’ approvals of the Current Advisory Agreements and New Advisory Agreements, as applicable, which are described in separate Board Consideration sections within this shareholder report. Prior to the Board Meeting, including at a series of meetings held in April and May 2021, the Trustees conferred extensively among themselves and with senior representatives of Funds Management, GTCR LLC and Reverence Capital Partners, L.P. about the Interim Advisory Agreements and related matters. The Independent Trustees were assisted in their evaluation of the Interim Advisory Agreements by independent legal counsel, from whom they received separate legal advice and with whom they met separately.
At the Board Meeting, after considering the factors and reaching the conclusions described in the separate Board Consideration sections within this shareholder report, the Boards unanimously determined that the compensation payable to Funds Management and to each Sub-Adviser under each of the Interim Advisory Agreements was reasonable, and approved the Interim Advisory Agreements.
Wells Fargo Fundamental Small Cap Growth Fund | 41
For more information
More information about Wells Fargo Funds is available free upon request. To obtain literature, please write, visit the Fund's website, or call:
Wells Fargo Funds
P.O. Box 219967
Kansas City, MO 64121-9967
Website: allspringglobal.com
Individual investors: 1-800-222-8222
Retail investment professionals: 1-888-877-9275
Institutional investment professionals: 1-866-765-0778
This report and the financial statements contained herein are submitted for the general information of the shareholders of the Fund. If this report is used for promotional purposes, distribution of the report must be accompanied or preceded by a current prospectus. Before investing, please consider the investment objectives, risks, charges, and expenses of the investment. For a current prospectus and, if available, a summary prospectus, containing this information, call
1-800-222-8222 or visit the Fund's website at allspringglobal.com. Read the prospectus carefully before you invest or send money.
Allspring Global InvestmentsTM is the trade name for the asset management firms of Allspring Global Investments Holdings, LLC, a holding company indirectly owned by certain private funds of GTCR LLC and Reverence Capital Partners, L.P. These firms include but are not limited to Allspring Global Investments, LLC, and Allspring Funds Management, LLC. Certain products managed by Allspring entities are distributed by Allspring Funds Distributor, LLC (a broker-dealer and Member FINRA/SIPC).
This material is for general informational and educational purposes only and is NOT intended to provide investment advice or a recommendation of any kind - including a recommendation for any specific investment, strategy, or plan.
© 2021 Allspring Global Investments. All rights reserved.
PAR-1121-00201 09-21
SA247/SAR247 09-21
Semi-Annual Report
September 30, 2021
Wells Fargo Small Cap Fund
The views expressed and any forward-looking statements are as of September 30, 2021, unless otherwise noted, and are those of the Fund's portfolio managers and/or Allspring Global Investments. Discussions of individual securities or the markets generally are not intended as individual recommendations. Future events or results may vary significantly from those expressed in any forward-looking statements. The views expressed are subject to change at any time in response to changing circumstances in the market. Allspring Global Investments disclaims any obligation to publicly update or revise any views expressed or forward-looking statements.
Wells Fargo Small Cap Fund | 1
Letter to shareholders (unaudited)
Andrew Owen
President
Wells Fargo Funds
Dear Shareholder:
We are pleased to offer you this semi-annual report for Wells Fargo Small Cap Fund for the six-month period that ended September 30, 2021. Global stocks continued to rally as the global economy continued to emerge from the haze of COVID-19. Tailwinds were provided by global stimulus programs, a rapid vaccination rollout, and recovering consumer and corporate sentiment. Bonds were mixed during the period, with municipal bonds and high-yield bonds delivering positive returns.
For the six-month period, U.S. stocks, based on the S&P 500 Index,1 gained 9.18%. International stocks, as measured by the MSCI ACWI ex USA Index (Net),2 returned 2.32%, while the MSCI EM Index (Net),3 trailed its developed market counterparts with a 3.45% loss. Among bond indexes, the Bloomberg U.S. Aggregate Bond Index,4 returned 1.88%, the Bloomberg Global Aggregate ex-USD Index (unhedged),5 returned -0.69%, the Bloomberg Municipal Bond Index6 returned 1.15%, and the ICE BofA U.S. High Yield Index,7 gained 3.74%.
Vaccination rollout drove the stock markets to new highs.
Equity markets produced another strong showing in April. Domestically, the continued reopening of the economy had a strong impact on positive equity performance, as people started leaving their households and jobless claims continued to fall. Domestic corporate bonds performed well and the U.S. dollar weakened. Meanwhile, the U.S. government continued to seek to invest in the recovery, this time by outlining a package of over $2 trillion to improve infrastructure. The primary headwind in April was inflation, as investors tried to determine the breadth and longevity of recent price increases. Developed Europe has been supported by a meaningful increase in the pace of vaccinations. Unfortunately many emerging market countries have not been as successful. India in particular saw COVID-19 cases surge, serving as an example of the need to get vaccinations rolled out to less developed nations.
| 1 | The S&P 500 Index consists of 500 stocks chosen for market size, liquidity, and industry group representation. It is a market-value-weighted index with each stock's weight in the index proportionate to its market value. You cannot invest directly in an index. |
| 2 | The Morgan Stanley Capital International (MSCI) All Country World Index (ACWI) ex USA Index (Net) is a free-float-adjusted market-capitalization-weighted index that is designed to measure the equity market performance of developed and emerging markets, excluding the U.S. Source: MSCI. MSCI makes no express or implied warranties or representations and shall have no liability whatsoever with respect to any MSCI data contained herein. The MSCI data may not be further redistributed or used as a basis for other indexes or any securities or financial products. This report is not approved, reviewed, or produced by MSCI. You cannot invest directly in an index. |
| 3 | The MSCI Emerging Markets (EM) Index (Net) is a free-float-adjusted market-capitalization-weighted index that is designed to measure equity market performance of emerging markets. You cannot invest directly in an index. |
| 4 | The Bloomberg U.S. Aggregate Bond Index is a broad-based benchmark that measures the investment-grade, U.S.-dollar-denominated, fixed-rate taxable bond market, including Treasuries, government-related and corporate securities, mortgage-backed securities (agency fixed-rate and hybrid adjustable-rate mortgage pass-throughs), asset-backed securities, and commercial mortgage-backed securities. You cannot invest directly in an index. |
| 5 | The Bloomberg Global Aggregate ex-USD Index (unhedged) is an unmanaged index that provides a broad-based measure of the global investment-grade fixed-income markets excluding the U.S.-dollar-denominated debt market. You cannot invest directly in an index. |
| 6 | The Bloomberg Municipal Bond Index is an unmanaged index composed of long-term tax-exempt bonds with a minimum credit rating of Baa. You cannot invest directly in an index. |
| 7 | The ICE BofA U.S. High Yield Index is a market-capitalization-weighted index of domestic and Yankee high-yield bonds. The index tracks the performance of high-yield securities traded in the U.S. bond market. You cannot invest directly in an index. Copyright 2021. ICE Data Indices, LLC. All rights reserved. |
2 | Wells Fargo Small Cap Fund
Letter to shareholders (unaudited)
Vaccine rollouts continued in May, leading to loosened restrictions globally. As a result, equity markets in general saw a minor increase in returns. Concerns that the continued economic rebound could result in inflation increases becoming more than transitory were supported by the higher input costs businesses were experiencing. Meanwhile, those inflation concerns were tempered by the U.S. Federal Reserve (Fed), which stayed steady on its view of the economy and eased fears of a sudden and substantial policy change. Positive performance in the emerging market equity space was supported this month by steady consumer demand and strong commodity prices. Fixed-income markets were also slightly positive for the month, driven by inflation uncertainty and a softer U.S. dollar.
June witnessed the S&P 500 Index reach a new all-time high. 2021 economic growth and inflation forecasts were revised higher to reflect a strong economic recovery and some supply and demand imbalances. Late June saw a deal reached on a U.S. infrastructure package of approximately $1 trillion for road, bridge, and broadband network upgrades over the next eight years. The Fed’s June meeting yielded no change to policy, but its projections pointed to a possible interest rate rise in 2023. This, combined with a rebound in economic activity and investors searching for yield, led to U.S. Treasury yields being down for the month. Many European and Asian countries saw vaccination momentum increase, while the U.K. dealt with a rise in COVID-19 infections, specifically the Delta variant. Meanwhile, crude oil jumped over 10% in June on the back of the pickup in global economic activity and the Organization of the Petroleum Exporting Countries’ (OPEC) slow pace of supply growth.
July began the month seeing vaccinations making progress, as several major developed countries eased restrictions, only to be threatened again by the spread of COVID-19’s Delta variant. Inflation continued to climb, aided by the continued supply bottleneck in the face of high demand. As it pertains to the equity area of the market, U.S. equities led the way in positive return territory, followed by international developed markets. In contrast, emerging markets were well in negative territory for the month, hindered by China’s plans for new regulations on a number of sectors, specifically education and technology. The U.S. 10-Year Treasury bond yield continued to decline, as strong demand swallowed up supply. After hitting a multi-year high earlier in the month, oil prices leveled off following an agreement by OPEC to raise oil production starting in August.
The Delta variant of COVID-19 produced outbreaks globally in August, increasing the potential for increased market volatility and bringing into question the ongoing economic recovery. Domestically, the U.S. economy continued to stay strong in the face of the Delta variant, continued inflationary pressures, and worries over Hurricane Ida. Emerging market equities experienced elevated volatility, largely influenced by China’s regulatory stance. Emerging market equities started the month with poor performance but rebounded to end the month in positive territory. Municipal debt experienced its first monthly performance drop since February of this year, slowing a rally that made it one of the best-performing sectors of the bond market. In the commodity segment of the market, crude oil fell sharply during the month on the back of dampened expectations as a result of the Delta variant but was still a leading asset class performer for the year.
Global markets suffered their broadest retreat in a year during September, with the exception of commodities. Concerns over inflation and the interest rate outlook depressed investor confidence and hurt performance. Emerging markets declined on concerns over the continued supply chain disruptions and worries over higher energy and food prices. Meanwhile, the Fed indicated it would slow the pace of asset purchases in the near future (pointing towards November). All eyes domestically are fixed on the raising of the debt ceiling, the 2022 budget plan, and the ongoing debate over the infrastructure package. Contrary to most asset classes, commodities thrived in September, driven by sharply higher energy prices.
“ 2021 economic growth and inflation forecasts were revised higher to reflect a strong economic recovery and some supply and demand imbalances.”
“ Municipal debt experienced its first monthly performance drop since February of this year, slowing a rally that made it one of the best-performing sectors of the bond market.”
Wells Fargo Small Cap Fund | 3
Letter to shareholders (unaudited)
Don’t let short-term uncertainty derail long-term investment goals.
Periods of investment uncertainty can present challenges, but experience has taught us that maintaining long-term investment goals can be an effective way to plan for the future. To help you create a sound strategy based on your personal goals and risk tolerance, Wells Fargo Funds offers more than 100 mutual funds spanning a wide range of asset classes and investment styles. Although diversification cannot guarantee an investment profit or prevent losses, we believe it can be an effective way to manage investment risk and potentially smooth out overall portfolio performance. We encourage investors to know their investments and to understand that appropriate levels of risk-taking may unlock opportunities.
On November 1, 2021, GTCR LLC and Reverence Capital Partners, L.P., announced the beginning of Allspring Global Investments™, with the close of the transaction to acquire Wells Fargo Funds Management, LLC; Wells Capital Management LLC; Galliard Capital Management LLC.; Wells Fargo Asset Management (International) Ltd.; Wells Fargo Asset Management Luxembourg S.A.; and Wells Fargo Funds Distributor, LLC, as well as Wells Fargo Bank, N.A.’s business of acting as trustee to its collective investment trusts and all related Wells Fargo Asset Management legal entities. The transaction closed on November 1, 2021, forming Allspring Global Investments, LLC, a privately held asset management firm with $587 billion in AUM1 as of September 30, 2021.
Allspring Global Investments™ is a leading independent asset management firm with a full breadth of investment capabilities across diverse asset classes, serving the needs of its institutional and wealth management clients around the world. Allspring operates across 18 offices globally supported by more than 480 investment professionals. Allspring and its investment teams provide a broad range of differentiated investment products and solutions to help its diverse range of clients meet their investment objectives.
As part of this transition, all mutual funds within the Wells Fargo Funds family will be rebranded as Allspring Funds. Each individual fund will have “Wells Fargo” removed from its fund name to be replaced with “Allspring.” The fund name changes are expected to take place on December 6, 2021.
Allspring Global Investments is the trade name for the asset management firms of Allspring Global Investments Holdings, LLC, a holding company indirectly owned by certain private funds of GTCR LLC and Reverence Capital Partners, L.P.
Thank you for choosing to invest with Wells Fargo Funds. We appreciate your confidence in us and remain committed to helping you meet your financial needs.
Sincerely,
Andrew Owen
President
Wells Fargo Funds
For further information about your Fund, contact your investment professional, visit our website at allspringglobal.com, or call us directly at 1-800-222-8222.
| 1 | As of September 30, 2021, assets under management (AUM) includes $93 billion from Galliard Capital Management, an investment advisor that is not part of the Allspring trade name/GIPS firm. |
4 | Wells Fargo Small Cap Fund
This page is intentionally left blank.
Performance highlights (unaudited)
| Investment objective | The Fund seeks long-term capital appreciation. |
| Manager | Allspring Funds Management, LLC |
| Subadviser | Allspring Global Investments, LLC |
| Portfolio managers | Christopher G. Miller, CFA®‡, Theran Motl, CFA®‡ |
| Average annual total returns (%) as of September 30, 2021 |
| | | Including sales charge | | Excluding sales charge | | Expense ratios1 (%) |
| | Inception date | 1 year | 5 year | 10 year | | 1 year | 5 year | 10 year | | Gross | Net 2 |
| Class A (WFSMX) | 3-31-2008 | 40.12 | 9.29 | 12.81 | | 48.67 | 10.59 | 13.48 | | 1.69 | 1.24 |
| Class C (WSCDX) | 3-31-2008 | 46.47 | 9.76 | 12.62 | | 47.47 | 9.76 | 12.62 | | 2.44 | 1.99 |
| Class R6 (WFSJX)3 | 5-29-2020 | – | – | – | | 49.45 | 11.02 | 13.94 | | 1.26 | 0.81 |
| Administrator Class (WFSDX) | 4-8-2005 | – | – | – | | 48.75 | 10.74 | 13.67 | | 1.61 | 1.16 |
| Institutional Class (WFSSX) | 4-8-2005 | – | – | – | | 49.13 | 10.97 | 13.91 | | 1.36 | 0.91 |
| Russell 2000® Index4 | – | – | – | – | | 47.68 | 13.45 | 14.63 | | – | – |
Figures quoted represent past performance, which is no guarantee of future results, and do not reflect taxes that a shareholder may pay on an investment in a fund. Investment return and principal value of an investment will fluctuate so that an investor’s shares, when redeemed, may be worth more or less than their original cost. Performance shown without sales charges would be lower if sales charges were reflected. Current performance may be lower or higher than the performance data quoted, which assumes the reinvestment of dividends and capital gains. Current month-end performance is available on the Fund’s website, allspringglobal.com.
Please keep in mind that high double-digit returns were primarily achieved during favorable market conditions. You should not expect that such favorable returns can be consistently achieved. A fund’s performance, especially for short time periods, should not be the sole factor in making your investment decision.
Index returns do not include transaction costs associated with buying and selling securities, any mutual fund fees or expenses, or any taxes. It is not possible to invest directly in an index.
For Class A shares, the maximum front-end sales charge is 5.75%. For Class C shares, the maximum contingent deferred sales charge is 1.00%. Performance including a contingent deferred sales charge assumes the sales charge for the corresponding time period. Class R6, Administrator Class and Institutional Class shares are sold without a front-end sales charge or contingent deferred sales charge.
| 1 | Reflects the expense ratios as stated in the most recent prospectuses, which include the impact of 0.01% in acquired fund fees and expenses. The expense ratios shown are subject to change and may differ from the annualized expense ratios shown in the financial highlights of this report, which do not include acquired fund fees and expenses. |
| 2 | The manager has contractually committed through July 31, 2022, to waive fees and/or reimburse expenses to the extent necessary to cap total annual fund operating expenses after fee waivers at 1.23% for Class A, 1.98% for Class C, 0.80% for Class R6, 1.15% for Administrator Class, and 0.90% for Institutional Class. Brokerage commissions, stamp duty fees, interest, taxes, acquired fund fees and expenses (if any), and extraordinary expenses are excluded from the expense caps. Prior to or after the commitment expiration date, the caps may be increased or the commitment to maintain the caps may be terminated only with the approval of the Board of Trustees. Without these caps, the Fund’s returns would have been lower. The expense ratio paid by an investor is the net expense ratio (the total annual fund operating expenses after fee waivers) as stated in the prospectuses. |
| 3 | Historical performance shown for the Class R shares prior to their inception reflects the performance of the Institutional Class shares adjusted to reflect the higher expenses applicable to the Class R shares. |
| 4 | The Russell 2000® Index measures the performance of the 2,000 smallest companies in the Russell 3000® Index, which represents approximately 8% of the total market capitalization of the Russell 3000® Index. You cannot invest directly in an index. |
Stock values fluctuate in response to the activities of individual companies and general market and economic conditions. Smaller company stocks tend to be more volatile and less liquid than those of larger companies. Certain investment strategies tend to increase the total risk of an investment (relative to the broader market). Consult the Fund’s prospectus for additional information on these and other risks.
| ‡ | CFA® and Chartered Financial Analyst® are trademarks owned by CFA Institute. |
6 | Wells Fargo Small Cap Fund
Performance highlights (unaudited)
| Ten largest holdings (%) as of September 30, 20211 |
| LivaNova plc | 2.27 |
| CoreSite Realty Corporation | 2.00 |
| Integer Holdings Corporation | 1.98 |
| Masonite International Corporation | 1.96 |
| Atkore International Incorporated | 1.83 |
| Quaker Chemical Corporation | 1.80 |
| National Vision Holdings Incorporated | 1.75 |
| Macom Technology Solutions Holdings Incorporated | 1.60 |
| Air Lease Corporation | 1.60 |
| Ashland Global Holdings Incorporated | 1.59 |
| 1 | Figures represent the percentage of the Fund's net assets. Holdings are subject to change and may have changed since the date specified. |
| Sector allocation as of September 30, 20211 |
| 1 | Figures represent the percentage of the Fund's long-term investments. These amounts are subject to change and may have changed since the date specified. |
Wells Fargo Small Cap Fund | 7
Fund expenses (unaudited)
As a shareholder of the Fund, you incur two types of costs: (1) transaction costs, including sales charges (loads) on purchase payments and contingent deferred sales charges (if any) on redemptions and (2) ongoing costs, including management fees, distribution (12b-1) and/or shareholder servicing fees, and other Fund expenses. This example is intended to help you understand your ongoing costs (in dollars) of investing in the Fund and to compare these costs with the ongoing costs of investing in other mutual funds.
The example is based on an investment of $1,000 invested at the beginning of the six-month period and held for the entire period from April 1, 2021 to September 30, 2021.
Actual expenses
The “Actual” line of the table below provides information about actual account values and actual expenses. You may use the information in this line, together with the amount you invested, to estimate the expenses that you paid over the period. Simply divide your account value by $1,000 (for example, an $8,600 account value divided by $1,000 = 8.6), then multiply the result by the number in the “Actual” line under the heading entitled “Expenses paid during period” for your applicable class of shares to estimate the expenses you paid on your account during this period.
Hypothetical example for comparison purposes
The “Hypothetical” line of the table below provides information about hypothetical account values and hypothetical expenses based on the Fund’s actual expense ratio and an assumed rate of return of 5% per year before expenses, which is not the Fund’s actual return. The hypothetical account values and expenses may not be used to estimate the actual ending account balance or expenses you paid for the period. You may use this information to compare the ongoing costs of investing in the Fund and other funds. To do so, compare this 5% hypothetical example with the 5% hypothetical examples that appear in the shareholder reports of the other funds.
Please note that the expenses shown in the table are meant to highlight your ongoing costs only and do not reflect any transactional costs, such as sales charges (loads) and contingent deferred sales charges. Therefore, the “Hypothetical” line of the table is useful in comparing ongoing costs only, and will not help you determine the relative total costs of owning different funds. In addition, if these transactional costs were included, your costs would have been higher.
| | Beginning
account value
4-1-2021 | Ending
account value
9-30-2021 | Expenses
paid during
the period1 | Annualized net
expense ratio |
| Class A | | | | |
| Actual | $1,000.00 | $1,044.21 | $ 6.25 | 1.22% |
| Hypothetical (5% return before expenses) | $1,000.00 | $1,018.95 | $ 6.17 | 1.22% |
| Class C | | | | |
| Actual | $1,000.00 | $1,039.75 | $10.12 | 1.98% |
| Hypothetical (5% return before expenses) | $1,000.00 | $1,015.14 | $10.00 | 1.98% |
| Class R6 | | | | |
| Actual | $1,000.00 | $1,046.38 | $ 4.10 | 0.80% |
| Hypothetical (5% return before expenses) | $1,000.00 | $1,021.06 | $ 4.05 | 0.80% |
| Administrator Class | | | | |
| Actual | $1,000.00 | $1,044.48 | $ 5.89 | 1.15% |
| Hypothetical (5% return before expenses) | $1,000.00 | $1,019.30 | $ 5.82 | 1.15% |
| Institutional Class | | | | |
| Actual | $1,000.00 | $1,045.81 | $ 4.62 | 0.90% |
| Hypothetical (5% return before expenses) | $1,000.00 | $1,020.56 | $ 4.56 | 0.90% |
1 Expenses paid is equal to the annualized net expense ratio of each class multiplied by the average account value over the period, multiplied by the number of days in the most recent fiscal half-year divided by the number of days in the fiscal year (to reflect the one-half-year period).
8 | Wells Fargo Small Cap Fund
Portfolio of investments—September 30, 2021 (unaudited)
| | | | | Shares | Value |
| Common stocks: 98.38% | | | | | |
| Communication services: 1.14% | | | | | |
| Interactive media & services: 1.14% | | | | | |
| Eventbrite Incorporated Class A † | | | | 32,565 | $ 615,804 |
| Consumer discretionary: 10.74% | | | | | |
| Auto components: 2.23% | | | | | |
| Dana Incorporated | | | | 26,060 | 579,574 |
| Gentherm Incorporated † | | | | 7,792 | 630,607 |
| | | | | | 1,210,181 |
| Diversified consumer services: 2.48% | | | | | |
| Houghton Mifflin Harcourt Company † | | | | 39,899 | 535,844 |
| Service Corporation International | | | | 13,470 | 811,702 |
| | | | | | 1,347,546 |
| Hotels, restaurants & leisure: 1.90% | | | | | |
| Jack In The Box Incorporated | | | | 6,518 | 634,397 |
| Planet Fitness Incorporated Class A † | | | | 5,042 | 396,049 |
| | | | | | 1,030,446 |
| Internet & direct marketing retail: 2.38% | | | | | |
| Revolve Group Incorporated † | | | | 13,524 | 835,377 |
| The RealReal Incorporated † | | | | 34,579 | 455,751 |
| | | | | | 1,291,128 |
| Specialty retail: 1.75% | | | | | |
| National Vision Holdings Incorporated † | | | | 16,698 | 947,945 |
| Consumer staples: 5.42% | | | | | |
| Food products: 3.63% | | | | | |
| Nomad Foods Limited † | | | | 25,939 | 714,879 |
| The Simply Good Foods Company † | | | | 22,559 | 778,060 |
| TreeHouse Foods Incorporated † | | | | 11,952 | 476,646 |
| | | | | | 1,969,585 |
| Personal products: 1.79% | | | | | |
| e.l.f. Beauty Incorporated † | | | | 22,903 | 665,332 |
| The Honest Company Incorporated †« | | | | 29,453 | 305,722 |
| | | | | | 971,054 |
| Financials: 13.46% | | | | | |
| Banks: 6.58% | | | | | |
| Ameris Bancorp | | | | 9,016 | 467,750 |
| Pinnacle Financial Partners Incorporated | | | | 6,932 | 652,163 |
| Sterling Bancorp | | | | 19,391 | 483,999 |
| United Community Bank | | | | 11,934 | 391,674 |
| Veritex Holdings Incorporated | | | | 16,298 | 641,489 |
| Webster Financial Corporation | | | | 10,591 | 576,786 |
| Wintrust Financial Corporation | | | | 4,414 | 354,753 |
| | | | | | 3,568,614 |
The accompanying notes are an integral part of these financial statements.
Wells Fargo Small Cap Fund | 9
Portfolio of investments—September 30, 2021 (unaudited)
| | | | | Shares | Value |
| Capital markets: 1.02% | | | | | |
| Raymond James Financial Incorporated | | | | 6,026 | $ 556,033 |
| Insurance: 4.36% | | | | | |
| Axis Capital Holdings Limited | | | | 15,502 | 713,712 |
| CNO Financial Group Incorporated | | | | 19,424 | 457,241 |
| First American Financial Corporation | | | | 7,915 | 530,701 |
| Reinsurance Group of America Incorporated | | | | 5,974 | 664,667 |
| | | | | | 2,366,321 |
| Thrifts & mortgage finance: 1.50% | | | | | |
| Essent Group Limited | | | | 18,469 | 812,821 |
| Health care: 15.03% | | | | | |
| Biotechnology: 2.80% | | | | | |
| Agios Pharmaceuticals Incorporated † | | | | 3,485 | 160,833 |
| Arena Pharmaceuticals Incorporated † | | | | 3,633 | 216,345 |
| Atara Biotherapeutics Incorporated † | | | | 6,615 | 118,409 |
| Coherus Biosciences Incorporated † | | | | 9,778 | 157,132 |
| Insmed Incorporated † | | | | 9,052 | 249,292 |
| Mirati Therapeutics Incorporated † | | | | 859 | 151,966 |
| Neurocrine Biosciences Incorporated † | | | | 2,625 | 251,764 |
| Sage Therapeutics Incorporated † | | | | 2,402 | 106,433 |
| Zymeworks Incorporated † | | | | 3,728 | 108,261 |
| | | | | | 1,520,435 |
| Health care equipment & supplies: 9.05% | | | | | |
| AngioDynamics Incorporated † | | | | 29,576 | 767,201 |
| Haemonetics Corporation † | | | | 6,675 | 471,188 |
| Integer Holdings Corporation † | | | | 11,999 | 1,071,991 |
| LivaNova plc † | | | | 15,574 | 1,233,305 |
| Mesa Laboratories Incorporated | | | | 563 | 170,229 |
| Neuronetics Incorporated † | | | | 27,304 | 179,114 |
| Teleflex Incorporated | | | | 1,265 | 476,336 |
| ViewRay Incorporated † | | | | 75,157 | 541,882 |
| | | | | | 4,911,246 |
| Health care providers & services: 0.89% | | | | | |
| HealthEquity Incorporated † | | | | 7,444 | 482,073 |
| Health care technology: 0.36% | | | | | |
| Schrodinger Incorporated † | | | | 3,507 | 191,763 |
| Life sciences tools & services: 1.93% | | | | | |
| Bruker Corporation | | | | 9,718 | 758,976 |
| Codexis Incorporated † | | | | 12,441 | 289,378 |
| | | | | | 1,048,354 |
| Industrials: 19.14% | | | | | |
| Building products: 6.63% | | | | | |
| Armstrong World Industries Incorporated | | | | 8,114 | 774,644 |
| Masonite International Corporation † | | | | 10,011 | 1,062,467 |
| Rexnord Corporation | | | | 13,207 | 849,078 |
The accompanying notes are an integral part of these financial statements.
10 | Wells Fargo Small Cap Fund
Portfolio of investments—September 30, 2021 (unaudited)
| | | | | Shares | Value |
| Building products (continued) | | | | | |
| Tecnoglass Incorporated | | | | 12,812 | $ 278,405 |
| The AZEK Company Incorporated † | | | | 17,257 | 630,398 |
| | | | | | 3,594,992 |
| Commercial services & supplies: 2.42% | | | | | |
| Steelcase Incorporated Class A | | | | 40,978 | 519,601 |
| Stericycle Incorporated † | | | | 11,709 | 795,861 |
| | | | | | 1,315,462 |
| Construction & engineering: 1.57% | | | | | |
| APi Group Corporation † | | | | 41,946 | 853,601 |
| Electrical equipment: 1.83% | | | | | |
| Atkore International Incorporated † | | | | 11,424 | 992,974 |
| Machinery: 2.47% | | | | | |
| Albany International Corporation Class A | | | | 7,238 | 556,385 |
| SPX Corporation † | | | | 14,631 | 782,027 |
| | | | | | 1,338,412 |
| Road & rail: 1.13% | | | | | |
| Ryder System Incorporated | | | | 7,425 | 614,122 |
| Trading companies & distributors: 3.09% | | | | | |
| Air Lease Corporation | | | | 22,017 | 866,149 |
| Herc Holdings Incorporated † | | | | 4,962 | 811,089 |
| | | | | | 1,677,238 |
| Information technology: 20.44% | | | | | |
| Communications equipment: 0.53% | | | | | |
| Infinera Corporation † | | | | 34,387 | 286,100 |
| Electronic equipment, instruments & components: 2.27% | | | | | |
| Avnet Incorporated | | | | 13,288 | 491,257 |
| Littelfuse Incorporated | | | | 2,714 | 741,655 |
| | | | | | 1,232,912 |
| IT services: 3.54% | | | | | |
| EVO Payments Incorporated Class A † | | | | 30,774 | 728,728 |
| Paya Holdings Incorporated Class A † | | | | 38,750 | 421,213 |
| WNS Holdings Limited ADR † | | | | 9,399 | 768,838 |
| | | | | | 1,918,779 |
| Semiconductors & semiconductor equipment: 2.66% | | | | | |
| Brooks Automation Incorporated | | | | 5,619 | 575,105 |
| Macom Technology Solutions Holdings Incorporated † | | | | 13,364 | 866,923 |
| | | | | | 1,442,028 |
| Software: 11.44% | | | | | |
| 8x8 Incorporated † | | | | 26,790 | 626,617 |
| Benefitfocus Incorporated † | | | | 18,654 | 207,059 |
| CommVault Systems Incorporated † | | | | 7,264 | 547,052 |
| Instructure Holdings Incorporated †« | | | | 28,095 | 634,666 |
| Mimecast Limited † | | | | 12,174 | 774,266 |
| New Relic Incorporated † | | | | 4,328 | 310,621 |
The accompanying notes are an integral part of these financial statements.
Wells Fargo Small Cap Fund | 11
Portfolio of investments—September 30, 2021 (unaudited)
| | | | | Shares | Value |
| Software (continued) | | | | | |
| Pagerduty Incorporated † | | | | 16,435 | $ 680,738 |
| Q2 Holdings Incorporated † | | | | 6,717 | 538,300 |
| Riskfied Limited Class A †« | | | | 11,666 | 266,101 |
| SPS Commerce Incorporated † | | | | 4,805 | 775,095 |
| Zendesk Incorporated † | | | | 7,287 | 848,134 |
| | | | | | 6,208,649 |
| Materials: 6.99% | | | | | |
| Chemicals: 4.66% | | | | | |
| Ashland Global Holdings Incorporated | | | | 9,692 | 863,751 |
| Quaker Chemical Corporation | | | | 4,107 | 976,316 |
| Westlake Chemical Corporation | | | | 7,552 | 688,289 |
| | | | | | 2,528,356 |
| Containers & packaging: 1.32% | | | | | |
| Silgan Holdings Incorporated | | | | 18,727 | 718,368 |
| Metals & mining: 1.01% | | | | | |
| Reliance Steel & Aluminum Company | | | | 3,841 | 547,035 |
| Real estate: 6.02% | | | | | |
| Equity REITs: 6.02% | | | | | |
| American Homes 4 Rent Class A | | | | 20,204 | 770,176 |
| CoreSite Realty Corporation | | | | 7,845 | 1,086,846 |
| Four Corners Property Trust Incorporated | | | | 28,085 | 754,363 |
| Healthcare Realty Trust Incorporated | | | | 22,047 | 656,560 |
| | | | | | 3,267,945 |
| Total Common stocks (Cost $41,439,758) | | | | | 53,378,322 |
| | | | | | |
| Investment companies: 1.06% | | | | | |
| Exchange-traded funds: 1.06% | | | | | |
| SPDR S&P Biotech ETF « | | | | 4,580 | 575,752 |
| Total Investment companies (Cost $698,962) | | | | | 575,752 |
| | | Yield | | | |
| Short-term investments: 1.69% | | | | | |
| Investment companies: 1.69% | | | | | |
| Securities Lending Cash Investments LLC ♠∩∞ | | 0.02% | | 583,950 | 583,950 |
| Wells Fargo Government Money Market Fund Select Class ♠∞ | | 0.03 | | 329,910 | 329,910 |
| Total Short-term investments (Cost $913,860) | | | | | 913,860 |
| Total investments in securities (Cost $43,052,580) | 101.13% | | | | 54,867,934 |
| Other assets and liabilities, net | (1.13) | | | | (612,069) |
| Total net assets | 100.00% | | | | $54,255,865 |
The accompanying notes are an integral part of these financial statements.
12 | Wells Fargo Small Cap Fund
Portfolio of investments—September 30, 2021 (unaudited)
| † | Non-income earning security |
| « | All or a portion of this security is on loan. |
| ♠ | The issuer of the security is an affiliated person of the Fund as defined in the Investment Company Act of 1940. |
| ∩ | The investment is a non-registered investment company purchased with cash collateral received from securities on loan. |
| ∞ | The rate represents the 7-day annualized yield at period end. |
| Abbreviations: |
| ADR | American depositary receipt |
| REIT | Real estate investment trust |
Investments in affiliates
An affiliated investment is an investment in which the Fund owns at least 5% of the outstanding voting shares of the issuer or as a result of other relationships, such as the Fund and the issuer having the same investment manager. Transactions with issuers that were either affiliates of the Fund at the beginning of the period or the end of the period were as follows:
| | Value,
beginning of
period | Purchases | Sales
proceeds | Net
realized
gains
(losses) | | Net
change in
unrealized
gains
(losses) | | Value,
end of
period | Shares,
end
of period | Income
from
affiliated
securities |
| Short-term investments | | | | | | | | | |
| Securities Lending Cash Investments LLC | $668,925 | $9,259,670 | $(9,344,645) | $0 | | $0 | | $ 583,950 | 583,950 | $144 # |
| Wells Fargo Government Money Market Fund Select Class | 893,581 | 7,166,802 | (7,730,473) | 0 | | 0 | | 329,910 | 329,910 | 70 |
| | | | | $0 | | $0 | | $913,860 | | $214 |
| # | Amount shown represents income before fees and rebates. |
The accompanying notes are an integral part of these financial statements.
Wells Fargo Small Cap Fund | 13
Statement of assets and liabilities—September 30, 2021 (unaudited)
| | |
| Assets | |
Investments in unaffiliated securities (including $570,893 of securities loaned), at value (cost $42,138,720)
| $ 53,954,074 |
Investments in affiliated securites, at value (cost $913,860)
| 913,860 |
Receivable for dividends
| 20,595 |
Receivable for securities lending income, net
| 2,044 |
Receivable for Fund shares sold
| 236 |
Prepaid expenses and other assets
| 52,549 |
Total assets
| 54,943,358 |
| Liabilities | |
Payable upon receipt of securities loaned
| 583,950 |
Payable for Fund shares redeemed
| 46,471 |
Management fee payable
| 18,640 |
Administration fees payable
| 8,972 |
Distribution fee payable
| 41 |
Accrued expenses and other liabilities
| 29,419 |
Total liabilities
| 687,493 |
Total net assets
| $54,255,865 |
| Net assets consist of | |
Paid-in capital
| $ 30,254,749 |
Total distributable earnings
| 24,001,116 |
Total net assets
| $54,255,865 |
| Computation of net asset value and offering price per share | |
Net assets – Class A
| $ 46,571,240 |
Shares outstanding – Class A1
| 1,180,871 |
Net asset value per share – Class A
| $39.44 |
Maximum offering price per share – Class A2
| $41.85 |
Net assets – Class C
| $ 64,984 |
Shares outstanding – Class C1
| 1,827 |
Net asset value per share – Class C
| $35.57 |
Net assets – Class R6
| $ 963,444 |
Shares outstanding – Class R61
| 23,333 |
Net asset value per share – Class R6
| $41.29 |
Net assets – Administrator Class
| $ 444,551 |
Shares outstanding – Administrator Class1
| 11,007 |
Net asset value per share – Administrator Class
| $40.39 |
Net assets – Institutional Class
| $ 6,211,646 |
Shares outstanding – Institutional Class1
| 151,189 |
Net asset value per share – Institutional Class
| $41.09 |
| 1 | The Fund has an unlimited number of authorized shares |
| 2 | Maximum offering price is computed as 100/94.25 of net asset value. On investments of $50,000 or more, the offering price is reduced. |
The accompanying notes are an integral part of these financial statements.
14 | Wells Fargo Small Cap Fund
Statement of operations—six months ended September 30, 2021 (unaudited)
| | |
| Investment income | |
Dividends
| $ 207,724 |
Income from affiliated securities
| 6,347 |
Total investment income
| 214,071 |
| Expenses | |
Management fee
| 241,215 |
| Administration fees | |
Class A
| 49,957 |
Class C
| 116 |
Class R6
| 154 |
Administrator Class
| 321 |
Institutional Class
| 4,907 |
| Shareholder servicing fees | |
Class A
| 59,472 |
Class C
| 135 |
Administrator Class
| 617 |
| Distribution fee | |
Class C
| 403 |
Custody and accounting fees
| 7,027 |
Professional fees
| 24,963 |
Registration fees
| 33,965 |
Shareholder report expenses
| 19,787 |
Trustees’ fees and expenses
| 9,662 |
Other fees and expenses
| 3,990 |
Total expenses
| 456,691 |
| Less: Fee waivers and/or expense reimbursements | |
Fund-level
| (112,238) |
Class A
| (12,618) |
Class R6
| (127) |
Administrator Class
| (57) |
Institutional Class
| (573) |
Net expenses
| 331,078 |
Net investment loss
| (117,007) |
| Realized and unrealized gains (losses) on investments | |
Net realized gains on investments
| 4,495,054 |
Net change in unrealized gains (losses) on investments
| (1,535,322) |
Net realized and unrealized gains (losses) on investments
| 2,959,732 |
Net increase in net assets resulting from operations
| $ 2,842,725 |
The accompanying notes are an integral part of these financial statements.
Wells Fargo Small Cap Fund | 15
Statement of changes in net assets
| | | | | |
| | Six months ended
September 30, 2021
(unaudited) | Year ended
March 31, 2021 |
| Operations | | | | |
Net investment loss
| | $ (117,007) | | $ (84,156) |
Net realized gains on investments
| | 4,495,054 | | 8,195,099 |
Net change in unrealized gains (losses) on investments
| | (1,535,322) | | 22,426,580 |
Net increase in net assets resulting from operations
| | 2,842,725 | | 30,537,523 |
| Distributions to shareholders from | | | | |
| Net investment income and net realized gains | | | | |
Class A
| | 0 | | (35,117) |
Class R6
| | 0 | | (2,355) 1 |
Administrator Class
| | 0 | | (1,270) |
Institutional Class
| | 0 | | (55,258) |
Total distributions to shareholders
| | 0 | | (94,000) |
| Capital share transactions | Shares | | Shares | |
| Proceeds from shares sold | | | | |
Class A
| 18,003 | 713,632 | 53,590 | 1,610,309 |
Class C
| 2,123 | 76,244 | 566 | 16,703 |
Class R6
| 4,878 | 197,875 | 29,573 1 | 831,915 1 |
Administrator Class
| 1,222 | 49,111 | 2,281 | 76,786 |
Institutional Class
| 2,664 | 109,983 | 49,452 | 1,722,335 |
| | | 1,146,845 | | 4,258,048 |
| Reinvestment of distributions | | | | |
Class A
| 0 | 0 | 999 | 33,896 |
Class R6
| 0 | 0 | 64 1 | 2,263 1 |
Administrator Class
| 0 | 0 | 33 | 1,137 |
Institutional Class
| 0 | 0 | 996 | 35,109 |
| | | 0 | | 72,405 |
| Payment for shares redeemed | | | | |
Class A
| (70,358) | (2,775,476) | (193,021) | (5,538,418) |
Class C
| (3,561) | (127,496) | (7,825) | (178,870) |
Class R6
| (5,262) | (218,677) | (5,920) 1 | (198,400) 1 |
Administrator Class
| (2,263) | (91,941) | (12,507) | (426,084) |
Institutional Class
| (192,541) | (8,014,617) | (258,725) | (5,997,728) |
| | | (11,228,207) | | (12,339,500) |
Net decrease in net assets resulting from capital share transactions
| | (10,081,362) | | (8,009,047) |
Total increase (decrease) in net assets
| | (7,238,637) | | 22,434,476 |
| Net assets | | | | |
Beginning of period
| | 61,494,502 | | 39,060,026 |
End of period
| | $ 54,255,865 | | $ 61,494,502 |
| 1 | For the period from May 29, 2020 (commencement of class operations) to March 31, 2021 |
The accompanying notes are an integral part of these financial statements.
16 | Wells Fargo Small Cap Fund
Financial highlights
(For a share outstanding throughout each period)
| | | Year ended March 31 |
| Class A | Six months ended
September 30, 2021
(unaudited) | 2021 | 2020 | 2019 | 2018 | 2017 |
Net asset value, beginning of period
| $37.77 | $19.77 | $30.27 | $31.46 | $28.92 | $23.49 |
Net investment income (loss)
| (0.09) 1 | (0.07) 1 | 0.02 1 | (0.04) 1 | (0.08) 1 | (0.15) 1 |
Net realized and unrealized gains (losses) on investments
| 1.76 | 18.10 | (8.43) | (1.15) | 2.62 | 5.71 |
Total from investment operations
| 1.67 | 18.03 | (8.41) | (1.19) | 2.54 | 5.56 |
| Distributions to shareholders from | | | | | | |
Net investment income
| 0.00 | (0.03) | 0.00 | 0.00 | 0.00 | (0.13) |
Net realized gains
| 0.00 | 0.00 | (2.09) | 0.00 | 0.00 | 0.00 |
Total distributions to shareholders
| 0.00 | (0.03) | (2.09) | 0.00 | 0.00 | (0.13) |
Net asset value, end of period
| $39.44 | $37.77 | $19.77 | $30.27 | $31.46 | $28.92 |
Total return2
| 4.42% | 91.20% | (30.24)% | (3.78)% | 8.78% | 23.68% |
| Ratios to average net assets (annualized) | | | | | | |
Gross expenses
| 1.66% | 1.68% | 1.60% | 1.54% | 1.54% | 1.48% |
Net expenses
| 1.22% | 1.32% | 1.33% | 1.35% | 1.35% | 1.35% |
Net investment income (loss)
| (0.45)% | (0.24)% | 0.05% | (0.11)% | (0.26)% | (0.57)% |
| Supplemental data | | | | | | |
Portfolio turnover rate
| 19% | 55% | 41% | 34% | 27% | 142% |
Net assets, end of period (000s omitted)
| $46,571 | $46,580 | $27,115 | $44,028 | $50,993 | $52,817 |
| 1 | Calculated based upon average shares outstanding |
| 2 | Total return calculations do not include any sales charges. Returns for periods of less than one year are not annualized. |
The accompanying notes are an integral part of these financial statements.
Wells Fargo Small Cap Fund | 17
Financial highlights
(For a share outstanding throughout each period)
| | | Year ended March 31 |
| Class C | Six months ended
September 30, 2021
(unaudited) | 2021 | 2020 | 2019 | 2018 | 2017 |
Net asset value, beginning of period
| $34.21 | $18.03 | $27.98 | $29.30 | $27.14 | $22.11 |
Net investment loss
| (0.21) 1 | (0.23) 1 | (0.20) 1 | (0.25) 1 | (0.28) 1 | (0.39) 1 |
Net realized and unrealized gains (losses) on investments
| 1.57 | 16.41 | (7.66) | (1.07) | 2.44 | 5.42 |
Total from investment operations
| 1.36 | 16.18 | (7.86) | (1.32) | 2.16 | 5.03 |
| Distributions to shareholders from | | | | | | |
Net realized gains
| 0.00 | 0.00 | (2.09) | 0.00 | 0.00 | 0.00 |
Net asset value, end of period
| $35.57 | $34.21 | $18.03 | $27.98 | $29.30 | $27.14 |
Total return2
| 3.98% | 89.74% | (30.76)% | (4.51)% | 7.96% | 22.75% |
| Ratios to average net assets (annualized) | | | | | | |
Gross expenses
| 2.39% | 2.44% | 2.34% | 2.29% | 2.29% | 2.22% |
Net expenses
| 1.98% | 2.09% | 2.10% | 2.10% | 2.10% | 2.10% |
Net investment loss
| (1.20)% | (0.94)% | (0.73)% | (0.85)% | (1.02)% | (1.52)% |
| Supplemental data | | | | | | |
Portfolio turnover rate
| 19% | 55% | 41% | 34% | 27% | 142% |
Net assets, end of period (000s omitted)
| $65 | $112 | $190 | $526 | $840 | $989 |
| 1 | Calculated based upon average shares outstanding |
| 2 | Total return calculations do not include any sales charges. Returns for periods of less than one year are not annualized. |
The accompanying notes are an integral part of these financial statements.
18 | Wells Fargo Small Cap Fund
Financial highlights
(For a share outstanding throughout each period)
| | | Year ended March 31 |
| Class R6 | Six months ended
September 30, 2021
(unaudited) | 2021 1 |
Net asset value, beginning of period
| $39.46 | $25.43 |
Net investment income (loss)
| (0.01) 2 | 0.03 2 |
Net realized and unrealized gains (losses) on investments
| 1.84 | 14.09 |
Total from investment operations
| 1.83 | 14.12 |
| Distributions to shareholders from | | |
Net investment income
| 0.00 | (0.09) |
Net asset value, end of period
| $41.29 | $39.46 |
Total return3
| 4.64% | 55.58% |
| Ratios to average net assets (annualized) | | |
Gross expenses
| 1.23% | 1.23% |
Net expenses
| 0.80% | 0.88% |
Net investment income (loss)
| (0.03)% | 0.09% |
| Supplemental data | | |
Portfolio turnover rate
| 19% | 55% |
Net assets, end of period (000s omitted)
| $963 | $936 |
| 1 | For the period from May 29, 2020 (commencement of class operations) to March 31, 2021 |
| 2 | Calculated based upon average shares outstanding |
| 3 | Returns for periods of less than one year are not annualized. |
The accompanying notes are an integral part of these financial statements.
Wells Fargo Small Cap Fund | 19
Financial highlights
(For a share outstanding throughout each period)
| | | Year ended March 31 |
| Administrator Class | Six months ended
September 30, 2021
(unaudited) | 2021 | 2020 | 2019 | 2018 | 2017 |
Net asset value, beginning of period
| $38.67 | $20.23 | $30.89 | $32.06 | $29.43 | $23.89 |
Net investment income (loss)
| (0.08) 1 | (0.01) 1 | 0.05 1 | 0.01 1 | (0.03) 1 | (0.10) 1 |
Net realized and unrealized gains (losses) on investments
| 1.80 | 18.51 | (8.62) | (1.18) | 2.66 | 5.80 |
Total from investment operations
| 1.72 | 18.50 | (8.57) | (1.17) | 2.63 | 5.70 |
| Distributions to shareholders from | | | | | | |
Net investment income
| 0.00 | (0.06) | 0.00 | 0.00 | 0.00 | (0.16) |
Net realized gains
| 0.00 | 0.00 | (2.09) | 0.00 | 0.00 | 0.00 |
Total distributions to shareholders
| 0.00 | (0.06) | (2.09) | 0.00 | 0.00 | (0.16) |
Net asset value, end of period
| $40.39 | $38.67 | $20.23 | $30.89 | $32.06 | $29.43 |
Total return2
| 4.45% | 91.48% | (30.15)% | (3.65)% | 8.94% | 23.86% |
| Ratios to average net assets (annualized) | | | | | | |
Gross expenses
| 1.58% | 1.61% | 1.51% | 1.46% | 1.46% | 1.40% |
Net expenses
| 1.15% | 1.20% | 1.20% | 1.20% | 1.20% | 1.20% |
Net investment income (loss)
| (0.37)% | (0.02)% | 0.17% | 0.05% | (0.10)% | (0.38)% |
| Supplemental data | | | | | | |
Portfolio turnover rate
| 19% | 55% | 41% | 34% | 27% | 142% |
Net assets, end of period (000s omitted)
| $445 | $466 | $450 | $1,165 | $1,347 | $4,355 |
| 1 | Calculated based upon average shares outstanding |
| 2 | Returns for periods of less than one year are not annualized. |
The accompanying notes are an integral part of these financial statements.
20 | Wells Fargo Small Cap Fund
Financial highlights
(For a share outstanding throughout each period)
| | | Year ended March 31 |
| Institutional Class | Six months ended
September 30, 2021
(unaudited) | 2021 | 2020 | 2019 | 2018 | 2017 |
Net asset value, beginning of period
| $39.29 | $20.58 | $31.33 | $32.45 | $29.73 | $24.13 |
Net investment income (loss)
| (0.05) 1 | 0.02 1 | 0.12 1 | 0.08 1 | 0.03 1 | (0.07) 1 |
Net realized and unrealized gains (losses) on investments
| 1.85 | 18.87 | (8.78) | (1.20) | 2.69 | 5.89 |
Total from investment operations
| 1.80 | 18.89 | (8.66) | (1.12) | 2.72 | 5.82 |
| Distributions to shareholders from | | | | | | |
Net investment income
| 0.00 | (0.18) | (0.00) 2 | 0.00 | 0.00 | (0.22) |
Net realized gains
| 0.00 | 0.00 | (2.09) | 0.00 | 0.00 | 0.00 |
Total distributions to shareholders
| 0.00 | (0.18) | (2.09) | 0.00 | 0.00 | (0.22) |
Net asset value, end of period
| $41.09 | $39.29 | $20.58 | $31.33 | $32.45 | $29.73 |
Total return3
| 4.58% | 91.87% | (30.00)% | (3.45)% | 9.15% | 24.14% |
| Ratios to average net assets (annualized) | | | | | | |
Gross expenses
| 1.32% | 1.35% | 1.27% | 1.21% | 1.21% | 1.15% |
Net expenses
| 0.90% | 0.98% | 1.00% | 1.00% | 1.00% | 1.00% |
Net investment income (loss)
| (0.24)% | 0.08% | 0.38% | 0.24% | 0.08% | (0.26)% |
| Supplemental data | | | | | | |
Portfolio turnover rate
| 19% | 55% | 41% | 34% | 27% | 142% |
Net assets, end of period (000s omitted)
| $6,212 | $13,401 | $11,305 | $21,398 | $28,032 | $59,991 |
| 1 | Calculated based upon average shares outstanding |
| 2 | Amount is less than $0.005. |
| 3 | Returns for periods of less than one year are not annualized. |
The accompanying notes are an integral part of these financial statements.
Wells Fargo Small Cap Fund | 21
Notes to financial statements (unaudited)
1. ORGANIZATION
Wells Fargo Funds Trust (the "Trust"), a Delaware statutory trust organized on March 10, 1999, is an open-end management investment company registered under the Investment Company Act of 1940, as amended (the "1940 Act"). As an investment company, the Trust follows the accounting and reporting guidance in Financial Accounting Standards Board ("FASB") Accounting Standards Codification Topic 946, Financial Services – Investment Companies. These financial statements report on the Wells Fargo Small Cap Fund (the "Fund") which is a diversified series of the Trust.
On February 23, 2021, Wells Fargo & Company announced that it has entered into a definitive agreement to sell Wells Fargo Asset Management ("WFAM") to GTCR LLC and Reverence Capital Partners, L.P. WFAM is the trade name used by the asset management businesses of Wells Fargo & Company and includes Wells Fargo Funds Management, LLC, the investment manager to the Fund, Wells Capital Management, LLC and Wells Fargo Asset Management (International) Limited, both registered investment advisers providing subadvisory services to certain funds, and Wells Fargo Funds Distributor, LLC, the Fund's principal underwriter. As part of the transaction, Wells Fargo & Company will own a 9.9% equity interest and will continue to serve as an important client and distribution partner.
Consummation of the transaction will result in the automatic termination of the Fund's investment management agreement and subadvisory agreement. The Fund's Board of Trustees approved a new investment management agreement and a new subadvisory agreement which were submitted to the Fund's shareholders for approval at a Special Meeting of Shareholders scheduled for October 15, 2021. Shareholders of record of the Fund at the close of business on May 28, 2021 are entitled to vote at the meeting. If shareholders approve the new agreements, they will take effect upon the closing of the transaction.
As more fully discussed in Note 10, the transaction closed on November 1, 2021 and the investment manager, sub-advisers and distributor changed their names to Allspring Funds Management, LLC, Allspring Global Investments, LLC, Allspring Global Investments (UK) Limited and Allspring Funds Distributor, LLC. While these name changes occurred after the end of the period, throughout this report, the new names have been used.
The Board of Trustees of the Wells Fargo Funds voted on July 15, 2021 to approve a change to the Fund's name to remove "Wells Fargo" from the name and replace it with "Allspring", effective December 6, 2021.
2. SIGNIFICANT ACCOUNTING POLICIES
The following significant accounting policies, which are consistently followed in the preparation of the financial statements of the Fund, are in conformity with U.S. generally accepted accounting principles which require management to make estimates and assumptions that affect the reported amounts of assets and liabilities, disclosure of contingent assets and liabilities at the date of the financial statements, and the reported amounts of income and expenses during the reporting period. Actual results could differ from those estimates.
Securities valuation
All investments are valued each business day as of the close of regular trading on the New York Stock Exchange (generally 4 p.m. Eastern Time), although the Fund may deviate from this calculation time under unusual or unexpected circumstances.
Equity securities that are listed on a foreign or domestic exchange or market are valued at the official closing price or, if none, the last sales price. If no sale occurs on the principal exchange or market that day, a fair value price will be determined in accordance with the Fund’s Valuation Procedures.
Investments in registered open-end investment companies are valued at net asset value. Interests in non-registered investment companies that are redeemable at net asset value are fair valued normally at net asset value.
Investments which are not valued using any of the methods discussed above are valued at their fair value, as determined in good faith by the Board of Trustees. The Board of Trustees has established a Valuation Committee comprised of the Trustees and has delegated to it the authority to take any actions regarding the valuation of portfolio securities that the Valuation Committee deems necessary or appropriate, including determining the fair value of portfolio securities, unless the determination has been delegated to the Allspring Global Investments Pricing Committee at Allspring Funds Management, LLC ("Allspring Funds Management"). The Board of Trustees retains the authority to make or ratify any valuation decisions or approve any changes to the Valuation Procedures as it deems appropriate. On a quarterly basis, the Board of Trustees receives reports on any valuation actions taken by the Valuation Committee or the Allspring Global Investments Pricing Committee which may include items for ratification.
Securities lending
The Fund may lend its securities from time to time in order to earn additional income in the form of fees or interest on securities received as collateral or the investment of any cash received as collateral. When securities are on loan, the Fund
22 | Wells Fargo Small Cap Fund
Notes to financial statements (unaudited)
receives interest or dividends on those securities. Cash collateral received in connection with its securities lending transactions is invested in Securities Lending Cash Investments, LLC (the "Securities Lending Fund"). Investments in Securities Lending Fund are valued at the evaluated bid price provided by an independent pricing service. Income earned from investment in the Securities Lending Fund (net of fees and rebates), if any, is included in income from affiliated securities on the Statement of Operations.
In a securities lending transaction, the net asset value of the Fund is affected by an increase or decrease in the value of the securities loaned and by an increase or decrease in the value of the instrument in which collateral is invested. The amount of securities lending activity undertaken by the Fund fluctuates from time to time. The Fund has the right under the lending agreement to recover the securities from the borrower on demand. In the event of default or bankruptcy by the borrower, the Fund may be prevented from recovering the loaned securities or gaining access to the collateral or may experience delays or costs in doing so. In such an event, the terms of the agreement allow the unaffiliated securities lending agent to use the collateral to purchase replacement securities on behalf of the Fund or pay the Fund the market value of the loaned securities. The Fund bears the risk of loss with respect to depreciation of its investment of the cash collateral.
Security transactions and income recognition
Securities transactions are recorded on a trade date basis. Realized gains or losses are recorded on the basis of identified cost.
Dividend income is recognized on the ex-dividend date.
Income dividends and capital gain distributions from investment companies are recorded on the ex-dividend date. Capital gain distributions from investment companies are treated as realized gains.
Distributions to shareholders
Distributions to shareholders from net investment income and any net realized gains are recorded on the ex-dividend date and paid at least annually. Such distributions are determined in accordance with income tax regulations and may differ from U.S. generally accepted accounting principles. Dividend sources are estimated at the time of declaration. The tax character of distributions is determined as of the Fund's fiscal year end. Therefore, a portion of the Fund's distributions made prior to the Fund’s fiscal year end may be categorized as a tax return of capital at year end.
Federal and other taxes
The Fund intends to continue to qualify as a regulated investment company by distributing substantially all of its investment company taxable income and any net realized capital gains (after reduction for capital loss carryforwards) sufficient to relieve it from all, or substantially all, federal income taxes. Accordingly, no provision for federal income taxes was required.
The Fund’s income and federal excise tax returns and all financial records supporting those returns for the prior three fiscal years are subject to examination by the federal and Delaware revenue authorities. Management has analyzed the Fund's tax positions taken on federal, state, and foreign tax returns for all open tax years and does not believe that there are any uncertain tax positions that require recognition of a tax liability.
As of September 30, 2021, the aggregate cost of all investments for federal income tax purposes was $42,273,794 and the unrealized gains (losses) consisted of:
| Gross unrealized gains | $14,506,958 |
| Gross unrealized losses | (1,912,818) |
| Net unrealized gains | $12,594,140 |
Class allocations
The separate classes of shares offered by the Fund differ principally in applicable sales charges, distribution, shareholder servicing, and administration fees. Class specific expenses are charged directly to that share class. Investment income, common fund-level expenses, and realized and unrealized gains (losses) on investments are allocated daily to each class of shares based on the relative proportion of net assets of each class.
Wells Fargo Small Cap Fund | 23
Notes to financial statements (unaudited)
3. FAIR VALUATION MEASUREMENTS
Fair value measurements of investments are determined within a framework that has established a fair value hierarchy based upon the various data inputs utilized in determining the value of the Fund’s investments. The three-level hierarchy gives the highest priority to unadjusted quoted prices in active markets for identical assets or liabilities (Level 1) and the lowest priority to unobservable inputs (Level 3). The Fund’s investments are classified within the fair value hierarchy based on the lowest level of input that is significant to the fair value measurement. The inputs are summarized into three broad levels as follows:
| ■ | Level 1 – quoted prices in active markets for identical securities |
| ■ | Level 2 – other significant observable inputs (including quoted prices for similar securities, interest rates, prepayment speeds, credit risk, etc.) |
| ■ | Level 3 – significant unobservable inputs (including the Fund’s own assumptions in determining the fair value of investments) |
The inputs or methodologies used for valuing investments in securities are not necessarily an indication of the risk associated with investing in those securities.
The following is a summary of the inputs used in valuing the Fund’s assets and liabilities as of September 30, 2021:
| | Quoted prices
(Level 1) | Other significant
observable inputs
(Level 2) | Significant
unobservable inputs
(Level 3) | Total |
| Assets | | | | |
| Investments in: | | | | |
| Common stocks | | | | |
| Communication services | $ 615,804 | $0 | $0 | $ 615,804 |
| Consumer discretionary | 5,827,246 | 0 | 0 | 5,827,246 |
| Consumer staples | 2,940,639 | 0 | 0 | 2,940,639 |
| Financials | 7,303,789 | 0 | 0 | 7,303,789 |
| Health care | 8,153,871 | 0 | 0 | 8,153,871 |
| Industrials | 10,386,801 | 0 | 0 | 10,386,801 |
| Information technology | 11,088,468 | 0 | 0 | 11,088,468 |
| Materials | 3,793,759 | 0 | 0 | 3,793,759 |
| Real estate | 3,267,945 | 0 | 0 | 3,267,945 |
| Investment companies | 575,752 | 0 | 0 | 575,752 |
| Short-term investments | | | | |
| Investment companies | 913,860 | 0 | 0 | 913,860 |
| Total assets | $54,867,934 | $0 | $0 | $54,867,934 |
Additional sector, industry or geographic detail, if any, is included in the Portfolio of Investments.
For the six months ended September 30, 2021, the Fund did not have any transfers into/out of Level 3.
4. TRANSACTIONS WITH AFFILIATES
Management fee
Allspring Funds Management, a wholly owned subsidiary of Allspring Global Investments Holdings, LLC, a holding company indirectly owned by Wells Fargo & Company as of September 30, 2021, is the manager of the Fund and provides advisory and fund-level administrative services under an investment management agreement. Under the investment management agreement, Allspring Funds Management is responsible for, among other services, implementing the investment objectives and strategies of the Fund, supervising the subadviser and providing fund-level administrative services in connection with the Fund’s operations. As compensation for its services under the investment management agreement, Allspring Funds Management is entitled to receive a management fee at the following annual rate based on the Fund’s average daily net assets:
24 | Wells Fargo Small Cap Fund
Notes to financial statements (unaudited)
| Average daily net assets | Management fee |
| First $500 million | 0.850% |
| Next $500 million | 0.825 |
| Next $1 billion | 0.800 |
| Next $1 billion | 0.775 |
| Next $1 billion | 0.750 |
| Next $1 billion | 0.730 |
| Next $5 billion | 0.720 |
| Over $10 billion | 0.710 |
For the six months ended September 30, 2021, the management fee was equivalent to an annual rate of 0.85% of the Fund’s average daily net assets.
Allspring Funds Management has retained the services of a subadviser to provide daily portfolio management to the Fund. The fee for subadvisory services is borne by Allspring Funds Management. Allspring Global Investments, LLC ("Allspring Investments"), an affiliate of Allspring Funds Management and wholly owned subsidiary of Allspring Global Investments Holdings, LLC, is the subadviser to the Fund and is entitled to receive a fee from Allspring Funds Management at an annual rate starting at 0.55% and declining to 0.40% as the average daily net assets of the Fund increase.
Administration fees
Under a class-level administration agreement, Allspring Funds Management provides class-level administrative services to the Fund, which includes paying fees and expenses for services provided by the transfer agent, sub-transfer agents, omnibus account servicers and record-keepers. As compensation for its services under the class-level administration agreement, Allspring Funds Management receives an annual fee which is calculated based on the average daily net assets of each class as follows:
| | Class-level
administration fee |
| Class A | 0.21% |
| Class C | 0.21 |
| Class R6 | 0.03 |
| Administrator Class | 0.13 |
| Institutional Class | 0.13 |
Waivers and/or expense reimbursements
Allspring Funds Management has contractually committed to waive and/or reimburse management and administration fees to the extent necessary to maintain certain net operating expense ratios for the Fund. When each class of the Fund has exceeded its expense cap, Allspring Funds Management will waive fees and/or reimburse expenses from fund-level expenses on a proportionate basis and then from class specific expenses. When only certain classes exceed their expense caps, waivers and/or reimbursements are applied against class specific expenses before fund-level expenses. Allspring Funds Management has contractually committed through July 31, 2022 to waive fees and/or reimburse expenses to the extent necessary to cap expenses. Prior to or after the commitment expiration date, the caps may be increased or the commitment to maintain the caps may be terminated only with the approval of the Board of Trustees. The contractual expense caps are as follows:
| | Expense ratio caps |
| Class A | 1.23% |
| Class C | 1.98 |
| Class R6 | 0.80 |
| Administrator Class | 1.15 |
| Institutional Class | 0.90 |
Wells Fargo Small Cap Fund | 25
Notes to financial statements (unaudited)
Distribution fee
The Trust has adopted a distribution plan for Class C shares of the Fund pursuant to Rule 12b-1 under the 1940 Act. A distribution fee is charged to Class C shares and paid to Allspring Funds Distributor, LLC ("Allspring Funds Distributor"), an affiliate of Allspring Funds Management, the principal underwriter, at an annual rate of 0.75% of the average daily net assets of Class C shares.
In addition, Allspring Funds Distributor is entitled to receive the front-end sales charge from the purchase of Class A shares and a contingent deferred sales charge on the redemption of certain Class A shares. Allspring Funds Distributor is also entitled to receive the contingent deferred sales charges from redemptions of Class C shares. For the six months ended September 30, 2021, Allspring Funds Distributor received $98 from the sale of Class A shares. No contingent deferred sales charges were incurred by Class A and Class C shares for the six months ended September 30, 2021.
Shareholder servicing fees
The Trust has entered into contracts with one or more shareholder servicing agents, whereby Class A, Class C, and Administrator Class of the Fund are charged a fee at an annual rate of 0.25% of the average daily net assets of each respective class. A portion of these total shareholder servicing fees were paid to affiliates.
Interfund transactions
The Fund may purchase or sell portfolio investment securities to certain affiliates pursuant to Rule 17a-7 under the 1940 Act and under procedures adopted by the Board of Trustees. The procedures have been designed to ensure that these interfund transactions, which do not incur broker commissions, are effected at current market prices.
5. INVESTMENT PORTFOLIO TRANSACTIONS
Purchases and sales of investments, excluding U.S. government obligations (if any) and short-term securities, for the six months ended September 30, 2021 were $10,564,903 and $20,504,198, respectively.
6. SECURITIES LENDING TRANSACTIONS
The Fund lends its securities through an unaffiliated securities lending agent and receives collateral in the form of cash or securities with a value at least equal to the value of the securities on loan. The value of the loaned securities is determined at the close of each business day and any increases or decreases in the required collateral are exchanged between the Fund and the counterparty on the next business day. Cash collateral received is invested in the Securities Lending Fund which seeks to provide a positive return compared to the daily Federal Funds Open Rate by investing in high-quality, U.S. dollar-denominated short-term money market instruments and is exempt from registration under Section 3(c)(7) of the 1940 Act. Securities Lending Fund is managed by Allspring Funds Management and is subadvised by Allspring Investments. Allspring Funds Management receives an advisory fee starting at 0.05% and declining to 0.01% as the average daily net assets of the Securities Lending Fund increase. All of the fees received by Allspring Funds Management are paid to Allspring Investments for its services as subadviser.
In the event of counterparty default or the failure of a borrower to return a loaned security, the Fund has the right to use the collateral to offset any losses incurred. As of September 30, 2021, the Fund had securities lending transactions with the following counterparties which are subject to offset:
| Counterparty | Value of
securities on
loan | Collateral
received1 | Net amount |
| Barclays Capital Incorporated | $157,350 | $(157,350) | $0 |
| Deutsche Bank Securities Incorporated | 21,150 | (21,150) | 0 |
| J.P. Morgan Securities LLC | 130,076 | (130,076) | 0 |
| Morgan Stanley & Company LLC | 50,252 | (50,252) | 0 |
| National Financial Services LLC | 34,470 | (34,470) | 0 |
| SG Americas Securities, LLC | 172,350 | (172,350) | 0 |
| UBS Securities LLC | 5,245 | (5,245) | 0 |
1 Collateral received within this table is limited to the collateral for the net transaction with the counterparty.
26 | Wells Fargo Small Cap Fund
Notes to financial statements (unaudited)
7. BANK BORROWINGS
The Trust (excluding the money market funds), Wells Fargo Master Trust and Wells Fargo Variable Trust are parties to a $350,000,000 revolving credit agreement whereby the Fund is permitted to use bank borrowings for temporary or emergency purposes, such as to fund shareholder redemption requests. Interest under the credit agreement is charged to the Fund based on a borrowing rate equal to the higher of the Federal Funds rate in effect on that day plus 1.25% or the overnight bank funding rate in effect on that day plus 1.25%. In addition, an annual commitment fee equal to 0.25% of the unused balance is allocated to each participating fund.
For the six months ended September 30, 2021, there were no borrowings by the Fund under the agreement.
8. INDEMNIFICATION
Under the Fund's organizational documents, the officers and Trustees have been granted certain indemnification rights against certain liabilities that may arise out of performance of their duties to the Fund. The Fund has entered into a separate agreement with each Trustee that converts indemnification rights currently existing under the Fund’s organizational documents into contractual rights that cannot be changed in the future without the consent of the Trustee. Additionally, in the normal course of business, the Fund may enter into contracts with service providers that contain a variety of indemnification clauses. The Fund’s maximum exposure under these arrangements is dependent on future claims that may be made against the Fund and, therefore, cannot be estimated.
9. CORONAVIRUS (COVID-19) PANDEMIC
On March 11, 2020, the World Health Organization announced that it had made the assessment that coronavirus disease 2019 (“COVID-19”) is a pandemic. The impacts of COVID-19 are affecting the entire global economy, individual companies and investment products, the funds, and the market in general. There is significant uncertainty around the extent and duration of business disruptions related to COVID-19 and the impacts may last for an extended period of time. COVID-19 has led to significant uncertainty and volatility in the financial markets.
10. SUBSEQUENT EVENTS
Effective after the close of business on November 1, 2021, the sale transaction of Wells Fargo Asset Management by Wells Fargo & Company to GTCR LLC and Reverence Capital Partners, L.P. was closed. In connection with the closing of the transaction, Wells Fargo Asset Management became known as Allspring Global Investments (“Allspring”) and various entities that provide services to the Fund changed their names to “Allspring”, including Allspring Funds Management, LLC (formerly Wells Fargo Funds Management, LLC), the investment manager to the Fund, Allspring Global Investments, LLC (formerly Wells Capital Management, LLC) and Allspring Global Investments (UK) Limited (formerly Wells Fargo Asset Management (International) Limited), both registered investment advisers providing sub-advisory services to certain funds, and Allspring Funds Distributor, LLC (formerly Wells Fargo Funds Distributor, LLC), the Fund's principal underwriter. These name changes have been reflected within this report.
At a Special Meeting of Shareholders held on October 15, 2021, shareholders of the Fund approved a new investment management and a new subadvisory agreement that was effective on November 1, 2021. The management and subadisory fee rates remained the same under the new agreements.
Wells Fargo Small Cap Fund | 27
Other information (unaudited)
PROXY VOTING INFORMATION
A description of the policies and procedures used to determine how to vote proxies relating to portfolio securities is available without charge, upon request, by calling 1-800-222-8222, visiting our website at allspringglobal.com, or visiting the SEC website at sec.gov. Information regarding how the proxies related to portfolio securities were voted during the most recent 12-month period ended June 30 is available on the website at allspringglobal.com or by visiting the SEC website at sec.gov.
SPECIAL MEETING OF SHAREHOLDERS
On October 15, 2021, a Special Meeting of Shareholders for the Fund was held to consider the following proposals. The results of the proposals are indicated below.
Proposal 1 – To consider and approve a new investment management agreement with Wells Fargo Funds Management, LLC*.
| Shares voted “For” | 593,761 |
| Shares voted “Against” | 65,107 |
| Shares voted “Abstain” | 64,889 |
Proposal 2 – To consider and approve a new investment subadvisory agreement with Wells Capital Management, LLC**.
| Shares voted “For” | 591,986 |
| Shares voted “Against” | 65,750 |
| Shares voted “Abstain” | 66,021 |
* Effective November 1, 2021, known as Allspring Funds Management, LLC.
** Effective November 1, 2021, known as Allspring Global Investments, LLC.
QUARTERLY PORTFOLIO HOLDINGS INFORMATION
The Fund files its complete schedule of portfolio holdings with the SEC for the first and third quarters of each fiscal year as an exhibit to its reports on Form N-PORT. Shareholders may view the filed Form N-PORT by visiting the SEC website at sec.gov.
28 | Wells Fargo Small Cap Fund
Other information (unaudited)
BOARD OF TRUSTEES AND OFFICERS
Each of the Trustees and Officers listed in the table below acts in identical capacities for each fund in the Wells Fargo family of funds, which consists of 139 mutual funds comprising the Wells Fargo Funds Trust, Wells Fargo Variable Trust, Wells Fargo Master Trust and four closed-end funds (collectively the “Fund Complex”). This table should be read in conjunction with the Prospectus and the Statement of Additional Information1. The mailing address of each Trustee and Officer is 525 Market Street, 12th Floor, San Francisco, CA 94105. Each Trustee and Officer serves an indefinite term, however, each Trustee serves such term until reaching the mandatory retirement age established by the Trustees.
Independent Trustees
Name and
year of birth | Position held and
length of service* | Principal occupations during past five years or longer | Current other
public company or
investment
company
directorships |
William R. Ebsworth
(Born 1957) | Trustee,
since 2015 | Retired. From 1984 to 2013, equities analyst, portfolio manager, research director and chief investment officer at Fidelity Management and Research Company in Boston, Tokyo, and Hong Kong, and retired in 2013 as Chief Investment Officer of Fidelity Strategic Advisers, Inc. where he led a team of investment professionals managing client assets. Prior thereto, Board member of Hong Kong Securities Clearing Co., Hong Kong Options Clearing Corp., the Thailand International Fund, Ltd., Fidelity Investments Life Insurance Company, and Empire Fidelity Investments Life Insurance Company. Audit Committee Chair and Investment Committee Chair of the Vincent Memorial Hospital Endowment (non-profit organization). Mr. Ebsworth is a CFA® charterholder. | N/A |
Jane A. Freeman
(Born 1953) | Trustee,
since 2015;
Chair Liaison,
since 2018 | Retired. From 2012 to 2014 and 1999 to 2008, Chief Financial Officer of Scientific Learning Corporation. From 2008 to 2012, Ms. Freeman provided consulting services related to strategic business projects. Prior to 1999, Portfolio Manager at Rockefeller & Co. and Scudder, Stevens & Clark. Board member of the Harding Loevner Funds from 1996 to 2014, serving as both Lead Independent Director and chair of the Audit Committee. Board member of the Russell Exchange Traded Funds Trust from 2011 to 2012 and the chair of the Audit Committee. Ms. Freeman is also an inactive Chartered Financial Analyst. | N/A |
Isaiah Harris, Jr.
(Born 1952) | Trustee,
since 2009; Audit
Committee
Chair,
since 2019 | Retired. Chairman of the Board of CIGNA Corporation since 2009, and Director since 2005. From 2003 to 2011, Director of Deluxe Corporation. Prior thereto, President and CEO of BellSouth Advertising and Publishing Corp. from 2005 to 2007, President and CEO of BellSouth Enterprises from 2004 to 2005 and President of BellSouth Consumer Services from 2000 to 2003. Emeritus member of the Iowa State University Foundation Board of Governors. Emeritus Member of the Advisory Board of Iowa State University School of Business. Advisory Board Member, Palm Harbor Academy (private school). Mr. Harris is a certified public accountant (inactive status). | CIGNA Corporation |
Judith M. Johnson
(Born 1949) | Trustee,
since 2008 | Retired. Prior thereto, Chief Executive Officer and Chief Investment Officer of Minneapolis Employees Retirement Fund from 1996 to 2008. Ms. Johnson is an attorney, certified public accountant and a certified managerial accountant. | N/A |
David F. Larcker
(Born 1950) | Trustee,
since 2009 | James Irvin Miller Professor of Accounting at the Graduate School of Business (Emeritus), Stanford University, Director of the Corporate Governance Research Initiative and Senior Faculty of The Rock Center for Corporate Governance since 2006. From 2005 to 2008, Professor of Accounting at the Graduate School of Business, Stanford University. Prior thereto, Ernst & Young Professor of Accounting at The Wharton School, University of Pennsylvania from 1985 to 2005. | N/A |
Wells Fargo Small Cap Fund | 29
Other information (unaudited)
Name and
year of birth | Position held and
length of service* | Principal occupations during past five years or longer | Current other
public company or
investment
company
directorships |
Olivia S. Mitchell
(Born 1953) | Trustee,
since 2006;
Nominating and
Governance
Committee Chair,
since 2018 | International Foundation of Employee Benefit Plans Professor, Wharton School of the University of Pennsylvania since 1993. Director of Wharton’s Pension Research Council and Boettner Center on Pensions & Retirement Research, and Research Associate at the National Bureau of Economic Research. Previously, Cornell University Professor from 1978 to 1993. | N/A |
Timothy J. Penny
(Born 1951) | Trustee,
since 1996;
Chair,
since 2018 | President and Chief Executive Officer of Southern Minnesota Initiative Foundation, a non-profit organization, since 2007. Member of the Board of Trustees of NorthStar Education Finance, Inc., a non-profit organization, since 2007. | N/A |
James G. Polisson
(Born 1959) | Trustee,
since 2018 | Retired. Chief Marketing Officer, Source (ETF) UK Services, Ltd, from 2015 to 2017. From 2012 to 2015, Principal of The Polisson Group, LLC, a management consulting, corporate advisory and principal investing company. Chief Executive Officer and Managing Director at Russell Investments, Global Exchange Traded Funds from 2010 to 2012. Managing Director of Barclays Global Investors from 1998 to 2010 and Global Chief Marketing Officer for iShares and Barclays Global Investors from 2000 to 2010. Trustee of the San Francisco Mechanics’ Institute, a non-profit organization, from 2013 to 2015. Board member of the Russell Exchange Traded Fund Trust from 2011 to 2012. Director of Barclays Global Investors Holdings Deutschland GmbH from 2006 to 2009. Mr. Polisson is an attorney and has a retired status with the Massachusetts and District of Columbia Bar Associations. | N/A |
Pamela Wheelock
(Born 1959) | Trustee,
since January
2020; previously
Trustee from
January 2018 to
July 2019 | Board member of the Destination Medical Center Economic Development Agency, Rochester, Minnesota since 2019. Interim President of the McKnight Foundation from January to September 2020. Acting Commissioner, Minnesota Department of Human Services, July 2019 through September 2019. Human Services Manager (part-time), Minnesota Department of Human Services, October 2019 through December 2019. Chief Operating Officer, Twin Cities Habitat for Humanity from 2017 to 2019. Vice President of University Services, University of Minnesota from 2012 to 2016. Prior thereto, on the Board of Directors, Governance Committee and Finance Committee for the Minnesota Philanthropy Partners (Saint Paul Foundation) from 2012 to 2018, Interim Chief Executive Officer of Blue Cross Blue Shield of Minnesota from 2011 to 2012, Chairman of the Board from 2009 to 2012 and Board Director from 2003 to 2015. Vice President, Leadership and Community Engagement, Bush Foundation, Saint Paul, Minnesota (a private foundation) from 2009 to 2011. Executive Vice President and Chief Financial Officer, Minnesota Sports and Entertainment from 2004 to 2009 and Senior Vice President from 2002 to 2004. Executive Vice President of the Minnesota Wild Foundation from 2004 to 2008. Commissioner of Finance, State of Minnesota, from 1999 to 2002. Currently Board Chair of the Minnesota Wild Foundation since 2010. | N/A |
* Length of service dates reflect the Trustee’s commencement of service with the Trust’s predecessor entities, where applicable.
30 | Wells Fargo Small Cap Fund
Other information (unaudited)
Officers2
Name and
year of birth | Position held and
length of service | Principal occupations during past five years or longer |
Andrew Owen
(Born 1960) | President,
since 2017 | President, Chief Executive Officer and Director of Allspring Funds Management, LLC since 2017 and co-president of Galliard Capital Management, LLC, an affiliate of Allspring Funds Management, LLC, since 2019. Prior thereto, Head of Affiliated Managers, Allspring Global Investments, from 2014 to 2019 and Executive Vice President responsible for marketing, investments and product development for Allspring Funds Management, LLC, from 2009 to 2014. In addition, Mr. Owen was an Executive Vice President of Wells Fargo & Company from 2014 to 2021. |
Jeremy DePalma
(Born 1974) | Treasurer,
since 2012
(for certain funds in
the Fund Complex);
since 2021 (for
the remaining funds in the
Fund Complex) | Senior Vice President of Allspring Funds Management, LLC since 2009. Senior Vice President of Evergreen Investment Management Company, LLC from 2008 to 2010 and head of the Fund Reporting and Control Team within Fund Administration. |
Kate McKinley
(Born 1977) | Chief Legal Officer and Chief Compliance Officer,
since 2021 | Chief Legal Officer of Allspring Global Investments since 2021. Prior thereto, held various roles at State Street Global Advisors, Inc. beginning in 2010, including serving as Senior Vice President and General Counsel from 2019 to 2021. Previously served as Assistant General Counsel for Bank of America Corporation from 2005 to 2010 and as an Associate at WilmerHale from 2002 to 2005. |
Matthew Prasse
(Born 1983) | Secretary,
since 2021 | Senior Counsel of the Allspring Legal Department since 2021. Senior Counsel of the Wells Fargo Legal Department from 2018 to 2021. Previously, Counsel for Barings LLC from 2015 to 2018. Prior to joining Barings, Associate at Morgan, Lewis & Bockius LLP from 2008 to 2015. |
1 The Statement of Additional Information includes additional information about the Trustees and is available, without charge, upon request, by calling 1-800-222-8222 or by visiting the website at allspringglobal.com.
2 For those Officers with tenures at Allspring Global Investments and/or Allspring Funds Management, LLC that began prior to 2021, such tenures include years of service during which these businesses/entities were known as Wells Fargo Asset Management and Wells Fargo Funds Management, LLC, respectively.
Wells Fargo Small Cap Fund | 31
Board considerations (unaudited)
BOARD CONSIDERATION OF INVESTMENT MANAGEMENT AND SUB-ADVISORY AGREEMENTS:
Board Considerations – Current Agreements
Under the Investment Company Act of 1940 (the “1940 Act”), the Board of Trustees (the “Board”) of Wells Fargo Funds Trust (the “Trust”) must determine annually whether to approve the continuation of the Trust’s investment management and sub-advisory agreements. In this regard, at a Board meeting held on May 17-19, 2021 (the “Meeting”), the Board, all the members of which have no direct or indirect interest in the investment management and sub-advisory agreements and are not “interested persons” of the Trust, as defined in the 1940 Act (the “Independent Trustees”), reviewed and approved for Wells Fargo Small Cap Fund (the “Fund”): (i) an investment management agreement (the “Management Agreement”) with Wells Fargo Funds Management, LLC (“Funds Management”); and (ii) an investment sub-advisory agreement (the “Sub-Advisory Agreement”) with Wells Capital Management Incorporated (the “Sub-Adviser”), an affiliate of Funds Management. The Management Agreement and the Sub-Advisory Agreement are collectively referred to as the “Advisory Agreements.”
The Board noted that Wells Fargo & Company recently announced that it had entered into a definitive agreement to sell Wells Fargo Asset Management (“WFAM”), which includes Funds Management and the Sub-Adviser, to GTCR LLC and Reverence Capital Partners, L.P. and/or their affiliates (the “Transaction”). The Board further noted that the Transaction would result in a change-of-control of Funds Management and the Sub-Adviser, which would be considered to be an assignment that would result in the termination of the Advisory Agreements. In light of the Transaction, the Board separately considered for approval a new investment management agreement with Funds Management and a new sub-advisory agreement with the Sub-Adviser (the “New Agreements”) that would replace the Advisory Agreements upon consummation of the Transaction, subject to approval of the New Agreements by the Fund’s shareholders. The Board also considered for approval interim agreements to go into effect in the event shareholders do not approve the New Agreements before the Transaction is completed. The interim agreements would allow the Manager and the Sub-Adviser to continue providing services to the Fund while the Fund continues to seek shareholder approval of the New Agreements. The Board noted that the terms of the interim agreements would be identical to those of the current Advisory Agreements, except for the term and certain escrow provisions.
At the Meeting, the Board considered the factors and reached the conclusions described below relating to the selection of Funds Management and the Sub-Adviser and the approval of the Advisory Agreements. Prior to the Meeting, including at Board meetings held in April and May 2021, the Trustees conferred extensively among themselves and with representatives of Funds Management about these matters. Also, the Board has adopted a team-based approach, with each team consisting of a sub-set of Trustees, to assist the full Board in the discharge of its duties in reviewing investment performance and other matters throughout the year. The Independent Trustees were assisted in their evaluation of the Advisory Agreements by independent legal counsel, from whom they received separate legal advice and with whom they met separately.
In providing information to the Board, Funds Management and the Sub-Adviser were guided by a detailed set of requests for information submitted to them by independent legal counsel on behalf of the Independent Trustees at the start of the Board’s annual contract renewal process earlier in 2021. In considering and approving the Advisory Agreements, the Trustees considered the information they believed relevant, including but not limited to the information discussed below. The Board considered not only the specific information presented in connection with the Meeting, but also the knowledge gained over time through interaction with Funds Management and the Sub-Adviser about various topics. In this regard, the Board reviewed reports of Funds Management at each of its quarterly meetings, which included, among other things, portfolio reviews and investment performance reports. In addition, the Board and the teams mentioned above confer with portfolio managers at various times throughout the year. The Board did not identify any particular information or consideration that was all-important or controlling, and each individual Trustee may have attributed different weights to various factors.
After its deliberations, the Board unanimously determined that the compensation payable to Funds Management and the Sub-Adviser under each of the Advisory Agreements was reasonable, and approved the continuation of the Advisory Agreements for a one-year term. The Board considered the approval of the Advisory Agreements for the Fund as part of its consideration of agreements for funds across the complex, but its approvals were made on a fund-by-fund basis. The following summarizes a number of important, but not necessarily all, factors considered by the Board in support of its approvals.
Nature, extent and quality of services
The Board received and considered various information regarding the nature, extent and quality of services provided to the Fund by Funds Management and the Sub-Adviser under the Advisory Agreements. This information included a description of the investment advisory services and Fund-level administrative services covered by the Management Agreement, as well as, among other things, a summary of the background and experience of senior management of WFAM, of which Funds Management and the Sub-Adviser are a part, and a summary of investments made in the business of WFAM. The Board also received a description of
32 | Wells Fargo Small Cap Fund
Board considerations (unaudited)
Funds Management’s and the Sub-Adviser’s business continuity plans, including a summary of the performance of such plans and any changes thereto during the COVID-19 pandemic, and of their approaches to data privacy and cybersecurity. The Board also received and reviewed information about Funds Management’s role as administrator of the Fund’s liquidity risk management program, Funds Management’s approach to risk management, and Funds Management’s intermediary and vendor oversight program.
The Board also considered the qualifications, background, tenure and responsibilities of each of the portfolio managers primarily responsible for the day-to-day portfolio management of the Fund. The Board evaluated the ability of Funds Management and the Sub-Adviser to attract and retain qualified investment professionals, including research, advisory and supervisory personnel.
The Board further considered the compliance programs and compliance records of Funds Management and the Sub-Adviser. In addition, the Board took into account the full range of services provided to the Fund by Funds Management and its affiliates. The Board also considered information about retention and back-up arrangements that have been put into place with respect to key personnel of WFAM in connection with the anticipated Transaction, noting that WFAM provided assurances that the announcement and eventual culmination of the Transaction is not expected to result in any diminution in the nature or quality of services provided to the Fund.
Fund investment performance and expenses
The Board considered the investment performance results for the Fund over various time periods ended December 31, 2020. The Board considered these results in comparison to the investment performance of funds in a universe that was determined by Broadridge Inc. (“Broadridge”) to be similar to the Fund (the “Universe”), and in comparison to the Fund’s benchmark index and to other comparative data. Broadridge is an independent provider of investment company data. The Board received a description of the methodology used by Broadridge to select the mutual funds in the performance Universe. The Board noted that the investment performance of the Fund (Administrator Class) was higher than or in range of the average investment performance of the Universe for all periods under review. The Board also noted that the investment performance of the Fund was lower than or in range of its benchmark index, the Russell 1000® Index, for all periods under review.
The Board also received and considered information regarding the Fund’s net operating expense ratios and their various components, including actual management fees, custodian and other non-management fees, and Rule 12b-1 and non-Rule 12b-1 shareholder service fees. The Board considered these ratios in comparison to the median ratios of funds in class-specific expense groups that were determined by Broadridge to be similar to the Fund (the “Groups”). The Board received a description of the methodology used by Broadridge to select the mutual funds in the expense Groups and an explanation of how funds comprising expense groups and their expense ratios may vary from year-to-year. Based on the Broadridge reports, the Board noted that the net operating expense ratios of the Fund were lower than the median net operating expense ratios of the expense Groups for each share class.
The Board took into account the Fund’s investment performance and expense information provided to it among the factors considered in deciding to re-approve the Advisory Agreements.
Investment management and sub-advisory fee rates
The Board reviewed and considered the contractual fee rates payable by the Fund to Funds Management under the Management Agreement, as well as the contractual fee rates payable by the Fund to Funds Management for class-level administrative services under a Class-Level Administration Agreement, which include, among other things, class-level transfer agency and sub-transfer agency costs (collectively, the “Management Rates”). The Board also reviewed and considered the contractual investment sub-advisory fee rates that are payable by Funds Management to the Sub-Adviser for investment sub-advisory services.
Among other information reviewed by the Board was a comparison of the Fund’s Management Rates with the average contractual investment management fee rates of funds in the expense Groups at a common asset level as well as transfer agency costs of the funds in the expense Groups. The Board noted that the Management Rates of the Fund were in range of the sum of these average rates for the Fund’s expense Groups for all share classes.
The Board also received and considered information about the portion of the total management fee that was retained by Funds Management after payment of the fee to the Sub-Adviser for sub-advisory services. In assessing the reasonableness of this amount, the Board received and evaluated information about the nature and extent of responsibilities retained and risks assumed by Funds Management and not delegated to or assumed by the Sub-Adviser, and about Funds Management’s on-going oversight services. Given the affiliation between Funds Management and the Sub-Adviser, the Board ascribed limited relevance to the allocation of fees between them.
The Board also received and considered information about the nature and extent of services offered and fee rates charged by Funds Management and the Sub-Adviser to other types of clients with investment strategies similar to those of the Fund. In this
Wells Fargo Small Cap Fund | 33
Board considerations (unaudited)
regard, the Board received information about the significantly greater scope of services, and compliance, reporting and other legal burdens and risks of managing proprietary mutual funds compared with those associated with managing assets of other types of clients, including third-party sub-advised fund clients and non-mutual fund clients such as institutional separate accounts.
Based on its consideration of the factors and information it deemed relevant, including those described here, the Board determined that the compensation payable to Funds Management under the Management Agreement and to the Sub-Adviser under the Sub-Advisory Agreement was reasonable.
Profitability
The Board received and considered information concerning the profitability of Funds Management, as well as the profitability of both WFAM and Wells Fargo & Co. (“Wells Fargo”) from providing services to the fund family as a whole. The Board noted that the Sub-Adviser’s profitability information with respect to providing services to the Fund and other funds in the family was subsumed in the WFAM and Wells Fargo profitability analysis.
Funds Management reported on the methodologies and estimates used in calculating profitability, including a description of the methodology used to allocate certain expenses. Among other things, the Board noted that the levels of profitability reported on a fund-by-fund basis varied widely, depending on factors such as the size, type and age of fund.
Based on its review, the Board did not deem the profits reported by Funds Management, WFAM or Wells Fargo from services provided to the Fund to be at a level that would prevent it from approving the continuation of the Advisory Agreements.
Economies of scale
The Board received and considered information about the potential for Funds Management to experience economies of scale in the provision of management services to the Fund, the difficulties of calculating economies of scale at an individual fund level, and the extent to which potential scale benefits are shared with Fund shareholders. The Board noted the existence of breakpoints in the Fund’s management fee structure, which operate generally to reduce the Fund’s expense ratios as the Fund grows in size, and the size of the Fund in relation to such breakpoints. The Board considered that in addition to management fee breakpoints, Funds Management shares potential economies of scale from its management business in a variety of ways, including through fee waiver and expense reimbursement arrangements, competitive management fee rates set at the outset without regard to breakpoints, and investments in the business intended to enhance services available to shareholders.
The Board concluded that Funds Management’s arrangements with respect to the Fund, including contractual breakpoints, constituted a reasonable approach to sharing potential economies of scale with the Fund and its shareholders.
Other benefits to Funds Management and the Sub-Adviser
The Board received and considered information regarding potential “fall-out” or ancillary benefits received by Funds Management and its affiliates, including the Sub-Adviser, as a result of their relationships with the Fund. Ancillary benefits could include, among others, benefits directly attributable to other relationships with the Fund and benefits potentially derived from an increase in Funds Management’s and the Sub-Adviser’s business as a result of their relationships with the Fund. The Board noted that various affiliates of Funds Management may receive distribution-related fees, shareholder servicing payments and sub-transfer agency fees in respect of shares sold or held through them and services provided.
The Board also reviewed information about soft dollar credits earned and utilized by the Sub-Adviser, fees earned by Funds Management and the Sub-Adviser from managing a private investment vehicle for the fund family’s securities lending collateral and commissions earned by an affiliated broker from portfolio transactions.
Based on its consideration of the factors and information it deemed relevant, including those described here, the Board did not find that any ancillary benefits received by Funds Management and its affiliates, including the Sub-Adviser, were unreasonable.
Conclusion
At the Meeting, after considering the above-described factors and based on its deliberations and its evaluation of the information described above, the Board unanimously determined that the compensation payable to Funds Management and the Sub-Adviser under each of the Advisory Agreements was reasonable, and approved the continuation of the Advisory Agreements for a one-year term.
34 | Wells Fargo Small Cap Fund
Board considerations (unaudited)
Board Considerations – New Agreements
Overview of the Board evaluation process
At a meeting held on May 17-19, 2021 (the “Board Meeting”), the Board of Trustees (the “Board”) of Wells Fargo Funds Trust (the “Trust”, and the series identified below, the “Funds”) approved the continuation of each Fund’s current Investment Management Agreement (the “Current Investment Management Agreement”) and the current Sub-Advisory Agreements (the “Current Sub-Advisory Agreements”, and collectively, the “Current Agreements”).
| Wells Fargo C&B Mid Cap Value Fund |
| Wells Fargo California Limited-Term Tax-Free Fund |
| Wells Fargo California Tax-Free Fund |
| Wells Fargo Classic Value Fund |
| Wells Fargo Common Stock Fund |
| Wells Fargo Disciplined Small Cap Fund |
| Wells Fargo Disciplined U.S. Core Fund |
| Wells Fargo Discovery Fund |
| Wells Fargo Diversified Equity Fund |
| Wells Fargo Endeavor Select Fund |
| Wells Fargo Enterprise Fund |
| Wells Fargo Fundamental Small Cap Growth Fund |
| Wells Fargo Growth Fund |
| Wells Fargo High Yield Municipal Bond Fund |
| Wells Fargo Intermediate Tax/AMT-Free Fund |
| Wells Fargo Large Cap Core Fund |
| Wells Fargo Large Cap Growth Fund |
| Wells Fargo Large Company Value Fund |
| Wells Fargo Minnesota Tax-Free Fund |
| Wells Fargo Municipal Bond Fund |
| Wells Fargo Omega Growth Fund |
| Wells Fargo Opportunity Fund |
| Wells Fargo Pennsylvania Tax-Free Fund |
| Wells Fargo Premier Large Company Growth Fund |
| Wells Fargo Short-Term Municipal Bond Fund |
| Wells Fargo Small Cap Fund |
| Wells Fargo Special Mid Cap Value Fund |
| Wells Fargo Special Small Cap Value Fund |
| Wells Fargo Strategic Municipal Bond Fund |
| Wells Fargo Ultra Short-Term Municipal Income Fund |
| Wells Fargo Wisconsin Tax-Free Fund |
Each Trustee on the Board is not an “interested person” (as defined in the Investment Company Act of 1940 (the “1940 Act”)) of the Funds (collectively, the “Independent Trustees”). The process followed by the Board in considering and approving the continuation of the Current Agreements is referred to herein as the “2021 Annual Approval Process.”
As noted above, the closing of the sale of Wells Fargo Asset Management (“WFAM”) to a holding company (“NewCo”) affiliated with private funds of GTCR LLC (“GTCR”) and of Reverence Capital Partners, L.P. (“Reverence Capital”, and such transaction, the “Transaction”) will result in a change of control of Wells Fargo Funds Management LLC (“Funds Management”) and Wells Capital Management Incorporated (“Wells Capital”, and together with Funds Management, the “Advisers”), which will be considered to be an “assignment” of each Fund’s Current Agreements under the 1940 Act that will result in the automatic termination of each Fund’s Current Agreements. In light of the expected termination of each Fund’s Current Agreements upon the closing, at the Board Meeting the Board also considered and approved the New Agreements, which are: (i) a new Investment Management Agreement (the “New Investment Management Agreement”) between the Trust, on behalf of each Fund, and Funds Management; (ii) a new Sub-Advisory Agreement (the “New Wells Capital Sub-Advisory Agreement”) among the Trust, Funds Management and Wells Capital with respect to each Fund other than C& B Mid Cap Value Fund and Diversified Equity Fund; and (iii) a new Sub-Advisory Agreement (the “New C&B Sub-Advisory Agreement”, and collectively, the “New Agreements”) among the Trust, with respect to the C&B Mid Cap Value Fund, Funds Management and Cooke & Bieler, L.P. (“C&B”, and together with Wells Capital, the “Sub-Advisers”), each of which is intended to go into effect upon the closing. The process followed by the Board in reviewing and approving the New Agreements is referred to herein as the “New Agreement Approval Process.”
Wells Fargo Small Cap Fund | 35
Board considerations (unaudited)
At a series of meetings held in April and May 2021 (collectively, “April and May 2021 Meetings”) and at the Board Meeting, the Trustees conferred extensively among themselves and with senior representatives of Funds Management, GTCR and Reverence Capital about the New Agreements and related matters. The Board reviewed and discussed information furnished by Funds Management, GTCR and Reverence Capital that the Board considered reasonably necessary to evaluate the terms of the New Agreements and the services to be provided. At these meetings, senior representatives from Funds Management, GTCR and Reverence Capital made presentations to, and responded to questions from, the Board.
In providing information to the Board in connection with the 2021 annual approval process (the “2021 Annual Approval Process”) and the New Agreement Approval Process, Funds Management, GTCR and Reverence Capital (as applicable) were guided by requests for information submitted by independent legal counsel on behalf of the Independent Trustees. In considering and approving the New Agreements, the Trustees considered the information they believed relevant, including but not limited to the information discussed herein. The Board considered not only the specific information presented in connection with the April and May 2021 Meetings as well as the Board Meeting, but also the knowledge gained over time through interaction with Funds Management and the Sub-Advisers about various topics. In this regard, the Board reviews reports of Funds Management at each of its regular Board meetings, which includes, among other things, portfolio reviews and investment performance reports. In addition, the Board confers with portfolio managers at various times throughout the year. The Board was assisted in its evaluation of the New Agreements by independent legal counsel, from whom the Independent Trustees received separate legal advice and with whom the Independent Trustees met separately. The Board did not identify any particular information or consideration that was all-important or controlling, and each individual Trustee may have attributed different weights to various factors.
Among other information considered by the Board in connection with the Transaction was:
| ■ | Information regarding the Transaction: information about the structure, financing sources and material terms and conditions of the Transaction, including the expected impact on the businesses conducted by the Advisers and by Wells Fargo Funds Distributor LLC, as the distributor of Fund shares. |
| ■ | Information regarding NewCo, GTCR and Reverence Capital: (i) information about NewCo, including information about its expected financial condition and access to capital, and senior leadership team; (ii) the experience of senior management at GTCR and Reverence Capital in acquiring portfolio companies; (iii) the plan to operationalize NewCo, including the transition of necessary infrastructure services through a transition services agreement with Wells Fargo under which Wells Fargo will continue to provide NewCo with certain services for a specified period of time after the closing; and (iv) information regarding regulatory matters, compliance, and risk management functions at NewCo, including resources to be dedicated thereto. |
| ■ | Impact of the Transaction on WFAM and Service Providers: (i) information regarding any changes to personnel and/or other resources of the Advisers as a result of the Transaction, including assurances regarding comparable and competitive compensation arrangements to attract and retain highly qualified personnel; and (ii) information about the organizational and operating structure with respect to NewCo, the Advisers and the Funds. |
| ■ | Impact of the Transaction on the Funds and their Shareholders: (i) information regarding anticipated benefits to the Funds as a result of the Transaction; (ii) a commitment that the Funds would not bear any expenses, directly or indirectly, in connection with the Transaction; (iii) confirmation that the Advisers intend to continue to manage the Funds in a manner consistent with each Fund’s current investment objectives and principal investments strategies; and (iv) a commitment that neither NewCo nor WFAM will take any steps that would impose any “unfair burden” (as that term is used in section 15(f)(1)(B) of the 1940 Act) on the Funds as a result of the Transaction. |
With respect to the New Agreements, the Board considered: (i) a representation that, after the closing, all of the Funds will continue to be managed and advised by their current Advisers and for C&B Mid Cap Value Fund, C&B, and that the same portfolio managers of the Sub-Advisers are expected to continue to manage the Funds after the Transaction; (ii) information regarding the terms of the New Agreements, including changes as compared to the Current Agreements; (iii) information confirming that the fee rates payable under the New Agreements will not increase as a result of the Transaction as compared to the rates under the Current Agreements; and (iv) assurances that the Transaction is not expected to cause any diminution with respect to the nature, extent and quality of any of the services currently provided to the Funds by the Advisers as a result of the Transaction.
In addition to considering information furnished specifically to evaluate the impact of the Transaction on the Funds and their respective shareholders in connection with the New Agreement Approval Process, the Board considered information furnished at prior meetings of the Board and its committees, including detailed information provided in connection with the 2021 Annual Approval Process. In this regard, in connection with the 2021 Annual Approval Process, the Board received information about complex-wide and individual Fund performance, fees and expenses, including: (i) a report from an independent data provider comparing the investment performance of each Fund to the investment performance of comparable funds and benchmark indices, over various time periods; (ii) a report from an independent data provider comparing each Fund’s total expense ratio (and
36 | Wells Fargo Small Cap Fund
Board considerations (unaudited)
its components) to those of comparable funds; (iii) comparative information concerning the fees charged and services provided by Funds Management and the Sub-Advisers to each Fund in managing other accounts (which may include other mutual funds, collective investment funds and institutional accounts), if any, that employ investment strategies and techniques similar to those used in managing such Fund(s); and (iv) profitability analyses of Funds Management, as well as the profitability of both WFAM and Wells Fargo from providing services to the fund family as a whole.
After its deliberations, the Board unanimously determined that the compensation payable to Funds Management and the Sub-Advisers under the New Agreements is reasonable, approved the New Agreements for a two-year term, and voted to recommend that Fund shareholders approve the New Agreements. The Board considered the approval of the New Agreements as part of its consideration of agreements for funds across the complex, but its approvals were made on a fund-by-fund basis. The following summarizes a number of important, but not necessarily all, factors considered by the Board in support of its approvals.
Nature, extent and quality of services
In connection with the 2021 Annual Approval Process, the Board received and considered various information regarding the nature, extent and quality of services provided to the Fund by Funds Management and the Sub-Advisers under the Advisory Agreements. This information included a description of the investment advisory services and Fund-level administrative services covered by the Current Management Agreement, as well as, among other things, a summary of the background and experience of senior management of WFAM, of which Funds Management and Wells Capital are a part, and a summary of investments made in the business of WFAM. The Board also received a description of Funds Management’s and the Sub-Advisers’ business continuity plans, including a summary of the performance of such plans and any changes thereto during the COVID-19 pandemic, and of their approaches to data privacy and cybersecurity. The Board also received and reviewed information about Funds Management’s role as administrator of the Funds’ liquidity risk management program, Funds Management’s approach to risk management, and Funds Management’s intermediary and vendor oversight program.
In connection with the 2021 Annual Approval Process, the Board also considered the qualifications, background, tenure and responsibilities of each of the portfolio managers primarily responsible for the day-to-day portfolio management of the Funds. The Board evaluated the ability of Funds Management and the Sub-Advisers to attract and retain qualified investment professionals, including research, advisory and supervisory personnel.
In connection with the 2021 Annual Approval Process, the Board further considered the compliance programs and compliance records of Funds Management and the Sub-Advisers. In addition, the Board took into account the full range of services provided to the Fund by Funds Management and its affiliates.
In connection with the New Agreement Approval Process, the Board considered, among other information, the structure of the Transaction and expected impact, if any, of the Transaction on the operations, facilities, organization and personnel of Funds Management and the Sub-Advisers. The Board received assurances from Funds Management that each Fund will continue to be advised by its current Sub-Adviser after the closing, and that the same individual portfolio managers are expected to continue to manage the Funds after the closing. With respect to the recruitment and retention of key personnel, the Board noted information from GTCR, Reverence Capital and the Advisers regarding the potential benefits for employees of joining NewCo. The Board recognized that the personnel who had been extended offers may not accept such offers and personnel changes may occur in the future in the ordinary course.
In addition, the Board considered information regarding the infrastructure, operational capabilities and support staff in place to assist in the portfolio management and operations of the Funds, including the provision of administrative services, and the anticipated impact of the Transaction on such matters. The Board also considered the business-related and other risks to which the Advisers may be subject in managing the Funds and in connection with the Transaction. The Board also considered the transition and integration plans as a result of the change in ownership of the Advisers from Wells Fargo to NewCo. The Board considered the resources and infrastructure that NewCo intends to devote to its compliance program to ensure compliance with applicable laws and regulations, as well as its risk management program and cybersecurity program. The Board also took into account assurances received from the Advisers, GTCR and Reverence Capital that the Transaction is not expected to cause any diminution in the nature, extent and quality of services provided by Funds Management and the Sub-Advisers to the Funds and their shareholders.
Fund investment performance and expenses
In connection with the 2021 Annual Approval Process, the Board considered the investment performance results for each Fund over various time periods ended December 31, 2020. The Board considered these results in comparison to the investment performance of funds in a universe that was determined by Broadridge Inc. (“Broadridge”) to be similar to each Fund (the “Universe”), and in comparison to each Fund’s benchmark index and to other comparative data. Broadridge is an independent provider of investment company data. The Board received a description of the methodology used by Broadridge to select the
Wells Fargo Small Cap Fund | 37
Board considerations (unaudited)
mutual funds in the performance Universe. Where applicable, the Board received information concerning, and discussed factors contributing to, underperformance of Funds relative to the Universe and benchmark for any underperformance periods.
In connection with the 2021 Annual Approval Process, the Board also received and considered information regarding each Fund’s net operating expense ratios and their various components, including actual management fees, custodian and other non-management fees, and Rule 12b-1 and non-Rule 12b-1 shareholder service fees. The Board considered these ratios in comparison to the median ratios of funds in class-specific expense groups that were determined by Broadridge to be similar to the Fund (the “Groups”). The Board received a description of the methodology used by Broadridge to select the mutual funds in the expense Groups and an explanation of how funds comprising expense groups and their expense ratios may vary from year-to-year.
In connection with the New Agreement Approval Process, the Board received a commitment that WFAM will maintain fee and expense commitments for at least two years after the closing. The Board took into account each Fund’s investment performance and expense information among the factors considered in deciding to approve the New Agreements.
Investment management and sub-advisory fee rates
In connection with the 2021 Annual Approval Process, the Board reviewed and considered the contractual fee rates payable by each Fund to Funds Management under the Current Management Agreement, as well as the contractual fee rates payable by each Fund to Funds Management for class-level administrative services under a Class-Level Administration Agreement, which include, among other things, class-level transfer agency and sub-transfer agency costs (collectively, the “Management Rates”). The Board also reviewed and considered the contractual investment sub-advisory fee rates that are payable by Funds Management to each of the Sub-Advisers under the Current Sub-Advisory Agreements for investment sub-advisory services (the “Sub-Advisory Fee Rates”).
Among other information reviewed by the Board in connection with the 2021 Annual Approval Process, was a comparison of each Fund’s Management Rates with the average contractual investment management fee rates of funds in the expense Groups at a common asset level as well as transfer agency costs of the funds in the expense Groups.
In connection with the 2021 Annual Approval Process, the Board also received and considered information about the portion of the total management fee that was retained by Funds Management after payment of the Sub-Advisory Fee Rates. In assessing the reasonableness of this amount, the Board received and evaluated information about the nature and extent of responsibilities retained and risks assumed by Funds Management and not delegated to or assumed by the Sub-Advisers, and about Funds Management’s on-going oversight services. With respect to C&B, the Board also considered this amount in comparison to the median amount retained by advisers to funds in a sub-advised expense universe that was determined by Broadridge to be similar to the Specialized Technology Fund. In this regard, the Board noted the small size of the sub-advised expense universe. The Board also considered that the sub-advisory fees paid to C&B had been negotiated by Funds Management on an arm’s length basis. Given the affiliation between Funds Management and Wells Capital, the Board ascribed limited relevance to the allocation of fees between them.
In connection with the 2021 Annual Approval Process, the Board also received and considered information about the nature and extent of services offered and fee rates charged by Funds Management and the Sub-Advisers to other types of clients, if any, with investment strategies similar to those of each Fund. In this regard, the Board received information about the significantly greater scope of services, and compliance, reporting and other legal burdens and risks of managing proprietary mutual funds compared with those associated with managing assets of other types of clients, including third-party sub-advised fund clients and non-mutual fund clients such as institutional separate accounts.
In connection with the New Agreement Approval Process, the Board noted the assurances received by it that there would be no increases to any of the Management Rates or the Sub-Advisory Fee Rates as a result of the Transaction. The Board also considered that the New Agreements do not change the computation method for calculating such fees, and there is no present intention to reduce expense waiver and reimbursement arrangements that are currently in effect. Based on its consideration of the factors and information it deemed relevant, including those described here, the Board determined that the compensation payable to Funds Management under the New Management Agreement and to each of the Sub-Advisers under the New Sub-Advisory Agreements was reasonable.
Profitability
In connection with the 2021 Annual Approval Process, the Board received and considered information concerning the profitability of Funds Management, as well as the profitability of both WFAM and Wells Fargo from providing services to the fund family as a whole. The Board noted that Wells Capital’s profitability information with respect to providing services to each Fund Wells Capital
38 | Wells Fargo Small Cap Fund
Board considerations (unaudited)
sub-advises and other funds in the family was subsumed in the WFAM and Wells Fargo profitability analysis. The Board did not consider profitability with respect to C&B, as the sub-advisory fees paid to C&B had been negotiated by Funds Management on an arm’s-length basis.
Funds Management reported on the methodologies and estimates used in calculating profitability in connection with the 2021 Annual Approval Process, including a description of the methodology used to allocate certain expenses. Among other things, the Board noted that the levels of profitability reported on a fund-by-fund basis varied widely, depending on factors such as the size, type and age of fund.
In connection with the New Agreement Approval Process, the Board received certain information about NewCo’s projected financial condition, and reviewed with senior representatives of Funds Management, GTCR and Reverence Capital the underlying assumptions on which such information was based. The Board considered that NewCo is a newly formed entity, with no historical operations, revenues or expenses, and that it is difficult to predict with any degree of certainty the future profitability of NewCo and the Advisers from advisory activities under the New Agreements. The Board considered that the fee rates payable under the New Agreements will not increase as a result of the Transaction as compared to the rates under the Current Agreements, and that the current contractual expense limitations applicable to each Fund will not increase. The Board noted that if the New Agreements are approved by shareholders and the Transaction closes, the Board will have the opportunity in the future to review the profitability of NewCo and the Advisers from advisory activities under the New Agreements.
Economies of scale
In connection with the 2021 Annual Approval Process, the Board received and considered information about the potential for Funds Management to experience economies of scale in the provision of management services to the Funds, the difficulties of calculating economies of scale at an individual fund level, and the extent to which potential scale benefits are shared with Fund shareholders. The Board noted the existence of breakpoints in each Fund’s management fee structure, which operate generally to reduce the Fund’s expense ratios as the Fund grows in size, and the size of the Fund in relation to such breakpoints. The Board considered that, in addition to management fee breakpoints, Funds Management shares potential economies of scale from its management business in a variety of ways, including through fee waiver and expense reimbursement arrangements, competitive management fee rates set at the outset without regard to breakpoints, and investments in the business intended to enhance services available to shareholders.
In connection with the New Agreement Approval Process, the Board noted that NewCo and the Advisers may benefit from possible growth of the Funds resulting from enhanced distribution capabilities. However, the Board noted that other factors could also affect the potential for economies of scale, and that it was not possible to quantify any potential future economies of scale. Based upon the information furnished to the Board in connection with the 2021 Annual Approval Process and the New Agreement Approval Process, the Board concluded that Funds Management’s arrangements with respect to each Fund, including contractual breakpoints and expense limitation arrangements, constituted a reasonable approach to sharing potential economies of scale with the Fund and its shareholders.
“Fall-out” benefits to Funds Management and the Sub-Advisers
In connection with the 2021 Annual Approval Process, the Board received and considered information regarding potential “fall-out” or ancillary benefits received by Funds Management and its affiliates, including Wells Capital, and C&B as a result of their relationships with the Funds. Ancillary benefits could include, among others, benefits directly attributable to other relationships with the Funds and benefits potentially derived from an increase in Funds Management’s and the Sub-Advisers’ business as a result of their relationships with the Funds. The Board noted that various current affiliates of Funds Management may receive distribution-related fees, shareholder servicing payments and sub-transfer agency fees in respect of shares sold or held through them and services provided.
In connection with the 2021 Annual Approval Process, the Board also reviewed information about soft dollar credits earned and utilized by the Sub-Advisers, fees earned by Funds Management and Wells Capital from managing a private investment vehicle for the fund family’s securities lending collateral, and commissions earned by an affiliated broker of Wells Fargo from portfolio transactions.
In connection with the New Agreement Approval Process, the Board received information to the effect that the Transaction is not expected to have a material impact on the fall-out benefits currently realized by Funds Management and its affiliates, including Wells Capital, and C&B. The information reviewed by the Board also noted that several of the ancillary benefits identified for WFAM would be potential ancillary benefits for NewCo, including that the scale and reputation of the Funds might benefit NewCo’s broader reputation, product initiatives, technology investment and talent acquisition. Based on its consideration of the
Wells Fargo Small Cap Fund | 39
Board considerations (unaudited)
factors and information it deemed relevant, including those described here, the Board did not find that any ancillary benefits expected to be received by Funds Management and its affiliates, including NewCo and Wells Capital, and C&B under the New Agreements were unreasonable.
Conclusion
At the Board Meeting, after considering the above-described factors and based on its deliberations and its evaluation of the information described above, the Board unanimously determined that the compensation payable to Funds Management and to each of the Sub-Advisers under the New Agreements is reasonable, approved the New Agreements for a two-year term, and voted to recommend that Fund shareholders approve the New Agreements.
40 | Wells Fargo Small Cap Fund
Board considerations (unaudited)
Board Considerations - Interim Agreements
At a meeting held on May 17-19, 2021 (the “Board Meeting”), the Boards of Trustees (each, a “Board”, and collectively, the “Boards”) of Wells Fargo Funds Trust, Wells Fargo Master Trust, Wells Fargo Variable Trust, Wells Fargo Global Dividend Opportunity Fund, Wells Fargo Income Opportunities Fund, Wells Fargo Multi-Sector Income Fund and Wells Fargo Utilities and High Income Fund (each a “Trust”, and the series thereof, a “Fund”) reviewed and approved for the Trusts and Funds, as applicable: (i) interim investment management agreements (the “Interim Management Agreements”) with Wells Fargo Funds Management, LLC (“Funds Management”); (ii) interim investment advisory agreements (the “Interim Advisory Agreements”) with Funds Management; and (iii) interim sub-advisory agreements (the “Interim Sub-Advisory Agreements”) with each of Cooke & Bieler, L.P., Galliard Capital Management LLC (“Galliard”), Peregrine Capital Management Inc., Wells Capital Management, LLC (“WellsCap”), and Wells Fargo Asset Management (International) Limited (“WFAMI”, and collectively, the “Sub-Advisers”). Each Trustee on the Board is not an “interested person” (as defined in the Investment Company Act of 1940 (the “1940 Act”) of the Funds (collectively, the “Independent Trustees”). The Interim Management Agreements, Interim Advisory Agreements, and Interim Sub-Advisory Agreements are collectively referred to as the “Interim Advisory Agreements.”
At the Board Meeting, the Boards reviewed and approved the continuation of existing investment management, advisory and sub-advisory agreements (the “Current Advisory Agreements”) for each Trust and Fund, as applicable. The factors considered and conclusions reached by the Boards in approving the Current Advisory Agreements are summarized in the section entitled “Board Considerations – Current Agreements” of this shareholder report. The Boards noted that Wells Fargo & Company has entered into a definitive agreement to sell Wells Fargo Asset Management (“WFAM”), which includes Funds Management, Galliard, WellsCap and WFAMI (the “Affiliated Sub-Advisers”), to a holding company affiliated with private funds of GTCR LLC and Reverence Capital Partners, L.P. (the “Transaction”). The Boards further noted that the Transaction would result in a change-of-control of Funds Management and the Affiliated Sub-Advisers, which would be considered to be an “assignment” under the 1940 Act that would terminate the Current Advisory Agreements. At the Board Meeting, the Boards also reviewed and approved new investment management, advisory and sub-advisory agreements (the “New Advisory Agreements”) for each Trust and Fund, as applicable, that would replace the Current Advisory Agreements upon consummation of the Transaction, subject to approval of the New Advisory Agreements by the applicable Trust’s or Fund’s shareholders. The factors considered and conclusions reached by the Boards in approving the New Advisory Agreements are summarized in the section entitled “Board Considerations – New Agreements” of this shareholder report.
At the Board Meeting, the Boards also approved the Interim Advisory Agreements, which will go into effect for a Trust or Fund only in the event that shareholders of such Trust or Fund do not approve the New Advisory Agreement(s) for the Trust or Fund by the closing date of the Transaction, when the Current Advisory Agreements will terminate. The Board noted that, in such a circumstance, the Interim Advisory Agreements will permit continuity of management by allowing Funds Management and the Sub-Advisers to continue providing services to the Trust or Fund pursuant to the Interim Advisory Agreements while the Trust or Fund continues to solicit shareholder approval of such New Advisory Agreement(s). The Boards noted that the terms of the Interim Advisory Agreements are identical to those of the Current Advisory Agreements, except for the term and the addition of escrow provisions with respect to the advisory fees. The Boards also noted that the entities that would service the Funds and Trusts under the Interim Advisory Agreements are identical to those that provide services under the Current Advisory Agreements and those that will provide services under the New Advisory Agreements.
In approving the Interim Advisory Agreements, the Boards considered the same factors and reached the same conclusions as they considered and reached with respect to the Boards’ approvals of the Current Advisory Agreements and New Advisory Agreements, as applicable, which are described in separate Board Consideration sections within this shareholder report. Prior to the Board Meeting, including at a series of meetings held in April and May 2021, the Trustees conferred extensively among themselves and with senior representatives of Funds Management, GTCR LLC and Reverence Capital Partners, L.P. about the Interim Advisory Agreements and related matters. The Independent Trustees were assisted in their evaluation of the Interim Advisory Agreements by independent legal counsel, from whom they received separate legal advice and with whom they met separately.
At the Board Meeting, after considering the factors and reaching the conclusions described in the separate Board Consideration sections within this shareholder report, the Boards unanimously determined that the compensation payable to Funds Management and to each Sub-Adviser under each of the Interim Advisory Agreements was reasonable, and approved the Interim Advisory Agreements.
Wells Fargo Small Cap Fund | 41
For more information
More information about Wells Fargo Funds is available free upon request. To obtain literature, please write, visit the Fund's website, or call:
Wells Fargo Funds
P.O. Box 219967
Kansas City, MO 64121-9967
Website: allspringglobal.com
Individual investors: 1-800-222-8222
Retail investment professionals: 1-888-877-9275
Institutional investment professionals: 1-866-765-0778
This report and the financial statements contained herein are submitted for the general information of the shareholders of the Fund. If this report is used for promotional purposes, distribution of the report must be accompanied or preceded by a current prospectus. Before investing, please consider the investment objectives, risks, charges, and expenses of the investment. For a current prospectus and, if available, a summary prospectus, containing this information, call
1-800-222-8222 or visit the Fund's website at allspringglobal.com. Read the prospectus carefully before you invest or send money.
Allspring Global InvestmentsTM is the trade name for the asset management firms of Allspring Global Investments Holdings, LLC, a holding company indirectly owned by certain private funds of GTCR LLC and Reverence Capital Partners, L.P. These firms include but are not limited to Allspring Global Investments, LLC, and Allspring Funds Management, LLC. Certain products managed by Allspring entities are distributed by Allspring Funds Distributor, LLC (a broker-dealer and Member FINRA/SIPC).
This material is for general informational and educational purposes only and is NOT intended to provide investment advice or a recommendation of any kind - including a recommendation for any specific investment, strategy, or plan.
© 2021 Allspring Global Investments. All rights reserved.
PAR-1121-00198 09-21
SA242/SAR242 09-21
Semi-Annual Report
September 30, 2021
Wells Fargo
Special Small Cap Value Fund
Reduce clutter.
Save trees.
Sign up for electronic delivery of prospectuses and shareholder reports at wellsfargo.com/ advantagedelivery
The views expressed and any forward-looking statements are as of September 30, 2021, unless otherwise noted, and are those of the Fund's portfolio managers and/or Allspring Global Investments. Discussions of individual securities or the markets generally are not intended as individual recommendations. Future events or results may vary significantly from those expressed in any forward-looking statements. The views expressed are subject to change at any time in response to changing circumstances in the market. Allspring Global Investments disclaims any obligation to publicly update or revise any views expressed or forward-looking statements.
Wells Fargo Special Small Cap Value Fund | 1
Letter to shareholders (unaudited)
Andrew Owen
President
Wells Fargo Funds
Dear Shareholder:
We are pleased to offer you this semi-annual report for Wells Fargo Special Small Cap Value Fund for the six-month period that ended September 30, 2021. Global stocks continued to rally as the global economy continued to emerge from the haze of COVID-19. Tailwinds were provided by global stimulus programs, a rapid vaccination rollout, and recovering consumer and corporate sentiment. Bonds were mixed during the period, with municipal bonds and high-yield bonds delivering positive returns.
For the six-month period, U.S. stocks, based on the S&P 500 Index,1 gained 9.18%. International stocks, as measured by the MSCI ACWI ex USA Index (Net),2 returned 2.32%, while the MSCI EM Index (Net),3 trailed its developed market counterparts with a 3.45% loss. Among bond indexes, the Bloomberg U.S. Aggregate Bond Index,4 returned 1.88%, the Bloomberg Global Aggregate ex-USD Index (unhedged),5 returned -0.69%, the Bloomberg Municipal Bond Index6 returned 1.15%, and the ICE BofA U.S. High Yield Index,7 gained 3.74%.
Vaccination rollout drove the stock markets to new highs.
Equity markets produced another strong showing in April. Domestically, the continued reopening of the economy had a strong impact on positive equity performance, as people started leaving their households and jobless claims continued to fall. Domestic corporate bonds performed well and the U.S. dollar weakened. Meanwhile, the U.S. government continued to seek to invest in the recovery, this time by outlining a package of over $2 trillion to improve infrastructure. The primary headwind in April was inflation, as investors tried to determine the breadth and longevity of recent price increases. Developed Europe has been supported by a meaningful increase in the pace of vaccinations. Unfortunately many emerging market countries have not been as successful. India in particular saw COVID-19 cases surge, serving as an example of the need to get vaccinations rolled out to less developed nations.
| 1 | The S&P 500 Index consists of 500 stocks chosen for market size, liquidity, and industry group representation. It is a market-value-weighted index with each stock's weight in the index proportionate to its market value. You cannot invest directly in an index. |
| 2 | The Morgan Stanley Capital International (MSCI) All Country World Index (ACWI) ex USA Index (Net) is a free-float-adjusted market-capitalization-weighted index that is designed to measure the equity market performance of developed and emerging markets, excluding the U.S. Source: MSCI. MSCI makes no express or implied warranties or representations and shall have no liability whatsoever with respect to any MSCI data contained herein. The MSCI data may not be further redistributed or used as a basis for other indexes or any securities or financial products. This report is not approved, reviewed, or produced by MSCI. You cannot invest directly in an index. |
| 3 | The MSCI Emerging Markets (EM) Index (Net) is a free-float-adjusted market-capitalization-weighted index that is designed to measure equity market performance of emerging markets. You cannot invest directly in an index. |
| 4 | The Bloomberg U.S. Aggregate Bond Index is a broad-based benchmark that measures the investment-grade, U.S.-dollar-denominated, fixed-rate taxable bond market, including Treasuries, government-related and corporate securities, mortgage-backed securities (agency fixed-rate and hybrid adjustable-rate mortgage pass-throughs), asset-backed securities, and commercial mortgage-backed securities. You cannot invest directly in an index. |
| 5 | The Bloomberg Global Aggregate ex-USD Index (unhedged) is an unmanaged index that provides a broad-based measure of the global investment-grade fixed-income markets excluding the U.S.-dollar-denominated debt market. You cannot invest directly in an index. |
| 6 | The Bloomberg Municipal Bond Index is an unmanaged index composed of long-term tax-exempt bonds with a minimum credit rating of Baa. You cannot invest directly in an index. |
| 7 | The ICE BofA U.S. High Yield Index is a market-capitalization-weighted index of domestic and Yankee high-yield bonds. The index tracks the performance of high-yield securities traded in the U.S. bond market. You cannot invest directly in an index. Copyright 2021. ICE Data Indices, LLC. All rights reserved. |
2 | Wells Fargo Special Small Cap Value Fund
Letter to shareholders (unaudited)
Vaccine rollouts continued in May, leading to loosened restrictions globally. As a result, equity markets in general saw a minor increase in returns. Concerns that the continued economic rebound could result in inflation increases becoming more than transitory were supported by the higher input costs businesses were experiencing. Meanwhile, those inflation concerns were tempered by the U.S. Federal Reserve (Fed), which stayed steady on its view of the economy and eased fears of a sudden and substantial policy change. Positive performance in the emerging market equity space was supported this month by steady consumer demand and strong commodity prices. Fixed-income markets were also slightly positive for the month, driven by inflation uncertainty and a softer U.S. dollar.
June witnessed the S&P 500 Index reach a new all-time high. 2021 economic growth and inflation forecasts were revised higher to reflect a strong economic recovery and some supply and demand imbalances. Late June saw a deal reached on a U.S. infrastructure package of approximately $1 trillion for road, bridge, and broadband network upgrades over the next eight years. The Fed’s June meeting yielded no change to policy, but its projections pointed to a possible interest rate rise in 2023. This, combined with a rebound in economic activity and investors searching for yield, led to U.S. Treasury yields being down for the month. Many European and Asian countries saw vaccination momentum increase, while the U.K. dealt with a rise in COVID-19 infections, specifically the Delta variant. Meanwhile, crude oil jumped over 10% in June on the back of the pickup in global economic activity and the Organization of the Petroleum Exporting Countries’ (OPEC) slow pace of supply growth.
July began the month seeing vaccinations making progress, as several major developed countries eased restrictions, only to be threatened again by the spread of COVID-19’s Delta variant. Inflation continued to climb, aided by the continued supply bottleneck in the face of high demand. As it pertains to the equity area of the market, U.S. equities led the way in positive return territory, followed by international developed markets. In contrast, emerging markets were well in negative territory for the month, hindered by China’s plans for new regulations on a number of sectors, specifically education and technology. The U.S. 10-Year Treasury bond yield continued to decline, as strong demand swallowed up supply. After hitting a multi-year high earlier in the month, oil prices leveled off following an agreement by OPEC to raise oil production starting in August.
The Delta variant of COVID-19 produced outbreaks globally in August, increasing the potential for increased market volatility and bringing into question the ongoing economic recovery. Domestically, the U.S. economy continued to stay strong in the face of the Delta variant, continued inflationary pressures, and worries over Hurricane Ida. Emerging market equities experienced elevated volatility, largely influenced by China’s regulatory stance. Emerging market equities started the month with poor performance but rebounded to end the month in positive territory. Municipal debt experienced its first monthly performance drop since February of this year, slowing a rally that made it one of the best-performing sectors of the bond market. In the commodity segment of the market, crude oil fell sharply during the month on the back of dampened expectations as a result of the Delta variant but was still a leading asset class performer for the year.
Global markets suffered their broadest retreat in a year during September, with the exception of commodities. Concerns over inflation and the interest rate outlook depressed investor confidence and hurt performance. Emerging markets declined on concerns over the continued supply chain disruptions and worries over higher energy and food prices. Meanwhile, the Fed indicated it would slow the pace of asset purchases in the near future (pointing towards November). All eyes domestically are fixed on the raising of the debt ceiling, the 2022 budget plan, and the ongoing debate over the infrastructure package. Contrary to most asset classes, commodities thrived in September, driven by sharply higher energy prices.
“ 2021 economic growth and inflation forecasts were revised higher to reflect a strong economic recovery and some supply and demand imbalances.”
“ Municipal debt experienced its first monthly performance drop since February of this year, slowing a rally that made it one of the best-performing sectors of the bond market.”
Wells Fargo Special Small Cap Value Fund | 3
Letter to shareholders (unaudited)
Don’t let short-term uncertainty derail long-term investment goals.
Periods of investment uncertainty can present challenges, but experience has taught us that maintaining long-term investment goals can be an effective way to plan for the future. To help you create a sound strategy based on your personal goals and risk tolerance, Wells Fargo Funds offers more than 100 mutual funds spanning a wide range of asset classes and investment styles. Although diversification cannot guarantee an investment profit or prevent losses, we believe it can be an effective way to manage investment risk and potentially smooth out overall portfolio performance. We encourage investors to know their investments and to understand that appropriate levels of risk-taking may unlock opportunities.
On November 1, 2021, GTCR LLC and Reverence Capital Partners, L.P., announced the beginning of Allspring Global Investments™, with the close of the transaction to acquire Wells Fargo Funds Management, LLC; Wells Capital Management LLC; Galliard Capital Management LLC.; Wells Fargo Asset Management (International) Ltd.; Wells Fargo Asset Management Luxembourg S.A.; and Wells Fargo Funds Distributor, LLC, as well as Wells Fargo Bank, N.A.’s business of acting as trustee to its collective investment trusts and all related Wells Fargo Asset Management legal entities. The transaction closed on November 1, 2021, forming Allspring Global Investments, LLC, a privately held asset management firm with $587 billion in AUM1 as of September 30, 2021.
Allspring Global Investments™ is a leading independent asset management firm with a full breadth of investment capabilities across diverse asset classes, serving the needs of its institutional and wealth management clients around the world. Allspring operates across 18 offices globally supported by more than 480 investment professionals. Allspring and its investment teams provide a broad range of differentiated investment products and solutions to help its diverse range of clients meet their investment objectives.
As part of this transition, all mutual funds within the Wells Fargo Funds family will be rebranded as Allspring Funds. Each individual fund will have “Wells Fargo” removed from its fund name to be replaced with “Allspring.” The fund name changes are expected to take place on December 6, 2021.
Allspring Global Investments is the trade name for the asset management firms of Allspring Global Investments Holdings, LLC, a holding company indirectly owned by certain private funds of GTCR LLC and Reverence Capital Partners, L.P.
Thank you for choosing to invest with Wells Fargo Funds. We appreciate your confidence in us and remain committed to helping you meet your financial needs.
Sincerely,
Andrew Owen
President
Wells Fargo Funds
For further information about your Fund, contact your investment professional, visit our website at allspringglobal.com, or call us directly at 1-800-222-8222.
| 1 | As of September 30, 2021, assets under management (AUM) includes $93 billion from Galliard Capital Management, an investment advisor that is not part of the Allspring trade name/GIPS firm. |
4 | Wells Fargo Special Small Cap Value Fund
This page is intentionally left blank.
Performance highlights (unaudited)
This Fund is currently closed to most new investors.*
| Investment objective | The Fund seeks long-term capital appreciation. |
| Manager | Allspring Funds Management, LLC |
| Subadviser | Allspring Global Investments, LLC |
| Portfolio managers | Brian Martin, CFA®‡, James M. Tringas, CFA®‡, Bryant VanCronkhite, CFA®‡ |
| Average annual total returns (%) as of September 30, 2021 |
| | | Including sales charge | | Excluding sales charge | | Expense ratios1 (%) |
| | Inception date | 1 year | 5 year | 10 year | | 1 year | 5 year | 10 year | | Gross | Net 2 |
| Class A (ESPAX) | 5-7-1993 | 44.39 | 9.17 | 12.99 | | 53.22 | 10.47 | 13.66 | | 1.28 | 1.28 |
| Class C (ESPCX) | 12-12-2000 | 51.08 | 9.66 | 12.82 | | 52.08 | 9.66 | 12.82 | | 2.03 | 2.03 |
| Class R (ESPHX)3 | 9-30-2015 | – | – | – | | 52.83 | 10.20 | 13.38 | | 1.53 | 1.53 |
| Class R6 (ESPRX)4 | 10-31-2014 | – | – | – | | 53.88 | 10.94 | 14.14 | | 0.85 | 0.85 |
| Administrator Class (ESPIX) | 7-23-1996 | – | – | – | | 53.36 | 10.57 | 13.84 | | 1.20 | 1.20 |
| Institutional Class (ESPNX) | 7-30-2010 | – | – | – | | 53.72 | 10.85 | 14.08 | | 0.95 | 0.95 |
| Russell 2000® Value Index5 | – | – | – | – | | 63.92 | 11.03 | 13.22 | | – | – |
Figures quoted represent past performance, which is no guarantee of future results, and do not reflect taxes that a shareholder may pay on an investment in a fund. Investment return and principal value of an investment will fluctuate so that an investor’s shares, when redeemed, may be worth more or less than their original cost. Performance shown without sales charges would be lower if sales charges were reflected. Current performance may be lower or higher than the performance data quoted, which assumes the reinvestment of dividends and capital gains. Current month-end performance is available on the Fund’s website, allspringglobal.com.
Please keep in mind that high double-digit returns were primarily achieved during favorable market conditions. You should not expect that such favorable returns can be consistently achieved. A fund’s performance, especially for short time periods, should not be the sole factor in making your investment decision.
Index returns do not include transaction costs associated with buying and selling securities, any mutual fund fees or expenses, or any taxes. It is not possible to invest directly in an index.
For Class A shares, the maximum front-end sales charge is 5.75%. For Class C shares, the maximum contingent deferred sales charge is 1.00%. Performance including a contingent deferred sales charge assumes the sales charge for the corresponding time period. Class R, Class R6, Administrator Class and Institutional Class shares are sold without a front-end sales charge or contingent deferred sales charge.
| 1 | Reflects the expense ratios as stated in the most recent prospectuses, which include the impact of 0.01% in acquired fund fees and expenses. The expense ratios shown are subject to change and may differ from the annualized expense ratios shown in the financial highlights of this report, which do not include acquired fund fees and expenses. |
| 2 | The manager has contractually committed through July 31, 2022, to waive fees and/or reimburse expenses to the extent necessary to cap total annual fund operating expenses after fee waivers at 1.31% for Class A, 2.06% for Class C, 1.56% for Class R, 0.89% for Class R6, 1.20% for Administrator Class, and 0.94% for Institutional Class. Brokerage commissions, stamp duty fees, interest, taxes, acquired fund fees and expenses (if any), and extraordinary expenses are excluded from the expense caps. Prior to or after the commitment expiration date, the caps may be increased or the commitment to maintain the caps may be terminated only with the approval of the Board of Trustees. Without these caps, the Fund’s returns would have been lower. The expense ratio paid by an investor is the net expense ratio (the total annual fund operating expenses after fee waivers) as stated in the prospectuses. |
| 3 | Historical performance shown for the Class R shares prior to their inception reflects the performance of the Institutional Class shares adjusted to reflect the higher expenses applicable to the Class R shares. |
| 4 | Historical performance shown for the Class R6 shares prior to their inception reflects the performance of the Institutional Class shares, and includes the higher expenses applicable to the Institutional Class shares. If these expenses had not been included, returns for the Class R6 shares would be higher. |
| 5 | The Russell 2000® Value Index measures the performance of those Russell 2000 companies with lower price/book ratios and lower forecasted growth values. You cannot invest directly in an index. |
Stock values fluctuate in response to the activities of individual companies and general market and economic conditions. Smaller-company stocks tend to be more volatile and less liquid than those of larger companies. Consult the Fund’s prospectus for additional information on these and other risks.
| ‡ | CFA® and Chartered Financial Analyst® are trademarks owned by CFA Institute. |
| * | Please see the Fund’s current Statement of Additional Information for further details. |
6 | Wells Fargo Special Small Cap Value Fund
Performance highlights (unaudited)
| Ten largest holdings (%) as of September 30, 20211 |
| Eagle Materials Incorporated | 2.77 |
| Spectrum Brands Holdings Incorporated | 2.57 |
| J & J Snack Foods Corporation | 2.56 |
| Innospec Incorporated | 2.47 |
| UMB Financial Corporation | 2.41 |
| Mueller Industries Incorporated | 2.34 |
| Franklin Electric Company Incorporated | 2.31 |
| Avient Corporation | 2.28 |
| Helen of Troy Limited | 2.01 |
| CSW Industrials Incorporated | 1.83 |
| 1 | Figures represent the percentage of the Fund's net assets. Holdings are subject to change and may have changed since the date specified. |
| Sector allocation as of September 30, 20211 |
| 1 | Figures represent the percentage of the Fund's long-term investments. These amounts are subject to change and may have changed since the date specified. |
Wells Fargo Special Small Cap Value Fund | 7
Fund expenses (unaudited)
As a shareholder of the Fund, you incur two types of costs: (1) transaction costs, including sales charges (loads) on purchase payments and contingent deferred sales charges (if any) on redemptions and (2) ongoing costs, including management fees, distribution (12b-1) and/or shareholder servicing fees, and other Fund expenses. This example is intended to help you understand your ongoing costs (in dollars) of investing in the Fund and to compare these costs with the ongoing costs of investing in other mutual funds.
The example is based on an investment of $1,000 invested at the beginning of the six-month period and held for the entire period from April 1, 2021 to September 30, 2021.
Actual expenses
The “Actual” line of the table below provides information about actual account values and actual expenses. You may use the information in this line, together with the amount you invested, to estimate the expenses that you paid over the period. Simply divide your account value by $1,000 (for example, an $8,600 account value divided by $1,000 = 8.6), then multiply the result by the number in the “Actual” line under the heading entitled “Expenses paid during period” for your applicable class of shares to estimate the expenses you paid on your account during this period.
Hypothetical example for comparison purposes
The “Hypothetical” line of the table below provides information about hypothetical account values and hypothetical expenses based on the Fund’s actual expense ratio and an assumed rate of return of 5% per year before expenses, which is not the Fund’s actual return. The hypothetical account values and expenses may not be used to estimate the actual ending account balance or expenses you paid for the period. You may use this information to compare the ongoing costs of investing in the Fund and other funds. To do so, compare this 5% hypothetical example with the 5% hypothetical examples that appear in the shareholder reports of the other funds.
Please note that the expenses shown in the table are meant to highlight your ongoing costs only and do not reflect any transactional costs, such as sales charges (loads) and contingent deferred sales charges. Therefore, the “Hypothetical” line of the table is useful in comparing ongoing costs only, and will not help you determine the relative total costs of owning different funds. In addition, if these transactional costs were included, your costs would have been higher.
| | Beginning
account value
4-1-2021 | Ending
account value
9-30-2021 | Expenses
paid during
the period1 | Annualized net
expense ratio |
| Class A | | | | |
| Actual | $1,000.00 | $1,001.42 | $ 6.22 | 1.24% |
| Hypothetical (5% return before expenses) | $1,000.00 | $1,018.85 | $ 6.28 | 1.24% |
| Class C | | | | |
| Actual | $1,000.00 | $ 997.63 | $ 9.97 | 1.99% |
| Hypothetical (5% return before expenses) | $1,000.00 | $1,015.09 | $10.05 | 1.99% |
| Class R | | | | |
| Actual | $1,000.00 | $1,000.00 | $ 7.47 | 1.49% |
| Hypothetical (5% return before expenses) | $1,000.00 | $1,017.60 | $ 7.54 | 1.49% |
| Class R6 | | | | |
| Actual | $1,000.00 | $1,003.45 | $ 4.07 | 0.81% |
| Hypothetical (5% return before expenses) | $1,000.00 | $1,021.01 | $ 4.10 | 0.81% |
| Administrator Class | | | | |
| Actual | $1,000.00 | $1,001.84 | $ 5.82 | 1.16% |
| Hypothetical (5% return before expenses) | $1,000.00 | $1,019.25 | $ 5.87 | 1.16% |
| Institutional Class | | | | |
| Actual | $1,000.00 | $1,002.99 | $ 4.57 | 0.91% |
| Hypothetical (5% return before expenses) | $1,000.00 | $1,020.51 | $ 4.61 | 0.91% |
1 Expenses paid is equal to the annualized net expense ratio of each class multiplied by the average account value over the period, multiplied by the number of days in the most recent fiscal half-year divided by the number of days in the fiscal year (to reflect the one-half-year period).
8 | Wells Fargo Special Small Cap Value Fund
Portfolio of investments—September 30, 2021 (unaudited)
| | | | | Shares | Value |
| Common stocks: 97.54% | | | | | |
| Communication services: 0.06% | | | | | |
| Media: 0.06% | | | | | |
| DallasNews Corporation Class A ♠ | | | | 542,597 | $ 3,771,049 |
| Consumer discretionary: 9.30% | | | | | |
| Auto components: 1.12% | | | | | |
| Holley Incorporated † | | | | 5,500,000 | 65,670,000 |
| Hotels, restaurants & leisure: 4.05% | | | | | |
| Bally's Corporation † | | | | 320,981 | 16,093,987 |
| Denny’s Corporation ♠† | | | | 4,526,812 | 73,968,108 |
| Dine Brands Global Incorporated ♠† | | | | 945,846 | 76,812,154 |
| Jack In The Box Incorporated | | | | 727,100 | 70,768,643 |
| | | | | | 237,642,892 |
| Household durables: 2.77% | | | | | |
| Helen of Troy Limited † | | | | 527,030 | 118,413,100 |
| Tupperware Brands Corporation † | | | | 2,107,513 | 44,510,675 |
| | | | | | 162,923,775 |
| Multiline retail: 0.50% | | | | | |
| Franchise Group Incorporated | | | | 821,421 | 29,086,518 |
| Textiles, apparel & luxury goods: 0.86% | | | | | |
| Delta Apparel Incorporated ♠† | | | | 597,802 | 16,325,973 |
| Steven Madden Limited | | | | 853,700 | 34,284,592 |
| | | | | | 50,610,565 |
| Consumer staples: 10.82% | | | | | |
| Beverages: 0.82% | | | | | |
| Primo Water Corporation | | | | 3,056,889 | 48,054,295 |
| Food products: 5.75% | | | | | |
| Hostess Brands Incorporated † | | | | 3,003,743 | 52,175,016 |
| J & J Snack Foods Corporation ♠ | | | | 982,119 | 150,087,426 |
| Nomad Foods Limited † | | | | 3,257,177 | 89,767,798 |
| Tootsie Roll Industries Incorporated « | | | | 734,424 | 22,348,522 |
| UTZ Brands Incorporated Class A | | | | 1,356,379 | 23,234,772 |
| | | | | | 337,613,534 |
| Household products: 3.94% | | | | | |
| Central Garden & Pet Company ♠† | | | | 816,722 | 39,202,656 |
| Central Garden & Pet Company Class A † | | | | 951,351 | 40,908,093 |
| Spectrum Brands Holdings Incorporated | | | | 1,576,729 | 150,845,663 |
| | | | | | 230,956,412 |
| Personal products: 0.31% | | | | | |
| Edgewell Personal Care Company | | | | 504,958 | 18,329,975 |
| Energy: 5.68% | | | | | |
| Energy equipment & services: 1.14% | | | | | |
| Forum Energy Technologies Incorporated †« | | | | 173,244 | 3,904,920 |
| Liberty Oilfield Services Class A † | | | | 544,891 | 6,609,528 |
The accompanying notes are an integral part of these financial statements.
Wells Fargo Special Small Cap Value Fund | 9
Portfolio of investments—September 30, 2021 (unaudited)
| | | | | Shares | Value |
| Energy equipment & services (continued) | | | | | |
| Patterson-UTI Energy Incorporated | | | | 4,310,810 | $ 38,797,290 |
| TechnipFMC plc | | | | 2,293,617 | 17,270,936 |
| | | | | | 66,582,674 |
| Oil, gas & consumable fuels: 4.54% | | | | | |
| Alto Ingredients Incorporated † | | | | 2,489,376 | 12,297,517 |
| Berry Petroleum Corporation | | | | 1,950,586 | 14,063,725 |
| Denbury Incorporated † | | | | 626,258 | 43,994,625 |
| EQT Corporation † | | | | 898,600 | 18,385,356 |
| Magnolia Oil & Gas Corporation | | | | 3,973,176 | 70,682,801 |
| Nordic American Tankers Limited « | | | | 4,144,811 | 10,610,716 |
| Northern Oil and Gas Incorporated | | | | 284,100 | 6,079,740 |
| Southwestern Energy Company † | | | | 7,862,680 | 43,559,247 |
| Whiting Petroleum Corporation † | | | | 804,248 | 46,976,126 |
| | | | | | 266,649,853 |
| Financials: 18.58% | | | | | |
| Banks: 8.67% | | | | | |
| Associated Banc Corporation | | | | 2,002,856 | 42,901,176 |
| CVB Financial Corporation | | | | 1,811,200 | 36,894,144 |
| First Citizens BancShares Corporation Class A | | | | 127,156 | 107,214,125 |
| First Hawaiian Incorporated | | | | 1,188,858 | 34,892,982 |
| Hancock Holding Company | | | | 1,080,620 | 50,918,814 |
| Renasant Corporation | | | | 1,287,574 | 46,417,043 |
| South State Corporation | | | | 641,832 | 47,925,595 |
| UMB Financial Corporation | | | | 1,463,300 | 141,515,743 |
| | | | | | 508,679,622 |
| Capital markets: 2.20% | | | | | |
| Apollo Investment Corporation | | | | 1,868,886 | 24,239,451 |
| Capitol Investment Corporation V † | | | | 1,250,000 | 9,250,000 |
| Glassbridge Enterprises Incorporated ♠♦†« | | | | 1,527 | 41,229 |
| Mason Industrial Technology Incorporated † | | | | 862,800 | 8,584,860 |
| New Mountain Finance Corporation | | | | 2,515,050 | 33,475,316 |
| Pershing Square Tontine Holdings † | | | | 2,308,595 | 45,479,322 |
| Westwood Holdings Group Incorporated ♠ | | | | 438,883 | 8,338,777 |
| | | | | | 129,408,955 |
| Diversified financial services: 0.68% | | | | | |
| Jackson Financial Incorporation Class A †« | | | | 1,312,600 | 34,127,600 |
| Pine Island Acquisition Corporation † | | | | 598,455 | 6,014,473 |
| | | | | | 40,142,073 |
| Insurance: 4.81% | | | | | |
| CNO Financial Group Incorporated | | | | 539,903 | 12,709,317 |
| Enstar Group Limited † | | | | 298,737 | 70,122,536 |
| National Western Life Group Class A | | | | 69,326 | 14,599,362 |
| ProAssurance Corporation | | | | 1,232,159 | 29,300,741 |
| Stewart Information Services Corporation | | | | 1,218,300 | 77,069,658 |
| The Hanover Insurance Group Incorporated | | | | 608,277 | 78,844,865 |
| | | | | | 282,646,479 |
| Mortgage REITs: 2.22% | | | | | |
| Apollo Commercial Real Estate Finance Incorporated | | | | 2,134,153 | 31,649,489 |
The accompanying notes are an integral part of these financial statements.
10 | Wells Fargo Special Small Cap Value Fund
Portfolio of investments—September 30, 2021 (unaudited)
| | | | | Shares | Value |
| Mortgage REITs (continued) | | | | | |
| New York Mortgage Trust Incorporated | | | | 7,635,522 | $ 32,527,324 |
| Two Harbors Investment Corporation | | | | 10,390,496 | 65,875,745 |
| | | | | | 130,052,558 |
| Health care: 4.60% | | | | | |
| Health care equipment & supplies: 1.00% | | | | | |
| Natus Medical Incorporated † | | | | 1,087,867 | 27,283,704 |
| Varex Imaging Corporation † | | | | 1,100,912 | 31,045,718 |
| | | | | | 58,329,422 |
| Health care providers & services: 2.21% | | | | | |
| ATI Physical Therapy Incorporated Class A † | | | | 928,700 | 3,529,060 |
| Owens & Minor Incorporated ## | | | | 1,980,398 | 61,966,653 |
| Patterson Companies Incorporated | | | | 1,290,765 | 38,903,657 |
| Premier Incorporated Class A | | | | 658,837 | 25,536,522 |
| | | | | | 129,935,892 |
| Pharmaceuticals: 1.39% | | | | | |
| Perrigo Company plc | | | | 754,851 | 35,727,098 |
| Prestige Consumer Healthcare Incorporated † | | | | 820,700 | 46,049,477 |
| | | | | | 81,776,575 |
| Industrials: 27.63% | | | | | |
| Aerospace & defense: 0.73% | | | | | |
| Parsons Corporation † | | | | 1,266,916 | 42,771,084 |
| Building products: 5.25% | | | | | |
| CSW Industrials Incorporated ♠ | | | | 839,881 | 107,252,804 |
| Griffon Corporation | | | | 1,812,799 | 44,594,855 |
| Janus International Group Incorporated †« | | | | 2,407,302 | 29,465,376 |
| JELD-WEN Holding Incorporated † | | | | 523,621 | 13,106,234 |
| Quanex Building Products Corporation ♠ | | | | 2,534,235 | 54,257,971 |
| Simpson Manufacturing Company Incorporated | | | | 458,581 | 49,054,410 |
| UFP Industries Incorporated | | | | 152,800 | 10,387,344 |
| | | | | | 308,118,994 |
| Commercial services & supplies: 4.09% | | | | | |
| ACCO Brands Corporation | | | | 3,656,528 | 31,409,576 |
| Custom Truck One Source Incorporated † | | | | 3,475,000 | 32,421,750 |
| Ennis Incorporated | | | | 1,291,529 | 24,345,322 |
| Harsco Corporation † | | | | 1,748,399 | 29,635,363 |
| Healthcare Services Group Incorporated | | | | 2,333,271 | 58,308,442 |
| Matthews International Corporation Class A | | | | 350,100 | 12,144,969 |
| Viad Corporation ♠† | | | | 1,147,215 | 52,095,033 |
| | | | | | 240,360,455 |
| Construction & engineering: 1.43% | | | | | |
| APi Group Corporation † | | | | 3,651,267 | 74,303,283 |
| Fluor Corporation † | | | | 602,499 | 9,621,909 |
| | | | | | 83,925,192 |
The accompanying notes are an integral part of these financial statements.
Wells Fargo Special Small Cap Value Fund | 11
Portfolio of investments—September 30, 2021 (unaudited)
| | | | | Shares | Value |
| Electrical equipment: 1.83% | | | | | |
| Atkore International Incorporated †## | | | | 1,044,164 | $ 90,758,735 |
| Babcock & Wilcox Enterprises Incorporated † | | | | 2,612,343 | 16,745,119 |
| | | | | | 107,503,854 |
| Machinery: 10.91% | | | | | |
| Alamo Group Incorporated | | | | 243,949 | 34,038,204 |
| Columbus McKinnon Corporation | | | | 919,917 | 44,477,987 |
| Douglas Dynamics Incorporated ♠ | | | | 1,694,144 | 61,497,427 |
| Franklin Electric Company Incorporated | | | | 1,699,969 | 135,742,525 |
| Hillenbrand Incorporated | | | | 286,446 | 12,216,922 |
| Hillman Group Incorporated † | | | | 3,622,900 | 43,221,197 |
| Hillman Solutions Corporation †« | | | | 1,382,008 | 16,487,355 |
| Kadant Incorporated | | | | 325,689 | 66,473,125 |
| Mayville Engineering Company Incorporated † | | | | 859,538 | 16,159,314 |
| Mueller Industries Incorporated ♠ | | | | 3,337,797 | 137,183,457 |
| NN Incorporated † | | | | 1,157,115 | 6,074,854 |
| Trimas Corporation † | | | | 2,069,663 | 66,974,295 |
| | | | | | 640,546,662 |
| Professional services: 2.19% | | | | | |
| CBIZ Incorporated † | | | | 1,715,603 | 55,482,601 |
| Korn Ferry International | | | | 1,009,537 | 73,050,097 |
| | | | | | 128,532,698 |
| Road & rail: 0.79% | | | | | |
| Werner Enterprises Incorporated | | | | 1,047,543 | 46,374,729 |
| Trading companies & distributors: 0.41% | | | | | |
| Air Lease Corporation | | | | 611,000 | 24,036,740 |
| Information technology: 3.60% | | | | | |
| Communications equipment: 0.36% | | | | | |
| Netgear Incorporated † | | | | 670,200 | 21,386,082 |
| Electronic equipment, instruments & components: 0.87% | | | | | |
| Belden Incorporated | | | | 873,493 | 50,889,702 |
| IT services: 2.23% | | | | | |
| Concentrix Corporation † | | | | 318,504 | 56,375,208 |
| Global Blue Group Holding AG † | | | | 4,536,904 | 29,308,400 |
| Maximus Incorporated | | | | 541,900 | 45,086,080 |
| | | | | | 130,769,688 |
| Software: 0.14% | | | | | |
| Synchronoss Technologies Incorporated † | | | | 3,344,238 | 8,026,171 |
| Materials: 14.78% | | | | | |
| Chemicals: 7.13% | | | | | |
| Avient Corporation | | | | 2,885,301 | 133,733,701 |
| Ecovyst Incorporated | | | | 2,712,563 | 31,628,485 |
| Element Solutions Incorporated | | | | 985,692 | 21,369,803 |
| Innospec Incorporated ♠ | | | | 1,723,494 | 145,152,665 |
| Minerals Technologies Incorporated | | | | 188,856 | 13,189,703 |
| NewMarket Corporation | | | | 217,686 | 73,745,486 |
| | | | | | 418,819,843 |
The accompanying notes are an integral part of these financial statements.
12 | Wells Fargo Special Small Cap Value Fund
Portfolio of investments—September 30, 2021 (unaudited)
| | | | | Shares | Value |
| Construction materials: 2.77% | | | | | |
| Eagle Materials Incorporated | | | | 1,238,757 | $ 162,475,367 |
| Containers & packaging: 2.25% | | | | | |
| Myers Industries Incorporated | | | | 1,639,760 | 32,090,103 |
| Silgan Holdings Incorporated | | | | 2,609,571 | 100,103,144 |
| | | | | | 132,193,247 |
| Metals & mining: 0.66% | | | | | |
| Compass Minerals International Incorporated | | | | 598,800 | 38,562,720 |
| Paper & forest products: 1.97% | | | | | |
| Neenah Incorporated ♠ | | | | 1,502,061 | 70,011,063 |
| Schweitzer-Mauduit International Incorporated | | | | 1,323,815 | 45,883,428 |
| | | | | | 115,894,491 |
| Real estate: 0.62% | | | | | |
| Equity REITs: 0.62% | | | | | |
| Washington REIT | | | | 1,468,710 | 36,350,573 |
| Utilities: 1.87% | | | | | |
| Electric utilities: 1.87% | | | | | |
| Allete Incorporated | | | | 624,100 | 37,146,432 |
| Hawaiian Electric Industries Incorporated | | | | 1,772,504 | 72,371,338 |
| | | | | | 109,517,770 |
| Total Common stocks (Cost $4,550,885,591) | | | | | 5,725,919,180 |
| Other instruments: 0.00% | | | | | |
| Isos Acquisition Corporation Class A (Acquired 7-1-2021, commitment amount $9,000,000, cost $0) ♦‡†= | | | | 900,000 | 0 |
| Total Other instruments (Cost $0) | | | | | 0 |
| | | Yield | | | |
| Short-term investments: 3.21% | | | | | |
| Investment companies: 3.21% | | | | | |
| Securities Lending Cash Investments LLC ♠∩∞ | | 0.02% | | 33,210,833 | 33,210,833 |
| Wells Fargo Government Money Market Fund Select Class ♠∞# | | 0.03 | | 155,134,300 | 155,134,300 |
| Total Short-term investments (Cost $188,345,133) | | | | | 188,345,133 |
| Total investments in securities (Cost $4,739,230,724) | 100.75% | | | | 5,914,264,313 |
| Other assets and liabilities, net | (0.75) | | | | (44,075,795) |
| Total net assets | 100.00% | | | | $5,870,188,518 |
The accompanying notes are an integral part of these financial statements.
Wells Fargo Special Small Cap Value Fund | 13
Portfolio of investments—September 30, 2021 (unaudited)
| † | Non-income earning security |
| ♦ | The security is fair valued in accordance with procedures approved by the Board of Trustees. |
| ‡ | Security is valued using significant unobservable inputs. |
| = | All or a portion of the position represents an unfunded purchase commitment. The Fund held securities with an aggregate unfunded commitment amount of $9,000,000, representing 0.15% of its net assets as of period end. |
| # | All or a portion of this security is segregated as collateral for investments in unfunded restricted securities. |
| « | All or a portion of this security is on loan. |
| ♠ | The issuer of the security is an affiliated person of the Fund as defined in the Investment Company Act of 1940. |
| ∩ | The investment is a non-registered investment company purchased with cash collateral received from securities on loan. |
| ∞ | The rate represents the 7-day annualized yield at period end. |
| ## | All or a portion of this security is segregated as collateral for investments in derivative instruments. |
| Abbreviations: |
| REIT | Real estate investment trust |
Investments in affiliates
An affiliated investment is an investment in which the Fund owns at least 5% of the outstanding voting shares of the issuer or as a result of other relationships, such as the Fund and the issuer having the same investment manager. Transactions with issuers that were either affiliates of the Fund at the beginning of the period or the end of the period were as follows:
| | Value,
beginning of
period | Purchases | Sales
proceeds | Net
realized
gains
(losses) | | Net
change in
unrealized
gains
(losses) | | Value,
end of
period | Shares,
end
of period | Income
from
affiliated
securities |
| Common Stocks | | | | | | | | | |
| A.H. Belo Corporation Class A* | $ 4,209,028 | $ 334,362 | $ (11,223,160) | $ 0 | | $ 6,679,770 | | $ 0 | 0 | $ 86,816 |
| Central Garden & Pet Company† | 45,370,897 | 2,014,684 | 0 | 0 | | (8,182,925) | | 39,202,656 | 816,722 | 0 |
| CSW Industrials Incorporated | 106,799,175 | 6,955,135 | (859,084) | (29,541) | | (5,612,881) | | 107,252,804 | 839,881 | 244,643 |
| DallasNews Corporation Class A | 0 | 11,223,160 | (2) | (4) | | (7,452,105) | | 3,771,049 | 542,597 | 86,816 |
| Delta Apparel Incorporated† | 15,770,723 | 533,074 | 0 | 0 | | 22,176 | | 16,325,973 | 597,802 | 0 |
| Denny’s Corporation† | 78,234,620 | 3,591,703 | 0 | 0 | | (7,858,215) | | 73,968,108 | 4,526,812 | 0 |
| Dine Brands Global Incorporated† | 72,487,294 | 12,902,011 | 0 | 0 | | (8,577,151) | | 76,812,154 | 945,846 | 0 |
| Douglas Dynamics Incorporated | 62,770,646 | 14,055,433 | 0 | 0 | | (15,328,652) | | 61,497,427 | 1,694,144 | 934,341 |
| Glassbridge Enterprises Incorporated† | 106,890 | 0 | 0 | 0 | | (65,661) | | 41,229 | 1,527 | 0 |
| Innospec Incorporated | 154,024,731 | 21,105,617 | (17,496) | (1,995) | | (29,958,192) | | 145,152,665 | 1,723,494 | 897,693 |
| J & J Snack Foods Corporation | 138,851,420 | 15,946,258 | 0 | 0 | | (4,710,252) | | 150,087,426 | 982,119 | 1,192,564 |
| Juniper Industrial Holdings Incorporated Class A* | 30,004,950 | 718,953 | (29,382,038) | 0 | | (1,341,865) | | 0 | 0 | 0 |
| Mueller Industries Incorporated | 132,122,926 | 6,286,982 | (133,687) | (7,366) | | (1,085,398) | | 137,183,457 | 3,337,797 | 852,531 |
| Neenah Incorporated | 74,946,002 | 2,210,777 | 0 | 0 | | (7,145,716) | | 70,011,063 | 1,502,061 | 1,385,711 |
| Quanex Building Products Corporation | 58,803,044 | 7,307,469 | 0 | 0 | | (11,852,542) | | 54,257,971 | 2,534,235 | 388,685 |
| Viad Corporation† | 46,553,755 | 1,381,285 | 0 | 0 | | 4,159,993 | | 52,095,033 | 1,147,215 | 0 |
| Westwood Holdings Group Incorporated | 6,346,248 | 0 | 0 | 0 | | 1,992,529 | | 8,338,777 | 438,883 | 1,184,984 |
| Short-term investments | | | | | | | | | |
| Securities Lending Cash Investments LLC | 88,068,134 | 307,841,431 | (362,698,732) | 0 | | 0 | | 33,210,833 | 33,210,833 | 7,299 # |
| Wells Fargo Government Money Market Fund Select Class | 229,802,237 | 724,305,176 | (798,973,113) | 0 | | 0 | | 155,134,300 | 155,134,300 | 20,956 |
| | | | | $(38,906) | | $(96,317,087)^ | | $1,184,342,925 | | $7,283,039 |
| † | Non-income earning security |
| * | No longer an affiliate of the Fund at the end of the period. |
| # | Amount shown represents income before fees and rebates. |
| ^ | Amount may differ from the value reported on the respective financial statement due to securities that were not deemed affiliates of the Fund either at the beginning or end of the period. |
The accompanying notes are an integral part of these financial statements.
14 | Wells Fargo Special Small Cap Value Fund
Portfolio of investments—September 30, 2021 (unaudited)
Written options
| Description | Counterparty | Number of
contracts | Notional
amount | Exercise
price | Expiration
date | Value |
| Put | | | | | | |
| Atkore International Incorporated | Bank of America Securities Incorporated | 500 | $ 4,500,000 | $ 90.00 | 10-15-2021 | $ (292,500) |
| Atkore International Incorporated | Bank of America Securities Incorporated | 250 | 2,125,000 | 85.00 | 10-15-2021 | (61,250) |
| B. Riley Financial Incorporated | Bank of America Securities Incorporated | 500 | 2,875,000 | 57.50 | 10-15-2021 | (67,500) |
| iShares Russell 2000 ETF | Bank of America Securities Incorporated | 500 | 10,750,000 | 215.00 | 10-15-2021 | (162,000) |
| Owens & Minor Incorporated | Bank of America Securities Incorporated | 500 | 1,750,000 | 35.00 | 10-15-2021 | (232,500) |
| | | | | | | $(815,750) |
The accompanying notes are an integral part of these financial statements.
Wells Fargo Special Small Cap Value Fund | 15
Statement of assets and liabilities—September 30, 2021 (unaudited)
| | |
| Assets | |
Investments in unaffiliated securities (including $32,175,848 of securities loaned), at value (cost $3,718,015,174)
| $ 4,729,921,388 |
Investments in affiliated securites, at value (cost $1,021,215,550)
| 1,184,342,925 |
Cash
| 7,999,280 |
Cash at broker segregated cash for written options
| 21,999,952 |
Receivable for Fund shares sold
| 8,513,958 |
Receivable for dividends
| 7,762,468 |
Receivable for investments sold
| 5,820,618 |
Receivable for securities lending income, net
| 10,430 |
Prepaid expenses and other assets
| 280,561 |
Total assets
| 5,966,651,580 |
| Liabilities | |
Payable for investments purchased
| 46,791,983 |
Payable upon receipt of securities loaned
| 33,210,833 |
Payable for Fund shares redeemed
| 5,920,088 |
Management fee payable
| 3,725,632 |
Written options at value (premiums received $645,057)
| 815,750 |
Administration fees payable
| 545,711 |
Distribution fees payable
| 11,097 |
Accrued expenses and other liabilities
| 5,441,968 |
Total liabilities
| 96,463,062 |
Total net assets
| $5,870,188,518 |
| Net assets consist of | |
Paid-in capital
| $ 4,374,682,225 |
Total distributable earnings
| 1,495,506,293 |
Total net assets
| $5,870,188,518 |
| Computation of net asset value and offering price per share | |
Net assets – Class A
| $ 817,870,550 |
Shares outstanding – Class A1
| 19,275,427 |
Net asset value per share – Class A
| $42.43 |
Maximum offering price per share – Class A2
| $45.02 |
Net assets – Class C
| $ 12,547,529 |
Shares outstanding – Class C1
| 331,841 |
Net asset value per share – Class C
| $37.81 |
Net assets – Class R
| $ 15,365,521 |
Shares outstanding – Class R1
| 357,257 |
Net asset value per share – Class R
| $43.01 |
Net assets – Class R6
| $ 1,736,794,698 |
Shares outstanding – Class R61
| 39,778,609 |
Net asset value per share – Class R6
| $43.66 |
Net assets – Administrator Class
| $ 186,798,412 |
Shares outstanding – Administrator Class1
| 4,286,770 |
Net asset value per share – Administrator Class
| $43.58 |
Net assets – Institutional Class
| $ 3,100,811,808 |
Shares outstanding – Institutional Class1
| 71,044,810 |
Net asset value per share – Institutional Class
| $43.65 |
| 1 | The Fund has an unlimited number of authorized shares |
| 2 | Maximum offering price is computed as 100/94.25 of net asset value. On investments of $50,000 or more, the offering price is reduced. |
The accompanying notes are an integral part of these financial statements.
16 | Wells Fargo Special Small Cap Value Fund
Statement of operations—six months ended September 30, 2021 (unaudited)
| | |
| Investment income | |
Dividends (net of foreign withholdings taxes of $50,051)
| $ 41,579,955 |
Income from affiliated securities
| 7,410,538 |
Total investment income
| 48,990,493 |
| Expenses | |
Management fee
| 22,987,123 |
| Administration fees | |
Class A
| 884,645 |
Class C
| 14,297 |
Class R
| 16,228 |
Class R6
| 254,248 |
Administrator Class
| 129,416 |
Institutional Class
| 2,087,977 |
| Shareholder servicing fees | |
Class A
| 1,053,148 |
Class C
| 17,004 |
Class R
| 19,317 |
Administrator Class
| 248,133 |
| Distribution fees | |
Class C
| 50,980 |
Class R
| 19,284 |
Custody and accounting fees
| 90,007 |
Professional fees
| 28,294 |
Registration fees
| 76,587 |
Shareholder report expenses
| 126,017 |
Trustees’ fees and expenses
| 9,663 |
Other fees and expenses
| 35,291 |
Total expenses
| 28,147,659 |
| Less: Fee waivers and/or expense reimbursements | |
Class A
| (808) |
Administrator Class
| (560) |
Net expenses
| 28,146,291 |
Net investment income
| 20,844,202 |
| Realized and unrealized gains (losses) on investments | |
| Net realized gains (losses) on | |
Unaffiliated securities
| 206,069,777 |
Affiliated securities
| (38,906) |
Written options
| 6,372,805 |
Net realized gains on investments
| 212,403,676 |
| Net change in unrealized gains (losses) on | |
Unaffiliated securities
| (164,349,901) |
Affiliated securities
| (57,867,939) |
Written options
| (1,323,926) |
Net change in unrealized gains (losses) on investments
| (223,541,766) |
Net realized and unrealized gains (losses) on investments
| (11,138,090) |
Net increase in net assets resulting from operations
| $ 9,706,112 |
The accompanying notes are an integral part of these financial statements.
Wells Fargo Special Small Cap Value Fund | 17
Statement of changes in net assets
| | | | | |
| | Six months ended
September 30, 2021
(unaudited) | Year ended
March 31, 2021 |
| Operations | | | | |
Net investment income
| | $ 20,844,202 | | $ 27,051,744 |
Net realized gains on investments
| | 212,403,676 | | 144,396,109 |
Net change in unrealized gains (losses) on investments
| | (223,541,766) | | 2,122,289,791 |
Net increase in net assets resulting from operations
| | 9,706,112 | | 2,293,737,644 |
| Distributions to shareholders from | | | | |
| Net investment income and net realized gains | | | | |
Class A
| | 0 | | (2,445,539) |
Class C
| | 0 | | (4,280) |
Class R
| | 0 | | (6,642) |
Class R6
| | 0 | | (7,859,335) |
Administrator Class
| | 0 | | (538,350) |
Institutional Class
| | 0 | | (15,451,748) |
Total distributions to shareholders
| | 0 | | (26,305,894) |
| Capital share transactions | Shares | | Shares | |
| Proceeds from shares sold | | | | |
Class A
| 2,544,559 | 110,850,643 | 7,294,082 | 230,613,268 |
Class C
| 6,790 | 263,485 | 16,692 | 494,243 |
Class R
| 63,231 | 2,768,328 | 250,757 | 9,097,592 |
Class R6
| 8,172,955 | 363,536,533 | 21,980,351 | 761,400,701 |
Administrator Class
| 504,567 | 22,467,966 | 2,055,132 | 75,004,672 |
Institutional Class
| 12,262,636 | 546,891,436 | 34,987,937 | 1,135,204,199 |
| | | 1,046,778,391 | | 2,211,814,675 |
| Reinvestment of distributions | | | | |
Class A
| 0 | 0 | 62,952 | 2,222,955 |
Class C
| 0 | 0 | 130 | 4,085 |
Class R
| 0 | 0 | 185 | 6,607 |
Class R6
| 0 | 0 | 191,793 | 6,947,813 |
Administrator Class
| 0 | 0 | 14,723 | 533,619 |
Institutional Class
| 0 | 0 | 341,159 | 12,364,859 |
| | | 0 | | 22,079,938 |
| Payment for shares redeemed | | | | |
Class A
| (2,082,585) | (89,905,158) | (4,832,719) | (153,758,673) |
Class C
| (45,983) | (1,786,406) | (189,809) | (5,180,413) |
Class R
| (48,552) | (2,139,410) | (127,826) | (4,228,425) |
Class R6
| (5,130,228) | (227,319,481) | (9,626,235) | (315,055,102) |
Administrator Class
| (742,024) | (33,048,484) | (1,933,125) | (59,966,242) |
Institutional Class
| (12,520,093) | (555,969,178) | (25,069,313) | (788,171,169) |
| | | (910,168,117) | | (1,326,360,024) |
Net increase in net assets resulting from capital share transactions
| | 136,610,274 | | 907,534,589 |
Total increase in net assets
| | 146,316,386 | | 3,174,966,339 |
| Net assets | | | | |
Beginning of period
| | 5,723,872,132 | | 2,548,905,793 |
End of period
| | $5,870,188,518 | | $ 5,723,872,132 |
The accompanying notes are an integral part of these financial statements.
18 | Wells Fargo Special Small Cap Value Fund
Financial highlights
(For a share outstanding throughout each period)
| | | Year ended March 31 |
| Class A | Six months ended
September 30, 2021
(unaudited) | 2021 | 2020 | 2019 | 2018 | 2017 |
Net asset value, beginning of period
| $42.37 | $23.39 | $31.74 | $34.42 | $33.15 | $27.40 |
Net investment income
| 0.09 | 0.14 1 | 0.24 | 0.22 | 0.24 | 0.35 1 |
Net realized and unrealized gains (losses) on investments
| (0.03) | 18.98 | (8.00) | (0.69) | 2.89 | 6.15 |
Total from investment operations
| 0.06 | 19.12 | (7.76) | (0.47) | 3.13 | 6.50 |
| Distributions to shareholders from | | | | | | |
Net investment income
| 0.00 | (0.13) | (0.28) | (0.15) | (0.32) | (0.18) |
Net realized gains
| 0.00 | (0.01) | (0.31) | (2.06) | (1.54) | (0.57) |
Total distributions to shareholders
| 0.00 | (0.14) | (0.59) | (2.21) | (1.86) | (0.75) |
Net asset value, end of period
| $42.43 | $42.37 | $23.39 | $31.74 | $34.42 | $33.15 |
Total return2
| 0.14% | 81.92% | (25.08)% | (0.87)% | 9.42% | 23.69% |
| Ratios to average net assets (annualized) | | | | | | |
Gross expenses
| 1.24% | 1.27% | 1.27% | 1.29% | 1.31% | 1.32% |
Net expenses
| 1.24% | 1.27% | 1.27% | 1.29% | 1.31% | 1.32% |
Net investment income
| 0.40% | 0.43% | 0.75% | 0.67% | 0.66% | 1.14% |
| Supplemental data | | | | | | |
Portfolio turnover rate
| 14% | 40% | 39% | 32% | 41% | 51% |
Net assets, end of period (000s omitted)
| $817,871 | $797,193 | $381,058 | $526,656 | $539,499 | $575,269 |
| 1 | Calculated based upon average shares outstanding |
| 2 | Total return calculations do not include any sales charges. Returns for periods of less than one year are not annualized. |
The accompanying notes are an integral part of these financial statements.
Wells Fargo Special Small Cap Value Fund | 19
Financial highlights
(For a share outstanding throughout each period)
| | | Year ended March 31 |
| Class C | Six months ended
September 30, 2021
(unaudited) | 2021 | 2020 | 2019 | 2018 | 2017 |
Net asset value, beginning of period
| $37.90 | $20.99 | $28.49 | $31.21 | $30.19 | $25.05 |
Net investment income (loss)
| (0.07) 1 | (0.08) 1 | (0.01) 1 | (0.05) 1 | (0.03) 1 | 0.12 1 |
Net realized and unrealized gains (losses) on investments
| (0.02) | 17.00 | (7.18) | (0.61) | 2.64 | 5.59 |
Total from investment operations
| (0.09) | 16.92 | (7.19) | (0.66) | 2.61 | 5.71 |
| Distributions to shareholders from | | | | | | |
Net investment income
| 0.00 | 0.00 | 0.00 | 0.00 | (0.05) | 0.00 |
Net realized gains
| 0.00 | (0.01) | (0.31) | (2.06) | (1.54) | (0.57) |
Total distributions to shareholders
| 0.00 | (0.01) | (0.31) | (2.06) | (1.59) | (0.57) |
Net asset value, end of period
| $37.81 | $37.90 | $20.99 | $28.49 | $31.21 | $30.19 |
Total return2
| (0.24)% | 80.71% | (25.65)% | (1.63)% | 8.60% | 22.75% |
| Ratios to average net assets (annualized) | | | | | | |
Gross expenses
| 1.99% | 2.01% | 2.02% | 2.04% | 2.06% | 2.07% |
Net expenses
| 1.99% | 2.01% | 2.02% | 2.04% | 2.06% | 2.07% |
Net investment income (loss)
| (0.38)% | (0.29)% | (0.04)% | (0.13)% | (0.10)% | 0.42% |
| Supplemental data | | | | | | |
Portfolio turnover rate
| 14% | 40% | 39% | 32% | 41% | 51% |
Net assets, end of period (000s omitted)
| $12,548 | $14,063 | $11,419 | $24,334 | $53,145 | $60,309 |
| 1 | Calculated based upon average shares outstanding |
| 2 | Total return calculations do not include any sales charges. Returns for periods of less than one year are not annualized. |
The accompanying notes are an integral part of these financial statements.
20 | Wells Fargo Special Small Cap Value Fund
Financial highlights
(For a share outstanding throughout each period)
| | | Year ended March 31 |
| Class R | Six months ended
September 30, 2021
(unaudited) | 2021 | 2020 | 2019 | 2018 | 2017 |
Net asset value, beginning of period
| $43.01 | $23.73 | $32.20 | $34.94 | $33.73 | $27.97 |
Net investment income
| 0.04 | 0.07 | 0.16 | 0.18 | 0.17 | 0.63 1 |
Net realized and unrealized gains (losses) on investments
| (0.04) | 19.25 | (8.12) | (0.74) | 2.92 | 5.94 |
Total from investment operations
| 0.00 | 19.32 | (7.96) | (0.56) | 3.09 | 6.57 |
| Distributions to shareholders from | | | | | | |
Net investment income
| 0.00 | (0.03) | (0.20) | (0.12) | (0.34) | (0.24) |
Net realized gains
| 0.00 | (0.01) | (0.31) | (2.06) | (1.54) | (0.57) |
Total distributions to shareholders
| 0.00 | (0.04) | (0.51) | (2.18) | (1.88) | (0.81) |
Net asset value, end of period
| $43.01 | $43.01 | $23.73 | $32.20 | $34.94 | $33.73 |
Total return2
| 0.00% | 81.50% | (25.29)% | (1.11)% | 9.13% | 23.47% |
| Ratios to average net assets (annualized) | | | | | | |
Gross expenses
| 1.49% | 1.51% | 1.52% | 1.55% | 1.57% | 1.56% |
Net expenses
| 1.49% | 1.51% | 1.52% | 1.55% | 1.56% | 1.56% |
Net investment income
| 0.16% | 0.13% | 0.46% | 0.47% | 0.43% | 1.86% |
| Supplemental data | | | | | | |
Portfolio turnover rate
| 14% | 40% | 39% | 32% | 41% | 51% |
Net assets, end of period (000s omitted)
| $15,366 | $14,733 | $5,209 | $6,656 | $4,631 | $785 |
| 1 | Calculated based upon average shares outstanding |
| 2 | Returns for periods of less than one year are not annualized. |
The accompanying notes are an integral part of these financial statements.
Wells Fargo Special Small Cap Value Fund | 21
Financial highlights
(For a share outstanding throughout each period)
| | | Year ended March 31 |
| Class R6 | Six months ended
September 30, 2021
(unaudited) | 2021 | 2020 | 2019 | 2018 | 2017 |
Net asset value, beginning of period
| $43.51 | $24.00 | $32.55 | $35.25 | $33.93 | $28.01 |
Net investment income
| 0.18 | 0.28 | 0.37 | 0.38 | 0.38 1 | 0.61 1 |
Net realized and unrealized gains (losses) on investments
| (0.03) | 19.49 | (8.17) | (0.72) | 2.97 | 6.18 |
Total from investment operations
| 0.15 | 19.77 | (7.80) | (0.34) | 3.35 | 6.79 |
| Distributions to shareholders from | | | | | | |
Net investment income
| 0.00 | (0.25) | (0.44) | (0.30) | (0.49) | (0.30) |
Net realized gains
| 0.00 | (0.01) | (0.31) | (2.06) | (1.54) | (0.57) |
Total distributions to shareholders
| 0.00 | (0.26) | (0.75) | (2.36) | (2.03) | (0.87) |
Net asset value, end of period
| $43.66 | $43.51 | $24.00 | $32.55 | $35.25 | $33.93 |
Total return2
| 0.34% | 82.77% | (24.78)% | (0.42)% | 9.85% | 24.22% |
| Ratios to average net assets (annualized) | | | | | | |
Gross expenses
| 0.81% | 0.84% | 0.84% | 0.86% | 0.88% | 0.89% |
Net expenses
| 0.81% | 0.84% | 0.84% | 0.86% | 0.88% | 0.89% |
Net investment income
| 0.84% | 0.84% | 1.12% | 1.16% | 0.10% | 1.87% |
| Supplemental data | | | | | | |
Portfolio turnover rate
| 14% | 40% | 39% | 32% | 41% | 51% |
Net assets, end of period (000s omitted)
| $1,736,795 | $1,598,341 | $580,535 | $518,377 | $254,801 | $176,362 |
| 1 | Calculated based upon average shares outstanding |
| 2 | Returns for periods of less than one year are not annualized. |
The accompanying notes are an integral part of these financial statements.
22 | Wells Fargo Special Small Cap Value Fund
Financial highlights
(For a share outstanding throughout each period)
| | | Year ended March 31 |
| Administrator Class | Six months ended
September 30, 2021
(unaudited) | 2021 | 2020 | 2019 | 2018 | 2017 |
Net asset value, beginning of period
| $43.50 | $24.00 | $32.55 | $35.22 | $33.90 | $28.02 |
Net investment income
| 0.10 1 | 0.16 1 | 0.26 1 | 0.27 1 | 0.27 1 | 0.44 1 |
Net realized and unrealized gains (losses) on investments
| (0.02) | 19.48 | (8.18) | (0.71) | 2.97 | 6.24 |
Total from investment operations
| 0.08 | 19.64 | (7.92) | (0.44) | 3.24 | 6.68 |
| Distributions to shareholders from | | | | | | |
Net investment income
| 0.00 | (0.13) | (0.32) | (0.17) | (0.38) | (0.23) |
Net realized gains
| 0.00 | (0.01) | (0.31) | (2.06) | (1.54) | (0.57) |
Total distributions to shareholders
| 0.00 | (0.14) | (0.63) | (2.23) | (1.92) | (0.80) |
Net asset value, end of period
| $43.58 | $43.50 | $24.00 | $32.55 | $35.22 | $33.90 |
Total return2
| 0.18% | 82.13% | (25.03)% | (0.77)% | 9.52% | 23.82% |
| Ratios to average net assets (annualized) | | | | | | |
Gross expenses
| 1.16% | 1.19% | 1.19% | 1.21% | 1.23% | 1.24% |
Net expenses
| 1.16% | 1.18% | 1.19% | 1.20% | 1.20% | 1.20% |
Net investment income
| 0.47% | 0.51% | 0.79% | 0.74% | 0.76% | 1.36% |
| Supplemental data | | | | | | |
Portfolio turnover rate
| 14% | 40% | 39% | 32% | 41% | 51% |
Net assets, end of period (000s omitted)
| $186,798 | $196,801 | $105,286 | $160,369 | $229,992 | $199,262 |
| 1 | Calculated based upon average shares outstanding |
| 2 | Returns for periods of less than one year are not annualized. |
The accompanying notes are an integral part of these financial statements.
Wells Fargo Special Small Cap Value Fund | 23
Financial highlights
(For a share outstanding throughout each period)
| | | Year ended March 31 |
| Institutional Class | Six months ended
September 30, 2021
(unaudited) | 2021 | 2020 | 2019 | 2018 | 2017 |
Net asset value, beginning of period
| $43.52 | $24.01 | $32.56 | $35.27 | $33.94 | $28.03 |
Net investment income
| 0.16 | 0.25 1 | 0.31 | 0.33 | 0.33 | 0.60 1 |
Net realized and unrealized gains (losses) on investments
| (0.03) | 19.50 | (8.14) | (0.70) | 3.01 | 6.17 |
Total from investment operations
| 0.13 | 19.75 | (7.83) | (0.37) | 3.34 | 6.77 |
| Distributions to shareholders from | | | | | | |
Net investment income
| 0.00 | (0.23) | (0.41) | (0.28) | (0.47) | (0.29) |
Net realized gains
| 0.00 | (0.01) | (0.31) | (2.06) | (1.54) | (0.57) |
Total distributions to shareholders
| 0.00 | (0.24) | (0.72) | (2.34) | (2.01) | (0.86) |
Net asset value, end of period
| $43.65 | $43.52 | $24.01 | $32.56 | $35.27 | $33.94 |
Total return2
| 0.30% | 82.59% | (24.85)% | (0.53)% | 9.82% | 24.13% |
| Ratios to average net assets (annualized) | | | | | | |
Gross expenses
| 0.91% | 0.94% | 0.94% | 0.96% | 0.98% | 0.99% |
Net expenses
| 0.91% | 0.93% | 0.94% | 0.94% | 0.94% | 0.94% |
Net investment income
| 0.72% | 0.77% | 1.07% | 1.04% | 1.02% | 1.86% |
| Supplemental data | | | | | | |
Portfolio turnover rate
| 14% | 40% | 39% | 32% | 41% | 51% |
Net assets, end of period (000s omitted)
| $3,100,812 | $3,102,741 | $1,465,398 | $1,359,038 | $1,196,501 | $921,732 |
| 1 | Calculated based upon average shares outstanding |
| 2 | Returns for periods of less than one year are not annualized. |
The accompanying notes are an integral part of these financial statements.
24 | Wells Fargo Special Small Cap Value Fund
Notes to financial statements (unaudited)
1. ORGANIZATION
Wells Fargo Funds Trust (the "Trust"), a Delaware statutory trust organized on March 10, 1999, is an open-end management investment company registered under the Investment Company Act of 1940, as amended (the "1940 Act"). As an investment company, the Trust follows the accounting and reporting guidance in Financial Accounting Standards Board ("FASB") Accounting Standards Codification Topic 946, Financial Services – Investment Companies. These financial statements report on the Wells Fargo Special Small Cap Value Fund (the "Fund") which is a diversified series of the Trust.
On February 23, 2021, Wells Fargo & Company announced that it has entered into a definitive agreement to sell Wells Fargo Asset Management ("WFAM") to GTCR LLC and Reverence Capital Partners, L.P. WFAM is the trade name used by the asset management businesses of Wells Fargo & Company and includes Wells Fargo Funds Management, LLC, the investment manager to the Fund, Wells Capital Management, LLC and Wells Fargo Asset Management (International) Limited, both registered investment advisers providing subadvisory services to certain funds, and Wells Fargo Funds Distributor, LLC, the Fund's principal underwriter. As part of the transaction, Wells Fargo & Company will own a 9.9% equity interest and will continue to serve as an important client and distribution partner.
Consummation of the transaction will result in the automatic termination of the Fund's investment management agreement and subadvisory agreement. The Fund's Board of Trustees approved a new investment management agreement and a new subadvisory agreement which were submitted to the Fund's shareholders for approval at a Special Meeting of Shareholders scheduled for October 15, 2021. Shareholders of record of the Fund at the close of business on May 28, 2021 are entitled to vote at the meeting. If shareholders approve the new agreements, they will take effect upon the closing of the transaction.
As more fully discussed in Note 12, the transaction closed on November 1, 2021 and the investment manager, sub-advisers and distributor changed their names to Allspring Funds Management, LLC, Allspring Global Investments, LLC, Allspring Global Investments (UK) Limited and Allspring Funds Distributor, LLC. While these name changes occurred after the end of the period, throughout this report, the new names have been used.
The Board of Trustees of the Wells Fargo Funds voted on July 15, 2021 to approve a change to the Fund's name to remove "Wells Fargo" from the name and replace it with "Allspring", effective December 6, 2021.
2. SIGNIFICANT ACCOUNTING POLICIES
The following significant accounting policies, which are consistently followed in the preparation of the financial statements of the Fund, are in conformity with U.S. generally accepted accounting principles which require management to make estimates and assumptions that affect the reported amounts of assets and liabilities, disclosure of contingent assets and liabilities at the date of the financial statements, and the reported amounts of income and expenses during the reporting period. Actual results could differ from those estimates.
Securities valuation
All investments are valued each business day as of the close of regular trading on the New York Stock Exchange (generally 4 p.m. Eastern Time), although the Fund may deviate from this calculation time under unusual or unexpected circumstances.
Equity securities that are listed on a foreign or domestic exchange or market are valued at the official closing price or, if none, the last sales price. If no sale occurs on the principal exchange or market that day, a fair value price will be determined in accordance with the Fund’s Valuation Procedures.
Options that are listed on a foreign or domestic exchange or market are valued at the closing mid-price. Non-listed options are valued at the evaluated price provided by an independent pricing service or, if a reliable price is not available, the quoted bid price from an independent broker-dealer.
Investments in registered open-end investment companies are valued at net asset value. Interests in non-registered investment companies that are redeemable at net asset value are fair valued normally at net asset value.
Investments which are not valued using any of the methods discussed above are valued at their fair value, as determined in good faith by the Board of Trustees. The Board of Trustees has established a Valuation Committee comprised of the Trustees and has delegated to it the authority to take any actions regarding the valuation of portfolio securities that the Valuation Committee deems necessary or appropriate, including determining the fair value of portfolio securities, unless the determination has been delegated to the Allspring Global Investments Pricing Committee at Allspring Funds Management, LLC ("Allspring Funds Management"). The Board of Trustees retains the authority to make or ratify any valuation decisions or approve any changes to the Valuation Procedures as it deems appropriate. On a quarterly basis, the Board of Trustees receives reports on any valuation actions taken by the Valuation Committee or the Allspring Global Investments Pricing Committee which may include items for ratification.
Wells Fargo Special Small Cap Value Fund | 25
Notes to financial statements (unaudited)
Securities lending
The Fund may lend its securities from time to time in order to earn additional income in the form of fees or interest on securities received as collateral or the investment of any cash received as collateral. When securities are on loan, the Fund receives interest or dividends on those securities. Cash collateral received in connection with its securities lending transactions is invested in Securities Lending Cash Investments, LLC (the "Securities Lending Fund"). Investments in Securities Lending Fund are valued at the evaluated bid price provided by an independent pricing service. Income earned from investment in the Securities Lending Fund (net of fees and rebates), if any, is included in income from affiliated securities on the Statement of Operations.
In a securities lending transaction, the net asset value of the Fund is affected by an increase or decrease in the value of the securities loaned and by an increase or decrease in the value of the instrument in which collateral is invested. The amount of securities lending activity undertaken by the Fund fluctuates from time to time. The Fund has the right under the lending agreement to recover the securities from the borrower on demand. In the event of default or bankruptcy by the borrower, the Fund may be prevented from recovering the loaned securities or gaining access to the collateral or may experience delays or costs in doing so. In such an event, the terms of the agreement allow the unaffiliated securities lending agent to use the collateral to purchase replacement securities on behalf of the Fund or pay the Fund the market value of the loaned securities. The Fund bears the risk of loss with respect to depreciation of its investment of the cash collateral.
Futures contracts
Futures contracts are agreements between the Fund and a counterparty to buy or sell a specific amount of a commodity, financial instrument or currency at a specified price on a specified date. The Fund may buy and sell futures contracts in order to gain exposure to, or protect against, changes in security values and is subject to equity price risk. The primary risks associated with the use of futures contracts are the imperfect correlation between changes in market values of securities held by the Fund and the prices of futures contracts, and the possibility of an illiquid market. Futures contracts are generally entered into on a regulated futures exchange and cleared through a clearinghouse associated with the exchange. With futures contracts, there is minimal counterparty risk to the Fund since futures contracts are exchange traded and the exchange’s clearinghouse, as the counterparty to all exchange traded futures, guarantees the futures contracts against default.
Upon entering into a futures contract, the Fund is required to deposit either cash or securities (initial margin) with the broker in an amount equal to a certain percentage of the contract value. Subsequent payments (variation margin) are paid to or from the broker each day equal to the daily changes in the contract value. Such payments are recorded as unrealized gains or losses and, if any, shown as variation margin receivable (payable) in the Statement of Assets and Liabilities. Should the Fund fail to make requested variation margin payments, the broker can gain access to the initial margin to satisfy the Fund’s payment obligations. When the contracts are closed, a realized gain or loss is recorded in the Statement of Operations.
Options
The Fund may write covered call options or secured put options on individual securities and/or indexes. When the Fund writes an option, an amount equal to the premium received is recorded as a liability and is subsequently adjusted to the current market value of the written option. Premiums received from written options that expire unexercised are recognized as realized gains on the expiration date. For exercised options, the difference between the premium received and the amount paid on effecting a closing purchase transaction, including brokerage commissions, is treated as a realized gain or loss. If a call option is exercised, the premium is added to the proceeds from the sale of the underlying security in calculating the realized gain or loss on the sale. If a put option is exercised, the premium reduces the cost of the security purchased. The Fund, as a writer of an option, bears the market risk of an unfavorable change in the price of the security and/or index underlying the written option.
The Fund may also purchase call or put options. Premiums paid are included in the Statement of Assets and Liabilities as investments, the values of which are subsequently adjusted based on the current market values of the options. Premiums paid for purchased options that expire are recognized as realized losses on the expiration date. Premiums paid for purchased options that are exercised or closed are added to the amount paid or offset against the proceeds received for the underlying security to determine the realized gain or loss. The risk of loss associated with purchased options is limited to the premium paid.
Options traded on an exchange are regulated and terms of the options are standardized. The Fund is subject to equity price risk. Purchased options traded over-the-counter expose the Fund to counterparty risk in the event the counterparty does not perform. This risk can be mitigated by having a master netting arrangement between the Fund and the counterparty and by having the counterparty post collateral to cover the Fund’s exposure to the counterparty.
Forward commitments
The Fund may enter into forward commitment agreements, which agreements obligate the Fund, for a set period, to buy a certain amount of a security that may be issued and sold on a private placement basis, at the option of the issuer. The price of a
26 | Wells Fargo Special Small Cap Value Fund
Notes to financial statements (unaudited)
security purchased pursuant to a forward commitment agreement is set at the time of the agreement. There is no assurance that the securities subject to a forward commitment agreement will be issued or, if such securities are issued, the value of the securities on the date of issuance may be more or less than the purchase price. The Fund will record the purchase of a security acquired under a forward commitment agreement, and will reflect the value of the security in the Fund’s net asset value, on the date on which the security can reasonably be expected to be issued.
Security transactions and income recognition
Securities transactions are recorded on a trade date basis. Realized gains or losses are recorded on the basis of identified cost.
Dividend income is recognized on the ex-dividend date. Dividend income is recorded net of foreign taxes withheld where recovery of such taxes is not assured.
Income dividends and capital gain distributions from investment companies are recorded on the ex-dividend date. Capital gain distributions from investment companies are treated as realized gains.
Distributions to shareholders
Distributions to shareholders from net investment income and any net realized gains are recorded on the ex-dividend date and paid at least annually. Such distributions are determined in accordance with income tax regulations and may differ from U.S. generally accepted accounting principles. Dividend sources are estimated at the time of declaration. The tax character of distributions is determined as of the Fund's fiscal year end. Therefore, a portion of the Fund's distributions made prior to the Fund’s fiscal year end may be categorized as a tax return of capital at year end.
Federal and other taxes
The Fund intends to continue to qualify as a regulated investment company by distributing substantially all of its investment company taxable income and any net realized capital gains (after reduction for capital loss carryforwards) sufficient to relieve it from all, or substantially all, federal income taxes. Accordingly, no provision for federal income taxes was required.
The Fund’s income and federal excise tax returns and all financial records supporting those returns for the prior three fiscal years are subject to examination by the federal and Delaware revenue authorities. Management has analyzed the Fund's tax positions taken on federal, state, and foreign tax returns for all open tax years and does not believe that there are any uncertain tax positions that require recognition of a tax liability.
As of September 30, 2021, the aggregate cost of all investments for federal income tax purposes was $4,741,794,497 and the unrealized gains (losses) consisted of:
| Gross unrealized gains | $1,383,179,825 |
| Gross unrealized losses | (210,880,702) |
| Net unrealized gains | $1,172,299,123 |
Class allocations
The separate classes of shares offered by the Fund differ principally in applicable sales charges, distribution, shareholder servicing, and administration fees. Class specific expenses are charged directly to that share class. Investment income, common fund-level expenses, and realized and unrealized gains (losses) on investments are allocated daily to each class of shares based on the relative proportion of net assets of each class.
Wells Fargo Special Small Cap Value Fund | 27
Notes to financial statements (unaudited)
3. FAIR VALUATION MEASUREMENTS
Fair value measurements of investments are determined within a framework that has established a fair value hierarchy based upon the various data inputs utilized in determining the value of the Fund’s investments. The three-level hierarchy gives the highest priority to unadjusted quoted prices in active markets for identical assets or liabilities (Level 1) and the lowest priority to unobservable inputs (Level 3). The Fund’s investments are classified within the fair value hierarchy based on the lowest level of input that is significant to the fair value measurement. The inputs are summarized into three broad levels as follows:
| ■ | Level 1 – quoted prices in active markets for identical securities |
| ■ | Level 2 – other significant observable inputs (including quoted prices for similar securities, interest rates, prepayment speeds, credit risk, etc.) |
| ■ | Level 3 – significant unobservable inputs (including the Fund’s own assumptions in determining the fair value of investments) |
The inputs or methodologies used for valuing investments in securities are not necessarily an indication of the risk associated with investing in those securities.
The following is a summary of the inputs used in valuing the Fund’s assets and liabilities as of September 30, 2021:
| | Quoted prices
(Level 1) | Other significant
observable inputs
(Level 2) | Significant
unobservable inputs
(Level 3) | Total |
| Assets | | | | |
| Investments in: | | | | |
| Common stocks | | | | |
| Communication services | $ 3,771,049 | $ 0 | $0 | $ 3,771,049 |
| Consumer discretionary | 480,263,750 | 65,670,000 | 0 | 545,933,750 |
| Consumer staples | 634,954,216 | 0 | 0 | 634,954,216 |
| Energy | 333,232,527 | 0 | 0 | 333,232,527 |
| Financials | 1,081,638,458 | 9,291,229 | 0 | 1,090,929,687 |
| Health care | 266,512,829 | 3,529,060 | 0 | 270,041,889 |
| Industrials | 1,546,527,461 | 75,642,947 | 0 | 1,622,170,408 |
| Information technology | 181,763,243 | 29,308,400 | 0 | 211,071,643 |
| Materials | 867,945,668 | 0 | 0 | 867,945,668 |
| Real estate | 36,350,573 | 0 | 0 | 36,350,573 |
| Utilities | 109,517,770 | 0 | 0 | 109,517,770 |
| Other instruments | 0 | 0 | 0 | 0 |
| Short-term investments | | | | |
| Investment companies | 188,345,133 | 0 | 0 | 188,345,133 |
| Total assets | $5,730,822,677 | $183,441,636 | $0 | $5,914,264,313 |
| Liabilities | | | | |
| Written options | $ 0 | $ 815,750 | $0 | $ 815,750 |
| Total liabilities | $ 0 | $ 815,750 | $0 | $ 815,750 |
Additional sector, industry or geographic detail, if any, is included in the Portfolio of Investments.
For the six months ended September 30, 2021 the Fund had no material transfers into/out of Level 3.
4. TRANSACTIONS WITH AFFILIATES
Management fee
Allspring Funds Management, a wholly owned subsidiary of Allspring Global Investments Holdings, LLC, a holding company indirectly owned by Wells Fargo & Company as of September 30, 2021, is the manager of the Fund and provides advisory and fund-level administrative services under an investment management agreement. Under the investment management agreement, Allspring Funds Management is responsible for, among other services, implementing the investment objectives and strategies of the Fund, supervising the subadviser and providing fund-level administrative services in connection with the
28 | Wells Fargo Special Small Cap Value Fund
Notes to financial statements (unaudited)
Fund’s operations. As compensation for its services under the investment management agreement, Allspring Funds Management is entitled to receive a management fee at the following annual rate based on the Fund’s average daily net assets:
| Average daily net assets | Management fee |
| First $500 million | 0.850% |
| Next $500 million | 0.825 |
| Next $1 billion | 0.800 |
| Next $1 billion | 0.775 |
| Next $1 billion | 0.750 |
| Next $1 billion | 0.730 |
| Next $5 billion | 0.720 |
| Over $10 billion | 0.710 |
For the six months ended September 30, 2021, the management fee was equivalent to an annual rate of 0.77% of the Fund’s average daily net assets.
Allspring Funds Management has retained the services of a subadviser to provide daily portfolio management to the Fund. The fee for subadvisory services is borne by Allspring Funds Management. Allspring Global Investments, LLC ("Allspring Investments"), an affiliate of Allspring Funds Management and wholly owned subsidiary of Allspring Global Investments Holdings, LLC, is the subadviser to the Fund and is entitled to receive a fee from Allspring Funds Management at an annual rate starting at 0.55% and declining to 0.40% as the average daily net assets of the Fund increase.
Administration fees
Under a class-level administration agreement, Allspring Funds Management provides class-level administrative services to the Fund, which includes paying fees and expenses for services provided by the transfer agent, sub-transfer agents, omnibus account servicers and record-keepers. As compensation for its services under the class-level administration agreement, Allspring Funds Management receives an annual fee which is calculated based on the average daily net assets of each class as follows:
| | Class-level
administration fee |
| Class A | 0.21% |
| Class C | 0.21 |
| Class R | 0.21 |
| Class R6 | 0.03 |
| Administrator Class | 0.13 |
| Institutional Class | 0.13 |
Waivers and/or expense reimbursements
Allspring Funds Management has contractually committed to waive and/or reimburse management and administration fees to the extent necessary to maintain certain net operating expense ratios for the Fund. When each class of the Fund has exceeded its expense cap, Allspring Funds Management will waive fees and/or reimburse expenses from fund-level expenses on a proportionate basis and then from class specific expenses. When only certain classes exceed their expense caps, waivers and/or reimbursements are applied against class specific expenses before fund-level expenses. Allspring Funds Management has contractually committed through July 31, 2022 to waive fees and/or reimburse expenses to the extent necessary to cap expenses. Prior to or after the commitment expiration date, the caps may be increased or the commitment to maintain the caps may be terminated only with the approval of the Board of Trustees. The contractual expense caps are as follows:
Wells Fargo Special Small Cap Value Fund | 29
Notes to financial statements (unaudited)
| | Expense ratio caps |
| Class A | 1.31% |
| Class C | 2.06 |
| Class R | 1.56 |
| Class R6 | 0.89 |
| Administrator Class | 1.20 |
| Institutional Class | 0.94 |
Distribution fees
The Trust has adopted a distribution plan for Class C and Class R shares of the Fund pursuant to Rule 12b-1 under the 1940 Act. Distribution fees are charged to Class C and Class R shares and paid to Allspring Funds Distributor, LLC ("Allspring Funds Distributor"), an affiliate of Allspring Funds Management, the principal underwriter, at an annual rate of 0.75% of the average daily net assets of Class C shares and 0.25% of the average daily net assets of Class R shares.
In addition, Allspring Funds Distributor is entitled to receive the front-end sales charge from the purchase of Class A shares and a contingent deferred sales charge on the redemption of certain Class A shares. Allspring Funds Distributor is also entitled to receive the contingent deferred sales charges from redemptions of Class C shares. For the six months ended September 30, 2021, Allspring Funds Distributor received $1,336 from the sale of Class A shares. No contingent deferred sales charges were incurred by Class A and Class C shares for the six months ended September 30, 2021.
Shareholder servicing fees
The Trust has entered into contracts with one or more shareholder servicing agents, whereby Class A, Class C, Class R, and Administrator Class of the Fund are charged a fee at an annual rate of 0.25% of the average daily net assets of each respective class. A portion of these total shareholder servicing fees were paid to affiliates.
Interfund transactions
The Fund may purchase or sell portfolio investment securities to certain affiliates pursuant to Rule 17a-7 under the 1940 Act and under procedures adopted by the Board of Trustees. The procedures have been designed to ensure that these interfund transactions, which do not incur broker commissions, are effected at current market prices.
5. INVESTMENT PORTFOLIO TRANSACTIONS
Purchases and sales of investments, excluding U.S. government obligations (if any) and short-term securities, for the six months ended September 30, 2021 were $1,104,405,589 and $802,399,351, respectively.
6. SECURITIES LENDING TRANSACTIONS
The Fund lends its securities through an unaffiliated securities lending agent and receives collateral in the form of cash or securities with a value at least equal to the value of the securities on loan. The value of the loaned securities is determined at the close of each business day and any increases or decreases in the required collateral are exchanged between the Fund and the counterparty on the next business day. Cash collateral received is invested in the Securities Lending Fund which seeks to provide a positive return compared to the daily Federal Funds Open Rate by investing in high-quality, U.S. dollar-denominated short-term money market instruments and is exempt from registration under Section 3(c)(7) of the 1940 Act. Securities Lending Fund is managed by Allspring Funds Management and is subadvised by Allspring Investments. Allspring Funds Management receives an advisory fee starting at 0.05% and declining to 0.01% as the average daily net assets of the Securities Lending Fund increase. All of the fees received by Allspring Funds Management are paid to Allspring Investments for its services as subadviser.
In the event of counterparty default or the failure of a borrower to return a loaned security, the Fund has the right to use the collateral to offset any losses incurred. As of September 30, 2021, the Fund had securities lending transactions with the following counterparties which are subject to offset:
30 | Wells Fargo Special Small Cap Value Fund
Notes to financial statements (unaudited)
| Counterparty | Value of
securities on
loan | Collateral
received1 | Net amount |
| Bank of America Securities Incorporated | $ 2,802,280 | $ (2,802,280) | $0 |
| Barclays Capital Incorporated | 757,482 | (757,482) | 0 |
| BNP Paribas Securities Corporation | 1,369,745 | (1,369,745) | 0 |
| JPMorgan Securities LLC | 27,027,450 | (27,027,450) | 0 |
| National Financial Services LLC | 218,891 | (218,891) | 0 |
1 Collateral received within this table is limited to the collateral for the net transaction with the counterparty.
7. DERIVATIVE TRANSACTIONS
During the six months ended September 30, 2021, the Fund entered into written options for hedging purposes and had an average of 5,709 written option contracts.
The fair value, realized gains or losses and change in unrealized gains or losses, if any, on derivative instruments are reflected in the corresponding financial statement captions.
The Fund's written option contracts are subject to a master netting arrangement. As of September 30, 2021, the Fund had written options contracts with the following counterparty which are subject to offset:
| Counterparty | Value of
written
options | Collateral
pledged1 | Net amount
of assets |
| Bank of America Securities Incorporated | $815,750 | $(815,750) | $0 |
1 Collateral pledged within this table is limited to the collateral for the net transaction with the counterparty.
8. BANK BORROWINGS
The Trust (excluding the money market funds), Wells Fargo Master Trust and Wells Fargo Variable Trust are parties to a $350,000,000 revolving credit agreement whereby the Fund is permitted to use bank borrowings for temporary or emergency purposes, such as to fund shareholder redemption requests. Interest under the credit agreement is charged to the Fund based on a borrowing rate equal to the higher of the Federal Funds rate in effect on that day plus 1.25% or the overnight bank funding rate in effect on that day plus 1.25%. In addition, an annual commitment fee equal to 0.25% of the unused balance is allocated to each participating fund.
For the six months ended September 30, 2021, there were no borrowings by the Fund under the agreement.
9. CONCENTRATION RISKS
As of the end of the period, the Fund concentrated its portfolio of investments in industrials sector. A fund that invests a substantial portion of its assets in any sector may be more affected by changes in that sector than would be a fund whose investments are not heavily weighted in any sector.
10. INDEMNIFICATION
Under the Fund's organizational documents, the officers and Trustees have been granted certain indemnification rights against certain liabilities that may arise out of performance of their duties to the Fund. The Fund has entered into a separate agreement with each Trustee that converts indemnification rights currently existing under the Fund’s organizational documents into contractual rights that cannot be changed in the future without the consent of the Trustee. Additionally, in the normal course of business, the Fund may enter into contracts with service providers that contain a variety of indemnification clauses. The Fund’s maximum exposure under these arrangements is dependent on future claims that may be made against the Fund and, therefore, cannot be estimated.
11. CORONAVIRUS (COVID-19) PANDEMIC
On March 11, 2020, the World Health Organization announced that it had made the assessment that coronavirus disease 2019 (“COVID-19”) is a pandemic. The impacts of COVID-19 are affecting the entire global economy, individual companies and investment products, the funds, and the market in general. There is significant uncertainty around the extent and duration of
Wells Fargo Special Small Cap Value Fund | 31
Notes to financial statements (unaudited)
business disruptions related to COVID-19 and the impacts may last for an extended period of time. COVID-19 has led to significant uncertainty and volatility in the financial markets.
12. SUBSEQUENT EVENTS
Effective after the close of business on November 1, 2021, the sale transaction of Wells Fargo Asset Management by Wells Fargo & Company to GTCR LLC and Reverence Capital Partners, L.P. was closed. In connection with the closing of the transaction, Wells Fargo Asset Management became known as Allspring Global Investments (“Allspring”) and various entities that provide services to the Fund changed their names to “Allspring”, including Allspring Funds Management, LLC (formerly Wells Fargo Funds Management, LLC), the investment manager to the Fund, Allspring Global Investments, LLC (formerly Wells Capital Management, LLC) and Allspring Global Investments (UK) Limited (formerly Wells Fargo Asset Management (International) Limited), both registered investment advisers providing sub-advisory services to certain funds, and Allspring Funds Distributor, LLC (formerly Wells Fargo Funds Distributor, LLC), the Fund's principal underwriter. These name changes have been reflected within this report.
At a Special Meeting of Shareholders held on October 15, 2021, shareholders of the Fund approved a new investment management and a new subadvisory agreement that was effective on November 1, 2021. The management and subadisory fee rates remained the same under the new agreements.
32 | Wells Fargo Special Small Cap Value Fund
Other information (unaudited)
PROXY VOTING INFORMATION
A description of the policies and procedures used to determine how to vote proxies relating to portfolio securities is available without charge, upon request, by calling 1-800-222-8222, visiting our website at allspringglobal.com, or visiting the SEC website at sec.gov. Information regarding how the proxies related to portfolio securities were voted during the most recent 12-month period ended June 30 is available on the website at allspringglobal.com or by visiting the SEC website at sec.gov.
SPECIAL MEETING OF SHAREHOLDERS
On October 15, 2021, a Special Meeting of Shareholders for the Fund was held to consider the following proposals. The results of the proposals are indicated below.
Proposal 1 – To consider and approve a new investment management agreement with Wells Fargo Funds Management, LLC*.
| Shares voted “For” | | 60,309,911 |
| Shares voted “Against” | | 1,608,022 |
| Shares voted “Abstain” | | 3,736,840 |
| Shares voted “Uninstructed” | | 3,815,599 |
Proposal 2 – To consider and approve a new investment subadvisory agreement with Wells Capital Management, LLC**.
| Shares voted “For” | | 60,120,532 |
| Shares voted “Against” | | 1,744,490 |
| Shares voted “Abstain” | | 3,789,751 |
| Shares voted “Uninstructed” | | 3,815,599 |
* Effective November 1, 2021, known as Allspring Funds Management, LLC.
** Effective November 1, 2021, known as Allspring Global Investments, LLC.
QUARTERLY PORTFOLIO HOLDINGS INFORMATION
The Fund files its complete schedule of portfolio holdings with the SEC for the first and third quarters of each fiscal year as an exhibit to its reports on Form N-PORT. Shareholders may view the filed Form N-PORT by visiting the SEC website at sec.gov.
Wells Fargo Special Small Cap Value Fund | 33
Other information (unaudited)
BOARD OF TRUSTEES AND OFFICERS
Each of the Trustees and Officers listed in the table below acts in identical capacities for each fund in the Wells Fargo family of funds, which consists of 139 mutual funds comprising the Wells Fargo Funds Trust, Wells Fargo Variable Trust, Wells Fargo Master Trust and four closed-end funds (collectively the “Fund Complex”). This table should be read in conjunction with the Prospectus and the Statement of Additional Information1. The mailing address of each Trustee and Officer is 525 Market Street, 12th Floor, San Francisco, CA 94105. Each Trustee and Officer serves an indefinite term, however, each Trustee serves such term until reaching the mandatory retirement age established by the Trustees.
Independent Trustees
Name and
year of birth | Position held and
length of service* | Principal occupations during past five years or longer | Current other
public company or
investment
company
directorships |
William R. Ebsworth
(Born 1957) | Trustee,
since 2015 | Retired. From 1984 to 2013, equities analyst, portfolio manager, research director and chief investment officer at Fidelity Management and Research Company in Boston, Tokyo, and Hong Kong, and retired in 2013 as Chief Investment Officer of Fidelity Strategic Advisers, Inc. where he led a team of investment professionals managing client assets. Prior thereto, Board member of Hong Kong Securities Clearing Co., Hong Kong Options Clearing Corp., the Thailand International Fund, Ltd., Fidelity Investments Life Insurance Company, and Empire Fidelity Investments Life Insurance Company. Audit Committee Chair and Investment Committee Chair of the Vincent Memorial Hospital Endowment (non-profit organization). Mr. Ebsworth is a CFA® charterholder. | N/A |
Jane A. Freeman
(Born 1953) | Trustee,
since 2015;
Chair Liaison,
since 2018 | Retired. From 2012 to 2014 and 1999 to 2008, Chief Financial Officer of Scientific Learning Corporation. From 2008 to 2012, Ms. Freeman provided consulting services related to strategic business projects. Prior to 1999, Portfolio Manager at Rockefeller & Co. and Scudder, Stevens & Clark. Board member of the Harding Loevner Funds from 1996 to 2014, serving as both Lead Independent Director and chair of the Audit Committee. Board member of the Russell Exchange Traded Funds Trust from 2011 to 2012 and the chair of the Audit Committee. Ms. Freeman is also an inactive Chartered Financial Analyst. | N/A |
Isaiah Harris, Jr.
(Born 1952) | Trustee,
since 2009; Audit
Committee
Chair,
since 2019 | Retired. Chairman of the Board of CIGNA Corporation since 2009, and Director since 2005. From 2003 to 2011, Director of Deluxe Corporation. Prior thereto, President and CEO of BellSouth Advertising and Publishing Corp. from 2005 to 2007, President and CEO of BellSouth Enterprises from 2004 to 2005 and President of BellSouth Consumer Services from 2000 to 2003. Emeritus member of the Iowa State University Foundation Board of Governors. Emeritus Member of the Advisory Board of Iowa State University School of Business. Advisory Board Member, Palm Harbor Academy (private school). Mr. Harris is a certified public accountant (inactive status). | CIGNA Corporation |
Judith M. Johnson
(Born 1949) | Trustee,
since 2008 | Retired. Prior thereto, Chief Executive Officer and Chief Investment Officer of Minneapolis Employees Retirement Fund from 1996 to 2008. Ms. Johnson is an attorney, certified public accountant and a certified managerial accountant. | N/A |
David F. Larcker
(Born 1950) | Trustee,
since 2009 | James Irvin Miller Professor of Accounting at the Graduate School of Business (Emeritus), Stanford University, Director of the Corporate Governance Research Initiative and Senior Faculty of The Rock Center for Corporate Governance since 2006. From 2005 to 2008, Professor of Accounting at the Graduate School of Business, Stanford University. Prior thereto, Ernst & Young Professor of Accounting at The Wharton School, University of Pennsylvania from 1985 to 2005. | N/A |
34 | Wells Fargo Special Small Cap Value Fund
Other information (unaudited)
Name and
year of birth | Position held and
length of service* | Principal occupations during past five years or longer | Current other
public company or
investment
company
directorships |
Olivia S. Mitchell
(Born 1953) | Trustee,
since 2006;
Nominating and
Governance
Committee Chair,
since 2018 | International Foundation of Employee Benefit Plans Professor, Wharton School of the University of Pennsylvania since 1993. Director of Wharton’s Pension Research Council and Boettner Center on Pensions & Retirement Research, and Research Associate at the National Bureau of Economic Research. Previously, Cornell University Professor from 1978 to 1993. | N/A |
Timothy J. Penny
(Born 1951) | Trustee,
since 1996;
Chair,
since 2018 | President and Chief Executive Officer of Southern Minnesota Initiative Foundation, a non-profit organization, since 2007. Member of the Board of Trustees of NorthStar Education Finance, Inc., a non-profit organization, since 2007. | N/A |
James G. Polisson
(Born 1959) | Trustee,
since 2018 | Retired. Chief Marketing Officer, Source (ETF) UK Services, Ltd, from 2015 to 2017. From 2012 to 2015, Principal of The Polisson Group, LLC, a management consulting, corporate advisory and principal investing company. Chief Executive Officer and Managing Director at Russell Investments, Global Exchange Traded Funds from 2010 to 2012. Managing Director of Barclays Global Investors from 1998 to 2010 and Global Chief Marketing Officer for iShares and Barclays Global Investors from 2000 to 2010. Trustee of the San Francisco Mechanics’ Institute, a non-profit organization, from 2013 to 2015. Board member of the Russell Exchange Traded Fund Trust from 2011 to 2012. Director of Barclays Global Investors Holdings Deutschland GmbH from 2006 to 2009. Mr. Polisson is an attorney and has a retired status with the Massachusetts and District of Columbia Bar Associations. | N/A |
Pamela Wheelock
(Born 1959) | Trustee,
since January
2020; previously
Trustee from
January 2018 to
July 2019 | Board member of the Destination Medical Center Economic Development Agency, Rochester, Minnesota since 2019. Interim President of the McKnight Foundation from January to September 2020. Acting Commissioner, Minnesota Department of Human Services, July 2019 through September 2019. Human Services Manager (part-time), Minnesota Department of Human Services, October 2019 through December 2019. Chief Operating Officer, Twin Cities Habitat for Humanity from 2017 to 2019. Vice President of University Services, University of Minnesota from 2012 to 2016. Prior thereto, on the Board of Directors, Governance Committee and Finance Committee for the Minnesota Philanthropy Partners (Saint Paul Foundation) from 2012 to 2018, Interim Chief Executive Officer of Blue Cross Blue Shield of Minnesota from 2011 to 2012, Chairman of the Board from 2009 to 2012 and Board Director from 2003 to 2015. Vice President, Leadership and Community Engagement, Bush Foundation, Saint Paul, Minnesota (a private foundation) from 2009 to 2011. Executive Vice President and Chief Financial Officer, Minnesota Sports and Entertainment from 2004 to 2009 and Senior Vice President from 2002 to 2004. Executive Vice President of the Minnesota Wild Foundation from 2004 to 2008. Commissioner of Finance, State of Minnesota, from 1999 to 2002. Currently Board Chair of the Minnesota Wild Foundation since 2010. | N/A |
* Length of service dates reflect the Trustee’s commencement of service with the Trust’s predecessor entities, where applicable.
Wells Fargo Special Small Cap Value Fund | 35
Other information (unaudited)
Officers2
Name and
year of birth | Position held and
length of service | Principal occupations during past five years or longer |
Andrew Owen
(Born 1960) | President,
since 2017 | President, Chief Executive Officer and Director of Allspring Funds Management, LLC since 2017 and co-president of Galliard Capital Management, LLC, an affiliate of Allspring Funds Management, LLC, since 2019. Prior thereto, Head of Affiliated Managers, Allspring Global Investments, from 2014 to 2019 and Executive Vice President responsible for marketing, investments and product development for Allspring Funds Management, LLC, from 2009 to 2014. In addition, Mr. Owen was an Executive Vice President of Wells Fargo & Company from 2014 to 2021. |
Jeremy DePalma
(Born 1974) | Treasurer,
since 2012
(for certain funds in
the Fund Complex);
since 2021 (for
the remaining funds in the
Fund Complex) | Senior Vice President of Allspring Funds Management, LLC since 2009. Senior Vice President of Evergreen Investment Management Company, LLC from 2008 to 2010 and head of the Fund Reporting and Control Team within Fund Administration. |
Kate McKinley
(Born 1977) | Chief Legal Officer and Chief Compliance Officer,
since 2021 | Chief Legal Officer of Allspring Global Investments since 2021. Prior thereto, held various roles at State Street Global Advisors, Inc. beginning in 2010, including serving as Senior Vice President and General Counsel from 2019 to 2021. Previously served as Assistant General Counsel for Bank of America Corporation from 2005 to 2010 and as an Associate at WilmerHale from 2002 to 2005. |
Matthew Prasse
(Born 1983) | Secretary,
since 2021 | Senior Counsel of the Allspring Legal Department since 2021. Senior Counsel of the Wells Fargo Legal Department from 2018 to 2021. Previously, Counsel for Barings LLC from 2015 to 2018. Prior to joining Barings, Associate at Morgan, Lewis & Bockius LLP from 2008 to 2015. |
1 The Statement of Additional Information includes additional information about the Trustees and is available, without charge, upon request, by calling 1-800-222-8222 or by visiting the website at allspringglobal.com.
2 For those Officers with tenures at Allspring Global Investments and/or Allspring Funds Management, LLC that began prior to 2021, such tenures include years of service during which these businesses/entities were known as Wells Fargo Asset Management and Wells Fargo Funds Management, LLC, respectively.
36 | Wells Fargo Special Small Cap Value Fund
Board considerations (unaudited)
BOARD CONSIDERATION OF INVESTMENT MANAGEMENT AND SUB-ADVISORY AGREEMENTS:
Board Considerations – Current Agreements
Under the Investment Company Act of 1940 (the “1940 Act”), the Board of Trustees (the “Board”) of Wells Fargo Funds Trust (the “Trust”) must determine annually whether to approve the continuation of the Trust’s investment management and sub-advisory agreements. In this regard, at a Board meeting held on May 17-19, 2021 (the “Meeting”), the Board, all the members of which have no direct or indirect interest in the investment management and sub-advisory agreements and are not “interested persons” of the Trust, as defined in the 1940 Act (the “Independent Trustees”), reviewed and approved for Wells Fargo Special Small Cap Value Fund (the “Fund”): (i) an investment management agreement (the “Management Agreement”) with Wells Fargo Funds Management, LLC (“Funds Management”); and (ii) an investment sub-advisory agreement (the “Sub-Advisory Agreement”) with Wells Capital Management Incorporated (the “Sub-Adviser”), an affiliate of Funds Management. The Management Agreement and the Sub-Advisory Agreement are collectively referred to as the “Advisory Agreements.”
The Board noted that Wells Fargo & Company recently announced that it had entered into a definitive agreement to sell Wells Fargo Asset Management (“WFAM”), which includes Funds Management and the Sub-Adviser, to GTCR LLC and Reverence Capital Partners, L.P. and/or their affiliates (the “Transaction”). The Board further noted that the Transaction would result in a change-of-control of Funds Management and the Sub-Adviser, which would be considered to be an assignment that would result in the termination of the Advisory Agreements. In light of the Transaction, the Board separately considered for approval a new investment management agreement with Funds Management and a new sub-advisory agreement with the Sub-Adviser (the “New Agreements”) that would replace the Advisory Agreements upon consummation of the Transaction, subject to approval of the New Agreements by the Fund’s shareholders. The Board also considered for approval interim agreements to go into effect in the event shareholders do not approve the New Agreements before the Transaction is completed. The interim agreements would allow the Manager and the Sub-Adviser to continue providing services to the Fund while the Fund continues to seek shareholder approval of the New Agreements. The Board noted that the terms of the interim agreements would be identical to those of the current Advisory Agreements, except for the term and certain escrow provisions.
At the Meeting, the Board considered the factors and reached the conclusions described below relating to the selection of Funds Management and the Sub-Adviser and the approval of the Advisory Agreements. Prior to the Meeting, including at Board meetings held in April and May 2021, the Trustees conferred extensively among themselves and with representatives of Funds Management about these matters. Also, the Board has adopted a team-based approach, with each team consisting of a sub-set of Trustees, to assist the full Board in the discharge of its duties in reviewing investment performance and other matters throughout the year. The Independent Trustees were assisted in their evaluation of the Advisory Agreements by independent legal counsel, from whom they received separate legal advice and with whom they met separately.
In providing information to the Board, Funds Management and the Sub-Adviser were guided by a detailed set of requests for information submitted to them by independent legal counsel on behalf of the Independent Trustees at the start of the Board’s annual contract renewal process earlier in 2021. In considering and approving the Advisory Agreements, the Trustees considered the information they believed relevant, including but not limited to the information discussed below. The Board considered not only the specific information presented in connection with the Meeting, but also the knowledge gained over time through interaction with Funds Management and the Sub-Adviser about various topics. In this regard, the Board reviewed reports of Funds Management at each of its quarterly meetings, which included, among other things, portfolio reviews and investment performance reports. In addition, the Board and the teams mentioned above confer with portfolio managers at various times throughout the year. The Board did not identify any particular information or consideration that was all-important or controlling, and each individual Trustee may have attributed different weights to various factors.
After its deliberations, the Board unanimously determined that the compensation payable to Funds Management and the Sub-Adviser under each of the Advisory Agreements was reasonable, and approved the continuation of the Advisory Agreements for a one-year term. The Board considered the approval of the Advisory Agreements for the Fund as part of its consideration of agreements for funds across the complex, but its approvals were made on a fund-by-fund basis. The following summarizes a number of important, but not necessarily all, factors considered by the Board in support of its approvals.
Nature, extent and quality of services
The Board received and considered various information regarding the nature, extent and quality of services provided to the Fund by Funds Management and the Sub-Adviser under the Advisory Agreements. This information included a description of the investment advisory services and Fund-level administrative services covered by the Management Agreement, as well as, among other things, a summary of the background and experience of senior management of WFAM, of which Funds Management and the Sub-Adviser are a part, and a summary of investments made in the business of WFAM. The Board also received a description of
Wells Fargo Special Small Cap Value Fund | 37
Board considerations (unaudited)
Funds Management’s and the Sub-Adviser’s business continuity plans, including a summary of the performance of such plans and any changes thereto during the COVID-19 pandemic, and of their approaches to data privacy and cybersecurity. The Board also received and reviewed information about Funds Management’s role as administrator of the Fund’s liquidity risk management program, Funds Management’s approach to risk management, and Funds Management’s intermediary and vendor oversight program.
The Board also considered the qualifications, background, tenure and responsibilities of each of the portfolio managers primarily responsible for the day-to-day portfolio management of the Fund. The Board evaluated the ability of Funds Management and the Sub-Adviser to attract and retain qualified investment professionals, including research, advisory and supervisory personnel.
The Board further considered the compliance programs and compliance records of Funds Management and the Sub-Adviser. In addition, the Board took into account the full range of services provided to the Fund by Funds Management and its affiliates. The Board also considered information about retention and back-up arrangements that have been put into place with respect to key personnel of WFAM in connection with the anticipated Transaction, noting that WFAM provided assurances that the announcement and eventual culmination of the Transaction is not expected to result in any diminution in the nature or quality of services provided to the Fund.
Fund investment performance and expenses
The Board considered the investment performance results for the Fund over various time periods ended December 31, 2020. The Board considered these results in comparison to the investment performance of funds in a universe that was determined by Broadridge Inc. (“Broadridge”) to be similar to the Fund (the “Universe”), and in comparison to the Fund’s benchmark index and to other comparative data. Broadridge is an independent provider of investment company data. The Board received a description of the methodology used by Broadridge to select the mutual funds in the performance Universe. The Board noted that the investment performance of the Fund (Administrator Class) was higher than the average investment performance of the Universe for all periods under review except the one-year period, which was lower than the average investment performance of the Universe. The Board also noted that the investment performance of the Fund was higher than its benchmark index, the Russell 2000® Value Index, for all periods under review except the one-year period, which was lower than its benchmark index.
The Board also received and considered information regarding the Fund’s net operating expense ratios and their various components, including actual management fees, custodian and other non-management fees, and Rule 12b-1 and non-Rule 12b-1 shareholder service fees. The Board considered these ratios in comparison to the median ratios of funds in class-specific expense groups that were determined by Broadridge to be similar to the Fund (the “Groups”). The Board received a description of the methodology used by Broadridge to select the mutual funds in the expense Groups and an explanation of how funds comprising expense groups and their expense ratios may vary from year-to-year. Based on the Broadridge reports, the Board noted that the net operating expense ratios of the Fund were lower than or in range of the median net operating expense ratios of the expense Groups for each share class.
The Board took into account the Fund’s investment performance and expense information provided to it among the factors considered in deciding to re-approve the Advisory Agreements.
Investment management and sub-advisory fee rates
The Board reviewed and considered the contractual fee rates payable by the Fund to Funds Management under the Management Agreement, as well as the contractual fee rates payable by the Fund to Funds Management for class-level administrative services under a Class-Level Administration Agreement, which include, among other things, class-level transfer agency and sub-transfer agency costs (collectively, the “Management Rates”). The Board also reviewed and considered the contractual investment sub-advisory fee rates that are payable by Funds Management to the Sub-Adviser for investment sub-advisory services.
Among other information reviewed by the Board was a comparison of the Fund’s Management Rates with the average contractual investment management fee rates of funds in the expense Groups at a common asset level as well as transfer agency costs of the funds in the expense Groups. The Board noted that the Management Rates of the Fund were in range of the sum of these average rates for the Fund’s expense Groups for all share classes except the Class R, which was lower than the sum of these average rates for the Fund’s expense Groups.
The Board also received and considered information about the portion of the total management fee that was retained by Funds Management after payment of the fee to the Sub-Adviser for sub-advisory services. In assessing the reasonableness of this amount, the Board received and evaluated information about the nature and extent of responsibilities retained and risks assumed by Funds Management and not delegated to or assumed by the Sub-Adviser, and about Funds Management’s on-going oversight services. Given the affiliation between Funds Management and the Sub-Adviser, the Board ascribed limited relevance to the allocation of fees between them.
38 | Wells Fargo Special Small Cap Value Fund
Board considerations (unaudited)
The Board also received and considered information about the nature and extent of services offered and fee rates charged by Funds Management and the Sub-Adviser to other types of clients with investment strategies similar to those of the Fund. In this regard, the Board received information about the significantly greater scope of services, and compliance, reporting and other legal burdens and risks of managing proprietary mutual funds compared with those associated with managing assets of other types of clients, including third-party sub-advised fund clients and non-mutual fund clients such as institutional separate accounts.
Based on its consideration of the factors and information it deemed relevant, including those described here, the Board determined that the compensation payable to Funds Management under the Management Agreement and to the Sub-Adviser under the Sub-Advisory Agreement was reasonable.
Profitability
The Board received and considered information concerning the profitability of Funds Management, as well as the profitability of both WFAM and Wells Fargo & Co. (“Wells Fargo”) from providing services to the fund family as a whole. The Board noted that the Sub-Adviser’s profitability information with respect to providing services to the Fund and other funds in the family was subsumed in the WFAM and Wells Fargo profitability analysis.
Funds Management reported on the methodologies and estimates used in calculating profitability, including a description of the methodology used to allocate certain expenses. Among other things, the Board noted that the levels of profitability reported on a fund-by-fund basis varied widely, depending on factors such as the size, type and age of fund.
Based on its review, the Board did not deem the profits reported by Funds Management, WFAM or Wells Fargo from services provided to the Fund to be at a level that would prevent it from approving the continuation of the Advisory Agreements.
Economies of scale
The Board received and considered information about the potential for Funds Management to experience economies of scale in the provision of management services to the Fund, the difficulties of calculating economies of scale at an individual fund level, and the extent to which potential scale benefits are shared with Fund shareholders. The Board noted the existence of breakpoints in the Fund’s management fee structure, which operate generally to reduce the Fund’s expense ratios as the Fund grows in size, and the size of the Fund in relation to such breakpoints. The Board considered that in addition to management fee breakpoints, Funds Management shares potential economies of scale from its management business in a variety of ways, including through fee waiver and expense reimbursement arrangements, competitive management fee rates set at the outset without regard to breakpoints, and investments in the business intended to enhance services available to shareholders.
The Board concluded that Funds Management’s arrangements with respect to the Fund, including contractual breakpoints, constituted a reasonable approach to sharing potential economies of scale with the Fund and its shareholders.
Other benefits to Funds Management and the Sub-Adviser
The Board received and considered information regarding potential “fall-out” or ancillary benefits received by Funds Management and its affiliates, including the Sub-Adviser, as a result of their relationships with the Fund. Ancillary benefits could include, among others, benefits directly attributable to other relationships with the Fund and benefits potentially derived from an increase in Funds Management’s and the Sub-Adviser’s business as a result of their relationships with the Fund. The Board noted that various affiliates of Funds Management may receive distribution-related fees, shareholder servicing payments and sub-transfer agency fees in respect of shares sold or held through them and services provided.
The Board also reviewed information about soft dollar credits earned and utilized by the Sub-Adviser, fees earned by Funds Management and the Sub-Adviser from managing a private investment vehicle for the fund family’s securities lending collateral and commissions earned by an affiliated broker from portfolio transactions.
Based on its consideration of the factors and information it deemed relevant, including those described here, the Board did not find that any ancillary benefits received by Funds Management and its affiliates, including the Sub-Adviser, were unreasonable.
Conclusion
At the Meeting, after considering the above-described factors and based on its deliberations and its evaluation of the information described above, the Board unanimously determined that the compensation payable to Funds Management and the Sub-Adviser under each of the Advisory Agreements was reasonable, and approved the continuation of the Advisory Agreements for a one-year term.
Wells Fargo Special Small Cap Value Fund | 39
Board considerations (unaudited)
Board Considerations – New Agreements
Overview of the Board evaluation process
At a meeting held on May 17-19, 2021 (the “Board Meeting”), the Board of Trustees (the “Board”) of Wells Fargo Funds Trust (the “Trust”, and the series identified below, the “Funds”) approved the continuation of each Fund’s current Investment Management Agreement (the “Current Investment Management Agreement”) and the current Sub-Advisory Agreements (the “Current Sub-Advisory Agreements”, and collectively, the “Current Agreements”).
| Wells Fargo C&B Mid Cap Value Fund |
| Wells Fargo California Limited-Term Tax-Free Fund |
| Wells Fargo California Tax-Free Fund |
| Wells Fargo Classic Value Fund |
| Wells Fargo Common Stock Fund |
| Wells Fargo Disciplined Small Cap Fund |
| Wells Fargo Disciplined U.S. Core Fund |
| Wells Fargo Discovery Fund |
| Wells Fargo Diversified Equity Fund |
| Wells Fargo Endeavor Select Fund |
| Wells Fargo Enterprise Fund |
| Wells Fargo Fundamental Small Cap Growth Fund |
| Wells Fargo Growth Fund |
| Wells Fargo High Yield Municipal Bond Fund |
| Wells Fargo Intermediate Tax/AMT-Free Fund |
| Wells Fargo Large Cap Core Fund |
| Wells Fargo Large Cap Growth Fund |
| Wells Fargo Large Company Value Fund |
| Wells Fargo Minnesota Tax-Free Fund |
| Wells Fargo Municipal Bond Fund |
| Wells Fargo Omega Growth Fund |
| Wells Fargo Opportunity Fund |
| Wells Fargo Pennsylvania Tax-Free Fund |
| Wells Fargo Premier Large Company Growth Fund |
| Wells Fargo Short-Term Municipal Bond Fund |
| Wells Fargo Small Cap Fund |
| Wells Fargo Special Mid Cap Value Fund |
| Wells Fargo Special Small Cap Value Fund |
| Wells Fargo Strategic Municipal Bond Fund |
| Wells Fargo Ultra Short-Term Municipal Income Fund |
| Wells Fargo Wisconsin Tax-Free Fund |
Each Trustee on the Board is not an “interested person” (as defined in the Investment Company Act of 1940 (the “1940 Act”)) of the Funds (collectively, the “Independent Trustees”). The process followed by the Board in considering and approving the continuation of the Current Agreements is referred to herein as the “2021 Annual Approval Process.”
As noted above, the closing of the sale of Wells Fargo Asset Management (“WFAM”) to a holding company (“NewCo”) affiliated with private funds of GTCR LLC (“GTCR”) and of Reverence Capital Partners, L.P. (“Reverence Capital”, and such transaction, the “Transaction”) will result in a change of control of Wells Fargo Funds Management LLC (“Funds Management”) and Wells Capital Management Incorporated (“Wells Capital”, and together with Funds Management, the “Advisers”), which will be considered to be an “assignment” of each Fund’s Current Agreements under the 1940 Act that will result in the automatic termination of each Fund’s Current Agreements. In light of the expected termination of each Fund’s Current Agreements upon the closing, at the Board Meeting the Board also considered and approved the New Agreements, which are: (i) a new Investment Management Agreement (the “New Investment Management Agreement”) between the Trust, on behalf of each Fund, and Funds Management; (ii) a new Sub-Advisory Agreement (the “New Wells Capital Sub-Advisory Agreement”) among the Trust, Funds Management and Wells Capital with respect to each Fund other than C& B Mid Cap Value Fund and Diversified Equity Fund; and (iii) a new Sub-Advisory Agreement (the “New C&B Sub-Advisory Agreement”, and collectively, the “New Agreements”) among the Trust, with respect to the C&B Mid Cap Value Fund, Funds Management and Cooke & Bieler, L.P. (“C&B”, and together with Wells Capital, the “Sub-Advisers”), each of which is intended to go into effect upon the closing. The process followed by the Board in reviewing and approving the New Agreements is referred to herein as the “New Agreement Approval Process.”
40 | Wells Fargo Special Small Cap Value Fund
Board considerations (unaudited)
At a series of meetings held in April and May 2021 (collectively, “April and May 2021 Meetings”) and at the Board Meeting, the Trustees conferred extensively among themselves and with senior representatives of Funds Management, GTCR and Reverence Capital about the New Agreements and related matters. The Board reviewed and discussed information furnished by Funds Management, GTCR and Reverence Capital that the Board considered reasonably necessary to evaluate the terms of the New Agreements and the services to be provided. At these meetings, senior representatives from Funds Management, GTCR and Reverence Capital made presentations to, and responded to questions from, the Board.
In providing information to the Board in connection with the 2021 annual approval process (the “2021 Annual Approval Process”) and the New Agreement Approval Process, Funds Management, GTCR and Reverence Capital (as applicable) were guided by requests for information submitted by independent legal counsel on behalf of the Independent Trustees. In considering and approving the New Agreements, the Trustees considered the information they believed relevant, including but not limited to the information discussed herein. The Board considered not only the specific information presented in connection with the April and May 2021 Meetings as well as the Board Meeting, but also the knowledge gained over time through interaction with Funds Management and the Sub-Advisers about various topics. In this regard, the Board reviews reports of Funds Management at each of its regular Board meetings, which includes, among other things, portfolio reviews and investment performance reports. In addition, the Board confers with portfolio managers at various times throughout the year. The Board was assisted in its evaluation of the New Agreements by independent legal counsel, from whom the Independent Trustees received separate legal advice and with whom the Independent Trustees met separately. The Board did not identify any particular information or consideration that was all-important or controlling, and each individual Trustee may have attributed different weights to various factors.
Among other information considered by the Board in connection with the Transaction was:
| ■ | Information regarding the Transaction: information about the structure, financing sources and material terms and conditions of the Transaction, including the expected impact on the businesses conducted by the Advisers and by Wells Fargo Funds Distributor LLC, as the distributor of Fund shares. |
| ■ | Information regarding NewCo, GTCR and Reverence Capital: (i) information about NewCo, including information about its expected financial condition and access to capital, and senior leadership team; (ii) the experience of senior management at GTCR and Reverence Capital in acquiring portfolio companies; (iii) the plan to operationalize NewCo, including the transition of necessary infrastructure services through a transition services agreement with Wells Fargo under which Wells Fargo will continue to provide NewCo with certain services for a specified period of time after the closing; and (iv) information regarding regulatory matters, compliance, and risk management functions at NewCo, including resources to be dedicated thereto. |
| ■ | Impact of the Transaction on WFAM and Service Providers: (i) information regarding any changes to personnel and/or other resources of the Advisers as a result of the Transaction, including assurances regarding comparable and competitive compensation arrangements to attract and retain highly qualified personnel; and (ii) information about the organizational and operating structure with respect to NewCo, the Advisers and the Funds. |
| ■ | Impact of the Transaction on the Funds and their Shareholders: (i) information regarding anticipated benefits to the Funds as a result of the Transaction; (ii) a commitment that the Funds would not bear any expenses, directly or indirectly, in connection with the Transaction; (iii) confirmation that the Advisers intend to continue to manage the Funds in a manner consistent with each Fund’s current investment objectives and principal investments strategies; and (iv) a commitment that neither NewCo nor WFAM will take any steps that would impose any “unfair burden” (as that term is used in section 15(f)(1)(B) of the 1940 Act) on the Funds as a result of the Transaction. |
With respect to the New Agreements, the Board considered: (i) a representation that, after the closing, all of the Funds will continue to be managed and advised by their current Advisers and for C&B Mid Cap Value Fund, C&B, and that the same portfolio managers of the Sub-Advisers are expected to continue to manage the Funds after the Transaction; (ii) information regarding the terms of the New Agreements, including changes as compared to the Current Agreements; (iii) information confirming that the fee rates payable under the New Agreements will not increase as a result of the Transaction as compared to the rates under the Current Agreements; and (iv) assurances that the Transaction is not expected to cause any diminution with respect to the nature, extent and quality of any of the services currently provided to the Funds by the Advisers as a result of the Transaction.
In addition to considering information furnished specifically to evaluate the impact of the Transaction on the Funds and their respective shareholders in connection with the New Agreement Approval Process, the Board considered information furnished at prior meetings of the Board and its committees, including detailed information provided in connection with the 2021 Annual Approval Process. In this regard, in connection with the 2021 Annual Approval Process, the Board received information about complex-wide and individual Fund performance, fees and expenses, including: (i) a report from an independent data provider comparing the investment performance of each Fund to the investment performance of comparable funds and benchmark indices, over various time periods; (ii) a report from an independent data provider comparing each Fund’s total expense ratio (and
Wells Fargo Special Small Cap Value Fund | 41
Board considerations (unaudited)
its components) to those of comparable funds; (iii) comparative information concerning the fees charged and services provided by Funds Management and the Sub-Advisers to each Fund in managing other accounts (which may include other mutual funds, collective investment funds and institutional accounts), if any, that employ investment strategies and techniques similar to those used in managing such Fund(s); and (iv) profitability analyses of Funds Management, as well as the profitability of both WFAM and Wells Fargo from providing services to the fund family as a whole.
After its deliberations, the Board unanimously determined that the compensation payable to Funds Management and the Sub-Advisers under the New Agreements is reasonable, approved the New Agreements for a two-year term, and voted to recommend that Fund shareholders approve the New Agreements. The Board considered the approval of the New Agreements as part of its consideration of agreements for funds across the complex, but its approvals were made on a fund-by-fund basis. The following summarizes a number of important, but not necessarily all, factors considered by the Board in support of its approvals.
Nature, extent and quality of services
In connection with the 2021 Annual Approval Process, the Board received and considered various information regarding the nature, extent and quality of services provided to the Fund by Funds Management and the Sub-Advisers under the Advisory Agreements. This information included a description of the investment advisory services and Fund-level administrative services covered by the Current Management Agreement, as well as, among other things, a summary of the background and experience of senior management of WFAM, of which Funds Management and Wells Capital are a part, and a summary of investments made in the business of WFAM. The Board also received a description of Funds Management’s and the Sub-Advisers’ business continuity plans, including a summary of the performance of such plans and any changes thereto during the COVID-19 pandemic, and of their approaches to data privacy and cybersecurity. The Board also received and reviewed information about Funds Management’s role as administrator of the Funds’ liquidity risk management program, Funds Management’s approach to risk management, and Funds Management’s intermediary and vendor oversight program.
In connection with the 2021 Annual Approval Process, the Board also considered the qualifications, background, tenure and responsibilities of each of the portfolio managers primarily responsible for the day-to-day portfolio management of the Funds. The Board evaluated the ability of Funds Management and the Sub-Advisers to attract and retain qualified investment professionals, including research, advisory and supervisory personnel.
In connection with the 2021 Annual Approval Process, the Board further considered the compliance programs and compliance records of Funds Management and the Sub-Advisers. In addition, the Board took into account the full range of services provided to the Fund by Funds Management and its affiliates.
In connection with the New Agreement Approval Process, the Board considered, among other information, the structure of the Transaction and expected impact, if any, of the Transaction on the operations, facilities, organization and personnel of Funds Management and the Sub-Advisers. The Board received assurances from Funds Management that each Fund will continue to be advised by its current Sub-Adviser after the closing, and that the same individual portfolio managers are expected to continue to manage the Funds after the closing. With respect to the recruitment and retention of key personnel, the Board noted information from GTCR, Reverence Capital and the Advisers regarding the potential benefits for employees of joining NewCo. The Board recognized that the personnel who had been extended offers may not accept such offers and personnel changes may occur in the future in the ordinary course.
In addition, the Board considered information regarding the infrastructure, operational capabilities and support staff in place to assist in the portfolio management and operations of the Funds, including the provision of administrative services, and the anticipated impact of the Transaction on such matters. The Board also considered the business-related and other risks to which the Advisers may be subject in managing the Funds and in connection with the Transaction. The Board also considered the transition and integration plans as a result of the change in ownership of the Advisers from Wells Fargo to NewCo. The Board considered the resources and infrastructure that NewCo intends to devote to its compliance program to ensure compliance with applicable laws and regulations, as well as its risk management program and cybersecurity program. The Board also took into account assurances received from the Advisers, GTCR and Reverence Capital that the Transaction is not expected to cause any diminution in the nature, extent and quality of services provided by Funds Management and the Sub-Advisers to the Funds and their shareholders.
Fund investment performance and expenses
In connection with the 2021 Annual Approval Process, the Board considered the investment performance results for each Fund over various time periods ended December 31, 2020. The Board considered these results in comparison to the investment performance of funds in a universe that was determined by Broadridge Inc. (“Broadridge”) to be similar to each Fund (the “Universe”), and in comparison to each Fund’s benchmark index and to other comparative data. Broadridge is an independent provider of investment company data. The Board received a description of the methodology used by Broadridge to select the
42 | Wells Fargo Special Small Cap Value Fund
Board considerations (unaudited)
mutual funds in the performance Universe. Where applicable, the Board received information concerning, and discussed factors contributing to, underperformance of Funds relative to the Universe and benchmark for any underperformance periods.
In connection with the 2021 Annual Approval Process, the Board also received and considered information regarding each Fund’s net operating expense ratios and their various components, including actual management fees, custodian and other non-management fees, and Rule 12b-1 and non-Rule 12b-1 shareholder service fees. The Board considered these ratios in comparison to the median ratios of funds in class-specific expense groups that were determined by Broadridge to be similar to the Fund (the “Groups”). The Board received a description of the methodology used by Broadridge to select the mutual funds in the expense Groups and an explanation of how funds comprising expense groups and their expense ratios may vary from year-to-year.
In connection with the New Agreement Approval Process, the Board received a commitment that WFAM will maintain fee and expense commitments for at least two years after the closing. The Board took into account each Fund’s investment performance and expense information among the factors considered in deciding to approve the New Agreements.
Investment management and sub-advisory fee rates
In connection with the 2021 Annual Approval Process, the Board reviewed and considered the contractual fee rates payable by each Fund to Funds Management under the Current Management Agreement, as well as the contractual fee rates payable by each Fund to Funds Management for class-level administrative services under a Class-Level Administration Agreement, which include, among other things, class-level transfer agency and sub-transfer agency costs (collectively, the “Management Rates”). The Board also reviewed and considered the contractual investment sub-advisory fee rates that are payable by Funds Management to each of the Sub-Advisers under the Current Sub-Advisory Agreements for investment sub-advisory services (the “Sub-Advisory Fee Rates”).
Among other information reviewed by the Board in connection with the 2021 Annual Approval Process, was a comparison of each Fund’s Management Rates with the average contractual investment management fee rates of funds in the expense Groups at a common asset level as well as transfer agency costs of the funds in the expense Groups.
In connection with the 2021 Annual Approval Process, the Board also received and considered information about the portion of the total management fee that was retained by Funds Management after payment of the Sub-Advisory Fee Rates. In assessing the reasonableness of this amount, the Board received and evaluated information about the nature and extent of responsibilities retained and risks assumed by Funds Management and not delegated to or assumed by the Sub-Advisers, and about Funds Management’s on-going oversight services. With respect to C&B, the Board also considered this amount in comparison to the median amount retained by advisers to funds in a sub-advised expense universe that was determined by Broadridge to be similar to the Specialized Technology Fund. In this regard, the Board noted the small size of the sub-advised expense universe. The Board also considered that the sub-advisory fees paid to C&B had been negotiated by Funds Management on an arm’s length basis. Given the affiliation between Funds Management and Wells Capital, the Board ascribed limited relevance to the allocation of fees between them.
In connection with the 2021 Annual Approval Process, the Board also received and considered information about the nature and extent of services offered and fee rates charged by Funds Management and the Sub-Advisers to other types of clients, if any, with investment strategies similar to those of each Fund. In this regard, the Board received information about the significantly greater scope of services, and compliance, reporting and other legal burdens and risks of managing proprietary mutual funds compared with those associated with managing assets of other types of clients, including third-party sub-advised fund clients and non-mutual fund clients such as institutional separate accounts.
In connection with the New Agreement Approval Process, the Board noted the assurances received by it that there would be no increases to any of the Management Rates or the Sub-Advisory Fee Rates as a result of the Transaction. The Board also considered that the New Agreements do not change the computation method for calculating such fees, and there is no present intention to reduce expense waiver and reimbursement arrangements that are currently in effect. Based on its consideration of the factors and information it deemed relevant, including those described here, the Board determined that the compensation payable to Funds Management under the New Management Agreement and to each of the Sub-Advisers under the New Sub-Advisory Agreements was reasonable.
Profitability
In connection with the 2021 Annual Approval Process, the Board received and considered information concerning the profitability of Funds Management, as well as the profitability of both WFAM and Wells Fargo from providing services to the fund family as a whole. The Board noted that Wells Capital’s profitability information with respect to providing services to each Fund Wells Capital
Wells Fargo Special Small Cap Value Fund | 43
Board considerations (unaudited)
sub-advises and other funds in the family was subsumed in the WFAM and Wells Fargo profitability analysis. The Board did not consider profitability with respect to C&B, as the sub-advisory fees paid to C&B had been negotiated by Funds Management on an arm’s-length basis.
Funds Management reported on the methodologies and estimates used in calculating profitability in connection with the 2021 Annual Approval Process, including a description of the methodology used to allocate certain expenses. Among other things, the Board noted that the levels of profitability reported on a fund-by-fund basis varied widely, depending on factors such as the size, type and age of fund.
In connection with the New Agreement Approval Process, the Board received certain information about NewCo’s projected financial condition, and reviewed with senior representatives of Funds Management, GTCR and Reverence Capital the underlying assumptions on which such information was based. The Board considered that NewCo is a newly formed entity, with no historical operations, revenues or expenses, and that it is difficult to predict with any degree of certainty the future profitability of NewCo and the Advisers from advisory activities under the New Agreements. The Board considered that the fee rates payable under the New Agreements will not increase as a result of the Transaction as compared to the rates under the Current Agreements, and that the current contractual expense limitations applicable to each Fund will not increase. The Board noted that if the New Agreements are approved by shareholders and the Transaction closes, the Board will have the opportunity in the future to review the profitability of NewCo and the Advisers from advisory activities under the New Agreements.
Economies of scale
In connection with the 2021 Annual Approval Process, the Board received and considered information about the potential for Funds Management to experience economies of scale in the provision of management services to the Funds, the difficulties of calculating economies of scale at an individual fund level, and the extent to which potential scale benefits are shared with Fund shareholders. The Board noted the existence of breakpoints in each Fund’s management fee structure, which operate generally to reduce the Fund’s expense ratios as the Fund grows in size, and the size of the Fund in relation to such breakpoints. The Board considered that, in addition to management fee breakpoints, Funds Management shares potential economies of scale from its management business in a variety of ways, including through fee waiver and expense reimbursement arrangements, competitive management fee rates set at the outset without regard to breakpoints, and investments in the business intended to enhance services available to shareholders.
In connection with the New Agreement Approval Process, the Board noted that NewCo and the Advisers may benefit from possible growth of the Funds resulting from enhanced distribution capabilities. However, the Board noted that other factors could also affect the potential for economies of scale, and that it was not possible to quantify any potential future economies of scale. Based upon the information furnished to the Board in connection with the 2021 Annual Approval Process and the New Agreement Approval Process, the Board concluded that Funds Management’s arrangements with respect to each Fund, including contractual breakpoints and expense limitation arrangements, constituted a reasonable approach to sharing potential economies of scale with the Fund and its shareholders.
“Fall-out” benefits to Funds Management and the Sub-Advisers
In connection with the 2021 Annual Approval Process, the Board received and considered information regarding potential “fall-out” or ancillary benefits received by Funds Management and its affiliates, including Wells Capital, and C&B as a result of their relationships with the Funds. Ancillary benefits could include, among others, benefits directly attributable to other relationships with the Funds and benefits potentially derived from an increase in Funds Management’s and the Sub-Advisers’ business as a result of their relationships with the Funds. The Board noted that various current affiliates of Funds Management may receive distribution-related fees, shareholder servicing payments and sub-transfer agency fees in respect of shares sold or held through them and services provided.
In connection with the 2021 Annual Approval Process, the Board also reviewed information about soft dollar credits earned and utilized by the Sub-Advisers, fees earned by Funds Management and Wells Capital from managing a private investment vehicle for the fund family’s securities lending collateral, and commissions earned by an affiliated broker of Wells Fargo from portfolio transactions.
In connection with the New Agreement Approval Process, the Board received information to the effect that the Transaction is not expected to have a material impact on the fall-out benefits currently realized by Funds Management and its affiliates, including Wells Capital, and C&B. The information reviewed by the Board also noted that several of the ancillary benefits identified for WFAM would be potential ancillary benefits for NewCo, including that the scale and reputation of the Funds might benefit NewCo’s broader reputation, product initiatives, technology investment and talent acquisition. Based on its consideration of the
44 | Wells Fargo Special Small Cap Value Fund
Board considerations (unaudited)
factors and information it deemed relevant, including those described here, the Board did not find that any ancillary benefits expected to be received by Funds Management and its affiliates, including NewCo and Wells Capital, and C&B under the New Agreements were unreasonable.
Conclusion
At the Board Meeting, after considering the above-described factors and based on its deliberations and its evaluation of the information described above, the Board unanimously determined that the compensation payable to Funds Management and to each of the Sub-Advisers under the New Agreements is reasonable, approved the New Agreements for a two-year term, and voted to recommend that Fund shareholders approve the New Agreements.
Wells Fargo Special Small Cap Value Fund | 45
Board considerations (unaudited)
Board Considerations - Interim Agreements
At a meeting held on May 17-19, 2021 (the “Board Meeting”), the Boards of Trustees (each, a “Board”, and collectively, the “Boards”) of Wells Fargo Funds Trust, Wells Fargo Master Trust, Wells Fargo Variable Trust, Wells Fargo Global Dividend Opportunity Fund, Wells Fargo Income Opportunities Fund, Wells Fargo Multi-Sector Income Fund and Wells Fargo Utilities and High Income Fund (each a “Trust”, and the series thereof, a “Fund”) reviewed and approved for the Trusts and Funds, as applicable: (i) interim investment management agreements (the “Interim Management Agreements”) with Wells Fargo Funds Management, LLC (“Funds Management”); (ii) interim investment advisory agreements (the “Interim Advisory Agreements”) with Funds Management; and (iii) interim sub-advisory agreements (the “Interim Sub-Advisory Agreements”) with each of Cooke & Bieler, L.P., Galliard Capital Management LLC (“Galliard”), Peregrine Capital Management Inc., Wells Capital Management, LLC (“WellsCap”), and Wells Fargo Asset Management (International) Limited (“WFAMI”, and collectively, the “Sub-Advisers”). Each Trustee on the Board is not an “interested person” (as defined in the Investment Company Act of 1940 (the “1940 Act”) of the Funds (collectively, the “Independent Trustees”). The Interim Management Agreements, Interim Advisory Agreements, and Interim Sub-Advisory Agreements are collectively referred to as the “Interim Advisory Agreements.”
At the Board Meeting, the Boards reviewed and approved the continuation of existing investment management, advisory and sub-advisory agreements (the “Current Advisory Agreements”) for each Trust and Fund, as applicable. The factors considered and conclusions reached by the Boards in approving the Current Advisory Agreements are summarized in the section entitled “Board Considerations – Current Agreements” of this shareholder report. The Boards noted that Wells Fargo & Company has entered into a definitive agreement to sell Wells Fargo Asset Management (“WFAM”), which includes Funds Management, Galliard, WellsCap and WFAMI (the “Affiliated Sub-Advisers”), to a holding company affiliated with private funds of GTCR LLC and Reverence Capital Partners, L.P. (the “Transaction”). The Boards further noted that the Transaction would result in a change-of-control of Funds Management and the Affiliated Sub-Advisers, which would be considered to be an “assignment” under the 1940 Act that would terminate the Current Advisory Agreements. At the Board Meeting, the Boards also reviewed and approved new investment management, advisory and sub-advisory agreements (the “New Advisory Agreements”) for each Trust and Fund, as applicable, that would replace the Current Advisory Agreements upon consummation of the Transaction, subject to approval of the New Advisory Agreements by the applicable Trust’s or Fund’s shareholders. The factors considered and conclusions reached by the Boards in approving the New Advisory Agreements are summarized in the section entitled “Board Considerations – New Agreements” of this shareholder report.
At the Board Meeting, the Boards also approved the Interim Advisory Agreements, which will go into effect for a Trust or Fund only in the event that shareholders of such Trust or Fund do not approve the New Advisory Agreement(s) for the Trust or Fund by the closing date of the Transaction, when the Current Advisory Agreements will terminate. The Board noted that, in such a circumstance, the Interim Advisory Agreements will permit continuity of management by allowing Funds Management and the Sub-Advisers to continue providing services to the Trust or Fund pursuant to the Interim Advisory Agreements while the Trust or Fund continues to solicit shareholder approval of such New Advisory Agreement(s). The Boards noted that the terms of the Interim Advisory Agreements are identical to those of the Current Advisory Agreements, except for the term and the addition of escrow provisions with respect to the advisory fees. The Boards also noted that the entities that would service the Funds and Trusts under the Interim Advisory Agreements are identical to those that provide services under the Current Advisory Agreements and those that will provide services under the New Advisory Agreements.
In approving the Interim Advisory Agreements, the Boards considered the same factors and reached the same conclusions as they considered and reached with respect to the Boards’ approvals of the Current Advisory Agreements and New Advisory Agreements, as applicable, which are described in separate Board Consideration sections within this shareholder report. Prior to the Board Meeting, including at a series of meetings held in April and May 2021, the Trustees conferred extensively among themselves and with senior representatives of Funds Management, GTCR LLC and Reverence Capital Partners, L.P. about the Interim Advisory Agreements and related matters. The Independent Trustees were assisted in their evaluation of the Interim Advisory Agreements by independent legal counsel, from whom they received separate legal advice and with whom they met separately.
At the Board Meeting, after considering the factors and reaching the conclusions described in the separate Board Consideration sections within this shareholder report, the Boards unanimously determined that the compensation payable to Funds Management and to each Sub-Adviser under each of the Interim Advisory Agreements was reasonable, and approved the Interim Advisory Agreements.
46 | Wells Fargo Special Small Cap Value Fund
For more information
More information about Wells Fargo Funds is available free upon request. To obtain literature, please write, visit the Fund's website, or call:
Wells Fargo Funds
P.O. Box 219967
Kansas City, MO 64121-9967
Website: allspringglobal.com
Individual investors: 1-800-222-8222
Retail investment professionals: 1-888-877-9275
Institutional investment professionals: 1-866-765-0778
This report and the financial statements contained herein are submitted for the general information of the shareholders of the Fund. If this report is used for promotional purposes, distribution of the report must be accompanied or preceded by a current prospectus. Before investing, please consider the investment objectives, risks, charges, and expenses of the investment. For a current prospectus and, if available, a summary prospectus, containing this information, call
1-800-222-8222 or visit the Fund's website at allspringglobal.com. Read the prospectus carefully before you invest or send money.
Allspring Global InvestmentsTM is the trade name for the asset management firms of Allspring Global Investments Holdings, LLC, a holding company indirectly owned by certain private funds of GTCR LLC and Reverence Capital Partners, L.P. These firms include but are not limited to Allspring Global Investments, LLC, and Allspring Funds Management, LLC. Certain products managed by Allspring entities are distributed by Allspring Funds Distributor, LLC (a broker-dealer and Member FINRA/SIPC).
This material is for general informational and educational purposes only and is NOT intended to provide investment advice or a recommendation of any kind - including a recommendation for any specific investment, strategy, or plan.
© 2021 Allspring Global Investments. All rights reserved.
PAR-1121-00200 09-21
SA246/SAR246 09-21
Semi-Annual Report
September 30, 2021
Wells Fargo Precious Metals Fund
The views expressed and any forward-looking statements are as of September 30, 2021, unless otherwise noted, and are those of the Fund's portfolio managers and/or Allspring Global Investments. Discussions of individual securities or the markets generally are not intended as individual recommendations. Future events or results may vary significantly from those expressed in any forward-looking statements. The views expressed are subject to change at any time in response to changing circumstances in the market. Allspring Global Investments disclaims any obligation to publicly update or revise any views expressed or forward-looking statements.
Wells Fargo Precious Metals Fund | 1
Letter to shareholders (unaudited)
Andrew Owen
President
Wells Fargo Funds
Dear Shareholder:
We are pleased to offer you this semi-annual report for Wells Fargo Precious Metals Fund for the six-month period that ended September 30, 2021. Global stocks continued to rally as the global economy continued to emerge from the haze of COVID-19. Tailwinds were provided by global stimulus programs, a rapid vaccination rollout, and recovering consumer and corporate sentiment. Bonds were mixed during the period, with municipal bonds and high-yield bonds delivering positive returns.
For the six-month period, U.S. stocks, based on the S&P 500 Index,1 gained 9.18%. International stocks, as measured by the MSCI ACWI ex USA Index (Net),2 returned 2.32%, while the MSCI EM Index (Net),3 trailed its developed market counterparts with a 3.45% loss. Among bond indexes, the Bloomberg U.S. Aggregate Bond Index,4 returned 1.88%, the Bloomberg Global Aggregate ex-USD Index (unhedged),5 returned -0.69%, the Bloomberg Municipal Bond Index6 returned 1.15%, and the ICE BofA U.S. High Yield Index,7 gained 3.74%.
Vaccination rollout drove the stock markets to new highs.
Equity markets produced another strong showing in April. Domestically, the continued reopening of the economy had a strong impact on positive equity performance, as people started leaving their households and jobless claims continued to fall. Domestic corporate bonds performed well and the U.S. dollar weakened. Meanwhile, the U.S. government continued to seek to invest in the recovery, this time by outlining a package of over $2 trillion to improve infrastructure. The primary headwind in April was inflation, as investors tried to determine the breadth and longevity of recent price increases. Developed Europe has been supported by a meaningful increase in the pace of vaccinations. Unfortunately many emerging market countries have not been as successful. India in particular saw COVID-19 cases surge, serving as an example of the need to get vaccinations rolled out to less developed nations.
| 1 | The S&P 500 Index consists of 500 stocks chosen for market size, liquidity, and industry group representation. It is a market-value-weighted index with each stock's weight in the index proportionate to its market value. You cannot invest directly in an index. |
| 2 | The Morgan Stanley Capital International (MSCI) All Country World Index (ACWI) ex USA Index (Net) is a free-float-adjusted market-capitalization-weighted index that is designed to measure the equity market performance of developed and emerging markets, excluding the U.S. Source: MSCI. MSCI makes no express or implied warranties or representations and shall have no liability whatsoever with respect to any MSCI data contained herein. The MSCI data may not be further redistributed or used as a basis for other indexes or any securities or financial products. This report is not approved, reviewed, or produced by MSCI. You cannot invest directly in an index. |
| 3 | The MSCI Emerging Markets (EM) Index (Net) is a free-float-adjusted market-capitalization-weighted index that is designed to measure equity market performance of emerging markets. You cannot invest directly in an index. |
| 4 | The Bloomberg U.S. Aggregate Bond Index is a broad-based benchmark that measures the investment-grade, U.S.-dollar-denominated, fixed-rate taxable bond market, including Treasuries, government-related and corporate securities, mortgage-backed securities (agency fixed-rate and hybrid adjustable-rate mortgage pass-throughs), asset-backed securities, and commercial mortgage-backed securities. You cannot invest directly in an index. |
| 5 | The Bloomberg Global Aggregate ex-USD Index (unhedged) is an unmanaged index that provides a broad-based measure of the global investment-grade fixed-income markets excluding the U.S.-dollar-denominated debt market. You cannot invest directly in an index. |
| 6 | The Bloomberg Municipal Bond Index is an unmanaged index composed of long-term tax-exempt bonds with a minimum credit rating of Baa. You cannot invest directly in an index. |
| 7 | The ICE BofA U.S. High Yield Index is a market-capitalization-weighted index of domestic and Yankee high-yield bonds. The index tracks the performance of high-yield securities traded in the U.S. bond market. You cannot invest directly in an index. Copyright 2021. ICE Data Indices, LLC. All rights reserved. |
2 | Wells Fargo Precious Metals Fund
Letter to shareholders (unaudited)
Vaccine rollouts continued in May, leading to loosened restrictions globally. As a result, equity markets in general saw a minor increase in returns. Concerns that the continued economic rebound could result in inflation increases becoming more than transitory were supported by the higher input costs businesses were experiencing. Meanwhile, those inflation concerns were tempered by the U.S. Federal Reserve (Fed), which stayed steady on its view of the economy and eased fears of a sudden and substantial policy change. Positive performance in the emerging market equity space was supported this month by steady consumer demand and strong commodity prices. Fixed-income markets were also slightly positive for the month, driven by inflation uncertainty and a softer U.S. dollar.
June witnessed the S&P 500 Index reach a new all-time high. 2021 economic growth and inflation forecasts were revised higher to reflect a strong economic recovery and some supply and demand imbalances. Late June saw a deal reached on a U.S. infrastructure package of approximately $1 trillion for road, bridge, and broadband network upgrades over the next eight years. The Fed’s June meeting yielded no change to policy, but its projections pointed to a possible interest rate rise in 2023. This, combined with a rebound in economic activity and investors searching for yield, led to U.S. Treasury yields being down for the month. Many European and Asian countries saw vaccination momentum increase, while the U.K. dealt with a rise in COVID-19 infections, specifically the Delta variant. Meanwhile, crude oil jumped over 10% in June on the back of the pickup in global economic activity and the Organization of the Petroleum Exporting Countries’ (OPEC) slow pace of supply growth.
July began the month seeing vaccinations making progress, as several major developed countries eased restrictions, only to be threatened again by the spread of COVID-19’s Delta variant. Inflation continued to climb, aided by the continued supply bottleneck in the face of high demand. As it pertains to the equity area of the market, U.S. equities led the way in positive return territory, followed by international developed markets. In contrast, emerging markets were well in negative territory for the month, hindered by China’s plans for new regulations on a number of sectors, specifically education and technology. The U.S. 10-Year Treasury bond yield continued to decline, as strong demand swallowed up supply. After hitting a multi-year high earlier in the month, oil prices leveled off following an agreement by OPEC to raise oil production starting in August.
The Delta variant of COVID-19 produced outbreaks globally in August, increasing the potential for increased market volatility and bringing into question the ongoing economic recovery. Domestically, the U.S. economy continued to stay strong in the face of the Delta variant, continued inflationary pressures, and worries over Hurricane Ida. Emerging market equities experienced elevated volatility, largely influenced by China’s regulatory stance. Emerging market equities started the month with poor performance but rebounded to end the month in positive territory. Municipal debt experienced its first monthly performance drop since February of this year, slowing a rally that made it one of the best-performing sectors of the bond market. In the commodity segment of the market, crude oil fell sharply during the month on the back of dampened expectations as a result of the Delta variant but was still a leading asset class performer for the year.
Global markets suffered their broadest retreat in a year during September, with the exception of commodities. Concerns over inflation and the interest rate outlook depressed investor confidence and hurt performance. Emerging markets declined on concerns over the continued supply chain disruptions and worries over higher energy and food prices. Meanwhile, the Fed indicated it would slow the pace of asset purchases in the near future (pointing towards November). All eyes domestically are fixed on the raising of the debt ceiling, the 2022 budget plan, and the ongoing debate over the infrastructure package. Contrary to most asset classes, commodities thrived in September, driven by sharply higher energy prices.
“ 2021 economic growth and inflation forecasts were revised higher to reflect a strong economic recovery and some supply and demand imbalances.”
“ Municipal debt experienced its first monthly performance drop since February of this year, slowing a rally that made it one of the best-performing sectors of the bond market.”
Wells Fargo Precious Metals Fund | 3
Letter to shareholders (unaudited)
Don’t let short-term uncertainty derail long-term investment goals.
Periods of investment uncertainty can present challenges, but experience has taught us that maintaining long-term investment goals can be an effective way to plan for the future. To help you create a sound strategy based on your personal goals and risk tolerance, Wells Fargo Funds offers more than 100 mutual funds spanning a wide range of asset classes and investment styles. Although diversification cannot guarantee an investment profit or prevent losses, we believe it can be an effective way to manage investment risk and potentially smooth out overall portfolio performance. We encourage investors to know their investments and to understand that appropriate levels of risk-taking may unlock opportunities.
On November 1, 2021, GTCR LLC and Reverence Capital Partners, L.P., announced the beginning of Allspring Global Investments™, with the close of the transaction to acquire Wells Fargo Funds Management, LLC; Wells Capital Management LLC; Galliard Capital Management LLC.; Wells Fargo Asset Management (International) Ltd.; Wells Fargo Asset Management Luxembourg S.A.; and Wells Fargo Funds Distributor, LLC, as well as Wells Fargo Bank, N.A.’s business of acting as trustee to its collective investment trusts and all related Wells Fargo Asset Management legal entities. The transaction closed on November 1, 2021, forming Allspring Global Investments, LLC, a privately held asset management firm with $587 billion in AUM1 as of September 30, 2021.
Allspring Global Investments™ is a leading independent asset management firm with a full breadth of investment capabilities across diverse asset classes, serving the needs of its institutional and wealth management clients around the world. Allspring operates across 18 offices globally supported by more than 480 investment professionals. Allspring and its investment teams provide a broad range of differentiated investment products and solutions to help its diverse range of clients meet their investment objectives.
As part of this transition, all mutual funds within the Wells Fargo Funds family will be rebranded as Allspring Funds. Each individual fund will have “Wells Fargo” removed from its fund name to be replaced with “Allspring.” The fund name changes are expected to take place on December 6, 2021.
Allspring Global Investments is the trade name for the asset management firms of Allspring Global Investments Holdings, LLC, a holding company indirectly owned by certain private funds of GTCR LLC and Reverence Capital Partners, L.P.
Thank you for choosing to invest with Wells Fargo Funds. We appreciate your confidence in us and remain committed to helping you meet your financial needs.
Sincerely,
Andrew Owen
President
Wells Fargo Funds
For further information about your Fund, contact your investment professional, visit our website at allspringglobal.com, or call us directly at 1-800-222-8222.
| 1 | As of September 30, 2021, assets under management (AUM) includes $93 billion from Galliard Capital Management, an investment advisor that is not part of the Allspring trade name/GIPS firm. |
4 | Wells Fargo Precious Metals Fund
This page is intentionally left blank.
Performance highlights (unaudited)
| Investment objective | The Funds seeks long-term capital appreciation. |
| Manager | Allspring Funds Management, LLC |
| Subadviser | Allspring Global Investments, LLC |
| Portfolio managers | Michael Bradshaw, CFA®‡, Oleg Makhorine |
| Average annual total returns (%) as of September 30, 2021 |
| | | Including sales charge | | Excluding sales charge | | Expense ratios1 (%) |
| | Inception date | 1 year | 5 year | 10 year | | 1 year | 5 year | 10 year | | Gross | Net 2 |
| Class A (EKWAX) | 1-20-1998 | -29.34 | -0.20 | -5.43 | | -25.03 | 0.99 | -4.87 | | 1.17 | 1.09 |
| Class C (EKWCX) | 1-29-1998 | -26.61 | 0.23 | -5.58 | | -25.61 | 0.23 | -5.58 | | 1.92 | 1.84 |
| Administrator Class (EKWDX) | 7-30-2010 | – | – | – | | -24.94 | 1.13 | -4.73 | | 1.09 | 0.95 |
| Institutional Class (EKWYX) | 2-29-2000 | – | – | – | | -24.82 | 1.29 | -4.58 | | 0.84 | 0.79 |
| FTSE Gold Mines Index3 | – | – | – | – | | -27.21 | 2.82 | -4.98 | | – | – |
| S&P 500 Index4 | – | – | – | – | | 30.00 | 16.90 | 16.63 | | – | – |
Figures quoted represent past performance, which is no guarantee of future results, and do not reflect taxes that a shareholder may pay on an investment in a fund. Investment return and principal value of an investment will fluctuate so that an investor’s shares, when redeemed, may be worth more or less than their original cost. Performance shown without sales charges would be lower if sales charges were reflected. Current performance may be lower or higher than the performance data quoted, which assumes the reinvestment of dividends and capital gains. Current month-end performance is available on the Fund’s website, allspringglobal.com.
While the S&P 500 Index is comprised of U.S. equity securities of companies diversified across ten sectors, the Fund’s holdings are concentrated primarily in precious metals related stocks. Therefore, the performance of the S&P 500 Index is displayed only to show how the concentrated Fund performed compared with a diversified selection of U.S. equity securities.
Index returns do not include transaction costs associated with buying and selling securities, any mutual fund fees or expenses, or any taxes. It is not possible to invest directly in an index.
For Class A shares, the maximum front-end sales charge is 5.75%. For Class C shares, the maximum contingent deferred sales charge is 1.00%. Performance including a contingent deferred sales charge assumes the sales charge for the corresponding time period. Administrator Class and Institutional Class shares are sold without a front-end sales charge or contingent deferred sales charge.
| 1 | Reflects the expense ratios as stated in the most recent prospectuses. The expense ratios shown are subject to change and may differ from the annualized expense ratios shown in the financial highlights of this report. |
| 2 | The manager has contractually committed through July 31, 2022, to waive fees and/or reimburse expenses to the extent necessary to cap total annual fund operating expenses after fee waivers at 1.09% for Class A, 1.84% for Class C, 0.95% for Administrator Class, and 0.79% for Institutional Class. Brokerage commissions, stamp duty fees, interest, taxes, acquired fund fees and expenses (if any), and extraordinary expenses are excluded from the expense caps. Prior to or after the commitment expiration date, the caps may be increased or the commitment to maintain the caps may be terminated only with the approval of the Board of Trustees. Without these caps, the Fund’s returns would have been lower. The expense ratio paid by an investor is the net expense ratio (the total annual fund operating expenses after fee waivers) as stated in the prospectuses. |
| 3 | FTSE Gold Mines Index is an unmanaged, open-ended index designed to reflect the performance of the worldwide market in the shares of companies whose principal activity is the mining of gold. You cannot invest directly in an index. |
| 4 | The S&P 500 Index consists of 500 stocks chosen for market size, liquidity, and industry group representation. It is a market-value weighted index with each stock’s weight in the index proportionate to its market value. You cannot invest directly in an index. |
| ‡ | CFA® and Chartered Financial Analyst® are trademarks owned by CFA Institute. |
6 | Wells Fargo Precious Metals Fund
Performance highlights (unaudited)
Stock values fluctuate in response to the activities of individual companies and general market and economic conditions. Bond values fluctuate in response to the financial condition of individual issuers, general market and economic conditions, and changes in interest rates. Changes in market conditions and government policies may lead to periods of heightened volatility in the bond market and reduced liquidity for certain bonds held by the fund. In general, when interest rates rise, bond values fall and investors may lose principal value. Interest rate changes and their impact on the fund and its share price can be sudden and unpredictable. Funds that concentrate their investments in limited sectors, such as gold-related investments, are more vulnerable to adverse market, economic, regulatory, political, or other developments affecting those sectors. Certain investment strategies tend to increase the total risk of an investment (relative to the broader market). This fund is exposed to foreign investment risk, geographic, nondiversification risk, smaller-company securities risk, and subsidiary risk. Consult the Fund’s prospectus for additional information on these and other risks.
Wells Fargo Precious Metals Fund | 7
Performance highlights (unaudited)
| Ten largest holdings (%) as of September 30, 20211 |
| Kirkland Lake Gold Limited | 7.19 |
| Newmont Corporation | 6.92 |
| Kinross Gold Corporation | 6.46 |
| Barrick Gold Corporation | 6.08 |
| Wheaton Precious Metals Corporation-U.S. Exchange Traded Shares | 5.54 |
| Franco-Nevada Corporation-Legend Shares | 5.39 |
| Endeavour Mining plc | 4.69 |
| Gold Bullion | 4.28 |
| Gold Fields Limited ADR | 4.12 |
| Royal Gold Incorporated | 3.95 |
| 1 | Figures represent the percentage of the Fund's net assets. Holdings are subject to change and may have changed since the date specified. |
| Country allocation as of September 30, 20211 |
| 1 | Figures represent the percentage of the Fund's long-term investments. These amounts are subject to change and may have changed since the date specified. |
8 | Wells Fargo Precious Metals Fund
Consolidated fund expenses (unaudited)
As a shareholder of the Fund, you incur two types of costs: (1) transaction costs, including sales charges (loads) on purchase payments and contingent deferred sales charges (if any) on redemptions and (2) ongoing costs, including management fees, distribution (12b-1) and/or shareholder servicing fees, and other Fund expenses. This example is intended to help you understand your ongoing costs (in dollars) of investing in the Fund and to compare these costs with the ongoing costs of investing in other mutual funds.
The example is based on an investment of $1,000 invested at the beginning of the six-month period and held for the entire period from April 1, 2021 to September 30, 2021.
Actual expenses
The “Actual” line of the table below provides information about actual account values and actual expenses. You may use the information in this line, together with the amount you invested, to estimate the expenses that you paid over the period. Simply divide your account value by $1,000 (for example, an $8,600 account value divided by $1,000 = 8.6), then multiply the result by the number in the “Actual” line under the heading entitled “Expenses paid during period” for your applicable class of shares to estimate the expenses you paid on your account during this period.
Hypothetical example for comparison purposes
The “Hypothetical” line of the table below provides information about hypothetical account values and hypothetical expenses based on the Fund’s actual expense ratio and an assumed rate of return of 5% per year before expenses, which is not the Fund’s actual return. The hypothetical account values and expenses may not be used to estimate the actual ending account balance or expenses you paid for the period. You may use this information to compare the ongoing costs of investing in the Fund and other funds. To do so, compare this 5% hypothetical example with the 5% hypothetical examples that appear in the shareholder reports of the other funds.
Please note that the expenses shown in the table are meant to highlight your ongoing costs only and do not reflect any transactional costs, such as sales charges (loads) and contingent deferred sales charges. Therefore, the “Hypothetical” line of the table is useful in comparing ongoing costs only, and will not help you determine the relative total costs of owning different funds. In addition, if these transactional costs were included, your costs would have been higher.
| | Beginning
account value
4-1-2021 | Ending
account value
9-30-2021 | Consolidated
expenses
paid during
the period1 | Annualized net
expense ratio |
| Class A | | | | |
| Actual | $1,000.00 | $ 923.75 | $5.26 | 1.09% |
| Hypothetical (5% return before expenses) | $1,000.00 | $1,019.60 | $5.52 | 1.09% |
| Class C | | | | |
| Actual | $1,000.00 | $ 920.19 | $8.86 | 1.84% |
| Hypothetical (5% return before expenses) | $1,000.00 | $1,015.84 | $9.30 | 1.84% |
| Administrator Class | | | | |
| Actual | $1,000.00 | $ 924.41 | $4.58 | 0.95% |
| Hypothetical (5% return before expenses) | $1,000.00 | $1,020.31 | $4.81 | 0.95% |
| Institutional Class | | | | |
| Actual | $1,000.00 | $ 925.01 | $3.81 | 0.79% |
| Hypothetical (5% return before expenses) | $1,000.00 | $1,021.11 | $4.00 | 0.79% |
1 Consolidated expenses paid is equal to the annualized net expense ratio of each class multiplied by the average account value over the period, multiplied by the number of days in the most recent fiscal half-year divided by the number of days in the fiscal year (to reflect the one-half-year period).
Wells Fargo Precious Metals Fund | 9
Consolidated portfolio of investments—September 30, 2021 (unaudited)
| | | | | | Shares | Value |
| Common stocks: 93.91% | | | | | | |
| Australia: 8.85% | | | | | | |
| Capricorn Metals Limited (Materials, Metals & mining) † | | | | | 600,000 | $ 923,391 |
| Evolution Mining Limited (Materials, Metals & mining) | | | | | 2,350,000 | 5,942,014 |
| Newcrest Mining Limited (Materials, Metals & mining) | | | | | 702,294 | 11,642,426 |
| Northern Star Resources Limited (Materials, Metals & mining) | | | | | 1,536,412 | 9,409,981 |
| | | | | | | 27,917,812 |
| Canada: 61.39% | | | | | | |
| Agnico-Eagle Mines Limited (Materials, Metals & mining) | | | | | 110,370 | 5,725,890 |
| Agnico-Eagle Mines Limited-Legend Shares (Materials, Metals & mining) | | | | | 35,000 | 1,814,750 |
| Agnico-Eagle Mines Limited-U.S. Exchange Traded Shares (Materials, Metals & mining) | | | | | 141,164 | 7,319,353 |
| Alamos Gold Incorporated Class A (Materials, Metals & mining) | | | | | 1,273,980 | 9,163,081 |
| Artemis Gold Incorporated (Materials, Metals & mining) † | | | | | 500,000 | 2,119,848 |
| B2Gold Corporation (Materials, Metals & mining) | | | | | 2,500,000 | 8,546,502 |
| Barrick Gold Corporation (Materials, Metals & mining) | | | | | 1,061,723 | 19,164,100 |
| Centerra Gold Incorporated (Materials, Metals & mining) | | | | | 325,000 | 2,219,525 |
| Centerra Gold Incorporated-Legend Shares (Materials, Metals & mining) 144A | | | | | 250,000 | 1,721,143 |
| Dundee Precious Metals Incorporated (Materials, Metals & mining) | | | | | 700,000 | 4,211,274 |
| Franco-Nevada Corporation-Legend Shares (Materials, Metals & mining) 144A | | | | | 130,948 | 17,012,074 |
| Great Bear Resources Limited (Materials, Metals & mining) † | | | | | 75,000 | 802,937 |
| Kinross Gold Corporation (Materials, Metals & mining) | | | | | 3,800,553 | 20,374,037 |
| Kirkland Lake Gold Limited (Materials, Metals & mining) | | | | | 544,094 | 22,664,140 |
| Lundin Gold Incorporated (Materials, Metals & mining) † | | | | | 875,000 | 6,542,121 |
| MAG Silver Corporation (Materials, Metals & mining) † | | | | | 300,000 | 4,857,887 |
| MAG Silver Corporation-Legend Shares (Materials, Metals & mining) | | | | | 100,000 | 1,619,296 |
| Marathon Gold Corporation (Materials, Metals & mining) † | | | | | 700,000 | 1,696,668 |
| Orla Mining Limited (Materials, Metals & mining) † | | | | | 300,000 | 990,052 |
| Pan American Silver Corporation (Materials, Metals & mining) | | | | | 310,000 | 7,213,700 |
| Pretium Resources Incorporated (Materials, Metals & mining) † | | | | | 650,000 | 6,286,515 |
| SilverCrest Metals Incorporated (Materials, Metals & mining) † | | | | | 615,000 | 4,297,134 |
| Skeena Resources Limited (Materials, Metals & mining) † | | | | | 175,000 | 1,735,354 |
| SSR Mining Incorporated (Materials, Metals & mining) | | | | | 225,000 | 3,273,750 |
| SSR Mining Incorporated - U.S. Exchange Traded Shares (Materials, Metals & mining) | | | | | 323,552 | 4,705,375 |
| Torex Gold Resources Incorporated (Materials, Metals & mining) † | | | | | 365,000 | 3,648,271 |
| Torex Gold Resources Incorporated-Legend Shares (Materials, Metals & mining) 144A | | | | | 185,000 | 1,849,124 |
| Torex Gold Resources Incorporated-Legend Shares (Materials, Metals & mining) | | | | | 266,250 | 2,661,239 |
| Triple Flag Precious Metals Corporation (Materials, Metals & mining) | | | | | 160,000 | 1,452,708 |
| Wheaton Precious Metals Corporation (Materials, Metals & mining) | | | | | 12,950 | 487,491 |
| Wheaton Precious Metals Corporation-U.S. Exchange Traded Shares (Materials, Metals & mining) | | | | | 465,000 | 17,474,700 |
| | | | | | | 193,650,039 |
| South Africa: 5.85% | | | | | | |
| AngloGold Ashanti Limited ADR (Materials, Metals & mining) | | | | | 340,591 | 5,446,050 |
| Gold Fields Limited ADR (Materials, Metals & mining) | | | | | 1,600,000 | 12,992,000 |
| | | | | | | 18,438,050 |
The accompanying notes are an integral part of these consolidated financial statements.
10 | Wells Fargo Precious Metals Fund
Consolidated portfolio of investments—September 30, 2021 (unaudited)
| | | | | | Shares | Value |
| United Kingdom: 4.69% | | | | | | |
| Endeavour Mining plc (Materials, Metals & mining) | | | | | 657,000 | $ 14,788,465 |
| United States: 13.13% | | | | | | |
| Newmont Corporation (Materials, Metals & mining) | | | | | 401,802 | 21,817,849 |
| Newmont Corporation-Toronto Exchange Traded Shares (Materials, Metals & mining) | | | | | 131,348 | 7,133,609 |
| Royal Gold Incorporated (Materials, Metals & mining) | | | | | 130,436 | 12,455,334 |
| | | | | | | 41,406,792 |
| Total Common stocks (Cost $189,295,036) | | | | | | 296,201,158 |
| | | | | | Troy ounces | |
| Commodities: 4.28% | | | | | | |
| Gold Bullion * | | | | | 7,690 | 13,503,308 |
| Total Commodities (Cost $4,532,552) | | | | | | 13,503,308 |
| | | Yield | | | Shares | |
| Short-term investments: 1.30% | | | | | | |
| Investment companies: 1.30% | | | | | | |
| Wells Fargo Government Money Market Fund Select Class ♠∞ | | 0.03% | | | 4,097,424 | 4,097,424 |
| Total Short-term investments (Cost $4,097,424) | | | | | | 4,097,424 |
| Total investments in securities (Cost $197,925,012) | 99.49% | | | | | 313,801,890 |
| Other assets and liabilities, net | 0.51 | | | | | 1,623,616 |
| Total net assets | 100.00% | | | | | $315,425,506 |
| † | Non-income earning security |
| 144A | The security may be resold in transactions exempt from registration, normally to qualified institutional buyers, pursuant to Rule 144A under the Securities Act of 1933. |
| * | Represents an investment held in Special Investments (Cayman) SPC, the consolidated entity. |
| ♠ | The issuer of the security is an affiliated person of the Fund as defined in the Investment Company Act of 1940. |
| ∞ | The rate represents the 7-day annualized yield at period end. |
| Abbreviations: |
| ADR | American depositary receipt |
Investments in affiliates
An affiliated investment is an investment in which the Fund owns at least 5% of the outstanding voting shares of the issuer or as a result of other relationships, such as the Fund and the issuer having the same investment manager. Transactions with issuers that were either affiliates of the Fund at the beginning of the period or the end of the period were as follows:
| | Value,
beginning of
period | Purchases | Sales
proceeds | Net
realized
gains
(losses) | Net
change in
unrealized
gains
(losses) | Value,
end of
period | Shares,
end
of period | Income
from
affiliated
securities |
| Short-term investments | | | | | | | |
| Wells Fargo Government Money Market Fund Select Class | $5,898,183 | $31,420,551 | $(33,221,310) | $0 | $0 | $4,097,424 | 4,097,424 | $679 |
The accompanying notes are an integral part of these consolidated financial statements.
Wells Fargo Precious Metals Fund | 11
Consolidated statement of assets and liabilities—September 30, 2021 (unaudited)
| | |
| Assets | |
Investments in unaffiliated securities, at value (cost $189,295,036)
| $ 296,201,158 |
Investments in affiliated securites, at value (cost $4,097,424)
| 4,097,424 |
Investments in commodities, at value (cost $4,532,552)
| 13,503,308 |
Cash
| 83,189 |
Foreign currency, at value (cost $710,507)
| 711,560 |
Receivable for Fund shares sold
| 756,544 |
Receivable for dividends
| 569,543 |
Prepaid expenses and other assets
| 25,309 |
Total assets
| 315,948,035 |
| Liabilities | |
Management fee payable
| 153,788 |
Payable for Fund shares redeemed
| 118,740 |
Administration fees payable
| 48,697 |
Shareholder report expenses payable
| 44,208 |
Shareholder servicing fees payable
| 43,877 |
Distribution fee payable
| 7,089 |
Accrued expenses and other liabilities
| 106,130 |
Total liabilities
| 522,529 |
Total net assets
| $315,425,506 |
| Net assets consist of | |
Paid-in capital
| $ 354,671,051 |
Total distributable loss
| (39,245,545) |
Total net assets
| $315,425,506 |
| Computation of net asset value and offering price per share | |
Net assets – Class A
| $ 172,054,999 |
Shares outstanding – Class A1
| 3,967,280 |
Net asset value per share – Class A
| $43.37 |
Maximum offering price per share – Class A2
| $46.02 |
Net assets – Class C
| $ 10,821,262 |
Shares outstanding – Class C1
| 284,371 |
Net asset value per share – Class C
| $38.05 |
Net assets – Administrator Class
| $ 17,595,327 |
Shares outstanding – Administrator Class1
| 401,882 |
Net asset value per share – Administrator Class
| $43.78 |
Net assets – Institutional Class
| $ 114,953,918 |
Shares outstanding – Institutional Class1
| 2,602,874 |
Net asset value per share – Institutional Class
| $44.16 |
| 1 | The Fund has an unlimited number of authorized shares |
| 2 | Maximum offering price is computed as 100/94.25 of net asset value. On investments of $50,000 or more, the offering price is reduced. |
The accompanying notes are an integral part of these consolidated financial statements.
12 | Wells Fargo Precious Metals Fund
Consolidated statement of operations— six months ended September 30, 2021 (unaudited)
| | |
| Investment income | |
Dividends (net of foreign withholdings taxes of $268,546)
| $ 3,131,315 |
Income from affiliated securities
| 679 |
Total investment income
| 3,131,994 |
| Expenses | |
Management fee
| 1,205,064 |
| Administration fees | |
Class A
| 214,375 |
Class C
| 13,495 |
Administrator Class
| 11,908 |
Institutional Class
| 88,042 |
| Shareholder servicing fees | |
Class A
| 255,208 |
Class C
| 16,066 |
Administrator Class
| 22,900 |
| Distribution fee | |
Class C
| 48,185 |
Custody and accounting fees
| 21,653 |
Professional fees
| 32,524 |
Registration fees
| 30,071 |
Shareholder report expenses
| 28,478 |
Trustees’ fees and expenses
| 9,663 |
Transfer agent fees
| 2,224 |
Other fees and expenses
| 9,332 |
Total expenses
| 2,009,188 |
| Less: Fee waivers and/or expense reimbursements | |
Fund-level
| (113,831) |
Class A
| (37,599) |
Class C
| (1,925) |
Administrator Class
| (7,050) |
Net expenses
| 1,848,783 |
Net investment income
| 1,283,211 |
| Realized and unrealized gains (losses) on investments | |
Net realized losses on investments
| (2,711,330) |
| Net change in unrealized gains (losses) on | |
Unaffiliated securities
| (24,591,221) |
Commodities
| 369,044 |
Net change in unrealized gains (losses) on investments
| (24,222,177) |
Net realized and unrealized gains (losses) on investments
| (26,933,507) |
Net decrease in net assets resulting from operations
| $(25,650,296) |
The accompanying notes are an integral part of these consolidated financial statements.
Wells Fargo Precious Metals Fund | 13
Consolidated statement of changes in net assets
| | | | | |
| | Six months ended
September 30, 2021
(unaudited) | Year ended
March 31, 2021 |
| Operations | | | | |
Net investment income
| | $ 1,283,211 | | $ 832,750 |
Net realized gains (losses) on investments
| | (2,711,330) | | 31,323,046 |
Net change in unrealized gains (losses) on investments
| | (24,222,177) | | 64,472,819 |
Net increase (decrease) in net assets resulting from operations
| | (25,650,296) | | 96,628,615 |
| Distributions to shareholders from | | | | |
| Net investment income and net realized gains | | | | |
Class A
| | 0 | | (3,269,928) |
Administrator Class
| | 0 | | (259,299) |
Institutional Class
| | 0 | | (2,949,296) |
Total distributions to shareholders
| | 0 | | (6,478,523) |
| Capital share transactions | Shares | | Shares | |
| Proceeds from shares sold | | | | |
Class A
| 294,231 | 14,871,519 | 1,263,769 | 70,589,866 |
Class C
| 18,142 | 809,924 | 93,294 | 4,459,073 |
Administrator Class
| 258,742 | 13,028,348 | 187,722 | 9,854,429 |
Institutional Class
| 420,099 | 21,206,739 | 1,417,420 | 78,271,394 |
| | | 49,916,530 | | 163,174,762 |
| Reinvestment of distributions | | | | |
Class A
| 0 | 0 | 57,106 | 3,047,187 |
Administrator Class
| 0 | 0 | 4,749 | 255,520 |
Institutional Class
| 0 | 0 | 43,907 | 2,380,208 |
| | | 0 | | 5,682,915 |
| Payment for shares redeemed | | | | |
Class A
| (458,370) | (22,746,020) | (1,354,083) | (72,940,719) |
Class C
| (24,934) | (1,099,345) | (185,427) | (9,204,883) |
Administrator Class
| (151,959) | (7,697,229) | (121,514) | (6,447,337) |
Institutional Class
| (486,208) | (24,668,595) | (1,793,191) | (97,798,865) |
| | | (56,211,189) | | (186,391,804) |
Net decrease in net assets resulting from capital share transactions
| | (6,294,659) | | (17,534,127) |
Total increase (decrease) in net assets
| | (31,944,955) | | 72,615,965 |
| Net assets | | | | |
Beginning of period
| | 347,370,461 | | 274,754,496 |
End of period
| | $315,425,506 | | $ 347,370,461 |
The accompanying notes are an integral part of these consolidated financial statements.
14 | Wells Fargo Precious Metals Fund
Consolidated financial highlights
(For a share outstanding throughout each period)
| | | Year ended March 31 |
| Class A | Six months ended
September 30, 2021
(unaudited) | 2021 | 2020 | 2019 | 2018 | 2017 |
Net asset value, beginning of period
| $46.95 | $35.30 | $33.94 | $32.80 | $35.99 | $32.73 |
Net investment income (loss)
| 0.15 1 | 0.08 | (0.03) 1 | (0.03) 1 | (0.11) 1 | (0.22) 1 |
Net realized and unrealized gains (losses) on investments
| (3.73) | 12.35 | 1.44 | 1.17 | (2.60) | 3.85 |
Total from investment operations
| (3.58) | 12.43 | 1.41 | 1.14 | (2.71) | 3.63 |
| Distributions to shareholders from | | | | | | |
Net investment income
| 0.00 | (0.78) | (0.05) | 0.00 | (0.48) | (0.37) |
Net asset value, end of period
| $43.37 | $46.95 | $35.30 | $33.94 | $32.80 | $35.99 |
Total return2
| (7.63)% | 34.95% | 4.13% | 3.48% | (7.56)% | 11.24% |
| Ratios to average net assets (annualized) | | | | | | |
Gross expenses
| 1.18% | 1.17% | 1.20% | 1.22% | 1.21% | 1.20% |
Net expenses
| 1.09% | 1.09% | 1.09% | 1.09% | 1.04% | 1.09% |
Net investment income (loss)
| 0.59% | 0.12% | (0.08)% | (0.11)% | (0.32)% | (0.57)% |
| Supplemental data | | | | | | |
Portfolio turnover rate3
| 5% | 22% | 25% | 19% | 27% | 21% |
Net assets, end of period (000s omitted)
| $172,055 | $193,949 | $147,020 | $162,860 | $177,859 | $242,423 |
| 1 | Calculated based upon average shares outstanding |
| 2 | Total return calculations do not include any sales charges. Returns for periods of less than one year are not annualized. |
| 3 | Portfolio turnover rate includes the purchases and sales transactions of its wholly-owned subsidiary. |
The accompanying notes are an integral part of these consolidated financial statements.
Wells Fargo Precious Metals Fund | 15
Consolidated financial highlights
(For a share outstanding throughout each period)
| | | Year ended March 31 |
| Class C | Six months ended
September 30, 2021
(unaudited) | 2021 | 2020 | 2019 | 2018 | 2017 |
Net asset value, beginning of period
| $41.35 | $30.87 | $29.88 | $29.09 | $32.07 | $29.10 |
Net investment loss
| (0.03) 1 | (0.32) 1 | (0.29) 1 | (0.24) 1 | (0.33) 1 | (0.46) 1 |
Net realized and unrealized gains (losses) on investments
| (3.27) | 10.80 | 1.28 | 1.03 | (2.30) | 3.49 |
Total from investment operations
| (3.30) | 10.48 | 0.99 | 0.79 | (2.63) | 3.03 |
| Distributions to shareholders from | | | | | | |
Net investment income
| 0.00 | 0.00 | 0.00 | 0.00 | (0.35) | (0.06) |
Net asset value, end of period
| $38.05 | $41.35 | $30.87 | $29.88 | $29.09 | $32.07 |
Total return2
| (7.98)% | 33.95% | 3.31% | 2.72% | (8.24)% | 10.42% |
| Ratios to average net assets (annualized) | | | | | | |
Gross expenses
| 1.93% | 1.92% | 1.95% | 1.97% | 1.96% | 1.95% |
Net expenses
| 1.84% | 1.84% | 1.84% | 1.84% | 1.79% | 1.84% |
Net investment loss
| (0.16)% | (0.68)% | (0.83)% | (0.88)% | (1.07)% | (1.32)% |
| Supplemental data | | | | | | |
Portfolio turnover rate3
| 5% | 22% | 25% | 19% | 27% | 21% |
Net assets, end of period (000s omitted)
| $10,821 | $12,039 | $11,834 | $14,908 | $33,022 | $48,710 |
| 1 | Calculated based upon average shares outstanding |
| 2 | Total return calculations do not include any sales charges. Returns for periods of less than one year are not annualized. |
| 3 | Portfolio turnover rate includes the purchases and sales transactions of its wholly-owned subsidiary. |
The accompanying notes are an integral part of these consolidated financial statements.
16 | Wells Fargo Precious Metals Fund
Consolidated financial highlights
(For a share outstanding throughout each period)
| | | Year ended March 31 |
| Administrator Class | Six months ended
September 30, 2021
(unaudited) | 2021 | 2020 | 2019 | 2018 | 2017 |
Net asset value, beginning of period
| $47.36 | $35.66 | $34.29 | $33.09 | $36.27 | $32.98 |
Net investment income (loss)
| 0.22 1 | 0.17 1 | 0.02 1 | 0.01 1 | (0.09) 1 | (0.17) 1 |
Net realized and unrealized gains (losses) on investments
| (3.80) | 12.47 | 1.45 | 1.19 | (2.59) | 3.87 |
Total from investment operations
| (3.58) | 12.64 | 1.47 | 1.20 | (2.68) | 3.70 |
| Distributions to shareholders from | | | | | | |
Net investment income
| 0.00 | (0.94) | (0.10) | 0.00 | (0.50) | (0.41) |
Net asset value, end of period
| $43.78 | $47.36 | $35.66 | $34.29 | $33.09 | $36.27 |
Total return2
| (7.56)% | 35.13% | 4.24% | 3.63% | (7.40)% | 11.37% |
| Ratios to average net assets (annualized) | | | | | | |
Gross expenses
| 1.10% | 1.09% | 1.12% | 1.14% | 1.15% | 1.12% |
Net expenses
| 0.95% | 0.95% | 0.95% | 0.95% | 0.91% | 0.95% |
Net investment income (loss)
| 0.86% | 0.31% | 0.06% | 0.04% | (0.25)% | (0.44)% |
| Supplemental data | | | | | | |
Portfolio turnover rate3
| 5% | 22% | 25% | 19% | 27% | 21% |
Net assets, end of period (000s omitted)
| $17,595 | $13,976 | $7,994 | $8,086 | $9,148 | $15,325 |
| 1 | Calculated based upon average shares outstanding |
| 2 | Returns for periods of less than one year are not annualized. |
| 3 | Portfolio turnover rate includes the purchases and sales transactions of its wholly-owned subsidiary. |
The accompanying notes are an integral part of these consolidated financial statements.
Wells Fargo Precious Metals Fund | 17
Consolidated financial highlights
(For a share outstanding throughout each period)
| | | Year ended March 31 |
| Institutional Class | Six months ended
September 30, 2021
(unaudited) | 2021 | 2020 | 2019 | 2018 | 2017 |
Net asset value, beginning of period
| $47.74 | $35.96 | $34.57 | $33.30 | $36.47 | $33.21 |
Net investment income (loss)
| 0.26 | 0.24 | 0.09 1 | 0.04 | 0.02 | (0.09) 1 |
Net realized and unrealized gains (losses) on investments
| (3.84) | 12.59 | 1.46 | 1.23 | (2.67) | 3.85 |
Total from investment operations
| (3.58) | 12.83 | 1.55 | 1.27 | (2.65) | 3.76 |
| Distributions to shareholders from | | | | | | |
Net investment income
| 0.00 | (1.05) | (0.16) | 0.00 | (0.52) | (0.50) |
Net asset value, end of period
| $44.16 | $47.74 | $35.96 | $34.57 | $33.30 | $36.47 |
Total return2
| (7.50)% | 35.34% | 4.43% | 3.81% | (7.27)% | 11.49% |
| Ratios to average net assets (annualized) | | | | | | |
Gross expenses
| 0.85% | 0.84% | 0.87% | 0.89% | 0.88% | 0.88% |
Net expenses
| 0.79% | 0.79% | 0.79% | 0.79% | 0.73% | 0.79% |
Net investment income (loss)
| 0.90% | 0.37% | 0.22% | 0.21% | 0.01% | (0.24)% |
| Supplemental data | | | | | | |
Portfolio turnover rate3
| 5% | 22% | 25% | 19% | 27% | 21% |
Net assets, end of period (000s omitted)
| $114,954 | $127,406 | $107,907 | $95,431 | $82,650 | $89,680 |
| 1 | Calculated based upon average shares outstanding |
| 2 | Returns for periods of less than one year are not annualized. |
| 3 | Portfolio turnover rate includes the purchases and sales transactions of its wholly-owned subsidiary. |
The accompanying notes are an integral part of these consolidated financial statements.
18 | Wells Fargo Precious Metals Fund
Notes to consolidated financial statements (unaudited)
1. ORGANIZATION
Wells Fargo Funds Trust (the "Trust"), a Delaware statutory trust organized on March 10, 1999, is an open-end management investment company registered under the Investment Company Act of 1940, as amended (the "1940 Act"). As an investment company, the Trust follows the accounting and reporting guidance in Financial Accounting Standards Board ("FASB") Accounting Standards Codification Topic 946, Financial Services – Investment Companies. These consolidated financial statements report on the Wells Fargo Precious Metals Fund (the "Fund") which is a non-diversified series of the Trust.
On February 23, 2021, Wells Fargo & Company announced that it has entered into a definitive agreement to sell Wells Fargo Asset Management ("WFAM") to GTCR LLC and Reverence Capital Partners, L.P. WFAM is the trade name used by the asset management businesses of Wells Fargo & Company and includes Wells Fargo Funds Management, LLC, the investment manager to the Fund, Wells Capital Management, LLC and Wells Fargo Asset Management (International) Limited, both registered investment advisers providing subadvisory services to certain funds, and Wells Fargo Funds Distributor, LLC, the Fund's principal underwriter. As part of the transaction, Wells Fargo & Company will own a 9.9% equity interest and will continue to serve as an important client and distribution partner.
Consummation of the transaction will result in the automatic termination of the Fund's investment management agreement and subadvisory agreement. The Fund's Board of Trustees approved a new investment management agreement and a new subadvisory agreement which were submitted to the Fund's shareholders for approval at a Special Meeting of Shareholders scheduled for November 24, 2021. Shareholders of record of the Fund at the close of business on May 28, 2021 are entitled to vote at the meeting. If shareholders approve the new agreements, they will take effect upon the closing of the transaction.
As more fully discussed in Note 11, the transaction closed on November 1, 2021 and the investment manager, sub-advisers and distributor changed their names to Allspring Funds Management, LLC, Allspring Global Investments, LLC, Allspring Global Investments (UK) Limited and Allspring Funds Distributor, LLC. While these name changes occurred after the end of the period, throughout this report, the new names have been used.
The Board of Trustees of the Wells Fargo Funds voted on July 15, 2021 to approve a change to the Fund's name to remove "Wells Fargo" from the name and replace it with "Allspring", effective December 6, 2021.
2. INVESTMENT IN SUBSIDIARY
The Fund invests in precious metals and minerals through Special Investments (Cayman) SPC (the “Subsidiary”), a wholly owned subsidiary incorporated on May 3, 2005 under the laws of the Cayman Islands as an exempted segregated portfolio company with limited liability. As of September 30, 2021, the Subsidiary held $13,503,308 in gold bullion representing 99.57% of its net assets. The Fund is the sole shareholder of the Subsidiary. As of September 30, 2021, the Fund held $13,561,365, in the Subsidiary, representing 4.30% of the Fund’s net assets prior to consolidation.
The consolidated financial statements of the Fund include the financial results of the Subsidiary. The Consolidated Portfolio of Investments includes positions of the Fund and the Subsidiary and the consolidated financial statements include the accounts of the Fund and the Subsidiary. Accordingly, all interfund balances and transactions between the Fund and the Subsidiary have been eliminated in consolidation.
3. SIGNIFICANT ACCOUNTING POLICIES
The following significant accounting policies, which are consistently followed in the preparation of the consolidated financial statements of the Fund, are in conformity with U.S. generally accepted accounting principles which require management to make estimates and assumptions that affect the reported amounts of assets and liabilities, disclosure of contingent assets and liabilities at the date of the consolidated financial statements, and the reported amounts of income and expenses during the reporting period. Actual results could differ from those estimates.
Securities valuation
All investments are valued each business day as of the close of regular trading on the New York Stock Exchange (generally 4 p.m. Eastern Time), although the Fund may deviate from this calculation time under unusual or unexpected circumstances.
Equity securities that are listed on a foreign or domestic exchange or market are valued at the official closing price or, if none, the last sales price. If no sale occurs on the principal exchange or market that day, a fair value price will be determined in accordance with the Fund’s Valuation Procedures.
The values of securities denominated in foreign currencies are translated into U.S. dollars at rates provided by an independent foreign currency pricing source at a time each business day specified by the Allspring Global Investments Pricing Committee at Allspring Funds Mangement, LLC ("Allspring Funds Management").
Wells Fargo Precious Metals Fund | 19
Notes to consolidated financial statements (unaudited)
Many securities markets and exchanges outside the U.S. close prior to the close of the New York Stock Exchange and therefore may not fully reflect trading or events that occur after the close of the principal exchange in which the foreign securities are traded, but before the close of the New York Stock Exchange. If such trading or events are expected to materially affect the value of such securities, then fair value pricing procedures approved by the Board of Trustees of the Fund are applied. These procedures take into account multiple factors including movements in U.S. securities markets after foreign exchanges close. Foreign securities that are fair valued under these procedures are categorized as Level 2 and the application of these procedures may result in transfers between Level 1 and Level 2. Depending on market activity, such fair valuations may be frequent. Such fair value pricing may result in net asset values that are higher or lower than net asset values based on the last reported sales price or latest quoted bid price. On September 30, 2021, such fair value pricing was used in pricing certain foreign securities.
Investments in commodities are valued at their last traded price.
Investments in registered open-end investment companies are valued at net asset value.
Investments which are not valued using any of the methods discussed above are valued at their fair value, as determined in good faith by the Board of Trustees. The Board of Trustees has established a Valuation Committee comprised of the Trustees and has delegated to it the authority to take any actions regarding the valuation of portfolio securities that the Valuation Committee deems necessary or appropriate, including determining the fair value of portfolio securities, unless the determination has been delegated to the Allspring Global Investments Pricing Committee. The Board of Trustees retains the authority to make or ratify any valuation decisions or approve any changes to the Valuation Procedures as it deems appropriate. On a quarterly basis, the Board of Trustees receives reports on any valuation actions taken by the Valuation Committee or the Allspring Global Investments Pricing Committee which may include items for ratification.
Foreign currency translation
The accounting records of the Fund are maintained in U.S. dollars. The values of other assets and liabilities denominated in foreign currencies are translated into U.S. dollars at rates provided by an independent foreign currency pricing source at a time each business day specified by the Allspring Global Investments Pricing Committee. Purchases and sales of securities, and income and expenses are converted at the rate of exchange on the respective dates of such transactions. Net realized foreign exchange gains or losses arise from sales of foreign currencies, currency gains or losses realized between the trade and settlement dates on securities transactions, and the difference between the amounts of dividends, interest and foreign withholding taxes recorded and the U.S. dollar equivalent of the amounts actually paid or received. Net unrealized foreign exchange gains and losses arise from changes in the fair value of assets and liabilities other than investments in securities resulting from changes in exchange rates. The changes in net assets arising from changes in exchange rates of securities and the changes in net assets resulting from changes in market prices of securities are not separately presented. Such changes are included in net realized and unrealized gains or losses from investments.
Security transactions and income recognition
Securities transactions are recorded on a trade date basis. Realized gains or losses are recorded on the basis of identified cost.
Dividend income is recognized on the ex-dividend date, except for certain dividends from foreign securities, which are recorded as soon as the custodian verifies the ex-dividend date. Dividend income is recorded net of foreign taxes withheld where recovery of such taxes is not assured.
Distributions to shareholders
Distributions to shareholders from net investment income and any net realized gains are recorded on the ex-dividend date and paid at least annually. Such distributions are determined in accordance with income tax regulations and may differ from U.S. generally accepted accounting principles. Dividend sources are estimated at the time of declaration. The tax character of distributions is determined as of the Fund's fiscal year end. Therefore, a portion of the Fund's distributions made prior to the Fund’s fiscal year end may be categorized as a tax return of capital at year end.
Federal and other taxes
The Fund intends to continue to qualify as a regulated investment company by distributing substantially all of its investment company taxable income and any net realized capital gains (after reduction for capital loss carryforwards) sufficient to relieve it from all, or substantially all, federal income taxes. Accordingly, no provision for federal income taxes was required.
The Subsidiary is classified as a controlled foreign corporation under Subchapter N of the Internal Revenue Code. Therefore, the Fund is required to increase its taxable income by its share of the Subsidiary’s income. Net investment losses of the Subsidiary cannot be deducted by the Fund in the current period nor carried forward to offset taxable income in future periods.
20 | Wells Fargo Precious Metals Fund
Notes to consolidated financial statements (unaudited)
The Fund’s income and federal excise tax returns and all financial records supporting those returns for the prior three fiscal years are subject to examination by the federal and Delaware revenue authorities. Management has analyzed the Fund's tax positions taken on federal, state, and foreign tax returns for all open tax years and does not believe that there are any uncertain tax positions that require recognition of a tax liability.
As of September 30, 2021, the aggregate cost of all investments for federal income tax purposes was $197,293,567 and the unrealized gains (losses) consisted of:
| Gross unrealized gains | $122,890,666 |
| Gross unrealized losses | (6,382,343) |
| Net unrealized gains | $116,508,323 |
As of March 31, 2021, the Fund had capital loss carryforwards which consisted of $26,341,382 in short-term capital losses and $114,831,327 in long-term capital losses.
As of March 31, 2021, the Fund had current year deferred post-October capital losses consisting of $3,248,022 in short-term losses which was recognized on the first day of the current fiscal year.
Class allocations
The separate classes of shares offered by the Fund differ principally in applicable sales charges, distribution, shareholder servicing, and administration fees. Class specific expenses are charged directly to that share class. Investment income, common fund-level expenses, and realized and unrealized gains (losses) on investments are allocated daily to each class of shares based on the relative proportion of net assets of each class.
4. FAIR VALUATION MEASUREMENTS
Fair value measurements of investments are determined within a framework that has established a fair value hierarchy based upon the various data inputs utilized in determining the value of the Fund’s investments. The three-level hierarchy gives the highest priority to unadjusted quoted prices in active markets for identical assets or liabilities (Level 1) and the lowest priority to unobservable inputs (Level 3). The Fund’s investments are classified within the fair value hierarchy based on the lowest level of input that is significant to the fair value measurement. The inputs are summarized into three broad levels as follows:
| ■ | Level 1 – quoted prices in active markets for identical securities |
| ■ | Level 2 – other significant observable inputs (including quoted prices for similar securities, interest rates, prepayment speeds, credit risk, etc.) |
| ■ | Level 3 – significant unobservable inputs (including the Fund’s own assumptions in determining the fair value of investments) |
The inputs or methodologies used for valuing investments in securities are not necessarily an indication of the risk associated with investing in those securities.
Wells Fargo Precious Metals Fund | 21
Notes to consolidated financial statements (unaudited)
The following is a summary of the inputs used in valuing the Fund’s assets and liabilities as of September 30, 2021:
| | Quoted prices
(Level 1) | Other significant
observable inputs
(Level 2) | Significant
unobservable inputs
(Level 3) | Total |
| Assets | | | | |
| Investments in: | | | | |
| Common stocks | | | | |
| Australia | $ 0 | $ 27,917,812 | $0 | $ 27,917,812 |
| Canada | 166,972,413 | 26,677,626 | 0 | 193,650,039 |
| South Africa | 18,438,050 | 0 | 0 | 18,438,050 |
| United Kingdom | 14,788,465 | 0 | 0 | 14,788,465 |
| United States | 41,406,792 | 0 | 0 | 41,406,792 |
| Commodities | 13,503,308 | 0 | 0 | 13,503,308 |
| Short-term investments | | | | |
| Investment companies | 4,097,424 | 0 | 0 | 4,097,424 |
| Total assets | $259,206,452 | $54,595,438 | $0 | $313,801,890 |
Additional sector, industry or geographic detail, if any, is included in the Consolidated Portfolio of Investments.
For the six months ended September 30, 2021, the Fund did not have any transfers into/out of Level 3.
5. TRANSACTIONS WITH AFFILIATES
Management fee
Allspring Funds Management, a wholly owned subsidiary of Allspring Global Investments Holdings, LLC, a holding company indirectly owned by Wells Fargo & Company as of September 30, 2021, is the manager of the Fund and provides advisory and fund-level administrative services under an investment management agreement. Under the investment management agreement, Allspring Funds Management is responsible for, among other services, implementing the investment objectives and strategies of the Fund, supervising the subadviser and providing fund-level administrative services in connection with the Fund’s operations. As compensation for its services under the investment management agreement, Allspring Funds Management is entitled to receive a management fee at the following annual rate based on the Fund’s average daily net assets:
| Average daily net assets | Management fee |
| First $500 million | 0.650% |
| Next $500 million | 0.600 |
| Next $1 billion | 0.550 |
| Next $2 billion | 0.525 |
| Next $1 billion | 0.500 |
| Next $5 billion | 0.490 |
| Over $10 billion | 0.480 |
For the six months ended September 30, 2021, the management fee was equivalent to an annual rate of 0.65% of the Fund’s average daily net assets.
The Subsidiary has entered into a separate advisory contract with Allspring Funds Management to manage the investment and reinvestment of its assets in conformity with its investment objectives and restrictions. Under this agreement, the Subsidiary does not pay Allspring Funds Management a fee for its services.
Allspring Funds Management has retained the services of a subadviser to provide daily portfolio management to the Fund. The fee for subadvisory services is borne by Allspring Funds Management. Allspring Global Investments, LLC, an affiliate of Allspring Funds Management and wholly owned subsidiary of Allspring Global Investments Holdings, LLC, is the subadviser to the Fund and is entitled to receive a fee from Allspring Funds Management at an annual rate starting at 0.40% and declining to 0.30% as the average daily net assets of the Fund increase.
22 | Wells Fargo Precious Metals Fund
Notes to consolidated financial statements (unaudited)
Administration fees
Under a class-level administration agreement, Allspring Funds Management provides class-level administrative services to the Fund, which includes paying fees and expenses for services provided by the transfer agent, sub-transfer agents, omnibus account servicers and record-keepers. As compensation for its services under the class-level administration agreement, Allspring Funds Management receives an annual fee which is calculated based on the average daily net assets of each class as follows:
| | Class-level
administration fee |
| Class A | 0.21% |
| Class C | 0.21 |
| Administrator Class | 0.13 |
| Institutional Class | 0.13 |
Waivers and/or expense reimbursements
Allspring Funds Management has contractually committed to waive and/or reimburse management and administration fees to the extent necessary to maintain certain net operating expense ratios for the Fund. When each class of the Fund has exceeded its expense cap, Allspring Funds Management will waive fees and/or reimburse expenses from fund-level expenses on a proportionate basis and then from class specific expenses. When only certain classes exceed their expense caps, waivers and/or reimbursements are applied against class specific expenses before fund-level expenses. Allspring Funds Management has contractually committed through July 31, 2022 to waive fees and/or reimburse expenses to the extent necessary to cap expenses. Prior to or after the commitment expiration date, the caps may be increased or the commitment to maintain the caps may be terminated only with the approval of the Board of Trustees. The contractual expense caps are as follows:
| | Expense ratio caps |
| Class A | 1.09% |
| Class C | 1.84 |
| Administrator Class | 0.95 |
| Institutional Class | 0.79 |
Distribution fee
The Trust has adopted a distribution plan for Class C shares of the Fund pursuant to Rule 12b-1 under the 1940 Act. A distribution fee is charged to Class C shares and paid to Allspring Funds Distributor, LLC ("Allspring Funds Distributor"), an affiliate of Allspring Funds Management, the principal underwriter, at an annual rate of 0.75% of the average daily net assets of Class C shares.
In addition, Allspring Funds Distributor is entitled to receive the front-end sales charge from the purchase of Class A shares and a contingent deferred sales charge on the redemption of certain Class A shares. Allspring Funds Distributor is also entitled to receive the contingent deferred sales charges from redemptions of Class C shares. For the six months ended September 30, 2021, Allspring Funds Distributor received $9,376 from the sale of Class A shares and $70 in contingent deferred sales charges from redemptions of Class C shares. No contingent deferred sales charges were incurred by Class A shares for the six months ended September 30, 2021.
Shareholder servicing fees
The Trust has entered into contracts with one or more shareholder servicing agents, whereby Class A, Class C, and Administrator Class of the Fund are charged a fee at an annual rate of 0.25% of the average daily net assets of each respective class. A portion of these total shareholder servicing fees were paid to affiliates.
Interfund transactions
The Fund may purchase or sell portfolio investment securities to certain affiliates pursuant to Rule 17a-7 under the 1940 Act and under procedures adopted by the Board of Trustees. The procedures have been designed to ensure that these interfund transactions, which do not incur broker commissions, are effected at current market prices.
Wells Fargo Precious Metals Fund | 23
Notes to consolidated financial statements (unaudited)
6. INVESTMENT PORTFOLIO TRANSACTIONS
Purchases and sales of investments, excluding U.S. government obligations (if any) and short-term securities, for the six months ended September 30, 2021 were $18,832,233 and $23,247,441, respectively. These amounts include purchase and sales transactions of the Subsidiary.
7. BANK BORROWINGS
The Trust (excluding the money market funds), Wells Fargo Master Trust and Wells Fargo Variable Trust are parties to a $350,000,000 revolving credit agreement whereby the Fund is permitted to use bank borrowings for temporary or emergency purposes, such as to fund shareholder redemption requests. Interest under the credit agreement is charged to the Fund based on a borrowing rate equal to the higher of the Federal Funds rate in effect on that day plus 1.25% or the overnight bank funding rate in effect on that day plus 1.25%. In addition, an annual commitment fee equal to 0.25% of the unused balance is allocated to each participating fund.
For the six months ended September 30, 2021, there were no borrowings by the Fund under the agreement.
8. CONCENTRATION RISKS
The Fund concentrated its portfolio of investments in precious metals and minerals with a geographic emphasis in Canada. A fund that invests a substantial portion of its assets in any sector or geographic region may be more affected by changes in that sector or geographic region than would be a fund whose investments are not heavily weighted in any sector or geographic region.
9. INDEMNIFICATION
Under the Fund's organizational documents, the officers and Trustees have been granted certain indemnification rights against certain liabilities that may arise out of performance of their duties to the Fund. The Fund has entered into a separate agreement with each Trustee that converts indemnification rights currently existing under the Fund’s organizational documents into contractual rights that cannot be changed in the future without the consent of the Trustee. Additionally, in the normal course of business, the Fund may enter into contracts with service providers that contain a variety of indemnification clauses. The Fund’s maximum exposure under these arrangements is dependent on future claims that may be made against the Fund and, therefore, cannot be estimated.
10. CORONAVIRUS (COVID-19) PANDEMIC
On March 11, 2020, the World Health Organization announced that it had made the assessment that coronavirus disease 2019 (“COVID-19”) is a pandemic. The impacts of COVID-19 are affecting the entire global economy, individual companies and investment products, the funds, and the market in general. There is significant uncertainty around the extent and duration of business disruptions related to COVID-19 and the impacts may last for an extended period of time. COVID-19 has led to significant uncertainty and volatility in the financial markets.
11. SUBSEQUENT EVENTS
Effective after the close of business on November 1, 2021, the sale transaction of Wells Fargo Asset Management by Wells Fargo & Company to GTCR LLC and Reverence Capital Partners, L.P. was closed. In connection with the closing of the transaction, Wells Fargo Asset Management became known as Allspring Global Investments (“Allspring”) and various entities that provide services to the Fund changed their names to “Allspring”, including Allspring Funds Management, LLC (formerly Wells Fargo Funds Management, LLC), the investment manager to the Fund, Allspring Global Investments, LLC (formerly Wells Capital Management, LLC) and Allspring Global Investments (UK) Limited (formerly Wells Fargo Asset Management (International) Limited), both registered investment advisers providing sub-advisory services to certain funds, and Allspring Funds Distributor, LLC (formerly Wells Fargo Funds Distributor, LLC), the Fund's principal underwriter. These name changes have been reflected within this report.
Pending shareholder approval at a Special Meeting of Shareholders expected to be held on November 24, 2021, the investment management and subadvisory agreements were replaced with interim agreements on November 1, 2021 at the same management and subadvisory fee rates. A new investment management and a new subadvisory agreement will become effective upon shareholder approval.
24 | Wells Fargo Precious Metals Fund
Other information (unaudited)
TAX INFORMATION
Pursuant to Section 853 of the Internal Revenue Code, the following amounts have been designated as foreign taxes paid for the fiscal year ended March 31, 2021. These amounts may be less than the actual foreign taxes paid for financial statement purposes. Foreign taxes paid or withheld should be included in taxable income with an offsetting deduction from gross income or as a credit for taxes paid to foreign governments. None of the income was derived from ineligible foreign sources as defined under Section 901(j) of the Internal Revenue Code.
Creditable
foreign taxes
paid | Per share
amount | Foreign
income as % of
ordinary income
distributions |
| $517,000 | $0.0700 | 80.86% |
PROXY VOTING INFORMATION
A description of the policies and procedures used to determine how to vote proxies relating to portfolio securities is available without charge, upon request, by calling 1-800-222-8222, visiting our website at allspringglobal.com, or visiting the SEC website at sec.gov. Information regarding how the proxies related to portfolio securities were voted during the most recent 12-month period ended June 30 is available on the website at allspringglobal.com or by visiting the SEC website at sec.gov.
QUARTERLY PORTFOLIO HOLDINGS INFORMATION
The Fund files its complete schedule of portfolio holdings with the SEC for the first and third quarters of each fiscal year as an exhibit to its reports on Form N-PORT. Shareholders may view the filed Form N-PORT by visiting the SEC website at sec.gov.
Wells Fargo Precious Metals Fund | 25
Other information (unaudited)
BOARD OF TRUSTEES AND OFFICERS
Each of the Trustees and Officers listed in the table below acts in identical capacities for each fund in the Wells Fargo family of funds, which consists of 139 mutual funds comprising the Wells Fargo Funds Trust, Wells Fargo Variable Trust, Wells Fargo Master Trust and four closed-end funds (collectively the “Fund Complex”). This table should be read in conjunction with the Prospectus and the Statement of Additional Information1. The mailing address of each Trustee and Officer is 525 Market Street, 12th Floor, San Francisco, CA 94105. Each Trustee and Officer serves an indefinite term, however, each Trustee serves such term until reaching the mandatory retirement age established by the Trustees.
Independent Trustees
Name and
year of birth | Position held and
length of service* | Principal occupations during past five years or longer | Current other
public company or
investment
company
directorships |
William R. Ebsworth
(Born 1957) | Trustee,
since 2015 | Retired. From 1984 to 2013, equities analyst, portfolio manager, research director and chief investment officer at Fidelity Management and Research Company in Boston, Tokyo, and Hong Kong, and retired in 2013 as Chief Investment Officer of Fidelity Strategic Advisers, Inc. where he led a team of investment professionals managing client assets. Prior thereto, Board member of Hong Kong Securities Clearing Co., Hong Kong Options Clearing Corp., the Thailand International Fund, Ltd., Fidelity Investments Life Insurance Company, and Empire Fidelity Investments Life Insurance Company. Audit Committee Chair and Investment Committee Chair of the Vincent Memorial Hospital Endowment (non-profit organization). Mr. Ebsworth is a CFA® charterholder. | N/A |
Jane A. Freeman
(Born 1953) | Trustee,
since 2015;
Chair Liaison,
since 2018 | Retired. From 2012 to 2014 and 1999 to 2008, Chief Financial Officer of Scientific Learning Corporation. From 2008 to 2012, Ms. Freeman provided consulting services related to strategic business projects. Prior to 1999, Portfolio Manager at Rockefeller & Co. and Scudder, Stevens & Clark. Board member of the Harding Loevner Funds from 1996 to 2014, serving as both Lead Independent Director and chair of the Audit Committee. Board member of the Russell Exchange Traded Funds Trust from 2011 to 2012 and the chair of the Audit Committee. Ms. Freeman is also an inactive Chartered Financial Analyst. | N/A |
Isaiah Harris, Jr.
(Born 1952) | Trustee,
since 2009; Audit
Committee
Chair,
since 2019 | Retired. Chairman of the Board of CIGNA Corporation since 2009, and Director since 2005. From 2003 to 2011, Director of Deluxe Corporation. Prior thereto, President and CEO of BellSouth Advertising and Publishing Corp. from 2005 to 2007, President and CEO of BellSouth Enterprises from 2004 to 2005 and President of BellSouth Consumer Services from 2000 to 2003. Emeritus member of the Iowa State University Foundation Board of Governors. Emeritus Member of the Advisory Board of Iowa State University School of Business. Advisory Board Member, Palm Harbor Academy (private school). Mr. Harris is a certified public accountant (inactive status). | CIGNA Corporation |
Judith M. Johnson
(Born 1949) | Trustee,
since 2008 | Retired. Prior thereto, Chief Executive Officer and Chief Investment Officer of Minneapolis Employees Retirement Fund from 1996 to 2008. Ms. Johnson is an attorney, certified public accountant and a certified managerial accountant. | N/A |
David F. Larcker
(Born 1950) | Trustee,
since 2009 | James Irvin Miller Professor of Accounting at the Graduate School of Business (Emeritus), Stanford University, Director of the Corporate Governance Research Initiative and Senior Faculty of The Rock Center for Corporate Governance since 2006. From 2005 to 2008, Professor of Accounting at the Graduate School of Business, Stanford University. Prior thereto, Ernst & Young Professor of Accounting at The Wharton School, University of Pennsylvania from 1985 to 2005. | N/A |
26 | Wells Fargo Precious Metals Fund
Other information (unaudited)
Name and
year of birth | Position held and
length of service* | Principal occupations during past five years or longer | Current other
public company or
investment
company
directorships |
Olivia S. Mitchell
(Born 1953) | Trustee,
since 2006;
Nominating and
Governance
Committee Chair,
since 2018 | International Foundation of Employee Benefit Plans Professor, Wharton School of the University of Pennsylvania since 1993. Director of Wharton’s Pension Research Council and Boettner Center on Pensions & Retirement Research, and Research Associate at the National Bureau of Economic Research. Previously, Cornell University Professor from 1978 to 1993. | N/A |
Timothy J. Penny
(Born 1951) | Trustee,
since 1996;
Chair,
since 2018 | President and Chief Executive Officer of Southern Minnesota Initiative Foundation, a non-profit organization, since 2007. Member of the Board of Trustees of NorthStar Education Finance, Inc., a non-profit organization, since 2007. | N/A |
James G. Polisson
(Born 1959) | Trustee,
since 2018 | Retired. Chief Marketing Officer, Source (ETF) UK Services, Ltd, from 2015 to 2017. From 2012 to 2015, Principal of The Polisson Group, LLC, a management consulting, corporate advisory and principal investing company. Chief Executive Officer and Managing Director at Russell Investments, Global Exchange Traded Funds from 2010 to 2012. Managing Director of Barclays Global Investors from 1998 to 2010 and Global Chief Marketing Officer for iShares and Barclays Global Investors from 2000 to 2010. Trustee of the San Francisco Mechanics’ Institute, a non-profit organization, from 2013 to 2015. Board member of the Russell Exchange Traded Fund Trust from 2011 to 2012. Director of Barclays Global Investors Holdings Deutschland GmbH from 2006 to 2009. Mr. Polisson is an attorney and has a retired status with the Massachusetts and District of Columbia Bar Associations. | N/A |
Pamela Wheelock
(Born 1959) | Trustee,
since January
2020; previously
Trustee from
January 2018 to
July 2019 | Board member of the Destination Medical Center Economic Development Agency, Rochester, Minnesota since 2019. Interim President of the McKnight Foundation from January to September 2020. Acting Commissioner, Minnesota Department of Human Services, July 2019 through September 2019. Human Services Manager (part-time), Minnesota Department of Human Services, October 2019 through December 2019. Chief Operating Officer, Twin Cities Habitat for Humanity from 2017 to 2019. Vice President of University Services, University of Minnesota from 2012 to 2016. Prior thereto, on the Board of Directors, Governance Committee and Finance Committee for the Minnesota Philanthropy Partners (Saint Paul Foundation) from 2012 to 2018, Interim Chief Executive Officer of Blue Cross Blue Shield of Minnesota from 2011 to 2012, Chairman of the Board from 2009 to 2012 and Board Director from 2003 to 2015. Vice President, Leadership and Community Engagement, Bush Foundation, Saint Paul, Minnesota (a private foundation) from 2009 to 2011. Executive Vice President and Chief Financial Officer, Minnesota Sports and Entertainment from 2004 to 2009 and Senior Vice President from 2002 to 2004. Executive Vice President of the Minnesota Wild Foundation from 2004 to 2008. Commissioner of Finance, State of Minnesota, from 1999 to 2002. Currently Board Chair of the Minnesota Wild Foundation since 2010. | N/A |
* Length of service dates reflect the Trustee’s commencement of service with the Trust’s predecessor entities, where applicable.
Wells Fargo Precious Metals Fund | 27
Other information (unaudited)
Officers2
Name and
year of birth | Position held and
length of service | Principal occupations during past five years or longer |
Andrew Owen
(Born 1960) | President,
since 2017 | President, Chief Executive Officer and Director of Allspring Funds Management, LLC since 2017 and co-president of Galliard Capital Management, LLC, an affiliate of Allspring Funds Management, LLC, since 2019. Prior thereto, Head of Affiliated Managers, Allspring Global Investments, from 2014 to 2019 and Executive Vice President responsible for marketing, investments and product development for Allspring Funds Management, LLC, from 2009 to 2014. In addition, Mr. Owen was an Executive Vice President of Wells Fargo & Company from 2014 to 2021. |
Jeremy DePalma
(Born 1974) | Treasurer,
since 2012
(for certain funds in
the Fund Complex);
since 2021 (for
the remaining funds in the
Fund Complex) | Senior Vice President of Allspring Funds Management, LLC since 2009. Senior Vice President of Evergreen Investment Management Company, LLC from 2008 to 2010 and head of the Fund Reporting and Control Team within Fund Administration. |
Kate McKinley
(Born 1977) | Chief Legal Officer and Chief Compliance Officer,
since 2021 | Chief Legal Officer of Allspring Global Investments since 2021. Prior thereto, held various roles at State Street Global Advisors, Inc. beginning in 2010, including serving as Senior Vice President and General Counsel from 2019 to 2021. Previously served as Assistant General Counsel for Bank of America Corporation from 2005 to 2010 and as an Associate at WilmerHale from 2002 to 2005. |
Matthew Prasse
(Born 1983) | Secretary,
since 2021 | Senior Counsel of the Allspring Legal Department since 2021. Senior Counsel of the Wells Fargo Legal Department from 2018 to 2021. Previously, Counsel for Barings LLC from 2015 to 2018. Prior to joining Barings, Associate at Morgan, Lewis & Bockius LLP from 2008 to 2015. |
1 The Statement of Additional Information includes additional information about the Trustees and is available, without charge, upon request, by calling 1-800-222-8222 or by visiting the website at allspringglobal.com.
2 For those Officers with tenures at Allspring Global Investments and/or Allspring Funds Management, LLC that began prior to 2021, such tenures include years of service during which these businesses/entities were known as Wells Fargo Asset Management and Wells Fargo Funds Management, LLC, respectively.
28 | Wells Fargo Precious Metals Fund
Board considerations (unaudited)
BOARD CONSIDERATION OF INVESTMENT MANAGEMENT AND SUB-ADVISORY AGREEMENTS:
Board Considerations – Current Agreements
Under the Investment Company Act of 1940 (the “1940 Act”), the Board of Trustees (the “Board”) of Wells Fargo Funds Trust (the “Trust”) must determine annually whether to approve the continuation of the Trust’s investment management and sub-advisory agreements. In this regard, at a Board meeting held on May 17-19, 2021 (the “Meeting”), the Board, all the members of which have no direct or indirect interest in the investment management and sub-advisory agreements and are not “interested persons” of the Trust, as defined in the 1940 Act (the “Independent Trustees”), reviewed and approved for Wells Fargo Precious Metals Fund (the “Fund”): (i) an investment management agreement (the “Management Agreement”) with Wells Fargo Funds Management, LLC (“Funds Management”); and (ii) an investment sub-advisory agreement (the “Sub-Advisory Agreement”) with Wells Capital Management Incorporated (the “Sub-Adviser”), an affiliate of Funds Management. The Management Agreement and the Sub-Advisory Agreement are collectively referred to as the “Advisory Agreements.”
The Board noted that Wells Fargo & Company recently announced that it had entered into a definitive agreement to sell Wells Fargo Asset Management (“WFAM”), which includes Funds Management and the Sub-Adviser, to GTCR LLC and Reverence Capital Partners, L.P. and/or their affiliates (the “Transaction”). The Board further noted that the Transaction would result in a change-of-control of Funds Management and the Sub-Adviser, which would be considered to be an assignment that would result in the termination of the Advisory Agreements. In light of the Transaction, the Board separately considered for approval a new investment management agreement with Funds Management and a new sub-advisory agreement with the Sub-Adviser (the “New Agreements”) that would replace the Advisory Agreements upon consummation of the Transaction, subject to approval of the New Agreements by the Fund’s shareholders. The Board also considered for approval interim agreements to go into effect in the event shareholders do not approve the New Agreements before the Transaction is completed. The interim agreements would allow the Manager and the Sub-Adviser to continue providing services to the Fund while the Fund continues to seek shareholder approval of the New Agreements. The Board noted that the terms of the interim agreements would be identical to those of the current Advisory Agreements, except for the term and certain escrow provisions.
At the Meeting, the Board considered the factors and reached the conclusions described below relating to the selection of Funds Management and the Sub-Adviser and the approval of the Advisory Agreements. Prior to the Meeting, including at Board meetings held in April and May 2021, the Trustees conferred extensively among themselves and with representatives of Funds Management about these matters. Also, the Board has adopted a team-based approach, with each team consisting of a sub-set of Trustees, to assist the full Board in the discharge of its duties in reviewing investment performance and other matters throughout the year. The Independent Trustees were assisted in their evaluation of the Advisory Agreements by independent legal counsel, from whom they received separate legal advice and with whom they met separately.
In providing information to the Board, Funds Management and the Sub-Adviser were guided by a detailed set of requests for information submitted to them by independent legal counsel on behalf of the Independent Trustees at the start of the Board’s annual contract renewal process earlier in 2021. In considering and approving the Advisory Agreements, the Trustees considered the information they believed relevant, including but not limited to the information discussed below. The Board considered not only the specific information presented in connection with the Meeting, but also the knowledge gained over time through interaction with Funds Management and the Sub-Adviser about various topics. In this regard, the Board reviewed reports of Funds Management at each of its quarterly meetings, which included, among other things, portfolio reviews and investment performance reports. In addition, the Board and the teams mentioned above confer with portfolio managers at various times throughout the year. The Board did not identify any particular information or consideration that was all-important or controlling, and each individual Trustee may have attributed different weights to various factors.
After its deliberations, the Board unanimously determined that the compensation payable to Funds Management and the Sub-Adviser under each of the Advisory Agreements was reasonable, and approved the continuation of the Advisory Agreements for a one-year term. The Board considered the approval of the Advisory Agreements for the Fund as part of its consideration of agreements for funds across the complex, but its approvals were made on a fund-by-fund basis. The following summarizes a number of important, but not necessarily all, factors considered by the Board in support of its approvals.
Nature, extent and quality of services
The Board received and considered various information regarding the nature, extent and quality of services provided to the Fund by Funds Management and the Sub-Adviser under the Advisory Agreements. This information included a description of the investment advisory services and Fund-level administrative services covered by the Management Agreement, as well as, among other things, a summary of the background and experience of senior management of WFAM, of which Funds Management and the Sub-Adviser are a part, and a summary of investments made in the business of WFAM. The Board also received a description of
Wells Fargo Precious Metals Fund | 29
Board considerations (unaudited)
Funds Management’s and the Sub-Adviser’s business continuity plans, including a summary of the performance of such plans and any changes thereto during the COVID-19 pandemic, and of their approaches to data privacy and cybersecurity. The Board also received and reviewed information about Funds Management’s role as administrator of the Fund’s liquidity risk management program, Funds Management’s approach to risk management, and Funds Management’s intermediary and vendor oversight program.
The Board also considered the qualifications, background, tenure and responsibilities of each of the portfolio managers primarily responsible for the day-to-day portfolio management of the Fund. The Board evaluated the ability of Funds Management and the Sub-Adviser to attract and retain qualified investment professionals, including research, advisory and supervisory personnel.
The Board further considered the compliance programs and compliance records of Funds Management and the Sub-Adviser. In addition, the Board took into account the full range of services provided to the Fund by Funds Management and its affiliates. The Board also considered information about retention and back-up arrangements that have been put into place with respect to key personnel of WFAM in connection with the anticipated Transaction, noting that WFAM provided assurances that the announcement and eventual culmination of the Transaction is not expected to result in any diminution in the nature or quality of services provided to the Fund.
Fund investment performance and expenses
The Board considered the investment performance results for the Fund over various time periods ended December 31, 2020. The Board considered these results in comparison to the investment performance of funds in a universe that was determined by Broadridge Inc. (“Broadridge”) to be similar to the Fund (the “Universe”), and in comparison to the Fund’s benchmark index and to other comparative data. Broadridge is an independent provider of investment company data. The Board received a description of the methodology used by Broadridge to select the mutual funds in the performance Universe. The Board noted that the investment performance of the Fund (Class A) was lower than the average investment performance of the Universe for all periods under review except the ten-year period. The Board also noted that the investment performance of the Fund was lower than its benchmark index, the FTSE Gold Mines Index, for all periods under review except the ten-year period.
The Board received information concerning, and discussed factors contributing to, the underperformance of the Fund relative to the Universe and benchmark index for the periods identified above. The Board took note of the explanations for the relative underperformance during these periods, including with respect to investment decisions and market factors that affected the Fund’s investment performance. The Board also took note of the Fund’s outperformance relative to the Universe and benchmark index over the ten-year period.
The Board also received and considered information regarding the Fund’s net operating expense ratios and their various components, including actual management fees, custodian and other non-management fees, and Rule 12b-1 and non-Rule 12b-1 shareholder service fees. The Board considered these ratios in comparison to the median ratios of funds in class-specific expense groups that were determined by Broadridge to be similar to the Fund (the “Groups”). The Board received a description of the methodology used by Broadridge to select the mutual funds in the expense Groups and an explanation of how funds comprising expense groups and their expense ratios may vary from year-to-year. Based on the Broadridge reports, the Board noted that the net operating expense ratios of the Fund were lower than the median net operating expense ratios of the expense Groups for each share class.
The Board took into account the Fund’s investment performance and expense information provided to it among the factors considered in deciding to re-approve the Advisory Agreements.
Investment management and sub-advisory fee rates
The Board reviewed and considered the contractual fee rates payable by the Fund to Funds Management under the Management Agreement, as well as the contractual fee rates payable by the Fund to Funds Management for class-level administrative services under a Class-Level Administration Agreement, which include, among other things, class-level transfer agency and sub-transfer agency costs (collectively, the “Management Rates”). The Board also reviewed and considered the contractual investment sub-advisory fee rates that are payable by Funds Management to the Sub-Adviser for investment sub-advisory services.
Among other information reviewed by the Board was a comparison of the Fund’s Management Rates with the average contractual investment management fee rates of funds in the expense Groups at a common asset level as well as transfer agency costs of the funds in the expense Groups. The Board noted that the Management Rates of the Fund were lower than the sum of these average rates for the Fund’s expense Groups for all share classes.
The Board also received and considered information about the portion of the total management fee that was retained by Funds Management after payment of the fee to the Sub-Adviser for sub-advisory services. In assessing the reasonableness of this amount, the Board received and evaluated information about the nature and extent of responsibilities retained and risks assumed
30 | Wells Fargo Precious Metals Fund
Board considerations (unaudited)
by Funds Management and not delegated to or assumed by the Sub-Adviser, and about Funds Management’s on-going oversight services. Given the affiliation between Funds Management and the Sub-Adviser, the Board ascribed limited relevance to the allocation of fees between them.
The Board also received and considered information about the nature and extent of services offered and fee rates charged by Funds Management and the Sub-Adviser to other types of clients with investment strategies similar to those of the Fund. In this regard, the Board received information about the significantly greater scope of services, and compliance, reporting and other legal burdens and risks of managing proprietary mutual funds compared with those associated with managing assets of other types of clients, including third-party sub-advised fund clients and non-mutual fund clients such as institutional separate accounts.
Based on its consideration of the factors and information it deemed relevant, including those described here, the Board determined that the compensation payable to Funds Management under the Management Agreement and to the Sub-Adviser under the Sub-Advisory Agreement was reasonable.
Profitability
The Board received and considered information concerning the profitability of Funds Management, as well as the profitability of both WFAM and Wells Fargo & Co. (“Wells Fargo”) from providing services to the fund family as a whole. The Board noted that the Sub-Adviser’s profitability information with respect to providing services to the Fund and other funds in the family was subsumed in the WFAM and Wells Fargo profitability analysis.
Funds Management reported on the methodologies and estimates used in calculating profitability, including a description of the methodology used to allocate certain expenses. Among other things, the Board noted that the levels of profitability reported on a fund-by-fund basis varied widely, depending on factors such as the size, type and age of fund.
Based on its review, the Board did not deem the profits reported by Funds Management, WFAM or Wells Fargo from services provided to the Fund to be at a level that would prevent it from approving the continuation of the Advisory Agreements.
Economies of scale
The Board received and considered information about the potential for Funds Management to experience economies of scale in the provision of management services to the Fund, the difficulties of calculating economies of scale at an individual fund level, and the extent to which potential scale benefits are shared with Fund shareholders. The Board noted the existence of breakpoints in the Fund’s management fee structure, which operate generally to reduce the Fund’s expense ratios as the Fund grows in size, and the size of the Fund in relation to such breakpoints. The Board considered that in addition to management fee breakpoints, Funds Management shares potential economies of scale from its management business in a variety of ways, including through fee waiver and expense reimbursement arrangements, competitive management fee rates set at the outset without regard to breakpoints, and investments in the business intended to enhance services available to shareholders.
The Board concluded that Funds Management’s arrangements with respect to the Fund, including contractual breakpoints, constituted a reasonable approach to sharing potential economies of scale with the Fund and its shareholders.
Other benefits to Funds Management and the Sub-Adviser
The Board received and considered information regarding potential “fall-out” or ancillary benefits received by Funds Management and its affiliates, including the Sub-Adviser, as a result of their relationships with the Fund. Ancillary benefits could include, among others, benefits directly attributable to other relationships with the Fund and benefits potentially derived from an increase in Funds Management’s and the Sub-Adviser’s business as a result of their relationships with the Fund. The Board noted that various affiliates of Funds Management may receive distribution-related fees, shareholder servicing payments and sub-transfer agency fees in respect of shares sold or held through them and services provided.
The Board also reviewed information about soft dollar credits earned and utilized by the Sub-Adviser, fees earned by Funds Management and the Sub-Adviser from managing a private investment vehicle for the fund family’s securities lending collateral, and commissions earned by an affiliated broker from portfolio transactions.
Based on its consideration of the factors and information it deemed relevant, including those described here, the Board did not find that any ancillary benefits received by Funds Management and its affiliates, including the Sub-Adviser, were unreasonable.
Conclusion
At the Meeting, after considering the above-described factors and based on its deliberations and its evaluation of the information described above, the Board unanimously determined that the compensation payable to Funds Management and the Sub-Adviser under each of the Advisory Agreements was reasonable, and approved the continuation of the Advisory Agreements for a one-year term.
Wells Fargo Precious Metals Fund | 31
Board considerations (unaudited)
Board Considerations – New Agreements
Overview of the Board evaluation process
At a meeting held on May 17-19, 2021 (the “Board Meeting”), the Board of Trustees (the “Board”) of Wells Fargo Funds Trust (the “Trust”, and the series identified below, the “Funds”) approved the continuation of each Fund’s current Investment Management Agreement (the “Current Investment Management Agreement”) and the current Sub-Advisory Agreements (the “Current Sub-Advisory Agreements”, and collectively, the “Current Agreements”).
| Wells Fargo Adjustable Rate Government Fund |
| Wells Fargo Asset Allocation Fund |
| Wells Fargo Conservative Income Fund |
| Wells Fargo Diversified Capital Builder Fund |
| Wells Fargo Diversified Income Builder Fund |
| Wells Fargo Emerging Markets Equity Fund |
| Wells Fargo Emerging Markets Equity Income Fund |
| Wells Fargo Global Small Cap Fund |
| Wells Fargo Government Securities Fund |
| Wells Fargo High Yield Bond Fund |
| Wells Fargo Income Plus Fund |
| Wells Fargo Index Asset Allocation Fund |
| Wells Fargo International Bond Fund |
| Wells Fargo International Equity Fund |
| Wells Fargo Precious Metals Fund |
| Wells Fargo Short Duration Government Bond Fund |
| Wells Fargo Short-Term Bond Plus Fund |
| Wells Fargo Short-Term High Yield Bond Fund |
| Wells Fargo Ultra Short-Term Income Fund |
| Wells Fargo Utility and Telecommunications Fund |
Each Trustee on the Board is not an “interested person” (as defined in the Investment Company Act of 1940 (the “1940 Act”)) of the Funds (collectively, the “Independent Trustees”). The process followed by the Board in considering and approving the continuation of the Current Agreements is referred to herein as the “2021 Annual Approval Process.”
As noted above, the closing of the sale of Wells Fargo Asset Management (“WFAM”) to a holding company (“NewCo”) affiliated with private funds of GTCR LLC (“GTCR”) and of Reverence Capital Partners, L.P. (“Reverence Capital”, and such transaction, the “Transaction”) will result in a change of control of Wells Fargo Funds Management LLC (“Funds Management”), Wells Capital Management Incorporated (“Wells Capital”) and Wells Fargo Asset Management (International) Limited (“WFAM(I) Ltd.”, and together with Funds Management and Wells Capital, the “Advisers”), which will be considered to be an “assignment” of each Fund’s Current Agreements under the 1940 Act that will result in the automatic termination of each Fund’s Current Agreements. In light of the expected termination of each Fund’s Current Agreements upon the closing, at the Board Meeting the Board also considered and approved the New Agreements, which are: (i) a new Investment Management Agreement (the “New Investment Management Agreement”) between the Trust, on behalf of each Fund, and Funds Management; (ii) a new Sub-Advisory Agreement (the “New Wells Capital Sub-Advisory Agreement”) among the Trust, on behalf of each Fund other than International Bond Fund, Funds Management and Wells Capital; and (iii) Sub-Advisory Agreement (the “New WFAM(I) Ltd Sub-Advisory Agreement”, and collectively, the “New Agreements”) among the Trust, on behalf of International Bond Fund, Funds Management and WFAM(I) Ltd (together with Wells Capital, the “Sub-Advisers”) with respect to International Bond Fund, each of which is intended to go into effect upon the closing. The process followed by the Board in reviewing and approving the New Agreements is referred to herein as the “New Agreement Approval Process.”
At a series of meetings held in April and May 2021 (collectively, “April and May 2021 Meetings”) and at the Board Meeting, the Trustees conferred extensively among themselves and with senior representatives of Funds Management, GTCR and Reverence Capital about the New Agreements and related matters. The Board reviewed and discussed information furnished by Funds Management, GTCR and Reverence Capital that the Board considered reasonably necessary to evaluate the terms of the New Agreements and the services to be provided. At these meetings, senior representatives from Funds Management, GTCR and Reverence Capital made presentations to, and responded to questions from, the Board.
In providing information to the Board in connection with the 2021 annual approval process for the Current Agreements (the “2021 Annual Approval Process”) and the New Agreement Approval Process, Funds Management, GTCR and Reverence Capital (as
32 | Wells Fargo Precious Metals Fund
Board considerations (unaudited)
applicable) were guided by requests for information submitted by independent legal counsel on behalf of the Independent Trustees. In considering and approving the New Agreements, the Trustees considered the information they believed relevant, including but not limited to the information discussed herein. The Board considered not only the specific information presented in connection with the April and May 2021 Meetings as well as the Board Meeting, but also the knowledge gained over time through interaction with Funds Management and the Sub-Advisers about various topics. In this regard, the Board reviews reports of Funds Management at each of its regular Board meetings, which includes, among other things, portfolio reviews and investment performance reports. In addition, the Board confers with portfolio managers at various times throughout the year. The Board was assisted in its evaluation of the New Agreements by independent legal counsel, from whom the Independent Trustees received separate legal advice and with whom the Independent Trustees met separately. The Board did not identify any particular information or consideration that was all-important or controlling, and each individual Trustee may have attributed different weights to various factors.
Among other information considered by the Board in connection with the Transaction was:
| ■ | Information regarding the Transaction: information about the structure, financing sources and material terms and conditions of the Transaction, including the expected impact on the businesses conducted by the Advisers and by Wells Fargo Funds Distributor LLC, as the distributor of Fund shares. |
| ■ | Information regarding NewCo, GTCR and Reverence Capital: (i) information about NewCo, including information about its expected financial condition and access to capital, and senior leadership team; (ii) the experience of senior management at GTCR and Reverence Capital in acquiring portfolio companies; (iii) the plan to operationalize NewCo, including the transition of necessary infrastructure services through a transition services agreement with Wells Fargo under which Wells Fargo will continue to provide NewCo with certain services for a specified period of time after the closing; and (iv) information regarding regulatory matters, compliance, and risk management functions at NewCo, including resources to be dedicated thereto. |
| ■ | Impact of the Transaction on WFAM and Service Providers: (i) information regarding any changes to personnel and/or other resources of the Advisers as a result of the Transaction, including assurances regarding comparable and competitive compensation arrangements to attract and retain highly qualified personnel; and (ii) information about the organizational and operating structure with respect to NewCo, the Advisers and the Funds. |
| ■ | Impact of the Transaction on the Funds and their Shareholders: (i) information regarding anticipated benefits to the Funds as a result of the Transaction; (ii) a commitment that the Funds would not bear any expenses, directly or indirectly, in connection with the Transaction; (iii) confirmation that the Advisers intend to continue to manage the Funds in a manner consistent with each Fund’s current investment objectives and principal investments strategies; and (iv) a commitment that neither NewCo nor WFAM will take any steps that would impose any “unfair burden” (as that term is used in section 15(f)(1)(B) of the 1940 Act) on the Funds as a result of the Transaction. |
With respect to the New Agreements, the Board considered: (i) a representation that, after the closing, all of the Funds will continue to be managed and advised by their current Advisers, and that the same portfolio managers of the Sub-Advisers are expected to continue to manage the Funds after the Transaction; (ii) information regarding the terms of the New Agreements, including changes as compared to the Current Agreements; (iii) information confirming that the fee rates payable under the New Agreements will not increase as a result of the Transaction as compared to the rates under the Current Agreements; and (iv) assurances that the Transaction is not expected to cause any diminution with respect to the nature, extent and quality of any of the services currently provided to the Funds by the Advisers as a result of the Transaction.
In addition to considering information furnished specifically to evaluate the impact of the Transaction on the Funds and their respective shareholders in connection with the New Agreement Approval Process, the Board considered information furnished at prior meetings of the Board and its committees, including detailed information provided in connection with the 2021 Annual Approval Process. In this regard, in connection with the 2021 Annual Approval Process, the Board received information about complex-wide and individual Fund performance, fees and expenses, including: (i) a report from an independent data provider comparing the investment performance of each Fund to the investment performance of comparable funds and benchmark indices, over various time periods; (ii) a report from an independent data provider comparing each Fund’s total expense ratio (and its components) to those of comparable funds; (iii) comparative information concerning the fees charged and services provided by the Advisers to each Fund in managing other accounts (which may include other mutual funds, collective investment funds and institutional accounts), if any, that employ investment strategies and techniques similar to those used in managing such Fund(s); and (iv) profitability analyses of Funds Management, as well as the profitability of both WFAM and Wells Fargo from providing services to the fund family as a whole.
After its deliberations, the Board unanimously determined that the compensation payable to Funds Management and the Sub-Advisers under the New Agreements is reasonable, approved the New Agreements for a two-year term, and voted to recommend
Wells Fargo Precious Metals Fund | 33
Board considerations (unaudited)
that Fund shareholders approve the New Agreements. The Board considered the approval of the New Agreements as part of its consideration of agreements for funds across the complex, but its approvals were made on a fund-by-fund basis. The following summarizes a number of important, but not necessarily all, factors considered by the Board in support of its approvals.
Nature, extent and quality of services
In connection with the 2021 Annual Approval Process, the Board received and considered various information regarding the nature, extent and quality of services provided to the Fund by Funds Management and the Sub-Advisers under the Advisory Agreements. This information included a description of the investment advisory services and Fund-level administrative services covered by the Current Management Agreement, as well as, among other things, a summary of the background and experience of senior management of WFAM, of which Funds Management and the Sub-Advisers are a part, and a summary of investments made in the business of WFAM. The Board also received a description of Funds Management’s and the Sub-Advisers’ business continuity plans, including a summary of the performance of such plans and any changes thereto during the COVID-19 pandemic, and of their approaches to data privacy and cybersecurity. The Board also received and reviewed information about Funds Management’s role as administrator of the Funds’ liquidity risk management program, Funds Management’s approach to risk management, and Funds Management’s intermediary and vendor oversight program.
In connection with the 2021 Annual Approval Process, the Board also considered the qualifications, background, tenure and responsibilities of each of the portfolio managers primarily responsible for the day-to-day portfolio management of the Funds. The Board evaluated the ability of Funds Management and the Sub-Advisers to attract and retain qualified investment professionals, including research, advisory and supervisory personnel.
In connection with the 2021 Annual Approval Process, the Board further considered the compliance programs and compliance records of Funds Management and the Sub-Advisers. In addition, the Board took into account the full range of services provided to the Fund by Funds Management and its affiliates.
In connection with the New Agreement Approval Process, the Board considered, among other information, the structure of the Transaction and expected impact, if any, of the Transaction on the operations, facilities, organization and personnel of the Advisers. The Board received assurances from Funds Management that each Fund will continue to be advised by its current Sub-Adviser after the closing, and that the same individual portfolio managers are expected to continue to manage the Funds after the closing. With respect to the recruitment and retention of key personnel, the Board noted information from GTCR, Reverence Capital and the Advisers regarding the potential benefits for employees of joining NewCo. The Board recognized that the personnel who had been extended offers may not accept such offers and personnel changes may occur in the future in the ordinary course.
In addition, the Board considered information regarding the infrastructure, operational capabilities and support staff in place to assist in the portfolio management and operations of the Funds, including the provision of administrative services, and the anticipated impact of the Transaction on such matters. The Board also considered the business-related and other risks to which the Advisers may be subject in managing the Funds and in connection with the Transaction. The Board also considered the transition and integration plans as a result of the change in ownership of the Advisers from Wells Fargo to NewCo. The Board considered the resources and infrastructure that NewCo intends to devote to its compliance program to ensure compliance with applicable laws and regulations, as well as its risk management program and cybersecurity program. The Board also took into account assurances received from the Advisers, GTCR and Reverence Capital that the Transaction is not expected to cause any diminution in the nature, extent and quality of services provided by the Advisers to the Funds and their shareholders.
Fund investment performance and expenses
In connection with the 2021 Annual Approval Process, the Board considered the investment performance results for each Fund over various time periods ended December 31, 2020. The Board considered these results in comparison to the investment performance of funds in a universe that was determined by Broadridge Inc. (“Broadridge”) to be similar to each Fund (the “Universe”), and in comparison to each Fund’s benchmark index and to other comparative data. Broadridge is an independent provider of investment company data. The Board received a description of the methodology used by Broadridge to select the mutual funds in the performance Universe. Where applicable, the Board received information concerning, and discussed factors contributing to, underperformance of Funds relative to the Universe and benchmark for any underperformance periods.
In connection with the 2021 Annual Approval Process, the Board also received and considered information regarding each Fund’s net operating expense ratios and their various components, including actual management fees, custodian and other non-management fees, and Rule 12b-1 and non-Rule 12b-1 shareholder service fees. The Board considered these ratios in comparison to the median ratios of funds in class-specific expense groups that were determined by Broadridge to be similar to the Fund (the “Groups”). The Board received a description of the methodology used by Broadridge to select the mutual funds in the expense Groups and an explanation of how funds comprising expense groups and their expense ratios may vary from year-to-year.
34 | Wells Fargo Precious Metals Fund
Board considerations (unaudited)
In connection with the New Agreement Approval Process, the Board received a commitment that WFAM will maintain fee and expense commitments for at least two years after the closing. The Board took into account each Fund’s investment performance and expense information among the factors considered in deciding to approve the New Agreements.
Investment management and sub-advisory fee rates
In connection with the 2021 Annual Approval Process, the Board reviewed and considered the contractual fee rates payable by each Fund to Funds Management under the Current Management Agreement, as well as the contractual fee rates payable by each Fund to Funds Management for class-level administrative services under a Class-Level Administration Agreement, which include, among other things, class-level transfer agency and sub-transfer agency costs (collectively, the “Management Rates”). The Board also reviewed and considered the contractual investment sub-advisory fee rates that are payable by Funds Management to each of the Sub-Advisers under the Current Sub-Advisory Agreements for investment sub-advisory services (the “Sub-Advisory Fee Rates”).
Among other information reviewed by the Board in connection with the 2021 Annual Approval Process, was a comparison of each Fund’s Management Rates with the average contractual investment management fee rates of funds in the expense Groups at a common asset level as well as transfer agency costs of the funds in the expense Groups.
In connection with the 2021 Annual Approval Process, the Board also received and considered information about the portion of the total management fee that was retained by Funds Management after payment of the Sub-Advisory Fee Rates. In assessing the reasonableness of this amount, the Board received and evaluated information about the nature and extent of responsibilities retained and risks assumed by Funds Management and not delegated to or assumed by the Sub-Advisers, and about Funds Management’s on-going oversight services. Given the affiliation between Funds Management and the Sub-Advisers, the Board ascribed limited relevance to the allocation of fees between them.
In connection with the 2021 Annual Approval Process, the Board also received and considered information about the nature and extent of services offered and fee rates charged by Funds Management and the Sub-Advisers to other types of clients, if any, with investment strategies similar to those of each Fund. In this regard, the Board received information about the significantly greater scope of services, and compliance, reporting and other legal burdens and risks of managing proprietary mutual funds compared with those associated with managing assets of other types of clients, including third-party sub-advised fund clients and non-mutual fund clients such as institutional separate accounts.
In connection with the New Agreement Approval Process, the Board noted the assurances received by it that there would be no increases to any of the Management Rates or the Sub-Advisory Fee Rates as a result of the Transaction. The Board also considered that the New Agreements do not change the computation method for calculating such fees, and there is no present intention to reduce expense waiver and reimbursement arrangements that are currently in effect. Based on its consideration of the factors and information it deemed relevant, including those described here, the Board determined that the compensation payable to Funds Management under the New Management Agreement and to each of the Sub-Advisers under the New Sub-Advisory Agreements was reasonable.
Profitability
In connection with the 2021 Annual Approval Process, the Board received and considered information concerning the profitability of Funds Management, as well as the profitability of both WFAM and Wells Fargo from providing services to the fund family as a whole. The Board noted that the Sub-Advisers’ profitability information with respect to providing services to each Fund and other funds in the family was subsumed in the WFAM and Wells Fargo profitability analysis.
Funds Management reported on the methodologies and estimates used in calculating profitability in connection with the 2021 Annual Approval Process, including a description of the methodology used to allocate certain expenses. Among other things, the Board noted that the levels of profitability reported on a fund-by-fund basis varied widely, depending on factors such as the size, type and age of fund.
In connection with the New Agreement Approval Process, the Board received certain information about NewCo’s projected financial condition, and reviewed with senior representatives of Funds Management, GTCR and Reverence Capital the underlying assumptions on which such information was based. The Board considered that NewCo is a newly formed entity, with no historical operations, revenues or expenses, and that it is difficult to predict with any degree of certainty the future profitability of NewCo and the Advisers from advisory activities under the New Agreements. The Board considered that the fee rates payable under the New Agreements will not increase as a result of the Transaction as compared to the rates under the Current Agreements, and that the current contractual expense limitations applicable to each Fund will not increase. The Board noted that if the New Agreements are approved by shareholders and the Transaction closes, the Board will have the opportunity in the future to review the profitability of NewCo and the Advisers from advisory activities under the New Agreements.
Wells Fargo Precious Metals Fund | 35
Board considerations (unaudited)
Economies of scale
In connection with the 2021 Annual Approval Process, the Board received and considered information about the potential for Funds Management to experience economies of scale in the provision of management services to the Funds, the difficulties of calculating economies of scale at an individual fund level, and the extent to which potential scale benefits are shared with Fund shareholders. The Board noted the existence of breakpoints in each Fund’s management fee structure, which operate generally to reduce the Fund’s expense ratios as the Fund grows in size, and the size of the Fund in relation to such breakpoints. The Board considered that, in addition to management fee breakpoints, Funds Management shares potential economies of scale from its management business in a variety of ways, including through fee waiver and expense reimbursement arrangements, competitive management fee rates set at the outset without regard to breakpoints, and investments in the business intended to enhance services available to shareholders.
In connection with the New Agreement Approval Process, the Board noted that NewCo and the Advisers may benefit from possible growth of the Funds resulting from enhanced distribution capabilities. However, the Board noted that other factors could also affect the potential for economies of scale, and that it was not possible to quantify any potential future economies of scale. Based upon the information furnished to the Board in connection with the 2021 Annual Approval Process and the New Agreement Approval Process, the Board concluded that Funds Management’s arrangements with respect to each Fund, including contractual breakpoints and expense limitation arrangements, constituted a reasonable approach to sharing potential economies of scale with the Fund and its shareholders.
“Fall-out” benefits to Funds Management and the Sub-Advisers
In connection with the 2021 Annual Approval Process, the Board received and considered information regarding potential “fall-out” or ancillary benefits received by Funds Management and its affiliates, including the Sub-Advisers, as a result of their relationships with the Funds. Ancillary benefits could include, among others, benefits directly attributable to other relationships with the Funds and benefits potentially derived from an increase in Funds Management’s and the Sub-Advisers’ business as a result of their relationships with the Funds. The Board noted that various current affiliates of Funds Management may receive distribution-related fees, shareholder servicing payments and sub-transfer agency fees in respect of shares sold or held through them and services provided.
In connection with the 2021 Annual Approval Process, the Board also reviewed information about soft dollar credits earned and utilized by the Sub-Advisers, fees earned by Funds Management and Wells Capital from managing a private investment vehicle for the fund family’s securities lending collateral, and commissions earned by an affiliated broker of Wells Fargo from portfolio transactions.
In connection with the New Agreement Approval Process, the Board received information to the effect that the Transaction is not expected to have a material impact on the fall-out benefits currently realized by Funds Management and its affiliates, including the Sub-Advisers. The information reviewed by the Board also noted that several of the ancillary benefits identified for WFAM would be potential ancillary benefits for NewCo, including that the scale and reputation of the Funds might benefit NewCo’s broader reputation, product initiatives, technology investment and talent acquisition. Based on its consideration of the factors and information it deemed relevant, including those described here, the Board did not find that any ancillary benefits expected to be received by Funds Management and its affiliates, including NewCo and the Sub-Advisers, under the New Agreements were unreasonable.
Conclusion
At the Board Meeting, after considering the above-described factors and based on its deliberations and its evaluation of the information described above, the Board unanimously determined that the compensation payable to Funds Management and to each of the Sub-Advisers under the New Agreements is reasonable, approved the New Agreements for a two-year term, and voted to recommend that Fund shareholders approve the New Agreements.
36 | Wells Fargo Precious Metals Fund
Board considerations (unaudited)
Board Considerations - Interim Agreements
At a meeting held on May 17-19, 2021 (the “Board Meeting”), the Boards of Trustees (each, a “Board”, and collectively, the “Boards”) of Wells Fargo Funds Trust, Wells Fargo Master Trust, Wells Fargo Variable Trust, Wells Fargo Global Dividend Opportunity Fund, Wells Fargo Income Opportunities Fund, Wells Fargo Multi-Sector Income Fund and Wells Fargo Utilities and High Income Fund (each a “Trust”, and the series thereof, a “Fund”) reviewed and approved for the Trusts and Funds, as applicable: (i) interim investment management agreements (the “Interim Management Agreements”) with Wells Fargo Funds Management, LLC (“Funds Management”); (ii) interim investment advisory agreements (the “Interim Advisory Agreements”) with Funds Management; and (iii) interim sub-advisory agreements (the “Interim Sub-Advisory Agreements”) with each of Cooke & Bieler, L.P., Galliard Capital Management LLC (“Galliard”), Peregrine Capital Management Inc., Wells Capital Management, LLC (“WellsCap”), and Wells Fargo Asset Management (International) Limited (“WFAMI”, and collectively, the “Sub-Advisers”). Each Trustee on the Board is not an “interested person” (as defined in the Investment Company Act of 1940 (the “1940 Act”) of the Funds (collectively, the “Independent Trustees”). The Interim Management Agreements, Interim Advisory Agreements, and Interim Sub-Advisory Agreements are collectively referred to as the “Interim Advisory Agreements.”
At the Board Meeting, the Boards reviewed and approved the continuation of existing investment management, advisory and sub-advisory agreements (the “Current Advisory Agreements”) for each Trust and Fund, as applicable. The factors considered and conclusions reached by the Boards in approving the Current Advisory Agreements are summarized in the section entitled “Board Considerations – Current Agreements” of this shareholder report. The Boards noted that Wells Fargo & Company has entered into a definitive agreement to sell Wells Fargo Asset Management (“WFAM”), which includes Funds Management, Galliard, WellsCap and WFAMI (the “Affiliated Sub-Advisers”), to a holding company affiliated with private funds of GTCR LLC and Reverence Capital Partners, L.P. (the “Transaction”). The Boards further noted that the Transaction would result in a change-of-control of Funds Management and the Affiliated Sub-Advisers, which would be considered to be an “assignment” under the 1940 Act that would terminate the Current Advisory Agreements. At the Board Meeting, the Boards also reviewed and approved new investment management, advisory and sub-advisory agreements (the “New Advisory Agreements”) for each Trust and Fund, as applicable, that would replace the Current Advisory Agreements upon consummation of the Transaction, subject to approval of the New Advisory Agreements by the applicable Trust’s or Fund’s shareholders. The factors considered and conclusions reached by the Boards in approving the New Advisory Agreements are summarized in the section entitled “Board Considerations – New Agreements” of this shareholder report.
At the Board Meeting, the Boards also approved the Interim Advisory Agreements, which will go into effect for a Trust or Fund only in the event that shareholders of such Trust or Fund do not approve the New Advisory Agreement(s) for the Trust or Fund by the closing date of the Transaction, when the Current Advisory Agreements will terminate. The Board noted that, in such a circumstance, the Interim Advisory Agreements will permit continuity of management by allowing Funds Management and the Sub-Advisers to continue providing services to the Trust or Fund pursuant to the Interim Advisory Agreements while the Trust or Fund continues to solicit shareholder approval of such New Advisory Agreement(s). The Boards noted that the terms of the Interim Advisory Agreements are identical to those of the Current Advisory Agreements, except for the term and the addition of escrow provisions with respect to the advisory fees. The Boards also noted that the entities that would service the Funds and Trusts under the Interim Advisory Agreements are identical to those that provide services under the Current Advisory Agreements and those that will provide services under the New Advisory Agreements.
In approving the Interim Advisory Agreements, the Boards considered the same factors and reached the same conclusions as they considered and reached with respect to the Boards’ approvals of the Current Advisory Agreements and New Advisory Agreements, as applicable, which are described in separate Board Consideration sections within this shareholder report. Prior to the Board Meeting, including at a series of meetings held in April and May 2021, the Trustees conferred extensively among themselves and with senior representatives of Funds Management, GTCR LLC and Reverence Capital Partners, L.P. about the Interim Advisory Agreements and related matters. The Independent Trustees were assisted in their evaluation of the Interim Advisory Agreements by independent legal counsel, from whom they received separate legal advice and with whom they met separately.
At the Board Meeting, after considering the factors and reaching the conclusions described in the separate Board Consideration sections within this shareholder report, the Boards unanimously determined that the compensation payable to Funds Management and to each Sub-Adviser under each of the Interim Advisory Agreements was reasonable, and approved the Interim Advisory Agreements.
Wells Fargo Precious Metals Fund | 37
For more information
More information about Wells Fargo Funds is available free upon request. To obtain literature, please write, visit the Fund's website, or call:
Wells Fargo Funds
P.O. Box 219967
Kansas City, MO 64121-9967
Website: allspringglobal.com
Individual investors: 1-800-222-8222
Retail investment professionals: 1-888-877-9275
Institutional investment professionals: 1-866-765-0778
This report and the financial statements contained herein are submitted for the general information of the shareholders of the Fund. If this report is used for promotional purposes, distribution of the report must be accompanied or preceded by a current prospectus. Before investing, please consider the investment objectives, risks, charges, and expenses of the investment. For a current prospectus and, if available, a summary prospectus, containing this information, call
1-800-222-8222 or visit the Fund's website at allspringglobal.com. Read the prospectus carefully before you invest or send money.
Allspring Global InvestmentsTM is the trade name for the asset management firms of Allspring Global Investments Holdings, LLC, a holding company indirectly owned by certain private funds of GTCR LLC and Reverence Capital Partners, L.P. These firms include but are not limited to Allspring Global Investments, LLC, and Allspring Funds Management, LLC. Certain products managed by Allspring entities are distributed by Allspring Funds Distributor, LLC (a broker-dealer and Member FINRA/SIPC).
This material is for general informational and educational purposes only and is NOT intended to provide investment advice or a recommendation of any kind - including a recommendation for any specific investment, strategy, or plan.
© 2021 Allspring Global Investments. All rights reserved.
PAR-1121-00202 09-21
SA316/SAR316 09-21
Semi-Annual Report
September 30, 2021
Wells Fargo
Specialized Technology Fund
The views expressed and any forward-looking statements are as of September 30, 2021, unless otherwise noted, and are those of the Fund's portfolio managers and/or Allspring Global Investments. Discussions of individual securities or the markets generally are not intended as individual recommendations. Future events or results may vary significantly from those expressed in any forward-looking statements. The views expressed are subject to change at any time in response to changing circumstances in the market. Allspring Global Investments disclaims any obligation to publicly update or revise any views expressed or forward-looking statements.
Wells Fargo Specialized Technology Fund | 1
Letter to shareholders (unaudited)
Andrew Owen
President
Wells Fargo Funds
Dear Shareholder:
We are pleased to offer you this semi-annual report for Wells Fargo Specialized Technology Fund for the six-month period that ended September 30, 2021. Global stocks continued to rally as the global economy continued to emerge from the haze of COVID-19. Tailwinds were provided by global stimulus programs, a rapid vaccination rollout, and recovering consumer and corporate sentiment. Bonds were mixed during the period, with municipal bonds and high-yield bonds delivering positive returns.
For the six-month period, U.S. stocks, based on the S&P 500 Index,1 gained 9.18%. International stocks, as measured by the MSCI ACWI ex USA Index (Net),2 returned 2.32%, while the MSCI EM Index (Net),3 trailed its developed market counterparts with a 3.45% loss. Among bond indexes, the Bloomberg U.S. Aggregate Bond Index,4 returned 1.88%, the Bloomberg Global Aggregate ex-USD Index (unhedged),5 returned -0.69%, the Bloomberg Municipal Bond Index6 returned 1.15%, and the ICE BofA U.S. High Yield Index,7 gained 3.74%.
Vaccination rollout drove the stock markets to new highs.
Equity markets produced another strong showing in April. Domestically, the continued reopening of the economy had a strong impact on positive equity performance, as people started leaving their households and jobless claims continued to fall. Domestic corporate bonds performed well and the U.S. dollar weakened. Meanwhile, the U.S. government continued to seek to invest in the recovery, this time by outlining a package of over $2 trillion to improve infrastructure. The primary headwind in April was inflation, as investors tried to determine the breadth and longevity of recent price increases. Developed Europe has been supported by a meaningful increase in the pace of vaccinations. Unfortunately many emerging market countries have not been as successful. India in particular saw COVID-19 cases surge, serving as an example of the need to get vaccinations rolled out to less developed nations.
| 1 | The S&P 500 Index consists of 500 stocks chosen for market size, liquidity, and industry group representation. It is a market-value-weighted index with each stock's weight in the index proportionate to its market value. You cannot invest directly in an index. |
| 2 | The Morgan Stanley Capital International (MSCI) All Country World Index (ACWI) ex USA Index (Net) is a free-float-adjusted market-capitalization-weighted index that is designed to measure the equity market performance of developed and emerging markets, excluding the U.S. Source: MSCI. MSCI makes no express or implied warranties or representations and shall have no liability whatsoever with respect to any MSCI data contained herein. The MSCI data may not be further redistributed or used as a basis for other indexes or any securities or financial products. This report is not approved, reviewed, or produced by MSCI. You cannot invest directly in an index. |
| 3 | The MSCI Emerging Markets (EM) Index (Net) is a free-float-adjusted market-capitalization-weighted index that is designed to measure equity market performance of emerging markets. You cannot invest directly in an index. |
| 4 | The Bloomberg U.S. Aggregate Bond Index is a broad-based benchmark that measures the investment-grade, U.S.-dollar-denominated, fixed-rate taxable bond market, including Treasuries, government-related and corporate securities, mortgage-backed securities (agency fixed-rate and hybrid adjustable-rate mortgage pass-throughs), asset-backed securities, and commercial mortgage-backed securities. You cannot invest directly in an index. |
| 5 | The Bloomberg Global Aggregate ex-USD Index (unhedged) is an unmanaged index that provides a broad-based measure of the global investment-grade fixed-income markets excluding the U.S.-dollar-denominated debt market. You cannot invest directly in an index. |
| 6 | The Bloomberg Municipal Bond Index is an unmanaged index composed of long-term tax-exempt bonds with a minimum credit rating of Baa. You cannot invest directly in an index. |
| 7 | The ICE BofA U.S. High Yield Index is a market-capitalization-weighted index of domestic and Yankee high-yield bonds. The index tracks the performance of high-yield securities traded in the U.S. bond market. You cannot invest directly in an index. Copyright 2021. ICE Data Indices, LLC. All rights reserved. |
2 | Wells Fargo Specialized Technology Fund
Letter to shareholders (unaudited)
Vaccine rollouts continued in May, leading to loosened restrictions globally. As a result, equity markets in general saw a minor increase in returns. Concerns that the continued economic rebound could result in inflation increases becoming more than transitory were supported by the higher input costs businesses were experiencing. Meanwhile, those inflation concerns were tempered by the U.S. Federal Reserve (Fed), which stayed steady on its view of the economy and eased fears of a sudden and substantial policy change. Positive performance in the emerging market equity space was supported this month by steady consumer demand and strong commodity prices. Fixed-income markets were also slightly positive for the month, driven by inflation uncertainty and a softer U.S. dollar.
June witnessed the S&P 500 Index reach a new all-time high. 2021 economic growth and inflation forecasts were revised higher to reflect a strong economic recovery and some supply and demand imbalances. Late June saw a deal reached on a U.S. infrastructure package of approximately $1 trillion for road, bridge, and broadband network upgrades over the next eight years. The Fed’s June meeting yielded no change to policy, but its projections pointed to a possible interest rate rise in 2023. This, combined with a rebound in economic activity and investors searching for yield, led to U.S. Treasury yields being down for the month. Many European and Asian countries saw vaccination momentum increase, while the U.K. dealt with a rise in COVID-19 infections, specifically the Delta variant. Meanwhile, crude oil jumped over 10% in June on the back of the pickup in global economic activity and the Organization of the Petroleum Exporting Countries’ (OPEC) slow pace of supply growth.
July began the month seeing vaccinations making progress, as several major developed countries eased restrictions, only to be threatened again by the spread of COVID-19’s Delta variant. Inflation continued to climb, aided by the continued supply bottleneck in the face of high demand. As it pertains to the equity area of the market, U.S. equities led the way in positive return territory, followed by international developed markets. In contrast, emerging markets were well in negative territory for the month, hindered by China’s plans for new regulations on a number of sectors, specifically education and technology. The U.S. 10-Year Treasury bond yield continued to decline, as strong demand swallowed up supply. After hitting a multi-year high earlier in the month, oil prices leveled off following an agreement by OPEC to raise oil production starting in August.
The Delta variant of COVID-19 produced outbreaks globally in August, increasing the potential for increased market volatility and bringing into question the ongoing economic recovery. Domestically, the U.S. economy continued to stay strong in the face of the Delta variant, continued inflationary pressures, and worries over Hurricane Ida. Emerging market equities experienced elevated volatility, largely influenced by China’s regulatory stance. Emerging market equities started the month with poor performance but rebounded to end the month in positive territory. Municipal debt experienced its first monthly performance drop since February of this year, slowing a rally that made it one of the best-performing sectors of the bond market. In the commodity segment of the market, crude oil fell sharply during the month on the back of dampened expectations as a result of the Delta variant but was still a leading asset class performer for the year.
Global markets suffered their broadest retreat in a year during September, with the exception of commodities. Concerns over inflation and the interest rate outlook depressed investor confidence and hurt performance. Emerging markets declined on concerns over the continued supply chain disruptions and worries over higher energy and food prices. Meanwhile, the Fed indicated it would slow the pace of asset purchases in the near future (pointing towards November). All eyes domestically are fixed on the raising of the debt ceiling, the 2022 budget plan, and the ongoing debate over the infrastructure package. Contrary to most asset classes, commodities thrived in September, driven by sharply higher energy prices.
“ 2021 economic growth and inflation forecasts were revised higher to reflect a strong economic recovery and some supply and demand imbalances.”
“ Municipal debt experienced its first monthly performance drop since February of this year, slowing a rally that made it one of the best-performing sectors of the bond market.”
Wells Fargo Specialized Technology Fund | 3
Letter to shareholders (unaudited)
Don’t let short-term uncertainty derail long-term investment goals.
Periods of investment uncertainty can present challenges, but experience has taught us that maintaining long-term investment goals can be an effective way to plan for the future. To help you create a sound strategy based on your personal goals and risk tolerance, Wells Fargo Funds offers more than 100 mutual funds spanning a wide range of asset classes and investment styles. Although diversification cannot guarantee an investment profit or prevent losses, we believe it can be an effective way to manage investment risk and potentially smooth out overall portfolio performance. We encourage investors to know their investments and to understand that appropriate levels of risk-taking may unlock opportunities.
On November 1, 2021, GTCR LLC and Reverence Capital Partners, L.P., announced the beginning of Allspring Global Investments™, with the close of the transaction to acquire Wells Fargo Funds Management, LLC; Wells Capital Management LLC; Galliard Capital Management LLC.; Wells Fargo Asset Management (International) Ltd.; Wells Fargo Asset Management Luxembourg S.A.; and Wells Fargo Funds Distributor, LLC, as well as Wells Fargo Bank, N.A.’s business of acting as trustee to its collective investment trusts and all related Wells Fargo Asset Management legal entities. The transaction closed on November 1, 2021, forming Allspring Global Investments, LLC, a privately held asset management firm with $587 billion in AUM1 as of September 30, 2021.
Allspring Global Investments™ is a leading independent asset management firm with a full breadth of investment capabilities across diverse asset classes, serving the needs of its institutional and wealth management clients around the world. Allspring operates across 18 offices globally supported by more than 480 investment professionals. Allspring and its investment teams provide a broad range of differentiated investment products and solutions to help its diverse range of clients meet their investment objectives.
As part of this transition, all mutual funds within the Wells Fargo Funds family will be rebranded as Allspring Funds. Each individual fund will have “Wells Fargo” removed from its fund name to be replaced with “Allspring.” The fund name changes are expected to take place on December 6, 2021.
Allspring Global Investments is the trade name for the asset management firms of Allspring Global Investments Holdings, LLC, a holding company indirectly owned by certain private funds of GTCR LLC and Reverence Capital Partners, L.P.
Thank you for choosing to invest with Wells Fargo Funds. We appreciate your confidence in us and remain committed to helping you meet your financial needs.
Sincerely,
Andrew Owen
President
Wells Fargo Funds
For further information about your Fund, contact your investment professional, visit our website at allspringglobal.com, or call us directly at 1-800-222-8222.
| 1 | As of September 30, 2021, assets under management (AUM) includes $93 billion from Galliard Capital Management, an investment advisor that is not part of the Allspring trade name/GIPS firm. |
4 | Wells Fargo Specialized Technology Fund
This page is intentionally left blank.
Performance highlights (unaudited)
| Investment objective | The Fund seeks long-term capital appreciation. |
| Manager | Allspring Funds Management, LLC |
| Subadviser | Allianz Global Investors U.S., LLC |
| Portfolio managers | Huachen Chen, CFA®‡, Walter C. Price, Jr., CFA®‡, Michael A. Seidenberg |
| Average annual total returns (%) as of September 30, 2021 |
| | | Including sales charge | | Excluding sales charge | | Expense ratios1 (%) |
| | Inception date | 1 year | 5 year | 10 year | | 1 year | 5 year | 10 year | | Gross | Net 2 |
| Class A (WFSTX) | 9-18-2000 | 19.71 | 26.57 | 21.24 | | 27.02 | 28.08 | 21.97 | | 1.36 | 1.36 |
| Class C (WFTCX) | 9-18-2000 | 25.01 | 27.15 | 21.07 | | 26.01 | 27.15 | 21.07 | | 2.11 | 2.11 |
| Administrator Class (WFTDX) | 7-30-2010 | – | – | – | | 27.13 | 28.19 | 22.12 | | 1.28 | 1.28 |
| Institutional Class (WFTIX)3 | 10-31-2016 | – | – | – | | 27.39 | 28.48 | 22.26 | | 1.03 | 1.03 |
| S&P North American Technology Sector Index4 | – | – | – | – | | 31.57 | 27.85 | 23.38 | | – | – |
| S&P 500 Index5 | – | – | – | – | | 30.00 | 16.90 | 16.63 | | – | – |
Figures quoted represent past performance, which is no guarantee of future results, and do not reflect taxes that a shareholder may pay on an investment in a fund. Investment return and principal value of an investment will fluctuate so that an investor’s shares, when redeemed, may be worth more or less than their original cost. Performance shown without sales charges would be lower if sales charges were reflected. Current performance may be lower or higher than the performance data quoted, which assumes the reinvestment of dividends and capital gains. Current month-end performance is available on the Fund’s website, allspringglobal.com.
Please keep in mind that high double-digit returns were primarily achieved during favorable market conditions. You should not expect that such favorable returns can be consistently achieved. A fund’s performance, especially for short time periods, should not be the sole factor in making your investment decision.
While the S&P 500 Index is comprised of U.S. equity securities of companies diversified across eleven sectors, the Fund’s holdings are concentrated primarily in technology related stocks. Therefore, the performance of the S&P 500 Index is displayed only to show how the concentrated Fund performed compared with a diversified selection of U.S. equity securities.
Index returns do not include transaction costs associated with buying and selling securities, any mutual fund fees or expenses, or any taxes. It is not possible to invest directly in an index.
For Class A shares, the maximum front-end sales charge is 5.75%. For Class C shares, the maximum contingent deferred sales charge is 1.00%. Performance including a contingent deferred sales charge assumes the sales charge for the corresponding time period. Administrator Class and Institutional Class shares are sold without a front-end sales charge or contingent deferred sales charge.
| 1 | Reflects the expense ratios as stated in the most recent prospectuses, which include the impact of 0.01% in acquired fund fees and expenses. The expense ratios shown are subject to change and may differ from the annualized expense ratios shown in the financial highlights of this report, which do not include acquired fund fees and expenses. |
| 2 | The manager has contractually committed through July 31, 2022, to waive fees and/or reimburse expenses to the extent necessary to cap total annual fund operating expenses after fee waivers at 1.35% for Class A, 2.10% for Class C, 1.28% for Administrator Class, and 1.03% for Institutional Class. Brokerage commissions, stamp duty fees, interest, taxes, acquired fund fees and expenses (if any), and extraordinary expenses are excluded from the expense caps. Prior to or after the commitment expiration date, the caps may be increased or the commitment to maintain the caps may be terminated only with the approval of the Board of Trustees. Without these caps, the Fund’s returns would have been lower. The expense ratio paid by an investor is the net expense ratio (the total annual fund operating expenses after fee waivers) as stated in the prospectuses. |
| 3 | Historical performance shown for the Institutional Class shares prior to their inception reflects the performance of the Administrator Class shares, and includes the higher expenses applicable to the Institutional Class shares. If these expenses had been included, returns for the Institutional Class shares would be higher. |
| 4 | The S&P North American Technology Sector Index is a modified market-capitalization-weighted index of select technology stocks. You cannot invest directly in an index. |
| 5 | The S&P 500 Index consists of 500 stocks chosen for market size, liquidity, and industry group representation. It is a market-value weighted index with each stock’s weight in the index proportionate to its market value. You cannot invest directly in an index. |
| ‡ | CFA® and Chartered Financial Analyst® are trademarks owned by CFA Institute. |
6 | Wells Fargo Specialized Technology Fund
Performance highlights (unaudited)
Stock values fluctuate in response to the activities of individual companies and general market and economic conditions. Funds that concentrate their investments in limited sectors, such as information technology, are more vulnerable to adverse market, economic, regulatory, political, or other developments affecting those sectors. Certain investment strategies tend to increase the total risk of an investment (relative to the broader market). This fund is exposed to convertible securities risk, foreign investment risk, nondiversification risk, and smaller-company securities risk. Consult the Fund’s prospectus for additional information on these and other risks.
Wells Fargo Specialized Technology Fund | 7
Performance highlights (unaudited)
| Ten largest holdings (%) as of September 30, 20211 |
| Alphabet Incorporated Class C | 5.94 |
| HubSpot Incorporated | 4.64 |
| Apple Incorporated | 4.31 |
| Amazon.com Incorporated | 4.17 |
| MongoDB Incorporated | 4.08 |
| Microsoft Corporation | 3.84 |
| Asana Incorporated Class A | 3.72 |
| Facebook Incorporated Class A | 3.25 |
| Zscaler Incorporated | 2.95 |
| Paycom Software Incorporated | 2.94 |
| 1 | Figures represent the percentage of the Fund's net assets. Holdings are subject to change and may have changed since the date specified. |
| Sector allocation as of September 30, 20211 |
| 1 | Figures represent the percentage of the Fund's long-term investments. These amounts are subject to change and may have changed since the date specified. |
8 | Wells Fargo Specialized Technology Fund
Fund expenses (unaudited)
As a shareholder of the Fund, you incur two types of costs: (1) transaction costs, including sales charges (loads) on purchase payments and contingent deferred sales charges (if any) on redemptions and (2) ongoing costs, including management fees, distribution (12b-1) and/or shareholder servicing fees, and other Fund expenses. This example is intended to help you understand your ongoing costs (in dollars) of investing in the Fund and to compare these costs with the ongoing costs of investing in other mutual funds.
The example is based on an investment of $1,000 invested at the beginning of the six-month period and held for the entire period from April 1, 2021 to September 30, 2021.
Actual expenses
The “Actual” line of the table below provides information about actual account values and actual expenses. You may use the information in this line, together with the amount you invested, to estimate the expenses that you paid over the period. Simply divide your account value by $1,000 (for example, an $8,600 account value divided by $1,000 = 8.6), then multiply the result by the number in the “Actual” line under the heading entitled “Expenses paid during period” for your applicable class of shares to estimate the expenses you paid on your account during this period.
Hypothetical example for comparison purposes
The “Hypothetical” line of the table below provides information about hypothetical account values and hypothetical expenses based on the Fund’s actual expense ratio and an assumed rate of return of 5% per year before expenses, which is not the Fund’s actual return. The hypothetical account values and expenses may not be used to estimate the actual ending account balance or expenses you paid for the period. You may use this information to compare the ongoing costs of investing in the Fund and other funds. To do so, compare this 5% hypothetical example with the 5% hypothetical examples that appear in the shareholder reports of the other funds.
Please note that the expenses shown in the table are meant to highlight your ongoing costs only and do not reflect any transactional costs, such as sales charges (loads) and contingent deferred sales charges. Therefore, the “Hypothetical” line of the table is useful in comparing ongoing costs only, and will not help you determine the relative total costs of owning different funds. In addition, if these transactional costs were included, your costs would have been higher.
| | Beginning
account value
4-1-2021 | Ending
account value
9-30-2021 | Expenses
paid during
the period1 | Annualized net
expense ratio |
| Class A | | | | |
| Actual | $1,000.00 | $1,094.34 | $ 6.98 | 1.33% |
| Hypothetical (5% return before expenses) | $1,000.00 | $1,018.40 | $ 6.73 | 1.33% |
| Class C | | | | |
| Actual | $1,000.00 | $1,090.19 | $10.95 | 2.09% |
| Hypothetical (5% return before expenses) | $1,000.00 | $1,014.59 | $10.56 | 2.09% |
| Administrator Class | | | | |
| Actual | $1,000.00 | $1,094.62 | $ 6.62 | 1.26% |
| Hypothetical (5% return before expenses) | $1,000.00 | $1,018.75 | $ 6.38 | 1.26% |
| Institutional Class | | | | |
| Actual | $1,000.00 | $1,095.93 | $ 5.31 | 1.01% |
| Hypothetical (5% return before expenses) | $1,000.00 | $1,020.00 | $ 5.11 | 1.01% |
1 Expenses paid is equal to the annualized net expense ratio of each class multiplied by the average account value over the period, multiplied by the number of days in the most recent fiscal half-year divided by the number of days in the fiscal year (to reflect the one-half-year period).
Wells Fargo Specialized Technology Fund | 9
Portfolio of investments—September 30, 2021 (unaudited)
| | | | | Shares | Value |
| Common stocks: 93.96% | | | | | |
| Communication services: 13.27% | | | | | |
| Entertainment: 0.08% | | | | | |
| Take-Two Interactive Software Incorporated † | | | | 3,570 | $ 550,030 |
| Interactive media & services: 13.19% | | | | | |
| Alphabet Incorporated Class A † | | | | 1,955 | 5,226,732 |
| Alphabet Incorporated Class C † | | | | 16,010 | 42,671,610 |
| Facebook Incorporated Class A † | | | | 68,720 | 23,322,881 |
| Snap Incorporated Class A † | | | | 107,995 | 7,977,591 |
| Zillow Group Incorporated Class A † | | | | 7,245 | 641,762 |
| ZoomInfo Technologies Incorporated † | | | | 243,580 | 14,904,660 |
| | | | | | 94,745,236 |
| Consumer discretionary: 6.49% | | | | | |
| Auto components: 0.57% | | | | | |
| Aptiv plc † | | | | 27,575 | 4,107,848 |
| Automobiles: 0.11% | | | | | |
| Tesla Motors Incorporated † | | | | 1,015 | 787,112 |
| Hotels, restaurants & leisure: 1.64% | | | | | |
| Booking Holdings Incorporated † | | | | 4,210 | 9,993,993 |
| Expedia Group Incorporated † | | | | 10,660 | 1,747,174 |
| | | | | | 11,741,167 |
| Internet & direct marketing retail: 4.17% | | | | | |
| Amazon.com Incorporated † | | | | 9,115 | 29,943,139 |
| Health care: 0.18% | | | | | |
| Health care technology: 0.18% | | | | | |
| Veeva Systems Incorporated Class A † | | | | 4,555 | 1,312,614 |
| Industrials: 0.80% | | | | | |
| Electrical equipment: 0.01% | | | | | |
| Bloom Energy Corporation Class A † | | | | 3,825 | 71,604 |
| Road & rail: 0.79% | | | | | |
| Lyft Incorporated Class A † | | | | 105,585 | 5,658,300 |
| Information technology: 73.22% | | | | | |
| Communications equipment: 1.16% | | | | | |
| Arista Networks Incorporated † | | | | 2,225 | 764,599 |
| Cisco Systems Incorporated | | | | 120,125 | 6,538,404 |
| F5 Networks Incorporated † | | | | 5,375 | 1,068,443 |
| | | | | | 8,371,446 |
| Electronic equipment, instruments & components: 2.45% | | | | | |
| Cognex Corporation | | | | 9,425 | 756,074 |
| Flex Limited † | | | | 68,045 | 1,203,036 |
| IPG Photonics Corporation † | | | | 12,990 | 2,057,616 |
| Samsung SDI Company Limited | | | | 22,729 | 13,562,846 |
| | | | | | 17,579,572 |
The accompanying notes are an integral part of these financial statements.
10 | Wells Fargo Specialized Technology Fund
Portfolio of investments—September 30, 2021 (unaudited)
| | | | | Shares | Value |
| IT services: 15.32% | | | | | |
| Adyen NV 144A† | | | | 810 | $ 2,264,243 |
| Cloudflare Incorporated Class A † | | | | 14,835 | 1,671,163 |
| DXC Technology Company † | | | | 171,870 | 5,776,551 |
| EPAM Systems Incorporated † | | | | 6,355 | 3,625,400 |
| Fiserv Incorporated † | | | | 22,195 | 2,408,158 |
| Infosys Limited ADR | | | | 74,290 | 1,652,953 |
| MongoDB Incorporated † | | | | 62,070 | 29,266,625 |
| Okta Incorporated † | | | | 18,195 | 4,318,401 |
| PayPal Holdings Incorporated † | | | | 65,040 | 16,924,058 |
| Shopify Incorporated Class A † | | | | 4,540 | 6,155,241 |
| Snowflake Incorporated Class A † | | | | 6,653 | 2,012,067 |
| Square Incorporated Class A † | | | | 62,840 | 15,071,546 |
| Toast Incorporated Class A † | | | | 2,038 | 101,798 |
| Twilio Incorporated Class A † | | | | 58,695 | 18,726,640 |
| | | | | | 109,974,844 |
| Semiconductors & semiconductor equipment: 17.08% | | | | | |
| Advanced Micro Devices Incorporated † | | | | 37,325 | 3,840,743 |
| Applied Materials Incorporated | | | | 80,535 | 10,367,271 |
| ASML Holding NV | | | | 2,905 | 2,164,545 |
| Infineon Technologies AG | | | | 151,350 | 6,189,938 |
| KLA Corporation | | | | 7,505 | 2,510,498 |
| Lam Research Corporation | | | | 13,565 | 7,720,520 |
| Marvell Technology Incorporated | | | | 97,160 | 5,859,720 |
| Micron Technology Incorporated | | | | 159,505 | 11,321,665 |
| NVIDIA Corporation | | | | 66,480 | 13,771,997 |
| NXP Semiconductors NV | | | | 39,985 | 7,831,862 |
| ON Semiconductor Corporation † | | | | 280,220 | 12,825,669 |
| Qorvo Incorporated † | | | | 21,670 | 3,623,007 |
| SK Hynix Incorporated | | | | 51,107 | 4,375,082 |
| Skyworks Solutions Incorporated | | | | 10,020 | 1,651,096 |
| STMicroelectronics NV | | | | 145,430 | 6,349,722 |
| Taiwan Semiconductor Manufacturing Company Limited ADR | | | | 123,265 | 13,762,537 |
| Teradyne Incorporated | | | | 23,180 | 2,530,561 |
| Tokyo Electron Limited | | | | 13,400 | 5,919,832 |
| | | | | | 122,616,265 |
| Software: 30.82% | | | | | |
| Adobe Incorporated † | | | | 8,655 | 4,982,857 |
| Altair Engineering Incorporated Class A † | | | | 12,215 | 842,102 |
| Alteryx Incorporated Class A † | | | | 27,050 | 1,977,355 |
| Asana Incorporated Class A † | | | | 257,255 | 26,713,358 |
| Atlassian Corporation plc Class A † | | | | 16,875 | 6,605,213 |
| Box Incorporated Class A † | | | | 53,470 | 1,265,635 |
| Crowdstrike Holdings Incorporated Class A † | | | | 80,095 | 19,685,748 |
| Datadog Incorporated Class A † | | | | 18,755 | 2,651,019 |
| DocuSign Incorporated † | | | | 13,820 | 3,557,683 |
| Fortinet Incorporated † | | | | 10,915 | 3,187,617 |
| HubSpot Incorporated † | | | | 49,244 | 33,293,375 |
| Intuit Incorporated | | | | 18,505 | 9,983,633 |
| KnowBe4 Incorporated †« | | | | 45,025 | 988,749 |
| Mandiant Incorporated † | | | | 38,395 | 683,431 |
| Microsoft Corporation | | | | 97,890 | 27,597,148 |
| Monday.com Limited †« | | | | 4,640 | 1,513,568 |
| Palo Alto Networks Incorporated † | | | | 18,255 | 8,744,145 |
| Paycom Software Incorporated † | | | | 42,615 | 21,126,386 |
The accompanying notes are an integral part of these financial statements.
Wells Fargo Specialized Technology Fund | 11
Portfolio of investments—September 30, 2021 (unaudited)
| | | | | Shares | Value |
| Software (continued) | | | | | |
| Salesforce.com Incorporated † | | | | 45,370 | $ 12,305,251 |
| Smartsheet Incorporated Class A † | | | | 10,865 | 747,729 |
| The Trade Desk Incorporated † | | | | 105,385 | 7,408,566 |
| Varonis Systems Incorporated † | | | | 59,630 | 3,628,486 |
| Workday Incorporated Class A † | | | | 2,360 | 589,740 |
| Zscaler Incorporated † | | | | 80,865 | 21,204,420 |
| | | | | | 221,283,214 |
| Technology hardware, storage & peripherals: 6.39% | | | | | |
| Apple Incorporated | | | | 218,730 | 30,950,295 |
| Samsung Electronics Company Limited | | | | 102,962 | 6,383,088 |
| Seagate Technology Holdings plc | | | | 64,535 | 5,325,428 |
| Western Digital Corporation † | | | | 57,065 | 3,220,749 |
| | | | | | 45,879,560 |
| Total Common stocks (Cost $402,981,087) | | | | | 674,621,951 |
| | | Yield | | | |
| Short-term investments: 6.24% | | | | | |
| Investment companies: 6.24% | | | | | |
| Securities Lending Cash Investments LLC ♠∩∞ | | 0.02% | | 892,750 | 892,750 |
| Wells Fargo Government Money Market Fund Select Class ♠∞ | | 0.03 | | 43,915,900 | 43,915,900 |
| Total Short-term investments (Cost $44,808,650) | | | | | 44,808,650 |
| Total investments in securities (Cost $447,789,737) | 100.20% | | | | 719,430,601 |
| Other assets and liabilities, net | (0.20) | | | | (1,451,081) |
| Total net assets | 100.00% | | | | $717,979,520 |
| † | Non-income earning security |
| 144A | The security may be resold in transactions exempt from registration, normally to qualified institutional buyers, pursuant to Rule 144A under the Securities Act of 1933. |
| « | All or a portion of this security is on loan. |
| ♠ | The issuer of the security is an affiliated person of the Fund as defined in the Investment Company Act of 1940. |
| ∩ | The investment is a non-registered investment company purchased with cash collateral received from securities on loan. |
| ∞ | The rate represents the 7-day annualized yield at period end. |
| Abbreviations: |
| ADR | American depositary receipt |
The accompanying notes are an integral part of these financial statements.
12 | Wells Fargo Specialized Technology Fund
Portfolio of investments—September 30, 2021 (unaudited)
Investments in affiliates
An affiliated investment is an investment in which the Fund owns at least 5% of the outstanding voting shares of the issuer or as a result of other relationships, such as the Fund and the issuer having the same investment manager. Transactions with issuers that were either affiliates of the Fund at the beginning of the period or the end of the period were as follows:
| | Value,
beginning of
period | Purchases | Sales
proceeds | Net
realized
gains
(losses) | | Net
change in
unrealized
gains
(losses) | | Value,
end of
period | Shares,
end
of period | Income
from
affiliated
securities |
| Short-term investments | | | | | | | | | |
| Securities Lending Cash Investments LLC | $ 0 | $ 27,294,709 | $(26,401,959) | $0 | | $0 | | $ 892,750 | 892,750 | $ 206# |
| Wells Fargo Government Money Market Fund Select Class | 32,924,749 | 108,524,601 | (97,533,450) | 0 | | 0 | | 43,915,900 | 43,915,900 | 4,874 |
| | | | | $0 | | $0 | | $44,808,650 | | $5,080 |
| # | Amount shown represents income before fees and rebates. |
The accompanying notes are an integral part of these financial statements.
Wells Fargo Specialized Technology Fund | 13
Statement of assets and liabilities—September 30, 2021 (unaudited)
| | |
| Assets | |
Investments in unaffiliated securities (including $874,101 of securities loaned), at value (cost $402,981,087)
| $ 674,621,951 |
Investments in affiliated securites, at value (cost $44,808,650)
| 44,808,650 |
Receivable for dividends
| 225,431 |
Receivable for Fund shares sold
| 222,335 |
Receivable for securities lending income, net
| 3,505 |
Prepaid expenses and other assets
| 41,627 |
Total assets
| 719,923,499 |
| Liabilities | |
Payable upon receipt of securities loaned
| 889,776 |
Management fee payable
| 525,714 |
Payable for Fund shares redeemed
| 176,483 |
Shareholder servicing fees payable
| 136,876 |
Administration fees payable
| 123,771 |
Distribution fee payable
| 8,196 |
Accrued expenses and other liabilities
| 83,163 |
Total liabilities
| 1,943,979 |
Total net assets
| $717,979,520 |
| Net assets consist of | |
Paid-in capital
| $ 258,844,667 |
Total distributable earnings
| 459,134,853 |
Total net assets
| $717,979,520 |
| Computation of net asset value and offering price per share | |
Net assets – Class A
| $ 610,632,760 |
Shares outstanding – Class A1
| 30,078,559 |
Net asset value per share – Class A
| $20.30 |
Maximum offering price per share – Class A2
| $21.54 |
Net assets – Class C
| $ 12,556,285 |
Shares outstanding – Class C1
| 911,211 |
Net asset value per share – Class C
| $13.78 |
Net assets – Administrator Class
| $ 10,863,230 |
Shares outstanding – Administrator Class1
| 518,845 |
Net asset value per share – Administrator Class
| $20.94 |
Net assets – Institutional Class
| $ 83,927,245 |
Shares outstanding – Institutional Class1
| 3,949,106 |
Net asset value per share – Institutional Class
| $21.25 |
| 1 | The Fund has an unlimited number of authorized shares |
| 2 | Maximum offering price is computed as 100/94.25 of net asset value. On investments of $50,000 or more, the offering price is reduced. |
The accompanying notes are an integral part of these financial statements.
14 | Wells Fargo Specialized Technology Fund
Statement of operations—six months ended September 30, 2021 (unaudited)
| | |
| Investment income | |
Dividends (net of foreign withholdings taxes of $58,210)
| $ 927,917 |
Income from affiliated securities
| 18,586 |
Total investment income
| 946,503 |
| Expenses | |
Management fee
| 3,060,023 |
| Administration fees | |
Class A
| 642,315 |
Class C
| 13,294 |
Administrator Class
| 6,875 |
Institutional Class
| 56,968 |
| Shareholder servicing fees | |
Class A
| 764,660 |
Class C
| 15,826 |
Administrator Class
| 13,221 |
| Distribution fee | |
Class C
| 47,478 |
Custody and accounting fees
| 28,899 |
Professional fees
| 25,493 |
Registration fees
| 34,439 |
Shareholder report expenses
| 26,846 |
Trustees’ fees and expenses
| 9,662 |
Other fees and expenses
| 7,272 |
Total expenses
| 4,753,271 |
| Less: Fee waivers and/or expense reimbursements | |
Class A
| (44,634) |
Administrator Class
| (23) |
Net expenses
| 4,708,614 |
Net investment loss
| (3,762,111) |
| Realized and unrealized gains (losses) on investments | |
Net realized gains on investments
| 31,209,683 |
Net change in unrealized gains (losses) on investments
| 36,298,900 |
Net realized and unrealized gains (losses) on investments
| 67,508,583 |
Net increase in net assets resulting from operations
| $63,746,472 |
The accompanying notes are an integral part of these financial statements.
Wells Fargo Specialized Technology Fund | 15
Statement of changes in net assets
| | | | | |
| | Six months ended
September 30, 2021
(unaudited) | Year ended
March 31, 2021 |
| Operations | | | | |
Net investment loss
| | $ (3,762,111) | | $ (5,883,706) |
Net realized gains on investments
| | 31,209,683 | | 190,286,867 |
Net change in unrealized gains (losses) on investments
| | 36,298,900 | | 131,087,249 |
Net increase in net assets resulting from operations
| | 63,746,472 | | 315,490,410 |
| Distributions to shareholders from | | | | |
| Net investment income and net realized gains | | | | |
Class A
| | 0 | | (78,405,462) |
Class C
| | 0 | | (2,280,902) |
Administrator Class
| | 0 | | (1,513,807) |
Institutional Class
| | 0 | | (10,489,201) |
Total distributions to shareholders
| | 0 | | (92,689,372) |
| Capital share transactions | Shares | | Shares | |
| Proceeds from shares sold | | | | |
Class A
| 404,782 | 8,100,184 | 2,163,000 | 37,972,273 |
Class C
| 42,749 | 587,554 | 302,791 | 3,665,611 |
Administrator Class
| 52,181 | 1,087,912 | 223,472 | 3,909,027 |
Institutional Class
| 339,937 | 7,147,707 | 1,553,730 | 28,178,733 |
| | | 16,923,357 | | 73,725,644 |
| Reinvestment of distributions | | | | |
Class A
| 0 | 0 | 4,189,570 | 75,118,993 |
Class C
| 0 | 0 | 186,253 | 2,279,734 |
Administrator Class
| 0 | 0 | 80,808 | 1,493,323 |
Institutional Class
| 0 | 0 | 553,428 | 10,360,173 |
| | | 0 | | 89,252,223 |
| Payment for shares redeemed | | | | |
Class A
| (1,339,979) | (26,641,983) | (3,902,978) | (70,093,344) |
Class C
| (82,124) | (1,104,823) | (451,677) | (5,823,540) |
Administrator Class
| (37,059) | (773,029) | (758,411) | (11,851,802) |
Institutional Class
| (808,241) | (16,909,611) | (1,566,683) | (28,632,320) |
| | | (45,429,446) | | (116,401,006) |
Net increase (decrease) in net assets resulting from capital share transactions
| | (28,506,089) | | 46,576,861 |
Total increase in net assets
| | 35,240,383 | | 269,377,899 |
| Net assets | | | | |
Beginning of period
| | 682,739,137 | | 413,361,238 |
End of period
| | $717,979,520 | | $ 682,739,137 |
The accompanying notes are an integral part of these financial statements.
16 | Wells Fargo Specialized Technology Fund
Financial highlights
(For a share outstanding throughout each period)
| | | Year ended March 31 |
| Class A | Six months ended
September 30, 2021
(unaudited) | 2021 | 2020 | 2019 | 2018 | 2017 |
Net asset value, beginning of period
| $18.55 | $12.08 | $13.33 | $14.08 | $10.95 | $9.39 |
Net investment loss
| (0.11) | (0.16) | (0.11) | (0.11) | (0.10) 1 | (0.03) 1 |
Net realized and unrealized gains (losses) on investments
| 1.86 | 9.44 | (0.01) | 2.06 | 4.20 | 2.17 |
Total from investment operations
| 1.75 | 9.28 | (0.12) | 1.95 | 4.10 | 2.14 |
| Distributions to shareholders from | | | | | | |
Net realized gains
| 0.00 | (2.81) | (1.13) | (2.70) | (0.97) | (0.58) |
Net asset value, end of period
| $20.30 | $18.55 | $12.08 | $13.33 | $14.08 | $10.95 |
Total return2
| 9.43% | 77.67% | (1.31)% | 16.80% | 38.41% | 23.55% |
| Ratios to average net assets (annualized) | | | | | | |
Gross expenses
| 1.34% | 1.35% | 1.39% | 1.40% | 1.41% | 1.44% |
Net expenses
| 1.33% | 1.34% | 1.37% | 1.39% | 1.41% | 1.44% |
Net investment loss
| (1.07)% | (0.98)% | (0.80)% | (0.77)% | (0.75)% | (0.28)% |
| Supplemental data | | | | | | |
Portfolio turnover rate
| 36% | 146% | 149% | 107% | 109% | 131% |
Net assets, end of period (000s omitted)
| $610,633 | $575,422 | $344,949 | $401,990 | $353,552 | $266,329 |
| 1 | Calculated based upon average shares outstanding |
| 2 | Total return calculations do not include any sales charges. Returns for periods of less than one year are not annualized. |
The accompanying notes are an integral part of these financial statements.
Wells Fargo Specialized Technology Fund | 17
Financial highlights
(For a share outstanding throughout each period)
| | | Year ended March 31 |
| Class C | Six months ended
September 30, 2021
(unaudited) | 2021 | 2020 | 2019 | 2018 | 2017 |
Net asset value, beginning of period
| $12.64 | $8.80 | $10.09 | $11.38 | $9.06 | $7.92 |
Net investment loss
| (0.12) 1 | (0.17) | (0.16) 1 | (0.17) 1 | (0.16) | (0.09) 1 |
Net realized and unrealized gains (losses) on investments
| 1.26 | 6.82 | (0.00) 2 | 1.58 | 3.45 | 1.81 |
Total from investment operations
| 1.14 | 6.65 | (0.16) | 1.41 | 3.29 | 1.72 |
| Distributions to shareholders from | | | | | | |
Net realized gains
| 0.00 | (2.81) | (1.13) | (2.70) | (0.97) | (0.58) |
Net asset value, end of period
| $13.78 | $12.64 | $8.80 | $10.09 | $11.38 | $9.06 |
Total return3
| 9.02% | 76.67% | (2.15)% | 16.01% | 37.45% | 22.59% |
| Ratios to average net assets (annualized) | | | | | | |
Gross expenses
| 2.09% | 2.10% | 2.14% | 2.15% | 2.16% | 2.19% |
Net expenses
| 2.09% | 2.10% | 2.13% | 2.14% | 2.16% | 2.19% |
Net investment loss
| (1.83)% | (1.75)% | (1.57)% | (1.52)% | (1.49)% | (1.03)% |
| Supplemental data | | | | | | |
Portfolio turnover rate
| 36% | 146% | 149% | 107% | 109% | 131% |
Net assets, end of period (000s omitted)
| $12,556 | $12,017 | $8,035 | $11,615 | $15,932 | $12,827 |
| 1 | Calculated based upon average shares outstanding |
| 2 | Amount is more than $(0.005). |
| 3 | Total return calculations do not include any sales charges. Returns for periods of less than one year are not annualized. |
The accompanying notes are an integral part of these financial statements.
18 | Wells Fargo Specialized Technology Fund
Financial highlights
(For a share outstanding throughout each period)
| | | Year ended March 31 |
| Administrator Class | Six months ended
September 30, 2021
(unaudited) | 2021 | 2020 | 2019 | 2018 | 2017 |
Net asset value, beginning of period
| $19.13 | $12.40 | $13.65 | $14.34 | $11.12 | $9.52 |
Net investment loss
| (0.10) 1 | (0.16) | (0.10) 1 | (0.09) 1 | (0.09) 1 | (0.02) |
Net realized and unrealized gains (losses) on investments
| 1.91 | 9.70 | (0.02) | 2.10 | 4.28 | 2.20 |
Total from investment operations
| 1.81 | 9.54 | (0.12) | 2.01 | 4.19 | 2.18 |
| Distributions to shareholders from | | | | | | |
Net realized gains
| 0.00 | (2.81) | (1.13) | (2.70) | (0.97) | (0.58) |
Net asset value, end of period
| $20.94 | $19.13 | $12.40 | $13.65 | $14.34 | $11.12 |
Total return2
| 9.46% | 77.92% | (1.28)% | 17.02% | 38.55% | 23.65% |
| Ratios to average net assets (annualized) | | | | | | |
Gross expenses
| 1.26% | 1.27% | 1.31% | 1.32% | 1.33% | 1.36% |
Net expenses
| 1.26% | 1.27% | 1.28% | 1.29% | 1.32% | 1.33% |
Net investment loss
| (1.00)% | (0.91)% | (0.71)% | (0.65)% | (0.66)% | (0.17)% |
| Supplemental data | | | | | | |
Portfolio turnover rate
| 36% | 146% | 149% | 107% | 109% | 131% |
Net assets, end of period (000s omitted)
| $10,863 | $9,636 | $11,873 | $22,480 | $19,140 | $39,833 |
| 1 | Calculated based upon average shares outstanding |
| 2 | Returns for periods of less than one year are not annualized. |
The accompanying notes are an integral part of these financial statements.
Wells Fargo Specialized Technology Fund | 19
Financial highlights
(For a share outstanding throughout each period)
| | | Year ended March 31 |
| Institutional Class | Six months ended
September 30, 2021
(unaudited) | 2021 | 2020 | 2019 | 2018 | 2017 1 |
Net asset value, beginning of period
| $19.39 | $12.51 | $13.73 | $14.37 | $11.12 | $10.42 |
Net investment income (loss)
| (0.07) | (0.12) | (0.07) | (0.07) | (0.05) | 0.01 2 |
Net realized and unrealized gains (losses) on investments
| 1.93 | 9.81 | (0.02) | 2.13 | 4.27 | 1.27 |
Total from investment operations
| 1.86 | 9.69 | (0.09) | 2.06 | 4.22 | 1.28 |
| Distributions to shareholders from | | | | | | |
Net realized gains
| 0.00 | (2.81) | (1.13) | (2.70) | (0.97) | (0.58) |
Net asset value, end of period
| $21.25 | $19.39 | $12.51 | $13.73 | $14.37 | $11.12 |
Total return3
| 9.59% | 78.30% | (1.05)% | 17.25% | 38.91% | 12.97% |
| Ratios to average net assets (annualized) | | | | | | |
Gross expenses
| 1.01% | 1.02% | 1.06% | 1.07% | 1.08% | 1.11% |
Net expenses
| 1.01% | 1.02% | 1.03% | 1.04% | 1.07% | 1.08% |
Net investment income (loss)
| (0.75)% | (0.66)% | (0.47)% | (0.42)% | (0.40)% | 0.17% |
| Supplemental data | | | | | | |
Portfolio turnover rate
| 36% | 146% | 149% | 107% | 109% | 131% |
Net assets, end of period (000s omitted)
| $83,927 | $85,664 | $48,504 | $51,223 | $27,509 | $19,869 |
| 1 | For the period from October 31, 2016 (commencement of class operations) to March 31, 2017 |
| 2 | Calculated based upon average shares outstanding |
| 3 | Returns for periods of less than one year are not annualized. |
The accompanying notes are an integral part of these financial statements.
20 | Wells Fargo Specialized Technology Fund
Notes to financial statements (unaudited)
1. ORGANIZATION
Wells Fargo Funds Trust (the "Trust"), a Delaware statutory trust organized on March 10, 1999, is an open-end management investment company registered under the Investment Company Act of 1940, as amended (the "1940 Act"). As an investment company, the Trust follows the accounting and reporting guidance in Financial Accounting Standards Board ("FASB") Accounting Standards Codification Topic 946, Financial Services – Investment Companies. These financial statements report on the Wells Fargo Specialized Technology Fund (the "Fund") which is a non-diversified series of the Trust.
On February 23, 2021, Wells Fargo & Company announced that it has entered into a definitive agreement to sell Wells Fargo Asset Management ("WFAM") to GTCR LLC and Reverence Capital Partners, L.P. WFAM is the trade name used by the asset management businesses of Wells Fargo & Company and includes Wells Fargo Funds Management, LLC, the investment manager to the Fund, Wells Capital Management, LLC and Wells Fargo Asset Management (International) Limited, both registered investment advisers providing subadvisory services to certain funds, and Wells Fargo Funds Distributor, LLC, the Fund's principal underwriter. As part of the transaction, Wells Fargo & Company will own a 9.9% equity interest and will continue to serve as an important client and distribution partner.
Consummation of the transaction will result in the automatic termination of the Fund’s investment management agreement and subadvisory agreement. The Fund’s Board of Trustees approved a new investment management agreement and a new subadvisory agreement which were submitted to the Fund’s shareholders for approval at a Special Meeting of Shareholders held on September 15, 2021. Shareholders of record of the Fund at the close of business on May 28, 2021 approved the new agreements which will take effect upon the closing of the transaction.
As more fully discussed in Note 11, the transaction closed on November 1, 2021 and the investment manager, sub-advisers and distributor changed their names to Allspring Funds Management, LLC, Allspring Global Investments, LLC, Allspring Global Investments (UK) Limited and Allspring Funds Distributor, LLC. While these name changes occurred after the end of the period, throughout this report, the new names have been used.
The Board of Trustees of the Wells Fargo Funds voted on July 15, 2021 to approve a change to the Fund's name to remove "Wells Fargo" from the name and replace it with "Allspring", effective December 6, 2021.
2. SIGNIFICANT ACCOUNTING POLICIES
The following significant accounting policies, which are consistently followed in the preparation of the financial statements of the Fund, are in conformity with U.S. generally accepted accounting principles which require management to make estimates and assumptions that affect the reported amounts of assets and liabilities, disclosure of contingent assets and liabilities at the date of the financial statements, and the reported amounts of income and expenses during the reporting period. Actual results could differ from those estimates.
Securities valuation
All investments are valued each business day as of the close of regular trading on the New York Stock Exchange (generally 4 p.m. Eastern Time), although the Fund may deviate from this calculation time under unusual or unexpected circumstances.
Equity securities that are listed on a foreign or domestic exchange or market are valued at the official closing price or, if none, the last sales price. If no sale occurs on the principal exchange or market that day, a fair value price will be determined in accordance with the Fund’s Valuation Procedures.
The values of securities denominated in foreign currencies are translated into U.S. dollars at rates provided by an independent foreign currency pricing source at a time each business day specified by the Allspring Global Investments Pricing Committee at Allspring Funds Mangement, LLC ("Allspring Funds Management").
Many securities markets and exchanges outside the U.S. close prior to the close of the New York Stock Exchange and therefore may not fully reflect trading or events that occur after the close of the principal exchange in which the foreign securities are traded, but before the close of the New York Stock Exchange. If such trading or events are expected to materially affect the value of such securities, then fair value pricing procedures approved by the Board of Trustees of the Fund are applied. These procedures take into account multiple factors including movements in U.S. securities markets after foreign exchanges close. Foreign securities that are fair valued under these procedures are categorized as Level 2 and the application of these procedures may result in transfers between Level 1 and Level 2. Depending on market activity, such fair valuations may be frequent. Such fair value pricing may result in net asset values that are higher or lower than net asset values based on the last reported sales price or latest quoted bid price. On September 30, 2021, such fair value pricing was used in pricing certain foreign securities.
Wells Fargo Specialized Technology Fund | 21
Notes to financial statements (unaudited)
Investments in registered open-end investment companies are valued at net asset value. Interests in non-registered investment companies that are redeemable at net asset value are fair valued normally at net asset value.
Investments which are not valued using any of the methods discussed above are valued at their fair value, as determined in good faith by the Board of Trustees. The Board of Trustees has established a Valuation Committee comprised of the Trustees and has delegated to it the authority to take any actions regarding the valuation of portfolio securities that the Valuation Committee deems necessary or appropriate, including determining the fair value of portfolio securities, unless the determination has been delegated to the Allspring Global Investments Pricing Committee. The Board of Trustees retains the authority to make or ratify any valuation decisions or approve any changes to the Valuation Procedures as it deems appropriate. On a quarterly basis, the Board of Trustees receives reports on any valuation actions taken by the Valuation Committee or the Allspring Global Investments Pricing Committee which may include items for ratification.
Foreign currency translation
The accounting records of the Fund are maintained in U.S. dollars. The values of other assets and liabilities denominated in foreign currencies are translated into U.S. dollars at rates provided by an independent foreign currency pricing source at a time each business day specified by the Allspring Global Investments Pricing Committee. Purchases and sales of securities, and income and expenses are converted at the rate of exchange on the respective dates of such transactions. Net realized foreign exchange gains or losses arise from sales of foreign currencies, currency gains or losses realized between the trade and settlement dates on securities transactions, and the difference between the amounts of dividends, interest and foreign withholding taxes recorded and the U.S. dollar equivalent of the amounts actually paid or received. Net unrealized foreign exchange gains and losses arise from changes in the fair value of assets and liabilities other than investments in securities resulting from changes in exchange rates. The changes in net assets arising from changes in exchange rates of securities and the changes in net assets resulting from changes in market prices of securities are not separately presented. Such changes are included in net realized and unrealized gains or losses from investments.
Securities lending
The Fund may lend its securities from time to time in order to earn additional income in the form of fees or interest on securities received as collateral or the investment of any cash received as collateral. When securities are on loan, the Fund receives interest or dividends on those securities. Cash collateral received in connection with its securities lending transactions is invested in Securities Lending Cash Investments, LLC (the "Securities Lending Fund"). Investments in Securities Lending Fund are valued at the evaluated bid price provided by an independent pricing service. Income earned from investment in the Securities Lending Fund (net of fees and rebates), if any, is included in income from affiliated securities on the Statement of Operations.
In a securities lending transaction, the net asset value of the Fund is affected by an increase or decrease in the value of the securities loaned and by an increase or decrease in the value of the instrument in which collateral is invested. The amount of securities lending activity undertaken by the Fund fluctuates from time to time. The Fund has the right under the lending agreement to recover the securities from the borrower on demand. In the event of default or bankruptcy by the borrower, the Fund may be prevented from recovering the loaned securities or gaining access to the collateral or may experience delays or costs in doing so. In such an event, the terms of the agreement allow the unaffiliated securities lending agent to use the collateral to purchase replacement securities on behalf of the Fund or pay the Fund the market value of the loaned securities. The Fund bears the risk of loss with respect to depreciation of its investment of the cash collateral.
Security transactions and income recognition
Securities transactions are recorded on a trade date basis. Realized gains or losses are recorded on the basis of identified cost.
Dividend income is recognized on the ex-dividend date, except for certain dividends from foreign securities, which are recorded as soon as the custodian verifies the ex-dividend date. Dividend income is recorded net of foreign taxes withheld where recovery of such taxes is not assured.
Distributions to shareholders
Distributions to shareholders from net investment income and any net realized gains are recorded on the ex-dividend date and paid at least annually. Such distributions are determined in accordance with income tax regulations and may differ from U.S. generally accepted accounting principles. Dividend sources are estimated at the time of declaration. The tax character of distributions is determined as of the Fund's fiscal year end. Therefore, a portion of the Fund's distributions made prior to the Fund’s fiscal year end may be categorized as a tax return of capital at year end.
22 | Wells Fargo Specialized Technology Fund
Notes to financial statements (unaudited)
Federal and other taxes
The Fund intends to continue to qualify as a regulated investment company by distributing substantially all of its investment company taxable income and any net realized capital gains (after reduction for capital loss carryforwards) sufficient to relieve it from all, or substantially all, federal income taxes. Accordingly, no provision for federal income taxes was required.
The Fund’s income and federal excise tax returns and all financial records supporting those returns for the prior three fiscal years are subject to examination by the federal and Delaware revenue authorities. Management has analyzed the Fund's tax positions taken on federal, state, and foreign tax returns for all open tax years and does not believe that there are any uncertain tax positions that require recognition of a tax liability.
As of September 30, 2021, the aggregate cost of all investments for federal income tax purposes was $469,117,106 and the unrealized gains (losses) consisted of:
| Gross unrealized gains | $268,216,003 |
| Gross unrealized losses | (17,902,508) |
| Net unrealized gains | $250,313,495 |
Class allocations
The separate classes of shares offered by the Fund differ principally in applicable sales charges, distribution, shareholder servicing, and administration fees. Class specific expenses are charged directly to that share class. Investment income, common fund-level expenses, and realized and unrealized gains (losses) on investments are allocated daily to each class of shares based on the relative proportion of net assets of each class.
3. FAIR VALUATION MEASUREMENTS
Fair value measurements of investments are determined within a framework that has established a fair value hierarchy based upon the various data inputs utilized in determining the value of the Fund’s investments. The three-level hierarchy gives the highest priority to unadjusted quoted prices in active markets for identical assets or liabilities (Level 1) and the lowest priority to unobservable inputs (Level 3). The Fund’s investments are classified within the fair value hierarchy based on the lowest level of input that is significant to the fair value measurement. The inputs are summarized into three broad levels as follows:
| ■ | Level 1 – quoted prices in active markets for identical securities |
| ■ | Level 2 – other significant observable inputs (including quoted prices for similar securities, interest rates, prepayment speeds, credit risk, etc.) |
| ■ | Level 3 – significant unobservable inputs (including the Fund’s own assumptions in determining the fair value of investments) |
The inputs or methodologies used for valuing investments in securities are not necessarily an indication of the risk associated with investing in those securities.
The following is a summary of the inputs used in valuing the Fund’s assets and liabilities as of September 30, 2021:
| | Quoted prices
(Level 1) | Other significant
observable inputs
(Level 2) | Significant
unobservable inputs
(Level 3) | Total |
| Assets | | | | |
| Investments in: | | | | |
| Common stocks | | | | |
| Communication services | $ 95,295,266 | $ 0 | $0 | $ 95,295,266 |
| Consumer discretionary | 46,579,266 | 0 | 0 | 46,579,266 |
| Health care | 1,312,614 | 0 | 0 | 1,312,614 |
| Industrials | 5,729,904 | 0 | 0 | 5,729,904 |
| Information technology | 480,660,150 | 45,044,751 | 0 | 525,704,901 |
| Short-term investments | | | | |
| Investment companies | 44,808,650 | 0 | 0 | 44,808,650 |
| Total assets | $674,385,850 | $45,044,751 | $0 | $719,430,601 |
Wells Fargo Specialized Technology Fund | 23
Notes to financial statements (unaudited)
Additional sector, industry or geographic detail, if any, is included in the Portfolio of Investments.
For the six months ended September 30, 2021, the Fund did not have any transfers into/out of Level 3.
4. TRANSACTIONS WITH AFFILIATES AND OTHER EXPENSES
Management fee
Allspring Funds Management, a wholly owned subsidiary of Allspring Global Investments Holdings, LLC, a holding company indirectly owned by Wells Fargo & Company as of September 30, 2021, is the manager of the Fund and provides advisory and fund-level administrative services under an investment management agreement. Under the investment management agreement, Allspring Funds Management is responsible for, among other services, implementing the investment objectives and strategies of the Fund, supervising the subadviser and providing fund-level administrative services in connection with the Fund’s operations. As compensation for its services under the investment management agreement, Allspring Funds Management is entitled to receive a management fee at the following annual rate based on the Fund’s average daily net assets:
| Average daily net assets | Management fee |
| First $500 million | 0.850% |
| Next $500 million | 0.840 |
| Next $1 billion | 0.815 |
| Next $2 billion | 0.790 |
| Next $1 billion | 0.765 |
| Next $5 billion | 0.755 |
| Over $10 billion | 0.745 |
Allspring Funds Management has retained the services of a subadviser to provide daily portfolio management to the Fund. The fee for subadvisory services is borne by Allspring Funds Management. Allianz Global Investors U.S., LLC, which is not an affiliate of the Allspring Funds Management, is the subadviser to the Fund and is entitled to receive a fee from Allspring Funds Management at an annual rate starting at 0.57% and declining to 0.50% as the average daily net assets of the Fund increase.
Administration fees
Under a class-level administration agreement, Allspring Funds Management provides class-level administrative services to the Fund, which includes paying fees and expenses for services provided by the transfer agent, sub-transfer agents, omnibus account servicers and record-keepers. As compensation for its services under the class-level administration agreement, Allspring Funds Management receives an annual fee which is calculated based on the average daily net assets of each class as follows:
| | Class-level
administration fee |
| Class A | 0.21% |
| Class C | 0.21 |
| Administrator Class | 0.13 |
| Institutional Class | 0.13 |
Waivers and/or expense reimbursements
Allspring Funds Management has contractually committed to waive and/or reimburse management and administration fees to the extent necessary to maintain certain net operating expense ratios for the Fund. When each class of the Fund has exceeded its expense cap, Allspring Funds Management will waive fees and/or reimburse expenses from fund-level expenses on a proportionate basis and then from class specific expenses. When only certain classes exceed their expense caps, waivers and/or reimbursements are applied against class specific expenses before fund-level expenses. Allspring Funds Management has contractually committed through July 31, 2022 to waive fees and/or reimburse expenses to the extent necessary to cap expenses. Prior to or after the commitment expiration date, the caps may be increased or the commitment to maintain the caps may be terminated only with the approval of the Board of Trustees. The contractual expense caps are as follows:
24 | Wells Fargo Specialized Technology Fund
Notes to financial statements (unaudited)
| | Expense ratio caps |
| Class A | 1.35% |
| Class C | 2.10 |
| Administrator Class | 1.28 |
| Institutional Class | 1.03 |
Distribution fee
The Trust has adopted a distribution plan for Class C shares of the Fund pursuant to Rule 12b-1 under the 1940 Act. A distribution fee is charged to Class C shares and paid to Allspring Funds Distributor, LLC ("Allspring Funds Distributor"), an affiliate of Allspring Funds Management, the principal underwriter, at an annual rate of 0.75% of the average daily net assets of Class C shares.
In addition, Allspring Funds Distributor is entitled to receive the front-end sales charge from the purchase of Class A shares and a contingent deferred sales charge on the redemption of certain Class A shares. Allspring Funds Distributor is also entitled to receive the contingent deferred sales charges from redemptions of Class C shares. For the six months ended September 30, 2021, Allspring Funds Distributor received $5,937 from the sale of Class A shares and $6 in contingent deferred sales charges from redemptions of Class C shares. No contingent deferred sales charges were incurred by Class A shares for the six months ended September 30, 2021.
Shareholder servicing fees
The Trust has entered into contracts with one or more shareholder servicing agents, whereby Class A, Class C, and Administrator Class of the Fund are charged a fee at an annual rate of 0.25% of the average daily net assets of each respective class. A portion of these total shareholder servicing fees were paid to affiliates.
Interfund transactions
The Fund may purchase or sell portfolio investment securities to certain affiliates pursuant to Rule 17a-7 under the 1940 Act and under procedures adopted by the Board of Trustees. The procedures have been designed to ensure that these interfund transactions, which do not incur broker commissions, are effected at current market prices.
5. INVESTMENT PORTFOLIO TRANSACTIONS
Purchases and sales of investments, excluding U.S. government obligations (if any) and short-term securities, for the six months ended September 30, 2021 were $242,093,264 and $286,360,962, respectively.
6. SECURITIES LENDING TRANSACTIONS
The Fund lends its securities through an unaffiliated securities lending agent and receives collateral in the form of cash or securities with a value at least equal to the value of the securities on loan. The value of the loaned securities is determined at the close of each business day and any increases or decreases in the required collateral are exchanged between the Fund and the counterparty on the next business day. Cash collateral received is invested in the Securities Lending Fund which seeks to provide a positive return compared to the daily Federal Funds Open Rate by investing in high-quality, U.S. dollar-denominated short-term money market instruments and is exempt from registration under Section 3(c)(7) of the 1940 Act. Securities Lending Fund is managed by Allspring Funds Management and is subadvised by Allspring Global Investments, LLC ("Allspring Investments"), an affiliate of Allspring Funds Management and wholly owned subsidiary of Allspring Global Investments Holdings, LLC. Allspring Funds Management receives an advisory fee starting at 0.05% and declining to 0.01% as the average daily net assets of the Securities Lending Fund increase. All of the fees received by Allspring Funds Management are paid to Allspring Investments for its services as subadviser.
In the event of counterparty default or the failure of a borrower to return a loaned security, the Fund has the right to use the collateral to offset any losses incurred. As of September 30, 2021, the Fund had securities lending transactions with the following counterparties which are subject to offset:
Wells Fargo Specialized Technology Fund | 25
Notes to financial statements (unaudited)
| Counterparty | Value of
securities on
loan | Collateral
received1 | Net amount |
| Morgan Stanley & Co. LLC | $656,400 | $(656,400) | $0 |
| SG Americas Securities LLC | 217,701 | (217,701) | 0 |
1 Collateral received within this table is limited to the collateral for the net transaction with the counterparty.
7. BANK BORROWINGS
The Trust (excluding the money market funds), Wells Fargo Master Trust and Wells Fargo Variable Trust are parties to a $350,000,000 revolving credit agreement whereby the Fund is permitted to use bank borrowings for temporary or emergency purposes, such as to fund shareholder redemption requests. Interest under the credit agreement is charged to the Fund based on a borrowing rate equal to the higher of the Federal Funds rate in effect on that day plus 1.25% or the overnight bank funding rate in effect on that day plus 1.25%. In addition, an annual commitment fee equal to 0.25% of the unused balance is allocated to each participating fund.
For the six months ended September 30, 2021, there were no borrowings by the Fund under the agreement.
8. CONCENTRATION RISKS
The Fund concentrated its portfolio of investments in the information technology sector. A fund that invests a substantial portion of its assets in any sector may be more affected by changes in that sector than would be a fund whose investments are not heavily weighted in any sector.
9. INDEMNIFICATION
Under the Fund's organizational documents, the officers and Trustees have been granted certain indemnification rights against certain liabilities that may arise out of performance of their duties to the Fund. The Fund has entered into a separate agreement with each Trustee that converts indemnification rights currently existing under the Fund’s organizational documents into contractual rights that cannot be changed in the future without the consent of the Trustee. Additionally, in the normal course of business, the Fund may enter into contracts with service providers that contain a variety of indemnification clauses. The Fund’s maximum exposure under these arrangements is dependent on future claims that may be made against the Fund and, therefore, cannot be estimated.
10. CORONAVIRUS (COVID-19) PANDEMIC
On March 11, 2020, the World Health Organization announced that it had made the assessment that coronavirus disease 2019 (“COVID-19”) is a pandemic. The impacts of COVID-19 are affecting the entire global economy, individual companies and investment products, the funds, and the market in general. There is significant uncertainty around the extent and duration of business disruptions related to COVID-19 and the impacts may last for an extended period of time. COVID-19 has led to significant uncertainty and volatility in the financial markets.
11. SUBSEQUENT EVENTS
Effective after the close of business on November 1, 2021, the sale transaction of Wells Fargo Asset Management by Wells Fargo & Company to GTCR LLC and Reverence Capital Partners, L.P. was closed. In connection with the closing of the transaction, Wells Fargo Asset Management became known as Allspring Global Investments (“Allspring”) and various entities that provide services to the Fund changed their names to “Allspring”, including Allspring Funds Management, LLC (formerly Wells Fargo Funds Management, LLC), the investment manager to the Fund, Allspring Global Investments, LLC (formerly Wells Capital Management, LLC) and Allspring Global Investments (UK) Limited (formerly Wells Fargo Asset Management (International) Limited), both registered investment advisers providing sub-advisory services to certain funds, and Allspring Funds Distributor, LLC (formerly Wells Fargo Funds Distributor, LLC), the Fund's principal underwriter. These name changes have been reflected within this report.
26 | Wells Fargo Specialized Technology Fund
Other information (unaudited)
PROXY VOTING INFORMATION
A description of the policies and procedures used to determine how to vote proxies relating to portfolio securities is available without charge, upon request, by calling 1-800-222-8222, visiting our website at allspringglobal.com, or visiting the SEC website at sec.gov. Information regarding how the proxies related to portfolio securities were voted during the most recent 12-month period ended June 30 is available on the website at allspringglobal.com or by visiting the SEC website at sec.gov.
SPECIAL MEETING OF SHAREHOLDERS
On September 15, 2021, a Special Meeting of Shareholders for the Fund was held to consider the following proposals. The results of the proposals are indicated below.
Proposal 1 – To consider and approve a new investment management agreement with Wells Fargo Funds Management, LLC*.
| Shares voted “For” | 15,664,863 |
| Shares voted “Against” | 1,345,072 |
| Shares voted “Abstain” | 1,511,364 |
Proposal 2 – To consider and approve a new investment subadvisory agreement with Allianz Global Investors U.S., LLC.
| Shares voted “For” | 15,402,206 |
| Shares voted “Against” | 1,513,886 |
| Shares voted “Abstain” | 1,605,207 |
Proposal 3 – To approve the use of a "multi-manager" structure whereby Wells Fargo Funds Management, LLC* would be able, subject to Board approval, to select subadvisers and enter into or amend subadvisory agreements with them, without obtaining shareholder approval.
| Shares voted “For” | 14,364,369 |
| Shares voted “Against” | 2,557,875 |
| Shares voted “Abstain” | 1,599,055 |
* Effective November 1, 2021, known as Allspring Funds Management, LLC.
QUARTERLY PORTFOLIO HOLDINGS INFORMATION
The Fund files its complete schedule of portfolio holdings with the SEC for the first and third quarters of each fiscal year as an exhibit to its reports on Form N-PORT. Shareholders may view the filed Form N-PORT by visiting the SEC website at sec.gov.
Wells Fargo Specialized Technology Fund | 27
Other information (unaudited)
BOARD OF TRUSTEES AND OFFICERS
Each of the Trustees and Officers listed in the table below acts in identical capacities for each fund in the Wells Fargo family of funds, which consists of 139 mutual funds comprising the Wells Fargo Funds Trust, Wells Fargo Variable Trust, Wells Fargo Master Trust and four closed-end funds (collectively the “Fund Complex”). This table should be read in conjunction with the Prospectus and the Statement of Additional Information1. The mailing address of each Trustee and Officer is 525 Market Street, 12th Floor, San Francisco, CA 94105. Each Trustee and Officer serves an indefinite term, however, each Trustee serves such term until reaching the mandatory retirement age established by the Trustees.
Independent Trustees
Name and
year of birth | Position held and
length of service* | Principal occupations during past five years or longer | Current other
public company or
investment
company
directorships |
William R. Ebsworth
(Born 1957) | Trustee,
since 2015 | Retired. From 1984 to 2013, equities analyst, portfolio manager, research director and chief investment officer at Fidelity Management and Research Company in Boston, Tokyo, and Hong Kong, and retired in 2013 as Chief Investment Officer of Fidelity Strategic Advisers, Inc. where he led a team of investment professionals managing client assets. Prior thereto, Board member of Hong Kong Securities Clearing Co., Hong Kong Options Clearing Corp., the Thailand International Fund, Ltd., Fidelity Investments Life Insurance Company, and Empire Fidelity Investments Life Insurance Company. Audit Committee Chair and Investment Committee Chair of the Vincent Memorial Hospital Endowment (non-profit organization). Mr. Ebsworth is a CFA® charterholder. | N/A |
Jane A. Freeman
(Born 1953) | Trustee,
since 2015;
Chair Liaison,
since 2018 | Retired. From 2012 to 2014 and 1999 to 2008, Chief Financial Officer of Scientific Learning Corporation. From 2008 to 2012, Ms. Freeman provided consulting services related to strategic business projects. Prior to 1999, Portfolio Manager at Rockefeller & Co. and Scudder, Stevens & Clark. Board member of the Harding Loevner Funds from 1996 to 2014, serving as both Lead Independent Director and chair of the Audit Committee. Board member of the Russell Exchange Traded Funds Trust from 2011 to 2012 and the chair of the Audit Committee. Ms. Freeman is also an inactive Chartered Financial Analyst. | N/A |
Isaiah Harris, Jr.
(Born 1952) | Trustee,
since 2009; Audit
Committee
Chair,
since 2019 | Retired. Chairman of the Board of CIGNA Corporation since 2009, and Director since 2005. From 2003 to 2011, Director of Deluxe Corporation. Prior thereto, President and CEO of BellSouth Advertising and Publishing Corp. from 2005 to 2007, President and CEO of BellSouth Enterprises from 2004 to 2005 and President of BellSouth Consumer Services from 2000 to 2003. Emeritus member of the Iowa State University Foundation Board of Governors. Emeritus Member of the Advisory Board of Iowa State University School of Business. Advisory Board Member, Palm Harbor Academy (private school). Mr. Harris is a certified public accountant (inactive status). | CIGNA Corporation |
Judith M. Johnson
(Born 1949) | Trustee,
since 2008 | Retired. Prior thereto, Chief Executive Officer and Chief Investment Officer of Minneapolis Employees Retirement Fund from 1996 to 2008. Ms. Johnson is an attorney, certified public accountant and a certified managerial accountant. | N/A |
David F. Larcker
(Born 1950) | Trustee,
since 2009 | James Irvin Miller Professor of Accounting at the Graduate School of Business (Emeritus), Stanford University, Director of the Corporate Governance Research Initiative and Senior Faculty of The Rock Center for Corporate Governance since 2006. From 2005 to 2008, Professor of Accounting at the Graduate School of Business, Stanford University. Prior thereto, Ernst & Young Professor of Accounting at The Wharton School, University of Pennsylvania from 1985 to 2005. | N/A |
28 | Wells Fargo Specialized Technology Fund
Other information (unaudited)
Name and
year of birth | Position held and
length of service* | Principal occupations during past five years or longer | Current other
public company or
investment
company
directorships |
Olivia S. Mitchell
(Born 1953) | Trustee,
since 2006;
Nominating and
Governance
Committee Chair,
since 2018 | International Foundation of Employee Benefit Plans Professor, Wharton School of the University of Pennsylvania since 1993. Director of Wharton’s Pension Research Council and Boettner Center on Pensions & Retirement Research, and Research Associate at the National Bureau of Economic Research. Previously, Cornell University Professor from 1978 to 1993. | N/A |
Timothy J. Penny
(Born 1951) | Trustee,
since 1996;
Chair,
since 2018 | President and Chief Executive Officer of Southern Minnesota Initiative Foundation, a non-profit organization, since 2007. Member of the Board of Trustees of NorthStar Education Finance, Inc., a non-profit organization, since 2007. | N/A |
James G. Polisson
(Born 1959) | Trustee,
since 2018 | Retired. Chief Marketing Officer, Source (ETF) UK Services, Ltd, from 2015 to 2017. From 2012 to 2015, Principal of The Polisson Group, LLC, a management consulting, corporate advisory and principal investing company. Chief Executive Officer and Managing Director at Russell Investments, Global Exchange Traded Funds from 2010 to 2012. Managing Director of Barclays Global Investors from 1998 to 2010 and Global Chief Marketing Officer for iShares and Barclays Global Investors from 2000 to 2010. Trustee of the San Francisco Mechanics’ Institute, a non-profit organization, from 2013 to 2015. Board member of the Russell Exchange Traded Fund Trust from 2011 to 2012. Director of Barclays Global Investors Holdings Deutschland GmbH from 2006 to 2009. Mr. Polisson is an attorney and has a retired status with the Massachusetts and District of Columbia Bar Associations. | N/A |
Pamela Wheelock
(Born 1959) | Trustee,
since January
2020; previously
Trustee from
January 2018 to
July 2019 | Board member of the Destination Medical Center Economic Development Agency, Rochester, Minnesota since 2019. Interim President of the McKnight Foundation from January to September 2020. Acting Commissioner, Minnesota Department of Human Services, July 2019 through September 2019. Human Services Manager (part-time), Minnesota Department of Human Services, October 2019 through December 2019. Chief Operating Officer, Twin Cities Habitat for Humanity from 2017 to 2019. Vice President of University Services, University of Minnesota from 2012 to 2016. Prior thereto, on the Board of Directors, Governance Committee and Finance Committee for the Minnesota Philanthropy Partners (Saint Paul Foundation) from 2012 to 2018, Interim Chief Executive Officer of Blue Cross Blue Shield of Minnesota from 2011 to 2012, Chairman of the Board from 2009 to 2012 and Board Director from 2003 to 2015. Vice President, Leadership and Community Engagement, Bush Foundation, Saint Paul, Minnesota (a private foundation) from 2009 to 2011. Executive Vice President and Chief Financial Officer, Minnesota Sports and Entertainment from 2004 to 2009 and Senior Vice President from 2002 to 2004. Executive Vice President of the Minnesota Wild Foundation from 2004 to 2008. Commissioner of Finance, State of Minnesota, from 1999 to 2002. Currently Board Chair of the Minnesota Wild Foundation since 2010. | N/A |
* Length of service dates reflect the Trustee’s commencement of service with the Trust’s predecessor entities, where applicable.
Wells Fargo Specialized Technology Fund | 29
Other information (unaudited)
Officers2
Name and
year of birth | Position held and
length of service | Principal occupations during past five years or longer |
Andrew Owen
(Born 1960) | President,
since 2017 | President, Chief Executive Officer and Director of Allspring Funds Management, LLC since 2017 and co-president of Galliard Capital Management, LLC, an affiliate of Allspring Funds Management, LLC, since 2019. Prior thereto, Head of Affiliated Managers, Allspring Global Investments, from 2014 to 2019 and Executive Vice President responsible for marketing, investments and product development for Allspring Funds Management, LLC, from 2009 to 2014. In addition, Mr. Owen was an Executive Vice President of Wells Fargo & Company from 2014 to 2021. |
Jeremy DePalma
(Born 1974) | Treasurer,
since 2012
(for certain funds in
the Fund Complex);
since 2021 (for
the remaining funds in the
Fund Complex) | Senior Vice President of Allspring Funds Management, LLC since 2009. Senior Vice President of Evergreen Investment Management Company, LLC from 2008 to 2010 and head of the Fund Reporting and Control Team within Fund Administration. |
Kate McKinley
(Born 1977) | Chief Legal Officer and Chief Compliance Officer,
since 2021 | Chief Legal Officer of Allspring Global Investments since 2021. Prior thereto, held various roles at State Street Global Advisors, Inc. beginning in 2010, including serving as Senior Vice President and General Counsel from 2019 to 2021. Previously served as Assistant General Counsel for Bank of America Corporation from 2005 to 2010 and as an Associate at WilmerHale from 2002 to 2005. |
Matthew Prasse
(Born 1983) | Secretary,
since 2021 | Senior Counsel of the Allspring Legal Department since 2021. Senior Counsel of the Wells Fargo Legal Department from 2018 to 2021. Previously, Counsel for Barings LLC from 2015 to 2018. Prior to joining Barings, Associate at Morgan, Lewis & Bockius LLP from 2008 to 2015. |
1 The Statement of Additional Information includes additional information about the Trustees and is available, without charge, upon request, by calling 1-800-222-8222 or by visiting the website at allspringglobal.com.
2 For those Officers with tenures at Allspring Global Investments and/or Allspring Funds Management, LLC that began prior to 2021, such tenures include years of service during which these businesses/entities were known as Wells Fargo Asset Management and Wells Fargo Funds Management, LLC, respectively.
30 | Wells Fargo Specialized Technology Fund
Board considerations (unaudited)
BOARD CONSIDERATION OF INVESTMENT MANAGEMENT AND SUB-ADVISORY AGREEMENTS:
Board Considerations – Current Agreements
Under the Investment Company Act of 1940 (the “1940 Act”), the Board of Trustees (the “Board”) of Wells Fargo Funds Trust (the “Trust”) must determine annually whether to approve the continuation of the Trust’s investment management and sub-advisory agreements. In this regard, at a Board meeting held on May 17-19, 2021 (the “Meeting”), the Board, all the members of which have no direct or indirect interest in the investment management and sub-advisory agreements and are not “interested persons” of the Trust, as defined in the 1940 Act (the “Independent Trustees”), reviewed and approved for Wells Fargo Specialized Technology Fund (the “Fund”): (i) an investment management agreement (the “Management Agreement”) with Wells Fargo Funds Management, LLC (“Funds Management”); and (ii) an investment sub-advisory agreement (the “Sub-Advisory Agreement”) with Allianz Global Investors U.S. LLC (the “Sub-Adviser”). The Management Agreement and the Sub-Advisory Agreement are collectively referred to as the “Advisory Agreements.”
The Board noted that Wells Fargo & Company recently announced that it had entered into a definitive agreement to sell Wells Fargo Asset Management (“WFAM”), which includes Funds Management, to GTCR LLC and Reverence Capital Partners, L.P. and/or their affiliates (the “Transaction”). The Board further noted that the Transaction would result in a change-of-control of Funds Management, which would be considered to be an assignment that would result in the termination of the Management Agreement. In light of the Transaction, the Board separately considered for approval a new investment management agreement with Funds Management and a new sub-advisory agreement with the Sub-Adviser (the “New Agreements”) that would replace the Advisory Agreements upon consummation of the Transaction, subject to approval of the New Agreements by the Fund’s shareholders. The Board also considered for approval interim agreements to go into effect in the event shareholders do not approve the New Agreements before the Transaction is completed. The interim agreements would allow the Manager and the Sub-Adviser to continue providing services to the Fund while the Fund continues to seek shareholder approval of the New Agreements. The Board noted that the terms of the interim agreements would be identical to those of the current Advisory Agreements, except for the term and certain escrow provisions.
At the Meeting, the Board considered the factors and reached the conclusions described below relating to the selection of Funds Management and the Sub-Adviser and the approval of the Advisory Agreements. Prior to the Meeting, including at Board meetings held in April and May 2021, the Trustees conferred extensively among themselves and with representatives of Funds Management about these matters. Also, the Board has adopted a team-based approach, with each team consisting of a sub-set of Trustees, to assist the full Board in the discharge of its duties in reviewing investment performance and other matters throughout the year. The Independent Trustees were assisted in their evaluation of the Advisory Agreements by independent legal counsel, from whom they received separate legal advice and with whom they met separately.
In providing information to the Board, Funds Management and the Sub-Adviser were guided by a detailed set of requests for information submitted to them by independent legal counsel on behalf of the Independent Trustees at the start of the Board’s annual contract renewal process earlier in 2021. In considering and approving the Advisory Agreements, the Trustees considered the information they believed relevant, including but not limited to the information discussed below. The Board considered not only the specific information presented in connection with the Meeting, but also the knowledge gained over time through interaction with Funds Management and the Sub-Adviser about various topics. In this regard, the Board reviewed reports of Funds Management at each of its quarterly meetings, which included, among other things, portfolio reviews and investment performance reports. In addition, the Board and the teams mentioned above confer with portfolio managers at various times throughout the year. The Board did not identify any particular information or consideration that was all-important or controlling, and each individual Trustee may have attributed different weights to various factors.
After its deliberations, the Board unanimously determined that the compensation payable to Funds Management and the Sub-Adviser under each of the Advisory Agreements was reasonable, and approved the continuation of the Advisory Agreements for a one-year term. The Board considered the approval of the Advisory Agreements for the Fund as part of its consideration of agreements for funds across the complex, but its approvals were made on a fund-by-fund basis. The following summarizes a number of important, but not necessarily all, factors considered by the Board in support of its approvals.
Nature, extent and quality of services
The Board received and considered various information regarding the nature, extent and quality of services provided to the Fund by Funds Management and the Sub-Adviser under the Advisory Agreements. This information included a description of the investment advisory services and Fund-level administrative services covered by the Management Agreement, as well as, among other things, a summary of the background and experience of senior management of WFAM, of which Funds Management is a part, and a summary of investments made in the business of WFAM. The Board also received a description of Funds
Wells Fargo Specialized Technology Fund | 31
Board considerations (unaudited)
Management’s and the Sub-Adviser’s business continuity plans, including a summary of the performance of such plans and any changes thereto during the COVID-19 pandemic, and of their approaches to data privacy and cybersecurity. The Board also received and reviewed information about Funds Management’s role as administrator of the Fund’s liquidity risk management program, Funds Management’s approach to risk management, and Funds Management’s intermediary and vendor oversight program.
The Board also considered the qualifications, background, tenure and responsibilities of each of the portfolio managers primarily responsible for the day-to-day portfolio management of the Fund. The Board evaluated the ability of Funds Management and the Sub-Adviser to attract and retain qualified investment professionals, including research, advisory and supervisory personnel.
The Board further considered the compliance programs and compliance records of Funds Management and the Sub-Adviser. In addition, the Board took into account the full range of services provided to the Fund by Funds Management and its affiliates. The Board also considered information about retention and back-up arrangements that have been put into place with respect to key personnel of WFAM in connection with the anticipated Transaction, noting that WFAM provided assurances that the announcement and eventual culmination of the Transaction is not expected to result in any diminution in the nature or quality of services provided to the Fund.
Fund investment performance and expenses
The Board considered the investment performance results for the Fund over various time periods ended December 31, 2020. The Board considered these results in comparison to the investment performance of funds in a universe that was determined by Broadridge Inc. (“Broadridge”) to be similar to the Fund (the “Universe”), and in comparison to the Fund’s benchmark index and to other comparative data. Broadridge is an independent provider of investment company data. The Board received a description of the methodology used by Broadridge to select the mutual funds in the performance Universe. The Board noted that the investment performance of the Fund (Class A) was higher than the average investment performance of the Universe for all periods under review. The Board also noted that the investment performance of the Fund was higher than its benchmark index, the S& P North American Technology TR Index, for all periods under review except for the ten-year period.
The Board also received and considered information regarding the Fund’s net operating expense ratios and their various components, including actual management fees, custodian and other non-management fees, and Rule 12b-1 and non-Rule 12b-1 shareholder service fees. The Board considered these ratios in comparison to the median ratios of funds in class-specific expense groups that were determined by Broadridge to be similar to the Fund (the “Groups”). The Board received a description of the methodology used by Broadridge to select the mutual funds in the expense Groups and an explanation of how funds comprising expense groups and their expense ratios may vary from year-to-year. Based on the Broadridge reports, the Board noted that the net operating expense ratios of the Fund were equal to or in range of the median net operating expense ratios of the expense Groups for each share class.
The Board took into account the Fund’s investment performance and expense information provided to it among the factors considered in deciding to re-approve the Advisory Agreements.
Investment management and sub-advisory fee rates
The Board reviewed and considered the contractual fee rates payable by the Fund to Funds Management under the Management Agreement, as well as the contractual fee rates payable by the Fund to Funds Management for class-level administrative services under a Class-Level Administration Agreement, which include, among other things, class-level transfer agency and sub-transfer agency costs (collectively, the “Management Rates”). The Board also reviewed and considered the contractual investment sub-advisory fee rates that are payable by Funds Management to the Sub-Adviser for investment sub-advisory services.
Among other information reviewed by the Board was a comparison of the Fund’s Management Rates with the average contractual investment management fee rates of funds in the expense Groups at a common asset level as well as transfer agency costs of the funds in the expense Groups. The Board noted that the Management Rates of the Fund were in range of the sum of the average rates for the Fund’s expense Groups for all share classes, except for Class A. The Board noted that the net operating expense ratios of the Fund were equal to or in range of the median net operating expense ratios of the expense Groups for each share class, including Class A. The Board further noted that the contractual management fees applicable to all share classes were reduced in 2020.
The Board also received and considered information about the portion of the total management fee that was retained by Funds Management after payment of the fee to the Sub-Adviser for sub-advisory services. The Board considered this amount in comparison to the median amount retained by advisers to funds in a sub-advised expense universe that was determined by Broadridge to be similar to the Fund. The Board noted the small size of the sub-advised expense universe. In assessing the reasonableness of this amount, the Board received and evaluated information about the nature and extent of responsibilities
32 | Wells Fargo Specialized Technology Fund
Board considerations (unaudited)
retained and risks assumed by Funds Management and not delegated to or assumed by the Sub-Adviser, and about Funds Management’s on-going oversight services. The Board also considered that the sub-advisory fees paid to the Sub-Adviser had been negotiated by Funds Management on an arm’s length basis, and it discussed and accepted Funds Management’s proposal to amend the Subadvisory Agreement to reduce the subadvisory fees paid by Funds Management to the Sub-Adviser.
The Board also received and considered information about the nature and extent of services offered and fee rates charged by Funds Management and the Sub-Adviser to other types of clients with investment strategies similar to those of the Fund. In this regard, the Board received information about the significantly greater scope of services, and compliance, reporting and other legal burdens and risks of managing proprietary mutual funds compared with those associated with managing assets of other types of clients, including third-party sub-advised fund clients and non-mutual fund clients such as institutional separate accounts.
Based on its consideration of the factors and information it deemed relevant, including those described here, the Board determined that the compensation payable to Funds Management under the Management Agreement and to the Sub-Adviser under the Sub-Advisory Agreement was reasonable.
Profitability
The Board received and considered information concerning the profitability of Funds Management, as well as the profitability of both WFAM and Wells Fargo & Co. (“Wells Fargo”) from providing services to the fund family as a whole. Funds Management reported on the methodologies and estimates used in calculating profitability, including a description of the methodology used to allocate certain expenses. Among other things, the Board noted that the levels of profitability reported on a fund-by-fund basis varied widely, depending on factors such as the size, type and age of fund. The Board did not consider profitability with respect to the Sub-Adviser, as the sub-advisory fees paid to the Sub-Adviser had been negotiated by Funds Management on an arm’s-length basis.
Based on its review, the Board did not deem the profits reported by Funds Management, WFAM or Wells Fargo from services provided to the Fund to be at a level that would prevent it from approving the continuation of the Advisory Agreements.
Economies of scale
The Board received and considered information about the potential for Funds Management to experience economies of scale in the provision of management services to the Fund, the difficulties of calculating economies of scale at an individual fund level, and the extent to which potential scale benefits are shared with Fund shareholders. The Board noted the existence of breakpoints in the Fund’s management fee structure, which operate generally to reduce the Fund’s expense ratios as the Fund grows in size, and the size of the Fund in relation to such breakpoints.
The Board considered that in addition to management fee breakpoints, Funds Management shares potential economies of scale from its management business in a variety of ways, including through fee waiver and expense reimbursement arrangements, competitive management fee rates set at the outset without regard to breakpoints, and investments in the business intended to enhance services available to shareholders.
The Board concluded that Funds Management’s arrangements with respect to the Fund, including contractual breakpoints, constituted a reasonable approach to sharing potential economies of scale with the Fund and its shareholders.
Other benefits to Funds Management and the Sub-Adviser
The Board received and considered information regarding potential “fall-out” or ancillary benefits received by Funds Management, the Sub-Adviser, and their affiliates as a result of their relationships with the Fund. Ancillary benefits could include, among others, benefits directly attributable to other relationships with the Fund and benefits potentially derived from an increase in Funds Management’s and the Sub-Adviser’s business as a result of their relationships with the Fund. The Board noted that various affiliates of Funds Management may receive distribution-related fees, shareholder servicing payments and sub-transfer agency fees in respect of shares sold or held through them and services provided.
The Board also reviewed information about soft dollar credits earned and utilized by the Sub-Adviser, fees earned by Funds Management and its affiliate from managing a private investment vehicle for the fund family’s securities lending collateral, and commissions earned by an affiliated broker from portfolio transactions.
Based on its consideration of the factors and information it deemed relevant, including those described here, the Board did not find that any ancillary benefits received by Funds Management, the Sub-Adviser, and their affiliates were unreasonable.
Wells Fargo Specialized Technology Fund | 33
Board considerations (unaudited)
Conclusion
At the Meeting, after considering the above-described factors and based on its deliberations and its evaluation of the information described above, the Board unanimously determined that the compensation payable to Funds Management and the Sub-Adviser under each of the Advisory Agreements was reasonable, and approved the continuation of the Advisory Agreements for a one-year term.
34 | Wells Fargo Specialized Technology Fund
Board considerations (unaudited)
Board Considerations – New Agreements
Overview of the Board evaluation process
At a meeting held on May 17-19, 2021 (the “Board Meeting”), the Board of Trustees (the “Board”) of Wells Fargo Funds Trust (the “Trust”, and the series identified below, the “Funds”) approved the continuation of each Fund’s current Investment Management Agreement (the “Current Investment Management Agreement”) and the current Wells Cap Sub-Advisory Agreement (the “Current Wells Cap Sub-Advisory Agreement”, and collectively, the “Current Agreements”).
| Wells Fargo Absolute Return Fund |
| Wells Fargo Core Plus Bond Fund |
| Wells Fargo Growth Balanced Fund |
| Wells Fargo Moderate Balanced Fund |
| Wells Fargo Specialized Technology Fund |
| Wells Fargo Spectrum Aggressive Growth Fund |
| Wells Fargo Spectrum Conservative Growth Fund |
| Wells Fargo Spectrum Growth Fund |
| Wells Fargo Spectrum Income Allocation Fund |
| Wells Fargo Spectrum Moderate Growth Fund |
Each Trustee on the Board is not an “interested person” (as defined in the Investment Company Act of 1940 (the “1940 Act”)) of the Funds (collectively, the “Independent Trustees”). The process followed by the Board in considering and approving the continuation of the Current Agreements is referred to herein as the “2021 Annual Approval Process.”
As noted above, the closing of the sale of Wells Fargo Asset Management (“WFAM”) to a holding company (“NewCo”) affiliated with private funds of GTCR LLC (“GTCR”) and of Reverence Capital Partners, L.P. (“Reverence Capital”, and such transaction, the “Transaction”) will result in a change of control of Wells Fargo Funds Management LLC (“Funds Management”) and Wells Capital Management Incorporated (“Wells Capital”, and together with Funds Management, the “Advisers”), which will be considered to be an “assignment” of each Fund’s Current Agreements under the 1940 Act that will result in the automatic termination of each Fund’s Current Agreements. In light of the expected termination of each Fund’s Current Agreements upon the closing, at the Board Meeting the Board also considered and approved: (i) (i) a new Investment Management Agreement (the “New Investment Management Agreement”) between the Trust, on behalf of each Fund, and Funds Management; (ii) a new Sub-Advisory Agreement (the “New Wells Capital Sub-Advisory Agreement”) among the Trust, Funds Management and Wells Capital with respect to Core Plus Bond Fund, Growth Balanced Fund, Moderate Balanced Fund, Spectrum Aggressive Growth Fund, Spectrum Conservative Growth Fund, Spectrum Growth Fund, Spectrum Income Allocation Fund, and Spectrum Moderate Growth Fund; and (iii) a new Sub-Advisory Agreement (the “New AllianzGI U.S. Sub-Advisory Agreement”, and collectively, the “New Agreements”) among the Trust, Funds Management and Allianz Global Investors U.S., LLC (“AllianzGI U.S.”, and together with Wells Capital, the “Sub-Advisers”) with respect to the Specialized Technology Fund, each of which is intended to go into effect upon the closing. The process followed by the Board in reviewing and approving the New Agreements is referred to herein as the “New Agreement Approval Process.”
At a series of meetings held in April and May 2021 (collectively, “April and May 2021 Meetings”) and at the Board Meeting, the Trustees conferred extensively among themselves and with senior representatives of Funds Management, GTCR and Reverence Capital about the New Agreements and related matters. The Board reviewed and discussed information furnished by Funds Management, GTCR and Reverence Capital that the Board considered reasonably necessary to evaluate the terms of the New Agreements and the services to be provided. At these meetings, senior representatives from Funds Management, GTCR and Reverence Capital made presentations to, and responded to questions from, the Board.
In providing information to the Board in connection with the 2021 annual approval process for the Current Agreements (the “2021 Annual Approval Process”) and the New Agreement Approval Process, Funds Management, GTCR and Reverence Capital (as applicable) were guided by requests for information submitted by independent legal counsel on behalf of the Independent Trustees. In considering and approving the New Agreements, the Trustees considered the information they believed relevant, including but not limited to the information discussed herein. The Board considered not only the specific information presented in connection with the April and May 2021 Meetings as well as the Board Meeting, but also the knowledge gained over time through interaction with Funds Management and the Sub-Advisers about various topics. In this regard, the Board reviews reports of Funds Management at each of its regular Board meetings, which includes, among other things, portfolio reviews and investment performance reports. In addition, the Board confers with portfolio managers at various times throughout the year. The Board was assisted in its evaluation of the New Agreements by independent legal counsel, from whom the Independent Trustees received
Wells Fargo Specialized Technology Fund | 35
Board considerations (unaudited)
separate legal advice and with whom the Independent Trustees met separately. The Board did not identify any particular information or consideration that was all-important or controlling, and each individual Trustee may have attributed different weights to various factors.
Among other information considered by the Board in connection with the Transaction was:
| ■ | Information regarding the Transaction: information about the structure, financing sources and material terms and conditions of the Transaction, including the expected impact on the businesses conducted by the Advisers and by Wells Fargo Funds Distributor LLC, as the distributor of Fund shares. |
| ■ | Information regarding NewCo, GTCR and Reverence Capital: (i) information about NewCo, including information about its expected financial condition and access to capital, and senior leadership team; (ii) the experience of senior management at GTCR and Reverence Capital in acquiring portfolio companies; (iii) the plan to operationalize NewCo, including the transition of necessary infrastructure services through a transition services agreement with Wells Fargo under which Wells Fargo will continue to provide NewCo with certain services for a specified period of time after the closing; and (iv) information regarding regulatory matters, compliance, and risk management functions at NewCo, including resources to be dedicated thereto. |
| ■ | Impact of the Transaction on WFAM and Service Providers: (i) information regarding any changes to personnel and/or other resources of the Advisers as a result of the Transaction, including assurances regarding comparable and competitive compensation arrangements to attract and retain highly qualified personnel; and (ii) information about the organizational and operating structure with respect to NewCo, the Advisers and the Funds. |
| ■ | Impact of the Transaction on the Funds and their Shareholders: (i) information regarding anticipated benefits to the Funds as a result of the Transaction; (ii) a commitment that the Funds would not bear any expenses, directly or indirectly, in connection with the Transaction; (iii) confirmation that the Advisers intend to continue to manage the Funds in a manner consistent with each Fund’s current investment objectives and principal investments strategies; and (iv) a commitment that neither NewCo nor WFAM will take any steps that would impose any “unfair burden” (as that term is used in section 15(f)(1)(B) of the 1940 Act) on the Funds as a result of the Transaction. |
With respect to the New Agreements, the Board considered: (i) a representation that, after the closing, all of the Funds will continue to be managed and advised by their current Advisers, and, for Specialized Technology Fund only, AllianzGI U.S., and that the same portfolio managers of the Sub-Advisers are expected to continue to manage the Funds after the Transaction; (ii) information regarding the terms of the New Agreements, including changes as compared to the Current Agreements; (iii) information confirming that the fee rates payable under the New Agreements will not increase as a result of the Transaction as compared to the rates under the Current Agreements; and (iv) assurances that the Transaction is not expected to cause any diminution with respect to the nature, extent and quality of any of the services currently provided to the Funds by the Advisers and, for Specialized Technology Fund only, AllianzGI U.S., as a result of the Transaction.
In addition to considering information furnished specifically to evaluate the impact of the Transaction on the Funds and their respective shareholders in connection with the New Agreement Approval Process, the Board considered information furnished at prior meetings of the Board and its committees, including detailed information provided in connection with the 2021 Annual Approval Process. In this regard, in connection with the 2021 Annual Approval Process, the Board received information about complex-wide and individual Fund performance, fees and expenses, including: (i) a report from an independent data provider comparing the investment performance of each Fund to the investment performance of comparable funds and benchmark indices, over various time periods; (ii) a report from an independent data provider comparing each Fund’s total expense ratio (and its components) to those of comparable funds; (iii) comparative information concerning the fees charged and services provided by Funds Management and the Sub-Advisers to each Fund in managing other accounts (which may include other mutual funds, collective investment funds and institutional accounts), if any, that employ investment strategies and techniques similar to those used in managing such Fund(s); and (iv) profitability analyses of Funds Management, as well as the profitability of both WFAM and Wells Fargo from providing services to the fund family as a whole.
After its deliberations, the Board unanimously determined that the compensation payable to Funds Management and the Sub-Advisers under the New Agreements is reasonable, approved the New Agreements for a two-year term, and voted to recommend that Fund shareholders approve the New Agreements. The Board considered the approval of the New Agreements as part of its consideration of agreements for funds across the complex, but its approvals were made on a fund-by-fund basis. The following summarizes a number of important, but not necessarily all, factors considered by the Board in support of its approvals.
Nature, extent and quality of services
In connection with the 2021 Annual Approval Process, the Board received and considered various information regarding the nature, extent and quality of services provided to the Fund by Funds Management and the Sub-Advisers under the Advisory
36 | Wells Fargo Specialized Technology Fund
Board considerations (unaudited)
Agreements. This information included a description of the investment advisory services and Fund-level administrative services covered by the Current Management Agreement, as well as, among other things, a summary of the background and experience of senior management of WFAM, of which Funds Management and Wells Capital are a part, and a summary of investments made in the business of WFAM. The Board also received a description of Funds Management’s and the Sub-Advisers’ business continuity plans, including a summary of the performance of such plans and any changes thereto during the COVID-19 pandemic, and of their approaches to data privacy and cybersecurity. The Board also received and reviewed information about Funds Management’s role as administrator of the Funds’ liquidity risk management program, Funds Management’s approach to risk management, and Funds Management’s intermediary and vendor oversight program.
In connection with the 2021 Annual Approval Process, the Board also considered the qualifications, background, tenure and responsibilities of each of the portfolio managers primarily responsible for the day-to-day portfolio management of the Funds. The Board evaluated the ability of Funds Management and the Sub-Advisers to attract and retain qualified investment professionals, including research, advisory and supervisory personnel.
In connection with the 2021 Annual Approval Process, the Board further considered the compliance programs and compliance records of Funds Management and the Sub-Advisers. In addition, the Board took into account the full range of services provided to the Fund by Funds Management and its affiliates.
In connection with the New Agreement Approval Process, the Board considered, among other information, the structure of the Transaction and expected impact, if any, of the Transaction on the operations, facilities, organization and personnel of Funds Management and the Sub-Advisers. The Board received assurances from Funds Management that each Fund will continue to be advised by its current Sub-Adviser after the closing, and that the same individual portfolio managers are expected to continue to manage the Funds after the closing. With respect to the recruitment and retention of key personnel, the Board noted information from GTCR, Reverence Capital and the Advisers regarding the potential benefits for employees of joining NewCo. The Board recognized that the personnel who had been extended offers may not accept such offers and personnel changes may occur in the future in the ordinary course.
In addition, the Board considered information regarding the infrastructure, operational capabilities and support staff in place to assist in the portfolio management and operations of the Funds, including the provision of administrative services, and the anticipated impact of the Transaction on such matters. The Board also considered the business-related and other risks to which the Advisers may be subject in managing the Funds and in connection with the Transaction. The Board also considered the transition and integration plans as a result of the change in ownership of the Advisers from Wells Fargo to NewCo. The Board considered the resources and infrastructure that NewCo intends to devote to its compliance program to ensure compliance with applicable laws and regulations, as well as its risk management program and cybersecurity program. The Board also took into account assurances received from the Advisers, GTCR and Reverence Capital that the Transaction is not expected to cause any diminution in the nature, extent and quality of services provided by Funds Management and the Sub-Advisers to the Funds and their shareholders.
Fund investment performance and expenses
In connection with the 2021 Annual Approval Process, the Board considered the investment performance results for each Fund over various time periods ended December 31, 2020. The Board considered these results in comparison to the investment performance of funds in a universe that was determined by Broadridge Inc. (“Broadridge”) to be similar to each Fund (the “Universe”), and in comparison to each Fund’s benchmark index and to other comparative data. Broadridge is an independent provider of investment company data. The Board received a description of the methodology used by Broadridge to select the mutual funds in the performance Universe. Where applicable, the Board received information concerning, and discussed factors contributing to, underperformance of Funds relative to the Universe and benchmark for any underperformance periods.
In connection with the 2021 Annual Approval Process, the Board also received and considered information regarding each Fund’s net operating expense ratios and their various components, including actual management fees, custodian and other non-management fees, and Rule 12b-1 and non-Rule 12b-1 shareholder service fees. The Board considered these ratios in comparison to the median ratios of funds in class-specific expense groups that were determined by Broadridge to be similar to the Fund (the “Groups”). The Board received a description of the methodology used by Broadridge to select the mutual funds in the expense Groups and an explanation of how funds comprising expense groups and their expense ratios may vary from year-to-year.
In connection with the New Agreement Approval Process, the Board received a commitment that WFAM will maintain fee and expense commitments for at least two years after the closing. The Board took into account each Fund’s investment performance and expense information among the factors considered in deciding to approve the New Agreements.
Wells Fargo Specialized Technology Fund | 37
Board considerations (unaudited)
Investment management and sub-advisory fee rates
In connection with the 2021 Annual Approval Process, the Board reviewed and considered the contractual fee rates payable by each Fund to Funds Management under the Current Management Agreement, as well as the contractual fee rates payable by each Fund to Funds Management for class-level administrative services under a Class-Level Administration Agreement, which include, among other things, class-level transfer agency and sub-transfer agency costs (collectively, the “Management Rates”). The Board also reviewed and considered the contractual investment sub-advisory fee rates that are payable by Funds Management to each of the Sub-Advisers under the Current Sub-Advisory Agreements for investment sub-advisory services (the “Sub-Advisory Fee Rates”).
Among other information reviewed by the Board in connection with the 2021 Annual Approval Process, was a comparison of each Fund’s Management Rates with the average contractual investment management fee rates of funds in the expense Groups at a common asset level as well as transfer agency costs of the funds in the expense Groups.
In connection with the 2021 Annual Approval Process, the Board also received and considered information about the portion of the total management fee that was retained by Funds Management after payment of the Sub-Advisory Fee Rates. In assessing the reasonableness of this amount, the Board received and evaluated information about the nature and extent of responsibilities retained and risks assumed by Funds Management and not delegated to or assumed by the Sub-Advisers, and about Funds Management’s on-going oversight services. With respect to AllianzGI U.S., the Board also considered this amount in comparison to the median amount retained by advisers to funds in a sub-advised expense universe that was determined by Broadridge to be similar to the Specialized Technology Fund. In this regard, the Board noted the small size of the sub-advised expense universe. The Board also considered that the sub-advisory fees paid to AllianzGI U.S. had been negotiated by Funds Management on an arm’s length basis. Given the affiliation between Funds Management and Wells Capital, the Board ascribed limited relevance to the allocation of fees between them.
In connection with the 2021 Annual Approval Process, the Board also received and considered information about the nature and extent of services offered and fee rates charged by Funds Management and the Sub-Advisers to other types of clients, if any, with investment strategies similar to those of each Fund. In this regard, the Board received information about the significantly greater scope of services, and compliance, reporting and other legal burdens and risks of managing proprietary mutual funds compared with those associated with managing assets of other types of clients, including third-party sub-advised fund clients and non-mutual fund clients such as institutional separate accounts.
In connection with the New Agreement Approval Process, the Board noted the assurances received by it that there would be no increases to any of the Management Rates or the Sub-Advisory Fee Rates as a result of the Transaction. The Board also considered that the New Agreements do not change the computation method for calculating such fees, and there is no present intention to reduce expense waiver and reimbursement arrangements that are currently in effect. Based on its consideration of the factors and information it deemed relevant, including those described here, the Board determined that the compensation payable to Funds Management under the New Management Agreement and to each of the Sub-Advisers under the New Sub-Advisory Agreements was reasonable.
Profitability
In connection with the 2021 Annual Approval Process, the Board received and considered information concerning the profitability of Funds Management, as well as the profitability of both WFAM and Wells Fargo from providing services to the fund family as a whole. The Board noted that Wells Capital’s profitability information with respect to providing services to each Fund Wells Capital sub-advises and other funds in the family was subsumed in the WFAM and Wells Fargo profitability analysis. The Board did not consider profitability with respect to AllianzGI U.S., as the sub-advisory fees paid to AllianzGI U.S. had been negotiated by Funds Management on an arm’s-length basis.
Funds Management reported on the methodologies and estimates used in calculating profitability in connection with the 2021 Annual Approval Process, including a description of the methodology used to allocate certain expenses. Among other things, the Board noted that the levels of profitability reported on a fund-by-fund basis varied widely, depending on factors such as the size, type and age of fund.
In connection with the New Agreement Approval Process, the Board received certain information about NewCo’s projected financial condition, and reviewed with senior representatives of Funds Management, GTCR and Reverence Capital the underlying assumptions on which such information was based. The Board considered that NewCo is a newly formed entity, with no historical operations, revenues or expenses, and that it is difficult to predict with any degree of certainty the future profitability of NewCo and the Advisers from advisory activities under the New Agreements. The Board considered that the fee rates payable under the New Agreements will not increase as a result of the Transaction as compared to the rates under the Current Agreements, and that the current contractual expense limitations applicable to each Fund will not increase. The Board noted that if the New Agreements
38 | Wells Fargo Specialized Technology Fund
Board considerations (unaudited)
are approved by shareholders and the Transaction closes, the Board will have the opportunity in the future to review the profitability of NewCo and the Advisers from advisory activities under the New Agreements.
Economies of scale
In connection with the 2021 Annual Approval Process, the Board received and considered information about the potential for Funds Management to experience economies of scale in the provision of management services to the Funds, the difficulties of calculating economies of scale at an individual fund level, and the extent to which potential scale benefits are shared with Fund shareholders. The Board noted the existence of breakpoints in each Fund’s management fee structure, which operate generally to reduce the Fund’s expense ratios as the Fund grows in size, and the size of the Fund in relation to such breakpoints. The Board considered that, in addition to management fee breakpoints, Funds Management shares potential economies of scale from its management business in a variety of ways, including through fee waiver and expense reimbursement arrangements, competitive management fee rates set at the outset without regard to breakpoints, and investments in the business intended to enhance services available to shareholders.
In connection with the New Agreement Approval Process, the Board noted that NewCo and the Advisers may benefit from possible growth of the Funds resulting from enhanced distribution capabilities. However, the Board noted that other factors could also affect the potential for economies of scale, and that it was not possible to quantify any potential future economies of scale. Based upon the information furnished to the Board in connection with the 2021 Annual Approval Process and the New Agreement Approval Process, the Board concluded that Funds Management’s arrangements with respect to each Fund, including contractual breakpoints and expense limitation arrangements, constituted a reasonable approach to sharing potential economies of scale with the Fund and its shareholders.
“Fall-out” benefits to Funds Management and the Sub-Advisers
In connection with the 2021 Annual Approval Process, the Board received and considered information regarding potential “fall-out” or ancillary benefits received by Funds Management and its affiliates, including Wells Capital, and AllianzGI U.S. as a result of their relationships with the Funds. Ancillary benefits could include, among others, benefits directly attributable to other relationships with the Funds and benefits potentially derived from an increase in Funds Management’s and the Sub-Advisers’ business as a result of their relationships with the Funds. The Board noted that various current affiliates of Funds Management may receive distribution-related fees, shareholder servicing payments and sub-transfer agency fees in respect of shares sold or held through them and services provided.
In connection with the 2021 Annual Approval Process, the Board also reviewed information about soft dollar credits earned and utilized by the Sub-Advisers, fees earned by Funds Management and Wells Capital from managing a private investment vehicle for the fund family’s securities lending collateral, and commissions earned by an affiliated broker of Wells Fargo from portfolio transactions.
In connection with the New Agreement Approval Process, the Board received information to the effect that the Transaction is not expected to have a material impact on the fall-out benefits currently realized by Funds Management and its affiliates, including Wells Capital, and AllianzGI U.S. The information reviewed by the Board also noted that several of the ancillary benefits identified for WFAM would be potential ancillary benefits for NewCo, including that the scale and reputation of the Funds might benefit NewCo’s broader reputation, product initiatives, technology investment and talent acquisition. Based on its consideration of the factors and information it deemed relevant, including those described here, the Board did not find that any ancillary benefits expected to be received by Funds Management and its affiliates, including NewCo and Wells Capital, and AllianzGI U.S. under the New Agreements were unreasonable.
Conclusion
At the Board Meeting, after considering the above-described factors and based on its deliberations and its evaluation of the information described above, the Board unanimously determined that the compensation payable to Funds Management and to each of the Sub-Advisers under the New Agreements is reasonable, approved the New Agreements for a two-year term, and voted to recommend that Fund shareholders approve the New Agreements.
Wells Fargo Specialized Technology Fund | 39
Board considerations (unaudited)
Board Considerations - Interim Agreements
At a meeting held on May 17-19, 2021 (the “Board Meeting”), the Boards of Trustees (each, a “Board”, and collectively, the “Boards”) of Wells Fargo Funds Trust, Wells Fargo Master Trust, Wells Fargo Variable Trust, Wells Fargo Global Dividend Opportunity Fund, Wells Fargo Income Opportunities Fund, Wells Fargo Multi-Sector Income Fund and Wells Fargo Utilities and High Income Fund (each a “Trust”, and the series thereof, a “Fund”) reviewed and approved for the Trusts and Funds, as applicable: (i) interim investment management agreements (the “Interim Management Agreements”) with Wells Fargo Funds Management, LLC (“Funds Management”); (ii) interim investment advisory agreements (the “Interim Advisory Agreements”) with Funds Management; and (iii) interim sub-advisory agreements (the “Interim Sub-Advisory Agreements”) with each of Cooke & Bieler, L.P., Galliard Capital Management LLC (“Galliard”), Peregrine Capital Management Inc., Wells Capital Management, LLC (“WellsCap”), and Wells Fargo Asset Management (International) Limited (“WFAMI”, and collectively, the “Sub-Advisers”). Each Trustee on the Board is not an “interested person” (as defined in the Investment Company Act of 1940 (the “1940 Act”) of the Funds (collectively, the “Independent Trustees”). The Interim Management Agreements, Interim Advisory Agreements, and Interim Sub-Advisory Agreements are collectively referred to as the “Interim Advisory Agreements.”
At the Board Meeting, the Boards reviewed and approved the continuation of existing investment management, advisory and sub-advisory agreements (the “Current Advisory Agreements”) for each Trust and Fund, as applicable. The factors considered and conclusions reached by the Boards in approving the Current Advisory Agreements are summarized in the section entitled “Board Considerations – Current Agreements” of this shareholder report. The Boards noted that Wells Fargo & Company has entered into a definitive agreement to sell Wells Fargo Asset Management (“WFAM”), which includes Funds Management, Galliard, WellsCap and WFAMI (the “Affiliated Sub-Advisers”), to a holding company affiliated with private funds of GTCR LLC and Reverence Capital Partners, L.P. (the “Transaction”). The Boards further noted that the Transaction would result in a change-of-control of Funds Management and the Affiliated Sub-Advisers, which would be considered to be an “assignment” under the 1940 Act that would terminate the Current Advisory Agreements. At the Board Meeting, the Boards also reviewed and approved new investment management, advisory and sub-advisory agreements (the “New Advisory Agreements”) for each Trust and Fund, as applicable, that would replace the Current Advisory Agreements upon consummation of the Transaction, subject to approval of the New Advisory Agreements by the applicable Trust’s or Fund’s shareholders. The factors considered and conclusions reached by the Boards in approving the New Advisory Agreements are summarized in the section entitled “Board Considerations – New Agreements” of this shareholder report.
At the Board Meeting, the Boards also approved the Interim Advisory Agreements, which will go into effect for a Trust or Fund only in the event that shareholders of such Trust or Fund do not approve the New Advisory Agreement(s) for the Trust or Fund by the closing date of the Transaction, when the Current Advisory Agreements will terminate. The Board noted that, in such a circumstance, the Interim Advisory Agreements will permit continuity of management by allowing Funds Management and the Sub-Advisers to continue providing services to the Trust or Fund pursuant to the Interim Advisory Agreements while the Trust or Fund continues to solicit shareholder approval of such New Advisory Agreement(s). The Boards noted that the terms of the Interim Advisory Agreements are identical to those of the Current Advisory Agreements, except for the term and the addition of escrow provisions with respect to the advisory fees. The Boards also noted that the entities that would service the Funds and Trusts under the Interim Advisory Agreements are identical to those that provide services under the Current Advisory Agreements and those that will provide services under the New Advisory Agreements.
In approving the Interim Advisory Agreements, the Boards considered the same factors and reached the same conclusions as they considered and reached with respect to the Boards’ approvals of the Current Advisory Agreements and New Advisory Agreements, as applicable, which are described in separate Board Consideration sections within this shareholder report. Prior to the Board Meeting, including at a series of meetings held in April and May 2021, the Trustees conferred extensively among themselves and with senior representatives of Funds Management, GTCR LLC and Reverence Capital Partners, L.P. about the Interim Advisory Agreements and related matters. The Independent Trustees were assisted in their evaluation of the Interim Advisory Agreements by independent legal counsel, from whom they received separate legal advice and with whom they met separately.
At the Board Meeting, after considering the factors and reaching the conclusions described in the separate Board Consideration sections within this shareholder report, the Boards unanimously determined that the compensation payable to Funds Management and to each Sub-Adviser under each of the Interim Advisory Agreements was reasonable, and approved the Interim Advisory Agreements.
40 | Wells Fargo Specialized Technology Fund
For more information
More information about Wells Fargo Funds is available free upon request. To obtain literature, please write, visit the Fund's website, or call:
Wells Fargo Funds
P.O. Box 219967
Kansas City, MO 64121-9967
Website: allspringglobal.com
Individual investors: 1-800-222-8222
Retail investment professionals: 1-888-877-9275
Institutional investment professionals: 1-866-765-0778
This report and the financial statements contained herein are submitted for the general information of the shareholders of the Fund. If this report is used for promotional purposes, distribution of the report must be accompanied or preceded by a current prospectus. Before investing, please consider the investment objectives, risks, charges, and expenses of the investment. For a current prospectus and, if available, a summary prospectus, containing this information, call
1-800-222-8222 or visit the Fund's website at allspringglobal.com. Read the prospectus carefully before you invest or send money.
Allspring Global InvestmentsTM is the trade name for the asset management firms of Allspring Global Investments Holdings, LLC, a holding company indirectly owned by certain private funds of GTCR LLC and Reverence Capital Partners, L.P. These firms include but are not limited to Allspring Global Investments, LLC, and Allspring Funds Management, LLC. Certain products managed by Allspring entities are distributed by Allspring Funds Distributor, LLC (a broker-dealer and Member FINRA/SIPC).
This material is for general informational and educational purposes only and is NOT intended to provide investment advice or a recommendation of any kind - including a recommendation for any specific investment, strategy, or plan.
© 2021 Allspring Global Investments. All rights reserved.
PAR-1121-00203 09-21
SA317/SAR317 09-21
Semi-Annual Report
September 30, 2021
Wells Fargo Utility and
Telecommunications Fund
The views expressed and any forward-looking statements are as of September 30, 2021, unless otherwise noted, and are those of the Fund's portfolio managers and/or Allspring Global Investments. Discussions of individual securities or the markets generally are not intended as individual recommendations. Future events or results may vary significantly from those expressed in any forward-looking statements. The views expressed are subject to change at any time in response to changing circumstances in the market. Allspring Global Investments disclaims any obligation to publicly update or revise any views expressed or forward-looking statements.
Wells Fargo Utility and Telecommunications Fund | 1
Letter to shareholders (unaudited)
Andrew Owen
President
Wells Fargo Funds
Dear Shareholder:
We are pleased to offer you this semi-annual report for Wells Fargo Utility and Telecommunications Fund for the six-month period that ended September 30, 2021. Global stocks continued to rally as the global economy continued to emerge from the haze of COVID-19. Tailwinds were provided by global stimulus programs, a rapid vaccination rollout, and recovering consumer and corporate sentiment. Bonds were mixed during the period, with municipal bonds and high-yield bonds delivering positive returns.
For the six-month period, U.S. stocks, based on the S&P 500 Index,1 gained 9.18%. International stocks, as measured by the MSCI ACWI ex USA Index (Net),2 returned 2.32%, while the MSCI EM Index (Net),3 trailed its developed market counterparts with a 3.45% loss. Among bond indexes, the Bloomberg U.S. Aggregate Bond Index,4 returned 1.88%, the Bloomberg Global Aggregate ex-USD Index (unhedged),5 returned -0.69%, the Bloomberg Municipal Bond Index6 returned 1.15%, and the ICE BofA U.S. High Yield Index,7 gained 3.74%.
Vaccination rollout drove the stock markets to new highs.
Equity markets produced another strong showing in April. Domestically, the continued reopening of the economy had a strong impact on positive equity performance, as people started leaving their households and jobless claims continued to fall. Domestic corporate bonds performed well and the U.S. dollar weakened. Meanwhile, the U.S. government continued to seek to invest in the recovery, this time by outlining a package of over $2 trillion to improve infrastructure. The primary headwind in April was inflation, as investors tried to determine the breadth and longevity of recent price increases. Developed Europe has been supported by a meaningful increase in the pace of vaccinations. Unfortunately many emerging market countries have not been as successful. India in particular saw COVID-19 cases surge, serving as an example of the need to get vaccinations rolled out to less developed nations.
| 1 | The S&P 500 Index consists of 500 stocks chosen for market size, liquidity, and industry group representation. It is a market-value-weighted index with each stock's weight in the index proportionate to its market value. You cannot invest directly in an index. |
| 2 | The Morgan Stanley Capital International (MSCI) All Country World Index (ACWI) ex USA Index (Net) is a free-float-adjusted market-capitalization-weighted index that is designed to measure the equity market performance of developed and emerging markets, excluding the U.S. Source: MSCI. MSCI makes no express or implied warranties or representations and shall have no liability whatsoever with respect to any MSCI data contained herein. The MSCI data may not be further redistributed or used as a basis for other indexes or any securities or financial products. This report is not approved, reviewed, or produced by MSCI. You cannot invest directly in an index. |
| 3 | The MSCI Emerging Markets (EM) Index (Net) is a free-float-adjusted market-capitalization-weighted index that is designed to measure equity market performance of emerging markets. You cannot invest directly in an index. |
| 4 | The Bloomberg U.S. Aggregate Bond Index is a broad-based benchmark that measures the investment-grade, U.S.-dollar-denominated, fixed-rate taxable bond market, including Treasuries, government-related and corporate securities, mortgage-backed securities (agency fixed-rate and hybrid adjustable-rate mortgage pass-throughs), asset-backed securities, and commercial mortgage-backed securities. You cannot invest directly in an index. |
| 5 | The Bloomberg Global Aggregate ex-USD Index (unhedged) is an unmanaged index that provides a broad-based measure of the global investment-grade fixed-income markets excluding the U.S.-dollar-denominated debt market. You cannot invest directly in an index. |
| 6 | The Bloomberg Municipal Bond Index is an unmanaged index composed of long-term tax-exempt bonds with a minimum credit rating of Baa. You cannot invest directly in an index. |
| 7 | The ICE BofA U.S. High Yield Index is a market-capitalization-weighted index of domestic and Yankee high-yield bonds. The index tracks the performance of high-yield securities traded in the U.S. bond market. You cannot invest directly in an index. Copyright 2021. ICE Data Indices, LLC. All rights reserved. |
2 | Wells Fargo Utility and Telecommunications Fund
Letter to shareholders (unaudited)
Vaccine rollouts continued in May, leading to loosened restrictions globally. As a result, equity markets in general saw a minor increase in returns. Concerns that the continued economic rebound could result in inflation increases becoming more than transitory were supported by the higher input costs businesses were experiencing. Meanwhile, those inflation concerns were tempered by the U.S. Federal Reserve (Fed), which stayed steady on its view of the economy and eased fears of a sudden and substantial policy change. Positive performance in the emerging market equity space was supported this month by steady consumer demand and strong commodity prices. Fixed-income markets were also slightly positive for the month, driven by inflation uncertainty and a softer U.S. dollar.
June witnessed the S&P 500 Index reach a new all-time high. 2021 economic growth and inflation forecasts were revised higher to reflect a strong economic recovery and some supply and demand imbalances. Late June saw a deal reached on a U.S. infrastructure package of approximately $1 trillion for road, bridge, and broadband network upgrades over the next eight years. The Fed’s June meeting yielded no change to policy, but its projections pointed to a possible interest rate rise in 2023. This, combined with a rebound in economic activity and investors searching for yield, led to U.S. Treasury yields being down for the month. Many European and Asian countries saw vaccination momentum increase, while the U.K. dealt with a rise in COVID-19 infections, specifically the Delta variant. Meanwhile, crude oil jumped over 10% in June on the back of the pickup in global economic activity and the Organization of the Petroleum Exporting Countries’ (OPEC) slow pace of supply growth.
July began the month seeing vaccinations making progress, as several major developed countries eased restrictions, only to be threatened again by the spread of COVID-19’s Delta variant. Inflation continued to climb, aided by the continued supply bottleneck in the face of high demand. As it pertains to the equity area of the market, U.S. equities led the way in positive return territory, followed by international developed markets. In contrast, emerging markets were well in negative territory for the month, hindered by China’s plans for new regulations on a number of sectors, specifically education and technology. The U.S. 10-Year Treasury bond yield continued to decline, as strong demand swallowed up supply. After hitting a multi-year high earlier in the month, oil prices leveled off following an agreement by OPEC to raise oil production starting in August.
The Delta variant of COVID-19 produced outbreaks globally in August, increasing the potential for increased market volatility and bringing into question the ongoing economic recovery. Domestically, the U.S. economy continued to stay strong in the face of the Delta variant, continued inflationary pressures, and worries over Hurricane Ida. Emerging market equities experienced elevated volatility, largely influenced by China’s regulatory stance. Emerging market equities started the month with poor performance but rebounded to end the month in positive territory. Municipal debt experienced its first monthly performance drop since February of this year, slowing a rally that made it one of the best-performing sectors of the bond market. In the commodity segment of the market, crude oil fell sharply during the month on the back of dampened expectations as a result of the Delta variant but was still a leading asset class performer for the year.
Global markets suffered their broadest retreat in a year during September, with the exception of commodities. Concerns over inflation and the interest rate outlook depressed investor confidence and hurt performance. Emerging markets declined on concerns over the continued supply chain disruptions and worries over higher energy and food prices. Meanwhile, the Fed indicated it would slow the pace of asset purchases in the near future (pointing towards November). All eyes domestically are fixed on the raising of the debt ceiling, the 2022 budget plan, and the ongoing debate over the infrastructure package. Contrary to most asset classes, commodities thrived in September, driven by sharply higher energy prices.
“ 2021 economic growth and inflation forecasts were revised higher to reflect a strong economic recovery and some supply and demand imbalances.”
“ Municipal debt experienced its first monthly performance drop since February of this year, slowing a rally that made it one of the best-performing sectors of the bond market.”
Wells Fargo Utility and Telecommunications Fund | 3
Letter to shareholders (unaudited)
Don’t let short-term uncertainty derail long-term investment goals.
Periods of investment uncertainty can present challenges, but experience has taught us that maintaining long-term investment goals can be an effective way to plan for the future. To help you create a sound strategy based on your personal goals and risk tolerance, Wells Fargo Funds offers more than 100 mutual funds spanning a wide range of asset classes and investment styles. Although diversification cannot guarantee an investment profit or prevent losses, we believe it can be an effective way to manage investment risk and potentially smooth out overall portfolio performance. We encourage investors to know their investments and to understand that appropriate levels of risk-taking may unlock opportunities.
On November 1, 2021, GTCR LLC and Reverence Capital Partners, L.P., announced the beginning of Allspring Global Investments™, with the close of the transaction to acquire Wells Fargo Funds Management, LLC; Wells Capital Management LLC; Galliard Capital Management LLC.; Wells Fargo Asset Management (International) Ltd.; Wells Fargo Asset Management Luxembourg S.A.; and Wells Fargo Funds Distributor, LLC, as well as Wells Fargo Bank, N.A.’s business of acting as trustee to its collective investment trusts and all related Wells Fargo Asset Management legal entities. The transaction closed on November 1, 2021, forming Allspring Global Investments, LLC, a privately held asset management firm with $587 billion in AUM1 as of September 30, 2021.
Allspring Global Investments™ is a leading independent asset management firm with a full breadth of investment capabilities across diverse asset classes, serving the needs of its institutional and wealth management clients around the world. Allspring operates across 18 offices globally supported by more than 480 investment professionals. Allspring and its investment teams provide a broad range of differentiated investment products and solutions to help its diverse range of clients meet their investment objectives.
As part of this transition, all mutual funds within the Wells Fargo Funds family will be rebranded as Allspring Funds. Each individual fund will have “Wells Fargo” removed from its fund name to be replaced with “Allspring.” The fund name changes are expected to take place on December 6, 2021.
Allspring Global Investments is the trade name for the asset management firms of Allspring Global Investments Holdings, LLC, a holding company indirectly owned by certain private funds of GTCR LLC and Reverence Capital Partners, L.P.
Thank you for choosing to invest with Wells Fargo Funds. We appreciate your confidence in us and remain committed to helping you meet your financial needs.
Sincerely,
Andrew Owen
President
Wells Fargo Funds
For further information about your Fund, contact your investment professional, visit our website at allspringglobal.com, or call us directly at 1-800-222-8222.
| 1 | As of September 30, 2021, assets under management (AUM) includes $93 billion from Galliard Capital Management, an investment advisor that is not part of the Allspring trade name/GIPS firm. |
4 | Wells Fargo Utility and Telecommunications Fund
This page is intentionally left blank.
Performance highlights (unaudited)
| Investment objective | The Fund seeks total return, consisting of current income and capital appreciation. |
| Manager | Allspring Funds Management, LLC |
| Subadviser | Allspring Global Investments, LLC |
| Portfolio managers | Kent Newcomb, CFA®‡, Jack Spudich, CFA®‡ |
| Average annual total returns (%) as of September 30, 2021 |
| | | Including sales charge | | Excluding sales charge | | Expense ratios1 (%) |
| | Inception date | 1 year | 5 year | 10 year | | 1 year | 5 year | 10 year | | Gross | Net 2 |
| Class A (EVUAX) | 1-4-1994 | 3.81 | 8.85 | 10.10 | | 10.15 | 10.15 | 10.75 | | 1.18 | 1.06 |
| Class C (EVUCX) | 9-2-1994 | 8.30 | 9.31 | 9.92 | | 9.30 | 9.31 | 9.92 | | 1.93 | 1.81 |
| Administrator Class (EVUDX) | 7-30-2010 | – | – | – | | 10.27 | 10.33 | 10.95 | | 1.10 | 0.93 |
| Institutional Class (EVUYX) | 2-28-1994 | – | – | – | | 10.50 | 10.52 | 11.12 | | 0.85 | 0.73 |
| S&P 500 Utilities Sector Index3 | – | – | – | – | | 11.01 | 9.11 | 10.59 | | – | – |
| S&P 500 Index4 | – | – | – | – | | 30.00 | 16.90 | 16.63 | | – | – |
Figures quoted represent past performance, which is no guarantee of future results, and do not reflect taxes that a shareholder may pay on an investment in a fund. Investment return and principal value of an investment will fluctuate so that an investor’s shares, when redeemed, may be worth more or less than their original cost. Performance shown without sales charges would be lower if sales charges were reflected. Current performance may be lower or higher than the performance data quoted, which assumes the reinvestment of dividends and capital gains. Current month-end performance is available on the Fund’s website, allspringglobal.com.
While the S&P 500 Index is comprised of U.S. equity securities of companies diversified across ten sectors, the Fund’s holdings are concentrated primarily in utilities and telecommunication services stocks. Therefore, the performance of the S&P 500 Index is displayed only to show how the concentrated Fund performed compared with a diversified selection of U.S. equity securities.
Index returns do not include transaction costs associated with buying and selling securities, any mutual fund fees or expenses, or any taxes. It is not possible to invest directly in an index.
For Class A shares, the maximum front-end sales charge is 5.75%. For Class C shares, the maximum contingent deferred sales charge is 1.00%. Performance including a contingent deferred sales charge assumes the sales charge for the corresponding time period. Administrator Class and Institutional Class shares are sold without a front-end sales charge or contingent deferred sales charge.
| 1 | Reflects the expense ratios as stated in the most recent prospectuses, which include the impact of 0.01% in acquired fund fees and expenses. The expense ratios shown are subject to change and may differ from the annualized expense ratios shown in the financial highlights of this report, which do not include acquired fund fees and expenses. |
| 2 | The manager has contractually committed through July 31, 2022, to waive fees and/or reimburse expenses to the extent necessary to cap total annual fund operating expenses after fee waivers at 1.05% for Class A, 1.80% for Class C, 0.92% for Administrator Class, and 0.72% for Institutional Class. Brokerage commissions, stamp duty fees, interest, taxes, acquired fund fees and expenses (if any), and extraordinary expenses are excluded from the expense caps. Prior to or after the commitment expiration date, the caps may be increased or the commitment to maintain the caps may be terminated only with the approval of the Board of Trustees. Without these caps, the Fund’s returns would have been lower. The expense ratio paid by an investor is the net expense ratio (the total annual fund operating expenses after fee waivers) as stated in the prospectuses. |
| 3 | The S&P 500 Utilities Sector Index is a market-value-weighted index that measures the performance of all stocks within the utilities sector of the S&P 500 Index. You cannot invest directly in an index. |
| 4 | The S&P 500 Index consists of 500 stocks chosen for market size, liquidity, and industry group representation. It is a market-value weighted index with each stock’s weight in the index proportionate to its market value. You cannot invest directly in an index. |
| ‡ | CFA® and Chartered Financial Analyst® are trademarks owned by CFA Institute. |
6 | Wells Fargo Utility and Telecommunications Fund
Performance highlights (unaudited)
Stock values fluctuate in response to the activities of individual companies and general market and economic conditions. Bond values fluctuate in response to the financial condition of individual issuers, general market and economic conditions, and changes in interest rates. Changes in market conditions and government policies may lead to periods of heightened volatility in the bond market and reduced liquidity for certain bonds held by the Fund. In general, when interest rates rise, bond values fall and investors may lose principal value. Interest rate changes and their impact on the Fund and its share price can be sudden and unpredictable. The use of derivatives may reduce returns and/or increase volatility. Funds that concentrate their investments in limited sectors, such as utilities and telecommunication services, are more vulnerable to adverse market, economic, regulatory, political, or other developments affecting those sectors. Certain investment strategies tend to increase the total risk of an investment (relative to the broader market). This fund is exposed to convertible securities risk, foreign investment risk, high-yield securities risk, smaller-company securities risk, and nondiversification risk. Consult the Fund’s prospectus for additional information on these and other risks.
Wells Fargo Utility and Telecommunications Fund | 7
Performance highlights (unaudited)
| Ten largest holdings (%) as of September 30, 20211 |
| NextEra Energy Incorporated | 12.70 |
| Visa Incorporated Class A | 6.33 |
| Comcast Corporation Class A | 5.72 |
| Dominion Energy Incorporated | 5.10 |
| The Southern Company | 5.02 |
| Duke Energy Corporation | 4.81 |
| Exelon Corporation | 4.44 |
| American Electric Power Company Incorporated | 4.39 |
| Sempra Energy | 3.79 |
| Xcel Energy Incorporated | 3.39 |
| 1 | Figures represent the percentage of the Fund's net assets. Holdings are subject to change and may have changed since the date specified. |
| Sector allocation as of September 30, 20211 |
| 1 | Figures represent the percentage of the Fund's long-term investments. These amounts are subject to change and may have changed since the date specified. |
8 | Wells Fargo Utility and Telecommunications Fund
Fund expenses (unaudited)
As a shareholder of the Fund, you incur two types of costs: (1) transaction costs, including sales charges (loads) on purchase payments and contingent deferred sales charges (if any) on redemptions and (2) ongoing costs, including management fees, distribution (12b-1) and/or shareholder servicing fees, and other Fund expenses. This example is intended to help you understand your ongoing costs (in dollars) of investing in the Fund and to compare these costs with the ongoing costs of investing in other mutual funds.
The example is based on an investment of $1,000 invested at the beginning of the six-month period and held for the entire period from April 1, 2021 to September 30, 2021.
Actual expenses
The “Actual” line of the table below provides information about actual account values and actual expenses. You may use the information in this line, together with the amount you invested, to estimate the expenses that you paid over the period. Simply divide your account value by $1,000 (for example, an $8,600 account value divided by $1,000 = 8.6), then multiply the result by the number in the “Actual” line under the heading entitled “Expenses paid during period” for your applicable class of shares to estimate the expenses you paid on your account during this period.
Hypothetical example for comparison purposes
The “Hypothetical” line of the table below provides information about hypothetical account values and hypothetical expenses based on the Fund’s actual expense ratio and an assumed rate of return of 5% per year before expenses, which is not the Fund’s actual return. The hypothetical account values and expenses may not be used to estimate the actual ending account balance or expenses you paid for the period. You may use this information to compare the ongoing costs of investing in the Fund and other funds. To do so, compare this 5% hypothetical example with the 5% hypothetical examples that appear in the shareholder reports of the other funds.
Please note that the expenses shown in the table are meant to highlight your ongoing costs only and do not reflect any transactional costs, such as sales charges (loads) and contingent deferred sales charges. Therefore, the “Hypothetical” line of the table is useful in comparing ongoing costs only, and will not help you determine the relative total costs of owning different funds. In addition, if these transactional costs were included, your costs would have been higher.
| | Beginning
account value
4-1-2021 | Ending
account value
9-30-2021 | Expenses
paid during
the period1 | Annualized net
expense ratio |
| Class A | | | | |
| Actual | $1,000.00 | $1,011.51 | $5.24 | 1.04% |
| Hypothetical (5% return before expenses) | $1,000.00 | $1,019.85 | $5.27 | 1.04% |
| Class C | | | | |
| Actual | $1,000.00 | $1,007.66 | $9.06 | 1.80% |
| Hypothetical (5% return before expenses) | $1,000.00 | $1,016.04 | $9.10 | 1.80% |
| Administrator Class | | | | |
| Actual | $1,000.00 | $1,012.26 | $4.64 | 0.92% |
| Hypothetical (5% return before expenses) | $1,000.00 | $1,020.46 | $4.66 | 0.92% |
| Institutional Class | | | | |
| Actual | $1,000.00 | $1,013.18 | $3.63 | 0.72% |
| Hypothetical (5% return before expenses) | $1,000.00 | $1,021.46 | $3.65 | 0.72% |
1 Expenses paid is equal to the annualized net expense ratio of each class multiplied by the average account value over the period, multiplied by the number of days in the most recent fiscal half-year divided by the number of days in the fiscal year (to reflect the one-half-year period).
Wells Fargo Utility and Telecommunications Fund | 9
Portfolio of investments—September 30, 2021 (unaudited)
| | | | | Shares | Value |
| Common stocks: 98.80% | | | | | |
| Communication services: 8.61% | | | | | |
| Diversified telecommunication services: 2.89% | | | | | |
| Verizon Communications Incorporated | | | | 235,998 | $ 12,746,252 |
| Media: 5.72% | | | | | |
| Comcast Corporation Class A | | | | 450,200 | 25,179,686 |
| Consumer discretionary: 0.70% | | | | | |
| Specialty retail: 0.70% | | | | | |
| The Home Depot Incorporated | | | | 9,418 | 3,091,553 |
| Consumer staples: 0.52% | | | | | |
| Food & staples retailing: 0.52% | | | | | |
| Walmart Incorporated | | | | 16,335 | 2,276,772 |
| Energy: 0.96% | | | | | |
| Oil, gas & consumable fuels: 0.96% | | | | | |
| DTE Midstream LLC | | | | 36,611 | 1,692,893 |
| Phillips 66 | | | | 35,880 | 2,512,676 |
| | | | | | 4,205,569 |
| Financials: 0.76% | | | | | |
| Banks: 0.76% | | | | | |
| JPMorgan Chase & Company | | | | 20,461 | 3,349,261 |
| Health care: 1.16% | | | | | |
| Biotechnology: 0.46% | | | | | |
| Amgen Incorporated | | | | 9,458 | 2,011,244 |
| Health care providers & services: 0.70% | | | | | |
| UnitedHealth Group Incorporated | | | | 7,915 | 3,092,707 |
| Information technology: 12.09% | | | | | |
| Communications equipment: 2.95% | | | | | |
| Cisco Systems Incorporated | | | | 238,967 | 13,006,974 |
| IT services: 9.14% | | | | | |
| MasterCard Incorporated Class A | | | | 35,630 | 12,387,838 |
| Visa Incorporated Class A | | | | 125,000 | 27,843,750 |
| | | | | | 40,231,588 |
| Real estate: 2.02% | | | | | |
| Equity REITs: 2.02% | | | | | |
| American Tower Corporation | | | | 33,479 | 8,885,661 |
| Utilities: 71.98% | | | | | |
| Electric utilities: 44.23% | | | | | |
| Alliant Energy Corporation | | | | 182,865 | 10,236,782 |
| American Electric Power Company Incorporated | | | | 238,088 | 19,327,984 |
| Duke Energy Corporation | | | | 217,240 | 21,200,452 |
| Entergy Corporation | | | | 77,022 | 7,649,055 |
The accompanying notes are an integral part of these financial statements.
10 | Wells Fargo Utility and Telecommunications Fund
Portfolio of investments—September 30, 2021 (unaudited)
| | | | | Shares | Value |
| Electric utilities (continued) | | | | | |
| Evergy Incorporated | | | | 98,279 | $ 6,112,954 |
| Eversource Energy | | | | 126,952 | 10,379,596 |
| Exelon Corporation | | | | 404,591 | 19,557,929 |
| FirstEnergy Corporation | | | | 205,868 | 7,333,018 |
| NextEra Energy Incorporated | | | | 711,832 | 55,893,049 |
| The Southern Company | | | | 356,660 | 22,102,220 |
| Xcel Energy Incorporated | | | | 238,866 | 14,929,125 |
| | | | | | 194,722,164 |
| Gas utilities: 2.79% | | | | | |
| Atmos Energy Corporation | | | | 97,312 | 8,582,918 |
| ONE Gas Incorporated | | | | 58,135 | 3,684,015 |
| | | | | | 12,266,933 |
| Multi-utilities: 22.38% | | | | | |
| Ameren Corporation | | | | 133,679 | 10,827,999 |
| CenterPoint Energy Incorporated | | | | 210,396 | 5,175,742 |
| CMS Energy Corporation | | | | 208,002 | 12,423,959 |
| Dominion Energy Incorporated | | | | 307,461 | 22,450,802 |
| DTE Energy Company | | | | 73,223 | 8,179,741 |
| Public Service Enterprise Group Incorporated | | | | 158,388 | 9,645,829 |
| Sempra Energy | | | | 131,761 | 16,667,767 |
| WEC Energy Group Incorporated | | | | 149,041 | 13,145,416 |
| | | | | | 98,517,255 |
| Water utilities: 2.58% | | | | | |
| American Water Works Company Incorporated | | | | 67,273 | 11,371,828 |
| Total Common stocks (Cost $273,087,843) | | | | | 434,955,447 |
| | | Yield | | | |
| Short-term investments: 1.90% | | | | | |
| Investment companies: 1.90% | | | | | |
| Wells Fargo Government Money Market Fund Select Class ♠∞ | | 0.03% | | 8,372,012 | 8,372,012 |
| Total Short-term investments (Cost $8,372,012) | | | | | 8,372,012 |
| Total investments in securities (Cost $281,459,855) | 100.70% | | | | 443,327,459 |
| Other assets and liabilities, net | (0.70) | | | | (3,090,971) |
| Total net assets | 100.00% | | | | $440,236,488 |
| ♠ | The issuer of the security is an affiliated person of the Fund as defined in the Investment Company Act of 1940. |
| ∞ | The rate represents the 7-day annualized yield at period end. |
| Abbreviations: |
| REIT | Real estate investment trust |
The accompanying notes are an integral part of these financial statements.
Wells Fargo Utility and Telecommunications Fund | 11
Portfolio of investments—September 30, 2021 (unaudited)
Investments in affiliates
An affiliated investment is an investment in which the Fund owns at least 5% of the outstanding voting shares of the issuer or as a result of other relationships, such as the Fund and the issuer having the same investment manager. Transactions with issuers that were either affiliates of the Fund at the beginning of the period or the end of the period were as follows:
| | Value,
beginning of
period | Purchases | Sales
proceeds | Net
realized
gains
(losses) | Net
change in
unrealized
gains
(losses) | Value,
end of
period | Shares,
end
of period | Income
from
affiliated
securities |
| Short-term investments | | | | | | | |
| Wells Fargo Government Money Market Fund Select Class | $5,837,687 | $15,628,363 | $(13,094,038) | $0 | $0 | $8,372,012 | 8,372,012 | $1,008 |
The accompanying notes are an integral part of these financial statements.
12 | Wells Fargo Utility and Telecommunications Fund
Statement of assets and liabilities—September 30, 2021 (unaudited)
| | |
| Assets | |
Investments in unaffiliated securities, at value (cost $273,087,843)
| $ 434,955,447 |
Investments in affiliated securites, at value (cost $8,372,012)
| 8,372,012 |
Receivable for investments sold
| 2,193,162 |
Receivable for Fund shares sold
| 1,185,088 |
Receivable for dividends
| 380,635 |
Prepaid expenses and other assets
| 38,992 |
Total assets
| 447,125,336 |
| Liabilities | |
Payable for investments purchased
| 6,194,939 |
Payable for Fund shares redeemed
| 223,414 |
Management fee payable
| 203,850 |
Administration fees payable
| 74,549 |
Distribution fee payable
| 3,305 |
Accrued expenses and other liabilities
| 188,791 |
Total liabilities
| 6,888,848 |
Total net assets
| $440,236,488 |
| Net assets consist of | |
Paid-in capital
| $ 230,006,530 |
Total distributable earnings
| 210,229,958 |
Total net assets
| $440,236,488 |
| Computation of net asset value and offering price per share | |
Net assets – Class A
| $ 359,755,014 |
Shares outstanding – Class A1
| 16,697,203 |
Net asset value per share – Class A
| $21.55 |
Maximum offering price per share – Class A2
| $22.86 |
Net assets – Class C
| $ 5,089,579 |
Shares outstanding – Class C1
| 235,026 |
Net asset value per share – Class C
| $21.66 |
Net assets – Administrator Class
| $ 6,118,454 |
Shares outstanding – Administrator Class1
| 283,499 |
Net asset value per share – Administrator Class
| $21.58 |
Net assets – Institutional Class
| $ 69,273,441 |
Shares outstanding – Institutional Class1
| 3,217,040 |
Net asset value per share – Institutional Class
| $21.53 |
| 1 | The Fund has an unlimited number of authorized shares |
| 2 | Maximum offering price is computed as 100/94.25 of net asset value. On investments of $50,000 or more, the offering price is reduced. |
The accompanying notes are an integral part of these financial statements.
Wells Fargo Utility and Telecommunications Fund | 13
Statement of operations—six months ended September 30, 2021 (unaudited)
| | |
| Investment income | |
Dividends
| $ 6,039,897 |
Income from affiliated securities
| 1,008 |
Total investment income
| 6,040,905 |
| Expenses | |
Management fee
| 1,485,445 |
| Administration fees | |
Class A
| 395,891 |
Class C
| 5,881 |
Administrator Class
| 3,059 |
Institutional Class
| 45,314 |
| Shareholder servicing fees | |
Class A
| 471,299 |
Class C
| 6,977 |
Administrator Class
| 5,883 |
| Distribution fee | |
Class C
| 20,817 |
Custody and accounting fees
| 10,070 |
Professional fees
| 28,720 |
Registration fees
| 32,830 |
Shareholder report expenses
| 29,024 |
Trustees’ fees and expenses
| 9,661 |
Other fees and expenses
| 9,657 |
Total expenses
| 2,560,528 |
| Less: Fee waivers and/or expense reimbursements | |
Fund-level
| (217,904) |
Class A
| (56,154) |
Administrator Class
| (1,399) |
Institutional Class
| (3,203) |
Net expenses
| 2,281,868 |
Net investment income
| 3,759,037 |
| Realized and unrealized gains (losses) on investments | |
Net realized losses on investments
| (290,996) |
Net change in unrealized gains (losses) on investments
| 1,775,085 |
Net realized and unrealized gains (losses) on investments
| 1,484,089 |
Net increase in net assets resulting from operations
| $5,243,126 |
The accompanying notes are an integral part of these financial statements.
14 | Wells Fargo Utility and Telecommunications Fund
Statement of changes in net assets
| | | | | |
| | Six months ended
September 30, 2021
(unaudited) | Year ended
March 31, 2021 |
| Operations | | | | |
Net investment income
| | $ 3,759,037 | | $ 6,854,079 |
Net realized gains (losses) on investments
| | (290,996) | | 48,447,575 |
Net change in unrealized gains (losses) on investments
| | 1,775,085 | | 24,852,185 |
Net increase in net assets resulting from operations
| | 5,243,126 | | 80,153,839 |
| Distributions to shareholders from | | | | |
| Net investment income and net realized gains | | | | |
Class A
| | (2,832,710) | | (45,244,979) |
Class C
| | (18,075) | | (911,494) |
Administrator Class
| | (41,503) | | (364,999) |
Institutional Class
| | (643,097) | | (8,269,341) |
Total distributions to shareholders
| | (3,535,385) | | (54,790,813) |
| Capital share transactions | Shares | | Shares | |
| Proceeds from shares sold | | | | |
Class A
| 587,011 | 13,127,048 | 1,290,321 | 28,237,989 |
Class C
| 17,516 | 392,880 | 49,123 | 1,078,714 |
Administrator Class
| 168,179 | 3,744,085 | 57,401 | 1,245,633 |
Institutional Class
| 569,909 | 12,675,912 | 2,239,542 | 48,698,035 |
| | | 29,939,925 | | 79,260,371 |
| Reinvestment of distributions | | | | |
Class A
| 122,750 | 2,676,311 | 2,051,387 | 42,893,752 |
Class C
| 814 | 17,849 | 43,020 | 901,317 |
Administrator Class
| 1,883 | 41,231 | 17,204 | 360,586 |
Institutional Class
| 29,341 | 639,405 | 391,341 | 8,188,340 |
| | | 3,374,796 | | 52,343,995 |
| Payment for shares redeemed | | | | |
Class A
| (947,598) | (21,156,051) | (2,217,981) | (47,844,571) |
Class C
| (79,080) | (1,756,902) | (303,611) | (6,751,214) |
Administrator Class
| (28,571) | (635,734) | (53,680) | (1,165,354) |
Institutional Class
| (441,803) | (9,854,224) | (1,845,506) | (40,399,867) |
| | | (33,402,911) | | (96,161,006) |
Net increase (decrease) in net assets resulting from capital share transactions
| | (88,190) | | 35,443,360 |
Total increase in net assets
| | 1,619,551 | | 60,806,386 |
| Net assets | | | | |
Beginning of period
| | 438,616,937 | | 377,810,551 |
End of period
| | $440,236,488 | | $438,616,937 |
The accompanying notes are an integral part of these financial statements.
Wells Fargo Utility and Telecommunications Fund | 15
Financial highlights
(For a share outstanding throughout each period)
| | | Year ended March 31 |
| Class A | Six months ended
September 30, 2021
(unaudited) | 2021 | 2020 | 2019 | 2018 | 2017 |
Net asset value, beginning of period
| $21.47 | $20.19 | $24.03 | $20.46 | $20.01 | $18.70 |
Net investment income
| 0.18 | 0.34 | 0.34 | 0.32 | 0.34 | 0.35 |
Net realized and unrealized gains (losses) on investments
| 0.07 | 3.82 | 0.02 | 3.65 | 0.47 | 1.30 |
Total from investment operations
| 0.25 | 4.16 | 0.36 | 3.97 | 0.81 | 1.65 |
| Distributions to shareholders from | | | | | | |
Net investment income
| (0.17) | (0.35) | (0.34) | (0.34) | (0.36) | (0.34) |
Net realized gains
| 0.00 | (2.53) | (3.86) | (0.06) | 0.00 | 0.00 |
Total distributions to shareholders
| (0.17) | (2.88) | (4.20) | (0.40) | (0.36) | (0.34) |
Net asset value, end of period
| $21.55 | $21.47 | $20.19 | $24.03 | $20.46 | $20.01 |
Total return1
| 1.15% | 21.23% | 0.04% | 19.59% | 4.00% | 8.87% |
| Ratios to average net assets (annualized) | | | | | | |
Gross expenses
| 1.16% | 1.17% | 1.17% | 1.19% | 1.17% | 1.18% |
Net expenses
| 1.04% | 1.04% | 1.09% | 1.14% | 1.14% | 1.14% |
Net investment income
| 1.60% | 1.58% | 1.42% | 1.47% | 1.60% | 1.79% |
| Supplemental data | | | | | | |
Portfolio turnover rate
| 3% | 20% | 49% | 10% | 7% | 22% |
Net assets, end of period (000s omitted)
| $359,755 | $363,540 | $319,200 | $337,848 | $287,047 | $308,152 |
| 1 | Total return calculations do not include any sales charges. Returns for periods of less than one year are not annualized. |
The accompanying notes are an integral part of these financial statements.
16 | Wells Fargo Utility and Telecommunications Fund
Financial highlights
(For a share outstanding throughout each period)
| | | Year ended March 31 |
| Class C | Six months ended
September 30, 2021
(unaudited) | 2021 | 2020 | 2019 | 2018 | 2017 |
Net asset value, beginning of period
| $21.57 | $20.25 | $24.06 | $20.47 | $20.01 | $18.70 |
Net investment income
| 0.09 1 | 0.17 1 | 0.16 1 | 0.16 1 | 0.13 | 0.16 |
Net realized and unrealized gains (losses) on investments
| 0.08 | 3.85 | 0.01 | 3.63 | 0.52 | 1.34 |
Total from investment operations
| 0.17 | 4.02 | 0.17 | 3.79 | 0.65 | 1.50 |
| Distributions to shareholders from | | | | | | |
Net investment income
| (0.08) | (0.17) | (0.12) | (0.14) | (0.19) | (0.19) |
Net realized gains
| 0.00 | (2.53) | (3.86) | (0.06) | 0.00 | 0.00 |
Total distributions to shareholders
| (0.08) | (2.70) | (3.98) | (0.20) | (0.19) | (0.19) |
Net asset value, end of period
| $21.66 | $21.57 | $20.25 | $24.06 | $20.47 | $20.01 |
Total return2
| 0.77% | 20.34% | (0.73)% | 18.65% | 3.24% | 8.04% |
| Ratios to average net assets (annualized) | | | | | | |
Gross expenses
| 1.90% | 1.91% | 1.92% | 1.94% | 1.92% | 1.93% |
Net expenses
| 1.80% | 1.80% | 1.86% | 1.89% | 1.89% | 1.89% |
Net investment income
| 0.83% | 0.80% | 0.63% | 0.74% | 0.85% | 1.02% |
| Supplemental data | | | | | | |
Portfolio turnover rate
| 3% | 20% | 49% | 10% | 7% | 22% |
Net assets, end of period (000s omitted)
| $5,090 | $6,379 | $10,274 | $19,618 | $41,729 | $51,123 |
| 1 | Calculated based upon average shares outstanding |
| 2 | Total return calculations do not include any sales charges. Returns for periods of less than one year are not annualized. |
The accompanying notes are an integral part of these financial statements.
Wells Fargo Utility and Telecommunications Fund | 17
Financial highlights
(For a share outstanding throughout each period)
| | | Year ended March 31 |
| Administrator Class | Six months ended
September 30, 2021
(unaudited) | 2021 | 2020 | 2019 | 2018 | 2017 |
Net asset value, beginning of period
| $21.51 | $20.22 | $24.05 | $20.48 | $20.03 | $18.72 |
Net investment income
| 0.21 | 0.37 | 0.36 | 0.36 | 0.37 | 0.38 |
Net realized and unrealized gains (losses) on investments
| 0.05 | 3.83 | 0.04 | 3.65 | 0.48 | 1.30 |
Total from investment operations
| 0.26 | 4.20 | 0.40 | 4.01 | 0.85 | 1.68 |
| Distributions to shareholders from | | | | | | |
Net investment income
| (0.19) | (0.38) | (0.37) | (0.38) | (0.40) | (0.37) |
Net realized gains
| 0.00 | (2.53) | (3.86) | (0.06) | 0.00 | 0.00 |
Total distributions to shareholders
| (0.19) | (2.91) | (4.23) | (0.44) | (0.40) | (0.37) |
Net asset value, end of period
| $21.58 | $21.51 | $20.22 | $24.05 | $20.48 | $20.03 |
Total return1
| 1.18% | 21.39% | 0.20% | 19.80% | 4.21% | 9.04% |
| Ratios to average net assets (annualized) | | | | | | |
Gross expenses
| 1.08% | 1.09% | 1.09% | 1.11% | 1.09% | 1.10% |
Net expenses
| 0.92% | 0.92% | 0.94% | 0.95% | 0.95% | 0.95% |
Net investment income
| 1.73% | 1.70% | 1.49% | 1.66% | 1.80% | 1.93% |
| Supplemental data | | | | | | |
Portfolio turnover rate
| 3% | 20% | 49% | 10% | 7% | 22% |
Net assets, end of period (000s omitted)
| $6,118 | $3,054 | $2,449 | $5,296 | $4,702 | $5,168 |
| 1 | Returns for periods of less than one year are not annualized. |
The accompanying notes are an integral part of these financial statements.
18 | Wells Fargo Utility and Telecommunications Fund
Financial highlights
(For a share outstanding throughout each period)
| | | Year ended March 31 |
| Institutional Class | Six months ended
September 30, 2021
(unaudited) | 2021 | 2020 | 2019 | 2018 | 2017 |
Net asset value, beginning of period
| $21.46 | $20.18 | $24.01 | $20.45 | $20.00 | $18.69 |
Net investment income
| 0.22 | 0.43 | 0.44 | 0.41 | 0.41 | 0.42 |
Net realized and unrealized gains (losses) on investments
| 0.05 | 3.80 | 0.01 | 3.62 | 0.47 | 1.30 |
Total from investment operations
| 0.27 | 4.23 | 0.45 | 4.03 | 0.88 | 1.72 |
| Distributions to shareholders from | | | | | | |
Net investment income
| (0.20) | (0.42) | (0.42) | (0.41) | (0.43) | (0.41) |
Net realized gains
| 0.00 | (2.53) | (3.86) | (0.06) | 0.00 | 0.00 |
Total distributions to shareholders
| (0.20) | (2.95) | (4.28) | (0.47) | (0.43) | (0.41) |
Net asset value, end of period
| $21.53 | $21.46 | $20.18 | $24.01 | $20.45 | $20.00 |
Total return1
| 1.27% | 21.62% | 0.42% | 20.03% | 4.38% | 9.26% |
| Ratios to average net assets (annualized) | | | | | | |
Gross expenses
| 0.83% | 0.84% | 0.84% | 0.86% | 0.84% | 0.85% |
Net expenses
| 0.72% | 0.72% | 0.75% | 0.78% | 0.78% | 0.78% |
Net investment income
| 1.92% | 1.92% | 1.76% | 1.83% | 1.95% | 2.18% |
| Supplemental data | | | | | | |
Portfolio turnover rate
| 3% | 20% | 49% | 10% | 7% | 22% |
Net assets, end of period (000s omitted)
| $69,273 | $65,644 | $45,888 | $42,427 | $31,548 | $24,575 |
| 1 | Returns for periods of less than one year are not annualized. |
The accompanying notes are an integral part of these financial statements.
Wells Fargo Utility and Telecommunications Fund | 19
Notes to financial statements (unaudited)
1. ORGANIZATION
Wells Fargo Funds Trust (the "Trust"), a Delaware statutory trust organized on March 10, 1999, is an open-end management investment company registered under the Investment Company Act of 1940, as amended (the "1940 Act"). As an investment company, the Trust follows the accounting and reporting guidance in Financial Accounting Standards Board ("FASB") Accounting Standards Codification Topic 946, Financial Services – Investment Companies. These financial statements report on the Wells Fargo Utility and Telecommunications Fund (the "Fund") which is a non-diversified series of the Trust.
On February 23, 2021, Wells Fargo & Company announced that it has entered into a definitive agreement to sell Wells Fargo Asset Management ("WFAM") to GTCR LLC and Reverence Capital Partners, L.P. WFAM is the trade name used by the asset management businesses of Wells Fargo & Company and includes Wells Fargo Funds Management, LLC, the investment manager to the Fund, Wells Capital Management, LLC and Wells Fargo Asset Management (International) Limited, both registered investment advisers providing subadvisory services to certain funds, and Wells Fargo Funds Distributor, LLC, the Fund's principal underwriter. As part of the transaction, Wells Fargo & Company will own a 9.9% equity interest and will continue to serve as an important client and distribution partner.
Consummation of the transaction will result in the automatic termination of the Fund’s investment management agreement and subadvisory agreement. The Fund’s Board of Trustees approved a new investment management agreement and a new subadvisory agreement which were submitted to the Fund’s shareholders for approval at a Special Meeting of Shareholders held on September 15, 2021. Shareholders of record of the Fund at the close of business on May 28, 2021 approved the new agreements which will take effect upon the closing of the transaction.
As more fully discussed in Note 10, the transaction closed on November 1, 2021 and the investment manager, sub-advisers and distributor changed their names to Allspring Funds Management, LLC, Allspring Global Investments, LLC, Allspring Global Investments (UK) Limited and Allspring Funds Distributor, LLC. While these name changes occurred after the end of the period, throughout this report, the new names have been used.
The Board of Trustees of the Wells Fargo Funds voted on July 15, 2021 to approve a change to the Fund's name to remove "Wells Fargo" from the name and replace it with "Allspring", effective December 6, 2021.
2. SIGNIFICANT ACCOUNTING POLICIES
The following significant accounting policies, which are consistently followed in the preparation of the financial statements of the Fund, are in conformity with U.S. generally accepted accounting principles which require management to make estimates and assumptions that affect the reported amounts of assets and liabilities, disclosure of contingent assets and liabilities at the date of the financial statements, and the reported amounts of income and expenses during the reporting period. Actual results could differ from those estimates.
Securities valuation
All investments are valued each business day as of the close of regular trading on the New York Stock Exchange (generally 4 p.m. Eastern Time), although the Fund may deviate from this calculation time under unusual or unexpected circumstances.
Equity securities that are listed on a foreign or domestic exchange or market are valued at the official closing price or, if none, the last sales price. If no sale occurs on the principal exchange or market that day, a fair value price will be determined in accordance with the Fund’s Valuation Procedures.
Investments in registered open-end investment companies are valued at net asset value.
Investments which are not valued using any of the methods discussed above are valued at their fair value, as determined in good faith by the Board of Trustees. The Board of Trustees has established a Valuation Committee comprised of the Trustees and has delegated to it the authority to take any actions regarding the valuation of portfolio securities that the Valuation Committee deems necessary or appropriate, including determining the fair value of portfolio securities, unless the determination has been delegated to the Allspring Global Investments Pricing Committee at Allspring Funds Management, LLC ("Allspring Funds Management"). The Board of Trustees retains the authority to make or ratify any valuation decisions or approve any changes to the Valuation Procedures as it deems appropriate. On a quarterly basis, the Board of Trustees receives reports on any valuation actions taken by the Valuation Committee or the Allspring Global Investments Pricing Committee which may include items for ratification.
Security transactions and income recognition
Securities transactions are recorded on a trade date basis. Realized gains or losses are recorded on the basis of identified cost.
Dividend income is recognized on the ex-dividend date.
20 | Wells Fargo Utility and Telecommunications Fund
Notes to financial statements (unaudited)
Distributions to shareholders
Distributions to shareholders are recorded on the ex-dividend date and paid from net investment income quarterly and any net realized gains are paid at least annually. Such distributions are determined in accordance with income tax regulations and may differ from U.S. generally accepted accounting principles. Dividend sources are estimated at the time of declaration. The tax character of distributions is determined as of the Fund's fiscal year end. Therefore, a portion of the Fund's distributions made prior to the Fund’s fiscal year end may be categorized as a tax return of capital at year end.
Federal and other taxes
The Fund intends to continue to qualify as a regulated investment company by distributing substantially all of its investment company taxable income and any net realized capital gains (after reduction for capital loss carryforwards) sufficient to relieve it from all, or substantially all, federal income taxes. Accordingly, no provision for federal income taxes was required.
The Fund’s income and federal excise tax returns and all financial records supporting those returns for the prior three fiscal years are subject to examination by the federal and Delaware revenue authorities. Management has analyzed the Fund's tax positions taken on federal, state, and foreign tax returns for all open tax years and does not believe that there are any uncertain tax positions that require recognition of a tax liability.
As of September 30, 2021, the aggregate cost of all investments for federal income tax purposes was $281,459,855 and the unrealized gains (losses) consisted of:
| Gross unrealized gains | $167,577,744 |
| Gross unrealized losses | (5,710,140) |
| Net unrealized gains | $161,867,604 |
Class allocations
The separate classes of shares offered by the Fund differ principally in applicable sales charges, distribution, shareholder servicing, and administration fees. Class specific expenses are charged directly to that share class. Investment income, common fund-level expenses, and realized and unrealized gains (losses) on investments are allocated daily to each class of shares based on the relative proportion of net assets of each class.
3. FAIR VALUATION MEASUREMENTS
Fair value measurements of investments are determined within a framework that has established a fair value hierarchy based upon the various data inputs utilized in determining the value of the Fund’s investments. The three-level hierarchy gives the highest priority to unadjusted quoted prices in active markets for identical assets or liabilities (Level 1) and the lowest priority to unobservable inputs (Level 3). The Fund’s investments are classified within the fair value hierarchy based on the lowest level of input that is significant to the fair value measurement. The inputs are summarized into three broad levels as follows:
| ■ | Level 1 – quoted prices in active markets for identical securities |
| ■ | Level 2 – other significant observable inputs (including quoted prices for similar securities, interest rates, prepayment speeds, credit risk, etc.) |
| ■ | Level 3 – significant unobservable inputs (including the Fund’s own assumptions in determining the fair value of investments) |
The inputs or methodologies used for valuing investments in securities are not necessarily an indication of the risk associated with investing in those securities.
Wells Fargo Utility and Telecommunications Fund | 21
Notes to financial statements (unaudited)
The following is a summary of the inputs used in valuing the Fund’s assets and liabilities as of September 30, 2021:
| | Quoted prices
(Level 1) | Other significant
observable inputs
(Level 2) | Significant
unobservable inputs
(Level 3) | Total |
| Assets | | | | |
| Investments in: | | | | |
| Common stocks | | | | |
| Communication services | $ 37,925,938 | $0 | $0 | $ 37,925,938 |
| Consumer discretionary | 3,091,553 | 0 | 0 | 3,091,553 |
| Consumer staples | 2,276,772 | 0 | 0 | 2,276,772 |
| Energy | 4,205,569 | 0 | 0 | 4,205,569 |
| Financials | 3,349,261 | 0 | 0 | 3,349,261 |
| Health care | 5,103,951 | 0 | 0 | 5,103,951 |
| Information technology | 53,238,562 | 0 | 0 | 53,238,562 |
| Real estate | 8,885,661 | 0 | 0 | 8,885,661 |
| Utilities | 316,878,180 | 0 | 0 | 316,878,180 |
| Short-term investments | | | | |
| Investment companies | 8,372,012 | 0 | 0 | 8,372,012 |
| Total assets | $443,327,459 | $0 | $0 | $443,327,459 |
Additional sector, industry or geographic detail, if any, is included in the Portfolio of Investments.
For the six months ended September 30, 2021, the Fund did not have any transfers into/out of Level 3.
4. TRANSACTIONS WITH AFFILIATES
Management fee
Allspring Funds Management, a wholly owned subsidiary of Allspring Global Investments Holdings, LLC, a holding company indirectly owned by Wells Fargo & Company as of September 30, 2021, is the manager of the Fund and provides advisory and fund-level administrative services under an investment management agreement. Under the investment management agreement, Allspring Funds Management is responsible for, among other services, implementing the investment objectives and strategies of the Fund, supervising the subadviser and providing fund-level administrative services in connection with the Fund’s operations. As compensation for its services under the investment management agreement, Allspring Funds Management is entitled to receive a management fee at the following annual rate based on the Fund’s average daily net assets:
| Average daily net assets | Management fee |
| First $500 million | 0.650% |
| Next $500 million | 0.600 |
| Next $1 billion | 0.550 |
| Next $2 billion | 0.525 |
| Next $1 billion | 0.500 |
| Next $5 billion | 0.490 |
| Over $10 billion | 0.480 |
For the six months ended September 30, 2021, the management fee was equivalent to an annual rate of 0.65% of the Fund’s average daily net assets.
Allspring Funds Management has retained the services of a subadviser to provide daily portfolio management to the Fund. The fee for subadvisory services is borne by Allspring Funds Management. Allspring Global Investments, LLC, an affiliate of Allspring Funds Management and wholly owned subsidiary of Allspring Global Investments Holdings, LLC, is the subadviser to the Fund and is entitled to receive a fee from Allspring Funds Management at an annual rate starting at 0.30% and declining to 0.20% as the average daily net assets of the Fund increase.
22 | Wells Fargo Utility and Telecommunications Fund
Notes to financial statements (unaudited)
Administration fees
Under a class-level administration agreement, Allspring Funds Management provides class-level administrative services to the Fund, which includes paying fees and expenses for services provided by the transfer agent, sub-transfer agents, omnibus account servicers and record-keepers. As compensation for its services under the class-level administration agreement, Allspring Funds Management receives an annual fee which is calculated based on the average daily net assets of each class as follows:
| | Class-level
administration fee |
| Class A | 0.21% |
| Class C | 0.21 |
| Administrator Class | 0.13 |
| Institutional Class | 0.13 |
Waivers and/or expense reimbursements
Allspring Funds Management has contractually committed to waive and/or reimburse management and administration fees to the extent necessary to maintain certain net operating expense ratios for the Fund. When each class of the Fund has exceeded its expense cap, Allspring Funds Management will waive fees and/or reimburse expenses from fund-level expenses on a proportionate basis and then from class specific expenses. When only certain classes exceed their expense caps, waivers and/or reimbursements are applied against class specific expenses before fund-level expenses. Allspring Funds Management has contractually committed through July 31, 2022 to waive fees and/or reimburse expenses to the extent necessary to cap expenses. Prior to or after the commitment expiration date, the caps may be increased or the commitment to maintain the caps may be terminated only with the approval of the Board of Trustees. The contractual expense caps are as follows:
| | Expense ratio caps |
| Class A | 1.05% |
| Class C | 1.80 |
| Administrator Class | 0.92 |
| Institutional Class | 0.72 |
Distribution fee
The Trust has adopted a distribution plan for Class C shares of the Fund pursuant to Rule 12b-1 under the 1940 Act. A distribution fee is charged to Class C shares and paid to Allspring Funds Distributor, LLC ("Allspring Funds Distributor"), an affiliate of Allspring Funds Management, the principal underwriter, at an annual rate of 0.75% of the average daily net assets of Class C shares.
In addition, Allspring Funds Distributor is entitled to receive the front-end sales charge from the purchase of Class A shares and a contingent deferred sales charge on the redemption of certain Class A shares. Allspring Funds Distributor is also entitled to receive the contingent deferred sales charges from redemptions of Class C shares. For the six months ended September 30, 2021, Allspring Funds Distributor received $6,950 from the sale of Class A shares. No contingent deferred sales charges were incurred by Class A and Class C shares for the six months ended September 30, 2021.
Shareholder servicing fees
The Trust has entered into contracts with one or more shareholder servicing agents, whereby Class A, Class C, and Administrator Class of the Fund are charged a fee at an annual rate of 0.25% of the average daily net assets of each respective class. A portion of these total shareholder servicing fees were paid to affiliates.
Interfund transactions
The Fund may purchase or sell portfolio investment securities to certain affiliates pursuant to Rule 17a-7 under the 1940 Act and under procedures adopted by the Board of Trustees. The procedures have been designed to ensure that these interfund transactions, which do not incur broker commissions, are effected at current market prices.
Wells Fargo Utility and Telecommunications Fund | 23
Notes to financial statements (unaudited)
5. INVESTMENT PORTFOLIO TRANSACTIONS
Purchases and sales of investments, excluding U.S. government obligations (if any) and short-term securities, for the six months ended September 30, 2021 were $13,318,987 and $12,715,180, respectively.
6. BANK BORROWINGS
The Trust (excluding the money market funds), Wells Fargo Master Trust and Wells Fargo Variable Trust are parties to a $350,000,000 revolving credit agreement whereby the Fund is permitted to use bank borrowings for temporary or emergency purposes, such as to fund shareholder redemption requests. Interest under the credit agreement is charged to the Fund based on a borrowing rate equal to the higher of the Federal Funds rate in effect on that day plus 1.25% or the overnight bank funding rate in effect on that day plus 1.25%. In addition, an annual commitment fee equal to 0.25% of the unused balance is allocated to each participating fund.
For the six months ended September 30, 2021, there were no borrowings by the Fund under the agreement.
7. CONCENTRATION RISKS
The Fund concentrated its portfolio of investments in the utility sector. A fund that invests a substantial portion of its assets in any sector may be more affected by changes in that sector than would be a fund whose investments are not heavily weighted in any sector.
8. INDEMNIFICATION
Under the Fund's organizational documents, the officers and Trustees have been granted certain indemnification rights against certain liabilities that may arise out of performance of their duties to the Fund. The Fund has entered into a separate agreement with each Trustee that converts indemnification rights currently existing under the Fund’s organizational documents into contractual rights that cannot be changed in the future without the consent of the Trustee. Additionally, in the normal course of business, the Fund may enter into contracts with service providers that contain a variety of indemnification clauses. The Fund’s maximum exposure under these arrangements is dependent on future claims that may be made against the Fund and, therefore, cannot be estimated.
9. CORONAVIRUS (COVID-19) PANDEMIC
On March 11, 2020, the World Health Organization announced that it had made the assessment that coronavirus disease 2019 (“COVID-19”) is a pandemic. The impacts of COVID-19 are affecting the entire global economy, individual companies and investment products, the funds, and the market in general. There is significant uncertainty around the extent and duration of business disruptions related to COVID-19 and the impacts may last for an extended period of time. COVID-19 has led to significant uncertainty and volatility in the financial markets.
10. SUBSEQUENT EVENTS
Effective after the close of business on November 1, 2021, the sale transaction of Wells Fargo Asset Management by Wells Fargo & Company to GTCR LLC and Reverence Capital Partners, L.P. was closed. In connection with the closing of the transaction, Wells Fargo Asset Management became known as Allspring Global Investments (“Allspring”) and various entities that provide services to the Fund changed their names to “Allspring”, including Allspring Funds Management, LLC (formerly Wells Fargo Funds Management, LLC), the investment manager to the Fund, Allspring Global Investments, LLC (formerly Wells Capital Management, LLC) and Allspring Global Investments (UK) Limited (formerly Wells Fargo Asset Management (International) Limited), both registered investment advisers providing sub-advisory services to certain funds, and Allspring Funds Distributor, LLC (formerly Wells Fargo Funds Distributor, LLC), the Fund's principal underwriter. These name changes have been reflected within this report.
24 | Wells Fargo Utility and Telecommunications Fund
Other information (unaudited)
PROXY VOTING INFORMATION
A description of the policies and procedures used to determine how to vote proxies relating to portfolio securities is available without charge, upon request, by calling 1-800-222-8222, visiting our website at allspringglobal.com, or visiting the SEC website at sec.gov. Information regarding how the proxies related to portfolio securities were voted during the most recent 12-month period ended June 30 is available on the website at allspringglobal.com or by visiting the SEC website at sec.gov.
SPECIAL MEETING OF SHAREHOLDERS
On September 15, 2021, a Special Meeting of Shareholders for the Fund was held to consider the following proposals. The results of the proposals are indicated below.
Proposal 1 – To consider and approve a new investment management agreement with Wells Fargo Funds Management, LLC*.
| Shares voted “For” | | 8,501,420 |
| Shares voted “Against” | | 552,962 |
| Shares voted “Abstain” | | 877,928 |
| Shares voted "Uninstructed" | | 480,000 |
Proposal 2 – To consider and approve a new investment subadvisory agreement with Wells Capital Management, LLC**.
| Shares voted “For” | | 8,410,029 |
| Shares voted “Against” | | 600,566 |
| Shares voted “Abstain” | | 921,725 |
| Shares voted "Uninstructed" | | 480,000 |
* Effective November 1, 2021, known as Allspring Funds Management, LLC.
** Effective November 1, 2021, known as Allspring Global Investments, LLC.
QUARTERLY PORTFOLIO HOLDINGS INFORMATION
The Fund files its complete schedule of portfolio holdings with the SEC for the first and third quarters of each fiscal year as an exhibit to its reports on Form N-PORT. Shareholders may view the filed Form N-PORT by visiting the SEC website at sec.gov.
Wells Fargo Utility and Telecommunications Fund | 25
Other information (unaudited)
BOARD OF TRUSTEES AND OFFICERS
Each of the Trustees and Officers listed in the table below acts in identical capacities for each fund in the Wells Fargo family of funds, which consists of 139 mutual funds comprising the Wells Fargo Funds Trust, Wells Fargo Variable Trust, Wells Fargo Master Trust and four closed-end funds (collectively the “Fund Complex”). This table should be read in conjunction with the Prospectus and the Statement of Additional Information1. The mailing address of each Trustee and Officer is 525 Market Street, 12th Floor, San Francisco, CA 94105. Each Trustee and Officer serves an indefinite term, however, each Trustee serves such term until reaching the mandatory retirement age established by the Trustees.
Independent Trustees
Name and
year of birth | Position held and
length of service* | Principal occupations during past five years or longer | Current other
public company or
investment
company
directorships |
William R. Ebsworth
(Born 1957) | Trustee,
since 2015 | Retired. From 1984 to 2013, equities analyst, portfolio manager, research director and chief investment officer at Fidelity Management and Research Company in Boston, Tokyo, and Hong Kong, and retired in 2013 as Chief Investment Officer of Fidelity Strategic Advisers, Inc. where he led a team of investment professionals managing client assets. Prior thereto, Board member of Hong Kong Securities Clearing Co., Hong Kong Options Clearing Corp., the Thailand International Fund, Ltd., Fidelity Investments Life Insurance Company, and Empire Fidelity Investments Life Insurance Company. Audit Committee Chair and Investment Committee Chair of the Vincent Memorial Hospital Endowment (non-profit organization). Mr. Ebsworth is a CFA® charterholder. | N/A |
Jane A. Freeman
(Born 1953) | Trustee,
since 2015;
Chair Liaison,
since 2018 | Retired. From 2012 to 2014 and 1999 to 2008, Chief Financial Officer of Scientific Learning Corporation. From 2008 to 2012, Ms. Freeman provided consulting services related to strategic business projects. Prior to 1999, Portfolio Manager at Rockefeller & Co. and Scudder, Stevens & Clark. Board member of the Harding Loevner Funds from 1996 to 2014, serving as both Lead Independent Director and chair of the Audit Committee. Board member of the Russell Exchange Traded Funds Trust from 2011 to 2012 and the chair of the Audit Committee. Ms. Freeman is also an inactive Chartered Financial Analyst. | N/A |
Isaiah Harris, Jr.
(Born 1952) | Trustee,
since 2009; Audit
Committee
Chair,
since 2019 | Retired. Chairman of the Board of CIGNA Corporation since 2009, and Director since 2005. From 2003 to 2011, Director of Deluxe Corporation. Prior thereto, President and CEO of BellSouth Advertising and Publishing Corp. from 2005 to 2007, President and CEO of BellSouth Enterprises from 2004 to 2005 and President of BellSouth Consumer Services from 2000 to 2003. Emeritus member of the Iowa State University Foundation Board of Governors. Emeritus Member of the Advisory Board of Iowa State University School of Business. Advisory Board Member, Palm Harbor Academy (private school). Mr. Harris is a certified public accountant (inactive status). | CIGNA Corporation |
Judith M. Johnson
(Born 1949) | Trustee,
since 2008 | Retired. Prior thereto, Chief Executive Officer and Chief Investment Officer of Minneapolis Employees Retirement Fund from 1996 to 2008. Ms. Johnson is an attorney, certified public accountant and a certified managerial accountant. | N/A |
David F. Larcker
(Born 1950) | Trustee,
since 2009 | James Irvin Miller Professor of Accounting at the Graduate School of Business (Emeritus), Stanford University, Director of the Corporate Governance Research Initiative and Senior Faculty of The Rock Center for Corporate Governance since 2006. From 2005 to 2008, Professor of Accounting at the Graduate School of Business, Stanford University. Prior thereto, Ernst & Young Professor of Accounting at The Wharton School, University of Pennsylvania from 1985 to 2005. | N/A |
26 | Wells Fargo Utility and Telecommunications Fund
Other information (unaudited)
Name and
year of birth | Position held and
length of service* | Principal occupations during past five years or longer | Current other
public company or
investment
company
directorships |
Olivia S. Mitchell
(Born 1953) | Trustee,
since 2006;
Nominating and
Governance
Committee Chair,
since 2018 | International Foundation of Employee Benefit Plans Professor, Wharton School of the University of Pennsylvania since 1993. Director of Wharton’s Pension Research Council and Boettner Center on Pensions & Retirement Research, and Research Associate at the National Bureau of Economic Research. Previously, Cornell University Professor from 1978 to 1993. | N/A |
Timothy J. Penny
(Born 1951) | Trustee,
since 1996;
Chair,
since 2018 | President and Chief Executive Officer of Southern Minnesota Initiative Foundation, a non-profit organization, since 2007. Member of the Board of Trustees of NorthStar Education Finance, Inc., a non-profit organization, since 2007. | N/A |
James G. Polisson
(Born 1959) | Trustee,
since 2018 | Retired. Chief Marketing Officer, Source (ETF) UK Services, Ltd, from 2015 to 2017. From 2012 to 2015, Principal of The Polisson Group, LLC, a management consulting, corporate advisory and principal investing company. Chief Executive Officer and Managing Director at Russell Investments, Global Exchange Traded Funds from 2010 to 2012. Managing Director of Barclays Global Investors from 1998 to 2010 and Global Chief Marketing Officer for iShares and Barclays Global Investors from 2000 to 2010. Trustee of the San Francisco Mechanics’ Institute, a non-profit organization, from 2013 to 2015. Board member of the Russell Exchange Traded Fund Trust from 2011 to 2012. Director of Barclays Global Investors Holdings Deutschland GmbH from 2006 to 2009. Mr. Polisson is an attorney and has a retired status with the Massachusetts and District of Columbia Bar Associations. | N/A |
Pamela Wheelock
(Born 1959) | Trustee,
since January
2020; previously
Trustee from
January 2018 to
July 2019 | Board member of the Destination Medical Center Economic Development Agency, Rochester, Minnesota since 2019. Interim President of the McKnight Foundation from January to September 2020. Acting Commissioner, Minnesota Department of Human Services, July 2019 through September 2019. Human Services Manager (part-time), Minnesota Department of Human Services, October 2019 through December 2019. Chief Operating Officer, Twin Cities Habitat for Humanity from 2017 to 2019. Vice President of University Services, University of Minnesota from 2012 to 2016. Prior thereto, on the Board of Directors, Governance Committee and Finance Committee for the Minnesota Philanthropy Partners (Saint Paul Foundation) from 2012 to 2018, Interim Chief Executive Officer of Blue Cross Blue Shield of Minnesota from 2011 to 2012, Chairman of the Board from 2009 to 2012 and Board Director from 2003 to 2015. Vice President, Leadership and Community Engagement, Bush Foundation, Saint Paul, Minnesota (a private foundation) from 2009 to 2011. Executive Vice President and Chief Financial Officer, Minnesota Sports and Entertainment from 2004 to 2009 and Senior Vice President from 2002 to 2004. Executive Vice President of the Minnesota Wild Foundation from 2004 to 2008. Commissioner of Finance, State of Minnesota, from 1999 to 2002. Currently Board Chair of the Minnesota Wild Foundation since 2010. | N/A |
* Length of service dates reflect the Trustee’s commencement of service with the Trust’s predecessor entities, where applicable.
Wells Fargo Utility and Telecommunications Fund | 27
Other information (unaudited)
Officers2
Name and
year of birth | Position held and
length of service | Principal occupations during past five years or longer |
Andrew Owen
(Born 1960) | President,
since 2017 | President, Chief Executive Officer and Director of Allspring Funds Management, LLC since 2017 and co-president of Galliard Capital Management, LLC, an affiliate of Allspring Funds Management, LLC, since 2019. Prior thereto, Head of Affiliated Managers, Allspring Global Investments, from 2014 to 2019 and Executive Vice President responsible for marketing, investments and product development for Allspring Funds Management, LLC, from 2009 to 2014. In addition, Mr. Owen was an Executive Vice President of Wells Fargo & Company from 2014 to 2021. |
Jeremy DePalma
(Born 1974) | Treasurer,
since 2012
(for certain funds in
the Fund Complex);
since 2021 (for
the remaining funds in the
Fund Complex) | Senior Vice President of Allspring Funds Management, LLC since 2009. Senior Vice President of Evergreen Investment Management Company, LLC from 2008 to 2010 and head of the Fund Reporting and Control Team within Fund Administration. |
Kate McKinley
(Born 1977) | Chief Legal Officer and Chief Compliance Officer,
since 2021 | Chief Legal Officer of Allspring Global Investments since 2021. Prior thereto, held various roles at State Street Global Advisors, Inc. beginning in 2010, including serving as Senior Vice President and General Counsel from 2019 to 2021. Previously served as Assistant General Counsel for Bank of America Corporation from 2005 to 2010 and as an Associate at WilmerHale from 2002 to 2005. |
Matthew Prasse
(Born 1983) | Secretary,
since 2021 | Senior Counsel of the Allspring Legal Department since 2021. Senior Counsel of the Wells Fargo Legal Department from 2018 to 2021. Previously, Counsel for Barings LLC from 2015 to 2018. Prior to joining Barings, Associate at Morgan, Lewis & Bockius LLP from 2008 to 2015. |
1 The Statement of Additional Information includes additional information about the Trustees and is available, without charge, upon request, by calling 1-800-222-8222 or by visiting the website at allspringglobal.com.
2 For those Officers with tenures at Allspring Global Investments and/or Allspring Funds Management, LLC that began prior to 2021, such tenures include years of service during which these businesses/entities were known as Wells Fargo Asset Management and Wells Fargo Funds Management, LLC, respectively.
28 | Wells Fargo Utility and Telecommunications Fund
Board considerations (unaudited)
BOARD CONSIDERATION OF INVESTMENT MANAGEMENT AND SUB-ADVISORY AGREEMENTS:
Board Considerations – Current Agreements
Under the Investment Company Act of 1940 (the “1940 Act”), the Board of Trustees (the “Board”) of Wells Fargo Funds Trust (the “Trust”) must determine annually whether to approve the continuation of the Trust’s investment management and sub-advisory agreements. In this regard, at a Board meeting held on May 17-19, 2021 (the “Meeting”), the Board, all the members of which have no direct or indirect interest in the investment management and sub-advisory agreements and are not “interested persons” of the Trust, as defined in the 1940 Act (the “Independent Trustees”), reviewed and approved for Wells Fargo Utility and Telecommunications Fund (the “Fund”): (i) an investment management agreement (the “Management Agreement”) with Wells Fargo Funds Management, LLC (“Funds Management”); and (ii) an investment sub-advisory agreement (the “Sub-Advisory Agreement”) with Wells Capital Management Incorporated (the “Sub-Adviser”), an affiliate of Funds Management. The Management Agreement and the Sub-Advisory Agreement are collectively referred to as the “Advisory Agreements.”
The Board noted that Wells Fargo & Company recently announced that it had entered into a definitive agreement to sell Wells Fargo Asset Management (“WFAM”), which includes Funds Management and the Sub-Adviser, to GTCR LLC and Reverence Capital Partners, L.P. and/or their affiliates (the “Transaction”). The Board further noted that the Transaction would result in a change-of-control of Funds Management and the Sub-Adviser, which would be considered to be an assignment that would result in the termination of the Advisory Agreements. In light of the Transaction, the Board separately considered for approval a new investment management agreement with Funds Management and a new sub-advisory agreement with the Sub-Adviser (the “New Agreements”) that would replace the Advisory Agreements upon consummation of the Transaction, subject to approval of the New Agreements by the Fund’s shareholders. The Board also considered for approval interim agreements to go into effect in the event shareholders do not approve the New Agreements before the Transaction is completed. The interim agreements would allow the Manager and the Sub-Adviser to continue providing services to the Fund while the Fund continues to seek shareholder approval of the New Agreements. The Board noted that the terms of the interim agreements would be identical to those of the current Advisory Agreements, except for the term and certain escrow provisions.
At the Meeting, the Board considered the factors and reached the conclusions described below relating to the selection of Funds Management and the Sub-Adviser and the approval of the Advisory Agreements. Prior to the Meeting, including at Board meetings held in April and May 2021, the Trustees conferred extensively among themselves and with representatives of Funds Management about these matters. Also, the Board has adopted a team-based approach, with each team consisting of a sub-set of Trustees, to assist the full Board in the discharge of its duties in reviewing investment performance and other matters throughout the year. The Independent Trustees were assisted in their evaluation of the Advisory Agreements by independent legal counsel, from whom they received separate legal advice and with whom they met separately.
In providing information to the Board, Funds Management and the Sub-Adviser were guided by a detailed set of requests for information submitted to them by independent legal counsel on behalf of the Independent Trustees at the start of the Board’s annual contract renewal process earlier in 2021. In considering and approving the Advisory Agreements, the Trustees considered the information they believed relevant, including but not limited to the information discussed below. The Board considered not only the specific information presented in connection with the Meeting, but also the knowledge gained over time through interaction with Funds Management and the Sub-Adviser about various topics. In this regard, the Board reviewed reports of Funds Management at each of its quarterly meetings, which included, among other things, portfolio reviews and investment performance reports. In addition, the Board and the teams mentioned above confer with portfolio managers at various times throughout the year. The Board did not identify any particular information or consideration that was all-important or controlling, and each individual Trustee may have attributed different weights to various factors.
After its deliberations, the Board unanimously determined that the compensation payable to Funds Management and the Sub-Adviser under each of the Advisory Agreements was reasonable, and approved the continuation of the Advisory Agreements for a one-year term. The Board considered the approval of the Advisory Agreements for the Fund as part of its consideration of agreements for funds across the complex, but its approvals were made on a fund-by-fund basis. The following summarizes a number of important, but not necessarily all, factors considered by the Board in support of its approvals.
Nature, extent and quality of services
The Board received and considered various information regarding the nature, extent and quality of services provided to the Fund by Funds Management and the Sub-Adviser under the Advisory Agreements. This information included a description of the investment advisory services and Fund-level administrative services covered by the Management Agreement, as well as, among other things, a summary of the background and experience of senior management of WFAM, of which Funds Management and the Sub-Adviser are a part, and a summary of investments made in the business of WFAM. The Board also received a description of
Wells Fargo Utility and Telecommunications Fund | 29
Board considerations (unaudited)
Funds Management’s and the Sub-Adviser’s business continuity plans, including a summary of the performance of such plans and any changes thereto during the COVID-19 pandemic, and of their approaches to data privacy and cybersecurity. The Board also received and reviewed information about Funds Management’s role as administrator of the Fund’s liquidity risk management program, Funds Management’s approach to risk management, and Funds Management’s intermediary and vendor oversight program.
The Board also considered the qualifications, background, tenure and responsibilities of each of the portfolio managers primarily responsible for the day-to-day portfolio management of the Fund. The Board evaluated the ability of Funds Management and the Sub-Adviser to attract and retain qualified investment professionals, including research, advisory and supervisory personnel.
The Board further considered the compliance programs and compliance records of Funds Management and the Sub-Adviser. In addition, the Board took into account the full range of services provided to the Fund by Funds Management and its affiliates. The Board also considered information about retention and back-up arrangements that have been put into place with respect to key personnel of WFAM in connection with the anticipated Transaction, noting that WFAM provided assurances that the announcement and eventual culmination of the Transaction is not expected to result in any diminution in the nature or quality of services provided to the Fund.
Fund investment performance and expenses
The Board considered the investment performance results for the Fund over various time periods ended December 31, 2020. The Board considered these results in comparison to the investment performance of funds in a universe that was determined by Broadridge Inc. (“Broadridge”) to be similar to the Fund (the “Universe”), and in comparison to the Fund’s benchmark index and to other comparative data. Broadridge is an independent provider of investment company data. The Board received a description of the methodology used by Broadridge to select the mutual funds in the performance Universe. The Board noted that the investment performance of the Fund (Class A) was higher than or in range of the average investment performance of the Universe for all periods under review. The Board also noted that the investment performance of the Fund was higher than its benchmark index, the S&P 500 Utilities Index, for all periods under review.
The Board also received and considered information regarding the Fund’s net operating expense ratios and their various components, including actual management fees, custodian and other non-management fees, and Rule 12b-1 and non-Rule 12b-1 shareholder service fees. The Board considered these ratios in comparison to the median ratios of funds in class-specific expense groups that were determined by Broadridge to be similar to the Fund (the “Groups”). The Board received a description of the methodology used by Broadridge to select the mutual funds in the expense Groups and an explanation of how funds comprising expense groups and their expense ratios may vary from year-to-year. Based on the Broadridge reports, the Board noted that the net operating expense ratios of the Fund were equal to or lower than the median net operating expense ratios of the expense Groups for each share class.
The Board took into account the Fund’s investment performance and expense information provided to it among the factors considered in deciding to re-approve the Advisory Agreements.
Investment management and sub-advisory fee rates
The Board reviewed and considered the contractual fee rates payable by the Fund to Funds Management under the Management Agreement, as well as the contractual fee rates payable by the Fund to Funds Management for class-level administrative services under a Class-Level Administration Agreement, which include, among other things, class-level transfer agency and sub-transfer agency costs (collectively, the “Management Rates”). The Board also reviewed and considered the contractual investment sub-advisory fee rates that are payable by Funds Management to the Sub-Adviser for investment sub-advisory services.
Among other information reviewed by the Board was a comparison of the Fund’s Management Rates with the average contractual investment management fee rates of funds in the expense Groups at a common asset level as well as transfer agency costs of the funds in the expense Groups. The Board noted that the Management Rates of the Fund were lower than or in range of the sum of these average rates for the Fund’s expense Groups for all share classes.
The Board also received and considered information about the nature and extent of services offered and fee rates charged by Funds Management and the Sub-Adviser to other types of clients with investment strategies similar to those of the Fund. In this regard, the Board received information about the significantly greater scope of services, and compliance, reporting and other legal burdens and risks of managing proprietary mutual funds compared with those associated with managing assets of other types of clients, including third-party sub-advised fund clients and non-mutual fund clients such as institutional separate accounts.
Based on its consideration of the factors and information it deemed relevant, including those described here, the Board determined that the compensation payable to Funds Management under the Management Agreement and to the Sub-Adviser under the Sub-Advisory Agreement was reasonable.
30 | Wells Fargo Utility and Telecommunications Fund
Board considerations (unaudited)
Profitability
The Board received and considered information concerning the profitability of Funds Management, as well as the profitability of both WFAM and Wells Fargo & Co. (“Wells Fargo”) from providing services to the fund family as a whole. The Board noted that the Sub-Adviser’s profitability information with respect to providing services to the Fund and other funds in the family was subsumed in the WFAM and Wells Fargo profitability analysis.
Funds Management reported on the methodologies and estimates used in calculating profitability, including a description of the methodology used to allocate certain expenses. Among other things, the Board noted that the levels of profitability reported on a fund-by-fund basis varied widely, depending on factors such as the size, type and age of fund.
Based on its review, the Board did not deem the profits reported by Funds Management, WFAM or Wells Fargo from services provided to the Fund to be at a level that would prevent it from approving the continuation of the Advisory Agreements.
Economies of scale
The Board received and considered information about the potential for Funds Management to experience economies of scale in the provision of management services to the Fund, the difficulties of calculating economies of scale at an individual fund level, and the extent to which potential scale benefits are shared with Fund shareholders. The Board noted the existence of breakpoints in the Fund’s management fee structure, which operate generally to reduce the Fund’s expense ratios as the Fund grows in size, and the size of the Fund in relation to such breakpoints. The Board considered that in addition to management fee breakpoints, Funds Management shares potential economies of scale from its management business in a variety of ways, including through fee waiver and expense reimbursement arrangements, competitive management fee rates set at the outset without regard to breakpoints, and investments in the business intended to enhance services available to shareholders.
The Board concluded that Funds Management’s arrangements with respect to the Fund, including contractual breakpoints, constituted a reasonable approach to sharing potential economies of scale with the Fund and its shareholders.
Other benefits to Funds Management and the Sub-Adviser
The Board received and considered information regarding potential “fall-out” or ancillary benefits received by Funds Management and its affiliates, including the Sub-Adviser, as a result of their relationships with the Fund. Ancillary benefits could include, among others, benefits directly attributable to other relationships with the Fund and benefits potentially derived from an increase in Funds Management’s and the Sub-Adviser’s business as a result of their relationships with the Fund. The Board noted that various affiliates of Funds Management may receive distribution-related fees, shareholder servicing payments and sub-transfer agency fees in respect of shares sold or held through them and services provided.
The Board also reviewed information about soft dollar credits earned and utilized by the Sub-Adviser, fees earned by Funds Management and the Sub-Adviser from managing a private investment vehicle for the fund family’s securities lending collateral, and commissions earned by an affiliated broker from portfolio transactions.
Based on its consideration of the factors and information it deemed relevant, including those described here, the Board did not find that any ancillary benefits received by Funds Management and its affiliates, including the Sub-Adviser, were unreasonable.
Conclusion
At the Meeting, after considering the above-described factors and based on its deliberations and its evaluation of the information described above, the Board unanimously determined that the compensation payable to Funds Management and the Sub-Adviser under each of the Advisory Agreements was reasonable, and approved the continuation of the Advisory Agreements for a one-year term.
Wells Fargo Utility and Telecommunications Fund | 31
Board considerations (unaudited)
Board Considerations – New Agreements
Overview of the Board evaluation process
At a meeting held on May 17-19, 2021 (the “Board Meeting”), the Board of Trustees (the “Board”) of Wells Fargo Funds Trust (the “Trust”, and the series identified below, the “Funds”) approved the continuation of each Fund’s current Investment Management Agreement (the “Current Investment Management Agreement”) and the current Sub-Advisory Agreements (the “Current Sub-Advisory Agreements”, and collectively, the “Current Agreements”).
| Wells Fargo Adjustable Rate Government Fund |
| Wells Fargo Asset Allocation Fund |
| Wells Fargo Conservative Income Fund |
| Wells Fargo Diversified Capital Builder Fund |
| Wells Fargo Diversified Income Builder Fund |
| Wells Fargo Emerging Markets Equity Fund |
| Wells Fargo Emerging Markets Equity Income Fund |
| Wells Fargo Global Small Cap Fund |
| Wells Fargo Government Securities Fund |
| Wells Fargo High Yield Bond Fund |
| Wells Fargo Income Plus Fund |
| Wells Fargo Index Asset Allocation Fund |
| Wells Fargo International Bond Fund |
| Wells Fargo International Equity Fund |
| Wells Fargo Precious Metals Fund |
| Wells Fargo Short Duration Government Bond Fund |
| Wells Fargo Short-Term Bond Plus Fund |
| Wells Fargo Short-Term High Yield Bond Fund |
| Wells Fargo Ultra Short-Term Income Fund |
| Wells Fargo Utility and Telecommunications Fund |
Each Trustee on the Board is not an “interested person” (as defined in the Investment Company Act of 1940 (the “1940 Act”)) of the Funds (collectively, the “Independent Trustees”). The process followed by the Board in considering and approving the continuation of the Current Agreements is referred to herein as the “2021 Annual Approval Process.”
As noted above, the closing of the sale of Wells Fargo Asset Management (“WFAM”) to a holding company (“NewCo”) affiliated with private funds of GTCR LLC (“GTCR”) and of Reverence Capital Partners, L.P. (“Reverence Capital”, and such transaction, the “Transaction”) will result in a change of control of Wells Fargo Funds Management LLC (“Funds Management”), Wells Capital Management Incorporated (“Wells Capital”) and Wells Fargo Asset Management (International) Limited (“WFAM(I) Ltd.”, and together with Funds Management and Wells Capital, the “Advisers”), which will be considered to be an “assignment” of each Fund’s Current Agreements under the 1940 Act that will result in the automatic termination of each Fund’s Current Agreements. In light of the expected termination of each Fund’s Current Agreements upon the closing, at the Board Meeting the Board also considered and approved the New Agreements, which are: (i) a new Investment Management Agreement (the “New Investment Management Agreement”) between the Trust, on behalf of each Fund, and Funds Management; (ii) a new Sub-Advisory Agreement (the “New Wells Capital Sub-Advisory Agreement”) among the Trust, on behalf of each Fund other than International Bond Fund, Funds Management and Wells Capital; and (iii) Sub-Advisory Agreement (the “New WFAM(I) Ltd Sub-Advisory Agreement”, and collectively, the “New Agreements”) among the Trust, on behalf of International Bond Fund, Funds Management and WFAM(I) Ltd (together with Wells Capital, the “Sub-Advisers”) with respect to International Bond Fund, each of which is intended to go into effect upon the closing. The process followed by the Board in reviewing and approving the New Agreements is referred to herein as the “New Agreement Approval Process.”
At a series of meetings held in April and May 2021 (collectively, “April and May 2021 Meetings”) and at the Board Meeting, the Trustees conferred extensively among themselves and with senior representatives of Funds Management, GTCR and Reverence Capital about the New Agreements and related matters. The Board reviewed and discussed information furnished by Funds Management, GTCR and Reverence Capital that the Board considered reasonably necessary to evaluate the terms of the New Agreements and the services to be provided. At these meetings, senior representatives from Funds Management, GTCR and Reverence Capital made presentations to, and responded to questions from, the Board.
In providing information to the Board in connection with the 2021 annual approval process for the Current Agreements (the “2021 Annual Approval Process”) and the New Agreement Approval Process, Funds Management, GTCR and Reverence Capital (as
32 | Wells Fargo Utility and Telecommunications Fund
Board considerations (unaudited)
applicable) were guided by requests for information submitted by independent legal counsel on behalf of the Independent Trustees. In considering and approving the New Agreements, the Trustees considered the information they believed relevant, including but not limited to the information discussed herein. The Board considered not only the specific information presented in connection with the April and May 2021 Meetings as well as the Board Meeting, but also the knowledge gained over time through interaction with Funds Management and the Sub-Advisers about various topics. In this regard, the Board reviews reports of Funds Management at each of its regular Board meetings, which includes, among other things, portfolio reviews and investment performance reports. In addition, the Board confers with portfolio managers at various times throughout the year. The Board was assisted in its evaluation of the New Agreements by independent legal counsel, from whom the Independent Trustees received separate legal advice and with whom the Independent Trustees met separately. The Board did not identify any particular information or consideration that was all-important or controlling, and each individual Trustee may have attributed different weights to various factors.
Among other information considered by the Board in connection with the Transaction was:
| ■ | Information regarding the Transaction: information about the structure, financing sources and material terms and conditions of the Transaction, including the expected impact on the businesses conducted by the Advisers and by Wells Fargo Funds Distributor LLC, as the distributor of Fund shares. |
| ■ | Information regarding NewCo, GTCR and Reverence Capital: (i) information about NewCo, including information about its expected financial condition and access to capital, and senior leadership team; (ii) the experience of senior management at GTCR and Reverence Capital in acquiring portfolio companies; (iii) the plan to operationalize NewCo, including the transition of necessary infrastructure services through a transition services agreement with Wells Fargo under which Wells Fargo will continue to provide NewCo with certain services for a specified period of time after the closing; and (iv) information regarding regulatory matters, compliance, and risk management functions at NewCo, including resources to be dedicated thereto. |
| ■ | Impact of the Transaction on WFAM and Service Providers: (i) information regarding any changes to personnel and/or other resources of the Advisers as a result of the Transaction, including assurances regarding comparable and competitive compensation arrangements to attract and retain highly qualified personnel; and (ii) information about the organizational and operating structure with respect to NewCo, the Advisers and the Funds. |
| ■ | Impact of the Transaction on the Funds and their Shareholders: (i) information regarding anticipated benefits to the Funds as a result of the Transaction; (ii) a commitment that the Funds would not bear any expenses, directly or indirectly, in connection with the Transaction; (iii) confirmation that the Advisers intend to continue to manage the Funds in a manner consistent with each Fund’s current investment objectives and principal investments strategies; and (iv) a commitment that neither NewCo nor WFAM will take any steps that would impose any “unfair burden” (as that term is used in section 15(f)(1)(B) of the 1940 Act) on the Funds as a result of the Transaction. |
With respect to the New Agreements, the Board considered: (i) a representation that, after the closing, all of the Funds will continue to be managed and advised by their current Advisers, and that the same portfolio managers of the Sub-Advisers are expected to continue to manage the Funds after the Transaction; (ii) information regarding the terms of the New Agreements, including changes as compared to the Current Agreements; (iii) information confirming that the fee rates payable under the New Agreements will not increase as a result of the Transaction as compared to the rates under the Current Agreements; and (iv) assurances that the Transaction is not expected to cause any diminution with respect to the nature, extent and quality of any of the services currently provided to the Funds by the Advisers as a result of the Transaction.
In addition to considering information furnished specifically to evaluate the impact of the Transaction on the Funds and their respective shareholders in connection with the New Agreement Approval Process, the Board considered information furnished at prior meetings of the Board and its committees, including detailed information provided in connection with the 2021 Annual Approval Process. In this regard, in connection with the 2021 Annual Approval Process, the Board received information about complex-wide and individual Fund performance, fees and expenses, including: (i) a report from an independent data provider comparing the investment performance of each Fund to the investment performance of comparable funds and benchmark indices, over various time periods; (ii) a report from an independent data provider comparing each Fund’s total expense ratio (and its components) to those of comparable funds; (iii) comparative information concerning the fees charged and services provided by the Advisers to each Fund in managing other accounts (which may include other mutual funds, collective investment funds and institutional accounts), if any, that employ investment strategies and techniques similar to those used in managing such Fund(s); and (iv) profitability analyses of Funds Management, as well as the profitability of both WFAM and Wells Fargo from providing services to the fund family as a whole.
After its deliberations, the Board unanimously determined that the compensation payable to Funds Management and the Sub-Advisers under the New Agreements is reasonable, approved the New Agreements for a two-year term, and voted to recommend
Wells Fargo Utility and Telecommunications Fund | 33
Board considerations (unaudited)
that Fund shareholders approve the New Agreements. The Board considered the approval of the New Agreements as part of its consideration of agreements for funds across the complex, but its approvals were made on a fund-by-fund basis. The following summarizes a number of important, but not necessarily all, factors considered by the Board in support of its approvals.
Nature, extent and quality of services
In connection with the 2021 Annual Approval Process, the Board received and considered various information regarding the nature, extent and quality of services provided to the Fund by Funds Management and the Sub-Advisers under the Advisory Agreements. This information included a description of the investment advisory services and Fund-level administrative services covered by the Current Management Agreement, as well as, among other things, a summary of the background and experience of senior management of WFAM, of which Funds Management and the Sub-Advisers are a part, and a summary of investments made in the business of WFAM. The Board also received a description of Funds Management’s and the Sub-Advisers’ business continuity plans, including a summary of the performance of such plans and any changes thereto during the COVID-19 pandemic, and of their approaches to data privacy and cybersecurity. The Board also received and reviewed information about Funds Management’s role as administrator of the Funds’ liquidity risk management program, Funds Management’s approach to risk management, and Funds Management’s intermediary and vendor oversight program.
In connection with the 2021 Annual Approval Process, the Board also considered the qualifications, background, tenure and responsibilities of each of the portfolio managers primarily responsible for the day-to-day portfolio management of the Funds. The Board evaluated the ability of Funds Management and the Sub-Advisers to attract and retain qualified investment professionals, including research, advisory and supervisory personnel.
In connection with the 2021 Annual Approval Process, the Board further considered the compliance programs and compliance records of Funds Management and the Sub-Advisers. In addition, the Board took into account the full range of services provided to the Fund by Funds Management and its affiliates.
In connection with the New Agreement Approval Process, the Board considered, among other information, the structure of the Transaction and expected impact, if any, of the Transaction on the operations, facilities, organization and personnel of the Advisers. The Board received assurances from Funds Management that each Fund will continue to be advised by its current Sub-Adviser after the closing, and that the same individual portfolio managers are expected to continue to manage the Funds after the closing. With respect to the recruitment and retention of key personnel, the Board noted information from GTCR, Reverence Capital and the Advisers regarding the potential benefits for employees of joining NewCo. The Board recognized that the personnel who had been extended offers may not accept such offers and personnel changes may occur in the future in the ordinary course.
In addition, the Board considered information regarding the infrastructure, operational capabilities and support staff in place to assist in the portfolio management and operations of the Funds, including the provision of administrative services, and the anticipated impact of the Transaction on such matters. The Board also considered the business-related and other risks to which the Advisers may be subject in managing the Funds and in connection with the Transaction. The Board also considered the transition and integration plans as a result of the change in ownership of the Advisers from Wells Fargo to NewCo. The Board considered the resources and infrastructure that NewCo intends to devote to its compliance program to ensure compliance with applicable laws and regulations, as well as its risk management program and cybersecurity program. The Board also took into account assurances received from the Advisers, GTCR and Reverence Capital that the Transaction is not expected to cause any diminution in the nature, extent and quality of services provided by the Advisers to the Funds and their shareholders.
Fund investment performance and expenses
In connection with the 2021 Annual Approval Process, the Board considered the investment performance results for each Fund over various time periods ended December 31, 2020. The Board considered these results in comparison to the investment performance of funds in a universe that was determined by Broadridge Inc. (“Broadridge”) to be similar to each Fund (the “Universe”), and in comparison to each Fund’s benchmark index and to other comparative data. Broadridge is an independent provider of investment company data. The Board received a description of the methodology used by Broadridge to select the mutual funds in the performance Universe. Where applicable, the Board received information concerning, and discussed factors contributing to, underperformance of Funds relative to the Universe and benchmark for any underperformance periods.
In connection with the 2021 Annual Approval Process, the Board also received and considered information regarding each Fund’s net operating expense ratios and their various components, including actual management fees, custodian and other non-management fees, and Rule 12b-1 and non-Rule 12b-1 shareholder service fees. The Board considered these ratios in comparison to the median ratios of funds in class-specific expense groups that were determined by Broadridge to be similar to the Fund (the “Groups”). The Board received a description of the methodology used by Broadridge to select the mutual funds in the expense Groups and an explanation of how funds comprising expense groups and their expense ratios may vary from year-to-year.
34 | Wells Fargo Utility and Telecommunications Fund
Board considerations (unaudited)
In connection with the New Agreement Approval Process, the Board received a commitment that WFAM will maintain fee and expense commitments for at least two years after the closing. The Board took into account each Fund’s investment performance and expense information among the factors considered in deciding to approve the New Agreements.
Investment management and sub-advisory fee rates
In connection with the 2021 Annual Approval Process, the Board reviewed and considered the contractual fee rates payable by each Fund to Funds Management under the Current Management Agreement, as well as the contractual fee rates payable by each Fund to Funds Management for class-level administrative services under a Class-Level Administration Agreement, which include, among other things, class-level transfer agency and sub-transfer agency costs (collectively, the “Management Rates”). The Board also reviewed and considered the contractual investment sub-advisory fee rates that are payable by Funds Management to each of the Sub-Advisers under the Current Sub-Advisory Agreements for investment sub-advisory services (the “Sub-Advisory Fee Rates”).
Among other information reviewed by the Board in connection with the 2021 Annual Approval Process, was a comparison of each Fund’s Management Rates with the average contractual investment management fee rates of funds in the expense Groups at a common asset level as well as transfer agency costs of the funds in the expense Groups.
In connection with the 2021 Annual Approval Process, the Board also received and considered information about the portion of the total management fee that was retained by Funds Management after payment of the Sub-Advisory Fee Rates. In assessing the reasonableness of this amount, the Board received and evaluated information about the nature and extent of responsibilities retained and risks assumed by Funds Management and not delegated to or assumed by the Sub-Advisers, and about Funds Management’s on-going oversight services. Given the affiliation between Funds Management and the Sub-Advisers, the Board ascribed limited relevance to the allocation of fees between them.
In connection with the 2021 Annual Approval Process, the Board also received and considered information about the nature and extent of services offered and fee rates charged by Funds Management and the Sub-Advisers to other types of clients, if any, with investment strategies similar to those of each Fund. In this regard, the Board received information about the significantly greater scope of services, and compliance, reporting and other legal burdens and risks of managing proprietary mutual funds compared with those associated with managing assets of other types of clients, including third-party sub-advised fund clients and non-mutual fund clients such as institutional separate accounts.
In connection with the New Agreement Approval Process, the Board noted the assurances received by it that there would be no increases to any of the Management Rates or the Sub-Advisory Fee Rates as a result of the Transaction. The Board also considered that the New Agreements do not change the computation method for calculating such fees, and there is no present intention to reduce expense waiver and reimbursement arrangements that are currently in effect. Based on its consideration of the factors and information it deemed relevant, including those described here, the Board determined that the compensation payable to Funds Management under the New Management Agreement and to each of the Sub-Advisers under the New Sub-Advisory Agreements was reasonable.
Profitability
In connection with the 2021 Annual Approval Process, the Board received and considered information concerning the profitability of Funds Management, as well as the profitability of both WFAM and Wells Fargo from providing services to the fund family as a whole. The Board noted that the Sub-Advisers’ profitability information with respect to providing services to each Fund and other funds in the family was subsumed in the WFAM and Wells Fargo profitability analysis.
Funds Management reported on the methodologies and estimates used in calculating profitability in connection with the 2021 Annual Approval Process, including a description of the methodology used to allocate certain expenses. Among other things, the Board noted that the levels of profitability reported on a fund-by-fund basis varied widely, depending on factors such as the size, type and age of fund.
In connection with the New Agreement Approval Process, the Board received certain information about NewCo’s projected financial condition, and reviewed with senior representatives of Funds Management, GTCR and Reverence Capital the underlying assumptions on which such information was based. The Board considered that NewCo is a newly formed entity, with no historical operations, revenues or expenses, and that it is difficult to predict with any degree of certainty the future profitability of NewCo and the Advisers from advisory activities under the New Agreements. The Board considered that the fee rates payable under the New Agreements will not increase as a result of the Transaction as compared to the rates under the Current Agreements, and that the current contractual expense limitations applicable to each Fund will not increase. The Board noted that if the New Agreements are approved by shareholders and the Transaction closes, the Board will have the opportunity in the future to review the profitability of NewCo and the Advisers from advisory activities under the New Agreements.
Wells Fargo Utility and Telecommunications Fund | 35
Board considerations (unaudited)
Economies of scale
In connection with the 2021 Annual Approval Process, the Board received and considered information about the potential for Funds Management to experience economies of scale in the provision of management services to the Funds, the difficulties of calculating economies of scale at an individual fund level, and the extent to which potential scale benefits are shared with Fund shareholders. The Board noted the existence of breakpoints in each Fund’s management fee structure, which operate generally to reduce the Fund’s expense ratios as the Fund grows in size, and the size of the Fund in relation to such breakpoints. The Board considered that, in addition to management fee breakpoints, Funds Management shares potential economies of scale from its management business in a variety of ways, including through fee waiver and expense reimbursement arrangements, competitive management fee rates set at the outset without regard to breakpoints, and investments in the business intended to enhance services available to shareholders.
In connection with the New Agreement Approval Process, the Board noted that NewCo and the Advisers may benefit from possible growth of the Funds resulting from enhanced distribution capabilities. However, the Board noted that other factors could also affect the potential for economies of scale, and that it was not possible to quantify any potential future economies of scale. Based upon the information furnished to the Board in connection with the 2021 Annual Approval Process and the New Agreement Approval Process, the Board concluded that Funds Management’s arrangements with respect to each Fund, including contractual breakpoints and expense limitation arrangements, constituted a reasonable approach to sharing potential economies of scale with the Fund and its shareholders.
“Fall-out” benefits to Funds Management and the Sub-Advisers
In connection with the 2021 Annual Approval Process, the Board received and considered information regarding potential “fall-out” or ancillary benefits received by Funds Management and its affiliates, including the Sub-Advisers, as a result of their relationships with the Funds. Ancillary benefits could include, among others, benefits directly attributable to other relationships with the Funds and benefits potentially derived from an increase in Funds Management’s and the Sub-Advisers’ business as a result of their relationships with the Funds. The Board noted that various current affiliates of Funds Management may receive distribution-related fees, shareholder servicing payments and sub-transfer agency fees in respect of shares sold or held through them and services provided.
In connection with the 2021 Annual Approval Process, the Board also reviewed information about soft dollar credits earned and utilized by the Sub-Advisers, fees earned by Funds Management and Wells Capital from managing a private investment vehicle for the fund family’s securities lending collateral, and commissions earned by an affiliated broker of Wells Fargo from portfolio transactions.
In connection with the New Agreement Approval Process, the Board received information to the effect that the Transaction is not expected to have a material impact on the fall-out benefits currently realized by Funds Management and its affiliates, including the Sub-Advisers. The information reviewed by the Board also noted that several of the ancillary benefits identified for WFAM would be potential ancillary benefits for NewCo, including that the scale and reputation of the Funds might benefit NewCo’s broader reputation, product initiatives, technology investment and talent acquisition. Based on its consideration of the factors and information it deemed relevant, including those described here, the Board did not find that any ancillary benefits expected to be received by Funds Management and its affiliates, including NewCo and the Sub-Advisers, under the New Agreements were unreasonable.
Conclusion
At the Board Meeting, after considering the above-described factors and based on its deliberations and its evaluation of the information described above, the Board unanimously determined that the compensation payable to Funds Management and to each of the Sub-Advisers under the New Agreements is reasonable, approved the New Agreements for a two-year term, and voted to recommend that Fund shareholders approve the New Agreements.
36 | Wells Fargo Utility and Telecommunications Fund
Board considerations (unaudited)
Board Considerations - Interim Agreements
At a meeting held on May 17-19, 2021 (the “Board Meeting”), the Boards of Trustees (each, a “Board”, and collectively, the “Boards”) of Wells Fargo Funds Trust, Wells Fargo Master Trust, Wells Fargo Variable Trust, Wells Fargo Global Dividend Opportunity Fund, Wells Fargo Income Opportunities Fund, Wells Fargo Multi-Sector Income Fund and Wells Fargo Utilities and High Income Fund (each a “Trust”, and the series thereof, a “Fund”) reviewed and approved for the Trusts and Funds, as applicable: (i) interim investment management agreements (the “Interim Management Agreements”) with Wells Fargo Funds Management, LLC (“Funds Management”); (ii) interim investment advisory agreements (the “Interim Advisory Agreements”) with Funds Management; and (iii) interim sub-advisory agreements (the “Interim Sub-Advisory Agreements”) with each of Cooke & Bieler, L.P., Galliard Capital Management LLC (“Galliard”), Peregrine Capital Management Inc., Wells Capital Management, LLC (“WellsCap”), and Wells Fargo Asset Management (International) Limited (“WFAMI”, and collectively, the “Sub-Advisers”). Each Trustee on the Board is not an “interested person” (as defined in the Investment Company Act of 1940 (the “1940 Act”) of the Funds (collectively, the “Independent Trustees”). The Interim Management Agreements, Interim Advisory Agreements, and Interim Sub-Advisory Agreements are collectively referred to as the “Interim Advisory Agreements.”
At the Board Meeting, the Boards reviewed and approved the continuation of existing investment management, advisory and sub-advisory agreements (the “Current Advisory Agreements”) for each Trust and Fund, as applicable. The factors considered and conclusions reached by the Boards in approving the Current Advisory Agreements are summarized in the section entitled “Board Considerations – Current Agreements” of this shareholder report. The Boards noted that Wells Fargo & Company has entered into a definitive agreement to sell Wells Fargo Asset Management (“WFAM”), which includes Funds Management, Galliard, WellsCap and WFAMI (the “Affiliated Sub-Advisers”), to a holding company affiliated with private funds of GTCR LLC and Reverence Capital Partners, L.P. (the “Transaction”). The Boards further noted that the Transaction would result in a change-of-control of Funds Management and the Affiliated Sub-Advisers, which would be considered to be an “assignment” under the 1940 Act that would terminate the Current Advisory Agreements. At the Board Meeting, the Boards also reviewed and approved new investment management, advisory and sub-advisory agreements (the “New Advisory Agreements”) for each Trust and Fund, as applicable, that would replace the Current Advisory Agreements upon consummation of the Transaction, subject to approval of the New Advisory Agreements by the applicable Trust’s or Fund’s shareholders. The factors considered and conclusions reached by the Boards in approving the New Advisory Agreements are summarized in the section entitled “Board Considerations – New Agreements” of this shareholder report.
At the Board Meeting, the Boards also approved the Interim Advisory Agreements, which will go into effect for a Trust or Fund only in the event that shareholders of such Trust or Fund do not approve the New Advisory Agreement(s) for the Trust or Fund by the closing date of the Transaction, when the Current Advisory Agreements will terminate. The Board noted that, in such a circumstance, the Interim Advisory Agreements will permit continuity of management by allowing Funds Management and the Sub-Advisers to continue providing services to the Trust or Fund pursuant to the Interim Advisory Agreements while the Trust or Fund continues to solicit shareholder approval of such New Advisory Agreement(s). The Boards noted that the terms of the Interim Advisory Agreements are identical to those of the Current Advisory Agreements, except for the term and the addition of escrow provisions with respect to the advisory fees. The Boards also noted that the entities that would service the Funds and Trusts under the Interim Advisory Agreements are identical to those that provide services under the Current Advisory Agreements and those that will provide services under the New Advisory Agreements.
In approving the Interim Advisory Agreements, the Boards considered the same factors and reached the same conclusions as they considered and reached with respect to the Boards’ approvals of the Current Advisory Agreements and New Advisory Agreements, as applicable, which are described in separate Board Consideration sections within this shareholder report. Prior to the Board Meeting, including at a series of meetings held in April and May 2021, the Trustees conferred extensively among themselves and with senior representatives of Funds Management, GTCR LLC and Reverence Capital Partners, L.P. about the Interim Advisory Agreements and related matters. The Independent Trustees were assisted in their evaluation of the Interim Advisory Agreements by independent legal counsel, from whom they received separate legal advice and with whom they met separately.
At the Board Meeting, after considering the factors and reaching the conclusions described in the separate Board Consideration sections within this shareholder report, the Boards unanimously determined that the compensation payable to Funds Management and to each Sub-Adviser under each of the Interim Advisory Agreements was reasonable, and approved the Interim Advisory Agreements.
Wells Fargo Utility and Telecommunications Fund | 37
For more information
More information about Wells Fargo Funds is available free upon request. To obtain literature, please write, visit the Fund's website, or call:
Wells Fargo Funds
P.O. Box 219967
Kansas City, MO 64121-9967
Website: allspringglobal.com
Individual investors: 1-800-222-8222
Retail investment professionals: 1-888-877-9275
Institutional investment professionals: 1-866-765-0778
This report and the financial statements contained herein are submitted for the general information of the shareholders of the Fund. If this report is used for promotional purposes, distribution of the report must be accompanied or preceded by a current prospectus. Before investing, please consider the investment objectives, risks, charges, and expenses of the investment. For a current prospectus and, if available, a summary prospectus, containing this information, call
1-800-222-8222 or visit the Fund's website at allspringglobal.com. Read the prospectus carefully before you invest or send money.
Allspring Global InvestmentsTM is the trade name for the asset management firms of Allspring Global Investments Holdings, LLC, a holding company indirectly owned by certain private funds of GTCR LLC and Reverence Capital Partners, L.P. These firms include but are not limited to Allspring Global Investments, LLC, and Allspring Funds Management, LLC. Certain products managed by Allspring entities are distributed by Allspring Funds Distributor, LLC (a broker-dealer and Member FINRA/SIPC).
This material is for general informational and educational purposes only and is NOT intended to provide investment advice or a recommendation of any kind - including a recommendation for any specific investment, strategy, or plan.
© 2021 Allspring Global Investments. All rights reserved.
PAR-1121-00204 09-21
SA318/SAR318 09-21
ITEM 2. CODE OF ETHICS
Not applicable.
ITEM 3. AUDIT COMMITTEE FINANCIAL EXPERT
Not applicable.
ITEM 4. PRINCIPAL ACCOUNTANT FEES AND SERVICES
Not applicable.
ITEM 5. AUDIT COMMITTEE OF LISTED REGISTRANTS
Not applicable.
ITEM 6. INVESTMENTS
A Portfolio of Investments for each series of Wells Fargo Funds Trust is included as part of the report to shareholders filed under Item 1 of this Form.
ITEM 7. DISCLOSURE OF PROXY VOTING POLICIES AND PROCEDURES FOR CLOSED-END MANAGEMENT INVESTMENT COMPANIES
Not applicable.
ITEM 8. PORTFOLIO MANAGERS OF CLOSED-END MANAGEMENT INVESTMENT COMPANIES
Not applicable.
ITEM 9. PURCHASES OF EQUITY SECURITIES BY CLOSED-END MANAGEMEENT INVESTMENT COMPANY AND AFFILIATED PURCHASERS
Not applicable.
ITEM 10. SUBMISSION OF MATTERS TO A VOTE OF SECURITY HOLDERS
There have been no material changes to the procedures by which shareholders may recommend nominees to the registrant’s Board of Trustees that have been implemented since the registrant’s last provided disclosure in response to the requirements of this Item.
ITEM 11. CONTROLS AND PROCEDURES
(a) The President and Treasurer have concluded that the Wells Fargo Funds Trust disclosure controls and procedures (as defined in Rule 30a-3(c) under the Investment Company Act of 1940) provide reasonable assurances that material information relating to the registrant is made known to them by the appropriate persons, based on their evaluation of these controls and procedures as of a date within 90 days of the filing of this report.
(b) There were no significant changes in the registrant’s internal controls over financial reporting (as defined in Rule 30a-3(d) under the Investment Company Act of 1940) that occurred during the most recent fiscal half-year of the period covered by this report that materially affected, or is reasonably likely to materially affect, the registrant’s internal control over financial reporting.
ITEM 12. DISCLOSURES OF SECURITIES LENDING ACTIVITES FOR CLOSED-END MANAGEMENT INVESTMENT COMPANIES
Not applicable.
ITEM 13. EXHIBITS
(a)(1) Not applicable.
(a)(2) Certifications pursuant to Section 302 of the Sarbanes-Oxley Act of 2002.
(b) Certifications pursuant to Section 906 of the Sarbanes-Oxley Act of 2002.
SIGNATURES
Pursuant to the requirements of the Securities Exchange Act of 1934 and the Investment Company Act of 1940, the registrant has duly caused this report to be signed on its behalf by the undersigned, thereunto duly authorized.
| | |
| Wells Fargo Funds Trust |
| |
| By: | | /s/ Andrew Owen |
| | Andrew Owen |
| | President |
|
| Date: November 23, 2021 |
Pursuant to the requirements of the Securities Exchange Act of 1934 and the Investment Company Act of 1940, this report has been signed below by the following persons on behalf of the registrant and in the capacities and on the date indicated.
| | |
| Wells Fargo Funds Trust |
| |
| By: | | /s/ Andrew Owen |
| | Andrew Owen |
| | President |
|
| Date: November 23, 2021 |
| | |
| By: | | /s/ Jeremy DePalma |
| | Jeremy DePalma |
| | Treasurer |
|
| Date: November 23, 2021 |