UNITED STATES
SECURITIES AND EXCHANGE COMMISSION
Washington, D.C. 20549
FORM N-CSRS
CERTIFIED SHAREHOLDER REPORT OF REGISTERED
MANAGEMENT INVESTMENT COMPANIES
Investment Company Act file number: 811-09253
Wells Fargo Funds Trust
(Exact name of registrant as specified in charter)
525 Market St., San Francisco, CA 94105
(Address of principal executive offices) (Zip code)
Matthew Prasse
Wells Fargo Funds Management, LLC
525 Market St., San Francisco, CA 94105
(Name and address of agent for service)
Registrant’s telephone number, including area code: 800-222-8222
Date of fiscal year end: February 28
Registrant is making a filing for 23 of its series:
Wells Fargo Dynamic Target Today Fund, Wells Fargo Dynamic Target 2015 Fund, Wells Fargo Dynamic Target 2020 Fund, Wells Fargo Dynamic Target 2025 Fund, Wells Fargo Dynamic Target 2030 Fund, Wells Fargo Dynamic Target 2035 Fund, Wells Fargo Dynamic Target 2040 Fund, Wells Fargo Dynamic Target 2045 Fund, Wells Fargo Dynamic Target 2050 Fund, Wells Fargo Dynamic Target 2055 Fund, Wells Fargo Dynamic Target 2060 Fund, Wells Fargo Target Today Fund, Wells Fargo Target 2010 Fund, Wells Fargo Target 2015 Fund, Wells Fargo Target 2020 Fund, Wells Fargo Target 2025 Fund, Wells Fargo Target 2030 Fund, Wells Fargo Target 2035 Fund, Wells Fargo Target 2040 Fund, Wells Fargo Target 2045 Fund, Wells Fargo Target 2050 Fund, Wells Fargo Target 2055 Fund, and Wells Fargo Target 2060 Fund.
Date of reporting period: August 31, 2021
| ITEM 1. | REPORT TO STOCKHOLDERS |
Semi-Annual Report
August 31, 2021
Target Date Retirement Funds
| ■ | Wells Fargo Target Today Fund |
| ■ | Wells Fargo Target 2010 Fund |
| ■ | Wells Fargo Target 2015 Fund |
| ■ | Wells Fargo Target 2020 Fund |
| ■ | Wells Fargo Target 2025 Fund |
| ■ | Wells Fargo Target 2030 Fund |
| ■ | Wells Fargo Target 2035 Fund |
| ■ | Wells Fargo Target 2040 Fund |
| ■ | Wells Fargo Target 2045 Fund |
| ■ | Wells Fargo Target 2050 Fund |
| ■ | Wells Fargo Target 2055 Fund |
| ■ | Wells Fargo Target 2060 Fund |
The views expressed and any forward-looking statements are as of August 31, 2021, unless otherwise noted, and are those of the Fund's portfolio managers and/or Wells Fargo Asset Management. Discussions of individual securities or the markets generally are not intended as individual recommendations. Future events or results may vary significantly from those expressed in any forward-looking statements. The views expressed are subject to change at any time in response to changing circumstances in the market. Wells Fargo Asset Management disclaims any obligation to publicly update or revise any views expressed or forward-looking statements.
INVESTMENT PRODUCTS: NOT FDIC INSURED ■ NO BANK GUARANTEE ■ MAY LOSE VALUE
Target Date Retirement Funds | 1
Letter to shareholders (unaudited)
Andrew Owen
President
Wells Fargo Funds
Dear Shareholder:
We are pleased to offer you this semi-annual report for Wells Fargo Target Date Funds for the six-month period that ended August 31, 2021. Global stocks continued to rally as the global economy continued to emerge from the haze of COVID-19. Tailwinds were provided by global stimulus programs, a rapid vaccination rollout, and recovering consumer and corporate sentiment. Bonds were mixed during the period, with municipal bonds and high-yield bonds delivering positive returns.
For the six-month period, U.S. stocks, based on the S&P 500 Index,1 gained 19.52%. International stocks, as measured by the MSCI ACWI ex USA Index (Net),2 returned 7.05%, while the MSCI EM Index (Net),3 trailed its developed market counterparts with a 0.98% loss. Among bond indexes, the Bloomberg U.S. Aggregate Bond Index,4 returned 1.49%, the Bloomberg Global Aggregate ex-USD Index (unhedged),5 returned -0.65%, the Bloomberg Municipal Bond Index,6 returned 2.51%, and the ICE BofA U.S. High Yield Index,7 gained 3.88%.
Vaccination rollout drove the stock markets to new highs.
The passage of the massive domestic stimulus bill highlighted March activity, leading to increased forecasts for U.S. growth in 2021. Domestic employment surged as COVID-19 vaccinations and an increasingly open economy spurred hiring. A majority of U.S. small companies reported they were operating at pre-pandemic capacity or higher. Value stocks continued their outperformance of growth stocks in the month, continuing the trend that started in late 2020. Meanwhile, most major developed global equity indexes were up month to date on the back of rising optimism regarding the outlook for global growth. While the U.S. and the U.K. have been the most successful in terms of the vaccine rollout, even in markets where the vaccine has lagged, such as in the eurozone and Japan, equity indexes in many of those countries have also been in positive territory this year.
| 1 | The S&P 500 Index consists of 500 stocks chosen for market size, liquidity, and industry group representation. It is a market-value-weighted index with each stock's weight in the index proportionate to its market value. You cannot invest directly in an index. |
| 2 | The Morgan Stanley Capital International (MSCI) All Country World Index (ACWI) ex USA Index (Net) is a free-float-adjusted market-capitalization-weighted index that is designed to measure the equity market performance of developed and emerging markets, excluding the United States. Source: MSCI. MSCI makes no express or implied warranties or representations and shall have no liability whatsoever with respect to any MSCI data contained herein. The MSCI data may not be further redistributed or used as a basis for other indices or any securities or financial products. This report is not approved, reviewed, or produced by MSCI. You cannot invest directly in an index. |
| 3 | The MSCI Emerging Markets (EM) Index (Net) is a free-float-adjusted market-capitalization-weighted index that is designed to measure equity market performance of emerging markets. You cannot invest directly in an index. |
| 4 | The Bloomberg U.S. Aggregate Bond Index is a broad-based benchmark that measures the investment-grade, U.S.-dollar-denominated, fixed-rate taxable bond market, including Treasuries, government-related and corporate securities, mortgage-backed securities (agency fixed-rate and hybrid adjustable-rate mortgage pass-throughs), asset-backed securities, and commercial mortgage-backed securities. You cannot invest directly in an index. |
| 5 | The Bloomberg Global Aggregate ex-USD Index (unhedged) is an unmanaged index that provides a broad-based measure of the global investment-grade fixed-income markets excluding the U.S.-dollar-denominated debt market. You cannot invest directly in an index. |
| 6 | The Bloomberg Municipal Bond Index is an unmanaged index composed of long-term tax-exempt bonds with a minimum credit rating of Baa. You cannot invest directly in an index. |
| 7 | The ICE BofA U.S. High Yield Index is a market-capitalization-weighted index of domestic and Yankee high-yield bonds. The index tracks the performance of high-yield securities traded in the U.S. bond market. You cannot invest directly in an index. Copyright 2021. ICE Data Indices, LLC. All rights reserved. |
2 | Target Date Retirement Funds
Letter to shareholders (unaudited)
Equity markets produced another strong showing in April. Domestically, the continued reopening of the economy had a strong impact on positive equity performance, as people started leaving their households and jobless claims continued to fall. Domestic corporate bonds performed well and the U.S. dollar weakened. Meanwhile, the U.S. government continued to seek to invest in the recovery, this time by outlining a package of over $2 trillion to improve infrastructure. The primary headwind in April was inflation, as investors tried to determine the breadth and longevity of recent price increases. Developed Europe has been supported by a meaningful increase in the pace of vaccinations. Unfortunately many emerging market countries have not been as successful. India in particular has seen COVID-19 cases surge, serving as an example of the need to get vaccinations rolled out to less developed nations.
Vaccine rollouts continued in May, leading to loosened restrictions globally. As a result, equity markets in general saw a minor increase in returns. Concerns that the continued economic rebound could result in inflation increases becoming more than transitory were supported by the higher input costs businesses were experiencing. Meanwhile, those inflation concerns were tempered by the U.S. Federal Reserve (Fed), which stayed steady on its view of the economy and eased fears of a sudden and substantial policy change. Positive performance in the emerging market equity space was supported this month by steady consumer demand and strong commodity prices. Fixed-income markets were also slightly positive for the month, driven by inflation uncertainty and a softer U.S. dollar.
June witnessed the S&P 500 Index reach a new all-time high. 2021 economic growth and inflation forecasts were revised higher to reflect a strong economic recovery and some supply and demand imbalances. Late June saw a deal reached on a U.S. infrastructure package of approximately $1 trillion for road, bridge, and broadband network upgrades over the next eight years. The Fed’s June meeting yielded no change to policy, but its projections pointed to a possible interest rate rise in 2023. This, combined with a rebound in economic activity and investors searching for yield, led to U.S. Treasury yields being down for the month. Many European and Asian countries saw vaccination momentum increase, while the U.K. dealt with a rise in COVID-19 infections, specifically the Delta variant. Meanwhile, crude oil jumped over 10% in June on the back of the pickup in global economic activity and the Organization of the Petroleum Exporting Countries’ (OPEC) slow pace of supply growth.
July began the month seeing vaccinations making progress, as several major developed countries eased restrictions, only to be threatened again by the spread of COVID-19’s Delta variant. Inflation continued to climb, aided by the continued supply bottleneck in the face of high demand. As it pertains to the equity area of the market, U.S. equities led the way in positive return territory, followed by international developed markets. In contrast, emerging markets were well in negative territory for the month, hindered by China’s plans for new regulations on a number of sectors, specifically education and technology. The U.S. 10-Year Treasury bond yield continued to decline, as strong demand swallowed up supply. After hitting a multi-year high earlier in the month, oil prices leveled off following an agreement by OPEC to raise oil production starting in August.
The Delta variant of COVID-19 produced outbreaks globally in August, increasing the potential for increased market volatility and bringing into question the ongoing economic recovery. Domestically, the U.S. economy continued to stay strong in the face of the Delta variant, continued inflationary pressures, and worries over Hurricane Ida. Emerging market equities experienced elevated volatility, largely influenced by China’s regulatory stance. Emerging market equities started the month with poor performance but rebounded to end the month in positive territory. Municipal debt experienced its first monthly performance drop since February of this year, slowing a rally that made it one of the best-performing sectors of the bond market. In the commodity segment of the market, crude oil fell sharply during the month on the back of dampened expectations as a result of the Delta variant but was still a leading asset class performer for the year.
“2021 economic growth and inflation forecasts were revised higher to reflect a strong economic recovery and some supply and demand imbalances.”
“Municipal debt experienced its first monthly performance drop since February of this year, slowing a rally that made it one of the best-performing sectors of the bond market.”
Target Date Retirement Funds | 3
Letter to shareholders (unaudited)
Don’t let short-term uncertainty derail long-term investment goals.
Periods of investment uncertainty can present challenges, but experience has taught us that maintaining long-term investment goals can be an effective way to plan for the future. To help you create a sound strategy based on your personal goals and risk tolerance, Wells Fargo Funds offers more than 100 mutual funds spanning a wide range of asset classes and investment styles. Although diversification cannot guarantee an investment profit or prevent losses, we believe it can be an effective way to manage investment risk and potentially smooth out overall portfolio performance. We encourage investors to know their investments and to understand that appropriate levels of risk-taking may unlock opportunities.
Thank you for choosing to invest with Wells Fargo Funds. We appreciate your confidence in us and remain committed to helping you meet your financial needs.
Sincerely,
Andrew Owen
President
Wells Fargo Funds
For further information about your Fund, contact your investment professional, visit our website at wfam.com, or call us directly at 1-800-222-8222.
4 | Target Date Retirement Funds
Letter to shareholders (unaudited)
Preparing for LIBOR Transition
The global financial industry is preparing to transition away from the London Interbank Offered Rate (LIBOR), a key benchmark interest rate, to new alternative rates. LIBOR underpins trillions of dollars of financial contracts. It is the benchmark rate for a wide spectrum of products ranging from residential mortgages to corporate bonds to derivatives. Regulators have called for a market-wide transition away from LIBOR to successor reference rates by the end of 2021 (by June 30, 2023 for most tenors of the U.S. dollar LIBOR), which requires proactive steps be taken by issuers, counterparties, and asset managers to identify impacted products and adopt new reference rates.
Each Fund invests in at least one underlying fund that holds at one or more securities that use LIBOR as a floating reference rate and has a maturity date after December 31, 2021.
Although the transition process away from LIBOR has become increasingly well-defined in advance of the anticipated discontinuation date, there remains uncertainty regarding the nature of successor reference rates, and any potential effects of the transition away from LIBOR on investment instruments that use it as a benchmark rate. The transition process may result in, among other things, increased volatility or illiquidity in markets for instruments that currently rely on LIBOR and could negatively impact the value of certain instruments held by each Fund.
Wells Fargo Asset Management is monitoring LIBOR exposure closely and has put resources and controls in place to manage this transition effectively. Each Fund’s portfolio management team is evaluating LIBOR holdings to understand what happens to those securities when LIBOR ceases to exist, including examining security documentation to identify the presence or absence of fallback language identifying a replacement rate to LIBOR.
While the pace of transition away from LIBOR will differ by asset class and investment strategy, the portfolio management team will monitor market conditions for those holdings to identify and mitigate deterioration or volatility in pricing and liquidity and ensure appropriate actions are taken in a timely manner.
Further information regarding the potential risks associated with the discontinuation of LIBOR can be found in the Funds' Statement of Additional Information.
Target Date Retirement Funds | 5
Wells Fargo Target Date Funds
Investment objective
Each Fund seeks total return over time, consistent with its strategic target asset allocation.
Manager
Wells Fargo Funds Management, LLC
Subadviser
Wells Capital Management, LLC
Portfolio managers
Kandarp R. Acharya, CFA®‡, FRM
Petros N. Bocray, CFA®‡, FRM
Christian L. Chan, CFA®‡
The target date represents the year in which investors may likely begin withdrawing assets. The Funds gradually seek to reduce market risk as the target date approaches and after it arrives by decreasing equity exposure and increasing fixed income exposure. The principal value is not guaranteed at any time, including at the target date.
Stock values fluctuate in response to the activities of individual companies and general market and economic conditions. Bond values fluctuate in response to the financial condition of individual issuers, general market and economic conditions, and changes in interest rates. Changes in market conditions and government policies may lead to periods of heightened volatility in the bond market and reduced liquidity for certain bonds held by each Fund. In general, when interest rates rise, bond values fall and investors may lose principal value. Interest rate changes and their impact on each Fund and its share price can be sudden and unpredictable. High-yield securities have a greater risk of default and tend to be more volatile than higher-rated debt securities. The use of derivatives may reduce returns and/or increase volatility. Securities issued by U.S. government agencies or government-sponsored entities may not be guaranteed by the U.S. Treasury. The Funds will indirectly be exposed to all of the risks of an investment in the underlying funds and will indirectly bear expenses of the underlying funds. Certain investment strategies tend to increase the total risk of an investment (relative to the broader market). The Funds are exposed to foreign investment risk, mortgage- and asset-backed securities risk, regulatory risk, and smaller-company investment risk. Consult the Funds’ prospectus for additional information on these and other risks.
| ‡ | CFA® and Chartered Financial Analyst® are trademarks owned by CFA Institute. |
6 | Target Date Retirement Funds
Wells Fargo Target Today Fund
| Average annual total returns (%) as of August 31, 2021 |
| | | Including sales charge | | Excluding sales charge | | Expense ratios1 (%) |
| | Inception date | 1 year | 5 year | 10 year | | 1 year | 5 year | 10 year | | Gross | Net 2 |
| Class A (STWRX) | 3-1-1994 | 2.77 | 3.79 | 3.07 | | 9.04 | 5.02 | 3.68 | | 0.96 | 0.60 |
| Class C (WFODX) | 12-1-1998 | 7.29 | 4.25 | 2.91 | | 8.29 | 4.25 | 2.91 | | 1.71 | 1.35 |
| Class R (WFRRX)3 | 6-28-2013 | – | – | – | | 8.79 | 4.91 | 3.52 | | 1.21 | 0.85 |
| Class R4 (WOTRX)4 | 11-30-2012 | – | – | – | | 9.37 | 5.25 | 4.01 | | 0.68 | 0.29 |
| Class R6 (WOTDX) | 6-30-2004 | – | – | – | | 9.53 | 5.49 | 4.18 | | 0.53 | 0.14 |
| Administrator Class (WFLOX) | 11-8-1999 | – | – | – | | 9.21 | 5.14 | 3.82 | | 0.88 | 0.49 |
| S&P Target Date Retirement Income Index5 | – | – | – | – | | 8.83 | 6.31 | 5.68 | | – | – |
| Target Today Blended Index6 | – | – | – | – | | 9.58 | – | – | | – | – |
Figures quoted represent past performance, which is no guarantee of future results, and do not reflect taxes that a shareholder may pay on an investment in a fund. Investment return and principal value of an investment will fluctuate so that an investor’s shares, when redeemed, may be worth more or less than their original cost. Performance shown without sales charges would be lower if sales charges were reflected. Current performance may be lower or higher than the performance data quoted, which assumes the reinvestment of dividends and capital gains. Current month-end performance is available on the Fund’s website, wfam.com.
Index returns do not include transaction costs associated with buying and selling securities, any mutual fund fees or expenses, or any taxes. It is not possible to invest directly in an index.
For Class A shares, the maximum front-end sales charge is 5.75%. For Class C shares, the maximum contingent deferred sales charge is 1.00%. Performance including a contingent deferred sales charge assumes the sales charge for the corresponding time period. Class R, Class R4, Class R6, and Administrator Class shares are sold without a front-end sales charge or contingent deferred sales charge.
| 1 | Reflects the expense ratios as stated in the most recent prospectuses, which include the impact of 0.10% of acquired fund fees and expenses representing the net expenses from the affiliated master portfolios. The expense ratios shown are subject to change and may differ from the annualized expense ratios shown in the financial highlights of this report. |
| 2 | The manager has contractually committed through June 30, 2022, to waive fees and/or reimburse expenses to the extent necessary to cap total annual fund operating expenses after fee waivers at 0.60% for Class A, 1.35% for Class C, 0.85% for Class R, 0.29% for Class R4, 0.14% for Class R6, and 0.49% for Administrator Class. Brokerage commissions, stamp duty fees, interest, taxes, acquired fund fees and expenses (if any) from funds in which the underlying affiliated master portfolios invest and from money market funds, and extraordinary expenses are excluded from the expense caps. All other acquired fund fees and expenses from the affiliated master portfolios are included in the expense caps. Prior to or after the commitment expiration date, the caps may be increased or the commitment to maintain the caps may be terminated only with the approval of the Board of Trustees. Without these caps, the Fund’s returns would have been lower. The expense ratio paid by an investor is the net expense ratio (the total annual fund operating expenses after fee waivers) as stated in the prospectuses. |
| 3 | Historical performance shown for the Class R shares prior to their inception reflects the performance of the Class A shares and has been adjusted to reflect the higher expenses applicable to the Class R shares. |
| 4 | Historical performance shown for the Class R4 shares prior to their inception reflects the performance of the Class R6 shares and has been adjusted to reflect the higher expenses applicable to the Class R4 shares. |
| 5 | The S&P Target Date Index is designed as a benchmark for multi-asset class portfolios with risk profiles that become more conservative over time, corresponding to the target retirement date. This index is representative of the investment opportunity available to investors for the target date horizon, with asset class exposures driven by a survey of available target date funds for that horizon. You cannot invest directly in an index. |
| 6 | Source: Wells Fargo Funds Management, LLC. The Target Blended Index is designed as a benchmark for multi-asset class portfolios with risk profiles that become more conservative over time, each corresponding to the target retirement date. The index weightings among the major asset classes are adjusted annually. The inception date of the index is July 14, 2017. See Appendix I for additional information. You cannot invest directly in an index. |
Target Date Retirement Funds | 7
Wells Fargo Target Today Fund (continued)
| Ten largest holdings (%) as of August 31, 20211 |
| Wells Fargo Bloomberg Barclays US Aggregate ex-Corporate Portfolio | 34.56 |
| Wells Fargo Investment Grade Corporate Bond Portfolio | 17.96 |
| Wells Fargo Strategic Retirement Bond Portfolio | 11.67 |
| Wells Fargo Factor Enhanced U.S. Large Cap Equity Portfolio | 11.67 |
| Wells Fargo Factor Enhanced International Equity Portfolio | 6.05 |
| Wells Fargo Factor Enhanced U.S. Low Volatility Equity Portfolio | 5.00 |
| Wells Fargo Emerging Markets Bond Portfolio | 2.95 |
| Wells Fargo High Yield Corporate Bond Portfolio | 2.95 |
| Wells Fargo Factor Enhanced U.S. Small Cap Equity Portfolio | 2.89 |
| Wells Fargo U.S. REIT Portfolio | 2.52 |
| 1 | Figures represent the percentage of the Fund's net assets. Holdings are subject to change and may have changed since the date specified. |
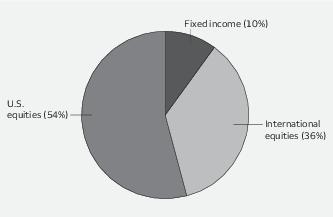
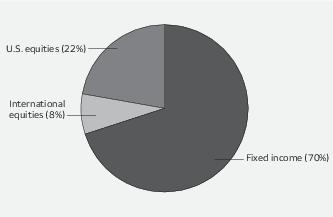
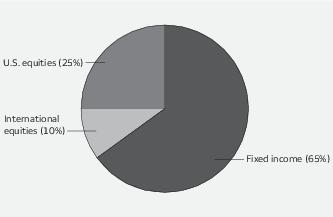
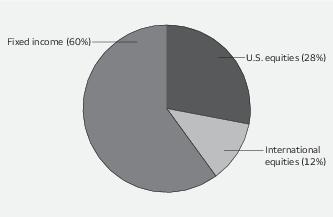
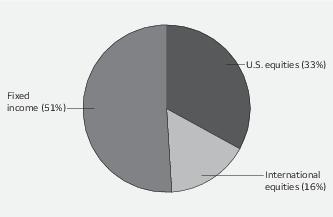
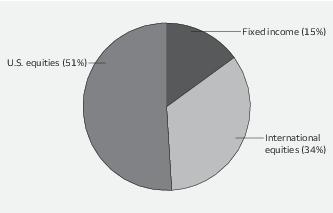
| Portfolio allocation as of August 31, 20211 |
| 1 | Figures represent the percentage of the Fund's long-term investments. These amounts are subject to change and may have changed since the date specified. |
| Volatility metrics as of August 31, 20211 |
| | Beta 2 | Standard
deviation3 | R-squared 4 |
| Class A | 1.00 | 6.48 | 0.96 |
| Class C | 1.00 | 6.49 | 0.96 |
| Class R | 1.00 | 6.47 | 0.96 |
| Class R4 | 1.00 | 6.47 | 0.96 |
| Class R6 | 1.01 | 6.52 | 0.96 |
| Administrator Class | 1.00 | 6.49 | 0.96 |
| 1 | These metrics show the degree and timing of the Fund’s fluctuations compared to S&P Target Date Retirement Income Index over 36 months. |
| 2 | Beta measures fund volatility relative to general market movements. It is a standardized measure of systematic risk in comparison with a specified index. The benchmark beta is 1.00 by definition. Beta is based on historical performance and does not represent future results. |
| 3 | Standard deviation is the square root of the sum of squared deviations from the mean. It is often used as a measure of volatility, variability, or risk. Standard deviation is based on historical performance and does not represent future results. |
| 4 | R-squared (R2) is a statistical measure that reflects the percentage of a fund’s movements that can be explained by movements in its benchmark index. The measure ranges from 0.0, which means that the fund’s performance bears no relationship to the performance of the index, to 1.0, which means that the fund’s performance was perfectly synchronized with the performance of the benchmark. R2 is based on historical performance and does not represent future results. |
8 | Target Date Retirement Funds
Performance highlights (unaudited)
Wells Fargo Target 2010 Fund
| Average annual total returns (%) as of August 31, 2021 |
| | | Including sales charge | | Excluding sales charge | | Expense ratios1 (%) |
| | Inception date | 1 year | 5 year | 10 year | | 1 year | 5 year | 10 year | | Gross | Net 2 |
| Class A (STNRX) | 3-1-1994 | 2.93 | 3.92 | 3.44 | | 9.24 | 5.15 | 4.05 | | 1.00 | 0.60 |
| Class C (WFOCX) | 12-1-1998 | 7.39 | 4.35 | 3.27 | | 8.39 | 4.35 | 3.27 | | 1.75 | 1.35 |
| Class R (WFARX)3 | 6-28-2013 | – | – | – | | 8.98 | 5.10 | 3.92 | | 1.25 | 0.85 |
| Class R4 (WFORX)4 | 11-30-2012 | – | – | – | | 9.61 | 5.48 | 4.42 | | 0.72 | 0.29 |
| Class R6 (WFOAX) | 6-30-2004 | – | – | – | | 9.72 | 5.63 | 4.55 | | 0.57 | 0.14 |
| Administrator Class (WFLGX) | 11-8-1999 | – | – | – | | 9.30 | 5.25 | 4.18 | | 0.92 | 0.49 |
| S&P Target Date 2010 Index5 | – | – | – | – | | 10.87 | 7.21 | 6.60 | | – | – |
| Target 2010 Blended Index6 | – | – | – | – | | 9.73 | – | – | | – | – |
Figures quoted represent past performance, which is no guarantee of future results, and do not reflect taxes that a shareholder may pay on an investment in a fund. Investment return and principal value of an investment will fluctuate so that an investor’s shares, when redeemed, may be worth more or less than their original cost. Performance shown without sales charges would be lower if sales charges were reflected. Current performance may be lower or higher than the performance data quoted, which assumes the reinvestment of dividends and capital gains. Current month-end performance is available on the Fund’s website, wfam.com.
Index returns do not include transaction costs associated with buying and selling securities, any mutual fund fees or expenses, or any taxes. It is not possible to invest directly in an index.
For Class A shares, the maximum front-end sales charge is 5.75%. For Class C shares, the maximum contingent deferred sales charge is 1.00%. Performance including a contingent deferred sales charge assumes the sales charge for the corresponding time period. Class R, Class R4, Class R6, and Administrator Class shares are sold without a front-end sales charge or contingent deferred sales charge.
| 1 | Reflects the expense ratios as stated in the most recent prospectuses, which include the impact of 0.10% of acquired fund fees and expenses representing the net expenses from the affiliated master portfolios. The expense ratios shown are subject to change and may differ from the annualized expense ratios shown in the financial highlights of this report. |
| 2 | The manager has contractually committed through June 30, 2022, to waive fees and/or reimburse expenses to the extent necessary to cap total annual fund operating expenses after fee waivers at 0.60% for Class A, 1.35% for Class C, 0.85% for Class R, 0.29% for Class R4, 0.14% for Class R6, and 0.49% for Administrator Class. Brokerage commissions, stamp duty fees, interest, taxes, acquired fund fees and expenses (if any) from funds in which the underlying affiliated master portfolios invest and from money market funds, and extraordinary expenses are excluded from the expense caps. All other acquired fund fees and expenses from the affiliated master portfolios are included in the expense caps. Prior to or after the commitment expiration date, the caps may be increased or the commitment to maintain the caps may be terminated only with the approval of the Board of Trustees. Without these caps, the Fund’s returns would have been lower. The expense ratio paid by an investor is the net expense ratio (the total annual fund operating expenses after fee waivers) as stated in the prospectuses. |
| 3 | Historical performance shown for the Class R shares prior to their inception reflects the performance of the Class A shares and has been adjusted to reflect the higher expenses applicable to the Class R shares. |
| 4 | Historical performance shown for the Class R4 shares prior to their inception reflects the performance of the Class R6 shares and has been adjusted to reflect the higher expenses applicable to the Class R4 shares. |
| 5 | The S&P Target Date Index is designed as a benchmark for multi-asset class portfolios with risk profiles that become more conservative over time, corresponding to the target retirement date. This index is representative of the investment opportunity available to investors for the target date horizon, with asset class exposures driven by a survey of available target date funds for that horizon. You cannot invest directly in an index. |
| 6 | Source: Wells Fargo Funds Management, LLC. The Target Blended Index is designed as a benchmark for multi-asset class portfolios with risk profiles that become more conservative over time, each corresponding to the target retirement date. The index weightings among the major asset classes are adjusted annually. The inception date of the index is July 14, 2017. See Appendix I for additional information. You cannot invest directly in an index. |
Target Date Retirement Funds | 9
Performance highlights (unaudited)
Wells Fargo Target 2010 Fund (continued)
| Ten largest holdings (%) as of August 31, 20211 |
| Wells Fargo Bloomberg Barclays US Aggregate ex-Corporate Portfolio | 34.47 |
| Wells Fargo Investment Grade Corporate Bond Portfolio | 17.94 |
| Wells Fargo Factor Enhanced U.S. Large Cap Equity Portfolio | 11.68 |
| Wells Fargo Strategic Retirement Bond Portfolio | 11.65 |
| Wells Fargo Factor Enhanced International Equity Portfolio | 6.06 |
| Wells Fargo Factor Enhanced U.S. Low Volatility Equity Portfolio | 5.00 |
| Wells Fargo Emerging Markets Bond Portfolio | 2.95 |
| Wells Fargo High Yield Corporate Bond Portfolio | 2.94 |
| Wells Fargo Factor Enhanced U.S. Small Cap Equity Portfolio | 2.89 |
| Wells Fargo U.S. REIT Portfolio | 2.52 |
| 1 | Figures represent the percentage of the Fund's net assets. Holdings are subject to change and may have changed since the date specified. |
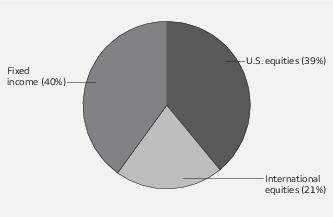
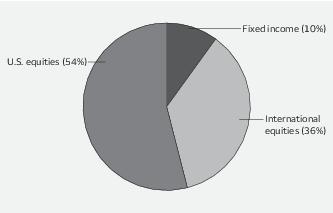
| Portfolio allocation as of August 31, 20211 |
| 1 | Figures represent the percentage of the Fund's long-term investments. These amounts are subject to change and may have changed since the date specified. |
| Volatility metrics as of August 31, 20211 |
| | Beta 2 | Standard
deviation3 | R-squared 4 |
| Class A | 0.90 | 6.62 | 0.96 |
| Class C | 0.90 | 6.62 | 0.96 |
| Class R | 0.90 | 6.66 | 0.96 |
| Class R4 | 0.90 | 6.62 | 0.95 |
| Class R6 | 0.90 | 6.61 | 0.95 |
| Administrator Class | 0.90 | 6.61 | 0.95 |
| 1 | These metrics show the degree and timing of the Fund’s fluctuations compared to S&P Target Date 2010 Index over 36 months. |
| 2 | Beta measures fund volatility relative to general market movements. It is a standardized measure of systematic risk in comparison with a specified index. The benchmark beta is 1.00 by definition. Beta is based on historical performance and does not represent future results. |
| 3 | Standard deviation is the square root of the sum of squared deviations from the mean. It is often used as a measure of volatility, variability, or risk. Standard deviation is based on historical performance and does not represent future results. |
| 4 | R-squared (R2) is a statistical measure that reflects the percentage of a fund’s movements that can be explained by movements in its benchmark index. The measure ranges from 0.0, which means that the fund’s performance bears no relationship to the performance of the index, to 1.0, which means that the fund’s performance was perfectly synchronized with the performance of the benchmark. R2 is based on historical performance and does not represent future results. |
10 | Target Date Retirement Funds
Performance highlights (unaudited)
Wells Fargo Target 2015 Fund
| Average annual total returns (%) as of August 31, 2021 |
| | | Including sales charge | | Excluding sales charge | | Expense ratios1 (%) |
| | Inception date | 1 year | 5 year | 10 year | | 1 year | 5 year | 10 year | | Gross | Net 2 |
| Class A (WFACX)3 | 11-30-2012 | 4.63 | 4.37 | 4.21 | | 10.96 | 5.61 | 4.83 | | 0.97 | 0.60 |
| Class R (WFBRX)4 | 6-28-2013 | – | – | – | | 10.60 | 5.59 | 4.68 | | 1.22 | 0.85 |
| Class R4 (WFSRX)5 | 11-30-2012 | – | – | – | | 11.21 | 5.95 | 5.17 | | 0.69 | 0.29 |
| Class R6 (WFSCX) | 6-29-2007 | – | – | – | | 11.34 | 6.08 | 5.29 | | 0.54 | 0.14 |
| Administrator Class (WFFFX) | 6-29-2007 | – | – | – | | 10.85 | 5.74 | 4.93 | | 0.89 | 0.49 |
| S&P Target Date 2015 Index6 | – | – | – | – | | 12.70 | 7.95 | 7.42 | | – | – |
| Target 2015 Blended Index7 | – | – | – | – | | 11.37 | – | – | | – | – |
Figures quoted represent past performance, which is no guarantee of future results, and do not reflect taxes that a shareholder may pay on an investment in a fund. Investment return and principal value of an investment will fluctuate so that an investor’s shares, when redeemed, may be worth more or less than their original cost. Performance shown without sales charges would be lower if sales charges were reflected. Current performance may be lower or higher than the performance data quoted, which assumes the reinvestment of dividends and capital gains. Current month-end performance is available on the Fund’s website, wfam.com.
Index returns do not include transaction costs associated with buying and selling securities, any mutual fund fees or expenses, or any taxes. It is not possible to invest directly in an index.
For Class A shares, the maximum front-end sales charge is 5.75%. Class R, Class R4, Class R6, and Administrator Class shares are sold without a front-end sales charge or contingent deferred sales charge.
| 1 | Reflects the expense ratios as stated in the most recent prospectuses, which include the impact of 0.10% of acquired fund fees and expenses representing the net expenses from the affiliated master portfolios. The expense ratios shown are subject to change and may differ from the annualized expense ratios shown in the financial highlights of this report. |
| 2 | The manager has contractually committed through June 30, 2022, to waive fees and/or reimburse expenses to the extent necessary to cap total annual fund operating expenses after fee waivers at 0.60% for Class A, 0.85% for Class R, 0.29% for Class R4, 0.14% for Class R6, and 0.49% for Administrator Class. Brokerage commissions, stamp duty fees, interest, taxes, acquired fund fees and expenses (if any) from funds in which the underlying affiliated master portfolios invest and from money market funds, and extraordinary expenses are excluded from the expense caps. All other acquired fund fees and expenses from the affiliated master portfolios are included in the expense caps. Prior to or after the commitment expiration date, the caps may be increased or the commitment to maintain the caps may be terminated only with the approval of the Board of Trustees. Without these caps, the Fund’s returns would have been lower. The expense ratio paid by an investor is the net expense ratio (the total annual fund operating expenses after fee waivers) as stated in the prospectuses. |
| 3 | Historical performance shown for the Class A shares prior to their inception reflects the performance of the Class R6 shares and has been adjusted to reflect the higher expenses applicable to the Class A shares. |
| 4 | Historical performance shown for the Class R shares prior to their inception reflects the performance of the Class A shares and has been adjusted to reflect the higher expenses applicable to the Class R shares. |
| 5 | Historical performance shown for the Class R4 shares prior to their inception reflects the performance of the Class R6 shares and has been adjusted to reflect the higher expenses applicable to the Class R4 shares. |
| 6 | The S&P Target Date Index is designed as a benchmark for multi-asset class portfolios with risk profiles that become more conservative over time, corresponding to the target retirement date. This index is representative of the investment opportunity available to investors for the target date horizon, with asset class exposures driven by a survey of available target date funds for that horizon. You cannot invest directly in an index. |
| 7 | Source: Wells Fargo Funds Management, LLC. The Target Blended Index is designed as a benchmark for multi-asset class portfolios with risk profiles that become more conservative over time, each corresponding to the target retirement date. The index weightings among the major asset classes are adjusted annually. The inception date of the index is July 14, 2017. See Appendix I for additional information. You cannot invest directly in an index. |
Target Date Retirement Funds | 11
Performance highlights (unaudited)
Wells Fargo Target 2015 Fund (continued)
| Ten largest holdings (%) as of August 31, 20211 |
| Wells Fargo Bloomberg Barclays US Aggregate ex-Corporate Portfolio | 32.07 |
| Wells Fargo Investment Grade Corporate Bond Portfolio | 16.68 |
| Wells Fargo Factor Enhanced U.S. Large Cap Equity Portfolio | 14.58 |
| Wells Fargo Strategic Retirement Bond Portfolio | 10.84 |
| Wells Fargo Factor Enhanced International Equity Portfolio | 7.55 |
| Wells Fargo Factor Enhanced U.S. Low Volatility Equity Portfolio | 4.00 |
| Wells Fargo Factor Enhanced U.S. Small Cap Equity Portfolio | 3.61 |
| Wells Fargo U.S. REIT Portfolio | 2.95 |
| Wells Fargo Emerging Markets Bond Portfolio | 2.74 |
| Wells Fargo High Yield Corporate Bond Portfolio | 2.74 |
| 1 | Figures represent the percentage of the Fund's net assets. Holdings are subject to change and may have changed since the date specified. |
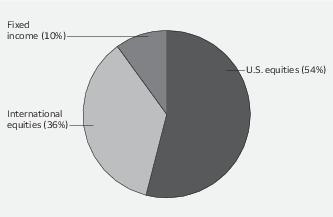
| Portfolio allocation as of August 31, 20211 |
| 1 | Figures represent the percentage of the Fund's long-term investments. These amounts are subject to change and may have changed since the date specified. |
| Volatility metrics as of August 31, 20211 |
| | Beta 2 | Standard
deviation3 | R-squared 4 |
| Class A | 0.88 | 7.44 | 0.96 |
| Class R | 0.89 | 7.44 | 0.97 |
| Class R4 | 0.89 | 7.46 | 0.96 |
| Class R6 | 0.88 | 7.39 | 0.96 |
| Administrator Class | 0.88 | 7.39 | 0.96 |
| 1 | These metrics show the degree and timing of the Fund’s fluctuations compared to S&P Target Date 2015 Index over 36 months. |
| 2 | Beta measures fund volatility relative to general market movements. It is a standardized measure of systematic risk in comparison with a specified index. The benchmark beta is 1.00 by definition. Beta is based on historical performance and does not represent future results. |
| 3 | Standard deviation is the square root of the sum of squared deviations from the mean. It is often used as a measure of volatility, variability, or risk. Standard deviation is based on historical performance and does not represent future results. |
| 4 | R-squared (R2) is a statistical measure that reflects the percentage of a fund’s movements that can be explained by movements in its benchmark index. The measure ranges from 0.0, which means that the fund’s performance bears no relationship to the performance of the index, to 1.0, which means that the fund’s performance was perfectly synchronized with the performance of the benchmark. R2 is based on historical performance and does not represent future results. |
12 | Target Date Retirement Funds
Performance highlights (unaudited)
Wells Fargo Target 2020 Fund
| Average annual total returns (%) as of August 31, 2021 |
| | | Including sales charge | | Excluding sales charge | | Expense ratios1 (%) |
| | Inception date | 1 year | 5 year | 10 year | | 1 year | 5 year | 10 year | | Gross | Net 2 |
| Class A (STTRX) | 3-1-1994 | 6.18 | 5.20 | 5.11 | | 12.68 | 6.45 | 5.73 | | 0.73 | 0.60 |
| Class C (WFLAX) | 12-1-1998 | 10.86 | 5.64 | 4.94 | | 11.86 | 5.64 | 4.94 | | 1.48 | 1.35 |
| Class R (WFURX)3 | 6-28-2013 | – | – | – | | 12.42 | 6.26 | 5.54 | | 0.98 | 0.85 |
| Class R4 (WFLRX)4 | 11-30-2012 | – | – | – | | 13.07 | 6.78 | 6.11 | | 0.45 | 0.29 |
| Class R6 (WFOBX) | 6-30-2004 | – | – | – | | 13.15 | 6.93 | 6.23 | | 0.30 | 0.14 |
| Administrator Class (WFLPX) | 11-8-1999 | – | – | – | | 12.76 | 6.55 | 5.86 | | 0.65 | 0.49 |
| S&P Target Date 2020 Index5 | – | – | – | – | | 13.79 | 8.51 | 8.09 | | – | – |
| Target 2020 Blended Index6 | – | – | – | – | | 13.16 | – | – | | – | – |
Figures quoted represent past performance, which is no guarantee of future results, and do not reflect taxes that a shareholder may pay on an investment in a fund. Investment return and principal value of an investment will fluctuate so that an investor’s shares, when redeemed, may be worth more or less than their original cost. Performance shown without sales charges would be lower if sales charges were reflected. Current performance may be lower or higher than the performance data quoted, which assumes the reinvestment of dividends and capital gains. Current month-end performance is available on the Fund’s website, wfam.com.
Index returns do not include transaction costs associated with buying and selling securities, any mutual fund fees or expenses, or any taxes. It is not possible to invest directly in an index.
For Class A shares, the maximum front-end sales charge is 5.75%. For Class C shares, the maximum contingent deferred sales charge is 1.00%. Performance including a contingent deferred sales charge assumes the sales charge for the corresponding time period. Class R, Class R4, Class R6, and Administrator Class shares are sold without a front-end sales charge or contingent deferred sales charge.
| 1 | Reflects the expense ratios as stated in the most recent prospectuses, which include the impact of 0.10% of acquired fund fees and expenses representing the net expenses from the affiliated master portfolios. The expense ratios shown are subject to change and may differ from the annualized expense ratios shown in the financial highlights of this report. |
| 2 | The manager has contractually committed through June 30, 2022, to waive fees and/or reimburse expenses to the extent necessary to cap total annual fund operating expenses after fee waivers at 0.60% for Class A, 1.35% for Class C, 0.85% for Class R, 0.29% for Class R4, 0.14% for Class R6, and 0.49% for Administrator Class. Brokerage commissions, stamp duty fees, interest, taxes, acquired fund fees and expenses (if any) from funds in which the underlying affiliated master portfolios invest and from money market funds, and extraordinary expenses are excluded from the expense caps. All other acquired fund fees and expenses from the affiliated master portfolios are included in the expense caps. Prior to or after the commitment expiration date, the caps may be increased or the commitment to maintain the caps may be terminated only with the approval of the Board of Trustees. Without these caps, the Fund’s returns would have been lower. The expense ratio paid by an investor is the net expense ratio (the total annual fund operating expenses after fee waivers) as stated in the prospectuses. |
| 3 | Historical performance shown for the Class R shares prior to their inception reflects the performance of the Class A shares and has been adjusted to reflect the higher expenses applicable to the Class R shares. |
| 4 | Historical performance shown for the Class R4 shares prior to their inception reflects the performance of the Class R6 shares and has been adjusted to reflect the higher expenses applicable to the Class R4 shares. |
| 5 | The S&P Target Date Index is designed as a benchmark for multi-asset class portfolios with risk profiles that become more conservative over time, corresponding to the target retirement date. This index is representative of the investment opportunity available to investors for the target date horizon, with asset class exposures driven by a survey of available target date funds for that horizon. You cannot invest directly in an index. |
| 6 | Source: Wells Fargo Funds Management, LLC. The Target Blended Index is designed as a benchmark for multi-asset class portfolios with risk profiles that become more conservative over time, each corresponding to the target retirement date. The index weightings among the major asset classes are adjusted annually. The inception date of the index is July 14, 2017. See Appendix I for additional information. You cannot invest directly in an index. |
Target Date Retirement Funds | 13
Performance highlights (unaudited)
Wells Fargo Target 2020 Fund (continued)
| Ten largest holdings (%) as of August 31, 20211 |
| Wells Fargo Bloomberg Barclays US Aggregate ex-Corporate Portfolio | 29.53 |
| Wells Fargo Factor Enhanced U.S. Large Cap Equity Portfolio | 17.52 |
| Wells Fargo Investment Grade Corporate Bond Portfolio | 15.36 |
| Wells Fargo Strategic Retirement Bond Portfolio | 9.98 |
| Wells Fargo Factor Enhanced International Equity Portfolio | 9.07 |
| Wells Fargo Factor Enhanced U.S. Small Cap Equity Portfolio | 4.34 |
| Wells Fargo U.S. REIT Portfolio | 3.37 |
| Wells Fargo Factor Enhanced U.S. Low Volatility Equity Portfolio | 3.00 |
| Wells Fargo Factor Enhanced Emerging Markets Equity Portfolio | 2.79 |
| Wells Fargo Emerging Markets Bond Portfolio | 2.53 |
| 1 | Figures represent the percentage of the Fund's net assets. Holdings are subject to change and may have changed since the date specified. |
| Portfolio allocation as of August 31, 20211 |
| 1 | Figures represent the percentage of the Fund's long-term investments. These amounts are subject to change and may have changed since the date specified. |
| Volatility metrics as of August 31, 20211 |
| | Beta 2 | Standard
deviation3 | R-squared 4 |
| Class A | 0.91 | 8.38 | 0.98 |
| Class C | 0.91 | 8.39 | 0.98 |
| Class R | 0.91 | 8.37 | 0.98 |
| Class R4 | 0.91 | 8.42 | 0.97 |
| Class R6 | 0.91 | 8.40 | 0.98 |
| Administrator Class | 0.91 | 8.41 | 0.98 |
| 1 | These metrics show the degree and timing of the Fund’s fluctuations compared to S&P Target Date 2020 Index over 36 months. |
| 2 | Beta measures fund volatility relative to general market movements. It is a standardized measure of systematic risk in comparison with a specified index. The benchmark beta is 1.00 by definition. Beta is based on historical performance and does not represent future results. |
| 3 | Standard deviation is the square root of the sum of squared deviations from the mean. It is often used as a measure of volatility, variability, or risk. Standard deviation is based on historical performance and does not represent future results. |
| 4 | R-squared (R2) is a statistical measure that reflects the percentage of a fund’s movements that can be explained by movements in its benchmark index. The measure ranges from 0.0, which means that the fund’s performance bears no relationship to the performance of the index, to 1.0, which means that the fund’s performance was perfectly synchronized with the performance of the benchmark. R2 is based on historical performance and does not represent future results. |
14 | Target Date Retirement Funds
Performance highlights (unaudited)
Wells Fargo Target 2025 Fund
| Average annual total returns (%) as of August 31, 2021 |
| | | Including sales charge | | Excluding sales charge | | Expense ratios1 (%) |
| | Inception date | 1 year | 5 year | 10 year | | 1 year | 5 year | 10 year | | Gross | Net 2 |
| Class A (WFAYX)3 | 11-30-2012 | 8.91 | 6.31 | 6.24 | | 15.56 | 7.58 | 6.88 | | 0.77 | 0.60 |
| Class R (WFHRX)4 | 6-28-2013 | – | – | – | | 15.24 | 7.26 | 6.58 | | 1.02 | 0.85 |
| Class R4 (WFGRX)5 | 11-30-2012 | – | – | – | | 15.95 | 7.91 | 7.23 | | 0.49 | 0.29 |
| Class R6 (WFTYX) | 6-29-2007 | – | – | – | | 16.11 | 8.08 | 7.36 | | 0.34 | 0.14 |
| Administrator Class (WFTRX) | 6-29-2007 | – | – | – | | 15.75 | 7.72 | 6.99 | | 0.69 | 0.49 |
| S&P Target Date 2025 Index6 | – | – | – | – | | 16.96 | 9.61 | 8.93 | | – | – |
| Target 2025 Blended Index7 | – | – | – | – | | 16.10 | – | – | | – | – |
Figures quoted represent past performance, which is no guarantee of future results, and do not reflect taxes that a shareholder may pay on an investment in a fund. Investment return and principal value of an investment will fluctuate so that an investor’s shares, when redeemed, may be worth more or less than their original cost. Performance shown without sales charges would be lower if sales charges were reflected. Current performance may be lower or higher than the performance data quoted, which assumes the reinvestment of dividends and capital gains. Current month-end performance is available on the Fund’s website, wfam.com.
Index returns do not include transaction costs associated with buying and selling securities, any mutual fund fees or expenses, or any taxes. It is not possible to invest directly in an index.
For Class A shares, the maximum front-end sales charge is 5.75%. Class R, Class R4, Class R6, and Administrator Class shares are sold without a front-end sales charge or contingent deferred sales charge.
| 1 | Reflects the expense ratios as stated in the most recent prospectuses, which include the impact of 0.11% of acquired fund fees and expenses representing the net expenses from the affiliated master portfolios. The expense ratios shown are subject to change and may differ from the annualized expense ratios shown in the financial highlights of this report. |
| 2 | The manager has contractually committed through June 30, 2022, to waive fees and/or reimburse expenses to the extent necessary to cap total annual fund operating expenses after fee waivers at 0.60% for Class A, 0.85% for Class R, 0.29% for Class R4, 0.14% for Class R6, and 0.49% for Administrator Class. Brokerage commissions, stamp duty fees, interest, taxes, acquired fund fees and expenses (if any) from funds in which the underlying affiliated master portfolios invest and from money market funds, and extraordinary expenses are excluded from the expense caps. All other acquired fund fees and expenses from the affiliated master portfolios are included in the expense caps. Prior to or after the commitment expiration date, the caps may be increased or the commitment to maintain the caps may be terminated only with the approval of the Board of Trustees. Without these caps, the Fund’s returns would have been lower. The expense ratio paid by an investor is the net expense ratio (the total annual fund operating expenses after fee waivers) as stated in the prospectuses. |
| 3 | Historical performance shown for the Class A shares prior to their inception reflects the performance of the Class R6 shares and has been adjusted to reflect the higher expenses applicable to the Class A shares. |
| 4 | Historical performance shown for the Class R shares prior to their inception reflects the performance of the Class A shares and has been adjusted to reflect the higher expenses applicable to the Class R shares. |
| 5 | Historical performance shown for the Class R4 shares prior to their inception reflects the performance of the Class R6 shares and has been adjusted to reflect the higher expenses applicable to the Class R4 shares. |
| 6 | The S&P Target Date Index is designed as a benchmark for multi-asset class portfolios with risk profiles that become more conservative over time, corresponding to the target retirement date. This index is representative of the investment opportunity available to investors for the target date horizon, with asset class exposures driven by a survey of available target date funds for that horizon. You cannot invest directly in an index. |
| 7 | Source: Wells Fargo Funds Management, LLC. The Target Blended Index is designed as a benchmark for multi-asset class portfolios with risk profiles that become more conservative over time, each corresponding to the target retirement date. The index weightings among the major asset classes are adjusted annually. The inception date of the index is July 14, 2017. See Appendix I for additional information. You cannot invest directly in an index. |
Target Date Retirement Funds | 15
Performance highlights (unaudited)
Wells Fargo Target 2025 Fund (continued)
| Ten largest holdings (%) as of August 31, 20211 |
| Wells Fargo Bloomberg Barclays US Aggregate ex-Corporate Portfolio | 26.62 |
| Wells Fargo Factor Enhanced U.S. Large Cap Equity Portfolio | 23.26 |
| Wells Fargo Investment Grade Corporate Bond Portfolio | 13.85 |
| Wells Fargo Factor Enhanced International Equity Portfolio | 12.60 |
| Wells Fargo Factor Enhanced U.S. Small Cap Equity Portfolio | 5.76 |
| Wells Fargo Strategic Retirement Bond Portfolio | 5.00 |
| Wells Fargo Factor Enhanced Emerging Markets Equity Portfolio | 3.88 |
| Wells Fargo U.S. REIT Portfolio | 2.53 |
| Wells Fargo Emerging Markets Bond Portfolio | 2.26 |
| Wells Fargo High Yield Corporate Bond Portfolio | 2.25 |
| 1 | Figures represent the percentage of the Fund's net assets. Holdings are subject to change and may have changed since the date specified. |
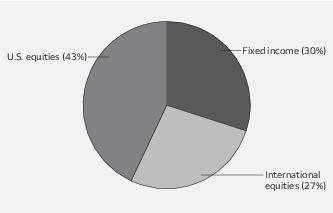
| Portfolio allocation as of August 31, 20211 |
| 1 | Figures represent the percentage of the Fund's long-term investments. These amounts are subject to change and may have changed since the date specified. |
| Volatility metrics as of August 31, 20211 |
| | Beta 2 | Standard
deviation3 | R-squared 4 |
| Class A | 0.91 | 9.95 | 0.98 |
| Class R | 0.93 | 10.12 | 0.98 |
| Class R4 | 0.91 | 9.94 | 0.98 |
| Class R6 | 0.93 | 10.11 | 0.98 |
| Administrator Class | 0.92 | 10.05 | 0.98 |
| 1 | These metrics show the degree and timing of the Fund’s fluctuations compared to S&P Target Date 2025 Index over 36 months. |
| 2 | Beta measures fund volatility relative to general market movements. It is a standardized measure of systematic risk in comparison with a specified index. The benchmark beta is 1.00 by definition. Beta is based on historical performance and does not represent future results. |
| 3 | Standard deviation is the square root of the sum of squared deviations from the mean. It is often used as a measure of volatility, variability, or risk. Standard deviation is based on historical performance and does not represent future results. |
| 4 | R-squared (R2) is a statistical measure that reflects the percentage of a fund’s movements that can be explained by movements in its benchmark index. The measure ranges from 0.0, which means that the fund’s performance bears no relationship to the performance of the index, to 1.0, which means that the fund’s performance was perfectly synchronized with the performance of the benchmark. R2 is based on historical performance and does not represent future results. |
16 | Target Date Retirement Funds
Performance highlights (unaudited)
Wells Fargo Target 2030 Fund
| Average annual total returns (%) as of August 31, 2021 |
| | | Including sales charge | | Excluding sales charge | | Expense ratios1 (%) |
| | Inception date | 1 year | 5 year | 10 year | | 1 year | 5 year | 10 year | | Gross | Net 2 |
| Class A (STHRX) | 3-1-1994 | 11.71 | 7.48 | 7.29 | | 18.53 | 8.76 | 7.93 | | 0.72 | 0.60 |
| Class C (WFDMX) | 12-1-1998 | 16.59 | 7.93 | 7.12 | | 17.59 | 7.93 | 7.12 | | 1.47 | 1.35 |
| Class R (WFJRX)3 | 6-28-2013 | – | – | – | | 18.19 | 8.60 | 7.75 | | 0.97 | 0.85 |
| Class R4 (WTHRX)4 | 11-30-2012 | – | – | – | | 18.83 | 9.08 | 8.31 | | 0.44 | 0.29 |
| Class R6 (WFOOX) | 6-30-2004 | – | – | – | | 19.02 | 9.24 | 8.44 | | 0.29 | 0.14 |
| Administrator Class (WFLIX) | 11-8-1999 | – | – | – | | 18.61 | 8.86 | 8.06 | | 0.64 | 0.49 |
| S&P Target Date 2030 Index5 | – | – | – | – | | 19.98 | 10.60 | 9.71 | | – | – |
| Target 2030 Blended Index6 | – | – | – | – | | 19.01 | – | – | | – | – |
Figures quoted represent past performance, which is no guarantee of future results, and do not reflect taxes that a shareholder may pay on an investment in a fund. Investment return and principal value of an investment will fluctuate so that an investor’s shares, when redeemed, may be worth more or less than their original cost. Performance shown without sales charges would be lower if sales charges were reflected. Current performance may be lower or higher than the performance data quoted, which assumes the reinvestment of dividends and capital gains. Current month-end performance is available on the Fund’s website, wfam.com.
Index returns do not include transaction costs associated with buying and selling securities, any mutual fund fees or expenses, or any taxes. It is not possible to invest directly in an index.
For Class A shares, the maximum front-end sales charge is 5.75%. For Class C shares, the maximum contingent deferred sales charge is 1.00%. Performance including a contingent deferred sales charge assumes the sales charge for the corresponding time period. Class R, Class R4, Class R6, and Administrator Class shares are sold without a front-end sales charge or contingent deferred sales charge.
| 1 | Reflects the expense ratios as stated in the most recent prospectuses, which include the impact of 0.11% of acquired fund fees and expenses representing the net expenses from the affiliated master portfolios. The expense ratios shown are subject to change and may differ from the annualized expense ratios shown in the financial highlights of this report. |
| 2 | The manager has contractually committed through June 30, 2022, to waive fees and/or reimburse expenses to the extent necessary to cap total annual fund operating expenses after fee waivers at 0.60% for Class A, 1.35% for Class C, 0.85% for Class R, 0.29% for Class R4, 0.14% for Class R6, and 0.49% for Administrator Class. Brokerage commissions, stamp duty fees, interest, taxes, acquired fund fees and expenses (if any) from funds in which the underlying affiliated master portfolios invest and from money market funds, and extraordinary expenses are excluded from the expense caps. All other acquired fund fees and expenses from the affiliated master portfolios are included in the expense caps. Prior to or after the commitment expiration date, the caps may be increased or the commitment to maintain the caps may be terminated only with the approval of the Board of Trustees. Without these caps, the Fund’s returns would have been lower. The expense ratio paid by an investor is the net expense ratio (the total annual fund operating expenses after fee waivers) as stated in the prospectuses. |
| 3 | Historical performance shown for the Class R shares prior to their inception reflects the performance of the Class A shares and has been adjusted to reflect the higher expenses applicable to the Class R shares. |
| 4 | Historical performance shown for the Class R4 shares prior to their inception reflects the performance of the Class R6 shares and has been adjusted to reflect the higher expenses applicable to the Class R4 shares. |
| 5 | The S&P Target Date Index is designed as a benchmark for multi-asset class portfolios with risk profiles that become more conservative over time, corresponding to the target retirement date. This index is representative of the investment opportunity available to investors for the target date horizon, with asset class exposures driven by a survey of available target date funds for that horizon. You cannot invest directly in an index. |
| 6 | Source: Wells Fargo Funds Management, LLC. The Target Blended Index is designed as a benchmark for multi-asset class portfolios with risk profiles that become more conservative over time, each corresponding to the target retirement date. The index weightings among the major asset classes are adjusted annually. The inception date of the index is July 14, 2017. See Appendix I for additional information. You cannot invest directly in an index. |
Target Date Retirement Funds | 17
Performance highlights (unaudited)
Wells Fargo Target 2030 Fund (continued)
| Ten largest holdings (%) as of August 31, 20211 |
| Wells Fargo Factor Enhanced U.S. Large Cap Equity Portfolio | 29.23 |
| Wells Fargo Bloomberg Barclays US Aggregate ex-Corporate Portfolio | 22.84 |
| Wells Fargo Factor Enhanced International Equity Portfolio | 16.49 |
| Wells Fargo Investment Grade Corporate Bond Portfolio | 11.90 |
| Wells Fargo Factor Enhanced U.S. Small Cap Equity Portfolio | 7.25 |
| Wells Fargo Factor Enhanced Emerging Markets Equity Portfolio | 5.08 |
| Wells Fargo Emerging Markets Bond Portfolio | 1.92 |
| Wells Fargo High Yield Corporate Bond Portfolio | 1.92 |
| Wells Fargo Strategic Retirement Bond Portfolio | 1.33 |
| Wells Fargo U.S. REIT Portfolio | 1.01 |
| 1 | Figures represent the percentage of the Fund's net assets. Holdings are subject to change and may have changed since the date specified. |
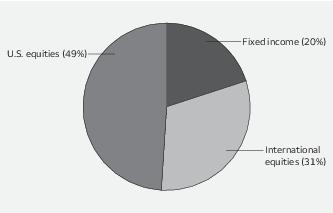
| Portfolio allocation as of August 31, 20211 |
| 1 | Figures represent the percentage of the Fund's long-term investments. These amounts are subject to change and may have changed since the date specified. |
| Volatility metrics as of August 31, 20211 |
| | Beta 2 | Standard
deviation3 | R-squared 4 |
| Class A | 0.92 | 11.64 | 0.99 |
| Class C | 0.92 | 11.64 | 0.99 |
| Class R | 0.92 | 11.71 | 0.99 |
| Class R4 | 0.92 | 11.66 | 0.99 |
| Class R6 | 0.92 | 11.67 | 0.99 |
| Administrator Class | 0.92 | 11.68 | 0.99 |
| 1 | These metrics show the degree and timing of the Fund’s fluctuations compared to S&P Target Date 2030 Index over 36 months. |
| 2 | Beta measures fund volatility relative to general market movements. It is a standardized measure of systematic risk in comparison with a specified index. The benchmark beta is 1.00 by definition. Beta is based on historical performance and does not represent future results. |
| 3 | Standard deviation is the square root of the sum of squared deviations from the mean. It is often used as a measure of volatility, variability, or risk. Standard deviation is based on historical performance and does not represent future results. |
| 4 | R-squared (R2) is a statistical measure that reflects the percentage of a fund’s movements that can be explained by movements in its benchmark index. The measure ranges from 0.0, which means that the fund’s performance bears no relationship to the performance of the index, to 1.0, which means that the fund’s performance was perfectly synchronized with the performance of the benchmark. R2 is based on historical performance and does not represent future results. |
18 | Target Date Retirement Funds
Performance highlights (unaudited)
Wells Fargo Target 2035 Fund
| Average annual total returns (%) as of August 31, 2021 |
| | | Including sales charge | | Excluding sales charge | | Expense ratios1 (%) |
| | Inception date | 1 year | 5 year | 10 year | | 1 year | 5 year | 10 year | | Gross | Net 2 |
| Class A (WFQBX)3 | 11-30-2012 | 14.68 | 8.55 | 8.24 | | 21.64 | 9.84 | 8.89 | | 0.78 | 0.60 |
| Class R (WFKRX)4 | 6-28-2013 | – | – | – | | 21.09 | 9.56 | 8.60 | | 1.03 | 0.85 |
| Class R4 (WTTRX)5 | 11-30-2012 | – | – | – | | 21.93 | 10.17 | 9.24 | | 0.50 | 0.29 |
| Class R6 (WFQRX) | 6-29-2007 | – | – | – | | 22.05 | 10.34 | 9.37 | | 0.35 | 0.14 |
| Administrator Class (WFQWX) | 6-29-2007 | – | – | – | | 21.56 | 9.94 | 8.98 | | 0.70 | 0.49 |
| S&P Target Date 2035 Index6 | – | – | – | – | | 23.45 | 11.65 | 10.45 | | – | – |
| Target 2035 Blended Index7 | – | – | – | – | | 22.02 | – | – | | – | – |
Figures quoted represent past performance, which is no guarantee of future results, and do not reflect taxes that a shareholder may pay on an investment in a fund. Investment return and principal value of an investment will fluctuate so that an investor’s shares, when redeemed, may be worth more or less than their original cost. Performance shown without sales charges would be lower if sales charges were reflected. Current performance may be lower or higher than the performance data quoted, which assumes the reinvestment of dividends and capital gains. Current month-end performance is available on the Fund’s website, wfam.com.
Index returns do not include transaction costs associated with buying and selling securities, any mutual fund fees or expenses, or any taxes. It is not possible to invest directly in an index.
For Class A shares, the maximum front-end sales charge is 5.75%. Class R, Class R4, Class R6, and Administrator Class shares are sold without a front-end sales charge or contingent deferred sales charge.
| 1 | Reflects the expense ratios as stated in the most recent prospectuses, which include the impact of 0.12% of acquired fund fees and expenses representing the net expenses from the affiliated master portfolios. The expense ratios shown are subject to change and may differ from the annualized expense ratios shown in the financial highlights of this report. |
| 2 | The manager has contractually committed through June 30, 2022, to waive fees and/or reimburse expenses to the extent necessary to cap total annual fund operating expenses after fee waivers at 0.60% for Class A, 0.85% for Class R, 0.29% for Class R4, 0.14% for Class R6, and 0.49% for Administrator Class. Brokerage commissions, stamp duty fees, interest, taxes, acquired fund fees and expenses (if any) from funds in which the underlying affiliated master portfolios invest and from money market funds, and extraordinary expenses are excluded from the expense caps. All other acquired fund fees and expenses from the affiliated master portfolios are included in the expense caps. Prior to or after the commitment expiration date, the caps may be increased or the commitment to maintain the caps may be terminated only with the approval of the Board of Trustees. Without these caps, the Fund’s returns would have been lower. The expense ratio paid by an investor is the net expense ratio (the total annual fund operating expenses after fee waivers) as stated in the prospectuses. |
| 3 | Historical performance shown for the Class A shares prior to their inception reflects the performance of the Class R6 shares and has been adjusted to reflect the higher expenses applicable to the Class A shares. |
| 4 | Historical performance shown for the Class R shares prior to their inception reflects the performance of the Class A shares and has been adjusted to reflect the higher expenses applicable to the Class R shares. |
| 5 | Historical performance shown for the Class R4 shares prior to their inception reflects the performance of the Class R6 shares and has been adjusted to reflect the higher expenses applicable to the Class R4 shares. |
| 6 | The S&P Target Date Index is designed as a benchmark for multi-asset class portfolios with risk profiles that become more conservative over time, corresponding to the target retirement date. This index is representative of the investment opportunity available to investors for the target date horizon, with asset class exposures driven by a survey of available target date funds for that horizon. You cannot invest directly in an index. |
| 7 | Source: Wells Fargo Funds Management, LLC. The Target Blended Index is designed as a benchmark for multi-asset class portfolios with risk profiles that become more conservative over time, each corresponding to the target retirement date. The index weightings among the major asset classes are adjusted annually. The inception date of the index is July 14, 2017. See Appendix I for additional information. You cannot invest directly in an index. |
Target Date Retirement Funds | 19
Performance highlights (unaudited)
Wells Fargo Target 2035 Fund (continued)
| Holdings (%) as of August 31, 20211 |
| Wells Fargo Factor Enhanced U.S. Large Cap Equity Portfolio | 34.69 |
| Wells Fargo Factor Enhanced International Equity Portfolio | 20.47 |
| Wells Fargo Bloomberg Barclays US Aggregate ex-Corporate Portfolio | 17.75 |
| Wells Fargo Investment Grade Corporate Bond Portfolio | 9.22 |
| Wells Fargo Factor Enhanced U.S. Small Cap Equity Portfolio | 8.65 |
| Wells Fargo Factor Enhanced Emerging Markets Equity Portfolio | 6.23 |
| Wells Fargo Emerging Markets Bond Portfolio | 1.50 |
| Wells Fargo High Yield Corporate Bond Portfolio | 1.50 |
| 1 | Figures represent the percentage of the Fund's net assets. Holdings are subject to change and may have changed since the date specified. |
| Portfolio allocation as of August 31, 20211 |
| 1 | Figures represent the percentage of the Fund's long-term investments. These amounts are subject to change and may have changed since the date specified. |
| Volatility metrics as of August 31, 20211 |
| | Beta 2 | Standard
deviation3 | R-squared 4 |
| Class A | 0.92 | 13.24 | 0.99 |
| Class R | 0.92 | 13.29 | 0.99 |
| Class R4 | 0.92 | 13.30 | 0.99 |
| Class R6 | 0.92 | 13.26 | 0.99 |
| Administrator Class | 0.92 | 13.29 | 0.99 |
| 1 | These metrics show the degree and timing of the Fund’s fluctuations compared to S&P Target Date 2035 Index over 36 months. |
| 2 | Beta measures fund volatility relative to general market movements. It is a standardized measure of systematic risk in comparison with a specified index. The benchmark beta is 1.00 by definition. Beta is based on historical performance and does not represent future results. |
| 3 | Standard deviation is the square root of the sum of squared deviations from the mean. It is often used as a measure of volatility, variability, or risk. Standard deviation is based on historical performance and does not represent future results. |
| 4 | R-squared (R2) is a statistical measure that reflects the percentage of a fund’s movements that can be explained by movements in its benchmark index. The measure ranges from 0.0, which means that the fund’s performance bears no relationship to the performance of the index, to 1.0, which means that the fund’s performance was perfectly synchronized with the performance of the benchmark. R2 is based on historical performance and does not represent future results. |
20 | Target Date Retirement Funds
Performance highlights (unaudited)
Wells Fargo Target 2040 Fund
| Average annual total returns (%) as of August 31, 2021 |
| | | Including sales charge | | Excluding sales charge | | Expense ratios1 (%) |
| | Inception date | 1 year | 5 year | 10 year | | 1 year | 5 year | 10 year | | Gross | Net 2 |
| Class A (STFRX) | 3-1-1994 | 17.18 | 9.35 | 8.90 | | 24.32 | 10.66 | 9.55 | | 0.74 | 0.60 |
| Class C (WFOFX) | 7-1-1998 | 22.45 | 9.83 | 8.73 | | 23.45 | 9.83 | 8.73 | | 1.49 | 1.35 |
| Class R (WFMRX)3 | 6-28-2013 | – | – | – | | 24.05 | 10.50 | 9.37 | | 0.99 | 0.85 |
| Class R4 (WTFRX)4 | 11-30-2012 | – | – | – | | 24.72 | 11.00 | 9.94 | | 0.46 | 0.29 |
| Class R6 (WFOSX) | 6-30-2004 | – | – | – | | 24.97 | 11.17 | 10.08 | | 0.31 | 0.14 |
| Administrator Class (WFLWX) | 11-8-1999 | – | – | – | | 24.56 | 10.79 | 9.69 | | 0.66 | 0.49 |
| S&P Target Date 2040 Index5 | – | – | – | – | | 25.91 | 12.38 | 10.97 | | – | – |
| Target 2040 Blended Index6 | – | – | – | – | | 25.00 | – | – | | – | – |
Figures quoted represent past performance, which is no guarantee of future results, and do not reflect taxes that a shareholder may pay on an investment in a fund. Investment return and principal value of an investment will fluctuate so that an investor’s shares, when redeemed, may be worth more or less than their original cost. Performance shown without sales charges would be lower if sales charges were reflected. Current performance may be lower or higher than the performance data quoted, which assumes the reinvestment of dividends and capital gains. Current month-end performance is available on the Fund’s website, wfam.com.
Index returns do not include transaction costs associated with buying and selling securities, any mutual fund fees or expenses, or any taxes. It is not possible to invest directly in an index.
For Class A shares, the maximum front-end sales charge is 5.75%. For Class C shares, the maximum contingent deferred sales charge is 1.00%. Performance including a contingent deferred sales charge assumes the sales charge for the corresponding time period. Class R, Class R4, Class R6, and Administrator Class shares are sold without a front-end sales charge or contingent deferred sales charge.
| 1 | Reflects the expense ratios as stated in the most recent prospectuses, which include the impact of 0.13% of acquired fund fees and expenses representing the net expenses from the affiliated master portfolios. The expense ratios shown are subject to change and may differ from the annualized expense ratios shown in the financial highlights of this report. |
| 2 | The manager has contractually committed through June 30, 2022, to waive fees and/or reimburse expenses to the extent necessary to cap total annual fund operating expenses after fee waivers at 0.60% for Class A, 1.35% for Class C, 0.85% for Class R, 0.29% for Class R4, 0.14% for Class R6, and 0.49% for Administrator Class. Brokerage commissions, stamp duty fees, interest, taxes, acquired fund fees and expenses (if any) from funds in which the underlying affiliated master portfolios invest and from money market funds, and extraordinary expenses are excluded from the expense caps. All other acquired fund fees and expenses from the affiliated master portfolios are included in the expense caps. Prior to or after the commitment expiration date, the caps may be increased or the commitment to maintain the caps may be terminated only with the approval of the Board of Trustees. Without these caps, the Fund’s returns would have been lower. The expense ratio paid by an investor is the net expense ratio (the total annual fund operating expenses after fee waivers) as stated in the prospectuses. |
| 3 | Historical performance shown for the Class R shares prior to their inception reflects the performance of the Class A shares and has been adjusted to reflect the higher expenses applicable to the Class R shares. |
| 4 | Historical performance shown for the Class R4 shares prior to their inception reflects the performance of the Class R6 shares and has been adjusted to reflect the higher expenses applicable to the Class R4 shares. |
| 5 | The S&P Target Date Index is designed as a benchmark for multi-asset class portfolios with risk profiles that become more conservative over time, corresponding to the target retirement date. This index is representative of the investment opportunity available to investors for the target date horizon, with asset class exposures driven by a survey of available target date funds for that horizon. You cannot invest directly in an index. |
| 6 | Source: Wells Fargo Funds Management, LLC. The Target Blended Index is designed as a benchmark for multi-asset class portfolios with risk profiles that become more conservative over time, each corresponding to the target retirement date. The index weightings among the major asset classes are adjusted annually. The inception date of the index is July 14, 2017. See Appendix I for additional information. You cannot invest directly in an index. |
Target Date Retirement Funds | 21
Performance highlights (unaudited)
Wells Fargo Target 2040 Fund (continued)
| Holdings (%) as of August 31, 20211 |
| Wells Fargo Factor Enhanced U.S. Large Cap Equity Portfolio | 39.00 |
| Wells Fargo Factor Enhanced International Equity Portfolio | 23.96 |
| Wells Fargo Bloomberg Barclays US Aggregate ex-Corporate Portfolio | 11.83 |
| Wells Fargo Factor Enhanced U.S. Small Cap Equity Portfolio | 9.69 |
| Wells Fargo Factor Enhanced Emerging Markets Equity Portfolio | 7.37 |
| Wells Fargo Investment Grade Corporate Bond Portfolio | 6.15 |
| Wells Fargo Emerging Markets Bond Portfolio | 1.00 |
| Wells Fargo High Yield Corporate Bond Portfolio | 1.00 |
| 1 | Figures represent the percentage of the Fund's net assets. Holdings are subject to change and may have changed since the date specified. |
| Portfolio allocation as of August 31, 20211 |
| 1 | Figures represent the percentage of the Fund's long-term investments. These amounts are subject to change and may have changed since the date specified. |
| Volatility metrics as of August 31, 20211 |
| | Beta 2 | Standard
deviation3 | R-squared 4 |
| Class A | 0.94 | 14.62 | 0.99 |
| Class C | 0.94 | 14.63 | 0.99 |
| Class R | 0.94 | 14.66 | 0.99 |
| Class R4 | 0.94 | 14.61 | 0.99 |
| Class R6 | 0.94 | 14.59 | 0.99 |
| Administrator Class | 0.94 | 14.60 | 0.99 |
| 1 | These metrics show the degree and timing of the Fund’s fluctuations compared to S&P Target Date 2040 Index over 36 months. |
| 2 | Beta measures fund volatility relative to general market movements. It is a standardized measure of systematic risk in comparison with a specified index. The benchmark beta is 1.00 by definition. Beta is based on historical performance and does not represent future results. |
| 3 | Standard deviation is the square root of the sum of squared deviations from the mean. It is often used as a measure of volatility, variability, or risk. Standard deviation is based on historical performance and does not represent future results. |
| 4 | R-squared (R2) is a statistical measure that reflects the percentage of a fund’s movements that can be explained by movements in its benchmark index. The measure ranges from 0.0, which means that the fund’s performance bears no relationship to the performance of the index, to 1.0, which means that the fund’s performance was perfectly synchronized with the performance of the benchmark. R2 is based on historical performance and does not represent future results. |
22 | Target Date Retirement Funds
Performance highlights (unaudited)
Wells Fargo Target 2045 Fund
| Average annual total returns (%) as of August 31, 2021 |
| | | Including sales charge | | Excluding sales charge | | Expense ratios1 (%) |
| | Inception date | 1 year | 5 year | 10 year | | 1 year | 5 year | 10 year | | Gross | Net 2 |
| Class A (WFQVX)3 | 11-30-2012 | 18.71 | 9.88 | 9.33 | | 25.93 | 11.20 | 9.98 | | 0.89 | 0.60 |
| Class R (WFNRX)4 | 6-28-2013 | – | – | – | | 25.63 | 11.05 | 9.77 | | 1.14 | 0.85 |
| Class R4 (WFFRX)5 | 11-30-2012 | – | – | – | | 26.40 | 11.55 | 10.36 | | 0.61 | 0.29 |
| Class R6 (WFQPX) | 6-29-2007 | – | – | – | | 26.62 | 11.70 | 10.47 | | 0.46 | 0.14 |
| Administrator Class (WFQYX) | 6-29-2007 | – | – | – | | 26.19 | 11.30 | 10.08 | | 0.81 | 0.49 |
| S&P Target Date 2045 Index6 | – | – | – | – | | 27.34 | 12.81 | 11.31 | | – | – |
| Target 2045 Blended Index7 | – | – | – | – | | 26.58 | – | – | | – | – |
Figures quoted represent past performance, which is no guarantee of future results, and do not reflect taxes that a shareholder may pay on an investment in a fund. Investment return and principal value of an investment will fluctuate so that an investor’s shares, when redeemed, may be worth more or less than their original cost. Performance shown without sales charges would be lower if sales charges were reflected. Current performance may be lower or higher than the performance data quoted, which assumes the reinvestment of dividends and capital gains. Current month-end performance is available on the Fund’s website, wfam.com.
Please keep in mind that high double-digit returns were primarily achieved during favorable market conditions. You should not expect that such favorable returns can be consistently achieved. A fund’s performance, especially for short time periods, should not be the sole factor in making your investment decision.
Index returns do not include transaction costs associated with buying and selling securities, any mutual fund fees or expenses, or any taxes. It is not possible to invest directly in an index.
For Class A shares, the maximum front-end sales charge is 5.75%. Class R, Class R4, Class R6, and Administrator Class shares are sold without a front-end sales charge or contingent deferred sales charge.
| 1 | Reflects the expense ratios as stated in the most recent prospectuses, which include the impact of 0.13% of acquired fund fees and expenses representing the net expenses from the affiliated master portfolios. The expense ratios shown are subject to change and may differ from the annualized expense ratios shown in the financial highlights of this report. |
| 2 | The manager has contractually committed through June 30, 2022, to waive fees and/or reimburse expenses to the extent necessary to cap total annual fund operating expenses after fee waivers at 0.60% for Class A, 0.85% for Class R, 0.29% for Class R4, 0.14% for Class R6, and 0.49% for Administrator Class. Brokerage commissions, stamp duty fees, interest, taxes, acquired fund fees and expenses (if any) from funds in which the underlying affiliated master portfolios invest and from money market funds, and extraordinary expenses are excluded from the expense caps. All other acquired fund fees and expenses from the affiliated master portfolios are included in the expense caps. Prior to or after the commitment expiration date, the caps may be increased or the commitment to maintain the caps may be terminated only with the approval of the Board of Trustees. Without these caps, the Fund’s returns would have been lower. The expense ratio paid by an investor is the net expense ratio (the total annual fund operating expenses after fee waivers) as stated in the prospectuses. |
| 3 | Historical performance shown for the Class A shares prior to their inception reflects the performance of the Class R6 shares and has been adjusted to reflect the higher expenses applicable to the Class A shares. |
| 4 | Historical performance shown for the Class R shares prior to their inception reflects the performance of the Class A shares and has been adjusted to reflect the higher expenses applicable to the Class R shares. |
| 5 | Historical performance shown for the Class R4 shares prior to their inception reflects the performance of the Class R6 shares and has been adjusted to reflect the higher expenses applicable to the Class R4 shares. |
| 6 | The S&P Target Date Index is designed as a benchmark for multi-asset class portfolios with risk profiles that become more conservative over time, corresponding to the target retirement date. This index is representative of the investment opportunity available to investors for the target date horizon, with asset class exposures driven by a survey of available target date funds for that horizon. You cannot invest directly in an index. |
| 7 | Source: Wells Fargo Funds Management, LLC. The Target Blended Index is designed as a benchmark for multi-asset class portfolios with risk profiles that become more conservative over time, each corresponding to the target retirement date. The index weightings among the major asset classes are adjusted annually. The inception date of the index is July 14, 2017. See Appendix I for additional information. You cannot invest directly in an index. |
Target Date Retirement Funds | 23
Performance highlights (unaudited)
Wells Fargo Target 2045 Fund (continued)
| Holdings (%) as of August 31, 20211 |
| Wells Fargo Factor Enhanced U.S. Large Cap Equity Portfolio | 41.08 |
| Wells Fargo Factor Enhanced International Equity Portfolio | 25.77 |
| Wells Fargo Factor Enhanced U.S. Small Cap Equity Portfolio | 10.24 |
| Wells Fargo Bloomberg Barclays US Aggregate ex-Corporate Portfolio | 8.90 |
| Wells Fargo Factor Enhanced Emerging Markets Equity Portfolio | 7.91 |
| Wells Fargo Investment Grade Corporate Bond Portfolio | 4.62 |
| Wells Fargo Emerging Markets Bond Portfolio | 0.76 |
| Wells Fargo High Yield Corporate Bond Portfolio | 0.75 |
| 1 | Figures represent the percentage of the Fund's net assets. Holdings are subject to change and may have changed since the date specified. |
| Portfolio allocation as of August 31, 20211 |
| 1 | Figures represent the percentage of the Fund's long-term investments. These amounts are subject to change and may have changed since the date specified. |
| Volatility metrics as of August 31, 20211 |
| | Beta 2 | Standard
deviation3 | R-squared 4 |
| Class A | 0.95 | 15.45 | 0.99 |
| Class R | 0.96 | 15.51 | 0.99 |
| Class R4 | 0.95 | 15.46 | 0.99 |
| Class R6 | 0.95 | 15.46 | 0.99 |
| Administrator Class | 0.95 | 15.39 | 0.99 |
| 1 | These metrics show the degree and timing of the Fund’s fluctuations compared to S&P Target Date 2045 Index over 36 months. |
| 2 | Beta measures fund volatility relative to general market movements. It is a standardized measure of systematic risk in comparison with a specified index. The benchmark beta is 1.00 by definition. Beta is based on historical performance and does not represent future results. |
| 3 | Standard deviation is the square root of the sum of squared deviations from the mean. It is often used as a measure of volatility, variability, or risk. Standard deviation is based on historical performance and does not represent future results. |
| 4 | R-squared (R2) is a statistical measure that reflects the percentage of a fund’s movements that can be explained by movements in its benchmark index. The measure ranges from 0.0, which means that the fund’s performance bears no relationship to the performance of the index, to 1.0, which means that the fund’s performance was perfectly synchronized with the performance of the benchmark. R2 is based on historical performance and does not represent future results. |
24 | Target Date Retirement Funds
Performance highlights (unaudited)
Wells Fargo Target 2050 Fund
| Average annual total returns (%) as of August 31, 2021 |
| | | Including sales charge | | Excluding sales charge | | Expense ratios1 (%) |
| | Inception date | 1 year | 5 year | 10 year | | 1 year | 5 year | 10 year | | Gross | Net 2 |
| Class A (WFQAX)3 | 11-30-2012 | 20.09 | 10.18 | 9.49 | | 27.46 | 11.48 | 10.15 | | 0.79 | 0.60 |
| Class C (WFQCX)4 | 11-30-2012 | 25.47 | 10.66 | 9.33 | | 26.47 | 10.66 | 9.33 | | 1.54 | 1.35 |
| Class R (WFWRX)5 | 6-28-2013 | – | – | – | | 27.00 | 11.40 | 9.96 | | 1.04 | 0.85 |
| Class R4 (WQFRX)6 | 11-30-2012 | – | – | – | | 27.85 | 11.84 | 10.51 | | 0.51 | 0.29 |
| Class R6 (WFQFX) | 6-29-2007 | – | – | – | | 27.86 | 11.98 | 10.64 | | 0.36 | 0.14 |
| Administrator Class (WFQDX) | 6-29-2007 | – | – | – | | 27.43 | 11.59 | 10.26 | | 0.71 | 0.49 |
| S&P Target Date 2045 Index7 | – | – | – | – | | 27.34 | 12.81 | 11.31 | | – | – |
| S&P Target Date 2050 Index**,7 | – | – | – | – | | 28.13 | 13.10 | – | | – | – |
| Target 2050 Blended Index8 | – | – | – | – | | 28.02 | – | – | | – | – |
Figures quoted represent past performance, which is no guarantee of future results, and do not reflect taxes that a shareholder may pay on an investment in a fund. Investment return and principal value of an investment will fluctuate so that an investor’s shares, when redeemed, may be worth more or less than their original cost. Performance shown without sales charges would be lower if sales charges were reflected. Current performance may be lower or higher than the performance data quoted, which assumes the reinvestment of dividends and capital gains. Current month-end performance is available on the Fund’s website, wfam.com.
Please keep in mind that high double-digit returns were primarily achieved during favorable market conditions. You should not expect that such favorable returns can be consistently achieved. A fund’s performance, especially for short time periods, should not be the sole factor in making your investment decision.
Index returns do not include transaction costs associated with buying and selling securities, any mutual fund fees or expenses, or any taxes. It is not possible to invest directly in an index.
Target Date Retirement Funds | 25
Performance highlights (unaudited)
Wells Fargo Target 2050 Fund (continued)
For Class A shares, the maximum front-end sales charge is 5.75%. For Class C shares, the maximum contingent deferred sales charge is 1.00%. Performance including a contingent deferred sales charge assumes the sales charge for the corresponding time period. Class R, Class R4, Class R6, and Administrator Class shares are sold without a front-end sales charge or contingent deferred sales charge.
| ** | The inception date of the index is June 1, 2012. |
| 1 | Reflects the expense ratios as stated in the most recent prospectuses, which include the impact of 0.13% of acquired fund fees and expenses representing the net expenses from the affiliated master portfolios. The expense ratios shown are subject to change and may differ from the annualized expense ratios shown in the financial highlights of this report. |
| 2 | The manager has contractually committed through June 30, 2022, to waive fees and/or reimburse expenses to the extent necessary to cap total annual fund operating expenses after fee waivers at 0.60% for Class A, 1.35% for Class C, 0.85% for Class R, 0.29% for Class R4, 0.14% for Class R6, and 0.49% for Administrator Class. Brokerage commissions, stamp duty fees, interest, taxes, acquired fund fees and expenses (if any) from funds in which the underlying affiliated master portfolios invest and from money market funds, and extraordinary expenses are excluded from the expense caps. All other acquired fund fees and expenses from the affiliated master portfolios are included in the expense caps. Prior to or after the commitment expiration date, the caps may be increased or the commitment to maintain the caps may be terminated only with the approval of the Board of Trustees. Without these caps, the Fund’s returns would have been lower. The expense ratio paid by an investor is the net expense ratio (the total annual fund operating expenses after fee waivers) as stated in the prospectuses. |
| 3 | Historical performance shown for the Class A shares prior to their inception reflects the performance of the Class R6 shares and has been adjusted to reflect the higher expenses applicable to the Class A shares. |
| 4 | Historical performance shown for the Class C shares prior to their inception reflects the performance of the Class R6 shares and has been adjusted to reflect the higher expenses applicable to the Class C shares. |
| 5 | Historical performance shown for the Class R shares prior to their inception reflects the performance of the Class A shares and has been adjusted to reflect the higher expenses applicable to the Class R shares. |
| 6 | Historical performance shown for the Class R4 shares prior to their inception reflects the performance of the Class R6 shares and has been adjusted to reflect the higher expenses applicable to the Class R4 shares. |
| 7 | The S&P Target Date Index is designed as a benchmark for multi-asset class portfolios with risk profiles that become more conservative over time, corresponding to the target retirement date. This index is representative of the investment opportunity available to investors for the target date horizon, with asset class exposures driven by a survey of available target date funds for that horizon. You cannot invest directly in an index. |
| 8 | Source: Wells Fargo Funds Management, LLC. The Target Blended Index is designed as a benchmark for multi-asset class portfolios with risk profiles that become more conservative over time, each corresponding to the target retirement date. The index weightings among the major asset classes are adjusted annually. The inception date of the index is July 14, 2017. See Appendix I for additional information. You cannot invest directly in an index. |
26 | Target Date Retirement Funds
Performance highlights (unaudited)
Wells Fargo Target 2050 Fund (continued)
| Holdings (%) as of August 31, 20211 |
| Wells Fargo Factor Enhanced U.S. Large Cap Equity Portfolio | 43.01 |
| Wells Fargo Factor Enhanced International Equity Portfolio | 27.64 |
| Wells Fargo Factor Enhanced U.S. Small Cap Equity Portfolio | 10.72 |
| Wells Fargo Factor Enhanced Emerging Markets Equity Portfolio | 8.50 |
| Wells Fargo Bloomberg Barclays US Aggregate ex-Corporate Portfolio | 6.01 |
| Wells Fargo Investment Grade Corporate Bond Portfolio | 3.12 |
| Wells Fargo Emerging Markets Bond Portfolio | 0.51 |
| Wells Fargo High Yield Corporate Bond Portfolio | 0.51 |
| 1 | Figures represent the percentage of the Fund's net assets. Holdings are subject to change and may have changed since the date specified. |
| Portfolio allocation as of August 31, 20211 |
| 1 | Figures represent the percentage of the Fund's long-term investments. These amounts are subject to change and may have changed since the date specified. |
| Volatility metrics as of August 31, 20211 |
| | Beta 2 | Standard
deviation3 | R-squared 4 |
| Class A | 0.97 | 16.03 | 0.99 |
| Class C | 0.97 | 16.01 | 0.99 |
| Class R | 0.97 | 16.11 | 0.99 |
| Class R4 | 0.97 | 16.02 | 0.99 |
| Class R6 | 0.97 | 16.04 | 0.99 |
| Administrator Class | 0.96 | 15.94 | 0.99 |
| 1 | These metrics show the degree and timing of the Fund’s fluctuations compared to S&P Target Date 2050 Index over 36 months. |
| 2 | Beta measures fund volatility relative to general market movements. It is a standardized measure of systematic risk in comparison with a specified index. The benchmark beta is 1.00 by definition. Beta is based on historical performance and does not represent future results. |
| 3 | Standard deviation is the square root of the sum of squared deviations from the mean. It is often used as a measure of volatility, variability, or risk. Standard deviation is based on historical performance and does not represent future results. |
| 4 | R-squared (R2) is a statistical measure that reflects the percentage of a fund’s movements that can be explained by movements in its benchmark index. The measure ranges from 0.0, which means that the fund’s performance bears no relationship to the performance of the index, to 1.0, which means that the fund’s performance was perfectly synchronized with the performance of the benchmark. R2 is based on historical performance and does not represent future results. |
Target Date Retirement Funds | 27
Performance highlights (unaudited)
Wells Fargo Target 2055 Fund
| Average annual total returns (%) as of August 31, 2021 |
| | | Including sales charge | | Excluding sales charge | | Expense ratios1 (%) |
| | Inception date | 1 year | 5 year | 10 year | | 1 year | 5 year | 10 year | | Gross | Net 2 |
| Class A (WFQZX)3 | 11-30-2012 | 20.19 | 10.18 | 9.50 | | 27.52 | 11.49 | 10.15 | | 1.30 | 0.60 |
| Class R (WFYRX)4 | 6-28-2013 | – | – | – | | 27.19 | 11.35 | 9.89 | | 1.55 | 0.85 |
| Class R4 (WFVRX)5 | 11-30-2012 | – | – | – | | 27.98 | 11.84 | 10.51 | | 1.02 | 0.29 |
| Class R6 (WFQUX) | 6-30-2011 | – | – | – | | 28.13 | 12.00 | 10.65 | | 0.87 | 0.14 |
| Administrator Class (WFLHX) | 6-30-2011 | – | – | – | | 27.66 | 11.61 | 10.25 | | 1.22 | 0.49 |
| S&P Target Date 2055 Index6 | – | – | – | – | | 28.45 | 13.24 | 11.73 | | – | – |
| Target 2055 Blended Index7 | – | – | – | – | | 28.02 | – | – | | – | – |
Figures quoted represent past performance, which is no guarantee of future results, and do not reflect taxes that a shareholder may pay on an investment in a fund. Investment return and principal value of an investment will fluctuate so that an investor’s shares, when redeemed, may be worth more or less than their original cost. Performance shown without sales charges would be lower if sales charges were reflected. Current performance may be lower or higher than the performance data quoted, which assumes the reinvestment of dividends and capital gains. Current month-end performance is available on the Fund’s website, wfam.com.
Please keep in mind that high double-digit returns were primarily achieved during favorable market conditions. You should not expect that such favorable returns can be consistently achieved. A fund’s performance, especially for short time periods, should not be the sole factor in making your investment decision.
Index returns do not include transaction costs associated with buying and selling securities, any mutual fund fees or expenses, or any taxes. It is not possible to invest directly in an index.
For Class A shares, the maximum front-end sales charge is 5.75%. Class R, Class R4, Class R6, and Administrator Class shares are sold without a front-end sales charge or contingent deferred sales charge.
| 1 | Reflects the expense ratios as stated in the most recent prospectuses, which include the impact of 0.13% of acquired fund fees and expenses representing the net expenses from the affiliated master portfolios. The expense ratios shown are subject to change and may differ from the annualized expense ratios shown in the financial highlights of this report. |
| 2 | The manager has contractually committed through June 30, 2022, to waive fees and/or reimburse expenses to the extent necessary to cap total annual fund operating expenses after fee waivers at 0.60% for Class A, 0.85% for Class R, 0.29% for Class R4, 0.14% for Class R6, and 0.49% for Administrator Class. Brokerage commissions, stamp duty fees, interest, taxes, acquired fund fees and expenses (if any) from funds in which the underlying affiliated master portfolios invest and from money market funds, and extraordinary expenses are excluded from the expense caps. All other acquired fund fees and expenses from the affiliated master portfolios are included in the expense caps. Prior to or after the commitment expiration date, the caps may be increased or the commitment to maintain the caps may be terminated only with the approval of the Board of Trustees. Without these caps, the Fund’s returns would have been lower. The expense ratio paid by an investor is the net expense ratio (the total annual fund operating expenses after fee waivers) as stated in the prospectuses. |
| 3 | Historical performance shown for the Class A shares prior to their inception reflects the performance of the Class R6 shares and has been adjusted to reflect the higher expenses applicable to the Class A shares. |
| 4 | Historical performance shown for the Class R shares prior to their inception reflects the performance of the Class A shares and has been adjusted to reflect the higher expenses applicable to the Class R shares. |
| 5 | Historical performance shown for the Class R4 shares prior to their inception reflects the performance of the Class R6 shares and has been adjusted to reflect the higher expenses applicable to the Class R4 shares. |
| 6 | The S&P Target Date Index is designed as a benchmark for multi-asset class portfolios with risk profiles that become more conservative over time, corresponding to the target retirement date. This index is representative of the investment opportunity available to investors for the target date horizon, with asset class exposures driven by a survey of available target date funds for that horizon. You cannot invest directly in an index. |
| 7 | Source: Wells Fargo Funds Management, LLC. The Target Blended Index is designed as a benchmark for multi-asset class portfolios with risk profiles that become more conservative over time, each corresponding to the target retirement date. The index weightings among the major asset classes are adjusted annually. The inception date of the index is July 14, 2017. See Appendix I for additional information. You cannot invest directly in an index. |
28 | Target Date Retirement Funds
Performance highlights (unaudited)
Wells Fargo Target 2055 Fund (continued)
| Holdings (%) as of August 31, 20211 |
| Wells Fargo Factor Enhanced U.S. Large Cap Equity Portfolio | 43.10 |
| Wells Fargo Factor Enhanced International Equity Portfolio | 27.71 |
| Wells Fargo Factor Enhanced U.S. Small Cap Equity Portfolio | 10.74 |
| Wells Fargo Factor Enhanced Emerging Markets Equity Portfolio | 8.48 |
| Wells Fargo Bloomberg Barclays US Aggregate ex-Corporate Portfolio | 5.95 |
| Wells Fargo Investment Grade Corporate Bond Portfolio | 3.09 |
| Wells Fargo Emerging Markets Bond Portfolio | 0.51 |
| Wells Fargo High Yield Corporate Bond Portfolio | 0.50 |
| 1 | Figures represent the percentage of the Fund's net assets. Holdings are subject to change and may have changed since the date specified. |
| Portfolio allocation as of August 31, 20211 |
| 1 | Figures represent the percentage of the Fund's long-term investments. These amounts are subject to change and may have changed since the date specified. |
| Volatility metrics as of August 31, 20211 |
| | Beta 2 | Standard
deviation3 | R-squared 4 |
| Class A | 0.96 | 16.15 | 0.99 |
| Class R | 0.97 | 16.25 | 0.99 |
| Class R4 | 0.97 | 16.20 | 0.99 |
| Class R6 | 0.96 | 16.15 | 0.99 |
| Administrator Class | 0.96 | 16.17 | 0.99 |
| 1 | These metrics show the degree and timing of the Fund’s fluctuations compared to S&P Target Date 2055 Index over 36 months. |
| 2 | Beta measures fund volatility relative to general market movements. It is a standardized measure of systematic risk in comparison with a specified index. The benchmark beta is 1.00 by definition. Beta is based on historical performance and does not represent future results. |
| 3 | Standard deviation is the square root of the sum of squared deviations from the mean. It is often used as a measure of volatility, variability, or risk. Standard deviation is based on historical performance and does not represent future results. |
| 4 | R-squared (R2) is a statistical measure that reflects the percentage of a fund’s movements that can be explained by movements in its benchmark index. The measure ranges from 0.0, which means that the fund’s performance bears no relationship to the performance of the index, to 1.0, which means that the fund’s performance was perfectly synchronized with the performance of the benchmark. R2 is based on historical performance and does not represent future results. |
Target Date Retirement Funds | 29
Performance highlights (unaudited)
Wells Fargo Target 2060 Fund
| Average annual total returns (%) as of August 31, 2021 | |
| | | Including sales charge | | Excluding sales charge | | Expense ratios1 (%) |
| | Inception date | 1 year | 5 year | Since
inception | | 1 year | 5 year | Since
inception | | Gross | Net 2 |
| Class A (WFAFX) | 6-30-2015 | 20.19 | 10.22 | 8.51 | | 27.48 | 11.53 | 9.55 | | 1.37 | 0.60 |
| Class C (WFCFX) | 6-30-2015 | 25.61 | 10.90 | 8.89 | | 26.61 | 10.90 | 8.89 | | 2.12 | 1.35 |
| Class R (WFRFX) | 6-30-2015 | – | – | – | | 27.20 | 11.47 | 9.45 | | 1.62 | 0.85 |
| Class R4 (WFSFX) | 6-30-2015 | – | – | – | | 27.94 | 11.87 | 9.90 | | 1.09 | 0.29 |
| Class R6 (WFUFX) | 6-30-2015 | – | – | – | | 28.07 | 12.03 | 10.04 | | 0.94 | 0.14 |
| Administrator Class (WFDFX) | 6-30-2015 | – | – | – | | 27.55 | 11.65 | 9.67 | | 1.29 | 0.49 |
| S&P Target Date 2055 Index3 | – | – | – | – | | 28.45 | 13.24 | 11.22 * | | – | – |
| S&P Target Date 2060+ Index**,3 | – | – | – | – | | 28.34 | 13.37 | – | | – | – |
| Target 2060 Blended Index4 | – | – | – | – | | 28.02 | – | – | | – | – |
Figures quoted represent past performance, which is no guarantee of future results, and do not reflect taxes that a shareholder may pay on an investment in a fund. Investment return and principal value of an investment will fluctuate so that an investor’s shares, when redeemed, may be worth more or less than their original cost. Performance shown without sales charges would be lower if sales charges were reflected. Current performance may be lower or higher than the performance data quoted, which assumes the reinvestment of dividends and capital gains. Current month-end performance is available on the Fund’s website, wfam.com.
Please keep in mind that high double-digit returns were primarily achieved during favorable market conditions. You should not expect that such favorable returns can be consistently achieved. A fund’s performance, especially for short time periods, should not be the sole factor in making your investment decision.
Index returns do not include transaction costs associated with buying and selling securities, any mutual fund fees or expenses, or any taxes. It is not possible to invest directly in an index.
For Class A shares, the maximum front-end sales charge is 5.75%. For Class C shares, the maximum contingent deferred sales charge is 1.00%. Performance including a contingent deferred sales charge assumes the sales charge for the corresponding time period. Class R, Class R4, Class R6, and Administrator Class shares are sold without a front-end sales charge or contingent deferred sales charge.
| * | Based on the inception date of the oldest Fund class. |
| ** | The inception date of the index is May 31, 2016. |
| 1 | Reflects the expense ratios as stated in the most recent prospectuses, which include the impact of 0.13% of acquired fund fees and expenses representing the net expenses from the affiliated master portfolios. The expense ratios shown are subject to change and may differ from the annualized expense ratios shown in the financial highlights of this report. |
| 2 | The manager has contractually committed through June 30, 2022, to waive fees and/or reimburse expenses to the extent necessary to cap total annual fund operating expenses after fee waivers at 0.60% for Class A, 1.35% for Class C, 0.85% for Class R, 0.29% for Class R4, 0.14% for Class R6, and 0.49% for Administrator Class. Brokerage commissions, stamp duty fees, interest, taxes, acquired fund fees and expenses (if any) from funds in which the underlying affiliated master portfolios invest and from money market funds, and extraordinary expenses are excluded from the expense caps. All other acquired fund fees and expenses from the affiliated master portfolios are included in the expense caps. Prior to or after the commitment expiration date, the caps may be increased or the commitment to maintain the caps may be terminated only with the approval of the Board of Trustees. Without these caps, the Fund’s returns would have been lower. The expense ratio paid by an investor is the net expense ratio (the total annual fund operating expenses after fee waivers) as stated in the prospectuses. |
| 3 | The S&P Target Date Index is designed as a benchmark for multi-asset class portfolios with risk profiles that become more conservative over time, corresponding to the target retirement date. This index is representative of the investment opportunity available to investors for the target date horizon, with asset class exposures driven by a survey of available target date funds for that horizon. You cannot invest directly in an index. |
| 4 | Source: Wells Fargo Funds Management, LLC. The Target Blended Index is designed as a benchmark for multi-asset class portfolios with risk profiles that become more conservative over time, each corresponding to the target retirement date. The index weightings among the major asset classes are adjusted annually. The inception date of the index is July 14, 2017. See Appendix I for additional information. You cannot invest directly in an index. |
30 | Target Date Retirement Funds
Performance highlights (unaudited)
Wells Fargo Target 2060 Fund (continued)
| Holdings (%) as of August 31, 20211 |
| Wells Fargo Factor Enhanced U.S. Large Cap Equity Portfolio | 42.98 |
| Wells Fargo Factor Enhanced International Equity Portfolio | 27.80 |
| Wells Fargo Factor Enhanced U.S. Small Cap Equity Portfolio | 10.71 |
| Wells Fargo Factor Enhanced Emerging Markets Equity Portfolio | 8.44 |
| Wells Fargo Bloomberg Barclays US Aggregate ex-Corporate Portfolio | 5.92 |
| Wells Fargo Investment Grade Corporate Bond Portfolio | 3.08 |
| Wells Fargo Emerging Markets Bond Portfolio | 0.50 |
| Wells Fargo High Yield Corporate Bond Portfolio | 0.50 |
| 1 | Figures represent the percentage of the Fund's net assets. Holdings are subject to change and may have changed since the date specified. |
| Portfolio allocation as of August 31, 20211 |
| 1 | Figures represent the percentage of the Fund's long-term investments. These amounts are subject to change and may have changed since the date specified. |
| Volatility metrics as of August 31, 20211 |
| | Beta 2 | Standard
deviation3 | R-squared 4 |
| Class A | 0.96 | 16.21 | 0.99 |
| Class C | 0.97 | 16.28 | 0.99 |
| Class R | 0.97 | 16.30 | 0.99 |
| Class R4 | 0.96 | 16.19 | 0.99 |
| Class R6 | 0.96 | 16.20 | 0.99 |
| Administrator Class | 0.96 | 16.20 | 0.99 |
| 1 | These metrics show the degree and timing of the Fund’s fluctuations compared to S&P Target Date 2060+ Index over 36 months. |
| 2 | Beta measures fund volatility relative to general market movements. It is a standardized measure of systematic risk in comparison with a specified index. The benchmark beta is 1.00 by definition. Beta is based on historical performance and does not represent future results. |
| 3 | Standard deviation is the square root of the sum of squared deviations from the mean. It is often used as a measure of volatility, variability, or risk. Standard deviation is based on historical performance and does not represent future results. |
| 4 | R-squared (R2) is a statistical measure that reflects the percentage of a fund’s movements that can be explained by movements in its benchmark index. The measure ranges from 0.0, which means that the fund’s performance bears no relationship to the performance of the index, to 1.0, which means that the fund’s performance was perfectly synchronized with the performance of the benchmark. R2 is based on historical performance and does not represent future results. |
Target Date Retirement Funds | 31
Fund expenses (unaudited)
As a shareholder of the Fund, you incur two types of costs: (1) transaction costs, including sales charges (loads) on purchase payments and contingent deferred sales charges (if any) on redemptions and (2) ongoing costs, including management fees, distribution (12b-1) and/or shareholder servicing fees, and other Fund expenses. This example is intended to help you understand your ongoing costs (in dollars) of investing in the Fund and to compare these costs with the ongoing costs of investing in other mutual funds.
The example is based on an investment of $1,000 invested at the beginning of the six-month period and held for the entire period from March 1, 2021 to August 31, 2021.
Actual expenses
The “Actual” line of the table below provides information about actual account values and actual expenses. You may use the information in this line, together with the amount you invested, to estimate the expenses that you paid over the period. Simply divide your account value by $1,000 (for example, an $8,600 account value divided by $1,000 = 8.6), then multiply the result by the number in the “Actual” line under the heading entitled “Expenses paid during period” for your applicable class of shares to estimate the expenses you paid on your account during this period.
Hypothetical example for comparison purposes
The “Hypothetical” line of the table below provides information about hypothetical account values and hypothetical expenses based on the Fund’s actual expense ratio and an assumed rate of return of 5% per year before expenses, which is not the Fund’s actual return. The hypothetical account values and expenses may not be used to estimate the actual ending account balance or expenses you paid for the period. You may use this information to compare the ongoing costs of investing in the Fund and other funds. To do so, compare this 5% hypothetical example with the 5% hypothetical examples that appear in the shareholder reports of the other funds.
Please note that the expenses shown in the table are meant to highlight your ongoing costs only and do not reflect any transactional costs, such as sales charges (loads) and contingent deferred sales charges. Therefore, the “Hypothetical” line of the table is useful in comparing ongoing costs only, and will not help you determine the relative total costs of owning different funds. In addition, if these transactional costs were included, your costs would have been higher.
| | Beginning
account value
3-1-2021 | Ending
account value
8-31-2021 | Expenses
paid during
the period1 | Annualized net
expense ratio |
| Target Today Fund | | | | |
| Class A | | | | |
| Actual | $1,000.00 | $1,054.91 | $3.00 | 0.58% |
| Hypothetical (5% return before expenses) | $1,000.00 | $1,022.28 | $2.96 | 0.58% |
| Class C | | | | |
| Actual | $1,000.00 | $1,051.32 | $6.98 | 1.35% |
| Hypothetical (5% return before expenses) | $1,000.00 | $1,018.40 | $6.87 | 1.35% |
| Class R | | | | |
| Actual | $1,000.00 | $1,054.43 | $4.40 | 0.85% |
| Hypothetical (5% return before expenses) | $1,000.00 | $1,020.92 | $4.33 | 0.85% |
| Class R4 | | | | |
| Actual | $1,000.00 | $1,056.86 | $1.50 | 0.29% |
| Hypothetical (5% return before expenses) | $1,000.00 | $1,023.74 | $1.48 | 0.29% |
| Class R6 | | | | |
| Actual | $1,000.00 | $1,057.95 | $0.73 | 0.14% |
| Hypothetical (5% return before expenses) | $1,000.00 | $1,024.50 | $0.71 | 0.14% |
| Administrator Class | | | | |
| Actual | $1,000.00 | $1,055.84 | $2.49 | 0.48% |
| Hypothetical (5% return before expenses) | $1,000.00 | $1,022.79 | $2.45 | 0.48% |
1 Expenses paid is equal to the annualized net expense ratio of each class multiplied by the average account value over the period, multiplied by the number of days in the most recent fiscal half-year divided by the number of days in the fiscal year (to reflect the one-half-year period).
32 | Target Date Retirement Funds
Fund expenses (unaudited)
| | Beginning
account value
3-1-2021 | Ending
account value
8-31-2021 | Expenses
paid during
the period1 | Annualized net
expense ratio |
| Target 2010 Fund | | | | |
| Class A | | | | |
| Actual | $1,000.00 | $1,055.36 | $3.00 | 0.58% |
| Hypothetical (5% return before expenses) | $1,000.00 | $1,022.28 | $2.96 | 0.58% |
| Class C | | | | |
| Actual | $1,000.00 | $1,051.26 | $6.98 | 1.35% |
| Hypothetical (5% return before expenses) | $1,000.00 | $1,018.40 | $6.87 | 1.35% |
| Class R | | | | |
| Actual | $1,000.00 | $1,054.68 | $4.30 | 0.83% |
| Hypothetical (5% return before expenses) | $1,000.00 | $1,021.02 | $4.23 | 0.83% |
| Class R4 | | | | |
| Actual | $1,000.00 | $1,057.73 | $1.50 | 0.29% |
| Hypothetical (5% return before expenses) | $1,000.00 | $1,023.74 | $1.48 | 0.29% |
| Class R6 | | | | |
| Actual | $1,000.00 | $1,057.80 | $0.73 | 0.14% |
| Hypothetical (5% return before expenses) | $1,000.00 | $1,024.50 | $0.71 | 0.14% |
| Administrator Class | | | | |
| Actual | $1,000.00 | $1,055.85 | $2.54 | 0.49% |
| Hypothetical (5% return before expenses) | $1,000.00 | $1,022.74 | $2.50 | 0.49% |
| Target 2015 Fund | | | | |
| Class A | | | | |
| Actual | $1,000.00 | $1,061.31 | $2.96 | 0.57% |
| Hypothetical (5% return before expenses) | $1,000.00 | $1,022.33 | $2.91 | 0.57% |
| Class R | | | | |
| Actual | $1,000.00 | $1,060.18 | $4.26 | 0.82% |
| Hypothetical (5% return before expenses) | $1,000.00 | $1,021.07 | $4.18 | 0.82% |
| Class R4 | | | | |
| Actual | $1,000.00 | $1,063.81 | $1.51 | 0.29% |
| Hypothetical (5% return before expenses) | $1,000.00 | $1,023.74 | $1.48 | 0.29% |
| Class R6 | | | | |
| Actual | $1,000.00 | $1,062.83 | $0.73 | 0.14% |
| Hypothetical (5% return before expenses) | $1,000.00 | $1,024.50 | $0.71 | 0.14% |
| Administrator Class | | | | |
| Actual | $1,000.00 | $1,061.13 | $2.55 | 0.49% |
| Hypothetical (5% return before expenses) | $1,000.00 | $1,022.74 | $2.50 | 0.49% |
1 Expenses paid is equal to the annualized net expense ratio of each class multiplied by the average account value over the period, multiplied by the number of days in the most recent fiscal half-year divided by the number of days in the fiscal year (to reflect the one-half-year period).
Target Date Retirement Funds | 33
Fund expenses (unaudited)
| | Beginning
account value
3-1-2021 | Ending
account value
8-31-2021 | Expenses
paid during
the period1 | Annualized net
expense ratio |
| Target 2020 Fund | | | | |
| Class A | | | | |
| Actual | $1,000.00 | $1,066.61 | $3.02 | 0.58% |
| Hypothetical (5% return before expenses) | $1,000.00 | $1,022.28 | $2.96 | 0.58% |
| Class C | | | | |
| Actual | $1,000.00 | $1,063.11 | $7.02 | 1.35% |
| Hypothetical (5% return before expenses) | $1,000.00 | $1,018.40 | $6.87 | 1.35% |
| Class R | | | | |
| Actual | $1,000.00 | $1,065.48 | $4.43 | 0.85% |
| Hypothetical (5% return before expenses) | $1,000.00 | $1,020.92 | $4.33 | 0.85% |
| Class R4 | | | | |
| Actual | $1,000.00 | $1,069.15 | $1.51 | 0.29% |
| Hypothetical (5% return before expenses) | $1,000.00 | $1,023.74 | $1.48 | 0.29% |
| Class R6 | | | | |
| Actual | $1,000.00 | $1,069.15 | $0.73 | 0.14% |
| Hypothetical (5% return before expenses) | $1,000.00 | $1,024.50 | $0.71 | 0.14% |
| Administrator Class | | | | |
| Actual | $1,000.00 | $1,067.29 | $2.55 | 0.49% |
| Hypothetical (5% return before expenses) | $1,000.00 | $1,022.74 | $2.50 | 0.49% |
| Target 2025 Fund | | | | |
| Class A | | | | |
| Actual | $1,000.00 | $1,076.92 | $3.04 | 0.58% |
| Hypothetical (5% return before expenses) | $1,000.00 | $1,022.28 | $2.96 | 0.58% |
| Class R | | | | |
| Actual | $1,000.00 | $1,074.07 | $4.44 | 0.85% |
| Hypothetical (5% return before expenses) | $1,000.00 | $1,020.92 | $4.33 | 0.85% |
| Class R4 | | | | |
| Actual | $1,000.00 | $1,077.85 | $1.52 | 0.29% |
| Hypothetical (5% return before expenses) | $1,000.00 | $1,023.74 | $1.48 | 0.29% |
| Class R6 | | | | |
| Actual | $1,000.00 | $1,079.86 | $0.73 | 0.14% |
| Hypothetical (5% return before expenses) | $1,000.00 | $1,024.50 | $0.71 | 0.14% |
| Administrator Class | | | | |
| Actual | $1,000.00 | $1,077.19 | $2.57 | 0.49% |
| Hypothetical (5% return before expenses) | $1,000.00 | $1,022.74 | $2.50 | 0.49% |
1 Expenses paid is equal to the annualized net expense ratio of each class multiplied by the average account value over the period, multiplied by the number of days in the most recent fiscal half-year divided by the number of days in the fiscal year (to reflect the one-half-year period).
34 | Target Date Retirement Funds
Fund expenses (unaudited)
| | Beginning
account value
3-1-2021 | Ending
account value
8-31-2021 | Expenses
paid during
the period1 | Annualized net
expense ratio |
| Target 2030 Fund | | | | |
| Class A | | | | |
| Actual | $1,000.00 | $1,086.10 | $3.05 | 0.58% |
| Hypothetical (5% return before expenses) | $1,000.00 | $1,022.28 | $2.96 | 0.58% |
| Class C | | | | |
| Actual | $1,000.00 | $1,081.42 | $7.08 | 1.35% |
| Hypothetical (5% return before expenses) | $1,000.00 | $1,018.40 | $6.87 | 1.35% |
| Class R | | | | |
| Actual | $1,000.00 | $1,084.64 | $4.20 | 0.80% |
| Hypothetical (5% return before expenses) | $1,000.00 | $1,021.17 | $4.08 | 0.80% |
| Class R4 | | | | |
| Actual | $1,000.00 | $1,087.50 | $1.53 | 0.29% |
| Hypothetical (5% return before expenses) | $1,000.00 | $1,023.74 | $1.48 | 0.29% |
| Class R6 | | | | |
| Actual | $1,000.00 | $1,088.43 | $0.74 | 0.14% |
| Hypothetical (5% return before expenses) | $1,000.00 | $1,024.50 | $0.71 | 0.14% |
| Administrator Class | | | | |
| Actual | $1,000.00 | $1,086.03 | $2.58 | 0.49% |
| Hypothetical (5% return before expenses) | $1,000.00 | $1,022.74 | $2.50 | 0.49% |
| Target 2035 Fund | | | | |
| Class A | | | | |
| Actual | $1,000.00 | $1,095.24 | $3.06 | 0.58% |
| Hypothetical (5% return before expenses) | $1,000.00 | $1,022.28 | $2.96 | 0.58% |
| Class R | | | | |
| Actual | $1,000.00 | $1,093.22 | $4.48 | 0.85% |
| Hypothetical (5% return before expenses) | $1,000.00 | $1,020.92 | $4.33 | 0.85% |
| Class R4 | | | | |
| Actual | $1,000.00 | $1,096.11 | $1.53 | 0.29% |
| Hypothetical (5% return before expenses) | $1,000.00 | $1,023.74 | $1.48 | 0.29% |
| Class R6 | | | | |
| Actual | $1,000.00 | $1,097.44 | $0.74 | 0.14% |
| Hypothetical (5% return before expenses) | $1,000.00 | $1,024.50 | $0.71 | 0.14% |
| Administrator Class | | | | |
| Actual | $1,000.00 | $1,095.18 | $2.59 | 0.49% |
| Hypothetical (5% return before expenses) | $1,000.00 | $1,022.74 | $2.50 | 0.49% |
1 Expenses paid is equal to the annualized net expense ratio of each class multiplied by the average account value over the period, multiplied by the number of days in the most recent fiscal half-year divided by the number of days in the fiscal year (to reflect the one-half-year period).
Target Date Retirement Funds | 35
Fund expenses (unaudited)
| | Beginning
account value
3-1-2021 | Ending
account value
8-31-2021 | Expenses
paid during
the period1 | Annualized net
expense ratio |
| Target 2040 Fund | | | | |
| Class A | | | | |
| Actual | $1,000.00 | $1,106.15 | $3.13 | 0.59% |
| Hypothetical (5% return before expenses) | $1,000.00 | $1,022.23 | $3.01 | 0.59% |
| Class C | | | | |
| Actual | $1,000.00 | $1,101.53 | $7.15 | 1.35% |
| Hypothetical (5% return before expenses) | $1,000.00 | $1,018.40 | $6.87 | 1.35% |
| Class R | | | | |
| Actual | $1,000.00 | $1,104.45 | $4.51 | 0.85% |
| Hypothetical (5% return before expenses) | $1,000.00 | $1,020.92 | $4.33 | 0.85% |
| Class R4 | | | | |
| Actual | $1,000.00 | $1,107.40 | $1.54 | 0.29% |
| Hypothetical (5% return before expenses) | $1,000.00 | $1,023.74 | $1.48 | 0.29% |
| Class R6 | | | | |
| Actual | $1,000.00 | $1,108.72 | $0.74 | 0.14% |
| Hypothetical (5% return before expenses) | $1,000.00 | $1,024.50 | $0.71 | 0.14% |
| Administrator Class | | | | |
| Actual | $1,000.00 | $1,107.12 | $2.60 | 0.49% |
| Hypothetical (5% return before expenses) | $1,000.00 | $1,022.74 | $2.50 | 0.49% |
| Target 2045 Fund | | | | |
| Class A | | | | |
| Actual | $1,000.00 | $1,111.60 | $3.09 | 0.58% |
| Hypothetical (5% return before expenses) | $1,000.00 | $1,022.28 | $2.96 | 0.58% |
| Class R | | | | |
| Actual | $1,000.00 | $1,109.81 | $4.52 | 0.85% |
| Hypothetical (5% return before expenses) | $1,000.00 | $1,020.92 | $4.33 | 0.85% |
| Class R4 | | | | |
| Actual | $1,000.00 | $1,114.25 | $1.55 | 0.29% |
| Hypothetical (5% return before expenses) | $1,000.00 | $1,023.74 | $1.48 | 0.29% |
| Class R6 | | | | |
| Actual | $1,000.00 | $1,114.63 | $0.75 | 0.14% |
| Hypothetical (5% return before expenses) | $1,000.00 | $1,024.50 | $0.71 | 0.14% |
| Administrator Class | | | | |
| Actual | $1,000.00 | $1,112.78 | $2.61 | 0.49% |
| Hypothetical (5% return before expenses) | $1,000.00 | $1,022.74 | $2.50 | 0.49% |
1 Expenses paid is equal to the annualized net expense ratio of each class multiplied by the average account value over the period, multiplied by the number of days in the most recent fiscal half-year divided by the number of days in the fiscal year (to reflect the one-half-year period).
36 | Target Date Retirement Funds
Fund expenses (unaudited)
| | Beginning
account value
3-1-2021 | Ending
account value
8-31-2021 | Expenses
paid during
the period1 | Annualized net
expense ratio |
| Target 2050 Fund | | | | |
| Class A | | | | |
| Actual | $1,000.00 | $1,117.06 | $3.09 | 0.58% |
| Hypothetical (5% return before expenses) | $1,000.00 | $1,022.28 | $2.96 | 0.58% |
| Class C | | | | |
| Actual | $1,000.00 | $1,114.04 | $7.19 | 1.35% |
| Hypothetical (5% return before expenses) | $1,000.00 | $1,018.40 | $6.87 | 1.35% |
| Class R | | | | |
| Actual | $1,000.00 | $1,115.76 | $4.53 | 0.85% |
| Hypothetical (5% return before expenses) | $1,000.00 | $1,020.92 | $4.33 | 0.85% |
| Class R4 | | | | |
| Actual | $1,000.00 | $1,118.52 | $1.55 | 0.29% |
| Hypothetical (5% return before expenses) | $1,000.00 | $1,023.74 | $1.48 | 0.29% |
| Class R6 | | | | |
| Actual | $1,000.00 | $1,120.05 | $0.75 | 0.14% |
| Hypothetical (5% return before expenses) | $1,000.00 | $1,024.50 | $0.71 | 0.14% |
| Administrator Class | | | | |
| Actual | $1,000.00 | $1,117.87 | $2.62 | 0.49% |
| Hypothetical (5% return before expenses) | $1,000.00 | $1,022.74 | $2.50 | 0.49% |
| Target 2055 Fund | | | | |
| Class A | | | | |
| Actual | $1,000.00 | $1,117.31 | $3.10 | 0.58% |
| Hypothetical (5% return before expenses) | $1,000.00 | $1,022.28 | $2.96 | 0.58% |
| Class R | | | | |
| Actual | $1,000.00 | $1,116.75 | $4.48 | 0.84% |
| Hypothetical (5% return before expenses) | $1,000.00 | $1,020.97 | $4.28 | 0.84% |
| Class R4 | | | | |
| Actual | $1,000.00 | $1,119.57 | $1.50 | 0.28% |
| Hypothetical (5% return before expenses) | $1,000.00 | $1,023.79 | $1.43 | 0.28% |
| Class R6 | | | | |
| Actual | $1,000.00 | $1,120.09 | $0.69 | 0.13% |
| Hypothetical (5% return before expenses) | $1,000.00 | $1,024.55 | $0.66 | 0.13% |
| Administrator Class | | | | |
| Actual | $1,000.00 | $1,117.90 | $2.62 | 0.49% |
| Hypothetical (5% return before expenses) | $1,000.00 | $1,022.74 | $2.50 | 0.49% |
1 Expenses paid is equal to the annualized net expense ratio of each class multiplied by the average account value over the period, multiplied by the number of days in the most recent fiscal half-year divided by the number of days in the fiscal year (to reflect the one-half-year period).
Target Date Retirement Funds | 37
Fund expenses (unaudited)
| | Beginning
account value
3-1-2021 | Ending
account value
8-31-2021 | Expenses
paid during
the period1 | Annualized net
expense ratio |
| Target 2060 Fund | | | | |
| Class A | | | | |
| Actual | $1,000.00 | $1,117.99 | $3.15 | 0.59% |
| Hypothetical (5% return before expenses) | $1,000.00 | $1,022.23 | $3.01 | 0.59% |
| Class C | | | | |
| Actual | $1,000.00 | $1,114.12 | $7.03 | 1.32% |
| Hypothetical (5% return before expenses) | $1,000.00 | $1,018.55 | $6.72 | 1.32% |
| Class R | | | | |
| Actual | $1,000.00 | $1,115.64 | $4.48 | 0.84% |
| Hypothetical (5% return before expenses) | $1,000.00 | $1,020.97 | $4.28 | 0.84% |
| Class R4 | | | | |
| Actual | $1,000.00 | $1,119.01 | $1.55 | 0.29% |
| Hypothetical (5% return before expenses) | $1,000.00 | $1,023.74 | $1.48 | 0.29% |
| Class R6 | | | | |
| Actual | $1,000.00 | $1,119.52 | $0.75 | 0.14% |
| Hypothetical (5% return before expenses) | $1,000.00 | $1,024.50 | $0.71 | 0.14% |
| Administrator Class | | | | |
| Actual | $1,000.00 | $1,118.11 | $2.62 | 0.49% |
| Hypothetical (5% return before expenses) | $1,000.00 | $1,022.74 | $2.50 | 0.49% |
1 Expenses paid is equal to the annualized net expense ratio of each class multiplied by the average account value over the period, multiplied by the number of days in the most recent fiscal half-year divided by the number of days in the fiscal year (to reflect the one-half-year period).
38 | Target Date Retirement Funds
Portfolio of investments—August 31, 2021 (unaudited)
| | | | | | Value |
| Investment companies: 100.08% | | | | | |
| Affiliated master portfolios: 100.08% | | | | | |
| Wells Fargo Bloomberg Barclays US Aggregate ex-Corporate Portfolio | | | | | $ 19,093,547 |
| Wells Fargo Emerging Markets Bond Portfolio | | | | | 1,633,051 |
| Wells Fargo Factor Enhanced Emerging Markets Equity Portfolio | | | | | 1,027,839 |
| Wells Fargo Factor Enhanced International Equity Portfolio | | | | | 3,344,330 |
| Wells Fargo Factor Enhanced U.S. Large Cap Equity Portfolio | | | | | 6,446,872 |
| Wells Fargo Factor Enhanced U.S. Low Volatility Equity Portfolio | | | | | 2,763,216 |
| Wells Fargo Factor Enhanced U.S. Small Cap Equity Portfolio | | | | | 1,595,171 |
| Wells Fargo High Yield Corporate Bond Portfolio | | | | | 1,629,898 |
| Wells Fargo Investment Grade Corporate Bond Portfolio | | | | | 9,924,541 |
| Wells Fargo Strategic Retirement Bond Portfolio | | | | | 6,450,244 |
| Wells Fargo U.S. REIT Portfolio | | | | | 1,391,112 |
| Total Investment companies (Cost $46,062,313) | | | | | 55,299,821 |
| Total investments in securities (Cost $46,062,313) | 100.08% | | | | 55,299,821 |
| Other assets and liabilities, net | (0.08) | | | | (45,481) |
| Total net assets | 100.00% | | | | $55,254,340 |
Transactions with the affiliated Master Portfolios were as follows:
| | % of
ownership,
beginning
of period | % of
ownership,
end of
period | Net realized
gains
(losses) on
securities
transactions
allocated
from
affiliated
Master
Portfolios | | Net
change in
unrealized
gains
(losses) on
securities
transactions
allocated
from
affiliated
Master
Portfolios | | Interest
allocated
from
affiliated
Master
Portfolios | | Dividends
allocated
from
affiliated
Master
Portfolios | | Affiliated
income
allocated
from
affiliated
Master
Portfolios | | Value,
end of
period | |
| Wells Fargo Bloomberg Barclays US Aggregate ex-Corporate Portfolio | 3.49% | 3.24% | $ 70,393 | | $ (12,579) | | $ 119,889 | | $ 0 | | $361 | | $ 19,093,547 | |
| Wells Fargo Emerging Markets Bond Portfolio | 4.67 | 4.30 | (26,813) | | 61,339 | | 37,840 | | 0 | | 3 | | 1,633,051 | |
| Wells Fargo Factor Enhanced Emerging Markets Equity Portfolio | 0.60 | 0.55 | 52,161 | | (61,114) | | 0 | | 16,096 | | 4 | | 1,027,839 | |
| Wells Fargo Factor Enhanced International Equity Portfolio | 0.52 | 0.46 | 258,819 | | 45,959 | | 0 | | 64,593 | | 11 | | 3,344,330 | |
| Wells Fargo Factor Enhanced U.S. Large Cap Equity Portfolio | 0.86 | 0.75 | 966,410 | | 179,460 | | 0 | | 45,995 | | 26 | | 6,446,872 | |
| Wells Fargo Factor Enhanced U.S. Low Volatility Equity Portfolio | 11.42 | 10.74 | 102,723 | | 369,274 | | 0 | | 23,305 | | 10 | | 2,763,216 | |
| Wells Fargo Factor Enhanced U.S. Small Cap Equity Portfolio | 0.81 | 0.72 | 324,907 | | (232,364) | | 0 | | 8,474 | | 8 | | 1,595,171 | |
| Wells Fargo High Yield Corporate Bond Portfolio | 3.46 | 3.22 | 18,242 | | 361 | | 42,347 | | 0 | | 4 | | 1,629,898 | |
| Wells Fargo Investment Grade Corporate Bond Portfolio | 4.63 | 4.26 | 116,752 | | (11,937) | | 154,516 | | 0 | | 10 | | 9,924,541 | |
| Wells Fargo Strategic Retirement Bond Portfolio | 4.46 | 4.21 | 35,355 | | 9,261 | | 126,296 | | 0 | | 6 | | 6,450,244 | |
| Wells Fargo U.S. REIT Portfolio | 5.66 | 5.29 | 119,671 | | 191,685 | | 0 | | 22,295 | | 1 | | 1,391,112 | |
| | | | $2,038,620 | | $ 539,345 | | $480,888 | | $180,758 | | $444 | | $55,299,821 | |
The accompanying notes are an integral part of these financial statements.
Target Date Retirement Funds | 39
Portfolio of investments—August 31, 2021 (unaudited)
| | | | | | Value |
| Investment companies: 99.97% | | | | | |
| Affiliated master portfolios: 99.97% | | | | | |
| Wells Fargo Bloomberg Barclays US Aggregate ex-Corporate Portfolio | | | | | $ 18,257,722 |
| Wells Fargo Emerging Markets Bond Portfolio | | | | | 1,562,722 |
| Wells Fargo Factor Enhanced Emerging Markets Equity Portfolio | | | | | 985,929 |
| Wells Fargo Factor Enhanced International Equity Portfolio | | | | | 3,208,035 |
| Wells Fargo Factor Enhanced U.S. Large Cap Equity Portfolio | | | | | 6,187,334 |
| Wells Fargo Factor Enhanced U.S. Low Volatility Equity Portfolio | | | | | 2,650,526 |
| Wells Fargo Factor Enhanced U.S. Small Cap Equity Portfolio | | | | | 1,530,401 |
| Wells Fargo High Yield Corporate Bond Portfolio | | | | | 1,559,291 |
| Wells Fargo Investment Grade Corporate Bond Portfolio | | | | | 9,501,892 |
| Wells Fargo Strategic Retirement Bond Portfolio | | | | | 6,172,939 |
| Wells Fargo U.S. REIT Portfolio | | | | | 1,335,933 |
| Total Investment companies (Cost $31,372,590) | | | | | 52,952,724 |
| Total investments in securities (Cost $31,372,590) | 99.97% | | | | 52,952,724 |
| Other assets and liabilities, net | 0.03 | | | | 16,973 |
| Total net assets | 100.00% | | | | $52,969,697 |
Transactions with the affiliated Master Portfolios were as follows:
| | % of
ownership,
beginning
of period | % of
ownership,
end of
period | Net realized
gains
(losses) on
securities
transactions
allocated
from
affiliated
Master
Portfolios | | Net
change in
unrealized
gains
(losses) on
securities
transactions
allocated
from
affiliated
Master
Portfolios | | Interest
allocated
from
affiliated
Master
Portfolios | | Dividends
allocated
from
affiliated
Master
Portfolios | | Affiliated
income
allocated
from
affiliated
Master
Portfolios | | Value,
end of
period | |
| Wells Fargo Bloomberg Barclays US Aggregate ex-Corporate Portfolio | 3.19% | 3.10% | $ 69,230 | | $ (3,837) | | $ 114,400 | | $ 0 | | $344 | | $ 18,257,722 | |
| Wells Fargo Emerging Markets Bond Portfolio | 4.26 | 4.11 | (24,169) | | 56,037 | | 36,089 | | 0 | | 3 | | 1,562,722 | |
| Wells Fargo Factor Enhanced Emerging Markets Equity Portfolio | 0.55 | 0.53 | 49,264 | | (61,459) | | 0 | | 15,518 | | 4 | | 985,929 | |
| Wells Fargo Factor Enhanced International Equity Portfolio | 0.47 | 0.44 | 242,892 | | 39,569 | | 0 | | 61,384 | | 10 | | 3,208,035 | |
| Wells Fargo Factor Enhanced U.S. Large Cap Equity Portfolio | 0.78 | 0.72 | 911,085 | | 165,501 | | 0 | | 43,964 | | 25 | | 6,187,334 | |
| Wells Fargo Factor Enhanced U.S. Low Volatility Equity Portfolio | 10.41 | 10.30 | 98,696 | | 343,858 | | 0 | | 22,127 | | 9 | | 2,650,526 | |
| Wells Fargo Factor Enhanced U.S. Small Cap Equity Portfolio | 0.74 | 0.69 | 311,438 | | (227,309) | | 0 | | 8,139 | | 8 | | 1,530,401 | |
| Wells Fargo High Yield Corporate Bond Portfolio | 3.18 | 3.08 | 17,245 | | 581 | | 40,365 | | 0 | | 4 | | 1,559,291 | |
| Wells Fargo Investment Grade Corporate Bond Portfolio | 4.23 | 4.08 | 112,120 | | (2,226) | | 147,444 | | 0 | | 10 | | 9,501,892 | |
| Wells Fargo Strategic Retirement Bond Portfolio | 4.09 | 4.02 | 31,540 | | 14,202 | | 120,901 | | 0 | | 6 | | 6,172,939 | |
| Wells Fargo U.S. REIT Portfolio | 5.15 | 5.08 | 116,936 | | 178,669 | | 0 | | 21,295 | | 1 | | 1,335,933 | |
| | | | $1,936,277 | | $ 503,586 | | $459,199 | | $172,427 | | $424 | | $52,952,724 | |
The accompanying notes are an integral part of these financial statements.
40 | Target Date Retirement Funds
Portfolio of investments—August 31, 2021 (unaudited)
| | | | | | Value |
| Investment companies: 100.08% | | | | | |
| Affiliated master portfolios: 100.08% | | | | | |
| Wells Fargo Bloomberg Barclays US Aggregate ex-Corporate Portfolio | | | | | $ 16,617,508 |
| Wells Fargo Emerging Markets Bond Portfolio | | | | | 1,422,414 |
| Wells Fargo Factor Enhanced Emerging Markets Equity Portfolio | | | | | 1,202,078 |
| Wells Fargo Factor Enhanced International Equity Portfolio | | | | | 3,912,871 |
| Wells Fargo Factor Enhanced U.S. Large Cap Equity Portfolio | | | | | 7,553,251 |
| Wells Fargo Factor Enhanced U.S. Low Volatility Equity Portfolio | | | | | 2,071,979 |
| Wells Fargo Factor Enhanced U.S. Small Cap Equity Portfolio | | | | | 1,868,097 |
| Wells Fargo High Yield Corporate Bond Portfolio | | | | | 1,418,690 |
| Wells Fargo Investment Grade Corporate Bond Portfolio | | | | | 8,642,957 |
| Wells Fargo Strategic Retirement Bond Portfolio | | | | | 5,616,311 |
| Wells Fargo U.S. REIT Portfolio | | | | | 1,527,121 |
| Total Investment companies (Cost $38,349,418) | | | | | 51,853,277 |
| Total investments in securities (Cost $38,349,418) | 100.08% | | | | 51,853,277 |
| Other assets and liabilities, net | (0.08) | | | | (39,530) |
| Total net assets | 100.00% | | | | $51,813,747 |
Transactions with the affiliated Master Portfolios were as follows:
| | % of
ownership,
beginning
of period | % of
ownership,
end of
period | Net realized
gains
(losses) on
securities
transactions
allocated
from
affiliated
Master
Portfolios | | Net
change in
unrealized
gains
(losses) on
securities
transactions
allocated
from
affiliated
Master
Portfolios | | Interest
allocated
from
affiliated
Master
Portfolios | | Dividends
allocated
from
affiliated
Master
Portfolios | | Affiliated
income
allocated
from
affiliated
Master
Portfolios | | Value,
end of
period | |
| Wells Fargo Bloomberg Barclays US Aggregate ex-Corporate Portfolio | 2.93% | 2.82% | $ 63,435 | | $ 61,237 | | $ 103,569 | | $ 0 | | $313 | | $ 16,617,508 | |
| Wells Fargo Emerging Markets Bond Portfolio | 3.92 | 3.74 | (21,891) | | 57,743 | | 32,739 | | 0 | | 3 | | 1,422,414 | |
| Wells Fargo Factor Enhanced Emerging Markets Equity Portfolio | 0.68 | 0.65 | 59,829 | | (425,443) | | 0 | | 18,885 | | 5 | | 1,202,078 | |
| Wells Fargo Factor Enhanced International Equity Portfolio | 0.59 | 0.53 | 294,722 | | 70,136 | | 0 | | 74,903 | | 12 | | 3,912,871 | |
| Wells Fargo Factor Enhanced U.S. Large Cap Equity Portfolio | 0.97 | 0.88 | 1,107,570 | | 239,150 | | 0 | | 53,656 | | 30 | | 7,553,251 | |
| Wells Fargo Factor Enhanced U.S. Low Volatility Equity Portfolio | 8.24 | 8.05 | 77,344 | | 410,458 | | 0 | | 17,327 | | 6 | | 2,071,979 | |
| Wells Fargo Factor Enhanced U.S. Small Cap Equity Portfolio | 0.92 | 0.84 | 374,832 | | (262,389) | | 0 | | 9,871 | | 10 | | 1,868,097 | |
| Wells Fargo High Yield Corporate Bond Portfolio | 2.93 | 2.80 | 15,811 | | 6,213 | | 36,601 | | 0 | | 4 | | 1,418,690 | |
| Wells Fargo Investment Grade Corporate Bond Portfolio | 3.89 | 3.71 | 101,574 | | 29,586 | | 133,752 | | 0 | | 9 | | 8,642,957 | |
| Wells Fargo Strategic Retirement Bond Portfolio | 3.76 | 3.66 | 32,260 | | 31,593 | | 109,609 | | 0 | | 6 | | 5,616,311 | |
| Wells Fargo U.S. REIT Portfolio | 6.13 | 5.81 | 133,282 | | 208,761 | | 0 | | 24,175 | | 1 | | 1,527,121 | |
| | | | $2,238,768 | | $ 427,045 | | $416,270 | | $198,817 | | $399 | | $51,853,277 | |
The accompanying notes are an integral part of these financial statements.
Target Date Retirement Funds | 41
Portfolio of investments—August 31, 2021 (unaudited)
| | | | | | Value |
| Investment companies: 100.01% | | | | | |
| Affiliated master portfolios: 100.01% | | | | | |
| Wells Fargo Bloomberg Barclays US Aggregate ex-Corporate Portfolio | | | | | $ 89,929,076 |
| Wells Fargo Emerging Markets Bond Portfolio | | | | | 7,694,263 |
| Wells Fargo Factor Enhanced Emerging Markets Equity Portfolio | | | | | 8,481,287 |
| Wells Fargo Factor Enhanced International Equity Portfolio | | | | | 27,604,112 |
| Wells Fargo Factor Enhanced U.S. Large Cap Equity Portfolio | | | | | 53,358,610 |
| Wells Fargo Factor Enhanced U.S. Low Volatility Equity Portfolio | | | | | 9,145,362 |
| Wells Fargo Factor Enhanced U.S. Small Cap Equity Portfolio | | | | | 13,205,761 |
| Wells Fargo High Yield Corporate Bond Portfolio | | | | | 7,677,387 |
| Wells Fargo Investment Grade Corporate Bond Portfolio | | | | | 46,784,175 |
| Wells Fargo Strategic Retirement Bond Portfolio | | | | | 30,392,431 |
| Wells Fargo U.S. REIT Portfolio | | | | | 10,276,538 |
| Total Investment companies (Cost $245,965,733) | | | | | 304,549,002 |
| Total investments in securities (Cost $245,965,733) | 100.01% | | | | 304,549,002 |
| Other assets and liabilities, net | (0.01) | | | | (45,326) |
| Total net assets | 100.00% | | | | $304,503,676 |
Transactions with the affiliated Master Portfolios were as follows:
| | % of
ownership,
beginning
of period | % of
ownership,
end of
period | Net realized
gains
(losses) on
securities
transactions
allocated
from
affiliated
Master
Portfolios | | Net
change in
unrealized
gains
(losses) on
securities
transactions
allocated
from
affiliated
Master
Portfolios | | Interest
allocated
from
affiliated
Master
Portfolios | | Dividends
allocated
from
affiliated
Master
Portfolios | | Affiliated
income
allocated
from
affiliated
Master
Portfolios | | Value,
end of
period | |
| Wells Fargo Bloomberg Barclays US Aggregate ex-Corporate Portfolio | 15.82% | 15.26% | $ 337,458 | | $ (28,320) | | $ 557,768 | | $ 0 | | $ 1,685 | | $ 89,929,076 | |
| Wells Fargo Emerging Markets Bond Portfolio | 21.18 | 20.25 | (118,634) | | 274,515 | | 176,437 | | 0 | | 14 | | 7,694,263 | |
| Wells Fargo Factor Enhanced Emerging Markets Equity Portfolio | 4.73 | 4.57 | 417,154 | | (522,335) | | 0 | | 132,093 | | 35 | | 8,481,287 | |
| Wells Fargo Factor Enhanced International Equity Portfolio | 4.10 | 3.76 | 2,057,744 | | 359,337 | | 0 | | 523,164 | | 87 | | 27,604,112 | |
| Wells Fargo Factor Enhanced U.S. Large Cap Equity Portfolio | 6.73 | 6.25 | 7,720,813 | | 1,477,235 | | 0 | | 375,219 | | 210 | | 53,358,610 | |
| Wells Fargo Factor Enhanced U.S. Low Volatility Equity Portfolio | 36.02 | 35.53 | 336,372 | | 1,184,806 | | 0 | | 75,735 | | 32 | | 9,145,362 | |
| Wells Fargo Factor Enhanced U.S. Small Cap Equity Portfolio | 6.34 | 5.95 | 2,627,431 | | (1,910,712) | | 0 | | 69,174 | | 68 | | 13,205,761 | |
| Wells Fargo High Yield Corporate Bond Portfolio | 15.72 | 15.15 | 84,605 | | 1,793 | | 197,250 | | 0 | | 19 | | 7,677,387 | |
| Wells Fargo Investment Grade Corporate Bond Portfolio | 21.03 | 20.10 | 550,251 | | (28,002) | | 720,534 | | 0 | | 47 | | 46,784,175 | |
| Wells Fargo Strategic Retirement Bond Portfolio | 20.22 | 19.81 | 153,842 | | 64,687 | | 590,733 | | 0 | | 30 | | 30,392,431 | |
| Wells Fargo U.S. REIT Portfolio | 39.76 | 39.07 | 882,033 | | 1,351,313 | | 0 | | 161,232 | | 7 | | 10,276,538 | |
| | | | $15,049,069 | | $ 2,224,317 | | $2,242,722 | | $1,336,617 | | $2,234 | | $304,549,002 | |
The accompanying notes are an integral part of these financial statements.
42 | Target Date Retirement Funds
Portfolio of investments—August 31, 2021 (unaudited)
| | | | | | Value |
| Investment companies: 100.01% | | | | | |
| Affiliated master portfolios: 100.01% | | | | | |
| Wells Fargo Bloomberg Barclays US Aggregate ex-Corporate Portfolio | | | | | $ 54,171,852 |
| Wells Fargo Emerging Markets Bond Portfolio | | | | | 4,594,634 |
| Wells Fargo Factor Enhanced Emerging Markets Equity Portfolio | | | | | 7,897,369 |
| Wells Fargo Factor Enhanced International Equity Portfolio | | | | | 25,633,412 |
| Wells Fargo Factor Enhanced U.S. Large Cap Equity Portfolio | | | | | 47,345,245 |
| Wells Fargo Factor Enhanced U.S. Low Volatility Equity Portfolio | | | | | 4,077,666 |
| Wells Fargo Factor Enhanced U.S. Small Cap Equity Portfolio | | | | | 11,728,846 |
| Wells Fargo High Yield Corporate Bond Portfolio | | | | | 4,584,576 |
| Wells Fargo Investment Grade Corporate Bond Portfolio | | | | | 28,188,216 |
| Wells Fargo Strategic Retirement Bond Portfolio | | | | | 10,163,426 |
| Wells Fargo U.S. REIT Portfolio | | | | | 5,153,046 |
| Total Investment companies (Cost $172,778,673) | | | | | 203,538,288 |
| Total investments in securities (Cost $172,778,673) | 100.01% | | | | 203,538,288 |
| Other assets and liabilities, net | (0.01) | | | | (10,289) |
| Total net assets | 100.00% | | | | $203,527,999 |
Transactions with the affiliated Master Portfolios were as follows:
| | % of
ownership,
beginning
of period | % of
ownership,
end of
period | Net realized
gains
(losses) on
securities
transactions
allocated
from
affiliated
Master
Portfolios | | Net
change in
unrealized
gains
(losses) on
securities
transactions
allocated
from
affiliated
Master
Portfolios | | Interest
allocated
from
affiliated
Master
Portfolios | | Dividends
allocated
from
affiliated
Master
Portfolios | | Affiliated
income
allocated
from
affiliated
Master
Portfolios | | Value,
end of
period | |
| Wells Fargo Bloomberg Barclays US Aggregate ex-Corporate Portfolio | 8.98% | 9.19% | $ 209,343 | | $ (6,150) | | $ 329,638 | | $ 0 | | $ 998 | | $ 54,171,852 | |
| Wells Fargo Emerging Markets Bond Portfolio | 11.92 | 12.10 | (66,996) | | 159,751 | | 103,421 | | 0 | | 8 | | 4,594,634 | |
| Wells Fargo Factor Enhanced Emerging Markets Equity Portfolio | 4.14 | 4.26 | 381,198 | | (481,762) | | 0 | | 121,544 | | 32 | | 7,897,369 | |
| Wells Fargo Factor Enhanced International Equity Portfolio | 3.59 | 3.49 | 1,866,694 | | 304,867 | | 0 | | 474,105 | | 79 | | 25,633,412 | |
| Wells Fargo Factor Enhanced U.S. Large Cap Equity Portfolio | 5.62 | 5.54 | 6,695,826 | | 1,271,803 | | 0 | | 328,038 | | 185 | | 47,345,245 | |
| Wells Fargo Factor Enhanced U.S. Low Volatility Equity Portfolio | 15.06 | 15.84 | 148,463 | | 513,766 | | 0 | | 33,110 | | 14 | | 4,077,666 | |
| Wells Fargo Factor Enhanced U.S. Small Cap Equity Portfolio | 5.33 | 5.29 | 2,303,148 | | (1,678,276) | | 0 | | 61,040 | | 60 | | 11,728,846 | |
| Wells Fargo High Yield Corporate Bond Portfolio | 8.84 | 9.05 | 49,717 | | 1,535 | | 115,575 | | 0 | | 11 | | 4,584,576 | |
| Wells Fargo Investment Grade Corporate Bond Portfolio | 11.93 | 12.11 | 331,108 | | 4,699 | | 425,866 | | 0 | | 28 | | 28,188,216 | |
| Wells Fargo Strategic Retirement Bond Portfolio | 6.37 | 6.63 | 51,721 | | 20,358 | | 194,849 | | 0 | | 10 | | 10,163,426 | |
| Wells Fargo U.S. REIT Portfolio | 18.77 | 19.59 | 441,605 | | 653,679 | | 0 | | 79,732 | | 3 | | 5,153,046 | |
| | | | $12,411,827 | | $ 764,270 | | $1,169,349 | | $1,097,569 | | $1,428 | | $203,538,288 | |
The accompanying notes are an integral part of these financial statements.
Target Date Retirement Funds | 43
Portfolio of investments—August 31, 2021 (unaudited)
| | | | | | Value |
| Investment companies: 99.97% | | | | | |
| Affiliated master portfolios: 99.97% | | | | | |
| Wells Fargo Bloomberg Barclays US Aggregate ex-Corporate Portfolio | | | | | $ 114,821,277 |
| Wells Fargo Emerging Markets Bond Portfolio | | | | | 9,671,190 |
| Wells Fargo Factor Enhanced Emerging Markets Equity Portfolio | | | | | 25,509,018 |
| Wells Fargo Factor Enhanced International Equity Portfolio | | | | | 82,902,084 |
| Wells Fargo Factor Enhanced U.S. Large Cap Equity Portfolio | | | | | 146,929,817 |
| Wells Fargo Factor Enhanced U.S. Low Volatility Equity Portfolio | | | | | 5,029,138 |
| Wells Fargo Factor Enhanced U.S. Small Cap Equity Portfolio | | | | | 36,461,883 |
| Wells Fargo High Yield Corporate Bond Portfolio | | | | | 9,650,051 |
| Wells Fargo Investment Grade Corporate Bond Portfolio | | | | | 59,793,368 |
| Wells Fargo Strategic Retirement Bond Portfolio | | | | | 6,683,625 |
| Wells Fargo U.S. REIT Portfolio | | | | | 5,086,466 |
| Total Investment companies (Cost $421,623,172) | | | | | 502,537,917 |
| Total investments in securities (Cost $421,623,172) | 99.97% | | | | 502,537,917 |
| Other assets and liabilities, net | 0.03 | | | | 129,087 |
| Total net assets | 100.00% | | | | $502,667,004 |
Transactions with the affiliated Master Portfolios were as follows:
| | % of
ownership,
beginning
of period | % of
ownership,
end of
period | Net realized
gains
(losses) on
securities
transactions
allocated
from
affiliated
Master
Portfolios | | Net
change in
unrealized
gains
(losses) on
securities
transactions
allocated
from
affiliated
Master
Portfolios | | Interest
allocated
from
affiliated
Master
Portfolios | | Dividends
allocated
from
affiliated
Master
Portfolios | | Affiliated
income
allocated
from
affiliated
Master
Portfolios | | Value,
end of
period | |
| Wells Fargo Bloomberg Barclays US Aggregate ex-Corporate Portfolio | 19.20% | 19.48% | $ 425,728 | | $ (22,044) | | $ 702,698 | | $ 0 | | $ 2,130 | | $ 114,821,277 | |
| Wells Fargo Emerging Markets Bond Portfolio | 25.32 | 25.46 | (144,507) | | 338,148 | | 218,335 | | 0 | | 19 | | 9,671,190 | |
| Wells Fargo Factor Enhanced Emerging Markets Equity Portfolio | 13.72 | 13.76 | 1,242,520 | | (1,532,572) | | 0 | | 393,510 | | 103 | | 25,509,018 | |
| Wells Fargo Factor Enhanced International Equity Portfolio | 11.93 | 11.28 | 6,091,076 | | 987,117 | | 0 | | 1,541,815 | | 257 | | 82,902,084 | |
| Wells Fargo Factor Enhanced U.S. Large Cap Equity Portfolio | 17.93 | 17.20 | 21,127,831 | | 3,818,538 | | 0 | | 1,019,119 | | 573 | | 146,929,817 | |
| Wells Fargo Factor Enhanced U.S. Low Volatility Equity Portfolio | 18.84 | 19.54 | 182,461 | | 642,933 | | 0 | | 41,007 | | 17 | | 5,029,138 | |
| Wells Fargo Factor Enhanced U.S. Small Cap Equity Portfolio | 16.93 | 16.43 | 7,185,248 | | (5,272,713) | | 0 | | 189,138 | | 186 | | 36,461,883 | |
| Wells Fargo High Yield Corporate Bond Portfolio | 18.86 | 19.04 | 103,973 | | 2,793 | | 244,131 | | 0 | | 26 | | 9,650,051 | |
| Wells Fargo Investment Grade Corporate Bond Portfolio | 25.51 | 25.68 | 695,467 | | (10,114) | | 903,224 | | 0 | | 61 | | 59,793,368 | |
| Wells Fargo Strategic Retirement Bond Portfolio | 4.24 | 4.36 | 28,967 | | 17,425 | | 128,327 | | 0 | | 0 | | 6,683,625 | |
| Wells Fargo U.S. REIT Portfolio | 19.05 | 19.34 | 433,115 | | 657,314 | | 0 | | 78,746 | | 0 | | 5,086,466 | |
| | | | $37,371,879 | | $ (373,175) | | $2,196,715 | | $3,263,335 | | $3,372 | | $502,537,917 | |
The accompanying notes are an integral part of these financial statements.
44 | Target Date Retirement Funds
Portfolio of investments—August 31, 2021 (unaudited)
| | | | | | Value |
| Investment companies: 100.01% | | | | | |
| Affiliated master portfolios: 100.01% | | | | | |
| Wells Fargo Bloomberg Barclays US Aggregate ex-Corporate Portfolio | | | | | $ 37,689,933 |
| Wells Fargo Emerging Markets Bond Portfolio | | | | | 3,190,738 |
| Wells Fargo Factor Enhanced Emerging Markets Equity Portfolio | | | | | 13,240,421 |
| Wells Fargo Factor Enhanced International Equity Portfolio | | | | | 43,477,682 |
| Wells Fargo Factor Enhanced U.S. Large Cap Equity Portfolio | | | | | 73,689,383 |
| Wells Fargo Factor Enhanced U.S. Small Cap Equity Portfolio | | | | | 18,364,893 |
| Wells Fargo High Yield Corporate Bond Portfolio | | | | | 3,183,762 |
| Wells Fargo Investment Grade Corporate Bond Portfolio | | | | | 19,575,295 |
| Total Investment companies (Cost $181,052,796) | | | | | 212,412,107 |
| Total investments in securities (Cost $181,052,796) | 100.01% | | | | 212,412,107 |
| Other assets and liabilities, net | (0.01) | | | | (19,339) |
| Total net assets | 100.00% | | | | $212,392,768 |
Transactions with the affiliated Master Portfolios were as follows:
| | % of
ownership,
beginning
of period | % of
ownership,
end of
period | Net realized
gains
(losses) on
securities
transactions
allocated
from
affiliated
Master
Portfolios | | Net
change in
unrealized
gains
(losses) on
securities
transactions
allocated
from
affiliated
Master
Portfolios | | Interest
allocated
from
affiliated
Master
Portfolios | | Dividends
allocated
from
affiliated
Master
Portfolios | | Affiliated
income
allocated
from
affiliated
Master
Portfolios | | Value,
end of
period | |
| Wells Fargo Bloomberg Barclays US Aggregate ex-Corporate Portfolio | 6.05% | 6.40% | $ 145,662 | | $ (4,552) | | $ 225,148 | | $ 0 | | $ 654 | | $ 37,689,933 | |
| Wells Fargo Emerging Markets Bond Portfolio | 8.03 | 8.40 | (44,696) | | 107,897 | | 70,387 | | 0 | | 6 | | 3,190,738 | |
| Wells Fargo Factor Enhanced Emerging Markets Equity Portfolio | 6.75 | 7.14 | 621,204 | | (781,307) | | 0 | | 199,899 | | 48 | | 13,240,421 | |
| Wells Fargo Factor Enhanced International Equity Portfolio | 5.92 | 5.92 | 3,070,102 | | 517,752 | | 0 | | 785,181 | | 127 | | 43,477,682 | |
| Wells Fargo Factor Enhanced U.S. Large Cap Equity Portfolio | 8.53 | 8.63 | 10,086,245 | | 2,016,962 | | 0 | | 499,650 | | 315 | | 73,689,383 | |
| Wells Fargo Factor Enhanced U.S. Small Cap Equity Portfolio | 8.12 | 8.28 | 3,471,276 | | (2,542,268) | | 0 | | 92,679 | | 90 | | 18,364,893 | |
| Wells Fargo High Yield Corporate Bond Portfolio | 5.94 | 6.28 | 33,975 | | 873 | | 78,628 | | 0 | | 8 | | 3,183,762 | |
| Wells Fargo Investment Grade Corporate Bond Portfolio | 8.05 | 8.41 | 227,463 | | 1,582 | | 287,783 | | 0 | | 19 | | 19,575,295 | |
| | | | $17,611,231 | | $ (683,061) | | $661,946 | | $1,577,409 | | $1,267 | | $212,412,107 | |
The accompanying notes are an integral part of these financial statements.
Target Date Retirement Funds | 45
Portfolio of investments—August 31, 2021 (unaudited)
| | | | | | Value |
| Investment companies: 100.00% | | | | | |
| Affiliated master portfolios: 100.00% | | | | | |
| Wells Fargo Bloomberg Barclays US Aggregate ex-Corporate Portfolio | | | | | $ 57,187,073 |
| Wells Fargo Emerging Markets Bond Portfolio | | | | | 4,844,241 |
| Wells Fargo Factor Enhanced Emerging Markets Equity Portfolio | | | | | 35,628,227 |
| Wells Fargo Factor Enhanced International Equity Portfolio | | | | | 115,812,911 |
| Wells Fargo Factor Enhanced U.S. Large Cap Equity Portfolio | | | | | 188,548,676 |
| Wells Fargo Factor Enhanced U.S. Small Cap Equity Portfolio | | | | | 46,869,470 |
| Wells Fargo High Yield Corporate Bond Portfolio | | | | | 4,833,679 |
| Wells Fargo Investment Grade Corporate Bond Portfolio | | | | | 29,719,536 |
| Total Investment companies (Cost $402,088,837) | | | | | 483,443,813 |
| Total investments in securities (Cost $402,088,837) | 100.00% | | | | 483,443,813 |
| Other assets and liabilities, net | 0.00 | | | | 12,495 |
| Total net assets | 100.00% | | | | $483,456,308 |
Transactions with the affiliated Master Portfolios were as follows:
| | % of
ownership,
beginning
of period | % of
ownership,
end of
period | Net realized
gains
(losses) on
securities
transactions
allocated
from
affiliated
Master
Portfolios | | Net
change in
unrealized
gains
(losses) on
securities
transactions
allocated
from
affiliated
Master
Portfolios | | Interest
allocated
from
affiliated
Master
Portfolios | | Dividends
allocated
from
affiliated
Master
Portfolios | | Affiliated
income
allocated
from
affiliated
Master
Portfolios | | Value,
end of
period | |
| Wells Fargo Bloomberg Barclays US Aggregate ex-Corporate Portfolio | 9.37% | 9.70% | $ 210,958 | | $ (6,914) | | $ 347,949 | | $ 0 | | $ 977 | | $ 57,187,073 | |
| Wells Fargo Emerging Markets Bond Portfolio | 12.41 | 12.75 | (72,450) | | 170,131 | | 108,840 | | 0 | | 9 | | 4,844,241 | |
| Wells Fargo Factor Enhanced Emerging Markets Equity Portfolio | 18.94 | 19.21 | 1,725,753 | | (2,136,283) | | 0 | | 545,090 | | 133 | | 35,628,227 | |
| Wells Fargo Factor Enhanced International Equity Portfolio | 16.44 | 15.76 | 8,473,944 | | 1,290,273 | | 0 | | 2,138,671 | | 345 | | 115,812,911 | |
| Wells Fargo Factor Enhanced U.S. Large Cap Equity Portfolio | 22.78 | 22.07 | 27,075,943 | | 4,764,704 | | 0 | | 1,298,264 | | 824 | | 188,548,676 | |
| Wells Fargo Factor Enhanced U.S. Small Cap Equity Portfolio | 21.82 | 21.12 | 9,185,725 | | (6,750,520) | | 0 | | 241,093 | | 238 | | 46,869,470 | |
| Wells Fargo High Yield Corporate Bond Portfolio | 9.26 | 9.54 | 51,529 | | 2,361 | | 121,595 | | 0 | | 12 | | 4,833,679 | |
| Wells Fargo Investment Grade Corporate Bond Portfolio | 12.43 | 12.77 | 342,793 | | 3,336 | | 443,253 | | 0 | | 29 | | 29,719,536 | |
| | | | $46,994,195 | | $(2,662,912) | | $1,021,637 | | $4,223,118 | | $2,567 | | $483,443,813 | |
The accompanying notes are an integral part of these financial statements.
46 | Target Date Retirement Funds
Portfolio of investments—August 31, 2021 (unaudited)
| | | | | | Value |
| Investment companies: 100.03% | | | | | |
| Affiliated master portfolios: 100.03% | | | | | |
| Wells Fargo Bloomberg Barclays US Aggregate ex-Corporate Portfolio | | | | | $ 8,708,176 |
| Wells Fargo Emerging Markets Bond Portfolio | | | | | 737,346 |
| Wells Fargo Factor Enhanced Emerging Markets Equity Portfolio | | | | | 7,743,175 |
| Wells Fargo Factor Enhanced International Equity Portfolio | | | | | 25,222,911 |
| Wells Fargo Factor Enhanced U.S. Large Cap Equity Portfolio | | | | | 40,205,763 |
| Wells Fargo Factor Enhanced U.S. Small Cap Equity Portfolio | | | | | 10,020,359 |
| Wells Fargo High Yield Corporate Bond Portfolio | | | | | 735,733 |
| Wells Fargo Investment Grade Corporate Bond Portfolio | | | | | 4,523,640 |
| Total Investment companies (Cost $82,340,699) | | | | | 97,897,103 |
| Total investments in securities (Cost $82,340,699) | 100.03% | | | | 97,897,103 |
| Other assets and liabilities, net | (0.03) | | | | (30,510) |
| Total net assets | 100.00% | | | | $97,866,593 |
Transactions with the affiliated Master Portfolios were as follows:
| | % of
ownership,
beginning
of period | % of
ownership,
end of
period | Net realized
gains
(losses) on
securities
transactions
allocated
from
affiliated
Master
Portfolios | | Net
change in
unrealized
gains
(losses) on
securities
transactions
allocated
from
affiliated
Master
Portfolios | | Interest
allocated
from
affiliated
Master
Portfolios | | Dividends
allocated
from
affiliated
Master
Portfolios | | Affiliated
income
allocated
from
affiliated
Master
Portfolios | | Value,
end of
period | |
| Wells Fargo Bloomberg Barclays US Aggregate ex-Corporate Portfolio | 1.40% | 1.48% | $ 32,760 | | $ 767 | | $ 52,725 | | $ 0 | | $159 | | $ 8,708,176 | |
| Wells Fargo Emerging Markets Bond Portfolio | 1.85 | 1.94 | (10,675) | | 25,458 | | 16,490 | | 0 | | 1 | | 737,346 | |
| Wells Fargo Factor Enhanced Emerging Markets Equity Portfolio | 3.98 | 4.18 | 369,167 | | (476,674) | | 0 | | 118,945 | | 28 | | 7,743,175 | |
| Wells Fargo Factor Enhanced International Equity Portfolio | 3.46 | 3.43 | 1,811,288 | | 294,127 | | 0 | | 463,164 | | 75 | | 25,222,911 | |
| Wells Fargo Factor Enhanced U.S. Large Cap Equity Portfolio | 4.69 | 4.71 | 5,648,303 | | 1,073,865 | | 0 | | 277,152 | | 163 | | 40,205,763 | |
| Wells Fargo Factor Enhanced U.S. Small Cap Equity Portfolio | 4.46 | 4.52 | 1,929,629 | | (1,429,690) | | 0 | | 51,367 | | 50 | | 10,020,359 | |
| Wells Fargo High Yield Corporate Bond Portfolio | 1.38 | 1.45 | 7,802 | | 300 | | 18,429 | | 0 | | 2 | | 735,733 | |
| Wells Fargo Investment Grade Corporate Bond Portfolio | 1.86 | 1.94 | 52,419 | | 2,525 | | 66,854 | | 0 | | 4 | | 4,523,640 | |
| | | | $9,840,693 | | $ (509,322) | | $154,498 | | $910,628 | | $482 | | $97,897,103 | |
The accompanying notes are an integral part of these financial statements.
Target Date Retirement Funds | 47
Portfolio of investments—August 31, 2021 (unaudited)
| | | | | | Value |
| Investment companies: 100.02% | | | | | |
| Affiliated master portfolios: 100.02% | | | | | |
| Wells Fargo Bloomberg Barclays US Aggregate ex-Corporate Portfolio | | | | | $ 13,294,629 |
| Wells Fargo Emerging Markets Bond Portfolio | | | | | 1,125,760 |
| Wells Fargo Factor Enhanced Emerging Markets Equity Portfolio | | | | | 18,783,063 |
| Wells Fargo Factor Enhanced International Equity Portfolio | | | | | 61,096,006 |
| Wells Fargo Factor Enhanced U.S. Large Cap Equity Portfolio | | | | | 95,084,511 |
| Wells Fargo Factor Enhanced U.S. Small Cap Equity Portfolio | | | | | 23,696,801 |
| Wells Fargo High Yield Corporate Bond Portfolio | | | | | 1,123,308 |
| Wells Fargo Investment Grade Corporate Bond Portfolio | | | | | 6,906,607 |
| Total Investment companies (Cost $182,015,804) | | | | | 221,110,685 |
| Total investments in securities (Cost $182,015,804) | 100.02% | | | | 221,110,685 |
| Other assets and liabilities, net | (0.02) | | | | (48,604) |
| Total net assets | 100.00% | | | | $221,062,081 |
Transactions with the affiliated Master Portfolios were as follows:
| | % of
ownership,
beginning
of period | % of
ownership,
end of
period | Net realized
gains
(losses) on
securities
transactions
allocated
from
affiliated
Master
Portfolios | | Net
change in
unrealized
gains
(losses) on
securities
transactions
allocated
from
affiliated
Master
Portfolios | | Interest
allocated
from
affiliated
Master
Portfolios | | Dividends
allocated
from
affiliated
Master
Portfolios | | Affiliated
income
allocated
from
affiliated
Master
Portfolios | | Value,
end of
period | |
| Wells Fargo Bloomberg Barclays US Aggregate ex-Corporate Portfolio | 2.16% | 2.26% | $ 48,224 | | $ 2,772 | | $ 80,149 | | $ 0 | | $ 241 | | $ 13,294,629 | |
| Wells Fargo Emerging Markets Bond Portfolio | 2.86 | 2.96 | (16,987) | | 40,388 | | 24,994 | | 0 | | 2 | | 1,125,760 | |
| Wells Fargo Factor Enhanced Emerging Markets Equity Portfolio | 10.02 | 10.13 | 920,669 | | (1,116,013) | | 0 | | 287,389 | | 70 | | 18,783,063 | |
| Wells Fargo Factor Enhanced International Equity Portfolio | 8.76 | 8.32 | 4,538,048 | | 675,852 | | 0 | | 1,134,392 | | 184 | | 61,096,006 | |
| Wells Fargo Factor Enhanced U.S. Large Cap Equity Portfolio | 11.60 | 11.13 | 13,876,263 | | 2,312,778 | | 0 | | 657,728 | | 380 | | 95,084,511 | |
| Wells Fargo Factor Enhanced U.S. Small Cap Equity Portfolio | 11.11 | 11.68 | 4,712,216 | | (3,453,333) | | 0 | | 122,343 | | 121 | | 23,696,801 | |
| Wells Fargo High Yield Corporate Bond Portfolio | 2.14 | 2.22 | 11,867 | | 1,188 | | 27,957 | | 0 | | 3 | | 1,123,308 | |
| Wells Fargo Investment Grade Corporate Bond Portfolio | 2.86 | 2.97 | 78,262 | | 2,771 | | 100,572 | | 0 | | 7 | | 6,906,607 | |
| | | | $24,168,562 | | $(1,533,597) | | $233,672 | | $2,201,852 | | $1,008 | | $221,110,685 | |
The accompanying notes are an integral part of these financial statements.
48 | Target Date Retirement Funds
Portfolio of investments—August 31, 2021 (unaudited)
| | | | | | Value |
| Investment companies: 100.08% | | | | | |
| Affiliated master portfolios: 100.08% | | | | | |
| Wells Fargo Bloomberg Barclays US Aggregate ex-Corporate Portfolio | | | | | $ 1,813,430 |
| Wells Fargo Emerging Markets Bond Portfolio | | | | | 153,582 |
| Wells Fargo Factor Enhanced Emerging Markets Equity Portfolio | | | | | 2,586,988 |
| Wells Fargo Factor Enhanced International Equity Portfolio | | | | | 8,453,053 |
| Wells Fargo Factor Enhanced U.S. Large Cap Equity Portfolio | | | | | 13,146,952 |
| Wells Fargo Factor Enhanced U.S. Small Cap Equity Portfolio | | | | | 3,276,504 |
| Wells Fargo High Yield Corporate Bond Portfolio | | | | | 153,296 |
| Wells Fargo Investment Grade Corporate Bond Portfolio | | | | | 942,148 |
| Total Investment companies (Cost $26,682,127) | | | | | 30,525,953 |
| Total investments in securities (Cost $26,682,127) | 100.08% | | | | 30,525,953 |
| Other assets and liabilities, net | (0.08) | | | | (23,786) |
| Total net assets | 100.00% | | | | $30,502,167 |
Transactions with the affiliated Master Portfolios were as follows:
| | % of
ownership,
beginning
of period | % of
ownership,
end of
period | Net realized
gains
(losses) on
securities
transactions
allocated
from
affiliated
Master
Portfolios | | Net
change in
unrealized
gains
(losses) on
securities
transactions
allocated
from
affiliated
Master
Portfolios | | Interest
allocated
from
affiliated
Master
Portfolios | | Dividends
allocated
from
affiliated
Master
Portfolios | | Affiliated
income
allocated
from
affiliated
Master
Portfolios | | Value,
end of
period | |
| Wells Fargo Bloomberg Barclays US Aggregate ex-Corporate Portfolio | 0.28% | 0.31% | $ 7,242 | | $ 880 | | $ 10,701 | | $ 0 | | $ 33 | | $ 1,813,430 | |
| Wells Fargo Emerging Markets Bond Portfolio | 0.37 | 0.43 | (2,138) | | 5,258 | | 3,388 | | 0 | | 0 | | 153,582 | |
| Wells Fargo Factor Enhanced Emerging Markets Equity Portfolio | 1.26 | 1.40 | 122,126 | | (161,679) | | 0 | | 39,632 | | 10 | | 2,586,988 | |
| Wells Fargo Factor Enhanced International Equity Portfolio | 1.10 | 1.15 | 594,277 | | 87,619 | | 0 | | 151,773 | | 26 | | 8,453,053 | |
| Wells Fargo Factor Enhanced U.S. Large Cap Equity Portfolio | 1.45 | 1.54 | 1,795,007 | | 352,019 | | 0 | | 89,512 | | 51 | | 13,146,952 | |
| Wells Fargo Factor Enhanced U.S. Small Cap Equity Portfolio | 1.40 | 1.48 | 627,494 | | (464,785) | | 0 | | 16,684 | | 16 | | 3,276,504 | |
| Wells Fargo High Yield Corporate Bond Portfolio | 0.27 | 0.30 | 1,635 | | 57 | | 3,785 | | 0 | | 0 | | 153,296 | |
| Wells Fargo Investment Grade Corporate Bond Portfolio | 0.37 | 0.40 | 11,152 | | 1,174 | | 13,910 | | 0 | | 1 | | 942,148 | |
| | | | $3,156,795 | | $(179,457) | | $31,784 | | $297,601 | | $137 | | $30,525,953 | |
The accompanying notes are an integral part of these financial statements.
Target Date Retirement Funds | 49
Portfolio of investments—August 31, 2021 (unaudited)
| | | | | | Value |
| Investment companies: 99.93% | | | | | |
| Affiliated master portfolios: 99.93% | | | | | |
| Wells Fargo Bloomberg Barclays US Aggregate ex-Corporate Portfolio | | | | | $ 2,024,914 |
| Wells Fargo Emerging Markets Bond Portfolio | | | | | 171,366 |
| Wells Fargo Factor Enhanced Emerging Markets Equity Portfolio | | | | | 2,884,851 |
| Wells Fargo Factor Enhanced International Equity Portfolio | | | | | 9,501,595 |
| Wells Fargo Factor Enhanced U.S. Large Cap Equity Portfolio | | | | | 14,693,557 |
| Wells Fargo Factor Enhanced U.S. Small Cap Equity Portfolio | | | | | 3,661,997 |
| Wells Fargo High Yield Corporate Bond Portfolio | | | | | 170,990 |
| Wells Fargo Investment Grade Corporate Bond Portfolio | | | | | 1,051,336 |
| Total Investment companies (Cost $29,437,770) | | | | | 34,160,606 |
| Total investments in securities (Cost $29,437,770) | 99.93% | | | | 34,160,606 |
| Other assets and liabilities, net | 0.07 | | | | 25,341 |
| Total net assets | 100.00% | | | | $34,185,947 |
Transactions with the affiliated Master Portfolios were as follows:
| | % of
ownership,
beginning
of period | % of
ownership,
end of
period | Net realized
gains
(losses) on
securities
transactions
allocated
from
affiliated
Master
Portfolios | | Net
change in
unrealized
gains
(losses) on
securities
transactions
allocated
from
affiliated
Master
Portfolios | | Interest
allocated
from
affiliated
Master
Portfolios | | Dividends
allocated
from
affiliated
Master
Portfolios | | Affiliated
income
allocated
from
affiliated
Master
Portfolios | | Value,
end of
period | |
| Wells Fargo Bloomberg Barclays US Aggregate ex-Corporate Portfolio | 0.30% | 0.34% | $ 7,492 | | $ 86,486 | | $ 11,848 | | $ 0 | | $ 36 | | $ 2,024,914 | |
| Wells Fargo Emerging Markets Bond Portfolio | 0.40 | 0.45 | (2,411) | | 13,076 | | 3,693 | | 0 | | 0 | | 171,366 | |
| Wells Fargo Factor Enhanced Emerging Markets Equity Portfolio | 1.37 | 1.56 | 134,896 | | (47,177) | | 0 | | 42,864 | | 11 | | 2,884,851 | |
| Wells Fargo Factor Enhanced International Equity Portfolio | 1.18 | 1.29 | 663,389 | | 465,516 | | 0 | | 165,525 | | 28 | | 9,501,595 | |
| Wells Fargo Factor Enhanced U.S. Large Cap Equity Portfolio | 1.56 | 1.72 | 2,020,565 | | (455,144) | | 0 | | 96,933 | | 56 | | 14,693,557 | |
| Wells Fargo Factor Enhanced U.S. Small Cap Equity Portfolio | 1.50 | 1.65 | 692,734 | | (348,302) | | 0 | | 18,145 | | 18 | | 3,661,997 | |
| Wells Fargo High Yield Corporate Bond Portfolio | 0.30 | 0.34 | 1,739 | | 7,361 | | 4,127 | | 0 | | 0 | | 170,990 | |
| Wells Fargo Investment Grade Corporate Bond Portfolio | 0.40 | 0.45 | 11,896 | | 46,468 | | 14,854 | | 0 | | 0 | | 1,051,336 | |
| | | | $3,530,300 | | $(231,716) | | $34,522 | | $323,467 | | $149 | | $34,160,606 | |
The accompanying notes are an integral part of these financial statements.
50 | Target Date Retirement Funds
Statements of assets and liabilities—August 31, 2021 (unaudited)
| | Target
Today Fund | Target
2010 Fund | Target
2015 Fund |
| Assets | | | |
Investments in affiliated Master Portfolios, at value (see cost below)
| $ 55,299,821 | $ 52,952,724 | $ 51,853,277 |
Receivable for Fund shares sold
| 10,208 | 5,661 | 5,166 |
Receivable from manager
| 8,802 | 8,749 | 8,592 |
Prepaid expenses and other assets
| 55,178 | 66,167 | 8,767 |
Total assets
| 55,374,009 | 53,033,301 | 51,875,802 |
| Liabilities | | | |
Payable for Fund shares redeemed
| 54,359 | 6,006 | 1,880 |
Shareholder report expenses payable
| 19,586 | 11,858 | 12,682 |
Professional fees payable
| 16,747 | 15,398 | 22,717 |
Shareholder servicing fees payable
| 8,878 | 8,408 | 7,594 |
Administration fees payable
| 7,340 | 6,935 | 6,487 |
Trustees’ fees and expenses payable
| 2,188 | 2,180 | 2,189 |
Distribution fees payable
| 199 | 92 | 0 |
Accrued expenses and other liabilities
| 10,372 | 12,727 | 8,506 |
Total liabilities
| 119,669 | 63,604 | 62,055 |
Total net assets
| $55,254,340 | $52,969,697 | $51,813,747 |
| Net assets consist of | | | |
Paid-in capital
| $ 43,505,590 | $ 29,082,835 | $ 36,456,915 |
Total distributable earnings
| 11,748,750 | 23,886,862 | 15,356,832 |
Total net assets
| $55,254,340 | $52,969,697 | $51,813,747 |
| Computation of net asset value and offering price per share | | | |
Net assets – Class A
| $ 34,419,558 | $ 32,119,921 | $ 30,704,335 |
Shares outstanding – Class A1
| 3,558,380 | 2,851,487 | 4,051,687 |
Net asset value per share – Class A
| $9.67 | $11.26 | $7.58 |
Maximum offering price per share – Class A2
| $10.26 | $11.95 | $8.04 |
Net assets – Class C
| $ 307,523 | $ 140,501 | N/A |
Shares outstanding – Class C1
| 30,814 | 12,303 | N/A |
Net asset value per share – Class C
| $9.98 | $11.42 | N/A |
Net assets – Class R
| $ 36,000 | $ 24,842 | $ 21,376 |
Shares outstanding – Class R1
| 3,707 | 2,201 | 2,716 |
Net asset value per share – Class R
| $9.71 | $11.29 | $7.87 |
Net assets – Class R4
| $ 1,093,375 | $ 1,172,389 | $ 1,520,283 |
Shares outstanding – Class R41
| 109,858 | 102,521 | 198,850 |
Net asset value per share – Class R4
| $9.95 | $11.44 | $7.65 |
Net assets – Class R6
| $ 12,969,549 | $ 12,793,840 | $ 15,354,603 |
Shares outstanding – Class R61
| 1,304,328 | 1,121,243 | 2,006,387 |
Net asset value per share – Class R6
| $9.94 | $11.41 | $7.65 |
Net assets – Administrator Class
| $ 6,428,335 | $ 6,718,204 | $ 4,213,150 |
Shares outstanding – Administrator Class1
| 644,878 | 587,211 | 538,466 |
Net asset value per share – Administrator Class
| $9.97 | $11.44 | $7.82 |
Investments in affiliated Master Portfolios, at cost
| $ 46,062,313 | $ 31,372,590 | $ 38,349,418 |
| 1 | Each Fund has an unlimited number of authorized shares |
| 2 | Maximum offering price is computed as 100/94.25 of net asset value. On investments of $50,000 or more, the offering price is reduced. |
The accompanying notes are an integral part of these financial statements.
Target Date Retirement Funds | 51
Statements of assets and liabilities—August 31, 2021 (unaudited)
| | Target
2020 Fund | Target
2025 Fund | Target
2030 Fund |
| Assets | | | |
Investments in affiliated Master Portfolios, at value (see cost below)
| $ 304,549,002 | $ 203,538,288 | $ 502,537,917 |
Receivable for Fund shares sold
| 85,293 | 58,799 | 377,046 |
Receivable from manager
| 2,930 | 7,343 | 6,014 |
Prepaid expenses and other assets
| 28,974 | 93,934 | 55,537 |
Total assets
| 304,666,199 | 203,698,364 | 502,976,514 |
| Liabilities | | | |
Payable for Fund shares redeemed
| 30,237 | 86,029 | 145,227 |
Shareholder report expenses payable
| 14,514 | 15,494 | 15,210 |
Professional fees payable
| 21,956 | 8,604 | 21,113 |
Shareholder servicing fees payable
| 38,198 | 21,481 | 55,326 |
Administration fees payable
| 32,115 | 19,838 | 46,909 |
Trustees’ fees and expenses payable
| 2,293 | 2,293 | 2,278 |
Distribution fees payable
| 1,393 | 13 | 773 |
Accrued expenses and other liabilities
| 21,817 | 16,613 | 22,674 |
Total liabilities
| 162,523 | 170,365 | 309,510 |
Total net assets
| $304,503,676 | $203,527,999 | $502,667,004 |
| Net assets consist of | | | |
Paid-in capital
| $ 225,624,006 | $ 160,001,282 | $ 371,588,706 |
Total distributable earnings
| 78,879,670 | 43,526,717 | 131,078,298 |
Total net assets
| $304,503,676 | $203,527,999 | $502,667,004 |
| Computation of net asset value and offering price per share | | | |
Net assets – Class A
| $ 128,741,796 | $ 86,881,210 | $ 167,657,336 |
Shares outstanding – Class A1
| 9,685,078 | 14,103,666 | 11,660,646 |
Net asset value per share – Class A
| $13.29 | $6.16 | $14.38 |
Maximum offering price per share – Class A2
| $14.10 | $6.54 | $15.26 |
Net assets – Class C
| $ 2,106,744 | N/A | $ 1,190,331 |
Shares outstanding – Class C1
| 162,457 | N/A | 87,016 |
Net asset value per share – Class C
| $12.97 | N/A | $13.68 |
Net assets – Class R
| $ 122,344 | $ 78,726 | $ 54,687 |
Shares outstanding – Class R1
| 9,282 | 12,923 | 3,777 |
Net asset value per share – Class R
| $13.18 | $6.09 | $14.48 |
Net assets – Class R4
| $ 17,116,283 | $ 13,299,965 | $ 32,465,949 |
Shares outstanding – Class R41
| 1,244,136 | 2,135,074 | 2,195,524 |
Net asset value per share – Class R4
| $13.76 | $6.23 | $14.79 |
Net assets – Class R6
| $ 115,577,114 | $ 94,839,834 | $ 226,136,190 |
Shares outstanding – Class R61
| 8,398,853 | 15,256,651 | 15,311,292 |
Net asset value per share – Class R6
| $13.76 | $6.22 | $14.77 |
Net assets – Administrator Class
| $ 40,839,395 | $ 8,428,264 | $ 75,162,511 |
Shares outstanding – Administrator Class1
| 2,993,402 | 1,342,817 | 5,087,428 |
Net asset value per share – Administrator Class
| $13.64 | $6.28 | $14.77 |
Investments in affiliated Master Portfolios, at cost
| $ 245,965,733 | $ 172,778,673 | $ 421,623,172 |
| 1 | Each Fund has an unlimited number of authorized shares |
| 2 | Maximum offering price is computed as 100/94.25 of net asset value. On investments of $50,000 or more, the offering price is reduced. |
The accompanying notes are an integral part of these financial statements.
52 | Target Date Retirement Funds
Statements of assets and liabilities—August 31, 2021 (unaudited)
| | Target
2035 Fund | Target
2040 Fund | Target
2045 Fund |
| Assets | | | |
Investments in affiliated Master Portfolios, at value (see cost below)
| $ 212,412,107 | $ 483,443,813 | $ 97,897,103 |
Receivable for Fund shares sold
| 65,554 | 227,472 | 27,039 |
Receivable from manager
| 7,960 | 10,304 | 9,799 |
Prepaid expenses and other assets
| 13,914 | 77,282 | 13,480 |
Total assets
| 212,499,535 | 483,758,871 | 97,947,421 |
| Liabilities | | | |
Payable for Fund shares redeemed
| 8,336 | 142,492 | 9,494 |
Shareholder report expenses payable
| 14,697 | 15,001 | 19,251 |
Professional fees payable
| 20,740 | 19,134 | 20,845 |
Shareholder servicing fees payable
| 23,733 | 57,404 | 9,823 |
Administration fees payable
| 21,889 | 48,653 | 9,331 |
Trustees’ fees and expenses payable
| 2,287 | 2,365 | 2,535 |
Distribution fees payable
| 109 | 803 | 12 |
Accrued expenses and other liabilities
| 14,976 | 16,711 | 9,537 |
Total liabilities
| 106,767 | 302,563 | 80,828 |
Total net assets
| $212,392,768 | $483,456,308 | $97,866,593 |
| Net assets consist of | | | |
Paid-in capital
| $ 157,848,205 | $ 340,151,471 | $ 69,946,257 |
Total distributable earnings
| 54,544,563 | 143,304,837 | 27,920,336 |
Total net assets
| $212,392,768 | $483,456,308 | $97,866,593 |
| Computation of net asset value and offering price per share | | | |
Net assets – Class A
| $ 102,148,791 | $ 192,854,021 | $ 41,373,739 |
Shares outstanding – Class A1
| 11,391,554 | 10,819,415 | 4,071,679 |
Net asset value per share – Class A
| $8.97 | $17.82 | $10.16 |
Maximum offering price per share – Class A2
| $9.52 | $18.91 | $10.78 |
Net assets – Class C
| N/A | $ 1,263,327 | N/A |
Shares outstanding – Class C1
| N/A | 79,748 | N/A |
Net asset value per share – Class C
| N/A | $15.84 | N/A |
Net assets – Class R
| $ 539,291 | $ 95,022 | $ 84,215 |
Shares outstanding – Class R1
| 59,704 | 5,318 | 8,088 |
Net asset value per share – Class R
| $9.03 | $17.87 | $10.41 |
Net assets – Class R4
| $ 10,388,876 | $ 30,673,254 | $ 4,964,893 |
Shares outstanding – Class R41
| 1,152,931 | 1,652,457 | 485,074 |
Net asset value per share – Class R4
| $9.01 | $18.56 | $10.24 |
Net assets – Class R6
| $ 93,870,538 | $ 194,328,956 | $ 49,355,305 |
Shares outstanding – Class R61
| 10,422,582 | 10,472,264 | 4,836,163 |
Net asset value per share – Class R6
| $9.01 | $18.56 | $10.21 |
Net assets – Administrator Class
| $ 5,445,272 | $ 64,241,728 | $ 2,088,441 |
Shares outstanding – Administrator Class1
| 598,930 | 3,473,205 | 201,569 |
Net asset value per share – Administrator Class
| $9.09 | $18.50 | $10.36 |
Investments in affiliated Master Portfolios, at cost
| $ 181,052,796 | $ 402,088,837 | $ 82,340,699 |
| 1 | Each Fund has an unlimited number of authorized shares |
| 2 | Maximum offering price is computed as 100/94.25 of net asset value. On investments of $50,000 or more, the offering price is reduced. |
The accompanying notes are an integral part of these financial statements.
Target Date Retirement Funds | 53
Statements of assets and liabilities—August 31, 2021 (unaudited)
| | Target
2050 Fund | Target
2055 Fund | Target
2060 Fund |
| Assets | | | |
Investments in affiliated Master Portfolios, at value (see cost below)
| $ 221,110,685 | $ 30,525,953 | $ 34,160,606 |
Receivable for Fund shares sold
| 148,069 | 26,011 | 28,116 |
Receivable from manager
| 10,878 | 8,668 | 9,018 |
Prepaid expenses and other assets
| 51,701 | 1,824 | 28,581 |
Total assets
| 221,321,333 | 30,562,456 | 34,226,321 |
| Liabilities | | | |
Payable for Fund shares redeemed
| 174,287 | 14,029 | 4,445 |
Shareholder report expenses payable
| 15,491 | 14,565 | 9,779 |
Professional fees payable
| 22,486 | 21,288 | 16,727 |
Shareholder servicing fees payable
| 19,664 | 1,904 | 1,464 |
Administration fees payable
| 16,889 | 2,043 | 1,577 |
Trustees’ fees and expenses payable
| 1,790 | 861 | 1,273 |
Distribution fees payable
| 377 | 7 | 100 |
Accrued expenses and other liabilities
| 8,268 | 5,592 | 5,009 |
Total liabilities
| 259,252 | 60,289 | 40,374 |
Total net assets
| $221,062,081 | $30,502,167 | $34,185,947 |
| Net assets consist of | | | |
Paid-in capital
| $ 150,802,618 | $ 22,835,676 | $ 24,926,262 |
Total distributable earnings
| 70,259,463 | 7,666,491 | 9,259,685 |
Total net assets
| $221,062,081 | $30,502,167 | $34,185,947 |
| Computation of net asset value and offering price per share | | | |
Net assets – Class A
| $ 47,478,073 | $ 6,147,185 | $ 1,290,307 |
Shares outstanding – Class A1
| 5,293,385 | 393,465 | 83,036 |
Net asset value per share – Class A
| $8.97 | $15.62 | $15.54 |
Maximum offering price per share – Class A2
| $9.52 | $16.57 | $16.49 |
Net assets – Class C
| $ 598,003 | N/A | $ 154,894 |
Shares outstanding – Class C1
| 67,286 | N/A | 9,919 |
Net asset value per share – Class C
| $8.89 | N/A | $15.62 |
Net assets – Class R
| $ 65,221 | $ 64,825 | $ 128,931 |
Shares outstanding – Class R1
| 7,199 | 4,210 | 8,404 |
Net asset value per share – Class R
| $9.06 | $15.40 | $15.34 |
Net assets – Class R4
| $ 15,016,718 | $ 2,667,462 | $ 3,043,590 |
Shares outstanding – Class R41
| 1,657,767 | 169,629 | 191,559 |
Net asset value per share – Class R4
| $9.06 | $15.73 | $15.89 |
Net assets – Class R6
| $ 119,740,121 | $ 20,658,768 | $ 25,426,491 |
Shares outstanding – Class R61
| 13,228,805 | 1,318,382 | 1,605,721 |
Net asset value per share – Class R6
| $9.05 | $15.67 | $15.83 |
Net assets – Administrator Class
| $ 38,163,945 | $ 963,927 | $ 4,141,734 |
Shares outstanding – Administrator Class1
| 4,235,008 | 61,236 | 265,077 |
Net asset value per share – Administrator Class
| $9.01 | $15.74 | $15.62 |
Investments in affiliated Master Portfolios, at cost
| $ 182,015,804 | $ 26,682,127 | $ 29,437,770 |
| 1 | Each Fund has an unlimited number of authorized shares |
| 2 | Maximum offering price is computed as 100/94.25 of net asset value. On investments of $50,000 or more, the offering price is reduced. |
The accompanying notes are an integral part of these financial statements.
54 | Target Date Retirement Funds
Statements of operations—six months ended August 31, 2021 (unaudited)
| | Target
Today Fund | Target
2010 Fund | Target
2015 Fund |
| Investment income | | | |
Interest allocated from affiliated Master Portfolios
| $ 480,888 | $ 459,199 | $ 416,270 |
Dividends allocated from affiliated Master Portfolios*
| 180,758 | 172,427 | 198,817 |
Affiliated income allocated from affiliated Master Portfolios
| 444 | 424 | 399 |
Expenses allocated from affiliated Master Portfolios
| (46,791) | (44,668) | (44,087) |
Waivers allocated from affiliated Master Portfolios
| 20,913 | 19,957 | 19,217 |
Total investment income
| 636,212 | 607,339 | 590,616 |
| Expenses | | | |
Management fee
| 28,401 | 27,110 | 26,458 |
| Administration fees | | | |
Class A
| 36,581 | 34,764 | 32,754 |
Class C
| 334 | 189 | N/A |
Class R
| 37 | 26 | 22 |
Class R4
| 469 | 454 | 793 |
Class R6
| 2,070 | 1,958 | 2,288 |
Administrator Class
| 4,315 | 4,368 | 2,902 |
| Shareholder servicing fees | | | |
Class A
| 43,548 | 41,386 | 38,988 |
Class C
| 391 | 224 | N/A |
Class R
| 43 | 31 | 26 |
Class R4
| 575 | 567 | 988 |
Administrator Class
| 8,294 | 8,384 | 5,573 |
| Distribution fees | | | |
Class C
| 1,172 | 621 | N/A |
Class R
| 17 | 4 | 3 |
Custody and accounting fees
| 1,798 | 1,616 | 1,694 |
Professional fees
| 13,498 | 14,685 | 14,343 |
Registration fees
| 31,423 | 32,675 | 30,660 |
Shareholder report expenses
| 5,701 | 5,692 | 5,049 |
Trustees’ fees and expenses
| 9,715 | 9,715 | 9,715 |
Other fees and expenses
| 2,402 | 2,846 | 1,904 |
Total expenses
| 190,784 | 187,315 | 174,160 |
| Less: Fee waivers and/or expense reimbursements | | | |
Fund-level
| (40,845) | (40,416) | (41,670) |
Class A
| (34,316) | (35,458) | (34,216) |
Class C
| (274) | (125) | N/A |
Class R4
| (1,044) | (1,021) | (1,781) |
Class R6
| (2,070) | (1,958) | (2,288) |
Administrator Class
| (7,128) | (7,774) | (4,990) |
Net expenses
| 105,107 | 100,563 | 89,215 |
Net investment income
| 531,105 | 506,776 | 501,401 |
| Realized and unrealized gains (losses) on investments | | | |
Net realized gains on securities transactions allocated from affiliated Master Portfolios
| 2,038,620 | 1,936,277 | 2,238,768 |
Net change in unrealized gains (losses) on securities transactions allocated from affiliated Master Portfolios
| 539,345 | 503,586 | 427,045 |
Net realized and unrealized gains (losses) on investments
| 2,577,965 | 2,439,863 | 2,665,813 |
Net increase in net assets resulting from operations
| $3,109,070 | $2,946,639 | $3,167,214 |
*Net of foreign dividend withholding taxes allocated from affiliated Master Portfolios in the amount of
| $9,997 | $9,553 | $11,519 |
The accompanying notes are an integral part of these financial statements.
Target Date Retirement Funds | 55
Statements of operations—six months ended August 31, 2021 (unaudited)
| | Target
2020 Fund | Target
2025 Fund | Target
2030 Fund |
| Investment income | | | |
Interest allocated from affiliated Master Portfolios
| $ 2,242,722 | $ 1,169,349 | $ 2,196,715 |
Dividends allocated from affiliated Master Portfolios*
| 1,336,617 | 1,097,569 | 3,263,335 |
Affiliated income allocated from affiliated Master Portfolios
| 2,234 | 1,428 | 3,372 |
Expenses allocated from affiliated Master Portfolios
| (259,941) | (173,142) | (428,907) |
Waivers allocated from affiliated Master Portfolios
| 110,488 | 68,648 | 154,732 |
Total investment income
| 3,432,120 | 2,163,852 | 5,189,247 |
| Expenses | | | |
Management fee
| 154,552 | 101,557 | 251,449 |
| Administration fees | | | |
Class A
| 136,408 | 93,421 | 180,882 |
Class C
| 2,596 | N/A | 1,429 |
Class R
| 120 | 76 | 57 |
Class R4
| 6,592 | 5,579 | 12,344 |
Class R6
| 17,576 | 13,644 | 33,354 |
Administrator Class
| 27,920 | 5,953 | 49,398 |
| Shareholder servicing fees | | | |
Class A
| 162,320 | 111,167 | 215,335 |
Class C
| 3,090 | N/A | 1,698 |
Class R
| 142 | 91 | 67 |
Class R4
| 8,222 | 6,934 | 15,395 |
Administrator Class
| 53,511 | 11,449 | 94,834 |
| Distribution fees | | | |
Class C
| 9,271 | N/A | 5,096 |
Class R
| 115 | 73 | 41 |
Custody and accounting fees
| 3,395 | 2,956 | 4,524 |
Professional fees
| 14,345 | 15,409 | 14,364 |
Registration fees
| 30,048 | 28,899 | 27,653 |
Shareholder report expenses
| 6,572 | 4,940 | 5,700 |
Trustees’ fees and expenses
| 9,715 | 9,715 | 9,715 |
Other fees and expenses
| 2,220 | 3,472 | 1,881 |
Total expenses
| 648,730 | 415,335 | 925,216 |
| Less: Fee waivers and/or expense reimbursements | | | |
Fund-level
| (145,210) | (113,966) | (128,435) |
Class A
| (17,283) | (22,714) | (80,895) |
Class C
| (107) | N/A | (515) |
Class R4
| (3,210) | (3,951) | (16,600) |
Class R6
| (17,576) | (13,644) | (33,354) |
Administrator Class
| (8,231) | (2,631) | (40,771) |
Net expenses
| 457,113 | 258,429 | 624,646 |
Net investment income
| 2,975,007 | 1,905,423 | 4,564,601 |
| Realized and unrealized gains (losses) on investments | | | |
Net realized gains on securities transactions allocated from affiliated Master Portfolios
| 15,049,069 | 12,411,827 | 37,371,879 |
Net change in unrealized gains (losses) on securities transactions allocated from affiliated Master Portfolios
| 2,224,317 | 764,270 | (373,175) |
Net realized and unrealized gains (losses) on investments
| 17,273,386 | 13,176,097 | 36,998,704 |
Net increase in net assets resulting from operations
| $20,248,393 | $15,081,520 | $41,563,305 |
*Net of foreign dividend withholding taxes allocated from affiliated Master Portfolios in the amount of
| $80,155 | $72,402 | $234,286 |
The accompanying notes are an integral part of these financial statements.
56 | Target Date Retirement Funds
Statements of operations—six months ended August 31, 2021 (unaudited)
| | Target
2035 Fund | Target
2040 Fund | Target
2045 Fund |
| Investment income | | | |
Interest allocated from affiliated Master Portfolios
| $ 661,946 | $ 1,021,637 | $ 154,498 |
Dividends allocated from affiliated Master Portfolios*
| 1,577,409 | 4,223,118 | 910,628 |
Affiliated income allocated from affiliated Master Portfolios
| 1,267 | 2,567 | 482 |
Expenses allocated from affiliated Master Portfolios
| (178,342) | (432,800) | (89,327) |
Waivers allocated from affiliated Master Portfolios
| 59,077 | 141,528 | 28,997 |
Total investment income
| 2,121,357 | 4,956,050 | 1,005,278 |
| Expenses | | | |
Management fee
| 103,631 | 240,299 | 48,535 |
| Administration fees | | | |
Class A
| 106,236 | 203,381 | 44,470 |
Class C
| N/A | 1,362 | N/A |
Class R
| 534 | 94 | 80 |
Class R4
| 3,968 | 11,856 | 1,910 |
Class R6
| 13,485 | 28,904 | 7,108 |
Administrator Class
| 3,742 | 41,067 | 1,613 |
| Shareholder servicing fees | | | |
Class A
| 126,464 | 242,121 | 52,940 |
Class C
| N/A | 1,619 | N/A |
Class R
| 635 | 112 | 95 |
Class R4
| 4,945 | 14,773 | 2,377 |
Administrator Class
| 7,185 | 78,832 | 3,096 |
| Distribution fees | | | |
Class C
| N/A | 4,845 | N/A |
Class R
| 611 | 84 | 69 |
Custody and accounting fees
| 2,257 | 3,950 | 1,843 |
Professional fees
| 14,388 | 14,249 | 14,216 |
Registration fees
| 26,667 | 27,324 | 26,350 |
Shareholder report expenses
| 5,700 | 5,700 | 4,565 |
Trustees’ fees and expenses
| 9,715 | 9,715 | 9,715 |
Other fees and expenses
| 1,819 | 1,956 | 1,775 |
Total expenses
| 431,982 | 932,243 | 220,757 |
| Less: Fee waivers and/or expense reimbursements | | | |
Fund-level
| (118,701) | (238,408) | (73,368) |
Class A
| (28,695) | (23,351) | (26,188) |
Class C
| N/A | (76) | N/A |
Class R
| (57) | 0 | (11) |
Class R4
| (3,134) | (6,436) | (3,207) |
Class R6
| (13,485) | (28,904) | (7,108) |
Administrator Class
| (1,828) | (13,648) | (1,675) |
Net expenses
| 266,082 | 621,420 | 109,200 |
Net investment income
| 1,855,275 | 4,334,630 | 896,078 |
| Realized and unrealized gains (losses) on investments | | | |
Net realized gains on securities transactions allocated from affiliated Master Portfolios
| 17,611,231 | 46,994,195 | 9,840,693 |
Net change in unrealized gains (losses) on securities transactions allocated from affiliated Master Portfolios
| (683,061) | (2,662,912) | (509,322) |
Net realized and unrealized gains (losses) on investments
| 16,928,170 | 44,331,283 | 9,331,371 |
Net increase in net assets resulting from operations
| $18,783,445 | $48,665,913 | $10,227,449 |
*Net of foreign dividend withholding taxes allocated from affiliated Master Portfolios in the amount of
| $119,097 | $325,088 | $70,392 |
The accompanying notes are an integral part of these financial statements.
Target Date Retirement Funds | 57
Statements of operations—six months ended August 31, 2021 (unaudited)
| | Target
2050 Fund | Target
2055 Fund | Target
2060 Fund |
| Investment income | | | |
Interest allocated from affiliated Master Portfolios
| $ 233,672 | $ 31,784 | $ 34,522 |
Dividends allocated from affiliated Master Portfolios*
| 2,201,852 | 297,601 | 323,467 |
Affiliated income allocated from affiliated Master Portfolios
| 1,008 | 137 | 149 |
Expenses allocated from affiliated Master Portfolios
| (207,539) | (28,164) | (30,637) |
Waivers allocated from affiliated Master Portfolios
| 67,047 | 9,095 | 9,900 |
Total investment income
| 2,296,040 | 310,453 | 337,401 |
| Expenses | | | |
Management fee
| 110,254 | 14,927 | 16,225 |
| Administration fees | | | |
Class A
| 51,598 | 7,359 | 1,418 |
Class C
| 624 | N/A | 154 |
Class R
| 61 | 63 | 122 |
Class R4
| 5,780 | 981 | 1,161 |
Class R6
| 17,769 | 2,912 | 3,585 |
Administrator Class
| 24,573 | 600 | 2,621 |
| Shareholder servicing fees | | | |
Class A
| 61,381 | 8,761 | 1,688 |
Class C
| 719 | N/A | 182 |
Class R
| 72 | 74 | 145 |
Class R4
| 7,212 | 1,222 | 1,449 |
Administrator Class
| 47,207 | 1,153 | 5,039 |
| Distribution fees | | | |
Class C
| 2,119 | N/A | 476 |
Class R
| 48 | 42 | 117 |
Custody and accounting fees
| 2,098 | 1,285 | 900 |
Professional fees
| 14,277 | 12,109 | 12,032 |
Registration fees
| 27,009 | 23,680 | 23,680 |
Shareholder report expenses
| 4,483 | 4,903 | 5,700 |
Trustees’ fees and expenses
| 9,715 | 9,715 | 9,715 |
Other fees and expenses
| 1,911 | 1,422 | 1,426 |
Total expenses
| 388,910 | 91,208 | 87,835 |
| Less: Fee waivers and/or expense reimbursements | | | |
Fund-level
| (134,788) | (51,164) | (57,211) |
Class A
| (14,226) | (12,857) | (2,198) |
Class C
| 0 | N/A | (169) |
Class R
| 0 | (71) | (157) |
Class R4
| (5,144) | (2,202) | (2,610) |
Class R6
| (17,769) | (2,912) | (3,585) |
Administrator Class
| (13,429) | (1,753) | (7,085) |
Net expenses
| 203,554 | 20,249 | 14,820 |
Net investment income
| 2,092,486 | 290,204 | 322,581 |
| Realized and unrealized gains (losses) on investments | | | |
Net realized gains on securities transactions allocated from affiliated Master Portfolios
| 24,168,562 | 3,156,795 | 3,530,300 |
Net change in unrealized gains (losses) on securities transactions allocated from affiliated Master Portfolios
| (1,533,597) | (179,457) | (231,716) |
Net realized and unrealized gains (losses) on investments
| 22,634,965 | 2,977,338 | 3,298,584 |
Net increase in net assets resulting from operations
| $24,727,451 | $3,267,542 | $3,621,165 |
*Net of foreign dividend withholding taxes allocated from affiliated Master Portfolios in the amount of
| $172,375 | $23,044 | $25,219 |
The accompanying notes are an integral part of these financial statements.
58 | Target Date Retirement Funds
Statements of changes in net assets
| | Target Today Fund |
| | Six months ended
August 31, 2021
(unaudited) | Year ended
February 28, 2021 |
| Operations | | | | |
Net investment income
| | $ 531,105 | | $ 1,085,739 |
Payment from affiliate
| | 0 | | 232 |
Net realized gains on investments
| | 2,038,620 | | 2,102,013 |
Net change in unrealized gains (losses) on investments
| | 539,345 | | 1,300,351 |
Net increase in net assets resulting from operations
| | 3,109,070 | | 4,488,335 |
| Distributions to shareholders from | | | | |
| Net investment income and net realized gains | | | | |
Class A
| | (236,578) | | (1,849,673) |
Class C
| | (892) | | (17,442) |
Class R
| | (191) | | (1,633) |
Class R4
| | (9,473) | | (67,469) |
Class R6
| | (112,369) | | (932,804) |
Administrator Class
| | (46,805) | | (365,962) |
Total distributions to shareholders
| | (406,308) | | (3,234,983) |
| Capital share transactions | Shares | | Shares | |
| Proceeds from shares sold | | | | |
Class A
| 50,856 | 473,952 | 80,722 | 735,729 |
Class C
| 62 | 600 | 1,821 | 15,854 |
Class R
| 127 | 1,216 | 224 | 2,008 |
Class R4
| 17,979 | 170,758 | 44,218 | 417,849 |
Class R6
| 113,188 | 1,097,408 | 742,714 | 6,935,641 |
Administrator Class
| 44,889 | 437,218 | 125,247 | 1,166,411 |
| | | 2,181,152 | | 9,273,492 |
| Reinvestment of distributions | | | | |
Class A
| 24,705 | 234,450 | 200,944 | 1,835,937 |
Class C
| 91 | 892 | 1,837 | 17,346 |
Class R
| 6 | 56 | 48 | 445 |
Class R4
| 971 | 9,473 | 7,259 | 67,469 |
Class R6
| 11,525 | 112,369 | 99,593 | 932,804 |
Administrator Class
| 4,786 | 46,805 | 38,905 | 365,962 |
| | | 404,045 | | 3,219,963 |
| Payment for shares redeemed | | | | |
Class A
| (286,383) | (2,704,643) | (592,910) | (5,333,233) |
Class C
| (9,301) | (88,954) | (20,524) | (195,874) |
Class R
| (1) | (6) | (100) | (905) |
Class R4
| (19,448) | (190,964) | (203,299) | (1,914,307) |
Class R6
| (489,321) | (4,745,505) | (1,034,292) | (9,695,447) |
Administrator Class
| (117,883) | (1,148,454) | (207,110) | (1,928,847) |
| | | (8,878,526) | | (19,068,613) |
Net decrease in net assets resulting from capital share transactions
| | (6,293,329) | | (6,575,158) |
Total decrease in net assets
| | (3,590,567) | | (5,321,806) |
| Net assets | | | | |
Beginning of period
| | 58,844,907 | | 64,166,713 |
End of period
| | $55,254,340 | | $ 58,844,907 |
The accompanying notes are an integral part of these financial statements.
Target Date Retirement Funds | 59
Statements of changes in net assets
| | Target 2010 Fund |
| | Six months ended
August 31, 2021
(unaudited) | Year ended
February 28, 2021 |
| Operations | | | | |
Net investment income
| | $ 506,776 | | $ 972,168 |
Payment from affiliate
| | 0 | | 230 |
Net realized gains on investments
| | 1,936,277 | | 2,195,529 |
Net change in unrealized gains (losses) on investments
| | 503,586 | | 1,196,047 |
Net increase in net assets resulting from operations
| | 2,946,639 | | 4,363,974 |
| Distributions to shareholders from | | | | |
| Net investment income and net realized gains | | | | |
Class A
| | (218,035) | | (1,907,402) |
Class C
| | (673) | | (10,031) |
Class R
| | (126) | | (1,343) |
Class R4
| | (8,739) | | (55,548) |
Class R6
| | (108,149) | | (896,186) |
Administrator Class
| | (46,165) | | (419,295) |
Total distributions to shareholders
| | (381,887) | | (3,289,805) |
| Capital share transactions | Shares | | Shares | |
| Proceeds from shares sold | | | | |
Class A
| 49,988 | 546,472 | 43,940 | 471,541 |
Class C
| 1,819 | 20,458 | 0 | 0 |
Class R4
| 7,638 | 84,789 | 37,514 | 408,231 |
Class R6
| 95,962 | 1,059,980 | 426,086 | 4,446,780 |
Administrator Class
| 35,523 | 398,645 | 193,123 | 2,096,991 |
| | | 2,110,344 | | 7,423,543 |
| Reinvestment of distributions | | | | |
Class A
| 19,629 | 217,099 | 178,092 | 1,897,873 |
Class C
| 60 | 673 | 927 | 10,031 |
Class R4
| 779 | 8,739 | 5,153 | 55,548 |
Class R6
| 9,632 | 107,788 | 82,981 | 893,979 |
Administrator Class
| 4,111 | 46,165 | 38,810 | 419,295 |
| | | 380,464 | | 3,276,726 |
| Payment for shares redeemed | | | | |
Class A
| (232,033) | (2,577,513) | (383,736) | (4,024,830) |
Class C
| (6,367) | (71,858) | (38,108) | (400,749) |
Class R4
| (4,435) | (49,044) | (52,091) | (549,438) |
Class R6
| (214,902) | (2,388,800) | (601,407) | (6,480,246) |
Administrator Class
| (69,217) | (770,781) | (393,437) | (4,266,839) |
| | | (5,857,996) | | (15,722,102) |
Net decrease in net assets resulting from capital share transactions
| | (3,367,188) | | (5,021,833) |
Total decrease in net assets
| | (802,436) | | (3,947,664) |
| Net assets | | | | |
Beginning of period
| | 53,772,133 | | 57,719,797 |
End of period
| | $52,969,697 | | $ 53,772,133 |
The accompanying notes are an integral part of these financial statements.
60 | Target Date Retirement Funds
Statements of changes in net assets
| | Target 2015 Fund |
| | Six months ended
August 31, 2021
(unaudited) | Year ended
February 28, 2021 |
| Operations | | | | |
Net investment income
| | $ 501,401 | | $ 1,027,552 |
Payment from affiliate
| | 0 | | 235 |
Net realized gains on investments
| | 2,238,768 | | 3,155,707 |
Net change in unrealized gains (losses) on investments
| | 427,045 | | 879,010 |
Net increase in net assets resulting from operations
| | 3,167,214 | | 5,062,504 |
| Distributions to shareholders from | | | | |
| Net investment income and net realized gains | | | | |
Class A
| | (205,442) | | (2,710,492) |
Class R
| | (104) | | (1,668) |
Class R4
| | (14,257) | | (235,612) |
Class R6
| | (129,744) | | (1,543,540) |
Administrator Class
| | (30,631) | | (400,404) |
Total distributions to shareholders
| | (380,178) | | (4,891,716) |
| Capital share transactions | Shares | | Shares | |
| Proceeds from shares sold | | | | |
Class A
| 24,360 | 180,695 | 100,048 | 720,560 |
Class R4
| 10,930 | 81,610 | 33,290 | 238,770 |
Class R6
| 103,952 | 775,099 | 373,588 | 2,636,879 |
Administrator Class
| 17,053 | 130,444 | 44,452 | 334,888 |
| | | 1,167,848 | | 3,931,097 |
| Reinvestment of distributions | | | | |
Class A
| 27,732 | 204,740 | 378,591 | 2,701,744 |
Class R4
| 1,922 | 14,257 | 32,931 | 235,612 |
Class R6
| 17,439 | 129,676 | 214,422 | 1,543,257 |
Administrator Class
| 4,022 | 30,631 | 54,416 | 400,404 |
| | | 379,304 | | 4,881,017 |
| Payment for shares redeemed | | | | |
Class A
| (382,718) | (2,820,124) | (649,422) | (4,686,312) |
Class R4
| (173,269) | (1,281,885) | (515,654) | (3,615,358) |
Class R6
| (136,910) | (1,025,746) | (1,153,795) | (8,348,308) |
Administrator Class
| (98,356) | (752,414) | (207,165) | (1,565,630) |
| | | (5,880,169) | | (18,215,608) |
Net decrease in net assets resulting from capital share transactions
| | (4,333,017) | | (9,403,494) |
Total decrease in net assets
| | (1,545,981) | | (9,232,706) |
| Net assets | | | | |
Beginning of period
| | 53,359,728 | | 62,592,434 |
End of period
| | $51,813,747 | | $ 53,359,728 |
The accompanying notes are an integral part of these financial statements.
Target Date Retirement Funds | 61
Statements of changes in net assets
| | Target 2020 Fund |
| | Six months ended
August 31, 2021
(unaudited) | Year ended
February 28, 2021 |
| Operations | | | | |
Net investment income
| | $ 2,975,007 | | $ 5,900,890 |
Payment from affiliate
| | 0 | | 1,288 |
Net realized gains on investments
| | 15,049,069 | | 14,655,254 |
Net change in unrealized gains (losses) on investments
| | 2,224,317 | | 12,245,584 |
Net increase in net assets resulting from operations
| | 20,248,393 | | 32,803,016 |
| Distributions to shareholders from | | | | |
| Net investment income and net realized gains | | | | |
Class A
| | 0 | | (8,140,622) |
Class C
| | 0 | | (150,450) |
Class R
| | 0 | | (6,055) |
Class R4
| | 0 | | (1,006,480) |
Class R6
| | 0 | | (8,882,310) |
Administrator Class
| | 0 | | (2,778,219) |
Total distributions to shareholders
| | 0 | | (20,964,136) |
| Capital share transactions | Shares | | Shares | |
| Proceeds from shares sold | | | | |
Class A
| 139,972 | 1,799,777 | 346,184 | 4,246,783 |
Class C
| 11,657 | 146,110 | 26,560 | 315,298 |
Class R
| 864 | 11,099 | 1,878 | 22,489 |
Class R4
| 141,415 | 1,883,392 | 210,197 | 2,598,110 |
Class R6
| 537,632 | 7,115,511 | 1,906,240 | 23,510,008 |
Administrator Class
| 87,709 | 1,154,335 | 511,984 | 6,343,899 |
| | | 12,110,224 | | 37,036,587 |
| Reinvestment of distributions | | | | |
Class A
| 0 | 0 | 642,857 | 8,013,839 |
Class C
| 0 | 0 | 12,341 | 150,199 |
Class R
| 0 | 0 | 368 | 4,544 |
Class R4
| 0 | 0 | 78,075 | 1,006,480 |
Class R6
| 0 | 0 | 688,993 | 8,877,675 |
Administrator Class
| 0 | 0 | 217,231 | 2,777,301 |
| | | 0 | | 20,830,038 |
| Payment for shares redeemed | | | | |
Class A
| (671,432) | (8,681,323) | (1,850,190) | (22,034,120) |
Class C
| (63,022) | (800,414) | (62,035) | (740,133) |
Class R
| (13) | (166) | (3,871) | (46,873) |
Class R4
| (98,446) | (1,308,887) | (1,606,962) | (19,423,550) |
Class R6
| (1,574,196) | (20,798,325) | (5,108,977) | (63,985,150) |
Administrator Class
| (514,661) | (6,800,500) | (1,744,772) | (21,763,341) |
| | | (38,389,615) | | (127,993,167) |
Net decrease in net assets resulting from capital share transactions
| | (26,279,391) | | (70,126,542) |
Total decrease in net assets
| | (6,030,998) | | (58,287,662) |
| Net assets | | | | |
Beginning of period
| | 310,534,674 | | 368,822,336 |
End of period
| | $304,503,676 | | $ 310,534,674 |
The accompanying notes are an integral part of these financial statements.
62 | Target Date Retirement Funds
Statements of changes in net assets
| | Target 2025 Fund |
| | Six months ended
August 31, 2021
(unaudited) | Year ended
February 28, 2021 |
| Operations | | | | |
Net investment income
| | $ 1,905,423 | | $ 3,667,037 |
Payment from affiliate
| | 0 | | 944 |
Net realized gains on investments
| | 12,411,827 | | 13,329,660 |
Net change in unrealized gains (losses) on investments
| | 764,270 | | 6,190,648 |
Net increase in net assets resulting from operations
| | 15,081,520 | | 23,188,289 |
| Distributions to shareholders from | | | | |
| Net investment income and net realized gains | | | | |
Class A
| | 0 | | (8,621,196) |
Class R
| | 0 | | (6,306) |
Class R4
| | 0 | | (1,314,996) |
Class R6
| | 0 | | (9,074,248) |
Administrator Class
| | 0 | | (998,117) |
Total distributions to shareholders
| | 0 | | (20,014,863) |
| Capital share transactions | Shares | | Shares | |
| Proceeds from shares sold | | | | |
Class A
| 346,298 | 2,063,995 | 663,066 | 3,720,868 |
Class R
| 1,214 | 7,212 | 2,138 | 11,753 |
Class R4
| 112,282 | 678,183 | 451,862 | 2,529,077 |
Class R6
| 1,460,905 | 8,702,710 | 3,144,713 | 17,976,012 |
Administrator Class
| 43,354 | 263,171 | 278,624 | 1,605,707 |
| | | 11,715,271 | | 25,843,417 |
| Reinvestment of distributions | | | | |
Class A
| 0 | 0 | 1,505,372 | 8,566,423 |
Class R
| 0 | 0 | 826 | 4,646 |
Class R4
| 0 | 0 | 228,509 | 1,314,996 |
Class R6
| 0 | 0 | 1,579,392 | 9,068,476 |
Administrator Class
| 0 | 0 | 172,149 | 998,117 |
| | | 0 | | 19,952,658 |
| Payment for shares redeemed | | | | |
Class A
| (1,468,868) | (8,801,877) | (3,899,378) | (21,728,738) |
Class R
| (24) | (144) | (1,540) | (9,320) |
Class R4
| (292,423) | (1,782,203) | (4,777,769) | (26,009,147) |
Class R6
| (819,756) | (4,887,470) | (9,146,681) | (50,953,179) |
Administrator Class
| (485,418) | (2,937,612) | (545,131) | (3,118,857) |
| | | (18,409,306) | | (101,819,241) |
Net decrease in net assets resulting from capital share transactions
| | (6,694,035) | | (56,023,166) |
Total increase (decrease) in net assets
| | 8,387,485 | | (52,849,740) |
| Net assets | | | | |
Beginning of period
| | 195,140,514 | | 247,990,254 |
End of period
| | $203,527,999 | | $ 195,140,514 |
The accompanying notes are an integral part of these financial statements.
Target Date Retirement Funds | 63
Statements of changes in net assets
| | Target 2030 Fund |
| | Six months ended
August 31, 2021
(unaudited) | Year ended
February 28, 2021 |
| Operations | | | | |
Net investment income
| | $ 4,564,601 | | $ 8,733,305 |
Payment from affiliate
| | 0 | | 3,159 |
Net realized gains on investments
| | 37,371,879 | | 26,170,367 |
Net change in unrealized gains (losses) on investments
| | (373,175) | | 38,087,349 |
Net increase in net assets resulting from operations
| | 41,563,305 | | 72,994,180 |
| Distributions to shareholders from | | | | |
| Net investment income and net realized gains | | | | |
Class A
| | 0 | | (10,517,662) |
Class C
| | 0 | | (78,974) |
Class R
| | 0 | | (2,987) |
Class R4
| | 0 | | (1,837,612) |
Class R6
| | 0 | | (15,175,830) |
Administrator Class
| | 0 | | (4,608,933) |
Total distributions to shareholders
| | 0 | | (32,221,998) |
| Capital share transactions | Shares | | Shares | |
| Proceeds from shares sold | | | | |
Class A
| 162,014 | 2,256,018 | 572,873 | 6,991,470 |
Class C
| 326 | 4,324 | 14,841 | 183,893 |
Class R
| 244 | 3,417 | 456 | 5,692 |
Class R4
| 200,403 | 2,855,338 | 383,360 | 4,720,967 |
Class R6
| 1,622,166 | 22,952,563 | 3,135,653 | 39,756,650 |
Administrator Class
| 262,597 | 3,725,949 | 823,421 | 10,474,295 |
| | | 31,797,609 | | 62,132,967 |
| Reinvestment of distributions | | | | |
Class A
| 0 | 0 | 793,584 | 10,362,362 |
Class C
| 0 | 0 | 6,367 | 78,974 |
Class R
| 0 | 0 | 110 | 1,449 |
Class R4
| 0 | 0 | 136,905 | 1,837,612 |
Class R6
| 0 | 0 | 1,130,909 | 15,158,456 |
Administrator Class
| 0 | 0 | 343,392 | 4,606,205 |
| | | 0 | | 32,045,058 |
| Payment for shares redeemed | | | | |
Class A
| (1,047,664) | (14,717,271) | (2,306,439) | (28,387,423) |
Class C
| (22,792) | (304,983) | (89,198) | (1,069,559) |
Class R
| (280) | (3,954) | (381) | (4,876) |
Class R4
| (130,487) | (1,846,993) | (2,539,777) | (30,499,597) |
Class R6
| (2,475,550) | (34,964,500) | (6,747,642) | (86,685,937) |
Administrator Class
| (594,992) | (8,502,274) | (2,136,957) | (27,326,026) |
| | | (60,339,975) | | (173,973,418) |
Net decrease in net assets resulting from capital share transactions
| | (28,542,366) | | (79,795,393) |
Total increase (decrease) in net assets
| | 13,020,939 | | (39,023,211) |
| Net assets | | | | |
Beginning of period
| | 489,646,065 | | 528,669,276 |
End of period
| | $502,667,004 | | $ 489,646,065 |
The accompanying notes are an integral part of these financial statements.
64 | Target Date Retirement Funds
Statements of changes in net assets
| | Target 2035 Fund |
| | Six months ended
August 31, 2021
(unaudited) | Year ended
February 28, 2021 |
| Operations | | | | |
Net investment income
| | $ 1,855,275 | | $ 3,341,135 |
Net realized gains on investments
| | 17,611,231 | | 11,824,917 |
Net change in unrealized gains (losses) on investments
| | (683,061) | | 16,907,374 |
Net increase in net assets resulting from operations
| | 18,783,445 | | 32,073,426 |
| Distributions to shareholders from | | | | |
| Net investment income and net realized gains | | | | |
Class A
| | 0 | | (6,662,520) |
Class R
| | 0 | | (28,573) |
Class R4
| | 0 | | (619,169) |
Class R6
| | 0 | | (6,238,390) |
Administrator Class
| | 0 | | (434,432) |
Total distributions to shareholders
| | 0 | | (13,983,084) |
| Capital share transactions | Shares | | Shares | |
| Proceeds from shares sold | | | | |
Class A
| 185,224 | 1,601,940 | 447,449 | 3,328,167 |
Class R
| 3,845 | 33,475 | 9,805 | 74,803 |
Class R4
| 88,895 | 773,651 | 314,819 | 2,325,964 |
Class R6
| 817,655 | 7,006,155 | 2,058,266 | 15,846,277 |
Administrator Class
| 79,952 | 688,237 | 207,923 | 1,548,358 |
| | | 10,103,458 | | 23,123,569 |
| Reinvestment of distributions | | | | |
Class A
| 0 | 0 | 828,620 | 6,639,395 |
Class R
| 0 | 0 | 3,342 | 26,990 |
Class R4
| 0 | 0 | 76,888 | 619,169 |
Class R6
| 0 | 0 | 774,596 | 6,234,838 |
Administrator Class
| 0 | 0 | 53,487 | 434,432 |
| | | 0 | | 13,954,824 |
| Payment for shares redeemed | | | | |
Class A
| (714,163) | (6,119,670) | (2,268,927) | (17,269,904) |
Class R
| (1) | (10) | (55) | (457) |
Class R4
| (59,083) | (509,841) | (2,884,179) | (20,216,042) |
Class R6
| (530,538) | (4,540,816) | (4,753,456) | (35,987,408) |
Administrator Class
| (269,156) | (2,337,416) | (395,243) | (3,027,706) |
| | | (13,507,753) | | (76,501,517) |
Net decrease in net assets resulting from capital share transactions
| | (3,404,295) | | (39,423,124) |
Total increase (decrease) in net assets
| | 15,379,150 | | (21,332,782) |
| Net assets | | | | |
Beginning of period
| | 197,013,618 | | 218,346,400 |
End of period
| | $212,392,768 | | $197,013,618 |
The accompanying notes are an integral part of these financial statements.
Target Date Retirement Funds | 65
Statements of changes in net assets
| | Target 2040 Fund |
| | Six months ended
August 31, 2021
(unaudited) | Year ended
February 28, 2021 |
| Operations | | | | |
Net investment income
| | $ 4,334,630 | | $ 7,552,641 |
Payment from affiliate
| | 0 | | 2,629 |
Net realized gains on investments
| | 46,994,195 | | 21,539,796 |
Net change in unrealized gains (losses) on investments
| | (2,662,912) | | 56,659,173 |
Net increase in net assets resulting from operations
| | 48,665,913 | | 85,754,239 |
| Distributions to shareholders from | | | | |
| Net investment income and net realized gains | | | | |
Class A
| | 0 | | (9,265,919) |
Class C
| | 0 | | (68,726) |
Class R
| | 0 | | (3,801) |
Class R4
| | 0 | | (1,290,252) |
Class R6
| | 0 | | (10,676,990) |
Administrator Class
| | 0 | | (2,901,134) |
Total distributions to shareholders
| | 0 | | (24,206,822) |
| Capital share transactions | Shares | | Shares | |
| Proceeds from shares sold | | | | |
Class A
| 154,361 | 2,617,398 | 339,262 | 4,963,022 |
Class C
| 1,097 | 16,722 | 5,358 | 64,860 |
Class R
| 439 | 7,547 | 623 | 9,430 |
Class R4
| 121,509 | 2,150,094 | 348,537 | 5,208,784 |
Class R6
| 1,054,719 | 18,556,670 | 2,412,772 | 35,549,867 |
Administrator Class
| 286,244 | 4,999,226 | 568,701 | 8,394,609 |
| | | 28,347,657 | | 54,190,572 |
| Reinvestment of distributions | | | | |
Class A
| 0 | 0 | 586,408 | 9,183,177 |
Class C
| 0 | 0 | 4,939 | 68,726 |
Class R
| 0 | 0 | 158 | 2,482 |
Class R4
| 0 | 0 | 79,166 | 1,290,252 |
Class R6
| 0 | 0 | 652,680 | 10,629,286 |
Administrator Class
| 0 | 0 | 178,642 | 2,901,134 |
| | | 0 | | 24,075,057 |
| Payment for shares redeemed | | | | |
Class A
| (763,018) | (13,165,861) | (2,050,802) | (29,695,885) |
Class C
| (19,933) | (296,204) | (63,400) | (836,030) |
Class R
| (276) | (4,622) | (335) | (4,961) |
Class R4
| (74,620) | (1,338,215) | (1,701,279) | (23,627,917) |
Class R6
| (2,177,688) | (38,325,628) | (4,227,491) | (64,710,878) |
Administrator Class
| (315,885) | (5,612,745) | (1,603,259) | (24,051,707) |
| | | (58,743,275) | | (142,927,378) |
Net decrease in net assets resulting from capital share transactions
| | (30,395,618) | | (64,661,749) |
Total increase (decrease) in net assets
| | 18,270,295 | | (3,114,332) |
| Net assets | | | | |
Beginning of period
| | 465,186,013 | | 468,300,345 |
End of period
| | $483,456,308 | | $ 465,186,013 |
The accompanying notes are an integral part of these financial statements.
66 | Target Date Retirement Funds
Statements of changes in net assets
| | Target 2045 Fund |
| | Six months ended
August 31, 2021
(unaudited) | Year ended
February 28, 2021 |
| Operations | | | | |
Net investment income
| | $ 896,078 | | $ 1,560,001 |
Payment from affiliate
| | 0 | | 1,213 |
Net realized gains on investments
| | 9,840,693 | | 6,061,969 |
Net change in unrealized gains (losses) on investments
| | (509,322) | | 9,911,775 |
Net increase in net assets resulting from operations
| | 10,227,449 | | 17,534,958 |
| Distributions to shareholders from | | | | |
| Net investment income and net realized gains | | | | |
Class A
| | 0 | | (3,113,511) |
Class R
| | 0 | | (4,629) |
Class R4
| | 0 | | (344,653) |
Class R6
| | 0 | | (3,397,477) |
Administrator Class
| | 0 | | (225,225) |
Total distributions to shareholders
| | 0 | | (7,085,495) |
| Capital share transactions | Shares | | Shares | |
| Proceeds from shares sold | | | | |
Class A
| 117,729 | 1,141,826 | 336,769 | 2,722,637 |
Class R
| 798 | 8,071 | 1,070 | 9,032 |
Class R4
| 39,561 | 388,969 | 138,594 | 1,094,312 |
Class R6
| 395,737 | 3,831,777 | 828,035 | 6,880,013 |
Administrator Class
| 13,130 | 129,091 | 84,013 | 692,188 |
| | | 5,499,734 | | 11,398,182 |
| Reinvestment of distributions | | | | |
Class A
| 0 | 0 | 351,390 | 3,112,534 |
Class R
| 0 | 0 | 305 | 2,767 |
Class R4
| 0 | 0 | 38,581 | 344,653 |
Class R6
| 0 | 0 | 381,803 | 3,396,567 |
Administrator Class
| 0 | 0 | 24,955 | 225,225 |
| | | 0 | | 7,081,746 |
| Payment for shares redeemed | | | | |
Class A
| (482,441) | (4,717,490) | (1,553,097) | (13,213,704) |
Class R
| (10) | (96) | (46) | (369) |
Class R4
| (39,624) | (389,493) | (1,594,955) | (12,212,259) |
Class R6
| (220,857) | (2,178,246) | (2,443,844) | (20,330,961) |
Administrator Class
| (154,305) | (1,523,252) | (319,499) | (2,741,245) |
| | | (8,808,577) | | (48,498,538) |
Net decrease in net assets resulting from capital share transactions
| | (3,308,843) | | (30,018,610) |
Total increase (decrease) in net assets
| | 6,918,606 | | (19,569,147) |
| Net assets | | | | |
Beginning of period
| | 90,947,987 | | 110,517,134 |
End of period
| | $97,866,593 | | $ 90,947,987 |
The accompanying notes are an integral part of these financial statements.
Target Date Retirement Funds | 67
Statements of changes in net assets
| | Target 2050 Fund |
| | Six months ended
August 31, 2021
(unaudited) | Year ended
February 28, 2021 |
| Operations | | | | |
Net investment income
| | $ 2,092,486 | | $ 3,505,946 |
Payment from affiliate
| | 0 | | 1,129 |
Net realized gains on investments
| | 24,168,562 | | 13,003,988 |
Net change in unrealized gains (losses) on investments
| | (1,533,597) | | 27,474,660 |
Net increase in net assets resulting from operations
| | 24,727,451 | | 43,985,723 |
| Distributions to shareholders from | | | | |
| Net investment income and net realized gains | | | | |
Class A
| | 0 | | (2,980,615) |
Class C
| | 0 | | (28,351) |
Class R
| | 0 | | (2,812) |
Class R4
| | 0 | | (801,873) |
Class R6
| | 0 | | (8,125,216) |
Administrator Class
| | 0 | | (2,287,576) |
Total distributions to shareholders
| | 0 | | (14,226,443) |
| Capital share transactions | Shares | | Shares | |
| Proceeds from shares sold | | | | |
Class A
| 146,663 | 1,262,932 | 465,519 | 3,204,263 |
Class C
| 756 | 6,437 | 15,091 | 114,883 |
Class R
| 958 | 8,416 | 1,574 | 11,377 |
Class R4
| 163,047 | 1,394,984 | 412,204 | 2,904,688 |
Class R6
| 1,619,717 | 13,840,204 | 3,622,150 | 25,560,400 |
Administrator Class
| 341,898 | 2,904,616 | 975,411 | 6,766,776 |
| | | 19,417,589 | | 38,562,387 |
| Reinvestment of distributions | | | | |
Class A
| 0 | 0 | 383,371 | 2,968,211 |
Class C
| 0 | 0 | 3,624 | 27,790 |
Class R
| 0 | 0 | 179 | 1,397 |
Class R4
| 0 | 0 | 102,485 | 801,873 |
Class R6
| 0 | 0 | 1,039,019 | 8,118,912 |
Administrator Class
| 0 | 0 | 294,033 | 2,287,576 |
| | | 0 | | 14,205,759 |
| Payment for shares redeemed | | | | |
Class A
| (679,589) | (5,926,425) | (1,797,194) | (12,724,307) |
Class C
| (10,149) | (85,242) | (17,165) | (116,624) |
Class R
| (17) | (148) | (849) | (6,836) |
Class R4
| (93,749) | (816,225) | (1,494,754) | (10,046,952) |
Class R6
| (3,010,995) | (25,801,001) | (5,476,026) | (40,564,559) |
Administrator Class
| (546,315) | (4,706,697) | (2,493,770) | (17,786,533) |
| | | (37,335,738) | | (81,245,811) |
Net decrease in net assets resulting from capital share transactions
| | (17,918,149) | | (28,477,665) |
Total increase in net assets
| | 6,809,302 | | 1,281,615 |
| Net assets | | | | |
Beginning of period
| | 214,252,779 | | 212,971,164 |
End of period
| | $221,062,081 | | $214,252,779 |
The accompanying notes are an integral part of these financial statements.
68 | Target Date Retirement Funds
Statements of changes in net assets
| | Target 2055 Fund |
| | Six months ended
August 31, 2021
(unaudited) | Year ended
February 28, 2021 |
| Operations | | | | |
Net investment income
| | $ 290,204 | | $ 505,196 |
Payment from affiliate
| | 0 | | 293 |
Net realized gains on investments
| | 3,156,795 | | 810,403 |
Net change in unrealized gains (losses) on investments
| | (179,457) | | 4,362,619 |
Net increase in net assets resulting from operations
| | 3,267,542 | | 5,678,511 |
| Distributions to shareholders from | | | | |
| Net investment income and net realized gains | | | | |
Class A
| | 0 | | (105,670) |
Class R
| | 0 | | (890) |
Class R4
| | 0 | | (37,204) |
Class R6
| | 0 | | (421,300) |
Administrator Class
| | 0 | | (16,119) |
Total distributions to shareholders
| | 0 | | (581,183) |
| Capital share transactions | Shares | | Shares | |
| Proceeds from shares sold | | | | |
Class A
| 28,396 | 420,401 | 99,848 | 1,206,020 |
Class R
| 302 | 4,530 | 452 | 5,365 |
Class R4
| 26,651 | 401,854 | 107,507 | 1,193,459 |
Class R6
| 169,578 | 2,530,005 | 412,277 | 4,951,813 |
Administrator Class
| 8,550 | 129,439 | 33,039 | 415,736 |
| | | 3,486,229 | | 7,772,393 |
| Reinvestment of distributions | | | | |
Class A
| 0 | 0 | 7,798 | 105,256 |
Class R
| 0 | 0 | 23 | 324 |
Class R4
| 0 | 0 | 2,744 | 37,204 |
Class R6
| 0 | 0 | 31,222 | 421,190 |
Administrator Class
| 0 | 0 | 1,186 | 16,119 |
| | | 0 | | 580,093 |
| Payment for shares redeemed | | | | |
Class A
| (102,232) | (1,559,557) | (279,475) | (3,468,376) |
Class R
| (3) | (51) | (192) | (2,334) |
Class R4
| (11,860) | (178,136) | (580,265) | (6,276,695) |
Class R6
| (68,947) | (1,039,740) | (899,474) | (11,302,117) |
Administrator Class
| (17,132) | (253,448) | (29,674) | (366,834) |
| | | (3,030,932) | | (21,416,356) |
Net increase (decrease) in net assets resulting from capital share transactions
| | 455,297 | | (13,063,870) |
Total increase (decrease) in net assets
| | 3,722,839 | | (7,966,542) |
| Net assets | | | | |
Beginning of period
| | 26,779,328 | | 34,745,870 |
End of period
| | $30,502,167 | | $ 26,779,328 |
The accompanying notes are an integral part of these financial statements.
Target Date Retirement Funds | 69
Statements of changes in net assets
| | Target 2060 Fund |
| | Six months ended
August 31, 2021
(unaudited) | Year ended
February 28, 2021 |
| Operations | | | | |
Net investment income
| | $ 322,581 | | $ 445,781 |
Payment from affiliate
| | 0 | | 2,213 |
Net realized gains on investments
| | 3,530,300 | | 687,372 |
Net change in unrealized gains (losses) on investments
| | (231,716) | | 4,796,628 |
Net increase in net assets resulting from operations
| | 3,621,165 | | 5,931,994 |
| Distributions to shareholders from | | | | |
| Net investment income and net realized gains | | | | |
Class A
| | 0 | | (15,716) |
Class C
| | 0 | | (748) |
Class R
| | 0 | | (1,350) |
Class R4
| | 0 | | (39,751) |
Class R6
| | 0 | | (392,092) |
Administrator Class
| | 0 | | (44,475) |
Total distributions to shareholders
| | 0 | | (494,132) |
| Capital share transactions | Shares | | Shares | |
| Proceeds from shares sold | | | | |
Class A
| 21,086 | 313,299 | 64,571 | 729,623 |
Class C
| 378 | 5,656 | 658 | 8,105 |
Class R
| 896 | 13,348 | 1,600 | 18,691 |
Class R4
| 26,673 | 400,349 | 64,992 | 787,588 |
Class R6
| 383,088 | 5,723,756 | 773,445 | 9,228,133 |
Administrator Class
| 106,983 | 1,582,655 | 144,201 | 1,711,581 |
| | | 8,039,063 | | 12,483,721 |
| Reinvestment of distributions | | | | |
Class A
| 0 | 0 | 1,159 | 15,554 |
Class C
| 0 | 0 | 44 | 585 |
Class R
| 0 | 0 | 72 | 960 |
Class R4
| 0 | 0 | 2,887 | 39,563 |
Class R6
| 0 | 0 | 28,726 | 391,836 |
Administrator Class
| 0 | 0 | 3,284 | 44,308 |
| | | 0 | | 492,806 |
| Payment for shares redeemed | | | | |
Class A
| (22,592) | (338,899) | (66,312) | (769,594) |
Class C
| (13) | (200) | (3,543) | (44,720) |
Class R
| (16) | (239) | (130) | (1,501) |
Class R4
| (12,798) | (195,993) | (87,050) | (1,064,340) |
Class R6
| (308,329) | (4,639,440) | (608,658) | (7,729,465) |
Administrator Class
| (75,386) | (1,140,696) | (229,454) | (2,606,292) |
| | | (6,315,467) | | (12,215,912) |
Net increase in net assets resulting from capital share transactions
| | 1,723,596 | | 760,615 |
Total increase in net assets
| | 5,344,761 | | 6,198,477 |
| Net assets | | | | |
Beginning of period
| | 28,841,186 | | 22,642,709 |
End of period
| | $34,185,947 | | $ 28,841,186 |
The accompanying notes are an integral part of these financial statements.
70 | Target Date Retirement Funds
Financial highlights
Target Today Fund
(For a share outstanding throughout each period)
| | | Year ended February 28 |
| Class A | Six months ended
August 31, 2021
(unaudited) | 2021 | 2020 1 | 2019 | 2018 | 2017 |
Net asset value, beginning of period
| $9.23 | $9.04 | $8.66 | $8.97 | $10.56 | $10.41 |
Net investment income
| 0.08 | 0.14 | 0.19 | 0.19 | 0.17 | 0.12 |
Net realized and unrealized gains (losses) on investments
| 0.43 | 0.55 | 0.47 | 0.07 | 0.13 | 0.23 |
Total from investment operations
| 0.51 | 0.69 | 0.66 | 0.26 | 0.30 | 0.35 |
| Distributions to shareholders from | | | | | | |
Net investment income
| (0.07) | (0.17) | (0.20) | (0.21) | (0.08) | (0.11) |
Net realized gains
| 0.00 | (0.33) | (0.08) | (0.36) | (1.81) | (0.09) |
Total distributions to shareholders
| (0.07) | (0.50) | (0.28) | (0.57) | (1.89) | (0.20) |
Net asset value, end of period
| $9.67 | $9.23 | $9.04 | $8.66 | $8.97 | $10.56 |
Total return2
| 5.49% | 7.70% | 7.64% | 3.09% | 2.54% | 3.39% |
| Ratios to average net assets (annualized)* | | | | | | |
Gross expenses
| 0.88% | 0.96% | 0.98% | 0.93% | 0.87% | 0.85% |
Net expenses
| 0.58% | 0.59% | 0.63% | 0.65% | 0.69% | 0.76% |
Net investment income
| 1.75% | 1.65% | 2.16% | 2.21% | 1.59% | 1.06% |
| Supplemental data | | | | | | |
Portfolio turnover rate3
| 52% | 79% | 37% | 45% | 80% | 41% |
Net assets, end of period (000s omitted)
| $34,420 | $34,779 | $36,878 | $37,865 | $47,030 | $55,965 |
| * | Ratios include net expenses allocated from the affiliated Master Portfolios which were as follows: |
| Six months ended August 31, 2021 (unaudited) | 0.10% |
| Year ended February 28, 2021 | 0.10% |
| Year ended February 29, 2020 | 0.12% |
| Year ended February 28, 2019 | 0.13% |
| Year ended February 28, 2018 | 0.15% |
| Year ended February 28, 2017 | 0.16% |
| 1 | Year ended February 29 |
| 2 | Total return calculations do not include any sales charges. Returns for periods of less than one year are not annualized. |
| 3 | Portfolio turnover rate is calculated by multiplying the Fund’s ownership percentage in each respective affiliated Master Portfolio by the corresponding affiliated Master Portfolio’s purchases and sales. |
The accompanying notes are an integral part of these financial statements.
Target Date Retirement Funds | 71
Financial highlights
Target Today Fund
(For a share outstanding throughout each period)
| | | Year ended February 28 |
| Class C | Six months ended
August 31, 2021
(unaudited) | 2021 | 2020 1 | 2019 | 2018 | 2017 |
Net asset value, beginning of period
| $9.52 | $9.30 | $8.89 | $9.18 | $10.77 | $10.63 |
Net investment income
| 0.05 2 | 0.09 2 | 0.14 2 | 0.14 2 | 0.10 | 0.03 |
Net realized and unrealized gains (losses) on investments
| 0.44 | 0.55 | 0.47 | 0.06 | 0.13 | 0.24 |
Total from investment operations
| 0.49 | 0.64 | 0.61 | 0.20 | 0.23 | 0.27 |
| Distributions to shareholders from | | | | | | |
Net investment income
| (0.03) | (0.09) | (0.12) | (0.13) | (0.01) | (0.04) |
Net realized gains
| 0.00 | (0.33) | (0.08) | (0.36) | (1.81) | (0.09) |
Total distributions to shareholders
| (0.03) | (0.42) | (0.20) | (0.49) | (1.82) | (0.13) |
Net asset value, end of period
| $9.98 | $9.52 | $9.30 | $8.89 | $9.18 | $10.77 |
Total return3
| 5.13% | 6.92% | 6.80% | 2.31% | 1.76% | 2.57% |
| Ratios to average net assets (annualized)* | | | | | | |
Gross expenses
| 1.62% | 1.70% | 1.73% | 1.68% | 1.62% | 1.61% |
Net expenses
| 1.35% | 1.36% | 1.39% | 1.40% | 1.44% | 1.51% |
Net investment income
| 0.99% | 0.93% | 1.46% | 1.50% | 0.83% | 0.31% |
| Supplemental data | | | | | | |
Portfolio turnover rate4
| 52% | 79% | 37% | 45% | 80% | 41% |
Net assets, end of period (000s omitted)
| $308 | $380 | $529 | $923 | $2,250 | $2,822 |
| * | Ratios include net expenses allocated from the affiliated Master Portfolios which were as follows: |
| Six months ended August 31, 2021 (unaudited) | 0.10% |
| Year ended February 28, 2021 | 0.09% |
| Year ended February 29, 2020 | 0.12% |
| Year ended February 28, 2019 | 0.13% |
| Year ended February 28, 2018 | 0.15% |
| Year ended February 28, 2017 | 0.15% |
| 1 | Year ended February 29 |
| 2 | Calculated based upon average shares outstanding |
| 3 | Total return calculations do not include any sales charges. Returns for periods of less than one year are not annualized. |
| 4 | Portfolio turnover rate is calculated by multiplying the Fund’s ownership percentage in each respective affiliated Master Portfolio by the corresponding affiliated Master Portfolio’s purchases and sales. |
The accompanying notes are an integral part of these financial statements.
72 | Target Date Retirement Funds
Financial highlights
Target Today Fund
(For a share outstanding throughout each period)
| | | Year ended February 28 |
| Class R | Six months ended
August 31, 2021
(unaudited) | 2021 | 2020 1 | 2019 | 2018 | 2017 |
Net asset value, beginning of period
| $9.26 | $9.00 | $8.62 | $8.94 | $10.53 | $10.39 |
Net investment income
| 0.07 | 0.13 | 0.17 | 0.17 | 0.14 | 0.09 |
Payment from affiliate
| 0.00 | 0.06 | 0.00 | 0.00 | 0.00 | 0.00 |
Net realized and unrealized gains (losses) on investments
| 0.43 | 0.54 | 0.46 | 0.06 | 0.14 | 0.23 |
Total from investment operations
| 0.50 | 0.73 | 0.63 | 0.23 | 0.28 | 0.32 |
| Distributions to shareholders from | | | | | | |
Net investment income
| (0.05) | (0.14) | (0.17) | (0.19) | (0.06) | (0.09) |
Net realized gains
| 0.00 | (0.33) | (0.08) | (0.36) | (1.81) | (0.09) |
Total distributions to shareholders
| (0.05) | (0.47) | (0.25) | (0.55) | (1.87) | (0.18) |
Net asset value, end of period
| $9.71 | $9.26 | $9.00 | $8.62 | $8.94 | $10.53 |
Total return2
| 5.44% | 8.18% 3 | 7.35% | 2.72% | 2.31% | 3.13% |
| Ratios to average net assets (annualized)* | | | | | | |
Gross expenses
| 0.98% | 1.08% | 1.23% | 1.16% | 1.13% | 1.12% |
Net expenses
| 0.85% | 0.86% | 0.90% | 0.89% | 0.94% | 1.01% |
Net investment income
| 1.49% | 1.38% | 1.88% | 1.96% | 1.36% | 0.79% |
| Supplemental data | | | | | | |
Portfolio turnover rate4
| 52% | 79% | 37% | 45% | 80% | 41% |
Net assets, end of period (000s omitted)
| $36 | $33 | $31 | $28 | $29 | $32 |
| * | Ratios include net expenses allocated from the affiliated Master Portfolios which were as follows: |
| Six months ended August 31, 2021 (unaudited) | 0.09% |
| Year ended February 28, 2021 | 0.09% |
| Year ended February 29, 2020 | 0.17% |
| Year ended February 28, 2019 | 0.11% |
| Year ended February 28, 2018 | 0.16% |
| Year ended February 28, 2017 | 0.16% |
| 1 | Year ended February 29 |
| 2 | Returns for periods of less than one year are not annualized. |
| 3 | During the year ended February 28, 2021, the Fund received a payment from an affiliate which had a 0.75% impact on the total return. See Note 4 in the Notes to Financial Statements for additional information. |
| 4 | Portfolio turnover rate is calculated by multiplying the Fund’s ownership percentage in each respective affiliated Master Portfolio by the corresponding affiliated Master Portfolio’s purchases and sales. |
The accompanying notes are an integral part of these financial statements.
Target Date Retirement Funds | 73
Financial highlights
Target Today Fund
(For a share outstanding throughout each period)
| | | Year ended February 28 |
| Class R4 | Six months ended
August 31, 2021
(unaudited) | 2021 | 2020 1 | 2019 | 2018 | 2017 |
Net asset value, beginning of period
| $9.49 | $9.29 | $8.89 | $9.20 | $10.81 | $10.65 |
Net investment income
| 0.10 | 0.19 2 | 0.23 2 | 0.24 2 | 0.17 2 | 0.14 |
Net realized and unrealized gains (losses) on investments
| 0.44 | 0.54 | 0.48 | 0.05 | 0.13 | 0.25 |
Total from investment operations
| 0.54 | 0.73 | 0.71 | 0.29 | 0.30 | 0.39 |
| Distributions to shareholders from | | | | | | |
Net investment income
| (0.08) | (0.20) | (0.23) | (0.24) | (0.10) | (0.14) |
Net realized gains
| 0.00 | (0.33) | (0.08) | (0.36) | (1.81) | (0.09) |
Total distributions to shareholders
| (0.08) | (0.53) | (0.31) | (0.60) | (1.91) | (0.23) |
Net asset value, end of period
| $9.95 | $9.49 | $9.29 | $8.89 | $9.20 | $10.81 |
Total return3
| 5.69% | 7.98% | 7.98% | 3.35% | 2.46% | 3.71% |
| Ratios to average net assets (annualized)* | | | | | | |
Gross expenses
| 0.60% | 0.69% | 0.70% | 0.67% | 0.60% | 0.58% |
Net expenses
| 0.29% | 0.30% | 0.34% | 0.34% | 0.44% | 0.45% |
Net investment income
| 2.04% | 2.02% | 2.46% | 2.62% | 1.54% | 1.37% |
| Supplemental data | | | | | | |
Portfolio turnover rate4
| 52% | 79% | 37% | 45% | 80% | 41% |
Net assets, end of period (000s omitted)
| $1,093 | $1,047 | $2,437 | $2,825 | $12,858 | $248,734 |
| * | Ratios include net expenses allocated from the affiliated Master Portfolios which were as follows: |
| Six months ended August 31, 2021 (unaudited) | 0.09% |
| Year ended February 28, 2021 | 0.10% |
| Year ended February 29, 2020 | 0.12% |
| Year ended February 28, 2019 | 0.13% |
| Year ended February 28, 2018 | 0.16% |
| Year ended February 28, 2017 | 0.15% |
| 1 | Year ended February 29 |
| 2 | Calculated based upon average shares outstanding |
| 3 | Returns for periods of less than one year are not annualized. |
| 4 | Portfolio turnover rate is calculated by multiplying the Fund’s ownership percentage in each respective affiliated Master Portfolio by the corresponding affiliated Master Portfolio’s purchases and sales. |
The accompanying notes are an integral part of these financial statements.
74 | Target Date Retirement Funds
Financial highlights
Target Today Fund
(For a share outstanding throughout each period)
| | | Year ended February 28 |
| Class R6 | Six months ended
August 31, 2021
(unaudited) | 2021 | 2020 1 | 2019 | 2018 | 2017 |
Net asset value, beginning of period
| $9.48 | $9.28 | $8.88 | $9.19 | $10.78 | $10.64 |
Net investment income
| 0.11 | 0.20 2 | 0.24 2 | 0.25 2 | 0.21 2 | 0.17 2 |
Net realized and unrealized gains (losses) on investments
| 0.44 | 0.54 | 0.48 | 0.06 | 0.15 | 0.23 |
Total from investment operations
| 0.55 | 0.74 | 0.72 | 0.31 | 0.36 | 0.40 |
| Distributions to shareholders from | | | | | | |
Net investment income
| (0.09) | (0.21) | (0.24) | (0.26) | (0.14) | (0.17) |
Net realized gains
| 0.00 | (0.33) | (0.08) | (0.36) | (1.81) | (0.09) |
Total distributions to shareholders
| (0.09) | (0.54) | (0.32) | (0.62) | (1.95) | (0.26) |
Net asset value, end of period
| $9.94 | $9.48 | $9.28 | $8.88 | $9.19 | $10.78 |
Total return3
| 5.79% | 8.10% | 8.16% | 3.52% | 2.99% | 3.81% |
| Ratios to average net assets (annualized)* | | | | | | |
Gross expenses
| 0.45% | 0.53% | 0.55% | 0.51% | 0.44% | 0.42% |
Net expenses
| 0.14% | 0.15% | 0.19% | 0.19% | 0.24% | 0.30% |
Net investment income
| 2.20% | 2.10% | 2.60% | 2.72% | 1.99% | 1.53% |
| Supplemental data | | | | | | |
Portfolio turnover rate4
| 52% | 79% | 37% | 45% | 80% | 41% |
Net assets, end of period (000s omitted)
| $12,970 | $15,827 | $17,264 | $17,013 | $40,511 | $72,643 |
| * | Ratios include net expenses allocated from the affiliated Master Portfolios which were as follows: |
| Six months ended August 31, 2021 (unaudited) | 0.09% |
| Year ended February 28, 2021 | 0.10% |
| Year ended February 29, 2020 | 0.12% |
| Year ended February 28, 2019 | 0.13% |
| Year ended February 28, 2018 | 0.15% |
| Year ended February 28, 2017 | 0.15% |
| 1 | Year ended February 29 |
| 2 | Calculated based upon average shares outstanding |
| 3 | Returns for periods of less than one year are not annualized. |
| 4 | Portfolio turnover rate is calculated by multiplying the Fund’s ownership percentage in each respective affiliated Master Portfolio by the corresponding affiliated Master Portfolio’s purchases and sales. |
The accompanying notes are an integral part of these financial statements.
Target Date Retirement Funds | 75
Financial highlights
Target Today Fund
(For a share outstanding throughout each period)
| | | Year ended February 28 |
| Administrator Class | Six months ended
August 31, 2021
(unaudited) | 2021 | 2020 1 | 2019 | 2018 | 2017 |
Net asset value, beginning of period
| $9.51 | $9.30 | $8.90 | $9.21 | $10.78 | $10.63 |
Net investment income
| 0.08 | 0.15 | 0.21 2 | 0.22 2 | 0.18 | 0.13 2 |
Net realized and unrealized gains (losses) on investments
| 0.45 | 0.57 | 0.48 | 0.05 | 0.15 | 0.23 |
Total from investment operations
| 0.53 | 0.72 | 0.69 | 0.27 | 0.33 | 0.36 |
| Distributions to shareholders from | | | | | | |
Net investment income
| (0.07) | (0.18) | (0.21) | (0.22) | (0.09) | (0.12) |
Net realized gains
| 0.00 | (0.33) | (0.08) | (0.36) | (1.81) | (0.09) |
Total distributions to shareholders
| (0.07) | (0.51) | (0.29) | (0.58) | (1.90) | (0.21) |
Net asset value, end of period
| $9.97 | $9.51 | $9.30 | $8.90 | $9.21 | $10.78 |
Total return3
| 5.58% | 7.81% | 7.76% | 3.11% | 2.77% | 3.41% |
| Ratios to average net assets (annualized)* | | | | | | |
Gross expenses
| 0.80% | 0.87% | 0.90% | 0.86% | 0.79% | 0.77% |
Net expenses
| 0.48% | 0.49% | 0.53% | 0.54% | 0.59% | 0.65% |
Net investment income
| 1.85% | 1.75% | 2.29% | 2.38% | 1.66% | 1.17% |
| Supplemental data | | | | | | |
Portfolio turnover rate4
| 52% | 79% | 37% | 45% | 80% | 41% |
Net assets, end of period (000s omitted)
| $6,428 | $6,779 | $7,029 | $9,597 | $24,351 | $39,234 |
| * | Ratios include net expenses allocated from the affiliated Master Portfolios which were as follows: |
| Six months ended August 31, 2021 (unaudited) | 0.09% |
| Year ended February 28, 2021 | 0.10% |
| Year ended February 29, 2020 | 0.12% |
| Year ended February 28, 2019 | 0.13% |
| Year ended February 28, 2018 | 0.15% |
| Year ended February 28, 2017 | 0.15% |
| 1 | Year ended February 29 |
| 2 | Calculated based upon average shares outstanding |
| 3 | Returns for periods of less than one year are not annualized. |
| 4 | Portfolio turnover rate is calculated by multiplying the Fund’s ownership percentage in each respective affiliated Master Portfolio by the corresponding affiliated Master Portfolio’s purchases and sales. |
The accompanying notes are an integral part of these financial statements.
76 | Target Date Retirement Funds
Financial highlights
Target 2010 Fund
(For a share outstanding throughout each period)
| | | Year ended February 28 |
| Class A | Six months ended
August 31, 2021
(unaudited) | 2021 | 2020 1 | 2019 | 2018 | 2017 |
Net asset value, beginning of period
| $10.74 | $10.55 | $10.13 | $10.72 | $12.41 | $12.26 |
Net investment income
| 0.11 | 0.18 | 0.23 2 | 0.23 2 | 0.19 | 0.15 |
Net realized and unrealized gains (losses) on investments
| 0.48 | 0.65 | 0.53 | 0.07 | 0.22 | 0.30 |
Total from investment operations
| 0.59 | 0.83 | 0.76 | 0.30 | 0.41 | 0.45 |
| Distributions to shareholders from | | | | | | |
Net investment income
| (0.07) | (0.19) | (0.23) | (0.27) | (0.04) | (0.09) |
Net realized gains
| 0.00 | (0.45) | (0.11) | (0.62) | (2.06) | (0.21) |
Total distributions to shareholders
| (0.07) | (0.64) | (0.34) | (0.89) | (2.10) | (0.30) |
Net asset value, end of period
| $11.26 | $10.74 | $10.55 | $10.13 | $10.72 | $12.41 |
Total return3
| 5.54% | 8.04% | 7.57% | 3.03% | 3.04% | 3.71% |
| Ratios to average net assets (annualized)* | | | | | | |
Gross expenses
| 0.90% | 1.00% | 1.00% | 0.91% | 0.87% | 0.87% |
Net expenses
| 0.58% | 0.59% | 0.63% | 0.65% | 0.70% | 0.78% |
Net investment income
| 1.76% | 1.64% | 2.15% | 2.20% | 1.58% | 1.14% |
| Supplemental data | | | | | | |
Portfolio turnover rate4
| 53% | 79% | 37% | 45% | 79% | 41% |
Net assets, end of period (000s omitted)
| $32,120 | $32,376 | $33,505 | $35,777 | $51,677 | $60,237 |
| * | Ratios include net expenses allocated from the affiliated Master Portfolios which were as follows: |
| Six months ended August 31, 2021 (unaudited) | 0.09% |
| Year ended February 28, 2021 | 0.10% |
| Year ended February 29, 2020 | 0.12% |
| Year ended February 28, 2019 | 0.13% |
| Year ended February 28, 2018 | 0.15% |
| Year ended February 28, 2017 | 0.16% |
| 1 | Year ended February 29 |
| 2 | Calculated based upon average shares outstanding |
| 3 | Total return calculations do not include any sales charges. Returns for periods of less than one year are not annualized. |
| 4 | Portfolio turnover rate is calculated by multiplying the Fund’s ownership percentage in each respective affiliated Master Portfolio by the corresponding affiliated Master Portfolio’s purchases and sales. |
The accompanying notes are an integral part of these financial statements.
Target Date Retirement Funds | 77
Financial highlights
Target 2010 Fund
(For a share outstanding throughout each period)
| | | Year ended February 28 |
| Class C | Six months ended
August 31, 2021
(unaudited) | 2021 | 2020 1 | 2019 | 2018 | 2017 |
Net asset value, beginning of period
| $10.90 | $10.67 | $10.24 | $10.82 | $12.56 | $12.42 |
Net investment income
| 0.06 2 | 0.11 2 | 0.15 2 | 0.16 2 | 0.13 | 0.07 |
Net realized and unrealized gains (losses) on investments
| 0.50 | 0.66 | 0.54 | 0.06 | 0.19 | 0.30 |
Total from investment operations
| 0.56 | 0.77 | 0.69 | 0.22 | 0.32 | 0.37 |
| Distributions to shareholders from | | | | | | |
Net investment income
| (0.04) | (0.09) | (0.15) | (0.18) | 0.00 | (0.02) |
Net realized gains
| 0.00 | (0.45) | (0.11) | (0.62) | (2.06) | (0.21) |
Total distributions to shareholders
| (0.04) | (0.54) | (0.26) | (0.80) | (2.06) | (0.23) |
Net asset value, end of period
| $11.42 | $10.90 | $10.67 | $10.24 | $10.82 | $12.56 |
Total return3
| 5.13% | 7.29% | 6.70% | 2.25% | 2.25% | 2.96% |
| Ratios to average net assets (annualized)* | | | | | | |
Gross expenses
| 1.59% | 1.74% | 1.75% | 1.65% | 1.62% | 1.62% |
Net expenses
| 1.35% | 1.36% | 1.39% | 1.40% | 1.45% | 1.53% |
Net investment income
| 0.99% | 0.99% | 1.40% | 1.47% | 0.83% | 0.39% |
| Supplemental data | | | | | | |
Portfolio turnover rate4
| 53% | 79% | 37% | 45% | 79% | 41% |
Net assets, end of period (000s omitted)
| $141 | $183 | $576 | $735 | $1,323 | $1,761 |
| * | Ratios include net expenses allocated from the affiliated Master Portfolios which were as follows: |
| Six months ended August 31, 2021 (unaudited) | 0.09% |
| Year ended February 28, 2021 | 0.09% |
| Year ended February 29, 2020 | 0.12% |
| Year ended February 28, 2019 | 0.13% |
| Year ended February 28, 2018 | 0.15% |
| Year ended February 28, 2017 | 0.16% |
| 1 | Year ended February 29 |
| 2 | Calculated based upon average shares outstanding |
| 3 | Total return calculations do not include any sales charges. Returns for periods of less than one year are not annualized. |
| 4 | Portfolio turnover rate is calculated by multiplying the Fund’s ownership percentage in each respective affiliated Master Portfolio by the corresponding affiliated Master Portfolio’s purchases and sales. |
The accompanying notes are an integral part of these financial statements.
78 | Target Date Retirement Funds
Financial highlights
Target 2010 Fund
(For a share outstanding throughout each period)
| | | Year ended February 28 |
| Class R | Six months ended
August 31, 2021
(unaudited) | 2021 | 2020 1 | 2019 | 2018 | 2017 |
Net asset value, beginning of period
| $10.76 | $10.46 | $10.04 | $10.63 | $12.33 | $12.19 |
Net investment income
| 0.08 | 0.15 | 0.20 | 0.20 | 0.16 | 0.11 |
Payment from affiliate
| 0.00 | 0.10 | 0.00 | 0.00 | 0.00 | 0.00 |
Net realized and unrealized gains (losses) on investments
| 0.51 | 0.66 | 0.53 | 0.07 | 0.22 | 0.31 |
Total from investment operations
| 0.59 | 0.91 | 0.73 | 0.27 | 0.38 | 0.42 |
| Distributions to shareholders from | | | | | | |
Net investment income
| (0.06) | (0.16) | (0.20) | (0.24) | (0.02) | (0.07) |
Net realized gains
| 0.00 | (0.45) | (0.11) | (0.62) | (2.06) | (0.21) |
Total distributions to shareholders
| (0.06) | (0.61) | (0.31) | (0.86) | (2.08) | (0.28) |
Net asset value, end of period
| $11.29 | $10.76 | $10.46 | $10.04 | $10.63 | $12.33 |
Total return2
| 5.47% | 8.83% 3 | 7.29% | 2.82% | 2.75% | 3.45% |
| Ratios to average net assets (annualized)* | | | | | | |
Gross expenses
| 0.92% | 1.07% | 1.24% | 1.14% | 1.13% | 1.14% |
Net expenses
| 0.83% | 0.85% | 0.90% | 0.90% | 0.96% | 1.03% |
Net investment income
| 1.51% | 1.38% | 1.87% | 1.94% | 1.32% | 0.88% |
| Supplemental data | | | | | | |
Portfolio turnover rate4
| 53% | 79% | 37% | 45% | 79% | 41% |
Net assets, end of period (000s omitted)
| $25 | $24 | $23 | $22 | $23 | $53 |
| * | Ratios include net expenses allocated from the affiliated Master Portfolios which were as follows: |
| Six months ended August 31, 2021 (unaudited) | 0.09% |
| Year ended February 28, 2021 | 0.09% |
| Year ended February 29, 2020 | 0.20% |
| Year ended February 28, 2019 | 0.13% |
| Year ended February 28, 2018 | 0.16% |
| Year ended February 28, 2017 | 0.16% |
| 1 | Year ended February 29 |
| 2 | Returns for periods of less than one year are not annualized. |
| 3 | During the year ended February 28, 2021, the Fund received a payment from an affiliate which had a 1.06% impact on the total return. See Note 4 in the Notes to Financial Statements for additional information. |
| 4 | Portfolio turnover rate is calculated by multiplying the Fund’s ownership percentage in each respective affiliated Master Portfolio by the corresponding affiliated Master Portfolio’s purchases and sales. |
The accompanying notes are an integral part of these financial statements.
Target Date Retirement Funds | 79
Financial highlights
Target 2010 Fund
(For a share outstanding throughout each period)
| | | Year ended February 28 |
| Class R4 | Six months ended
August 31, 2021
(unaudited) | 2021 | 2020 1 | 2019 | 2018 | 2017 |
Net asset value, beginning of period
| $10.90 | $10.70 | $10.27 | $10.86 | $12.55 | $12.38 |
Net investment income
| 0.12 2 | 0.21 2 | 0.27 2 | 0.29 2 | 0.23 2 | 0.19 2 |
Net realized and unrealized gains (losses) on investments
| 0.51 | 0.67 | 0.54 | 0.04 | 0.22 | 0.32 |
Total from investment operations
| 0.63 | 0.88 | 0.81 | 0.33 | 0.45 | 0.51 |
| Distributions to shareholders from | | | | | | |
Net investment income
| (0.09) | (0.23) | (0.27) | (0.30) | (0.08) | (0.13) |
Net realized gains
| 0.00 | (0.45) | (0.11) | (0.62) | (2.06) | (0.21) |
Total distributions to shareholders
| (0.09) | (0.68) | (0.38) | (0.92) | (2.14) | (0.34) |
Net asset value, end of period
| $11.44 | $10.90 | $10.70 | $10.27 | $10.86 | $12.55 |
Total return3
| 5.77% | 8.37% | 7.90% | 3.35% | 3.30% | 4.11% |
| Ratios to average net assets (annualized)* | | | | | | |
Gross expenses
| 0.62% | 0.72% | 0.72% | 0.66% | 0.59% | 0.59% |
Net expenses
| 0.29% | 0.30% | 0.34% | 0.34% | 0.41% | 0.47% |
Net investment income
| 2.06% | 1.94% | 2.50% | 2.65% | 1.83% | 1.45% |
| Supplemental data | | | | | | |
Portfolio turnover rate4
| 53% | 79% | 37% | 45% | 79% | 41% |
Net assets, end of period (000s omitted)
| $1,172 | $1,074 | $1,155 | $1,825 | $17,218 | $48,885 |
| * | Ratios include net expenses allocated from the affiliated Master Portfolios which were as follows: |
| Six months ended August 31, 2021 (unaudited) | 0.09% |
| Year ended February 28, 2021 | 0.10% |
| Year ended February 29, 2020 | 0.12% |
| Year ended February 28, 2019 | 0.13% |
| Year ended February 28, 2018 | 0.15% |
| Year ended February 28, 2017 | 0.16% |
| 1 | Year ended February 29 |
| 2 | Calculated based upon average shares outstanding |
| 3 | Returns for periods of less than one year are not annualized. |
| 4 | Portfolio turnover rate is calculated by multiplying the Fund’s ownership percentage in each respective affiliated Master Portfolio by the corresponding affiliated Master Portfolio’s purchases and sales. |
The accompanying notes are an integral part of these financial statements.
80 | Target Date Retirement Funds
Financial highlights
Target 2010 Fund
(For a share outstanding throughout each period)
| | | Year ended February 28 |
| Class R6 | Six months ended
August 31, 2021
(unaudited) | 2021 | 2020 1 | 2019 | 2018 | 2017 |
Net asset value, beginning of period
| $10.88 | $10.68 | $10.25 | $10.84 | $12.54 | $12.37 |
Net investment income
| 0.17 | 0.26 | 0.28 2 | 0.29 2 | 0.25 2 | 0.21 2 |
Net realized and unrealized gains (losses) on investments
| 0.46 | 0.63 | 0.54 | 0.06 | 0.22 | 0.32 |
Total from investment operations
| 0.63 | 0.89 | 0.82 | 0.35 | 0.47 | 0.53 |
| Distributions to shareholders from | | | | | | |
Net investment income
| (0.10) | (0.24) | (0.28) | (0.32) | (0.11) | (0.15) |
Net realized gains
| 0.00 | (0.45) | (0.11) | (0.62) | (2.06) | (0.21) |
Total distributions to shareholders
| (0.10) | (0.69) | (0.39) | (0.94) | (2.17) | (0.36) |
Net asset value, end of period
| $11.41 | $10.88 | $10.68 | $10.25 | $10.84 | $12.54 |
Total return3
| 5.78% | 8.54% | 8.07% | 3.53% | 3.42% | 4.27% |
| Ratios to average net assets (annualized)* | | | | | | |
Gross expenses
| 0.47% | 0.57% | 0.57% | 0.48% | 0.44% | 0.44% |
Net expenses
| 0.14% | 0.15% | 0.19% | 0.19% | 0.25% | 0.32% |
Net investment income
| 2.19% | 2.08% | 2.61% | 2.71% | 2.00% | 1.61% |
| Supplemental data | | | | | | |
Portfolio turnover rate4
| 53% | 79% | 37% | 45% | 79% | 41% |
Net assets, end of period (000s omitted)
| $12,794 | $13,387 | $14,128 | $16,789 | $40,332 | $82,474 |
| * | Ratios include net expenses allocated from the affiliated Master Portfolios which were as follows: |
| Six months ended August 31, 2021 (unaudited) | 0.09% |
| Year ended February 28, 2021 | 0.10% |
| Year ended February 29, 2020 | 0.12% |
| Year ended February 28, 2019 | 0.13% |
| Year ended February 28, 2018 | 0.15% |
| Year ended February 28, 2017 | 0.16% |
| 1 | Year ended February 29 |
| 2 | Calculated based upon average shares outstanding |
| 3 | Returns for periods of less than one year are not annualized. |
| 4 | Portfolio turnover rate is calculated by multiplying the Fund’s ownership percentage in each respective affiliated Master Portfolio by the corresponding affiliated Master Portfolio’s purchases and sales. |
The accompanying notes are an integral part of these financial statements.
Target Date Retirement Funds | 81
Financial highlights
Target 2010 Fund
(For a share outstanding throughout each period)
| | | Year ended February 28 |
| Administrator Class | Six months ended
August 31, 2021
(unaudited) | 2021 | 2020 1 | 2019 | 2018 | 2017 |
Net asset value, beginning of period
| $10.91 | $10.71 | $10.27 | $10.86 | $12.55 | $12.39 |
Net investment income
| 0.10 | 0.19 2 | 0.24 2 | 0.26 2 | 0.21 2 | 0.16 |
Net realized and unrealized gains (losses) on investments
| 0.51 | 0.66 | 0.55 | 0.05 | 0.21 | 0.31 |
Total from investment operations
| 0.61 | 0.85 | 0.79 | 0.31 | 0.42 | 0.47 |
| Distributions to shareholders from | | | | | | |
Net investment income
| (0.08) | (0.20) | (0.24) | (0.28) | (0.05) | (0.10) |
Net realized gains
| 0.00 | (0.45) | (0.11) | (0.62) | (2.06) | (0.21) |
Total distributions to shareholders
| (0.08) | (0.65) | (0.35) | (0.90) | (2.11) | (0.31) |
Net asset value, end of period
| $11.44 | $10.91 | $10.71 | $10.27 | $10.86 | $12.55 |
Total return3
| 5.59% | 8.13% | 7.77% | 3.08% | 3.09% | 3.84% |
| Ratios to average net assets (annualized)* | | | | | | |
Gross expenses
| 0.82% | 0.92% | 0.92% | 0.83% | 0.79% | 0.79% |
Net expenses
| 0.49% | 0.50% | 0.54% | 0.54% | 0.59% | 0.67% |
Net investment income
| 1.85% | 1.76% | 2.29% | 2.37% | 1.68% | 1.26% |
| Supplemental data | | | | | | |
Portfolio turnover rate4
| 53% | 79% | 37% | 45% | 79% | 41% |
Net assets, end of period (000s omitted)
| $6,718 | $6,728 | $8,332 | $12,382 | $32,634 | $49,565 |
| * | Ratios include net expenses allocated from the affiliated Master Portfolios which were as follows: |
| Six months ended August 31, 2021 (unaudited) | 0.09% |
| Year ended February 28, 2021 | 0.10% |
| Year ended February 29, 2020 | 0.12% |
| Year ended February 28, 2019 | 0.13% |
| Year ended February 28, 2018 | 0.15% |
| Year ended February 28, 2017 | 0.16% |
| 1 | Year ended February 29 |
| 2 | Calculated based upon average shares outstanding |
| 3 | Returns for periods of less than one year are not annualized. |
| 4 | Portfolio turnover rate is calculated by multiplying the Fund’s ownership percentage in each respective affiliated Master Portfolio by the corresponding affiliated Master Portfolio’s purchases and sales. |
The accompanying notes are an integral part of these financial statements.
82 | Target Date Retirement Funds
Financial highlights
Target 2015 Fund
(For a share outstanding throughout each period)
| | | Year ended February 28 |
| Class A | Six months ended
August 31, 2021
(unaudited) | 2021 | 2020 1 | 2019 | 2018 | 2017 |
Net asset value, beginning of period
| $7.19 | $7.17 | $7.04 | $7.88 | $10.12 | $9.87 |
Net investment income
| 0.06 | 0.12 | 0.16 2 | 0.16 | 0.15 | 0.15 2 |
Net realized and unrealized gains (losses) on investments
| 0.38 | 0.54 | 0.34 | 0.06 | 0.27 | 0.37 |
Total from investment operations
| 0.44 | 0.66 | 0.50 | 0.22 | 0.42 | 0.52 |
| Distributions to shareholders from | | | | | | |
Net investment income
| (0.05) | (0.13) | (0.16) | (0.17) | (0.02) | (0.10) |
Net realized gains
| 0.00 | (0.51) | (0.21) | (0.89) | (2.64) | (0.17) |
Total distributions to shareholders
| (0.05) | (0.64) | (0.37) | (1.06) | (2.66) | (0.27) |
Net asset value, end of period
| $7.58 | $7.19 | $7.17 | $7.04 | $7.88 | $10.12 |
Total return3
| 6.13% | 9.40% | 7.18% | 3.17% | 3.72% | 5.30% |
| Ratios to average net assets (annualized)* | | | | | | |
Gross expenses
| 0.89% | 0.97% | 0.96% | 0.90% | 0.86% | 0.87% |
Net expenses
| 0.57% | 0.58% | 0.62% | 0.65% | 0.71% | 0.79% |
Net investment income
| 1.75% | 1.63% | 2.13% | 2.16% | 1.65% | 1.43% |
| Supplemental data | | | | | | |
Portfolio turnover rate4
| 52% | 80% | 36% | 44% | 76% | 41% |
Net assets, end of period (000s omitted)
| $30,704 | $31,496 | $32,650 | $36,236 | $42,542 | $54,770 |
| * | Ratios include net expenses allocated from the affiliated Master Portfolios which were as follows: |
| Six months ended August 31, 2021 (unaudited) | 0.09% |
| Year ended February 28, 2021 | 0.10% |
| Year ended February 29, 2020 | 0.12% |
| Year ended February 28, 2019 | 0.14% |
| Year ended February 28, 2018 | 0.16% |
| Year ended February 28, 2017 | 0.16% |
| 1 | Year ended February 29 |
| 2 | Calculated based upon average shares outstanding |
| 3 | Total return calculations do not include any sales charges. Returns for periods of less than one year are not annualized. |
| 4 | Portfolio turnover rate is calculated by multiplying the Fund’s ownership percentage in each respective affiliated Master Portfolio by the corresponding affiliated Master Portfolio’s purchases and sales. |
The accompanying notes are an integral part of these financial statements.
Target Date Retirement Funds | 83
Financial highlights
Target 2015 Fund
(For a share outstanding throughout each period)
| | | Year ended February 28 |
| Class R | Six months ended
August 31, 2021
(unaudited) | 2021 | 2020 1 | 2019 | 2018 | 2017 |
Net asset value, beginning of period
| $7.46 | $7.33 | $7.19 | $8.02 | $10.26 | $10.01 |
Net investment income
| 0.06 | 0.10 | 0.14 | 0.15 | 0.13 | 0.13 |
Payment from affiliate
| 0.00 | 0.09 | 0.00 | 0.00 | 0.00 | 0.00 |
Net realized and unrealized gains (losses) on investments
| 0.39 | 0.56 | 0.35 | 0.05 | 0.27 | 0.37 |
Total from investment operations
| 0.45 | 0.75 | 0.49 | 0.20 | 0.40 | 0.50 |
| Distributions to shareholders from | | | | | | |
Net investment income
| (0.04) | (0.11) | (0.14) | (0.14) | (0.00) 2 | (0.08) |
Net realized gains
| 0.00 | (0.51) | (0.21) | (0.89) | (2.64) | (0.17) |
Total distributions to shareholders
| (0.04) | (0.62) | (0.35) | (1.03) | (2.64) | (0.25) |
Net asset value, end of period
| $7.87 | $7.46 | $7.33 | $7.19 | $8.02 | $10.26 |
Total return3
| 6.02% | 10.33% 4 | 6.80% | 2.98% | 3.52% | 4.99% |
| Ratios to average net assets (annualized)* | | | | | | |
Gross expenses
| 0.89% | 1.04% | 1.19% | 1.14% | 1.12% | 1.12% |
Net expenses
| 0.82% | 0.85% | 0.90% | 0.90% | 0.96% | 1.04% |
Net investment income
| 1.50% | 1.36% | 1.83% | 1.91% | 1.41% | 1.18% |
| Supplemental data | | | | | | |
Portfolio turnover rate5
| 52% | 80% | 36% | 44% | 76% | 41% |
Net assets, end of period (000s omitted)
| $21 | $20 | $20 | $20 | $22 | $37 |
| * | Ratios include net expenses allocated from the affiliated Master Portfolios which were as follows: |
| Six months ended August 31, 2021 (unaudited) | 0.07% |
| Year ended February 28, 2021 | 0.10% |
| Year ended February 29, 2020 | 0.19% |
| Year ended February 28, 2019 | 0.12% |
| Year ended February 28, 2018 | 0.17% |
| Year ended February 28, 2017 | 0.16% |
| 1 | Year ended February 29 |
| 2 | Amount is less than $0.005. |
| 3 | Returns for periods of less than one year are not annualized. |
| 4 | During the year ended Febuary 28, 2021, the Fund received a payment from an affiliate which had a 1.28% impact on the total return. See Note 4 in the Notes to Financial Statements for additional information. |
| 5 | Portfolio turnover rate is calculated by multiplying the Fund’s ownership percentage in each respective affiliated Master Portfolio by the corresponding affiliated Master Portfolio’s purchases and sales. |
The accompanying notes are an integral part of these financial statements.
84 | Target Date Retirement Funds
Financial highlights
Target 2015 Fund
(For a share outstanding throughout each period)
| | | Year ended February 28 |
| Class R4 | Six months ended
August 31, 2021
(unaudited) | 2021 | 2020 1 | 2019 | 2018 | 2017 |
Net asset value, beginning of period
| $7.25 | $7.24 | $7.10 | $7.94 | $10.16 | $9.91 |
Net investment income
| 0.08 2 | 0.15 2 | 0.18 2 | 0.21 2 | 0.19 2 | 0.18 2 |
Net realized and unrealized gains (losses) on investments
| 0.38 | 0.53 | 0.35 | 0.03 | 0.26 | 0.37 |
Total from investment operations
| 0.46 | 0.68 | 0.53 | 0.24 | 0.45 | 0.55 |
| Distributions to shareholders from | | | | | | |
Net investment income
| (0.06) | (0.16) | (0.18) | (0.19) | (0.03) | (0.13) |
Net realized gains
| 0.00 | (0.51) | (0.21) | (0.89) | (2.64) | (0.17) |
Total distributions to shareholders
| (0.06) | (0.67) | (0.39) | (1.08) | (2.67) | (0.30) |
Net asset value, end of period
| $7.65 | $7.25 | $7.24 | $7.10 | $7.94 | $10.16 |
Total return3
| 6.38% | 9.58% | 7.57% | 3.50% | 4.05% | 5.57% |
| Ratios to average net assets (annualized)* | | | | | | |
Gross expenses
| 0.62% | 0.70% | 0.67% | 0.60% | 0.59% | 0.59% |
Net expenses
| 0.29% | 0.30% | 0.34% | 0.34% | 0.41% | 0.48% |
Net investment income
| 2.05% | 2.05% | 2.42% | 2.62% | 1.91% | 1.73% |
| Supplemental data | | | | | | |
Portfolio turnover rate4
| 52% | 80% | 36% | 44% | 76% | 41% |
Net assets, end of period (000s omitted)
| $1,520 | $2,605 | $5,853 | $7,352 | $43,346 | $105,773 |
| * | Ratios include net expenses allocated from the affiliated Master Portfolios which were as follows: |
| Six months ended August 31, 2021 (unaudited) | 0.09% |
| Year ended February 28, 2021 | 0.10% |
| Year ended February 29, 2020 | 0.12% |
| Year ended February 28, 2019 | 0.14% |
| Year ended February 28, 2018 | 0.16% |
| Year ended February 28, 2017 | 0.16% |
| 1 | Year ended February 29 |
| 2 | Calculated based upon average shares outstanding |
| 3 | Returns for periods of less than one year are not annualized. |
| 4 | Portfolio turnover rate is calculated by multiplying the Fund’s ownership percentage in each respective affiliated Master Portfolio by the corresponding affiliated Master Portfolio’s purchases and sales. |
The accompanying notes are an integral part of these financial statements.
Target Date Retirement Funds | 85
Financial highlights
Target 2015 Fund
(For a share outstanding throughout each period)
| | | Year ended February 28 |
| Class R6 | Six months ended
August 31, 2021
(unaudited) | 2021 | 2020 1 | 2019 | 2018 | 2017 |
Net asset value, beginning of period
| $7.26 | $7.24 | $7.10 | $7.94 | $10.15 | $9.90 |
Net investment income
| 0.09 | 0.25 | 0.19 2 | 0.21 2 | 0.25 | 0.20 2 |
Net realized and unrealized gains (losses) on investments
| 0.36 | 0.44 | 0.35 | 0.04 | 0.22 | 0.37 |
Total from investment operations
| 0.45 | 0.69 | 0.54 | 0.25 | 0.47 | 0.57 |
| Distributions to shareholders from | | | | | | |
Net investment income
| (0.06) | (0.16) | (0.19) | (0.20) | (0.04) | (0.15) |
Net realized gains
| 0.00 | (0.51) | (0.21) | (0.89) | (2.64) | (0.17) |
Total distributions to shareholders
| (0.06) | (0.67) | (0.40) | (1.09) | (2.68) | (0.32) |
Net asset value, end of period
| $7.65 | $7.26 | $7.24 | $7.10 | $7.94 | $10.15 |
Total return3
| 6.28% | 9.82% | 7.74% | 3.65% | 4.27% | 5.74% |
| Ratios to average net assets (annualized)* | | | | | | |
Gross expenses
| 0.46% | 0.54% | 0.52% | 0.46% | 0.44% | 0.43% |
Net expenses
| 0.14% | 0.15% | 0.19% | 0.19% | 0.26% | 0.33% |
Net investment income
| 2.18% | 2.09% | 2.62% | 2.67% | 2.08% | 1.92% |
| Supplemental data | | | | | | |
Portfolio turnover rate4
| 52% | 80% | 36% | 44% | 76% | 41% |
Net assets, end of period (000s omitted)
| $15,355 | $14,671 | $18,725 | $31,174 | $61,265 | $125,438 |
| * | Ratios include net expenses allocated from the affiliated Master Portfolios which were as follows: |
| Six months ended August 31, 2021 (unaudited) | 0.09% |
| Year ended February 28, 2021 | 0.10% |
| Year ended February 29, 2020 | 0.12% |
| Year ended February 28, 2019 | 0.14% |
| Year ended February 28, 2018 | 0.16% |
| Year ended February 28, 2017 | 0.16% |
| 1 | Year ended February 29 |
| 2 | Calculated based upon average shares outstanding |
| 3 | Returns for periods of less than one year are not annualized. |
| 4 | Portfolio turnover rate is calculated by multiplying the Fund’s ownership percentage in each respective affiliated Master Portfolio by the corresponding affiliated Master Portfolio’s purchases and sales. |
The accompanying notes are an integral part of these financial statements.
86 | Target Date Retirement Funds
Financial highlights
Target 2015 Fund
(For a share outstanding throughout each period)
| | | Year ended February 28 |
| Administrator Class | Six months ended
August 31, 2021
(unaudited) | 2021 | 2020 1 | 2019 | 2018 | 2017 |
Net asset value, beginning of period
| $7.42 | $7.38 | $7.24 | $8.07 | $10.29 | $10.02 |
Net investment income
| 0.07 2 | 0.13 2 | 0.17 2 | 0.19 2 | 0.18 2 | 0.17 2 |
Net realized and unrealized gains (losses) on investments
| 0.38 | 0.56 | 0.35 | 0.04 | 0.26 | 0.38 |
Total from investment operations
| 0.45 | 0.69 | 0.52 | 0.23 | 0.44 | 0.55 |
| Distributions to shareholders from | | | | | | |
Net investment income
| (0.05) | (0.14) | (0.17) | (0.17) | (0.02) | (0.11) |
Net realized gains
| 0.00 | (0.51) | (0.21) | (0.89) | (2.64) | (0.17) |
Total distributions to shareholders
| (0.05) | (0.65) | (0.38) | (1.06) | (2.66) | (0.28) |
Net asset value, end of period
| $7.82 | $7.42 | $7.38 | $7.24 | $8.07 | $10.29 |
Total return3
| 6.11% | 9.51% | 7.20% | 3.33% | 3.89% | 5.52% |
| Ratios to average net assets (annualized)* | | | | | | |
Gross expenses
| 0.81% | 0.89% | 0.87% | 0.81% | 0.77% | 0.78% |
Net expenses
| 0.49% | 0.50% | 0.54% | 0.54% | 0.60% | 0.68% |
Net investment income
| 1.84% | 1.74% | 2.24% | 2.33% | 1.76% | 1.59% |
| Supplemental data | | | | | | |
Portfolio turnover rate4
| 52% | 80% | 36% | 44% | 76% | 41% |
Net assets, end of period (000s omitted)
| $4,213 | $4,568 | $5,345 | $6,821 | $15,886 | $21,910 |
| * | Ratios include net expenses allocated from the affiliated Master Portfolios which were as follows: |
| Six months ended August 31, 2021 (unaudited) | 0.09% |
| Year ended February 28, 2021 | 0.10% |
| Year ended February 29, 2020 | 0.12% |
| Year ended February 28, 2019 | 0.14% |
| Year ended February 28, 2018 | 0.16% |
| Year ended February 28, 2017 | 0.16% |
| 1 | Year ended February 29 |
| 2 | Calculated based upon average shares outstanding |
| 3 | Returns for periods of less than one year are not annualized. |
| 4 | Portfolio turnover rate is calculated by multiplying the Fund’s ownership percentage in each respective affiliated Master Portfolio by the corresponding affiliated Master Portfolio’s purchases and sales. |
The accompanying notes are an integral part of these financial statements.
Target Date Retirement Funds | 87
Financial highlights
Target 2020 Fund
(For a share outstanding throughout each period)
| | | Year ended February 28 |
| Class A | Six months ended
August 31, 2021
(unaudited) | 2021 | 2020 1 | 2019 | 2018 | 2017 |
Net asset value, beginning of period
| $12.46 | $11.98 | $11.64 | $12.55 | $14.87 | $14.19 |
Net investment income
| 0.10 | 0.17 | 0.25 2 | 0.26 | 0.24 | 0.21 |
Payment from affiliate
| 0.00 | 0.00 3 | 0.00 | 0.00 | 0.00 | 0.00 |
Net realized and unrealized gains (losses) on investments
| 0.73 | 1.13 | 0.51 | 0.06 | 0.61 | 0.85 |
Total from investment operations
| 0.83 | 1.30 | 0.76 | 0.32 | 0.85 | 1.06 |
| Distributions to shareholders from | | | | | | |
Net investment income
| 0.00 | (0.23) | (0.27) | (0.41) | 0.00 | (0.17) |
Net realized gains
| 0.00 | (0.59) | (0.15) | (0.82) | (3.17) | (0.21) |
Total distributions to shareholders
| 0.00 | (0.82) | (0.42) | (1.23) | (3.17) | (0.38) |
Net asset value, end of period
| $13.29 | $12.46 | $11.98 | $11.64 | $12.55 | $14.87 |
Total return4
| 6.66% | 10.93% 5 | 6.53% | 3.12% | 5.40% | 7.53% |
| Ratios to average net assets (annualized)* | | | | | | |
Gross expenses
| 0.70% | 0.73% | 0.75% | 0.75% | 0.79% | 0.85% |
Net expenses
| 0.58% | 0.59% | 0.63% | 0.65% | 0.71% | 0.81% |
Net investment income
| 1.74% | 1.61% | 2.08% | 2.14% | 1.74% | 1.44% |
| Supplemental data | | | | | | |
Portfolio turnover rate6
| 51% | 80% | 36% | 43% | 73% | 39% |
Net assets, end of period (000s omitted)
| $128,742 | $127,258 | $132,755 | $147,196 | $199,069 | $218,652 |
| * | Ratios include net expenses allocated from the affiliated Master Portfolios which were as follows: |
| Six months ended August 31, 2021 (unaudited) | 0.10% |
| Year ended February 28, 2021 | 0.10% |
| Year ended February 29, 2020 | 0.13% |
| Year ended February 28, 2019 | 0.14% |
| Year ended February 28, 2018 | 0.16% |
| Year ended February 28, 2017 | 0.17% |
| 1 | Year ended February 29 |
| 2 | Calculated based upon average shares outstanding |
| 3 | Amount is less than $0.005. |
| 4 | Total return calculations do not include any sales charges. Returns for periods of less than one year are not annualized. |
| 5 | During the year ended February 28, 2021, the Fund received a payment from an affiliate that had an impact of less than 0.005% on total return. See Note 4 in the Notes to Financial Statements for additional information. |
| 6 | Portfolio turnover rate is calculated by multiplying the Fund’s ownership percentage in each respective affiliated Master Portfolio by the corresponding affiliated Master Portfolio’s purchases and sales. |
The accompanying notes are an integral part of these financial statements.
88 | Target Date Retirement Funds
Financial highlights
Target 2020 Fund
(For a share outstanding throughout each period)
| | | Year ended February 28 |
| Class C | Six months ended
August 31, 2021
(unaudited) | 2021 | 2020 1 | 2019 | 2018 | 2017 |
Net asset value, beginning of period
| $12.20 | $11.75 | $11.41 | $12.31 | $14.75 | $14.10 |
Net investment income
| 0.06 2 | 0.06 | 0.16 2 | 0.17 2 | 0.13 | 0.10 |
Net realized and unrealized gains (losses) on investments
| 0.71 | 1.12 | 0.50 | 0.06 | 0.60 | 0.84 |
Total from investment operations
| 0.77 | 1.18 | 0.66 | 0.23 | 0.73 | 0.94 |
| Distributions to shareholders from | | | | | | |
Net investment income
| 0.00 | (0.14) | (0.17) | (0.31) | 0.00 | (0.08) |
Net realized gains
| 0.00 | (0.59) | (0.15) | (0.82) | (3.17) | (0.21) |
Total distributions to shareholders
| 0.00 | (0.73) | (0.32) | (1.13) | (3.17) | (0.29) |
Net asset value, end of period
| $12.97 | $12.20 | $11.75 | $11.41 | $12.31 | $14.75 |
Total return3
| 6.31% | 10.05% | 5.79% | 2.28% | 4.60% | 6.71% |
| Ratios to average net assets (annualized)* | | | | | | |
Gross expenses
| 1.45% | 1.48% | 1.50% | 1.50% | 1.54% | 1.60% |
Net expenses
| 1.35% | 1.36% | 1.39% | 1.40% | 1.46% | 1.56% |
Net investment income
| 0.97% | 0.85% | 1.33% | 1.41% | 0.99% | 0.69% |
| Supplemental data | | | | | | |
Portfolio turnover rate4
| 51% | 80% | 36% | 43% | 73% | 39% |
Net assets, end of period (000s omitted)
| $2,107 | $2,608 | $2,785 | $3,377 | $6,219 | $6,713 |
| * | Ratios include net expenses allocated from the affiliated Master Portfolios which were as follows: |
| Six months ended August 31, 2021 (unaudited) | 0.10% |
| Year ended February 28, 2021 | 0.10% |
| Year ended February 29, 2020 | 0.13% |
| Year ended February 28, 2019 | 0.14% |
| Year ended February 28, 2018 | 0.16% |
| Year ended February 28, 2017 | 0.17% |
| 1 | Year ended February 29 |
| 2 | Calculated based upon average shares outstanding |
| 3 | Total return calculations do not include any sales charges. Returns for periods of less than one year are not annualized. |
| 4 | Portfolio turnover rate is calculated by multiplying the Fund’s ownership percentage in each respective affiliated Master Portfolio by the corresponding affiliated Master Portfolio’s purchases and sales. |
The accompanying notes are an integral part of these financial statements.
Target Date Retirement Funds | 89
Financial highlights
Target 2020 Fund
(For a share outstanding throughout each period)
| | | Year ended February 28 |
| Class R | Six months ended
August 31, 2021
(unaudited) | 2021 | 2020 1 | 2019 | 2018 | 2017 |
Net asset value, beginning of period
| $12.37 | $11.86 | $11.53 | $12.46 | $14.81 | $14.14 |
Net investment income
| 0.09 2 | 0.12 | 0.21 2 | 0.22 2 | 0.22 2 | 0.18 |
Payment from affiliate
| 0.00 | 0.04 | 0.00 | 0.00 | 0.00 | 0.00 |
Net realized and unrealized gains (losses) on investments
| 0.72 | 1.13 | 0.52 | 0.08 | 0.60 | 0.84 |
Total from investment operations
| 0.81 | 1.29 | 0.73 | 0.30 | 0.82 | 1.02 |
| Distributions to shareholders from | | | | | | |
Net investment income
| 0.00 | (0.19) | (0.25) | (0.41) | 0.00 | (0.14) |
Net realized gains
| 0.00 | (0.59) | (0.15) | (0.82) | (3.17) | (0.21) |
Total distributions to shareholders
| 0.00 | (0.78) | (0.40) | (1.23) | (3.17) | (0.35) |
Net asset value, end of period
| $13.18 | $12.37 | $11.86 | $11.53 | $12.46 | $14.81 |
Total return3
| 6.55% | 10.94% 4 | 6.32% | 2.84% | 5.20% | 7.27% |
| Ratios to average net assets (annualized)* | | | | | | |
Gross expenses
| 0.90% | 0.94% | 0.99% | 1.00% | 1.06% | 1.10% |
Net expenses
| 0.85% | 0.86% | 0.90% | 0.90% | 0.98% | 1.06% |
Net investment income
| 1.47% | 1.36% | 1.76% | 1.84% | 1.51% | 1.21% |
| Supplemental data | | | | | | �� |
Portfolio turnover rate5
| 51% | 80% | 36% | 43% | 73% | 39% |
Net assets, end of period (000s omitted)
| $122 | $104 | $119 | $86 | $66 | $321 |
| * | Ratios include net expenses allocated from the affiliated Master Portfolios which were as follows: |
| Six months ended August 31, 2021 (unaudited) | 0.09% |
| Year ended February 28, 2021 | 0.10% |
| Year ended February 29, 2020 | 0.14% |
| Year ended February 28, 2019 | 0.13% |
| Year ended February 28, 2018 | 0.17% |
| Year ended February 28, 2017 | 0.17% |
| 1 | Year ended February 29 |
| 2 | Calculated based upon average shares outstanding |
| 3 | Returns for periods of less than one year are not annualized. |
| 4 | During the year ended February 28, 2021, the Fund received a payment from an affiliate that had an impact of 0.40% on total return. See Note 4 in the Notes to Financial Statements for additional information. |
| 5 | Portfolio turnover rate is calculated by multiplying the Fund’s ownership percentage in each respective affiliated Master Portfolio by the corresponding affiliated Master Portfolio’s purchases and sales. |
The accompanying notes are an integral part of these financial statements.
90 | Target Date Retirement Funds
Financial highlights
Target 2020 Fund
(For a share outstanding throughout each period)
| | | Year ended February 28 |
| Class R4 | Six months ended
August 31, 2021
(unaudited) | 2021 | 2020 1 | 2019 | 2018 | 2017 |
Net asset value, beginning of period
| $12.87 | $12.36 | $11.98 | $12.89 | $15.15 | $14.44 |
Net investment income
| 0.14 2 | 0.25 | 0.30 2 | 0.33 2 | 0.31 2 | 0.27 2 |
Net realized and unrealized gains (losses) on investments
| 0.75 | 1.12 | 0.54 | 0.04 | 0.60 | 0.86 |
Total from investment operations
| 0.89 | 1.37 | 0.84 | 0.37 | 0.91 | 1.13 |
| Distributions to shareholders from | | | | | | |
Net investment income
| 0.00 | (0.27) | (0.31) | (0.46) | 0.00 | (0.21) |
Net realized gains
| 0.00 | (0.59) | (0.15) | (0.82) | (3.17) | (0.21) |
Total distributions to shareholders
| 0.00 | (0.86) | (0.46) | (1.28) | (3.17) | (0.42) |
Net asset value, end of period
| $13.76 | $12.87 | $12.36 | $11.98 | $12.89 | $15.15 |
Total return3
| 6.92% | 11.15% | 6.99% | 3.36% | 5.70% | 7.89% |
| Ratios to average net assets (annualized)* | | | | | | |
Gross expenses
| 0.42% | 0.45% | 0.47% | 0.47% | 0.53% | 0.56% |
Net expenses
| 0.29% | 0.30% | 0.34% | 0.34% | 0.42% | 0.50% |
Net investment income
| 2.03% | 2.02% | 2.39% | 2.54% | 2.05% | 1.76% |
| Supplemental data | | | | | | |
Portfolio turnover rate4
| 51% | 80% | 36% | 43% | 73% | 39% |
Net assets, end of period (000s omitted)
| $17,116 | $15,462 | $31,139 | $38,539 | $130,172 | $357,823 |
| * | Ratios include net expenses allocated from the affiliated Master Portfolios which were as follows: |
| Six months ended August 31, 2021 (unaudited) | 0.10% |
| Year ended February 28, 2021 | 0.10% |
| Year ended February 29, 2020 | 0.13% |
| Year ended February 28, 2019 | 0.14% |
| Year ended February 28, 2018 | 0.17% |
| Year ended February 28, 2017 | 0.17% |
| 1 | Year ended February 29 |
| 2 | Calculated based upon average shares outstanding |
| 3 | Returns for periods of less than one year are not annualized. |
| 4 | Portfolio turnover rate is calculated by multiplying the Fund’s ownership percentage in each respective affiliated Master Portfolio by the corresponding affiliated Master Portfolio’s purchases and sales. |
The accompanying notes are an integral part of these financial statements.
Target Date Retirement Funds | 91
Financial highlights
Target 2020 Fund
(For a share outstanding throughout each period)
| | | Year ended February 28 |
| Class R6 | Six months ended
August 31, 2021
(unaudited) | 2021 | 2020 1 | 2019 | 2018 | 2017 |
Net asset value, beginning of period
| $12.87 | $12.35 | $11.98 | $12.90 | $15.14 | $14.43 |
Net investment income
| 0.15 2 | 0.40 | 0.32 2 | 0.34 2 | 0.33 2 | 0.29 2 |
Net realized and unrealized gains (losses) on investments
| 0.74 | 1.00 | 0.53 | 0.06 | 0.61 | 0.86 |
Total from investment operations
| 0.89 | 1.40 | 0.85 | 0.40 | 0.94 | 1.15 |
| Distributions to shareholders from | | | | | | |
Net investment income
| 0.00 | (0.29) | (0.33) | (0.50) | (0.01) | (0.23) |
Net realized gains
| 0.00 | (0.59) | (0.15) | (0.82) | (3.17) | (0.21) |
Total distributions to shareholders
| 0.00 | (0.88) | (0.48) | (1.32) | (3.18) | (0.44) |
Net asset value, end of period
| $13.76 | $12.87 | $12.35 | $11.98 | $12.90 | $15.14 |
Total return3
| 6.92% | 11.40% | 7.06% | 3.58% | 5.89% | 8.04% |
| Ratios to average net assets (annualized)* | | | | | | |
Gross expenses
| 0.27% | 0.30% | 0.32% | 0.32% | 0.37% | 0.41% |
Net expenses
| 0.14% | 0.15% | 0.19% | 0.19% | 0.26% | 0.35% |
Net investment income
| 2.18% | 2.06% | 2.52% | 2.66% | 2.20% | 1.92% |
| Supplemental data | | | | | | |
Portfolio turnover rate4
| 51% | 80% | 36% | 43% | 73% | 39% |
Net assets, end of period (000s omitted)
| $115,577 | $121,395 | $147,590 | $154,089 | $400,206 | $645,237 |
| * | Ratios include net expenses allocated from the affiliated Master Portfolios which were as follows: |
| Six months ended August 31, 2021 (unaudited) | 0.10% |
| Year ended February 28, 2021 | 0.10% |
| Year ended February 29, 2020 | 0.13% |
| Year ended February 28, 2019 | 0.14% |
| Year ended February 28, 2018 | 0.17% |
| Year ended February 28, 2017 | 0.17% |
| 1 | Year ended February 29 |
| 2 | Calculated based upon average shares outstanding |
| 3 | Returns for periods of less than one year are not annualized. |
| 4 | Portfolio turnover rate is calculated by multiplying the Fund’s ownership percentage in each respective affiliated Master Portfolio by the corresponding affiliated Master Portfolio’s purchases and sales. |
The accompanying notes are an integral part of these financial statements.
92 | Target Date Retirement Funds
Financial highlights
Target 2020 Fund
(For a share outstanding throughout each period)
| | | Year ended February 28 |
| Administrator Class | Six months ended
August 31, 2021
(unaudited) | 2021 | 2020 1 | 2019 | 2018 | 2017 |
Net asset value, beginning of period
| $12.78 | $12.27 | $11.90 | $12.80 | $15.09 | $14.40 |
Net investment income
| 0.12 2 | 0.18 | 0.27 2 | 0.31 | 0.29 | 0.24 2 |
Net realized and unrealized gains (losses) on investments
| 0.74 | 1.16 | 0.53 | 0.04 | 0.59 | 0.84 |
Total from investment operations
| 0.86 | 1.34 | 0.80 | 0.35 | 0.88 | 1.08 |
| Distributions to shareholders from | | | | | | |
Net investment income
| 0.00 | (0.24) | (0.28) | (0.43) | 0.00 | (0.18) |
Net realized gains
| 0.00 | (0.59) | (0.15) | (0.82) | (3.17) | (0.21) |
Total distributions to shareholders
| 0.00 | (0.83) | (0.43) | (1.25) | (3.17) | (0.39) |
Net asset value, end of period
| $13.64 | $12.78 | $12.27 | $11.90 | $12.80 | $15.09 |
Total return3
| 6.73% | 10.99% | 6.73% | 3.18% | 5.51% | 7.58% |
| Ratios to average net assets (annualized)* | | | | | | |
Gross expenses
| 0.62% | 0.65% | 0.67% | 0.67% | 0.72% | 0.76% |
Net expenses
| 0.49% | 0.50% | 0.54% | 0.54% | 0.61% | 0.70% |
Net investment income
| 1.83% | 1.73% | 2.18% | 2.28% | 1.85% | 1.60% |
| Supplemental data | | | | | | |
Portfolio turnover rate4
| 51% | 80% | 36% | 43% | 73% | 39% |
Net assets, end of period (000s omitted)
| $40,839 | $43,707 | $54,435 | $63,684 | $111,716 | $197,835 |
| * | Ratios include net expenses allocated from the affiliated Master Portfolios which were as follows: |
| Six months ended August 31, 2021 (unaudited) | 0.10% |
| Year ended February 28, 2021 | 0.10% |
| Year ended February 29, 2020 | 0.13% |
| Year ended February 28, 2019 | 0.14% |
| Year ended February 28, 2018 | 0.17% |
| Year ended February 28, 2017 | 0.17% |
| 1 | Year ended February 29 |
| 2 | Calculated based upon average shares outstanding |
| 3 | Returns for periods of less than one year are not annualized. |
| 4 | Portfolio turnover rate is calculated by multiplying the Fund’s ownership percentage in each respective affiliated Master Portfolio by the corresponding affiliated Master Portfolio’s purchases and sales. |
The accompanying notes are an integral part of these financial statements.
Target Date Retirement Funds | 93
Financial highlights
Target 2025 Fund
(For a share outstanding throughout each period)
| | | Year ended February 28 |
| Class A | Six months ended
August 31, 2021
(unaudited) | 2021 | 2020 1 | 2019 | 2018 | 2017 |
Net asset value, beginning of period
| $5.72 | $5.57 | $5.57 | $6.41 | $10.48 | $9.77 |
Net investment income
| 0.04 | 0.08 | 0.12 | 0.13 2 | 0.17 2 | 0.13 |
Payment from affiliate
| 0.00 | 0.00 3 | 0.00 | 0.00 | 0.00 | 0.00 |
Net realized and unrealized gains (losses) on investments
| 0.40 | 0.67 | 0.21 | (0.00) 4 | 0.63 | 0.90 |
Total from investment operations
| 0.44 | 0.75 | 0.33 | 0.13 | 0.80 | 1.03 |
| Distributions to shareholders from | | | | | | |
Net investment income
| 0.00 | (0.11) | (0.13) | (0.14) | (0.03) | (0.15) |
Net realized gains
| 0.00 | (0.49) | (0.20) | (0.83) | (4.84) | (0.17) |
Total distributions to shareholders
| 0.00 | (0.60) | (0.33) | (0.97) | (4.87) | (0.32) |
Net asset value, end of period
| $6.16 | $5.72 | $5.57 | $5.57 | $6.41 | $10.48 |
Total return5
| 7.69% | 13.66% 6 | 5.71% | 2.78% | 7.09% | 10.61% |
| Ratios to average net assets (annualized)* | | | | | | |
Gross expenses
| 0.73% | 0.77% | 0.77% | 0.78% | 0.81% | 0.84% |
Net expenses
| 0.58% | 0.59% | 0.62% | 0.65% | 0.71% | 0.81% |
Net investment income
| 1.66% | 1.62% | 2.04% | 2.08% | 1.70% | 1.37% |
| Supplemental data | | | | | | |
Portfolio turnover rate7
| 52% | 83% | 36% | 43% | 67% | 36% |
Net assets, end of period (000s omitted)
| $86,881 | $87,108 | $94,505 | $106,485 | $117,382 | $140,428 |
| * | Ratios include net expenses allocated from the affiliated Master Portfolios which were as follows: |
| Six months ended August 31, 2021 (unaudited) | 0.10% |
| Year ended February 28, 2021 | 0.11% |
| Year ended February 29, 2020 | 0.13% |
| Year ended February 28, 2019 | 0.15% |
| Year ended February 28, 2018 | 0.17% |
| Year ended February 28, 2017 | 0.17% |
| 1 | Year ended February 29 |
| 2 | Calculated based upon average shares outstanding |
| 3 | Amount is less than $0.005. |
| 4 | Amount is more than $(0.005) |
| 5 | Total return calculations do not include any sales charges. Returns for periods of less than one year are not annualized. |
| 6 | During the year ended February 28, 2021, the Fund received a payment from an affiliate that had an impact of less than 0.005% on total return. See Note 4 in the Notes to Financial Statements for additional information. |
| 7 | Portfolio turnover rate is calculated by multiplying the Fund’s ownership percentage in each respective affiliated Master Portfolio by the corresponding affiliated Master Portfolio’s purchases and sales. |
The accompanying notes are an integral part of these financial statements.
94 | Target Date Retirement Funds
Financial highlights
Target 2025 Fund
(For a share outstanding throughout each period)
| | | Year ended February 28 |
| Class R | Six months ended
August 31, 2021
(unaudited) | 2021 | 2020 1 | 2019 | 2018 | 2017 |
Net asset value, beginning of period
| $5.67 | $5.49 | $5.50 | $6.34 | $10.49 | $9.79 |
Net investment income
| 0.06 | 0.11 | 0.10 2 | 0.11 2 | 0.16 2 | 0.12 |
Payment from affiliate
| 0.00 | 0.03 | 0.00 | 0.00 | 0.00 | 0.00 |
Net realized and unrealized gains (losses) on investments
| 0.36 | 0.62 | 0.20 | 0.02 | 0.53 | 0.88 |
Total from investment operations
| 0.42 | 0.76 | 0.30 | 0.13 | 0.69 | 1.00 |
| Distributions to shareholders from | | | | | | |
Net investment income
| 0.00 | (0.09) | (0.11) | (0.14) | 0.00 | (0.13) |
Net realized gains
| 0.00 | (0.49) | (0.20) | (0.83) | (4.84) | (0.17) |
Total distributions to shareholders
| 0.00 | (0.58) | (0.31) | (0.97) | (4.84) | (0.30) |
Net asset value, end of period
| $6.09 | $5.67 | $5.49 | $5.50 | $6.34 | $10.49 |
Total return3
| 7.41% | 14.13% 4 | 5.37% | 2.67% | 5.94% | 10.22% |
| Ratios to average net assets (annualized)* | | | | | | |
Gross expenses
| 0.93% | 0.98% | 1.01% | 1.02% | 1.10% | 1.10% |
Net expenses
| 0.85% | 0.86% | 0.89% | 0.90% | 1.02% | 1.06% |
Net investment income
| 1.41% | 1.32% | 1.73% | 1.78% | 1.53% | 1.12% |
| Supplemental data | | | | | | |
Portfolio turnover rate5
| 52% | 83% | 36% | 43% | 67% | 36% |
Net assets, end of period (000s omitted)
| $79 | $66 | $57 | $44 | $29 | $610 |
| * | Ratios include net expenses allocated from the affiliated Master Portfolios which were as follows: |
| Six months ended August 31, 2021 (unaudited) | 0.10% |
| Year ended February 28, 2021 | 0.12% |
| Year ended February 29, 2020 | 0.15% |
| Year ended February 28, 2019 | 0.13% |
| Year ended February 28, 2018 | 0.18% |
| Year ended February 28, 2017 | 0.17% |
| 1 | Year ended February 29 |
| 2 | Calculated based upon average shares outstanding |
| 3 | Returns for periods of less than one year are not annualized. |
| 4 | During the year ended February 28, 2021, the Fund received a payment from an affiliate that had an impact of 0.68% on total return. See Note 4 in the Notes to Financial Statements for additional information. |
| 5 | Portfolio turnover rate is calculated by multiplying the Fund’s ownership percentage in each respective affiliated Master Portfolio by the corresponding affiliated Master Portfolio’s purchases and sales. |
The accompanying notes are an integral part of these financial statements.
Target Date Retirement Funds | 95
Financial highlights
Target 2025 Fund
(For a share outstanding throughout each period)
| | | Year ended February 28 |
| Class R4 | Six months ended
August 31, 2021
(unaudited) | 2021 | 2020 1 | 2019 | 2018 | 2017 |
Net asset value, beginning of period
| $5.78 | $5.62 | $5.61 | $6.45 | $10.52 | $9.80 |
Net investment income
| 0.04 | 0.12 2 | 0.14 2 | 0.16 2 | 0.20 | 0.17 |
Net realized and unrealized gains (losses) on investments
| 0.41 | 0.66 | 0.21 | (0.01) | 0.63 | 0.90 |
Total from investment operations
| 0.45 | 0.78 | 0.35 | 0.15 | 0.83 | 1.07 |
| Distributions to shareholders from | | | | | | |
Net investment income
| 0.00 | (0.13) | (0.14) | (0.16) | (0.06) | (0.18) |
Net realized gains
| 0.00 | (0.49) | (0.20) | (0.83) | (4.84) | (0.17) |
Total distributions to shareholders
| 0.00 | (0.62) | (0.34) | (0.99) | (4.90) | (0.35) |
Net asset value, end of period
| $6.23 | $5.78 | $5.62 | $5.61 | $6.45 | $10.52 |
Total return3
| 7.79% | 14.08% | 6.16% | 3.05% | 7.33% | 10.98% |
| Ratios to average net assets (annualized)* | | | | | | |
Gross expenses
| 0.45% | 0.49% | 0.49% | 0.50% | 0.55% | 0.57% |
Net expenses
| 0.29% | 0.31% | 0.34% | 0.34% | 0.43% | 0.50% |
Net investment income
| 1.94% | 2.07% | 2.31% | 2.45% | 2.01% | 1.65% |
| Supplemental data | | | | | | |
Portfolio turnover rate4
| 52% | 83% | 36% | 43% | 67% | 36% |
Net assets, end of period (000s omitted)
| $13,300 | $13,375 | $36,023 | $42,046 | $87,607 | $274,639 |
| * | Ratios include net expenses allocated from the affiliated Master Portfolios which were as follows: |
| Six months ended August 31, 2021 (unaudited) | 0.10% |
| Year ended February 28, 2021 | 0.11% |
| Year ended February 29, 2020 | 0.13% |
| Year ended February 28, 2019 | 0.15% |
| Year ended February 28, 2018 | 0.17% |
| Year ended February 28, 2017 | 0.17% |
| 1 | Year ended February 29 |
| 2 | Calculated based upon average shares outstanding |
| 3 | Returns for periods of less than one year are not annualized. |
| 4 | Portfolio turnover rate is calculated by multiplying the Fund’s ownership percentage in each respective affiliated Master Portfolio by the corresponding affiliated Master Portfolio’s purchases and sales. |
The accompanying notes are an integral part of these financial statements.
96 | Target Date Retirement Funds
Financial highlights
Target 2025 Fund
(For a share outstanding throughout each period)
| | | Year ended February 28 |
| Class R6 | Six months ended
August 31, 2021
(unaudited) | 2021 | 2020 1 | 2019 | 2018 | 2017 |
Net asset value, beginning of period
| $5.76 | $5.61 | $5.61 | $6.44 | $10.51 | $9.80 |
Net investment income
| 0.05 | 0.19 | 0.15 2 | 0.16 2 | 0.25 | 0.20 2 |
Net realized and unrealized gains (losses) on investments
| 0.41 | 0.58 | 0.20 | 0.01 | 0.60 | 0.87 |
Total from investment operations
| 0.46 | 0.77 | 0.35 | 0.17 | 0.85 | 1.07 |
| Distributions to shareholders from | | | | | | |
Net investment income
| 0.00 | (0.13) | (0.15) | (0.17) | (0.08) | (0.19) |
Net realized gains
| 0.00 | (0.49) | (0.20) | (0.83) | (4.84) | (0.17) |
Total distributions to shareholders
| 0.00 | (0.62) | (0.35) | (1.00) | (4.92) | (0.36) |
Net asset value, end of period
| $6.22 | $5.76 | $5.61 | $5.61 | $6.44 | $10.51 |
Total return3
| 7.99% | 14.04% | 6.15% | 3.41% | 7.54% | 11.04% |
| Ratios to average net assets (annualized)* | | | | | | |
Gross expenses
| 0.30% | 0.33% | 0.34% | 0.35% | 0.39% | 0.41% |
Net expenses
| 0.14% | 0.15% | 0.19% | 0.19% | 0.26% | 0.35% |
Net investment income
| 2.09% | 2.05% | 2.49% | 2.57% | 2.16% | 1.92% |
| Supplemental data | | | | | | |
Portfolio turnover rate4
| 52% | 83% | 36% | 43% | 67% | 36% |
Net assets, end of period (000s omitted)
| $94,840 | $84,191 | $106,756 | $131,314 | $201,812 | $372,101 |
| * | Ratios include net expenses allocated from the affiliated Master Portfolios which were as follows: |
| Six months ended August 31, 2021 (unaudited) | 0.10% |
| Year ended February 28, 2021 | 0.11% |
| Year ended February 29, 2020 | 0.13% |
| Year ended February 28, 2019 | 0.15% |
| Year ended February 28, 2018 | 0.17% |
| Year ended February 28, 2017 | 0.16% |
| 1 | Year ended February 29 |
| 2 | Calculated based upon average shares outstanding |
| 3 | Returns for periods of less than one year are not annualized. |
| 4 | Portfolio turnover rate is calculated by multiplying the Fund’s ownership percentage in each respective affiliated Master Portfolio by the corresponding affiliated Master Portfolio’s purchases and sales. |
The accompanying notes are an integral part of these financial statements.
Target Date Retirement Funds | 97
Financial highlights
Target 2025 Fund
(For a share outstanding throughout each period)
| | | Year ended February 28 |
| Administrator Class | Six months ended
August 31, 2021
(unaudited) | 2021 | 2020 1 | 2019 | 2018 | 2017 |
Net asset value, beginning of period
| $5.83 | $5.67 | $5.66 | $6.48 | $10.55 | $9.82 |
Net investment income (loss)
| (0.21) | 0.06 | 0.13 2 | 0.15 2 | 0.19 | 0.17 2 |
Net realized and unrealized gains (losses) on investments
| 0.66 | 0.70 | 0.21 | (0.00) 3 | 0.62 | 0.89 |
Total from investment operations
| 0.45 | 0.76 | 0.34 | 0.15 | 0.81 | 1.06 |
| Distributions to shareholders from | | | | | | |
Net investment income
| 0.00 | (0.11) | (0.13) | (0.14) | (0.04) | (0.16) |
Net realized gains
| 0.00 | (0.49) | (0.20) | (0.83) | (4.84) | (0.17) |
Total distributions to shareholders
| 0.00 | (0.60) | (0.33) | (0.97) | (4.88) | (0.33) |
Net asset value, end of period
| $6.28 | $5.83 | $5.67 | $5.66 | $6.48 | $10.55 |
Total return4
| 7.72% | 13.71% | 5.88% | 2.94% | 7.12% | 10.87% |
| Ratios to average net assets (annualized)* | | | | | | |
Gross expenses
| 0.65% | 0.69% | 0.69% | 0.70% | 0.73% | 0.76% |
Net expenses
| 0.49% | 0.50% | 0.54% | 0.54% | 0.61% | 0.70% |
Net investment income
| 1.75% | 1.70% | 2.16% | 2.27% | 1.81% | 1.59% |
| Supplemental data | | | | | | |
Portfolio turnover rate5
| 52% | 83% | 36% | 43% | 67% | 36% |
Net assets, end of period (000s omitted)
| $8,428 | $10,401 | $10,650 | $15,362 | $43,559 | $65,620 |
| * | Ratios include net expenses allocated from the affiliated Master Portfolios which were as follows: |
| Six months ended August 31, 2021 (unaudited) | 0.10% |
| Year ended February 28, 2021 | 0.11% |
| Year ended February 29, 2020 | 0.13% |
| Year ended February 28, 2019 | 0.15% |
| Year ended February 28, 2018 | 0.17% |
| Year ended February 28, 2017 | 0.16% |
| 1 | Year ended February 29 |
| 2 | Calculated based upon average shares outstanding |
| 3 | Amount is more than $(0.005) |
| 4 | Returns for periods of less than one year are not annualized. |
| 5 | Portfolio turnover rate is calculated by multiplying the Fund’s ownership percentage in each respective affiliated Master Portfolio by the corresponding affiliated Master Portfolio’s purchases and sales. |
The accompanying notes are an integral part of these financial statements.
98 | Target Date Retirement Funds
Financial highlights
Target 2030 Fund
(For a share outstanding throughout each period)
| | | Year ended February 28 |
| Class A | Six months ended
August 31, 2021
(unaudited) | 2021 | 2020 1 | 2019 | 2018 | 2017 |
Net asset value, beginning of period
| $13.24 | $12.14 | $12.03 | $13.53 | $16.70 | $15.17 |
Net investment income
| 0.11 | 0.19 | 0.25 | 0.26 | 0.27 | 0.23 |
Payment from affiliate
| 0.00 | 0.00 2 | 0.00 | 0.00 | 0.00 | 0.00 |
Net realized and unrealized gains (losses) on investments
| 1.03 | 1.77 | 0.34 | (0.00) 3 | 1.25 | 1.90 |
Total from investment operations
| 1.14 | 1.96 | 0.59 | 0.26 | 1.52 | 2.13 |
| Distributions to shareholders from | | | | | | |
Net investment income
| 0.00 | (0.23) | (0.27) | (0.33) | (0.15) | (0.31) |
Net realized gains
| 0.00 | (0.63) | (0.21) | (1.43) | (4.54) | (0.29) |
Total distributions to shareholders
| 0.00 | (0.86) | (0.48) | (1.76) | (4.69) | (0.60) |
Net asset value, end of period
| $14.38 | $13.24 | $12.14 | $12.03 | $13.53 | $16.70 |
Total return4
| 8.61% | 16.32% 5 | 4.72% | 2.55% | 8.79% | 14.15% |
| Ratios to average net assets (annualized)* | | | | | | |
Gross expenses
| 0.69% | 0.72% | 0.75% | 0.76% | 0.80% | 0.84% |
Net expenses
| 0.58% | 0.59% | 0.63% | 0.65% | 0.71% | 0.82% |
Net investment income
| 1.59% | 1.58% | 1.98% | 2.04% | 1.63% | 1.32% |
| Supplemental data | | | | | | |
Portfolio turnover rate6
| 52% | 85% | 36% | 43% | 61% | 31% |
Net assets, end of period (000s omitted)
| $167,657 | $166,161 | $163,774 | $177,608 | $228,015 | $230,044 |
| * | Ratios include net expenses allocated from the affiliated Master Portfolios which were as follows: |
| Six months ended August 31, 2021 (unaudited) | 0.11% |
| Year ended February 28, 2021 | 0.11% |
| Year ended February 29, 2020 | 0.14% |
| Year ended February 28, 2019 | 0.15% |
| Year ended February 28, 2018 | 0.17% |
| Year ended February 28, 2017 | 0.17% |
| 1 | Year ended February 29 |
| 2 | Amount is less than $0.005. |
| 3 | Amount is more than $(0.005) |
| 4 | Total return calculations do not include any sales charges. Returns for periods of less than one year are not annualized. |
| 5 | During the year ended February 28, 2021, the Fund received a payment from an affiliate that had an impact of less than 0.005% on total return. See Note 4 in the Notes to Financial Statements for additional information. |
| 6 | Portfolio turnover rate is calculated by multiplying the Fund’s ownership percentage in each respective affiliated Master Portfolio by the corresponding affiliated Master Portfolio’s purchases and sales. |
The accompanying notes are an integral part of these financial statements.
Target Date Retirement Funds | 99
Financial highlights
Target 2030 Fund
(For a share outstanding throughout each period)
| | | Year ended February 28 |
| Class C | Six months ended
August 31, 2021
(unaudited) | 2021 | 2020 1 | 2019 | 2018 | 2017 |
Net asset value, beginning of period
| $12.65 | $11.60 | $11.50 | $13.01 | $16.24 | $14.79 |
Net investment income
| 0.05 2 | 0.10 2 | 0.15 | 0.16 | 0.18 | 0.07 |
Net realized and unrealized gains (losses) on investments
| 0.98 | 1.68 | 0.32 | (0.00) 3 | 1.17 | 1.88 |
Total from investment operations
| 1.03 | 1.78 | 0.47 | 0.16 | 1.35 | 1.95 |
| Distributions to shareholders from | | | | | | |
Net investment income
| 0.00 | (0.10) | (0.16) | (0.24) | (0.04) | (0.21) |
Net realized gains
| 0.00 | (0.63) | (0.21) | (1.43) | (4.54) | (0.29) |
Total distributions to shareholders
| 0.00 | (0.73) | (0.37) | (1.67) | (4.58) | (0.50) |
Net asset value, end of period
| $13.68 | $12.65 | $11.60 | $11.50 | $13.01 | $16.24 |
Total return4
| 8.14% | 15.48% | 3.92% | 1.82% | 7.95% | 13.28% |
| Ratios to average net assets (annualized)* | | | | | | |
Gross expenses
| 1.44% | 1.47% | 1.50% | 1.51% | 1.55% | 1.59% |
Net expenses
| 1.35% | 1.36% | 1.39% | 1.40% | 1.46% | 1.57% |
Net investment income
| 0.82% | 0.86% | 1.24% | 1.30% | 0.88% | 0.57% |
| Supplemental data | | | | | | |
Portfolio turnover rate5
| 52% | 85% | 36% | 43% | 61% | 31% |
Net assets, end of period (000s omitted)
| $1,190 | $1,385 | $2,060 | $2,851 | $4,748 | $4,630 |
| * | Ratios include net expenses allocated from the affiliated Master Portfolios which were as follows: |
| Six months ended August 31, 2021 (unaudited) | 0.11% |
| Year ended February 28, 2021 | 0.11% |
| Year ended February 29, 2020 | 0.14% |
| Year ended February 28, 2019 | 0.15% |
| Year ended February 28, 2018 | 0.17% |
| Year ended February 28, 2017 | 0.17% |
| 1 | Year ended February 29 |
| 2 | Calculated based upon average shares outstanding |
| 3 | Amount is more than $(0.005) |
| 4 | Total return calculations do not include any sales charges. Returns for periods of less than one year are not annualized. |
| 5 | Portfolio turnover rate is calculated by multiplying the Fund’s ownership percentage in each respective affiliated Master Portfolio by the corresponding affiliated Master Portfolio’s purchases and sales. |
The accompanying notes are an integral part of these financial statements.
100 | Target Date Retirement Funds
Financial highlights
Target 2030 Fund
(For a share outstanding throughout each period)
| | | Year ended February 28 |
| Class R | Six months ended
August 31, 2021
(unaudited) | 2021 | 2020 1 | 2019 | 2018 | 2017 |
Net asset value, beginning of period
| $13.35 | $12.16 | $12.05 | $13.55 | $16.66 | $15.14 |
Net investment income
| 0.08 | 0.26 | 0.22 | 0.23 | 0.26 | 0.18 |
Payment from affiliate
| 0.00 | 0.08 | 0.00 | 0.00 | 0.00 | 0.00 |
Net realized and unrealized gains (losses) on investments
| 1.05 | 1.68 | 0.34 | (0.00) 2 | 1.17 | 1.90 |
Total from investment operations
| 1.13 | 2.02 | 0.56 | 0.23 | 1.43 | 2.08 |
| Distributions to shareholders from | | | | | | |
Net investment income
| 0.00 | (0.20) | (0.24) | (0.30) | 0.00 | (0.27) |
Net realized gains
| 0.00 | (0.63) | (0.21) | (1.43) | (4.54) | (0.29) |
Total distributions to shareholders
| 0.00 | (0.83) | (0.45) | (1.73) | (4.54) | (0.56) |
Net asset value, end of period
| $14.48 | $13.35 | $12.16 | $12.05 | $13.55 | $16.66 |
Total return3
| 8.46% | 16.76% 4 | 4.48% | 2.37% | 8.28% | 13.88% |
| Ratios to average net assets (annualized)* | | | | | | |
Gross expenses
| 0.81% | 0.86% | 0.97% | 1.01% | 1.10% | 1.10% |
Net expenses
| 0.80% | 0.83% | 0.87% | 0.89% | 1.04% | 1.07% |
Net investment income
| 1.39% | 1.32% | 1.72% | 1.76% | 1.54% | 1.06% |
| Supplemental data | | | | | | |
Portfolio turnover rate5
| 52% | 85% | 36% | 43% | 61% | 31% |
Net assets, end of period (000s omitted)
| $55 | $51 | $44 | $40 | $34 | $904 |
| * | Ratios include net expenses allocated from the affiliated Master Portfolios which were as follows: |
| Six months ended August 31, 2021 (unaudited) | 0.07% |
| Year ended February 28, 2021 | 0.09% |
| Year ended February 29, 2020 | 0.16% |
| Year ended February 28, 2019 | 0.15% |
| Year ended February 28, 2018 | 0.19% |
| Year ended February 28, 2017 | 0.17% |
| 1 | Year ended February 29 |
| 2 | Amount is more than $(0.005) |
| 3 | Returns for periods of less than one year are not annualized. |
| 4 | During the year ended February 28, 2021, the Fund received a payment from an affiliate that had an impact of 0.74% on total return. See Note 4 in the Notes to Financial Statements for additional information. |
| 5 | Portfolio turnover rate is calculated by multiplying the Fund’s ownership percentage in each respective affiliated Master Portfolio by the corresponding affiliated Master Portfolio’s purchases and sales. |
The accompanying notes are an integral part of these financial statements.
Target Date Retirement Funds | 101
Financial highlights
Target 2030 Fund
(For a share outstanding throughout each period)
| | | Year ended February 28 |
| Class R4 | Six months ended
August 31, 2021
(unaudited) | 2021 | 2020 1 | 2019 | 2018 | 2017 |
Net asset value, beginning of period
| $13.60 | $12.45 | $12.32 | $13.81 | $16.95 | $15.38 |
Net investment income
| 0.19 2 | 0.25 2 | 0.29 | 0.34 | 0.34 | 0.27 |
Net realized and unrealized gains (losses) on investments
| 1.00 | 1.80 | 0.36 | (0.03) | 1.25 | 1.94 |
Total from investment operations
| 1.19 | 2.05 | 0.65 | 0.31 | 1.59 | 2.21 |
| Distributions to shareholders from | | | | | | |
Net investment income
| 0.00 | (0.27) | (0.31) | (0.37) | (0.19) | (0.35) |
Net realized gains
| 0.00 | (0.63) | (0.21) | (1.43) | (4.54) | (0.29) |
Total distributions to shareholders
| 0.00 | (0.90) | (0.52) | (1.80) | (4.73) | (0.64) |
Net asset value, end of period
| $14.79 | $13.60 | $12.45 | $12.32 | $13.81 | $16.95 |
Total return3
| 8.75% | 16.64% | 5.07% | 2.88% | 9.09% | 14.52% |
| Ratios to average net assets (annualized)* | | | | | | |
Gross expenses
| 0.41% | 0.44% | 0.47% | 0.48% | 0.53% | 0.56% |
Net expenses
| 0.29% | 0.30% | 0.34% | 0.34% | 0.42% | 0.51% |
Net investment income
| 1.88% | 1.97% | 2.28% | 2.45% | 1.95% | 1.64% |
| Supplemental data | | | | | | |
Portfolio turnover rate4
| 52% | 85% | 36% | 43% | 61% | 31% |
Net assets, end of period (000s omitted)
| $32,466 | $28,910 | $51,595 | $57,366 | $219,799 | $507,587 |
| * | Ratios include net expenses allocated from the affiliated Master Portfolios which were as follows: |
| Six months ended August 31, 2021 (unaudited) | 0.11% |
| Year ended February 28, 2021 | 0.12% |
| Year ended February 29, 2020 | 0.14% |
| Year ended February 28, 2019 | 0.15% |
| Year ended February 28, 2018 | 0.17% |
| Year ended February 28, 2017 | 0.17% |
| 1 | Year ended February 29 |
| 2 | Calculated based upon average shares outstanding |
| 3 | Returns for periods of less than one year are not annualized. |
| 4 | Portfolio turnover rate is calculated by multiplying the Fund’s ownership percentage in each respective affiliated Master Portfolio by the corresponding affiliated Master Portfolio’s purchases and sales. |
The accompanying notes are an integral part of these financial statements.
102 | Target Date Retirement Funds
Financial highlights
Target 2030 Fund
(For a share outstanding throughout each period)
| | | Year ended February 28 |
| Class R6 | Six months ended
August 31, 2021
(unaudited) | 2021 | 2020 1 | 2019 | 2018 | 2017 |
Net asset value, beginning of period
| $13.57 | $12.42 | $12.30 | $13.79 | $16.93 | $15.37 |
Net investment income
| 0.18 | 0.33 | 0.32 | 0.34 | 0.36 | 0.31 |
Net realized and unrealized gains (losses) on investments
| 1.02 | 1.74 | 0.33 | (0.01) | 1.26 | 1.92 |
Total from investment operations
| 1.20 | 2.07 | 0.65 | 0.33 | 1.62 | 2.23 |
| Distributions to shareholders from | | | | | | |
Net investment income
| 0.00 | (0.29) | (0.32) | (0.39) | (0.22) | (0.38) |
Net realized gains
| 0.00 | (0.63) | (0.21) | (1.43) | (4.54) | (0.29) |
Total distributions to shareholders
| 0.00 | (0.92) | (0.53) | (1.82) | (4.76) | (0.67) |
Net asset value, end of period
| $14.77 | $13.57 | $12.42 | $12.30 | $13.79 | $16.93 |
Total return2
| 8.84% | 16.84% | 5.15% | 3.08% | 9.28% | 14.63% |
| Ratios to average net assets (annualized)* | | | | | | |
Gross expenses
| 0.26% | 0.29% | 0.32% | 0.33% | 0.38% | 0.41% |
Net expenses
| 0.14% | 0.15% | 0.19% | 0.19% | 0.26% | 0.36% |
Net investment income
| 2.03% | 2.02% | 2.41% | 2.51% | 2.10% | 1.87% |
| Supplemental data | | | | | | |
Portfolio turnover rate3
| 52% | 85% | 36% | 43% | 61% | 31% |
Net assets, end of period (000s omitted)
| $226,136 | $219,419 | $231,645 | $230,953 | $353,891 | $618,551 |
| * | Ratios include net expenses allocated from the affiliated Master Portfolios which were as follows: |
| Six months ended August 31, 2021 (unaudited) | 0.11% |
| Year ended February 28, 2021 | 0.11% |
| Year ended February 29, 2020 | 0.14% |
| Year ended February 28, 2019 | 0.15% |
| Year ended February 28, 2018 | 0.17% |
| Year ended February 28, 2017 | 0.16% |
| 1 | Year ended February 29 |
| 2 | Returns for periods of less than one year are not annualized. |
| 3 | Portfolio turnover rate is calculated by multiplying the Fund’s ownership percentage in each respective affiliated Master Portfolio by the corresponding affiliated Master Portfolio’s purchases and sales. |
The accompanying notes are an integral part of these financial statements.
Target Date Retirement Funds | 103
Financial highlights
Target 2030 Fund
(For a share outstanding throughout each period)
| | | Year ended February 28 |
| Administrator Class | Six months ended
August 31, 2021
(unaudited) | 2021 | 2020 1 | 2019 | 2018 | 2017 |
Net asset value, beginning of period
| $13.60 | $12.45 | $12.32 | $13.80 | $16.94 | $15.37 |
Net investment income
| 0.12 2 | 0.17 | 0.27 | 0.30 | 0.28 | 0.25 |
Net realized and unrealized gains (losses) on investments
| 1.05 | 1.85 | 0.35 | (0.02) | 1.27 | 1.93 |
Total from investment operations
| 1.17 | 2.02 | 0.62 | 0.28 | 1.55 | 2.18 |
| Distributions to shareholders from | | | | | | |
Net investment income
| 0.00 | (0.24) | (0.28) | (0.33) | (0.15) | (0.32) |
Net realized gains
| 0.00 | (0.63) | (0.21) | (1.43) | (4.54) | (0.29) |
Total distributions to shareholders
| 0.00 | (0.87) | (0.49) | (1.76) | (4.69) | (0.61) |
Net asset value, end of period
| $14.77 | $13.60 | $12.45 | $12.32 | $13.80 | $16.94 |
Total return3
| 8.60% | 16.41% | 4.86% | 2.69% | 8.86% | 14.32% |
| Ratios to average net assets (annualized)* | | | | | | |
Gross expenses
| 0.61% | 0.64% | 0.67% | 0.68% | 0.72% | 0.76% |
Net expenses
| 0.49% | 0.50% | 0.54% | 0.54% | 0.61% | 0.71% |
Net investment income
| 1.68% | 1.69% | 2.08% | 2.18% | 1.75% | 1.51% |
| Supplemental data | | | | | | |
Portfolio turnover rate4
| 52% | 85% | 36% | 43% | 61% | 31% |
Net assets, end of period (000s omitted)
| $75,163 | $73,721 | $79,552 | $89,022 | $161,583 | $262,336 |
| * | Ratios include net expenses allocated from the affiliated Master Portfolios which were as follows: |
| Six months ended August 31, 2021 (unaudited) | 0.11% |
| Year ended February 28, 2021 | 0.11% |
| Year ended February 29, 2020 | 0.14% |
| Year ended February 28, 2019 | 0.15% |
| Year ended February 28, 2018 | 0.17% |
| Year ended February 28, 2017 | 0.17% |
| 1 | Year ended February 29 |
| 2 | Calculated based upon average shares outstanding |
| 3 | Returns for periods of less than one year are not annualized. |
| 4 | Portfolio turnover rate is calculated by multiplying the Fund’s ownership percentage in each respective affiliated Master Portfolio by the corresponding affiliated Master Portfolio’s purchases and sales. |
The accompanying notes are an integral part of these financial statements.
104 | Target Date Retirement Funds
Financial highlights
Target 2035 Fund
(For a share outstanding throughout each period)
| | | Year ended February 28 |
| Class A | Six months ended
August 31, 2021
(unaudited) | 2021 | 2020 1 | 2019 | 2018 | 2017 |
Net asset value, beginning of period
| $8.19 | $7.38 | $7.38 | $8.35 | $11.25 | $9.89 |
Net investment income
| 0.07 | 0.12 | 0.15 | 0.15 | 0.18 | 0.13 |
Net realized and unrealized gains (losses) on investments
| 0.71 | 1.27 | 0.14 | (0.00) 2 | 1.01 | 1.56 |
Total from investment operations
| 0.78 | 1.39 | 0.29 | 0.15 | 1.19 | 1.69 |
| Distributions to shareholders from | | | | | | |
Net investment income
| 0.00 | (0.14) | (0.16) | (0.18) | (0.12) | (0.15) |
Net realized gains
| 0.00 | (0.44) | (0.13) | (0.94) | (3.97) | (0.18) |
Total distributions to shareholders
| 0.00 | (0.58) | (0.29) | (1.12) | (4.09) | (0.33) |
Net asset value, end of period
| $8.97 | $8.19 | $7.38 | $7.38 | $8.35 | $11.25 |
Total return3
| 9.52% | 19.04% | 3.70% | 2.48% | 10.21% | 17.33% |
| Ratios to average net assets (annualized)* | | | | | | |
Gross expenses
| 0.73% | 0.78% | 0.80% | 0.81% | 0.83% | 0.85% |
Net expenses
| 0.58% | 0.59% | 0.63% | 0.65% | 0.72% | 0.83% |
Net investment income
| 1.59% | 1.54% | 1.92% | 1.97% | 1.56% | 1.28% |
| Supplemental data | | | | | | |
Portfolio turnover rate4
| 51% | 87% | 36% | 41% | 55% | 27% |
Net assets, end of period (000s omitted)
| $102,149 | $97,610 | $95,284 | $108,389 | $118,000 | $127,294 |
| * | Ratios include net expenses allocated from the affiliated Master Portfolios which were as follows: |
| Six months ended August 31, 2021 (unaudited) | 0.12% |
| Year ended February 28, 2021 | 0.12% |
| Year ended February 29, 2020 | 0.15% |
| Year ended February 28, 2019 | 0.16% |
| Year ended February 28, 2018 | 0.18% |
| Year ended February 28, 2017 | 0.17% |
| 1 | Year ended February 29 |
| 2 | Amount is more than $(0.005) |
| 3 | Total return calculations do not include any sales charges. Returns for periods of less than one year are not annualized. |
| 4 | Portfolio turnover rate is calculated by multiplying the Fund’s ownership percentage in each respective affiliated Master Portfolio by the corresponding affiliated Master Portfolio’s purchases and sales. |
The accompanying notes are an integral part of these financial statements.
Target Date Retirement Funds | 105
Financial highlights
Target 2035 Fund
(For a share outstanding throughout each period)
| | | Year ended February 28 |
| Class R | Six months ended
August 31, 2021
(unaudited) | 2021 | 2020 1 | 2019 | 2018 | 2017 |
Net asset value, beginning of period
| $8.26 | $7.44 | $7.44 | $8.42 | $11.32 | $9.95 |
Net investment income
| 0.06 | 0.10 | 0.13 | 0.12 | 0.15 | 0.11 |
Net realized and unrealized gains (losses) on investments
| 0.71 | 1.28 | 0.15 | 0.01 | 1.01 | 1.57 |
Total from investment operations
| 0.77 | 1.38 | 0.28 | 0.13 | 1.16 | 1.68 |
| Distributions to shareholders from | | | | | | |
Net investment income
| 0.00 | (0.12) | (0.15) | (0.17) | (0.09) | (0.13) |
Net realized gains
| 0.00 | (0.44) | (0.13) | (0.94) | (3.97) | (0.18) |
Total distributions to shareholders
| 0.00 | (0.56) | (0.28) | (1.11) | (4.06) | (0.31) |
Net asset value, end of period
| $9.03 | $8.26 | $7.44 | $7.44 | $8.42 | $11.32 |
Total return2
| 9.32% | 18.81% | 3.46% | 2.16% | 9.87% | 17.09% |
| Ratios to average net assets (annualized)* | | | | | | |
Gross expenses
| 0.97% | 1.01% | 1.04% | 1.06% | 1.08% | 1.11% |
Net expenses
| 0.85% | 0.86% | 0.90% | 0.90% | 0.97% | 1.08% |
Net investment income
| 1.31% | 1.22% | 1.60% | 1.68% | 1.32% | 0.89% |
| Supplemental data | | | | | | |
Portfolio turnover rate3
| 51% | 87% | 36% | 41% | 55% | 27% |
Net assets, end of period (000s omitted)
| $539 | $461 | $318 | $250 | $192 | $171 |
| * | Ratios include net expenses allocated from the affiliated Master Portfolios which were as follows: |
| Six months ended August 31, 2021 (unaudited) | 0.11% |
| Year ended February 28, 2021 | 0.12% |
| Year ended February 29, 2020 | 0.15% |
| Year ended February 28, 2019 | 0.16% |
| Year ended February 28, 2018 | 0.18% |
| Year ended February 28, 2017 | 0.17% |
| 1 | Year ended February 29 |
| 2 | Returns for periods of less than one year are not annualized. |
| 3 | Portfolio turnover rate is calculated by multiplying the Fund’s ownership percentage in each respective affiliated Master Portfolio by the corresponding affiliated Master Portfolio’s purchases and sales. |
The accompanying notes are an integral part of these financial statements.
106 | Target Date Retirement Funds
Financial highlights
Target 2035 Fund
(For a share outstanding throughout each period)
| | | Year ended February 28 |
| Class R4 | Six months ended
August 31, 2021
(unaudited) | 2021 | 2020 1 | 2019 | 2018 | 2017 |
Net asset value, beginning of period
| $8.22 | $7.40 | $7.40 | $8.37 | $11.27 | $9.91 |
Net investment income
| 0.08 2 | 0.15 2 | 0.17 2 | 0.20 2 | 0.21 2 | 0.17 2 |
Net realized and unrealized gains (losses) on investments
| 0.71 | 1.28 | 0.15 | (0.03) | 1.02 | 1.56 |
Total from investment operations
| 0.79 | 1.43 | 0.32 | 0.17 | 1.23 | 1.73 |
| Distributions to shareholders from | | | | | | |
Net investment income
| 0.00 | (0.17) | (0.19) | (0.20) | (0.16) | (0.19) |
Net realized gains
| 0.00 | (0.44) | (0.13) | (0.94) | (3.97) | (0.18) |
Total distributions to shareholders
| 0.00 | (0.61) | (0.32) | (1.14) | (4.13) | (0.37) |
Net asset value, end of period
| $9.01 | $8.22 | $7.40 | $7.40 | $8.37 | $11.27 |
Total return3
| 9.61% | 19.51% | 3.99% | 2.80% | 10.53% | 17.68% |
| Ratios to average net assets (annualized)* | | | | | | |
Gross expenses
| 0.45% | 0.51% | 0.52% | 0.53% | 0.56% | 0.57% |
Net expenses
| 0.29% | 0.31% | 0.34% | 0.34% | 0.43% | 0.52% |
Net investment income
| 1.87% | 2.05% | 2.20% | 2.37% | 1.90% | 1.54% |
| Supplemental data | | | | | | |
Portfolio turnover rate4
| 51% | 87% | 36% | 41% | 55% | 27% |
Net assets, end of period (000s omitted)
| $10,389 | $9,228 | $26,748 | $34,388 | $82,617 | $240,025 |
| * | Ratios include net expenses allocated from the affiliated Master Portfolios which were as follows: |
| Six months ended August 31, 2021 (unaudited) | 0.12% |
| Year ended February 28, 2021 | 0.13% |
| Year ended February 29, 2020 | 0.15% |
| Year ended February 28, 2019 | 0.16% |
| Year ended February 28, 2018 | 0.18% |
| Year ended February 28, 2017 | 0.17% |
| 1 | Year ended February 29 |
| 2 | Calculated based upon average shares outstanding |
| 3 | Returns for periods of less than one year are not annualized. |
| 4 | Portfolio turnover rate is calculated by multiplying the Fund’s ownership percentage in each respective affiliated Master Portfolio by the corresponding affiliated Master Portfolio’s purchases and sales. |
The accompanying notes are an integral part of these financial statements.
Target Date Retirement Funds | 107
Financial highlights
Target 2035 Fund
(For a share outstanding throughout each period)
| | | Year ended February 28 |
| Class R6 | Six months ended
August 31, 2021
(unaudited) | 2021 | 2020 1 | 2019 | 2018 | 2017 |
Net asset value, beginning of period
| $8.21 | $7.39 | $7.39 | $8.37 | $11.27 | $9.91 |
Net investment income
| 0.08 | 0.18 | 0.18 2 | 0.25 | 0.27 | 0.20 2 |
Net realized and unrealized gains (losses) on investments
| 0.72 | 1.25 | 0.15 | (0.07) | 0.98 | 1.55 |
Total from investment operations
| 0.80 | 1.43 | 0.33 | 0.18 | 1.25 | 1.75 |
| Distributions to shareholders from | | | | | | |
Net investment income
| 0.00 | (0.17) | (0.20) | (0.22) | (0.18) | (0.21) |
Net realized gains
| 0.00 | (0.44) | (0.13) | (0.94) | (3.97) | (0.18) |
Total distributions to shareholders
| 0.00 | (0.61) | (0.33) | (1.16) | (4.15) | (0.39) |
Net asset value, end of period
| $9.01 | $8.21 | $7.39 | $7.39 | $8.37 | $11.27 |
Total return3
| 9.74% | 19.64% | 4.16% | 2.86% | 10.76% | 17.86% |
| Ratios to average net assets (annualized)* | | | | | | |
Gross expenses
| 0.30% | 0.35% | 0.37% | 0.38% | 0.41% | 0.42% |
Net expenses
| 0.14% | 0.15% | 0.19% | 0.19% | 0.27% | 0.37% |
Net investment income
| 2.02% | 1.97% | 2.38% | 2.48% | 2.04% | 1.83% |
| Supplemental data | | | | | | |
Portfolio turnover rate4
| 51% | 87% | 36% | 41% | 55% | 27% |
Net assets, end of period (000s omitted)
| $93,871 | $83,173 | $89,108 | $112,021 | $185,889 | $317,594 |
| * | Ratios include net expenses allocated from the affiliated Master Portfolios which were as follows: |
| Six months ended August 31, 2021 (unaudited) | 0.12% |
| Year ended February 28, 2021 | 0.12% |
| Year ended February 29, 2020 | 0.15% |
| Year ended February 28, 2019 | 0.16% |
| Year ended February 28, 2018 | 0.18% |
| Year ended February 28, 2017 | 0.16% |
| 1 | Year ended February 29 |
| 2 | Calculated based upon average shares outstanding |
| 3 | Returns for periods of less than one year are not annualized. |
| 4 | Portfolio turnover rate is calculated by multiplying the Fund’s ownership percentage in each respective affiliated Master Portfolio by the corresponding affiliated Master Portfolio’s purchases and sales. |
The accompanying notes are an integral part of these financial statements.
108 | Target Date Retirement Funds
Financial highlights
Target 2035 Fund
(For a share outstanding throughout each period)
| | | Year ended February 28 |
| Administrator Class | Six months ended
August 31, 2021
(unaudited) | 2021 | 2020 1 | 2019 | 2018 | 2017 |
Net asset value, beginning of period
| $8.30 | $7.47 | $7.47 | $8.41 | $11.30 | $9.94 |
Net investment income
| 0.07 2 | 0.12 | 0.16 2 | 0.18 | 0.19 | 0.16 2 |
Net realized and unrealized gains (losses) on investments
| 0.72 | 1.30 | 0.14 | (0.01) | 1.02 | 1.55 |
Total from investment operations
| 0.79 | 1.42 | 0.30 | 0.17 | 1.21 | 1.71 |
| Distributions to shareholders from | | | | | | |
Net investment income
| 0.00 | (0.15) | (0.17) | (0.17) | (0.13) | (0.17) |
Net realized gains
| 0.00 | (0.44) | (0.13) | (0.94) | (3.97) | (0.18) |
Total distributions to shareholders
| 0.00 | (0.59) | (0.30) | (1.11) | (4.10) | (0.35) |
Net asset value, end of period
| $9.09 | $8.30 | $7.47 | $7.47 | $8.41 | $11.30 |
Total return3
| 9.52% | 19.17% | 3.75% | 2.64% | 10.33% | 17.38% |
| Ratios to average net assets (annualized)* | | | | | | |
Gross expenses
| 0.65% | 0.70% | 0.72% | 0.72% | 0.74% | 0.77% |
Net expenses
| 0.49% | 0.50% | 0.54% | 0.54% | 0.61% | 0.72% |
Net investment income
| 1.70% | 1.66% | 2.04% | 2.20% | 1.67% | 1.52% |
| Supplemental data | | | | | | |
Portfolio turnover rate4
| 51% | 87% | 36% | 41% | 55% | 27% |
Net assets, end of period (000s omitted)
| $5,445 | $6,541 | $6,888 | $9,608 | $35,678 | $50,898 |
| * | Ratios include net expenses allocated from the affiliated Master Portfolios which were as follows: |
| Six months ended August 31, 2021 (unaudited) | 0.12% |
| Year ended February 28, 2021 | 0.12% |
| Year ended February 29, 2020 | 0.15% |
| Year ended February 28, 2019 | 0.16% |
| Year ended February 28, 2018 | 0.18% |
| Year ended February 28, 2017 | 0.16% |
| 1 | Year ended February 29 |
| 2 | Calculated based upon average shares outstanding |
| 3 | Returns for periods of less than one year are not annualized. |
| 4 | Portfolio turnover rate is calculated by multiplying the Fund’s ownership percentage in each respective affiliated Master Portfolio by the corresponding affiliated Master Portfolio’s purchases and sales. |
The accompanying notes are an integral part of these financial statements.
Target Date Retirement Funds | 109
Financial highlights
Target 2040 Fund
(For a share outstanding throughout each period)
| | | Year ended February 28 |
| Class A | Six months ended
August 31, 2021
(unaudited) | 2021 | 2020 1 | 2019 | 2018 | 2017 |
Net asset value, beginning of period
| $16.11 | $14.02 | $14.09 | $16.02 | $19.43 | $16.74 |
Net investment income
| 0.14 | 0.22 | 0.28 | 0.29 | 0.31 | 0.23 |
Payment from affiliate
| 0.00 | 0.00 2 | 0.00 | 0.00 | 0.00 | 0.00 |
Net realized and unrealized gains (losses) on investments
| 1.57 | 2.69 | 0.12 | (0.05) | 1.93 | 3.08 |
Total from investment operations
| 1.71 | 2.91 | 0.40 | 0.24 | 2.24 | 3.31 |
| Distributions to shareholders from | | | | | | |
Net investment income
| 0.00 | (0.26) | (0.29) | (0.36) | (0.31) | (0.27) |
Net realized gains
| 0.00 | (0.56) | (0.18) | (1.81) | (5.34) | (0.35) |
Total distributions to shareholders
| 0.00 | (0.82) | (0.47) | (2.17) | (5.65) | (0.62) |
Net asset value, end of period
| $17.82 | $16.11 | $14.02 | $14.09 | $16.02 | $19.43 |
Total return3
| 10.61% | 20.97% 4 | 2.68% | 2.32% | 11.24% | 20.01% |
| Ratios to average net assets (annualized)* | | | | | | |
Gross expenses
| 0.71% | 0.74% | 0.77% | 0.78% | 0.81% | 0.85% |
Net expenses
| 0.59% | 0.60% | 0.64% | 0.65% | 0.72% | 0.83% |
Net investment income
| 1.59% | 1.49% | 1.85% | 1.91% | 1.51% | 1.21% |
| Supplemental data | | | | | | |
Portfolio turnover rate5
| 49% | 87% | 36% | 40% | 51% | 24% |
Net assets, end of period (000s omitted)
| $192,854 | $184,160 | $175,942 | $189,990 | $223,769 | $218,689 |
| * | Ratios include net expenses allocated from the affiliated Master Portfolios which were as follows: |
| Six months ended August 31, 2021 (unaudited) | 0.12% |
| Year ended February 28, 2021 | 0.13% |
| Year ended February 29, 2020 | 0.15% |
| Year ended February 28, 2019 | 0.17% |
| Year ended February 28, 2018 | 0.18% |
| Year ended February 28, 2017 | 0.17% |
| 1 | Year ended February 29 |
| 2 | Amount is less than $0.005. |
| 3 | Total return calculations do not include any sales charges. Returns for periods of less than one year are not annualized. |
| 4 | During the year ended February 28, 2021, the Fund received a payment from an affiliate that had an impact of less than 0.005% on total return. See Note 4 in the Notes to Financial Statements for additional information. |
| 5 | Portfolio turnover rate is calculated by multiplying the Fund’s ownership percentage in each respective affiliated Master Portfolio by the corresponding affiliated Master Portfolio’s purchases and sales. |
The accompanying notes are an integral part of these financial statements.
110 | Target Date Retirement Funds
Financial highlights
Target 2040 Fund
(For a share outstanding throughout each period)
| | | Year ended February 28 |
| Class C | Six months ended
August 31, 2021
(unaudited) | 2021 | 2020 1 | 2019 | 2018 | 2017 |
Net asset value, beginning of period
| $14.38 | $12.56 | $12.66 | $14.61 | $18.19 | $15.71 |
Net investment income
| 0.06 | 0.10 2 | 0.15 2 | 0.17 2 | 0.14 2 | 0.04 2 |
Net realized and unrealized gains (losses) on investments
| 1.40 | 2.41 | 0.11 | (0.06) | 1.81 | 2.94 |
Total from investment operations
| 1.46 | 2.51 | 0.26 | 0.11 | 1.95 | 2.98 |
| Distributions to shareholders from | | | | | | |
Net investment income
| 0.00 | (0.13) | (0.18) | (0.25) | (0.19) | (0.15) |
Net realized gains
| 0.00 | (0.56) | (0.18) | (1.81) | (5.34) | (0.35) |
Total distributions to shareholders
| 0.00 | (0.69) | (0.36) | (2.06) | (5.53) | (0.50) |
Net asset value, end of period
| $15.84 | $14.38 | $12.56 | $12.66 | $14.61 | $18.19 |
Total return3
| 10.15% | 20.19% | 1.87% | 1.55% | 10.41% | 19.11% |
| Ratios to average net assets (annualized)* | | | | | | |
Gross expenses
| 1.46% | 1.49% | 1.52% | 1.53% | 1.56% | 1.60% |
Net expenses
| 1.35% | 1.36% | 1.39% | 1.40% | 1.46% | 1.58% |
Net investment income
| 0.84% | 0.77% | 1.12% | 1.21% | 0.76% | 0.47% |
| Supplemental data | | | | | | |
Portfolio turnover rate4
| 49% | 87% | 36% | 40% | 51% | 24% |
Net assets, end of period (000s omitted)
| $1,263 | $1,417 | $1,906 | $2,754 | $5,292 | $4,782 |
| * | Ratios include net expenses allocated from the affiliated Master Portfolios which were as follows: |
| Six months ended August 31, 2021 (unaudited) | 0.12% |
| Year ended February 28, 2021 | 0.13% |
| Year ended February 29, 2020 | 0.15% |
| Year ended February 28, 2019 | 0.17% |
| Year ended February 28, 2018 | 0.18% |
| Year ended February 28, 2017 | 0.17% |
| 1 | Year ended February 29 |
| 2 | Calculated based upon average shares outstanding |
| 3 | Total return calculations do not include any sales charges. Returns for periods of less than one year are not annualized. |
| 4 | Portfolio turnover rate is calculated by multiplying the Fund’s ownership percentage in each respective affiliated Master Portfolio by the corresponding affiliated Master Portfolio’s purchases and sales. |
The accompanying notes are an integral part of these financial statements.
Target Date Retirement Funds | 111
Financial highlights
Target 2040 Fund
(For a share outstanding throughout each period)
| | | Year ended February 28 |
| Class R | Six months ended
August 31, 2021
(unaudited) | 2021 | 2020 1 | 2019 | 2018 | 2017 |
Net asset value, beginning of period
| $16.18 | $14.01 | $14.08 | $16.02 | $19.36 | $16.69 |
Net investment income
| 0.12 | 0.20 | 0.25 | 0.25 2 | 0.27 2 | 0.18 |
Payment from affiliate
| 0.00 | 0.07 | 0.00 | 0.00 | 0.00 | 0.00 |
Net realized and unrealized gains (losses) on investments
| 1.57 | 2.69 | 0.12 | (0.05) | 1.93 | 3.07 |
Total from investment operations
| 1.69 | 2.96 | 0.37 | 0.20 | 2.20 | 3.25 |
| Distributions to shareholders from | | | | | | |
Net investment income
| 0.00 | (0.23) | (0.26) | (0.33) | (0.20) | (0.23) |
Net realized gains
| 0.00 | (0.56) | (0.18) | (1.81) | (5.34) | (0.35) |
Total distributions to shareholders
| 0.00 | (0.79) | (0.44) | (2.14) | (5.54) | (0.58) |
Net asset value, end of period
| $17.87 | $16.18 | $14.01 | $14.08 | $16.02 | $19.36 |
Total return3
| 10.44% | 21.30% 4 | 2.44% | 2.04% | 11.07% | 19.68% |
| Ratios to average net assets (annualized)* | | | | | | |
Gross expenses
| 0.90% | 0.92% | 1.02% | 1.02% | 1.08% | 1.10% |
Net expenses
| 0.85% | 0.85% | 0.89% | 0.90% | 1.01% | 1.08% |
Net investment income
| 1.33% | 1.20% | 1.57% | 1.63% | 1.40% | 0.94% |
| Supplemental data | | | | | | |
Portfolio turnover rate5
| 49% | 87% | 36% | 40% | 51% | 24% |
Net assets, end of period (000s omitted)
| $95 | $83 | $66 | $62 | $56 | $394 |
| * | Ratios include net expenses allocated from the affiliated Master Portfolios which were as follows: |
| Six months ended August 31, 2021 (unaudited) | 0.12% |
| Year ended February 28, 2021 | 0.12% |
| Year ended February 29, 2020 | 0.18% |
| Year ended February 28, 2019 | 0.16% |
| Year ended February 28, 2018 | 0.18% |
| Year ended February 28, 2017 | 0.17% |
| 1 | Year ended February 29 |
| 2 | Calculated based upon average shares outstanding |
| 3 | Returns for periods of less than one year are not annualized. |
| 4 | During the year ended February 28, 2021, the Fund received a payment from an affiliate that had an impact of 0.49% on total return. See Note 4 in the Notes to Financial Statements for additional information. |
| 5 | Portfolio turnover rate is calculated by multiplying the Fund’s ownership percentage in each respective affiliated Master Portfolio by the corresponding affiliated Master Portfolio’s purchases and sales. |
The accompanying notes are an integral part of these financial statements.
112 | Target Date Retirement Funds
Financial highlights
Target 2040 Fund
(For a share outstanding throughout each period)
| | | Year ended February 28 |
| Class R4 | Six months ended
August 31, 2021
(unaudited) | 2021 | 2020 1 | 2019 | 2018 | 2017 |
Net asset value, beginning of period
| $16.76 | $14.54 | $14.60 | $16.51 | $19.86 | $17.09 |
Net investment income
| 0.19 | 0.28 2 | 0.33 2 | 0.39 2 | 0.36 | 0.27 |
Net realized and unrealized gains (losses) on investments
| 1.61 | 2.81 | 0.13 | (0.08) | 1.99 | 3.18 |
Total from investment operations
| 1.80 | 3.09 | 0.46 | 0.31 | 2.35 | 3.45 |
| Distributions to shareholders from | | | | | | |
Net investment income
| 0.00 | (0.31) | (0.34) | (0.41) | (0.36) | (0.33) |
Net realized gains
| 0.00 | (0.56) | (0.18) | (1.81) | (5.34) | (0.35) |
Total distributions to shareholders
| 0.00 | (0.87) | (0.52) | (2.22) | (5.70) | (0.68) |
Net asset value, end of period
| $18.56 | $16.76 | $14.54 | $14.60 | $16.51 | $19.86 |
Total return3
| 10.74% | 21.45% | 2.94% | 2.69% | 11.56% | 20.43% |
| Ratios to average net assets (annualized)* | | | | | | |
Gross expenses
| 0.43% | 0.46% | 0.49% | 0.50% | 0.54% | 0.57% |
Net expenses
| 0.29% | 0.30% | 0.34% | 0.34% | 0.42% | 0.52% |
Net investment income
| 1.89% | 1.88% | 2.14% | 2.38% | 1.85% | 1.54% |
| Supplemental data | | | | | | |
Portfolio turnover rate4
| 49% | 87% | 36% | 40% | 51% | 24% |
Net assets, end of period (000s omitted)
| $30,673 | $26,903 | $41,864 | $45,177 | $189,896 | $388,622 |
| * | Ratios include net expenses allocated from the affiliated Master Portfolios which were as follows: |
| Six months ended August 31, 2021 (unaudited) | 0.12% |
| Year ended February 28, 2021 | 0.13% |
| Year ended February 29, 2020 | 0.15% |
| Year ended February 28, 2019 | 0.17% |
| Year ended February 28, 2018 | 0.18% |
| Year ended February 28, 2017 | 0.17% |
| 1 | Year ended February 29 |
| 2 | Calculated based upon average shares outstanding |
| 3 | Returns for periods of less than one year are not annualized. |
| 4 | Portfolio turnover rate is calculated by multiplying the Fund’s ownership percentage in each respective affiliated Master Portfolio by the corresponding affiliated Master Portfolio’s purchases and sales. |
The accompanying notes are an integral part of these financial statements.
Target Date Retirement Funds | 113
Financial highlights
Target 2040 Fund
(For a share outstanding throughout each period)
| | | Year ended February 28 |
| Class R6 | Six months ended
August 31, 2021
(unaudited) | 2021 | 2020 1 | 2019 | 2018 | 2017 |
Net asset value, beginning of period
| $16.74 | $14.52 | $14.58 | $16.50 | $19.85 | $17.09 |
Net investment income
| 0.22 | 0.32 | 0.35 | 0.39 2 | 0.40 2 | 0.41 |
Net realized and unrealized gains (losses) on investments
| 1.60 | 2.79 | 0.13 | (0.06) | 1.98 | 3.06 |
Total from investment operations
| 1.82 | 3.11 | 0.48 | 0.33 | 2.38 | 3.47 |
| Distributions to shareholders from | | | | | | |
Net investment income
| 0.00 | (0.33) | (0.36) | (0.44) | (0.39) | (0.36) |
Net realized gains
| 0.00 | (0.56) | (0.18) | (1.81) | (5.34) | (0.35) |
Total distributions to shareholders
| 0.00 | (0.89) | (0.54) | (2.25) | (5.73) | (0.71) |
Net asset value, end of period
| $18.56 | $16.74 | $14.52 | $14.58 | $16.50 | $19.85 |
Total return3
| 10.87% | 21.64% | 3.09% | 2.81% | 11.74% | 20.56% |
| Ratios to average net assets (annualized)* | | | | | | |
Gross expenses
| 0.28% | 0.30% | 0.34% | 0.35% | 0.39% | 0.41% |
Net expenses
| 0.14% | 0.15% | 0.19% | 0.19% | 0.27% | 0.37% |
Net investment income
| 2.05% | 1.93% | 2.29% | 2.40% | 2.00% | 1.80% |
| Supplemental data | | | | | | |
Portfolio turnover rate4
| 49% | 87% | 36% | 40% | 51% | 24% |
Net assets, end of period (000s omitted)
| $194,329 | $194,078 | $185,291 | $184,594 | $283,562 | $489,693 |
| * | Ratios include net expenses allocated from the affiliated Master Portfolios which were as follows: |
| Six months ended August 31, 2021 (unaudited) | 0.12% |
| Year ended February 28, 2021 | 0.13% |
| Year ended February 29, 2020 | 0.15% |
| Year ended February 28, 2019 | 0.17% |
| Year ended February 28, 2018 | 0.18% |
| Year ended February 28, 2017 | 0.16% |
| 1 | Year ended February 29 |
| 2 | Calculated based upon average shares outstanding |
| 3 | Returns for periods of less than one year are not annualized. |
| 4 | Portfolio turnover rate is calculated by multiplying the Fund’s ownership percentage in each respective affiliated Master Portfolio by the corresponding affiliated Master Portfolio’s purchases and sales. |
The accompanying notes are an integral part of these financial statements.
114 | Target Date Retirement Funds
Financial highlights
Target 2040 Fund
(For a share outstanding throughout each period)
| | | Year ended February 28 |
| Administrator Class | Six months ended
August 31, 2021
(unaudited) | 2021 | 2020 1 | 2019 | 2018 | 2017 |
Net asset value, beginning of period
| $16.71 | $14.51 | $14.56 | $16.47 | $19.82 | $17.07 |
Net investment income
| 0.16 | 0.30 | 0.32 | 0.34 2 | 0.33 2 | 0.25 |
Net realized and unrealized gains (losses) on investments
| 1.63 | 2.73 | 0.12 | (0.07) | 1.98 | 3.14 |
Total from investment operations
| 1.79 | 3.03 | 0.44 | 0.27 | 2.31 | 3.39 |
| Distributions to shareholders from | | | | | | |
Net investment income
| 0.00 | (0.27) | (0.31) | (0.37) | (0.32) | (0.29) |
Net realized gains
| 0.00 | (0.56) | (0.18) | (1.81) | (5.34) | (0.35) |
Total distributions to shareholders
| 0.00 | (0.83) | (0.49) | (2.18) | (5.66) | (0.64) |
Net asset value, end of period
| $18.50 | $16.71 | $14.51 | $14.56 | $16.47 | $19.82 |
Total return3
| 10.71% | 21.11% | 2.82% | 2.40% | 11.38% | 20.09% |
| Ratios to average net assets (annualized)* | | | | | | |
Gross expenses
| 0.63% | 0.66% | 0.69% | 0.70% | 0.73% | 0.76% |
Net expenses
| 0.49% | 0.50% | 0.54% | 0.54% | 0.61% | 0.72% |
Net investment income
| 1.69% | 1.61% | 1.95% | 2.09% | 1.63% | 1.43% |
| Supplemental data | | | | | | |
Portfolio turnover rate4
| 49% | 87% | 36% | 40% | 51% | 24% |
Net assets, end of period (000s omitted)
| $64,242 | $58,544 | $63,232 | $71,411 | $132,365 | $197,272 |
| * | Ratios include net expenses allocated from the affiliated Master Portfolios which were as follows: |
| Six months ended August 31, 2021 (unaudited) | 0.12% |
| Year ended February 28, 2021 | 0.13% |
| Year ended February 29, 2020 | 0.15% |
| Year ended February 28, 2019 | 0.17% |
| Year ended February 28, 2018 | 0.18% |
| Year ended February 28, 2017 | 0.17% |
| 1 | Year ended February 29 |
| 2 | Calculated based upon average shares outstanding |
| 3 | Returns for periods of less than one year are not annualized. |
| 4 | Portfolio turnover rate is calculated by multiplying the Fund’s ownership percentage in each respective affiliated Master Portfolio by the corresponding affiliated Master Portfolio’s purchases and sales. |
The accompanying notes are an integral part of these financial statements.
Target Date Retirement Funds | 115
Financial highlights
Target 2045 Fund
(For a share outstanding throughout each period)
| | | Year ended February 28 |
| Class A | Six months ended
August 31, 2021
(unaudited) | 2021 | 2020 1 | 2019 | 2018 | 2017 |
Net asset value, beginning of period
| $9.14 | $8.07 | $8.13 | $9.18 | $11.91 | $10.07 |
Net investment income
| 0.08 | 0.12 | 0.16 2 | 0.16 | 0.18 2 | 0.13 |
Payment from affiliate
| 0.00 | 0.00 3 | 0.00 | 0.00 | 0.00 | 0.00 |
Net realized and unrealized gains (losses) on investments
| 0.94 | 1.64 | 0.03 | (0.03) | 1.28 | 2.05 |
Total from investment operations
| 1.02 | 1.76 | 0.19 | 0.13 | 1.46 | 2.18 |
| Distributions to shareholders from | | | | | | |
Net investment income
| 0.00 | (0.15) | (0.19) | (0.19) | (0.20) | (0.17) |
Net realized gains
| 0.00 | (0.54) | (0.06) | (0.99) | (3.99) | (0.17) |
Total distributions to shareholders
| 0.00 | (0.69) | (0.25) | (1.18) | (4.19) | (0.34) |
Net asset value, end of period
| $10.16 | $9.14 | $8.07 | $8.13 | $9.18 | $11.91 |
Total return4
| 11.16% | 22.27% 5 | 2.14% | 2.21% | 11.98% | 21.85% |
| Ratios to average net assets (annualized)* | | | | | | |
Gross expenses
| 0.80% | 0.89% | 0.88% | 0.85% | 0.86% | 0.86% |
Net expenses
| 0.58% | 0.59% | 0.63% | 0.65% | 0.72% | 0.83% |
Net investment income
| 1.62% | 1.48% | 1.85% | 1.88% | 1.48% | 1.22% |
| Supplemental data | | | | | | |
Portfolio turnover rate6
| 47% | 87% | 36% | 39% | 48% | 22% |
Net assets, end of period (000s omitted)
| $41,374 | $40,542 | $42,792 | $56,491 | $61,914 | $70,570 |
| * | Ratios include net expenses allocated from the affiliated Master Portfolios which were as follows: |
| Six months ended August 31, 2021 (unaudited) | 0.12% |
| Year ended February 28, 2021 | 0.13% |
| Year ended February 29, 2020 | 0.16% |
| Year ended February 28, 2019 | 0.17% |
| Year ended February 28, 2018 | 0.19% |
| Year ended February 28, 2017 | 0.17% |
| 1 | Year ended February 29 |
| 2 | Calculated based upon average shares outstanding |
| 3 | Amount is less than $0.005. |
| 4 | Total return calculations do not include any sales charges. Returns for periods of less than one year are not annualized. |
| 5 | During the year ended February 28, 2021, the Fund received a payment from an affiliate that had an impact of less than 0.005% on total return. See Note 4 in the Notes to Financial Statements for additional information. |
| 6 | Portfolio turnover rate is calculated by multiplying the Fund’s ownership percentage in each respective affiliated Master Portfolio by the corresponding affiliated Master Portfolio’s purchases and sales. |
The accompanying notes are an integral part of these financial statements.
116 | Target Date Retirement Funds
Financial highlights
Target 2045 Fund
(For a share outstanding throughout each period)
| | | Year ended February 28 |
| Class R | Six months ended
August 31, 2021
(unaudited) | 2021 | 2020 1 | 2019 | 2018 | 2017 |
Net asset value, beginning of period
| $9.38 | $8.22 | $8.29 | $9.33 | $12.04 | $10.19 |
Net investment income
| 0.07 | 0.11 | 0.13 | 0.14 | 0.16 | 0.11 |
Payment from affiliate
| 0.00 | 0.05 | 0.00 | 0.00 | 0.00 | 0.00 |
Net realized and unrealized gains (losses) on investments
| 0.96 | 1.67 | 0.03 | (0.02) | 1.29 | 2.05 |
Total from investment operations
| 1.03 | 1.83 | 0.16 | 0.12 | 1.45 | 2.16 |
| Distributions to shareholders from | | | | | | |
Net investment income
| 0.00 | (0.13) | (0.17) | (0.17) | (0.17) | (0.14) |
Net realized gains
| 0.00 | (0.54) | (0.06) | (0.99) | (3.99) | (0.17) |
Total distributions to shareholders
| 0.00 | (0.67) | (0.23) | (1.16) | (4.16) | (0.31) |
Net asset value, end of period
| $10.41 | $9.38 | $8.22 | $8.29 | $9.33 | $12.04 |
Total return2
| 10.98% | 22.70% 3 | 1.81% | 2.03% | 11.77% | 21.41% |
| Ratios to average net assets (annualized)* | | | | | | |
Gross expenses
| 0.98% | 1.07% | 1.13% | 1.09% | 1.10% | 1.11% |
Net expenses
| 0.85% | 0.86% | 0.90% | 0.90% | 0.97% | 1.08% |
Net investment income
| 1.34% | 1.15% | 1.47% | 1.62% | 1.25% | 0.88% |
| Supplemental data | | | | | | |
Portfolio turnover rate4
| 47% | 87% | 36% | 39% | 48% | 22% |
Net assets, end of period (000s omitted)
| $84 | $68 | $49 | $37 | $36 | $42 |
| * | Ratios include net expenses allocated from the affiliated Master Portfolios which were as follows: |
| Six months ended August 31, 2021 (unaudited) | 0.12% |
| Year ended February 28, 2021 | 0.14% |
| Year ended February 29, 2020 | 0.20% |
| Year ended February 28, 2019 | 0.16% |
| Year ended February 28, 2018 | 0.18% |
| Year ended February 28, 2017 | 0.16% |
| 1 | Year ended February 29 |
| 2 | Returns for periods of less than one year are not annualized. |
| 3 | During the year ended February 28, 2021, the Fund received a payment from an affiliate that had an impact of 0.65% on total return. See Note 4 in the Notes to Financial Statements for additional information. |
| 4 | Portfolio turnover rate is calculated by multiplying the Fund’s ownership percentage in each respective affiliated Master Portfolio by the corresponding affiliated Master Portfolio’s purchases and sales. |
The accompanying notes are an integral part of these financial statements.
Target Date Retirement Funds | 117
Financial highlights
Target 2045 Fund
(For a share outstanding throughout each period)
| | | Year ended February 28 |
| Class R4 | Six months ended
August 31, 2021
(unaudited) | 2021 | 2020 1 | 2019 | 2018 | 2017 |
Net asset value, beginning of period
| $9.19 | $8.12 | $8.19 | $9.24 | $11.96 | $10.11 |
Net investment income
| 0.09 | 0.16 2 | 0.18 2 | 0.20 2 | 0.22 2 | 0.16 |
Net realized and unrealized gains (losses) on investments
| 0.96 | 1.65 | 0.03 | (0.04) | 1.28 | 2.06 |
Total from investment operations
| 1.05 | 1.81 | 0.21 | 0.16 | 1.50 | 2.22 |
| Distributions to shareholders from | | | | | | |
Net investment income
| 0.00 | (0.20) | (0.22) | (0.22) | (0.23) | (0.20) |
Net realized gains
| 0.00 | (0.54) | (0.06) | (0.99) | (3.99) | (0.17) |
Total distributions to shareholders
| 0.00 | (0.74) | (0.28) | (1.21) | (4.22) | (0.37) |
Net asset value, end of period
| $10.24 | $9.19 | $8.12 | $8.19 | $9.24 | $11.96 |
Total return3
| 11.43% | 22.66% | 2.34% | 2.53% | 12.39% | 22.25% |
| Ratios to average net assets (annualized)* | | | | | | |
Gross expenses
| 0.52% | 0.63% | 0.60% | 0.57% | 0.59% | 0.59% |
Net expenses
| 0.29% | 0.31% | 0.34% | 0.34% | 0.44% | 0.52% |
Net investment income
| 1.90% | 2.04% | 2.12% | 2.26% | 1.84% | 1.46% |
| Supplemental data | | | | | | |
Portfolio turnover rate4
| 47% | 87% | 36% | 39% | 48% | 22% |
Net assets, end of period (000s omitted)
| $4,965 | $4,459 | $15,460 | $22,076 | $46,811 | $151,999 |
| * | Ratios include net expenses allocated from the affiliated Master Portfolios which were as follows: |
| Six months ended August 31, 2021 (unaudited) | 0.12% |
| Year ended February 28, 2021 | 0.14% |
| Year ended February 29, 2020 | 0.16% |
| Year ended February 28, 2019 | 0.17% |
| Year ended February 28, 2018 | 0.19% |
| Year ended February 28, 2017 | 0.17% |
| 1 | Year ended February 29 |
| 2 | Calculated based upon average shares outstanding |
| 3 | Returns for periods of less than one year are not annualized. |
| 4 | Portfolio turnover rate is calculated by multiplying the Fund’s ownership percentage in each respective affiliated Master Portfolio by the corresponding affiliated Master Portfolio’s purchases and sales. |
The accompanying notes are an integral part of these financial statements.
118 | Target Date Retirement Funds
Financial highlights
Target 2045 Fund
(For a share outstanding throughout each period)
| | | Year ended February 28 |
| Class R6 | Six months ended
August 31, 2021
(unaudited) | 2021 | 2020 1 | 2019 | 2018 | 2017 |
Net asset value, beginning of period
| $9.16 | $8.09 | $8.15 | $9.21 | $11.93 | $10.10 |
Net investment income
| 0.09 | 0.16 2 | 0.20 2 | 0.22 2 | 0.29 | 0.23 |
Net realized and unrealized gains (losses) on investments
| 0.96 | 1.64 | 0.03 | (0.05) | 1.24 | 1.99 |
Total from investment operations
| 1.05 | 1.80 | 0.23 | 0.17 | 1.53 | 2.22 |
| Distributions to shareholders from | | | | | | |
Net investment income
| 0.00 | (0.19) | (0.23) | (0.24) | (0.26) | (0.22) |
Net realized gains
| 0.00 | (0.54) | (0.06) | (0.99) | (3.99) | (0.17) |
Total distributions to shareholders
| 0.00 | (0.73) | (0.29) | (1.23) | (4.25) | (0.39) |
Net asset value, end of period
| $10.21 | $9.16 | $8.09 | $8.15 | $9.21 | $11.93 |
Total return3
| 11.46% | 22.73% | 2.64% | 2.61% | 12.61% | 22.26% |
| Ratios to average net assets (annualized)* | | | | | | |
Gross expenses
| 0.37% | 0.46% | 0.45% | 0.42% | 0.43% | 0.43% |
Net expenses
| 0.14% | 0.15% | 0.19% | 0.19% | 0.27% | 0.37% |
Net investment income
| 2.05% | 1.91% | 2.32% | 2.41% | 1.97% | 1.77% |
| Supplemental data | | | | | | |
Portfolio turnover rate4
| 47% | 87% | 36% | 39% | 48% | 22% |
Net assets, end of period (000s omitted)
| $49,355 | $42,687 | $47,672 | $69,435 | $133,524 | $219,922 |
| * | Ratios include net expenses allocated from the affiliated Master Portfolios which were as follows: |
| Six months ended August 31, 2021 (unaudited) | 0.12% |
| Year ended February 28, 2021 | 0.13% |
| Year ended February 29, 2020 | 0.16% |
| Year ended February 28, 2019 | 0.17% |
| Year ended February 28, 2018 | 0.19% |
| Year ended February 28, 2017 | 0.16% |
| 1 | Year ended February 29 |
| 2 | Calculated based upon average shares outstanding |
| 3 | Returns for periods of less than one year are not annualized. |
| 4 | Portfolio turnover rate is calculated by multiplying the Fund’s ownership percentage in each respective affiliated Master Portfolio by the corresponding affiliated Master Portfolio’s purchases and sales. |
The accompanying notes are an integral part of these financial statements.
Target Date Retirement Funds | 119
Financial highlights
Target 2045 Fund
(For a share outstanding throughout each period)
| | | Year ended February 28 |
| Administrator Class | Six months ended
August 31, 2021
(unaudited) | 2021 | 2020 1 | 2019 | 2018 | 2017 |
Net asset value, beginning of period
| $9.31 | $8.21 | $8.27 | $9.29 | $12.01 | $10.16 |
Net investment income
| 0.09 2 | 0.14 2 | 0.17 2 | 0.20 2 | 0.19 2 | 0.16 2 |
Net realized and unrealized gains (losses) on investments
| 0.96 | 1.66 | 0.03 | (0.05) | 1.28 | 2.04 |
Total from investment operations
| 1.05 | 1.80 | 0.20 | 0.15 | 1.47 | 2.20 |
| Distributions to shareholders from | | | | | | |
Net investment income
| 0.00 | (0.16) | (0.20) | (0.18) | (0.20) | (0.18) |
Net realized gains
| 0.00 | (0.54) | (0.06) | (0.99) | (3.99) | (0.17) |
Total distributions to shareholders
| 0.00 | (0.70) | (0.26) | (1.17) | (4.19) | (0.35) |
Net asset value, end of period
| $10.36 | $9.31 | $8.21 | $8.27 | $9.29 | $12.01 |
Total return3
| 11.28% | 22.38% | 2.21% | 2.32% | 12.05% | 21.89% |
| Ratios to average net assets (annualized)* | | | | | | |
Gross expenses
| 0.73% | 0.82% | 0.80% | 0.76% | 0.77% | 0.78% |
Net expenses
| 0.49% | 0.50% | 0.54% | 0.54% | 0.61% | 0.72% |
Net investment income
| 1.76% | 1.66% | 1.98% | 2.14% | 1.60% | 1.46% |
| Supplemental data | | | | | | |
Portfolio turnover rate4
| 47% | 87% | 36% | 39% | 48% | 22% |
Net assets, end of period (000s omitted)
| $2,088 | $3,192 | $4,544 | $7,213 | $30,255 | $41,504 |
| * | Ratios include net expenses allocated from the affiliated Master Portfolios which were as follows: |
| Six months ended August 31, 2021 (unaudited) | 0.12% |
| Year ended February 28, 2021 | 0.13% |
| Year ended February 29, 2020 | 0.16% |
| Year ended February 28, 2019 | 0.17% |
| Year ended February 28, 2018 | 0.19% |
| Year ended February 28, 2017 | 0.17% |
| 1 | Year ended February 29 |
| 2 | Calculated based upon average shares outstanding |
| 3 | Returns for periods of less than one year are not annualized. |
| 4 | Portfolio turnover rate is calculated by multiplying the Fund’s ownership percentage in each respective affiliated Master Portfolio by the corresponding affiliated Master Portfolio’s purchases and sales. |
The accompanying notes are an integral part of these financial statements.
120 | Target Date Retirement Funds
Financial highlights
Target 2050 Fund
(For a share outstanding throughout each period)
| | | Year ended February 28 |
| Class A | Six months ended
August 31, 2021
(unaudited) | 2021 | 2020 1 | 2019 | 2018 | 2017 |
Net asset value, beginning of period
| $8.03 | $6.95 | $7.13 | $8.61 | $11.40 | $9.61 |
Net investment income
| 0.07 | 0.10 | 0.13 2 | 0.14 | 0.20 | 0.12 |
Payment from affiliate
| 0.00 | 0.00 3 | 0.00 | 0.00 | 0.00 | 0.00 |
Net realized and unrealized gains (losses) on investments
| 0.87 | 1.48 | 0.02 | (0.05) | 1.23 | 2.02 |
Total from investment operations
| 0.94 | 1.58 | 0.15 | 0.09 | 1.43 | 2.14 |
| Distributions to shareholders from | | | | | | |
Net investment income
| 0.00 | (0.12) | (0.14) | (0.20) | (0.19) | (0.18) |
Net realized gains
| 0.00 | (0.38) | (0.19) | (1.37) | (4.03) | (0.17) |
Total distributions to shareholders
| 0.00 | (0.50) | (0.33) | (1.57) | (4.22) | (0.35) |
Net asset value, end of period
| $8.97 | $8.03 | $6.95 | $7.13 | $8.61 | $11.40 |
Total return4
| 11.71% | 23.13% 5 | 1.74% | 2.10% | 12.26% | 22.48% |
| Ratios to average net assets (annualized)* | | | | | | |
Gross expenses
| 0.74% | 0.79% | 0.83% | 0.82% | 0.83% | 0.85% |
Net expenses
| 0.58% | 0.59% | 0.63% | 0.65% | 0.72% | 0.83% |
Net investment income
| 1.63% | 1.45% | 1.81% | 1.88% | 1.47% | 1.13% |
| Supplemental data | | | | | | |
Portfolio turnover rate6
| 46% | 87% | 36% | 39% | 46% | 21% |
Net assets, end of period (000s omitted)
| $47,478 | $46,771 | $47,060 | $53,038 | $67,360 | $64,356 |
| * | Ratios include net expenses allocated from the affiliated Master Portfolios which were as follows: |
| Six months ended August 31, 2021 (unaudited) | 0.13% |
| Year ended February 28, 2021 | 0.13% |
| Year ended February 29, 2020 | 0.16% |
| Year ended February 28, 2019 | 0.17% |
| Year ended February 28, 2018 | 0.19% |
| Year ended February 28, 2017 | 0.17% |
| 1 | Year ended February 29 |
| 2 | Calculated based upon average shares outstanding |
| 3 | Amount is less than $0.005. |
| 4 | Total return calculations do not include any sales charges. Returns for periods of less than one year are not annualized. |
| 5 | During the year ended February 28, 2021, the Fund received a payment from an affiliate that had an impact of less than 0.005% on total return. See Note 4 in the Notes to Financial Statements for additional information. |
| 6 | Portfolio turnover rate is calculated by multiplying the Fund’s ownership percentage in each respective affiliated Master Portfolio by the corresponding affiliated Master Portfolio’s purchases and sales. |
The accompanying notes are an integral part of these financial statements.
Target Date Retirement Funds | 121
Financial highlights
Target 2050 Fund
(For a share outstanding throughout each period)
| | | Year ended February 28 |
| Class C | Six months ended
August 31, 2021
(unaudited) | 2021 | 2020 1 | 2019 | 2018 | 2017 |
Net asset value, beginning of period
| $7.98 | $6.91 | $7.08 | $8.56 | $11.36 | $9.58 |
Net investment income
| 0.04 2 | 0.06 | 0.08 2 | 0.06 | 0.11 | 0.04 |
Payment from affiliate
| 0.00 | 0.00 3 | 0.00 | 0.00 | 0.00 | 0.00 |
Net realized and unrealized gains (losses) on investments
| 0.87 | 1.45 | 0.00 3 | (0.03) | 1.22 | 2.02 |
Total from investment operations
| 0.91 | 1.51 | 0.08 | 0.03 | 1.33 | 2.06 |
| Distributions to shareholders from | | | | | | |
Net investment income
| 0.00 | (0.06) | (0.06) | (0.14) | (0.10) | (0.11) |
Net realized gains
| 0.00 | (0.38) | (0.19) | (1.37) | (4.03) | (0.17) |
Total distributions to shareholders
| 0.00 | (0.44) | (0.25) | (1.51) | (4.13) | (0.28) |
Net asset value, end of period
| $8.89 | $7.98 | $6.91 | $7.08 | $8.56 | $11.36 |
Total return4
| 11.40% | 22.23% 5 | 0.88% | 1.38% | 11.38% | 21.58% |
| Ratios to average net assets (annualized)* | | | | | | |
Gross expenses
| 1.45% | 1.50% | 1.57% | 1.57% | 1.58% | 1.61% |
Net expenses
| 1.35% | 1.36% | 1.39% | 1.40% | 1.46% | 1.58% |
Net investment income
| 0.87% | 0.66% | 1.12% | 1.13% | 0.72% | 0.33% |
| Supplemental data | | | | | | |
Portfolio turnover rate6
| 46% | 87% | 36% | 39% | 46% | 21% |
Net assets, end of period (000s omitted)
| $598 | $612 | $519 | $1,013 | $1,376 | $1,218 |
| * | Ratios include net expenses allocated from the affiliated Master Portfolios which were as follows: |
| Six months ended August 31, 2021 (unaudited) | 0.13% |
| Year ended February 28, 2021 | 0.14% |
| Year ended February 29, 2020 | 0.16% |
| Year ended February 28, 2019 | 0.17% |
| Year ended February 28, 2018 | 0.18% |
| Year ended February 28, 2017 | 0.17% |
| 1 | Year ended February 29 |
| 2 | Calculated based upon average shares outstanding |
| 3 | Amount is less than $0.005. |
| 4 | Total return calculations do not include any sales charges. Returns for periods of less than one year are not annualized. |
| 5 | During the year ended February 28, 2021, the Fund received a payment from an affiliate that had an impact of less than 0.005% on total return. See Note 4 in the Notes to Financial Statements for additional information. |
| 6 | Portfolio turnover rate is calculated by multiplying the Fund’s ownership percentage in each respective affiliated Master Portfolio by the corresponding affiliated Master Portfolio’s purchases and sales. |
The accompanying notes are an integral part of these financial statements.
122 | Target Date Retirement Funds
Financial highlights
Target 2050 Fund
(For a share outstanding throughout each period)
| | | Year ended February 28 |
| Class R | Six months ended
August 31, 2021
(unaudited) | 2021 | 2020 1 | 2019 | 2018 | 2017 |
Net asset value, beginning of period
| $8.12 | $6.96 | $7.15 | $8.63 | $11.43 | $9.63 |
Net investment income
| 0.07 | 0.10 | 0.12 | 0.13 | 0.15 | 0.09 |
Payment from affiliate
| 0.00 | 0.06 | 0.00 | 0.00 | 0.00 | 0.00 |
Net realized and unrealized gains (losses) on investments
| 0.87 | 1.48 | 0.00 2 | (0.05) | 1.24 | 2.04 |
Total from investment operations
| 0.94 | 1.64 | 0.12 | 0.08 | 1.39 | 2.13 |
| Distributions to shareholders from | | | | | | |
Net investment income
| 0.00 | (0.10) | (0.12) | (0.19) | (0.16) | (0.16) |
Net realized gains
| 0.00 | (0.38) | (0.19) | (1.37) | (4.03) | (0.17) |
Total distributions to shareholders
| 0.00 | (0.48) | (0.31) | (1.56) | (4.19) | (0.33) |
Net asset value, end of period
| $9.06 | $8.12 | $6.96 | $7.15 | $8.63 | $11.43 |
Total return3
| 11.58% | 23.96% 4 | 1.38% | 1.93% | 11.88% | 22.29% |
| Ratios to average net assets (annualized)* | | | | | | |
Gross expenses
| 0.91% | 0.94% | 1.07% | 1.08% | 1.12% | 1.13% |
Net expenses
| 0.85% | 0.84% | 0.89% | 0.90% | 0.97% | 1.08% |
Net investment income
| 1.35% | 1.15% | 1.50% | 1.58% | 1.24% | 0.94% |
| Supplemental data | | | | | | |
Portfolio turnover rate5
| 46% | 87% | 36% | 39% | 46% | 21% |
Net assets, end of period (000s omitted)
| $65 | $51 | $37 | $32 | $28 | $34 |
| * | Ratios include net expenses allocated from the affiliated Master Portfolios which were as follows: |
| Six months ended August 31, 2021 (unaudited) | 0.13% |
| Year ended February 28, 2021 | 0.13% |
| Year ended February 29, 2020 | 0.21% |
| Year ended February 28, 2019 | 0.18% |
| Year ended February 28, 2018 | 0.23% |
| Year ended February 28, 2017 | 0.19% |
| 1 | Year ended February 29 |
| 2 | Amount is less than $0.005. |
| 3 | Returns for periods of less than one year are not annualized. |
| 4 | During the year ended February 28, 2021, the Fund received a payment from an affiliate that had an impact of 0.96% on total return. See Note 4 in the Notes to Financial Statements for additional information. |
| 5 | Portfolio turnover rate is calculated by multiplying the Fund’s ownership percentage in each respective affiliated Master Portfolio by the corresponding affiliated Master Portfolio’s purchases and sales. |
The accompanying notes are an integral part of these financial statements.
Target Date Retirement Funds | 123
Financial highlights
Target 2050 Fund
(For a share outstanding throughout each period)
| | | Year ended February 28 |
| Class R4 | Six months ended
August 31, 2021
(unaudited) | 2021 | 2020 1 | 2019 | 2018 | 2017 |
Net asset value, beginning of period
| $8.10 | $7.00 | $7.19 | $8.66 | $11.45 | $9.64 |
Net investment income
| 0.10 | 0.13 2 | 0.16 2 | 0.20 2 | 0.21 2 | 0.16 2 |
Net realized and unrealized gains (losses) on investments
| 0.86 | 1.50 | 0.00 3 | (0.07) | 1.25 | 2.03 |
Total from investment operations
| 0.96 | 1.63 | 0.16 | 0.13 | 1.46 | 2.19 |
| Distributions to shareholders from | | | | | | |
Net investment income
| 0.00 | (0.15) | (0.16) | (0.23) | (0.22) | (0.21) |
Net realized gains
| 0.00 | (0.38) | (0.19) | (1.37) | (4.03) | (0.17) |
Total distributions to shareholders
| 0.00 | (0.53) | (0.35) | (1.60) | (4.25) | (0.38) |
Net asset value, end of period
| $9.06 | $8.10 | $7.00 | $7.19 | $8.66 | $11.45 |
Total return4
| 11.85% | 23.61% | 1.89% | 2.57% | 12.54% | 23.00% |
| Ratios to average net assets (annualized)* | | | | | | |
Gross expenses
| 0.46% | 0.51% | 0.55% | 0.53% | 0.56% | 0.57% |
Net expenses
| 0.29% | 0.30% | 0.34% | 0.34% | 0.42% | 0.52% |
Net investment income
| 1.91% | 1.82% | 2.08% | 2.40% | 1.82% | 1.45% |
| Supplemental data | | | | | | |
Portfolio turnover rate5
| 46% | 87% | 36% | 39% | 46% | 21% |
Net assets, end of period (000s omitted)
| $15,017 | $12,859 | $17,989 | $19,551 | $122,118 | $243,339 |
| * | Ratios include net expenses allocated from the affiliated Master Portfolios which were as follows: |
| Six months ended August 31, 2021 (unaudited) | 0.13% |
| Year ended February 28, 2021 | 0.13% |
| Year ended February 29, 2020 | 0.16% |
| Year ended February 28, 2019 | 0.18% |
| Year ended February 28, 2018 | 0.19% |
| Year ended February 28, 2017 | 0.17% |
| 1 | Year ended February 29 |
| 2 | Calculated based upon average shares outstanding |
| 3 | Amount is less than $0.005. |
| 4 | Returns for periods of less than one year are not annualized. |
| 5 | Portfolio turnover rate is calculated by multiplying the Fund’s ownership percentage in each respective affiliated Master Portfolio by the corresponding affiliated Master Portfolio’s purchases and sales. |
The accompanying notes are an integral part of these financial statements.
124 | Target Date Retirement Funds
Financial highlights
Target 2050 Fund
(For a share outstanding throughout each period)
| | | Year ended February 28 |
| Class R6 | Six months ended
August 31, 2021
(unaudited) | 2021 | 2020 1 | 2019 | 2018 | 2017 |
Net asset value, beginning of period
| $8.08 | $6.99 | $7.17 | $8.65 | $11.44 | $9.64 |
Net investment income
| 0.11 | 0.14 | 0.17 | 0.25 | 0.26 | 0.19 2 |
Net realized and unrealized gains (losses) on investments
| 0.86 | 1.48 | 0.02 | (0.12) | 1.22 | 2.01 |
Total from investment operations
| 0.97 | 1.62 | 0.19 | 0.13 | 1.48 | 2.20 |
| Distributions to shareholders from | | | | | | |
Net investment income
| 0.00 | (0.15) | (0.18) | (0.24) | (0.24) | (0.23) |
Net realized gains
| 0.00 | (0.38) | (0.19) | (1.37) | (4.03) | (0.17) |
Total distributions to shareholders
| 0.00 | (0.53) | (0.37) | (1.61) | (4.27) | (0.40) |
Net asset value, end of period
| $9.05 | $8.08 | $6.99 | $7.17 | $8.65 | $11.44 |
Total return3
| 12.00% | 23.63% | 2.18% | 2.61% | 12.73% | 23.09% |
| Ratios to average net assets (annualized)* | | | | | | |
Gross expenses
| 0.31% | 0.36% | 0.40% | 0.39% | 0.41% | 0.42% |
Net expenses
| 0.14% | 0.15% | 0.19% | 0.19% | 0.27% | 0.37% |
Net investment income
| 2.07% | 1.87% | 2.23% | 2.37% | 1.95% | 1.81% |
| Supplemental data | | | | | | |
Portfolio turnover rate4
| 46% | 87% | 36% | 39% | 46% | 21% |
Net assets, end of period (000s omitted)
| $119,740 | $118,172 | $107,868 | $107,769 | $180,036 | $287,423 |
| * | Ratios include net expenses allocated from the affiliated Master Portfolios which were as follows: |
| Six months ended August 31, 2021 (unaudited) | 0.13% |
| Year ended February 28, 2021 | 0.13% |
| Year ended February 29, 2020 | 0.16% |
| Year ended February 28, 2019 | 0.17% |
| Year ended February 28, 2018 | 0.19% |
| Year ended February 28, 2017 | 0.16% |
| 1 | Year ended February 29 |
| 2 | Calculated based upon average shares outstanding |
| 3 | Returns for periods of less than one year are not annualized. |
| 4 | Portfolio turnover rate is calculated by multiplying the Fund’s ownership percentage in each respective affiliated Master Portfolio by the corresponding affiliated Master Portfolio’s purchases and sales. |
The accompanying notes are an integral part of these financial statements.
Target Date Retirement Funds | 125
Financial highlights
Target 2050 Fund
(For a share outstanding throughout each period)
| | | Year ended February 28 |
| Administrator Class | Six months ended
August 31, 2021
(unaudited) | 2021 | 2020 1 | 2019 | 2018 | 2017 |
Net asset value, beginning of period
| $8.06 | $6.97 | $7.16 | $8.62 | $11.41 | $9.61 |
Net investment income
| 0.07 | 0.11 | 0.14 | 0.18 | 0.20 | 0.15 2 |
Net realized and unrealized gains (losses) on investments
| 0.88 | 1.49 | 0.01 | (0.07) | 1.24 | 2.01 |
Total from investment operations
| 0.95 | 1.60 | 0.15 | 0.11 | 1.44 | 2.16 |
| Distributions to shareholders from | | | | | | |
Net investment income
| 0.00 | (0.13) | (0.15) | (0.20) | (0.20) | (0.19) |
Net realized gains
| 0.00 | (0.38) | (0.19) | (1.37) | (4.03) | (0.17) |
Total distributions to shareholders
| 0.00 | (0.51) | (0.34) | (1.57) | (4.23) | (0.36) |
Net asset value, end of period
| $9.01 | $8.06 | $6.97 | $7.16 | $8.62 | $11.41 |
Total return3
| 11.79% | 23.31% | 1.70% | 2.37% | 12.29% | 22.72% |
| Ratios to average net assets (annualized)* | | | | | | |
Gross expenses
| 0.66% | 0.71% | 0.75% | 0.74% | 0.75% | 0.76% |
Net expenses
| 0.49% | 0.50% | 0.54% | 0.54% | 0.61% | 0.72% |
Net investment income
| 1.72% | 1.57% | 1.88% | 2.07% | 1.59% | 1.37% |
| Supplemental data | | | | | | |
Portfolio turnover rate4
| 46% | 87% | 36% | 39% | 46% | 21% |
Net assets, end of period (000s omitted)
| $38,164 | $35,788 | $39,498 | $40,236 | $82,574 | $121,028 |
| * | Ratios include net expenses allocated from the affiliated Master Portfolios which were as follows: |
| Six months ended August 31, 2021 (unaudited) | 0.13% |
| Year ended February 28, 2021 | 0.13% |
| Year ended February 29, 2020 | 0.16% |
| Year ended February 28, 2019 | 0.17% |
| Year ended February 28, 2018 | 0.19% |
| Year ended February 28, 2017 | 0.17% |
| 1 | Year ended February 29 |
| 2 | Calculated based upon average shares outstanding |
| 3 | Returns for periods of less than one year are not annualized. |
| 4 | Portfolio turnover rate is calculated by multiplying the Fund’s ownership percentage in each respective affiliated Master Portfolio by the corresponding affiliated Master Portfolio’s purchases and sales. |
The accompanying notes are an integral part of these financial statements.
126 | Target Date Retirement Funds
Financial highlights
Target 2055 Fund
(For a share outstanding throughout each period)
| | | Year ended February 28 |
| Class A | Six months ended
August 31, 2021
(unaudited) | 2021 | 2020 1 | 2019 | 2018 | 2017 |
Net asset value, beginning of period
| $13.98 | $11.54 | $11.56 | $12.72 | $13.91 | $11.56 |
Net investment income
| 0.11 | 0.16 | 0.22 2 | 0.22 | 0.21 2 | 0.14 |
Net realized and unrealized gains (losses) on investments
| 1.53 | 2.51 | (0.01) | (0.02) | 1.50 | 2.44 |
Total from investment operations
| 1.64 | 2.67 | 0.21 | 0.20 | 1.71 | 2.58 |
| Distributions to shareholders from | | | | | | |
Net investment income
| 0.00 | (0.23) | (0.22) | (0.30) | (0.23) | (0.23) |
Net realized gains
| 0.00 | 0.00 | (0.01) | (1.06) | (2.67) | 0.00 |
Total distributions to shareholders
| 0.00 | (0.23) | (0.23) | (1.36) | (2.90) | (0.23) |
Net asset value, end of period
| $15.62 | $13.98 | $11.54 | $11.56 | $12.72 | $13.91 |
Total return3
| 11.73% | 23.23% | 1.62% | 2.29% | 12.15% | 22.45% |
| Ratios to average net assets (annualized)* | | | | | | |
Gross expenses
| 1.04% | 1.31% | 1.21% | 1.17% | 1.04% | 0.91% |
Net expenses
| 0.58% | 0.59% | 0.63% | 0.65% | 0.71% | 0.83% |
Net investment income
| 1.64% | 1.47% | 1.87% | 1.86% | 1.47% | 1.13% |
| Supplemental data | | | | | | |
Portfolio turnover rate4
| 46% | 87% | 36.0% | 39% | 46% | 21% |
Net assets, end of period (000s omitted)
| $6,147 | $6,532 | $7,374 | $10,582 | $10,352 | $9,270 |
| * | Ratios include net expenses allocated from the affiliated Master Portfolios which were as follows: |
| Six months ended August 31, 2021 (unaudited) | 0.13% |
| Year ended February 28, 2021 | 0.13% |
| Year ended February 29, 2020 | 0.16% |
| Year ended February 28, 2019 | 0.17% |
| Year ended February 28, 2018 | 0.19% |
| Year ended February 28, 2017 | 0.17% |
| 1 | Year ended February 29 |
| 2 | Calculated based upon average shares outstanding |
| 3 | Total return calculations do not include any sales charges. Returns for periods of less than one year are not annualized. |
| 4 | Portfolio turnover rate is calculated by multiplying the Fund’s ownership percentage in each respective affiliated Master Portfolio by the corresponding affiliated Master Portfolio’s purchases and sales. |
The accompanying notes are an integral part of these financial statements.
Target Date Retirement Funds | 127
Financial highlights
Target 2055 Fund
(For a share outstanding throughout each period)
| | | Year ended February 28 |
| Class R | Six months ended
August 31, 2021
(unaudited) | 2021 | 2020 1 | 2019 | 2018 | 2017 |
Net asset value, beginning of period
| $13.79 | $11.35 | $11.39 | $12.56 | $13.76 | $11.45 |
Net investment income
| 0.10 2 | 0.15 | 0.18 | 0.19 | 0.18 | 0.10 |
Payment from affiliate
| 0.00 | 0.07 | 0.00 | 0.00 | 0.00 | 0.00 |
Net realized and unrealized gains (losses) on investments
| 1.51 | 2.45 | 0.00 3 | (0.03) | 1.49 | 2.41 |
Total from investment operations
| 1.61 | 2.67 | 0.18 | 0.16 | 1.67 | 2.51 |
| Distributions to shareholders from | | | | | | |
Net investment income
| 0.00 | (0.23) | (0.21) | (0.27) | (0.20) | (0.20) |
Net realized gains
| 0.00 | 0.00 | (0.01) | (1.06) | (2.67) | 0.00 |
Total distributions to shareholders
| 0.00 | (0.23) | (0.22) | (1.33) | (2.87) | (0.20) |
Net asset value, end of period
| $15.40 | $13.79 | $11.35 | $11.39 | $12.56 | $13.76 |
Total return4
| 11.68% | 23.63% 5 | 1.43% | 1.96% | 11.99% | 22.04% |
| Ratios to average net assets (annualized)* | | | | | | |
Gross expenses
| 1.18% | 1.44% | 1.45% | 1.39% | 1.29% | 1.16% |
Net expenses
| 0.84% | 0.86% | 0.89% | 0.89% | 0.96% | 1.08% |
Net investment income
| 1.37% | 1.15% | 1.52% | 1.60% | 1.22% | 0.98% |
| Supplemental data | | | | | | |
Portfolio turnover rate6
| 46% | 87% | 36% | 39% | 46% | 21% |
Net assets, end of period (000s omitted)
| $65 | $54 | $41 | $43 | $42 | $40 |
| * | Ratios include net expenses allocated from the affiliated Master Portfolios which were as follows: |
| Six months ended August 31, 2021 (unaudited) | 0.13% |
| Year ended February 28, 2021 | 0.14% |
| Year ended February 29, 2020 | 0.21% |
| Year ended February 28, 2019 | 0.17% |
| Year ended February 28, 2018 | 0.19% |
| Year ended February 28, 2017 | 0.17% |
| 1 | Year ended February 29 |
| 2 | Calculated based upon average shares outstanding |
| 3 | Amount is less than $0.005. |
| 4 | Returns for periods of less than one year are not annualized. |
| 5 | During the year ended February 28, 2021, the Fund received a payment from an affiliate that had an impact of 0.68% on total return. See Note 4 in the Notes to Financial Statements for additional information. |
| 6 | Portfolio turnover rate is calculated by multiplying the Fund’s ownership percentage in each respective affiliated Master Portfolio by the corresponding affiliated Master Portfolio’s purchases and sales. |
The accompanying notes are an integral part of these financial statements.
128 | Target Date Retirement Funds
Financial highlights
Target 2055 Fund
(For a share outstanding throughout each period)
| | | Year ended February 28 |
| Class R4 | Six months ended
August 31, 2021
(unaudited) | 2021 | 2020 1 | 2019 | 2018 | 2017 |
Net asset value, beginning of period
| $14.05 | $11.58 | $11.60 | $12.76 | $13.94 | $11.59 |
Net investment income
| 0.15 2 | 0.23 2 | 0.25 2 | 0.28 2 | 0.27 2 | 0.18 |
Net realized and unrealized gains (losses) on investments
| 1.53 | 2.49 | 0.00 3 | (0.05) | 1.50 | 2.44 |
Total from investment operations
| 1.68 | 2.72 | 0.25 | 0.23 | 1.77 | 2.62 |
| Distributions to shareholders from | | | | | | |
Net investment income
| 0.00 | (0.25) | (0.26) | (0.33) | (0.28) | (0.27) |
Net realized gains
| 0.00 | 0.00 | (0.01) | (1.06) | (2.67) | 0.00 |
Total distributions to shareholders
| 0.00 | (0.25) | (0.27) | (1.39) | (2.95) | (0.27) |
Net asset value, end of period
| $15.73 | $14.05 | $11.58 | $11.60 | $12.76 | $13.94 |
Total return4
| 11.96% | 23.59% | 1.98% | 2.57% | 12.56% | 22.78% |
| Ratios to average net assets (annualized)* | | | | | | |
Gross expenses
| 0.76% | 1.06% | 0.93% | 0.93% | 0.73% | 0.64% |
Net expenses
| 0.28% | 0.31% | 0.34% | 0.34% | 0.44% | 0.52% |
Net investment income
| 1.92% | 2.05% | 2.08% | 2.24% | 1.85% | 1.32% |
| Supplemental data | | | | | | |
Portfolio turnover rate5
| 46% | 87% | 36% | 39% | 46% | 21% |
Net assets, end of period (000s omitted)
| $2,667 | $2,175 | $7,233 | $7,578 | $15,764 | $43,147 |
| * | Ratios include net expenses allocated from the affiliated Master Portfolios which were as follows: |
| Six months ended August 31, 2021 (unaudited) | 0.13% |
| Year ended February 28, 2021 | 0.14% |
| Year ended February 29, 2020 | 0.16% |
| Year ended February 28, 2019 | 0.18% |
| Year ended February 28, 2018 | 0.19% |
| Year ended February 28, 2017 | 0.17% |
| 1 | Year ended February 29 |
| 2 | Calculated based upon average shares outstanding |
| 3 | Amount is less than $0.005. |
| 4 | Returns for periods of less than one year are not annualized. |
| 5 | Portfolio turnover rate is calculated by multiplying the Fund’s ownership percentage in each respective affiliated Master Portfolio by the corresponding affiliated Master Portfolio’s purchases and sales. |
The accompanying notes are an integral part of these financial statements.
Target Date Retirement Funds | 129
Financial highlights
Target 2055 Fund
(For a share outstanding throughout each period)
| | | Year ended February 28 |
| Class R6 | Six months ended
August 31, 2021
(unaudited) | 2021 | 2020 1 | 2019 | 2018 | 2017 |
Net asset value, beginning of period
| $13.99 | $11.55 | $11.57 | $12.73 | $13.91 | $11.57 |
Net investment income
| 0.16 2 | 0.32 | 0.27 2 | 0.31 2 | 0.31 | 0.23 2 |
Net realized and unrealized gains (losses) on investments
| 1.52 | 2.42 | 0.00 3 | (0.06) | 1.48 | 2.40 |
Total from investment operations
| 1.68 | 2.74 | 0.27 | 0.25 | 1.79 | 2.63 |
| Distributions to shareholders from | | | | | | |
Net investment income
| 0.00 | (0.30) | (0.28) | (0.35) | (0.30) | (0.29) |
Net realized gains
| 0.00 | 0.00 | (0.01) | (1.06) | (2.67) | 0.00 |
Total distributions to shareholders
| 0.00 | (0.30) | (0.29) | (1.41) | (2.97) | (0.29) |
Net asset value, end of period
| $15.67 | $13.99 | $11.55 | $11.57 | $12.73 | $13.91 |
Total return4
| 12.01% | 23.80% | 2.10% | 2.71% | 12.76% | 22.97% |
| Ratios to average net assets (annualized)* | | | | | | |
Gross expenses
| 0.61% | 0.87% | 0.78% | 0.87% | 0.60% | 0.47% |
Net expenses
| 0.13% | 0.15% | 0.19% | 0.19% | 0.26% | 0.37% |
Net investment income
| 2.07% | 1.90% | 2.23% | 2.46% | 1.94% | 1.79% |
| Supplemental data | | | | | | |
Portfolio turnover rate5
| 46% | 87% | 36% | 39% | 46% | 21% |
Net assets, end of period (000s omitted)
| $20,659 | $17,035 | $19,338 | $18,491 | $56,563 | $65,516 |
| * | Ratios include net expenses allocated from the affiliated Master Portfolios which were as follows: |
| Six months ended August 31, 2021 (unaudited) | 0.13% |
| Year ended February 28, 2021 | 0.13% |
| Year ended February 29, 2020 | 0.16% |
| Year ended February 28, 2019 | 0.18% |
| Year ended February 28, 2018 | 0.19% |
| Year ended February 28, 2017 | 0.16% |
| 1 | Year ended February 29 |
| 2 | Calculated based upon average shares outstanding |
| 3 | Amount is less than $0.005. |
| 4 | Returns for periods of less than one year are not annualized. |
| 5 | Portfolio turnover rate is calculated by multiplying the Fund’s ownership percentage in each respective affiliated Master Portfolio by the corresponding affiliated Master Portfolio’s purchases and sales. |
The accompanying notes are an integral part of these financial statements.
130 | Target Date Retirement Funds
Financial highlights
Target 2055 Fund
(For a share outstanding throughout each period)
| | | Year ended February 28 |
| Administrator Class | Six months ended
August 31, 2021
(unaudited) | 2021 | 2020 1 | 2019 | 2018 | 2017 |
Net asset value, beginning of period
| $14.08 | $11.63 | $11.57 | $12.73 | $13.91 | $11.57 |
Net investment income
| 0.13 2 | 0.22 | 0.24 2 | 0.28 2 | 0.23 2 | 0.17 2 |
Net realized and unrealized gains (losses) on investments
| 1.53 | 2.48 | (0.03) | (0.07) | 1.50 | 2.41 |
Total from investment operations
| 1.66 | 2.70 | 0.21 | 0.21 | 1.73 | 2.58 |
| Distributions to shareholders from | | | | | | |
Net investment income
| 0.00 | (0.25) | (0.14) | (0.31) | (0.24) | (0.24) |
Net realized gains
| 0.00 | 0.00 | (0.01) | (1.06) | (2.67) | 0.00 |
Total distributions to shareholders
| 0.00 | (0.25) | (0.15) | (1.37) | (2.91) | (0.24) |
Net asset value, end of period
| $15.74 | $14.08 | $11.63 | $11.57 | $12.73 | $13.91 |
Total return3
| 11.79% | 23.33% | 1.74% | 2.37% | 12.32% | 22.50% |
| Ratios to average net assets (annualized)* | | | | | | |
Gross expenses
| 0.97% | 1.23% | 1.13% | 1.37% | 0.94% | 0.83% |
Net expenses
| 0.49% | 0.50% | 0.54% | 0.54% | 0.62% | 0.72% |
Net investment income
| 1.74% | 1.54% | 1.97% | 2.22% | 1.62% | 1.34% |
| Supplemental data | | | | | | |
Portfolio turnover rate4
| 46% | 87% | 36% | 39% | 46% | 21% |
Net assets, end of period (000s omitted)
| $964 | $983 | $759 | $1,188 | $5,662 | $9,700 |
| * | Ratios include net expenses allocated from the affiliated Master Portfolios which were as follows: |
| Six months ended August 31, 2021 (unaudited) | 0.13% |
| Year ended February 28, 2021 | 0.13% |
| Year ended February 29, 2020 | 0.16% |
| Year ended February 28, 2019 | 0.18% |
| Year ended February 28, 2018 | 0.19% |
| Year ended February 28, 2017 | 0.17% |
| 1 | Year ended February 29 |
| 2 | Calculated based upon average shares outstanding |
| 3 | Returns for periods of less than one year are not annualized. |
| 4 | Portfolio turnover rate is calculated by multiplying the Fund’s ownership percentage in each respective affiliated Master Portfolio by the corresponding affiliated Master Portfolio’s purchases and sales. |
The accompanying notes are an integral part of these financial statements.
Target Date Retirement Funds | 131
Financial highlights
Target 2060 Fund
(For a share outstanding throughout each period)
| | | Year ended February 28 |
| Class A | Six months ended
August 31, 2021
(unaudited) | 2021 | 2020 1 | 2019 | 2018 | 2017 |
Net asset value, beginning of period
| $13.90 | $11.44 | $11.44 | $11.83 | $10.69 | $8.84 |
Net investment income
| 0.13 | 0.19 | 0.19 | 0.22 2 | 0.15 | 0.09 2 |
Net realized and unrealized gains (losses) on investments
| 1.51 | 2.47 | 0.02 | (0.01) | 1.15 | 1.86 |
Total from investment operations
| 1.64 | 2.66 | 0.21 | 0.21 | 1.30 | 1.95 |
| Distributions to shareholders from | | | | | | |
Net investment income
| 0.00 | (0.19) | (0.21) | (0.25) | (0.16) | (0.10) |
Net realized gains
| 0.00 | (0.01) | 0.00 | (0.35) | 0.00 | 0.00 |
Total distributions to shareholders
| 0.00 | (0.20) | (0.21) | (0.60) | (0.16) | (0.10) |
Net asset value, end of period
| $15.54 | $13.90 | $11.44 | $11.44 | $11.83 | $10.69 |
Total return3
| 11.80% | 23.30% | 1.67% | 2.18% | 12.20% | 22.23% |
| Ratios to average net assets (annualized)* | | | | | | |
Gross expenses
| 1.02% | 1.38% | 1.61% | 2.69% | 1.79% | 3.21% |
Net expenses
| 0.59% | 0.60% | 0.64% | 0.65% | 0.71% | 0.83% |
Net investment income
| 1.61% | 1.45% | 1.74% | 1.88% | 1.45% | 0.90% |
| Supplemental data | | | | | | |
Portfolio turnover rate4
| 46% | 87% | 36% | 39% | 46% | 21% |
Net assets, end of period (000s omitted)
| $1,290 | $1,176 | $973 | $660 | $907 | $671 |
| * | Ratios include net expenses allocated from the affiliated Master Portfolios which were as follows: |
| Six months ended August 31, 2021 (unaudited) | 0.13% |
| Year ended February 28, 2021 | 0.13% |
| Year ended February 29, 2020 | 0.16% |
| Year ended February 28, 2019 | 0.17% |
| Year ended February 28, 2018 | 0.18% |
| Year ended February 28, 2017 | 0.17% |
| 1 | Year ended February 29 |
| 2 | Calculated based upon average shares outstanding |
| 3 | Total return calculations do not include any sales charges. Returns for periods of less than one year are not annualized. |
| 4 | Portfolio turnover rate is calculated by multiplying the Fund’s ownership percentage in each respective affiliated Master Portfolio by the corresponding affiliated Master Portfolio’s purchases and sales. |
The accompanying notes are an integral part of these financial statements.
132 | Target Date Retirement Funds
Financial highlights
Target 2060 Fund
(For a share outstanding throughout each period)
| | | Year ended February 28 |
| Class C | Six months ended
August 31, 2021
(unaudited) | 2021 | 2020 1 | 2019 | 2018 | 2017 |
Net asset value, beginning of period
| $14.02 | $11.43 | $11.42 | $11.85 | $10.71 | $8.90 |
Net investment income
| 0.07 | 0.07 | 0.08 | 0.13 | 0.07 | 0.04 |
Payment from affiliate
| 0.00 | 0.14 | 0.00 | 0.00 | 0.00 | 0.00 |
Net realized and unrealized gains (losses) on investments
| 1.53 | 2.46 | 0.04 | (0.00) 2 | 1.15 | 1.84 |
Total from investment operations
| 1.60 | 2.67 | 0.12 | 0.13 | 1.22 | 1.88 |
| Distributions to shareholders from | | | | | | |
Net investment income
| 0.00 | (0.07) | (0.11) | (0.21) | (0.08) | (0.07) |
Net realized gains
| 0.00 | (0.01) | 0.00 | (0.35) | 0.00 | 0.00 |
Total distributions to shareholders
| 0.00 | (0.08) | (0.11) | (0.56) | (0.08) | (0.07) |
Net asset value, end of period
| $15.62 | $14.02 | $11.43 | $11.42 | $11.85 | $10.71 |
Total return3
| 11.41% | 23.38% 4 | 0.94% | 1.42% | 11.37% | 21.22% |
| Ratios to average net assets (annualized)* | | | | | | |
Gross expenses
| 1.65% | 2.08% | 2.35% | 3.06% | 2.41% | 5.30% |
Net expenses
| 1.32% | 1.36% | 1.39% | 1.40% | 1.47% | 1.58% |
Net investment income
| 0.88% | 0.72% | 1.09% | 1.10% | 0.73% | 0.39% |
| Supplemental data | | | | | | |
Portfolio turnover rate5
| 46% | 87% | 36% | 39% | 46% | 21% |
Net assets, end of period (000s omitted)
| $155 | $134 | $142 | $221 | $196 | $252 |
| * | Ratios include net expenses allocated from the affiliated Master Portfolios which were as follows: |
| Six months ended August 31, 2021 (unaudited) | 0.12% |
| Year ended February 28, 2021 | 0.13% |
| Year ended February 29, 2020 | 0.18% |
| Year ended February 28, 2019 | 0.17% |
| Year ended February 28, 2018 | 0.18% |
| Year ended February 28, 2017 | 0.16% |
| 1 | Year ended February 29 |
| 2 | Amount is more than $(0.005) |
| 3 | Total return calculations do not include any sales charges. Returns for periods of less than one year are not annualized. |
| 4 | During the year ended February 28, 2021, the Fund received a payment from an affiliate that had an impact of 1.21% on total return. See Note 4 in the Notes to Financial Statements for additional information. |
| 5 | Portfolio turnover rate is calculated by multiplying the Fund’s ownership percentage in each respective affiliated Master Portfolio by the corresponding affiliated Master Portfolio’s purchases and sales. |
The accompanying notes are an integral part of these financial statements.
Target Date Retirement Funds | 133
Financial highlights
Target 2060 Fund
(For a share outstanding throughout each period)
| | | Year ended February 28 |
| Class R | Six months ended
August 31, 2021
(unaudited) | 2021 | 2020 1 | 2019 | 2018 | 2017 |
Net asset value, beginning of period
| $13.75 | $11.21 | $11.22 | $11.65 | $10.53 | $8.84 |
Net investment income
| 0.10 2 | 0.14 2 | 0.18 2 | 0.19 2 | 0.14 2 | 0.09 2 |
Payment from affiliate
| 0.00 | 0.12 | 0.00 | 0.00 | 0.00 | 0.00 |
Net realized and unrealized gains (losses) on investments
| 1.49 | 2.47 | (0.01) | (0.01) | 1.11 | 1.80 |
Total from investment operations
| 1.59 | 2.73 | 0.17 | 0.18 | 1.25 | 1.89 |
| Distributions to shareholders from | | | | | | |
Net investment income
| 0.00 | (0.18) | (0.18) | (0.26) | (0.13) | (0.20) |
Net realized gains
| 0.00 | (0.01) | 0.00 | (0.35) | 0.00 | 0.00 |
Total distributions to shareholders
| 0.00 | (0.19) | (0.18) | (0.61) | (0.13) | (0.20) |
Net asset value, end of period
| $15.34 | $13.75 | $11.21 | $11.22 | $11.65 | $10.53 |
Total return3
| 11.56% | 24.39% 4 | 1.42% | 1.91% | 11.90% | 21.73% |
| Ratios to average net assets (annualized)* | | | | | | |
Gross expenses
| 1.22% | 1.56% | 1.85% | 2.59% | 1.81% | 4.69% |
Net expenses
| 0.84% | 0.86% | 0.90% | 0.90% | 0.97% | 1.08% |
Net investment income
| 1.36% | 1.14% | 1.50% | 1.62% | 1.24% | 0.89% |
| Supplemental data | | | | | | |
Portfolio turnover rate5
| 46% | 87% | 36% | 39% | 46% | 21% |
Net assets, end of period (000s omitted)
| $129 | $103 | $67 | $54 | $50 | $127 |
| * | Ratios include net expenses allocated from the affiliated Master Portfolios which were as follows: |
| Six months ended August 31, 2021 (unaudited) | 0.13% |
| Year ended February 28, 2021 | 0.13% |
| Year ended February 29, 2020 | 0.19% |
| Year ended February 28, 2019 | 0.18% |
| Year ended February 28, 2018 | 0.20% |
| Year ended February 28, 2017 | 0.19% |
| 1 | Year ended February 29 |
| 2 | Calculated based upon average shares outstanding |
| 3 | Returns for periods of less than one year are not annualized. |
| 4 | During the year ended February 28, 2021, the Fund received a payment from an affiliate that had an impact of 1.08% on total return. See Note 4 in the Notes to Financial Statements for additional information. |
| 5 | Portfolio turnover rate is calculated by multiplying the Fund’s ownership percentage in each respective affiliated Master Portfolio by the corresponding affiliated Master Portfolio’s purchases and sales. |
The accompanying notes are an integral part of these financial statements.
134 | Target Date Retirement Funds
Financial highlights
Target 2060 Fund
(For a share outstanding throughout each period)
| | | Year ended February 28 |
| Class R4 | Six months ended
August 31, 2021
(unaudited) | 2021 | 2020 1 | 2019 | 2018 | 2017 |
Net asset value, beginning of period
| $14.20 | $11.67 | $11.66 | $12.06 | $10.88 | $8.97 |
Net investment income
| 0.15 2 | 0.22 2 | 0.22 | 0.28 2 | 0.21 | 0.12 2 |
Net realized and unrealized gains (losses) on investments
| 1.54 | 2.54 | 0.02 | (0.02) | 1.16 | 1.89 |
Total from investment operations
| 1.69 | 2.76 | 0.24 | 0.26 | 1.37 | 2.01 |
| Distributions to shareholders from | | | | | | |
Net investment income
| 0.00 | (0.22) | (0.23) | (0.31) | (0.19) | (0.10) |
Net realized gains
| 0.00 | (0.01) | 0.00 | (0.35) | 0.00 | 0.00 |
Total distributions to shareholders
| 0.00 | (0.23) | (0.23) | (0.66) | (0.19) | (0.10) |
Net asset value, end of period
| $15.89 | $14.20 | $11.67 | $11.66 | $12.06 | $10.88 |
Total return3
| 11.90% | 23.74% | 1.94% | 2.56% | 12.61% | 22.45% |
| Ratios to average net assets (annualized)* | | | | | | |
Gross expenses
| 0.74% | 1.12% | 1.33% | 3.01% | 1.38% | 1.88% |
Net expenses
| 0.29% | 0.30% | 0.34% | 0.34% | 0.41% | 0.52% |
Net investment income
| 1.92% | 1.78% | 2.07% | 2.34% | 1.81% | 1.14% |
| Supplemental data | | | | | | |
Portfolio turnover rate4
| 46% | 87% | 36% | 39% | 46% | 21% |
Net assets, end of period (000s omitted)
| $3,044 | $2,522 | $2,297 | $2,038 | $5,119 | $6,443 |
| * | Ratios include net expenses allocated from the affiliated Master Portfolios which were as follows: |
| Six months ended August 31, 2021 (unaudited) | 0.13% |
| Year ended February 28, 2021 | 0.13% |
| Year ended February 29, 2020 | 0.16% |
| Year ended February 28, 2019 | 0.18% |
| Year ended February 28, 2018 | 0.19% |
| Year ended February 28, 2017 | 0.17% |
| 1 | Year ended February 29 |
| 2 | Calculated based upon average shares outstanding |
| 3 | Returns for periods of less than one year are not annualized. |
| 4 | Portfolio turnover rate is calculated by multiplying the Fund’s ownership percentage in each respective affiliated Master Portfolio by the corresponding affiliated Master Portfolio’s purchases and sales. |
The accompanying notes are an integral part of these financial statements.
Target Date Retirement Funds | 135
Financial highlights
Target 2060 Fund
(For a share outstanding throughout each period)
| | | Year ended February 28 |
| Class R6 | Six months ended
August 31, 2021
(unaudited) | 2021 | 2020 1 | 2019 | 2018 | 2017 |
Net asset value, beginning of period
| $14.14 | $11.62 | $11.61 | $12.03 | $10.86 | $8.95 |
Net investment income
| 0.15 | 0.23 2 | 0.25 | 0.28 2 | 0.24 | 0.13 2 |
Net realized and unrealized gains (losses) on investments
| 1.54 | 2.55 | 0.01 | (0.01) | 1.14 | 1.90 |
Total from investment operations
| 1.69 | 2.78 | 0.26 | 0.27 | 1.38 | 2.03 |
| Distributions to shareholders from | | | | | | |
Net investment income
| 0.00 | (0.25) | (0.25) | (0.34) | (0.21) | (0.12) |
Net realized gains
| 0.00 | (0.01) | 0.00 | (0.35) | 0.00 | 0.00 |
Total distributions to shareholders
| 0.00 | (0.26) | (0.25) | (0.69) | (0.21) | (0.12) |
Net asset value, end of period
| $15.83 | $14.14 | $11.62 | $11.61 | $12.03 | $10.86 |
Total return3
| 11.95% | 23.95% | 2.07% | 2.68% | 12.70% | 22.75% |
| Ratios to average net assets (annualized)* | | | | | | |
Gross expenses
| 0.59% | 0.94% | 1.18% | 1.88% | 1.29% | 1.82% |
Net expenses
| 0.14% | 0.15% | 0.19% | 0.19% | 0.26% | 0.37% |
Net investment income
| 2.07% | 1.86% | 2.20% | 2.36% | 1.95% | 1.31% |
| Supplemental data | | | | | | |
Portfolio turnover rate4
| 46% | 87% | 36% | 39% | 46% | 21% |
Net assets, end of period (000s omitted)
| $25,426 | $21,643 | $15,541 | $10,497 | $12,115 | $12,518 |
| * | Ratios include net expenses allocated from the affiliated Master Portfolios which were as follows: |
| Six months ended August 31, 2021 (unaudited) | 0.13% |
| Year ended February 28, 2021 | 0.13% |
| Year ended February 29, 2020 | 0.16% |
| Year ended February 28, 2019 | 0.18% |
| Year ended February 28, 2018 | 0.19% |
| Year ended February 28, 2017 | 0.17% |
| 1 | Year ended February 29 |
| 2 | Calculated based upon average shares outstanding |
| 3 | Returns for periods of less than one year are not annualized. |
| 4 | Portfolio turnover rate is calculated by multiplying the Fund’s ownership percentage in each respective affiliated Master Portfolio by the corresponding affiliated Master Portfolio’s purchases and sales. |
The accompanying notes are an integral part of these financial statements.
136 | Target Date Retirement Funds
Financial highlights
Target 2060 Fund
(For a share outstanding throughout each period)
| | | Year ended February 28 |
| Administrator Class | Six months ended
August 31, 2021
(unaudited) | 2021 | 2020 1 | 2019 | 2018 | 2017 |
Net asset value, beginning of period
| $13.97 | $11.49 | $11.48 | $11.89 | $10.74 | $8.89 |
Net investment income
| 0.13 2 | 0.19 2 | 0.21 | 0.24 2 | 0.19 | 0.10 2 |
Net realized and unrealized gains (losses) on investments
| 1.52 | 2.49 | 0.01 | (0.01) | 1.13 | 1.88 |
Total from investment operations
| 1.65 | 2.68 | 0.22 | 0.23 | 1.32 | 1.98 |
| Distributions to shareholders from | | | | | | |
Net investment income
| 0.00 | (0.19) | (0.21) | (0.29) | (0.17) | (0.13) |
Net realized gains
| 0.00 | (0.01) | 0.00 | (0.35) | 0.00 | 0.00 |
Total distributions to shareholders
| 0.00 | (0.20) | (0.21) | (0.64) | (0.17) | (0.13) |
Net asset value, end of period
| $15.62 | $13.97 | $11.49 | $11.48 | $11.89 | $10.74 |
Total return3
| 11.81% | 23.41% | 1.79% | 2.32% | 12.27% | 22.38% |
| Ratios to average net assets (annualized)* | | | | | | |
Gross expenses
| 0.94% | 1.32% | 1.53% | 2.42% | 1.61% | 2.31% |
Net expenses
| 0.49% | 0.50% | 0.54% | 0.54% | 0.61% | 0.72% |
Net investment income
| 1.73% | 1.59% | 1.87% | 2.06% | 1.58% | 0.98% |
| Supplemental data | | | | | | |
Portfolio turnover rate4
| 46% | 87% | 36% | 39% | 46% | 21% |
Net assets, end of period (000s omitted)
| $4,142 | $3,263 | $3,623 | $3,068 | $4,267 | $4,427 |
| * | Ratios include net expenses allocated from the affiliated Master Portfolios which were as follows: |
| Six months ended August 31, 2021 (unaudited) | 0.13% |
| Year ended February 28, 2021 | 0.13% |
| Year ended February 29, 2020 | 0.16% |
| Year ended February 28, 2019 | 0.18% |
| Year ended February 28, 2018 | 0.19% |
| Year ended February 28, 2017 | 0.17% |
| 1 | Year ended February 29 |
| 2 | Calculated based upon average shares outstanding |
| 3 | Returns for periods of less than one year are not annualized. |
| 4 | Portfolio turnover rate is calculated by multiplying the Fund’s ownership percentage in each respective affiliated Master Portfolio by the corresponding affiliated Master Portfolio’s purchases and sales. |
The accompanying notes are an integral part of these financial statements.
Target Date Retirement Funds | 137
Notes to financial statements (unaudited)
1. ORGANIZATION
Wells Fargo Funds Trust (the “Trust”), a Delaware statutory trust organized on March 10, 1999, is an open-end management investment company registered under the Investment Company Act of 1940, as amended (the “1940 Act”). As an investment company, the Trust follows the accounting and reporting guidance in Financial Accounting Standards Board Accounting Standards Codification Topic 946, Financial Services – Investment Companies. These financial statements report on the following funds: Wells Fargo Target Today Fund (“Target Today Fund”), Wells Fargo Target 2010 Fund (“Target 2010 Fund”), Wells Fargo Target 2015 Fund (“Target 2015 Fund”), Wells Fargo Target 2020 Fund (“Target 2020 Fund”), Wells Fargo Target 2025 Fund (“Target 2025 Fund”), Wells Fargo Target 2030 Fund (“Target 2030 Fund”), Wells Fargo Target 2035 Fund (“Target 2035 Fund”), Wells Fargo Target 2040 Fund (“Target 2040 Fund”), Wells Fargo Target 2045 Fund (“Target 2045 Fund”), Wells Fargo Target 2050 Fund (“Target 2050 Fund”), Wells Fargo Target 2055 Fund (“Target 2055 Fund”), and Wells Fargo Target 2060 Fund (“Target 2060 Fund”) (each, a “Fund”, collectively, the “Funds”). Each Fund is a diversified series of the Trust.
Each Fund is a fund-of-funds which seeks to achieve its investment objective by investing in multiple diversified portfolios (collectively, the “affiliated Master Portfolios”) of Wells Fargo Master Trust, a registered open-end management investment company. Each affiliated Master Portfolio directly acquires portfolio securities, and a Fund investing in an affiliated Master Portfolio acquires an indirect interest in those securities. Each Fund accounts for its investment in the affiliated Master Portfolios as partnership investments and records on a daily basis its share of the affiliated Master Portfolio’s income, expense and realized and unrealized gains and losses. The financial statements of each affiliated Master Portfolio are presented in separate financial statements and may be obtained free of charge by contacting Investor Services or by visiting the SEC website at sec.gov. The financial statements of the affiliated Master Portfolios are filed with the SEC under Wells Fargo Master Trust.
On February 23, 2021, Wells Fargo & Company announced that it has entered into a definitive agreement to sell Wells Fargo Asset Management (“WFAM”) to GTCR LLC and Reverence Capital Partners, L.P. WFAM is the trade name used by the asset management businesses of Wells Fargo & Company and includes Wells Fargo Funds Management, LLC, the investment manager to each Fund, Wells Capital Management, LLC and Wells Fargo Asset Management (International) Limited, both registered investment advisers providing subadvisory services to certain funds, and Wells Fargo Funds Distributor, LLC, each Fund's principal underwriter. As part of the transaction, Wells Fargo & Company will own a 9.9% equity interest and will continue to serve as an important client and distribution partner.
Consummation of the transaction will result in the automatic termination of each Fund's investment management agreement and subadvisory agreement. Each Fund's Board of Trustees approved a new investment management and new subadvisory agreement which were submitted to each Fund’s shareholders for approval at Special Meeting of Shareholders held on August 16, 2021, September 15, 2021 and October 15, 2021. Shareholders of record of certain Funds at the close of business on May 28, 2021 approved the new agreements which will take effect upon the closing of the transaction. A Special Meeting of Shareholders for the remaining Funds is expected to be held on October 29, 2021. The transaction is expected to close in the second half of 2021, subject to customary closing conditions.
2. SIGNIFICANT ACCOUNTING POLICIES
The following significant accounting policies, which are consistently followed in the preparation of the financial statements of the Funds, are in conformity with U.S. generally accepted accounting principles which require management to make estimates and assumptions that affect the reported amounts of assets and liabilities, disclosure of contingent assets and liabilities at the date of the financial statements, and the reported amounts of income and expenses during the reporting period. Actual results could differ from those estimates.
Securities valuation
All investments are valued each business day as of the close of regular trading on the New York Stock Exchange (generally 4 p.m. Eastern Time), although the Funds may deviate from this calculation time under unusual or unexpected circumstances.
Investments in the affiliated Master Portfolios are valued daily based on each Fund’s proportionate share of each affiliated Master Portfolio’s net assets, which are also valued daily.
Investments which are not valued using any of the methods discussed above are valued at their fair value, as determined in good faith by the Board of Trustees. The Board of Trustees has established a Valuation Committee comprised of the Trustees and has delegated to it the authority to take any actions regarding the valuation of portfolio securities that the Valuation Committee deems necessary or appropriate, including determining the fair value of portfolio securities, unless the determination has been delegated to the Wells Fargo Asset Management Pricing Committee at Wells Fargo Funds Management, LLC ("Funds Management"). The Board of Trustees retains the authority to make or ratify any valuation decisions
138 | Target Date Retirement Funds
Notes to financial statements (unaudited)
or approve any changes to the Valuation Procedures as it deems appropriate. On a quarterly basis, the Board of Trustees receives reports on any valuation actions taken by the Valuation Committee or the Wells Fargo Asset Management Pricing Committee which may include items for ratification.
Investment transactions, income and expenses
Investments in affiliated Master Portfolios are recorded on a trade date basis.
Each Fund records daily its proportionate share of each affiliated Master Portfolio’s income, expenses and realized and unrealized gains or losses. Each Fund also accrues its own expenses. Income from foreign securities in each affiliated Master Portfolio is recorded net of foreign taxes withheld where recovery of such taxes is not assured.
Distributions to shareholders
For each Fund (except Target Today Fund, Target 2010 Fund and Target 2015 Fund), distributions to shareholders from net investment income and any net realized gains are recorded on the ex-dividend date and paid at least annually. For Target Today Fund, Target 2010 Fund and Target 2015 Fund, distributions to shareholders are recorded on the ex-dividend date and paid from net investment income quarterly and any net realized gains are paid at least annually. Such distributions are determined in accordance with income tax regulations and may differ from U.S. generally accepted accounting principles. Dividend sources are estimated at the time of declaration. The tax character of distributions is determined as of each Fund's fiscal year end. Therefore, a portion of each Fund's distributions made prior to the Fund’s fiscal year end may be categorized as a tax return of capital at year end.
Federal and other taxes
Each Fund is treated as a separate entity for federal income tax purposes. Each Fund intends to continue to qualify as a regulated investment company by distributing substantially all of its investment company taxable income and any net realized capital gains (after reduction for capital loss carryforwards) sufficient to relieve it from all, or substantially all, federal income taxes. Accordingly, no provision for federal income taxes was required.
Each Fund’s income and federal excise tax returns and all financial records supporting those returns for the prior three fiscal years are subject to examination by the federal and Delaware revenue authorities. Management has analyzed each Fund's tax positions taken on federal, state, and foreign tax returns for all open tax years and does not believe that there are any uncertain tax positions that require recognition of a tax liability.
As of August 31, 2021, the aggregate cost of all investments for federal income tax purposes and the unrealized gains (losses) were as follows:
| | Tax cost | Gross
unrealized
gains | Gross
unrealized
losses | Net
unrealized
gains |
| Target Today Fund | $ 46,209,376 | $ 9,090,445 | $0 | $ 9,090,445 |
| Target 2010 Fund | 31,513,570 | 21,439,154 | 0 | 21,439,154 |
| Target 2015 Fund | 38,516,578 | 13,336,699 | 0 | 13,336,699 |
| Target 2020 Fund | 246,869,469 | 57,679,533 | 0 | 57,679,533 |
| Target 2025 Fund | 173,385,925 | 30,152,363 | 0 | 30,152,363 |
| Target 2030 Fund | 422,975,907 | 79,562,010 | 0 | 79,562,010 |
| Target 2035 Fund | 181,968,129 | 30,443,978 | 0 | 30,443,978 |
| Target 2040 Fund | 404,420,052 | 79,023,761 | 0 | 79,023,761 |
| Target 2045 Fund | 82,870,256 | 15,026,847 | 0 | 15,026,847 |
| Target 2050 Fund | 183,222,284 | 37,888,401 | 0 | 37,888,401 |
| Target 2055 Fund | 26,837,522 | 3,688,431 | 0 | 3,688,431 |
| Target 2060 Fund | 29,548,150 | 4,612,456 | 0 | 4,612,456 |
Class allocations
The separate classes of shares offered by each Fund differ principally in applicable sales charges, distribution, shareholder servicing, and administration fees. Class specific expenses are charged directly to that share class. Investment income, common
Target Date Retirement Funds | 139
Notes to financial statements (unaudited)
fund-level expenses, and realized and unrealized gains (losses) on investments are allocated daily to each class of shares based on the relative proportion of net assets of each class.
3. FAIR VALUATION MEASUREMENTS
At August 31, 2021, each Fund’s investment in an affiliated Master Portfolio was measured at fair value using the net asset value per share (or its equivalent) as a practical expedient. The investment objective and aggregate fair value of the affiliated Master Portfolios is as follows:
| | Aggregate
fair value of affiliated
Master Portfolios |
| Target Today Fund | $ 55,299,821 |
| Target 2010 Fund | 52,952,724 |
| Target 2015 Fund | 51,853,277 |
| Target 2020 Fund | 304,549,002 |
| Target 2025 Fund | 203,538,288 |
| Target 2030 Fund | 502,537,917 |
| Target 2035 Fund | 212,412,107 |
| Target 2040 Fund | 483,443,813 |
| Target 2045 Fund | 97,897,103 |
| Target 2050 Fund | 221,110,685 |
| Target 2055 Fund | 30,525,953 |
| Target 2060 Fund | 34,160,606 |
The investment objective of each affiliated Master Portfolio is as follows:
| Affiliated Master Portfolio | Investment objective |
| Wells Fargo Bloomberg Barclays US Aggregate ex-Corporate Portfolio | Seeks to replicate the total return of the Bloomberg U.S. Aggregate ex-Corporate Index, before fees and expenses |
| Wells Fargo Emerging Markets Bond Portfolio | Seeks to replicate the total return of the JP Morgan EMBI Global Diversified Index, before fees and expenses |
| Wells Fargo Factor Enhanced Emerging Markets Equity Portfolio | Seeks long-term capital appreciation |
| Wells Fargo Factor Enhanced International Equity Portfolio | Seeks long-term capital appreciation |
| Wells Fargo Factor Enhanced U.S. Large Cap Equity Portfolio | Seeks long-term capital appreciation |
| Wells Fargo Factor Enhanced U.S. Low Volatility Equity Portfolio | Seeks long-term capital appreciation |
| Wells Fargo Factor Enhanced U.S. Small Cap Equity Portfolio | Seeks long-term capital appreciation |
| Wells Fargo High Yield Corporate Bond Portfolio | Seeks to replicate the total return of the Bloomberg U.S. High Yield 2% Issuer Capped Bond Index, before fees and expenses |
| Wells Fargo Investment Grade Corporate Bond Portfolio | Seeks to replicate the total return of the Bloomberg U.S. Corporate Bond Index, before fees and expenses |
| Wells Fargo Strategic Retirement Bond Portfolio | Seeks to replicate the total return of a blended index that is weighted 50% to the Bloomberg U.S. Treasury Inflation-Linked 1-10 Year Bond Index and 50% to the Bloomberg U.S. Intermediate Government Bond Index, before fees and expense |
| Wells Fargo U.S. REIT Portfolio | Seeks to replicate the total return of the Dow Jones U.S. Select REIT Index, before fees and expenses. |
Each affiliated Master Portfolio does not have a redemption period notice, can be redeemed daily and does not have any unfunded commitments.
140 | Target Date Retirement Funds
Notes to financial statements (unaudited)
4. TRANSACTIONS WITH AFFILIATES
Management fee
Funds Management, an indirect wholly owned subsidiary of Wells Fargo & Company ("Wells Fargo"), is the manager of each Fund and provides advisory and fund-level administrative services under an investment management agreement. Under the investment management agreement, Funds Management is responsible for, among other services, implementing the investment objectives and strategies of each Fund, supervising the subadviser and providing fund-level administrative services in connection with each Fund’s operations. As compensation for its services under the investment management agreement, Funds Management is entitled to receive a management fee at the following annual rate based on each Fund’s average daily net assets:
| Average daily net assets | Management fee |
| First $5 billion | 0.100% |
| Next $5 billion | 0.090 |
| Over $10 billion | 0.080 |
For the six months ended August 31, 2021, the management fee was equivalent to an annual rate of 0.10% of each Fund’s average daily net assets.
Funds Management has retained the services of a subadviser to provide daily portfolio management to each Fund. The fee for subadvisory services is borne by Funds Management. Wells Capital Management, LLC, an affiliate of Funds Management and an indirect wholly owned subsidiary of Wells Fargo, is the subadviser to each Fund and is entitled to receive a fee from Funds Management at an annual rate starting at 0.05% and declining to 0.03% as the average daily net assets of each Fund increase.
Funds Management also serves as the adviser to each affiliated Master Portfolio and is entitled to receive a fee from each affiliated Master Portfolio for those services.
Administration fees
Under a class-level administration agreement, Funds Management provides class-level administrative services to each Fund, which includes paying fees and expenses for services provided by the transfer agent, sub-transfer agents, omnibus account servicers and record-keepers. As compensation for its services under the class-level administration agreement, Funds Management receives an annual fee which is calculated based on the average daily net assets of each class as follows:
| | Class-level
administration fee |
| Class A | 0.21% |
| Class C | 0.21 |
| Class R | 0.21 |
| Class R4 | 0.08 |
| Class R6 | 0.03 |
| Administrator Class | 0.13 |
Waivers and/or expense reimbursements
Funds Management has contractually committed to waive and/or reimburse management and administration fees to the extent necessary to maintain certain net operating expense ratios for each Fund. When each class of each Fund has exceeded its expense cap, Funds Management will waive fees and/or reimburse expenses from fund-level expenses on a proportionate basis and then from class specific expenses. When only certain classes exceed their expense caps, waivers and/or reimbursements are applied against class specific expenses before fund-level expenses. Funds Management has contractually committed through June 30, 2022 to waive fees and/or reimburse expenses to the extent necessary to cap expenses. Prior to or after the commitment expiration date, the caps may be increased or the commitment to maintain the caps may be terminated only with the approval of the Board of Trustees. The contractual expense caps are as follows:
Target Date Retirement Funds | 141
Notes to financial statements (unaudited)
| | Expense ratio caps |
| Class A | 0.60% |
| Class C | 1.35 |
| Class R | 0.85 |
| Class R4 | 0.29 |
| Class R6 | 0.14 |
| Administrator Class | 0.49 |
Distribution fees
The Trust has adopted a Distribution Plan for Class C and Class R shares of the applicable Funds pursuant to Rule 12b-1 under the 1940 Act. Distribution fees are charged to Class C and Class R shares and paid to Wells Fargo Funds Distributor, LLC ("Funds Distributor"), the principal underwriter of each Fund, at an annual rate of 0.75% of the average daily net assets of Class C shares and 0.25% of the average daily net assets of Class R shares.
In addition, Funds Distributor is entitled to receive the front-end sales charge from the purchase of Class A shares and a contingent deferred sales charge on the redemption of certain Class A shares. Funds Distributor is also entitled to receive the contingent deferred sales charges from redemptions of Class C shares. For the six months ended August 31, 2021, Funds Distributor received front-end sales charges and contingent deferred sales charges from the following Funds:
| | Front-end sales charges | Contingent deferred sales charges |
| | Class A | Class C |
| Target Today Fund | $ 488 | $ 0 |
| Target 2010 Fund | 16 | 0 |
| Target 2015 Fund | 57 | N/A |
| Target 2020 Fund | 313 | 0 |
| Target 2025 Fund | 1,743 | N/A |
| Target 2030 Fund | 1,859 | 18 |
| Target 2035 Fund | 192 | N/A |
| Target 2040 Fund | 844 | 18 |
| Target 2045 Fund | 70 | N/A |
| Target 2050 Fund | 117 | 0 |
| Target 2055 Fund | 32 | N/A |
| Target 2060 Fund | 293 | 0 |
No contingent deferred sales charges were incurred by Class A shares for the six months ended August 31, 2021.
Shareholder servicing fees
The Trust has entered into contracts with one or more shareholder servicing agents, whereby Class A, Class C, Class R, and Administrator Class of each Fund are charged a fee at an annual rate of 0.25% of the average daily net assets of each respective class. Class R4 is charged a fee at an annual rate of 0.10% of its average daily net assets. A portion of these total shareholder servicing fees were paid to affiliates of Wells Fargo.
Other transactions
On August 14, 2020, Class A, Class C, and/or Class R of each Fund received a payment from Funds Management in connection with resolving certain fee reimbursements.
142 | Target Date Retirement Funds
Notes to financial statements (unaudited)
| | Reimbursement amount |
| | Class A | Class C | Class R |
| Target Today Fund | $ 0 | $ 0 | $232 |
| Target 2010 Fund | 0 | 0 | 230 |
| Target 2015 Fund | 0 | N/A | 235 |
| Target 2020 Fund | 916 | 0 | 372 |
| Target 2025 Fund | 547 | N/A | 397 |
| Target 2030 Fund | 2,838 | 0 | 321 |
| Target 2040 Fund | 2,292 | 0 | 337 |
| Target 2045 Fund | 850 | N/A | 363 |
| Target 2050 Fund | 716 | 17 | 396 |
| Target 2055 Fund | 0 | N/A | 293 |
| Target 2060 Fund | 0 | 1,316 | 897 |
5. INVESTMENT PORTFOLIO TRANSACTIONS
Each Fund seeks to achieve its investment objectives by investing some of its investable assets in affiliated Master Portfolios. Purchases and sales related to these investments have been calculated by aggregating the results of multiplying each Fund's ownership percentage in the respective affiliated Master Portfolio by the corresponding affiliated Master Portfolio’s purchases and sales. Purchases and sales of investments, excluding short-term securities, for the six months ended August 31, 2021 were as follows:
| | Purchases at cost | | Sales proceeds |
| | U.S.
government | Non-U.S.
government | | U.S.
government | Non-U.S.
government |
| Target Today Fund | $ 19,354,128 | $ 9,058,545 | | $ 18,449,581 | $ 10,158,425 |
| Target 2010 Fund | 18,507,597 | 8,683,849 | | 17,642,815 | 9,739,533 |
| Target 2015 Fund | 16,844,648 | 9,402,000 | | 16,057,486 | 10,511,394 |
| Target 2020 Fund | 91,158,097 | 60,638,908 | | 86,898,163 | 67,627,510 |
| Target 2025 Fund | 53,782,096 | 48,427,451 | | 50,945,484 | 53,334,946 |
| Target 2030 Fund | 111,933,451 | 139,182,741 | | 105,427,558 | 151,333,539 |
| Target 2035 Fund | 36,437,592 | 66,362,358 | | 34,229,178 | 71,633,802 |
| Target 2040 Fund | 55,286,891 | 165,420,574 | | 51,936,056 | 178,918,523 |
| Target 2045 Fund | 8,418,826 | 34,947,202 | | 7,908,576 | 37,827,326 |
| Target 2050 Fund | 12,852,882 | 82,142,256 | | 12,073,893 | 88,946,285 |
| Target 2055 Fund | 1,753,174 | 11,350,480 | | 1,646,918 | 12,292,258 |
| Target 2060 Fund | 1,957,631 | 12,702,722 | | 1,838,983 | 13,756,260 |
6. BANK BORROWINGS
The Trust (excluding the money market funds), Wells Fargo Master Trust and Wells Fargo Variable Trust are parties to a $350,000,000 revolving credit agreement whereby each Fund is permitted to use bank borrowings for temporary or emergency purposes, such as to fund shareholder redemption requests. Interest under the credit agreement is charged to each Fund based on a borrowing rate equal to the higher of the Federal Funds rate in effect on that day plus 1.25% or the overnight bank funding rate in effect on that day plus 1.25%. In addition, an annual commitment fee equal to 0.25% of the unused balance is allocated to each participating fund.
For the six months ended August 31, 2021, there were no borrowings by each Fund under the agreement.
Target Date Retirement Funds | 143
Notes to financial statements (unaudited)
7. INDEMNIFICATION
Under each Fund's organizational documents, the officers and Trustees have been granted certain indemnification rights against certain liabilities that may arise out of performance of their duties to each Fund. Each Fund has entered into a separate agreement with each Trustee that converts indemnification rights currently existing under each Fund’s organizational documents into contractual rights that cannot be changed in the future without the consent of the Trustee. Additionally, in the normal course of business, each Fund may enter into contracts with service providers that contain a variety of indemnification clauses. Each Fund’s maximum exposure under these arrangements is dependent on future claims that may be made against each Fund and, therefore, cannot be estimated.
8. CORONAVIRUS (COVID-19) PANDEMIC
On March 11, 2020, the World Health Organization announced that it had made the assessment that coronavirus disease 2019 (“COVID-19”) is a pandemic. The impacts of COVID-19 are affecting the entire global economy, individual companies and investment products, the funds, and the market in general. There is significant uncertainty around the extent and duration of business disruptions related to COVID-19 and the impacts may last for an extended period of time. COVID-19 has led to significant uncertainty and volatility in the financial markets.
9. REORGANIZATIONS
At a meeting of the Board of Trustees held on June 1, 2021, the Trustees of each Fund approved the merger of each Fund (the "Target Fund") in the table below into another Fund of the Trust (the "Acquiring Fund"). Each Acquiring Fund will acquire the assets and assume the liabilities of the respective Target Fund in exchange for shares of Acquiring Fund. The mergers are contingent on a number of conditions. If all conditions are satisfied, the mergers are expected to occur on or about February 11, 2022.
| Target Fund | Acquiring Fund |
| Wells Fargo Target Today Fund | Wells Fargo Dynamic Target Today Fund |
| Wells Fargo Target 2010 Fund | Wells Fargo Dynamic Target Today Fund |
| Wells Fargo Target 2015 Fund | Wells Fargo Dynamic Target 2015 Fund |
| Wells Fargo Target 2020 Fund | Wells Fargo Dynamic Target 2020 Fund |
| Wells Fargo Target 2025 Fund | Wells Fargo Dynamic Target 2025 Fund |
| Wells Fargo Target 2030 Fund | Wells Fargo Dynamic Target 2030 Fund |
| Wells Fargo Target 2035 Fund | Wells Fargo Dynamic Target 2035 Fund |
| Wells Fargo Target 2040 Fund | Wells Fargo Dynamic Target 2040 Fund |
| Wells Fargo Target 2045 Fund | Wells Fargo Dynamic Target 2045 Fund |
| Wells Fargo Target 2050 Fund | Wells Fargo Dynamic Target 2050 Fund |
| Wells Fargo Target 2055 Fund | Wells Fargo Dynamic Target 2055 Fund |
| Wells Fargo Target 2060 Fund | Wells Fargo Dynamic Target 2060 Fund |
10. SUBSEQUENT EVENTS
Wells Fargo Asset Management ("WFAM") announced that it will be changing its company name to Allspring Global Investments upon the closing of the previously announced sale transaction of WFAM by Wells Fargo & Company to GTCR LLC and Reverence Capital Partners, L.P. The new corporate name is expected to go into effect on the closing date of the transaction, which is anticipated to occur in the second half of 2021, subject to customary closing conditions.
The Board of Trustees of the Wells Fargo Funds approved a change in the Funds' names to remove “Wells Fargo” from the Funds' names and replace with “Allspring” on December 6, 2021.
Following the closing of the transaction, Wells Fargo Funds Management, LLC, the Funds' investment manager, Wells Capital Management, LLC and Wells Fargo Asset Management (International) Limited, each subadvisers to certain funds, and Wells Fargo Funds Distributor, LLC, the Funds' principal underwriter, will each be rebranded as Allspring.
At a Special Meeting of Shareholders held on September 15, 2021 and October 15, 2021, shareholders of certain Funds approved a new investment management and a new subadvisory agreement that will be effective at the closing of the sale transaction.
144 | Target Date Retirement Funds
Other information (unaudited)
PROXY VOTING INFORMATION
A description of the policies and procedures used to determine how to vote proxies relating to portfolio securities is available without charge, upon request, by calling 1-800-222-8222, visiting our website at wfam.com, or visiting the SEC website at sec.gov. Information regarding how the proxies related to portfolio securities were voted during the most recent 12-month period ended June 30 is available on the website at wfam.com or by visiting the SEC website at sec.gov.
SPECIAL MEETING OF SHAREHOLDERS
On August 16, 2021, September 15, 2021 and October 15, 2021, a Special Meeting of Shareholders for certain Funds was held to consider the following proposals. The results of the proposals are indicated below.
Proposal 1 – To consider and approve a new investment management agreement with Wells Fargo Funds Management, LLC.
| | Shares voted
“For” | | Shares voted
“Against” | | Shares voted
“Abstain” |
| Target Today Fund | 2,789,107 | | 71,508 | | 264,530 |
| Target 2010 Fund | 2,424,039 | | 97,702 | | 139,720 |
| Target 2015 Fund | 3,591,094 | | 53,134 | | 156,007 |
| Target 2020 Fund | 12,651,693 | | 990,477 | | 718,205 |
| Target 2025 Fund | 15,248,092 | | 1,421,702 | | 817,776 |
| Target 2030 Fund | 18,404,975 | | 1,377,761 | | 1,022,250 |
| Target 2035 Fund | 11,257,874 | | 325,675 | | 745,971 |
| Target 2040 Fund | 12,881,846 | | 799,307 | | 1,561,191 |
| Target 2050 Fund | 12,276,471 | | 1,236,957 | | 1,870,979 |
| Target 2060 Fund | 1,542,511 | | 2,423 | | 229,646 |
Proposal 2 – To consider and approve a new investment sub-advisory agreement with Wells Capital Management, LLC.
| | Shares voted
“For” | | Shares voted
“Against” | | Shares voted
“Abstain” |
| Target Today Fund | 2,700,596 | | 160,668 | | 263,881 |
| Target 2010 Fund | 2,407,726 | | 107,619 | | 146,116 |
| Target 2015 Fund | 3,591,094 | | 53,200 | | 155,941 |
| Target 2020 Fund | 12,612,042 | | 998,931 | | 749,402 |
| Target 2025 Fund | 15,069,177 | | 1,523,242 | | 895,151 |
| Target 2030 Fund | 18,268,379 | | 1,381,093 | | 1,155,514 |
| Target 2035 Fund | 11,206,687 | | 379,682 | | 743,151 |
| Target 2040 Fund | 12,556,308 | | 1,126,034 | | 1,560,002 |
| Target 2050 Fund | 12,317,043 | | 1,196,385 | | 1,870,979 |
| Target 2060 Fund | 1,542,511 | | 2,423 | | 229,646 |
QUARTERLY PORTFOLIO HOLDINGS INFORMATION
Each Fund files its complete schedule of portfolio holdings with the SEC for the first and third quarters of each fiscal year as an exhibit to its reports on Form N-PORT. Shareholders may view the filed Form N-PORT by visiting the SEC website at sec.gov.
Target Date Retirement Funds | 145
Other information (unaudited)
BOARD OF TRUSTEES AND OFFICERS
Each of the Trustees and Officers listed in the table below acts in identical capacities for each fund in the Wells Fargo family of funds, which consists of 139 mutual funds comprising the Wells Fargo Funds Trust, Wells Fargo Variable Trust, Wells Fargo Master Trust and four closed-end funds (collectively the “Fund Complex”). This table should be read in conjunction with the Prospectus and the Statement of Additional Information1. The mailing address of each Trustee and Officer is 525 Market Street, 12th Floor, San Francisco, CA 94105. Each Trustee and Officer serves an indefinite term, however, each Trustee serves such term until reaching the mandatory retirement age established by the Trustees.
Independent Trustees
Name and
year of birth | Position held and
length of service* | Principal occupations during past five years or longer | Current other
public company or
investment
company
directorships |
William R. Ebsworth
(Born 1957) | Trustee,
since 2015 | Retired. From 1984 to 2013, equities analyst, portfolio manager, research director and chief investment officer at Fidelity Management and Research Company in Boston, Tokyo, and Hong Kong, and retired in 2013 as Chief Investment Officer of Fidelity Strategic Advisers, Inc. where he led a team of investment professionals managing client assets. Prior thereto, Board member of Hong Kong Securities Clearing Co., Hong Kong Options Clearing Corp., the Thailand International Fund, Ltd., Fidelity Investments Life Insurance Company, and Empire Fidelity Investments Life Insurance Company. Audit Committee Chair and Investment Committee Chair of the Vincent Memorial Hospital Endowment (non-profit organization). Mr. Ebsworth is a CFA® charterholder. | N/A |
Jane A. Freeman
(Born 1953) | Trustee,
since 2015;
Chair Liaison,
since 2018 | Retired. From 2012 to 2014 and 1999 to 2008, Chief Financial Officer of Scientific Learning Corporation. From 2008 to 2012, Ms. Freeman provided consulting services related to strategic business projects. Prior to 1999, Portfolio Manager at Rockefeller & Co. and Scudder, Stevens & Clark. Board member of the Harding Loevner Funds from 1996 to 2014, serving as both Lead Independent Director and chair of the Audit Committee. Board member of the Russell Exchange Traded Funds Trust from 2011 to 2012 and the chair of the Audit Committee. Ms. Freeman is also an inactive Chartered Financial Analyst. | N/A |
Isaiah Harris, Jr.
(Born 1952) | Trustee,
since 2009; Audit
Committee
Chair,
since 2019 | Retired. Chairman of the Board of CIGNA Corporation since 2009, and Director since 2005. From 2003 to 2011, Director of Deluxe Corporation. Prior thereto, President and CEO of BellSouth Advertising and Publishing Corp. from 2005 to 2007, President and CEO of BellSouth Enterprises from 2004 to 2005 and President of BellSouth Consumer Services from 2000 to 2003. Emeritus member of the Iowa State University Foundation Board of Governors. Emeritus Member of the Advisory Board of Iowa State University School of Business. Advisory Board Member, Palm Harbor Academy (private school). Mr. Harris is a certified public accountant (inactive status). | CIGNA Corporation |
Judith M. Johnson
(Born 1949) | Trustee,
since 2008 | Retired. Prior thereto, Chief Executive Officer and Chief Investment Officer of Minneapolis Employees Retirement Fund from 1996 to 2008. Ms. Johnson is an attorney, certified public accountant and a certified managerial accountant. | N/A |
David F. Larcker
(Born 1950) | Trustee,
since 2009 | James Irvin Miller Professor of Accounting at the Graduate School of Business (Emeritus), Stanford University, Director of the Corporate Governance Research Initiative and Senior Faculty of The Rock Center for Corporate Governance since 2006. From 2005 to 2008, Professor of Accounting at the Graduate School of Business, Stanford University. Prior thereto, Ernst & Young Professor of Accounting at The Wharton School, University of Pennsylvania from 1985 to 2005. | N/A |
146 | Target Date Retirement Funds
Other information (unaudited)
Name and
year of birth | Position held and
length of service* | Principal occupations during past five years or longer | Current other
public company or
investment
company
directorships |
Olivia S. Mitchell
(Born 1953) | Trustee,
since 2006;
Nominating and
Governance
Committee Chair,
since 2018 | International Foundation of Employee Benefit Plans Professor, Wharton School of the University of Pennsylvania since 1993. Director of Wharton’s Pension Research Council and Boettner Center on Pensions & Retirement Research, and Research Associate at the National Bureau of Economic Research. Previously, Cornell University Professor from 1978 to 1993. | N/A |
Timothy J. Penny
(Born 1951) | Trustee,
since 1996;
Chair,
since 2018 | President and Chief Executive Officer of Southern Minnesota Initiative Foundation, a non-profit organization, since 2007. Member of the Board of Trustees of NorthStar Education Finance, Inc., a non-profit organization, since 2007. | N/A |
James G. Polisson
(Born 1959) | Trustee,
since 2018 | Retired. Chief Marketing Officer, Source (ETF) UK Services, Ltd, from 2015 to 2017. From 2012 to 2015, Principal of The Polisson Group, LLC, a management consulting, corporate advisory and principal investing company. Chief Executive Officer and Managing Director at Russell Investments, Global Exchange Traded Funds from 2010 to 2012. Managing Director of Barclays Global Investors from 1998 to 2010 and Global Chief Marketing Officer for iShares and Barclays Global Investors from 2000 to 2010. Trustee of the San Francisco Mechanics’ Institute, a non-profit organization, from 2013 to 2015. Board member of the Russell Exchange Traded Fund Trust from 2011 to 2012. Director of Barclays Global Investors Holdings Deutschland GmbH from 2006 to 2009. Mr. Polisson is an attorney and has a retired status with the Massachusetts and District of Columbia Bar Associations. | N/A |
Pamela Wheelock
(Born 1959) | Trustee,
since January
2020; previously
Trustee from
January 2018 to
July 2019 | Board member of the Destination Medical Center Economic Development Agency, Rochester, Minnesota since 2019. Interim President of the McKnight Foundation from January to September 2020. Acting Commissioner, Minnesota Department of Human Services, July 2019 through September 2019. Human Services Manager (part-time), Minnesota Department of Human Services, October 2019 through December 2019. Chief Operating Officer, Twin Cities Habitat for Humanity from 2017 to 2019. Vice President of University Services, University of Minnesota from 2012 to 2016. Prior thereto, on the Board of Directors, Governance Committee and Finance Committee for the Minnesota Philanthropy Partners (Saint Paul Foundation) from 2012 to 2018, Interim Chief Executive Officer of Blue Cross Blue Shield of Minnesota from 2011 to 2012, Chairman of the Board from 2009 to 2012 and Board Director from 2003 to 2015. Vice President, Leadership and Community Engagement, Bush Foundation, Saint Paul, Minnesota (a private foundation) from 2009 to 2011. Executive Vice President and Chief Financial Officer, Minnesota Sports and Entertainment from 2004 to 2009 and Senior Vice President from 2002 to 2004. Executive Vice President of the Minnesota Wild Foundation from 2004 to 2008. Commissioner of Finance, State of Minnesota, from 1999 to 2002. Currently Board Chair of the Minnesota Wild Foundation since 2010. | N/A |
* Length of service dates reflect the Trustee’s commencement of service with the Trust’s predecessor entities, where applicable.
Target Date Retirement Funds | 147
Other information (unaudited)
Officers
Name and
year of birth | Position held and
length of service | Principal occupations during past five years or longer |
Andrew Owen
(Born 1960) | President,
since 2017 | Executive Vice President of Wells Fargo & Company and Head of Affiliated Managers, Wells Fargo Asset Management, since 2014. In addition, Mr. Owen is currently President, Chief Executive Officer and Director of Wells Fargo Funds Management, LLC since 2017. Prior thereto, Executive Vice President responsible for marketing, investments and product development for Wells Fargo Funds Management, LLC, from 2009 to 2014. |
Jeremy DePalma
(Born 1974) | Treasurer,
since 2012
(for certain funds in
the Fund Complex);
since 2021 (for
the remaining funds in the
Fund Complex) | Senior Vice President of Wells Fargo Funds Management, LLC since 2009. Senior Vice President of Evergreen Investment Management Company, LLC from 2008 to 2010 and head of the Fund Reporting and Control Team within Fund Administration from 2005 to 2010. |
Michelle Rhee
(Born 1966) | Chief Legal Officer,
since 2019 | Secretary of Wells Fargo Funds Management, LLC and Chief Legal Counsel of Wells Fargo Asset Management since 2018. Deputy General Counsel of Wells Fargo Bank, N.A. since 2020 and Assistant General Counsel of Wells Fargo Bank, N.A. from 2018 to 2020. Associate General Counsel and Managing Director of Bank of America Corporation from 2004 to 2018. |
Matthew Prasse
(Born 1983) | Secretary,
since 2021 | Senior Counsel of the Wells Fargo Legal Department since 2018. Previously, Director and Counsel for Barings LLC from 2015 to 2018. Prior to joining Barings, Associate at Morgan, Lewis & Bockius LLP from 2008 to 2015. |
Michael H. Whitaker
(Born 1967) | Chief Compliance Officer,
since 2016 | Chief Compliance Officer of Wells Fargo Asset Management since 2016. Senior Vice President and Chief Compliance Officer for Fidelity Investments from 2007 to 2016. |
1 The Statement of Additional Information includes additional information about the Trustees and is available, without charge, upon request, by calling 1-800-222-8222 or by visiting the website at wfam.com.
148 | Target Date Retirement Funds
Board considerations (unaudited)
BOARD CONSIDERATION OF INVESTMENT MANAGEMENT AND SUB-ADVISORY AGREEMENTS:
Wells Fargo Target Today Fund, Wells Fargo Target 2010 Fund, Wells Fargo Target 2015 Fund, Wells Fargo Target 2020 Fund, Wells Fargo Target 2025 Fund, Wells Fargo Target 2030 Fund, Wells Fargo Target 2035 Fund, Wells Fargo Target 2040 Fund, Wells Fargo Target 2045 Fund, Wells Fargo Target 2050 Fund, Wells Fargo Target 2055 Fund, and Wells Fargo Target 2060 Fund
Board Considerations – Current Agreements
Under the Investment Company Act of 1940 (the “1940 Act”), the Board of Trustees (the “Board”) of Wells Fargo Funds Trust (the “Trust”) must determine annually whether to approve the continuation of the Trust’s investment management and sub-advisory agreements. In this regard, at a Board meeting held on May 17-19, 2021 (the “Meeting”), the Board, all the members of which have no direct or indirect interest in the investment management and sub-advisory agreements and are not “interested persons” of the Trust, as defined in the 1940 Act (the “Independent Trustees”), reviewed and approved for each of the funds of the Trust identified above (each, a “Fund” and collectively, the “Funds”): (i) an investment management agreement (the “Management Agreement”) with Wells Fargo Funds Management, LLC (“Funds Management”); and (ii) an investment sub-advisory agreement (the “Sub-Advisory Agreement”) with Wells Capital Management Incorporated (the “Sub-Adviser”), an affiliate of Funds Management. The Management Agreement and the Sub-Advisory Agreement are collectively referred to as the “Advisory Agreements.”
The Board noted that Wells Fargo & Company recently announced that it had entered into a definitive agreement to sell Wells Fargo Asset Management (“WFAM”), which includes Funds Management and the Sub-Adviser, to GTCR LLC and Reverence Capital Partners, L.P. and/or their affiliates (the “Transaction”). The Board further noted that the Transaction would result in a change-of-control of Funds Management and the Sub-Adviser, which would be considered to be an assignment that would result in the termination of the Advisory Agreements. In light of the Transaction, the Board separately considered for approval a new investment management agreement with Funds Management and a new sub-advisory agreement with the Sub-Adviser (the “New Agreements”) that would replace the Advisory Agreements upon consummation of the Transaction, subject to approval of the New Agreements by the Funds’ shareholders. The Board also considered for approval interim agreements to go into effect in the event shareholders do not approve the New Agreements before the Transaction is completed. The interim agreements would allow the Manager and the Sub-Adviser to continue providing services to the Funds while the Funds continues to seek shareholder approval of the New Agreements. The Board noted that the terms of the interim agreements would be identical to those of the current Advisory Agreements, except for the term and certain escrow provisions.
At the Meeting, the Board considered the factors and reached the conclusions described below relating to the selection of Funds Management and the Sub-Adviser and the approval of the Advisory Agreements. Prior to the Meeting, including at Board meetings held in April and May 2021, the Trustees conferred extensively among themselves and with representatives of Funds Management about these matters. Also, the Board has adopted a team-based approach, with each team consisting of a sub-set of Trustees, to assist the full Board in the discharge of its duties in reviewing investment performance and other matters throughout the year. The Independent Trustees were assisted in their evaluation of the Advisory Agreements by independent legal counsel, from whom they received separate legal advice and with whom they met separately.
In providing information to the Board, Funds Management and the Sub-Adviser were guided by a detailed set of requests for information submitted to them by independent legal counsel on behalf of the Independent Trustees at the start of the Board’s annual contract renewal process earlier in 2021. In considering and approving the Advisory Agreements, the Trustees considered the information they believed relevant, including but not limited to the information discussed below. The Board considered not only the specific information presented in connection with the Meeting, but also the knowledge gained over time through interaction with Funds Management and the Sub-Adviser about various topics. In this regard, the Board reviewed reports of Funds Management at each of its quarterly meetings, which included, among other things, portfolio reviews and investment performance reports. In addition, the Board and the teams mentioned above confer with portfolio managers at various times throughout the year. The Board did not identify any particular information or consideration that was all-important or controlling, and each individual Trustee may have attributed different weights to various factors.
After its deliberations, the Board unanimously determined that the compensation payable to Funds Management and the Sub-Adviser under each of the Advisory Agreements was reasonable, and approved the continuation of the Advisory Agreements for a one-year term. The Board considered the approval of the Advisory Agreements for the Funds as part of its consideration of
Wells Fargo Target Today Fund | 149
Board considerations (unaudited)
agreements for funds across the complex, but its approvals were made on a fund-by-fund basis. The following summarizes a number of important, but not necessarily all, factors considered by the Board in support of its approvals.
Nature, extent and quality of services
The Board received and considered various information regarding the nature, extent and quality of services provided to the Funds by Funds Management and the Sub-Adviser under the Advisory Agreements. This information included a description of the investment advisory services and Fund-level administrative services covered by the Management Agreement, as well as, among other things, a summary of the background and experience of senior management of WFAM, of which Funds Management and the Sub-Adviser are a part, and a summary of investments made in the business of WFAM. The Board also received a description of Funds Management’s and the Sub-Adviser’s business continuity plans, including a summary of the performance of such plans and any changes thereto during the COVID-19 pandemic, and of their approaches to data privacy and cybersecurity. The Board also received and reviewed information about Funds Management’s role as administrator of the Funds’ liquidity risk management program, Funds Management’s approach to risk management, and Funds Management’s intermediary and vendor oversight program.
The Board also considered the qualifications, background, tenure and responsibilities of each of the portfolio managers primarily responsible for the day-to-day portfolio management of the Funds. The Board evaluated the ability of Funds Management and the Sub-Adviser to attract and retain qualified investment professionals, including research, advisory and supervisory personnel.
The Board further considered the compliance programs and compliance records of Funds Management and the Sub-Adviser. In addition, the Board took into account the full range of services provided to the Funds by Funds Management and its affiliates. The Board also considered information about retention and back-up arrangements that have been put into place with respect to key personnel of WFAM in connection with the anticipated Transaction, noting that WFAM provided assurances that the announcement and eventual culmination of the Transaction is not expected to result in any diminution in the nature or quality of services provided to the Funds.
Fund investment performance and expenses
The Board considered the investment performance results for each of the Funds over various time periods ended December 31, 2020. The Board considered these results in comparison to the investment performance of funds in a universe that was determined by Broadridge Inc. (“Broadridge”) to be similar to each respective Fund (each, a “Universe”), and in comparison to each Fund’s benchmark index and to other comparative data. Broadridge is an independent provider of investment company data. The Board received a description of the methodology used by Broadridge to select the mutual funds in the performance Universe. The Board noted that the investment performance of each Fund (Administrator Class) relative to its respective Universe, was lower than the average investment performance of each Fund’s respective Universe for all periods under review, except for the three-year performance of the Wells Fargo Target Today Fund. The Board noted that the three-year performance of the Wells Fargo Target Today Fund was in range of the average investment performance of each Fund’s Universe.
With respect to the investment performance of each Fund (Administrator Class) relative to its respective benchmark index, the Board noted the following: (i) the investment performance of each of Wells Fargo Target Today Fund, Wells Fargo Target 2010 Fund, Wells Fargo Target 2015 Fund, and Wells Fargo Target 2020 Fund was lower than such Fund’s respective benchmark index for all periods under review; (ii) the investment performance of each of Wells Fargo Target 2025 Fund and Wells Fargo Target 2030 Fund was in range of such Fund’s respective benchmark index for the one-year period, and lower than such Fund’s respective benchmark index for the three-, five-, and ten-year periods; (iii) the investment performance of each of Wells Fargo Target 2035 Fund, Wells Fargo Target 2040 Fund, Wells Fargo Target 2045 Fund, and Wells Fargo Target 2050 Fund was higher than, equal to, or in range of such Fund’s respective benchmark index for the one- and three-year periods, and was lower than such Fund’s respective benchmark index for the five- and ten-year periods; and (iv) the investment performance of each of Wells Fargo Target 2055 Fund and Wells Fargo Target 2060 Fund was higher than or in range of such Fund’s respective benchmark index for the one- and three-year periods, and was lower than such Fund’s respective benchmark index for the ten-year period.
The Board received information concerning, and discussed factors contributing to, the underperformance of the Funds for the periods identified above. The Board took note of the explanations for the underperformance relative to each Fund’s Universe and benchmark index for the periods identified above, including with respect to investment decisions and market factors that affected each Fund’s investment performance.
The Board also received and considered information regarding each Fund’s net operating expense ratios and their various components, including actual management fees, custodian and other non-management fees, and Rule 12b-1 and non-Rule 12b-1 shareholder service fees. The Board considered these ratios for each Fund in comparison to the median ratios of funds in class-specific expense groups that were determined by Broadridge to be similar to each Fund (the “Groups”). The Board received a description of the methodology used by Broadridge to select the mutual funds in the expense Groups and an explanation of how
150 | Wells Fargo Target Today Fund
Board considerations (unaudited)
funds comprising expense groups and their expense ratios may vary from year-to-year. Based on the Broadridge reports, the Board noted that the net operating expense ratios of each of the Funds were lower than the median net operating expense ratio of each Fund’s respective expense Group for all share classes.
The Board took into account each Fund’s investment performance and expense information provided to it among the factors considered in deciding to re-approve the Advisory Agreements.
Investment management and sub-advisory fee rates
The Board reviewed and considered the contractual fee rates payable by each Fund to Funds Management under the Management Agreement, as well as the contractual fee rates payable by each Fund to Funds Management for class-level administrative services under a Class-Level Administration Agreement, which include, among other things, class-level transfer agency and sub-transfer agency costs (collectively, the “Management Rates”). The Board also reviewed and considered the contractual investment sub-advisory fee rates that are payable by Funds Management to the Sub-Adviser for investment sub-advisory services.
Among other information reviewed by the Board was a comparison of each Fund’s Management Rates with the average contractual investment management fee rates of funds in the expense Groups at a common asset level as well as transfer agency costs of the funds in the expense Groups. The Board noted that the Management Rates of each Fund were equal to, lower than, or in range of the sum of these average rates for the expense Groups for all share classes.
The Board also received and considered information about the portion of the total management fee that was retained by Funds Management after payment of the fee to the Sub-Adviser for sub-advisory services. In assessing the reasonableness of this amount, the Board received and evaluated information about the nature and extent of responsibilities retained and risks assumed by Funds Management and not delegated to or assumed by the Sub-Adviser, and about Funds Management’s on-going oversight services. Given the affiliation between Funds Management and the Sub-Adviser, the Board ascribed limited relevance to the allocation of fees between them.
Based on its consideration of the factors and information it deemed relevant, including those described here, the Board determined that the compensation payable to Funds Management under the Management Agreement and to the Sub-Adviser under the Sub-Advisory Agreement was reasonable.
Profitability
The Board received and considered information concerning the profitability of Funds Management, as well as the profitability of both WFAM and Wells Fargo & Co. (“Wells Fargo”) from providing services to the fund family as a whole. The Board noted that the Sub-Adviser’s profitability information with respect to providing services to the Funds and other funds in the family was subsumed in the WFAM and Wells Fargo profitability analysis.
Funds Management reported on the methodologies and estimates used in calculating profitability, including a description of the methodology used to allocate certain expenses. Among other things, the Board noted that the levels of profitability reported on a fund-by-fund basis varied widely, depending on factors such as the size, type and age of fund.
Based on its review, the Board did not deem the profits reported by Funds Management, WFAM or Wells Fargo from services provided to the Funds to be at a level that would prevent it from approving the continuation of the Advisory Agreements.
Economies of scale
The Board received and considered information about the potential for Funds Management to experience economies of scale in the provision of management services to the Funds, the difficulties of calculating economies of scale at an individual fund level, and the extent to which potential scale benefits are shared with shareholders. The Board noted the existence of breakpoints in each Fund’s management fee structure, which operate generally to reduce the Fund’s expense ratios as the Fund grows in size, and the size of the Fund in relation to such breakpoints. The Board considered that in addition to management fee breakpoints, Funds Management shares potential economies of scale from its management business in a variety of ways, including through fee waiver and expense reimbursement arrangements, competitive management fee rates set at the outset without regard to breakpoints, and investments in the business intended to enhance services available to shareholders.
The Board concluded that Funds Management’s arrangements with respect to the Funds, including contractual breakpoints, constituted a reasonable approach to sharing potential economies of scale with the Funds and their shareholders.
Other benefits to Funds Management and the Sub-Adviser
The Board received and considered information regarding potential “fall-out” or ancillary benefits received by Funds Management and its affiliates, including the Sub-Adviser, as a result of their relationships with the Funds. Ancillary benefits could include, among others, benefits directly attributable to other relationships with the Funds and benefits potentially derived from an increase in
Wells Fargo Target Today Fund | 151
Board considerations (unaudited)
Funds Management’s and the Sub-Adviser’s business as a result of their relationships with the Funds. The Board noted that various affiliates of Funds Management may receive distribution-related fees, shareholder servicing payments and sub-transfer agency fees in respect of shares sold or held through them and services provided.
The Board also reviewed information about soft dollar credits earned and utilized by the Sub-Adviser, fees earned by Funds Management and the Sub-Adviser from managing a private investment vehicle for the fund family’s securities lending collateral and commissions earned by an affiliated broker from portfolio transactions.
Based on its consideration of the factors and information it deemed relevant, including those described here, the Board did not find that any ancillary benefits received by Funds Management and its affiliates, including the Sub-Adviser, were unreasonable.
Conclusion
At the Meeting, after considering the above-described factors and based on its deliberations and its evaluation of the information described above, the Board unanimously determined that the compensation payable to Funds Management and the Sub-Adviser under each of the Advisory Agreements was reasonable, and approved the continuation of the Advisory Agreements for a one-year term.
152 | Wells Fargo Target Today Fund
Board considerations (unaudited)
Board Considerations – New Agreements
Overview of the Board evaluation process
At a meeting held on May 17-19, 2021 (the “Board Meeting”), the Board of Trustees (the “Board”) of Wells Fargo Funds Trust (the “Trust”, and the series identified below, the “Funds”) approved the continuation of each Fund’s current Investment Management Agreement (the “Current Investment Management Agreement”) and the current Wells Cap Sub-Advisory Agreement (the “Current Wells Cap Sub-Advisory Agreement”, and collectively, the “Current Agreements”).
| Wells Fargo Dynamic Target Today Fund |
| Wells Fargo Dynamic Target 2015 Fund |
| Wells Fargo Dynamic Target 2020 Fund |
| Wells Fargo Dynamic Target 2025 Fund |
| Wells Fargo Dynamic Target 2030 Fund |
| Wells Fargo Dynamic Target 2035 Fund |
| Wells Fargo Dynamic Target 2040 Fund |
| Wells Fargo Dynamic Target 2045 Fund |
| Wells Fargo Dynamic Target 2050 Fund |
| Wells Fargo Dynamic Target 2055 Fund |
| Wells Fargo Dynamic Target 2060 Fund |
| Wells Fargo Target Today Fund |
| Wells Fargo Target 2010 Fund |
| Wells Fargo Target 2015 Fund |
| Wells Fargo Target 2020 Fund |
| Wells Fargo Target 2025 Fund |
| Wells Fargo Target 2030 Fund |
| Wells Fargo Target 2035 Fund |
| Wells Fargo Target 2040 Fund |
| Wells Fargo Target 2045 Fund |
| Wells Fargo Target 2050 Fund |
| Wells Fargo Target 2055 Fund |
| Wells Fargo Target 2060 Fund |
Each Trustee on the Board is not an “interested person” (as defined in the Investment Company Act of 1940 (the “1940 Act”)) of the Funds (collectively, the “Independent Trustees”). The process followed by the Board in considering and approving the continuation of the Current Agreements is referred to herein as the “2021 Annual Approval Process.”
As noted above, the closing of the sale of Wells Fargo Asset Management (“WFAM”) to a holding company (“NewCo”) affiliated with private funds of GTCR LLC (“GTCR”) and of Reverence Capital Partners, L.P. (“Reverence Capital”, and such transaction, the “Transaction”) will result in a change of control of Wells Fargo Funds Management LLC (“Funds Management”) and Wells Capital Management Incorporated (“Wells Capital” or the “Sub-Adviser”, and together with Funds Management, the “Advisers”), which will be considered to be an “assignment” of each Fund’s Current Agreements under the 1940 Act that will result in the automatic termination of each Fund’s Current Agreements. In light of the expected termination of each Fund’s Current Agreements upon the closing, at the Board Meeting the Board also considered and approved: (i) a new Investment Management Agreement between the Trust, on behalf of each Fund, and Funds Management (the “New Investment Management Agreement”); and (ii) a new Sub-Advisory Agreement among the Trust, on behalf of each Fund, Funds Management and Wells Capital (the “New Sub-Advisory Agreement”, and collectively, the “New Agreements”), each of which is intended to go into effect upon the closing. The process followed by the Board in reviewing and approving the New Agreements is referred to herein as the “New Agreement Approval Process.”
At a series of meetings held in April and May 2021 (collectively, “April and May 2021 Meetings”) and at the Board Meeting, the Trustees conferred extensively among themselves and with senior representatives of Funds Management, GTCR and Reverence Capital about the New Agreements and related matters. The Board reviewed and discussed information furnished by Funds Management, GTCR and Reverence Capital that the Board considered reasonably necessary to evaluate the terms of the New Agreements and the services to be provided. At these meetings, senior representatives from Funds Management, GTCR and Reverence Capital made presentations to, and responded to questions from, the Board.
In providing information to the Board in connection with the 2021 annual approval process for the Current Agreements (the “2021 Annual Approval Process”) and the New Agreement Approval Process, Funds Management, GTCR and Reverence Capital (as applicable) were guided by requests for information submitted by independent legal counsel on behalf of the Independent
Wells Fargo Target Today Fund | 153
Board considerations (unaudited)
Trustees. In considering and approving the New Agreements, the Trustees considered the information they believed relevant, including but not limited to the information discussed herein. The Board considered not only the specific information presented in connection with the April and May 2021 Meetings as well as the Board Meeting, but also the knowledge gained over time through interaction with Funds Management and the Sub-Adviser about various topics. In this regard, the Board reviews reports of Funds Management at each of its regular Board meetings, which includes, among other things, portfolio reviews and investment performance reports. In addition, the Board confers with portfolio managers at various times throughout the year. The Board was assisted in its evaluation of the New Agreements by independent legal counsel, from whom the Independent Trustees received separate legal advice and with whom the Independent Trustees met separately. The Board did not identify any particular information or consideration that was all-important or controlling, and each individual Trustee may have attributed different weights to various factors.
Among other information considered by the Board in connection with the Transaction was:
| ■ | Information regarding the Transaction: information about the structure, financing sources and material terms and conditions of the Transaction, including the expected impact on the businesses conducted by the Advisers and by Wells Fargo Funds Distributor LLC, as the distributor of Fund shares. |
| ■ | Information regarding NewCo, GTCR and Reverence Capital: (i) information about NewCo, including information about its expected financial condition and access to capital, and senior leadership team; (ii) the experience of senior management at GTCR and Reverence Capital in acquiring portfolio companies; (iii) the plan to operationalize NewCo, including the transition of necessary infrastructure services through a transition services agreement with Wells Fargo under which Wells Fargo will continue to provide NewCo with certain services for a specified period of time after the closing; and (iv) information regarding regulatory matters, compliance, and risk management functions at NewCo, including resources to be dedicated thereto. |
| ■ | Impact of the Transaction on WFAM and Service Providers: (i) information regarding any changes to personnel and/or other resources of the Advisers as a result of the Transaction, including assurances regarding comparable and competitive compensation arrangements to attract and retain highly qualified personnel; and (ii) information about the organizational and operating structure with respect to NewCo, the Advisers and the Funds. |
| ■ | Impact of the Transaction on the Funds and their Shareholders: (i) information regarding anticipated benefits to the Funds as a result of the Transaction; (ii) a commitment that the Funds would not bear any expenses, directly or indirectly, in connection with the Transaction; (iii) confirmation that the Advisers intend to continue to manage the Funds in a manner consistent with each Fund’s current investment objectives and principal investments strategies; and (iv) a commitment that neither NewCo nor WFAM will take any steps that would impose any “unfair burden” (as that term is used in section 15(f)(1)(B) of the 1940 Act) on the Funds as a result of the Transaction. |
With respect to the New Agreements, the Board considered: (i) a representation that, after the closing, all of the Funds will continue to be managed and advised by their current Advisers, and that the same portfolio managers of the Sub-Adviser are expected to continue to manage the Funds after the Transaction; (ii) information regarding the terms of the New Agreements, including changes as compared to the Current Agreements; (iii) information confirming that the fee rates payable under the New Agreements will not increase as a result of the Transaction as compared to the rates under the Current Agreements; and (iv) assurances that the Transaction is not expected to cause any diminution with respect to the nature, extent and quality of any of the services currently provided to the Funds by the Advisers as a result of the Transaction.
In addition to considering information furnished specifically to evaluate the impact of the Transaction on the Funds and their respective shareholders in connection with the New Agreement Approval Process, the Board considered information furnished at prior meetings of the Board and its committees, including detailed information provided in connection with the 2021 Annual Approval Process. In this regard, in connection with the 2021 Annual Approval Process, the Board received information about complex-wide and individual Fund performance, fees and expenses, including: (i) a report from an independent data provider comparing the investment performance of each Fund to the investment performance of comparable funds and benchmark indices, over various time periods; (ii) a report from an independent data provider comparing each Fund’s total expense ratio (and its components) to those of comparable funds; (iii) comparative information concerning the fees charged and services provided by the Advisers to each Fund in managing other accounts (which may include other mutual funds, collective investment funds and institutional accounts), if any, that employ investment strategies and techniques similar to those used in managing such Fund(s); and (iv) profitability analyses of Funds Management, as well as the profitability of both WFAM and Wells Fargo from providing services to the fund family as a whole.
After its deliberations, the Board unanimously determined that the compensation payable to Funds Management and the Sub-Adviser under the New Agreements is reasonable, approved the New Agreements for a two-year term, and voted to recommend that Fund shareholders approve the New Agreements. The Board considered the approval of the New Agreements as part of its
154 | Wells Fargo Target Today Fund
Board considerations (unaudited)
consideration of agreements for funds across the complex, but its approvals were made on a fund-by-fund basis. The following summarizes a number of important, but not necessarily all, factors considered by the Board in support of its approvals.
Nature, extent and quality of services
In connection with the 2021 Annual Approval Process, the Board received and considered various information regarding the nature, extent and quality of services provided to each Fund by Funds Management and the Sub-Adviser under the Current Agreements. This information included a description of the investment advisory services and Fund-level administrative services covered by the Current Management Agreement, as well as, among other things, a summary of the background and experience of senior management of WFAM, of which Funds Management and the Sub-Adviser are a part, and a summary of investments made in the business of WFAM. The Board also received a description of Funds Management’s and the Sub-Adviser’s business continuity plans, including a summary of the performance of such plans and any changes thereto during the COVID-19 pandemic, and of their approaches to data privacy and cybersecurity. The Board also received and reviewed information about Funds Management’s role as administrator of the Funds’ liquidity risk management program, Funds Management’s approach to risk management, and Funds Management’s intermediary and vendor oversight program.
In connection with the 2021 Annual Approval Process, the Board also considered the qualifications, background, tenure and responsibilities of each of the portfolio managers primarily responsible for the day-to-day portfolio management of the Funds. The Board evaluated the ability of Funds Management and the Sub-Adviser to attract and retain qualified investment professionals, including research, advisory and supervisory personnel.
In connection with the 2021 Annual Approval Process, the Board further considered the compliance programs and compliance records of Funds Management and the Sub-Adviser. In addition, the Board took into account the full range of services provided to the Funds by Funds Management and its affiliates.
In connection with the New Agreement Approval Process, the Board considered, among other information, the structure of the Transaction and expected impact, if any, of the Transaction on the operations, facilities, organization and personnel of the Advisers. The Board received assurances from the Advisers that each Fund will continue to be advised by its current Advisers after the closing, and that the same individual portfolio managers are expected to continue to manage the Funds after the closing. With respect to the recruitment and retention of key personnel, the Board noted information from GTCR, Reverence Capital and the Advisers regarding the potential benefits for employees of joining NewCo. The Board recognized that the personnel who had been extended offers may not accept such offers, and personnel changes may occur in the future in the ordinary course.
In addition, the Board considered information regarding the infrastructure, operational capabilities and support staff in place to assist in the portfolio management and operations of the Funds, including the provision of administrative services, and the anticipated impact of the Transaction on such matters. The Board also considered the business-related and other risks to which the Advisers may be subject in managing the Funds and in connection with the Transaction. The Board also considered the transition and integration plans as a result of the change in ownership of the Advisers from Wells Fargo to NewCo. The Board considered the resources and infrastructure that NewCo intends to devote to its compliance program to ensure compliance with applicable laws and regulations, as well as its risk management program and cybersecurity program. The Board also took into account assurances received from the Advisers, GTCR and Reverence Capital that the Transaction is not expected to cause any diminution in the nature, extent and quality of services provided by the Advisers to the Funds and their shareholders.
Fund investment performance and expenses
In connection with the 2021 Annual Approval Process, the Board considered the investment performance results for each Fund over various time periods ended December 31, 2020. The Board considered these results in comparison to the investment performance of funds in a universe that was determined by Broadridge Inc. (“Broadridge”) to be similar to each Fund (the “Universe”), and in comparison to each Fund’s benchmark index and to other comparative data. Broadridge is an independent provider of investment company data. The Board received a description of the methodology used by Broadridge to select the mutual funds in the performance Universe. Where applicable, the Board received information concerning, and discussed factors contributing to, underperformance of Funds relative to the Universe and benchmark for any underperformance periods.
In connection with the 2021 Annual Approval Process, the Board also received and considered information regarding each Fund’s net operating expense ratios and their various components, including actual management fees, custodian and other non-management fees, and Rule 12b-1 and non-Rule 12b-1 shareholder service fees. The Board considered these ratios in comparison to the median ratios of funds in class-specific expense groups that were determined by Broadridge to be similar to the Fund (the “Groups”). The Board received a description of the methodology used by Broadridge to select the mutual funds in the expense Groups and an explanation of how funds comprising expense groups and their expense ratios may vary from year-to-year.
Wells Fargo Target Today Fund | 155
Board considerations (unaudited)
In connection with the New Agreement Approval Process, the Board received a commitment that WFAM will maintain fee and expense commitments for at least two years after the closing. The Board took into account each Fund’s investment performance and expense information among the factors considered in deciding to approve the New Agreements.
Investment management and sub-advisory fee rates
In connection with the 2021 Annual Approval Process, the Board reviewed and considered the contractual fee rates payable by each Fund to Funds Management under the Current Management Agreement, as well as the contractual fee rates payable by each Fund to Funds Management for class-level administrative services under a Class-Level Administration Agreement, which include, among other things, class-level transfer agency and sub-transfer agency costs (collectively, the “Management Rates”). The Board also reviewed and considered the contractual investment sub-advisory fee rates that are payable by Funds Management to the Sub-Adviser under the Current Sub-Advisory Agreements for investment sub-advisory services (the “Sub-Advisory Fee Rates”).
Among other information reviewed by the Board in connection with the 2021 Annual Approval Process, was a comparison of each Fund’s Management Rates with the average contractual investment management fee rates of funds in the expense Groups at a common asset level as well as transfer agency costs of the funds in the expense Groups.
In connection with the 2021 Annual Approval Process, the Board also received and considered information about the portion of the total management fee that was retained by Funds Management after payment of the Sub-Advisory Fee Rates. In assessing the reasonableness of this amount, the Board received and evaluated information about the nature and extent of responsibilities retained and risks assumed by Funds Management and not delegated to or assumed by the Sub-Adviser, and about Funds Management’s on-going oversight services. Given the affiliation between Funds Management and the Sub-Adviser, the Board ascribed limited relevance to the allocation of fees between them.
In connection with the 2021 Annual Approval Process, the Board also received and considered information about the nature and extent of services offered and fee rates charged by Funds Management and the Sub-Adviser to other types of clients, if any, with investment strategies similar to those of each Fund. In this regard, the Board received information about the significantly greater scope of services, and compliance, reporting and other legal burdens and risks of managing proprietary mutual funds compared with those associated with managing assets of other types of clients, including third-party sub-advised fund clients and non-mutual fund clients such as institutional separate accounts.
In connection with the New Agreement Approval Process, the Board noted the assurances received by it that there would be no increases to any of the Management Rates or the Sub-Advisory Fee Rates as a result of the Transaction. The Board also considered that the New Agreements do not change the computation method for calculating such fees, and there is no present intention to reduce expense waiver and reimbursement arrangements that are currently in effect. Based on its consideration of the factors and information it deemed relevant, including those described here, the Board determined that the compensation payable to Funds Management under the New Management Agreement and to the Sub-Adviser under the New Sub-Advisory Agreement was reasonable.
Profitability
In connection with the 2021 Annual Approval Process, the Board received and considered information concerning the profitability of Funds Management, as well as the profitability of both WFAM and Wells Fargo from providing services to the fund family as a whole. The Board noted that the Sub-Adviser’s profitability information with respect to providing services to each Fund and other funds in the family was subsumed in the WFAM and Wells Fargo profitability analysis.
Funds Management reported on the methodologies and estimates used in calculating profitability in connection with the 2021 Annual Approval Process, including a description of the methodology used to allocate certain expenses. Among other things, the Board noted that the levels of profitability reported on a fund-by-fund basis varied widely, depending on factors such as the size, type and age of fund.
In connection with the New Agreement Approval Process, the Board received certain information about NewCo’s projected financial condition, and reviewed with senior representatives of Funds Management, GTCR and Reverence Capital the underlying assumptions on which such information was based. The Board considered that NewCo is a newly formed entity, with no historical operations, revenues or expenses, and that it is difficult to predict with any degree of certainty the future profitability of NewCo and the Advisers from advisory activities under the New Agreements. The Board considered that the fee rates payable under the New Agreements will not increase as a result of the Transaction as compared to the rates under the Current Agreements, and that the current contractual expense limitations applicable to each Fund will not increase. The Board noted that if the New Agreements are approved by shareholders and the Transaction closes, the Board will have the opportunity in the future to review the profitability of NewCo and the Advisers from advisory activities under the New Agreements.
156 | Wells Fargo Target Today Fund
Board considerations (unaudited)
Economies of scale
In connection with the 2021 Annual Approval Process, the Board received and considered information about the potential for Funds Management to experience economies of scale in the provision of management services to the Funds, the difficulties of calculating economies of scale at an individual fund level, and the extent to which potential scale benefits are shared with Fund shareholders. The Board noted the existence of breakpoints in each Fund’s management fee structure, which operate generally to reduce the Fund’s expense ratios as the Fund grows in size, and the size of the Fund in relation to such breakpoints. The Board considered that, in addition to management fee breakpoints, Funds Management shares potential economies of scale from its management business in a variety of ways, including through fee waiver and expense reimbursement arrangements, competitive management fee rates set at the outset without regard to breakpoints, and investments in the business intended to enhance services available to shareholders.
In connection with the New Agreement Approval Process, the Board noted that NewCo and the Advisers may benefit from possible growth of the Funds resulting from enhanced distribution capabilities. However, the Board noted that other factors could also affect the potential for economies of scale, and that it was not possible to quantify any potential future economies of scale. Based upon the information furnished to the Board in connection with the 2021 Annual Approval Process and the New Agreement Approval Process, the Board concluded that Funds Management’s arrangements with respect to each Fund, including contractual breakpoints and expense limitation arrangements, constitute a reasonable approach to sharing potential economies of scale with the Fund and its shareholders.
“Fall-out” benefits to Funds Management and the Sub-Adviser
In connection with the 2021 Annual Approval Process, the Board received and considered information regarding potential “fall-out” or ancillary benefits received by Funds Management and its affiliates, including the Sub-Adviser, as a result of their relationships with the Funds. Ancillary benefits could include, among others, benefits directly attributable to other relationships with the Funds and benefits potentially derived from an increase in Funds Management’s and the Sub-Adviser’s business as a result of their relationships with the Funds. The Board noted that various current affiliates of Funds Management may receive distribution-related fees, shareholder servicing payments and sub-transfer agency fees in respect of shares sold or held through them and services provided.
In connection with the 2021 Annual Approval Process, the Board also reviewed information about soft dollar credits earned and utilized by the Sub-Adviser, fees earned by Funds Management and the Sub-Adviser from managing a private investment vehicle for the fund family’s securities lending collateral, and commissions earned by an affiliated broker of Wells Fargo from portfolio transactions.
In connection with the New Agreement Approval Process, the Board received information to the effect that the Transaction is not expected to have a material impact on the fall-out benefits currently realized by Funds Management and its affiliates, including the Sub-Adviser. The information reviewed by the Board also noted that several of the ancillary benefits identified for WFAM would be potential ancillary benefits for NewCo, including that the scale and reputation of the Funds might benefit NewCo’s broader reputation, product initiatives, technology investment and talent acquisition. Based on its consideration of the factors and information it deemed relevant, including those described here, the Board did not find that any ancillary benefits expected to be received by Funds Management and its affiliates, including NewCo and the Sub-Adviser, under the New Agreements were unreasonable.
Conclusion
At the Board Meeting, after considering the above-described factors and based on its deliberations and its evaluation of the information described above, the Board unanimously determined that the compensation payable to Funds Management and the Sub-Adviser under the New Agreements is reasonable, approved the New Agreements for a two-year term, and voted to recommend that Fund shareholders approve the New Agreements.
Wells Fargo Target Today Fund | 157
Board considerations (unaudited)
Board Considerations - Interim Agreements
At a meeting held on May 17-19, 2021 (the “Board Meeting”), the Boards of Trustees (each, a “Board”, and collectively, the “Boards”) of Wells Fargo Funds Trust, Wells Fargo Master Trust, Wells Fargo Variable Trust, Wells Fargo Global Dividend Opportunity Fund, Wells Fargo Income Opportunities Fund, Wells Fargo Multi-Sector Income Fund and Wells Fargo Utilities and High Income Fund (each a “Trust”, and the series thereof, a “Fund”) reviewed and approved for the Trusts and Funds, as applicable: (i) interim investment management agreements (the “Interim Management Agreements”) with Wells Fargo Funds Management, LLC (“Funds Management”); (ii) interim investment advisory agreements (the “Interim Advisory Agreements”) with Funds Management; and (iii) interim sub-advisory agreements (the “Interim Sub-Advisory Agreements”) with each of Cooke & Bieler, L.P., Galliard Capital Management LLC (“Galliard”), Peregrine Capital Management Inc., Wells Capital Management, LLC (“WellsCap”), and Wells Fargo Asset Management (International) Limited (“WFAMI”, and collectively, the “Sub-Advisers”). Each Trustee on the Board is not an “interested person” (as defined in the Investment Company Act of 1940 (the “1940 Act”) of the Funds (collectively, the “Independent Trustees”). The Interim Management Agreements, Interim Advisory Agreements, and Interim Sub-Advisory Agreements are collectively referred to as the “Interim Advisory Agreements.”
At the Board Meeting, the Boards reviewed and approved the continuation of existing investment management, advisory and sub-advisory agreements (the “Current Advisory Agreements”) for each Trust and Fund, as applicable. The factors considered and conclusions reached by the Boards in approving the Current Advisory Agreements are summarized in the section entitled “Board Considerations – Current Agreements” of this shareholder report. The Boards noted that Wells Fargo & Company has entered into a definitive agreement to sell Wells Fargo Asset Management (“WFAM”), which includes Funds Management, Galliard, WellsCap and WFAMI (the “Affiliated Sub-Advisers”), to a holding company affiliated with private funds of GTCR LLC and Reverence Capital Partners, L.P. (the “Transaction”). The Boards further noted that the Transaction would result in a change-of-control of Funds Management and the Affiliated Sub-Advisers, which would be considered to be an “assignment” under the 1940 Act that would terminate the Current Advisory Agreements. At the Board Meeting, the Boards also reviewed and approved new investment management, advisory and sub-advisory agreements (the “New Advisory Agreements”) for each Trust and Fund, as applicable, that would replace the Current Advisory Agreements upon consummation of the Transaction, subject to approval of the New Advisory Agreements by the applicable Trust’s or Fund’s shareholders. The factors considered and conclusions reached by the Boards in approving the New Advisory Agreements are summarized in the section entitled “Board Considerations – New Agreements” of this shareholder report.
At the Board Meeting, the Boards also approved the Interim Advisory Agreements, which will go into effect for a Trust or Fund only in the event that shareholders of such Trust or Fund do not approve the New Advisory Agreement(s) for the Trust or Fund by the closing date of the Transaction, when the Current Advisory Agreements will terminate. The Board noted that, in such a circumstance, the Interim Advisory Agreements will permit continuity of management by allowing Funds Management and the Sub-Advisers to continue providing services to the Trust or Fund pursuant to the Interim Advisory Agreements while the Trust or Fund continues to solicit shareholder approval of such New Advisory Agreement(s). The Boards noted that the terms of the Interim Advisory Agreements are identical to those of the Current Advisory Agreements, except for the term and the addition of escrow provisions with respect to the advisory fees. The Boards also noted that the entities that would service the Funds and Trusts under the Interim Advisory Agreements are identical to those that provide services under the Current Advisory Agreements and those that will provide services under the New Advisory Agreements.
In approving the Interim Advisory Agreements, the Boards considered the same factors and reached the same conclusions as they considered and reached with respect to the Boards’ approvals of the Current Advisory Agreements and New Advisory Agreements, as applicable, which are described in separate Board Consideration sections within this shareholder report. Prior to the Board Meeting, including at a series of meetings held in April and May 2021, the Trustees conferred extensively among themselves and with senior representatives of Funds Management, GTCR LLC and Reverence Capital Partners, L.P. about the Interim Advisory Agreements and related matters. The Independent Trustees were assisted in their evaluation of the Interim Advisory Agreements by independent legal counsel, from whom they received separate legal advice and with whom they met separately.
At the Board Meeting, after considering the factors and reaching the conclusions described in the separate Board Consideration sections within this shareholder report, the Boards unanimously determined that the compensation payable to Funds Management and to each Sub-Adviser under each of the Interim Advisory Agreements was reasonable, and approved the Interim Advisory Agreements.
158 | Wells Fargo Target Today Fund
This page is intentionally left blank.
On August 31, 2021, the Target Blended Indexes were composed of the following indexes:
| | Target
Today
Blended
Index | Target
2010
Blended
Index | Target
2015
Blended
Index |
| Bloomberg U.S. Aggregate ex-Corporate Index | 34.50% | 34.50% | 32.03% |
| Bloomberg U.S. Corporate High Yield 2% Issuer Capped Index | 2.94% | 2.94% | 2.73% |
| Bloomberg U.S. Corporate Investment Grade Index | 17.95% | 17.95% | 16.67% |
| Bloomberg U.S. Government Intermediate Bond Index | 5.83% | 5.83% | 5.41% |
| Bloomberg U.S. Treasury Inflation Notes: 1-10 Year Index | 5.83% | 5.83% | 5.41% |
| Dow Jones U.S. Select REIT Index | 2.50% | 2.50% | 2.92% |
| JP Morgan EMBI Global Diversified Index | 2.94% | 2.94% | 2.73% |
| MSCI Emerging Markets Index (Net) (USD) | 1.82% | 1.82% | 2.27% |
| MSCI USA Minimum Volatility Index (Net) (USD) | 5.00% | 5.00% | 4.00% |
| MSCI World ex USA Index (Net) (USD) | 6.06% | 6.06% | 7.57% |
| Russell 1000® Index | 11.71% | 11.71% | 14.61% |
| Russell 2000® Index | 2.92% | 2.92% | 3.65% |
Average annual total returns (%) as of August 31, 2021
| | 1 year | 5 year | 10 year |
| Bloomberg U.S. Aggregate ex-Corporate Index1* | (1.04) | 2.50 | – |
| Bloomberg U.S. Corporate High Yield 2% Issuer Capped Index2 | 10.14 | 6.65 | 7.06 |
| Bloomberg U.S. Corporate Investment Grade Index3 | 2.53 | 4.78 | 5.01 |
| Bloomberg U.S. Government Intermediate Bond Index4 | (0.66) | 2.15 | 1.90 |
| Bloomberg U.S. Treasury Inflation Notes: 1-10 Year Index5 | 5.82 | 4.08 | 2.55 |
| Dow Jones U.S. Select REIT Index6 | 44.17 | 6.44 | 9.85 |
| JP Morgan EMBI Global Diversified Index7 | 4.59 | 4.41 | 5.55 |
| MSCI EM Index (Net) (USD)8 | 21.12 | 10.40 | 4.85 |
| MSCI USA Minimum Volatility Index (Net) (USD)9 | 20.70 | 12.72 | 13.67 |
| MSCI World ex USA Index (Net) (USD)10 | 26.57 | 9.78 | 7.05 |
| Russell 1000® Index11 | 32.25 | 18.24 | 16.40 |
| Russell 2000® Index12 | 47.08 | 14.38 | 13.62 |
| * | The inception date of the index is December 2015. |
| 1 | The Bloomberg U.S. Aggregate ex-Corporate Index is a broad-based benchmark that includes Treasuries, government-related securities, mortgage-backed securities (agency fixed-rate and hybrid adjustable-rate mortgage pass-throughs), asset-backed securities and commercial mortgage-backed securities (agency and non-agency). You cannot invest directly in an index. |
| 2 | The Bloomberg U.S. Corporate High Yield 2% Issuer Capped Index is an unmanaged index comprised of fixed rate, non-investment grade debt securities that are dollar denominated and non-convertible. The index limits the maximum exposure to any one issuer to 2%. You cannot invest directly into an index. |
| 3 | The Bloomberg U.S. Corporate Investment Grade Index is a broad based benchmark that measures the investment grade, fixed-rate, taxable, corporate bond market. Bloomberg U.S. Credit - Financial Institutions Index. You cannot invest directly into an index. |
| 4 | The Bloomberg U.S. Government Intermediate Bond Index is an unmanaged index composed of U.S. government securities with maturities in the 1- to 10-year range, including securities issued by the U.S. Treasury and U.S. government agencies. You cannot invest directly in an index. |
| 5 | Bloomberg U.S. Treasury Inflation Notes: 1-10 Year Index measures the performance of the U.S. Treasury Inflation Protected Securities (TIPS) market with maturities more than 1 year and less than 10 years. Federal Reserve holdings of U.S. TIPS are not index eligible and are excluded from the face amount outstanding of each bond in the index. You cannot invest directly in an index. |
160 | Target Date Retirement Funds
Target
2020
Blended
Index | Target
2025
Blended
Index | Target
2030
Blended
Index | Target
2035
Blended
Index | Target
2040
Blended
Index | Target
2045
Blended
Index | Target
2050
Blended
Index | Target
2055
Blended
Index | Target
2060
Blended
Index |
| 29.56% | 26.64% | 22.87% | 17.76% | 11.84% | 8.87% | 5.92% | 5.92% | 5.92% |
| 2.52% | 2.25% | 1.92% | 1.50% | 1.00% | 0.75% | 0.50% | 0.50% | 0.50% |
| 15.39% | 13.86% | 11.92% | 9.24% | 6.16% | 4.62% | 3.08% | 3.08% | 3.08% |
| 5.00% | 2.50% | 0.67% | 0.00% | 0.00% | 0.00% | 0.00% | 0.00% | 0.00% |
| 5.00% | 2.50% | 0.67% | 0.00% | 0.00% | 0.00% | 0.00% | 0.00% | 0.00% |
| 3.33% | 2.50% | 1.00% | 0.00% | 0.00% | 0.00% | 0.00% | 0.00% | 0.00% |
| 2.52% | 2.25% | 1.92% | 1.50% | 1.00% | 0.75% | 0.50% | 0.50% | 0.50% |
| 2.72% | 3.78% | 4.96% | 6.09% | 7.20% | 7.74% | 8.28% | 8.28% | 8.28% |
| 3.00% | 2.00% | 1.00% | 0.00% | 0.00% | 0.00% | 0.00% | 0.00% | 0.00% |
| 9.07% | 12.60% | 16.52% | 20.51% | 24.00% | 25.84% | 27.72% | 27.72% | 27.72% |
| 17.52% | 23.28% | 29.24% | 34.72% | 39.04% | 41.14% | 43.20% | 43.20% | 43.20% |
| 4.37% | 5.84% | 7.31% | 8.68% | 9.76% | 10.29% | 10.80% | 10.80% | 10.80% |
| 6 | The Dow Jones U.S. Select REIT Index tracks the performance of publicly traded REITs and REIT-like securities and is designed to serve as a proxy for direct real estate investment, in part by excluding companies whose performance may be driven by factors other than the value of real estate. The index is a subset of the Dow Jones U.S. Select Real Estate Securities Index (RESI). You cannot invest directly into an index. |
| 7 | The JP Morgan Emerging Markets Bond Index (“EMBI”) Global Diversified Index is a composite index representing an unleveraged investment in emerging market bonds that is broadly based across the spectrum of emerging market bonds and includes reinvestment of income (to represent real assets). You cannot invest directly in an index. |
| 8 | The Morgan Stanley Capital International (MSCI) Emerging Markets (EM) Index (Net) (USD)is a free-float-adjusted market-capitalization-weighted index that is designed to measure equity market performance of emerging markets. You cannot invest directly in an index. |
| 9 | The MSCI USA Minimum Volatility Index (Net) (USD) aims to reflect the performance characteristics of a minimum variance strategy applied to the large and mid-cap USA equity universe. The index is calculated by optimizing the MSCI USA Index, its parent index, in USD for the lowest absolute risk (within a given set of constraints). You cannot invest directly in an index. |
| 10 | The MSCI World ex USA Index (Net) (USD) is a free-float-adjusted market-capitalization-weighted index that is designed to measure the equity market performance of developed markets, excluding the U.S. You cannot invest directly in an index. |
| 11 | The Russell 1000® Index measures the performance of the 1,000 largest companies in the Russell 3000® Index, which represents approximately 92% of the total market capitalization of the Russell 3000® Index. You cannot invest directly in an index. |
| 12 | The Russell 2000® Index measures the performance of the 2,000 smallest companies in the Russell 3000® Index, which represents approximately 8% of the total market capitalization of the Russell 3000® Index. You cannot invest directly in an index. |
Target Date Retirement Funds | 161
For more information
More information about Wells Fargo Funds is available free upon request. To obtain literature, please write, visit the Fund's website, or call:
Wells Fargo Funds
P.O. Box 219967
Kansas City, MO 64121-9967
Website: wfam.com
Individual investors: 1-800-222-8222
Retail investment professionals: 1-888-877-9275
Institutional investment professionals: 1-866-765-0778
This report and the financial statements contained herein are submitted for the general information of the shareholders of the Wells Fargo Funds. If this report is used for promotional purposes, distribution of the report must be accompanied or preceded by a current prospectus. Before investing, please consider the investment objectives, risks, charges, and expenses of the investment. For a current prospectus and, if available, a summary prospectus, containing this information, call
1-800-222-8222 or visit the Funds' website at wfam.com. Read the prospectus carefully before you invest or send money.
Wells Fargo Asset Management (WFAM) is the trade name for certain investment advisory/management firms owned by Wells Fargo & Company. These firms include but are not limited to Wells Capital Management, LLC and Wells Fargo Funds Management, LLC. Certain products managed by WFAM entities are distributed by Wells Fargo Funds Distributor, LLC (a broker-dealer and Member FINRA).
This material is for general informational and educational purposes only and is NOT intended to provide investment advice or a recommendation of any kind - including a recommendation for any specific investment, strategy, or plan.
INVESTMENT PRODUCTS: NOT FDIC INSURED ■ NO BANK GUARANTEE ■ MAY LOSE VALUE
© 2021 Wells Fargo & Company. All rights reserved.
PAR-0921-00710 10-21
SOFLD/SAR101 08-21
Semi-Annual Report
August 31, 2021
Target Date Retirement Funds
| ■ | Wells Fargo Dynamic Target Today Fund |
| ■ | Wells Fargo Dynamic Target 2015 Fund |
| ■ | Wells Fargo Dynamic Target 2020 Fund |
| ■ | Wells Fargo Dynamic Target 2025 Fund |
| ■ | Wells Fargo Dynamic Target 2030 Fund |
| ■ | Wells Fargo Dynamic Target 2035 Fund |
| ■ | Wells Fargo Dynamic Target 2040 Fund |
| ■ | Wells Fargo Dynamic Target 2045 Fund |
| ■ | Wells Fargo Dynamic Target 2050 Fund |
| ■ | Wells Fargo Dynamic Target 2055 Fund |
| ■ | Wells Fargo Dynamic Target 2060 Fund |
The views expressed and any forward-looking statements are as of August 31, 2021, unless otherwise noted, and are those of the Fund's portfolio managers and/or Wells Fargo Asset Management. Discussions of individual securities or the markets generally are not intended as individual recommendations. Future events or results may vary significantly from those expressed in any forward-looking statements. The views expressed are subject to change at any time in response to changing circumstances in the market. Wells Fargo Asset Management disclaims any obligation to publicly update or revise any views expressed or forward-looking statements.
INVESTMENT PRODUCTS: NOT FDIC INSURED ■ NO BANK GUARANTEE ■ MAY LOSE VALUE
Target Date Retirement Funds | 1
Letter to shareholders (unaudited)
Andrew Owen
President
Wells Fargo Funds
Dear Shareholder:
We are pleased to offer you this semi-annual report for Wells Fargo Dynamic Target Date Funds for the six-month period that ended August 31, 2021. Global stocks continued to rally as the global economy continued to emerge from the haze of COVID-19. Tailwinds were provided by global stimulus programs, a rapid vaccination rollout, and recovering consumer and corporate sentiment. Bonds were mixed during the period, with municipal bonds and high-yield bonds delivering positive returns.
For the six-month period, U.S. stocks, based on the S&P 500 Index,1 gained 19.52%. International stocks, as measured by the MSCI ACWI ex USA Index (Net),2 returned 7.05%, while the MSCI EM Index (Net),3 trailed its developed market counterparts with a 0.98% loss. Among bond indexes, the Bloomberg U.S. Aggregate Bond Index,4 returned 1.49%, the Bloomberg Global Aggregate ex-USD Index (unhedged),5 returned -0.65%, the Bloomberg Municipal Bond Index,6 returned 2.51%, and the ICE BofA U.S. High Yield Index,7 gained 3.88%.
Vaccination rollout drove the stock markets to new highs.
The passage of the massive domestic stimulus bill highlighted March activity, leading to increased forecasts for U.S. growth in 2021. Domestic employment surged as COVID-19 vaccinations and an increasingly open economy spurred hiring. A majority of U.S. small companies reported they were operating at pre-pandemic capacity or higher. Value stocks continued their outperformance of growth stocks in the month, continuing the trend that started in late 2020. Meanwhile, most major developed global equity indexes were up month to date on the back of rising optimism regarding the outlook for global growth. While the U.S. and the U.K. have been the most successful in terms of the vaccine rollout, even in markets where the vaccine has lagged, such as in the eurozone and Japan, equity indexes in many of those countries have also been in positive territory this year.
| 1 | The S&P 500 Index consists of 500 stocks chosen for market size, liquidity, and industry group representation. It is a market-value-weighted index with each stock's weight in the index proportionate to its market value. You cannot invest directly in an index. |
| 2 | The Morgan Stanley Capital International (MSCI) All Country World Index (ACWI) ex USA Index (Net) is a free-float-adjusted market-capitalization-weighted index that is designed to measure the equity market performance of developed and emerging markets, excluding the United States. Source: MSCI. MSCI makes no express or implied warranties or representations and shall have no liability whatsoever with respect to any MSCI data contained herein. The MSCI data may not be further redistributed or used as a basis for other indices or any securities or financial products. This report is not approved, reviewed, or produced by MSCI. You cannot invest directly in an index. |
| 3 | The MSCI Emerging Markets (EM) Index (Net) is a free-float-adjusted market-capitalization-weighted index that is designed to measure equity market performance of emerging markets. You cannot invest directly in an index. |
| 4 | The Bloomberg U.S. Aggregate Bond Index is a broad-based benchmark that measures the investment-grade, U.S.-dollar-denominated, fixed-rate taxable bond market, including Treasuries, government-related and corporate securities, mortgage-backed securities (agency fixed-rate and hybrid adjustable-rate mortgage pass-throughs), asset-backed securities, and commercial mortgage-backed securities. You cannot invest directly in an index. |
| 5 | The Bloomberg Global Aggregate ex-USD Index (unhedged) is an unmanaged index that provides a broad-based measure of the global investment-grade fixed-income markets excluding the U.S.-dollar-denominated debt market. You cannot invest directly in an index. |
| 6 | The Bloomberg Municipal Bond Index is an unmanaged index composed of long-term tax-exempt bonds with a minimum credit rating of Baa. You cannot invest directly in an index. |
| 7 | The ICE BofA U.S. High Yield Index is a market-capitalization-weighted index of domestic and Yankee high-yield bonds. The index tracks the performance of high-yield securities traded in the U.S. bond market. You cannot invest directly in an index. Copyright 2021. ICE Data Indices, LLC. All rights reserved. |
2 | Target Date Retirement Funds
Letter to shareholders (unaudited)
Equity markets produced another strong showing in April. Domestically, the continued reopening of the economy had a strong impact on positive equity performance, as people started leaving their households and jobless claims continued to fall. Domestic corporate bonds performed well and the U.S. dollar weakened. Meanwhile, the U.S. government continued to seek to invest in the recovery, this time by outlining a package of over $2 trillion to improve infrastructure. The primary headwind in April was inflation, as investors tried to determine the breadth and longevity of recent price increases. Developed Europe has been supported by a meaningful increase in the pace of vaccinations. Unfortunately many emerging market countries have not been as successful. India in particular has seen COVID-19 cases surge, serving as an example of the need to get vaccinations rolled out to less developed nations.
Vaccine rollouts continued in May, leading to loosened restrictions globally. As a result, equity markets in general saw a minor increase in returns. Concerns that the continued economic rebound could result in inflation increases becoming more than transitory were supported by the higher input costs businesses were experiencing. Meanwhile, those inflation concerns were tempered by the U.S. Federal Reserve (Fed), which stayed steady on its view of the economy and eased fears of a sudden and substantial policy change. Positive performance in the emerging market equity space was supported this month by steady consumer demand and strong commodity prices. Fixed-income markets were also slightly positive for the month, driven by inflation uncertainty and a softer U.S. dollar.
June witnessed the S&P 500 Index reach a new all-time high. 2021 economic growth and inflation forecasts were revised higher to reflect a strong economic recovery and some supply and demand imbalances. Late June saw a deal reached on a U.S. infrastructure package of approximately $1 trillion for road, bridge, and broadband network upgrades over the next eight years. The Fed’s June meeting yielded no change to policy, but its projections pointed to a possible interest rate rise in 2023. This, combined with a rebound in economic activity and investors searching for yield, led to U.S. Treasury yields being down for the month. Many European and Asian countries saw vaccination momentum increase, while the U.K. dealt with a rise in COVID-19 infections, specifically the Delta variant. Meanwhile, crude oil jumped over 10% in June on the back of the pickup in global economic activity and the Organization of the Petroleum Exporting Countries’ (OPEC) slow pace of supply growth.
July began the month seeing vaccinations making progress, as several major developed countries eased restrictions, only to be threatened again by the spread of COVID-19’s Delta variant. Inflation continued to climb, aided by the continued supply bottleneck in the face of high demand. As it pertains to the equity area of the market, U.S. equities led the way in positive return territory, followed by international developed markets. In contrast, emerging markets were well in negative territory for the month, hindered by China’s plans for new regulations on a number of sectors, specifically education and technology. The U.S. 10-Year Treasury bond yield continued to decline, as strong demand swallowed up supply. After hitting a multi-year high earlier in the month, oil prices leveled off following an agreement by OPEC to raise oil production starting in August.
The Delta variant of COVID-19 produced outbreaks globally in August, increasing the potential for increased market volatility and bringing into question the ongoing economic recovery. Domestically, the U.S. economy continued to stay strong in the face of the Delta variant, continued inflationary pressures, and worries over Hurricane Ida. Emerging market equities experienced elevated volatility, largely influenced by China’s regulatory stance. Emerging market equities started the month with poor performance but rebounded to end the month in positive territory. Municipal debt experienced its first monthly performance drop since February of this year, slowing a rally that made it one of the best-performing sectors of the bond market. In the commodity segment of the market, crude oil fell sharply during the month on the back of dampened expectations as a result of the Delta variant but was still a leading asset class performer for the year.
“2021 economic growth and inflation forecasts were revised higher to reflect a strong economic recovery and some supply and demand imbalances.”
“Municipal debt experienced its first monthly performance drop since February of this year, slowing a rally that made it one of the best-performing sectors of the bond market.”
Target Date Retirement Funds | 3
Letter to shareholders (unaudited)
Don’t let short-term uncertainty derail long-term investment goals.
Periods of investment uncertainty can present challenges, but experience has taught us that maintaining long-term investment goals can be an effective way to plan for the future. To help you create a sound strategy based on your personal goals and risk tolerance, Wells Fargo Funds offers more than 100 mutual funds spanning a wide range of asset classes and investment styles. Although diversification cannot guarantee an investment profit or prevent losses, we believe it can be an effective way to manage investment risk and potentially smooth out overall portfolio performance. We encourage investors to know their investments and to understand that appropriate levels of risk-taking may unlock opportunities.
Thank you for choosing to invest with Wells Fargo Funds. We appreciate your confidence in us and remain committed to helping you meet your financial needs.
Sincerely,
Andrew Owen
President
Wells Fargo Funds
For further information about your Fund, contact your investment professional, visit our website at wfam.com, or call us directly at 1-800-222-8222.
4 | Target Date Retirement Funds
Letter to shareholders (unaudited)
Preparing for LIBOR Transition
The global financial industry is preparing to transition away from the London Interbank Offered Rate (LIBOR), a key benchmark interest rate, to new alternative rates. LIBOR underpins trillions of dollars of financial contracts. It is the benchmark rate for a wide spectrum of products ranging from residential mortgages to corporate bonds to derivatives. Regulators have called for a market-wide transition away from LIBOR to successor reference rates by the end of 2021 (by June 30, 2023 for most tenors of the U.S. dollar LIBOR), which requires proactive steps be taken by issuers, counterparties, and asset managers to identify impacted products and adopt new reference rates.
Each Fund invests in at least one underlying fund that holds at one or more securities that use LIBOR as a floating reference rate and has a maturity date after December 31, 2021.
Although the transition process away from LIBOR has become increasingly well-defined in advance of the anticipated discontinuation date, there remains uncertainty regarding the nature of successor reference rates, and any potential effects of the transition away from LIBOR on investment instruments that use it as a benchmark rate. The transition process may result in, among other things, increased volatility or illiquidity in markets for instruments that currently rely on LIBOR and could negatively impact the value of certain instruments held by each Fund.
Wells Fargo Asset Management is monitoring LIBOR exposure closely and has put resources and controls in place to manage this transition effectively. Each Fund’s portfolio management team is evaluating LIBOR holdings to understand what happens to those securities when LIBOR ceases to exist, including examining security documentation to identify the presence or absence of fallback language identifying a replacement rate to LIBOR.
While the pace of transition away from LIBOR will differ by asset class and investment strategy, the portfolio management team will monitor market conditions for those holdings to identify and mitigate deterioration or volatility in pricing and liquidity and ensure appropriate actions are taken in a timely manner.
Further information regarding the potential risks associated with the discontinuation of LIBOR can be found in the Funds' Statement of Additional Information.
Target Date Retirement Funds | 5
Wells Fargo Dynamic Target Date Funds
Investment objective
Each Fund seeks total return over time, consistent with its strategic target allocation.
Manager
Wells Fargo Funds Management, LLC
Subadviser
Wells Capital Management, LLC
Portfolio managers
Kandarp R. Acharya, CFA®‡, FRM
Petros N. Bocray, CFA®‡, FRM
Christian L. Chan, CFA®‡
The target date represents the year in which investors may likely begin withdrawing assets. The Funds gradually seek to reduce market risk as the target date approaches and after it arrives by decreasing equity exposure and increasing fixed income exposure. The principal value is not guaranteed at any time, including at the target date.
Stock values fluctuate in response to the activities of individual companies and general market and economic conditions. Bond values fluctuate in response to the financial condition of individual issuers, general market and economic conditions, and changes in interest rates. Changes in market conditions and government policies may lead to periods of heightened volatility in the bond market and reduced liquidity for certain bonds held by each Fund. In general, when interest rates rise, bond values fall and investors may lose principal value. Interest rate changes and their impact on each Fund and its share price can be sudden and unpredictable. High-yield securities have a greater risk of default and tend to be more volatile than higher-rated debt securities. The use of derivatives may reduce returns and/or increase volatility. Securities issued by U.S. government agencies or government-sponsored entities may not be guaranteed by the U.S. Treasury. The Funds will indirectly be exposed to all of the risks of an investment in the underlying funds and will indirectly bear expenses of the underlying funds. Certain investment strategies tend to increase the total risk of an investment (relative to the broader market). The Funds are exposed to foreign investment risk, mortgage- and asset-backed securities risk, regulatory risk, and smaller-company investment risk. Consult the Funds’ prospectus for additional information on these and other risks.
| ‡ | CFA® and Chartered Financial Analyst® are trademarks owned by CFA Institute. |
6 | Target Date Retirement Funds
Performance highlights (unaudited)
Wells Fargo Dynamic Target Today Fund
| Average annual total returns (%) as of August 31, 2021 | |
| | | Including sales charge | | Excluding sales charge | | Expense ratios1 (%) |
| | Inception date | 1 year | 5 year | Since
inception | | 1 year | 5 year | Since
inception | | Gross | Net 2 |
| Class A (WDYAX) | 11-30-2015 | 5.75 | 6.39 | 6.22 | | 12.23 | 7.66 | 7.32 | | 2.95 | 0.68 |
| Class C (WDYCX) | 11-30-2015 | 10.34 | 7.17 | 6.79 | | 11.34 | 7.17 | 6.79 | | 3.70 | 1.43 |
| Class R4 (WDYYX) | 11-30-2015 | – | – | – | | 12.56 | 7.99 | 7.64 | | 2.67 | 0.37 |
| Class R6 (WDYZX) | 11-30-2015 | – | – | – | | 12.71 | 8.13 | 7.80 | | 2.52 | 0.22 |
| S&P Target Date Retirement Income Index3 | – | – | – | – | | 8.83 | 6.31 | 6.28 * | | – | – |
| Dynamic Target Today Blended Index4 | – | – | – | – | | 13.16 | – | – | | – | – |
Figures quoted represent past performance, which is no guarantee of future results, and do not reflect taxes that a shareholder may pay on an investment in a fund. Investment return and principal value of an investment will fluctuate so that an investor’s shares, when redeemed, may be worth more or less than their original cost. Performance shown without sales charges would be lower if sales charges were reflected. Current performance may be lower or higher than the performance data quoted, which assumes the reinvestment of dividends and capital gains. Current month-end performance is available on the Fund’s website, wfam.com.
Index returns do not include transaction costs associated with buying and selling securities, any mutual fund fees or expenses, or any taxes. It is not possible to invest directly in an index.
For Class A shares, the maximum front-end sales charge is 5.75%. For Class C shares, the maximum contingent deferred sales charge is 1.00%. Performance including a contingent deferred sales charge assumes the sales charge for the corresponding time period. Class R4 and Class R6 shares are sold without a front-end sales charge or contingent deferred sales charge.
| * | Based on the inception date of the oldest Fund class. |
| 1 | Reflects the expense ratios as stated in the most recent prospectuses, which include the impact of 0.10% of acquired fund fees and expenses representing the net expenses from the affiliated master portfolios. The expense ratios shown are subject to change and may differ from the annualized expense ratios shown in the financial highlights of this report. |
| 2 | The manager has contractually committed through June 30, 2022, to waive fees and/or reimburse expenses to the extent necessary to cap total annual fund operating expenses after fee waivers at 0.68% for Class A, 1.43% for Class C, 0.37% for Class R4 and 0.22% for Class R6. Brokerage commissions, stamp duty fees, interest, taxes, acquired fund fees and expenses (if any) from funds in which the underlying affiliated master portfolios invest and from money market funds, and extraordinary expenses are excluded from the expense caps. All other acquired fund fees and expenses from the affiliated master portfolios are included in the expense caps. Prior to or after the commitment expiration date, the caps may be increased or the commitment to maintain the caps may be terminated only with the approval of the Board of Trustees. Without these caps, the Fund’s returns would have been lower. The expense ratio paid by an investor is the net expense ratio (the total annual fund operating expenses after fee waivers) as stated in the prospectuses. |
| 3 | The S&P Target Date Index is designed as a benchmark for multi-asset class portfolios with risk profiles that become more conservative over time, corresponding to the target retirement date. This index is representative of the investment opportunity available to investors for the target date horizon, with asset class exposures driven by a survey of available target date funds for that horizon. You cannot invest directly in an index. |
| 4 | Source: Wells Fargo Funds Management, LLC. The Dynamic Target Blended Index is designed as a benchmark for multi-asset class portfolios with risk profiles that become more conservative over time, corresponding to the target retirement date. The index weightings among the major asset classes are adjusted annually. The inception date of the index is September 21, 2018. See Appendix I for additional information. You cannot invest directly in an index. |
Target Date Retirement Funds | 7
Performance highlights (unaudited)
Wells Fargo Dynamic Target Today Fund (continued)
| Holdings (%) as of August 31, 20211 |
| Wells Fargo Bloomberg Barclays US Aggregate ex-Corporate Portfolio | 29.27 |
| Wells Fargo Factor Enhanced U.S. Large Cap Equity Portfolio | 18.89 |
| Wells Fargo Investment Grade Corporate Bond Portfolio | 15.21 |
| Wells Fargo Strategic Retirement Bond Portfolio | 9.88 |
| Wells Fargo Factor Enhanced International Equity Portfolio | 9.77 |
| Wells Fargo Factor Enhanced U.S. Small Cap Equity Portfolio | 4.70 |
| Wells Fargo U.S. REIT Portfolio | 3.34 |
| Wells Fargo Factor Enhanced Emerging Markets Equity Portfolio | 3.00 |
| Wells Fargo Emerging Markets Bond Portfolio | 2.50 |
| Wells Fargo High Yield Corporate Bond Portfolio | 2.50 |
| 1 | Figures represent the percentage of the Fund's net assets. Holdings are subject to change and may have changed since the date specified. |
| Allocation (%) as of August 31, 2021 |
| | Neutral
allocation | Effective
allocation1 |
| Bond Funds | 60 | 60 |
| Stock Funds | 40 | 43 |
| Effective Cash | 0 | (3) |
| 1 | The effective allocation includes the effect of any tactical futures overlay that may be in place. Effective cash, if any, represents the net offset to such future positions. The effective allocation does not reflect futures positions held in dynamic risk hedging strategies. Effective allocations are subject to change and may have changed since the date specified. |
| Volatility metrics as of August 31, 20211 |
| | Beta 2 | Standard
deviation3 | R-squared 4 |
| Class A | 1.08 | 6.94 | 0.97 |
| Class C | 1.09 | 7.06 | 0.95 |
| Class R4 | 1.08 | 6.93 | 0.97 |
| Class R6 | 1.08 | 6.95 | 0.97 |
| 1 | These metrics show the degree and timing of the Fund’s fluctuations compared to S&P Target Date Retirement Income Index over 36 months. |
| 2 | Beta measures fund volatility relative to general market movements. It is a standardized measure of systematic risk in comparison with a specified index. The benchmark beta is 1.00 by definition. Beta is based on historical performance and does not represent future results. |
| 3 | Standard deviation is the square root of the sum of squared deviations from the mean. It is often used as a measure of volatility, variability, or risk. Standard deviation is based on historical performance and does not represent future results. |
| 4 | R-squared (R2) is a statistical measure that reflects the percentage of a fund’s movements that can be explained by movements in its benchmark index. The measure ranges from 0.0, which means that the fund’s performance bears no relationship to the performance of the index, to 1.0, which means that the fund’s performance was perfectly synchronized with the performance of the benchmark. R2 is based on historical performance and does not represent future results. |
8 | Target Date Retirement Funds
Performance highlights (unaudited)
Wells Fargo Dynamic Target 2015 Fund
| Average annual total returns (%) as of August 31, 2021 | |
| | | Including sales charge | | Excluding sales charge | | Expense ratios1 (%) |
| | Inception date | 1 year | 5 year | Since
inception | | 1 year | 5 year | Since
inception | | Gross | Net 2 |
| Class A (WDTAX) | 11-30-2015 | 8.04 | 7.41 | 7.02 | | 14.59 | 8.70 | 8.13 | | 3.40 | 0.68 |
| Class C (WDTCX) | 11-30-2015 | 12.64 | 8.20 | 7.59 | | 13.64 | 8.20 | 7.59 | | 4.15 | 1.43 |
| Class R4 (WDTYX) | 11-30-2015 | – | – | – | | 14.90 | 9.01 | 8.44 | | 3.12 | 0.37 |
| Class R6 (WDTZX) | 11-30-2015 | – | – | – | | 15.04 | 9.17 | 8.61 | | 2.97 | 0.22 |
| S&P Target Date 2015 Index3 | – | – | – | – | | 12.70 | 7.95 | 7.74 * | | – | – |
| Dynamic Target 2015 Blended Index4 | – | – | – | – | | 15.72 | – | – | | – | – |
Figures quoted represent past performance, which is no guarantee of future results, and do not reflect taxes that a shareholder may pay on an investment in a fund. Investment return and principal value of an investment will fluctuate so that an investor’s shares, when redeemed, may be worth more or less than their original cost. Performance shown without sales charges would be lower if sales charges were reflected. Current performance may be lower or higher than the performance data quoted, which assumes the reinvestment of dividends and capital gains. Current month-end performance is available on the Fund’s website, wfam.com.
Index returns do not include transaction costs associated with buying and selling securities, any mutual fund fees or expenses, or any taxes. It is not possible to invest directly in an index.
For Class A shares, the maximum front-end sales charge is 5.75%. For Class C shares, the maximum contingent deferred sales charge is 1.00%. Performance including a contingent deferred sales charge assumes the sales charge for the corresponding time period. Class R4 and Class R6 shares are sold without a front-end sales charge or contingent deferred sales charge.
| * | Based on the inception date of the oldest Fund class. |
| 1 | Reflects the expense ratios as stated in the most recent prospectuses, which include the impact of 0.11% of acquired fund fees and expenses representing the net expenses from the affiliated master portfolios. The expense ratios shown are subject to change and may differ from the annualized expense ratios shown in the financial highlights of this report. |
| 2 | The manager has contractually committed through June 30, 2022, to waive fees and/or reimburse expenses to the extent necessary to cap total annual fund operating expenses after fee waivers at 0.68% for Class A, 1.43% for Class C, 0.37% for Class R4 and 0.22% for Class R6. Brokerage commissions, stamp duty fees, interest, taxes, acquired fund fees and expenses (if any) from funds in which the underlying affiliated master portfolios invest and from money market funds, and extraordinary expenses are excluded from the expense caps. All other acquired fund fees and expenses from the affiliated master portfolios are included in the expense caps. Prior to or after the commitment expiration date, the caps may be increased or the commitment to maintain the caps may be terminated only with the approval of the Board of Trustees. Without these caps, the Fund’s returns would have been lower. The expense ratio paid by an investor is the net expense ratio (the total annual fund operating expenses after fee waivers) as stated in the prospectuses. |
| 3 | The S&P Target Date Index is designed as a benchmark for multi-asset class portfolios with risk profiles that become more conservative over time, corresponding to the target retirement date. This index is representative of the investment opportunity available to investors for the target date horizon, with asset class exposures driven by a survey of available target date funds for that horizon. You cannot invest directly in an index. |
| 4 | Source: Wells Fargo Funds Management, LLC. The Dynamic Target Blended Index is designed as a benchmark for multi-asset class portfolios with risk profiles that become more conservative over time, corresponding to the target retirement date. The index weightings among the major asset classes are adjusted annually. The inception date of the index is September 21, 2018. See Appendix I for additional information. You cannot invest directly in an index. |
Target Date Retirement Funds | 9
Performance highlights (unaudited)
Wells Fargo Dynamic Target 2015 Fund (continued)
| Holdings (%) as of August 31, 20211 |
| Wells Fargo Bloomberg Barclays US Aggregate ex-Corporate Portfolio | 25.70 |
| Wells Fargo Factor Enhanced U.S. Large Cap Equity Portfolio | 22.50 |
| Wells Fargo Investment Grade Corporate Bond Portfolio | 13.35 |
| Wells Fargo Factor Enhanced International Equity Portfolio | 11.64 |
| Wells Fargo Strategic Retirement Bond Portfolio | 8.67 |
| Wells Fargo Factor Enhanced U.S. Small Cap Equity Portfolio | 5.59 |
| Wells Fargo U.S. REIT Portfolio | 3.98 |
| Wells Fargo Factor Enhanced Emerging Markets Equity Portfolio | 3.57 |
| Wells Fargo Emerging Markets Bond Portfolio | 2.20 |
| Wells Fargo High Yield Corporate Bond Portfolio | 2.19 |
| 1 | Figures represent the percentage of the Fund's net assets. Holdings are subject to change and may have changed since the date specified. |
| Allocation (%) as of August 31, 2021 |
| | Neutral
allocation | Effective
allocation1 |
| Bond Funds | 53 | 53 |
| Stock Funds | 47 | 50 |
| Effective Cash | 0 | (3) |
| 1 | The effective allocation includes the effect of any tactical futures overlay that may be in place. Effective cash, if any, represents the net offset to such future positions. The effective allocation does not reflect futures positions held in dynamic risk hedging strategies. Effective allocations are subject to change and may have changed since the date specified. |
| Volatility metrics as of August 31, 20211 |
| | Beta 2 | Standard
deviation3 | R-squared 4 |
| Class A | 1.00 | 8.34 | 0.98 |
| Class C | 1.01 | 8.43 | 0.97 |
| Class R4 | 0.99 | 8.27 | 0.98 |
| Class R6 | 1.00 | 8.35 | 0.98 |
| 1 | These metrics show the degree and timing of the Fund’s fluctuations compared to S&P Target Date 2015 Index over 36 months. |
| 2 | Beta measures fund volatility relative to general market movements. It is a standardized measure of systematic risk in comparison with a specified index. The benchmark beta is 1.00 by definition. Beta is based on historical performance and does not represent future results. |
| 3 | Standard deviation is the square root of the sum of squared deviations from the mean. It is often used as a measure of volatility, variability, or risk. Standard deviation is based on historical performance and does not represent future results. |
| 4 | R-squared (R2) is a statistical measure that reflects the percentage of a fund’s movements that can be explained by movements in its benchmark index. The measure ranges from 0.0, which means that the fund’s performance bears no relationship to the performance of the index, to 1.0, which means that the fund’s performance was perfectly synchronized with the performance of the benchmark. R2 is based on historical performance and does not represent future results. |
10 | Target Date Retirement Funds
Performance highlights (unaudited)
Wells Fargo Dynamic Target 2020 Fund
| Average annual total returns (%) as of August 31, 2021 | |
| | | Including sales charge | | Excluding sales charge | | Expense ratios1 (%) |
| | Inception date | 1 year | 5 year | Since
inception | | 1 year | 5 year | Since
inception | | Gross | Net 2 |
| Class A (WDTDX) | 11-30-2015 | 10.27 | 8.29 | 7.81 | | 16.99 | 9.59 | 8.92 | | 2.89 | 0.68 |
| Class C (WDTEX) | 11-30-2015 | 15.09 | 9.02 | 8.34 | | 16.09 | 9.02 | 8.34 | | 3.64 | 1.43 |
| Class R4 (WDTGX) | 11-30-2015 | – | – | – | | 17.34 | 9.91 | 9.25 | | 2.61 | 0.37 |
| Class R6 (WDTHX) | 11-30-2015 | – | – | – | | 17.58 | 10.08 | 9.42 | | 2.46 | 0.22 |
| S&P Target Date 2020 Index3 | – | – | – | – | | 13.79 | 8.51 | 8.24 * | | – | – |
| Dynamic Target 2020 Blended Index4 | – | – | – | – | | 18.19 | – | – | | – | – |
Figures quoted represent past performance, which is no guarantee of future results, and do not reflect taxes that a shareholder may pay on an investment in a fund. Investment return and principal value of an investment will fluctuate so that an investor’s shares, when redeemed, may be worth more or less than their original cost. Performance shown without sales charges would be lower if sales charges were reflected. Current performance may be lower or higher than the performance data quoted, which assumes the reinvestment of dividends and capital gains. Current month-end performance is available on the Fund’s website, wfam.com.
Index returns do not include transaction costs associated with buying and selling securities, any mutual fund fees or expenses, or any taxes. It is not possible to invest directly in an index.
For Class A shares, the maximum front-end sales charge is 5.75%. For Class C shares, the maximum contingent deferred sales charge is 1.00%. Performance including a contingent deferred sales charge assumes the sales charge for the corresponding time period. Class R4 and Class R6 shares are sold without a front-end sales charge or contingent deferred sales charge.
| * | Based on the inception date of the oldest Fund class. |
| 1 | Reflects the expense ratios as stated in the most recent prospectuses, which include the impact of 0.11% of acquired fund fees and expenses representing the net expenses from the affiliated master portfolios. The expense ratios shown are subject to change and may differ from the annualized expense ratios shown in the financial highlights of this report. |
| 2 | The manager has contractually committed through June 30, 2022, to waive fees and/or reimburse expenses to the extent necessary to cap total annual fund operating expenses after fee waivers at 0.68% for Class A, 1.43% for Class C, 0.37% for Class R4 and 0.22% for Class R6. Brokerage commissions, stamp duty fees, interest, taxes, acquired fund fees and expenses (if any) from funds in which the underlying affiliated master portfolios invest and from money market funds, and extraordinary expenses are excluded from the expense caps. All other acquired fund fees and expenses from the affiliated master portfolios are included in the expense caps. Prior to or after the commitment expiration date, the caps may be increased or the commitment to maintain the caps may be terminated only with the approval of the Board of Trustees. Without these caps, the Fund’s returns would have been lower. The expense ratio paid by an investor is the net expense ratio (the total annual fund operating expenses after fee waivers) as stated in the prospectuses. |
| 3 | The S&P Target Date Index is designed as a benchmark for multi-asset class portfolios with risk profiles that become more conservative over time, corresponding to the target retirement date. This index is representative of the investment opportunity available to investors for the target date horizon, with asset class exposures driven by a survey of available target date funds for that horizon. You cannot invest directly in an index. |
| 4 | Source: Wells Fargo Funds Management, LLC. The Dynamic Target Blended Index is designed as a benchmark for multi-asset class portfolios with risk profiles that become more conservative over time, corresponding to the target retirement date. The index weightings among the major asset classes are adjusted annually. The inception date of the index is September 21, 2018. See Appendix I for additional information. You cannot invest directly in an index. |
Target Date Retirement Funds | 11
Performance highlights (unaudited)
Wells Fargo Dynamic Target 2020 Fund (continued)
| Holdings (%) as of August 31, 20211 |
| Wells Fargo Factor Enhanced U.S. Large Cap Equity Portfolio | 26.01 |
| Wells Fargo Bloomberg Barclays US Aggregate ex-Corporate Portfolio | 22.01 |
| Wells Fargo Factor Enhanced International Equity Portfolio | 13.45 |
| Wells Fargo Investment Grade Corporate Bond Portfolio | 11.44 |
| Wells Fargo Strategic Retirement Bond Portfolio | 7.43 |
| Wells Fargo Factor Enhanced U.S. Small Cap Equity Portfolio | 6.47 |
| Wells Fargo U.S. REIT Portfolio | 4.60 |
| Wells Fargo Factor Enhanced Emerging Markets Equity Portfolio | 4.13 |
| Wells Fargo Emerging Markets Bond Portfolio | 1.88 |
| Wells Fargo High Yield Corporate Bond Portfolio | 1.88 |
| 1 | Figures represent the percentage of the Fund's net assets. Holdings are subject to change and may have changed since the date specified. |
| Allocation (%) as of August 31, 2021 |
| | Neutral
allocation | Effective
allocation1 |
| Bond Funds | 45 | 45 |
| Stock Funds | 55 | 58 |
| Effective Cash | 0 | (3) |
| 1 | The effective allocation includes the effect of any tactical futures overlay that may be in place. Effective cash, if any, represents the net offset to such future positions. The effective allocation does not reflect futures positions held in dynamic risk hedging strategies. Effective allocations are subject to change and may have changed since the date specified. |
| Volatility metrics as of August 31, 20211 |
| | Beta 2 | Standard
deviation3 | R-squared 4 |
| Class A | 1.01 | 9.30 | 0.98 |
| Class C | 1.01 | 9.40 | 0.97 |
| Class R4 | 1.01 | 9.33 | 0.98 |
| Class R6 | 1.01 | 9.31 | 0.98 |
| 1 | These metrics show the degree and timing of the Fund’s fluctuations compared to S&P Target Date 2020 Index over 36 months. |
| 2 | Beta measures fund volatility relative to general market movements. It is a standardized measure of systematic risk in comparison with a specified index. The benchmark beta is 1.00 by definition. Beta is based on historical performance and does not represent future results. |
| 3 | Standard deviation is the square root of the sum of squared deviations from the mean. It is often used as a measure of volatility, variability, or risk. Standard deviation is based on historical performance and does not represent future results. |
| 4 | R-squared (R2) is a statistical measure that reflects the percentage of a fund’s movements that can be explained by movements in its benchmark index. The measure ranges from 0.0, which means that the fund’s performance bears no relationship to the performance of the index, to 1.0, which means that the fund’s performance was perfectly synchronized with the performance of the benchmark. R2 is based on historical performance and does not represent future results. |
12 | Target Date Retirement Funds
Performance highlights (unaudited)
Wells Fargo Dynamic Target 2025 Fund
| Average annual total returns (%) as of August 31, 2021 | |
| | | Including sales charge | | Excluding sales charge | | Expense ratios1 (%) |
| | Inception date | 1 year | 5 year | Since
inception | | 1 year | 5 year | Since
inception | | Gross | Net 2 |
| Class A (WDTIX) | 11-30-2015 | 12.88 | 9.45 | 8.71 | | 19.77 | 10.75 | 9.83 | | 2.21 | 0.68 |
| Class C (WDTJX) | 11-30-2015 | 17.78 | 10.20 | 9.25 | | 18.78 | 10.20 | 9.25 | | 2.96 | 1.43 |
| Class R4 (WDTLX) | 11-30-2015 | – | – | – | | 20.09 | 11.04 | 10.14 | | 1.93 | 0.37 |
| Class R6 (WDTMX) | 11-30-2015 | – | – | – | | 20.22 | 11.21 | 10.31 | | 1.78 | 0.22 |
| S&P Target Date 2025 Index3 | – | – | – | – | | 16.96 | 9.61 | 9.19 * | | – | – |
| Dynamic Target 2025 Blended Index4 | – | – | – | – | | 21.06 | – | – | | – | – |
Figures quoted represent past performance, which is no guarantee of future results, and do not reflect taxes that a shareholder may pay on an investment in a fund. Investment return and principal value of an investment will fluctuate so that an investor’s shares, when redeemed, may be worth more or less than their original cost. Performance shown without sales charges would be lower if sales charges were reflected. Current performance may be lower or higher than the performance data quoted, which assumes the reinvestment of dividends and capital gains. Current month-end performance is available on the Fund’s website, wfam.com.
Index returns do not include transaction costs associated with buying and selling securities, any mutual fund fees or expenses, or any taxes. It is not possible to invest directly in an index.
For Class A shares, the maximum front-end sales charge is 5.75%. For Class C shares, the maximum contingent deferred sales charge is 1.00%. Performance including a contingent deferred sales charge assumes the sales charge for the corresponding time period. Class R4 and Class R6 shares are sold without a front-end sales charge or contingent deferred sales charge.
| * | Based on the inception date of the oldest Fund class. |
| 1 | Reflects the expense ratios as stated in the most recent prospectuses, which include the impact of 0.12% of acquired fund fees and expenses representing the net expenses from the affiliated master portfolios. The expense ratios shown are subject to change and may differ from the annualized expense ratios shown in the financial highlights of this report. |
| 2 | The manager has contractually committed through June 30, 2021, to waive fees and/or reimburse expenses to the extent necessary to cap total annual fund operating expenses after fee waivers at 0.68% for Class A, 1.43% for Class C, 0.37% for Class R4 and 0.22% for Class R6. Brokerage commissions, stamp duty fees, interest, taxes, acquired fund fees and expenses (if any) from funds in which the underlying affiliated master portfolios invest and from money market funds, and extraordinary expenses are excluded from the expense caps. All other acquired fund fees and expenses from the affiliated master portfolios are included in the expense caps. Prior to or after the commitment expiration date, the caps may be increased or the commitment to maintain the caps may be terminated only with the approval of the Board of Trustees. Without these caps, the Fund’s returns would have been lower. The expense ratio paid by an investor is the net expense ratio (the total annual fund operating expenses after fee waivers) as stated in the prospectuses. |
| 3 | The S&P Target Date Index is designed as a benchmark for multi-asset class portfolios with risk profiles that become more conservative over time, corresponding to the target retirement date. This index is representative of the investment opportunity available to investors for the target date horizon, with asset class exposures driven by a survey of available target date funds for that horizon. You cannot invest directly in an index. |
| 4 | Source: Wells Fargo Funds Management, LLC. The Dynamic Target Blended Index is designed as a benchmark for multi-asset class portfolios with risk profiles that become more conservative over time, corresponding to the target retirement date. The index weightings among the major asset classes are adjusted annually. The inception date of the index is September 21, 2018. See Appendix I for additional information. You cannot invest directly in an index. |
Target Date Retirement Funds | 13
Performance highlights (unaudited)
Wells Fargo Dynamic Target 2025 Fund (continued)
| Holdings (%) as of August 31, 20211 |
| Wells Fargo Factor Enhanced U.S. Large Cap Equity Portfolio | 31.39 |
| Wells Fargo Bloomberg Barclays US Aggregate ex-Corporate Portfolio | 18.60 |
| Wells Fargo Factor Enhanced International Equity Portfolio | 16.98 |
| Wells Fargo Investment Grade Corporate Bond Portfolio | 9.66 |
| Wells Fargo Factor Enhanced U.S. Small Cap Equity Portfolio | 7.81 |
| Wells Fargo Factor Enhanced Emerging Markets Equity Portfolio | 5.22 |
| Wells Fargo Strategic Retirement Bond Portfolio | 3.49 |
| Wells Fargo U.S. REIT Portfolio | 3.27 |
| Wells Fargo Emerging Markets Bond Portfolio | 1.58 |
| Wells Fargo High Yield Corporate Bond Portfolio | 1.57 |
| 1 | Figures represent the percentage of the Fund's net assets. Holdings are subject to change and may have changed since the date specified. |
| Allocation (%) as of August 31, 2021 |
| | Neutral
allocation | Effective
allocation1 |
| Bond Funds | 35 | 35 |
| Stock Funds | 65 | 68 |
| Effective Cash | 0 | (3) |
| 1 | The effective allocation includes the effect of any tactical futures overlay that may be in place. Effective cash, if any, represents the net offset to such future positions. The effective allocation does not reflect futures positions held in dynamic risk hedging strategies. Effective allocations are subject to change and may have changed since the date specified. |
| Volatility metrics as of August 31, 20211 |
| | Beta 2 | Standard
deviation3 | R-squared 4 |
| Class A | 0.98 | 10.73 | 0.98 |
| Class C | 0.99 | 10.85 | 0.97 |
| Class R4 | 0.98 | 10.68 | 0.98 |
| Class R6 | 0.98 | 10.69 | 0.98 |
| 1 | These metrics show the degree and timing of the Fund’s fluctuations compared to S&P Target Date 2025 Index over 36 months. |
| 2 | Beta measures fund volatility relative to general market movements. It is a standardized measure of systematic risk in comparison with a specified index. The benchmark beta is 1.00 by definition. Beta is based on historical performance and does not represent future results. |
| 3 | Standard deviation is the square root of the sum of squared deviations from the mean. It is often used as a measure of volatility, variability, or risk. Standard deviation is based on historical performance and does not represent future results. |
| 4 | R-squared (R2) is a statistical measure that reflects the percentage of a fund’s movements that can be explained by movements in its benchmark index. The measure ranges from 0.0, which means that the fund’s performance bears no relationship to the performance of the index, to 1.0, which means that the fund’s performance was perfectly synchronized with the performance of the benchmark. R2 is based on historical performance and does not represent future results. |
14 | Target Date Retirement Funds
Performance highlights (unaudited)
Wells Fargo Dynamic Target 2030 Fund
| Average annual total returns (%) as of August 31, 2021 | |
| | | Including sales charge | | Excluding sales charge | | Expense ratios1 (%) |
| | Inception date | 1 year | 5 year | Since
inception | | 1 year | 5 year | Since
inception | | Gross | Net 2 |
| Class A (WDTNX) | 11-30-2015 | 15.32 | 10.52 | 9.59 | | 22.34 | 11.83 | 10.73 | | 2.33 | 0.68 |
| Class C (WDTOX) | 11-30-2015 | 20.34 | 11.23 | 10.11 | | 21.34 | 11.23 | 10.11 | | 3.08 | 1.43 |
| Class R4 (WDTQX) | 11-30-2015 | – | – | – | | 22.67 | 12.15 | 11.05 | | 2.05 | 0.37 |
| Class R6 (WDTSX) | 11-30-2015 | – | – | – | | 22.80 | 12.32 | 11.22 | | 1.90 | 0.22 |
| S&P Target Date 2030 Index3 | – | – | – | – | | 19.98 | 10.60 | 10.05 * | | – | – |
| Dynamic Target 2030 Blended Index4 | – | – | – | – | | 23.73 | – | – | | – | – |
Figures quoted represent past performance, which is no guarantee of future results, and do not reflect taxes that a shareholder may pay on an investment in a fund. Investment return and principal value of an investment will fluctuate so that an investor’s shares, when redeemed, may be worth more or less than their original cost. Performance shown without sales charges would be lower if sales charges were reflected. Current performance may be lower or higher than the performance data quoted, which assumes the reinvestment of dividends and capital gains. Current month-end performance is available on the Fund’s website, wfam.com.
Index returns do not include transaction costs associated with buying and selling securities, any mutual fund fees or expenses, or any taxes. It is not possible to invest directly in an index.
For Class A shares, the maximum front-end sales charge is 5.75%. For Class C shares, the maximum contingent deferred sales charge is 1.00%. Performance including a contingent deferred sales charge assumes the sales charge for the corresponding time period. Class R4 and Class R6 shares are sold without a front-end sales charge or contingent deferred sales charge.
| * | Based on the inception date of the oldest Fund class. |
| 1 | Reflects the expense ratios as stated in the most recent prospectuses, which include the impact of 0.12% of acquired fund fees and expenses representing the net expenses from the affiliated master portfolios. The expense ratios shown are subject to change and may differ from the annualized expense ratios shown in the financial highlights of this report. |
| 2 | The manager has contractually committed through June 30, 2022, to waive fees and/or reimburse expenses to the extent necessary to cap total annual fund operating expenses after fee waivers at 0.68% for Class A, 1.43% for Class C, 0.37% for Class R4 and 0.22% for Class R6. Brokerage commissions, stamp duty fees, interest, taxes, acquired fund fees and expenses (if any) from funds in which the underlying affiliated master portfolios invest and from money market funds, and extraordinary expenses are excluded from the expense caps. All other acquired fund fees and expenses from the affiliated master portfolios are included in the expense caps. Prior to or after the commitment expiration date, the caps may be increased or the commitment to maintain the caps may be terminated only with the approval of the Board of Trustees. Without these caps, the Fund’s returns would have been lower. The expense ratio paid by an investor is the net expense ratio (the total annual fund operating expenses after fee waivers) as stated in the prospectuses. |
| 3 | The S&P Target Date Index is designed as a benchmark for multi-asset class portfolios with risk profiles that become more conservative over time, corresponding to the target retirement date. This index is representative of the investment opportunity available to investors for the target date horizon, with asset class exposures driven by a survey of available target date funds for that horizon. You cannot invest directly in an index. |
| 4 | Source: Wells Fargo Funds Management, LLC. The Dynamic Target Blended Index is designed as a benchmark for multi-asset class portfolios with risk profiles that become more conservative over time, corresponding to the target retirement date. The index weightings among the major asset classes are adjusted annually. The inception date of the index is September 21, 2018. See Appendix I for additional information. You cannot invest directly in an index. |
Target Date Retirement Funds | 15
Performance highlights (unaudited)
Wells Fargo Dynamic Target 2030 Fund (continued)
| Holdings (%) as of August 31, 20211 |
| Wells Fargo Factor Enhanced U.S. Large Cap Equity Portfolio | 36.94 |
| Wells Fargo Factor Enhanced International Equity Portfolio | 20.84 |
| Wells Fargo Bloomberg Barclays US Aggregate ex-Corporate Portfolio | 14.27 |
| Wells Fargo Factor Enhanced U.S. Small Cap Equity Portfolio | 9.21 |
| Wells Fargo Investment Grade Corporate Bond Portfolio | 7.42 |
| Wells Fargo Factor Enhanced Emerging Markets Equity Portfolio | 6.41 |
| Wells Fargo U.S. REIT Portfolio | 1.25 |
| Wells Fargo Emerging Markets Bond Portfolio | 1.20 |
| Wells Fargo High Yield Corporate Bond Portfolio | 1.20 |
| Wells Fargo Strategic Retirement Bond Portfolio | 0.83 |
| 1 | Figures represent the percentage of the Fund's net assets. Holdings are subject to change and may have changed since the date specified. |
| Allocation (%) as of August 31, 2021 |
| | Neutral
allocation | Effective
allocation1 |
| Bond Funds | 25 | 25 |
| Stock Funds | 75 | 78 |
| Effective Cash | 0 | (3) |
| 1 | The effective allocation includes the effect of any tactical futures overlay that may be in place. Effective cash, if any, represents the net offset to such future positions. The effective allocation does not reflect futures positions held in dynamic risk hedging strategies. Effective allocations are subject to change and may have changed since the date specified. |
| Volatility metrics as of August 31, 20211 |
| | Beta 2 | Standard
deviation3 | R-squared 4 |
| Class A | 0.93 | 11.83 | 0.98 |
| Class C | 0.93 | 11.93 | 0.97 |
| Class R4 | 0.93 | 11.87 | 0.98 |
| Class R6 | 0.93 | 11.83 | 0.98 |
| 1 | These metrics show the degree and timing of the Fund’s fluctuations compared to S&P Target Date 2030 Index over 36 months. |
| 2 | Beta measures fund volatility relative to general market movements. It is a standardized measure of systematic risk in comparison with a specified index. The benchmark beta is 1.00 by definition. Beta is based on historical performance and does not represent future results. |
| 3 | Standard deviation is the square root of the sum of squared deviations from the mean. It is often used as a measure of volatility, variability, or risk. Standard deviation is based on historical performance and does not represent future results. |
| 4 | R-squared (R2) is a statistical measure that reflects the percentage of a fund’s movements that can be explained by movements in its benchmark index. The measure ranges from 0.0, which means that the fund’s performance bears no relationship to the performance of the index, to 1.0, which means that the fund’s performance was perfectly synchronized with the performance of the benchmark. R2 is based on historical performance and does not represent future results. |
16 | Target Date Retirement Funds
Performance highlights (unaudited)
Wells Fargo Dynamic Target 2035 Fund
| Average annual total returns (%) as of August 31, 2021 | |
| | | Including sales charge | | Excluding sales charge | | Expense ratios1 (%) |
| | Inception date | 1 year | 5 year | Since
inception | | 1 year | 5 year | Since
inception | | Gross | Net 2 |
| Class A (WDTTX) | 11-30-2015 | 16.48 | 11.23 | 10.16 | | 23.60 | 12.55 | 11.30 | | 2.40 | 0.68 |
| Class C (WDCTX) | 11-30-2015 | 21.70 | 12.03 | 10.74 | | 22.70 | 12.03 | 10.74 | | 3.15 | 1.43 |
| Class R4 (WDTVX) | 11-30-2015 | – | – | – | | 23.90 | 12.87 | 11.62 | | 2.12 | 0.37 |
| Class R6 (WDTWX) | 11-30-2015 | – | – | – | | 24.22 | 13.06 | 11.80 | | 1.97 | 0.22 |
| S&P Target Date 2035 Index3 | – | – | – | – | | 23.45 | 11.65 | 10.96 * | | – | – |
| Dynamic Target 2035 Blended Index4 | – | – | – | – | | 25.08 | – | – | | – | – |
Figures quoted represent past performance, which is no guarantee of future results, and do not reflect taxes that a shareholder may pay on an investment in a fund. Investment return and principal value of an investment will fluctuate so that an investor’s shares, when redeemed, may be worth more or less than their original cost. Performance shown without sales charges would be lower if sales charges were reflected. Current performance may be lower or higher than the performance data quoted, which assumes the reinvestment of dividends and capital gains. Current month-end performance is available on the Fund’s website, wfam.com.
Index returns do not include transaction costs associated with buying and selling securities, any mutual fund fees or expenses, or any taxes. It is not possible to invest directly in an index.
For Class A shares, the maximum front-end sales charge is 5.75%. For Class C shares, the maximum contingent deferred sales charge is 1.00%. Performance including a contingent deferred sales charge assumes the sales charge for the corresponding time period. Class R4 and Class R6 shares are sold without a front-end sales charge or contingent deferred sales charge.
| * | Based on the inception date of the oldest Fund class. |
| 1 | Reflects the expense ratios as stated in the most recent prospectuses, which include the impact of 0.13% of acquired fund fees and expenses representing the net expenses from the affiliated master portfolios. The expense ratios shown are subject to change and may differ from the annualized expense ratios shown in the financial highlights of this report. |
| 2 | The manager has contractually committed through June 30, 2022, to waive fees and/or reimburse expenses to the extent necessary to cap total annual fund operating expenses after fee waivers at 0.68% for Class A, 1.43% for Class C, 0.37% for Class R4 and 0.22% for Class R6. Brokerage commissions, stamp duty fees, interest, taxes, acquired fund fees and expenses (if any) from funds in which the underlying affiliated master portfolios invest and from money market funds, and extraordinary expenses are excluded from the expense caps. All other acquired fund fees and expenses from the affiliated master portfolios are included in the expense caps. Prior to or after the commitment expiration date, the caps may be increased or the commitment to maintain the caps may be terminated only with the approval of the Board of Trustees. Without these caps, the Fund’s returns would have been lower. The expense ratio paid by an investor is the net expense ratio (the total annual fund operating expenses after fee waivers) as stated in the prospectuses. |
| 3 | The S&P Target Date Index is designed as a benchmark for multi-asset class portfolios with risk profiles that become more conservative over time, corresponding to the target retirement date. This index is representative of the investment opportunity available to investors for the target date horizon, with asset class exposures driven by a survey of available target date funds for that horizon. You cannot invest directly in an index. |
| 4 | Source: Wells Fargo Funds Management, LLC. The Dynamic Target Blended Index is designed as a benchmark for multi-asset class portfolios with risk profiles that become more conservative over time, corresponding to the target retirement date. The index weightings among the major asset classes are adjusted annually. The inception date of the index is September 21, 2018. See Appendix I for additional information. You cannot invest directly in an index. |
Target Date Retirement Funds | 17
Performance highlights (unaudited)
Wells Fargo Dynamic Target 2035 Fund (continued)
| Holdings (%) as of August 31, 20211 |
| Wells Fargo Factor Enhanced U.S. Large Cap Equity Portfolio | 39.41 |
| Wells Fargo Factor Enhanced International Equity Portfolio | 23.25 |
| Wells Fargo Bloomberg Barclays US Aggregate ex-Corporate Portfolio | 11.84 |
| Wells Fargo Factor Enhanced U.S. Small Cap Equity Portfolio | 9.82 |
| Wells Fargo Factor Enhanced Emerging Markets Equity Portfolio | 7.08 |
| Wells Fargo Investment Grade Corporate Bond Portfolio | 6.14 |
| Wells Fargo Emerging Markets Bond Portfolio | 1.00 |
| Wells Fargo High Yield Corporate Bond Portfolio | 1.00 |
| 1 | Figures represent the percentage of the Fund's net assets. Holdings are subject to change and may have changed since the date specified. |
| Allocation (%) as of August 31, 2021 |
| | Neutral
allocation | Effective
allocation1 |
| Bond Funds | 20 | 20 |
| Stock Funds | 80 | 83 |
| Effective Cash | 0 | (3) |
| 1 | The effective allocation includes the effect of any tactical futures overlay that may be in place. Effective cash, if any, represents the net offset to such future positions. The effective allocation does not reflect futures positions held in dynamic risk hedging strategies. Effective allocations are subject to change and may have changed since the date specified. |
| Volatility metrics as of August 31, 20211 |
| | Beta 2 | Standard
deviation3 | R-squared 4 |
| Class A | 0.86 | 12.52 | 0.97 |
| Class C | 0.87 | 12.66 | 0.97 |
| Class R4 | 0.86 | 12.53 | 0.97 |
| Class R6 | 0.86 | 12.47 | 0.97 |
| 1 | These metrics show the degree and timing of the Fund’s fluctuations compared to S&P Target Date 2035 Index over 36 months. |
| 2 | Beta measures fund volatility relative to general market movements. It is a standardized measure of systematic risk in comparison with a specified index. The benchmark beta is 1.00 by definition. Beta is based on historical performance and does not represent future results. |
| 3 | Standard deviation is the square root of the sum of squared deviations from the mean. It is often used as a measure of volatility, variability, or risk. Standard deviation is based on historical performance and does not represent future results. |
| 4 | R-squared (R2) is a statistical measure that reflects the percentage of a fund’s movements that can be explained by movements in its benchmark index. The measure ranges from 0.0, which means that the fund’s performance bears no relationship to the performance of the index, to 1.0, which means that the fund’s performance was perfectly synchronized with the performance of the benchmark. R2 is based on historical performance and does not represent future results. |
18 | Target Date Retirement Funds
Performance highlights (unaudited)
Wells Fargo Dynamic Target 2040 Fund
| Average annual total returns (%) as of August 31, 2021 | |
| | | Including sales charge | | Excluding sales charge | | Expense ratios1 (%) |
| | Inception date | 1 year | 5 year | Since
inception | | 1 year | 5 year | Since
inception | | Gross | Net 2 |
| Class A (WTDAX) | 11-30-2015 | 17.79 | 11.43 | 10.28 | | 25.02 | 12.75 | 11.42 | | 2.63 | 0.68 |
| Class C (WTDCX) | 11-30-2015 | 23.02 | 12.21 | 10.87 | | 24.02 | 12.21 | 10.87 | | 3.38 | 1.43 |
| Class R4 (WTDEX) | 11-30-2015 | – | – | – | | 25.37 | 13.08 | 11.76 | | 2.35 | 0.37 |
| Class R6 (WTDFX) | 11-30-2015 | – | – | – | | 25.50 | 13.25 | 11.93 | | 2.20 | 0.22 |
| S&P Target Date 2040 Index3 | – | – | – | – | | 25.91 | 12.38 | 11.59 * | | – | – |
| Dynamic Target 2040 Blended Index4 | – | – | – | – | | 26.62 | – | – | | – | – |
Figures quoted represent past performance, which is no guarantee of future results, and do not reflect taxes that a shareholder may pay on an investment in a fund. Investment return and principal value of an investment will fluctuate so that an investor’s shares, when redeemed, may be worth more or less than their original cost. Performance shown without sales charges would be lower if sales charges were reflected. Current performance may be lower or higher than the performance data quoted, which assumes the reinvestment of dividends and capital gains. Current month-end performance is available on the Fund’s website, wfam.com.
Index returns do not include transaction costs associated with buying and selling securities, any mutual fund fees or expenses, or any taxes. It is not possible to invest directly in an index.
For Class A shares, the maximum front-end sales charge is 5.75%. For Class C shares, the maximum contingent deferred sales charge is 1.00%. Performance including a contingent deferred sales charge assumes the sales charge for the corresponding time period. Class R4 and Class R6 shares are sold without a front-end sales charge or contingent deferred sales charge.
| * | Based on the inception date of the oldest Fund class. |
| 1 | Reflects the expense ratios as stated in the most recent prospectuses, which include the impact of 0.13% of acquired fund fees and expenses representing the net expenses from the affiliated master portfolios. The expense ratios shown are subject to change and may differ from the annualized expense ratios shown in the financial highlights of this report. |
| 2 | The manager has contractually committed through June 30, 2022, to waive fees and/or reimburse expenses to the extent necessary to cap total annual fund operating expenses after fee waivers at 0.68% for Class A, 1.43% for Class C, 0.37% for Class R4 and 0.22% for Class R6. Brokerage commissions, stamp duty fees, interest, taxes, acquired fund fees and expenses (if any) from funds in which the underlying affiliated master portfolios invest and from money market funds, and extraordinary expenses are excluded from the expense caps. All other acquired fund fees and expenses from the affiliated master portfolios are included in the expense caps. Prior to or after the commitment expiration date, the caps may be increased or the commitment to maintain the caps may be terminated only with the approval of the Board of Trustees. Without these caps, the Fund’s returns would have been lower. The expense ratio paid by an investor is the net expense ratio (the total annual fund operating expenses after fee waivers) as stated in the prospectuses. |
| 3 | The S&P Target Date Index is designed as a benchmark for multi-asset class portfolios with risk profiles that become more conservative over time, corresponding to the target retirement date. This index is representative of the investment opportunity available to investors for the target date horizon, with asset class exposures driven by a survey of available target date funds for that horizon. You cannot invest directly in an index. |
| 4 | Source: Wells Fargo Funds Management, LLC. The Dynamic Target Blended Index is designed as a benchmark for multi-asset class portfolios with risk profiles that become more conservative over time, corresponding to the target retirement date. The index weightings among the major asset classes are adjusted annually. The inception date of the index is September 21, 2018. See Appendix I for additional information. You cannot invest directly in an index. |
Target Date Retirement Funds | 19
Performance highlights (unaudited)
Wells Fargo Dynamic Target 2040 Fund (continued)
| Holdings (%) as of August 31, 20211 |
| Wells Fargo Factor Enhanced U.S. Large Cap Equity Portfolio | 41.17 |
| Wells Fargo Factor Enhanced International Equity Portfolio | 25.28 |
| Wells Fargo Factor Enhanced U.S. Small Cap Equity Portfolio | 10.26 |
| Wells Fargo Bloomberg Barclays US Aggregate ex-Corporate Portfolio | 8.83 |
| Wells Fargo Factor Enhanced Emerging Markets Equity Portfolio | 7.77 |
| Wells Fargo Investment Grade Corporate Bond Portfolio | 4.59 |
| Wells Fargo Emerging Markets Bond Portfolio | 0.75 |
| Wells Fargo High Yield Corporate Bond Portfolio | 0.74 |
| 1 | Figures represent the percentage of the Fund's net assets. Holdings are subject to change and may have changed since the date specified. |
| Allocation (%) as of August 31, 2021 |
| | Neutral
allocation | Effective
allocation1 |
| Bond Funds | 15 | 15 |
| Stock Funds | 85 | 88 |
| Effective Cash | 0 | (3) |
| 1 | The effective allocation includes the effect of any tactical futures overlay that may be in place. Effective cash, if any, represents the net offset to such future positions. The effective allocation does not reflect futures positions held in dynamic risk hedging strategies. Effective allocations are subject to change and may have changed since the date specified. |
| Volatility metrics as of August 31, 20211 |
| | Beta 2 | Standard
deviation3 | R-squared 4 |
| Class A | 0.84 | 13.21 | 0.98 |
| Class C | 0.85 | 13.38 | 0.97 |
| Class R4 | 0.84 | 13.21 | 0.98 |
| Class R6 | 0.84 | 13.23 | 0.98 |
| 1 | These metrics show the degree and timing of the Fund’s fluctuations compared to S&P Target Date 2040 Index over 36 months. |
| 2 | Beta measures fund volatility relative to general market movements. It is a standardized measure of systematic risk in comparison with a specified index. The benchmark beta is 1.00 by definition. Beta is based on historical performance and does not represent future results. |
| 3 | Standard deviation is the square root of the sum of squared deviations from the mean. It is often used as a measure of volatility, variability, or risk. Standard deviation is based on historical performance and does not represent future results. |
| 4 | R-squared (R2) is a statistical measure that reflects the percentage of a fund’s movements that can be explained by movements in its benchmark index. The measure ranges from 0.0, which means that the fund’s performance bears no relationship to the performance of the index, to 1.0, which means that the fund’s performance was perfectly synchronized with the performance of the benchmark. R2 is based on historical performance and does not represent future results. |
20 | Target Date Retirement Funds
Performance highlights (unaudited)
Wells Fargo Dynamic Target 2045 Fund
| Average annual total returns (%) as of August 31, 2021 | |
| | | Including sales charge | | Excluding sales charge | | Expense ratios1 (%) |
| | Inception date | 1 year | 5 year | Since
inception | | 1 year | 5 year | Since
inception | | Gross | Net 2 |
| Class A (WTDGX) | 11-30-2015 | 19.27 | 11.74 | 10.59 | | 26.51 | 13.07 | 11.73 | | 2.97 | 0.68 |
| Class C (WTDHX) | 11-30-2015 | 24.58 | 12.54 | 11.17 | | 25.58 | 12.54 | 11.17 | | 3.72 | 1.43 |
| Class R4 (WTDJX) | 11-30-2015 | – | – | – | | 26.86 | 13.40 | 12.06 | | 2.69 | 0.37 |
| Class R6 (WTDKX) | 11-30-2015 | – | – | – | | 27.07 | 13.58 | 12.23 | | 2.54 | 0.22 |
| S&P Target Date 2045 Index3 | – | – | – | – | | 27.34 | 12.81 | 11.95 * | | – | – |
| Dynamic Target 2045 Blended Index4 | – | – | – | – | | 28.21 | – | – | | – | – |
Figures quoted represent past performance, which is no guarantee of future results, and do not reflect taxes that a shareholder may pay on an investment in a fund. Investment return and principal value of an investment will fluctuate so that an investor’s shares, when redeemed, may be worth more or less than their original cost. Performance shown without sales charges would be lower if sales charges were reflected. Current performance may be lower or higher than the performance data quoted, which assumes the reinvestment of dividends and capital gains. Current month-end performance is available on the Fund’s website, wfam.com.
Please keep in mind that high double-digit returns were primarily achieved during favorable market conditions. You should not expect that such favorable returns can be consistently achieved. A fund’s performance, especially for short time periods, should not be the sole factor in making your investment decision.
Index returns do not include transaction costs associated with buying and selling securities, any mutual fund fees or expenses, or any taxes. It is not possible to invest directly in an index.
For Class A shares, the maximum front-end sales charge is 5.75%. For Class C shares, the maximum contingent deferred sales charge is 1.00%. Performance including a contingent deferred sales charge assumes the sales charge for the corresponding time period. Class R4 and Class R6 shares are sold without a front-end sales charge or contingent deferred sales charge.
| * | Based on the inception date of the oldest Fund class. |
| 1 | Reflects the expense ratios as stated in the most recent prospectuses, which include the impact of 0.13% of acquired fund fees and expenses representing the net expenses from the affiliated master portfolios. The expense ratios shown are subject to change and may differ from the annualized expense ratios shown in the financial highlights of this report. |
| 2 | The manager has contractually committed through June 30, 2022, to waive fees and/or reimburse expenses to the extent necessary to cap total annual fund operating expenses after fee waivers at 0.68% for Class A, 1.43% for Class C, 0.37% for Class R4 and 0.22% for Class R6. Brokerage commissions, stamp duty fees, interest, taxes, acquired fund fees and expenses (if any) from funds in which the underlying affiliated master portfolios invest and from money market funds, and extraordinary expenses are excluded from the expense caps. All other acquired fund fees and expenses from the affiliated master portfolios are included in the expense caps. Prior to or after the commitment expiration date, the caps may be increased or the commitment to maintain the caps may be terminated only with the approval of the Board of Trustees. Without these caps, the Fund’s returns would have been lower. The expense ratio paid by an investor is the net expense ratio (the total annual fund operating expenses after fee waivers) as stated in the prospectuses. |
| 3 | The S&P Target Date Index is designed as a benchmark for multi-asset class portfolios with risk profiles that become more conservative over time, corresponding to the target retirement date. This index is representative of the investment opportunity available to investors for the target date horizon, with asset class exposures driven by a survey of available target date funds for that horizon. You cannot invest directly in an index. |
| 4 | Source: Wells Fargo Funds Management, LLC. The Dynamic Target Blended Index is designed as a benchmark for multi-asset class portfolios with risk profiles that become more conservative over time, corresponding to the target retirement date. The index weightings among the major asset classes are adjusted annually. The inception date of the index is September 21, 2018. See Appendix I for additional information. You cannot invest directly in an index. |
Target Date Retirement Funds | 21
Performance highlights (unaudited)
Wells Fargo Dynamic Target 2045 Fund (continued)
| Holdings (%) as of August 31, 20211 |
| Wells Fargo Factor Enhanced U.S. Large Cap Equity Portfolio | 43.22 |
| Wells Fargo Factor Enhanced International Equity Portfolio | 27.21 |
| Wells Fargo Factor Enhanced U.S. Small Cap Equity Portfolio | 10.77 |
| Wells Fargo Factor Enhanced Emerging Markets Equity Portfolio | 8.37 |
| Wells Fargo Bloomberg Barclays US Aggregate ex-Corporate Portfolio | 5.94 |
| Wells Fargo Investment Grade Corporate Bond Portfolio | 3.09 |
| Wells Fargo Emerging Markets Bond Portfolio | 0.50 |
| Wells Fargo High Yield Corporate Bond Portfolio | 0.50 |
| 1 | Figures represent the percentage of the Fund's net assets. Holdings are subject to change and may have changed since the date specified. |
| Allocation (%) as of August 31, 2021 |
| | Neutral
allocation | Effective
allocation1 |
| Bond Funds | 10 | 10 |
| Stock Funds | 90 | 93 |
| Effective Cash | 0 | (3) |
| 1 | The effective allocation includes the effect of any tactical futures overlay that may be in place. Effective cash, if any, represents the net offset to such future positions. The effective allocation does not reflect futures positions held in dynamic risk hedging strategies. Effective allocations are subject to change and may have changed since the date specified. |
| Volatility metrics as of August 31, 20211 |
| | Beta 2 | Standard
deviation3 | R-squared 4 |
| Class A | 0.87 | 14.14 | 0.98 |
| Class C | 0.87 | 14.28 | 0.97 |
| Class R4 | 0.86 | 14.11 | 0.98 |
| Class R6 | 0.86 | 14.09 | 0.98 |
| 1 | These metrics show the degree and timing of the Fund’s fluctuations compared to S&P Target Date 2045 Index over 36 months. |
| 2 | Beta measures fund volatility relative to general market movements. It is a standardized measure of systematic risk in comparison with a specified index. The benchmark beta is 1.00 by definition. Beta is based on historical performance and does not represent future results. |
| 3 | Standard deviation is the square root of the sum of squared deviations from the mean. It is often used as a measure of volatility, variability, or risk. Standard deviation is based on historical performance and does not represent future results. |
| 4 | R-squared (R2) is a statistical measure that reflects the percentage of a fund’s movements that can be explained by movements in its benchmark index. The measure ranges from 0.0, which means that the fund’s performance bears no relationship to the performance of the index, to 1.0, which means that the fund’s performance was perfectly synchronized with the performance of the benchmark. R2 is based on historical performance and does not represent future results. |
22 | Target Date Retirement Funds
Performance highlights (unaudited)
Wells Fargo Dynamic Target 2050 Fund
| Average annual total returns (%) as of August 31, 2021 | |
| | | Including sales charge | | Excluding sales charge | | Expense ratios1 (%) |
| | Inception date | 1 year | 5 year | Since
inception | | 1 year | 5 year | Since
inception | | Gross | Net 2 |
| Class A (WTDLX) | 11-30-2015 | 21.17 | 11.91 | 10.73 | | 28.58 | 13.24 | 11.88 | | 3.28 | 0.68 |
| Class C (WTDMX) | 11-30-2015 | 26.59 | 12.71 | 11.32 | | 27.59 | 12.71 | 11.32 | | 4.03 | 1.43 |
| Class R4 (WTDOX) | 11-30-2015 | – | – | – | | 28.88 | 13.56 | 12.20 | | 3.00 | 0.37 |
| Class R6 (WTDPX) | 11-30-2015 | – | – | – | | 29.00 | 13.73 | 12.37 | | 2.85 | 0.22 |
| S&P Target Date 2050 Index3 | – | – | – | – | | 28.13 | 13.10 | 12.19 * | | – | – |
| Dynamic Target 2050 Blended Index4 | – | – | – | – | | 29.66 | – | – | | – | – |
Figures quoted represent past performance, which is no guarantee of future results, and do not reflect taxes that a shareholder may pay on an investment in a fund. Investment return and principal value of an investment will fluctuate so that an investor’s shares, when redeemed, may be worth more or less than their original cost. Performance shown without sales charges would be lower if sales charges were reflected. Current performance may be lower or higher than the performance data quoted, which assumes the reinvestment of dividends and capital gains. Current month-end performance is available on the Fund’s website, wfam.com.
Please keep in mind that high double-digit returns were primarily achieved during favorable market conditions. You should not expect that such favorable returns can be consistently achieved. A fund’s performance, especially for short time periods, should not be the sole factor in making your investment decision.
Index returns do not include transaction costs associated with buying and selling securities, any mutual fund fees or expenses, or any taxes. It is not possible to invest directly in an index.
For Class A shares, the maximum front-end sales charge is 5.75%. For Class C shares, the maximum contingent deferred sales charge is 1.00%. Performance including a contingent deferred sales charge assumes the sales charge for the corresponding time period. Class R4 and Class R6 shares are sold without a front-end sales charge or contingent deferred sales charge.
| * | Based on the inception date of the oldest Fund class. |
| 1 | Reflects the expense ratios as stated in the most recent prospectuses, which include the impact of 0.13% of acquired fund fees and expenses representing the net expenses from the affiliated master portfolios. The expense ratios shown are subject to change and may differ from the annualized expense ratios shown in the financial highlights of this report. |
| 2 | The manager has contractually committed through June 30, 2022, to waive fees and/or reimburse expenses to the extent necessary to cap total annual fund operating expenses after fee waivers at 0.68% for Class A, 1.43% for Class C, 0.37% for Class R4 and 0.22% for Class R6. Brokerage commissions, stamp duty fees, interest, taxes, acquired fund fees and expenses (if any) from funds in which the underlying affiliated master portfolios invest and from money market funds, and extraordinary expenses are excluded from the expense caps. All other acquired fund fees and expenses from the affiliated master portfolios are included in the expense caps. Prior to or after the commitment expiration date, the caps may be increased or the commitment to maintain the caps may be terminated only with the approval of the Board of Trustees. Without these caps, the Fund’s returns would have been lower. The expense ratio paid by an investor is the net expense ratio (the total annual fund operating expenses after fee waivers) as stated in the prospectuses. |
| 3 | The S&P Target Date Index is designed as a benchmark for multi-asset class portfolios with risk profiles that become more conservative over time, corresponding to the target retirement date. This index is representative of the investment opportunity available to investors for the target date horizon, with asset class exposures driven by a survey of available target date funds for that horizon. You cannot invest directly in an index. |
| 4 | Source: Wells Fargo Funds Management, LLC. The Dynamic Target Blended Index is designed as a benchmark for multi-asset class portfolios with risk profiles that become more conservative over time, corresponding to the target retirement date. The index weightings among the major asset classes are adjusted annually. The inception date of the index is September 21, 2018. See Appendix I for additional information. You cannot invest directly in an index. |
Target Date Retirement Funds | 23
Performance highlights (unaudited)
Wells Fargo Dynamic Target 2050 Fund (continued)
| Holdings (%) as of August 31, 20211 |
| Wells Fargo Factor Enhanced U.S. Large Cap Equity Portfolio | 45.16 |
| Wells Fargo Factor Enhanced International Equity Portfolio | 29.09 |
| Wells Fargo Factor Enhanced U.S. Small Cap Equity Portfolio | 11.16 |
| Wells Fargo Factor Enhanced Emerging Markets Equity Portfolio | 8.91 |
| Wells Fargo Bloomberg Barclays US Aggregate ex-Corporate Portfolio | 2.94 |
| Wells Fargo Investment Grade Corporate Bond Portfolio | 1.52 |
| Wells Fargo Emerging Markets Bond Portfolio | 0.25 |
| Wells Fargo High Yield Corporate Bond Portfolio | 0.25 |
| 1 | Figures represent the percentage of the Fund's net assets. Holdings are subject to change and may have changed since the date specified. |
| Allocation (%) as of August 31, 2021 |
| | Neutral
allocation | Effective
allocation1 |
| Bond Funds | 5 | 5 |
| Stock Funds | 95 | 98 |
| Effective Cash | 0 | (3) |
| 1 | The effective allocation includes the effect of any tactical futures overlay that may be in place. Effective cash, if any, represents the net offset to such future positions. The effective allocation does not reflect futures positions held in dynamic risk hedging strategies. Effective allocations are subject to change and may have changed since the date specified. |
| Volatility metrics as of August 31, 20211 |
| | Beta 2 | Standard
deviation3 | R-squared 4 |
| Class A | 0.88 | 14.65 | 0.98 |
| Class C | 0.88 | 14.79 | 0.97 |
| Class R4 | 0.88 | 14.63 | 0.98 |
| Class R6 | 0.88 | 14.65 | 0.98 |
| 1 | These metrics show the degree and timing of the Fund’s fluctuations compared to S&P Target Date 2050 Index over 36 months. |
| 2 | Beta measures fund volatility relative to general market movements. It is a standardized measure of systematic risk in comparison with a specified index. The benchmark beta is 1.00 by definition. Beta is based on historical performance and does not represent future results. |
| 3 | Standard deviation is the square root of the sum of squared deviations from the mean. It is often used as a measure of volatility, variability, or risk. Standard deviation is based on historical performance and does not represent future results. |
| 4 | R-squared (R2) is a statistical measure that reflects the percentage of a fund’s movements that can be explained by movements in its benchmark index. The measure ranges from 0.0, which means that the fund’s performance bears no relationship to the performance of the index, to 1.0, which means that the fund’s performance was perfectly synchronized with the performance of the benchmark. R2 is based on historical performance and does not represent future results. |
24 | Target Date Retirement Funds
Performance highlights (unaudited)
Wells Fargo Dynamic Target 2055 Fund
| Average annual total returns (%) as of August 31, 2021 | |
| | | Including sales charge | | Excluding sales charge | | Expense ratios1 (%) |
| | Inception date | 1 year | 5 year | Since
inception | | 1 year | 5 year | Since
inception | | Gross | Net 2 |
| Class A (WTDQX) | 11-30-2015 | 21.02 | 11.96 | 10.78 | | 28.39 | 13.29 | 11.92 | | 3.29 | 0.68 |
| Class C (WTDRX) | 11-30-2015 | 26.40 | 12.77 | 11.37 | | 27.40 | 12.77 | 11.37 | | 4.04 | 1.43 |
| Class R4 (WTDTX) | 11-30-2015 | – | – | – | | 28.64 | 13.60 | 12.25 | | 3.01 | 0.37 |
| Class R6 (WTDUX) | 11-30-2015 | – | – | – | | 28.88 | 13.78 | 12.43 | | 2.86 | 0.22 |
| S&P Target Date 2055 Index3 | – | – | – | – | | 28.45 | 13.24 | 12.31 * | | – | – |
| Dynamic Target 2055 Blended Index4 | – | – | – | – | | 29.66 | – | – | | – | – |
Figures quoted represent past performance, which is no guarantee of future results, and do not reflect taxes that a shareholder may pay on an investment in a fund. Investment return and principal value of an investment will fluctuate so that an investor’s shares, when redeemed, may be worth more or less than their original cost. Performance shown without sales charges would be lower if sales charges were reflected. Current performance may be lower or higher than the performance data quoted, which assumes the reinvestment of dividends and capital gains. Current month-end performance is available on the Fund’s website, wfam.com.
Please keep in mind that high double-digit returns were primarily achieved during favorable market conditions. You should not expect that such favorable returns can be consistently achieved. A fund’s performance, especially for short time periods, should not be the sole factor in making your investment decision.
Index returns do not include transaction costs associated with buying and selling securities, any mutual fund fees or expenses, or any taxes. It is not possible to invest directly in an index.
For Class A shares, the maximum front-end sales charge is 5.75%. For Class C shares, the maximum contingent deferred sales charge is 1.00%. Performance including a contingent deferred sales charge assumes the sales charge for the corresponding time period. Class R4 and Class R6 shares are sold without a front-end sales charge or contingent deferred sales charge.
| * | Based on the inception date of the oldest Fund class. |
| 1 | Reflects the expense ratios as stated in the most recent prospectuses, which include the impact of 0.13% of acquired fund fees and expenses representing the net expenses from the affiliated master portfolios. The expense ratios shown are subject to change and may differ from the annualized expense ratios shown in the financial highlights of this report. |
| 2 | The manager has contractually committed through June 30, 2022, to waive fees and/or reimburse expenses to the extent necessary to cap total annual fund operating expenses after fee waivers at 0.68% for Class A, 1.43% for Class C, 0.37% for Class R4 and 0.22% for Class R6. Brokerage commissions, stamp duty fees, interest, taxes, acquired fund fees and expenses (if any) from funds in which the underlying affiliated master portfolios invest and from money market funds, and extraordinary expenses are excluded from the expense caps. All other acquired fund fees and expenses from the affiliated master portfolios are included in the expense caps. Prior to or after the commitment expiration date, the caps may be increased or the commitment to maintain the caps may be terminated only with the approval of the Board of Trustees. Without these caps, the Fund’s returns would have been lower. The expense ratio paid by an investor is the net expense ratio (the total annual fund operating expenses after fee waivers) as stated in the prospectuses. |
| 3 | The S&P Target Date Index is designed as a benchmark for multi-asset class portfolios with risk profiles that become more conservative over time, corresponding to the target retirement date. This index is representative of the investment opportunity available to investors for the target date horizon, with asset class exposures driven by a survey of available target date funds for that horizon. You cannot invest directly in an index. |
| 4 | Source: Wells Fargo Funds Management, LLC. The Dynamic Target Blended Index is designed as a benchmark for multi-asset class portfolios with risk profiles that become more conservative over time, corresponding to the target retirement date. The index weightings among the major asset classes are adjusted annually. The inception date of the index is September 21, 2018. See Appendix I for additional information. You cannot invest directly in an index. |
Target Date Retirement Funds | 25
Performance highlights (unaudited)
Wells Fargo Dynamic Target 2055 Fund (continued)
| Holdings (%) as of August 31, 20211 |
| Wells Fargo Factor Enhanced U.S. Large Cap Equity Portfolio | 45.13 |
| Wells Fargo Factor Enhanced International Equity Portfolio | 29.01 |
| Wells Fargo Factor Enhanced U.S. Small Cap Equity Portfolio | 11.25 |
| Wells Fargo Factor Enhanced Emerging Markets Equity Portfolio | 8.89 |
| Wells Fargo Bloomberg Barclays US Aggregate ex-Corporate Portfolio | 2.96 |
| Wells Fargo Investment Grade Corporate Bond Portfolio | 1.54 |
| Wells Fargo Emerging Markets Bond Portfolio | 0.25 |
| Wells Fargo High Yield Corporate Bond Portfolio | 0.25 |
| 1 | Figures represent the percentage of the Fund's net assets. Holdings are subject to change and may have changed since the date specified. |
| Allocation (%) as of August 31, 2021 |
| | Neutral
allocation | Effective
allocation1 |
| Bond Funds | 5 | 5 |
| Stock Funds | 95 | 98 |
| Effective Cash | 0 | (3) |
| 1 | The effective allocation includes the effect of any tactical futures overlay that may be in place. Effective cash, if any, represents the net offset to such future positions. The effective allocation does not reflect futures positions held in dynamic risk hedging strategies. Effective allocations are subject to change and may have changed since the date specified. |
| Volatility metrics as of August 31, 20211 |
| | Beta 2 | Standard
deviation3 | R-squared 4 |
| Class A | 0.87 | 14.65 | 0.98 |
| Class C | 0.88 | 14.83 | 0.97 |
| Class R4 | 0.87 | 14.62 | 0.98 |
| Class R6 | 0.87 | 14.65 | 0.98 |
| 1 | These metrics show the degree and timing of the Fund’s fluctuations compared to S&P Target Date 2055 Index over 36 months. |
| 2 | Beta measures fund volatility relative to general market movements. It is a standardized measure of systematic risk in comparison with a specified index. The benchmark beta is 1.00 by definition. Beta is based on historical performance and does not represent future results. |
| 3 | Standard deviation is the square root of the sum of squared deviations from the mean. It is often used as a measure of volatility, variability, or risk. Standard deviation is based on historical performance and does not represent future results. |
| 4 | R-squared (R2) is a statistical measure that reflects the percentage of a fund’s movements that can be explained by movements in its benchmark index. The measure ranges from 0.0, which means that the fund’s performance bears no relationship to the performance of the index, to 1.0, which means that the fund’s performance was perfectly synchronized with the performance of the benchmark. R2 is based on historical performance and does not represent future results. |
26 | Target Date Retirement Funds
Performance highlights (unaudited)
Wells Fargo Dynamic Target 2060 Fund
| Average annual total returns (%) as of August 31, 2021 | |
| | | Including sales charge | | Excluding sales charge | | Expense ratios1 (%) |
| | Inception date | 1 year | 5 year | Since
inception | | 1 year | 5 year | Since
inception | | Gross | Net 2 |
| Class A (WTDVX) | 11-30-2015 | 20.99 | 11.86 | 10.73 | | 28.39 | 13.19 | 11.87 | | 3.39 | 0.68 |
| Class C (WTDWX) | 11-30-2015 | 26.45 | 12.68 | 11.33 | | 27.45 | 12.68 | 11.33 | | 4.14 | 1.43 |
| Class R4 (WTDZX) | 11-30-2015 | – | – | – | | 28.83 | 13.53 | 12.21 | | 3.11 | 0.37 |
| Class R6 (WTSZX) | 11-30-2015 | – | – | – | | 28.95 | 13.70 | 12.38 | | 2.96 | 0.22 |
| S&P Target Date 2055 Index3 | – | – | – | – | | 28.45 | 13.24 | 12.31 * | | – | – |
| S&P Target Date 2060+ Index**,3 | – | – | – | – | | 28.34 | 13.37 | – | | – | – |
| Dynamic Target 2060 Blended Index4 | – | – | – | – | | 29.66 | – | – | | – | – |
Figures quoted represent past performance, which is no guarantee of future results, and do not reflect taxes that a shareholder may pay on an investment in a fund. Investment return and principal value of an investment will fluctuate so that an investor’s shares, when redeemed, may be worth more or less than their original cost. Performance shown without sales charges would be lower if sales charges were reflected. Current performance may be lower or higher than the performance data quoted, which assumes the reinvestment of dividends and capital gains. Current month-end performance is available on the Fund’s website, wfam.com.
Please keep in mind that high double-digit returns were primarily achieved during favorable market conditions. You should not expect that such favorable returns can be consistently achieved. A fund’s performance, especially for short time periods, should not be the sole factor in making your investment decision.
Index returns do not include transaction costs associated with buying and selling securities, any mutual fund fees or expenses, or any taxes. It is not possible to invest directly in an index.
For Class A shares, the maximum front-end sales charge is 5.75%. For Class C shares, the maximum contingent deferred sales charge is 1.00%. Performance including a contingent deferred sales charge assumes the sales charge for the corresponding time period. Class R4 and Class R6 shares are sold without a front-end sales charge or contingent deferred sales charge.
| * | Based on the inception date of the oldest Fund class. |
| ** | The inception date of the index is May 31, 2016. |
| 1 | Reflects the expense ratios as stated in the most recent prospectuses, which include the impact of 0.13% of acquired fund fees and expenses representing the net expenses from the affiliated master portfolios. The expense ratios shown are subject to change and may differ from the annualized expense ratios shown in the financial highlights of this report. |
| 2 | The manager has contractually committed through June 30, 2022, to waive fees and/or reimburse expenses to the extent necessary to cap total annual fund operating expenses after fee waivers at 0.68% for Class A, 1.43% for Class C, 0.37% for Class R4 and 0.22% for Class R6. Brokerage commissions, stamp duty fees, interest, taxes, acquired fund fees and expenses (if any) from funds in which the underlying affiliated master portfolios invest and from money market funds, and extraordinary expenses are excluded from the expense caps. All other acquired fund fees and expenses from the affiliated master portfolios are included in the expense caps. Prior to or after the commitment expiration date, the caps may be increased or the commitment to maintain the caps may be terminated only with the approval of the Board of Trustees. Without these caps, the Fund’s returns would have been lower. The expense ratio paid by an investor is the net expense ratio (the total annual fund operating expenses after fee waivers) as stated in the prospectuses. |
| 3 | The S&P Target Date Index is designed as a benchmark for multi-asset class portfolios with risk profiles that become more conservative over time, corresponding to the target retirement date. This index is representative of the investment opportunity available to investors for the target date horizon, with asset class exposures driven by a survey of available target date funds for that horizon. You cannot invest directly in an index. |
| 4 | Source: Wells Fargo Funds Management, LLC. The Dynamic Target Blended Index is designed as a benchmark for multi-asset class portfolios with risk profiles that become more conservative over time, corresponding to the target retirement date. The index weightings among the major asset classes are adjusted annually. The inception date of the index is September 21, 2018. See Appendix I for additional information. You cannot invest directly in an index. |
Target Date Retirement Funds | 27
Performance highlights (unaudited)
Wells Fargo Dynamic Target 2060 Fund (continued)
| Holdings (%) as of August 31, 20211 |
| Wells Fargo Factor Enhanced U.S. Large Cap Equity Portfolio | 45.08 |
| Wells Fargo Factor Enhanced International Equity Portfolio | 28.94 |
| Wells Fargo Factor Enhanced U.S. Small Cap Equity Portfolio | 11.24 |
| Wells Fargo Factor Enhanced Emerging Markets Equity Portfolio | 8.88 |
| Wells Fargo Bloomberg Barclays US Aggregate ex-Corporate Portfolio | 2.95 |
| Wells Fargo Investment Grade Corporate Bond Portfolio | 1.53 |
| Wells Fargo Emerging Markets Bond Portfolio | 0.25 |
| Wells Fargo High Yield Corporate Bond Portfolio | 0.25 |
| Wells Fargo U.S. REIT Portfolio | 0.11 |
| 1 | Figures represent the percentage of the Fund's net assets. Holdings are subject to change and may have changed since the date specified. |
| Allocation (%) as of August 31, 2021 |
| | Neutral
allocation | Effective
allocation1 |
| Bond Funds | 5 | 5 |
| Stock Funds | 95 | 98 |
| Effective Cash | 0 | (3) |
| 1 | The effective allocation includes the effect of any tactical futures overlay that may be in place. Effective cash, if any, represents the net offset to such future positions. The effective allocation does not reflect futures positions held in dynamic risk hedging strategies. Effective allocations are subject to change and may have changed since the date specified. |
| Volatility metrics as of August 31, 20211 |
| | Beta 2 | Standard
deviation3 | R-squared 4 |
| Class A | 0.86 | 14.64 | 0.98 |
| Class C | 0.87 | 14.80 | 0.97 |
| Class R4 | 0.87 | 14.64 | 0.98 |
| Class R6 | 0.86 | 14.63 | 0.98 |
| 1 | These metrics show the degree and timing of the Fund’s fluctuations compared to S&P Target Date 2060+ Index over 36 months. |
| 2 | Beta measures fund volatility relative to general market movements. It is a standardized measure of systematic risk in comparison with a specified index. The benchmark beta is 1.00 by definition. Beta is based on historical performance and does not represent future results. |
| 3 | Standard deviation is the square root of the sum of squared deviations from the mean. It is often used as a measure of volatility, variability, or risk. Standard deviation is based on historical performance and does not represent future results. |
| 4 | R-squared (R2) is a statistical measure that reflects the percentage of a fund’s movements that can be explained by movements in its benchmark index. The measure ranges from 0.0, which means that the fund’s performance bears no relationship to the performance of the index, to 1.0, which means that the fund’s performance was perfectly synchronized with the performance of the benchmark. R2 is based on historical performance and does not represent future results. |
28 | Target Date Retirement Funds
Fund expenses (unaudited)
As a shareholder of the Fund, you incur two types of costs: (1) transaction costs, including sales charges (loads) on purchase payments and contingent deferred sales charges (if any) on redemptions and (2) ongoing costs, including management fees, distribution (12b-1) and/or shareholder servicing fees, and other Fund expenses. This example is intended to help you understand your ongoing costs (in dollars) of investing in the Fund and to compare these costs with the ongoing costs of investing in other mutual funds.
The example is based on an investment of $1,000 invested at the beginning of the six-month period and held for the entire period from March 1, 2021 to August 31, 2021.
Actual expenses
The “Actual” line of the table below provides information about actual account values and actual expenses. You may use the information in this line, together with the amount you invested, to estimate the expenses that you paid over the period. Simply divide your account value by $1,000 (for example, an $8,600 account value divided by $1,000 = 8.6), then multiply the result by the number in the “Actual” line under the heading entitled “Expenses paid during period” for your applicable class of shares to estimate the expenses you paid on your account during this period.
Hypothetical example for comparison purposes
The “Hypothetical” line of the table below provides information about hypothetical account values and hypothetical expenses based on the Fund’s actual expense ratio and an assumed rate of return of 5% per year before expenses, which is not the Fund’s actual return. The hypothetical account values and expenses may not be used to estimate the actual ending account balance or expenses you paid for the period. You may use this information to compare the ongoing costs of investing in the Fund and other funds. To do so, compare this 5% hypothetical example with the 5% hypothetical examples that appear in the shareholder reports of the other funds.
Please note that the expenses shown in the table are meant to highlight your ongoing costs only and do not reflect any transactional costs, such as sales charges (loads) and contingent deferred sales charges. Therefore, the “Hypothetical” line of the table is useful in comparing ongoing costs only, and will not help you determine the relative total costs of owning different funds. In addition, if these transactional costs were included, your costs would have been higher.
| | Beginning
account value
3-1-2021 | Ending
account value
8-31-2021 | Expenses
paid during
the period1 | Annualized net
expense ratio |
| Dynamic Target Today Fund | | | | |
| Class A | | | | |
| Actual | $1,000.00 | $1,069.48 | $3.44 | 0.66% |
| Hypothetical (5% return before expenses) | $1,000.00 | $1,021.88 | $3.36 | 0.66% |
| Class C | | | | |
| Actual | $1,000.00 | $1,064.63 | $7.44 | 1.43% |
| Hypothetical (5% return before expenses) | $1,000.00 | $1,018.00 | $7.27 | 1.43% |
| Class R4 | | | | |
| Actual | $1,000.00 | $1,070.24 | $1.93 | 0.37% |
| Hypothetical (5% return before expenses) | $1,000.00 | $1,023.34 | $1.89 | 0.37% |
| Class R6 | | | | |
| Actual | $1,000.00 | $1,071.12 | $1.15 | 0.22% |
| Hypothetical (5% return before expenses) | $1,000.00 | $1,024.10 | $1.12 | 0.22% |
1 Expenses paid is equal to the annualized net expense ratio of each class multiplied by the average account value over the period, multiplied by the number of days in the most recent fiscal half-year divided by the number of days in the fiscal year (to reflect the one-half-year period).
Target Date Retirement Funds | 29
Fund expenses (unaudited)
| | Beginning
account value
3-1-2021 | Ending
account value
8-31-2021 | Expenses
paid during
the period1 | Annualized net
expense ratio |
| Dynamic Target 2015 Fund | | | | |
| Class A | | | | |
| Actual | $1,000.00 | $1,078.88 | $3.46 | 0.66% |
| Hypothetical (5% return before expenses) | $1,000.00 | $1,021.88 | $3.36 | 0.66% |
| Class C | | | | |
| Actual | $1,000.00 | $1,074.04 | $7.48 | 1.43% |
| Hypothetical (5% return before expenses) | $1,000.00 | $1,018.00 | $7.27 | 1.43% |
| Class R4 | | | | |
| Actual | $1,000.00 | $1,079.75 | $1.94 | 0.37% |
| Hypothetical (5% return before expenses) | $1,000.00 | $1,023.34 | $1.89 | 0.37% |
| Class R6 | | | | |
| Actual | $1,000.00 | $1,080.56 | $1.15 | 0.22% |
| Hypothetical (5% return before expenses) | $1,000.00 | $1,024.10 | $1.12 | 0.22% |
| Dynamic Target 2020 Fund | | | | |
| Class A | | | | |
| Actual | $1,000.00 | $1,087.29 | $3.47 | 0.66% |
| Hypothetical (5% return before expenses) | $1,000.00 | $1,021.88 | $3.36 | 0.66% |
| Class C | | | | |
| Actual | $1,000.00 | $1,083.19 | $7.51 | 1.43% |
| Hypothetical (5% return before expenses) | $1,000.00 | $1,018.00 | $7.27 | 1.43% |
| Class R4 | | | | |
| Actual | $1,000.00 | $1,089.35 | $1.95 | 0.37% |
| Hypothetical (5% return before expenses) | $1,000.00 | $1,023.34 | $1.89 | 0.37% |
| Class R6 | | | | |
| Actual | $1,000.00 | $1,090.13 | $1.16 | 0.22% |
| Hypothetical (5% return before expenses) | $1,000.00 | $1,024.10 | $1.12 | 0.22% |
| Dynamic Target 2025 Fund | | | | |
| Class A | | | | |
| Actual | $1,000.00 | $1,099.34 | $3.49 | 0.66% |
| Hypothetical (5% return before expenses) | $1,000.00 | $1,021.88 | $3.36 | 0.66% |
| Class C | | | | |
| Actual | $1,000.00 | $1,094.34 | $7.55 | 1.43% |
| Hypothetical (5% return before expenses) | $1,000.00 | $1,018.00 | $7.27 | 1.43% |
| Class R4 | | | | |
| Actual | $1,000.00 | $1,100.41 | $1.96 | 0.37% |
| Hypothetical (5% return before expenses) | $1,000.00 | $1,023.34 | $1.89 | 0.37% |
| Class R6 | | | | |
| Actual | $1,000.00 | $1,101.15 | $1.17 | 0.22% |
| Hypothetical (5% return before expenses) | $1,000.00 | $1,024.10 | $1.12 | 0.22% |
1 Expenses paid is equal to the annualized net expense ratio of each class multiplied by the average account value over the period, multiplied by the number of days in the most recent fiscal half-year divided by the number of days in the fiscal year (to reflect the one-half-year period).
30 | Target Date Retirement Funds
Fund expenses (unaudited)
| | Beginning
account value
3-1-2021 | Ending
account value
8-31-2021 | Expenses
paid during
the period1 | Annualized net
expense ratio |
| Dynamic Target 2030 Fund | | | | |
| Class A | | | | |
| Actual | $1,000.00 | $1,106.17 | $3.50 | 0.66% |
| Hypothetical (5% return before expenses) | $1,000.00 | $1,021.88 | $3.36 | 0.66% |
| Class C | | | | |
| Actual | $1,000.00 | $1,101.31 | $7.57 | 1.43% |
| Hypothetical (5% return before expenses) | $1,000.00 | $1,018.00 | $7.27 | 1.43% |
| Class R4 | | | | |
| Actual | $1,000.00 | $1,107.76 | $1.97 | 0.37% |
| Hypothetical (5% return before expenses) | $1,000.00 | $1,023.34 | $1.89 | 0.37% |
| Class R6 | | | | |
| Actual | $1,000.00 | $1,108.48 | $1.17 | 0.22% |
| Hypothetical (5% return before expenses) | $1,000.00 | $1,024.10 | $1.12 | 0.22% |
| Dynamic Target 2035 Fund | | | | |
| Class A | | | | |
| Actual | $1,000.00 | $1,108.84 | $3.51 | 0.66% |
| Hypothetical (5% return before expenses) | $1,000.00 | $1,021.88 | $3.36 | 0.66% |
| Class C | | | | |
| Actual | $1,000.00 | $1,104.62 | $7.59 | 1.43% |
| Hypothetical (5% return before expenses) | $1,000.00 | $1,018.00 | $7.27 | 1.43% |
| Class R4 | | | | |
| Actual | $1,000.00 | $1,110.48 | $1.97 | 0.37% |
| Hypothetical (5% return before expenses) | $1,000.00 | $1,023.34 | $1.89 | 0.37% |
| Class R6 | | | | |
| Actual | $1,000.00 | $1,112.01 | $1.17 | 0.22% |
| Hypothetical (5% return before expenses) | $1,000.00 | $1,024.10 | $1.12 | 0.22% |
| Dynamic Target 2040 Fund | | | | |
| Class A | | | | |
| Actual | $1,000.00 | $1,114.24 | $3.57 | 0.67% |
| Hypothetical (5% return before expenses) | $1,000.00 | $1,021.83 | $3.41 | 0.67% |
| Class C | | | | |
| Actual | $1,000.00 | $1,109.93 | $7.60 | 1.43% |
| Hypothetical (5% return before expenses) | $1,000.00 | $1,018.00 | $7.27 | 1.43% |
| Class R4 | | | | |
| Actual | $1,000.00 | $1,116.49 | $1.97 | 0.37% |
| Hypothetical (5% return before expenses) | $1,000.00 | $1,023.34 | $1.89 | 0.37% |
| Class R6 | | | | |
| Actual | $1,000.00 | $1,117.21 | $1.17 | 0.22% |
| Hypothetical (5% return before expenses) | $1,000.00 | $1,024.10 | $1.12 | 0.22% |
1 Expenses paid is equal to the annualized net expense ratio of each class multiplied by the average account value over the period, multiplied by the number of days in the most recent fiscal half-year divided by the number of days in the fiscal year (to reflect the one-half-year period).
Target Date Retirement Funds | 31
Fund expenses (unaudited)
| | Beginning
account value
3-1-2021 | Ending
account value
8-31-2021 | Expenses
paid during
the period1 | Annualized net
expense ratio |
| Dynamic Target 2045 Fund | | | | |
| Class A | | | | |
| Actual | $1,000.00 | $1,120.56 | $3.58 | 0.67% |
| Hypothetical (5% return before expenses) | $1,000.00 | $1,021.83 | $3.41 | 0.67% |
| Class C | | | | |
| Actual | $1,000.00 | $1,116.49 | $7.63 | 1.43% |
| Hypothetical (5% return before expenses) | $1,000.00 | $1,018.00 | $7.27 | 1.43% |
| Class R4 | | | | |
| Actual | $1,000.00 | $1,122.13 | $1.98 | 0.37% |
| Hypothetical (5% return before expenses) | $1,000.00 | $1,023.34 | $1.89 | 0.37% |
| Class R6 | | | | |
| Actual | $1,000.00 | $1,123.67 | $1.18 | 0.22% |
| Hypothetical (5% return before expenses) | $1,000.00 | $1,024.10 | $1.12 | 0.22% |
| Dynamic Target 2050 Fund | | | | |
| Class A | | | | |
| Actual | $1,000.00 | $1,126.85 | $3.59 | 0.67% |
| Hypothetical (5% return before expenses) | $1,000.00 | $1,021.83 | $3.41 | 0.67% |
| Class C | | | | |
| Actual | $1,000.00 | $1,122.23 | $7.65 | 1.43% |
| Hypothetical (5% return before expenses) | $1,000.00 | $1,018.00 | $7.27 | 1.43% |
| Class R4 | | | | |
| Actual | $1,000.00 | $1,127.87 | $1.98 | 0.37% |
| Hypothetical (5% return before expenses) | $1,000.00 | $1,023.34 | $1.89 | 0.37% |
| Class R6 | | | | |
| Actual | $1,000.00 | $1,128.58 | $1.18 | 0.22% |
| Hypothetical (5% return before expenses) | $1,000.00 | $1,024.10 | $1.12 | 0.22% |
| Dynamic Target 2055 Fund | | | | |
| Class A | | | | |
| Actual | $1,000.00 | $1,125.51 | $3.59 | 0.67% |
| Hypothetical (5% return before expenses) | $1,000.00 | $1,021.83 | $3.41 | 0.67% |
| Class C | | | | |
| Actual | $1,000.00 | $1,120.92 | $7.64 | 1.43% |
| Hypothetical (5% return before expenses) | $1,000.00 | $1,018.00 | $7.27 | 1.43% |
| Class R4 | | | | |
| Actual | $1,000.00 | $1,126.53 | $1.98 | 0.37% |
| Hypothetical (5% return before expenses) | $1,000.00 | $1,023.34 | $1.89 | 0.37% |
| Class R6 | | | | |
| Actual | $1,000.00 | $1,128.16 | $1.18 | 0.22% |
| Hypothetical (5% return before expenses) | $1,000.00 | $1,024.10 | $1.12 | 0.22% |
1 Expenses paid is equal to the annualized net expense ratio of each class multiplied by the average account value over the period, multiplied by the number of days in the most recent fiscal half-year divided by the number of days in the fiscal year (to reflect the one-half-year period).
32 | Target Date Retirement Funds
Fund expenses (unaudited)
| | Beginning
account value
3-1-2021 | Ending
account value
8-31-2021 | Expenses
paid during
the period1 | Annualized net
expense ratio |
| Dynamic Target 2060 Fund | | | | |
| Class A | | | | |
| Actual | $1,000.00 | $1,126.13 | $3.59 | 0.67% |
| Hypothetical (5% return before expenses) | $1,000.00 | $1,021.83 | $3.41 | 0.67% |
| Class C | | | | |
| Actual | $1,000.00 | $1,121.93 | $7.65 | 1.43% |
| Hypothetical (5% return before expenses) | $1,000.00 | $1,018.00 | $7.27 | 1.43% |
| Class R4 | | | | |
| Actual | $1,000.00 | $1,127.56 | $1.98 | 0.37% |
| Hypothetical (5% return before expenses) | $1,000.00 | $1,023.34 | $1.89 | 0.37% |
| Class R6 | | | | |
| Actual | $1,000.00 | $1,128.27 | $1.18 | 0.22% |
| Hypothetical (5% return before expenses) | $1,000.00 | $1,024.10 | $1.12 | 0.22% |
1 Expenses paid is equal to the annualized net expense ratio of each class multiplied by the average account value over the period, multiplied by the number of days in the most recent fiscal half-year divided by the number of days in the fiscal year (to reflect the one-half-year period).
Target Date Retirement Funds | 33
Portfolio of investments—August 31, 2021 (unaudited)
Dynamic Target Today Fund
| | | | | | Value |
| Investment companies: 99.06% | | | | | |
| Affiliated master portfolios: 99.06% | | | | | |
| Wells Fargo Bloomberg Barclays US Aggregate ex-Corporate Portfolio | | | | | $ 2,180,545 |
| Wells Fargo Emerging Markets Bond Portfolio | | | | | 186,322 |
| Wells Fargo Factor Enhanced Emerging Markets Equity Portfolio | | | | | 223,533 |
| Wells Fargo Factor Enhanced International Equity Portfolio | | | | | 727,531 |
| Wells Fargo Factor Enhanced U.S. Large Cap Equity Portfolio | | | | | 1,406,676 |
| Wells Fargo Factor Enhanced U.S. Small Cap Equity Portfolio | | | | | 349,792 |
| Wells Fargo High Yield Corporate Bond Portfolio | | | | | 185,912 |
| Wells Fargo Investment Grade Corporate Bond Portfolio | | | | | 1,133,134 |
| Wells Fargo Strategic Retirement Bond Portfolio | | | | | 736,085 |
| Wells Fargo U.S. REIT Portfolio | | | | | 248,685 |
| Total Investment companies (Cost $6,556,352) | | | | | 7,378,215 |
| Total investments in securities (Cost $6,556,352) | 99.06% | | | | 7,378,215 |
| Other assets and liabilities, net | 0.94 | | | | 70,007 |
| Total net assets | 100.00% | | | | $7,448,222 |
Transactions with the affiliated Master Portfolios were as follows:
| | % of
ownership,
beginning
of period | % of
ownership,
end of
period | Net realized
gains
(losses) on
securities
transactions
allocated
from
affiliated
Master
Portfolios | | Net
change in
unrealized
gains
(losses) on
securities
transactions
allocated
from
affiliated
Master
Portfolios | | Interest
allocated
from
affiliated
Master
Portfolios | | Dividends
allocated
from
affiliated
Master
Portfolios | | Affiliated
income
allocated
from
affiliated
Master
Portfolios | | Value,
end of
period | |
| Wells Fargo Bloomberg Barclays US Aggregate ex-Corporate Portfolio | 0.35% | 0.37% | $ 8,106 | | $ (1,463) | | $ 13,098 | | $ 0 | | $41 | | $ 2,180,545 | |
| Wells Fargo Emerging Markets Bond Portfolio | 0.47 | 0.49 | (2,694) | | 6,397 | | 4,119 | | 0 | | 0 | | 186,322 | |
| Wells Fargo Factor Enhanced Emerging Markets Equity Portfolio | 0.12 | 0.12 | 10,477 | | (13,767) | | 0 | | 3,398 | | 0 | | 223,533 | |
| Wells Fargo Factor Enhanced International Equity Portfolio | 0.10 | 0.10 | 51,840 | | 10,729 | | 0 | | 13,242 | | 0 | | 727,531 | |
| Wells Fargo Factor Enhanced U.S. Large Cap Equity Portfolio | 0.17 | 0.16 | 195,189 | | 36,296 | | 0 | | 9,567 | | 7 | | 1,406,676 | |
| Wells Fargo Factor Enhanced U.S. Small Cap Equity Portfolio | 0.16 | 0.16 | 67,809 | | (47,533) | | 0 | | 1,774 | | 4 | | 349,792 | |
| Wells Fargo High Yield Corporate Bond Portfolio | 0.35 | 0.37 | 1,963 | | 76 | | 4,613 | | 0 | | 0 | | 185,912 | |
| Wells Fargo Investment Grade Corporate Bond Portfolio | 0.47 | 0.49 | 12,997 | | 388 | | 16,878 | | 0 | | 0 | | 1,133,134 | |
| Wells Fargo Strategic Retirement Bond Portfolio | 0.45 | 0.48 | 4,001 | | 1,057 | | 13,563 | | 0 | | 0 | | 736,085 | |
| Wells Fargo U.S. REIT Portfolio | 0.94 | 0.95 | 20,952 | | 30,708 | | 0 | | 3,757 | | 0 | | 248,685 | |
| | | | $370,640 | | $ 22,888 | | $52,271 | | $31,738 | | $52 | | $7,378,215 | |
The accompanying notes are an integral part of these financial statements.
34 | Target Date Retirement Funds
Portfolio of investments—August 31, 2021 (unaudited)
Dynamic Target Today Fund
Futures contracts
| Description | Number of
contracts | Expiration
date | Notional
cost | Notional
value | Unrealized
gains | | Unrealized
losses |
| Long | | | | | | | |
| New Zealand Dollar Futures | 3 | 9-13-2021 | $ 208,924 | $ 211,695 | $ 2,771 | | $ 0 |
| E-Mini S&P 500 Index | 1 | 9-17-2021 | 211,835 | 226,025 | 14,190 | | 0 |
| MSCI Emerging Markets Index | 1 | 9-17-2021 | 68,732 | 64,960 | 0 | | (3,772) |
| Short | | | | | | | |
| Euro FX Futures | (2) | 9-13-2021 | (297,909) | (295,388) | 2,521 | | 0 |
| | | | | | $19,482 | | $(3,772) |
The accompanying notes are an integral part of these financial statements.
Target Date Retirement Funds | 35
Portfolio of investments—August 31, 2021 (unaudited)
| | | | | | Value |
| Investment companies: 99.39% | | | | | |
| Affiliated master portfolios: 99.39% | | | | | |
| Wells Fargo Bloomberg Barclays US Aggregate ex-Corporate Portfolio | | | | | $ 1,748,468 |
| Wells Fargo Emerging Markets Bond Portfolio | | | | | 149,368 |
| Wells Fargo Factor Enhanced Emerging Markets Equity Portfolio | | | | | 243,248 |
| Wells Fargo Factor Enhanced International Equity Portfolio | | | | | 791,665 |
| Wells Fargo Factor Enhanced U.S. Large Cap Equity Portfolio | | | | | 1,530,646 |
| Wells Fargo Factor Enhanced U.S. Small Cap Equity Portfolio | | | | | 380,690 |
| Wells Fargo High Yield Corporate Bond Portfolio | | | | | 149,041 |
| Wells Fargo Investment Grade Corporate Bond Portfolio | | | | | 908,366 |
| Wells Fargo Strategic Retirement Bond Portfolio | | | | | 590,145 |
| Wells Fargo U.S. REIT Portfolio | | | | | 270,620 |
| Total Investment companies (Cost $5,944,284) | | | | | 6,762,257 |
| Total investments in securities (Cost $5,944,284) | 99.39% | | | | 6,762,257 |
| Other assets and liabilities, net | 0.61 | | | | 41,491 |
| Total net assets | 100.00% | | | | $6,803,748 |
Transactions with the affiliated Master Portfolios were as follows:
| | % of
ownership,
beginning
of period | % of
ownership,
end of
period | Net realized
gains
(losses) on
securities
transactions
allocated
from
affiliated
Master
Portfolios | | Net
change in
unrealized
gains
(losses) on
securities
transactions
allocated
from
affiliated
Master
Portfolios | | Interest
allocated
from
affiliated
Master
Portfolios | | Dividends
allocated
from
affiliated
Master
Portfolios | | Affiliated
income
allocated
from
affiliated
Master
Portfolios | | Value,
end of
period | |
| Wells Fargo Bloomberg Barclays US Aggregate ex-Corporate Portfolio | 0.27% | 0.30% | $ 6,621 | | $ (1,566) | | $ 10,206 | | $ 0 | | $32 | | $ 1,748,468 | |
| Wells Fargo Emerging Markets Bond Portfolio | 0.37 | 0.39 | (2,076) | | 5,073 | | 3,261 | | 0 | | 0 | | 149,368 | |
| Wells Fargo Factor Enhanced Emerging Markets Equity Portfolio | 0.12 | 0.13 | 11,329 | | (15,026) | | 0 | | 3,655 | | 1 | | 243,248 | |
| Wells Fargo Factor Enhanced International Equity Portfolio | 0.11 | 0.11 | 55,239 | | 9,734 | | 0 | | 14,182 | | 0 | | 791,665 | |
| Wells Fargo Factor Enhanced U.S. Large Cap Equity Portfolio | 0.18 | 0.18 | 208,239 | | 40,550 | | 0 | | 10,312 | | 7 | | 1,530,646 | |
| Wells Fargo Factor Enhanced U.S. Small Cap Equity Portfolio | 0.17 | 0.17 | 72,033 | | (52,035) | | 0 | | 1,912 | | 2 | | 380,690 | |
| Wells Fargo High Yield Corporate Bond Portfolio | 0.28 | 0.29 | 1,564 | | 111 | | 3,647 | | 0 | | 0 | | 149,041 | |
| Wells Fargo Investment Grade Corporate Bond Portfolio | 0.36 | 0.39 | 10,467 | | 647 | | 13,285 | | 0 | | 2 | | 908,366 | |
| Wells Fargo Strategic Retirement Bond Portfolio | 0.35 | 0.38 | 3,029 | | 1,242 | | 11,008 | | 0 | | 0 | | 590,145 | |
| Wells Fargo U.S. REIT Portfolio | 0.99 | 1.03 | 22,806 | | 32,683 | | 0 | | 4,073 | | 0 | | 270,620 | |
| | | | $389,251 | | $ 21,413 | | $41,407 | | $34,134 | | $44 | | $6,762,257 | |
The accompanying notes are an integral part of these financial statements.
36 | Target Date Retirement Funds
Portfolio of investments—August 31, 2021 (unaudited)
Futures contracts
| Description | Number of
contracts | Expiration
date | Notional
cost | Notional
value | Unrealized
gains | | Unrealized
losses |
| Long | | | | | | | |
| New Zealand Dollar Futures | 2 | 9-13-2021 | $ 139,283 | $ 141,130 | $ 1,847 | | $ 0 |
| E-Mini S&P 500 Index | 1 | 9-17-2021 | 211,835 | 226,025 | 14,190 | | 0 |
| MSCI Emerging Markets Index | 1 | 9-17-2021 | 68,732 | 64,960 | 0 | | (3,772) |
| Short | | | | | | | |
| Euro FX Futures | (2) | 9-13-2021 | (297,909) | (295,388) | 2,521 | | 0 |
| | | | | | $18,558 | | $(3,772) |
The accompanying notes are an integral part of these financial statements.
Target Date Retirement Funds | 37
Portfolio of investments—August 31, 2021 (unaudited)
| | | | | | Value |
| Investment companies: 99.30% | | | | | |
| Affiliated master portfolios: 99.30% | | | | | |
| Wells Fargo Bloomberg Barclays US Aggregate ex-Corporate Portfolio | | | | | $ 1,830,625 |
| Wells Fargo Emerging Markets Bond Portfolio | | | | | 156,410 |
| Wells Fargo Factor Enhanced Emerging Markets Equity Portfolio | | | | | 343,841 |
| Wells Fargo Factor Enhanced International Equity Portfolio | | | | | 1,118,992 |
| Wells Fargo Factor Enhanced U.S. Large Cap Equity Portfolio | | | | | 2,163,730 |
| Wells Fargo Factor Enhanced U.S. Small Cap Equity Portfolio | | | | | 538,093 |
| Wells Fargo High Yield Corporate Bond Portfolio | | | | | 156,067 |
| Wells Fargo Investment Grade Corporate Bond Portfolio | | | | | 951,223 |
| Wells Fargo Strategic Retirement Bond Portfolio | | | | | 617,989 |
| Wells Fargo U.S. REIT Portfolio | | | | | 382,572 |
| Total Investment companies (Cost $7,196,226) | | | | | 8,259,542 |
| Total investments in securities (Cost $7,196,226) | 99.30% | | | | 8,259,542 |
| Other assets and liabilities, net | 0.70 | | | | 58,512 |
| Total net assets | 100.00% | | | | $8,318,054 |
Transactions with the affiliated Master Portfolios were as follows:
| | % of
ownership,
beginning
of period | % of
ownership,
end of
period | Net realized
gains
(losses) on
securities
transactions
allocated
from
affiliated
Master
Portfolios | | Net
change in
unrealized
gains
(losses) on
securities
transactions
allocated
from
affiliated
Master
Portfolios | | Interest
allocated
from
affiliated
Master
Portfolios | | Dividends
allocated
from
affiliated
Master
Portfolios | | Affiliated
income
allocated
from
affiliated
Master
Portfolios | | Value,
end of
period | |
| Wells Fargo Bloomberg Barclays US Aggregate ex-Corporate Portfolio | 0.29% | 0.31% | $ 7,183 | | $ (494) | | $ 10,769 | | $ 0 | | $36 | | $ 1,830,625 | |
| Wells Fargo Emerging Markets Bond Portfolio | 0.39 | 0.41 | (2,146) | | 5,200 | | 3,406 | | 0 | | 0 | | 156,410 | |
| Wells Fargo Factor Enhanced Emerging Markets Equity Portfolio | 0.17 | 0.19 | 15,897 | | (20,193) | | 0 | | 5,103 | | 1 | | 343,841 | |
| Wells Fargo Factor Enhanced International Equity Portfolio | 0.15 | 0.15 | 77,543 | | 12,934 | | 0 | | 19,830 | | 0 | | 1,118,992 | |
| Wells Fargo Factor Enhanced U.S. Large Cap Equity Portfolio | 0.25 | 0.25 | 290,309 | | 60,775 | | 0 | | 14,306 | | 8 | | 2,163,730 | |
| Wells Fargo Factor Enhanced U.S. Small Cap Equity Portfolio | 0.24 | 0.24 | 100,300 | | (72,898) | | 0 | | 2,653 | | 3 | | 538,093 | |
| Wells Fargo High Yield Corporate Bond Portfolio | 0.29 | 0.31 | 1,656 | | 38 | | 3,807 | | 0 | | 0 | | 156,067 | |
| Wells Fargo Investment Grade Corporate Bond Portfolio | 0.38 | 0.41 | 11,040 | | (7) | | 13,903 | | 0 | | 1 | | 951,223 | |
| Wells Fargo Strategic Retirement Bond Portfolio | 0.37 | 0.40 | 2,813 | | 1,308 | | 11,498 | | 0 | | 0 | | 617,989 | |
| Wells Fargo U.S. REIT Portfolio | 1.40 | 1.45 | 32,033 | | 45,868 | | 0 | | 5,715 | | 0 | | 382,572 | |
| | | | $536,628 | | $ 32,531 | | $43,383 | | $47,607 | | $49 | | $8,259,542 | |
The accompanying notes are an integral part of these financial statements.
38 | Target Date Retirement Funds
Portfolio of investments—August 31, 2021 (unaudited)
Futures contracts
| Description | Number of
contracts | Expiration
date | Notional
cost | Notional
value | Unrealized
gains | | Unrealized
losses |
| Long | | | | | | | |
| New Zealand Dollar Futures | 3 | 9-13-2021 | $ 208,924 | $ 211,695 | $ 2,771 | | $ 0 |
| E-Mini S&P 500 Index | 1 | 9-17-2021 | 211,835 | 226,025 | 14,190 | | 0 |
| MSCI Emerging Markets Index | 1 | 9-17-2021 | 68,732 | 64,960 | 0 | | (3,772) |
| Short | | | | | | | |
| Euro FX Futures | (2) | 9-13-2021 | (297,909) | (295,388) | 2,521 | | 0 |
| | | | | | $19,482 | | $(3,772) |
The accompanying notes are an integral part of these financial statements.
Target Date Retirement Funds | 39
Portfolio of investments—August 31, 2021 (unaudited)
| | | | | | Value |
| Investment companies: 99.57% | | | | | |
| Affiliated master portfolios: 99.57% | | | | | |
| Wells Fargo Bloomberg Barclays US Aggregate ex-Corporate Portfolio | | | | | $ 2,558,823 |
| Wells Fargo Emerging Markets Bond Portfolio | | | | | 217,132 |
| Wells Fargo Factor Enhanced Emerging Markets Equity Portfolio | | | | | 717,508 |
| Wells Fargo Factor Enhanced International Equity Portfolio | | | | | 2,336,221 |
| Wells Fargo Factor Enhanced U.S. Large Cap Equity Portfolio | | | | | 4,319,213 |
| Wells Fargo Factor Enhanced U.S. Small Cap Equity Portfolio | | | | | 1,074,111 |
| Wells Fargo High Yield Corporate Bond Portfolio | | | | | 216,455 |
| Wells Fargo Investment Grade Corporate Bond Portfolio | | | | | 1,329,306 |
| Wells Fargo Strategic Retirement Bond Portfolio | | | | | 479,855 |
| Wells Fargo U.S. REIT Portfolio | | | | | 450,052 |
| Total Investment companies (Cost $12,078,332) | | | | | 13,698,676 |
| Total investments in securities (Cost $12,078,332) | 99.57% | | | | 13,698,676 |
| Other assets and liabilities, net | 0.43 | | | | 59,590 |
| Total net assets | 100.00% | | | | $13,758,266 |
Transactions with the affiliated Master Portfolios were as follows:
| | % of
ownership,
beginning
of period | % of
ownership,
end of
period | Net realized
gains
(losses) on
securities
transactions
allocated
from
affiliated
Master
Portfolios | | Net
change in
unrealized
gains
(losses) on
securities
transactions
allocated
from
affiliated
Master
Portfolios | | Interest
allocated
from
affiliated
Master
Portfolios | | Dividends
allocated
from
affiliated
Master
Portfolios | | Affiliated
income
allocated
from
affiliated
Master
Portfolios | | Value,
end of
period | |
| Wells Fargo Bloomberg Barclays US Aggregate ex-Corporate Portfolio | 0.38% | 0.43% | $ 10,264 | | $ 1,334 | | $ 15,138 | | $ 0 | | $50 | | $ 2,558,823 | |
| Wells Fargo Emerging Markets Bond Portfolio | 0.50 | 0.57 | (2,926) | | 7,237 | | 4,822 | | 0 | | 0 | | 217,132 | |
| Wells Fargo Factor Enhanced Emerging Markets Equity Portfolio | 0.35 | 0.39 | 34,185 | | (48,109) | | 0 | | 11,202 | | 3 | | 717,508 | |
| Wells Fargo Factor Enhanced International Equity Portfolio | 0.30 | 0.32 | 163,874 | | 22,956 | | 0 | | 42,173 | | 0 | | 2,336,221 | |
| Wells Fargo Factor Enhanced U.S. Large Cap Equity Portfolio | 0.47 | 0.51 | 590,451 | | 112,427 | | 0 | | 29,716 | | 20 | | 4,319,213 | |
| Wells Fargo Factor Enhanced U.S. Small Cap Equity Portfolio | 0.46 | 0.48 | 211,431 | | (159,853) | | 0 | | 5,577 | | 7 | | 1,074,111 | |
| Wells Fargo High Yield Corporate Bond Portfolio | 0.38 | 0.43 | 2,320 | | (49) | | 5,384 | | 0 | | 0 | | 216,455 | |
| Wells Fargo Investment Grade Corporate Bond Portfolio | 0.50 | 0.57 | 16,260 | | 714 | | 19,766 | | 0 | | 2 | | 1,329,306 | |
| Wells Fargo Strategic Retirement Bond Portfolio | 0.27 | 0.31 | 1,797 | | 1,660 | | 9,188 | | 0 | | 0 | | 479,855 | |
| Wells Fargo U.S. REIT Portfolio | 1.57 | 1.71 | 39,550 | | 52,546 | | 0 | | 6,841 | | 0 | | 450,052 | |
| | | | $1,067,206 | | $ (9,137) | | $54,298 | | $95,509 | | $82 | | $13,698,676 | |
The accompanying notes are an integral part of these financial statements.
40 | Target Date Retirement Funds
Portfolio of investments—August 31, 2021 (unaudited)
Futures contracts
| Description | Number of
contracts | Expiration
date | Notional
cost | Notional
value | Unrealized
gains | | Unrealized
losses |
| Long | | | | | | | |
| New Zealand Dollar Futures | 5 | 9-13-2021 | $ 348,207 | $ 352,825 | $ 4,618 | | $ 0 |
| E-Mini S&P 500 Index | 2 | 9-17-2021 | 423,670 | 452,050 | 28,380 | | 0 |
| MSCI Emerging Markets Index | 2 | 9-17-2021 | 137,465 | 129,920 | 0 | | (7,545) |
| Short | | | | | | | |
| Euro FX Futures | (4) | 9-13-2021 | (595,818) | (590,775) | 5,043 | | 0 |
| | | | | | $38,041 | | $(7,545) |
The accompanying notes are an integral part of these financial statements.
Target Date Retirement Funds | 41
Portfolio of investments—August 31, 2021 (unaudited)
| | | | | | Value |
| Investment companies: 99.57% | | | | | |
| Affiliated master portfolios: 99.57% | | | | | |
| Wells Fargo Bloomberg Barclays US Aggregate ex-Corporate Portfolio | | | | | $ 1,967,190 |
| Wells Fargo Emerging Markets Bond Portfolio | | | | | 165,463 |
| Wells Fargo Factor Enhanced Emerging Markets Equity Portfolio | | | | | 883,820 |
| Wells Fargo Factor Enhanced International Equity Portfolio | | | | | 2,872,944 |
| Wells Fargo Factor Enhanced U.S. Large Cap Equity Portfolio | | | | | 5,093,081 |
| Wells Fargo Factor Enhanced U.S. Small Cap Equity Portfolio | | | | | 1,269,859 |
| Wells Fargo High Yield Corporate Bond Portfolio | | | | | 165,101 |
| Wells Fargo Investment Grade Corporate Bond Portfolio | | | | | 1,022,784 |
| Wells Fargo Strategic Retirement Bond Portfolio | | | | | 114,375 |
| Wells Fargo U.S. REIT Portfolio | | | | | 173,210 |
| Total Investment companies (Cost $12,033,715) | | | | | 13,727,827 |
| Total investments in securities (Cost $12,033,715) | 99.57% | | | | 13,727,827 |
| Other assets and liabilities, net | 0.43 | | | | 58,636 |
| Total net assets | 100.00% | | | | $13,786,463 |
Transactions with the affiliated Master Portfolios were as follows:
| | % of
ownership,
beginning
of period | % of
ownership,
end of
period | Net realized
gains
(losses) on
securities
transactions
allocated
from
affiliated
Master
Portfolios | | Net
change in
unrealized
gains
(losses) on
securities
transactions
allocated
from
affiliated
Master
Portfolios | | Interest
allocated
from
affiliated
Master
Portfolios | | Dividends
allocated
from
affiliated
Master
Portfolios | | Affiliated
income
allocated
from
affiliated
Master
Portfolios | | Value,
end of
period | |
| Wells Fargo Bloomberg Barclays US Aggregate ex-Corporate Portfolio | 0.27% | 0.33% | $ 7,551 | | $ 1,261 | | $ 10,966 | | $ 0 | | $37 | | $ 1,967,190 | |
| Wells Fargo Emerging Markets Bond Portfolio | 0.35 | 0.44 | (2,096) | | 5,202 | | 3,479 | | 0 | | 0 | | 165,463 | |
| Wells Fargo Factor Enhanced Emerging Markets Equity Portfolio | 0.40 | 0.48 | 39,379 | | (54,196) | | 0 | | 12,981 | | 4 | | 883,820 | |
| Wells Fargo Factor Enhanced International Equity Portfolio | 0.34 | 0.39 | 189,654 | | 22,368 | | 0 | | 48,679 | | 0 | | 2,872,944 | |
| Wells Fargo Factor Enhanced U.S. Large Cap Equity Portfolio | 0.52 | 0.60 | 652,343 | | 131,863 | | 0 | | 33,115 | | 22 | | 5,093,081 | |
| Wells Fargo Factor Enhanced U.S. Small Cap Equity Portfolio | 0.49 | 0.57 | 233,799 | | (174,945) | | 0 | | 6,209 | | 7 | | 1,269,859 | |
| Wells Fargo High Yield Corporate Bond Portfolio | 0.27 | 0.33 | 1,664 | | 49 | | 3,887 | | 0 | | 0 | | 165,101 | |
| Wells Fargo Investment Grade Corporate Bond Portfolio | 0.36 | 0.44 | 11,778 | | 1,703 | | 14,360 | | 0 | | 2 | | 1,022,784 | |
| Wells Fargo Strategic Retirement Bond Portfolio | 0.06 | 0.07 | 362 | | 401 | | 2,073 | | 0 | | 0 | | 114,375 | |
| Wells Fargo U.S. REIT Portfolio | 0.56 | 0.66 | 14,556 | | 18,766 | | 0 | | 2,516 | | 0 | | 173,210 | |
| | | | $1,148,990 | | $ (47,528) | | $34,765 | | $103,500 | | $72 | | $13,727,827 | |
The accompanying notes are an integral part of these financial statements.
42 | Target Date Retirement Funds
Portfolio of investments—August 31, 2021 (unaudited)
Futures contracts
| Description | Number of
contracts | Expiration
date | Notional
cost | Notional
value | Unrealized
gains | | Unrealized
losses |
| Long | | | | | | | |
| New Zealand Dollar Futures | 5 | 9-13-2021 | $ 348,207 | $ 352,825 | $ 4,618 | | $ 0 |
| E-Mini S&P 500 Index | 1 | 9-17-2021 | 211,835 | 226,025 | 14,190 | | 0 |
| MSCI Emerging Markets Index | 2 | 9-17-2021 | 137,465 | 129,920 | 0 | | (7,545) |
| Short | | | | | | | |
| Euro FX Futures | (4) | 9-13-2021 | (595,818) | (590,775) | 5,043 | | 0 |
| | | | | | $23,851 | | $(7,545) |
The accompanying notes are an integral part of these financial statements.
Target Date Retirement Funds | 43
Portfolio of investments—August 31, 2021 (unaudited)
| | | | | | Value |
| Investment companies: 99.54% | | | | | |
| Affiliated master portfolios: 99.54% | | | | | |
| Wells Fargo Bloomberg Barclays US Aggregate ex-Corporate Portfolio | | | | | $ 1,490,472 |
| Wells Fargo Emerging Markets Bond Portfolio | | | | | 126,136 |
| Wells Fargo Factor Enhanced Emerging Markets Equity Portfolio | | | | | 891,648 |
| Wells Fargo Factor Enhanced International Equity Portfolio | | | | | 2,928,221 |
| Wells Fargo Factor Enhanced U.S. Large Cap Equity Portfolio | | | | | 4,962,999 |
| Wells Fargo Factor Enhanced U.S. Small Cap Equity Portfolio | | | | | 1,236,902 |
| Wells Fargo High Yield Corporate Bond Portfolio | | | | | 125,860 |
| Wells Fargo Investment Grade Corporate Bond Portfolio | | | | | 773,849 |
| Total Investment companies (Cost $10,803,025) | | | | | 12,536,087 |
| Total investments in securities (Cost $10,803,025) | 99.54% | | | | 12,536,087 |
| Other assets and liabilities, net | 0.46 | | | | 58,059 |
| Total net assets | 100.00% | | | | $12,594,146 |
Transactions with the affiliated Master Portfolios were as follows:
| | % of
ownership,
beginning
of period | % of
ownership,
end of
period | Net realized
gains
(losses) on
securities
transactions
allocated
from
affiliated
Master
Portfolios | | Net
change in
unrealized
gains
(losses) on
securities
transactions
allocated
from
affiliated
Master
Portfolios | | Interest
allocated
from
affiliated
Master
Portfolios | | Dividends
allocated
from
affiliated
Master
Portfolios | | Affiliated
income
allocated
from
affiliated
Master
Portfolios | | Value,
end of
period | |
| Wells Fargo Bloomberg Barclays US Aggregate ex-Corporate Portfolio | 0.22% | 0.25% | $ 5,532 | | $ 70,616 | | $ 8,658 | | $ 0 | | $37 | | $ 1,490,472 | |
| Wells Fargo Emerging Markets Bond Portfolio | 0.29 | 0.33 | (1,704) | | 7,863 | | 2,696 | | 0 | | 0 | | 126,136 | |
| Wells Fargo Factor Enhanced Emerging Markets Equity Portfolio | 0.43 | 0.48 | 40,510 | | (46,057) | | 0 | | 13,209 | | 3 | | 891,648 | |
| Wells Fargo Factor Enhanced International Equity Portfolio | 0.38 | 0.40 | 198,611 | | 134,717 | | 0 | | 51,151 | | 0 | | 2,928,221 | |
| Wells Fargo Factor Enhanced U.S. Large Cap Equity Portfolio | 0.54 | 0.58 | 658,897 | | 109,603 | | 0 | | 32,807 | | 18 | | 4,962,999 | |
| Wells Fargo Factor Enhanced U.S. Small Cap Equity Portfolio | 0.52 | 0.56 | 232,873 | | (382,173) | | 0 | | 6,133 | | 6 | | 1,236,902 | |
| Wells Fargo High Yield Corporate Bond Portfolio | 0.22 | 0.25 | 1,279 | | 835 | | 3,018 | | 0 | | 0 | | 125,860 | |
| Wells Fargo Investment Grade Corporate Bond Portfolio | 0.29 | 0.33 | 8,740 | | 47,272 | | 10,541 | | 0 | | 0 | | 773,849 | |
| | | | $1,144,738 | | $ (57,324) | | $24,913 | | $103,300 | | $64 | | $12,536,087 | |
The accompanying notes are an integral part of these financial statements.
44 | Target Date Retirement Funds
Portfolio of investments—August 31, 2021 (unaudited)
Futures contracts
| Description | Number of
contracts | Expiration
date | Notional
cost | Notional
value | Unrealized
gains | | Unrealized
losses |
| Long | | | | | | | |
| New Zealand Dollar Futures | 4 | 9-13-2021 | $ 278,566 | $ 282,260 | $ 3,694 | | $ 0 |
| E-Mini S&P 500 Index | 1 | 9-17-2021 | 211,835 | 226,025 | 14,190 | | 0 |
| MSCI Emerging Markets Index | 2 | 9-17-2021 | 137,465 | 129,920 | 0 | | (7,545) |
| Short | | | | | | | |
| Euro FX Futures | (3) | 9-13-2021 | (446,864) | (443,081) | 3,783 | | 0 |
| | | | | | $21,667 | | $(7,545) |
The accompanying notes are an integral part of these financial statements.
Target Date Retirement Funds | 45
Portfolio of investments—August 31, 2021 (unaudited)
| | | | | | Value |
| Investment companies: 99.39% | | | | | |
| Affiliated master portfolios: 99.39% | | | | | |
| Wells Fargo Bloomberg Barclays US Aggregate ex-Corporate Portfolio | | | | | $ 957,767 |
| Wells Fargo Emerging Markets Bond Portfolio | | | | | 81,130 |
| Wells Fargo Factor Enhanced Emerging Markets Equity Portfolio | | | | | 843,756 |
| Wells Fargo Factor Enhanced International Equity Portfolio | | | | | 2,742,584 |
| Wells Fargo Factor Enhanced U.S. Large Cap Equity Portfolio | | | | | 4,466,715 |
| Wells Fargo Factor Enhanced U.S. Small Cap Equity Portfolio | | | | | 1,113,248 |
| Wells Fargo High Yield Corporate Bond Portfolio | | | | | 80,970 |
| Wells Fargo Investment Grade Corporate Bond Portfolio | | | | | 497,696 |
| Total Investment companies (Cost $9,093,769) | | | | | 10,783,866 |
| Total investments in securities (Cost $9,093,769) | 99.39% | | | | 10,783,866 |
| Other assets and liabilities, net | 0.61 | | | | 66,539 |
| Total net assets | 100.00% | | | | $10,850,405 |
Transactions with the affiliated Master Portfolios were as follows:
| | % of
ownership,
beginning
of period | % of
ownership,
end of
period | Net realized
gains
(losses) on
securities
transactions
allocated
from
affiliated
Master
Portfolios | | Net
change in
unrealized
gains
(losses) on
securities
transactions
allocated
from
affiliated
Master
Portfolios | | Interest
allocated
from
affiliated
Master
Portfolios | | Dividends
allocated
from
affiliated
Master
Portfolios | | Affiliated
income
allocated
from
affiliated
Master
Portfolios | | Value,
end of
period | |
| Wells Fargo Bloomberg Barclays US Aggregate ex-Corporate Portfolio | 0.15% | 0.16% | $ 3,555 | | $ (13,761) | | $ 5,633 | | $ 0 | | $26 | | $ 957,767 | |
| Wells Fargo Emerging Markets Bond Portfolio | 0.19 | 0.21 | (1,117) | | 1,748 | | 1,753 | | 0 | | 0 | | 81,130 | |
| Wells Fargo Factor Enhanced Emerging Markets Equity Portfolio | 0.41 | 0.46 | 38,210 | | (34,386) | | 0 | | 12,569 | | 3 | | 843,756 | |
| Wells Fargo Factor Enhanced International Equity Portfolio | 0.36 | 0.37 | 188,695 | | 29,614 | | 0 | | 48,435 | | 0 | | 2,742,584 | |
| Wells Fargo Factor Enhanced U.S. Large Cap Equity Portfolio | 0.50 | 0.52 | 601,106 | | 182,480 | | 0 | | 29,777 | | 17 | | 4,466,715 | |
| Wells Fargo Factor Enhanced U.S. Small Cap Equity Portfolio | 0.48 | 0.50 | 208,197 | | (199,545) | | 0 | | 5,534 | | 5 | | 1,113,248 | |
| Wells Fargo High Yield Corporate Bond Portfolio | 0.14 | 0.16 | 831 | | 1,297 | | 1,963 | | 0 | | 0 | | 80,970 | |
| Wells Fargo Investment Grade Corporate Bond Portfolio | 0.19 | 0.21 | 5,654 | | (22,651) | | 6,701 | | 0 | | 0 | | 497,696 | |
| | | | $1,045,131 | | $ (55,204) | | $16,050 | | $96,315 | | $51 | | $10,783,866 | |
The accompanying notes are an integral part of these financial statements.
46 | Target Date Retirement Funds
Portfolio of investments—August 31, 2021 (unaudited)
Futures contracts
| Description | Number of
contracts | Expiration
date | Notional
cost | Notional
value | Unrealized
gains | | Unrealized
losses |
| Long | | | | | | | |
| New Zealand Dollar Futures | 4 | 9-13-2021 | $ 278,566 | $ 282,260 | $ 3,694 | | $ 0 |
| E-Mini S&P 500 Index | 1 | 9-17-2021 | 211,835 | 226,025 | 14,190 | | 0 |
| MSCI Emerging Markets Index | 2 | 9-17-2021 | 137,465 | 129,920 | 0 | | (7,545) |
| Short | | | | | | | |
| Euro FX Futures | (3) | 9-13-2021 | (446,864) | (443,081) | 3,783 | | 0 |
| | | | | | $21,667 | | $(7,545) |
The accompanying notes are an integral part of these financial statements.
Target Date Retirement Funds | 47
Portfolio of investments—August 31, 2021 (unaudited)
| | | | | | Value |
| Investment companies: 99.60% | | | | | |
| Affiliated master portfolios: 99.60% | | | | | |
| Wells Fargo Bloomberg Barclays US Aggregate ex-Corporate Portfolio | | | | | $ 525,965 |
| Wells Fargo Emerging Markets Bond Portfolio | | | | | 44,566 |
| Wells Fargo Factor Enhanced Emerging Markets Equity Portfolio | | | | | 740,683 |
| Wells Fargo Factor Enhanced International Equity Portfolio | | | | | 2,408,482 |
| Wells Fargo Factor Enhanced U.S. Large Cap Equity Portfolio | | | | | 3,825,870 |
| Wells Fargo Factor Enhanced U.S. Small Cap Equity Portfolio | | | | | 953,483 |
| Wells Fargo High Yield Corporate Bond Portfolio | | | | | 44,479 |
| Wells Fargo Investment Grade Corporate Bond Portfolio | | | | | 273,327 |
| Total Investment companies (Cost $7,350,128) | | | | | 8,816,855 |
| Total investments in securities (Cost $7,350,128) | 99.60% | | | | 8,816,855 |
| Other assets and liabilities, net | 0.40 | | | | 35,445 |
| Total net assets | 100.00% | | | | $8,852,300 |
Transactions with the affiliated Master Portfolios were as follows:
| | % of
ownership,
beginning
of period | % of
ownership,
end of
period | Net realized
gains
(losses) on
securities
transactions
allocated
from
affiliated
Master
Portfolios | | Net
change in
unrealized
gains
(losses) on
securities
transactions
allocated
from
affiliated
Master
Portfolios | | Interest
allocated
from
affiliated
Master
Portfolios | | Dividends
allocated
from
affiliated
Master
Portfolios | | Affiliated
income
allocated
from
affiliated
Master
Portfolios | | Value,
end of
period | |
| Wells Fargo Bloomberg Barclays US Aggregate ex-Corporate Portfolio | 0.08% | 0.09% | $ 2,009 | | $ (3) | | $ 2,903 | | $ 0 | | $ 9 | | $ 525,965 | |
| Wells Fargo Emerging Markets Bond Portfolio | 0.11 | 0.12 | (617) | | 1,493 | | 965 | | 0 | | 0 | | 44,566 | |
| Wells Fargo Factor Enhanced Emerging Markets Equity Portfolio | 0.37 | 0.40 | 33,965 | | (43,441) | | 0 | | 11,098 | | 3 | | 740,683 | |
| Wells Fargo Factor Enhanced International Equity Portfolio | 0.32 | 0.33 | 167,757 | | 27,005 | | 0 | | 43,028 | | 0 | | 2,408,482 | |
| Wells Fargo Factor Enhanced U.S. Large Cap Equity Portfolio | 0.43 | 0.45 | 521,816 | | 99,777 | | 0 | | 25,813 | | 22 | | 3,825,870 | |
| Wells Fargo Factor Enhanced U.S. Small Cap Equity Portfolio | 0.42 | 0.43 | 180,746 | | (132,874) | | 0 | | 4,801 | | 5 | | 953,483 | |
| Wells Fargo High Yield Corporate Bond Portfolio | 0.08 | 0.09 | 463 | | 14 | | 1,082 | | 0 | | 0 | | 44,479 | |
| Wells Fargo Investment Grade Corporate Bond Portfolio | 0.11 | 0.12 | 3,119 | | 152 | | 3,730 | | 0 | | 0 | | 273,327 | |
| | | | $909,258 | | $ (47,877) | | $8,680 | | $84,740 | | $39 | | $8,816,855 | |
The accompanying notes are an integral part of these financial statements.
48 | Target Date Retirement Funds
Portfolio of investments—August 31, 2021 (unaudited)
Futures contracts
| Description | Number of
contracts | Expiration
date | Notional
cost | Notional
value | Unrealized
gains | | Unrealized
losses |
| Long | | | | | | | |
| New Zealand Dollar Futures | 3 | 9-13-2021 | $ 208,924 | $ 211,695 | $ 2,771 | | $ 0 |
| E-Mini S&P 500 Index | 1 | 9-17-2021 | 211,835 | 226,025 | 14,190 | | 0 |
| MSCI Emerging Markets Index | 1 | 9-17-2021 | 68,732 | 64,960 | 0 | | (3,772) |
| Short | | | | | | | |
| Euro FX Futures | (2) | 9-13-2021 | (297,909) | (295,388) | 2,521 | | 0 |
| | | | | | $19,482 | | $(3,772) |
The accompanying notes are an integral part of these financial statements.
Target Date Retirement Funds | 49
Portfolio of investments—August 31, 2021 (unaudited)
| | | | | | Value |
| Investment companies: 99.28% | | | | | |
| Affiliated master portfolios: 99.28% | | | | | |
| Wells Fargo Bloomberg Barclays US Aggregate ex-Corporate Portfolio | | | | | $ 235,909 |
| Wells Fargo Emerging Markets Bond Portfolio | | | | | 19,996 |
| Wells Fargo Factor Enhanced Emerging Markets Equity Portfolio | | | | | 715,678 |
| Wells Fargo Factor Enhanced International Equity Portfolio | | | | | 2,336,427 |
| Wells Fargo Factor Enhanced U.S. Large Cap Equity Portfolio | | | | | 3,628,005 |
| Wells Fargo Factor Enhanced U.S. Small Cap Equity Portfolio | | | | | 896,559 |
| Wells Fargo High Yield Corporate Bond Portfolio | | | | | 19,941 |
| Wells Fargo Investment Grade Corporate Bond Portfolio | | | | | 122,501 |
| Total Investment companies (Cost $6,616,087) | | | | | 7,975,016 |
| Total investments in securities (Cost $6,616,087) | 99.28% | | | | 7,975,016 |
| Other assets and liabilities, net | 0.72 | | | | 57,535 |
| Total net assets | 100.00% | | | | $8,032,551 |
Transactions with the affiliated Master Portfolios were as follows:
| | % of
ownership,
beginning
of period | % of
ownership,
end of
period | Net realized
gains
(losses) on
securities
transactions
allocated
from
affiliated
Master
Portfolios | | Net
change in
unrealized
gains
(losses) on
securities
transactions
allocated
from
affiliated
Master
Portfolios | | Interest
allocated
from
affiliated
Master
Portfolios | | Dividends
allocated
from
affiliated
Master
Portfolios | | Affiliated
income
allocated
from
affiliated
Master
Portfolios | | Value,
end of
period | |
| Wells Fargo Bloomberg Barclays US Aggregate ex-Corporate Portfolio | 0.04% | 0.04% | $ 917 | | $ 41 | | $ 1,241 | | $ 0 | | $ 4 | | $ 235,909 | |
| Wells Fargo Emerging Markets Bond Portfolio | 0.05 | 0.05 | (270) | | 664 | | 395 | | 0 | | 0 | | 19,996 | |
| Wells Fargo Factor Enhanced Emerging Markets Equity Portfolio | 0.34 | 0.39 | 32,330 | | (42,704) | | 0 | | 10,614 | | 3 | | 715,678 | |
| Wells Fargo Factor Enhanced International Equity Portfolio | 0.30 | 0.32 | 159,800 | | 23,277 | | 0 | | 40,881 | | 7 | | 2,336,427 | |
| Wells Fargo Factor Enhanced U.S. Large Cap Equity Portfolio | 0.40 | 0.42 | 484,299 | | 94,448 | | 0 | | 24,096 | | 14 | | 3,628,005 | |
| Wells Fargo Factor Enhanced U.S. Small Cap Equity Portfolio | 0.39 | 0.40 | 169,169 | | (125,227) | | 0 | | 4,483 | | 4 | | 896,559 | |
| Wells Fargo High Yield Corporate Bond Portfolio | 0.04 | 0.04 | 208 | | 9 | | 434 | | 0 | | 0 | | 19,941 | |
| Wells Fargo Investment Grade Corporate Bond Portfolio | 0.05 | 0.05 | 1,414 | | 101 | | 1,583 | | 0 | | 0 | | 122,501 | |
| | | | $847,867 | | $ (49,391) | | $3,653 | | $80,074 | | $32 | | $7,975,016 | |
The accompanying notes are an integral part of these financial statements.
50 | Target Date Retirement Funds
Portfolio of investments—August 31, 2021 (unaudited)
Futures contracts
| Description | Number of
contracts | Expiration
date | Notional
cost | Notional
value | Unrealized
gains | | Unrealized
losses |
| Long | | | | | | | |
| New Zealand Dollar Futures | 3 | 9-13-2021 | $ 208,924 | $ 211,695 | $ 2,771 | | $ 0 |
| E-Mini S&P 500 Index | 1 | 9-17-2021 | 211,835 | 226,025 | 14,190 | | 0 |
| MSCI Emerging Markets Index | 1 | 9-17-2021 | 68,732 | 64,960 | 0 | | (3,772) |
| Short | | | | | | | |
| Euro FX Futures | (2) | 9-13-2021 | (297,909) | (295,388) | 2,521 | | 0 |
| | | | | | $19,482 | | $(3,772) |
The accompanying notes are an integral part of these financial statements.
Target Date Retirement Funds | 51
Portfolio of investments—August 31, 2021 (unaudited)
| | | | | | Value |
| Investment companies: 99.28% | | | | | |
| Affiliated master portfolios: 99.28% | | | | | |
| Wells Fargo Bloomberg Barclays US Aggregate ex-Corporate Portfolio | | | | | $ 246,784 |
| Wells Fargo Emerging Markets Bond Portfolio | | | | | 20,899 |
| Wells Fargo Factor Enhanced Emerging Markets Equity Portfolio | | | | | 742,112 |
| Wells Fargo Factor Enhanced International Equity Portfolio | | | | | 2,420,582 |
| Wells Fargo Factor Enhanced U.S. Large Cap Equity Portfolio | | | | | 3,766,212 |
| Wells Fargo Factor Enhanced U.S. Small Cap Equity Portfolio | | | | | 938,640 |
| Wells Fargo High Yield Corporate Bond Portfolio | | | | | 20,861 |
| Wells Fargo Investment Grade Corporate Bond Portfolio | | | | | 128,211 |
| Total Investment companies (Cost $6,884,200) | | | | | 8,284,301 |
| Total investments in securities (Cost $6,884,200) | 99.28% | | | | 8,284,301 |
| Other assets and liabilities, net | 0.72 | | | | 59,836 |
| Total net assets | 100.00% | | | | $8,344,137 |
Transactions with the affiliated Master Portfolios were as follows:
| | % of
ownership,
beginning
of period | % of
ownership,
end of
period | Net realized
gains
(losses) on
securities
transactions
allocated
from
affiliated
Master
Portfolios | | Net
change in
unrealized
gains
(losses) on
securities
transactions
allocated
from
affiliated
Master
Portfolios | | Interest
allocated
from
affiliated
Master
Portfolios | | Dividends
allocated
from
affiliated
Master
Portfolios | | Affiliated
income
allocated
from
affiliated
Master
Portfolios | | Value,
end of
period | |
| Wells Fargo Bloomberg Barclays US Aggregate ex-Corporate Portfolio | 0.04% | 0.04% | $ 951 | | $ 18 | | $ 1,277 | | $ 0 | | $ 4 | | $ 246,784 | |
| Wells Fargo Emerging Markets Bond Portfolio | 0.05 | 0.06 | (279) | | 682 | | 399 | | 0 | | 0 | | 20,899 | |
| Wells Fargo Factor Enhanced Emerging Markets Equity Portfolio | 0.36 | 0.40 | 33,481 | | (43,834) | | 0 | | 10,970 | | 3 | | 742,112 | |
| Wells Fargo Factor Enhanced International Equity Portfolio | 0.31 | 0.33 | 164,526 | | 25,308 | | 0 | | 42,215 | | 6 | | 2,420,582 | |
| Wells Fargo Factor Enhanced U.S. Large Cap Equity Portfolio | 0.41 | 0.44 | 499,499 | | 98,437 | | 0 | | 24,915 | | 14 | | 3,766,212 | |
| Wells Fargo Factor Enhanced U.S. Small Cap Equity Portfolio | 0.40 | 0.42 | 175,526 | | (129,531) | | 0 | | 4,638 | | 5 | | 938,640 | |
| Wells Fargo High Yield Corporate Bond Portfolio | 0.04 | 0.04 | 215 | | 7 | | 445 | | 0 | | 0 | | 20,861 | |
| Wells Fargo Investment Grade Corporate Bond Portfolio | 0.05 | 0.06 | 1,461 | | 78 | | 1,646 | | 0 | | 0 | | 128,211 | |
| | | | $875,380 | | $ (48,835) | | $3,767 | | $82,738 | | $32 | | $8,284,301 | |
The accompanying notes are an integral part of these financial statements.
52 | Target Date Retirement Funds
Portfolio of investments—August 31, 2021 (unaudited)
Futures contracts
| Description | Number of
contracts | Expiration
date | Notional
cost | Notional
value | Unrealized
gains | | Unrealized
losses |
| Long | | | | | | | |
| New Zealand Dollar Futures | 3 | 9-13-2021 | $ 208,924 | $ 211,695 | $ 2,771 | | $ 0 |
| E-Mini S&P 500 Index | 1 | 9-17-2021 | 211,835 | 226,025 | 14,190 | | 0 |
| MSCI Emerging Markets Index | 1 | 9-17-2021 | 68,732 | 64,960 | 0 | | (3,772) |
| Short | | | | | | | |
| Euro FX Futures | (2) | 9-13-2021 | (297,909) | (295,388) | 2,521 | | 0 |
| | | | | | $19,482 | | $(3,772) |
The accompanying notes are an integral part of these financial statements.
Target Date Retirement Funds | 53
Portfolio of investments—August 31, 2021 (unaudited)
| | | | | | Value |
| Investment companies: 99.23% | | | | | |
| Affiliated master portfolios: 99.23% | | | | | |
| Wells Fargo Bloomberg Barclays US Aggregate ex-Corporate Portfolio | | | | | $ 222,468 |
| Wells Fargo Emerging Markets Bond Portfolio | | | | | 18,840 |
| Wells Fargo Factor Enhanced Emerging Markets Equity Portfolio | | | | | 668,848 |
| Wells Fargo Factor Enhanced International Equity Portfolio | | | | | 2,179,792 |
| Wells Fargo Factor Enhanced U.S. Large Cap Equity Portfolio | | | | | 3,396,067 |
| Wells Fargo Factor Enhanced U.S. Small Cap Equity Portfolio | | | | | 846,396 |
| Wells Fargo High Yield Corporate Bond Portfolio | | | | | 18,805 |
| Wells Fargo Investment Grade Corporate Bond Portfolio | | | | | 115,578 |
| Wells Fargo U.S. REIT Portfolio | | | | | 8,100 |
| Total Investment companies (Cost $6,166,572) | | | | | 7,474,894 |
| Total investments in securities (Cost $6,166,572) | 99.23% | | | | 7,474,894 |
| Other assets and liabilities, net | 0.77 | | | | 58,227 |
| Total net assets | 100.00% | | | | $7,533,121 |
Transactions with the affiliated Master Portfolios were as follows:
| | % of
ownership,
beginning
of period | % of
ownership,
end of
period | Net realized
gains
(losses) on
securities
transactions
allocated
from
affiliated
Master
Portfolios | | Net
change in
unrealized
gains
(losses) on
securities
transactions
allocated
from
affiliated
Master
Portfolios | | Interest
allocated
from
affiliated
Master
Portfolios | | Dividends
allocated
from
affiliated
Master
Portfolios | | Affiliated
income
allocated
from
affiliated
Master
Portfolios | | Value,
end of
period | |
| Wells Fargo Bloomberg Barclays US Aggregate ex-Corporate Portfolio | 0.03% | 0.04% | $ 830 | | $ 13 | | $ 1,158 | | $ 0 | | $ 4 | | $ 222,468 | |
| Wells Fargo Emerging Markets Bond Portfolio | 0.05 | 0.05 | (258) | | 622 | | 363 | | 0 | | 0 | | 18,840 | |
| Wells Fargo Factor Enhanced Emerging Markets Equity Portfolio | 0.33 | 0.36 | 30,443 | | (39,689) | | 0 | | 9,937 | | 3 | | 668,848 | |
| Wells Fargo Factor Enhanced International Equity Portfolio | 0.28 | 0.30 | 150,134 | | 22,994 | | 0 | | 38,413 | | 6 | | 2,179,792 | |
| Wells Fargo Factor Enhanced U.S. Large Cap Equity Portfolio | 0.37 | 0.40 | 454,519 | | 88,762 | | 0 | | 22,628 | | 13 | | 3,396,067 | |
| Wells Fargo Factor Enhanced U.S. Small Cap Equity Portfolio | 0.37 | 0.38 | 158,421 | | (117,076) | | 0 | | 4,207 | | 4 | | 846,396 | |
| Wells Fargo High Yield Corporate Bond Portfolio | 0.03 | 0.04 | 192 | | 7 | | 405 | | 0 | | 0 | | 18,805 | |
| Wells Fargo Investment Grade Corporate Bond Portfolio | 0.05 | 0.05 | 1,308 | | 72 | | 1,496 | | 0 | | 0 | | 115,578 | |
| Wells Fargo U.S. REIT Portfolio | 0.03 | 0.03 | 855 | | 889 | | 0 | | 115 | | 0 | | 8,100 | |
| | | | $796,444 | | $ (43,406) | | $3,422 | | $75,300 | | $30 | | $7,474,894 | |
The accompanying notes are an integral part of these financial statements.
54 | Target Date Retirement Funds
Portfolio of investments—August 31, 2021 (unaudited)
Futures contracts
| Description | Number of
contracts | Expiration
date | Notional
cost | Notional
value | Unrealized
gains | | Unrealized
losses |
| Long | | | | | | | |
| New Zealand Dollar Futures | 3 | 9-13-2021 | $ 208,924 | $ 211,695 | $ 2,771 | | $ 0 |
| E-Mini S&P 500 Index | 1 | 9-17-2021 | 211,835 | 226,025 | 14,190 | | 0 |
| MSCI Emerging Markets Index | 1 | 9-17-2021 | 68,732 | 64,960 | 0 | | (3,772) |
| Short | | | | | | | |
| Euro FX Futures | (2) | 9-13-2021 | (297,909) | (295,388) | 2,521 | | 0 |
| | | | | | $19,482 | | $(3,772) |
The accompanying notes are an integral part of these financial statements.
Target Date Retirement Funds | 55
Statements of assets and liabilities—August 31, 2021 (unaudited)
| | Dynamic Target
Today Fund | Dynamic Target
2015 Fund | Dynamic Target
2020 Fund |
| Assets | | | |
Investments in affiliated Master Portfolios, at value (see cost below)
| $ 7,378,215 | $ 6,762,257 | $ 8,259,542 |
Cash
| 10,000 | 10,000 | 10,000 |
Cash at broker segregated for futures contracts
| 21,999 | 22,000 | 23,000 |
Receivable from manager
| 8,673 | 8,704 | 8,326 |
Receivable for daily variation margin on open futures contracts
| 2,068 | 1,550 | 2,070 |
Receivable for Fund shares sold
| 54 | 0 | 0 |
Prepaid expenses and other assets
| 50,913 | 30,820 | 33,535 |
Total assets
| 7,471,922 | 6,835,331 | 8,336,473 |
| Liabilities | | | |
Professional fees payable
| 17,973 | 23,101 | 12,052 |
Trustees’ fees and expenses payable
| 1,677 | 1,737 | 1,737 |
Custodian and accounting fee payable
| 1,518 | 1,626 | 1,645 |
Payable for Fund shares redeemed
| 487 | 0 | 0 |
Administration fees payable
| 317 | 302 | 485 |
Distribution fee payable
| 16 | 14 | 37 |
Shareholder report expenses payable
| 0 | 1,265 | 0 |
Accrued expenses and other liabilities
| 1,712 | 3,538 | 2,463 |
Total liabilities
| 23,700 | 31,583 | 18,419 |
Total net assets
| $7,448,222 | $6,803,748 | $8,318,054 |
| Net assets consist of | | | |
Paid-in capital
| $ 6,091,144 | $ 5,447,873 | $ 6,529,337 |
Total distributable earnings
| 1,357,078 | 1,355,875 | 1,788,717 |
Total net assets
| $7,448,222 | $6,803,748 | $8,318,054 |
| Computation of net asset value and offering price per share | | | |
Net assets – Class A
| $ 671,968 | $ 697,103 | $ 1,632,441 |
Shares outstanding – Class A1
| 55,268 | 56,638 | 129,719 |
Net asset value per share – Class A
| $12.16 | $12.31 | $12.58 |
Maximum offering price per share – Class A2
| $12.90 | $13.06 | $13.35 |
Net assets – Class C
| $ 137,438 | $ 125,543 | $ 167,118 |
Shares outstanding – Class C1
| 11,274 | 10,180 | 13,228 |
Net asset value per share – Class C
| $12.19 | $12.33 | $12.63 |
Net assets – Class R4
| $ 125,304 | $ 126,892 | $ 131,333 |
Shares outstanding – Class R41
| 10,279 | 10,296 | 10,356 |
Net asset value per share – Class R4
| $12.19 | $12.32 | $12.68 |
Net assets – Class R6
| $ 6,513,512 | $ 5,854,210 | $ 6,387,162 |
Shares outstanding – Class R61
| 533,703 | 474,416 | 502,936 |
Net asset value per share – Class R6
| $12.20 | $12.34 | $12.70 |
Investments in affiliated Master Portfolios, at cost
| $ 6,556,352 | $ 5,944,284 | $ 7,196,226 |
| 1 | Each Fund has an unlimited number of authorized shares |
| 2 | Maximum offering price is computed as 100/94.25 of net asset value. On investments of $50,000 or more, the offering price is reduced. |
The accompanying notes are an integral part of these financial statements.
56 | Target Date Retirement Funds
Statements of assets and liabilities—August 31, 2021 (unaudited)
| | Dynamic Target
2025 Fund | Dynamic Target
2030 Fund | Dynamic Target
2035 Fund |
| Assets | | | |
Investments in affiliated Master Portfolios, at value (see cost below)
| $ 13,698,676 | $ 13,727,827 | $ 12,536,087 |
Cash
| 10,000 | 10,000 | 10,000 |
Cash at broker segregated for futures contracts
| 41,000 | 30,200 | 28,200 |
Receivable from manager
| 7,930 | 8,609 | 8,371 |
Receivable for daily variation margin on open futures contracts
| 3,571 | 3,807 | 3,419 |
Receivable for Fund shares sold
| 1,274 | 270 | 0 |
Prepaid expenses and other assets
| 21,215 | 29,579 | 27,827 |
Total assets
| 13,783,666 | 13,810,292 | 12,613,904 |
| Liabilities | | | |
Professional fees payable
| 15,970 | 15,663 | 13,627 |
Trustees’ fees and expenses payable
| 1,778 | 1,848 | 1,848 |
Custodian and accounting fee payable
| 2,544 | 2,276 | 1,361 |
Administration fees payable
| 1,201 | 1,101 | 628 |
Distribution fee payable
| 20 | 19 | 23 |
Shareholder report expenses payable
| 1,607 | 923 | 943 |
Accrued expenses and other liabilities
| 2,280 | 1,999 | 1,328 |
Total liabilities
| 25,400 | 23,829 | 19,758 |
Total net assets
| $13,758,266 | $13,786,463 | $12,594,146 |
| Net assets consist of | | | |
Paid-in capital
| $ 10,712,797 | $ 10,586,892 | $ 9,352,005 |
Total distributable earnings
| 3,045,469 | 3,199,571 | 3,242,141 |
Total net assets
| $13,758,266 | $13,786,463 | $12,594,146 |
| Computation of net asset value and offering price per share | | | |
Net assets – Class A
| $ 4,968,776 | $ 4,667,926 | $ 1,847,343 |
Shares outstanding – Class A1
| 374,151 | 347,388 | 136,309 |
Net asset value per share – Class A
| $13.28 | $13.44 | $13.55 |
Maximum offering price per share – Class A2
| $14.09 | $14.26 | $14.38 |
Net assets – Class C
| $ 143,807 | $ 143,307 | $ 150,840 |
Shares outstanding – Class C1
| 10,780 | 10,632 | 11,074 |
Net asset value per share – Class C
| $13.34 | $13.48 | $13.62 |
Net assets – Class R4
| $ 138,377 | $ 140,703 | $ 142,039 |
Shares outstanding – Class R41
| 10,347 | 10,369 | 10,388 |
Net asset value per share – Class R4
| $13.37 | $13.57 | $13.67 |
Net assets – Class R6
| $ 8,507,306 | $ 8,834,527 | $ 10,453,924 |
Shares outstanding – Class R61
| 635,280 | 650,043 | 763,328 |
Net asset value per share – Class R6
| $13.39 | $13.59 | $13.70 |
Investments in affiliated Master Portfolios, at cost
| $ 12,078,332 | $ 12,033,715 | $ 10,803,025 |
| 1 | Each Fund has an unlimited number of authorized shares |
| 2 | Maximum offering price is computed as 100/94.25 of net asset value. On investments of $50,000 or more, the offering price is reduced. |
The accompanying notes are an integral part of these financial statements.
Target Date Retirement Funds | 57
Statements of assets and liabilities—August 31, 2021 (unaudited)
| | Dynamic Target
2040 Fund | Dynamic Target
2045 Fund | Dynamic Target
2050 Fund |
| Assets | | | |
Investments in affiliated Master Portfolios, at value (see cost below)
| $ 10,783,866 | $ 8,816,855 | $ 7,975,016 |
Cash
| 10,000 | 10,000 | 10,000 |
Cash at broker segregated for futures contracts
| 28,000 | 22,000 | 21,999 |
Receivable from manager
| 7,541 | 7,603 | 8,770 |
Receivable for daily variation margin on open futures contracts
| 3,401 | 2,067 | 2,068 |
Receivable for Fund shares sold
| 11,130 | 1,623 | 866 |
Prepaid expenses and other assets
| 28,084 | 43,841 | 34,403 |
Total assets
| 10,872,022 | 8,903,989 | 8,053,122 |
| Liabilities | | | |
Professional fees payable
| 12,344 | 13,297 | 14,447 |
Trustees’ fees and expenses payable
| 2,031 | 1,737 | 1,715 |
Custodian and accounting fee payable
| 2,337 | 2,352 | 1,491 |
Payable for Fund shares redeemed
| 0 | 12 | 10 |
Administration fees payable
| 863 | 371 | 304 |
Distribution fee payable
| 21 | 34 | 28 |
Shareholder report expenses payable
| 774 | 31,268 | 834 |
Accrued expenses and other liabilities
| 3,247 | 2,618 | 1,742 |
Total liabilities
| 21,617 | 51,689 | 20,571 |
Total net assets
| $10,850,405 | $8,852,300 | $8,032,551 |
| Net assets consist of | | | |
Paid-in capital
| $ 7,896,405 | $ 6,324,180 | $ 5,719,594 |
Total distributable earnings
| 2,954,000 | 2,528,120 | 2,312,957 |
Total net assets
| $10,850,405 | $8,852,300 | $8,032,551 |
| Computation of net asset value and offering price per share | | | |
Net assets – Class A
| $ 3,742,366 | $ 795,901 | $ 481,678 |
Shares outstanding – Class A1
| 278,081 | 58,667 | 35,220 |
Net asset value per share – Class A
| $13.46 | $13.57 | $13.68 |
Maximum offering price per share – Class A2
| $14.28 | $14.40 | $14.51 |
Net assets – Class C
| $ 146,880 | $ 164,196 | $ 154,512 |
Shares outstanding – Class C1
| 10,852 | 12,067 | 11,296 |
Net asset value per share – Class C
| $13.53 | $13.61 | $13.68 |
Net assets – Class R4
| $ 141,338 | $ 142,484 | $ 143,273 |
Shares outstanding – Class R41
| 10,387 | 10,408 | 10,410 |
Net asset value per share – Class R4
| $13.61 | $13.69 | $13.76 |
Net assets – Class R6
| $ 6,819,821 | $ 7,749,719 | $ 7,253,088 |
Shares outstanding – Class R61
| 500,416 | 565,028 | 526,165 |
Net asset value per share – Class R6
| $13.63 | $13.72 | $13.78 |
Investments in affiliated Master Portfolios, at cost
| $ 9,093,769 | $ 7,350,128 | $ 6,616,087 |
| 1 | Each Fund has an unlimited number of authorized shares |
| 2 | Maximum offering price is computed as 100/94.25 of net asset value. On investments of $50,000 or more, the offering price is reduced. |
The accompanying notes are an integral part of these financial statements.
58 | ��Target Date Retirement Funds
Statements of assets and liabilities—August 31, 2021 (unaudited)
| | Dynamic Target
2055 Fund | Dynamic Target
2060 Fund |
| Assets | | |
Investments in affiliated Master Portfolios, at value (see cost below)
| $ 8,284,301 | $ 7,474,894 |
Cash
| 10,000 | 10,000 |
Cash at broker segregated for futures contracts
| 22,000 | 23,000 |
Receivable from manager
| 8,338 | 8,412 |
Receivable for daily variation margin on open futures contracts
| 2,067 | 2,065 |
Receivable for Fund shares sold
| 214 | 407 |
Prepaid expenses and other assets
| 37,960 | 35,047 |
Total assets
| 8,364,880 | 7,553,825 |
| Liabilities | | |
Professional fees payable
| 15,429 | 15,441 |
Trustees’ fees and expenses payable
| 1,732 | 1,732 |
Custodian and accounting fee payable
| 1,373 | 1,586 |
Administration fees payable
| 317 | 290 |
Distribution fee payable
| 29 | 20 |
Shareholder report expenses payable
| 885 | 0 |
Accrued expenses and other liabilities
| 978 | 1,635 |
Total liabilities
| 20,743 | 20,704 |
Total net assets
| $8,344,137 | $7,533,121 |
| Net assets consist of | | |
Paid-in capital
| $ 5,936,827 | $ 5,350,565 |
Total distributable earnings
| 2,407,310 | 2,182,556 |
Total net assets
| $8,344,137 | $7,533,121 |
| Computation of net asset value and offering price per share | | |
Net assets – Class A
| $ 502,192 | $ 475,948 |
Shares outstanding – Class A1
| 36,614 | 34,839 |
Net asset value per share – Class A
| $13.72 | $13.66 |
Maximum offering price per share – Class A2
| $14.56 | $14.49 |
Net assets – Class C
| $ 162,588 | $ 141,430 |
Shares outstanding – Class C1
| 11,852 | 10,318 |
Net asset value per share – Class C
| $13.72 | $13.71 |
Net assets – Class R4
| $ 143,740 | $ 143,769 |
Shares outstanding – Class R41
| 10,413 | 10,424 |
Net asset value per share – Class R4
| $13.80 | $13.79 |
Net assets – Class R6
| $ 7,535,617 | $ 6,771,974 |
Shares outstanding – Class R61
| 545,267 | 490,255 |
Net asset value per share – Class R6
| $13.82 | $13.81 |
Investments in affiliated Master Portfolios, at cost
| $ 6,884,200 | $ 6,166,572 |
| 1 | Each Fund has an unlimited number of authorized shares |
| 2 | Maximum offering price is computed as 100/94.25 of net asset value. On investments of $50,000 or more, the offering price is reduced. |
The accompanying notes are an integral part of these financial statements.
Target Date Retirement Funds | 59
Statements of operations—six months ended August 31, 2021 (unaudited)
| | Dynamic Target
Today Fund | Dynamic Target
2015 Fund | Dynamic Target
2020 Fund |
| Investment income | | | |
Interest allocated from affiliated Master Portfolios
| $ 52,271 | $ 41,407 | $ 43,383 |
Dividends allocated from affiliated Master Portfolios*
| 31,738 | 34,134 | 47,607 |
Affiliated income allocated from affiliated Master Portfolios
| 52 | 44 | 49 |
Expenses allocated from affiliated Master Portfolios
| (5,769) | (5,462) | (6,914) |
Waivers allocated from affiliated Master Portfolios
| 2,278 | 2,156 | 2,728 |
Total investment income
| 80,570 | 72,279 | 86,853 |
| Expenses | | | |
Management fee
| 5,484 | 4,952 | 6,021 |
| Administration fees | | | |
Class A
| 735 | 695 | 1,611 |
Class C
| 136 | 129 | 171 |
Class R4
| 49 | 49 | 51 |
Class R6
| 954 | 854 | 930 |
| Shareholder servicing fees | | | |
Class A
| 873 | 827 | 1,918 |
Class C
| 160 | 153 | 203 |
Class R4
| 61 | 62 | 64 |
| Distribution fee | | | |
Class C
| 101 | 88 | 238 |
Custody and accounting fees
| 1,844 | 1,958 | 1,917 |
Professional fees
| 15,613 | 15,452 | 16,132 |
Registration fees
| 22,565 | 22,554 | 20,865 |
Shareholder report expenses
| 7,407 | 8,892 | 7,820 |
Trustees’ fees and expenses
| 9,715 | 9,715 | 9,715 |
Other fees and expenses
| 2,600 | 2,028 | 2,165 |
Total expenses
| 68,297 | 68,408 | 69,821 |
| Less: Fee waivers and/or expense reimbursements | | | |
Fund-level
| (60,276) | (61,289) | (59,685) |
Class A
| (83) | 0 | (77) |
Class R4
| (7) | (6) | (5) |
Class R6
| (954) | (854) | (930) |
Net expenses
| 6,977 | 6,259 | 9,124 |
Net investment income
| 73,593 | 66,020 | 77,729 |
| Realized and unrealized gains (losses) on investments | | | |
| Net realized gains on | | | |
Securities transactions allocated from affiliated Master Portfolios
| 370,640 | 389,251 | 536,628 |
Futures contracts
| 9,968 | 9,485 | 12,825 |
Net realized gains on investments
| 380,608 | 398,736 | 549,453 |
| Net change in unrealized gains (losses) on | | | |
Securities transactions allocated from affiliated Master Portfolios
| 22,888 | 21,413 | 32,531 |
Futures contracts
| 19,178 | 17,726 | 19,557 |
Net change in unrealized gains (losses) on investments
| 42,066 | 39,139 | 52,088 |
Net realized and unrealized gains (losses) on investments
| 422,674 | 437,875 | 601,541 |
Net increase in net assets resulting from operations
| $496,267 | $503,895 | $679,270 |
*Net of foreign dividend withholding taxes allocated from affiliated Master Portfolios in the amount of
| $2,010 | $2,153 | $3,023 |
The accompanying notes are an integral part of these financial statements.
60 | Target Date Retirement Funds
Statements of operations—six months ended August 31, 2021 (unaudited)
| | Dynamic Target
2025 Fund | Dynamic Target
2030 Fund | Dynamic Target
2035 Fund |
| Investment income | | | |
Interest allocated from affiliated Master Portfolios
| $ 54,298 | $ 34,765 | $ 24,913 |
Dividends allocated from affiliated Master Portfolios*
| 95,509 | 103,500 | 103,300 |
Affiliated income allocated from affiliated Master Portfolios
| 82 | 72 | 64 |
Expenses allocated from affiliated Master Portfolios
| (12,042) | (11,487) | (10,662) |
Waivers allocated from affiliated Master Portfolios
| 4,480 | 3,924 | 3,460 |
Total investment income
| 142,327 | 130,774 | 121,075 |
| Expenses | | | |
Management fee
| 10,248 | 9,706 | 9,001 |
| Administration fees | | | |
Class A
| 4,935 | 4,492 | 1,812 |
Class C
| 149 | 143 | 153 |
Class R4
| 54 | 54 | 55 |
Class R6
| 1,303 | 1,259 | 1,499 |
| Shareholder servicing fees | | | |
Class A
| 5,871 | 5,348 | 2,158 |
Class C
| 178 | 170 | 178 |
Class R4
| 67 | 68 | 69 |
| Distribution fee | | | |
Class C
| 151 | 132 | 153 |
Custody and accounting fees
| 1,952 | 1,952 | 1,952 |
Professional fees
| 15,491 | 15,228 | 15,127 |
Registration fees
| 16,058 | 19,337 | 17,892 |
Shareholder report expenses
| 8,769 | 9,072 | 9,119 |
Trustees’ fees and expenses
| 9,715 | 9,715 | 9,715 |
Other fees and expenses
| 1,999 | 1,973 | 1,986 |
Total expenses
| 76,940 | 78,649 | 70,869 |
| Less: Fee waivers and/or expense reimbursements | | | |
Fund-level
| (56,487) | (60,294) | (58,458) |
Class A
| (303) | 0 | (94) |
Class R4
| (15) | (10) | (14) |
Class R6
| (1,303) | (1,259) | (1,499) |
Net expenses
| 18,832 | 17,086 | 10,804 |
Net investment income
| 123,495 | 113,688 | 110,271 |
| Realized and unrealized gains (losses) on investments | | | |
| Net realized gains on | | | |
Securities transactions allocated from affiliated Master Portfolios
| 1,067,206 | 1,148,990 | 1,144,738 |
Futures contracts
| 40,353 | 26,303 | 24,049 |
Net realized gains on investments
| 1,107,559 | 1,175,293 | 1,168,787 |
| Net change in unrealized gains (losses) on | | | |
Securities transactions allocated from affiliated Master Portfolios
| (9,137) | (47,528) | (57,324) |
Futures contracts
| 35,443 | 21,253 | 18,121 |
Net change in unrealized gains (losses) on investments
| 26,306 | (26,275) | (39,203) |
Net realized and unrealized gains (losses) on investments
| 1,133,865 | 1,149,018 | 1,129,584 |
Net increase in net assets resulting from operations
| $1,257,360 | $1,262,706 | $1,239,855 |
*Net of foreign dividend withholding taxes allocated from affiliated Master Portfolios in the amount of
| $6,439 | $7,428 | $7,738 |
The accompanying notes are an integral part of these financial statements.
Target Date Retirement Funds | 61
Statements of operations—six months ended August 31, 2021 (unaudited)
| | Dynamic Target
2040 Fund | Dynamic Target
2045 Fund | Dynamic Target
2050 Fund |
| Investment income | | | |
Interest allocated from affiliated Master Portfolios
| $ 16,050 | $ 8,680 | $ 3,653 |
Dividends allocated from affiliated Master Portfolios*
| 96,315 | 84,740 | 80,074 |
Affiliated income allocated from affiliated Master Portfolios
| 51 | 39 | 32 |
Expenses allocated from affiliated Master Portfolios
| (9,491) | (8,008) | (7,303) |
Waivers allocated from affiliated Master Portfolios
| 3,074 | 2,577 | 2,337 |
Total investment income
| 105,999 | 88,028 | 78,793 |
| Expenses | | | |
Management fee
| 7,813 | 6,435 | 5,763 |
| Administration fees | | | |
Class A
| 3,765 | 839 | 466 |
Class C
| 148 | 165 | 156 |
Class R4
| 55 | 55 | 55 |
Class R6
| 983 | 1,123 | 1,043 |
| Shareholder servicing fees | | | |
Class A
| 4,482 | 999 | 554 |
Class C
| 173 | 197 | 186 |
Class R4
| 68 | 69 | 69 |
| Distribution fee | | | |
Class C
| 148 | 225 | 195 |
Custody and accounting fees
| 1,952 | 1,952 | 1,952 |
Professional fees
| 14,828 | 14,838 | 14,995 |
Registration fees
| 15,034 | 16,682 | 19,995 |
Shareholder report expenses
| 8,991 | 6,788 | 9,003 |
Trustees’ fees and expenses
| 9,715 | 9,715 | 9,715 |
Other fees and expenses
| 2,374 | 2,269 | 2,441 |
Total expenses
| 70,529 | 62,351 | 66,588 |
| Less: Fee waivers and/or expense reimbursements | | | |
Fund-level
| (55,387) | (54,256) | (60,037) |
Class A
| 0 | (106) | 0 |
Class R4
| (13) | (17) | (19) |
Class R6
| (983) | (1,123) | (1,043) |
Net expenses
| 14,146 | 6,849 | 5,489 |
Net investment income
| 91,853 | 81,179 | 73,304 |
| Realized and unrealized gains (losses) on investments | | | |
| Net realized gains on | | | |
Securities transactions allocated from affiliated Master Portfolios
| 1,045,131 | 909,258 | 847,867 |
Futures contracts
| 15,006 | 9,985 | 12,966 |
Net realized gains on investments
| 1,060,137 | 919,243 | 860,833 |
| Net change in unrealized gains (losses) on | | | |
Securities transactions allocated from affiliated Master Portfolios
| (55,204) | (47,877) | (49,391) |
Futures contracts
| 22,373 | 22,714 | 22,046 |
Net change in unrealized gains (losses) on investments
| (32,831) | (25,163) | (27,345) |
Net realized and unrealized gains (losses) on investments
| 1,027,306 | 894,080 | 833,488 |
Net increase in net assets resulting from operations
| $1,119,159 | $975,259 | $906,792 |
*Net of foreign dividend withholding taxes allocated from affiliated Master Portfolios in the amount of
| $7,337 | $6,515 | $6,190 |
The accompanying notes are an integral part of these financial statements.
62 | Target Date Retirement Funds
Statements of operations—six months ended August 31, 2021 (unaudited)
| | Dynamic Target
2055 Fund | Dynamic Target
2060 Fund |
| Investment income | | |
Interest allocated from affiliated Master Portfolios
| $ 3,767 | $ 3,422 |
Dividends allocated from affiliated Master Portfolios*
| 82,738 | 75,300 |
Affiliated income allocated from affiliated Master Portfolios
| 32 | 30 |
Expenses allocated from affiliated Master Portfolios
| (7,546) | (6,872) |
Waivers allocated from affiliated Master Portfolios
| 2,414 | 2,205 |
Total investment income
| 81,405 | 74,085 |
| Expenses | | |
Management fee
| 5,957 | 5,416 |
| Administration fees | | |
Class A
| 494 | 495 |
Class C
| 162 | 143 |
Class R4
| 55 | 55 |
Class R6
| 1,077 | 971 |
| Shareholder servicing fees | | |
Class A
| 588 | 589 |
Class C
| 188 | 170 |
Class R4
| 69 | 69 |
| Distribution fee | | |
Class C
| 194 | 146 |
Custody and accounting fees
| 1,952 | 1,952 |
Professional fees
| 15,007 | 15,018 |
Registration fees
| 19,766 | 19,837 |
Shareholder report expenses
| 9,028 | 7,808 |
Trustees’ fees and expenses
| 9,715 | 9,715 |
Other fees and expenses
| 2,246 | 2,109 |
Total expenses
| 66,498 | 64,493 |
| Less: Fee waivers and/or expense reimbursements | | |
Fund-level
| (59,704) | (58,240) |
Class R4
| (20) | (18) |
Class R6
| (1,077) | (971) |
Net expenses
| 5,697 | 5,264 |
Net investment income
| 75,708 | 68,821 |
| Realized and unrealized gains (losses) on investments | | |
| Net realized gains on | | |
Securities transactions allocated from affiliated Master Portfolios
| 875,380 | 796,444 |
Futures contracts
| 6,721 | 12,891 |
Net realized gains on investments
| 882,101 | 809,335 |
| Net change in unrealized gains (losses) on | | |
Securities transactions allocated from affiliated Master Portfolios
| (48,835) | (43,406) |
Futures contracts
| 22,334 | 18,919 |
Net change in unrealized gains (losses) on investments
| (26,501) | (24,487) |
Net realized and unrealized gains (losses) on investments
| 855,600 | 784,848 |
Net increase in net assets resulting from operations
| $931,308 | $853,669 |
*Net of foreign dividend withholding taxes allocated from affiliated Master Portfolios in the amount of
| $6,389 | $5,811 |
The accompanying notes are an integral part of these financial statements.
Target Date Retirement Funds | 63
Statements of changes in net assets
| | Dynamic Target Today Fund |
| | Six months ended
August 31, 2021
(unaudited) | Year ended
February 28, 2021 |
| Operations | | | | |
Net investment income
| | $ 73,593 | | $ 132,102 |
Payment from affiliate
| | 0 | | 1,648 |
Net realized gains on investments
| | 380,608 | | 209,607 |
Net change in unrealized gains (losses) on investments
| | 42,066 | | 463,636 |
Net increase in net assets resulting from operations
| | 496,267 | | 806,993 |
| Distributions to shareholders from | | | | |
| Net investment income and net realized gains | | | | |
Class A
| | 0 | | (34,876) |
Class C
| | 0 | | (4,227) |
Class R4
| | 0 | | (4,908) |
Class R6
| | 0 | | (262,818) |
Total distributions to shareholders
| | 0 | | (306,829) |
| Capital share transactions | Shares | | Shares | |
| Proceeds from shares sold | | | | |
Class A
| 7,884 | 91,214 | 15,550 | 172,874 |
Class C
| 927 | 11,000 | 316 | 3,500 |
Class R6
| 4,486 | 52,734 | 16,865 | 180,112 |
| | | 154,948 | | 356,486 |
| Reinvestment of distributions | | | | |
Class A
| 0 | 0 | 2,679 | 30,376 |
Class C
| 0 | 0 | 10 | 109 |
Class R6
| 0 | 0 | 2,541 | 28,872 |
| | | 0 | | 59,357 |
| Payment for shares redeemed | | | | |
Class A
| (10,804) | (128,170) | (56,424) | (631,348) |
Class C
| (90) | (1,050) | (52) | (574) |
Class R6
| (5,553) | (65,300) | (6,783) | (75,511) |
| | | (194,520) | | (707,433) |
Net decrease in net assets resulting from capital share transactions
| | (39,572) | | (291,590) |
Total increase in net assets
| | 456,695 | | 208,574 |
| Net assets | | | | |
Beginning of period
| | 6,991,527 | | 6,782,953 |
End of period
| | $7,448,222 | | $6,991,527 |
The accompanying notes are an integral part of these financial statements.
64 | Target Date Retirement Funds
Statements of changes in net assets
| | Dynamic Target 2015 Fund |
| | Six months ended
August 31, 2021
(unaudited) | Year ended
February 28, 2021 |
| Operations | | | | |
Net investment income
| | $ 66,020 | | $ 109,378 |
Payment from affiliate
| | 0 | | 1,699 |
Net realized gains on investments
| | 398,736 | | 176,579 |
Net change in unrealized gains (losses) on investments
| | 39,139 | | 457,272 |
Net increase in net assets resulting from operations
| | 503,895 | | 744,928 |
| Distributions to shareholders from | | | | |
| Net investment income and net realized gains | | | | |
Class A
| | 0 | | (13,767) |
Class C
| | 0 | | (2,965) |
Class R4
| | 0 | | (3,742) |
Class R6
| | 0 | | (180,070) |
Total distributions to shareholders
| | 0 | | (200,544) |
| Capital share transactions | Shares | | Shares | |
| Proceeds from shares sold | | | | |
Class A
| 6,436 | 75,682 | 15,447 | 172,588 |
Class R6
| 15 | 176 | 19 | 208 |
| | | 75,858 | | 172,796 |
| Reinvestment of distributions | | | | |
Class A
| 0 | 0 | 919 | 10,377 |
| Payment for shares redeemed | | | | |
Class A
| (461) | (5,604) | (9,938) | (107,011) |
Class R6
| (34) | (409) | 0 | 0 |
| | | (6,013) | | (107,011) |
Net increase in net assets resulting from capital share transactions
| | 69,845 | | 76,162 |
Total increase in net assets
| | 573,740 | | 620,546 |
| Net assets | | | | |
Beginning of period
| | 6,230,008 | | 5,609,462 |
End of period
| | $6,803,748 | | $6,230,008 |
The accompanying notes are an integral part of these financial statements.
Target Date Retirement Funds | 65
Statements of changes in net assets
| | Dynamic Target 2020 Fund |
| | Six months ended
August 31, 2021
(unaudited) | Year ended
February 28, 2021 |
| Operations | | | | |
Net investment income
| | $ 77,729 | | $ 123,306 |
Payment from affiliate
| | 0 | | 1,768 |
Net realized gains on investments
| | 549,453 | | 186,024 |
Net change in unrealized gains (losses) on investments
| | 52,088 | | 709,753 |
Net increase in net assets resulting from operations
| | 679,270 | | 1,020,851 |
| Distributions to shareholders from | | | | |
| Net investment income and net realized gains | | | | |
Class A
| | 0 | | (33,648) |
Class C
| | 0 | | (2,781) |
Class R4
| | 0 | | (2,881) |
Class R6
| | 0 | | (148,499) |
Total distributions to shareholders
| | 0 | | (187,809) |
| Capital share transactions | Shares | | Shares | |
| Proceeds from shares sold | | | | |
Class A
| 20,776 | 249,531 | 66,041 | 695,433 |
Class C
| 0 | 0 | 2,924 | 30,529 |
Class R6
| 2,429 | 29,682 | 11,502 | 127,813 |
| | | 279,213 | | 853,775 |
| Reinvestment of distributions | | | | |
Class A
| 0 | 0 | 2,728 | 31,068 |
Class C
| 0 | 0 | 54 | 619 |
Class R6
| 0 | 0 | 701 | 8,031 |
| | | 0 | | 39,718 |
| Payment for shares redeemed | | | | |
Class A
| (16,223) | (193,260) | (83,209) | (862,514) |
Class R6
| (5,066) | (61,166) | (1,409) | (15,434) |
| | | (254,426) | | (877,948) |
Net increase in net assets resulting from capital share transactions
| | 24,787 | | 15,545 |
Total increase in net assets
| | 704,057 | | 848,587 |
| Net assets | | | | |
Beginning of period
| | 7,613,997 | | 6,765,410 |
End of period
| | $8,318,054 | | $7,613,997 |
The accompanying notes are an integral part of these financial statements.
66 | Target Date Retirement Funds
Statements of changes in net assets
| | Dynamic Target 2025 Fund |
| | Six months ended
August 31, 2021
(unaudited) | Year ended
February 28, 2021 |
| Operations | | | | |
Net investment income
| | $ 123,495 | | $ 177,049 |
Payment from affiliate
| | 0 | | 1,794 |
Net realized gains on investments
| | 1,107,559 | | 338,764 |
Net change in unrealized gains (losses) on investments
| | 26,306 | | 1,261,073 |
Net increase in net assets resulting from operations
| | 1,257,360 | | 1,778,680 |
| Distributions to shareholders from | | | | |
| Net investment income and net realized gains | | | | |
Class A
| | 0 | | (53,176) |
Class C
| | 0 | | (2,039) |
Class R4
| | 0 | | (2,712) |
Class R6
| | 0 | | (179,812) |
Total distributions to shareholders
| | 0 | | (237,739) |
| Capital share transactions | Shares | | Shares | |
| Proceeds from shares sold | | | | |
Class A
| 119,159 | 1,511,896 | 116,622 | 1,344,924 |
Class C
| 0 | 0 | 51 | 525 |
Class R6
| 89,813 | 1,167,124 | 107,559 | 1,237,908 |
| | | 2,679,020 | | 2,583,357 |
| Reinvestment of distributions | | | | |
Class A
| 0 | 0 | 4,302 | 50,847 |
Class C
| 0 | 0 | 17 | 207 |
Class R6
| 0 | 0 | 3,949 | 46,939 |
| | | 0 | | 97,993 |
| Payment for shares redeemed | | | | |
Class A
| (54,863) | (709,081) | (86,608) | (945,150) |
Class C
| (468) | (6,000) | (915) | (10,088) |
Class R6
| (109,048) | (1,427,972) | (93,340) | (1,026,249) |
| | | (2,143,053) | | (1,981,487) |
Net increase in net assets resulting from capital share transactions
| | 535,967 | | 699,863 |
Total increase in net assets
| | 1,793,327 | | 2,240,804 |
| Net assets | | | | |
Beginning of period
| | 11,964,939 | | 9,724,135 |
End of period
| | $13,758,266 | | $11,964,939 |
The accompanying notes are an integral part of these financial statements.
Target Date Retirement Funds | 67
Statements of changes in net assets
| | Dynamic Target 2030 Fund |
| | Six months ended
August 31, 2021
(unaudited) | Year ended
February 28, 2021 |
| Operations | | | | |
Net investment income
| | $ 113,688 | | $ 155,795 |
Payment from affiliate
| | 0 | | 1,378 |
Net realized gains on investments
| | 1,175,293 | | 424,253 |
Net change in unrealized gains (losses) on investments
| | (26,275) | | 1,388,568 |
Net increase in net assets resulting from operations
| | 1,262,706 | | 1,969,994 |
| Distributions to shareholders from | | | | |
| Net investment income and net realized gains | | | | |
Class A
| | 0 | | (54,874) |
Class C
| | 0 | | (1,660) |
Class R4
| | 0 | | (2,422) |
Class R6
| | 0 | | (151,909) |
Total distributions to shareholders
| | 0 | | (210,865) |
| Capital share transactions | Shares | | Shares | |
| Proceeds from shares sold | | | | |
Class A
| 100,948 | 1,298,574 | 104,999 | 1,147,351 |
Class C
| 329 | 4,315 | 0 | 0 |
Class R6
| 68,626 | 898,799 | 66,690 | 760,708 |
| | | 2,201,688 | | 1,908,059 |
| Reinvestment of distributions | | | | |
Class A
| 0 | 0 | 4,300 | 50,872 |
Class R6
| 0 | 0 | 2,715 | 32,386 |
| | | 0 | | 83,258 |
| Payment for shares redeemed | | | | |
Class A
| (28,388) | (374,447) | (63,595) | (705,738) |
Class R6
| (31,188) | (409,600) | (696) | (7,969) |
| | | (784,047) | | (713,707) |
Net increase in net assets resulting from capital share transactions
| | 1,417,641 | | 1,277,610 |
Total increase in net assets
| | 2,680,347 | | 3,036,739 |
| Net assets | | | | |
Beginning of period
| | 11,106,116 | | 8,069,377 |
End of period
| | $13,786,463 | | $11,106,116 |
The accompanying notes are an integral part of these financial statements.
68 | Target Date Retirement Funds
Statements of changes in net assets
| | Dynamic Target 2035 Fund |
| | Six months ended
August 31, 2021
(unaudited) | Year ended
February 28, 2021 |
| Operations | | | | |
Net investment income
| | $ 110,271 | | $ 155,122 |
Payment from affiliate
| | 0 | | 1,801 |
Net realized gains on investments
| | 1,168,787 | | 415,473 |
Net change in unrealized gains (losses) on investments
| | (39,203) | | 1,491,216 |
Net increase in net assets resulting from operations
| | 1,239,855 | | 2,063,612 |
| Distributions to shareholders from | | | | |
| Net investment income and net realized gains | | | | |
Class A
| | 0 | | (17,069) |
Class C
| | 0 | | (1,296) |
Class R4
| | 0 | | (1,987) |
Class R6
| | 0 | | (152,324) |
Total distributions to shareholders
| | 0 | | (172,676) |
| Capital share transactions | Shares | | Shares | |
| Proceeds from shares sold | | | | |
Class A
| 22,851 | 292,088 | 71,273 | 799,559 |
Class C
| 97 | 1,280 | 232 | 2,531 |
Class R6
| 27,111 | 354,414 | 81,138 | 895,886 |
| | | 647,782 | | 1,697,976 |
| Reinvestment of distributions | | | | |
Class A
| 0 | 0 | 1,291 | 15,307 |
Class C
| 0 | 0 | 7 | 80 |
Class R6
| 0 | 0 | 4,434 | 52,984 |
| | | 0 | | 68,371 |
| Payment for shares redeemed | | | | |
Class A
| (6,381) | (81,943) | (26,363) | (289,545) |
Class C
| 0 | 0 | (2) | (20) |
Class R6
| (9,438) | (124,114) | (16,428) | (179,192) |
| | | (206,057) | | (468,757) |
Net increase in net assets resulting from capital share transactions
| | 441,725 | | 1,297,590 |
Total increase in net assets
| | 1,681,580 | | 3,188,526 |
| Net assets | | | | |
Beginning of period
| | 10,912,566 | | 7,724,040 |
End of period
| | $12,594,146 | | $10,912,566 |
The accompanying notes are an integral part of these financial statements.
Target Date Retirement Funds | 69
Statements of changes in net assets
| | Dynamic Target 2040 Fund |
| | Six months ended
August 31, 2021
(unaudited) | Year ended
February 28, 2021 |
| Operations | | | | |
Net investment income
| | $ 91,853 | | $ 132,898 |
Payment from affiliate
| | 0 | | 1,690 |
Net realized gains on investments
| | 1,060,137 | | 335,617 |
Net change in unrealized gains (losses) on investments
| | (32,831) | | 1,470,019 |
Net increase in net assets resulting from operations
| | 1,119,159 | | 1,940,224 |
| Distributions to shareholders from | | | | |
| Net investment income and net realized gains | | | | |
Class A
| | 0 | | (45,099) |
Class C
| | 0 | | (1,273) |
Class R4
| | 0 | | (1,970) |
Class R6
| | 0 | | (101,687) |
Total distributions to shareholders
| | 0 | | (150,029) |
| Capital share transactions | Shares | | Shares | |
| Proceeds from shares sold | | | | |
Class A
| 14,362 | 184,710 | 90,234 | 890,249 |
Class C
| 191 | 2,520 | 328 | 3,357 |
Class R6
| 5,931 | 76,997 | 8,375 | 89,743 |
| | | 264,227 | | 983,349 |
| Reinvestment of distributions | | | | |
Class A
| 0 | 0 | 3,707 | 43,371 |
Class C
| 0 | 0 | 4 | 45 |
Class R6
| 0 | 0 | 280 | 3,308 |
| | | 0 | | 46,724 |
| Payment for shares redeemed | | | | |
Class A
| (7,832) | (101,017) | (11,520) | (125,598) |
Class C
| 0 | 0 | (2) | (20) |
Class R6
| (1,381) | (18,355) | (6,531) | (68,363) |
| | | (119,372) | | (193,981) |
Net increase in net assets resulting from capital share transactions
| | 144,855 | | 836,092 |
Total increase in net assets
| | 1,264,014 | | 2,626,287 |
| Net assets | | | | |
Beginning of period
| | 9,586,391 | | 6,960,104 |
End of period
| | $10,850,405 | | $9,586,391 |
The accompanying notes are an integral part of these financial statements.
70 | Target Date Retirement Funds
Statements of changes in net assets
| | Dynamic Target 2045 Fund |
| | Six months ended
August 31, 2021
(unaudited) | Year ended
February 28, 2021 |
| Operations | | | | |
Net investment income
| | $ 81,179 | | $ 115,081 |
Payment from affiliate
| | 0 | | 1,821 |
Net realized gains on investments
| | 919,243 | | 303,630 |
Net change in unrealized gains (losses) on investments
| | (25,163) | | 1,232,915 |
Net increase in net assets resulting from operations
| | 975,259 | | 1,653,447 |
| Distributions to shareholders from | | | | |
| Net investment income and net realized gains | | | | |
Class A
| | 0 | | (8,119) |
Class C
| | 0 | | (1,435) |
Class R4
| | 0 | | (2,023) |
Class R6
| | 0 | | (118,025) |
Total distributions to shareholders
| | 0 | | (129,602) |
| Capital share transactions | Shares | | Shares | |
| Proceeds from shares sold | | | | |
Class A
| 5,980 | 77,778 | 27,914 | 316,550 |
Class C
| 161 | 2,098 | 583 | 6,107 |
Class R6
| 17,514 | 228,322 | 16,337 | 174,096 |
| | | 308,198 | | 496,753 |
| Reinvestment of distributions | | | | |
Class A
| 0 | 0 | 546 | 6,380 |
Class C
| 0 | 0 | 15 | 180 |
Class R6
| 0 | 0 | 1,463 | 17,239 |
| | | 0 | | 23,799 |
| Payment for shares redeemed | | | | |
Class A
| (12,893) | (166,470) | (5,443) | (57,498) |
Class C
| 0 | 0 | (3) | (40) |
Class R6
| (17,541) | (231,793) | (6,182) | (63,617) |
| | | (398,263) | | (121,155) |
Net increase (decrease) in net assets resulting from capital share transactions
| | (90,065) | | 399,397 |
Total increase in net assets
| | 885,194 | | 1,923,242 |
| Net assets | | | | |
Beginning of period
| | 7,967,106 | | 6,043,864 |
End of period
| | $8,852,300 | | $7,967,106 |
The accompanying notes are an integral part of these financial statements.
Target Date Retirement Funds | 71
Statements of changes in net assets
| | Dynamic Target 2050 Fund |
| | Six months ended
August 31, 2021
(unaudited) | Year ended
February 28, 2021 |
| Operations | | | | |
Net investment income
| | $ 73,304 | | $ 100,934 |
Payment from affiliate
| | 0 | | 1,735 |
Net realized gains on investments
| | 860,833 | | 277,077 |
Net change in unrealized gains (losses) on investments
| | (27,345) | | 1,145,983 |
Net increase in net assets resulting from operations
| | 906,792 | | 1,525,729 |
| Distributions to shareholders from | | | | |
| Net investment income and net realized gains | | | | |
Class A
| | 0 | | (5,026) |
Class C
| | 0 | | (1,340) |
Class R4
| | 0 | | (1,983) |
Class R6
| | 0 | | (105,760) |
Total distributions to shareholders
| | 0 | | (114,109) |
| Capital share transactions | Shares | | Shares | |
| Proceeds from shares sold | | | | |
Class A
| 8,838 | 116,307 | 8,242 | 87,395 |
Class C
| 5 | 58 | 263 | 2,625 |
Class R6
| 12,432 | 161,692 | 16,652 | 181,746 |
| | | 278,057 | | 271,766 |
| Reinvestment of distributions | | | | |
Class A
| 0 | 0 | 283 | 3,307 |
Class C
| 0 | 0 | 10 | 115 |
Class R6
| 0 | 0 | 584 | 6,866 |
| | | 0 | | 10,288 |
| Payment for shares redeemed | | | | |
Class A
| (5,040) | (66,672) | (3,419) | (36,122) |
Class C
| 0 | 0 | (2) | (20) |
Class R6
| (4,001) | (54,185) | (3,000) | (33,593) |
| | | (120,857) | | (69,735) |
Net increase in net assets resulting from capital share transactions
| | 157,200 | | 212,319 |
Total increase in net assets
| | 1,063,992 | | 1,623,939 |
| Net assets | | | | |
Beginning of period
| | 6,968,559 | | 5,344,620 |
End of period
| | $8,032,551 | | $6,968,559 |
The accompanying notes are an integral part of these financial statements.
72 | Target Date Retirement Funds
Statements of changes in net assets
| | Dynamic Target 2055 Fund |
| | Six months ended
August 31, 2021
(unaudited) | Year ended
February 28, 2021 |
| Operations | | | | |
Net investment income
| | $ 75,708 | | $ 104,162 |
Payment from affiliate
| | 0 | | 1,693 |
Net realized gains on investments
| | 882,101 | | 303,713 |
Net change in unrealized gains (losses) on investments
| | (26,501) | | 1,192,728 |
Net increase in net assets resulting from operations
| | 931,308 | | 1,602,296 |
| Distributions to shareholders from | | | | |
| Net investment income and net realized gains | | | | |
Class A
| | 0 | | (5,783) |
Class C
| | 0 | | (1,336) |
Class R4
| | 0 | | (1,972) |
Class R6
| | 0 | | (108,542) |
Total distributions to shareholders
| | 0 | | (117,633) |
| Capital share transactions | Shares | | Shares | |
| Proceeds from shares sold | | | | |
Class A
| 6,327 | 83,692 | 11,351 | 118,670 |
Class C
| 457 | 6,000 | 971 | 10,676 |
Class R6
| 13,047 | 171,280 | 18,055 | 190,935 |
| | | 260,972 | | 320,281 |
| Reinvestment of distributions | | | | |
Class A
| 0 | 0 | 344 | 4,033 |
Class C
| 0 | 0 | 7 | 88 |
Class R6
| 0 | 0 | 862 | 10,153 |
| | | 0 | | 14,274 |
| Payment for shares redeemed | | | | |
Class A
| (4,297) | (56,614) | (1,828) | (19,612) |
Class C
| 0 | 0 | (2) | (20) |
Class R6
| (1,536) | (20,493) | (4,066) | (40,720) |
| | | (77,107) | | (60,352) |
Net increase in net assets resulting from capital share transactions
| | 183,865 | | 274,203 |
Total increase in net assets
| | 1,115,173 | | 1,758,866 |
| Net assets | | | | |
Beginning of period
| | 7,228,964 | | 5,470,098 |
End of period
| | $8,344,137 | | $7,228,964 |
The accompanying notes are an integral part of these financial statements.
Target Date Retirement Funds | 73
Statements of changes in net assets
| | Dynamic Target 2060 Fund |
| | Six months ended
August 31, 2021
(unaudited) | Year ended
February 28, 2021 |
| Operations | | | | |
Net investment income
| | $ 68,821 | | $ 96,484 |
Payment from affiliate
| | 0 | | 1,632 |
Net realized gains on investments
| | 809,335 | | 256,303 |
Net change in unrealized gains (losses) on investments
| | (24,487) | | 1,081,263 |
Net increase in net assets resulting from operations
| | 853,669 | | 1,435,682 |
| Distributions to shareholders from | | | | |
| Net investment income and net realized gains | | | | |
Class A
| | 0 | | (5,036) |
Class C
| | 0 | | (1,275) |
Class R4
| | 0 | | (2,015) |
Class R6
| | 0 | | (101,116) |
Total distributions to shareholders
| | 0 | | (109,442) |
| Capital share transactions | Shares | | Shares | |
| Proceeds from shares sold | | | | |
Class A
| 4,673 | 60,680 | 15,065 | 159,897 |
Class R6
| 4,967 | 65,261 | 4,305 | 46,772 |
| | | 125,941 | | 206,669 |
| Reinvestment of distributions | | | | |
Class A
| 0 | 0 | 284 | 3,322 |
Class R6
| 0 | 0 | 65 | 761 |
| | | 0 | | 4,083 |
| Payment for shares redeemed | | | | |
Class A
| (3,409) | (45,955) | (17,452) | (164,974) |
Class C
| 0 | 0 | (1) | (10) |
Class R6
| (6) | (78) | (223) | (2,332) |
| | | (46,033) | | (167,316) |
Net increase in net assets resulting from capital share transactions
| | 79,908 | | 43,436 |
Total increase in net assets
| | 933,577 | | 1,369,676 |
| Net assets | | | | |
Beginning of period
| | 6,599,544 | | 5,229,868 |
End of period
| | $7,533,121 | | $6,599,544 |
The accompanying notes are an integral part of these financial statements.
74 | Target Date Retirement Funds
Financial highlights
Dynamic Target Today Fund
(For a share outstanding throughout each period)
| | | Year ended February 28 | | Year ended May 31 |
| Class A | Six months ended
August 31, 2021
(unaudited) | 2021 | 2020 1 | 2019 2 | | 2018 | 2017 | 2016 3 |
Net asset value, beginning of period
| $11.38 | $10.60 | $10.11 | $10.82 | | $10.65 | $10.06 | $10.00 |
Net investment income
| 0.10 | 0.13 | 0.21 4 | 0.13 | | 0.15 | 0.12 4 | 0.06 |
Net realized and unrealized gains (losses) on investments
| 0.68 | 1.09 | 0.50 | 0.16 | | 0.38 | 0.65 | 0.03 |
Total from investment operations
| 0.78 | 1.22 | 0.71 | 0.29 | | 0.53 | 0.77 | 0.09 |
| Distributions to shareholders from | | | | | | | | |
Net investment income
| 0.00 | (0.18) | (0.22) | (0.15) | | (0.19) | (0.09) | (0.03) |
Net realized gains
| 0.00 | (0.26) | 0.00 | (0.85) | | (0.17) | (0.09) | (0.00) |
Total distributions to shareholders
| 0.00 | (0.44) | (0.22) | (1.00) | | (0.36) | (0.18) | (0.03) |
Net asset value, end of period
| $12.16 | $11.38 | $10.60 | $10.11 | | $10.82 | $10.65 | $10.06 |
Total return5
| 6.85% | 11.47% | 6.95% | 3.16% | | 4.96% | 7.97% | 0.95% |
| Ratios to average net assets (annualized) | | | | | | | | |
Gross expenses
| 2.35% * | 2.98% * | 3.37% * | 4.39% * | | 4.39% ^ | 4.67% ^ | 5.22% ^ |
Net expenses
| 0.66% * | 0.67% * | 0.66% * | 0.59% * | | 0.48% ^ | 0.53% ^ | 0.53% ^ |
Net investment income
| 1.64% * | 1.58% * | 1.95% * | 1.75% * | | 1.37% | 1.16% | 1.31% |
| Supplemental data | | | | | | | | |
Portfolio turnover rate6
| 52% | 87% | 39% | 48% | | 94% | 97% | 66% |
Net assets, end of period (000s omitted)
| $672 | $662 | $1,022 | $400 | | $384 | $238 | $101 |
| * | Ratios reflect net expenses allocated from the affiliated Master Portfolios which were as follows: |
| Six months ended August 31, 2021 (unaudited) | 0.10% |
| Year ended February 28, 2021 | 0.10% |
| Year ended February 29, 2020 | 0.12% |
| Year ended February 28, 20192 | 0.12% |
| ^ | Ratios do not reflect net expenses allocated from the affiliated Master Portfolios. Including annualized net expenses allocated from the affiliated Master Portfolios, the expense ratios would be increased by the following amounts: |
| Year ended May 31, 2018 | 0.10% |
| Year ended May 31, 2017 | 0.10% |
| Year ended May 31, 20163 | 0.11% |
| 1 | Year ended February 29 |
| 2 | For the nine months ended February 28, 2019. The Fund changed its fiscal year end from May 31 to February 28, effective February 28, 2019. |
| 3 | For the period from November 30, 2015 (commencement of class operations) to May 31, 2016 |
| 4 | Calculated based upon average shares outstanding |
| 5 | Total return calculations do not include any sales charges. Returns for periods of less than one year are not annualized. |
| 6 | Portfolio turnover rate is calculated by multiplying the Fund’s ownership percentage in each respective affiliated Master Portfolio by the corresponding affiliated Master Portfolio’s purchases and sales. These purchase and sale amounts are aggregated with any direct purchases and sales in affiliated and unaffiliated mutual funds, exchange-traded funds and unaffiliated securities and included in the portfolio turnover calculation. |
The accompanying notes are an integral part of these financial statements.
Target Date Retirement Funds | 75
Financial highlights
Dynamic Target Today Fund
(For a share outstanding throughout each period)
| | | Year ended February 28 | | Year ended May 31 |
| Class C | Six months ended
August 31, 2021
(unaudited) | 2021 | 2020 1 | 2019 2 | | 2018 | 2017 | 2016 3 |
Net asset value, beginning of period
| $11.45 | $10.56 | $10.08 | $10.76 | | $10.58 | $10.03 | $10.00 |
Net investment income
| 0.05 | 0.08 | 0.14 | 0.08 | | 0.07 | 0.05 | 0.03 |
Payment from affiliate
| 0.00 | 0.16 | 0.00 | 0.00 | | 0.00 | 0.00 | 0.00 |
Net realized and unrealized gains (losses) on investments
| 0.69 | 1.05 | 0.48 | 0.15 | | 0.38 | 0.64 | 0.03 |
Total from investment operations
| 0.74 | 1.29 | 0.62 | 0.23 | | 0.45 | 0.69 | 0.06 |
| Distributions to shareholders from | | | | | | | | |
Net investment income
| 0.00 | (0.14) | (0.14) | (0.06) | | (0.10) | (0.05) | (0.03) |
Net realized gains
| 0.00 | (0.26) | 0.00 | (0.85) | | (0.17) | (0.09) | 0.00 |
Total distributions to shareholders
| 0.00 | (0.40) | (0.14) | (0.91) | | (0.27) | (0.14) | (0.03) |
Net asset value, end of period
| $12.19 | $11.45 | $10.56 | $10.08 | | $10.76 | $10.58 | $10.03 |
Total return4
| 6.46% | 12.31% 5 | 6.11% | 2.60% | | 4.25% | 7.12% | 0.58% |
| Ratios to average net assets (annualized) | | | | | | | | |
Gross expenses
| 2.50% * | 3.30% * | 4.02% * | 5.14% * | | 5.14% ^ | 5.45% ^ | 5.97% ^ |
Net expenses
| 1.43% * | 1.43% * | 1.41% * | 1.34% * | | 1.24% ^ | 1.28% ^ | 1.28% ^ |
Net investment income
| 0.87% * | 0.74% * | 1.33% * | 0.99% * | | 0.65% | 0.45% | 0.56% |
| Supplemental data | | | | | | | | |
Portfolio turnover rate6
| 52% | 87% | 39% | 48% | | 94% | 97% | 66% |
Net assets, end of period (000s omitted)
| $137 | $120 | $107 | $102 | | $109 | $108 | $101 |
| * | Ratios reflect net expenses allocated from the affiliated Master Portfolios which were as follows: |
| Six months ended August 31, 2021 (unaudited) | 0.11% |
| Year ended February 28, 2021 | 0.11% |
| Year ended February 29, 2020 | 0.11% |
| Year ended February 28, 20192 | 0.11% |
| ^ | Ratios do not reflect net expenses allocated from the affiliated Master Portfolios. Including annualized net expenses allocated from the affiliated Master Portfolios, the expense ratios would be increased by the following amounts: |
| Year ended May 31, 2018 | 0.10% |
| Year ended May 31, 2017 | 0.10% |
| Year ended May 31, 20163 | 0.10% |
| 1 | Year ended February 29 |
| 2 | For the nine months ended February 28, 2019. The Fund changed its fiscal year end from May 31 to February 28, effective February 28, 2019. |
| 3 | For the period from November 30, 2015 (commencement of class operations) to May 31, 2016 |
| 4 | Total return calculations do not include any sales charges. Returns for periods of less than one year are not annualized. |
| 5 | During the year ended February 28, 2021, the Fund received a payment from an affiliate which had an impact of 1.55% on the total return. See Note 4 in the Notes to Financial Statements for additional information. |
| 6 | Portfolio turnover rate is calculated by multiplying the Fund’s ownership percentage in each respective affiliated Master Portfolio by the corresponding affiliated Master Portfolio’s purchases and sales. These purchase and sale amounts are aggregated with any direct purchases and sales in affiliated and unaffiliated mutual funds, exchange-traded funds and unaffiliated securities and included in the portfolio turnover calculation. |
The accompanying notes are an integral part of these financial statements.
76 | Target Date Retirement Funds
Financial highlights
Dynamic Target Today Fund
(For a share outstanding throughout each period)
| | | Year ended February 28 | | Year ended May 31 |
| Class R4 | Six months ended
August 31, 2021
(unaudited) | 2021 | 2020 1 | 2019 2 | | 2018 | 2017 | 2016 3 |
Net asset value, beginning of period
| $11.39 | $10.62 | $10.10 | $10.81 | | $10.63 | $10.07 | $10.00 |
Net investment income
| 0.11 | 0.20 | 0.25 | 0.16 | | 0.18 | 0.16 | 0.08 |
Net realized and unrealized gains (losses) on investments
| 0.69 | 1.05 | 0.49 | 0.16 | | 0.38 | 0.64 | 0.03 |
Total from investment operations
| 0.80 | 1.25 | 0.74 | 0.32 | | 0.56 | 0.80 | 0.11 |
| Distributions to shareholders from | | | | | | | | |
Net investment income
| 0.00 | (0.22) | (0.22) | (0.18) | | (0.21) | (0.15) | (0.04) |
Net realized gains
| 0.00 | (0.26) | 0.00 | (0.85) | | (0.17) | (0.09) | 0.00 |
Total distributions to shareholders
| 0.00 | (0.48) | (0.22) | (1.03) | | (0.38) | (0.24) | (0.04) |
Net asset value, end of period
| $12.19 | $11.39 | $10.62 | $10.10 | | $10.81 | $10.63 | $10.07 |
Total return4
| 7.02% | 11.81% | 7.33% | 3.42% | | 5.27% | 8.21% | 1.08% |
| Ratios to average net assets (annualized) | | | | | | | | |
Gross expenses
| 2.04% * | 2.65% * | 3.17% * | 4.11% * | | 4.11% ^ | 4.42% ^ | 4.94% ^ |
Net expenses
| 0.37% * | 0.37% * | 0.36% * | 0.31% * | | 0.22% ^ | 0.22% ^ | 0.22% ^ |
Net investment income
| 1.93% * | 1.82% * | 2.38% * | 2.02% * | | 1.67% | 1.51% | 1.62% |
| Supplemental data | | | | | | | | |
Portfolio turnover rate5
| 52% | 87% | 39% | 48% | | 94% | 97% | 66% |
Net assets, end of period (000s omitted)
| $125 | $117 | $109 | $104 | | $111 | $109 | $101 |
| * | Ratios reflect net expenses allocated from the affiliated Master Portfolios which were as follows: |
| Six months ended August 31, 2021 (unaudited) | 0.08% |
| Year ended February 28, 2021 | 0.08% |
| Year ended February 29, 2020 | 0.11% |
| Year ended February 28, 20192 | 0.11% |
| ^ | Ratios do not reflect net expenses allocated from the affiliated Master Portfolios. Including annualized net expenses allocated from the affiliated Master Portfolios, the expense ratios would be increased by the following amounts: |
| Year ended May 31, 2018 | 0.10% |
| Year ended May 31, 2017 | 0.10% |
| Year ended May 31, 20163 | 0.11% |
| 1 | Year ended February 29 |
| 2 | For the nine months ended February 28, 2019. The Fund changed its fiscal year end from May 31 to February 28, effective February 28, 2019. |
| 3 | For the period from November 30, 2015 (commencement of class operations) to May 31, 2016 |
| 4 | Returns for periods of less than one year are not annualized. |
| 5 | Portfolio turnover rate is calculated by multiplying the Fund’s ownership percentage in each respective affiliated Master Portfolio by the corresponding affiliated Master Portfolio’s purchases and sales. These purchase and sale amounts are aggregated with any direct purchases and sales in affiliated and unaffiliated mutual funds, exchange-traded funds and unaffiliated securities and included in the portfolio turnover calculation. |
The accompanying notes are an integral part of these financial statements.
Target Date Retirement Funds | 77
Financial highlights
Dynamic Target Today Fund
(For a share outstanding throughout each period)
| | | Year ended February 28 | | Year ended May 31 |
| Class R6 | Six months ended
August 31, 2021
(unaudited) | 2021 | 2020 1 | 2019 2 | | 2018 | 2017 | 2016 3 |
Net asset value, beginning of period
| $11.39 | $10.62 | $10.10 | $10.82 | | $10.64 | $10.08 | $10.00 |
Net investment income
| 0.12 | 0.21 | 0.27 4 | 0.17 | | 0.20 | 0.17 | 0.09 |
Net realized and unrealized gains (losses) on investments
| 0.69 | 1.05 | 0.49 | 0.15 | | 0.38 | 0.65 | 0.03 |
Total from investment operations
| 0.81 | 1.26 | 0.76 | 0.32 | | 0.58 | 0.82 | 0.12 |
| Distributions to shareholders from | | | | | | | | |
Net investment income
| 0.00 | (0.23) | (0.24) | (0.19) | | (0.23) | (0.17) | (0.04) |
Net realized gains
| 0.00 | (0.26) | 0.00 | (0.85) | | (0.17) | (0.09) | 0.00 |
Total distributions to shareholders
| 0.00 | (0.49) | (0.24) | (1.04) | | (0.40) | (0.26) | (0.04) |
Net asset value, end of period
| $12.20 | $11.39 | $10.62 | $10.10 | | $10.82 | $10.64 | $10.08 |
Total return5
| 7.11% | 11.96% | 7.48% | 3.49% | | 5.42% | 8.48% | 1.19% |
| Ratios to average net assets (annualized) | | | | | | | | |
Gross expenses
| 1.91% * | 2.52% * | 3.02% * | 3.97% * | | 3.96% ^ | 4.27% ^ | 4.79% ^ |
Net expenses
| 0.22% * | 0.22% * | 0.21% * | 0.16% * | | 0.07% ^ | 0.06% ^ | 0.07% ^ |
Net investment income
| 2.08% * | 1.96% * | 2.51% * | 2.17% * | | 1.82% | 1.67% | 1.77% |
| Supplemental data | | | | | | | | |
Portfolio turnover rate6
| 52% | 87% | 39% | 48% | | 94% | 97% | 66% |
Net assets, end of period (000s omitted)
| $6,514 | $6,093 | $5,545 | $4,785 | | $5,123 | $5,037 | $4,654 |
| * | Ratios reflect net expenses allocated from the affiliated Master Portfolios which were as follows: |
| Six months ended August 31, 2021 (unaudited) | 0.10% |
| Year ended February 28, 2021 | 0.10% |
| Year ended February 29, 2020 | 0.12% |
| Year ended February 28, 20192 | 0.12% |
| ^ | Ratios do not reflect net expenses allocated from the affiliated Master Portfolios. Including annualized net expenses allocated from the affiliated Master Portfolios, the expense ratios would be increased by the following amounts: |
| Year ended May 31, 2018 | 0.10% |
| Year ended May 31, 2017 | 0.11% |
| Year ended May 31, 20163 | 0.11% |
| 1 | Year ended February 29 |
| 2 | For the nine months ended February 28, 2019. The Fund changed its fiscal year end from May 31 to February 28, effective February 28, 2019. |
| 3 | For the period from November 30, 2015 (commencement of class operations) to May 31, 2016 |
| 4 | Calculated based upon average shares outstanding |
| 5 | Returns for periods of less than one year are not annualized. |
| 6 | Portfolio turnover rate is calculated by multiplying the Fund’s ownership percentage in each respective affiliated Master Portfolio by the corresponding affiliated Master Portfolio’s purchases and sales. These purchase and sale amounts are aggregated with any direct purchases and sales in affiliated and unaffiliated mutual funds, exchange-traded funds and unaffiliated securities and included in the portfolio turnover calculation. |
The accompanying notes are an integral part of these financial statements.
78 | Target Date Retirement Funds
Financial highlights
Dynamic Target 2015 Fund
(For a share outstanding throughout each period)
| | | Year ended February 28 | | Year ended May 31 |
| Class A | Six months ended
August 31, 2021
(unaudited) | 2021 | 2020 1 | 2019 2 | | 2018 | 2017 | 2016 3 |
Net asset value, beginning of period
| $11.41 | $10.40 | $9.99 | $11.06 | | $10.76 | $9.99 | $10.00 |
Net investment income
| 0.10 | 0.17 | 0.22 | 0.12 | | 0.15 4 | 0.11 | 0.07 |
Net realized and unrealized gains (losses) on investments
| 0.80 | 1.17 | 0.41 | 0.15 | | 0.56 | 0.86 | (0.04) |
Total from investment operations
| 0.90 | 1.34 | 0.63 | 0.27 | | 0.71 | 0.97 | 0.03 |
| Distributions to shareholders from | | | | | | | | |
Net investment income
| 0.00 | (0.18) | (0.22) | (0.13) | | (0.19) | (0.09) | (0.04) |
Net realized gains
| 0.00 | (0.15) | 0.00 | (1.21) | | (0.22) | (0.11) | 0.00 |
Total distributions to shareholders
| 0.00 | (0.33) | (0.22) | (1.34) | | (0.41) | (0.20) | (0.04) |
Net asset value, end of period
| $12.31 | $11.41 | $10.40 | $9.99 | | $11.06 | $10.76 | $9.99 |
Total return5
| 7.89% | 12.95% | 6.22% | 3.09% | | 6.62% | 9.95% | 0.34% |
| Ratios to average net assets (annualized) | | | | | | | | |
Gross expenses
| 2.54% * | 3.39% * | 3.63% * | 4.23% * | | 4.14% ^ | 4.42% ^ | 5.21% ^ |
Net expenses
| 0.66% * | 0.66% * | 0.65% * | 0.61% * | | 0.51% ^ | 0.51% ^ | 0.45% ^ |
Net investment income
| 1.62% * | 1.49% * | 2.00% * | 1.50% * | | 1.33% | 1.14% | 1.16% |
| Supplemental data | | | | | | | | |
Portfolio turnover rate6
| 51% | 87% | 38% | 45% | | 82% | 81% | 38% |
Net assets, end of period (000s omitted)
| $697 | $578 | $460 | $390 | | $456 | $363 | $199 |
| * | Ratios reflect net expenses allocated from the affiliated Master Portfolios which were as follows: |
| Six months ended August 31, 2021 (unaudited) | 0.10% |
| Year ended February 28, 2021 | 0.10% |
| Year ended February 29, 2020 | 0.13% |
| Year ended February 28, 20192 | 0.12% |
| ^ | Ratios do not reflect net expenses allocated from the affiliated Master Portfolios. Including annualized net expenses allocated from the affiliated Master Portfolios, the expense ratios would be increased by the following amounts: |
| Year ended May 31, 2018 | 0.10% |
| Year ended May 31, 2017 | 0.11% |
| Year ended May 31, 20163 | 0.10% |
| 1 | Year ended February 29 |
| 2 | For the nine months ended February 28, 2019. The Fund changed its fiscal year end from May 31 to February 28, effective February 28, 2019. |
| 3 | For the period from November 30, 2015 (commencement of class operations) to May 31, 2016 |
| 4 | Calculated based upon average shares outstanding |
| 5 | Total return calculations do not include any sales charges. Returns for periods of less than one year are not annualized. |
| 6 | Portfolio turnover rate is calculated by multiplying the Fund’s ownership percentage in each respective affiliated Master Portfolio by the corresponding affiliated Master Portfolio’s purchases and sales. These purchase and sale amounts are aggregated with any direct purchases and sales in affiliated and unaffiliated mutual funds, exchange-traded funds and unaffiliated securities and included in the portfolio turnover calculation. |
The accompanying notes are an integral part of these financial statements.
Target Date Retirement Funds | 79
Financial highlights
Dynamic Target 2015 Fund
(For a share outstanding throughout each period)
| | | Year ended February 28 | | Year ended May 31 |
| Class C | Six months ended
August 31, 2021
(unaudited) | 2021 | 2020 1 | 2019 2 | | 2018 | 2017 | 2016 3 |
Net asset value, beginning of period
| $11.48 | $10.35 | $9.96 | $11.01 | | $10.71 | $9.97 | $10.00 |
Net investment income
| 0.05 | 0.08 | 0.13 | 0.06 | | 0.06 | 0.04 | 0.03 |
Payment from affiliate
| 0.00 | 0.17 | 0.00 | 0.00 | | 0.00 | 0.00 | 0.00 |
Net realized and unrealized gains (losses) on investments
| 0.80 | 1.17 | 0.42 | 0.15 | | 0.56 | 0.85 | (0.02) |
Total from investment operations
| 0.85 | 1.42 | 0.55 | 0.21 | | 0.62 | 0.89 | 0.01 |
| Distributions to shareholders from | | | | | | | | |
Net investment income
| 0.00 | (0.14) | (0.16) | (0.05) | | (0.10) | (0.04) | (0.04) |
Net realized gains
| 0.00 | (0.15) | 0.00 | (1.21) | | (0.22) | (0.11) | 0.00 |
Total distributions to shareholders
| 0.00 | (0.29) | (0.16) | (1.26) | | (0.32) | (0.15) | (0.04) |
Net asset value, end of period
| $12.33 | $11.48 | $10.35 | $9.96 | | $11.01 | $10.71 | $9.97 |
Total return4
| 7.40% | 13.78% 5 | 5.49% | 2.46% | | 5.80% | 9.18% | 0.07% |
| Ratios to average net assets (annualized) | | | | | | | | |
Gross expenses
| 2.69% * | 3.74% * | 4.19% * | 4.97% * | | 4.89% ^ | 5.18% ^ | 5.96% ^ |
Net expenses
| 1.43% * | 1.43% * | 1.42% * | 1.36% * | | 1.27% ^ | 1.27% ^ | 1.28% ^ |
Net investment income
| 0.86% * | 0.73% * | 1.26% * | 0.76% * | | 0.52% | 0.40% | 0.56% |
| Supplemental data | | | | | | | | |
Portfolio turnover rate6
| 51% | 87% | 38% | 45% | | 82% | 81% | 38% |
Net assets, end of period (000s omitted)
| $126 | $117 | $105 | $101 | | $112 | $109 | $100 |
| * | Ratios reflect net expenses allocated from the affiliated Master Portfolios which were as follows: |
| Six months ended August 31, 2021 (unaudited) | 0.10% |
| Year ended February 28, 2021 | 0.10% |
| Year ended February 29, 2020 | 0.12% |
| Year ended February 28, 20192 | 0.11% |
| ^ | Ratios do not reflect net expenses allocated from the affiliated Master Portfolios. Including annualized net expenses allocated from the affiliated Master Portfolios, the expense ratios would be increased by the following amounts: |
| Year ended May 31, 2018 | 0.09% |
| Year ended May 31, 2017 | 0.10% |
| Year ended May 31, 20163 | 0.10% |
| 1 | Year ended February 29 |
| 2 | For the nine months ended February 28, 2019. The Fund changed its fiscal year end from May 31 to February 28, effective February 28, 2019. |
| 3 | For the period from November 30, 2015 (commencement of class operations) to May 31, 2016 |
| 4 | Total return calculations do not include any sales charges. Returns for periods of less than one year are not annualized. |
| 5 | During the year ended February 28, 2021, the Fund received a payment from an affiliate which had an impact of 1.66% on the total return. See Note 4 in the Notes to Financial Statements for additional information. |
| 6 | Portfolio turnover rate is calculated by multiplying the Fund’s ownership percentage in each respective affiliated Master Portfolio by the corresponding affiliated Master Portfolio’s purchases and sales. These purchase and sale amounts are aggregated with any direct purchases and sales in affiliated and unaffiliated mutual funds, exchange-traded funds and unaffiliated securities and included in the portfolio turnover calculation. |
The accompanying notes are an integral part of these financial statements.
80 | Target Date Retirement Funds
Financial highlights
Dynamic Target 2015 Fund
(For a share outstanding throughout each period)
| | | Year ended February 28 | | Year ended May 31 |
| Class R4 | Six months ended
August 31, 2021
(unaudited) | 2021 | 2020 1 | 2019 2 | | 2018 | 2017 | 2016 3 |
Net asset value, beginning of period
| $11.41 | $10.40 | $9.99 | $11.07 | | $10.75 | $10.01 | $10.00 |
Net investment income
| 0.12 | 0.19 | 0.24 | 0.15 | | 0.17 | 0.15 | 0.08 |
Net realized and unrealized gains (losses) on investments
| 0.79 | 1.18 | 0.42 | 0.14 | | 0.58 | 0.84 | (0.02) |
Total from investment operations
| 0.91 | 1.37 | 0.66 | 0.29 | | 0.75 | 0.99 | 0.06 |
| Distributions to shareholders from | | | | | | | | |
Net investment income
| 0.00 | (0.21) | (0.25) | (0.16) | | (0.21) | (0.14) | (0.05) |
Net realized gains
| 0.00 | (0.15) | 0.00 | (1.21) | | (0.22) | (0.11) | 0.00 |
Total distributions to shareholders
| 0.00 | (0.36) | (0.25) | (1.37) | | (0.43) | (0.25) | (0.05) |
Net asset value, end of period
| $12.32 | $11.41 | $10.40 | $9.99 | | $11.07 | $10.75 | $10.01 |
Total return4
| 7.98% | 13.27% | 6.51% | 3.30% | | 7.01% | 10.28% | 0.57% |
| Ratios to average net assets (annualized) | | | | | | | | |
Gross expenses
| 2.25% * | 3.10% * | 3.34% * | 3.94% * | | 3.86% ^ | 4.15% ^ | 4.93% ^ |
Net expenses
| 0.37% * | 0.37% * | 0.36% * | 0.31% * | | 0.23% ^ | 0.22% ^ | 0.22% ^ |
Net investment income
| 1.92% * | 1.79% * | 2.31% * | 1.77% * | | 1.56% | 1.45% | 1.61% |
| Supplemental data | | | | | | | | |
Portfolio turnover rate5
| 51% | 87% | 38% | 45% | | 82% | 81% | 38% |
Net assets, end of period (000s omitted)
| $127 | $118 | $107 | $103 | | $114 | $111 | $101 |
| * | Ratios reflect net expenses allocated from the affiliated Master Portfolios which were as follows: |
| Six months ended August 31, 2021 (unaudited) | 0.08% |
| Year ended February 28, 2021 | 0.09% |
| Year ended February 29, 2020 | 0.12% |
| Year ended February 28, 20192 | 0.11% |
| ^ | Ratios do not reflect net expenses allocated from the affiliated Master Portfolios. Including annualized net expenses allocated from the affiliated Master Portfolios, the expense ratios would be increased by the following amounts: |
| Year ended May 31, 2018 | 0.09% |
| Year ended May 31, 2017 | 0.10% |
| Year ended May 31, 20163 | 0.10% |
| 1 | Year ended February 29 |
| 2 | For the nine months ended February 28, 2019. The Fund changed its fiscal year end from May 31 to February 28, effective February 28, 2019. |
| 3 | For the period from November 30, 2015 (commencement of class operations) to May 31, 2016 |
| 4 | Returns for periods of less than one year are not annualized. |
| 5 | Portfolio turnover rate is calculated by multiplying the Fund’s ownership percentage in each respective affiliated Master Portfolio by the corresponding affiliated Master Portfolio’s purchases and sales. These purchase and sale amounts are aggregated with any direct purchases and sales in affiliated and unaffiliated mutual funds, exchange-traded funds and unaffiliated securities and included in the portfolio turnover calculation. |
The accompanying notes are an integral part of these financial statements.
Target Date Retirement Funds | 81
Financial highlights
Dynamic Target 2015 Fund
(For a share outstanding throughout each period)
| | | Year ended February 28 | | Year ended May 31 |
| Class R6 | Six months ended
August 31, 2021
(unaudited) | 2021 | 2020 1 | 2019 2 | | 2018 | 2017 | 2016 3 |
Net asset value, beginning of period
| $11.42 | $10.41 | $9.99 | $11.07 | | $10.76 | $10.01 | $10.00 |
Net investment income
| 0.12 | 0.21 | 0.26 | 0.16 | | 0.19 | 0.16 | 0.09 |
Net realized and unrealized gains (losses) on investments
| 0.80 | 1.18 | 0.42 | 0.15 | | 0.57 | 0.86 | (0.03) |
Total from investment operations
| 0.92 | 1.39 | 0.68 | 0.31 | | 0.76 | 1.02 | 0.06 |
| Distributions to shareholders from | | | | | | | | |
Net investment income
| 0.00 | (0.23) | (0.26) | (0.18) | | (0.23) | (0.16) | (0.05) |
Net realized gains
| 0.00 | (0.15) | 0.00 | (1.21) | | (0.22) | (0.11) | 0.00 |
Total distributions to shareholders
| 0.00 | (0.38) | (0.26) | (1.39) | | (0.45) | (0.27) | (0.05) |
Net asset value, end of period
| $12.34 | $11.42 | $10.41 | $9.99 | | $11.07 | $10.76 | $10.01 |
Total return4
| 8.06% | 13.41% | 6.77% | 3.47% | | 7.06% | 10.44% | 0.58% |
| Ratios to average net assets (annualized) | | | | | | | | |
Gross expenses
| 2.12% * | 2.96% * | 3.20% * | 3.80% * | | 3.71% ^ | 4.00% ^ | 4.78% ^ |
Net expenses
| 0.22% * | 0.22% * | 0.21% * | 0.16% * | | 0.07% ^ | 0.06% ^ | 0.06% ^ |
Net investment income
| 2.07% * | 1.94% * | 2.46% * | 1.91% * | | 1.72% | 1.60% | 1.77% |
| Supplemental data | | | | | | | | |
Portfolio turnover rate5
| 51% | 87% | 38% | 45% | | 82% | 81% | 38% |
Net assets, end of period (000s omitted)
| $5,854 | $5,417 | $4,937 | $4,740 | | $5,253 | $5,105 | $4,629 |
| * | Ratios reflect net expenses allocated from the affiliated Master Portfolios which were as follows: |
| Six months ended August 31, 2021 (unaudited) | 0.10% |
| Year ended February 28, 2021 | 0.11% |
| Year ended February 29, 2020 | 0.13% |
| Year ended February 28, 20192 | 0.12% |
| ^ | Ratios do not reflect net expenses allocated from the affiliated Master Portfolios. Including annualized net expenses allocated from the affiliated Master Portfolios, the expense ratios would be increased by the following amounts: |
| Year ended May 31, 2018 | 0.10% |
| Year ended May 31, 2017 | 0.11% |
| Year ended May 31, 20163 | 0.11% |
| 1 | Year ended February 29 |
| 2 | For the nine months ended February 28, 2019. The Fund changed its fiscal year end from May 31 to February 28, effective February 28, 2019. |
| 3 | For the period from November 30, 2015 (commencement of class operations) to May 31, 2016 |
| 4 | Returns for periods of less than one year are not annualized. |
| 5 | Portfolio turnover rate is calculated by multiplying the Fund’s ownership percentage in each respective affiliated Master Portfolio by the corresponding affiliated Master Portfolio’s purchases and sales. These purchase and sale amounts are aggregated with any direct purchases and sales in affiliated and unaffiliated mutual funds, exchange-traded funds and unaffiliated securities and included in the portfolio turnover calculation. |
The accompanying notes are an integral part of these financial statements.
82 | Target Date Retirement Funds
Financial highlights
Dynamic Target 2020 Fund
(For a share outstanding throughout each period)
| | | Year ended February 28 | | Year ended May 31 |
| Class A | Six months ended
August 31, 2021
(unaudited) | 2021 | 2020 1 | 2019 2 | | 2018 | 2017 | 2016 3 |
Net asset value, beginning of period
| $11.57 | $10.28 | $9.95 | $11.18 | | $10.78 | $9.99 | $10.00 |
Net investment income
| 0.10 | 0.14 | 0.19 4 | 0.11 | | 0.14 | 0.11 4 | 0.06 |
Net realized and unrealized gains (losses) on investments
| 0.91 | 1.40 | 0.35 | 0.18 | | 0.70 | 0.97 | (0.03) |
Total from investment operations
| 1.01 | 1.54 | 0.54 | 0.29 | | 0.84 | 1.08 | 0.03 |
| Distributions to shareholders from | | | | | | | | |
Net investment income
| 0.00 | (0.18) | (0.21) | (0.12) | | (0.19) | (0.12) | (0.04) |
Net realized gains
| 0.00 | (0.07) | 0.00 | (1.40) | | (0.25) | (0.17) | 0.00 |
Total distributions to shareholders
| 0.00 | (0.25) | (0.21) | (1.52) | | (0.44) | (0.29) | (0.04) |
Net asset value, end of period
| $12.58 | $11.57 | $10.28 | $9.95 | | $11.18 | $10.78 | $9.99 |
Total return5
| 8.73% | 15.03% | 5.31% | 3.33% | | 7.80% | 11.18% | 0.35% |
| Ratios to average net assets (annualized) | | | | | | | | |
Gross expenses
| 2.17% * | 2.89% * | 3.27% * | 4.04% * | | 3.96% ^ | 4.32% ^ | 5.21% ^ |
Net expenses
| 0.66% * | 0.67% * | 0.67% * | 0.61% * | | 0.52% ^ | 0.51% ^ | 0.54% ^ |
Net investment income
| 1.61% * | 1.45% * | 1.81% * | 1.38% * | | 1.15% | 1.09% | 1.33% |
| Supplemental data | | | | | | | | |
Portfolio turnover rate6
| 50% | 87% | 38% | 42% | | 72% | 69% | 38% |
Net assets, end of period (000s omitted)
| $1,632 | $1,448 | $1,435 | $623 | | $540 | $380 | $119 |
| * | Ratios reflect net expenses allocated from the affiliated Master Portfolios which were as follows: |
| Six months ended August 31, 2021 (unaudited) | 0.10% |
| Year ended February 28, 2021 | 0.11% |
| Year ended February 29, 2020 | 0.14% |
| Year ended February 28, 20192 | 0.12% |
| ^ | Ratios do not reflect net expenses allocated from the affiliated Master Portfolios. Including annualized net expenses allocated from the affiliated Master Portfolios, the expense ratios would be increased by the following amounts: |
| Year ended May 31, 2018 | 0.10% |
| Year ended May 31, 2017 | 0.10% |
| Year ended May 31, 20163 | 0.10% |
| 1 | Year ended February 29 |
| 2 | For the nine months ended February 28, 2019. The Fund changed its fiscal year end from May 31 to February 28, effective February 28, 2019. |
| 3 | For the period from November 30, 2015 (commencement of class operations) to May 31, 2016 |
| 4 | Calculated based upon average shares outstanding |
| 5 | Total return calculations do not include any sales charges. Returns for periods of less than one year are not annualized. |
| 6 | Portfolio turnover rate is calculated by multiplying the Fund’s ownership percentage in each respective affiliated Master Portfolio by the corresponding affiliated Master Portfolio’s purchases and sales. These purchase and sale amounts are aggregated with any direct purchases and sales in affiliated and unaffiliated mutual funds, exchange-traded funds and unaffiliated securities and included in the portfolio turnover calculation. |
The accompanying notes are an integral part of these financial statements.
Target Date Retirement Funds | 83
Financial highlights
Dynamic Target 2020 Fund
(For a share outstanding throughout each period)
| | | Year ended February 28 | | Year ended May 31 |
| Class C | Six months ended
August 31, 2021
(unaudited) | 2021 | 2020 1 | 2019 2 | | 2018 | 2017 | 2016 3 |
Net asset value, beginning of period
| $11.66 | $10.28 | $9.95 | $11.15 | | $10.76 | $9.96 | $10.00 |
Net investment income
| 0.05 | 0.07 | 0.13 | 0.06 | | 0.05 | 0.03 | 0.03 |
Payment from affiliate
| 0.00 | 0.13 | 0.00 | 0.00 | | 0.00 | 0.00 | 0.00 |
Net realized and unrealized gains (losses) on investments
| 0.92 | 1.39 | 0.33 | 0.17 | | 0.69 | 0.98 | (0.03) |
Total from investment operations
| 0.97 | 1.59 | 0.46 | 0.23 | | 0.74 | 1.01 | 0.00 |
| Distributions to shareholders from | | | | | | | | |
Net investment income
| 0.00 | (0.14) | (0.13) | (0.03) | | (0.10) | (0.04) | (0.04) |
Net realized gains
| 0.00 | (0.07) | 0.00 | (1.40) | | (0.25) | (0.17) | 0.00 |
Total distributions to shareholders
| 0.00 | (0.21) | (0.13) | (1.43) | | (0.35) | (0.21) | (0.04) |
Net asset value, end of period
| $12.63 | $11.66 | $10.28 | $9.95 | | $11.15 | $10.76 | $9.96 |
Total return4
| 8.32% | 15.52% 5 | 4.61% | 2.72% | | 6.89% | 10.39% | 0.01% |
| Ratios to average net assets (annualized) | | | | | | | | |
Gross expenses
| 2.47% * | 3.30% * | 3.88% * | 4.79% * | | 4.71% ^ | 5.09% ^ | 5.97% ^ |
Net expenses
| 1.43% * | 1.43% * | 1.42% * | 1.37% * | | 1.28% ^ | 1.28% ^ | 1.29% ^ |
Net investment income
| 0.85% * | 0.62% * | 1.21% * | 0.66% * | | 0.43% | 0.33% | 0.53% |
| Supplemental data | | | | | | | | |
Portfolio turnover rate6
| 50% | 87% | 38% | 42% | | 72% | 69% | 38% |
Net assets, end of period (000s omitted)
| $167 | $154 | $105 | $102 | | $114 | $110 | $100 |
| * | Ratios reflect net expenses allocated from the affiliated Master Portfolios which were as follows: |
| Six months ended August 31, 2021 (unaudited) | 0.11% |
| Year ended February 28, 2021 | 0.10% |
| Year ended February 29, 2020 | 0.12% |
| Year ended February 28, 20192 | 0.11% |
| ^ | Ratios do not reflect net expenses allocated from the affiliated Master Portfolios. Including annualized net expenses allocated from the affiliated Master Portfolios, the expense ratios would be increased by the following amounts: |
| Year ended May 31, 2018 | 0.09% |
| Year ended May 31, 2017 | 0.10% |
| Year ended May 31, 20163 | 0.10% |
| 1 | Year ended February 29 |
| 2 | For the nine months ended February 28, 2019. The Fund changed its fiscal year end from May 31 to February 28, effective February 28, 2019. |
| 3 | For the period from November 30, 2015 (commencement of class operations) to May 31, 2016 |
| 4 | Total return calculations do not include any sales charges. Returns for periods of less than one year are not annualized. |
| 5 | During the year ended February 28, 2021, the Fund received a payment from an affiliate which had an impact of 1.33% on the total return. See Note 4 in the Notes to Financial Statements for additional information. |
| 6 | Portfolio turnover rate is calculated by multiplying the Fund’s ownership percentage in each respective affiliated Master Portfolio by the corresponding affiliated Master Portfolio’s purchases and sales. These purchase and sale amounts are aggregated with any direct purchases and sales in affiliated and unaffiliated mutual funds, exchange-traded funds and unaffiliated securities and included in the portfolio turnover calculation. |
The accompanying notes are an integral part of these financial statements.
84 | Target Date Retirement Funds
Financial highlights
Dynamic Target 2020 Fund
(For a share outstanding throughout each period)
| | | Year ended February 28 | | Year ended May 31 |
| Class R4 | Six months ended
August 31, 2021
(unaudited) | 2021 | 2020 1 | 2019 2 | | 2018 | 2017 | 2016 3 |
Net asset value, beginning of period
| $11.64 | $10.34 | $9.99 | $11.22 | | $10.82 | $10.01 | $10.00 |
Net investment income
| 0.12 | 0.19 | 0.24 | 0.14 | | 0.17 | 0.14 | 0.08 |
Net realized and unrealized gains (losses) on investments
| 0.92 | 1.38 | 0.33 | 0.17 | | 0.69 | 0.97 | (0.02) |
Total from investment operations
| 1.04 | 1.57 | 0.57 | 0.31 | | 0.86 | 1.11 | 0.06 |
| Distributions to shareholders from | | | | | | | | |
Net investment income
| 0.00 | (0.20) | (0.22) | (0.14) | | (0.21) | (0.13) | (0.05) |
Net realized gains
| 0.00 | (0.07) | 0.00 | (1.40) | | (0.25) | (0.17) | 0.00 |
Total distributions to shareholders
| 0.00 | (0.27) | (0.22) | (1.54) | | (0.46) | (0.30) | (0.05) |
Net asset value, end of period
| $12.68 | $11.64 | $10.34 | $9.99 | | $11.22 | $10.82 | $10.01 |
Total return4
| 8.93% | 15.32% | 5.62% | 3.59% | | 8.03% | 11.60% | 0.61% |
| Ratios to average net assets (annualized) | | | | | | | | |
Gross expenses
| 1.88% * | 2.60% * | 3.03% * | 3.77% * | | 3.68% ^ | 4.06% ^ | 4.94% ^ |
Net expenses
| 0.37% * | 0.37% * | 0.36% * | 0.32% * | | 0.24% ^ | 0.23% ^ | 0.23% ^ |
Net investment income
| 1.90% * | 1.72% * | 2.26% * | 1.71% * | | 1.47% | 1.39% | 1.59% |
| Supplemental data | | | | | | | | |
Portfolio turnover rate5
| 50% | 87% | 38% | 42% | | 72% | 69% | 38% |
Net assets, end of period (000s omitted)
| $131 | $121 | $107 | $103 | | $116 | $112 | $101 |
| * | Ratios reflect net expenses allocated from the affiliated Master Portfolios which were as follows: |
| Six months ended August 31, 2021 (unaudited) | 0.09% |
| Year ended February 28, 2021 | 0.09% |
| Year ended February 29, 2020 | 0.12% |
| Year ended February 28, 20192 | 0.11% |
| ^ | Ratios do not reflect net expenses allocated from the affiliated Master Portfolios. Including annualized net expenses allocated from the affiliated Master Portfolios, the expense ratios would be increased by the following amounts: |
| Year ended May 31, 2018 | 0.09% |
| Year ended May 31, 2017 | 0.10% |
| Year ended May 31, 20163 | 0.10% |
| 1 | Year ended February 29 |
| 2 | For the nine months ended February 28, 2019. The Fund changed its fiscal year end from May 31 to February 28, effective February 28, 2019. |
| 3 | For the period from November 30, 2015 (commencement of class operations) to May 31, 2016 |
| 4 | Returns for periods of less than one year are not annualized. |
| 5 | Portfolio turnover rate is calculated by multiplying the Fund’s ownership percentage in each respective affiliated Master Portfolio by the corresponding affiliated Master Portfolio’s purchases and sales. These purchase and sale amounts are aggregated with any direct purchases and sales in affiliated and unaffiliated mutual funds, exchange-traded funds and unaffiliated securities and included in the portfolio turnover calculation. |
The accompanying notes are an integral part of these financial statements.
Target Date Retirement Funds | 85
Financial highlights
Dynamic Target 2020 Fund
(For a share outstanding throughout each period)
| | | Year ended February 28 | | Year ended May 31 |
| Class R6 | Six months ended
August 31, 2021
(unaudited) | 2021 | 2020 1 | 2019 2 | | 2018 | 2017 | 2016 3 |
Net asset value, beginning of period
| $11.65 | $10.34 | $9.99 | $11.23 | | $10.82 | $10.01 | $10.00 |
Net investment income
| 0.13 | 0.20 | 0.25 | 0.15 | | 0.18 | 0.16 | 0.08 |
Net realized and unrealized gains (losses) on investments
| 0.92 | 1.40 | 0.34 | 0.17 | | 0.71 | 0.97 | (0.02) |
Total from investment operations
| 1.05 | 1.60 | 0.59 | 0.32 | | 0.89 | 1.13 | 0.06 |
| Distributions to shareholders from | | | | | | | | |
Net investment income
| 0.00 | (0.22) | (0.24) | (0.16) | | (0.23) | (0.15) | (0.05) |
Net realized gains
| 0.00 | (0.07) | 0.00 | (1.40) | | (0.25) | (0.17) | 0.00 |
Total distributions to shareholders
| 0.00 | (0.29) | (0.24) | (1.56) | | (0.48) | (0.32) | (0.05) |
Net asset value, end of period
| $12.70 | $11.65 | $10.34 | $9.99 | | $11.23 | $10.82 | $10.01 |
Total return4
| 9.01% | 15.58% | 5.77% | 3.65% | | 8.03% | 11.60% | 0.61% |
| Ratios to average net assets (annualized) | | | | | | | | |
Gross expenses
| 1.75% * | 2.46% * | 2.90% * | 3.63% * | | 3.53% ^ | 3.91% ^ | 4.79% ^ |
Net expenses
| 0.22% * | 0.22% * | 0.21% * | 0.17% * | | 0.08% ^ | 0.07% ^ | 0.07% ^ |
Net investment income
| 2.05% * | 1.87% * | 2.40% * | 1.86% * | | 1.63% | 1.54% | 1.74% |
| Supplemental data | | | | | | | | |
Portfolio turnover rate5
| 50% | 87% | 38% | 42% | | 72% | 69% | 38% |
Net assets, end of period (000s omitted)
| $6,387 | $5,891 | $5,118 | $4,767 | | $5,359 | $5,165 | $4,631 |
| * | Ratios reflect net expenses allocated from the affiliated Master Portfolios which were as follows: |
| Six months ended August 31, 2021 (unaudited) | 0.10% |
| Year ended February 28, 2021 | 0.11% |
| Year ended February 29, 2020 | 0.14% |
| Year ended February 28, 20192 | 0.13% |
| ^ | Ratios do not reflect net expenses allocated from the affiliated Master Portfolios. Including annualized net expenses allocated from the affiliated Master Portfolios, the expense ratios would be increased by the following amounts: |
| Year ended May 31, 2018 | 0.10% |
| Year ended May 31, 2017 | 0.11% |
| Year ended May 31, 20163 | 0.11% |
| 1 | Year ended February 29 |
| 2 | For the nine months ended February 28, 2019. The Fund changed its fiscal year end from May 31 to February 28, effective February 28, 2019. |
| 3 | For the period from November 30, 2015 (commencement of class operations) to May 31, 2016 |
| 4 | Returns for periods of less than one year are not annualized. |
| 5 | Portfolio turnover rate is calculated by multiplying the Fund’s ownership percentage in each respective affiliated Master Portfolio by the corresponding affiliated Master Portfolio’s purchases and sales. These purchase and sale amounts are aggregated with any direct purchases and sales in affiliated and unaffiliated mutual funds, exchange-traded funds and unaffiliated securities and included in the portfolio turnover calculation. |
The accompanying notes are an integral part of these financial statements.
86 | Target Date Retirement Funds
Financial highlights
Dynamic Target 2025 Fund
(For a share outstanding throughout each period)
| | | Year ended February 28 | | Year ended May 31 |
| Class A | Six months ended
August 31, 2021
(unaudited) | 2021 | 2020 1 | 2019 2 | | 2018 | 2017 | 2016 3 |
Net asset value, beginning of period
| $12.08 | $10.36 | $10.10 | $11.38 | | $10.87 | $9.94 | $10.00 |
Net investment income
| 0.09 | 0.18 | 0.19 | 0.10 | | 0.11 4 | 0.09 | 0.07 |
Net realized and unrealized gains (losses) on investments
| 1.11 | 1.77 | 0.25 | 0.12 | | 0.87 | 1.13 | (0.08) |
Total from investment operations
| 1.20 | 1.95 | 0.44 | 0.22 | | 0.98 | 1.22 | (0.01) |
| Distributions to shareholders from | | | | | | | | |
Net investment income
| 0.00 | (0.18) | (0.18) | (0.10) | | (0.19) | (0.12) | (0.05) |
Net realized gains
| 0.00 | (0.05) | 0.00 | (1.40) | | (0.28) | (0.17) | 0.00 |
Total distributions to shareholders
| 0.00 | (0.23) | (0.18) | (1.50) | | (0.47) | (0.29) | (0.05) |
Net asset value, end of period
| $13.28 | $12.08 | $10.36 | $10.10 | | $11.38 | $10.87 | $9.94 |
Total return5
| 9.93% | 18.83% | 4.29% | 2.76% | | 9.07% | 12.62% | (0.07)% |
| Ratios to average net assets (annualized) | | | | | | | | |
Gross expenses
| 1.51% * | 2.21% * | 2.72% * | 3.81% * | | 4.06% ^ | 4.75% ^ | 5.25% ^ |
Net expenses
| 0.66% * | 0.66% * | 0.66% * | 0.60% * | | 0.52% ^ | 0.49% ^ | 0.46% ^ |
Net investment income
| 1.53% * | 1.44% * | 1.88% * | 1.31% * | | 1.00% | 1.07% | 1.09% |
| Supplemental data | | | | | | | | |
Portfolio turnover rate6
| 50% | 85% | 37% | 41% | | 62% | 58% | 38% |
Net assets, end of period (000s omitted)
| $4,969 | $3,744 | $2,856 | $1,929 | | $1,497 | $510 | $188 |
| * | Ratios reflect net expenses allocated from the affiliated Master Portfolios which were as follows: |
| Six months ended August 31, 2021 (unaudited) | 0.11% |
| Year ended February 28, 2021 | 0.12% |
| Year ended February 29, 2020 | 0.14% |
| Year ended February 28, 20192 | 0.13% |
| ^ | Ratios do not reflect net expenses allocated from the affiliated Master Portfolios. Including annualized net expenses allocated from the affiliated Master Portfolios, the expense ratios would be increased by the following amounts: |
| Year ended May 31, 2018 | 0.10% |
| Year ended May 31, 2017 | 0.10% |
| Year ended May 31, 20163 | 0.10% |
| 1 | Year ended February 29 |
| 2 | For the nine months ended February 28, 2019. The Fund changed its fiscal year end from May 31 to February 28, effective February 28, 2019. |
| 3 | For the period from November 30, 2015 (commencement of class operations) to May 31, 2016 |
| 4 | Calculated based upon average shares outstanding |
| 5 | Total return calculations do not include any sales charges. Returns for periods of less than one year are not annualized. |
| 6 | Portfolio turnover rate is calculated by multiplying the Fund’s ownership percentage in each respective affiliated Master Portfolio by the corresponding affiliated Master Portfolio’s purchases and sales. These purchase and sale amounts are aggregated with any direct purchases and sales in affiliated and unaffiliated mutual funds, exchange-traded funds and unaffiliated securities and included in the portfolio turnover calculation. |
The accompanying notes are an integral part of these financial statements.
Target Date Retirement Funds | 87
Financial highlights
Dynamic Target 2025 Fund
(For a share outstanding throughout each period)
| | | Year ended February 28 | | Year ended May 31 |
| Class C | Six months ended
August 31, 2021
(unaudited) | 2021 | 2020 1 | 2019 2 | | 2018 | 2017 | 2016 3 |
Net asset value, beginning of period
| $12.19 | $10.35 | $10.10 | $11.35 | | $10.84 | $9.91 | $10.00 |
Net investment income
| 0.05 | 0.08 | 0.12 | 0.05 | | 0.04 | 0.03 | 0.02 |
Payment from affiliate
| 0.00 | 0.16 | 0.00 | 0.00 | | 0.00 | 0.00 | 0.00 |
Net realized and unrealized gains (losses) on investments
| 1.10 | 1.78 | 0.24 | 0.12 | | 0.85 | 1.10 | (0.06) |
Total from investment operations
| 1.15 | 2.02 | 0.36 | 0.17 | | 0.89 | 1.13 | (0.04) |
| Distributions to shareholders from | | | | | | | | |
Net investment income
| 0.00 | (0.13) | (0.11) | (0.02) | | (0.10) | (0.03) | (0.05) |
Net realized gains
| 0.00 | (0.05) | 0.00 | (1.40) | | (0.28) | (0.17) | 0.00 |
Total distributions to shareholders
| 0.00 | (0.18) | (0.11) | (1.42) | | (0.38) | (0.20) | (0.05) |
Net asset value, end of period
| $13.34 | $12.19 | $10.35 | $10.10 | | $11.35 | $10.84 | $9.91 |
Total return4
| 9.43% | 19.55% 5 | 3.55% | 2.17% | | 8.24% | 11.77% | (0.44)% |
| Ratios to average net assets (annualized) | | | | | | | | |
Gross expenses
| 1.72% * | 2.60% * | 3.34% * | 4.56% * | | 4.88% ^ | 5.55% ^ | 6.00% ^ |
Net expenses
| 1.43% * | 1.43% * | 1.42% * | 1.36% * | | 1.28% ^ | 1.29% ^ | 1.30% ^ |
Net investment income
| 0.79% * | 0.70% * | 1.17% * | 0.56% * | | 0.36% | 0.29% | 0.52% |
| Supplemental data | | | | | | | | |
Portfolio turnover rate6
| 50% | 85% | 37% | 41% | | 62% | 58% | 38% |
Net assets, end of period (000s omitted)
| $144 | $137 | $125 | $130 | | $130 | $124 | $100 |
| * | Ratios reflect net expenses allocated from the affiliated Master Portfolios which were as follows: |
| Six months ended August 31, 2021 (unaudited) | 0.10% |
| Year ended February 28, 2021 | 0.10% |
| Year ended February 29, 2020 | 0.13% |
| Year ended February 28, 20192 | 0.12% |
| ^ | Ratios do not reflect net expenses allocated from the affiliated Master Portfolios. Including annualized net expenses allocated from the affiliated Master Portfolios, the expense ratios would be increased by the following amounts: |
| Year ended May 31, 2018 | 0.09% |
| Year ended May 31, 2017 | 0.10% |
| Year ended May 31, 20163 | 0.10% |
| 1 | Year ended February 29 |
| 2 | For the nine months ended February 28, 2019. The Fund changed its fiscal year end from May 31 to February 28, effective February 28, 2019. |
| 3 | For the period from November 30, 2015 (commencement of class operations) to May 31, 2016 |
| 4 | Total return calculations do not include any sales charges. Returns for periods of less than one year are not annualized. |
| 5 | During the year ended February 28, 2021, the Fund received a payment from an affiliate which had an impact of 1.56% on the total return. See Note 4 in the Notes to Financial Statements for additional information. |
| 6 | Portfolio turnover rate is calculated by multiplying the Fund’s ownership percentage in each respective affiliated Master Portfolio by the corresponding affiliated Master Portfolio’s purchases and sales. These purchase and sale amounts are aggregated with any direct purchases and sales in affiliated and unaffiliated mutual funds, exchange-traded funds and unaffiliated securities and included in the portfolio turnover calculation. |
The accompanying notes are an integral part of these financial statements.
88 | Target Date Retirement Funds
Financial highlights
Dynamic Target 2025 Fund
(For a share outstanding throughout each period)
| | | Year ended February 28 | | Year ended May 31 |
| Class R4 | Six months ended
August 31, 2021
(unaudited) | 2021 | 2020 1 | 2019 2 | | 2018 | 2017 | 2016 3 |
Net asset value, beginning of period
| $12.15 | $10.42 | $10.14 | $11.42 | | $10.90 | $9.96 | $10.00 |
Net investment income
| 0.12 | 0.19 | 0.24 | 0.14 | | 0.16 | 0.14 | 0.08 |
Net realized and unrealized gains (losses) on investments
| 1.10 | 1.81 | 0.25 | 0.11 | | 0.85 | 1.10 | (0.07) |
Total from investment operations
| 1.22 | 2.00 | 0.49 | 0.25 | | 1.01 | 1.24 | 0.01 |
| Distributions to shareholders from | | | | | | | | |
Net investment income
| 0.00 | (0.22) | (0.21) | (0.13) | | (0.21) | (0.13) | (0.05) |
Net realized gains
| 0.00 | (0.05) | 0.00 | (1.40) | | (0.28) | (0.17) | 0.00 |
Total distributions to shareholders
| 0.00 | (0.27) | (0.21) | (1.53) | | (0.49) | (0.30) | (0.05) |
Net asset value, end of period
| $13.37 | $12.15 | $10.42 | $10.14 | | $11.42 | $10.90 | $9.96 |
Total return4
| 10.04% | 19.18% | 4.68% | 2.96% | | 9.33% | 12.84% | 0.16% |
| Ratios to average net assets (annualized) | | | | | | | | |
Gross expenses
| 1.22% * | 1.91% * | 2.45% * | 3.53% * | | 3.85% ^ | 4.52% ^ | 4.97% ^ |
Net expenses
| 0.37% * | 0.37% * | 0.36% * | 0.31% * | | 0.24% ^ | 0.23% ^ | 0.23% ^ |
Net investment income
| 1.85% * | 1.75% * | 2.22% * | 1.62% * | | 1.41% | 1.35% | 1.58% |
| Supplemental data | | | | | | | | |
Portfolio turnover rate5
| 50% | 85% | 37% | 41% | | 62% | 58% | 38% |
Net assets, end of period (000s omitted)
| $138 | $126 | $108 | $105 | | $118 | $113 | $100 |
| * | Ratios reflect net expenses allocated from the affiliated Master Portfolios which were as follows: |
| Six months ended August 31, 2021 (unaudited) | 0.10% |
| Year ended February 28, 2021 | 0.10% |
| Year ended February 29, 2020 | 0.12% |
| Year ended February 28, 20192 | 0.12% |
| ^ | Ratios do not reflect net expenses allocated from the affiliated Master Portfolios. Including annualized net expenses allocated from the affiliated Master Portfolios, the expense ratios would be increased by the following amounts: |
| Year ended May 31, 2018 | 0.09% |
| Year ended May 31, 2017 | 0.10% |
| Year ended May 31, 20163 | 0.11% |
| 1 | Year ended February 29 |
| 2 | For the nine months ended February 28, 2019. The Fund changed its fiscal year end from May 31 to February 28, effective February 28, 2019. |
| 3 | For the period from November 30, 2015 (commencement of class operations) to May 31, 2016 |
| 4 | Returns for periods of less than one year are not annualized. |
| 5 | Portfolio turnover rate is calculated by multiplying the Fund’s ownership percentage in each respective affiliated Master Portfolio by the corresponding affiliated Master Portfolio’s purchases and sales. These purchase and sale amounts are aggregated with any direct purchases and sales in affiliated and unaffiliated mutual funds, exchange-traded funds and unaffiliated securities and included in the portfolio turnover calculation. |
The accompanying notes are an integral part of these financial statements.
Target Date Retirement Funds | 89
Financial highlights
Dynamic Target 2025 Fund
(For a share outstanding throughout each period)
| | | Year ended February 28 | | Year ended May 31 |
| Class R6 | Six months ended
August 31, 2021
(unaudited) | 2021 | 2020 1 | 2019 2 | | 2018 | 2017 | 2016 3 |
Net asset value, beginning of period
| $12.16 | $10.43 | $10.15 | $11.43 | | $10.91 | $9.96 | $10.00 |
Net investment income
| 0.14 | 0.20 | 0.25 4 | 0.15 | | 0.18 | 0.15 | 0.08 |
Net realized and unrealized gains (losses) on investments
| 1.09 | 1.81 | 0.25 | 0.11 | | 0.85 | 1.11 | (0.06) |
Total from investment operations
| 1.23 | 2.01 | 0.50 | 0.26 | | 1.03 | 1.26 | 0.02 |
| Distributions to shareholders from | | | | | | | | |
Net investment income
| 0.00 | (0.23) | (0.22) | (0.14) | | (0.23) | (0.14) | (0.06) |
Net realized gains
| 0.00 | (0.05) | 0.00 | (1.40) | | (0.28) | (0.17) | 0.00 |
Total distributions to shareholders
| 0.00 | (0.28) | (0.22) | (1.54) | | (0.51) | (0.31) | (0.06) |
Net asset value, end of period
| $13.39 | $12.16 | $10.43 | $10.15 | | $11.43 | $10.91 | $9.96 |
Total return5
| 10.12% | 19.33% | 4.83% | 3.13% | | 9.48% | 13.10% | 0.17% |
| Ratios to average net assets (annualized) | | | | | | | | |
Gross expenses
| 1.08% * | 1.77% * | 2.29% * | 3.39% * | | 3.70% ^ | 4.37% | 4.82% ^ |
Net expenses
| 0.22% * | 0.22% * | 0.22% * | 0.16% * | | 0.09% ^ | 0.08% ^ | 0.08% ^ |
Net investment income
| 1.98% * | 1.89% * | 2.31% * | 1.77% * | | 1.56% | 1.50% | 1.73% |
| Supplemental data | | | | | | | | |
Portfolio turnover rate6
| 50% | 85% | 37% | 41% | | 62% | 58% | 38% |
Net assets, end of period (000s omitted)
| $8,507 | $7,958 | $6,635 | $4,838 | | $5,451 | $5,201 | $4,609 |
| * | Ratios reflect net expenses allocated from the affiliated Master Portfolios which were as follows: |
| Six months ended August 31, 2021 (unaudited) | 0.11% |
| Year ended February 28, 2021 | 0.12% |
| Year ended February 29, 2020 | 0.15% |
| Year ended February 28, 20192 | 0.13% |
| ^ | Ratios do not reflect net expenses allocated from the affiliated Master Portfolios. Including annualized net expenses allocated from the affiliated Master Portfolios, the expense ratios would be increased by the following amounts: |
| Year ended May 31, 2018 | 0.10% |
| Year ended May 31, 2017 | 0.11% |
| Year ended May 31, 20163 | 0.11% |
| 1 | Year ended February 29 |
| 2 | For the nine months ended February 28, 2019. The Fund changed its fiscal year end from May 31 to February 28, effective February 28, 2019. |
| 3 | For the period from November 30, 2015 (commencement of class operations) to May 31, 2016 |
| 4 | Calculated based upon average shares outstanding |
| 5 | Returns for periods of less than one year are not annualized. |
| 6 | Portfolio turnover rate is calculated by multiplying the Fund’s ownership percentage in each respective affiliated Master Portfolio by the corresponding affiliated Master Portfolio’s purchases and sales. These purchase and sale amounts are aggregated with any direct purchases and sales in affiliated and unaffiliated mutual funds, exchange-traded funds and unaffiliated securities and included in the portfolio turnover calculation. |
The accompanying notes are an integral part of these financial statements.
90 | Target Date Retirement Funds
Financial highlights
Dynamic Target 2030 Fund
(For a share outstanding throughout each period)
| | | Year ended February 28 | | Year ended May 31 |
| Class A | Six months ended
August 31, 2021
(unaudited) | 2021 | 2020 1 | 2019 2 | | 2018 | 2017 | 2016 3 |
Net asset value, beginning of period
| $12.15 | $10.11 | $9.94 | $11.54 | | $10.92 | $9.91 | $10.00 |
Net investment income
| 0.10 | 0.15 | 0.18 | 0.11 | | 0.13 | 0.09 | 0.06 |
Net realized and unrealized gains (losses) on investments
| 1.19 | 2.09 | 0.17 | 0.12 | | 0.98 | 1.22 | (0.10) |
Total from investment operations
| 1.29 | 2.24 | 0.35 | 0.23 | | 1.11 | 1.31 | (0.04) |
| Distributions to shareholders from | | | | | | | | |
Net investment income
| 0.00 | (0.16) | (0.18) | (0.09) | | (0.19) | (0.11) | (0.05) |
Net realized gains
| 0.00 | (0.04) | 0.00 | (1.74) | | (0.30) | (0.19) | 0.00 |
Total distributions to shareholders
| 0.00 | (0.20) | (0.18) | (1.83) | | (0.49) | (0.30) | (0.05) |
Net asset value, end of period
| $13.44 | $12.15 | $10.11 | $9.94 | | $11.54 | $10.92 | $9.91 |
Total return4
| 10.62% | 22.30% | 3.40% | 2.99% | | 10.30% | 13.72% | (0.34)% |
| Ratios to average net assets (annualized) | | | | | | | | |
Gross expenses
| 1.61% * | 2.32% * | 2.94% * | 4.08% * | | 4.20% ^ | 4.76% ^ | 5.29% ^ |
Net expenses
| 0.66% * | 0.67% * | 0.66% * | 0.60% * | | 0.53% ^ | 0.48% ^ | 0.45% ^ |
Net investment income
| 1.47% * | 1.37% * | 1.77% * | 1.23% * | | 1.08% | 1.04% | 1.19% |
| Supplemental data | | | | | | | | |
Portfolio turnover rate5
| 49% | 85% | 36% | 37% | | 53% | 46% | 22% |
Net assets, end of period (000s omitted)
| $4,668 | $3,340 | $2,317 | $1,010 | | $917 | $543 | $173 |
| * | Ratios reflect net expenses allocated from the affiliated Master Portfolios which were as follows: |
| Six months ended August 31, 2021 (unaudited) | 0.12% |
| Year ended February 28, 2021 | 0.12% |
| Year ended February 29, 2020 | 0.15% |
| Year ended February 28, 20192 | 0.13% |
| ^ | Ratios do not reflect net expenses allocated from the affiliated Master Portfolios. Including annualized net expenses allocated from the affiliated Master Portfolios, the expense ratios would be increased by the following amounts: |
| Year ended May 31, 2018 | 0.10% |
| Year ended May 31, 2017 | 0.10% |
| Year ended May 31, 20163 | 0.10% |
| 1 | Year ended February 29 |
| 2 | For the nine months ended February 28, 2019. The Fund changed its fiscal year end from May 31 to February 28, effective February 28, 2019. |
| 3 | For the period from November 30, 2015 (commencement of class operations) to May 31, 2016 |
| 4 | Total return calculations do not include any sales charges. Returns for periods of less than one year are not annualized. |
| 5 | Portfolio turnover rate is calculated by multiplying the Fund’s ownership percentage in each respective affiliated Master Portfolio by the corresponding affiliated Master Portfolio’s purchases and sales. These purchase and sale amounts are aggregated with any direct purchases and sales in affiliated and unaffiliated mutual funds, exchange-traded funds and unaffiliated securities and included in the portfolio turnover calculation. |
The accompanying notes are an integral part of these financial statements.
Target Date Retirement Funds | 91
Financial highlights
Dynamic Target 2030 Fund
(For a share outstanding throughout each period)
| | | Year ended February 28 | | Year ended May 31 |
| Class C | Six months ended
August 31, 2021
(unaudited) | 2021 | 2020 1 | 2019 2 | | 2018 | 2017 | 2016 3 |
Net asset value, beginning of period
| $12.24 | $10.10 | $9.88 | $11.52 | | $10.90 | $9.88 | $10.00 |
Net investment income
| 0.05 | 0.07 | 0.12 4 | 0.05 | | 0.03 | 0.02 | 0.02 |
Payment from affiliate
| 0.00 | 0.13 | 0.00 | 0.00 | | 0.00 | 0.00 | 0.00 |
Net realized and unrealized gains (losses) on investments
| 1.19 | 2.10 | 0.15 | 0.11 | | 0.99 | 1.21 | (0.09) |
Total from investment operations
| 1.24 | 2.30 | 0.27 | 0.16 | | 1.02 | 1.23 | (0.07) |
| Distributions to shareholders from | | | | | | | | |
Net investment income
| 0.00 | (0.12) | (0.05) | (0.06) | | (0.10) | (0.02) | (0.05) |
Net realized gains
| 0.00 | (0.04) | 0.00 | (1.74) | | (0.30) | (0.19) | 0.00 |
Total distributions to shareholders
| 0.00 | (0.16) | (0.05) | (1.80) | | (0.40) | (0.21) | (0.05) |
Net asset value, end of period
| $13.48 | $12.24 | $10.10 | $9.88 | | $11.52 | $10.90 | $9.88 |
Total return5
| 10.13% | 22.95% 6 | 2.74% | 2.32% | | 9.43% | 12.86% | (0.70)% |
| Ratios to average net assets (annualized) | | | | | | | | |
Gross expenses
| 1.81% * | 2.69% * | 3.62% * | 4.81% * | | 4.95% ^ | 5.59% ^ | 6.03% ^ |
Net expenses
| 1.43% * | 1.43% * | 1.42% * | 1.35% * | | 1.29% ^ | 1.29% ^ | 1.30% ^ |
Net investment income
| 0.73% * | 0.65% * | 1.17% * | 0.49% * | | 0.27% | 0.24% | 0.49% |
| Supplemental data | | | | | | | | |
Portfolio turnover rate7
| 49% | 85% | 36% | 37% | | 53% | 46% | 22% |
Net assets, end of period (000s omitted)
| $143 | $126 | $104 | $153 | | $119 | $112 | $99 |
| * | Ratios reflect net expenses allocated from the affiliated Master Portfolios which were as follows: |
| Six months ended August 31, 2021 (unaudited) | 0.12% |
| Year ended February 28, 2021 | 0.11% |
| Year ended February 29, 2020 | 0.14% |
| Year ended February 28, 20192 | 0.12% |
| ^ | Ratios do not reflect net expenses allocated from the affiliated Master Portfolios. Including annualized net expenses allocated from the affiliated Master Portfolios, the expense ratios would be increased by the following amounts: |
| Year ended May 31, 2018 | 0.09% |
| Year ended May 31, 2017 | 0.10% |
| Year ended May 31, 20163 | 0.10% |
| 1 | Year ended February 29 |
| 2 | For the nine months ended February 28, 2019. The Fund changed its fiscal year end from May 31 to February 28, effective February 28, 2019. |
| 3 | For the period from November 30, 2015 (commencement of class operations) to May 31, 2016 |
| 4 | Calculated based upon average shares outstanding |
| 5 | Total return calculations do not include any sales charges. Returns for periods of less than one year are not annualized. |
| 6 | During the year ended February 28, 2021, the Fund received a payment from an affiliate which had an impact of 1.34% on the total return. See Note 4 in the Notes to Financial Statements for additional information. |
| 7 | Portfolio turnover rate is calculated by multiplying the Fund’s ownership percentage in each respective affiliated Master Portfolio by the corresponding affiliated Master Portfolio’s purchases and sales. These purchase and sale amounts are aggregated with any direct purchases and sales in affiliated and unaffiliated mutual funds, exchange-traded funds and unaffiliated securities and included in the portfolio turnover calculation. |
The accompanying notes are an integral part of these financial statements.
92 | Target Date Retirement Funds
Financial highlights
Dynamic Target 2030 Fund
(For a share outstanding throughout each period)
| | | Year ended February 28 | | Year ended May 31 |
| Class R4 | Six months ended
August 31, 2021
(unaudited) | 2021 | 2020 1 | 2019 2 | | 2018 | 2017 | 2016 3 |
Net asset value, beginning of period
| $12.25 | $10.18 | $9.99 | $11.59 | | $10.96 | $9.93 | $10.00 |
Net investment income
| 0.12 | 0.19 | 0.23 | 0.13 | | 0.15 | 0.13 | 0.07 |
Net realized and unrealized gains (losses) on investments
| 1.20 | 2.11 | 0.16 | 0.12 | | 0.99 | 1.21 | (0.08) |
Total from investment operations
| 1.32 | 2.30 | 0.39 | 0.25 | | 1.14 | 1.34 | (0.01) |
| Distributions to shareholders from | | | | | | | | |
Net investment income
| 0.00 | (0.19) | (0.20) | (0.11) | | (0.21) | (0.12) | (0.06) |
Net realized gains
| 0.00 | (0.04) | 0.00 | (1.74) | | (0.30) | (0.19) | 0.00 |
Total distributions to shareholders
| 0.00 | (0.23) | (0.20) | (1.85) | | (0.51) | (0.31) | (0.06) |
Net asset value, end of period
| $13.57 | $12.25 | $10.18 | $9.99 | | $11.59 | $10.96 | $9.93 |
Total return4
| 10.78% | 22.70% | 3.74% | 3.19% | | 10.53% | 13.99% | (0.10)% |
| Ratios to average net assets (annualized) | | | | | | | | |
Gross expenses
| 1.33% * | 2.04% * | 2.70% * | 3.80% * | | 3.92% ^ | 4.56% ^ | 5.00% ^ |
Net expenses
| 0.37% * | 0.37% * | 0.36% * | 0.31% * | | 0.25% ^ | 0.24% ^ | 0.24% ^ |
Net investment income
| 1.79% * | 1.70% * | 2.17% * | 1.51% * | | 1.32% | 1.29% | 1.55% |
| Supplemental data | | | | | | | | |
Portfolio turnover rate5
| 49% | 85% | 36% | 37% | | 53% | 46% | 22% |
Net assets, end of period (000s omitted)
| $141 | $127 | $106 | $104 | | $120 | $114 | $100 |
| * | Ratios reflect net expenses allocated from the affiliated Master Portfolios which were as follows: |
| Six months ended August 31, 2021 (unaudited) | 0.10% |
| Year ended February 28, 2021 | 0.10% |
| Year ended February 29, 2020 | 0.13% |
| Year ended February 28, 20192 | 0.12% |
| ^ | Ratios do not reflect net expenses allocated from the affiliated Master Portfolios. Including annualized net expenses allocated from the affiliated Master Portfolios, the expense ratios would be increased by the following amounts: |
| Year ended May 31, 2018 | 0.09% |
| Year ended May 31, 2017 | 0.10% |
| Year ended May 31, 20163 | 0.10% |
| 1 | Year ended February 29 |
| 2 | For the nine months ended February 28, 2019. The Fund changed its fiscal year end from May 31 to February 28, effective February 28, 2019. |
| 3 | For the period from November 30, 2015 (commencement of class operations) to May 31, 2016 |
| 4 | Returns for periods of less than one year are not annualized. |
| 5 | Portfolio turnover rate is calculated by multiplying the Fund’s ownership percentage in each respective affiliated Master Portfolio by the corresponding affiliated Master Portfolio’s purchases and sales. These purchase and sale amounts are aggregated with any direct purchases and sales in affiliated and unaffiliated mutual funds, exchange-traded funds and unaffiliated securities and included in the portfolio turnover calculation. |
The accompanying notes are an integral part of these financial statements.
Target Date Retirement Funds | 93
Financial highlights
Dynamic Target 2030 Fund
(For a share outstanding throughout each period)
| | | Year ended February 28 | | Year ended May 31 |
| Class R6 | Six months ended
August 31, 2021
(unaudited) | 2021 | 2020 1 | 2019 2 | | 2018 | 2017 | 2016 3 |
Net asset value, beginning of period
| $12.26 | $10.19 | $9.99 | $11.60 | | $10.96 | $9.93 | $10.00 |
Net investment income
| 0.13 4 | 0.16 | 0.24 4 | 0.14 | | 0.17 | 0.14 | 0.08 |
Net realized and unrealized gains (losses) on investments
| 1.20 | 2.16 | 0.17 | 0.12 | | 1.00 | 1.22 | (0.09) |
Total from investment operations
| 1.33 | 2.32 | 0.41 | 0.26 | | 1.17 | 1.36 | (0.01) |
| Distributions to shareholders from | | | | | | | | |
Net investment income
| 0.00 | (0.21) | (0.21) | (0.13) | | (0.23) | (0.14) | (0.06) |
Net realized gains
| 0.00 | (0.04) | 0.00 | (1.74) | | (0.30) | (0.19) | 0.00 |
Total distributions to shareholders
| 0.00 | (0.25) | (0.21) | (1.87) | | (0.53) | (0.33) | (0.06) |
Net asset value, end of period
| $13.59 | $12.26 | $10.19 | $9.99 | | $11.60 | $10.96 | $9.93 |
Total return5
| 10.85% | 22.85% | 3.99% | 3.26% | | 10.77% | 14.15% | (0.09)% |
| Ratios to average net assets (annualized) | | | | | | | | |
Gross expenses
| 1.19% * | 1.90% * | 2.54% * | 3.66% * | | 3.77% ^ | 4.41% ^ | 4.85% ^ |
Net expenses
| 0.22% * | 0.22% * | 0.22% * | 0.16% * | | 0.09% ^ | 0.08% ^ | 0.09% ^ |
Net investment income
| 1.92% * | 1.84% * | 2.29% * | 1.66% * | | 1.47% | 1.440% | 1.70% |
| Supplemental data | | | | | | | | |
Portfolio turnover rate6
| 49% | 85% | 36% | 37% | | 53% | 46% | 22% |
Net assets, end of period (000s omitted)
| $8,835 | $7,513 | $5,543 | $4,775 | | $5,544 | $5,238 | $4,597 |
| * | Ratios reflect net expenses allocated from the affiliated Master Portfolios which were as follows: |
| Six months ended August 31, 2021 (unaudited) | 0.12% |
| Year ended February 28, 2021 | 0.12% |
| Year ended February 29, 2020 | 0.15% |
| Year ended February 28, 20192 | 0.13% |
| ^ | Ratios do not reflect net expenses allocated from the affiliated Master Portfolios. Including annualized net expenses allocated from the affiliated Master Portfolios, the expense ratios would be increased by the following amounts: |
| Year ended May 31, 2018 | 0.10% |
| Year ended May 31, 2017 | 0.11% |
| Year ended May 31, 20163 | 0.11% |
| 1 | Year ended February 29 |
| 2 | For the nine months ended February 28, 2019. The Fund changed its fiscal year end from May 31 to February 28, effective February 28, 2019. |
| 3 | For the period from November 30, 2015 (commencement of class operations) to May 31, 2016 |
| 4 | Calculated based upon average shares outstanding |
| 5 | Returns for periods of less than one year are not annualized. |
| 6 | Portfolio turnover rate is calculated by multiplying the Fund’s ownership percentage in each respective affiliated Master Portfolio by the corresponding affiliated Master Portfolio’s purchases and sales. These purchase and sale amounts are aggregated with any direct purchases and sales in affiliated and unaffiliated mutual funds, exchange-traded funds and unaffiliated securities and included in the portfolio turnover calculation. |
The accompanying notes are an integral part of these financial statements.
94 | Target Date Retirement Funds
Financial highlights
Dynamic Target 2035 Fund
(For a share outstanding throughout each period)
| | | Year ended February 28 | | Year ended May 31 |
| Class A | Six months ended
August 31, 2021
(unaudited) | 2021 | 2020 1 | 2019 2 | | 2018 | 2017 | 2016 3 |
Net asset value, beginning of period
| $12.22 | $9.95 | $9.84 | $11.66 | | $10.97 | $9.88 | $10.00 |
Net investment income
| 0.10 | 0.14 | 0.18 | 0.09 | | 0.11 | 0.09 | 0.06 |
Net realized and unrealized gains (losses) on investments
| 1.23 | 2.30 | 0.09 | 0.14 | | 1.11 | 1.32 | (0.12) |
Total from investment operations
| 1.33 | 2.44 | 0.27 | 0.23 | | 1.22 | 1.41 | (0.06) |
| Distributions to shareholders from | | | | | | | | |
Net investment income
| 0.00 | (0.17) | (0.16) | (0.08) | | (0.19) | (0.11) | (0.06) |
Net realized gains
| 0.00 | 0.00 | 0.00 | (1.97) | | (0.34) | (0.21) | 0.00 |
Total distributions to shareholders
| 0.00 | (0.17) | (0.16) | (2.05) | | (0.53) | (0.32) | (0.06) |
Net asset value, end of period
| $13.55 | $12.22 | $9.95 | $9.84 | | $11.66 | $10.97 | $9.88 |
Total return4
| 10.88% | 24.45% | 2.65% | 3.13% | | 11.24% | 14.74% | (0.62)% |
| Ratios to average net assets (annualized) | | | | | | | | |
Gross expenses
| 1.65% * | 2.41% * | 3.12% * | 4.34% * | | 4.32% ^ | 4.86% ^ | 5.32% ^ |
Net expenses
| 0.66% * | 0.67% * | 0.66% * | 0.60% * | | 0.53% ^ | 0.49% ^ | 0.55% ^ |
Net investment income
| 1.47% * | 1.30% * | 1.81% * | 1.16% * | | 0.99% | 1.05% | 1.24% |
| Supplemental data | | | | | | | | |
Portfolio turnover rate5
| 48% | 85% | 36% | 34% | | 44% | 39% | 19% |
Net assets, end of period (000s omitted)
| $1,847 | $1,464 | $733 | $521 | | $453 | $338 | $119 |
| * | Ratios reflect net expenses allocated from the affiliated Master Portfolios which were as follows: |
| Six months ended August 31, 2021 (unaudited) | 0.12% |
| Year ended February 28, 2021 | 0.12% |
| Year ended February 29, 2020 | 0.15% |
| Year ended February 28, 20192 | 0.13% |
| ^ | Ratios do not reflect net expenses allocated from the affiliated Master Portfolios. Including annualized net expenses allocated from the affiliated Master Portfolios, the expense ratios would be increased by the following amounts: |
| Year ended May 31, 2018 | 0.09% |
| Year ended May 31, 2017 | 0.10% |
| Year ended May 31, 20163 | 0.10% |
| 1 | Year ended February 29 |
| 2 | For the nine months ended February 28, 2019. The Fund changed its fiscal year end from May 31 to February 28, effective February 28, 2019. |
| 3 | For the period from November 30, 2015 (commencement of class operations) to May 31, 2016 |
| 4 | Total return calculations do not include any sales charges. Returns for periods of less than one year are not annualized. |
| 5 | Portfolio turnover rate is calculated by multiplying the Fund’s ownership percentage in each respective affiliated Master Portfolio by the corresponding affiliated Master Portfolio’s purchases and sales. These purchase and sale amounts are aggregated with any direct purchases and sales in affiliated and unaffiliated mutual funds, exchange-traded funds and unaffiliated securities and included in the portfolio turnover calculation. |
The accompanying notes are an integral part of these financial statements.
Target Date Retirement Funds | 95
Financial highlights
Dynamic Target 2035 Fund
(For a share outstanding throughout each period)
| | | Year ended February 28 | | Year ended May 31 |
| Class C | Six months ended
August 31, 2021
(unaudited) | 2021 | 2020 1 | 2019 2 | | 2018 | 2017 | 2016 3 |
Net asset value, beginning of period
| $12.33 | $9.93 | $9.83 | $11.63 | | $10.95 | $9.84 | $10.00 |
Net investment income
| 0.05 | 0.07 | 0.11 | 0.03 | | 0.02 | 0.02 | 0.02 |
Payment from affiliate
| 0.00 | 0.16 | 0.00 | 0.00 | | 0.00 | 0.00 | 0.00 |
Net realized and unrealized gains (losses) on investments
| 1.24 | 2.29 | 0.09 | 0.14 | | 1.10 | 1.32 | (0.13) |
Total from investment operations
| 1.29 | 2.52 | 0.20 | 0.17 | | 1.12 | 1.34 | (0.11) |
| Distributions to shareholders from | | | | | | | | |
Net investment income
| 0.00 | (0.12) | (0.10) | 0.00 | | (0.10) | (0.02) | (0.05) |
Net realized gains
| 0.00 | 0.00 | 0.00 | (1.97) | | (0.34) | (0.21) | 0.00 |
Total distributions to shareholders
| 0.00 | (0.12) | (0.10) | (1.97) | | (0.44) | (0.23) | (0.05) |
Net asset value, end of period
| $13.62 | $12.33 | $9.93 | $9.83 | | $11.63 | $10.95 | $9.84 |
Total return4
| 10.46% | 25.39% 5 | 1.99% | 2.55% | | 10.30% | 14.02% | (1.08)% |
| Ratios to average net assets (annualized) | | | | | | | | |
Gross expenses
| 1.85% * | 2.78% * | 3.71% * | 5.08% * | | 5.07% ^ | 5.67% ^ | 6.06% ^ |
Net expenses
| 1.43% * | 1.43% * | 1.42% * | 1.36% * | | 1.29% ^ | 1.29% ^ | 1.30% ^ |
Net investment income
| 0.71% * | 0.62% * | 1.09% * | 0.37% * | | 0.21% | 0.21% | 0.48% |
| Supplemental data | | | | | | | | |
Portfolio turnover rate6
| 48% | 85% | 36% | 34% | | 44% | 39% | 19% |
Net assets, end of period (000s omitted)
| $151 | $135 | $107 | $102 | | $120 | $113 | $99 |
| * | Ratios reflect net expenses allocated from the affiliated Master Portfolios which were as follows: |
| Six months ended August 31, 2021 (unaudited) | 0.11% |
| Year ended February 28, 2021 | 0.11% |
| Year ended February 29, 2020 | 0.14% |
| Year ended February 28, 20192 | 0.13% |
| ^ | Ratios do not reflect net expenses allocated from the affiliated Master Portfolios. Including annualized net expenses allocated from the affiliated Master Portfolios, the expense ratios would be increased by the following amounts: |
| Year ended May 31, 2018 | 0.09% |
| Year ended May 31, 2017 | 0.10% |
| Year ended May 31, 20163 | 0.10% |
| 1 | Year ended February 29 |
| 2 | For the nine months ended February 28, 2019. The Fund changed its fiscal year end from May 31 to February 28, effective February 28, 2019. |
| 3 | For the period from November 30, 2015 (commencement of class operations) to May 31, 2016 |
| 4 | Total return calculations do not include any sales charges. Returns for periods of less than one year are not annualized. |
| 5 | During the year ended February 28, 2021, the Fund received a payment from an affiliate which had an impact of 1.66% on the total return. See Note 4 in the Notes to Financial Statements for additional information. |
| 6 | Portfolio turnover rate is calculated by multiplying the Fund’s ownership percentage in each respective affiliated Master Portfolio by the corresponding affiliated Master Portfolio’s purchases and sales. These purchase and sale amounts are aggregated with any direct purchases and sales in affiliated and unaffiliated mutual funds, exchange-traded funds and unaffiliated securities and included in the portfolio turnover calculation. |
The accompanying notes are an integral part of these financial statements.
96 | Target Date Retirement Funds
Financial highlights
Dynamic Target 2035 Fund
(For a share outstanding throughout each period)
| | | Year ended February 28 | | Year ended May 31 |
| Class R4 | Six months ended
August 31, 2021
(unaudited) | 2021 | 2020 1 | 2019 2 | | 2018 | 2017 | 2016 3 |
Net asset value, beginning of period
| $12.31 | $10.02 | $9.89 | $11.71 | | $11.00 | $9.89 | $10.00 |
Net investment income
| 0.12 | 0.18 | 0.22 | 0.12 | | 0.15 | 0.13 | 0.07 |
Net realized and unrealized gains (losses) on investments
| 1.24 | 2.30 | 0.09 | 0.13 | | 1.11 | 1.31 | (0.12) |
Total from investment operations
| 1.36 | 2.48 | 0.31 | 0.25 | | 1.26 | 1.44 | (0.05) |
| Distributions to shareholders from | | | | | | | | |
Net investment income
| 0.00 | (0.19) | (0.18) | (0.10) | | (0.21) | (0.12) | (0.06) |
Net realized gains
| 0.00 | 0.00 | 0.00 | (1.97) | | (0.34) | (0.21) | 0.00 |
Total distributions to shareholders
| 0.00 | (0.19) | (0.18) | (2.07) | | (0.55) | (0.33) | (0.06) |
Net asset value, end of period
| $13.67 | $12.31 | $10.02 | $9.89 | | $11.71 | $11.00 | $9.89 |
Total return4
| 11.05% | 24.82% | 3.05% | 3.34% | | 11.59% | 15.05% | (0.48)% |
| Ratios to average net assets (annualized) | | | | | | | | |
Gross expenses
| 1.37% * | 2.12% * | 2.86% * | 4.06% * | | 4.04% ^ | 4.64% ^ | 5.03% ^ |
Net expenses
| 0.37% * | 0.37% * | 0.36% * | 0.31% * | | 0.25% ^ | 0.24% ^ | 0.24% ^ |
Net investment income
| 1.77% * | 1.68% * | 2.15% * | 1.42% * | | 1.26% | 1.26% | 1.54% |
| Supplemental data | | | | | | | | |
Portfolio turnover rate5
| 48% | 85% | 36% | 34% | | 44% | 39% | 19% |
Net assets, end of period (000s omitted)
| $142 | $128 | $104 | $103 | | $122 | $114 | $99 |
| * | Ratios reflect net expenses allocated from the affiliated Master Portfolios which were as follows: |
| Six months ended August 31, 2021 (unaudited) | 0.11% |
| Year ended February 28, 2021 | 0.11% |
| Year ended February 29, 2020 | 0.14% |
| Year ended February 28, 20192 | 0.13% |
| ^ | Ratios do not reflect net expenses allocated from the affiliated Master Portfolios. Including annualized net expenses allocated from the affiliated Master Portfolios, the expense ratios would be increased by the following amounts: |
| Year ended May 31, 2018 | 0.09% |
| Year ended May 31, 2017 | 0.10% |
| Year ended May 31, 20163 | 0.10% |
| 1 | Year ended February 29 |
| 2 | For the nine months ended February 28, 2019. The Fund changed its fiscal year end from May 31 to February 28, effective February 28, 2019. |
| 3 | For the period from November 30, 2015 (commencement of class operations) to May 31, 2016 |
| 4 | Returns for periods of less than one year are not annualized. |
| 5 | Portfolio turnover rate is calculated by multiplying the Fund’s ownership percentage in each respective affiliated Master Portfolio by the corresponding affiliated Master Portfolio’s purchases and sales. These purchase and sale amounts are aggregated with any direct purchases and sales in affiliated and unaffiliated mutual funds, exchange-traded funds and unaffiliated securities and included in the portfolio turnover calculation. |
The accompanying notes are an integral part of these financial statements.
Target Date Retirement Funds | 97
Financial highlights
Dynamic Target 2035 Fund
(For a share outstanding throughout each period)
| | | Year ended February 28 | | Year ended May 31 |
| Class R6 | Six months ended
August 31, 2021
(unaudited) | 2021 | 2020 1 | 2019 2 | | 2018 | 2017 | 2016 3 |
Net asset value, beginning of period
| $12.32 | $10.02 | $9.89 | $11.72 | | $11.01 | $9.89 | $10.00 |
Net investment income
| 0.13 | 0.19 | 0.23 4 | 0.13 | | 0.16 | 0.14 | 0.08 |
Net realized and unrealized gains (losses) on investments
| 1.25 | 2.32 | 0.10 | 0.13 | | 1.12 | 1.33 | (0.13) |
Total from investment operations
| 1.38 | 2.51 | 0.33 | 0.26 | | 1.28 | 1.47 | (0.05) |
| Distributions to shareholders from | | | | | | | | |
Net investment income
| 0.00 | (0.21) | (0.20) | (0.12) | | (0.23) | (0.14) | (0.06) |
Net realized gains
| 0.00 | 0.00 | 0.00 | (1.97) | | (0.34) | (0.21) | 0.00 |
Total distributions to shareholders
| 0.00 | (0.21) | (0.20) | (2.09) | | (0.57) | (0.35) | (0.06) |
Net asset value, end of period
| $13.70 | $12.32 | $10.02 | $9.89 | | $11.72 | $11.01 | $9.89 |
Total return5
| 11.20% | 25.09% | 3.19% | 3.41% | | 11.73% | 15.31% | (0.46)% |
| Ratios to average net assets (annualized) | | | | | | | | |
Gross expenses
| 1.23% * | 1.96% * | 2.66% * | 3.91% * | | 3.89% ^ | 4.49% ^ | 4.88% ^ |
Net expenses
| 0.22% * | 0.22% * | 0.22% * | 0.16% * | | 0.09% ^ | 0.08% ^ | 0.08% ^ |
Net investment income
| 1.92% * | 1.81% * | 2.22% * | 1.57% * | | 1.41% | 1.41% | 1.69% |
| Supplemental data | | | | | | | | |
Portfolio turnover rate6
| 48% | 85% | 36% | 34% | | 44% | 39% | 19% |
Net assets, end of period (000s omitted)
| $10,454 | $9,185 | $6,780 | $4,734 | | $5,608 | $5,270 | $4,580 |
| * | Ratios reflect net expenses allocated from the affiliated Master Portfolios which were as follows: |
| Six months ended August 31, 2021 (unaudited) | 0.12% |
| Year ended February 28, 2021 | 0.13% |
| Year ended February 29, 2020 | 0.16% |
| Year ended February 28, 20192 | 0.13% |
| ^ | Ratios do not reflect net expenses allocated from the affiliated Master Portfolios. Including annualized net expenses allocated from the affiliated Master Portfolios, the expense ratios would be increased by the following amounts: |
| Year ended May 31, 2018 | 0.10% |
| Year ended May 31, 2017 | 0.11% |
| Year ended May 31, 20163 | 0.11% |
| 1 | Year ended February 29 |
| 2 | For the nine months ended February 28, 2019. The Fund changed its fiscal year end from May 31 to February 28, effective February 28, 2019. |
| 3 | For the period from November 30, 2015 (commencement of class operations) to May 31, 2016 |
| 4 | Calculated based upon average shares outstanding |
| 5 | Returns for periods of less than one year are not annualized. |
| 6 | Portfolio turnover rate is calculated by multiplying the Fund’s ownership percentage in each respective affiliated Master Portfolio by the corresponding affiliated Master Portfolio’s purchases and sales. These purchase and sale amounts are aggregated with any direct purchases and sales in affiliated and unaffiliated mutual funds, exchange-traded funds and unaffiliated securities and included in the portfolio turnover calculation. |
The accompanying notes are an integral part of these financial statements.
98 | Target Date Retirement Funds
Financial highlights
Dynamic Target 2040 Fund
(For a share outstanding throughout each period)
| | | Year ended February 28 | | Year ended May 31 |
| Class A | Six months ended
August 31, 2021
(unaudited) | 2021 | 2020 1 | 2019 2 | | 2018 | 2017 | 2016 3 |
Net asset value, beginning of period
| $12.08 | $9.83 | $9.77 | $11.74 | | $11.00 | $9.85 | $10.00 |
Net investment income
| 0.10 | 0.15 | 0.16 | 0.08 | | 0.09 | 0.09 | 0.06 |
Net realized and unrealized gains (losses) on investments
| 1.28 | 2.27 | 0.08 | 0.11 | | 1.20 | 1.37 | (0.15) |
Total from investment operations
| 1.38 | 2.42 | 0.24 | 0.19 | | 1.29 | 1.46 | (0.09) |
| Distributions to shareholders from | | | | | | | | |
Net investment income
| 0.00 | (0.17) | (0.18) | (0.06) | | (0.20) | (0.11) | (0.06) |
Net realized gains
| 0.00 | 0.00 | 0.00 | (2.10) | | (0.35) | (0.20) | 0.00 |
Total distributions to shareholders
| 0.00 | (0.17) | (0.18) | (2.16) | | (0.55) | (0.31) | (0.06) |
Net asset value, end of period
| $13.46 | $12.08 | $9.83 | $9.77 | | $11.74 | $11.00 | $9.85 |
Total return4
| 11.42% | 24.64% | 2.33% | 2.80% | | 11.79% | 15.34% | (0.90)% |
| Ratios to average net assets (annualized) | | | | | | | | |
Gross expenses
| 1.75% * | 2.63% * | 3.57% * | 4.11% * | | 3.93% ^ | 4.46% ^ | 5.33% ^ |
Net expenses
| 0.67% * | 0.68% * | 0.67% * | 0.63% * | | 0.54% ^ | 0.51% ^ | 0.53% ^ |
Net investment income
| 1.48% * | 1.30% * | 1.62% * | 0.99% * | | 1.02% | 1.01% | 1.22% |
| Supplemental data | | | | | | | | |
Portfolio turnover rate5
| 47% | 87% | 36% | 32% | | 40% | 33% | 15% |
Net assets, end of period (000s omitted)
| $3,742 | $3,279 | $1,858 | $454 | | $472 | $307 | $157 |
| * | Ratios reflect net expenses allocated from the affiliated Master Portfolios which were as follows: |
| Six months ended August 31, 2021 (unaudited) | 0.12% |
| Year ended February 28, 2021 | 0.13% |
| Year ended February 29, 2020 | 0.16% |
| Year ended February 28, 20192 | 0.13% |
| ^ | Ratios do not reflect net expenses allocated from the affiliated Master Portfolios. Including annualized net expenses allocated from the affiliated Master Portfolios, the expense ratios would be increased by the following amounts: |
| Year ended May 31, 2018 | 0.09% |
| Year ended May 31, 2017 | 0.10% |
| Year ended May 31, 20163 | 0.10% |
| 1 | Year ended February 29 |
| 2 | For the nine months ended February 28, 2019. The Fund changed its fiscal year end from May 31 to February 28, effective February 28, 2019. |
| 3 | For the period from November 30, 2015 (commencement of class operations) to May 31, 2016 |
| 4 | Total return calculations do not include any sales charges. Returns for periods of less than one year are not annualized. |
| 5 | Portfolio turnover rate is calculated by multiplying the Fund’s ownership percentage in each respective affiliated Master Portfolio by the corresponding affiliated Master Portfolio’s purchases and sales. These purchase and sale amounts are aggregated with any direct purchases and sales in affiliated and unaffiliated mutual funds, exchange-traded funds and unaffiliated securities and included in the portfolio turnover calculation. |
The accompanying notes are an integral part of these financial statements.
Target Date Retirement Funds | 99
Financial highlights
Dynamic Target 2040 Fund
(For a share outstanding throughout each period)
| | | Year ended February 28 | | Year ended May 31 |
| Class C | Six months ended
August 31, 2021
(unaudited) | 2021 | 2020 1 | 2019 2 | | 2018 | 2017 | 2016 3 |
Net asset value, beginning of period
| $12.19 | $9.81 | $9.76 | $11.72 | | $10.98 | $9.82 | $10.00 |
Net investment income
| 0.05 | 0.06 | 0.11 | 0.02 | | 0.02 | 0.02 | 0.02 |
Payment from affiliate
| 0.00 | 0.16 | 0.00 | 0.00 | | 0.00 | 0.00 | 0.00 |
Net realized and unrealized gains (losses) on investments
| 1.29 | 2.28 | 0.05 | 0.12 | | 1.17 | 1.36 | (0.15) |
Total from investment operations
| 1.34 | 2.50 | 0.16 | 0.14 | | 1.19 | 1.38 | (0.13) |
| Distributions to shareholders from | | | | | | | | |
Net investment income
| 0.00 | (0.12) | (0.11) | 0.00 | | (0.10) | (0.02) | (0.05) |
Net realized gains
| 0.00 | 0.00 | 0.00 | (2.10) | | (0.35) | (0.20) | 0.00 |
Total distributions to shareholders
| 0.00 | (0.12) | (0.11) | (2.10) | | (0.45) | (0.22) | (0.05) |
Net asset value, end of period
| $13.53 | $12.19 | $9.81 | $9.76 | | $11.72 | $10.98 | $9.82 |
Total return4
| 10.99% | 25.52% 5 | 1.53% | 2.30% | | 10.88% | 14.52% | (1.25)% |
| Ratios to average net assets (annualized) | | | | | | | | |
Gross expenses
| 1.94% * | 3.00% * | 4.35% * | 4.85% * | | 4.70% ^ | 5.25% ^ | 6.07% ^ |
Net expenses
| 1.43% * | 1.43% * | 1.42% * | 1.38% * | | 1.29% ^ | 1.30% ^ | 1.30% ^ |
Net investment income
| 0.73% * | 0.59% * | 1.05% * | 0.25% * | | 0.16% | 0.18% | 0.47% |
| Supplemental data | | | | | | | | |
Portfolio turnover rate6
| 47% | 87% | 36% | 32% | | 40% | 33% | 15% |
Net assets, end of period (000s omitted)
| $147 | $130 | $101 | $100 | | $120 | $113 | $99 |
| * | Ratios reflect net expenses allocated from the affiliated Master Portfolios which were as follows: |
| Six months ended August 31, 2021 (unaudited) | 0.11% |
| Year ended February 28, 2021 | 0.12% |
| Year ended February 29, 2020 | 0.14% |
| Year ended February 28, 20192 | 0.13% |
| ^ | Ratios do not reflect net expenses allocated from the affiliated Master Portfolios. Including annualized net expenses allocated from the affiliated Master Portfolios, the expense ratios would be increased by the following amounts: |
| Year ended May 31, 2018 | 0.09% |
| Year ended May 31, 2017 | 0.10% |
| Year ended May 31, 20163 | 0.10% |
| 1 | Year ended February 29 |
| 2 | For the nine months ended February 28, 2019. The Fund changed its fiscal year end from May 31 to February 28, effective February 28, 2019. |
| 3 | For the period from November 30, 2015 (commencement of class operations) to May 31, 2016 |
| 4 | Total return calculations do not include any sales charges. Returns for periods of less than one year are not annualized. |
| 5 | During the year ended February 28, 2021, the Fund received a payment from an affiliate which had an impact of 1.64% on the total return. See Note 4 in the Notes to Financial Statements for additional information. |
| 6 | Portfolio turnover rate is calculated by multiplying the Fund’s ownership percentage in each respective affiliated Master Portfolio by the corresponding affiliated Master Portfolio’s purchases and sales. These purchase and sale amounts are aggregated with any direct purchases and sales in affiliated and unaffiliated mutual funds, exchange-traded funds and unaffiliated securities and included in the portfolio turnover calculation. |
The accompanying notes are an integral part of these financial statements.
100 | Target Date Retirement Funds
Financial highlights
Dynamic Target 2040 Fund
(For a share outstanding throughout each period)
| | | Year ended February 28 | | Year ended May 31 |
| Class R4 | Six months ended
August 31, 2021
(unaudited) | 2021 | 2020 1 | 2019 2 | | 2018 | 2017 | 2016 3 |
Net asset value, beginning of period
| $12.19 | $9.91 | $9.83 | $11.80 | | $11.04 | $9.86 | $10.00 |
Net investment income
| 0.12 | 0.18 | 0.22 | 0.11 | | 0.14 | 0.13 | 0.07 |
Net realized and unrealized gains (losses) on investments
| 1.30 | 2.29 | 0.05 | 0.11 | | 1.18 | 1.37 | (0.15) |
Total from investment operations
| 1.42 | 2.47 | 0.27 | 0.22 | | 1.32 | 1.50 | (0.08) |
| Distributions to shareholders from | | | | | | | | |
Net investment income
| 0.00 | (0.19) | (0.19) | (0.09) | | (0.21) | (0.12) | (0.06) |
Net realized gains
| 0.00 | 0.00 | 0.00 | (2.10) | | (0.35) | (0.20) | 0.00 |
Total distributions to shareholders
| 0.00 | (0.19) | (0.19) | (2.19) | | (0.56) | (0.32) | (0.06) |
Net asset value, end of period
| $13.61 | $12.19 | $9.91 | $9.83 | | $11.80 | $11.04 | $9.86 |
Total return4
| 11.65% | 24.98% | 2.61% | 3.06% | | 12.07% | 15.78% | (0.76)% |
| Ratios to average net assets (annualized) | | | | | | | | |
Gross expenses
| 1.46% * | 2.36% * | 3.31% * | 3.82% * | | 3.67% ^ | 4.22% ^ | 5.04% ^ |
Net expenses
| 0.37% * | 0.37% * | 0.36% * | 0.34% * | | 0.25% ^ | 0.24% ^ | 0.24% ^ |
Net investment income
| 1.79% * | 1.65% * | 2.10% * | 1.29% * | | 1.21% | 1.24% | 1.53% |
| Supplemental data | | | | | | | | |
Portfolio turnover rate5
| 47% | 87% | 36% | 32% | | 40% | 33% | 15% |
Net assets, end of period (000s omitted)
| $141 | $127 | $103 | $102 | | $123 | $115 | $99 |
| * | Ratios reflect net expenses allocated from the affiliated Master Portfolios which were as follows: |
| Six months ended August 31, 2021 (unaudited) | 0.11% |
| Year ended February 28, 2021 | 0.12% |
| Year ended February 29, 2020 | 0.14% |
| Year ended February 28, 20192 | 0.13% |
| ^ | Ratios do not reflect net expenses allocated from the affiliated Master Portfolios. Including annualized net expenses allocated from the affiliated Master Portfolios, the expense ratios would be increased by the following amounts: |
| Year ended May 31, 2018 | 0.09% |
| Year ended May 31, 2017 | 0.10% |
| Year ended May 31, 20163 | 0.10% |
| 1 | Year ended February 29 |
| 2 | For the nine months ended February 28, 2019. The Fund changed its fiscal year end from May 31 to February 28, effective February 28, 2019. |
| 3 | For the period from November 30, 2015 (commencement of class operations) to May 31, 2016 |
| 4 | Returns for periods of less than one year are not annualized. |
| 5 | Portfolio turnover rate is calculated by multiplying the Fund’s ownership percentage in each respective affiliated Master Portfolio by the corresponding affiliated Master Portfolio’s purchases and sales. These purchase and sale amounts are aggregated with any direct purchases and sales in affiliated and unaffiliated mutual funds, exchange-traded funds and unaffiliated securities and included in the portfolio turnover calculation. |
The accompanying notes are an integral part of these financial statements.
Target Date Retirement Funds | 101
Financial highlights
Dynamic Target 2040 Fund
(For a share outstanding throughout each period)
| | | Year ended February 28 | | Year ended May 31 |
| Class R6 | Six months ended
August 31, 2021
(unaudited) | 2021 | 2020 1 | 2019 2 | | 2018 | 2017 | 2016 3 |
Net asset value, beginning of period
| $12.20 | $9.92 | $9.84 | $11.81 | | $11.04 | $9.87 | $10.00 |
Net investment income
| 0.13 | 0.19 | 0.23 | 0.12 | | 0.16 | 0.14 | 0.08 |
Net realized and unrealized gains (losses) on investments
| 1.30 | 2.30 | 0.06 | 0.12 | | 1.19 | 1.36 | (0.14) |
Total from investment operations
| 1.43 | 2.49 | 0.29 | 0.24 | | 1.35 | 1.50 | (0.06) |
| Distributions to shareholders from | | | | | | | | |
Net investment income
| 0.00 | (0.21) | (0.21) | (0.11) | | (0.23) | (0.13) | (0.07) |
Net realized gains
| 0.00 | 0.00 | 0.00 | (2.10) | | (0.35) | (0.20) | 0.00 |
Total distributions to shareholders
| 0.00 | (0.21) | (0.21) | (2.21) | | (0.58) | (0.33) | (0.07) |
Net asset value, end of period
| $13.63 | $12.20 | $9.92 | $9.84 | | $11.81 | $11.04 | $9.87 |
Total return4
| 11.72% | 25.12% | 2.75% | 3.24% | | 12.31% | 15.82% | (0.64)% |
| Ratios to average net assets (annualized) | | | | | | | | |
Gross expenses
| 1.32% * | 2.20% * | 3.15% * | 3.67% * | | 3.52% ^ | 4.07% ^ | 4.90% ^ |
Net expenses
| 0.22% * | 0.22% * | 0.21% * | 0.19% * | | 0.10% ^ | 0.09% ^ | 0.09% ^ |
Net investment income
| 1.94% * | 1.80% * | 2.24% * | 1.44% * | | 1.36% | 1.39% | 1.69% |
| Supplemental data | | | | | | | | |
Portfolio turnover rate5
| 47% | 87% | 36% | 32% | | 40% | 33% | 15% |
Net assets, end of period (000s omitted)
| $6,820 | $6,050 | $4,897 | $4,707 | | $5,651 | $5,285 | $4,571 |
| * | Ratios reflect net expenses allocated from the affiliated Master Portfolios which were as follows: |
| Six months ended August 31, 2021 (unaudited) | 0.12% |
| Year ended February 28, 2021 | 0.13% |
| Year ended February 29, 2020 | 0.16% |
| Year ended February 28, 20192 | 0.13% |
| ^ | Ratios do not reflect net expenses allocated from the affiliated Master Portfolios. Including annualized net expenses allocated from the affiliated Master Portfolios, the expense ratios would be increased by the following amounts: |
| Year ended May 31, 2018 | 0.10% |
| Year ended May 31, 2017 | 0.11% |
| Year ended May 31, 20163 | 0.11% |
| 1 | Year ended February 29 |
| 2 | For the nine months ended February 28, 2019. The Fund changed its fiscal year end from May 31 to February 28, effective February 28, 2019. |
| 3 | For the period from November 30, 2015 (commencement of class operations) to May 31, 2016 |
| 4 | Returns for periods of less than one year are not annualized. |
| 5 | Portfolio turnover rate is calculated by multiplying the Fund’s ownership percentage in each respective affiliated Master Portfolio by the corresponding affiliated Master Portfolio’s purchases and sales. These purchase and sale amounts are aggregated with any direct purchases and sales in affiliated and unaffiliated mutual funds, exchange-traded funds and unaffiliated securities and included in the portfolio turnover calculation. |
The accompanying notes are an integral part of these financial statements.
102 | Target Date Retirement Funds
Financial highlights
Dynamic Target 2045 Fund
(For a share outstanding throughout each period)
| | | Year ended February 28 | | Year ended May 31 |
| Class A | Six months ended
August 31, 2021
(unaudited) | 2021 | 2020 1 | 2019 2 | | 2018 | 2017 | 2016 3 |
Net asset value, beginning of period
| $12.11 | $9.72 | $9.73 | $11.79 | | $11.02 | $9.86 | $10.00 |
Net investment income
| 0.10 | 0.15 | 0.16 | 0.08 | | 0.12 | 0.08 | 0.06 |
Net realized and unrealized gains (losses) on investments
| 1.36 | 2.41 | 0.00 4 | 0.08 | | 1.20 | 1.41 | (0.14) |
Total from investment operations
| 1.46 | 2.56 | 0.16 | 0.16 | | 1.32 | 1.49 | (0.08) |
| Distributions to shareholders from | | | | | | | | |
Net investment income
| 0.00 | (0.17) | (0.17) | (0.07) | | (0.19) | (0.10) | (0.06) |
Net realized gains
| 0.00 | 0.00 | 0.00 | (2.15) | | (0.36) | (0.23) | 0.00 |
Total distributions to shareholders
| 0.00 | (0.17) | (0.17) | (2.22) | | (0.55) | (0.33) | (0.06) |
Net asset value, end of period
| $13.57 | $12.11 | $9.72 | $9.73 | | $11.79 | $11.02 | $9.86 |
Total return5
| 12.06% | 26.37% | 1.53% | 2.62% | | 12.06% | 15.64% | (0.79)% |
| Ratios to average net assets (annualized) | | | | | | | | |
Gross expenses
| 1.96% * | 2.96% * | 3.61% * | 4.18% * | | 4.09% ^ | 4.58% ^ | 5.36% ^ |
Net expenses
| 0.67% * | 0.67% * | 0.66% * | 0.61% * | | 0.54% ^ | 0.51% ^ | 0.53% ^ |
Net investment income
| 1.54% * | 1.26% * | 1.72% * | 0.97% * | | 0.90% | 0.98% | 1.23% |
| Supplemental data | | | | | | | | |
Portfolio turnover rate6
| 46% | 86% | 36% | 31% | | 35% | 31% | 14% |
Net assets, end of period (000s omitted)
| $796 | $794 | $414 | $329 | | $327 | $221 | $121 |
| * | Ratios reflect net expenses allocated from the affiliated Master Portfolios which were as follows: |
| Six months ended August 31, 2021 (unaudited) | 0.13% |
| Year ended February 28, 2021 | 0.13% |
| Year ended February 29, 2020 | 0.16% |
| Year ended February 28, 20192 | 0.14% |
| ^ | Ratios do not reflect net expenses allocated from the affiliated Master Portfolios. Including annualized net expenses allocated from the affiliated Master Portfolios, the expense ratios would be increased by the following amounts: |
| Year ended May 31, 2018 | 0.09% |
| Year ended May 31, 2017 | 0.10% |
| Year ended May 31, 20163 | 0.10% |
| 1 | Year ended February 29 |
| 2 | For the nine months ended February 28, 2019. The Fund changed its fiscal year end from May 31 to February 28, effective February 28, 2019. |
| 3 | For the period from November 30, 2015 (commencement of class operations) to May 31, 2016 |
| 4 | Amount is less than $0.005. |
| 5 | Total return calculations do not include any sales charges. Returns for periods of less than one year are not annualized. |
| 6 | Portfolio turnover rate is calculated by multiplying the Fund’s ownership percentage in each respective affiliated Master Portfolio by the corresponding affiliated Master Portfolio’s purchases and sales. These purchase and sale amounts are aggregated with any direct purchases and sales in affiliated and unaffiliated mutual funds, exchange-traded funds and unaffiliated securities and included in the portfolio turnover calculation. |
The accompanying notes are an integral part of these financial statements.
Target Date Retirement Funds | 103
Financial highlights
Dynamic Target 2045 Fund
(For a share outstanding throughout each period)
| | | Year ended February 28 | | Year ended May 31 |
| Class C | Six months ended
August 31, 2021
(unaudited) | 2021 | 2020 1 | 2019 2 | | 2018 | 2017 | 2016 3 |
Net asset value, beginning of period
| $12.19 | $9.68 | $9.71 | $11.75 | | $10.99 | $9.83 | $10.00 |
Net investment income
| 0.05 | 0.06 | 0.10 | 0.02 | | 0.02 | 0.02 | 0.02 |
Payment from affiliate
| 0.00 | 0.15 | 0.00 | 0.00 | | 0.00 | 0.00 | 0.00 |
Net realized and unrealized gains (losses) on investments
| 1.37 | 2.42 | (0.01) | 0.09 | | 1.20 | 1.39 | (0.14) |
Total from investment operations
| 1.42 | 2.63 | 0.09 | 0.11 | | 1.22 | 1.41 | (0.12) |
| Distributions to shareholders from | | | | | | | | |
Net investment income
| 0.00 | (0.12) | (0.12) | 0.00 | | (0.10) | (0.02) | (0.05) |
Net realized gains
| 0.00 | 0.00 | 0.00 | (2.15) | | (0.36) | (0.23) | 0.00 |
Total distributions to shareholders
| 0.00 | (0.12) | (0.12) | (2.15) | | (0.46) | (0.25) | (0.05) |
Net asset value, end of period
| $13.61 | $12.19 | $9.68 | $9.71 | | $11.75 | $10.99 | $9.83 |
Total return4
| 11.65% | 27.23% 5 | 0.78% | 2.06% | | 11.18% | 14.74% | (1.15)% |
| Ratios to average net assets (annualized) | | | | | | | | |
Gross expenses
| 2.23% * | 3.38% * | 4.19% * | 4.92% * | | 4.84% ^ | 5.37% ^ | 6.10% ^ |
Net expenses
| 1.43% * | 1.43% * | 1.42% * | 1.36% * | | 1.29% ^ | 1.30% ^ | 1.30% ^ |
Net investment income
| 0.75% * | 0.56% * | 1.00% * | 0.21% * | | 0.15% | 0.17% | 0.48% |
| Supplemental data | | | | | | | | |
Portfolio turnover rate6
| 46% | 86% | 36% | 31% | | 35% | 31% | 14% |
Net assets, end of period (000s omitted)
| $164 | $145 | $109 | $102 | | $121 | $113 | $99 |
| * | Ratios reflect net expenses allocated from the affiliated Master Portfolios which were as follows: |
| Six months ended August 31, 2021 (unaudited) | 0.12% |
| Year ended February 28, 2021 | 0.13% |
| Year ended February 29, 2020 | 0.15% |
| Year ended February 28, 20192 | 0.13% |
| ^ | Ratios do not reflect net expenses allocated from the affiliated Master Portfolios. Including annualized net expenses allocated from the affiliated Master Portfolios, the expense ratios would be increased by the following amounts: |
| Year ended May 31, 2018 | 0.09% |
| Year ended May 31, 2017 | 0.10% |
| Year ended May 31, 20163 | 0.10% |
| 1 | Year ended February 29 |
| 2 | For the nine months ended February 28, 2019. The Fund changed its fiscal year end from May 31 to February 28, effective February 28, 2019. |
| 3 | For the period from November 30, 2015 (commencement of class operations) to May 31, 2016 |
| 4 | Total return calculations do not include any sales charges. Returns for periods of less than one year are not annualized. |
| 5 | During the year ended February 28, 2021, the Fund received a payment from an affiliate which had an impact of 1.60% on the total return. See Note 4 in the Notes to Financial Statements for additional information. |
| 6 | Portfolio turnover rate is calculated by multiplying the Fund’s ownership percentage in each respective affiliated Master Portfolio by the corresponding affiliated Master Portfolio’s purchases and sales. These purchase and sale amounts are aggregated with any direct purchases and sales in affiliated and unaffiliated mutual funds, exchange-traded funds and unaffiliated securities and included in the portfolio turnover calculation. |
The accompanying notes are an integral part of these financial statements.
104 | Target Date Retirement Funds
Financial highlights
Dynamic Target 2045 Fund
(For a share outstanding throughout each period)
| | | Year ended February 28 | | Year ended May 31 |
| Class R4 | Six months ended
August 31, 2021
(unaudited) | 2021 | 2020 1 | 2019 2 | | 2018 | 2017 | 2016 3 |
Net asset value, beginning of period
| $12.20 | $9.78 | $9.78 | $11.83 | | $11.05 | $9.88 | $10.00 |
Net investment income
| 0.12 | 0.17 | 0.21 | 0.11 | | 0.14 | 0.13 | 0.07 |
Net realized and unrealized gains (losses) on investments
| 1.37 | 2.44 | (0.01) | 0.08 | | 1.22 | 1.39 | (0.13) |
Total from investment operations
| 1.49 | 2.61 | 0.20 | 0.19 | | 1.36 | 1.52 | (0.06) |
| Distributions to shareholders from | | | | | | | | |
Net investment income
| 0.00 | (0.19) | (0.20) | (0.09) | | (0.22) | (0.12) | (0.06) |
Net realized gains
| 0.00 | 0.00 | 0.00 | (2.15) | | (0.36) | (0.23) | 0.00 |
Total distributions to shareholders
| 0.00 | (0.19) | (0.20) | (2.24) | | (0.58) | (0.35) | (0.06) |
Net asset value, end of period
| $13.69 | $12.20 | $9.78 | $9.78 | | $11.83 | $11.05 | $9.88 |
Total return4
| 12.21% | 26.80% | 1.83% | 2.81% | | 12.36% | 15.88% | (0.55)% |
| Ratios to average net assets (annualized) | | | | | | | | |
Gross expenses
| 1.67% * | 2.68% * | 3.34% * | 3.89% * | | 3.81% ^ | 4.34% ^ | 5.07% ^ |
Net expenses
| 0.37% * | 0.37% * | 0.36% * | 0.32% * | | 0.25% ^ | 0.24% ^ | 0.24% ^ |
Net investment income
| 1.81% * | 1.63% * | 2.06% * | 1.25% * | | 1.19% | 1.23% | 1.54% |
| Supplemental data | | | | | | | | |
Portfolio turnover rate5
| 46% | 86% | 36% | 31% | | 35% | 31% | 14% |
Net assets, end of period (000s omitted)
| $142 | $127 | $102 | $102 | | $123 | $115 | $99 |
| * | Ratios reflect net expenses allocated from the affiliated Master Portfolios which were as follows: |
| Six months ended August 31, 2021 (unaudited) | 0.12% |
| Year ended February 28, 2021 | 0.12% |
| Year ended February 29, 2020 | 0.15% |
| Year ended February 28, 20192 | 0.13% |
| ^ | Ratios do not reflect net expenses allocated from the affiliated Master Portfolios. Including annualized net expenses allocated from the affiliated Master Portfolios, the expense ratios would be increased by the following amounts: |
| Year ended May 31, 2018 | 0.09% |
| Year ended May 31, 2017 | 0.10% |
| Year ended May 31, 20163 | 0.10% |
| 1 | Year ended February 29 |
| 2 | For the nine months ended February 28, 2019. The Fund changed its fiscal year end from May 31 to February 28, effective February 28, 2019. |
| 3 | For the period from November 30, 2015 (commencement of class operations) to May 31, 2016 |
| 4 | Returns for periods of less than one year are not annualized. |
| 5 | Portfolio turnover rate is calculated by multiplying the Fund’s ownership percentage in each respective affiliated Master Portfolio by the corresponding affiliated Master Portfolio’s purchases and sales. These purchase and sale amounts are aggregated with any direct purchases and sales in affiliated and unaffiliated mutual funds, exchange-traded funds and unaffiliated securities and included in the portfolio turnover calculation. |
The accompanying notes are an integral part of these financial statements.
Target Date Retirement Funds | 105
Financial highlights
Dynamic Target 2045 Fund
(For a share outstanding throughout each period)
| | | Year ended February 28 | | Year ended May 31 |
| Class R6 | Six months ended
August 31, 2021
(unaudited) | 2021 | 2020 1 | 2019 2 | | 2018 | 2017 | 2016 3 |
Net asset value, beginning of period
| $12.21 | $9.79 | $9.79 | $11.84 | | $11.06 | $9.88 | $10.00 |
Net investment income
| 0.13 | 0.19 | 0.22 4 | 0.12 | | 0.16 | 0.14 | 0.08 |
Net realized and unrealized gains (losses) on investments
| 1.38 | 2.44 | (0.01) | 0.08 | | 1.21 | 1.40 | (0.13) |
Total from investment operations
| 1.51 | 2.63 | 0.21 | 0.20 | | 1.37 | 1.54 | (0.05) |
| Distributions to shareholders from | | | | | | | | |
Net investment income
| 0.00 | (0.21) | (0.21) | (0.10) | | (0.23) | (0.13) | (0.07) |
Net realized gains
| 0.00 | 0.00 | 0.00 | (2.15) | | (0.36) | (0.23) | 0.00 |
Total distributions to shareholders
| 0.00 | (0.21) | (0.21) | (2.25) | | (0.59) | (0.36) | (0.07) |
Net asset value, end of period
| $13.72 | $12.21 | $9.79 | $9.79 | | $11.84 | $11.05 | $9.88 |
Total return5
| 12.37% | 26.94% | 1.97% | 2.97% | | 12.51% | 16.14% | (0.53)% |
| Ratios to average net assets (annualized) | | | | | | | | |
Gross expenses
| 1.52% * | 2.54% * | 3.18% * | 3.75% * | | 3.66% ^ | 4.19% ^ | 4.92% ^ |
Net expenses
| 0.22% * | 0.22% * | 0.21% * | 0.17% * | | 0.10% ^ | 0.09% ^ | 0.09% ^ |
Net investment income
| 1.96% * | 1.78% * | 2.18% * | 1.40% * | | 1.35% | 1.38% | 1.69% |
| Supplemental data | | | | | | | | |
Portfolio turnover rate6
| 46% | 86% | 36% | 31% | | 35% | 31% | 14% |
Net assets, end of period (000s omitted)
| $7,750 | $6,901 | $5,419 | $4,695 | | $5,679 | $5,303 | $4,576 |
| * | Ratios reflect net expenses allocated from the affiliated Master Portfolios which were as follows: |
| Six months ended August 31, 2021 (unaudited) | 0.13% |
| Year ended February 28, 2021 | 0.13% |
| Year ended February 29, 2020 | 0.16% |
| Year ended February 28, 20192 | 0.14% |
| ^ | Ratios do not reflect net expenses allocated from the affiliated Master Portfolios. Including annualized net expenses allocated from the affiliated Master Portfolios, the expense ratios would be increased by the following amounts: |
| Year ended May 31, 2018 | 0.10% |
| Year ended May 31, 2017 | 0.11% |
| Year ended May 31, 20163 | 0.11% |
| 1 | Year ended February 29 |
| 2 | For the nine months ended February 28, 2019. The Fund changed its fiscal year end from May 31 to February 28, effective February 28, 2019. |
| 3 | For the period from November 30, 2015 (commencement of class operations) to May 31, 2016 |
| 4 | Calculated based upon average shares outstanding |
| 5 | Returns for periods of less than one year are not annualized. |
| 6 | Portfolio turnover rate is calculated by multiplying the Fund’s ownership percentage in each respective affiliated Master Portfolio by the corresponding affiliated Master Portfolio’s purchases and sales. These purchase and sale amounts are aggregated with any direct purchases and sales in affiliated and unaffiliated mutual funds, exchange-traded funds and unaffiliated securities and included in the portfolio turnover calculation. |
The accompanying notes are an integral part of these financial statements.
106 | Target Date Retirement Funds
Financial highlights
Dynamic Target 2050 Fund
(For a share outstanding throughout each period)
| | | Year ended February 28 | | Year ended May 31 |
| Class A | Six months ended
August 31, 2021
(unaudited) | 2021 | 2020 1 | 2019 2 | | 2018 | 2017 | 2016 3 |
Net asset value, beginning of period
| $12.14 | $9.66 | $9.73 | $11.80 | | $11.03 | $9.86 | $10.00 |
Net investment income
| 0.10 | 0.13 | 0.17 | 0.07 | | 0.11 | 0.09 | 0.06 |
Net realized and unrealized gains (losses) on investments
| 1.44 | 2.52 | (0.06) | 0.06 | | 1.22 | 1.40 | (0.14) |
Total from investment operations
| 1.54 | 2.65 | 0.11 | 0.13 | | 1.33 | 1.49 | (0.08) |
| Distributions to shareholders from | | | | | | | | |
Net investment income
| 0.00 | (0.17) | (0.18) | (0.05) | | (0.20) | (0.09) | (0.06) |
Net realized gains
| 0.00 | 0.00 | 0.00 | (2.15) | | (0.36) | (0.23) | 0.00 |
Total distributions to shareholders
| 0.00 | (0.17) | (0.18) | (2.20) | | (0.56) | (0.32) | (0.06) |
Net asset value, end of period
| $13.68 | $12.14 | $9.66 | $9.73 | | $11.80 | $11.03 | $9.86 |
Total return4
| 12.69% | 27.59% | 1.01% | 2.37% | | 12.16% | 15.65% | (0.78)% |
| Ratios to average net assets (annualized) | | | | | | | | |
Gross expenses
| 2.24% * | 3.27% * | 3.67% * | 4.34% * | | 4.26% ^ | 4.80% ^ | 5.25% ^ |
Net expenses
| 0.67% * | 0.67% * | 0.66% * | 0.60% * | | 0.54% ^ | 0.53% ^ | 0.53% ^ |
Net investment income
| 1.49% * | 1.28% * | 1.72% * | 0.96% * | | 0.83% | 0.91% | 1.22% |
| Supplemental data | | | | | | | | |
Portfolio turnover rate5
| 44% | 85% | 36% | 31% | | 35% | 31% | 14% |
Net assets, end of period (000s omitted)
| $482 | $382 | $254 | $198 | | $256 | $134 | $108 |
| * | Ratios reflect net expenses allocated from the affiliated Master Portfolios which were as follows: |
| Six months ended August 31, 2021 (unaudited) | 0.13% |
| Year ended February 28, 2021 | 0.13% |
| Year ended February 29, 2020 | 0.16% |
| Year ended February 28, 20192 | 0.13% |
| ^ | Ratios do not reflect net expenses allocated from the affiliated Master Portfolios. Including annualized net expenses allocated from the affiliated Master Portfolios, the expense ratios would be increased by the following amounts: |
| Year ended May 31, 2018 | 0.09% |
| Year ended May 31, 2017 | 0.10% |
| Year ended May 31, 20163 | 0.10% |
| 1 | Year ended February 29 |
| 2 | For the nine months ended February 28, 2019. The Fund changed its fiscal year end from May 31 to February 28, effective February 28, 2019. |
| 3 | For the period from November 30, 2015 (commencement of class operations) to May 31, 2016 |
| 4 | Total return calculations do not include any sales charges. Returns for periods of less than one year are not annualized. |
| 5 | Portfolio turnover rate is calculated by multiplying the Fund’s ownership percentage in each respective affiliated Master Portfolio by the corresponding affiliated Master Portfolio’s purchases and sales. These purchase and sale amounts are aggregated with any direct purchases and sales in affiliated and unaffiliated mutual funds, exchange-traded funds and unaffiliated securities and included in the portfolio turnover calculation. |
The accompanying notes are an integral part of these financial statements.
Target Date Retirement Funds | 107
Financial highlights
Dynamic Target 2050 Fund
(For a share outstanding throughout each period)
| | | Year ended February 28 | | Year ended May 31 |
| Class C | Six months ended
August 31, 2021
(unaudited) | 2021 | 2020 1 | 2019 2 | | 2018 | 2017 | 2016 3 |
Net asset value, beginning of period
| $12.19 | $9.59 | $9.68 | $11.76 | | $10.99 | $9.83 | $10.00 |
Net investment income
| 0.05 | 0.06 | 0.10 | 0.02 | | 0.02 | 0.02 | 0.02 |
Payment from affiliate
| 0.00 | 0.15 | 0.00 | 0.00 | | 0.00 | 0.00 | 0.00 |
Net realized and unrealized gains (losses) on investments
| 1.44 | 2.51 | (0.06) | 0.05 | | 1.21 | 1.39 | (0.14) |
Total from investment operations
| 1.49 | 2.72 | 0.04 | 0.07 | | 1.23 | 1.41 | (0.12) |
| Distributions to shareholders from | | | | | | | | |
Net investment income
| 0.00 | (0.12) | (0.13) | 0.00 | | (0.10) | (0.02) | (0.05) |
Net realized gains
| 0.00 | 0.00 | 0.00 | (2.15) | | (0.36) | (0.23) | 0.00 |
Total distributions to shareholders
| 0.00 | (0.12) | (0.13) | (2.15) | | (0.46) | (0.25) | (0.05) |
Net asset value, end of period
| $13.68 | $12.19 | $9.59 | $9.68 | | $11.76 | $10.99 | $9.83 |
Total return4
| 12.22% | 28.40% 5 | 0.26% | 1.77% | | 11.33% | 14.77% | (1.15)% |
| Ratios to average net assets (annualized) | | | | | | | | |
Gross expenses
| 2.51% * | 3.67% * | 4.42% * | 5.09% * | | 5.02% ^ | 5.56% ^ | 6.00% ^ |
Net expenses
| 1.43% * | 1.43% * | 1.42% * | 1.35% * | | 1.29% ^ | 1.29% ^ | 1.30% ^ |
Net investment income
| 0.75% * | 0.54% * | 0.99% * | 0.21% * | | 0.15% | 0.18% | 0.48% |
| Supplemental data | | | | | | | | |
Portfolio turnover rate6
| 44% | 85% | 36% | 31% | | 35% | 31% | 14% |
Net assets, end of period (000s omitted)
| $155 | $138 | $106 | $102 | | $121 | $113 | $99 |
| * | Ratios reflect net expenses allocated from the affiliated Master Portfolios which were as follows: |
| Six months ended August 31, 2021 (unaudited) | 0.12% |
| Year ended February 28, 2021 | 0.13% |
| Year ended February 29, 2020 | 0.16% |
| Year ended February 28, 20192 | 0.13% |
| ^ | Ratios do not reflect net expenses allocated from the affiliated Master Portfolios. Including annualized net expenses allocated from the affiliated Master Portfolios, the expense ratios would be increased by the following amounts: |
| Year ended May 31, 2018 | 0.09% |
| Year ended May 31, 2017 | 0.10% |
| Year ended May 31, 20163 | 0.10% |
| 1 | Year ended February 29 |
| 2 | For the nine months ended February 28, 2019. The Fund changed its fiscal year end from May 31 to February 28, effective February 28, 2019. |
| 3 | For the period from November 30, 2015 (commencement of class operations) to May 31, 2016 |
| 4 | Total return calculations do not include any sales charges. Returns for periods of less than one year are not annualized. |
| 5 | During the year ended February 28, 2021, the Fund received a payment from an affiliate which had a 1.62% impact on the total return. See Note 4 in the Notes to Financial Statements for additional information. |
| 6 | Portfolio turnover rate is calculated by multiplying the Fund’s ownership percentage in each respective affiliated Master Portfolio by the corresponding affiliated Master Portfolio’s purchases and sales. These purchase and sale amounts are aggregated with any direct purchases and sales in affiliated and unaffiliated mutual funds, exchange-traded funds and unaffiliated securities and included in the portfolio turnover calculation. |
The accompanying notes are an integral part of these financial statements.
108 | Target Date Retirement Funds
Financial highlights
Dynamic Target 2050 Fund
(For a share outstanding throughout each period)
| | | Year ended February 28 | | Year ended May 31 |
| Class R4 | Six months ended
August 31, 2021
(unaudited) | 2021 | 2020 1 | 2019 2 | | 2018 | 2017 | 2016 3 |
Net asset value, beginning of period
| $12.20 | $9.69 | $9.76 | $11.83 | | $11.05 | $9.88 | $10.00 |
Net investment income
| 0.12 | 0.17 | 0.21 | 0.10 | | 0.14 | 0.13 | 0.07 |
Net realized and unrealized gains (losses) on investments
| 1.44 | 2.53 | (0.07) | 0.06 | | 1.22 | 1.39 | (0.13) |
Total from investment operations
| 1.56 | 2.70 | 0.14 | 0.16 | | 1.36 | 1.52 | (0.05) |
| Distributions to shareholders from | | | | | | | | |
Net investment income
| 0.00 | (0.19) | (0.21) | (0.08) | | (0.22) | (0.12) | (0.06) |
Net realized gains
| 0.00 | 0.00 | 0.00 | (2.15) | | (0.36) | (0.23) | 0.00 |
Total distributions to shareholders
| 0.00 | (0.19) | (0.21) | (2.23) | | (0.58) | (0.35) | (0.06) |
Net asset value, end of period
| $13.76 | $12.20 | $9.69 | $9.76 | | $11.83 | $11.05 | $9.88 |
Total return4
| 12.79% | 27.95% | 1.22% | 2.67% | | 12.42% | 15.90% | (0.55)% |
| Ratios to average net assets (annualized) | | | | | | | | |
Gross expenses
| 1.97% * | 3.00% * | 3.39% * | 4.06% * | | 3.99% ^ | 4.53% ^ | 4.97% ^ |
Net expenses
| 0.37% * | 0.37% * | 0.36% * | 0.30% * | | 0.25% ^ | 0.24% ^ | 0.24% ^ |
Net investment income
| 1.81% * | 1.61% * | 2.05% * | 1.25% * | | 1.19% | 1.23% | 1.53% |
| Supplemental data | | | | | | | | |
Portfolio turnover rate5
| 44% | 85% | 36% | 31% | | 35% | 31% | 14% |
Net assets, end of period (000s omitted)
| $143 | $127 | $101 | $102 | | $123 | $115 | $99 |
| * | Ratios reflect net expenses allocated from the affiliated Master Portfolios which were as follows: |
| Six months ended August 31, 2021 (unaudited) | 0.12% |
| Year ended February 28, 2021 | 0.13% |
| Year ended February 29, 2020 | 0.15% |
| Year ended February 28, 20192 | 0.13% |
| ^ | Ratios do not reflect net expenses allocated from the affiliated Master Portfolios. Including annualized net expenses allocated from the affiliated Master Portfolios, the expense ratios would be increased by the following amounts: |
| Year ended May 31, 2018 | 0.09% |
| Year ended May 31, 2017 | 0.10% |
| Year ended May 31, 20163 | 0.10% |
| 1 | Year ended February 29 |
| 2 | For the nine months ended February 28, 2019. The Fund changed its fiscal year end from May 31 to February 28, effective February 28, 2019. |
| 3 | For the period from November 30, 2015 (commencement of class operations) to May 31, 2016 |
| 4 | Returns for periods of less than one year are not annualized. |
| 5 | Portfolio turnover rate is calculated by multiplying the Fund’s ownership percentage in each respective affiliated Master Portfolio by the corresponding affiliated Master Portfolio’s purchases and sales. These purchase and sale amounts are aggregated with any direct purchases and sales in affiliated and unaffiliated mutual funds, exchange-traded funds and unaffiliated securities and included in the portfolio turnover calculation. |
The accompanying notes are an integral part of these financial statements.
Target Date Retirement Funds | 109
Financial highlights
Dynamic Target 2050 Fund
(For a share outstanding throughout each period)
| | | Year ended February 28 | | Year ended May 31 |
| Class R6 | Six months ended
August 31, 2021
(unaudited) | 2021 | 2020 1 | 2019 2 | | 2018 | 2017 | 2016 3 |
Net asset value, beginning of period
| $12.21 | $9.70 | $9.76 | $11.84 | | $11.06 | $9.88 | $10.00 |
Net investment income
| 0.13 | 0.18 | 0.22 | 0.12 | | 0.16 | 0.14 | 0.08 |
Net realized and unrealized gains (losses) on investments
| 1.44 | 2.54 | (0.06) | 0.05 | | 1.21 | 1.40 | (0.13) |
Total from investment operations
| 1.57 | 2.72 | 0.16 | 0.17 | | 1.37 | 1.54 | (0.05) |
| Distributions to shareholders from | | | | | | | | |
Net investment income
| 0.00 | (0.21) | (0.22) | (0.10) | | (0.23) | (0.13) | (0.07) |
Net realized gains
| 0.00 | 0.00 | 0.00 | (2.15) | | (0.36) | (0.23) | 0.00 |
Total distributions to shareholders
| 0.00 | (0.21) | (0.22) | (2.25) | | (0.59) | (0.36) | (0.07) |
Net asset value, end of period
| $13.78 | $12.21 | $9.70 | $9.76 | | $11.84 | $11.06 | $9.88 |
Total return4
| 12.86% | 28.09% | 1.47% | 2.75% | | 12.56% | 16.17% | (0.53)% |
| Ratios to average net assets (annualized) | | | | | | | | |
Gross expenses
| 1.82% * | 2.85% * | 3.25% * | 3.92% * | | 3.84% ^ | 4.38% ^ | 4.82% ^ |
Net expenses
| 0.22% * | 0.22% * | 0.21% * | 0.15% * | | 0.10% ^ | 0.09% ^ | 0.09% ^ |
Net investment income
| 1.96% * | 1.75% * | 2.19% * | 1.40% * | | 1.35% | 1.39% | 1.69% |
| Supplemental data | | | | | | | | |
Portfolio turnover rate5
| 44% | 85% | 36% | 31% | | 35% | 31% | 14% |
Net assets, end of period (000s omitted)
| $7,253 | $6,322 | $4,884 | $4,682 | | $5,681 | $5,304 | $4,576 |
| * | Ratios reflect net expenses allocated from the affiliated Master Portfolios which were as follows: |
| Six months ended August 31, 2021 (unaudited) | 0.13% |
| Year ended February 28, 2021 | 0.13% |
| Year ended February 29, 2020 | 0.17% |
| Year ended February 28, 20192 | 0.14% |
| ^ | Ratios do not reflect net expenses allocated from the affiliated Master Portfolios. Including annualized net expenses allocated from the affiliated Master Portfolios, the expense ratios would be increased by the following amounts: |
| Year ended May 31, 2018 | 0.10% |
| Year ended May 31, 2017 | 0.11% |
| Year ended May 31, 20163 | 0.11% |
| 1 | Year ended February 29 |
| 2 | For the nine months ended February 28, 2019. The Fund changed its fiscal year end from May 31 to February 28, effective February 28, 2019. |
| 3 | For the period from November 30, 2015 (commencement of class operations) to May 31, 2016 |
| 4 | Returns for periods of less than one year are not annualized. |
| 5 | Portfolio turnover rate is calculated by multiplying the Fund’s ownership percentage in each respective affiliated Master Portfolio by the corresponding affiliated Master Portfolio’s purchases and sales. These purchase and sale amounts are aggregated with any direct purchases and sales in affiliated and unaffiliated mutual funds, exchange-traded funds and unaffiliated securities and included in the portfolio turnover calculation. |
The accompanying notes are an integral part of these financial statements.
110 | Target Date Retirement Funds
Financial highlights
Dynamic Target 2055 Fund
(For a share outstanding throughout each period)
| | | Year ended February 28 | | Year ended May 31 |
| Class A | Six months ended
August 31, 2021
(unaudited) | 2021 | 2020 1 | 2019 2 | | 2018 | 2017 | 2016 3 |
Net asset value, beginning of period
| $12.19 | $9.66 | $9.73 | $11.80 | | $11.03 | $9.87 | $10.00 |
Net investment income
| 0.10 | 0.12 | 0.15 | 0.08 | | 0.11 | 0.09 | 0.06 |
Net realized and unrealized gains (losses) on investments
| 1.43 | 2.58 | (0.04) | 0.05 | | 1.22 | 1.39 | (0.13) |
Total from investment operations
| 1.53 | 2.70 | 0.11 | 0.13 | | 1.33 | 1.48 | (0.07) |
| Distributions to shareholders from | | | | | | | | |
Net investment income
| 0.00 | (0.17) | (0.18) | (0.05) | | (0.19) | (0.09) | (0.06) |
Net realized gains
| 0.00 | 0.00 | 0.00 | (2.15) | | (0.37) | (0.23) | 0.00 |
Total distributions to shareholders
| 0.00 | (0.17) | (0.18) | (2.20) | | (0.56) | (0.32) | (0.06) |
Net asset value, end of period
| $13.72 | $12.19 | $9.66 | $9.73 | | $11.80 | $11.03 | $9.87 |
Total return4
| 12.55% | 28.00% | 0.95% | 2.37% | | 12.10% | 15.56% | (0.68)% |
| Ratios to average net assets (annualized) | | | | | | | | |
Gross expenses
| 2.18% * | 3.28% * | 3.82% * | 4.31% * | | 4.18% ^ | 4.67% ^ | 5.23% ^ |
Net expenses
| 0.67% * | 0.68% * | 0.67% * | 0.61% * | | 0.54% ^ | 0.54% ^ | 0.54% ^ |
Net investment income
| 1.49% * | 1.23% * | 1.68% * | 0.95% * | | 0.89% | 0.90% | 1.21% |
| Supplemental data | | | | | | | | |
Portfolio turnover rate5
| 44% | 85% | 36% | 31% | | 34% | 31% | 14% |
Net assets, end of period (000s omitted)
| $502 | $422 | $239 | $161 | | $170 | $134 | $103 |
| * | Ratios reflect net expenses allocated from the affiliated Master Portfolios which were as follows: |
| Six months ended August 31, 2021 (unaudited) | 0.13% |
| Year ended February 28, 2021 | 0.13% |
| Year ended February 29, 2020 | 0.16% |
| Year ended February 28, 20192 | 0.13% |
| ^ | Ratios do not reflect net expenses allocated from the affiliated Master Portfolios. Including annualized net expenses allocated from the affiliated Master Portfolios, the expense ratios would be increased by the following amounts: |
| Year ended May 31, 2018 | 0.09% |
| Year ended May 31, 2017 | 0.10% |
| Year ended May 31, 20163 | 0.10% |
| 1 | Year ended February 29 |
| 2 | For the nine months ended February 28, 2019. The Fund changed its fiscal year end from May 31 to February 28, effective February 28, 2019. |
| 3 | For the period from November 30, 2015 (commencement of class operations) to May 31, 2016 |
| 4 | Total return calculations do not include any sales charges. Returns for periods of less than one year are not annualized. |
| 5 | Portfolio turnover rate is calculated by multiplying the Fund’s ownership percentage in each respective affiliated Master Portfolio by the corresponding affiliated Master Portfolio’s purchases and sales. These purchase and sale amounts are aggregated with any direct purchases and sales in affiliated and unaffiliated mutual funds, exchange-traded funds and unaffiliated securities and included in the portfolio turnover calculation. |
The accompanying notes are an integral part of these financial statements.
Target Date Retirement Funds | 111
Financial highlights
Dynamic Target 2055 Fund
(For a share outstanding throughout each period)
| | | Year ended February 28 | | Year ended May 31 |
| Class C | Six months ended
August 31, 2021
(unaudited) | 2021 | 2020 1 | 2019 2 | | 2018 | 2017 | 2016 3 |
Net asset value, beginning of period
| $12.24 | $9.59 | $9.67 | $11.75 | | $10.99 | $9.84 | $10.00 |
Net investment income
| 0.05 | 0.06 | 0.10 | 0.02 | | 0.02 | 0.02 | 0.02 |
Payment from affiliate
| 0.00 | 0.15 | 0.00 | 0.00 | | 0.00 | 0.00 | 0.00 |
Net realized and unrealized gains (losses) on investments
| 1.43 | 2.56 | (0.06) | 0.05 | | 1.21 | 1.38 | (0.13) |
Total from investment operations
| 1.48 | 2.77 | 0.04 | 0.07 | | 1.23 | 1.40 | (0.11) |
| Distributions to shareholders from | | | | | | | | |
Net investment income
| 0.00 | (0.12) | (0.12) | 0.00 | | (0.10) | (0.02) | (0.05) |
Net realized gains
| 0.00 | 0.00 | 0.00 | (2.15) | | (0.37) | (0.23) | 0.00 |
Total distributions to shareholders
| 0.00 | (0.12) | (0.12) | (2.15) | | (0.47) | (0.25) | (0.05) |
Net asset value, end of period
| $13.72 | $12.24 | $9.59 | $9.67 | | $11.75 | $10.99 | $9.84 |
Total return4
| 12.09% | 28.94% 5 | 0.26% | 1.77% | | 11.25% | 14.68% | (1.05)% |
| Ratios to average net assets (annualized) | | | | | | | | |
Gross expenses
| 2.43% * | 3.67% * | 4.40% * | 5.04% * | | 4.93% ^ | 5.42% ^ | 5.98% ^ |
Net expenses
| 1.43% * | 1.43% * | 1.42% * | 1.36% * | | 1.29% ^ | 1.30% ^ | 1.30% ^ |
Net investment income
| 0.75% * | 0.53% * | 0.99% * | 0.18% * | | 0.15% | 0.17% | 0.47% |
| Supplemental data | | | | | | | | |
Portfolio turnover rate6
| 44% | 85% | 36% | 31% | | 34% | 31% | 14% |
Net assets, end of period (000s omitted)
| $163 | $139 | $100 | $100 | | $121 | $113 | $99 |
| * | Ratios reflect net expenses allocated from the affiliated Master Portfolios which were as follows: |
| Six months ended August 31, 2021 (unaudited) | 0.12% |
| Year ended February 28, 2021 | 0.13% |
| Year ended February 29, 2020 | 0.15% |
| Year ended February 28, 20192 | 0.13% |
| ^ | Ratios do not reflect net expenses allocated from the affiliated Master Portfolios. Including annualized net expenses allocated from the affiliated Master Portfolios, the expense ratios would be increased by the following amounts: |
| Year ended May 31, 2018 | 0.09% |
| Year ended May 31, 2017 | 0.10% |
| Year ended May 31, 20163 | 0.10% |
| 1 | Year ended February 29 |
| 2 | For the nine months ended February 28, 2019. The Fund changed its fiscal year end from May 31 to February 28, effective February 28, 2019. |
| 3 | For the period from November 30, 2015 (commencement of class operations) to May 31, 2016 |
| 4 | Total return calculations do not include any sales charges. Returns for periods of less than one year are not annualized. |
| 5 | During the year ended February 28, 2021, the Fund received a payment from an affiliate which had a 1.56% impact on the total return. See Note 4 in the Notes to Financial Statements for additional information. |
| 6 | Portfolio turnover rate is calculated by multiplying the Fund’s ownership percentage in each respective affiliated Master Portfolio by the corresponding affiliated Master Portfolio’s purchases and sales. These purchase and sale amounts are aggregated with any direct purchases and sales in affiliated and unaffiliated mutual funds, exchange-traded funds and unaffiliated securities and included in the portfolio turnover calculation. |
The accompanying notes are an integral part of these financial statements.
112 | Target Date Retirement Funds
Financial highlights
Dynamic Target 2055 Fund
(For a share outstanding throughout each period)
| | | Year ended February 28 | | Year ended May 31 |
| Class R4 | Six months ended
August 31, 2021
(unaudited) | 2021 | 2020 1 | 2019 2 | | 2018 | 2017 | 2016 3 |
Net asset value, beginning of period
| $12.25 | $9.69 | $9.75 | $11.83 | | $11.05 | $9.88 | $10.00 |
Net investment income
| 0.12 | 0.17 | 0.21 | 0.10 | | 0.14 | 0.13 | 0.07 |
Net realized and unrealized gains (losses) on investments
| 1.43 | 2.58 | (0.07) | 0.05 | | 1.23 | 1.39 | (0.13) |
Total from investment operations
| 1.55 | 2.75 | 0.14 | 0.15 | | 1.37 | 1.52 | (0.06) |
| Distributions to shareholders from | | | | | | | | |
Net investment income
| 0.00 | (0.19) | (0.20) | (0.08) | | (0.22) | (0.12) | (0.06) |
Net realized gains
| 0.00 | 0.00 | 0.00 | (2.15) | | (0.37) | (0.23) | 0.00 |
Total distributions to shareholders
| 0.00 | (0.19) | (0.20) | (2.23) | | (0.59) | (0.35) | (0.06) |
Net asset value, end of period
| $13.80 | $12.25 | $9.69 | $9.75 | | $11.83 | $11.05 | $9.88 |
Total return4
| 12.65% | 28.45% | 1.24% | 2.58% | | 12.44% | 15.94% | (0.55)% |
| Ratios to average net assets (annualized) | | | | | | | | |
Gross expenses
| 1.91% * | 3.01% * | 3.55% * | 4.02% * | | 3.90% ^ | 4.39% ^ | 4.95% ^ |
Net expenses
| 0.37% * | 0.37% * | 0.36% * | 0.32% * | | 0.25% ^ | 0.24% ^ | 0.24% ^ |
Net investment income
| 1.81% * | 1.61% * | 2.04% * | 1.23% * | | 1.19% | 1.23% | 1.53% |
| Supplemental data | | | | | | | | |
Portfolio turnover rate5
| 44% | 85% | 36% | 31% | | 34% | 31% | 14% |
Net assets, end of period (000s omitted)
| $144 | $128 | $101 | $102 | | $123 | $115 | $99 |
| * | Ratios reflect net expenses allocated from the affiliated Master Portfolios which were as follows: |
| Six months ended August 31, 2021 (unaudited) | 0.12% |
| Year ended February 28, 2021 | 0.13% |
| Year ended February 29, 2020 | 0.15% |
| Year ended February 28, 20192 | 0.13% |
| ^ | Ratios do not reflect net expenses allocated from the affiliated Master Portfolios. Including annualized net expenses allocated from the affiliated Master Portfolios, the expense ratios would be increased by the following amounts: |
| Year ended May 31, 2018 | 0.09% |
| Year ended May 31, 2017 | 0.10% |
| Year ended May 31, 20163 | 0.10% |
| 1 | Year ended February 29 |
| 2 | For the nine months ended February 28, 2019. The Fund changed its fiscal year end from May 31 to February 28, effective February 28, 2019. |
| 3 | For the period from November 30, 2015 (commencement of class operations) to May 31, 2016 |
| 4 | Returns for periods of less than one year are not annualized. |
| 5 | Portfolio turnover rate is calculated by multiplying the Fund’s ownership percentage in each respective affiliated Master Portfolio by the corresponding affiliated Master Portfolio’s purchases and sales. These purchase and sale amounts are aggregated with any direct purchases and sales in affiliated and unaffiliated mutual funds, exchange-traded funds and unaffiliated securities and included in the portfolio turnover calculation. |
The accompanying notes are an integral part of these financial statements.
Target Date Retirement Funds | 113
Financial highlights
Dynamic Target 2055 Fund
(For a share outstanding throughout each period)
| | | Year ended February 28 | | Year ended May 31 |
| Class R6 | Six months ended
August 31, 2021
(unaudited) | 2021 | 2020 1 | 2019 2 | | 2018 | 2017 | 2016 3 |
Net asset value, beginning of period
| $12.25 | $9.69 | $9.75 | $11.84 | | $11.06 | $9.89 | $10.00 |
Net investment income
| 0.13 | 0.18 | 0.22 4 | 0.12 | | 0.16 | 0.14 | 0.08 |
Net realized and unrealized gains (losses) on investments
| 1.44 | 2.59 | (0.07) | 0.04 | | 1.22 | 1.39 | (0.12) |
Total from investment operations
| 1.57 | 2.77 | 0.15 | 0.16 | | 1.38 | 1.53 | (0.04) |
| Distributions to shareholders from | | | | | | | | |
Net investment income
| 0.00 | (0.21) | (0.21) | (0.10) | | (0.23) | (0.13) | (0.07) |
Net realized gains
| 0.00 | 0.00 | 0.00 | (2.15) | | (0.37) | (0.23) | 0.00 |
Total distributions to shareholders
| 0.00 | (0.21) | (0.21) | (2.25) | | (0.60) | (0.35) | (0.07) |
Net asset value, end of period
| $13.82 | $12.25 | $9.69 | $9.75 | | $11.84 | $11.06 | $9.89 |
Total return5
| 12.82% | 28.62% | 1.38% | 2.70% | | 12.58% | 16.08% | (0.43)% |
| Ratios to average net assets (annualized) | | | | | | | | |
Gross expenses
| 1.76% * | 2.86% * | 3.41% * | 3.87% * | | 3.75% ^ | 4.25% ^ | 4.80% ^ |
Net expenses
| 0.22% * | 0.22% * | 0.21% * | 0.17% * | | 0.10% ^ | 0.09% ^ | 0.09% ^ |
Net investment income
| 1.96% * | 1.75% * | 2.18% * | 1.38% * | | 1.34% | 1.38% | 1.69% |
| Supplemental data | | | | | | | | |
Portfolio turnover rate6
| 44% | 85% | 36% | 31% | | 34% | 31% | 14% |
Net assets, end of period (000s omitted)
| $7,536 | $6,540 | $5,031 | $4,678 | | $5,679 | $5,305 | $4,579 |
| * | Ratios reflect net expenses allocated from the affiliated Master Portfolios which were as follows: |
| Six months ended August 31, 2021 (unaudited) | 0.13% |
| Year ended February 28, 2021 | 0.13% |
| Year ended February 29, 2020 | 0.17% |
| Year ended February 28, 20192 | 0.14% |
| ^ | Ratios do not reflect net expenses allocated from the affiliated Master Portfolios. Including annualized net expenses allocated from the affiliated Master Portfolios, the expense ratios would be increased by the following amounts: |
| Year ended May 31, 2018 | 0.10% |
| Year ended May 31, 2017 | 0.11% |
| Year ended May 31, 20163 | 0.11% |
| 1 | Year ended February 29 |
| 2 | For the nine months ended February 28, 2019. The Fund changed its fiscal year end from May 31 to February 28, effective February 28, 2019. |
| 3 | For the period from November 30, 2015 (commencement of class operations) to May 31, 2016 |
| 4 | Calculated based upon average shares outstanding |
| 5 | Returns for periods of less than one year are not annualized. |
| 6 | Portfolio turnover rate is calculated by multiplying the Fund’s ownership percentage in each respective affiliated Master Portfolio by the corresponding affiliated Master Portfolio’s purchases and sales. These purchase and sale amounts are aggregated with any direct purchases and sales in affiliated and unaffiliated mutual funds, exchange-traded funds and unaffiliated securities and included in the portfolio turnover calculation. |
The accompanying notes are an integral part of these financial statements.
114 | Target Date Retirement Funds
Financial highlights
Dynamic Target 2060 Fund
(For a share outstanding throughout each period)
| | | Year ended February 28 | | Year ended May 31 |
| Class A | Six months ended
August 31, 2021
(unaudited) | 2021 | 2020 1 | 2019 2 | | 2018 | 2017 | 2016 3 |
Net asset value, beginning of period
| $12.13 | $9.66 | $9.74 | $11.79 | | $11.03 | $9.88 | $10.00 |
Net investment income
| 0.11 | 0.12 | 0.17 4 | 0.08 | | 0.09 | 0.09 | 0.06 |
Net realized and unrealized gains (losses) on investments
| 1.42 | 2.51 | (0.05) | 0.06 | | 1.23 | 1.39 | (0.12) |
Total from investment operations
| 1.53 | 2.63 | 0.12 | 0.14 | | 1.32 | 1.48 | (0.06) |
| Distributions to shareholders from | | | | | | | | |
Net investment income
| 0.00 | (0.16) | (0.20) | (0.06) | | (0.20) | (0.09) | (0.06) |
Net realized gains
| 0.00 | 0.00 | 0.00 | (2.13) | | (0.36) | (0.24) | 0.00 |
Total distributions to shareholders
| 0.00 | (0.16) | (0.20) | (2.19) | | (0.56) | (0.33) | (0.06) |
Net asset value, end of period
| $13.66 | $12.13 | $9.66 | $9.74 | | $11.79 | $11.03 | $9.88 |
Total return5
| 12.61% | 27.34% | 1.01% | 2.40% | | 12.12% | 15.57% | (0.58)% |
| Ratios to average net assets (annualized) | | | | | | | | |
Gross expenses
| 2.29% * | 3.37% * | 3.64% * | 4.30% * | | 4.22% ^ | 4.80% ^ | 5.24% ^ |
Net expenses
| 0.67% * | 0.67% * | 0.66% * | 0.59% * | | 0.53% ^ | 0.55% ^ | 0.55% ^ |
Net investment income
| 1.50% * | 1.29% * | 1.67% * | 0.97% * | | 1.03% | 0.92% | 1.22% |
| Supplemental data | | | | | | | | |
Portfolio turnover rate6
| 44% | 85% | 36% | 31% | | 36% | 30% | 14% |
Net assets, end of period (000s omitted)
| $476 | $407 | $345 | $290 | | $261 | $127 | $101 |
| * | Ratios reflect net expenses allocated from the affiliated Master Portfolios which were as follows: |
| Six months ended August 31, 2021 (unaudited) | 0.13% |
| Year ended February 28, 2021 | 0.13% |
| Year ended February 29, 2020 | 0.16% |
| Year ended February 28, 20192 | 0.14% |
| ^ | Ratios do not reflect net expenses allocated from the affiliated Master Portfolios. Including annualized net expenses allocated from the affiliated Master Portfolios, the expense ratios would be increased by the following amounts: |
| Year ended May 31, 2018 | 0.09% |
| Year ended May 31, 2017 | 0.10% |
| Year ended May 31, 20163 | 0.10% |
| 1 | Year ended February 29 |
| 2 | For the nine months ended February 28, 2019. The Fund changed its fiscal year end from May 31 to February 28, effective February 28, 2019. |
| 3 | For the period from November 30, 2015 (commencement of class operations) to May 31, 2016 |
| 4 | Calculated based upon average shares outstanding |
| 5 | Total return calculations do not include any sales charges. Returns for periods of less than one year are not annualized. |
| 6 | Portfolio turnover rate is calculated by multiplying the Fund’s ownership percentage in each respective affiliated Master Portfolio by the corresponding affiliated Master Portfolio’s purchases and sales. These purchase and sale amounts are aggregated with any direct purchases and sales in affiliated and unaffiliated mutual funds, exchange-traded funds and unaffiliated securities and included in the portfolio turnover calculation. |
The accompanying notes are an integral part of these financial statements.
Target Date Retirement Funds | 115
Financial highlights
Dynamic Target 2060 Fund
(For a share outstanding throughout each period)
| | | Year ended February 28 | | Year ended May 31 |
| Class C | Six months ended
August 31, 2021
(unaudited) | 2021 | 2020 1 | 2019 2 | | 2018 | 2017 | 2016 3 |
Net asset value, beginning of period
| $12.22 | $9.62 | $9.72 | $11.76 | | $10.99 | $9.85 | $10.00 |
Net investment income
| 0.05 | 0.06 | 0.10 | 0.02 | | 0.02 | 0.02 | 0.02 |
Payment from affiliate
| 0.00 | 0.16 | 0.00 | 0.00 | | 0.00 | 0.00 | 0.00 |
Net realized and unrealized gains (losses) on investments
| 1.44 | 2.50 | (0.07) | 0.07 | | 1.21 | 1.38 | (0.12) |
Total from investment operations
| 1.49 | 2.72 | 0.03 | 0.09 | | 1.23 | 1.40 | (0.10) |
| Distributions to shareholders from | | | | | | | | |
Net investment income
| 0.00 | (0.12) | (0.13) | 0.00 | | (0.10) | (0.02) | (0.05) |
Net realized gains
| 0.00 | 0.00 | 0.00 | (2.13) | | (0.36) | (0.24) | 0.00 |
Total distributions to shareholders
| 0.00 | (0.12) | (0.13) | (2.13) | | (0.46) | (0.26) | (0.05) |
Net asset value, end of period
| $13.71 | $12.22 | $9.62 | $9.72 | | $11.76 | $10.99 | $9.85 |
Total return4
| 12.19% | 28.36% 5 | 0.16% | 1.89% | | 11.28% | 14.69% | (0.94)% |
| Ratios to average net assets (annualized) | | | | | | | | |
Gross expenses
| 2.51% * | 3.75% * | 4.22% * | 5.04% * | | 4.99% ^ | 5.55% ^ | 5.99% ^ |
Net expenses
| 1.43% * | 1.43% * | 1.42% * | 1.35% * | | 1.29% ^ | 1.30% ^ | 1.30% ^ |
Net investment income
| 0.75% * | 0.55% * | 0.99% * | 0.20% * | | 0.15% | 0.17% | 0.48% |
| Supplemental data | | | | | | | | |
Portfolio turnover rate6
| 44% | 85% | 36% | 31% | | 36% | 30% | 14% |
Net assets, end of period (000s omitted)
| $141 | $126 | $99 | $100 | | $121 | $113 | $99 |
| * | Ratios reflect net expenses allocated from the affiliated Master Portfolios which were as follows: |
| Six months ended August 31, 2021 (unaudited) | 0.12% |
| Year ended February 28, 2021 | 0.13% |
| Year ended February 29, 2020 | 0.15% |
| Year ended February 28, 20192 | 0.13% |
| ^ | Ratios do not reflect net expenses allocated from the affiliated Master Portfolios. Including annualized net expenses allocated from the affiliated Master Portfolios, the expense ratios would be increased by the following amounts: |
| Year ended May 31, 2018 | 0.09% |
| Year ended May 31, 2017 | 0.10% |
| Year ended May 31, 20163 | 0.10% |
| 1 | Year ended February 29 |
| 2 | For the nine months ended February 28, 2019. The Fund changed its fiscal year end from May 31 to February 28, effective February 28, 2019. |
| 3 | For the period from November 30, 2015 (commencement of class operations) to May 31, 2016 |
| 4 | Total return calculations do not include any sales charges. Returns for periods of less than one year are not annualized. |
| 5 | During the year ended February 28, 2021, the Fund received a payment from an affiliate which had a 1.66% impact on the total return. See Note 4 in the Notes to Financial Statements for additional information. |
| 6 | Portfolio turnover rate is calculated by multiplying the Fund’s ownership percentage in each respective affiliated Master Portfolio by the corresponding affiliated Master Portfolio’s purchases and sales. These purchase and sale amounts are aggregated with any direct purchases and sales in affiliated and unaffiliated mutual funds, exchange-traded funds and unaffiliated securities and included in the portfolio turnover calculation. |
The accompanying notes are an integral part of these financial statements.
116 | Target Date Retirement Funds
Financial highlights
Dynamic Target 2060 Fund
(For a share outstanding throughout each period)
| | | Year ended February 28 | | Year ended May 31 |
| Class R4 | Six months ended
August 31, 2021
(unaudited) | 2021 | 2020 1 | 2019 2 | | 2018 | 2017 | 2016 3 |
Net asset value, beginning of period
| $12.23 | $9.73 | $9.79 | $11.84 | | $11.05 | $9.89 | $10.00 |
Net investment income
| 0.12 | 0.17 | 0.21 | 0.10 | | 0.14 | 0.13 | 0.07 |
Net realized and unrealized gains (losses) on investments
| 1.44 | 2.52 | (0.06) | 0.06 | | 1.22 | 1.39 | (0.12) |
Total from investment operations
| 1.56 | 2.69 | 0.15 | 0.16 | | 1.36 | 1.52 | (0.05) |
| Distributions to shareholders from | | | | | | | | |
Net investment income
| 0.00 | (0.19) | (0.21) | (0.08) | | (0.21) | (0.12) | (0.06) |
Net realized gains
| 0.00 | 0.00 | 0.00 | (2.13) | | (0.36) | (0.24) | 0.00 |
Total distributions to shareholders
| 0.00 | (0.19) | (0.21) | (2.21) | | (0.57) | (0.36) | (0.06) |
Net asset value, end of period
| $13.79 | $12.23 | $9.73 | $9.79 | | $11.84 | $11.05 | $9.89 |
Total return4
| 12.76% | 27.76% | 1.34% | 2.60% | | 12.46% | 15.94% | (0.45)% |
| Ratios to average net assets (annualized) | | | | | | | | |
Gross expenses
| 2.02% * | 3.11% * | 3.37% * | 4.01% * | | 3.96% ^ | 4.52% ^ | 4.96% ^ |
Net expenses
| 0.37% * | 0.37% * | 0.36% * | 0.30% * | | 0.25% ^ | 0.24% ^ | 0.24% ^ |
Net investment income
| 1.81% * | 1.61% * | 2.05% * | 1.25% * | | 1.19% | 1.23% | 1.53% |
| Supplemental data | | | | | | | | |
Portfolio turnover rate5
| 44% | 85% | 36% | 31% | | 36% | 30% | 14% |
Net assets, end of period (000s omitted)
| $144 | $127 | $101 | $102 | | $123 | $115 | $100 |
| * | Ratios reflect net expenses allocated from the affiliated Master Portfolios which were as follows: |
| Six months ended August 31, 2021 (unaudited) | 0.12% |
| Year ended February 28, 2021 | 0.13% |
| Year ended February 29, 2020 | 0.15% |
| Year ended February 28, 20192 | 0.13% |
| ^ | Ratios do not reflect net expenses allocated from the affiliated Master Portfolios. Including annualized net expenses allocated from the affiliated Master Portfolios, the expense ratios would be increased by the following amounts: |
| Year ended May 31, 2018 | 0.09% |
| Year ended May 31, 2017 | 0.10% |
| Year ended May 31, 20163 | 0.10% |
| 1 | Year ended February 29 |
| 2 | For the nine months ended February 28, 2019. The Fund changed its fiscal year end from May 31 to February 28, effective February 28, 2019. |
| 3 | For the period from November 30, 2015 (commencement of class operations) to May 31, 2016 |
| 4 | Returns for periods of less than one year are not annualized. |
| 5 | Portfolio turnover rate is calculated by multiplying the Fund’s ownership percentage in each respective affiliated Master Portfolio by the corresponding affiliated Master Portfolio’s purchases and sales. These purchase and sale amounts are aggregated with any direct purchases and sales in affiliated and unaffiliated mutual funds, exchange-traded funds and unaffiliated securities and included in the portfolio turnover calculation. |
The accompanying notes are an integral part of these financial statements.
Target Date Retirement Funds | 117
Financial highlights
Dynamic Target 2060 Fund
(For a share outstanding throughout each period)
| | | Year ended February 28 | | Year ended May 31 |
| Class R6 | Six months ended
August 31, 2021
(unaudited) | 2021 | 2020 1 | 2019 2 | | 2018 | 2017 | 2016 3 |
Net asset value, beginning of period
| $12.24 | $9.74 | $9.80 | $11.85 | | $11.06 | $9.90 | $10.00 |
Net investment income
| 0.13 | 0.19 | 0.23 | 0.12 | | 0.16 | 0.14 | 0.08 |
Net realized and unrealized gains (losses) on investments
| 1.44 | 2.52 | (0.06) | 0.06 | | 1.22 | 1.39 | (0.11) |
Total from investment operations
| 1.57 | 2.71 | 0.17 | 0.18 | | 1.38 | 1.53 | 0.03 |
| Distributions to shareholders from | | | | | | | | |
Net investment income
| 0.00 | (0.21) | (0.23) | (0.10) | | (0.23) | (0.13) | (0.07) |
Net realized gains
| 0.00 | 0.00 | 0.00 | (2.13) | | (0.36) | (0.24) | 0.00 |
Total distributions to shareholders
| 0.00 | (0.21) | (0.23) | (2.23) | | (0.59) | (0.37) | (0.07) |
Net asset value, end of period
| $13.81 | $12.24 | $9.74 | $9.80 | | $11.85 | $11.06 | $9.90 |
Total return4
| 12.83% | 28.03% | 1.48% | 2.78% | | 12.60% | 16.09% | (0.33)% |
| Ratios to average net assets (annualized) | | | | | | | | |
Gross expenses
| 1.87% * | 2.96% * | 3.23% * | 3.87% * | | 3.81% ^ | 4.37% ^ | 4.81% ^ |
Net expenses
| 0.22% * | 0.22% * | 0.21% * | 0.15% * | | 0.10% ^ | 0.09% ^ | 0.09% ^ |
Net investment income
| 1.96% * | 1.76% * | 2.20% * | 1.40% * | | 1.35% | 1.39% | 1.69% |
| Supplemental data | | | | | | | | |
Portfolio turnover rate5
| 44% | 85% | 36% | 31% | | 36% | 30% | 14% |
Net assets, end of period (000s omitted)
| $6,772 | $5,939 | $4,685 | $4,706 | | $5,692 | $5,312 | $4,584 |
| * | Ratios reflect net expenses allocated from the affiliated Master Portfolios which were as follows: |
| Six months ended August 31, 2021 (unaudited) | 0.13% |
| Year ended February 28, 2021 | 0.14% |
| Year ended February 29, 2020 | 0.17% |
| Year ended February 28, 20192 | 0.14% |
| ^ | Ratios do not reflect net expenses allocated from the affiliated Master Portfolios. Including annualized net expenses allocated from the affiliated Master Portfolios, the expense ratios would be increased by the following amounts: |
| Year ended May 31, 2018 | 0.10% |
| Year ended May 31, 2017 | 0.11% |
| Year ended May 31, 20163 | 0.11% |
| 1 | Year ended February 29 |
| 2 | For the nine months ended February 28, 2019. The Fund changed its fiscal year end from May 31 to February 28, effective February 28, 2019. |
| 3 | For the period from November 30, 2015 (commencement of class operations) to May 31, 2016 |
| 4 | Returns for periods of less than one year are not annualized. |
| 5 | Portfolio turnover rate is calculated by multiplying the Fund’s ownership percentage in each respective affiliated Master Portfolio by the corresponding affiliated Master Portfolio’s purchases and sales. These purchase and sale amounts are aggregated with any direct purchases and sales in affiliated and unaffiliated mutual funds, exchange-traded funds and unaffiliated securities and included in the portfolio turnover calculation. |
The accompanying notes are an integral part of these financial statements.
118 | Target Date Retirement Funds
Notes to financial statements (unaudited)
1. ORGANIZATION
Wells Fargo Funds Trust (the “Trust”), a Delaware statutory trust organized on March 10, 1999, is an open-end management investment company registered under the Investment Company Act of 1940, as amended (the “1940 Act”). As an investment company, the Trust follows the accounting and reporting guidance in Financial Accounting Standards Board Accounting Standards Codification Topic 946, Financial Services – Investment Companies. These financial statements report on the following funds: Wells Fargo Dynamic Target Today Fund (“Dynamic Target Today Fund”), Wells Fargo Dynamic Target 2015 Fund (“Dynamic Target 2015 Fund”), Wells Fargo Dynamic Target 2020 Fund (“Dynamic Target 2020 Fund”), Wells Fargo Dynamic Target 2025 Fund (“Dynamic Target 2025 Fund”), Wells Fargo Dynamic Target 2030 Fund (“Dynamic Target 2030 Fund”), Wells Fargo Dynamic Target 2035 Fund (“Dynamic Target 2035 Fund”), Wells Fargo Dynamic Target 2040 Fund (“Dynamic Target 2040 Fund”), Wells Fargo Dynamic Target 2045 Fund (“Dynamic Target 2045 Fund”), Wells Fargo Dynamic Target 2050 Fund (“Dynamic Target 2050 Fund”), Wells Fargo Dynamic Target 2055 Fund (“Dynamic Target 2055 Fund”), and Wells Fargo Dynamic Target 2060 Fund (“Dynamic Target 2060 Fund”) (each, a “Fund”, collectively, the “Funds”). Each Fund is a diversified series of the Trust.
Each Fund is a fund-of-funds which seeks to achieve its investment objective by investing in multiple diversified portfolios (collectively, the “affiliated Master Portfolios”) of Wells Fargo Master Trust, a registered open-end management investment company. Each affiliated Master Portfolio directly acquires portfolio securities, and a Fund investing in an affiliated Master Portfolio acquires an indirect interest in those securities. Each Fund accounts for its investment in the affiliated Master Portfolios as partnership investments and records on a daily basis its share of each affiliated Master Portfolio’s income, expense and realized and unrealized gains and losses. The financial statements of each affiliated Master Portfolio are presented in separate financial statements and may be obtained free of charge by contacting Investor Services or by visiting the SEC website at sec.gov. The financial statements of the affiliated Master Portfolios are filed with the SEC under Wells Fargo Master Trust.
On February 23, 2021, Wells Fargo & Company announced that it has entered into a definitive agreement to sell Wells Fargo Asset Management (“WFAM”) to GTCR LLC and Reverence Capital Partners, L.P. WFAM is the trade name used by the asset management businesses of Wells Fargo & Company and includes Wells Fargo Funds Management, LLC, the investment manager to each Fund, Wells Capital Management, LLC and Wells Fargo Asset Management (International) Limited, both registered investment advisers providing subadvisory services to certain funds, and Wells Fargo Funds Distributor, LLC, each Fund's principal underwriter. As part of the transaction, Wells Fargo & Company will own a 9.9% equity interest and will continue to serve as an important client and distribution partner.
Consummation of the transaction will result in the automatic termination of each Fund's investment management agreement and subadvisory agreement. Each Fund's Board of Trustees approved a new investment management and new subadvisory agreement which were submitted to each Fund’s shareholders for approval at a Special Meeting of Shareholders held on August 16, 2021. Shareholders of record of each Fund at the close of business on May 28, 2021 approved the new agreements which will take effect upon the closing of the transaction. The transaction is expected to close in the second half of 2021, subject to customary closing conditions.
2. SIGNIFICANT ACCOUNTING POLICIES
The following significant accounting policies, which are consistently followed in the preparation of the financial statements of the Funds, are in conformity with U.S. generally accepted accounting principles which require management to make estimates and assumptions that affect the reported amounts of assets and liabilities, disclosure of contingent assets and liabilities at the date of the financial statements, and the reported amounts of income and expenses during the reporting period. Actual results could differ from those estimates.
Securities valuation
All investments are valued each business day as of the close of regular trading on the New York Stock Exchange (generally 4 p.m. Eastern Time), although the Funds may deviate from this calculation time under unusual or unexpected circumstances.
Investments in the affiliated Master Portfolios are valued daily based on each Fund’s proportionate share of each affiliated Master Portfolio’s net assets, which are also valued daily.
Debt securities are valued at the evaluated bid price provided by an independent pricing service (e.g. taking into account various factors, including yields, maturities, or credit ratings) or, if a reliable price is not available, the quoted bid price from an independent broker-dealer.
Futures contracts that are listed on a foreign or domestic exchange or market are valued at the official closing price or, if none, the last sales price.
Target Date Retirement Funds | 119
Notes to financial statements (unaudited)
Investments which are not valued using any of the methods discussed above are valued at their fair value, as determined in good faith by the Board of Trustees. The Board of Trustees has established a Valuation Committee comprised of the Trustees and has delegated to it the authority to take any actions regarding the valuation of portfolio securities that the Valuation Committee deems necessary or appropriate, including determining the fair value of portfolio securities, unless the determination has been delegated to the Wells Fargo Asset Management Pricing Committee at Wells Fargo Funds Management, LLC ("Funds Management"). The Board of Trustees retains the authority to make or ratify any valuation decisions or approve any changes to the Valuation Procedures as it deems appropriate. On a quarterly basis, the Board of Trustees receives reports on any valuation actions taken by the Valuation Committee or the Wells Fargo Asset Management Pricing Committee which may include items for ratification.
Futures contracts
Futures contracts are agreements between each Fund and a counterparty to buy or sell a specific amount of a commodity, financial instrument or currency at a specified price on a specified date. Each Fund may buy and sell futures contracts in order to gain exposure to, or protect against, changes in interest rates, security values and foreign exchange rates and is subject to interest rate risk, equity price risk and foreign currency risk. The primary risks associated with the use of futures contracts are the imperfect correlation between changes in market values of securities held by the Fund and the prices of futures contracts, and the possibility of an illiquid market. Futures contracts are generally entered into on a regulated futures exchange and cleared through a clearinghouse associated with the exchange. With futures contracts, there is minimal counterparty risk to the Fund since futures contracts are exchange traded and the exchange’s clearinghouse, as the counterparty to all exchange traded futures, guarantees the futures contracts against default.
Upon entering into a futures contract, the Fund is required to deposit either cash or securities (initial margin) with the broker in an amount equal to a certain percentage of the contract value. Subsequent payments (variation margin) are paid to or from the broker each day equal to the daily changes in the contract value. Such payments are recorded as unrealized gains or losses and, if any, shown as variation margin receivable (payable) in the Statements of Assets and Liabilities. Should the Fund fail to make requested variation margin payments, the broker can gain access to the initial margin to satisfy the Fund’s payment obligations. When the contracts are closed, a realized gain or loss is recorded in the Statements of Operations.
Investment transactions, income and expenses
Investments in affiliated Master Portfolios and securities transactions are recorded on a trade date basis. Realized gains or losses are recorded on the basis of identified cost.
Each Fund records on a daily basis its proportionate share of each affiliated Master Portfolio’s income, expenses and realized and unrealized gains and losses. Each Fund also accrues its own expenses. Income from foreign securities in each affiliated Master Portfolio is recorded net of foreign taxes withheld where recovery of such taxes is not assured.
Interest income is accrued daily and bond discounts are accreted and premiums are amortized daily. To the extent debt obligations are placed on non-accrual status, any related interest income may be reduced by writing off interest receivables when the collection of all or a portion of interest has been determined to be doubtful based on consistently applied procedures and the fair value has decreased. If the issuer subsequently resumes interest payments or when the collectability of interest is reasonably assured, the debt obligation is removed from non-accrual status.
Distributions to shareholders
Distributions to shareholders from net investment income and any net realized gains are recorded on the ex-dividend date and paid at least annually. Such distributions are determined in accordance with income tax regulations and may differ from U.S. generally accepted accounting principles. Dividend sources are estimated at the time of declaration. The tax character of distributions is determined as of each Fund's fiscal year end. Therefore, a portion of each Fund's distributions made prior to the Fund’s fiscal year end may be categorized as a tax return of capital at year end.
Federal and other taxes
Each Fund is treated as a separate entity for federal income tax purposes. Each Fund intends to continue to qualify as a regulated investment company by distributing substantially all of its investment company taxable income and any net realized capital gains (after reduction for capital loss carryforwards) sufficient to relieve it from all, or substantially all, federal income taxes. Accordingly, no provision for federal income taxes was required.
Each Fund’s income and federal excise tax returns and all financial records supporting those returns for the prior three fiscal years are subject to examination by the federal and Delaware revenue authorities. Management has analyzed each Fund's tax positions taken on federal, state, and foreign tax returns for all open tax years and does not believe that there are any uncertain tax positions that require recognition of a tax liability.
120 | Target Date Retirement Funds
Notes to financial statements (unaudited)
As of August 31, 2021, the aggregate cost of all investments for federal income tax purposes and the unrealized gains (losses) were as follows:
| | Tax cost | Gross
unrealized
gains | Gross
unrealized
losses | Net
unrealized
gains |
| Dynamic Target Today Fund | $ 6,556,352 | $ 837,573 | $0 | $ 837,573 |
| Dynamic Target 2015 Fund | 6,008,627 | 768,416 | 0 | 768,416 |
| Dynamic Target 2020 Fund | 7,281,166 | 994,086 | 0 | 994,086 |
| Dynamic Target 2025 Fund | 12,182,324 | 1,546,848 | 0 | 1,546,848 |
| Dynamic Target 2030 Fund | 12,106,533 | 1,637,600 | 0 | 1,637,600 |
| Dynamic Target 2035 Fund | 10,854,239 | 1,695,970 | 0 | 1,695,970 |
| Dynamic Target 2040 Fund | 9,135,658 | 1,662,330 | 0 | 1,662,330 |
| Dynamic Target 2045 Fund | 7,398,306 | 1,434,259 | 0 | 1,434,259 |
| Dynamic Target 2050 Fund | 6,653,510 | 1,337,216 | 0 | 1,337,216 |
| Dynamic Target 2055 Fund | 6,922,847 | 1,377,164 | 0 | 1,377,164 |
| Dynamic Target 2060 Fund | 6,204,889 | 1,285,715 | 0 | 1,285,715 |
As of February 28, 2021, the Dynamic Target 2060 Fund had capital loss carryforwards which consist of $12,802 in short-term capital losses and $4,970 in long-term capital losses.
Class allocations
The separate classes of shares offered by each Fund differ principally in applicable sales charges, distribution, shareholder servicing, and administration fees. Class specific expenses are charged directly to that share class. Investment income, common fund-level expenses, and realized and unrealized gains (losses) on investments are allocated daily to each class of shares based on the relative proportion of net assets of each class.
3. FAIR VALUATION MEASUREMENTS
Fair value measurements of investments are determined within a framework that has established a fair value hierarchy based upon the various data inputs utilized in determining the value of each Fund’s investments. The three-level hierarchy gives the highest priority to unadjusted quoted prices in active markets for identical assets or liabilities (Level 1) and the lowest priority to unobservable inputs (Level 3). Each Fund’s investments are classified within the fair value hierarchy based on the lowest level of input that is significant to the fair value measurement. The inputs are summarized into three broad levels as follows:
| ■ | Level 1 – quoted prices in active markets for identical securities |
| ■ | Level 2 – other significant observable inputs (including quoted prices for similar securities, interest rates, prepayment speeds, credit risk, etc.) |
| ■ | Level 3 – significant unobservable inputs (including the Fund’s own assumptions in determining the fair value of investments) |
The inputs or methodologies used for valuing investments in securities are not necessarily an indication of the risk associated with investing in those securities.
The following is a summary of the inputs used in valuing each Fund’s assets and liabilities as of August 31, 2021:
Target Date Retirement Funds | 121
Notes to financial statements (unaudited)
| Dynamic Target Today Fund | Quoted prices
(Level 1) | Other significant
observable inputs
(Level 2) | Significant
unobservable inputs
(Level 3) | Total |
| Assets | | | | |
| Investments in: | | | | |
| Investments measured at net asset value* | | | | $ 7,378,215 |
| Futures contracts | $ 19,482 | $0 | $0 | 19,482 |
| Total assets | $19,482 | $0 | $0 | $7,397,697 |
| Liabilities | | | | |
| Futures contracts | $ 3,772 | $0 | $0 | $ 3,772 |
| Total liabilities | $ 3,772 | $0 | $0 | $ 3,772 |
| * | Investments that are measured at fair value using the net asset value per share (or its equivalent) as a practical expedient have not been categorized in the fair value hierarchy. The fair value amount presented in the table is intended to permit reconciliation of the fair value hierarchy to the amounts presented in the Statements of Assets and Liabilities. The Fund’s investments in the affiliated Master Portfolios are valued at $7,378,215. Each affiliated Master Portfolio does not have a redemption period notice, can be redeemed daily and does not have any unfunded commitments. |
| Dynamic Target 2015 Fund | Quoted prices
(Level 1) | Other significant
observable inputs
(Level 2) | Significant
unobservable inputs
(Level 3) | Total |
| Assets | | | | |
| Investments in: | | | | |
| Investments measured at net asset value* | | | | $ 6,762,257 |
| Futures contracts | $ 18,558 | $0 | $0 | 18,558 |
| Total assets | $18,558 | $0 | $0 | $6,780,815 |
| Liabilities | | | | |
| Futures contracts | $ 3,772 | $0 | $0 | $ 3,772 |
| Total liabilities | $ 3,772 | $0 | $0 | $ 3,772 |
| * | Investments that are measured at fair value using the net asset value per share (or its equivalent) as a practical expedient have not been categorized in the fair value hierarchy. The fair value amount presented in the table is intended to permit reconciliation of the fair value hierarchy to the amounts presented in the Statements of Assets and Liabilities. The Fund’s investments in the affiliated Master Portfolios are valued at $6,762,257. Each affiliated Master Portfolio does not have a redemption period notice, can be redeemed daily and does not have any unfunded commitments. |
122 | Target Date Retirement Funds
Notes to financial statements (unaudited)
| Dynamic Target 2020 Fund | Quoted prices
(Level 1) | Other significant
observable inputs
(Level 2) | Significant
unobservable inputs
(Level 3) | Total |
| Assets | | | | |
| Investments in: | | | | |
| Investments measured at net asset value* | | | | $ 8,259,542 |
| Futures contracts | $ 19,482 | $0 | $0 | 19,482 |
| Total assets | $19,482 | $0 | $0 | $8,279,024 |
| Liabilities | | | | |
| Futures contracts | $ 3,772 | $0 | $0 | $ 3,772 |
| Total liabilities | $ 3,772 | $0 | $0 | $ 3,772 |
| * | Investments that are measured at fair value using the net asset value per share (or its equivalent) as a practical expedient have not been categorized in the fair value hierarchy. The fair value amount presented in the table is intended to permit reconciliation of the fair value hierarchy to the amounts presented in the Statements of Assets and Liabilities. The Fund’s investments in the affiliated Master Portfolios are valued at $8,259,542. Each affiliated Master Portfolio does not have a redemption period notice, can be redeemed daily and does not have any unfunded commitments. |
| Dynamic Target 2025 Fund | Quoted prices
(Level 1) | Other significant
observable inputs
(Level 2) | Significant
unobservable inputs
(Level 3) | Total |
| Assets | | | | |
| Investments in: | | | | |
| Investments measured at net asset value* | | | | $ 13,698,676 |
| Futures contracts | $ 38,041 | $0 | $0 | 38,041 |
| Total assets | $38,041 | $0 | $0 | $13,736,717 |
| Liabilities | | | | |
| Futures contracts | $ 7,545 | $0 | $0 | $ 7,545 |
| Total liabilities | $ 7,545 | $0 | $0 | $ 7,545 |
| * | Investments that are measured at fair value using the net asset value per share (or its equivalent) as a practical expedient have not been categorized in the fair value hierarchy. The fair value amount presented in the table is intended to permit reconciliation of the fair value hierarchy to the amounts presented in the Statements of Assets and Liabilities. The Fund’s investments in the affiliated Master Portfolios are valued at $13,698,676. Each affiliated Master Portfolio does not have a redemption period notice, can be redeemed daily and does not have any unfunded commitments. |
Target Date Retirement Funds | 123
Notes to financial statements (unaudited)
| Dynamic Target 2030 Fund | Quoted prices
(Level 1) | Other significant
observable inputs
(Level 2) | Significant
unobservable inputs
(Level 3) | Total |
| Assets | | | | |
| Investments in: | | | | |
| Investments measured at net asset value* | | | | $ 13,727,827 |
| Futures contracts | $ 23,851 | $0 | $0 | 23,851 |
| Total assets | $23,851 | $0 | $0 | $13,751,678 |
| Liabilities | | | | |
| Futures contracts | $ 7,545 | $0 | $0 | $ 7,545 |
| Total liabilities | $ 7,545 | $0 | $0 | $ 7,545 |
| * | Investments that are measured at fair value using the net asset value per share (or its equivalent) as a practical expedient have not been categorized in the fair value hierarchy. The fair value amount presented in the table is intended to permit reconciliation of the fair value hierarchy to the amounts presented in the Statements of Assets and Liabilities. The Fund’s investments in the affiliated Master Portfolios are valued at $13,727,827. Each affiliated Master Portfolio does not have a redemption period notice, can be redeemed daily and does not have any unfunded commitments. |
| Dynamic Target 2035 Fund | Quoted prices
(Level 1) | Other significant
observable inputs
(Level 2) | Significant
unobservable inputs
(Level 3) | Total |
| Assets | | | | |
| Investments in: | | | | |
| Investments measured at net asset value* | | | | $ 12,536,087 |
| Futures contracts | $ 21,667 | $0 | $0 | 21,667 |
| Total assets | $21,667 | $0 | $0 | $12,557,754 |
| Liabilities | | | | |
| Futures contracts | $ 7,545 | $0 | $0 | $ 7,545 |
| Total liabilities | $ 7,545 | $0 | $0 | $ 7,545 |
| * | Investments that are measured at fair value using the net asset value per share (or its equivalent) as a practical expedient have not been categorized in the fair value hierarchy. The fair value amount presented in the table is intended to permit reconciliation of the fair value hierarchy to the amounts presented in the Statements of Assets and Liabilities. The Fund’s investments in the affiliated Master Portfolios are valued at $12,536,087. Each affiliated Master Portfolio does not have a redemption period notice, can be redeemed daily and does not have any unfunded commitments. |
124 | Target Date Retirement Funds
Notes to financial statements (unaudited)
| Dynamic Target 2040 Fund | Quoted prices
(Level 1) | Other significant
observable inputs
(Level 2) | Significant
unobservable inputs
(Level 3) | Total |
| Assets | | | | |
| Investments in: | | | | |
| Investments measured at net asset value* | | | | $ 10,783,866 |
| Futures contracts | $ 21,667 | $0 | $0 | 21,667 |
| Total assets | $21,667 | $0 | $0 | $10,805,533 |
| Liabilities | | | | |
| Futures contracts | $ 7,545 | $0 | $0 | $ 7,545 |
| Total liabilities | $ 7,545 | $0 | $0 | $ 7,545 |
| * | Investments that are measured at fair value using the net asset value per share (or its equivalent) as a practical expedient have not been categorized in the fair value hierarchy. The fair value amount presented in the table is intended to permit reconciliation of the fair value hierarchy to the amounts presented in the Statements of Assets and Liabilities. The Fund’s investments in the affiliated Master Portfolios are valued at $10,783,866. Each affiliated Master Portfolio does not have a redemption period notice, can be redeemed daily and does not have any unfunded commitments. |
| Dynamic Target 2045 Fund | Quoted prices
(Level 1) | Other significant
observable inputs
(Level 2) | Significant
unobservable inputs
(Level 3) | Total |
| Assets | | | | |
| Investments in: | | | | |
| Investments measured at net asset value* | | | | $ 8,816,855 |
| Futures contracts | $ 19,482 | $0 | $0 | 19,482 |
| Total assets | $19,482 | $0 | $0 | $8,836,337 |
| Liabilities | | | | |
| Futures contracts | $ 3,772 | $0 | $0 | $ 3,772 |
| Total liabilities | $ 3,772 | $0 | $0 | $ 3,772 |
| * | Investments that are measured at fair value using the net asset value per share (or its equivalent) as a practical expedient have not been categorized in the fair value hierarchy. The fair value amount presented in the table is intended to permit reconciliation of the fair value hierarchy to the amounts presented in the Statements of Assets and Liabilities. The Fund’s investments in the affiliated Master Portfolios are valued at $8,816,855. Each affiliated Master Portfolio does not have a redemption period notice, can be redeemed daily and does not have any unfunded commitments. |
Target Date Retirement Funds | 125
Notes to financial statements (unaudited)
| Dynamic Target 2050 Fund | Quoted prices
(Level 1) | Other significant
observable inputs
(Level 2) | Significant
unobservable inputs
(Level 3) | Total |
| Assets | | | | |
| Investments in: | | | | |
| Investments measured at net asset value* | | | | $ 7,975,016 |
| Futures contracts | $ 19,482 | $0 | $0 | 19,482 |
| Total assets | $19,482 | $0 | $0 | $7,994,498 |
| Liabilities | | | | |
| Futures contracts | $ 3,772 | $0 | $0 | $ 3,772 |
| Total liabilities | $ 3,772 | $0 | $0 | $ 3,772 |
| * | Investments that are measured at fair value using the net asset value per share (or its equivalent) as a practical expedient have not been categorized in the fair value hierarchy. The fair value amount presented in the table is intended to permit reconciliation of the fair value hierarchy to the amounts presented in the Statements of Assets and Liabilities. The Fund’s investments in the affiliated Master Portfolios are valued at $7,975,016. Each affiliated Master Portfolio does not have a redemption period notice, can be redeemed daily and does not have any unfunded commitments. |
| Dynamic Target 2055 Fund | Quoted prices
(Level 1) | Other significant
observable inputs
(Level 2) | Significant
unobservable inputs
(Level 3) | Total |
| Assets | | | | |
| Investments in: | | | | |
| Investments measured at net asset value* | | | | $ 8,284,301 |
| Futures contracts | $ 19,482 | $0 | $0 | 19,482 |
| Total assets | $19,482 | $0 | $0 | $8,303,783 |
| Liabilities | | | | |
| Futures contracts | $ 3,772 | $0 | $0 | $ 3,772 |
| Total liabilities | $ 3,772 | $0 | $0 | $ 3,772 |
| * | Investments that are measured at fair value using the net asset value per share (or its equivalent) as a practical expedient have not been categorized in the fair value hierarchy. The fair value amount presented in the table is intended to permit reconciliation of the fair value hierarchy to the amounts presented in the Statements of Assets and Liabilities. The Fund’s investments in the affiliated Master Portfolios are valued at $8,284,301. Each affiliated Master Portfolio does not have a redemption period notice, can be redeemed daily and does not have any unfunded commitments. |
126 | Target Date Retirement Funds
Notes to financial statements (unaudited)
| Dynamic Target 2060 Fund | Quoted prices
(Level 1) | Other significant
observable inputs
(Level 2) | Significant
unobservable inputs
(Level 3) | Total |
| Assets | | | | |
| Investments in: | | | | |
| Investments measured at net asset value* | | | | $ 7,474,894 |
| Futures contracts | $ 19,482 | $0 | $0 | 19,482 |
| Total assets | $19,482 | $0 | $0 | $7,494,376 |
| Liabilities | | | | |
| Futures contracts | $ 3,772 | $0 | $0 | $ 3,772 |
| Total liabilities | $ 3,772 | $0 | $0 | $ 3,772 |
| * | Investments that are measured at fair value using the net asset value per share (or its equivalent) as a practical expedient have not been categorized in the fair value hierarchy. The fair value amount presented in the table is intended to permit reconciliation of the fair value hierarchy to the amounts presented in the Statements of Assets and Liabilities. The Fund’s investments in the affiliated Master Portfolios are valued at $7,474,894. Each affiliated Master Portfolio does not have a redemption period notice, can be redeemed daily and does not have any unfunded commitments. |
Futures contracts are reported at their cumulative unrealized gains (losses) at measurement date as reported in the tables following each Portfolio of Investments. For futures contracts, the current day’s variation margin is reported on the Statements of Assets and Liabilities. All other assets and liabilities are reported at their market value at measurement date.
The investment objective of each affiliated Master Portfolio is as follows:
| Affiliated Master Portfolio | Investment objective |
| Wells Fargo Bloomberg Barclays US Aggregate ex-Corporate Portfolio | Seeks to replicate the total return of the Bloomberg U.S. Aggregate ex-Corporate Index, before fees and expenses |
| Wells Fargo Emerging Markets Bond Portfolio | Seeks to replicate the total return of the JP Morgan EMBI Global Diversified Index, before fees and expenses |
| Wells Fargo Factor Enhanced Emerging Markets Equity Portfolio | Seeks long-term capital appreciation |
| Wells Fargo Factor Enhanced International Equity Portfolio | Seeks long-term capital appreciation |
| Wells Fargo Factor Enhanced U.S. Large Cap Equity Portfolio | Seeks long-term capital appreciation |
| Wells Fargo Factor Enhanced U.S. Small Cap Equity Portfolio | Seeks long-term capital appreciation |
| Wells Fargo High Yield Corporate Bond Portfolio | Seeks to replicate the total return of the Bloomberg U.S. High Yield 2% Issuer Capped Bond Index, before fees and expenses |
| Wells Fargo Investment Grade Corporate Bond Portfolio | Seeks to replicate the total return of the Bloomberg U.S. Corporate Bond Index, before fees and expenses |
| Wells Fargo Strategic Retirement Bond Portfolio | Seeks to replicate the total return of a blended index that is weighted 50% to the Bloomberg U.S. Treasury Inflation-Linked 1-10 Year Bond Index and 50% to the Bloomberg U.S. Intermediate Government Bond Index, before fees and expenses |
| Wells Fargo U.S. REIT Portfolio | Seeks to replicate the total return of the Dow Jones U.S. Select REIT Index, before fees and expenses |
4. TRANSACTIONS WITH AFFILIATES
Management fee
Funds Management, an indirect wholly owned subsidiary of Wells Fargo & Company ("Wells Fargo"), is the manager of each Fund and provides advisory and fund-level administrative services under an investment management agreement. Under the investment management agreement, Funds Management is responsible for, among other services, implementing the investment objectives and strategies of each Fund, supervising the subadviser and providing fund-level administrative services in connection with each Fund’s operations. As compensation for its services under the investment management agreement,
Target Date Retirement Funds | 127
Notes to financial statements (unaudited)
Funds Management is entitled to receive a management fee at the following annual rate based on each Fund’s average daily net assets:
| Average daily net assets | Management fee |
| First $5 billion | 0.150% |
| Next $5 billion | 0.140 |
| Over $10 billion | 0.130 |
For the six months ended August 31, 2021, the management fee was equivalent to an annual rate of 0.15% of each Fund’s average daily net assets.
Funds Management has retained the services of a subadviser to provide daily portfolio management to each Fund. The fee for subadvisory services is borne by Funds Management. Wells Capital Management, LLC, an affiliate of Funds Management and an indirect wholly owned subsidiary of Wells Fargo, is the subadviser to each Fund and is entitled to receive a fee from Funds Management at an annual rate starting at 0.10% and declining to 0.06% as the average daily net assets of each Fund increase.
Funds Management also serves as the adviser to each affiliated Master Portfolio and is entitled to receive a fee from each affiliated Master Portfolio for those services.
Administration fees
Under a class-level administration agreement, Funds Management provides class-level administrative services to each Fund, which includes paying fees and expenses for services provided by the transfer agent, sub-transfer agents, omnibus account servicers and record-keepers. As compensation for its services under the class-level administration agreement, Funds Management receives an annual fee which is calculated based on the average daily net assets of each class as follows:
| | Class-level
administration fee |
| Class A | 0.21% |
| Class C | 0.21 |
| Class R4 | 0.08 |
| Class R6 | 0.03 |
Waivers and/or expense reimbursements
Funds Management has contractually committed to waive and/or reimburse management and administration fees to the extent necessary to maintain certain net operating expense ratios for each Fund. When each class of each Fund has exceeded its expense cap, Funds Management will waive fees and/or reimburse expenses from fund-level expenses on a proportionate basis and then from class specific expenses. When only certain classes exceed their expense caps, waivers and/or reimbursements are applied against class specific expenses before fund-level expenses. Funds Management has contractually committed through June 30, 2022 to waive fees and/or reimburse expenses to the extent necessary to cap expenses. Prior to or after the commitment expiration date, the caps may be increased or the commitment to maintain the caps may be terminated only with the approval of the Board of Trustees. The contractual expense caps are as follows:
| | Expense ratio caps |
| Class A | 0.68% |
| Class C | 1.43 |
| Class R4 | 0.37 |
| Class R6 | 0.22 |
Distribution fee
The Trust has adopted a Distribution Plan for Class C shares of the applicable Funds pursuant to Rule 12b-1 under the 1940 Act. A distribution fee is charged to Class C shares and paid to Wells Fargo Funds Distributor, LLC ("Funds Distributor"), the principal underwriter of each Fund, at an annual rate of 0.75% of the average daily net assets of Class C shares.
128 | Target Date Retirement Funds
Notes to financial statements (unaudited)
In addition, Funds Distributor is entitled to receive the front-end sales charge from the purchase of Class A shares and a contingent deferred sales charge on the redemption of certain Class A shares. Funds Distributor is also entitled to receive the contingent deferred sales charges from redemptions of Class C shares. For the six months ended August 31, 2021, Funds Distributor received front-end sales charges and contingent deferred sales charges from the following Funds:
| | Front-end
sales charges |
| | Class A |
| Dynamic Target 2025 Fund | $ 46 |
| Dynamic Target 2030 Fund | 15 |
| Dynamic Target 2035 Fund | 29 |
| Dynamic Target 2040 Fund | 3 |
| Dynamic Target 2050 Fund | 19 |
| Dynamic Target 2055 Fund | 10 |
| Dynamic Target 2060 Fund | 25 |
No contingent deferred sales charges were incurred by Class A shares and Class C shares for the six months ended August 31, 2021.
Shareholder servicing fees
The Trust has entered into contracts with one or more shareholder servicing agents, whereby Class A and Class C of each Fund are charged a fee at an annual rate of 0.25% of the average daily net assets of each respective class. Class R4 is charged a fee at an annual rate of 0.10% of its average daily net assets. A portion of these total shareholder servicing fees were paid to affiliates of Wells Fargo.
Other transactions
On August 14, 2020, Class C of each Fund received a payment from Funds Management in connection with resolving certain fee reimbursements.
| | Reimbursement amount |
| Dynamic Target Today Fund | $1,648 |
| Dynamic Target 2015 Fund | 1,699 |
| Dynamic Target 2020 Fund | 1,768 |
| Dynamic Target 2025 Fund | 1,794 |
| Dynamic Target 2030 Fund | 1,378 |
| Dynamic Target 2035 Fund | 1,801 |
| Dynamic Target 2040 Fund | 1,690 |
| Dynamic Target 2045 Fund | 1,821 |
| Dynamic Target 2050 Fund | 1,735 |
| Dynamic Target 2055 Fund | 1,693 |
| Dynamic Target 2060 Fund | 1,632 |
5. INVESTMENT PORTFOLIO TRANSACTIONS
Each Fund seeks to achieve its investment objectives by investing some of its investable assets in affiliated Master Portfolios. Purchases and sales related to these investments have been calculated by aggregating the results of multiplying each Fund's ownership percentage in the respective affiliated Master Portfolio by the corresponding affiliated Master Portfolio’s purchases and sales. Purchases and sales of investments, excluding short-term securities, for the six months ended August 31, 2021 were as follows:
Target Date Retirement Funds | 129
Notes to financial statements (unaudited)
| | Purchases at cost | | Sales proceeds |
| | U.S.
government | Non-U.S.
government | | U.S.
government | Non-U.S.
government |
| Dynamic Target Today Fund | $2,210,227 | $1,459,877 | | $2,106,907 | $1,603,985 |
| Dynamic Target 2015 Fund | 1,772,257 | 1,459,260 | | 1,689,407 | 1,615,231 |
| Dynamic Target 2020 Fund | 1,855,547 | 1,949,012 | | 1,768,808 | 2,167,626 |
| Dynamic Target 2025 Fund | 2,540,383 | 3,993,129 | | 2,406,387 | 4,374,774 |
| Dynamic Target 2030 Fund | 1,917,695 | 4,150,052 | | 1,806,228 | 4,518,535 |
| Dynamic Target 2035 Fund | 1,440,948 | 4,064,137 | | 1,353,614 | 4,408,728 |
| Dynamic Target 2040 Fund | 925,942 | 3,691,395 | | 869,823 | 4,001,630 |
| Dynamic Target 2045 Fund | 508,488 | 3,189,179 | | 477,670 | 3,461,664 |
| Dynamic Target 2050 Fund | 228,070 | 2,965,790 | | 214,248 | 3,214,008 |
| Dynamic Target 2055 Fund | 238,584 | 3,068,248 | | 224,124 | 3,325,347 |
| Dynamic Target 2060 Fund | 215,076 | 2,789,784 | | 202,040 | 3,026,454 |
6. DERIVATIVE TRANSACTIONS
During the six months ended August 31, 2021 , the following Fund entered into futures contracts to gain market exposure to certain asset classes consistent with an active asset allocation strategy. The volume of each Fund's futures contracts during the six months ended August 31, 2021 was as follows:
| | Average notional balance |
| | Long
futures | Short
futures |
| Dynamic Target Today Fund | $550,407 | $437,255 |
| Dynamic Target 2015 Fund | 499,655 | 415,548 |
| Dynamic Target 2020 Fund | 562,699 | 437,255 |
| Dynamic Target 2025 Fund | 945,346 | 695,812 |
| Dynamic Target 2030 Fund | 758,511 | 695,812 |
| Dynamic Target 2035 Fund | 714,793 | 637,525 |
| Dynamic Target 2040 Fund | 686,640 | 577,132 |
| Dynamic Target 2045 Fund | 556,414 | 437,255 |
| Dynamic Target 2050 Fund | 542,043 | 415,548 |
| Dynamic Target 2055 Fund | 542,043 | 437,255 |
| Dynamic Target 2060 Fund | 536,666 | 415,548 |
A summary of the location of derivative instruments on the financial statements by primary risk exposure is outlined in the following tables.
130 | Target Date Retirement Funds
Notes to financial statements (unaudited)
The fair value of derivative instruments as of August 31, 2021 by primary risk type was as follows for the Dynamic Target Today Fund:
| | Asset derivatives | | Liability derivatives |
| Dynamic Target Today Fund | Statements of Assets and
Liabilities location | Fair value | | Statements of Assets and
Liabilities location | Fair value |
| Equity risk | Unrealized gains on futures contracts | $ 14,190* | | Unrealized losses on futures contracts | $ 3,772* |
| Foreign currency risk | Unrealized gains on futures contracts | 5,292* | | Unrealized losses on futures contracts | 0* |
| | | $19,482 | | | $3,772 |
* Amount represents the cumulative unrealized gains (losses) as reported in the table following the Portfolio of Investments. For futures contracts, only the current day's variation margin as of August 31, 2021 is reported separately on the Statements of Assets and Liabilities.
The effect of derivative instruments on the Statements of Operations for the six months ended August 31, 2021 was as follows:
| Dynamic Target Today Fund | Amount of realized
gains (losses) on
derivatives | Change in unrealized
gains (losses) on
derivatives |
| Equity risk | $ (1,215) | $ 13,886 |
| Foreign currency risk | 11,183 | 5,292 |
| | $ 9,968 | $19,178 |
The fair value of derivative instruments as of August 31, 2021 by primary risk type was as follows for the Dynamic Target 2015 Fund:
| | Asset derivatives | | Liability derivatives |
| Dynamic Target 2015 Fund | Statements of Assets and
Liabilities location | Fair value | | Statements of Assets and
Liabilities location | Fair value |
| Equity risk | Unrealized gains on futures contracts | $ 14,190* | | Unrealized losses on futures contracts | $ 3,772* |
| Foreign currency risk | Unrealized gains on futures contracts | 4,368* | | Unrealized losses on futures contracts | 0* |
| | | $18,558 | | | $3,772 |
* Amount represents the cumulative unrealized gains (losses) as reported in the table following the Portfolio of Investments. For futures contracts, only the current day's variation margin as of August 31, 2021 is reported separately on the Statements of Assets and Liabilities.
The effect of derivative instruments on the Statements of Operations for the six months ended August 31, 2021 was as follows:
| Dynamic Target 2015 Fund | Amount of realized
gains (losses) on
derivatives | Change in unrealized
gains (losses) on
derivatives |
| Equity risk | $ (1,608) | $ 13,358 |
| Foreign currency risk | 11,093 | 4,368 |
| | $ 9,485 | $17,726 |
Target Date Retirement Funds | 131
Notes to financial statements (unaudited)
The fair value of derivative instruments as of August 31, 2021 by primary risk type was as follows for the Dynamic Target 2020 Fund:
| | Asset derivatives | | Liability derivatives |
| Dynamic Target 2020 Fund | Statements of Assets and
Liabilities location | Fair value | | Statements of Assets and
Liabilities location | Fair value |
| Equity risk | Unrealized gains on futures contracts | $ 14,190* | | Unrealized losses on futures contracts | $ 3,772* |
| Foreign currency risk | Unrealized gains on futures contracts | 5,292* | | Unrealized losses on futures contracts | 0* |
| | | $19,482 | | | $3,772 |
* Amount represents the cumulative unrealized gains (losses) as reported in the table following the Portfolio of Investments. For futures contracts, only the current day's variation margin as of August 31, 2021 is reported separately on the Statements of Assets and Liabilities.
The effect of derivative instruments on the Statements of Operations for the six months ended August 31, 2021 was as follows:
| Dynamic Target 2020 Fund | Amount of realized
gains (losses) on
derivatives | Change in unrealized
gains (losses) on
derivatives |
| Equity risk | $ 1,642 | $ 14,265 |
| Foreign currency risk | 11,183 | 5,292 |
| | $12,825 | $19,557 |
The fair value of derivative instruments as of August 31, 2021 by primary risk type was as follows for the Dynamic Target 2025 Fund:
| | Asset derivatives | | Liability derivatives |
| Dynamic Target 2025 Fund | Statements of Assets and
Liabilities location | Fair value | | Statements of Assets and
Liabilities location | Fair value |
| Equity risk | Unrealized gains on futures contracts | $ 28,380* | | Unrealized losses on futures contracts | $ 7,545* |
| Foreign currency risk | Unrealized gains on futures contracts | 9,661* | | Unrealized losses on futures contracts | 0* |
| | | $38,041 | | | $7,545 |
* Amount represents the cumulative unrealized gains (losses) as reported in the table following the Portfolio of Investments. For futures contracts, only the current day's variation margin as of August 31, 2021 is reported separately on the Statements of Assets and Liabilities.
The effect of derivative instruments on the Statements of Operations for the six months ended August 31, 2021 was as follows:
| Dynamic Target 2025 Fund | Amount of realized
gains (losses) on
derivatives | Change in unrealized
gains (losses) on
derivatives |
| Equity risk | $ 21,688 | $ 25,782 |
| Foreign currency risk | 18,665 | 9,661 |
| | $40,353 | $35,443 |
132 | Target Date Retirement Funds
Notes to financial statements (unaudited)
The fair value of derivative instruments as of August 31, 2021 by primary risk type was as follows for the Dynamic Target 2030 Fund:
| | Asset derivatives | | Liability derivatives |
| Dynamic Target 2030 Fund | Statements of Assets and
Liabilities location | Fair value | | Statements of Assets and
Liabilities location | Fair value |
| Equity risk | Unrealized gains on futures contracts | $ 14,190* | | Unrealized losses on futures contracts | $ 7,545* |
| Foreign currency risk | Unrealized gains on futures contracts | 9,661* | | Unrealized losses on futures contracts | 0* |
| | | $23,851 | | | $7,545 |
* Amount represents the cumulative unrealized gains (losses) as reported in the table following the Portfolio of Investments. For futures contracts, only the current day's variation margin as of August 31, 2021 is reported separately on the Statements of Assets and Liabilities.
The effect of derivative instruments on the Statements of Operations for the six months ended August 31, 2021 was as follows:
| Dynamic Target 2030 Fund | Amount of realized
gains (losses) on
derivatives | Change in unrealized
gains (losses) on
derivatives |
| Equity risk | $ 7,638 | $ 11,592 |
| Foreign currency risk | 18,665 | 9,661 |
| | $26,303 | $21,253 |
The fair value of derivative instruments as of August 31, 2021 by primary risk type was as follows for the Dynamic Target 2035 Fund:
| | Asset derivatives | | Liability derivatives |
| Dynamic Target 2035 Fund | Statements of Assets and
Liabilities location | Fair value | | Statements of Assets and
Liabilities location | Fair value |
| Equity risk | Unrealized gains on futures contracts | $ 14,190* | | Unrealized losses on futures contracts | $ 7,545* |
| Foreign currency risk | Unrealized gains on futures contracts | 7,477* | | Unrealized losses on futures contracts | 0* |
| | | $21,667 | | | $7,545 |
* Amount represents the cumulative unrealized gains (losses) as reported in the table following the Portfolio of Investments. For futures contracts, only the current day's variation margin as of August 31, 2021 is reported separately on the Statements of Assets and Liabilities.
The effect of derivative instruments on the Statements of Operations for the six months ended August 31, 2021 was as follows:
| Dynamic Target 2035 Fund | Amount of realized
gains (losses) on
derivatives | Change in unrealized
gains (losses) on
derivatives |
| Equity risk | $ 5,383 | $ 10,644 |
| Foreign currency risk | 18,666 | 7,477 |
| | $24,049 | $18,121 |
Target Date Retirement Funds | 133
Notes to financial statements (unaudited)
The fair value of derivative instruments as of August 31, 2021 by primary risk type was as follows for the Dynamic Target 2040 Fund:
| | Asset derivatives | | Liability derivatives |
| Dynamic Target 2040 Fund | Statements of Assets and
Liabilities location | Fair value | | Statements of Assets and
Liabilities location | Fair value |
| Equity risk | Unrealized gains on futures contracts | $ 14,190* | | Unrealized losses on futures contracts | $ 7,545* |
| Foreign currency risk | Unrealized gains on futures contracts | 7,477* | | Unrealized losses on futures contracts | 0* |
| | | $21,667 | | | $7,545 |
* Amount represents the cumulative unrealized gains (losses) as reported in the table following the Portfolio of Investments. For futures contracts, only the current day's variation margin as of August 31, 2021 is reported separately on the Statements of Assets and Liabilities.
The effect of derivative instruments on the Statements of Operations for the six months ended August 31, 2021 was as follows:
| Dynamic Target 2040 Fund | Amount of realized
gains (losses) on
derivatives | Change in unrealized
gains (losses) on
derivatives |
| Equity risk | $ (138) | $ 14,896 |
| Foreign currency risk | 15,144 | 7,477 |
| | $15,006 | $22,373 |
The fair value of derivative instruments as of August 31, 2021 by primary risk type was as follows for the Dynamic Target 2045 Fund:
| | Asset derivatives | | Liability derivatives |
| Dynamic Target 2045 Fund | Statements of Assets and
Liabilities location | Fair value | | Statements of Assets and
Liabilities location | Fair value |
| Equity risk | Unrealized gains on futures contracts | $ 14,190* | | Unrealized losses on futures contracts | $ 3,772* |
| Foreign currency risk | Unrealized gains on futures contracts | 5,292* | | Unrealized losses on futures contracts | 0* |
| | | $19,482 | | | $3,772 |
* Amount represents the cumulative unrealized gains (losses) as reported in the table following the Portfolio of Investments. For futures contracts, only the current day's variation margin as of August 31, 2021 is reported separately on the Statements of Assets and Liabilities.
The effect of derivative instruments on the Statements of Operations for the six months ended August 31, 2021 was as follows:
| Dynamic Target 2045 Fund | Amount of realized
gains (losses) on
derivatives | Change in unrealized
gains (losses) on
derivatives |
| Equity risk | $ (1,109) | $ 17,422 |
| Foreign currency risk | 11,094 | 5,292 |
| | $ 9,985 | $22,714 |
134 | Target Date Retirement Funds
Notes to financial statements (unaudited)
The fair value of derivative instruments as of August 31, 2021 by primary risk type was as follows for the Dynamic Target 2050 Fund:
| | Asset derivatives | | Liability derivatives |
| Dynamic Target 2050 Fund | Statements of Assets and
Liabilities location | Fair value | | Statements of Assets and
Liabilities location | Fair value |
| Equity risk | Unrealized gains on futures contracts | $ 14,190* | | Unrealized losses on futures contracts | $ 3,772* |
| Foreign currency risk | Unrealized gains on futures contracts | 5,292* | | Unrealized losses on futures contracts | 0* |
| | | $19,482 | | | $3,772 |
* Amount represents the cumulative unrealized gains (losses) as reported in the table following the Portfolio of Investments. For futures contracts, only the current day's variation margin as of August 31, 2021 is reported separately on the Statements of Assets and Liabilities.
The effect of derivative instruments on the Statements of Operations for the six months ended August 31, 2021 was as follows:
| Dynamic Target 2050 Fund | Amount of realized
gains (losses) on
derivatives | Change in unrealized
gains (losses) on
derivatives |
| Equity risk | $ 1,872 | $ 16,754 |
| Foreign currency risk | 11,094 | 5,292 |
| | $12,966 | $22,046 |
The fair value of derivative instruments as of August 31, 2021 by primary risk type was as follows for the Dynamic Target 2055 Fund:
| | Asset derivatives | | Liability derivatives |
| Dynamic Target 2055 Fund | Statements of Assets and
Liabilities location | Fair value | | Statements of Assets and
Liabilities location | Fair value |
| Equity risk | Unrealized gains on futures contracts | $ 14,190* | | Unrealized losses on futures contracts | $ 3,772* |
| Foreign currency risk | Unrealized gains on futures contracts | 5,292* | | Unrealized losses on futures contracts | 0* |
| | | $19,482 | | | $3,772 |
* Amount represents the cumulative unrealized gains (losses) as reported in the table following the Portfolio of Investments. For futures contracts, only the current day's variation margin as of August 31, 2021 is reported separately on the Statements of Assets and Liabilities.
The effect of derivative instruments on the Statements of Operations for the six months ended August 31, 2021 was as follows:
| Dynamic Target 2055 Fund | Amount of realized
gains (losses) on
derivatives | Change in unrealized
gains (losses) on
derivatives |
| Equity risk | $ (4,372) | $ 17,042 |
| Foreign currency risk | 11,093 | 5,292 |
| | $ 6,721 | $22,334 |
Target Date Retirement Funds | 135
Notes to financial statements (unaudited)
The fair value of derivative instruments as of August 31, 2021 by primary risk type was as follows for the Dynamic Target 2060 Fund:
| | Asset derivatives | | Liability derivatives |
| Dynamic Target 2060 Fund | Statements of Assets and
Liabilities location | Fair value | | Statements of Assets and
Liabilities location | Fair value |
| Equity risk | Unrealized gains on futures contracts | $ 14,190* | | Unrealized losses on futures contracts | $ 3,772* |
| Foreign currency risk | Unrealized gains on futures contracts | 5,292* | | Unrealized losses on futures contracts | 0* |
| | | $19,482 | | | $3,772 |
* Amount represents the cumulative unrealized gains (losses) as reported in the table following the Portfolio of Investments. For futures contracts, only the current day's variation margin as of August 31, 2021 is reported separately on the Statements of Assets and Liabilities.
The effect of derivative instruments on the Statements of Operations for the six months ended August 31, 2021 was as follows:
| Dynamic Target 2060 Fund | Amount of realized
gains (losses) on
derivatives | Change in unrealized
gains (losses) on
derivatives |
| Equity risk | $ 1,358 | $ 13,627 |
| Foreign currency risk | 11,533 | 5,292 |
| | $12,891 | $18,919 |
7. BANK BORROWINGS
The Trust (excluding the money market funds), Wells Fargo Master Trust and Wells Fargo Variable Trust are parties to a $350,000,000 revolving credit agreement whereby each Fund is permitted to use bank borrowings for temporary or emergency purposes, such as to fund shareholder redemption requests. Interest under the credit agreement is charged to each Fund based on a borrowing rate equal to the higher of the Federal Funds rate in effect on that day plus 1.25% or the overnight bank funding rate in effect on that day plus 1.25%. In addition, an annual commitment fee equal to 0.25% of the unused balance is allocated to each participating fund.
For the six months ended August 31, 2021, there were no borrowings by each Fund under the agreement.
8. CONCENTRATION RISK
As of August 31, 2021, the Funds were primarily owned by Funds Management. Investment by and/or voting activities of Funds Management with respect to its holdings in each Fund could have a material impact on the Fund. At August 31, 2021, Funds Management’s ownership of each Fund was as follows:
136 | Target Date Retirement Funds
Notes to financial statements (unaudited)
| | % of ownership |
| Dynamic Target Today Fund | 82.60% |
| Dynamic Target 2015 Fund | 91.59 |
| Dynamic Target 2020 Fund | 77.42 |
| Dynamic Target 2025 Fund | 48.26 |
| Dynamic Target 2030 Fund | 48.93 |
| Dynamic Target 2035 Fund | 55.33 |
| Dynamic Target 2040 Fund | 62.42 |
| Dynamic Target 2045 Fund | 79.02 |
| Dynamic Target 2050 Fund | 87.58 |
| Dynamic Target 2055 Fund | 84.56 |
| Dynamic Target 2060 Fund | 93.69 |
9. INDEMNIFICATION
Under each Fund's organizational documents, the officers and Trustees have been granted certain indemnification rights against certain liabilities that may arise out of performance of their duties to each Fund. Each Fund has entered into a separate agreement with each Trustee that converts indemnification rights currently existing under each Fund’s organizational documents into contractual rights that cannot be changed in the future without the consent of the Trustee. Additionally, in the normal course of business, each Fund may enter into contracts with service providers that contain a variety of indemnification clauses. Each Fund’s maximum exposure under these arrangements is dependent on future claims that may be made against each Fund and, therefore, cannot be estimated.
10. CORONAVIRUS (COVID-19) PANDEMIC
On March 11, 2020, the World Health Organization announced that it had made the assessment that coronavirus disease 2019 (“COVID-19”) is a pandemic. The impacts of COVID-19 are affecting the entire global economy, individual companies and investment products, the funds, and the market in general. There is significant uncertainty around the extent and duration of business disruptions related to COVID-19 and the impacts may last for an extended period of time. COVID-19 has led to significant uncertainty and volatility in the financial markets.
11. SUBSEQUENT EVENTS
Wells Fargo Asset Management ("WFAM") announced that it will be changing its company name to Allspring Global Investments upon the closing of the previously announced sale transaction of WFAM by Wells Fargo & Company to GTCR LLC and Reverence Capital Partners, L.P. The new corporate name is expected to go into effect on the closing date of the transaction, which is anticipated to occur in the second half of 2021, subject to customary closing conditions.
The Board of Trustees of the Wells Fargo Funds approved a change in the Funds' names to remove “Wells Fargo” from the Funds' names and replace with “Allspring” on December 6, 2021.
Following the closing of the transaction, Wells Fargo Funds Management, LLC, the Funds' investment manager, Wells Capital Management, LLC and Wells Fargo Asset Management (International) Limited, each subadvisers to certain funds, and Wells Fargo Funds Distributor, LLC, the Funds' principal underwriter, will each be rebranded as Allspring.
Target Date Retirement Funds | 137
Other information (unaudited)
PROXY VOTING INFORMATION
A description of the policies and procedures used to determine how to vote proxies relating to portfolio securities is available without charge, upon request, by calling 1-800-222-8222, visiting our website at wfam.com, or visiting the SEC website at sec.gov. Information regarding how the proxies related to portfolio securities were voted during the most recent 12-month period ended June 30 is available on the website at wfam.com or by visiting the SEC website at sec.gov.
SPECIAL MEETING OF SHAREHOLDERS
On August 16, 2021, a Special Meeting of Shareholders for each Fund was held to consider the following proposals. The results of the proposals are indicated below.
Proposal 1 – To consider and approve a new investment management agreement with Wells Fargo Funds Management, LLC.
| | Shares voted
“For” | | Shares voted
“Against” | | Shares voted
“Abstain” |
| Dynamic Target Today Fund | 517,929 | | 0 | | 0 |
| Dynamic Target 2015 Fund | 513,938 | | 0 | | 0 |
| Dynamic Target 2020 Fund | 546,229 | | 0 | | 0 |
| Dynamic Target 2025 Fund | 623,857 | | 0 | | 4,052 |
| Dynamic Target 2030 Fund | 612,936 | | 1,493 | | 77 |
| Dynamic Target 2035 Fund | 529,808 | | 0 | | 0 |
| Dynamic Target 2040 Fund | 518,391 | | 0 | | 582 |
| Dynamic Target 2045 Fund | 515,036 | | 0 | | 0 |
| Dynamic Target 2050 Fund | 518,699 | | 0 | | 0 |
| Dynamic Target 2055 Fund | 516,117 | | 0 | | 0 |
| Dynamic Target 2060 Fund | 513,268 | | 0 | | 0 |
Proposal 2 – To consider and approve a new investment sub-advisory agreement with Wells Capital Management, LLC.
| | Shares voted
“For” | | Shares voted
“Against” | | Shares voted
“Abstain” |
| Dynamic Target Today Fund | 517,929 | | 0 | | 0 |
| Dynamic Target 2015 Fund | 513,938 | | 0 | | 0 |
| Dynamic Target 2020 Fund | 546,229 | | 0 | | 0 |
| Dynamic Target 2025 Fund | 623,857 | | 0 | | 4,052 |
| Dynamic Target 2030 Fund | 612,936 | | 1,493 | | 77 |
| Dynamic Target 2035 Fund | 529,808 | | 0 | | 0 |
| Dynamic Target 2040 Fund | 518,391 | | 0 | | 582 |
| Dynamic Target 2045 Fund | 515,036 | | 0 | | 0 |
| Dynamic Target 2050 Fund | 518,699 | | 0 | | 0 |
| Dynamic Target 2055 Fund | 516,117 | | 0 | | 0 |
| Dynamic Target 2060 Fund | 513,268 | | 0 | | 0 |
QUARTERLY PORTFOLIO HOLDINGS INFORMATION
Each Fund files its complete schedule of portfolio holdings with the SEC for the first and third quarters of each fiscal year as an exhibit to its reports on Form N-PORT. Shareholders may view the filed Form N-PORT by visiting the SEC website at sec.gov.
138 | Target Date Retirement Funds
Other information (unaudited)
BOARD OF TRUSTEES AND OFFICERS
Each of the Trustees and Officers listed in the table below acts in identical capacities for each fund in the Wells Fargo family of funds, which consists of 139 mutual funds comprising the Wells Fargo Funds Trust, Wells Fargo Variable Trust, Wells Fargo Master Trust and four closed-end funds (collectively the “Fund Complex”). This table should be read in conjunction with the Prospectus and the Statement of Additional Information1. The mailing address of each Trustee and Officer is 525 Market Street, 12th Floor, San Francisco, CA 94105. Each Trustee and Officer serves an indefinite term, however, each Trustee serves such term until reaching the mandatory retirement age established by the Trustees.
Independent Trustees
Name and
year of birth | Position held and
length of service* | Principal occupations during past five years or longer | Current other
public company or
investment
company
directorships |
William R. Ebsworth
(Born 1957) | Trustee,
since 2015 | Retired. From 1984 to 2013, equities analyst, portfolio manager, research director and chief investment officer at Fidelity Management and Research Company in Boston, Tokyo, and Hong Kong, and retired in 2013 as Chief Investment Officer of Fidelity Strategic Advisers, Inc. where he led a team of investment professionals managing client assets. Prior thereto, Board member of Hong Kong Securities Clearing Co., Hong Kong Options Clearing Corp., the Thailand International Fund, Ltd., Fidelity Investments Life Insurance Company, and Empire Fidelity Investments Life Insurance Company. Audit Committee Chair and Investment Committee Chair of the Vincent Memorial Hospital Endowment (non-profit organization). Mr. Ebsworth is a CFA® charterholder. | N/A |
Jane A. Freeman
(Born 1953) | Trustee,
since 2015;
Chair Liaison,
since 2018 | Retired. From 2012 to 2014 and 1999 to 2008, Chief Financial Officer of Scientific Learning Corporation. From 2008 to 2012, Ms. Freeman provided consulting services related to strategic business projects. Prior to 1999, Portfolio Manager at Rockefeller & Co. and Scudder, Stevens & Clark. Board member of the Harding Loevner Funds from 1996 to 2014, serving as both Lead Independent Director and chair of the Audit Committee. Board member of the Russell Exchange Traded Funds Trust from 2011 to 2012 and the chair of the Audit Committee. Ms. Freeman is also an inactive Chartered Financial Analyst. | N/A |
Isaiah Harris, Jr.
(Born 1952) | Trustee,
since 2009; Audit
Committee
Chair,
since 2019 | Retired. Chairman of the Board of CIGNA Corporation since 2009, and Director since 2005. From 2003 to 2011, Director of Deluxe Corporation. Prior thereto, President and CEO of BellSouth Advertising and Publishing Corp. from 2005 to 2007, President and CEO of BellSouth Enterprises from 2004 to 2005 and President of BellSouth Consumer Services from 2000 to 2003. Emeritus member of the Iowa State University Foundation Board of Governors. Emeritus Member of the Advisory Board of Iowa State University School of Business. Advisory Board Member, Palm Harbor Academy (private school). Mr. Harris is a certified public accountant (inactive status). | CIGNA Corporation |
Judith M. Johnson
(Born 1949) | Trustee,
since 2008 | Retired. Prior thereto, Chief Executive Officer and Chief Investment Officer of Minneapolis Employees Retirement Fund from 1996 to 2008. Ms. Johnson is an attorney, certified public accountant and a certified managerial accountant. | N/A |
David F. Larcker
(Born 1950) | Trustee,
since 2009 | James Irvin Miller Professor of Accounting at the Graduate School of Business (Emeritus), Stanford University, Director of the Corporate Governance Research Initiative and Senior Faculty of The Rock Center for Corporate Governance since 2006. From 2005 to 2008, Professor of Accounting at the Graduate School of Business, Stanford University. Prior thereto, Ernst & Young Professor of Accounting at The Wharton School, University of Pennsylvania from 1985 to 2005. | N/A |
Target Date Retirement Funds | 139
Other information (unaudited)
Name and
year of birth | Position held and
length of service* | Principal occupations during past five years or longer | Current other
public company or
investment
company
directorships |
Olivia S. Mitchell
(Born 1953) | Trustee,
since 2006;
Nominating and
Governance
Committee Chair,
since 2018 | International Foundation of Employee Benefit Plans Professor, Wharton School of the University of Pennsylvania since 1993. Director of Wharton’s Pension Research Council and Boettner Center on Pensions & Retirement Research, and Research Associate at the National Bureau of Economic Research. Previously, Cornell University Professor from 1978 to 1993. | N/A |
Timothy J. Penny
(Born 1951) | Trustee,
since 1996;
Chair,
since 2018 | President and Chief Executive Officer of Southern Minnesota Initiative Foundation, a non-profit organization, since 2007. Member of the Board of Trustees of NorthStar Education Finance, Inc., a non-profit organization, since 2007. | N/A |
James G. Polisson
(Born 1959) | Trustee,
since 2018 | Retired. Chief Marketing Officer, Source (ETF) UK Services, Ltd, from 2015 to 2017. From 2012 to 2015, Principal of The Polisson Group, LLC, a management consulting, corporate advisory and principal investing company. Chief Executive Officer and Managing Director at Russell Investments, Global Exchange Traded Funds from 2010 to 2012. Managing Director of Barclays Global Investors from 1998 to 2010 and Global Chief Marketing Officer for iShares and Barclays Global Investors from 2000 to 2010. Trustee of the San Francisco Mechanics’ Institute, a non-profit organization, from 2013 to 2015. Board member of the Russell Exchange Traded Fund Trust from 2011 to 2012. Director of Barclays Global Investors Holdings Deutschland GmbH from 2006 to 2009. Mr. Polisson is an attorney and has a retired status with the Massachusetts and District of Columbia Bar Associations. | N/A |
Pamela Wheelock
(Born 1959) | Trustee,
since January
2020; previously
Trustee from
January 2018 to
July 2019 | Board member of the Destination Medical Center Economic Development Agency, Rochester, Minnesota since 2019. Interim President of the McKnight Foundation from January to September 2020. Acting Commissioner, Minnesota Department of Human Services, July 2019 through September 2019. Human Services Manager (part-time), Minnesota Department of Human Services, October 2019 through December 2019. Chief Operating Officer, Twin Cities Habitat for Humanity from 2017 to 2019. Vice President of University Services, University of Minnesota from 2012 to 2016. Prior thereto, on the Board of Directors, Governance Committee and Finance Committee for the Minnesota Philanthropy Partners (Saint Paul Foundation) from 2012 to 2018, Interim Chief Executive Officer of Blue Cross Blue Shield of Minnesota from 2011 to 2012, Chairman of the Board from 2009 to 2012 and Board Director from 2003 to 2015. Vice President, Leadership and Community Engagement, Bush Foundation, Saint Paul, Minnesota (a private foundation) from 2009 to 2011. Executive Vice President and Chief Financial Officer, Minnesota Sports and Entertainment from 2004 to 2009 and Senior Vice President from 2002 to 2004. Executive Vice President of the Minnesota Wild Foundation from 2004 to 2008. Commissioner of Finance, State of Minnesota, from 1999 to 2002. Currently Board Chair of the Minnesota Wild Foundation since 2010. | N/A |
* Length of service dates reflect the Trustee’s commencement of service with the Trust’s predecessor entities, where applicable.
140 | Target Date Retirement Funds
Other information (unaudited)
Officers
Name and
year of birth | Position held and
length of service | Principal occupations during past five years or longer |
Andrew Owen
(Born 1960) | President,
since 2017 | Executive Vice President of Wells Fargo & Company and Head of Affiliated Managers, Wells Fargo Asset Management, since 2014. In addition, Mr. Owen is currently President, Chief Executive Officer and Director of Wells Fargo Funds Management, LLC since 2017. Prior thereto, Executive Vice President responsible for marketing, investments and product development for Wells Fargo Funds Management, LLC, from 2009 to 2014. |
Jeremy DePalma
(Born 1974) | Treasurer,
since 2012
(for certain funds in
the Fund Complex);
since 2021 (for
the remaining funds in the
Fund Complex) | Senior Vice President of Wells Fargo Funds Management, LLC since 2009. Senior Vice President of Evergreen Investment Management Company, LLC from 2008 to 2010 and head of the Fund Reporting and Control Team within Fund Administration from 2005 to 2010. |
Michelle Rhee
(Born 1966) | Chief Legal Officer,
since 2019 | Secretary of Wells Fargo Funds Management, LLC and Chief Legal Counsel of Wells Fargo Asset Management since 2018. Deputy General Counsel of Wells Fargo Bank, N.A. since 2020 and Assistant General Counsel of Wells Fargo Bank, N.A. from 2018 to 2020. Associate General Counsel and Managing Director of Bank of America Corporation from 2004 to 2018. |
Matthew Prasse
(Born 1983) | Secretary,
since 2021 | Senior Counsel of the Wells Fargo Legal Department since 2018. Previously, Director and Counsel for Barings LLC from 2015 to 2018. Prior to joining Barings, Associate at Morgan, Lewis & Bockius LLP from 2008 to 2015. |
Michael H. Whitaker
(Born 1967) | Chief Compliance Officer,
since 2016 | Chief Compliance Officer of Wells Fargo Asset Management since 2016. Senior Vice President and Chief Compliance Officer for Fidelity Investments from 2007 to 2016. |
1 The Statement of Additional Information includes additional information about the Trustees and is available, without charge, upon request, by calling 1-800-222-8222 or by visiting the website at wfam.com.
Target Date Retirement Funds | 141
Board considerations (unaudited)
BOARD CONSIDERATION OF INVESTMENT MANAGEMENT AND SUB-ADVISORY AGREEMENTS:
Wells Fargo Dynamic Target Today Fund, Wells Fargo Dynamic Target 2015 Fund, Wells Fargo Dynamic Target 2020 Fund, Wells Fargo Dynamic Target 2025 Fund, Wells Fargo Dynamic Target 2030 Fund, Wells Fargo Dynamic Target 2035 Fund, Wells Fargo Dynamic Target 2040 Fund, Wells Fargo Dynamic Target 2045 Fund, Wells Fargo Dynamic Target 2050 Fund, Wells Fargo Dynamic Target 2055 Fund, and Wells Fargo Dynamic Target 2060 Fund
Board Considerations – Current Agreements
Under the Investment Company Act of 1940 (the “1940 Act”), the Board of Trustees (the “Board”) of Wells Fargo Funds Trust (the “Trust”) must determine annually whether to approve the continuation of the Trust’s investment management and sub-advisory agreements. In this regard, at a Board meeting held on May 17-19, 2021 (the “Meeting”), the Board, all the members of which have no direct or indirect interest in the investment management and sub-advisory agreements and are not “interested persons” of the Trust, as defined in the 1940 Act (the “Independent Trustees”), reviewed and approved for each of the funds of the Trust identified above (each, a “Fund” and collectively, the “Funds”): (i) an investment management agreement (the “Management Agreement”) with Wells Fargo Funds Management, LLC (“Funds Management”); and (ii) an investment sub-advisory agreement (the “Sub-Advisory Agreement”) with Wells Capital Management Incorporated (the “Sub-Adviser”), an affiliate of Funds Management. The Management Agreement and the Sub-Advisory Agreement are collectively referred to as the “Advisory Agreements.” The Board noted that each Fund commenced operations in 2015.
The Board noted that Wells Fargo & Company recently announced that it had entered into a definitive agreement to sell Wells Fargo Asset Management (“WFAM”), which includes Funds Management and the Sub-Adviser, to GTCR LLC and Reverence Capital Partners, L.P. and/or their affiliates (the “Transaction”). The Board further noted that the Transaction would result in a change-of-control of Funds Management and the Sub-Adviser, which would be considered to be an assignment that would result in the termination of the Advisory Agreements. In light of the Transaction, the Board separately considered for approval a new investment management agreement with Funds Management and a new sub-advisory agreement with the Sub-Adviser (the “New Agreements”) that would replace the Advisory Agreements upon consummation of the Transaction, subject to approval of the New Agreements by the Funds’ shareholders. The Board also considered for approval interim agreements to go into effect in the event shareholders do not approve the New Agreements before the Transaction is completed. The interim agreements would allow the Manager and the Sub-Adviser to continue providing services to the Funds while the Funds continues to seek shareholder approval of the New Agreements. The Board noted that the terms of the interim agreements would be identical to those of the current Advisory Agreements, except for the term and certain escrow provisions.
At the Meeting, the Board considered the factors and reached the conclusions described below relating to the selection of Funds Management and the Sub-Adviser and the approval of the Advisory Agreements. Prior to the Meeting, including at Board meetings held in April and May 2021, the Trustees conferred extensively among themselves and with representatives of Funds Management about these matters. Also, the Board has adopted a team-based approach, with each team consisting of a sub-set of Trustees, to assist the full Board in the discharge of its duties in reviewing investment performance and other matters throughout the year. The Independent Trustees were assisted in their evaluation of the Advisory Agreements by independent legal counsel, from whom they received separate legal advice and with whom they met separately.
In providing information to the Board, Funds Management and the Sub-Adviser were guided by a detailed set of requests for information submitted to them by independent legal counsel on behalf of the Independent Trustees at the start of the Board’s annual contract renewal process earlier in 2021. In considering and approving the Advisory Agreements, the Trustees considered the information they believed relevant, including but not limited to the information discussed below. The Board considered not only the specific information presented in connection with the Meeting, but also the knowledge gained over time through interaction with Funds Management and the Sub-Adviser about various topics. In this regard, the Board reviewed reports of Funds Management at each of its quarterly meetings, which included, among other things, portfolio reviews and investment performance reports. In addition, the Board and the teams mentioned above confer with portfolio managers at various times throughout the year. The Board did not identify any particular information or consideration that was all-important or controlling, and each individual Trustee may have attributed different weights to various factors.
After its deliberations, the Board unanimously determined that the compensation payable to Funds Management and the Sub-Adviser under each of the Advisory Agreements was reasonable, and approved the continuation of the Advisory Agreements for a
142 | Target Date Retirement Funds
Board considerations (unaudited)
one-year term. The Board considered the approval of the Advisory Agreements for the Funds as part of its consideration of agreements for funds across the complex, but its approvals were made on a fund-by-fund basis. The following summarizes a number of important, but not necessarily all, factors considered by the Board in support of its approvals.
Nature, extent and quality of services
The Board received and considered various information regarding the nature, extent and quality of services provided to the Funds by Funds Management and the Sub-Adviser under the Advisory Agreements. This information included a description of the investment advisory services and Fund-level administrative services covered by the Management Agreement, as well as, among other things, a summary of the background and experience of senior management of WFAM, of which Funds Management and the Sub-Adviser are a part, and a summary of investments made in the business of WFAM. The Board also received a description of Funds Management’s and the Sub-Adviser’s business continuity plans, including a summary of the performance of such plans and any changes thereto during the COVID-19 pandemic, and of their approaches to data privacy and cybersecurity. The Board also received and reviewed information about Funds Management’s role as administrator of the Funds’ liquidity risk management program, Funds Management’s approach to risk management, and Funds Management’s intermediary and vendor oversight program.
The Board also considered the qualifications, background, tenure and responsibilities of each of the portfolio managers primarily responsible for the day-to-day portfolio management of the Funds. The Board evaluated the ability of Funds Management and the Sub-Adviser to attract and retain qualified investment professionals, including research, advisory and supervisory personnel.
The Board further considered the compliance programs and compliance records of Funds Management and the Sub-Adviser. In addition, the Board took into account the full range of services provided to the Funds by Funds Management and its affiliates. The Board also considered information about retention and back-up arrangements that have been put into place with respect to key personnel of WFAM in connection with the anticipated Transaction, noting that WFAM provided assurances that the announcement and eventual culmination of the Transaction is not expected to result in any diminution in the nature or quality of services provided to the Funds.
Fund investment performance and expenses
The Board considered the investment performance results for each of the Funds over various time periods ended December 31, 2020. The Board considered these results in comparison to the investment performance of funds in a universe that was determined by Broadridge Inc. (“Broadridge”) to be similar to each respective Fund (each, a “Universe”), and in comparison to each Fund’s benchmark index and to other comparative data. Broadridge is an independent provider of investment company data. The Board received a description of the methodology used by Broadridge to select the mutual funds in the performance Universe. With respect to the investment performance of each Fund (Class R6) relative to its respective Universe, the Board noted that the investment performance of each of Wells Fargo Dynamic Target 2015 Fund, Wells Fargo Dynamic Target 2020 Fund, Wells Fargo Dynamic Target 2040 Fund, Wells Fargo Dynamic Target 2045 Fund, Wells Fargo Dynamic Target 2050 Fund, Wells Fargo Dynamic Target 2055 Fund, and Wells Fargo Dynamic Target 2060 Fund was lower than such Fund’s respective Universe for the one-year period under review. The Board noted that, for all other periods under review, the investment performance of each of the Funds was higher than or in range of the average investment performance of each Fund’s respective Universe.
With respect to the investment performance of each Fund (Class R6) relative to its respective benchmark index, the Board noted that the investment performance of the Wells Fargo Dynamic Target 2015 Fund was lower than such Fund’s respective benchmark index for the one-year period under review. The Board noted that, for all other periods under review, the investment performance of each of the Funds was higher than such Fund’s respective benchmark index.
The Board received information concerning, and discussed factors contributing to, the underperformance of the Funds for the periods identified above. The Board took note of the explanations for the underperformance relative to each such Fund’s Universe and benchmark index for the periods identified above, including with respect to investment decisions and market factors that affected each Fund’s investment performance. The Board also took note of each of Wells Fargo Dynamic Target Today Fund’s, Wells Fargo Dynamic Target 2015 Fund’s, Wells Fargo Dynamic Target 2020 Fund’s, Wells Fargo Dynamic Target 2025 Fund’s, Wells Fargo Dynamic Target 2030 Fund’s, Wells Fargo Dynamic Target 2035 Fund’s, Wells Fargo Dynamic Target 2040 Fund’s, Wells Fargo Dynamic Target 2045 Fund’s, Wells Fargo Dynamic Target 2050 Fund’s, and Wells Fargo Dynamic Target 2055 Fund’s outperformance relative to such Fund’s Universe and benchmark index over the three- and five-year periods.
The Board also received and considered information regarding each Fund’s net operating expense ratios and their various components, including actual management fees, custodian and other non-management fees, and Rule 12b-1 and non-Rule 12b-1 shareholder service fees. The Board considered these ratios for each Fund in comparison to the median ratios of funds in class-specific expense groups that were determined by Broadridge to be similar to each Fund (the “Groups”). The Board received a description of the methodology used by Broadridge to select the mutual funds in the expense Groups and an explanation of how
Target Date Retirement Funds | 143
Board considerations (unaudited)
funds comprising expense groups and their expense ratios may vary from year-to-year. Based on the Broadridge reports, the Board noted that the net operating expense ratios of each of the Funds were lower than the median net operating expense ratio of each Fund’s respective expense Group for all share classes.
The Board took into account each Fund’s investment performance and expense information provided to it among the factors considered in deciding to re-approve the Advisory Agreements.
Investment management and sub-advisory fee rates
The Board reviewed and considered the contractual fee rates payable by each Fund to Funds Management under the Management Agreement, as well as the contractual fee rates payable by each Fund to Funds Management for class-level administrative services under a Class-Level Administration Agreement, which include, among other things, class-level transfer agency and sub-transfer agency costs (collectively, the “Management Rates”). The Board also reviewed and considered the contractual investment sub-advisory fee rates that are payable by Funds Management to the Sub-Adviser for investment sub-advisory services.
Among other information reviewed by the Board was a comparison of each Fund’s Management Rates with the average contractual investment management fee rates of funds in the expense Groups at a common asset level as well as transfer agency costs of the funds in the expense Groups. The Board noted that the Management Rates of each Fund were equal to, lower than, or in range of the sum of these average rates for the expense Groups for all share classes.
The Board also received and considered information about the portion of the total management fee that was retained by Funds Management after payment of the fee to the Sub-Adviser for sub-advisory services. In assessing the reasonableness of this amount, the Board received and evaluated information about the nature and extent of responsibilities retained and risks assumed by Funds Management and not delegated to or assumed by the Sub-Adviser, and about Funds Management’s on-going oversight services. Given the affiliation between Funds Management and the Sub-Adviser, the Board ascribed limited relevance to the allocation of fees between them.
Based on its consideration of the factors and information it deemed relevant, including those described here, the Board determined that the compensation payable to Funds Management under the Management Agreement and to the Sub-Adviser under the Sub-Advisory Agreement was reasonable.
Profitability
The Board received and considered information concerning the profitability of Funds Management, as well as the profitability of both WFAM and Wells Fargo & Co. (“Wells Fargo”) from providing services to the fund family as a whole. The Board noted that the Sub-Adviser’s profitability information with respect to providing services to the Funds and other funds in the family was subsumed in the WFAM and Wells Fargo profitability analysis.
Funds Management reported on the methodologies and estimates used in calculating profitability, including a description of the methodology used to allocate certain expenses. Among other things, the Board noted that the levels of profitability reported on a fund-by-fund basis varied widely, depending on factors such as the size, type and age of fund.
Based on its review, the Board did not deem the profits reported by Funds Management, WFAM or Wells Fargo from services provided to the Funds to be at a level that would prevent it from approving the continuation of the Advisory Agreements.
Economies of scale
The Board received and considered information about the potential for Funds Management to experience economies of scale in the provision of management services to the Funds, the difficulties of calculating economies of scale at an individual fund level, and the extent to which potential scale benefits are shared with shareholders. The Board noted the existence of breakpoints in each Fund’s management fee structure, which operate generally to reduce the Fund’s expense ratios as the Fund grows in size, and the size of the Fund in relation to such breakpoints. The Board considered that in addition to management fee breakpoints, Funds Management shares potential economies of scale from its management business in a variety of ways, including through fee waiver and expense reimbursement arrangements, competitive management fee rates set at the outset without regard to breakpoints, and investments in the business intended to enhance services available to shareholders.
The Board concluded that Funds Management’s arrangements with respect to the Funds, including contractual breakpoints, constituted a reasonable approach to sharing potential economies of scale with the Funds and their shareholders.
Other benefits to Funds Management and the Sub-Adviser
The Board received and considered information regarding potential “fall-out” or ancillary benefits received by Funds Management and its affiliates, including the Sub-Adviser, as a result of their relationships with the Funds. Ancillary benefits could include, among others, benefits directly attributable to other relationships with the Funds and benefits potentially derived from an increase in
144 | Target Date Retirement Funds
Board considerations (unaudited)
Funds Management’s and the Sub-Adviser’s business as a result of their relationships with the Funds. The Board noted that various affiliates of Funds Management may receive distribution-related fees, shareholder servicing payments and sub-transfer agency fees in respect of shares sold or held through them and services provided.
The Board also reviewed information about soft dollar credits earned and utilized by the Sub-Adviser, fees earned by Funds Management and the Sub-Adviser from managing a private investment vehicle for the fund family’s securities lending collateral and commissions earned by an affiliated broker from portfolio transactions.
Based on its consideration of the factors and information it deemed relevant, including those described here, the Board did not find that any ancillary benefits received by Funds Management and its affiliates, including the Sub-Adviser, were unreasonable.
Conclusion
At the Meeting, after considering the above-described factors and based on its deliberations and its evaluation of the information described above, the Board unanimously determined that the compensation payable to Funds Management and the Sub-Adviser under each of the Advisory Agreements was reasonable, and approved the continuation of the Advisory Agreements for a one-year term.
Target Date Retirement Funds | 145
Board considerations (unaudited)
Board Considerations – New Agreements
Overview of the Board evaluation process
At a meeting held on May 17-19, 2021 (the “Board Meeting”), the Board of Trustees (the “Board”) of Wells Fargo Funds Trust (the “Trust”, and the series identified below, the “Funds”) approved the continuation of each Fund’s current Investment Management Agreement (the “Current Investment Management Agreement”) and the current Wells Cap Sub-Advisory Agreement (the “Current Wells Cap Sub-Advisory Agreement”, and collectively, the “Current Agreements”).
| Wells Fargo Dynamic Target Today Fund |
| Wells Fargo Dynamic Target 2015 Fund |
| Wells Fargo Dynamic Target 2020 Fund |
| Wells Fargo Dynamic Target 2025 Fund |
| Wells Fargo Dynamic Target 2030 Fund |
| Wells Fargo Dynamic Target 2035 Fund |
| Wells Fargo Dynamic Target 2040 Fund |
| Wells Fargo Dynamic Target 2045 Fund |
| Wells Fargo Dynamic Target 2050 Fund |
| Wells Fargo Dynamic Target 2055 Fund |
| Wells Fargo Dynamic Target 2060 Fund |
| Wells Fargo Target Today Fund |
| Wells Fargo Target 2010 Fund |
| Wells Fargo Target 2015 Fund |
| Wells Fargo Target 2020 Fund |
| Wells Fargo Target 2025 Fund |
| Wells Fargo Target 2030 Fund |
| Wells Fargo Target 2035 Fund |
| Wells Fargo Target 2040 Fund |
| Wells Fargo Target 2045 Fund |
| Wells Fargo Target 2050 Fund |
| Wells Fargo Target 2055 Fund |
| Wells Fargo Target 2060 Fund |
Each Trustee on the Board is not an “interested person” (as defined in the Investment Company Act of 1940 (the “1940 Act”)) of the Funds (collectively, the “Independent Trustees”). The process followed by the Board in considering and approving the continuation of the Current Agreements is referred to herein as the “2021 Annual Approval Process.”
As noted above, the closing of the sale of Wells Fargo Asset Management (“WFAM”) to a holding company (“NewCo”) affiliated with private funds of GTCR LLC (“GTCR”) and of Reverence Capital Partners, L.P. (“Reverence Capital”, and such transaction, the “Transaction”) will result in a change of control of Wells Fargo Funds Management LLC (“Funds Management”) and Wells Capital Management Incorporated (“Wells Capital” or the “Sub-Adviser”, and together with Funds Management, the “Advisers”), which will be considered to be an “assignment” of each Fund’s Current Agreements under the 1940 Act that will result in the automatic termination of each Fund’s Current Agreements. In light of the expected termination of each Fund’s Current Agreements upon the closing, at the Board Meeting the Board also considered and approved: (i) a new Investment Management Agreement between the Trust, on behalf of each Fund, and Funds Management (the “New Investment Management Agreement”); and (ii) a new Sub-Advisory Agreement among the Trust, on behalf of each Fund, Funds Management and Wells Capital (the “New Sub-Advisory Agreement”, and collectively, the “New Agreements”), each of which is intended to go into effect upon the closing. The process followed by the Board in reviewing and approving the New Agreements is referred to herein as the “New Agreement Approval Process.”
At a series of meetings held in April and May 2021 (collectively, “April and May 2021 Meetings”) and at the Board Meeting, the Trustees conferred extensively among themselves and with senior representatives of Funds Management, GTCR and Reverence Capital about the New Agreements and related matters. The Board reviewed and discussed information furnished by Funds Management, GTCR and Reverence Capital that the Board considered reasonably necessary to evaluate the terms of the New Agreements and the services to be provided. At these meetings, senior representatives from Funds Management, GTCR and Reverence Capital made presentations to, and responded to questions from, the Board.
In providing information to the Board in connection with the 2021 annual approval process for the Current Agreements (the “2021 Annual Approval Process”) and the New Agreement Approval Process, Funds Management, GTCR and Reverence Capital (as applicable) were guided by requests for information submitted by independent legal counsel on behalf of the Independent
146 | Target Date Retirement Funds
Board considerations (unaudited)
Trustees. In considering and approving the New Agreements, the Trustees considered the information they believed relevant, including but not limited to the information discussed herein. The Board considered not only the specific information presented in connection with the April and May 2021 Meetings as well as the Board Meeting, but also the knowledge gained over time through interaction with Funds Management and the Sub-Adviser about various topics. In this regard, the Board reviews reports of Funds Management at each of its regular Board meetings, which includes, among other things, portfolio reviews and investment performance reports. In addition, the Board confers with portfolio managers at various times throughout the year. The Board was assisted in its evaluation of the New Agreements by independent legal counsel, from whom the Independent Trustees received separate legal advice and with whom the Independent Trustees met separately. The Board did not identify any particular information or consideration that was all-important or controlling, and each individual Trustee may have attributed different weights to various factors.
Among other information considered by the Board in connection with the Transaction was:
| ■ | Information regarding the Transaction: information about the structure, financing sources and material terms and conditions of the Transaction, including the expected impact on the businesses conducted by the Advisers and by Wells Fargo Funds Distributor LLC, as the distributor of Fund shares. |
| ■ | Information regarding NewCo, GTCR and Reverence Capital: (i) information about NewCo, including information about its expected financial condition and access to capital, and senior leadership team; (ii) the experience of senior management at GTCR and Reverence Capital in acquiring portfolio companies; (iii) the plan to operationalize NewCo, including the transition of necessary infrastructure services through a transition services agreement with Wells Fargo under which Wells Fargo will continue to provide NewCo with certain services for a specified period of time after the closing; and (iv) information regarding regulatory matters, compliance, and risk management functions at NewCo, including resources to be dedicated thereto. |
| ■ | Impact of the Transaction on WFAM and Service Providers: (i) information regarding any changes to personnel and/or other resources of the Advisers as a result of the Transaction, including assurances regarding comparable and competitive compensation arrangements to attract and retain highly qualified personnel; and (ii) information about the organizational and operating structure with respect to NewCo, the Advisers and the Funds. |
| ■ | Impact of the Transaction on the Funds and their Shareholders: (i) information regarding anticipated benefits to the Funds as a result of the Transaction; (ii) a commitment that the Funds would not bear any expenses, directly or indirectly, in connection with the Transaction; (iii) confirmation that the Advisers intend to continue to manage the Funds in a manner consistent with each Fund’s current investment objectives and principal investments strategies; and (iv) a commitment that neither NewCo nor WFAM will take any steps that would impose any “unfair burden” (as that term is used in section 15(f)(1)(B) of the 1940 Act) on the Funds as a result of the Transaction. |
With respect to the New Agreements, the Board considered: (i) a representation that, after the closing, all of the Funds will continue to be managed and advised by their current Advisers, and that the same portfolio managers of the Sub-Adviser are expected to continue to manage the Funds after the Transaction; (ii) information regarding the terms of the New Agreements, including changes as compared to the Current Agreements; (iii) information confirming that the fee rates payable under the New Agreements will not increase as a result of the Transaction as compared to the rates under the Current Agreements; and (iv) assurances that the Transaction is not expected to cause any diminution with respect to the nature, extent and quality of any of the services currently provided to the Funds by the Advisers as a result of the Transaction.
In addition to considering information furnished specifically to evaluate the impact of the Transaction on the Funds and their respective shareholders in connection with the New Agreement Approval Process, the Board considered information furnished at prior meetings of the Board and its committees, including detailed information provided in connection with the 2021 Annual Approval Process. In this regard, in connection with the 2021 Annual Approval Process, the Board received information about complex-wide and individual Fund performance, fees and expenses, including: (i) a report from an independent data provider comparing the investment performance of each Fund to the investment performance of comparable funds and benchmark indices, over various time periods; (ii) a report from an independent data provider comparing each Fund’s total expense ratio (and its components) to those of comparable funds; (iii) comparative information concerning the fees charged and services provided by the Advisers to each Fund in managing other accounts (which may include other mutual funds, collective investment funds and institutional accounts), if any, that employ investment strategies and techniques similar to those used in managing such Fund(s); and (iv) profitability analyses of Funds Management, as well as the profitability of both WFAM and Wells Fargo from providing services to the fund family as a whole.
After its deliberations, the Board unanimously determined that the compensation payable to Funds Management and the Sub-Adviser under the New Agreements is reasonable, approved the New Agreements for a two-year term, and voted to recommend that Fund shareholders approve the New Agreements. The Board considered the approval of the New Agreements as part of its
Target Date Retirement Funds | 147
Board considerations (unaudited)
consideration of agreements for funds across the complex, but its approvals were made on a fund-by-fund basis. The following summarizes a number of important, but not necessarily all, factors considered by the Board in support of its approvals.
Nature, extent and quality of services
In connection with the 2021 Annual Approval Process, the Board received and considered various information regarding the nature, extent and quality of services provided to each Fund by Funds Management and the Sub-Adviser under the Current Agreements. This information included a description of the investment advisory services and Fund-level administrative services covered by the Current Management Agreement, as well as, among other things, a summary of the background and experience of senior management of WFAM, of which Funds Management and the Sub-Adviser are a part, and a summary of investments made in the business of WFAM. The Board also received a description of Funds Management’s and the Sub-Adviser’s business continuity plans, including a summary of the performance of such plans and any changes thereto during the COVID-19 pandemic, and of their approaches to data privacy and cybersecurity. The Board also received and reviewed information about Funds Management’s role as administrator of the Funds’ liquidity risk management program, Funds Management’s approach to risk management, and Funds Management’s intermediary and vendor oversight program.
In connection with the 2021 Annual Approval Process, the Board also considered the qualifications, background, tenure and responsibilities of each of the portfolio managers primarily responsible for the day-to-day portfolio management of the Funds. The Board evaluated the ability of Funds Management and the Sub-Adviser to attract and retain qualified investment professionals, including research, advisory and supervisory personnel.
In connection with the 2021 Annual Approval Process, the Board further considered the compliance programs and compliance records of Funds Management and the Sub-Adviser. In addition, the Board took into account the full range of services provided to the Funds by Funds Management and its affiliates.
In connection with the New Agreement Approval Process, the Board considered, among other information, the structure of the Transaction and expected impact, if any, of the Transaction on the operations, facilities, organization and personnel of the Advisers. The Board received assurances from the Advisers that each Fund will continue to be advised by its current Advisers after the closing, and that the same individual portfolio managers are expected to continue to manage the Funds after the closing. With respect to the recruitment and retention of key personnel, the Board noted information from GTCR, Reverence Capital and the Advisers regarding the potential benefits for employees of joining NewCo. The Board recognized that the personnel who had been extended offers may not accept such offers, and personnel changes may occur in the future in the ordinary course.
In addition, the Board considered information regarding the infrastructure, operational capabilities and support staff in place to assist in the portfolio management and operations of the Funds, including the provision of administrative services, and the anticipated impact of the Transaction on such matters. The Board also considered the business-related and other risks to which the Advisers may be subject in managing the Funds and in connection with the Transaction. The Board also considered the transition and integration plans as a result of the change in ownership of the Advisers from Wells Fargo to NewCo. The Board considered the resources and infrastructure that NewCo intends to devote to its compliance program to ensure compliance with applicable laws and regulations, as well as its risk management program and cybersecurity program. The Board also took into account assurances received from the Advisers, GTCR and Reverence Capital that the Transaction is not expected to cause any diminution in the nature, extent and quality of services provided by the Advisers to the Funds and their shareholders.
Fund investment performance and expenses
In connection with the 2021 Annual Approval Process, the Board considered the investment performance results for each Fund over various time periods ended December 31, 2020. The Board considered these results in comparison to the investment performance of funds in a universe that was determined by Broadridge Inc. (“Broadridge”) to be similar to each Fund (the “Universe”), and in comparison to each Fund’s benchmark index and to other comparative data. Broadridge is an independent provider of investment company data. The Board received a description of the methodology used by Broadridge to select the mutual funds in the performance Universe. Where applicable, the Board received information concerning, and discussed factors contributing to, underperformance of Funds relative to the Universe and benchmark for any underperformance periods.
In connection with the 2021 Annual Approval Process, the Board also received and considered information regarding each Fund’s net operating expense ratios and their various components, including actual management fees, custodian and other non-management fees, and Rule 12b-1 and non-Rule 12b-1 shareholder service fees. The Board considered these ratios in comparison to the median ratios of funds in class-specific expense groups that were determined by Broadridge to be similar to the Fund (the “Groups”). The Board received a description of the methodology used by Broadridge to select the mutual funds in the expense Groups and an explanation of how funds comprising expense groups and their expense ratios may vary from year-to-year.
148 | Target Date Retirement Funds
Board considerations (unaudited)
In connection with the New Agreement Approval Process, the Board received a commitment that WFAM will maintain fee and expense commitments for at least two years after the closing. The Board took into account each Fund’s investment performance and expense information among the factors considered in deciding to approve the New Agreements.
Investment management and sub-advisory fee rates
In connection with the 2021 Annual Approval Process, the Board reviewed and considered the contractual fee rates payable by each Fund to Funds Management under the Current Management Agreement, as well as the contractual fee rates payable by each Fund to Funds Management for class-level administrative services under a Class-Level Administration Agreement, which include, among other things, class-level transfer agency and sub-transfer agency costs (collectively, the “Management Rates”). The Board also reviewed and considered the contractual investment sub-advisory fee rates that are payable by Funds Management to the Sub-Adviser under the Current Sub-Advisory Agreements for investment sub-advisory services (the “Sub-Advisory Fee Rates”).
Among other information reviewed by the Board in connection with the 2021 Annual Approval Process, was a comparison of each Fund’s Management Rates with the average contractual investment management fee rates of funds in the expense Groups at a common asset level as well as transfer agency costs of the funds in the expense Groups.
In connection with the 2021 Annual Approval Process, the Board also received and considered information about the portion of the total management fee that was retained by Funds Management after payment of the Sub-Advisory Fee Rates. In assessing the reasonableness of this amount, the Board received and evaluated information about the nature and extent of responsibilities retained and risks assumed by Funds Management and not delegated to or assumed by the Sub-Adviser, and about Funds Management’s on-going oversight services. Given the affiliation between Funds Management and the Sub-Adviser, the Board ascribed limited relevance to the allocation of fees between them.
In connection with the 2021 Annual Approval Process, the Board also received and considered information about the nature and extent of services offered and fee rates charged by Funds Management and the Sub-Adviser to other types of clients, if any, with investment strategies similar to those of each Fund. In this regard, the Board received information about the significantly greater scope of services, and compliance, reporting and other legal burdens and risks of managing proprietary mutual funds compared with those associated with managing assets of other types of clients, including third-party sub-advised fund clients and non-mutual fund clients such as institutional separate accounts.
In connection with the New Agreement Approval Process, the Board noted the assurances received by it that there would be no increases to any of the Management Rates or the Sub-Advisory Fee Rates as a result of the Transaction. The Board also considered that the New Agreements do not change the computation method for calculating such fees, and there is no present intention to reduce expense waiver and reimbursement arrangements that are currently in effect. Based on its consideration of the factors and information it deemed relevant, including those described here, the Board determined that the compensation payable to Funds Management under the New Management Agreement and to the Sub-Adviser under the New Sub-Advisory Agreement was reasonable.
Profitability
In connection with the 2021 Annual Approval Process, the Board received and considered information concerning the profitability of Funds Management, as well as the profitability of both WFAM and Wells Fargo from providing services to the fund family as a whole. The Board noted that the Sub-Adviser’s profitability information with respect to providing services to each Fund and other funds in the family was subsumed in the WFAM and Wells Fargo profitability analysis.
Funds Management reported on the methodologies and estimates used in calculating profitability in connection with the 2021 Annual Approval Process, including a description of the methodology used to allocate certain expenses. Among other things, the Board noted that the levels of profitability reported on a fund-by-fund basis varied widely, depending on factors such as the size, type and age of fund.
In connection with the New Agreement Approval Process, the Board received certain information about NewCo’s projected financial condition, and reviewed with senior representatives of Funds Management, GTCR and Reverence Capital the underlying assumptions on which such information was based. The Board considered that NewCo is a newly formed entity, with no historical operations, revenues or expenses, and that it is difficult to predict with any degree of certainty the future profitability of NewCo and the Advisers from advisory activities under the New Agreements. The Board considered that the fee rates payable under the New Agreements will not increase as a result of the Transaction as compared to the rates under the Current Agreements, and that the current contractual expense limitations applicable to each Fund will not increase. The Board noted that if the New Agreements are approved by shareholders and the Transaction closes, the Board will have the opportunity in the future to review the profitability of NewCo and the Advisers from advisory activities under the New Agreements.
Target Date Retirement Funds | 149
Board considerations (unaudited)
Economies of scale
In connection with the 2021 Annual Approval Process, the Board received and considered information about the potential for Funds Management to experience economies of scale in the provision of management services to the Funds, the difficulties of calculating economies of scale at an individual fund level, and the extent to which potential scale benefits are shared with Fund shareholders. The Board noted the existence of breakpoints in each Fund’s management fee structure, which operate generally to reduce the Fund’s expense ratios as the Fund grows in size, and the size of the Fund in relation to such breakpoints. The Board considered that, in addition to management fee breakpoints, Funds Management shares potential economies of scale from its management business in a variety of ways, including through fee waiver and expense reimbursement arrangements, competitive management fee rates set at the outset without regard to breakpoints, and investments in the business intended to enhance services available to shareholders.
In connection with the New Agreement Approval Process, the Board noted that NewCo and the Advisers may benefit from possible growth of the Funds resulting from enhanced distribution capabilities. However, the Board noted that other factors could also affect the potential for economies of scale, and that it was not possible to quantify any potential future economies of scale. Based upon the information furnished to the Board in connection with the 2021 Annual Approval Process and the New Agreement Approval Process, the Board concluded that Funds Management’s arrangements with respect to each Fund, including contractual breakpoints and expense limitation arrangements, constitute a reasonable approach to sharing potential economies of scale with the Fund and its shareholders.
“Fall-out” benefits to Funds Management and the Sub-Adviser
In connection with the 2021 Annual Approval Process, the Board received and considered information regarding potential “fall-out” or ancillary benefits received by Funds Management and its affiliates, including the Sub-Adviser, as a result of their relationships with the Funds. Ancillary benefits could include, among others, benefits directly attributable to other relationships with the Funds and benefits potentially derived from an increase in Funds Management’s and the Sub-Adviser’s business as a result of their relationships with the Funds. The Board noted that various current affiliates of Funds Management may receive distribution-related fees, shareholder servicing payments and sub-transfer agency fees in respect of shares sold or held through them and services provided.
In connection with the 2021 Annual Approval Process, the Board also reviewed information about soft dollar credits earned and utilized by the Sub-Adviser, fees earned by Funds Management and the Sub-Adviser from managing a private investment vehicle for the fund family’s securities lending collateral, and commissions earned by an affiliated broker of Wells Fargo from portfolio transactions.
In connection with the New Agreement Approval Process, the Board received information to the effect that the Transaction is not expected to have a material impact on the fall-out benefits currently realized by Funds Management and its affiliates, including the Sub-Adviser. The information reviewed by the Board also noted that several of the ancillary benefits identified for WFAM would be potential ancillary benefits for NewCo, including that the scale and reputation of the Funds might benefit NewCo’s broader reputation, product initiatives, technology investment and talent acquisition. Based on its consideration of the factors and information it deemed relevant, including those described here, the Board did not find that any ancillary benefits expected to be received by Funds Management and its affiliates, including NewCo and the Sub-Adviser, under the New Agreements were unreasonable.
Conclusion
At the Board Meeting, after considering the above-described factors and based on its deliberations and its evaluation of the information described above, the Board unanimously determined that the compensation payable to Funds Management and the Sub-Adviser under the New Agreements is reasonable, approved the New Agreements for a two-year term, and voted to recommend that Fund shareholders approve the New Agreements.
150 | Target Date Retirement Funds
Board considerations (unaudited)
Board Considerations - Interim Agreements
At a meeting held on May 17-19, 2021 (the “Board Meeting”), the Boards of Trustees (each, a “Board”, and collectively, the “Boards”) of Wells Fargo Funds Trust, Wells Fargo Master Trust, Wells Fargo Variable Trust, Wells Fargo Global Dividend Opportunity Fund, Wells Fargo Income Opportunities Fund, Wells Fargo Multi-Sector Income Fund and Wells Fargo Utilities and High Income Fund (each a “Trust”, and the series thereof, a “Fund”) reviewed and approved for the Trusts and Funds, as applicable: (i) interim investment management agreements (the “Interim Management Agreements”) with Wells Fargo Funds Management, LLC (“Funds Management”); (ii) interim investment advisory agreements (the “Interim Advisory Agreements”) with Funds Management; and (iii) interim sub-advisory agreements (the “Interim Sub-Advisory Agreements”) with each of Cooke & Bieler, L.P., Galliard Capital Management LLC (“Galliard”), Peregrine Capital Management Inc., Wells Capital Management, LLC (“WellsCap”), and Wells Fargo Asset Management (International) Limited (“WFAMI”, and collectively, the “Sub-Advisers”). Each Trustee on the Board is not an “interested person” (as defined in the Investment Company Act of 1940 (the “1940 Act”) of the Funds (collectively, the “Independent Trustees”). The Interim Management Agreements, Interim Advisory Agreements, and Interim Sub-Advisory Agreements are collectively referred to as the “Interim Advisory Agreements.”
At the Board Meeting, the Boards reviewed and approved the continuation of existing investment management, advisory and sub-advisory agreements (the “Current Advisory Agreements”) for each Trust and Fund, as applicable. The factors considered and conclusions reached by the Boards in approving the Current Advisory Agreements are summarized in the section entitled “Board Considerations – Current Agreements” of this shareholder report. The Boards noted that Wells Fargo & Company has entered into a definitive agreement to sell Wells Fargo Asset Management (“WFAM”), which includes Funds Management, Galliard, WellsCap and WFAMI (the “Affiliated Sub-Advisers”), to a holding company affiliated with private funds of GTCR LLC and Reverence Capital Partners, L.P. (the “Transaction”). The Boards further noted that the Transaction would result in a change-of-control of Funds Management and the Affiliated Sub-Advisers, which would be considered to be an “assignment” under the 1940 Act that would terminate the Current Advisory Agreements. At the Board Meeting, the Boards also reviewed and approved new investment management, advisory and sub-advisory agreements (the “New Advisory Agreements”) for each Trust and Fund, as applicable, that would replace the Current Advisory Agreements upon consummation of the Transaction, subject to approval of the New Advisory Agreements by the applicable Trust’s or Fund’s shareholders. The factors considered and conclusions reached by the Boards in approving the New Advisory Agreements are summarized in the section entitled “Board Considerations – New Agreements” of this shareholder report.
At the Board Meeting, the Boards also approved the Interim Advisory Agreements, which will go into effect for a Trust or Fund only in the event that shareholders of such Trust or Fund do not approve the New Advisory Agreement(s) for the Trust or Fund by the closing date of the Transaction, when the Current Advisory Agreements will terminate. The Board noted that, in such a circumstance, the Interim Advisory Agreements will permit continuity of management by allowing Funds Management and the Sub-Advisers to continue providing services to the Trust or Fund pursuant to the Interim Advisory Agreements while the Trust or Fund continues to solicit shareholder approval of such New Advisory Agreement(s). The Boards noted that the terms of the Interim Advisory Agreements are identical to those of the Current Advisory Agreements, except for the term and the addition of escrow provisions with respect to the advisory fees. The Boards also noted that the entities that would service the Funds and Trusts under the Interim Advisory Agreements are identical to those that provide services under the Current Advisory Agreements and those that will provide services under the New Advisory Agreements.
In approving the Interim Advisory Agreements, the Boards considered the same factors and reached the same conclusions as they considered and reached with respect to the Boards’ approvals of the Current Advisory Agreements and New Advisory Agreements, as applicable, which are described in separate Board Consideration sections within this shareholder report. Prior to the Board Meeting, including at a series of meetings held in April and May 2021, the Trustees conferred extensively among themselves and with senior representatives of Funds Management, GTCR LLC and Reverence Capital Partners, L.P. about the Interim Advisory Agreements and related matters. The Independent Trustees were assisted in their evaluation of the Interim Advisory Agreements by independent legal counsel, from whom they received separate legal advice and with whom they met separately.
At the Board Meeting, after considering the factors and reaching the conclusions described in the separate Board Consideration sections within this shareholder report, the Boards unanimously determined that the compensation payable to Funds Management and to each Sub-Adviser under each of the Interim Advisory Agreements was reasonable, and approved the Interim Advisory Agreements.
Target Date Retirement Funds | 151
On August 31, 2021, the Dynamic Target Blended Indexes were composed of the following indexes:
| | Dynamic
Target
Today
Blended
Index | Dynamic
Target
2015
Blended
Index | Dynamic
Target
2020
Blended
Index |
| Bloomberg U.S. Aggregate ex-Corporate Index | 29.57% | 25.86% | 22.18% |
| Bloomberg U.S. Corporate High Yield 2% Issuer Capped Index | 2.52% | 2.21% | 1.89% |
| Bloomberg U.S. Corporate Investment Grade Index | 15.39% | 13.46% | 11.54% |
| Bloomberg U.S. Government Intermediate Bond Index | 5.00% | 4.38% | 3.75% |
| Bloomberg U.S. Treasury Inflation Notes: 1-10 Year Index | 5.00% | 4.38% | 3.75% |
| Dow Jones U.S. Select REIT Index | 3.33% | 3.96% | 4.58% |
| JP Morgan EMBI Global Diversified Index | 2.52% | 2.21% | 1.89% |
| MSCI Emerging Markets Index (Net) (USD) | 2.96% | 3.51% | 4.07% |
| MSCI World ex USA Index (Net) (USD) | 9.88% | 11.73% | 13.58% |
| Russell 1000® Index | 19.07% | 22.65% | 26.23% |
| Russell 2000® Index | 4.76% | 5.65% | 6.54% |
Average annual total returns (%) as of August 31, 2021
| | 1 year | 5 year | 10 year |
| Bloomberg U.S. Aggregate ex-Corporate Index1* | (1.04) | 2.50 | – |
| Bloomberg U.S. Corporate High Yield 2% Issuer Capped Index2 | 10.14 | 6.65 | 7.06 |
| Bloomberg U.S. Corporate Investment Grade Index3 | 2.53 | 4.78 | 5.01 |
| Bloomberg U.S. Government Intermediate Bond Index4 | (0.66) | 2.15 | 1.90 |
| Bloomberg U.S. Treasury Inflation Notes: 1-10 Year Index5 | 5.82 | 4.08 | 2.55 |
| Dow Jones U.S. Select REIT Index6 | 44.17 | 6.44 | 9.85 |
| JP Morgan EMBI Global Diversified Index7 | 4.59 | 4.41 | 5.55 |
| MSCI EM Index (Net) (USD)8 | 21.12 | 10.40 | 4.85 |
| MSCI World ex USA Index (Net) (USD)9 | 26.57 | 9.78 | 7.05 |
| Russell 1000® Index10 | 32.25 | 18.24 | 16.40 |
| Russell 2000® Index11 | 47.08 | 14.38 | 13.62 |
| * | The inception date of the index is December 2015. |
| 1 | The Bloomberg U.S. Aggregate ex-Corporate Index is a broad-based benchmark that includes Treasuries, government-related securities, mortgage-backed securities (agency fixed-rate and hybrid adjustable-rate mortgage pass-throughs), asset-backed securities and commercial mortgage-backed securities (agency and non-agency). You cannot invest directly in an index. |
| 2 | The Bloomberg U.S. Corporate High Yield 2% Issuer Capped Index is an unmanaged index comprised of fixed rate, non-investment grade debt securities that are dollar denominated and non-convertible. The index limits the maximum exposure to any one issuer to 2%. You cannot invest directly into an index. |
| 3 | The Bloomberg U.S. Corporate Investment Grade Index is a broad based benchmark that measures the investment grade, fixed-rate, taxable, corporate bond market. Bloomberg U.S. Credit - Financial Institutions Index. You cannot invest directly into an index. |
| 4 | The Bloomberg U.S. Government Intermediate Bond Index is an unmanaged index composed of U.S. government securities with maturities in the 1- to 10-year range, including securities issued by the U.S. Treasury and U.S. government agencies. You cannot invest directly in an index. |
| 5 | Bloomberg U.S. Treasury Inflation Notes: 1-10 Year Index measures the performance of the U.S. Treasury Inflation Protected Securities (TIPS) market with maturities more than 1 year and less than 10 years. Federal Reserve holdings of U.S. TIPS are not index eligible and are excluded from the face amount outstanding of each bond in the index. You cannot invest directly in an index. |
152 | Target Date Retirement Funds
Dynamic
Target
2025
Blended
Index | Dynamic
Target
2030
Blended
Index | Dynamic
Target
2035
Blended
Index | Dynamic
Target
2040
Blended
Index | Dynamic
Target
2045
Blended
Index | Dynamic
Target
2050
Blended
Index | Dynamic
Target
2055
Blended
Index | Dynamic
Target
2060
Blended
Index |
| 18.65% | 14.31% | 11.84% | 8.88% | 5.92% | 2.96% | 2.96% | 2.96% |
| 1.57% | 1.20% | 1.00% | 0.75% | 0.50% | 0.25% | 0.25% | 0.25% |
| 9.70% | 7.45% | 6.16% | 4.62% | 3.08% | 1.54% | 1.54% | 1.54% |
| 1.75% | 0.42% | 0.00% | 0.00% | 0.00% | 0.00% | 0.00% | 0.00% |
| 1.75% | 0.42% | 0.00% | 0.00% | 0.00% | 0.00% | 0.00% | 0.00% |
| 3.25% | 1.24% | 0.00% | 0.00% | 0.00% | 0.00% | 0.00% | 0.00% |
| 1.57% | 1.20% | 1.00% | 0.75% | 0.50% | 0.25% | 0.25% | 0.25% |
| 5.14% | 6.30% | 6.96% | 7.65% | 8.19% | 8.74% | 8.74% | 8.74% |
| 17.10% | 20.99% | 23.44% | 25.50% | 27.36% | 29.26% | 29.26% | 29.26% |
| 31.59% | 37.17% | 39.68% | 41.48% | 43.56% | 45.60% | 45.60% | 45.60% |
| 7.93% | 9.30% | 9.92% | 10.37% | 10.89% | 11.40% | 11.40% | 11.40% |
| 6 | The Dow Jones U.S. Select REIT Index tracks the performance of publicly traded REITs and REIT-like securities and is designed to serve as a proxy for direct real estate investment, in part by excluding companies whose performance may be driven by factors other than the value of real estate. The index is a subset of the Dow Jones U.S. Select Real Estate Securities Index (RESI). You cannot invest directly into an index. |
| 7 | The JP Morgan Emerging Markets Bond Index (“EMBI”) Global Diversified Index is a composite index representing an unleveraged investment in emerging market bonds that is broadly based across the spectrum of emerging market bonds and includes reinvestment of income (to represent real assets). You cannot invest directly in an index. |
| 8 | The Morgan Stanley Capital International (MSCI) Emerging Markets (EM) Index (Net) (USD)is a free-float-adjusted market-capitalization-weighted index that is designed to measure equity market performance of emerging markets. You cannot invest directly in an index. |
| 9 | The MSCI World ex USA Index (Net) (USD)is a free-float-adjusted market-capitalization-weighted index that is designed to measure the equity market performance of developed markets, excluding the U.S. You cannot invest directly in an index. |
| 10 | The Russell 1000® Index measures the performance of the 1,000 largest companies in the Russell 3000® Index, which represents approximately 92% of the total market capitalization of the Russell 3000® Index. You cannot invest directly in an index. |
| 11 | The Russell 2000® Index measures the performance of the 2,000 smallest companies in the Russell 3000® Index, which represents approximately 8% of the total market capitalization of the Russell 3000® Index. You cannot invest directly in an index. |
Target Date Retirement Funds | 153
For more information
More information about Wells Fargo Funds is available free upon request. To obtain literature, please write, visit the Funds' website, or call:
Wells Fargo Funds
P.O. Box 219967
Kansas City, MO 64121-9967
Website: wfam.com
Individual investors: 1-800-222-8222
Retail investment professionals: 1-888-877-9275
Institutional investment professionals: 1-866-765-0778
This report and the financial statements contained herein are submitted for the general information of the shareholders of the Wells Fargo Funds. If this report is used for promotional purposes, distribution of the report must be accompanied or preceded by a current prospectus. Before investing, please consider the investment objectives, risks, charges, and expenses of the investment. For a current prospectus and, if available, a summary prospectus, containing this information, call
1-800-222-8222 or visit the Funds' website at wfam.com. Read the prospectus carefully before you invest or send money.
Wells Fargo Asset Management (WFAM) is the trade name for certain investment advisory/management firms owned by Wells Fargo & Company. These firms include but are not limited to Wells Capital Management, LLC and Wells Fargo Funds Management, LLC. Certain products managed by WFAM entities are distributed by Wells Fargo Funds Distributor, LLC (a broker-dealer and Member FINRA).
This material is for general informational and educational purposes only and is NOT intended to provide investment advice or a recommendation of any kind - including a recommendation for any specific investment, strategy, or plan.
INVESTMENT PRODUCTS: NOT FDIC INSURED ■ NO BANK GUARANTEE ■ MAY LOSE VALUE
© 2021 Wells Fargo & Company. All rights reserved.
PAR-0921-00711 10-21
SDTD/SAR104 08-21
Not applicable.
| ITEM 3. | AUDIT COMMITTEE FINANCIAL EXPERT |
Not applicable.
| ITEM 4. | PRINCIPAL ACCOUNTANT FEES AND SERVICES |
Not applicable.
| ITEM 5. | AUDIT COMMITTEE OF LISTED REGISTRANTS |
Not applicable.
A Portfolio of Investments for each series of Wells Fargo Funds Trust is included as part of the report to shareholders filed under Item 1 of this Form.
| ITEM 7. | DISCLOSURE OF PROXY VOTING POLICIES AND PROCEDURES FOR CLOSED-END MANAGEMENT INVESTMENT COMPANIES |
Not applicable.
| ITEM 8. | PORTFOLIO MANAGERS OF CLOSED-END MANAGEMENT INVESTMENT COMPANIES |
Not applicable.
| ITEM 9. | PURCHASES OF EQUITY SECURITIES BY CLOSED-END MANAGEMEENT INVESTMENT COMPANY AND AFFILIATED PURCHASERS |
Not applicable.
| ITEM 10. | SUBMISSION OF MATTERS TO A VOTE OF SECURITY HOLDERS |
There have been no material changes to the procedures by which shareholders may recommend nominees to the registrant’s Board of Trustees that have been implemented since the registrant’s last provided disclosure in response to the requirements of this Item.
| ITEM 11. | CONTROLS AND PROCEDURES |
(a) The President and Treasurer have concluded that the Wells Fargo Funds Trust disclosure controls and procedures (as defined in Rule 30a-3(c) under the Investment Company Act of 1940) provide reasonable assurances that material information relating to the registrant is made known to them by the appropriate persons, based on their evaluation of these controls and procedures as of a date within 90 days of the filing of this report.
(b) There were no significant changes in the registrant’s internal controls over financial reporting (as defined in Rule 30a-3(d) under the Investment Company Act of 1940) that occurred during the most recent fiscal half-year of the period covered by this report that materially affected, or is reasonably likely to materially affect, the registrant’s internal control over financial reporting.
| ITEM 12. | DISCLOSURES OF SECURITIES LENDING ACTIVITES FOR CLOSED-END MANAGEMENT INVESTMENT COMPANIES |
Not applicable.
(a)(1) Not applicable.
(a)(2) Certifications pursuant to Section 302 of the Sarbanes-Oxley Act of 2002.
(b) Certifications pursuant to Section 906 of the Sarbanes-Oxley Act of 2002.

SIGNATURES
Pursuant to the requirements of the Securities Exchange Act of 1934 and the Investment Company Act of 1940, the registrant has duly caused this report to be signed on its behalf by the undersigned, thereunto duly authorized.
| | |
| Wells Fargo Funds Trust |
| |
| By: | | /s/Andrew Owen |
| | Andrew Owen |
| | President |
|
| Date: October 27, 2021 |
Pursuant to the requirements of the Securities Exchange Act of 1934 and the Investment Company Act of 1940, this report has been signed below by the following persons on behalf of the registrant and in the capacities and on the date indicated.
| | |
| Wells Fargo Funds Trust |
| |
| By: | | /s/Andrew Owen |
| | Andrew Owen |
| | President |
|
| Date: October 27, 2021 |
| |
| By: | | /s/Jeremy DePalma |
| | Jeremy DePalma |
| | Treasurer |
|
| Date: October 27, 2021 |