UNITED STATES
SECURITIES AND EXCHANGE COMMISSION
Washington, D.C. 20549
FORM N-CSRS
CERTIFIED SHAREHOLDER REPORT OF REGISTERED
MANAGEMENT INVESTMENT COMPANIES
Investment Company Act file number: 811-09253
Wells Fargo Funds Trust
(Exact name of registrant as specified in charter)
525 Market St., San Francisco, CA 94105
(Address of principal executive offices) (Zip code)
Catherine Kennedy
Wells Fargo Funds Management, LLC
525 Market St., San Francisco, CA 94105
(Name and address of agent for service)
Registrant’s telephone number, including area code: 800-222-8222
Date of fiscal year end: October 31
Registrant is making a filing for 5 of its series:
Wells Fargo Emerging Markets Equity Fund, Wells Fargo Emerging Markets Equity Income Fund, Wells Fargo Global Small Cap Fund, Wells Fargo International Equity Fund, and Wells Fargo Special International Small Cap Fund
Date of reporting period: April 30, 2021
ITEM 1. REPORT TO STOCKHOLDERS
Semi-Annual Report
April 30, 2021
Wells Fargo
Emerging Markets Equity Fund
Reduce clutter.
Save trees.
Sign up for electronic delivery of prospectuses and shareholder reports at wellsfargo.com/ advantagedelivery
The views expressed and any forward-looking statements are as of April 30, 2021, unless otherwise noted, and are those of the Fund's portfolio managers and/or Wells Fargo Asset Management. Discussions of individual securities or the markets generally are not intended as individual recommendations. Future events or results may vary significantly from those expressed in any forward-looking statements. The views expressed are subject to change at any time in response to changing circumstances in the market. Wells Fargo Asset Management and the Fund disclaim any obligation to publicly update or revise any views expressed or forward-looking statements.
INVESTMENT PRODUCTS: NOT FDIC INSURED ■ NO BANK GUARANTEE ■ MAY LOSE VALUE
Wells Fargo Emerging Markets Equity Fund | 1
Letter to shareholders (unaudited)
Andrew Owen
President
Wells Fargo Funds
Dear Shareholder:
We are pleased to offer you this semi-annual report for the Wells Fargo Emerging Markets Equity Fund for the six-month period that ended April 30, 2021. Global stocks continued to rally as the global economy continued to work through the haze of COVID-19. Tailwinds were provided by global stimulus programs, a rapid vaccination rollout, and recovering consumer and corporate sentiment. Bonds were mixed during the period, with global bonds, municipal bonds, and high-yield bonds delivering positive returns.
For the six-month period, U.S. stocks, based on the S&P 500 Index,1 gained 28.85%. International stocks, as measured by the MSCI ACWI ex USA Index (Net),2 returned 27.40%, while the MSCI EM Index (Net),3 trailed its developed market counterparts with a 22.95% gain. Among bond indexes, the Bloomberg Barclays U.S. Aggregate Bond Index,4 returned -1.52%, the Bloomberg Barclays Global Aggregate ex-USD Index (unhedged),5 returned 0.68%, the Bloomberg Barclays Municipal Bond Index,6 returned 2.62%, and the ICE BofA U.S. High Yield Index,7 returned 8.12%.
Hope drove the stock markets to new highs.
Global stocks rallied in November, propelled by optimism over three promising COVID-19 vaccines. Reversing recent trends, value stocks outperformed growth stocks and cyclical stocks outpaced information technology (IT) stocks. However, U.S. unemployment remained elevated, with a net job loss of 10 million since February. The eurozone services Purchasing Managers’ Index, a monthly survey of purchasing managers, contracted sharply while the region’s manufacturing activity grew. The U.S. election results added to the upbeat mood as investors anticipated more consistent policies in the new administration.
Financial markets ended the year with strength on high expectations for a rapid rollout of the COVID-19 vaccines, the successful passage of a $900 billion stimulus package, and rising expectations of additional economic support from a Democratic-led Congress. U.S. economic data were mixed with still-elevated unemployment and weak retail sales but growth in manufacturing output. In contrast, China’s economic expansion continued in both manufacturing and nonmanufacturing. U.S. COVID-19 infection rates continued to rise even as new state and local lockdown measures were implemented.
“Global stocks rallied in November, propelled by optimism over three promising COVID-19 vaccines.”
| 1 | The S&P 500 Index consists of 500 stocks chosen for market size, liquidity, and industry group representation. It is a market-value-weighted index with each stock's weight in the index proportionate to its market value. You cannot invest directly in an index. |
| 2 | The Morgan Stanley Capital International (MSCI) All Country World Index (ACWI) ex USA Index (Net) is a free-float-adjusted market-capitalization-weighted index that is designed to measure the equity market performance of developed and emerging markets, excluding the United States. Source: MSCI. MSCI makes no express or implied warranties or representations and shall have no liability whatsoever with respect to any MSCI data contained herein. The MSCI data may not be further redistributed or used as a basis for other indices or any securities or financial products. This report is not approved, reviewed, or produced by MSCI. You cannot invest directly in an index. |
| 1 | The S&P 500 Index consists of 500 stocks chosen for market size, liquidity, and industry group representation. It is a market-value-weighted index with each stock's weight in the index proportionate to its market value. You cannot invest directly in an index. |
| 3 | The MSCI Emerging Markets (EM) Index (Net) is a free-float-adjusted market-capitalization-weighted index that is designed to measure equity market performance of emerging markets. You cannot invest directly in an index. |
| 1 | The S&P 500 Index consists of 500 stocks chosen for market size, liquidity, and industry group representation. It is a market-value-weighted index with each stock's weight in the index proportionate to its market value. You cannot invest directly in an index. |
| 4 | The Bloomberg Barclays U.S. Aggregate Bond Index is a broad-based benchmark that measures the investment-grade, U.S. dollar-denominated, fixed-rate taxable bond market, including Treasuries, government-related and corporate securities, mortgage-backed securities (agency fixed-rate and hybrid adjustable-rate mortgage pass-throughs), asset-backed securities, and commercial mortgage-backed securities. You cannot invest directly in an index. |
| 1 | The S&P 500 Index consists of 500 stocks chosen for market size, liquidity, and industry group representation. It is a market-value-weighted index with each stock's weight in the index proportionate to its market value. You cannot invest directly in an index. |
| 5 | The Bloomberg Barclays Global Aggregate ex-USD Index (unhedged) is an unmanaged index that provides a broad-based measure of the global investment-grade fixed-income markets excluding the U.S. dollar-denominated debt market. You cannot invest directly in an index. |
| 1 | The S&P 500 Index consists of 500 stocks chosen for market size, liquidity, and industry group representation. It is a market-value-weighted index with each stock's weight in the index proportionate to its market value. You cannot invest directly in an index. |
| 6 | The Bloomberg Barclays Municipal Bond Index is an unmanaged index composed of long-term tax-exempt bonds with a minimum credit rating of Baa. You cannot invest directly in an index. |
| 1 | The S&P 500 Index consists of 500 stocks chosen for market size, liquidity, and industry group representation. It is a market-value-weighted index with each stock's weight in the index proportionate to its market value. You cannot invest directly in an index. |
| 7 | The ICE BofA U.S. High Yield Index is a market-capitalization-weighted index of domestic and Yankee high-yield bonds. The index tracks the performance of high-yield securities traded in the U.S. bond market. You cannot invest directly in an index. Copyright 2021. ICE Data Indices, LLC. All rights reserved. |
2 | Wells Fargo Emerging Markets Equity Fund
Letter to shareholders (unaudited)
The calendar year 2021 began with emerging market stocks leading all major asset classes in January, driven by China’s strong economic growth and a broad recovery in corporate earnings, which propelled China’s stock market higher. In the U.S., positive news on vaccine trials and January's expansion in both the manufacturing and services sectors were offset by a weak December monthly jobs report. This was compounded by technical factors as some hedge funds were forced to sell stocks to protect themselves against a well-publicized short squeeze coordinated by a group of retail investors. Eurozone sentiment and economic growth were particularly weak, reflecting the impact of a new lockdown with stricter social distancing along with a slow vaccine rollout.
February saw major domestic equity indexes driven higher on the hope of a new stimulus bill, improving COVID-19 vaccination numbers, and the gradual reopening of the economy. Most S&P 500 companies reported better-than-expected earnings, with positive surprises coming from the financials, IT, health care, and materials sectors. Japan saw its economy strengthen as a result of strong export numbers. Meanwhile, crude-oil prices continued their climb, rising more than 25% for the year. Domestic government bonds experienced a sharp sell-off in late February as markets priced in a more robust economic recovery and higher future growth and inflation expectations.
The passage of the massive domestic stimulus bill highlighted March activity, leading to increased forecasts for U.S. growth in 2021. Domestic employment surged as COVID-19 vaccinations and an increasingly open economy spurred hiring. A majority of U.S. small companies reported they were operating at pre-pandemic capacity or higher. Value continued its outperformance of growth in the month, continuing the trend that started in late 2020. Meanwhile, most major developed global equity indexes were up month to date on the back of rising optimism regarding the outlook for global growth. While the U.S. and the U.K. have been the most successful in terms of the vaccine rollout, even within markets where the vaccine has lagged, such as the eurozone and Japan, equity indexes in many of those countries are also in positive territory this year.
Equity markets produced another strong showing in April. Domestically, the continued reopening of the economy had a strong impact on positive equity performance as people started leaving their households and jobless claims continued to fall. Domestic corporate bonds performed well and the U.S. dollar weakened. Meanwhile, the U.S. government continued to seek to invest in the recovery, this time by outlining a package of over $2 billion to improve infrastructure. The primary headwind in April was inflation, as investors tried to determine the breadth and longevity of recent price increases. Developed Europe has been supported by a meaningful increase in the pace of vaccinations. Unfortunately many emerging market countries have not been as successful. India in particular has seen COVID-19 cases surge, serving as an example of the need to get vaccinations rolled out to less developed nations.
Don’t let short-term uncertainty derail long-term investment goals.
Periods of investment uncertainty can present challenges, but experience has taught us that maintaining long-term investment goals can be an effective way to plan for the future. Although diversification cannot guarantee an investment profit or prevent losses, we believe it can be an effective way to manage investment risk and potentially smooth out overall portfolio performance. We encourage investors to know their investments and to understand that appropriate levels of risk-taking may unlock opportunities.
Thank you for choosing to invest with Wells Fargo Funds. We appreciate your confidence in us and remain committed to helping you meet your financial needs.
Sincerely,
Andrew Owen
President
Wells Fargo Funds
“The passage of the massive domestic stimulus bill highlighted March activity, leading to increased forecasts for U.S. growth in 2021.”
For further information about your Fund, contact your investment professional, visit our website at wfam.com, or call us directly at 1-800-222-8222.
Wells Fargo Emerging Markets Equity Fund | 3
Performance highlights (unaudited)
| Investment objective | The Fund seeks long-term capital appreciation. |
| Manager | Wells Fargo Funds Management, LLC |
| Subadviser | Wells Capital Management Incorporated |
| Portfolio managers | Derrick Irwin, CFA®‡, Richard Peck, CFA®‡, Yi (Jerry) Zhang, Ph.D., CFA®‡ |
| Average annual total returns (%) as of April 30, 2021 |
| | | Including sales charge | | Excluding sales charge | | Expense ratios1 (%) |
| | Inception date | 1 year | 5 year | 10 year | | 1 year | 5 year | 10 year | | Gross | Net 2 |
| Class A (EMGAX) | 9-6-1994 | 42.61 | 12.18 | 3.57 | | 51.30 | 13.52 | 4.18 | | 1.55 | 1.55 |
| Class C (EMGCX) | 9-6-1994 | 49.37 | 12.68 | 3.41 | | 50.37 | 12.68 | 3.41 | | 2.30 | 2.30 |
| Class R6 (EMGDX)3 | 6-28-2013 | – | – | – | | 51.92 | 14.00 | 4.64 | | 1.12 | 1.12 |
| Administrator Class (EMGYX) | 9-6-1994 | – | – | – | | 52.93 | 13.85 | 4.42 | | 1.47 | 1.43 |
| Institutional Class (EMGNX) | 7-30-2010 | – | – | – | | 51.82 | 13.92 | 4.59 | | 1.22 | 1.18 |
| MSCI EM Index (Net)4 | – | – | – | – | | 48.71 | 12.50 | 3.59 | | – | – |
Figures quoted represent past performance, which is no guarantee of future results, and do not reflect taxes that a shareholder may pay on an investment in a fund. Investment return and principal value of an investment will fluctuate so that an investor’s shares, when redeemed, may be worth more or less than their original cost. Performance shown without sales charges would be lower if sales charges were reflected. Current performance may be lower or higher than the performance data quoted, which assumes the reinvestment of dividends and capital gains. Current month-end performance is available on the Fund’s website, wfam.com.
Please keep in mind that high double-digit returns were primarily achieved during favorable market conditions. You should not expect that such favorable returns can be consistently achieved. A fund’s performance, especially for short time periods, should not be the sole factor in making your investment decision.
Index returns do not include transaction costs associated with buying and selling securities, any mutual fund fees or expenses, or any taxes. It is not possible to invest directly in an index.
For Class A shares, the maximum front-end sales charge is 5.75%. For Class C shares, the maximum contingent deferred sales charge is 1.00%. Performance including a contingent deferred sales charge assumes the sales charge for the corresponding time period. Class R6, Administrator Class, and Institutional Class shares are sold without a front-end sales charge or contingent deferred sales charge.
| 1 | Reflects the expense ratios as stated in the most recent prospectuses, which include the impact of 0.01% in acquired fund fees and expenses. The expense ratios shown are subject to change and may differ from the annualized expense ratios shown in the financial highlights of this report, which do not include acquired fund fees and expenses. |
| 2 | The manager has contractually committed through February 28, 2022, to waive fees and/or reimburse expenses to the extent necessary to cap total annual fund operating expenses after fee waivers at 1.55% for Class A, 2.30% for Class C, 1.13% for Class R6, 1.42% for Administrator Class and 1.17% for Institutional Class. Brokerage commissions, stamp duty fees, interest, taxes, acquired fund fees and expenses (if any), and extraordinary expenses are excluded from the expense caps. Prior to or after the commitment expiration date, the caps may be increased or the commitment to maintain the caps may be terminated only with the approval of the Board of Trustees. Without these caps, the Fund’s returns would have been lower. The expense ratio paid by an investor is the net expense ratio (the total annual fund operating expenses after fee waivers) as stated in the prospectuses. |
| 3 | Historical performance shown for the Class R6 shares prior to their inception reflects the performance of the Institutional Class shares and includes the higher expenses applicable to the Institutional Class shares. If these expenses had not be included, returns for the Class R6 shares would have been higher. |
| 4 | The Morgan Stanley Capital International (MSCI) Emerging Markets (EM) Index (Net) is a free-float-adjusted market-capitalization-weighted index that is designed to measure the equity market performance of emerging markets. Source: MSCI. MSCI makes no express or implied warranties or representations and shall have no liability whatsoever with respect to any MSCI data contained herein. The MSCI data may not be further redistributed or used as a basis for other indices or any securities or financial products. This report is not approved, reviewed, or produced by MSCI. You cannot invest directly in an index. |
| ‡ | CFA® and Chartered Financial Analyst® are trademarks owned by CFA Institute. |
4 | Wells Fargo Emerging Markets Equity Fund
Performance highlights (unaudited)
Stock values fluctuate in response to the activities of individual companies and general market and economic conditions. Foreign investments are especially volatile and can rise or fall dramatically due to differences in the political and economic conditions of the host country. These risks are generally intensified in emerging markets. The use of derivatives may reduce returns and/or increase volatility. Certain investment strategies tend to increase the total risk of an investment (relative to the broader market). The Fund is exposed to focused portfolio risk, geographic risk, and smaller company securities risk. Consult the Fund’s prospectus for additional information on these and other risks.
| Ten largest holdings (%) as of April 30, 20211 |
| Samsung Electronics Company Limited | 5.68 |
| Tencent Holdings Limited | 4.80 |
| Taiwan Semiconductor Manufacturing Company Limited ADR | 4.26 |
| Bilibili Incorporated ADR | 4.25 |
| Li Ning Company Limited | 3.33 |
| Alibaba Group Holding Limited ADR | 2.87 |
| Meituan Dianping | 2.85 |
| Taiwan Semiconductor Manufacturing Company Limited | 2.57 |
| Mediatek Incorporated | 2.30 |
| Vipshop Holdings Limited ADR | 2.24 |
| 1 | Figures represent the percentage of the Fund's net assets. Holdings are subject to change and may have changed since the date specified. |
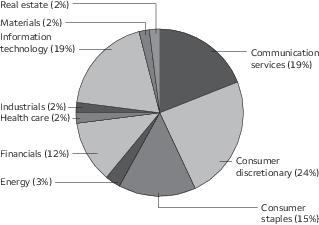
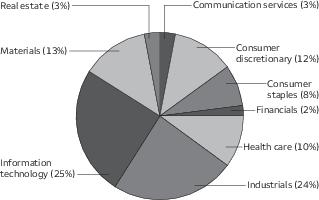
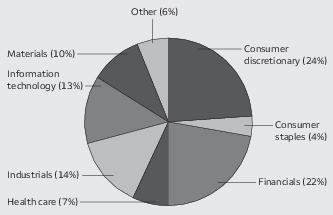
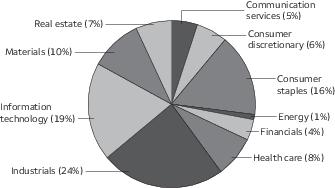
| Sector allocation as of April 30, 20211 |
| 1 | Figures represent the percentage of the Fund's long-term investments. These amounts are subject to change and may have changed since the date specified. |
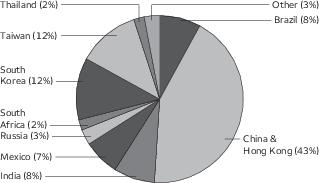
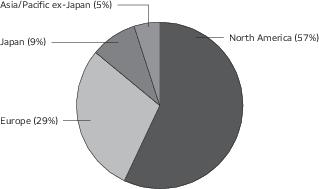
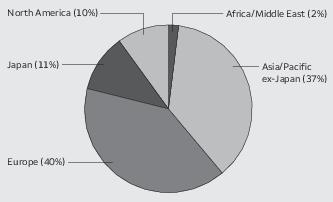
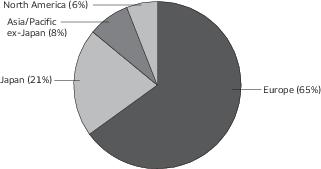
| Country allocation as of April 30, 20211 |
| 1 | Figures represent the percentage of the Fund's long-term investments. These amounts are subject to change and may have changed since the date specified. |
Wells Fargo Emerging Markets Equity Fund | 5
Fund expenses (unaudited)
As a shareholder of the Fund, you incur two types of costs: (1) transaction costs, including sales charges (loads) on purchase payments and contingent deferred sales charges (if any) on redemptions and (2) ongoing costs, including management fees, distribution (12b-1) and/or shareholder servicing fees, and other Fund expenses. This example is intended to help you understand your ongoing costs (in dollars) of investing in the Fund and to compare these costs with the ongoing costs of investing in other mutual funds.
The example is based on an investment of $1,000 invested at the beginning of the six-month period and held for the entire period from November 1, 2020 to April 30, 2021.
Actual expenses
The “Actual” line of the table below provides information about actual account values and actual expenses. You may use the information in this line, together with the amount you invested, to estimate the expenses that you paid over the period. Simply divide your account value by $1,000 (for example, an $8,600 account value divided by $1,000 = 8.6), then multiply the result by the number in the “Actual” line under the heading entitled “Expenses paid during period” for your applicable class of shares to estimate the expenses you paid on your account during this period.
Hypothetical example for comparison purposes
The “Hypothetical” line of the table below provides information about hypothetical account values and hypothetical expenses based on the Fund’s actual expense ratio and an assumed rate of return of 5% per year before expenses, which is not the Fund’s actual return. The hypothetical account values and expenses may not be used to estimate the actual ending account balance or expenses you paid for the period. You may use this information to compare the ongoing costs of investing in the Fund and other funds. To do so, compare this 5% hypothetical example with the 5% hypothetical examples that appear in the shareholder reports of the other funds.
Please note that the expenses shown in the table are meant to highlight your ongoing costs only and do not reflect any transactional costs, such as sales charges (loads) and contingent deferred sales charges. Therefore, the “Hypothetical” line of the table is useful in comparing ongoing costs only and will not help you determine the relative total costs of owning different funds. In addition, if these transactional costs were included, your costs would have been higher.
| | Beginning
account value
11-1-2020 | Ending
account value
4-30-2021 | Expenses
paid during
the period1 | Annualized net
expense ratio |
| Class A | | | | |
| Actual | $1,000.00 | $1,241.74 | $ 8.23 | 1.48% |
| Hypothetical (5% return before expenses) | $1,000.00 | $1,017.46 | $ 7.40 | 1.48% |
| Class C | | | | |
| Actual | $1,000.00 | $1,236.66 | $12.37 | 2.23% |
| Hypothetical (5% return before expenses) | $1,000.00 | $1,013.74 | $11.13 | 2.23% |
| Class R6 | | | | |
| Actual | $1,000.00 | $1,244.45 | $ 5.84 | 1.05% |
| Hypothetical (5% return before expenses) | $1,000.00 | $1,019.59 | $ 5.26 | 1.05% |
| Administrator Class | | | | |
| Actual | $1,000.00 | $1,242.04 | $ 7.78 | 1.40% |
| Hypothetical (5% return before expenses) | $1,000.00 | $1,017.85 | $ 7.00 | 1.40% |
| Institutional Class | | | | |
| Actual | $1,000.00 | $1,244.03 | $ 6.40 | 1.15% |
| Hypothetical (5% return before expenses) | $1,000.00 | $1,019.09 | $ 5.76 | 1.15% |
1 Expenses paid is equal to the annualized net expense ratio of each class multiplied by the average account value over the period, multiplied by the number of days in the most recent fiscal half-year divided by the number of days in the fiscal year (to reflect the one-half-year period).
6 | Wells Fargo Emerging Markets Equity Fund
Portfolio of investments—April 30, 2021 (unaudited)
| | | | | | Shares | Value |
| Common stocks: 91.30% | | | | | | |
| Argentina: 0.27% | | | | | | |
| MercadoLibre Incorporated (Consumer discretionary, Internet & direct marketing retail) † | | | | | 10,716 | $ 16,834,622 |
| Brazil: 5.80% | | | | | | |
| Ambev SA ADR (Consumer staples, Beverages) | | | | | 4,164,500 | 11,577,310 |
| Atacadao Distribuicao Comercio e Industria Limitada (Consumer staples, Food & staples retailing) | | | | | 6,467,000 | 25,858,238 |
| B2W Companhia Digital (Consumer discretionary, Internet & direct marketing retail) † | | | | | 6,825,534 | 84,589,602 |
| B3 Brasil Bolsa Balcao SA (Financials, Capital markets) | | | | | 5,243,005 | 49,707,708 |
| Banco Bradesco SA ADR (Financials, Banks) | | | | | 5,222,979 | 22,719,960 |
| BK Brasil Operacao e Assessoria a Restaurantes SA (Consumer discretionary, Hotels, restaurants & leisure) † | | | | | 3,855,794 | 7,027,248 |
| BRF Brazil Foods SA ADR (Consumer staples, Food products) † | | | | | 10,457,912 | 40,576,699 |
| Diagnosticos da America SA (Health care, Health care providers & services) | | | | | 2,166,273 | 23,010,457 |
| Hapvida Participacoes e Investimentos SA (Health care, Health care providers & services) 144A | | | | | 14,967,335 | 39,787,616 |
| Lojas Renner SA (Consumer discretionary, Multiline retail) | | | | | 4,937,175 | 36,719,447 |
| Multiplan Empreendimentos Imobiliarios SA (Real estate, Real estate management & development) | | | | | 2,446,906 | 10,374,029 |
| Raia Drogasil SA (Consumer staples, Food & staples retailing) | | | | | 1,968,000 | 9,528,336 |
| | | | | | | 361,476,650 |
| Chile: 1.16% | | | | | | |
| Banco Santander Chile SA ADR (Financials, Banks) | | | | | 1,130,492 | 25,142,142 |
| S.A.C.I. Falabella (Consumer discretionary, Multiline retail) | | | | | 10,460,549 | 47,244,892 |
| | | | | | | 72,387,034 |
| China: 35.15% | | | | | | |
| 51job Incorporated ADR (Industrials, Professional services) † | | | | | 780,541 | 48,042,299 |
| Agora Incorporated ADR (Information technology, Software) †« | | | | | 181,765 | 8,835,597 |
| Alibaba Group Holding Limited ADR (Consumer discretionary, Internet & direct marketing retail) † | | | | | 775,337 | 179,064,080 |
| Alibaba Group Holding Limited ADR (Consumer discretionary, Internet & direct marketing retail) † | | | | | 1,535,000 | 44,462,682 |
| Best Incorporated ADR (Industrials, Air freight & logistics) †« | | | | | 3,757,927 | 4,960,464 |
| Bilibili Incorporated ADR (Communication services, Entertainment) † | | | | | 2,391,012 | 265,067,590 |
| China Life Insurance Company Limited Class H (Financials, Insurance) | | | | | 23,043,190 | 46,930,355 |
| China Literature Limited (Communication services, Media) 144A†« | | | | | 2,469,968 | 25,756,160 |
| China MeiDong Auto Holdings Limited (Consumer discretionary, Specialty retail) | | | | | 12,373,400 | 61,884,920 |
| FinVolution Group ADR (Financials, Consumer finance) | | | | | 4,401,985 | 29,537,319 |
| Greentree Hospitality Group Limited (Consumer discretionary, Hotels, restaurants & leisure) † | | | | | 1,215,741 | 15,269,707 |
| Hua Medicine Limited (Health care, Pharmaceuticals) 144A† | | | | | 8,733,136 | 5,430,279 |
| Jianpu Technology Incorporated ADR (Financials, Consumer finance) †« | | | | | 64,322 | 185,247 |
The accompanying notes are an integral part of these financial statements.
Wells Fargo Emerging Markets Equity Fund | 7
Portfolio of investments—April 30, 2021 (unaudited)
| | | | | | Shares | Value |
| China: (continued) | | | | | | |
| Koolearn Technology Holding Limited (Consumer discretionary, Diversified consumer services) 144A†« | | | | | 11,063,215 | $ 21,278,289 |
| Li Ning Company Limited (Consumer discretionary, Textiles, apparel & luxury goods) | | | | | 25,427,707 | 207,539,715 |
| Meituan Dianping (Consumer discretionary, Internet & direct marketing retail) † | | | | | 4,622,600 | 177,340,259 |
| New Oriental Education & Technology Group Incorporated ADR (Consumer discretionary, Diversified consumer services) † | | | | | 6,241,890 | 95,251,241 |
| Pinduoduo Incorporated ADR (Consumer discretionary, Internet & direct marketing retail) † | | | | | 254,441 | 34,077,283 |
| Shandong Weigao Group Medical Polymer Company Limited Class H (Health care, Health care equipment & supplies) | | | | | 23,290,600 | 52,231,631 |
| Tencent Holdings Limited (Communication services, Interactive media & services) | | | | | 3,731,700 | 299,295,047 |
| Tencent Music Entertainment ADR (Communication services, Entertainment) † | | | | | 1,081,603 | 18,841,524 |
| Tongdao Liepin Group (Communication services, Interactive media & services) † | | | | | 1,636,260 | 5,487,377 |
| Trip.com Group Limited ADR (Consumer discretionary, Internet & direct marketing retail) † | | | | | 1,708,013 | 66,749,148 |
| Tsingtao Brewery Company Limited Class H (Consumer staples, Beverages) | | | | | 5,312,500 | 48,216,182 |
| Uxin Limited ADR (Consumer discretionary, Internet & direct marketing retail) †« | | | | | 3,950,000 | 11,889,500 |
| Uxin Limited ADR Class A (Consumer discretionary, Internet & direct marketing retail) ♦ | | | | | 23,979,831 | 24,059,756 |
| Vipshop Holdings Limited ADR (Consumer discretionary, Internet & direct marketing retail) † | | | | | 4,543,039 | 139,789,310 |
| Want Want China Holdings Limited (Consumer staples, Food products) | | | | | 63,025,800 | 45,680,571 |
| Weibo Corporation ADR (Communication services, Interactive media & services) † | | | | | 1,796,634 | 90,550,354 |
| Xiaomi Corporation Class B (Information technology, Technology hardware, storage & peripherals) 144A† | | | | | 20,160,100 | 63,845,832 |
| Zepp Health Corporation ADR Class A (Information technology, Electronic equipment, instruments & components) † | | | | | 2,239,291 | 22,997,519 |
| Zhou Hei Ya International Holding Company Limited (Consumer staples, Food products) 144A | | | | | 25,612,726 | 31,390,448 |
| | | | | | | 2,191,937,685 |
| Colombia: 0.24% | | | | | | |
| Bancolombia SA ADR (Financials, Banks) | | | | | 499,100 | 14,938,063 |
| Hong Kong: 4.68% | | | | | | |
| AIA Group Limited (Financials, Insurance) | | | | | 8,677,500 | 110,483,055 |
| Johnson Electric Holdings Limited (Industrials, Electrical equipment) | | | | | 4,183,050 | 11,147,261 |
| Sun Art Retail Group Limited (Consumer staples, Food & staples retailing) « | | | | | 55,955,400 | 51,577,441 |
| WH Group Limited (Consumer staples, Food products) 144A | | | | | 136,165,700 | 119,026,115 |
| | | | | | | 292,233,872 |
| India: 7.72% | | | | | | |
| Axis Bank Limited (Financials, Banks) † | | | | | 4,251,923 | 41,036,819 |
The accompanying notes are an integral part of these financial statements.
8 | Wells Fargo Emerging Markets Equity Fund
Portfolio of investments—April 30, 2021 (unaudited)
| | | | | | Shares | Value |
| India: (continued) | | | | | | |
| Bajaj Finance Limited (Financials, Consumer finance) † | | | | | 420,281 | $ 30,933,612 |
| Bandhan Bank Limited (Financials, Banks) 144A† | | | | | 1,416,131 | 6,304,218 |
| Bharti Airtel Limited (Communication services, Wireless telecommunication services) | | | | | 3,969,052 | 28,760,858 |
| Dalmia Bharat Limited (Materials, Construction materials) † | | | | | 624,658 | 12,703,143 |
| Fortis Healthcare Limited (Health care, Health care providers & services) † | | | | | 5,634,970 | 16,028,731 |
| HDFC Bank Limited ADR (Financials, Banks) † | | | | | 428,752 | 30,132,691 |
| Housing Development Finance Corporation Limited (Financials, Thrifts & mortgage finance) | | | | | 1,115,700 | 36,452,200 |
| Indus Towers Limited (Communication services, Diversified telecommunication services) | | | | | 1,373,851 | 4,683,214 |
| ITC Limited (Consumer staples, Tobacco) | | | | | 14,883,960 | 40,709,984 |
| JM Financial Limited (Financials, Capital markets) | | | | | 11,571,429 | 12,552,085 |
| Kotak Mahindra Bank Limited (Financials, Banks) † | | | | | 1,117,262 | 26,377,776 |
| Max Financial Services Limited (Financials, Insurance) † | | | | | 925,389 | 11,192,494 |
| Oberoi Realty Limited (Real estate, Real estate management & development) † | | | | | 1,064,750 | 7,866,407 |
| Reliance Industries Limited (Energy, Oil, gas & consumable fuels) | | | | | 260,000 | 7,000,844 |
| Reliance Industries Limited GDR (Energy, Oil, gas & consumable fuels) 144A | | | | | 2,322,274 | 125,635,023 |
| SBI Life Insurance Company Limited (Financials, Insurance) 144A | | | | | 964,273 | 12,089,781 |
| SH Kelkar & Company Limited (Materials, Chemicals) | | | | | 1,244,001 | 2,321,822 |
| Spandana Sphoorty Financial (Financials, Consumer finance) † | | | | | 440,254 | 3,561,378 |
| Ultra Tech Cement Limited (Materials, Construction materials) | | | | | 296,000 | 25,091,217 |
| | | | | | | 481,434,297 |
| Indonesia: 1.22% | | | | | | |
| PT Astra International Tbk (Consumer discretionary, Automobiles) | | | | | 21,151,000 | 8,053,340 |
| PT Bank Central Asia Tbk (Financials, Banks) | | | | | 11,949,500 | 26,492,401 |
| PT Blue Bird Tbk (Industrials, Road & rail) † | | | | | 4,605,309 | 435,185 |
| PT Link Net Tbk (Communication services, Diversified telecommunication services) | | | | | 38,278,161 | 10,599,698 |
| PT Telekomunikasi Indonesia Persero Tbk ADR (Communication services, Diversified telecommunication services) « | | | | | 1,387,471 | 30,607,610 |
| | | | | | | 76,188,234 |
| Luxembourg: 0.09% | | | | | | |
| InPost SA (Industrials, Industrial conglomerates) † | | | | | 297,122 | 5,661,855 |
| Mexico: 6.17% | | | | | | |
| America Movil SAB de CV ADR (Communication services, Wireless telecommunication services) | | | | | 4,087,304 | 56,977,018 |
| Banco Santander Mexico SA ADR Class B (Financials, Banks) † | | | | | 3,029,336 | 17,115,748 |
| Banco Santander Mexico SA Class B (Financials, Banks) † | | | | | 2,977,800 | 3,358,974 |
| Becle SAB de CV ADR (Consumer staples, Beverages) | | | | | 12,667,225 | 30,397,088 |
| Cemex SAB de CV ADR (Materials, Construction materials) † | | | | | 4,311,948 | 34,021,270 |
| Fibra Uno Administracion SAB de CV (Real estate, Equity REITs) | | | | | 53,740,122 | 66,322,903 |
The accompanying notes are an integral part of these financial statements.
Wells Fargo Emerging Markets Equity Fund | 9
Portfolio of investments—April 30, 2021 (unaudited)
| | | | | | Shares | Value |
| Mexico: (continued) | | | | | | |
| Fomento Economico Mexicano SAB de CV ADR (Consumer staples, Beverages) | | | | | 1,712,182 | $ 132,694,105 |
| Grupo Financiero Banorte SAB de CV (Financials, Banks) | | | | | 4,050,488 | 22,998,822 |
| Walmart de Mexico SAB de CV (Consumer staples, Food & staples retailing) | | | | | 6,342,900 | 20,800,654 |
| | | | | | | 384,686,582 |
| Peru: 0.12% | | | | | | |
| Compania de Minas Buenaventura SA ADR (Materials, Metals & mining) † | | | | | 796,695 | 7,743,875 |
| Philippines: 0.53% | | | | | | |
| Ayala Corporation (Industrials, Industrial conglomerates) | | | | | 787,624 | 12,121,067 |
| San Miguel Food & Beverage Incorporated (Consumer staples, Food products) | | | | | 3,495,810 | 4,838,956 |
| SM Investments Corporation (Industrials, Industrial conglomerates) | | | | | 812,873 | 16,223,696 |
| | | | | | | 33,183,719 |
| Russia: 2.91% | | | | | | |
| Fix Price Group Limited GDR (Consumer discretionary, Specialty retail) † | | | | | 1,972,714 | 18,454,739 |
| Headhunter Group plc ADR (Industrials, Professional services) † | | | | | 350,160 | 14,388,074 |
| LUKOIL PJSC ADR (Energy, Oil, gas & consumable fuels) | | | | | 443,149 | 33,980,665 |
| Magnit PJSC (Consumer staples, Food & staples retailing) | | | | | 152,816 | 10,398,376 |
| Ozon Holdings plc ADR (Consumer discretionary, Internet & direct marketing retail) †« | | | | | 84,713 | 5,268,301 |
| Sberbank PJSC ADR (Financials, Banks) | | | | | 1,740,395 | 27,393,817 |
| Yandex NV Class A (Communication services, Interactive media & services) † | | | | | 1,092,406 | 71,607,213 |
| | | | | | | 181,491,185 |
| South Africa: 1.57% | | | | | | |
| AngloGold Ashanti Limited ADR (Materials, Metals & mining) | | | | | 178,308 | 3,669,579 |
| MTN Group Limited (Communication services, Wireless telecommunication services) † | | | | | 3,978,543 | 25,134,571 |
| Shoprite Holdings Limited (Consumer staples, Food & staples retailing) | | | | | 3,211,500 | 32,018,672 |
| Standard Bank Group Limited (Financials, Banks) | | | | | 2,007,090 | 16,332,128 |
| Tiger Brands Limited (Consumer staples, Food products) | | | | | 1,531,933 | 20,598,306 |
| | | | | | | 97,753,256 |
| South Korea: 10.65% | | | | | | |
| KT Corporation ADR (Communication services, Diversified telecommunication services) | | | | | 4,384,713 | 55,247,384 |
| KT&G Corporation (Consumer staples, Tobacco) | | | | | 320,091 | 23,711,510 |
| Naver Corporation (Communication services, Interactive media & services) | | | | | 367,000 | 118,610,599 |
| Samsung Electronics Company Limited (Information technology, Technology hardware, storage & peripherals) | | | | | 4,832,800 | 354,091,071 |
The accompanying notes are an integral part of these financial statements.
10 | Wells Fargo Emerging Markets Equity Fund
Portfolio of investments—April 30, 2021 (unaudited)
| | | | | | Shares | Value |
| South Korea: (continued) | | | | | | |
| Samsung Life Insurance Company Limited (Financials, Insurance) | | | | | 642,337 | $ 47,178,436 |
| SK Hynix Incorporated (Information technology, Semiconductors & semiconductor equipment) | | | | | 568,500 | 65,418,259 |
| | | | | | | 664,257,259 |
| Taiwan: 11.36% | | | | | | |
| 104 Corporation (Industrials, Professional services) | | | | | 1,655,000 | 10,013,067 |
| Mediatek Incorporated (Information technology, Semiconductors & semiconductor equipment) | | | | | 3,419,881 | 143,370,173 |
| President Chain Store Corporation (Consumer staples, Food & staples retailing) | | | | | 2,800,000 | 27,062,318 |
| Taiwan Semiconductor Manufacturing Company Limited (Information technology, Semiconductors & semiconductor equipment) | | | | | 7,605,224 | 160,163,028 |
| Taiwan Semiconductor Manufacturing Company Limited ADR (Information technology, Semiconductors & semiconductor equipment) | | | | | 2,277,552 | 265,881,420 |
| Uni-President Enterprises Corporation (Consumer staples, Food products) | | | | | 38,062,368 | 101,948,394 |
| | | | | | | 708,438,400 |
| Thailand: 1.43% | | | | | | |
| PTT Exploration & Production plc (Energy, Oil, gas & consumable fuels) | | | | | 1,933,139 | 7,387,990 |
| PTT plc (Energy, Oil, gas & consumable fuels) | | | | | 16,859,000 | 21,657,487 |
| Siam Commercial Bank plc (Financials, Banks) | | | | | 8,405,100 | 28,343,171 |
| Thai Beverage PCL (Consumer staples, Beverages) | | | | | 58,927,000 | 31,660,947 |
| | | | | | | 89,049,595 |
| Turkey: 0.07% | | | | | | |
| Avivasa Emeklilik Ve Hayat AS (Financials, Insurance) | | | | | 1,901,979 | 4,231,853 |
| United Kingdom: 0.16% | | | | | | |
| Standard Chartered plc (Financials, Banks) | | | | | 1,364,444 | 9,791,159 |
| Total Common stocks (Cost $3,274,681,338) | | | | | | 5,693,719,195 |
| | | Interest
rate | Maturity
date | | Principal | |
| Convertible debentures: 0.00% | | | | | | |
| Brazil: 0.00% | | | | | | |
| Lupatech SA (Energy, Energy equipment & services) ♦† | | 6.50% | 4-15-2022 | | $ 303,000 | 0 |
| Total Convertible debentures (Cost $160,691) | | | | | | 0 |
| | | Dividend
yield | | | Shares | |
| Preferred stocks: 1.16% | | | | | | |
| Brazil: 1.16% | | | | | | |
| Lojas Americanas SA (Consumer discretionary, Multiline retail) | | 1.06 | | | 18,787,917 | 72,148,811 |
| Total Preferred stocks (Cost $80,223,642) | | | | | | 72,148,811 |
The accompanying notes are an integral part of these financial statements.
Wells Fargo Emerging Markets Equity Fund | 11
Portfolio of investments—April 30, 2021 (unaudited)
| | | Yield | | | Shares | Value |
| Short-term investments: 8.36% | | | | | | |
| Investment companies: 8.36% | | | | | | |
| Securities Lending Cash Investments LLC ♠∩∞ | | 0.03% | | | 64,189,200 | $ 64,189,200 |
| Wells Fargo Government Money Market Fund Select Class ♠∞ | | 0.03 | | | 457,298,126 | 457,298,126 |
| Total Short-term investments (Cost $521,487,326) | | | | | | 521,487,326 |
| Total investments in securities (Cost $3,876,552,997) | 100.82% | | | | | 6,287,355,332 |
| Other assets and liabilities, net | (0.82) | | | | | (51,358,551) |
| Total net assets | 100.00% | | | | | $6,235,996,781 |
| † | Non-income-earning security |
| 144A | The security may be resold in transactions exempt from registration, normally to qualified institutional buyers, pursuant to Rule 144A under the Securities Act of 1933. |
| ♦ | The security is fair valued in accordance with procedures approved by the Board of Trustees. |
| « | All or a portion of this security is on loan. |
| ♠ | The issuer of the security is an affiliate of the Fund as defined in the Investment Company Act of 1940. |
| ∩ | The investment is a non-registered investment company purchased with cash collateral received from securities on loan. |
| ∞ | The rate represents the 7-day annualized yield at period end. |
| Abbreviations: |
| ADR | American depositary receipt |
| GDR | Global depositary receipt |
| REIT | Real estate investment trust |
Investments in affiliates
An affiliated investment is an investment in which the Fund owns at least 5% of the outstanding voting shares of the issuer or as a result of other relationships, such as the Fund and the issuer having the same investment manager. Transactions with issuers that were either affiliates of the Fund at the beginning of the period or the end of the period were as follows:
| | Value,
beginning of
period | Purchases | Sales
proceeds | Net
realized
gains
(losses) | | Net
change in
unrealized
gains
(losses) | | Value,
end of
period | | % of
net
assets | Shares,
end
of period | Income
from
affiliated
securities |
Short-term
investments | | | | | | | | | | | | |
Investment
companies | | | | | | | | | | | | |
| Securities Lending Cash Investments LLC | $ 20,105,794 | $299,783,122 | $(255,699,716) | $0 | | $0 | | $ 64,189,200 | | | 64,189,200 | $ 30,219# |
| Wells Fargo Government Money Market Fund Select Class | 199,808,582 | 757,846,177 | (500,356,633) | 0 | | 0 | | 457,298,126 | | | 457,298,126 | 63,658 |
| | | | | $0 | | $0 | | $521,487,326 | | 8.36% | | $93,877 |
| # | Amount shown represents income before fees and rebates. |
The accompanying notes are an integral part of these financial statements.
12 | Wells Fargo Emerging Markets Equity Fund
Statement of assets and liabilities—April 30, 2021 (unaudited)
| | |
| Assets | |
Investments in unaffiliated securities (including $60,948,826 of securities loaned), at value (cost $3,355,065,671)
| $ 5,765,868,006 |
Investments in affiliated securites, at value (cost $521,487,326)
| 521,487,326 |
Cash
| 574,448 |
Foreign currency, at value (cost $12,901,584)
| 11,887,591 |
Receivable for Fund shares sold
| 11,213,470 |
Receivable for dividends
| 4,737,293 |
Receivable for investments sold
| 4,036,529 |
Receivable for securities lending income, net
| 72,542 |
Prepaid expenses and other assets
| 182,172 |
Total assets
| 6,320,059,377 |
| Liabilities | |
Payable upon receipt of securities loaned
| 64,188,700 |
Contingent tax liability
| 8,466,071 |
Management fee payable
| 5,421,076 |
Payable for Fund shares redeemed
| 3,950,489 |
Administration fees payable
| 673,469 |
Payable for investments purchased
| 309,506 |
Distribution fee payable
| 11,089 |
Trustees’ fees and expenses payable
| 1,966 |
Accrued expenses and other liabilities
| 1,040,230 |
Total liabilities
| 84,062,596 |
Total net assets
| $6,235,996,781 |
| Net assets consist of | |
Paid-in capital
| $ 3,975,316,694 |
Total distributable earnings
| 2,260,680,087 |
Total net assets
| $6,235,996,781 |
| Computation of net asset value and offering price per share | |
Net assets – Class A
| $ 264,101,043 |
Shares outstanding – Class A1
| 7,770,018 |
Net asset value per share – Class A
| $33.99 |
Maximum offering price per share – Class A2
| $36.06 |
Net assets – Class C
| $ 16,927,982 |
Shares outstanding – Class C1
| 598,708 |
Net asset value per share – Class C
| $28.27 |
Net assets – Class R6
| $ 576,110,415 |
Shares outstanding – Class R61
| 16,261,379 |
Net asset value per share – Class R6
| $35.43 |
Net assets – Administrator Class
| $ 92,546,694 |
Shares outstanding – Administrator Class1
| 2,571,402 |
Net asset value per share – Administrator Class
| $35.99 |
Net assets – Institutional Class
| $ 5,286,310,647 |
Shares outstanding – Institutional Class1
| 149,255,752 |
Net asset value per share – Institutional Class
| $35.42 |
| 1 | The Fund has an unlimited number of authorized shares |
| 2 | Maximum offering price is computed as 100/94.25 of net asset value. On investments of $50,000 or more, the offering price is reduced. |
The accompanying notes are an integral part of these financial statements.
Wells Fargo Emerging Markets Equity Fund | 13
Statement of operations—six months ended April 30, 2021 (unaudited)
| | |
| Investment income | |
Dividends (net of foreign withholdings taxes of $4,796,197)
| $ 32,145,126 |
Income from affiliated securities
| 725,149 |
Total investment income
| 32,870,275 |
| Expenses | |
Management fee
| 29,581,426 |
| Administration fees | |
Class A
| 268,140 |
Class C
| 18,703 |
Class R6
| 75,542 |
Administrator Class
| 57,362 |
Institutional Class
| 3,271,725 |
| Shareholder servicing fees | |
Class A
| 319,215 |
Class C
| 22,257 |
Administrator Class
| 109,563 |
| Distribution fee | |
Class C
| 66,726 |
Custody and accounting fees
| 222,218 |
Professional fees
| 30,859 |
Registration fees
| 50,993 |
Shareholder report expenses
| 224,528 |
Trustees’ fees and expenses
| 9,610 |
Other fees and expenses
| 56,492 |
Total expenses
| 34,385,359 |
| Less: Fee waivers and/or expense reimbursements | |
Fund-level
| (3,958) |
Class A
| (3,614) |
Class C
| (4) |
Administrator Class
| (345) |
Net expenses
| 34,377,438 |
Net investment loss
| (1,507,163) |
| Realized and unrealized gains (losses) on investments | |
Net realized gains on investments
| 38,216,231 |
Net change in unrealized gains (losses) on investments (net of decrease in contingent taxes of $(10,026,122))
| 1,125,056,787 |
Net realized and unrealized gains (losses) on investments
| 1,163,273,018 |
Net increase in net assets resulting from operations
| $1,161,765,855 |
The accompanying notes are an integral part of these financial statements.
14 | Wells Fargo Emerging Markets Equity Fund
Statement of changes in net assets
| | | | | |
| | Six months ended
April 30, 2021
(unaudited) | Year ended
October 31, 2020 |
| Operations | | | | |
Net investment income (loss)
| | $ (1,507,163) | | $ 19,314,250 |
Payment from affiliate
| | 0 | | 814,760 |
Net realized gains on investments
| | 38,216,231 | | 28,501,702 |
Net change in unrealized gains (losses) on investments
| | 1,125,056,787 | | 343,880,924 |
Net increase in net assets resulting from operations
| | 1,161,765,855 | | 392,511,636 |
| Distributions to shareholders from | | | | |
| Net investment income and net realized gains | | | | |
Class A
| | (153,789) | | (1,592,205) |
Class R6
| | (1,997,619) | | (3,433,287) |
Administrator Class
| | (99,238) | | (690,072) |
Institutional Class
| | (16,550,884) | | (37,764,049) |
Total distributions to shareholders
| | (18,801,530) | | (43,479,613) |
| Capital share transactions | Shares | | Shares | |
| Proceeds from shares sold | | | | |
Class A
| 719,930 | 23,262,186 | 865,603 | 22,093,065 |
Class C
| 48,538 | 1,345,156 | 62,810 | 1,341,561 |
Class R6
| 6,910,072 | 232,450,455 | 3,888,578 | 97,521,245 |
Administrator Class
| 343,755 | 12,208,614 | 466,599 | 12,164,727 |
Institutional Class
| 26,383,240 | 900,488,493 | 55,315,223 | 1,422,431,335 |
| | | 1,169,754,904 | | 1,555,551,933 |
| Reinvestment of distributions | | | | |
Class A
| 4,479 | 141,490 | 54,378 | 1,460,585 |
Class R6
| 50,522 | 1,661,164 | 89,034 | 2,487,612 |
Administrator Class
| 2,928 | 97,946 | 23,753 | 668,417 |
Institutional Class
| 498,950 | 16,405,460 | 1,335,293 | 37,308,081 |
| | | 18,306,060 | | 41,924,695 |
| Payment for shares redeemed | | | | |
Class A
| (636,005) | (20,799,566) | (2,247,714) | (55,922,187) |
Class C
| (331,396) | (8,529,442) | (579,377) | (12,172,959) |
Class R6
| (2,054,267) | (69,220,524) | (5,956,259) | (150,951,408) |
Administrator Class
| (322,650) | (11,194,862) | (1,900,708) | (50,457,674) |
Institutional Class
| (17,087,546) | (599,289,956) | (48,926,107) | (1,252,304,510) |
| | | (709,034,350) | | (1,521,808,738) |
Net increase in net assets resulting from capital share transactions
| | 479,026,614 | | 75,667,890 |
Total increase in net assets
| | 1,621,990,939 | | 424,699,913 |
| Net assets | | | | |
Beginning of period
| | 4,614,005,842 | | 4,189,305,929 |
End of period
| | $6,235,996,781 | | $ 4,614,005,842 |
The accompanying notes are an integral part of these financial statements.
Wells Fargo Emerging Markets Equity Fund | 15
Financial highlights
(For a share outstanding throughout each period)
| | | Year ended October 31 |
| Class A | Six months ended
April 30, 2021
(unaudited) | 2020 | 2019 | 2018 | 2017 | 2016 |
Net asset value, beginning of period
| $27.39 | $25.29 | $21.16 | $24.83 | $20.49 | $18.09 |
Net investment income (loss)
| (0.06) 1 | 0.00 2 | 0.10 | 0.07 | (0.03) 1 | 0.12 |
Payment from affiliate
| 0.00 | 0.00 2 | 0.00 | 0.00 | 0.00 | 0.00 |
Net realized and unrealized gains (losses) on investments
| 6.68 | 2.28 | 4.11 | (3.70) | 4.50 | 2.38 |
Total from investment operations
| 6.62 | 2.28 | 4.21 | (3.63) | 4.47 | 2.50 |
| Distributions to shareholders from | | | | | | |
Net investment income
| (0.02) | (0.18) | (0.08) | (0.04) | (0.13) | (0.10) |
Net asset value, end of period
| $33.99 | $27.39 | $25.29 | $21.16 | $24.83 | $20.49 |
Total return3
| 24.17% | 9.03% 4 | 19.95% | (14.65)% | 21.99% | 13.93% |
| Ratios to average net assets (annualized) | | | | | | |
Gross expenses
| 1.48% | 1.54% | 1.57% | 1.58% | 1.58% | 1.64% |
Net expenses
| 1.48% | 1.52% | 1.57% | 1.57% | 1.58% | 1.60% |
Net investment income (loss)
| (0.36)% | 0.13% | 0.43% | 0.38% | (0.13)% | 0.64% |
| Supplemental data | | | | | | |
Portfolio turnover rate
| 7% | 12% | 8% | 11% | 13% | 8% |
Net assets, end of period (000s omitted)
| $264,101 | $210,393 | $227,811 | $201,515 | $268,384 | $874,625 |
| 1 | Calculated based upon average shares outstanding |
| 2 | Amount is less than $0.005. |
| 3 | Total return calculations do not include any sales charges. Returns for periods of less than one year are not annualized. |
| 4 | During the year ended October 31, 2020, the Fund received a payment from an affiliate that had an impact of less than 0.005% on total return. See Note 4 in the Notes to Financial Statements for additional information. |
The accompanying notes are an integral part of these financial statements.
16 | Wells Fargo Emerging Markets Equity Fund
Financial highlights
(For a share outstanding throughout each period)
| | | Year ended October 31 |
| Class C | Six months ended
April 30, 2021
(unaudited) | 2020 | 2019 | 2018 | 2017 | 2016 |
Net asset value, beginning of period
| $22.86 | $21.09 | $17.71 | $20.92 | $17.28 | $15.28 |
Net investment loss
| (0.15) 1 | (0.14) 1 | (0.07) 1 | (0.08) 1 | (0.08) | (0.02) 1 |
Payment from affiliate
| 0.00 | 0.04 | 0.00 | 0.00 | 0.00 | 0.00 |
Net realized and unrealized gains (losses) on investments
| 5.56 | 1.87 | 3.45 | (3.13) | 3.72 | 2.02 |
Total from investment operations
| 5.41 | 1.77 | 3.38 | (3.21) | 3.64 | 2.00 |
Net asset value, end of period
| $28.27 | $22.86 | $21.09 | $17.71 | $20.92 | $17.28 |
Total return2
| 23.67% | 8.39% 3 | 19.09% | (15.34)% | 21.06% | 13.09% |
| Ratios to average net assets (annualized) | | | | | | |
Gross expenses
| 2.23% | 2.29% | 2.32% | 2.33% | 2.31% | 2.39% |
Net expenses
| 2.23% | 2.28% | 2.32% | 2.32% | 2.31% | 2.35% |
Net investment loss
| (1.12)% | (0.64)% | (0.37)% | (0.38)% | (0.43)% | (0.12)% |
| Supplemental data | | | | | | |
Portfolio turnover rate
| 7% | 12% | 8% | 11% | 13% | 8% |
Net assets, end of period (000s omitted)
| $16,928 | $20,149 | $29,484 | $49,103 | $69,845 | $71,900 |
| 1 | Calculated based upon average shares outstanding |
| 2 | Total return calculations do not include any sales charges. Returns for periods of less than one year are not annualized. |
| 3 | During the year ended October 31, 2020, the Fund received a payment from an affiliate which had a 0.18% impact on the total return. See Note 4 in the Notes to Financial Statements for additional information. |
The accompanying notes are an integral part of these financial statements.
Wells Fargo Emerging Markets Equity Fund | 17
Financial highlights
(For a share outstanding throughout each period)
| | | Year ended October 31 |
| Class R6 | Six months ended
April 30, 2021
(unaudited) | 2020 | 2019 | 2018 | 2017 | 2016 |
Net asset value, beginning of period
| $28.59 | $26.39 | $22.10 | $26.00 | $21.46 | $19.00 |
Net investment income
| 0.01 1 | 0.17 | 0.22 1 | 0.23 1 | 0.17 1 | 0.23 1 |
Net realized and unrealized gains (losses) on investments
| 6.97 | 2.33 | 4.27 | (3.92) | 4.59 | 2.46 |
Total from investment operations
| 6.98 | 2.50 | 4.49 | (3.69) | 4.76 | 2.69 |
| Distributions to shareholders from | | | | | | |
Net investment income
| (0.14) | (0.30) | (0.20) | (0.21) | (0.22) | (0.23) |
Net asset value, end of period
| $35.43 | $28.59 | $26.39 | $22.10 | $26.00 | $21.46 |
Total return2
| 24.45% | 9.49% | 20.50% | (14.33)% | 22.53% | 14.43% |
| Ratios to average net assets (annualized) | | | | | | |
Gross expenses
| 1.05% | 1.11% | 1.14% | 1.16% | 1.14% | 1.20% |
Net expenses
| 1.05% | 1.11% | 1.14% | 1.15% | 1.14% | 1.17% |
Net investment income
| 0.06% | 0.55% | 0.88% | 0.90% | 0.76% | 1.16% |
| Supplemental data | | | | | | |
Portfolio turnover rate
| 7% | 12% | 8% | 11% | 13% | 8% |
Net assets, end of period (000s omitted)
| $576,110 | $324,637 | $351,829 | $326,131 | $192,929 | $191,250 |
| 1 | Calculated based upon average shares outstanding |
| 2 | Returns for periods of less than one year are not annualized. |
The accompanying notes are an integral part of these financial statements.
18 | Wells Fargo Emerging Markets Equity Fund
Financial highlights
(For a share outstanding throughout each period)
| | | Year ended October 31 |
| Administrator Class | Six months ended
April 30, 2021
(unaudited) | 2020 | 2019 | 2018 | 2017 | 2016 |
Net asset value, beginning of period
| $29.01 | $26.50 | $22.18 | $26.08 | $21.53 | $18.99 |
Net investment income (loss)
| (0.05) 1 | 0.05 1 | 0.13 1 | 0.12 1 | 0.10 1 | 0.15 1 |
Payment from affiliate
| 0.00 | 0.31 | 0.00 | 0.00 | 0.00 | 0.00 |
Net realized and unrealized gains (losses) on investments
| 7.07 | 2.35 | 4.30 | (3.90) | 4.61 | 2.50 |
Total from investment operations
| 7.02 | 2.71 | 4.43 | (3.78) | 4.71 | 2.65 |
| Distributions to shareholders from | | | | | | |
Net investment income
| (0.04) | (0.20) | (0.11) | (0.12) | (0.16) | (0.11) |
Net asset value, end of period
| $35.99 | $29.01 | $26.50 | $22.18 | $26.08 | $21.53 |
Total return2
| 24.20% | 10.25% 3 | 20.09% | (14.57)% | 22.10% | 14.07% |
| Ratios to average net assets (annualized) | | | | | | |
Gross expenses
| 1.40% | 1.46% | 1.49% | 1.50% | 1.48% | 1.56% |
Net expenses
| 1.40% | 1.43% | 1.46% | 1.46% | 1.46% | 1.49% |
Net investment income (loss)
| (0.29)% | 0.20% | 0.54% | 0.48% | 0.42% | 0.76% |
| Supplemental data | | | | | | |
Portfolio turnover rate
| 7% | 12% | 8% | 11% | 13% | 8% |
Net assets, end of period (000s omitted)
| $92,547 | $73,888 | $104,869 | $103,740 | $144,421 | $160,657 |
| 1 | Calculated based upon average shares outstanding |
| 2 | Returns for periods of less than one year are not annualized. |
| 3 | During the year ended October 31, 2020, the Fund received a payment from an affiliate which had a 1.16% impact on the total return. See Note 4 in the Notes to Financial Statements for additional information. |
The accompanying notes are an integral part of these financial statements.
Wells Fargo Emerging Markets Equity Fund | 19
Financial highlights
(For a share outstanding throughout each period)
| | | Year ended October 31 |
| Institutional Class | Six months ended
April 30, 2021
(unaudited) | 2020 | 2019 | 2018 | 2017 | 2016 |
Net asset value, beginning of period
| $28.57 | $26.38 | $22.10 | $25.99 | $21.46 | $18.99 |
Net investment income (loss)
| (0.01) 1 | 0.14 | 0.19 | 0.19 | 0.19 1 | 0.20 1 |
Net realized and unrealized gains (losses) on investments
| 6.97 | 2.34 | 4.28 | (3.89) | 4.55 | 2.49 |
Total from investment operations
| 6.96 | 2.48 | 4.47 | (3.70) | 4.74 | 2.69 |
| Distributions to shareholders from | | | | | | |
Net investment income
| (0.11) | (0.29) | (0.19) | (0.19) | (0.21) | (0.22) |
Net asset value, end of period
| $35.42 | $28.57 | $26.38 | $22.10 | $25.99 | $21.46 |
Total return2
| 24.40% | 9.42% | 20.40% | (14.35)% | 22.42% | 14.40% |
| Ratios to average net assets (annualized) | | | | | | |
Gross expenses
| 1.15% | 1.21% | 1.25% | 1.25% | 1.23% | 1.31% |
Net expenses
| 1.15% | 1.18% | 1.19% | 1.19% | 1.20% | 1.22% |
Net investment income (loss)
| (0.04)% | 0.49% | 0.81% | 0.75% | 0.82% | 1.04% |
| Supplemental data | | | | | | |
Portfolio turnover rate
| 7% | 12% | 8% | 11% | 13% | 8% |
Net assets, end of period (000s omitted)
| $5,286,311 | $3,984,940 | $3,475,314 | $2,790,071 | $3,423,366 | $1,826,097 |
| 1 | Calculated based upon average shares outstanding |
| 2 | Returns for periods of less than one year are not annualized. |
The accompanying notes are an integral part of these financial statements.
20 | Wells Fargo Emerging Markets Equity Fund
Notes to financial statements (unaudited)
1. ORGANIZATION
Wells Fargo Funds Trust (the "Trust"), a Delaware statutory trust organized on March 10, 1999, is an open-end management investment company registered under the Investment Company Act of 1940, as amended (the "1940 Act"). As an investment company, the Trust follows the accounting and reporting guidance in Financial Accounting Standards Board ("FASB") Accounting Standards Codification Topic 946, Financial Services – Investment Companies. These financial statements report on the Wells Fargo Emerging Markets Equity Fund (the "Fund") which is a diversified series of the Trust.
On February 23, 2021, Wells Fargo & Company announced that it has entered into a definitive agreement to sell Wells Fargo Asset Management ("WFAM") to GTCR LLC and Reverence Capital Partners, L.P. WFAM is the trade name used by the asset management businesses of Wells Fargo & Company and includes Wells Fargo Funds Management, LLC, the investment manager to the Fund, Wells Capital Management Incorporated and Wells Fargo Asset Management (International) Limited, both registered investment advisers providing sub-advisory services to certain funds, and Wells Fargo Funds Distributor, LLC, the Fund's principal underwriter. As part of the transaction, Wells Fargo & Company will own a 9.9% equity interest and will continue to serve as an important client and distribution partner.
Consummation of the transaction will result in the automatic termination of the Fund's investment management agreement and subadvisory agreement. The Fund's Board of Trustees approved a new investment management and new subadvisory agreement and approved submitting the agreements to the Fund’s shareholders for approval at a special meeting of shareholders expected to be held on July 15, 2021. Shareholders of record of the Fund at the close of business on May 28, 2021 are entitled to vote at the meeting. If shareholders approve the new agreements, they would take effect upon the closing of the transaction. The transaction is expected to close in the second half of 2021, subject to customary closing conditions.
This shareholder report is not asking you for a proxy. A separate proxy statement with more detailed information about the transaction will be provided to Fund shareholders and should be reviewed carefully.
2. SIGNIFICANT ACCOUNTING POLICIES
The following significant accounting policies, which are consistently followed in the preparation of the financial statements of the Fund, are in conformity with U.S. generally accepted accounting principles which require management to make estimates and assumptions that affect the reported amounts of assets and liabilities, disclosure of contingent assets and liabilities at the date of the financial statements, and the reported amounts of income and expenses during the reporting period. Actual results could differ from those estimates.
Securities valuation
All investments are valued each business day as of the close of regular trading on the New York Stock Exchange (generally 4 p.m. Eastern Time), although the Fund may deviate from this calculation time under unusual or unexpected circumstances.
Equity securities that are listed on a foreign or domestic exchange or market are valued at the official closing price or, if none, the last sales price. If no sale occurs on the principal exchange or market that day, a fair value price will be determined in accordance with the Fund’s Valuation Procedures.
The values of securities denominated in foreign currencies are translated into U.S. dollars at rates provided by an independent foreign currency pricing source at a time each business day specified by the Wells Fargo Asset Management Pricing Committee at Wells Fargo Funds Management, LLC ("Funds Management").
Many securities markets and exchanges outside the U.S. close prior to the close of the New York Stock Exchange and therefore may not fully reflect trading or events that occur after the close of the principal exchange in which the foreign securities are traded, but before the close of the New York Stock Exchange. If such trading or events are expected to materially affect the value of such securities, then fair value pricing procedures approved by the Board of Trustees of the Fund are applied. These procedures take into account multiple factors including movements in U.S. securities markets after foreign exchanges close. Foreign securities that are fair valued under these procedures are categorized as Level 2 and the application of these procedures may result in transfers between Level 1 and Level 2. Depending on market activity, such fair valuations may be frequent. Such fair value pricing may result in net asset values that are higher or lower than net asset values based on the last reported sales price or latest quoted bid price. On April 30, 2021, such fair value pricing was used in pricing certain foreign securities.
Debt securities are valued at the evaluated bid price provided by an independent pricing service (e.g. taking into account various factors, including yields, maturities, or credit ratings) or, if a reliable price is not available, the quoted bid price from an independent broker-dealer.
Wells Fargo Emerging Markets Equity Fund | 21
Notes to financial statements (unaudited)
Forward foreign currency contracts are recorded at the forward rate provided by an independent foreign currency pricing source at a time each business day specified by the Wells Fargo Asset Management Pricing Committee.
Investments in registered open-end investment companies are valued at net asset value. Interests in non-registered investment companies that are redeemable at net asset value are fair valued normally at net asset value.
Investments which are not valued using any of the methods discussed above are valued at their fair value, as determined in good faith by the Board of Trustees. The Board of Trustees has established a Valuation Committee comprised of the Trustees and has delegated to it the authority to take any actions regarding the valuation of portfolio securities that the Valuation Committee deems necessary or appropriate, including determining the fair value of portfolio securities, unless the determination has been delegated to the Wells Fargo Asset Management Pricing Committee. The Board of Trustees retains the authority to make or ratify any valuation decisions or approve any changes to the Valuation Procedures as it deems appropriate. On a quarterly basis, the Board of Trustees receives reports on any valuation actions taken by the Valuation Committee or the Wells Fargo Asset Management Pricing Committee which may include items for ratification.
Foreign currency translation
The accounting records of the Fund are maintained in U.S. dollars. The values of other assets and liabilities denominated in foreign currencies are translated into U.S. dollars at rates provided by an independent foreign currency pricing source at a time each business day specified by the Wells Fargo Asset Management Pricing Committee. Purchases and sales of securities, and income and expenses are converted at the rate of exchange on the respective dates of such transactions. Net realized foreign exchange gains or losses arise from sales of foreign currencies, currency gains or losses realized between the trade and settlement dates on securities transactions, and the difference between the amounts of dividends, interest and foreign withholding taxes recorded and the U.S. dollar equivalent of the amounts actually paid or received. Net unrealized foreign exchange gains and losses arise from changes in the fair value of assets and liabilities other than investments in securities resulting from changes in exchange rates. The changes in net assets arising from changes in exchange rates of securities and the changes in net assets resulting from changes in market prices of securities are not separately presented. Such changes are included in net realized and unrealized gains or losses from investments.
Forward foreign currency contracts
A forward foreign currency contract is an agreement between two parties to purchase or sell a specific currency for an agreed-upon price at a future date. The Fund enters into forward foreign currency contracts to facilitate transactions in foreign-denominated securities and to attempt to minimize the risk to the Fund from adverse changes in the relationship between currencies. Forward foreign currency contracts are recorded at the forward rate and marked-to-market daily. When the contracts are closed, realized gains and losses arising from such transactions are recorded as realized gains or losses on forward foreign currency contracts. The Fund is subject to foreign currency risk and may be exposed to risks if the counterparties to the contracts are unable to meet the terms of their contracts or if the value of the foreign currency changes unfavorably. The Fund's maximum risk of loss from counterparty credit risk is the unrealized gains on the contracts. This risk may be mitigated if there is a master netting arrangement between the Fund and the counterparty.
Securities lending
The Fund may lend its securities from time to time in order to earn additional income in the form of fees or interest on securities received as collateral or the investment of any cash received as collateral. When securities are on loan, the Fund receives interest or dividends on those securities. Cash collateral received in connection with its securities lending transactions is invested in Securities Lending Cash Investments, LLC (the "Securities Lending Fund"). Investments in Securities Lending Fund are valued at the evaluated bid price provided by an independent pricing service. Income earned from investment in the Securities Lending Fund (net of fees and rebates), if any, is included in income from affiliated securities on the Statement of Operations.
In a securities lending transaction, the net asset value of the Fund is affected by an increase or decrease in the value of the securities loaned and by an increase or decrease in the value of the instrument in which collateral is invested. The amount of securities lending activity undertaken by the Fund fluctuates from time to time. The Fund has the right under the lending agreement to recover the securities from the borrower on demand. In the event of default or bankruptcy by the borrower, the Fund may be prevented from recovering the loaned securities or gaining access to the collateral or may experience delays or costs in doing so. In such an event, the terms of the agreement allow the unaffiliated securities lending agent to use the collateral to purchase replacement securities on behalf of the Fund or pay the Fund the market value of the loaned securities. The Fund bears the risk of loss with respect to depreciation of its investment of the cash collateral.
Security transactions and income recognition
Securities transactions are recorded on a trade date basis. Realized gains or losses are recorded on the basis of identified cost.
22 | Wells Fargo Emerging Markets Equity Fund
Notes to financial statements (unaudited)
Dividend income is recognized on the ex-dividend date, except for certain dividends from foreign securities, which are recorded as soon as the custodian verifies the ex-dividend date.
Interest income is accrued daily and bond discounts are accreted and premiums are amortized daily. To the extent debt obligations are placed on non-accrual status, any related interest income may be reduced by writing off interest receivables when the collection of all or a portion of interest has been determined to be doubtful based on consistently applied procedures and the fair value has decreased. If the issuer subsequently resumes interest payments or when the collectability of interest is reasonably assured, the debt obligation is removed from non-accrual status.
Income is recorded net of foreign taxes withheld where recovery of such taxes is not assured.
Distributions to shareholders
Distributions to shareholders from net investment income and any net realized gains are recorded on the ex-dividend date and paid at least annually. Such distributions are determined in accordance with income tax regulations and may differ from U.S. generally accepted accounting principles. Dividend sources are estimated at the time of declaration. The tax character of distributions is determined as of the Fund's fiscal year end. Therefore, a portion of the Fund's distributions made prior to the Fund’s fiscal year end may be categorized as a tax return of capital at year end.
Federal and other taxes
The Fund intends to continue to qualify as a regulated investment company by distributing substantially all of its investment company taxable income and any net realized capital gains (after reduction for capital loss carryforwards) sufficient to relieve it from all, or substantially all, federal income taxes. Accordingly, no provision for federal income taxes was required.
The Fund’s income and federal excise tax returns and all financial records supporting those returns for the prior three fiscal years are subject to examination by the federal and Delaware revenue authorities. Management has analyzed the Fund's tax positions taken on federal, state, and foreign tax returns for all open tax years and does not believe that there are any uncertain tax positions that require recognition of a tax liability.
As of April 30, 2021, the aggregate cost of all investments for federal income tax purposes was $3,904,052,787 and the unrealized gains (losses) consisted of:
| Gross unrealized gains | $2,699,833,117 |
| Gross unrealized losses | (316,530,572) |
| Net unrealized gains | $2,383,302,545 |
As of October 31, 2020, the Fund had capital loss carryforwards which consisted of $136,193,719 in long-term capital losses.
Class allocations
The separate classes of shares offered by the Fund differ principally in applicable sales charges, distribution, shareholder servicing, and administration fees. Class specific expenses are charged directly to that share class. Investment income, common fund-level expenses, and realized and unrealized gains (losses) on investments are allocated daily to each class of shares based on the relative proportion of net assets of each class.
3. FAIR VALUATION MEASUREMENTS
Fair value measurements of investments are determined within a framework that has established a fair value hierarchy based upon the various data inputs utilized in determining the value of the Fund’s investments. The three-level hierarchy gives the highest priority to unadjusted quoted prices in active markets for identical assets or liabilities (Level 1) and the lowest priority to unobservable inputs (Level 3). The Fund’s investments are classified within the fair value hierarchy based on the lowest level of input that is significant to the fair value measurement. The inputs are summarized into three broad levels as follows:
| ■ | Level 1 – quoted prices in active markets for identical securities |
| ■ | Level 2 – other significant observable inputs (including quoted prices for similar securities, interest rates, prepayment speeds, credit risk, etc.) |
| ■ | Level 3 – significant unobservable inputs (including the Fund’s own assumptions in determining the fair value of investments) |
The inputs or methodologies used for valuing investments in securities are not necessarily an indication of the risk associated with investing in those securities.
Wells Fargo Emerging Markets Equity Fund | 23
Notes to financial statements (unaudited)
The following is a summary of the inputs used in valuing the Fund’s assets and liabilities as of April 30, 2021:
| | Quoted prices
(Level 1) | Other significant
observable inputs
(Level 2) | Significant
unobservable inputs
(Level 3) | Total |
| Assets | | | | |
| Investments in: | | | | |
| Common stocks | | | | |
| Argentina | $ 16,834,622 | $ 0 | $0 | $ 16,834,622 |
| Brazil | 361,476,650 | 0 | 0 | 361,476,650 |
| Chile | 72,387,034 | 0 | 0 | 72,387,034 |
| China | 2,167,877,929 | 24,059,756 | 0 | 2,191,937,685 |
| Colombia | 14,938,063 | 0 | 0 | 14,938,063 |
| Hong Kong | 292,233,872 | 0 | 0 | 292,233,872 |
| India | 481,434,297 | 0 | 0 | 481,434,297 |
| Indonesia | 76,188,234 | 0 | 0 | 76,188,234 |
| Luxembourg | 5,661,855 | 0 | 0 | 5,661,855 |
| Mexico | 384,686,582 | 0 | 0 | 384,686,582 |
| Peru | 7,743,875 | 0 | 0 | 7,743,875 |
| Philippines | 33,183,719 | 0 | 0 | 33,183,719 |
| Russia | 181,491,185 | 0 | 0 | 181,491,185 |
| South Africa | 97,753,256 | 0 | 0 | 97,753,256 |
| South Korea | 664,257,259 | 0 | 0 | 664,257,259 |
| Taiwan | 275,894,487 | 432,543,913 | 0 | 708,438,400 |
| Thailand | 89,049,595 | 0 | 0 | 89,049,595 |
| Turkey | 4,231,853 | 0 | 0 | 4,231,853 |
| United Kingdom | 9,791,159 | 0 | 0 | 9,791,159 |
| Preferred stocks | | | | |
| Brazil | 72,148,811 | 0 | 0 | 72,148,811 |
| Convertible debentures | 0 | 0 | 0 | 0 |
| Short-term investments | | | | |
| Investment companies | 521,487,326 | 0 | 0 | 521,487,326 |
| Total assets | $5,830,751,663 | $456,603,669 | $0 | $6,287,355,332 |
Additional sector, industry or geographic detail, if any, is included in the Portfolio of Investments.
For the six months ended April 30, 2021, the Fund did not have any transfers into/out of Level 3.
4. TRANSACTIONS WITH AFFILIATES
Management fee
Funds Management, an indirect wholly owned subsidiary of Wells Fargo & Company ("Wells Fargo"), is the manager of the Fund and provides advisory and fund-level administrative services under an investment management agreement. Under the investment management agreement, Funds Management is responsible for, among other services, implementing the investment objectives and strategies of the Fund, supervising the subadviser and providing fund-level administrative services in connection with the Fund’s operations. As compensation for its services under the investment management agreement, Funds Management is entitled to receive a management fee at the following annual rate based on the Fund’s average daily net assets:
24 | Wells Fargo Emerging Markets Equity Fund
Notes to financial statements (unaudited)
| Average daily net assets | Management fee |
| First $1 billion | 1.050% |
| Next $1 billion | 1.025 |
| Next $2 billion | 1.000 |
| Next $1 billion | 0.975 |
| Next $3 billion | 0.965 |
| Next $2 billion | 0.955 |
| Over $10 billion | 0.945 |
For the six months ended April 30, 2021, the management fee was equivalent to an annual rate of 1.00% of the Fund’s average daily net assets.
Funds Management has retained the services of a subadviser to provide daily portfolio management to the Fund. The fee for subadvisory services is borne by Funds Management. Wells Capital Management Incorporated ("WellsCap"), an affiliate of Funds Management and an indirect wholly owned subsidiary of Wells Fargo, is the subadviser to the Fund and is entitled to receive a fee from Funds Management at an annual rate starting at 0.65% and declining to 0.45% as the average daily net assets of the Fund increase.
Administration fees
Under a class-level administration agreement, Funds Management provides class-level administrative services to the Fund, which includes paying fees and expenses for services provided by the transfer agent, sub-transfer agents, omnibus account servicers and record-keepers. As compensation for its services under the class-level administration agreement, Funds Management receives an annual fee which is calculated based on the average daily net assets of each class as follows:
| | Class-level
administration fee |
| Class A | 0.21% |
| Class C | 0.21 |
| Class R6 | 0.03 |
| Administrator Class | 0.13 |
| Institutional Class | 0.13 |
Waivers and/or expense reimbursements
Funds Management has contractually waived and/or reimbursed management and administration fees to the extent necessary to maintain certain net operating expense ratios for the Fund. When each class of the Fund has exceeded its expense cap, Funds Management has waived fees and/or reimbursed expenses from fund-level expenses on a proportionate basis and then from class specific expenses. When only certain classes exceed their expense caps, waivers and/or reimbursements are applied against class specific expenses before fund-level expenses. Funds Management has committed through February 28, 2022 to waive fees and/or reimburse expenses to the extent necessary to cap expenses. Prior to or after the commitment expiration date, the cap may be increased or the commitment to maintain the cap may be terminated only with the approval of the Board of Trustees. The contractual expense caps are as follows:
| | Expense ratio caps |
| Class A | 1.55% |
| Class C | 2.30 |
| Class R6 | 1.13 |
| Administrator Class | 1.42 |
| Institutional Class | 1.17 |
Wells Fargo Emerging Markets Equity Fund | 25
Notes to financial statements (unaudited)
Distribution fee
The Trust has adopted a distribution plan for Class C shares of the Fund pursuant to Rule 12b-1 under the 1940 Act. A distribution fee is charged to Class C shares and paid to Wells Fargo Funds Distributor, LLC ("Funds Distributor"), the principal underwriter, at an annual rate of 0.75% of the average daily net assets of Class C shares.
In addition, Funds Distributor is entitled to receive the front-end sales charge from the purchase of Class A shares and a contingent deferred sales charge on the redemption of certain Class A shares. Funds Distributor is also entitled to receive the contingent deferred sales charges from redemptions of Class C shares. For the six months ended April 30, 2021, Funds Distributor received $10,158 from the sale of Class A shares. No contingent deferred sales charges were incurred by Class A and Class C shares for the six months ended April 30, 2021.
Shareholder servicing fees
The Trust has entered into contracts with one or more shareholder servicing agents, whereby Class A, Class C, and Administrator Class of the Fund are charged a fee at an annual rate of 0.25% of the average daily net assets of each respective class. A portion of these total shareholder servicing fees were paid to affiliates of Wells Fargo.
Interfund transactions
The Fund may purchase or sell portfolio investment securities to certain other Wells Fargo affiliates pursuant to Rule 17a-7 under the 1940 Act and under procedures adopted by the Board of Trustees. The procedures have been designed to ensure that these interfund transactions, which do not incur broker commissions, are effected at current market prices.
Other transactions
On August 14, 2020, Class A, Class C, and Administrator Class of the Fund was reimbursed by Funds Management in the amount of $2,438, $778,933 and $33,389, respectively. The reimbursements were made in connection with resolving certain fee reimbursements.
5. INVESTMENT PORTFOLIO TRANSACTIONS
Purchases and sales of investments, excluding U.S. government obligations (if any) and short-term securities, for the six months ended April 30, 2021 were $558,825,876 and $345,694,997, respectively.
6. SECURITIES LENDING TRANSACTIONS
The Fund lends its securities through an unaffiliated securities lending agent and receives collateral in the form of cash or securities with a value at least equal to the value of the securities on loan. The value of the loaned securities is determined at the close of each business day and any increases or decreases in the required collateral are exchanged between the Fund and the counterparty on the next business day. Cash collateral received is invested in the Securities Lending Fund which seeks to provide a positive return compared to the daily Federal Funds Open Rate by investing in high-quality, U.S. dollar-denominated short-term money market instruments and is exempt from registration under Section 3(c)(7) of the 1940 Act. Securities Lending Fund is managed by Funds Management and is subadvised by WellsCap. Funds Management receives an advisory fee starting at 0.05% and declining to 0.01% as the average daily net assets of the Securities Lending Fund increase. All of the fees received by Funds Management are paid to WellsCap for its services as subadviser.
In the event of counterparty default or the failure of a borrower to return a loaned security, the Fund has the right to use the collateral to offset any losses incurred. As of April 30, 2021, the Fund had securities lending transactions with the following counterparties which are subject to offset:
26 | Wells Fargo Emerging Markets Equity Fund
Notes to financial statements (unaudited)
| Counterparty | Value of
securities on
loan | Collateral
received1 | Net amount |
| Bank of America Securities Incorporated | $ 632,212 | $ (632,212) | $0 |
| Barclays Capital Incorporated | 19,968,544 | (19,968,544) | 0 |
| Citigroup Global Markets Incorporated | 8,612,161 | (8,612,161) | 0 |
| Credit Suisse Securities (USA) LLC | 8,062,808 | (8,062,808) | 0 |
| Deutsche Bank Securities Incorporated | 4,827,900 | (4,827,900) | 0 |
| JPMorgan Securities LLC | 13,046,316 | (13,046,316) | 0 |
| UBS Securities LLC | 5,798,885 | (5,798,885) | 0 |
1 Collateral received within this table is limited to the collateral for the net transaction with the counterparty.
7. BANK BORROWINGS
The Trust (excluding the money market funds), Wells Fargo Master Trust and Wells Fargo Variable Trust are parties to a $350,000,000 revolving credit agreement whereby the Fund is permitted to use bank borrowings for temporary or emergency purposes, such as to fund shareholder redemption requests. Interest under the credit agreement is charged to the Fund based on a borrowing rate equal to the higher of the Federal Funds rate in effect on that day plus 1.25% or the overnight LIBOR rate in effect on that day plus 1.25%. In addition, an annual commitment fee equal to 0.25% of the unused balance is allocated to each participating fund.
For the six months ended April 30, 2021, there were no borrowings by the Fund under the agreement.
8. CONCENTRATION RISKS
As of the end of the period, the Fund concentrated its portfolio of investments in China and Hong Kong. A fund that invests a substantial portion of its assets in any country or geographic region will be more vulnerable than a fund that invests its assets more broadly to the economic, financial, political or other developments affecting that country or region. Such developments may have a significant impact on the Fund's investment performance causing such performance to be more volatile than the investment performance of a more geographically diversified fund.
9. INDEMNIFICATION
Under the Fund's organizational documents, the officers and Trustees have been granted certain indemnification rights against certain liabilities that may arise out of performance of their duties to the Fund. The Fund has entered into a separate agreement with each Trustee that converts indemnification rights currently existing under the Fund’s organizational documents into contractual rights that cannot be changed in the future without the consent of the Trustee. Additionally, in the normal course of business, the Fund may enter into contracts with service providers that contain a variety of indemnification clauses. The Fund’s maximum exposure under these arrangements is dependent on future claims that may be made against the Fund and, therefore, cannot be estimated.
10. CORONAVIRUS (COVID-19) PANDEMIC
On March 11, 2020, the World Health Organization announced that it had made the assessment that coronavirus disease 2019 (“COVID-19”) is a pandemic. The impacts of COVID-19 are affecting the entire global economy, individual companies and investment products, the funds, and the market in general. There is significant uncertainty around the extent and duration of business disruptions related to COVID-19 and the impacts may last for an extended period of time. COVID-19 has led to significant uncertainty and volatility in the financial markets.
Wells Fargo Emerging Markets Equity Fund | 27
Other information (unaudited)
TAX INFORMATION
Pursuant to Section 853 of the Internal Revenue Code, the following amounts have been designated as foreign taxes paid for the fiscal year ended October 31, 2020. These amounts may be less than the actual foreign taxes paid for financial statement purposes. Foreign taxes paid or withheld should be included in taxable income with an offsetting deduction from gross income or as a credit for taxes paid to foreign governments. None of the income was derived from ineligible foreign sources as defined under Section 901(j) of the Internal Revenue Code.
Creditable
foreign taxes
paid | Per share
amount | Foreign
income as % of
ordinary income
distributions |
| $8,272,032 | $0.0511 | 97.22% |
PROXY VOTING INFORMATION
A description of the policies and procedures used to determine how to vote proxies relating to portfolio securities is available without charge, upon request, by calling 1-800-222-8222, visiting our website at wfam.com, or visiting the SEC website at sec.gov. Information regarding how the proxies related to portfolio securities were voted during the most recent 12-month period ended June 30 is available on the website at wfam.com or by visiting the SEC website at sec.gov.
QUARTERLY PORTFOLIO HOLDINGS INFORMATION
The Fund files its complete schedule of portfolio holdings with the SEC for the first and third quarters of each fiscal year as an exhibit to its reports on Form N-PORT. Shareholders may view the filed Form N-PORT by visiting the SEC website at sec.gov.
28 | Wells Fargo Emerging Markets Equity Fund
Other information (unaudited)
BOARD OF TRUSTEES AND OFFICERS
Each of the Trustees and Officers listed in the table below acts in identical capacities for each fund in the Wells Fargo family of funds, which consists of 139 mutual funds comprising the Wells Fargo Funds Trust, Wells Fargo Variable Trust, Wells Fargo Master Trust and four closed-end funds (collectively the “Fund Complex”). This table should be read in conjunction with the Prospectus and the Statement of Additional Information1. The mailing address of each Trustee and Officer is 525 Market Street, 12th Floor, San Francisco, CA 94105. Each Trustee and Officer serves an indefinite term, however, each Trustee serves such term until reaching the mandatory retirement age established by the Trustees.
Independent Trustees
Name and
year of birth | Position held and
length of service* | Principal occupations during past five years or longer | Current other
public company or
investment
company
directorships |
William R. Ebsworth
(Born 1957) | Trustee,
since 2015 | Retired. From 1984 to 2013, equities analyst, portfolio manager, research director and chief investment officer at Fidelity Management and Research Company in Boston, Tokyo, and Hong Kong, and retired in 2013 as Chief Investment Officer of Fidelity Strategic Advisers, Inc. where he led a team of investment professionals managing client assets. Prior thereto, Board member of Hong Kong Securities Clearing Co., Hong Kong Options Clearing Corp., the Thailand International Fund, Ltd., Fidelity Investments Life Insurance Company, and Empire Fidelity Investments Life Insurance Company. Audit Committee Chair and Investment Committee Chair of the Vincent Memorial Hospital Endowment (non-profit organization). Mr. Ebsworth is a CFA® charterholder. | N/A |
Jane A. Freeman
(Born 1953) | Trustee,
since 2015;
Chair Liaison,
since 2018 | Retired. From 2012 to 2014 and 1999 to 2008, Chief Financial Officer of Scientific Learning Corporation. From 2008 to 2012, Ms. Freeman provided consulting services related to strategic business projects. Prior to 1999, Portfolio Manager at Rockefeller & Co. and Scudder, Stevens & Clark. Board member of the Harding Loevner Funds from 1996 to 2014, serving as both Lead Independent Director and chair of the Audit Committee. Board member of the Russell Exchange Traded Funds Trust from 2011 to 2012 and the chair of the Audit Committee. Ms. Freeman is also an inactive Chartered Financial Analyst. | N/A |
Isaiah Harris, Jr.
(Born 1952) | Trustee,
since 2009; Audit
Committee
Chair,
since 2019 | Retired. Chairman of the Board of CIGNA Corporation since 2009, and Director since 2005. From 2003 to 2011, Director of Deluxe Corporation. Prior thereto, President and CEO of BellSouth Advertising and Publishing Corp. from 2005 to 2007, President and CEO of BellSouth Enterprises from 2004 to 2005 and President of BellSouth Consumer Services from 2000 to 2003. Emeritus member of the Iowa State University Foundation Board of Governors. Emeritus Member of the Advisory Board of Iowa State University School of Business. Advisory Board Member, Palm Harbor Academy (private school). Mr. Harris is a certified public accountant (inactive status). | CIGNA Corporation |
Judith M. Johnson
(Born 1949) | Trustee,
since 2008 | Retired. Prior thereto, Chief Executive Officer and Chief Investment Officer of Minneapolis Employees Retirement Fund from 1996 to 2008. Ms. Johnson is an attorney, certified public accountant and a certified managerial accountant. | N/A |
David F. Larcker
(Born 1950) | Trustee,
since 2009 | James Irvin Miller Professor of Accounting at the Graduate School of Business (Emeritus), Stanford University, Director of the Corporate Governance Research Initiative and Senior Faculty of The Rock Center for Corporate Governance since 2006. From 2005 to 2008, Professor of Accounting at the Graduate School of Business, Stanford University. Prior thereto, Ernst & Young Professor of Accounting at The Wharton School, University of Pennsylvania from 1985 to 2005. | N/A |
Wells Fargo Emerging Markets Equity Fund | 29
Other information (unaudited)
Name and
year of birth | Position held and
length of service* | Principal occupations during past five years or longer | Current other
public company or
investment
company
directorships |
Olivia S. Mitchell
(Born 1953) | Trustee,
since 2006;
Nominating and
Governance
Committee Chair,
since 2018 | International Foundation of Employee Benefit Plans Professor, Wharton School of the University of Pennsylvania since 1993. Director of Wharton’s Pension Research Council and Boettner Center on Pensions & Retirement Research, and Research Associate at the National Bureau of Economic Research. Previously, Cornell University Professor from 1978 to 1993. | N/A |
Timothy J. Penny
(Born 1951) | Trustee,
since 1996;
Chair,
since 2018 | President and Chief Executive Officer of Southern Minnesota Initiative Foundation, a non-profit organization, since 2007. Member of the Board of Trustees of NorthStar Education Finance, Inc., a non-profit organization, since 2007. | N/A |
James G. Polisson
(Born 1959) | Trustee,
since 2018 | Retired. Chief Marketing Officer, Source (ETF) UK Services, Ltd, from 2015 to 2017. From 2012 to 2015, Principal of The Polisson Group, LLC, a management consulting, corporate advisory and principal investing company. Chief Executive Officer and Managing Director at Russell Investments, Global Exchange Traded Funds from 2010 to 2012. Managing Director of Barclays Global Investors from 1998 to 2010 and Global Chief Marketing Officer for iShares and Barclays Global Investors from 2000 to 2010. Trustee of the San Francisco Mechanics’ Institute, a non-profit organization, from 2013 to 2015. Board member of the Russell Exchange Traded Fund Trust from 2011 to 2012. Director of Barclays Global Investors Holdings Deutschland GmbH from 2006 to 2009. Mr. Polisson is an attorney and has a retired status with the Massachusetts and District of Columbia Bar Associations. | N/A |
Pamela Wheelock
(Born 1959) | Trustee,
since January
2020; previously
Trustee from
January 2018 to
July 2019 | Board member of the Destination Medical Center Economic Development Agency, Rochester, Minnesota since 2019. Interim President of the McKnight Foundation from January to September 2020. Acting Commissioner, Minnesota Department of Human Services, July 2019 through September 2019. Human Services Manager (part-time), Minnesota Department of Human Services, October 2019 through December 2019. Chief Operating Officer, Twin Cities Habitat for Humanity from 2017 to 2019. Vice President of University Services, University of Minnesota from 2012 to 2016. Prior thereto, on the Board of Directors, Governance Committee and Finance Committee for the Minnesota Philanthropy Partners (Saint Paul Foundation) from 2012 to 2018, Interim Chief Executive Officer of Blue Cross Blue Shield of Minnesota from 2011 to 2012, Chairman of the Board from 2009 to 2012 and Board Director from 2003 to 2015. Vice President, Leadership and Community Engagement, Bush Foundation, Saint Paul, Minnesota (a private foundation) from 2009 to 2011. Executive Vice President and Chief Financial Officer, Minnesota Sports and Entertainment from 2004 to 2009 and Senior Vice President from 2002 to 2004. Executive Vice President of the Minnesota Wild Foundation from 2004 to 2008. Commissioner of Finance, State of Minnesota, from 1999 to 2002. Currently Board Chair of the Minnesota Wild Foundation since 2010. | N/A |
* Length of service dates reflect the Trustee’s commencement of service with the Trust’s predecessor entities, where applicable.
30 | Wells Fargo Emerging Markets Equity Fund
Other information (unaudited)
Officers
Name and
year of birth | Position held and
length of service | Principal occupations during past five years or longer |
Andrew Owen
(Born 1960) | President,
since 2017 | Executive Vice President of Wells Fargo & Company and Head of Affiliated Managers, Wells Fargo Asset Management, since 2014. In addition, Mr. Owen is currently President, Chief Executive Officer and Director of Wells Fargo Funds Management, LLC since 2017. Prior thereto, Executive Vice President responsible for marketing, investments and product development for Wells Fargo Funds Management, LLC, from 2009 to 2014. |
Jeremy DePalma
(Born 1974) | Treasurer,
since 2012
(for certain funds in
the Fund Complex);
since 2021 (for
the remaining funds in the
Fund Complex) | Senior Vice President of Wells Fargo Funds Management, LLC since 2009. Senior Vice President of Evergreen Investment Management Company, LLC from 2008 to 2010 and head of the Fund Reporting and Control Team within Fund Administration from 2005 to 2010. |
Michelle Rhee
(Born 1966) | Chief Legal Officer,
since 2019 | Secretary of Wells Fargo Funds Management, LLC and Chief Legal Counsel of Wells Fargo Asset Management since 2018. Deputy General Counsel of Wells Fargo Bank, N.A. since 2020 and Assistant General Counsel of Wells Fargo Bank, N.A. from 2018 to 2020. Associate General Counsel and Managing Director of Bank of America Corporation from 2004 to 2018. |
Catherine Kennedy
(Born 1969) | Secretary,
since 2019 | Vice President of Wells Fargo Funds Management, LLC and Senior Counsel of the Wells Fargo Legal Department since 2010. Vice President and Senior Counsel of Evergreen Investment Management Company, LLC from 1998 to 2010. |
Michael H. Whitaker
(Born 1967) | Chief Compliance Officer,
since 2016 | Chief Compliance Officer of Wells Fargo Asset Management since 2016. Senior Vice President and Chief Compliance Officer for Fidelity Investments from 2007 to 2016. |
1 The Statement of Additional Information includes additional information about the Trustees and is available, without charge, upon request, by calling 1-800-222-8222 or by visiting the website at wfam.com.
Wells Fargo Emerging Markets Equity Fund | 31
For more information
More information about Wells Fargo Funds is available free upon request. To obtain literature, please write, visit the Fund's website, or call:
Wells Fargo Funds
P.O. Box 219967
Kansas City, MO 64121-9967
Website: wfam.com
Individual investors: 1-800-222-8222
Retail investment professionals: 1-888-877-9275
Institutional investment professionals: 1-866-765-0778
This report and the financial statements contained herein are submitted for the general information of the shareholders of the Fund. If this report is used for promotional purposes, distribution of the report must be accompanied or preceded by a current prospectus. Before investing, please consider the investment objectives, risks, charges, and expenses of the investment. For a current prospectus and, if available, a summary prospectus, containing this information, call 1-800-222-8222 or visit the Fund's website at wfam.com. Read the prospectus carefully before you invest or send money.
Wells Fargo Asset Management (WFAM) is the trade name for certain investment advisory/management firms owned by Wells Fargo & Company. These firms include but are not limited to Wells Capital Management Incorporated and Wells Fargo Funds Management, LLC. Certain products managed by WFAM entities are distributed by Wells Fargo Funds Distributor, LLC (a broker-dealer and Member FINRA).
This material is for general informational and educational purposes only and is NOT intended to provide investment advice or a recommendation of any kind - including a recommendation for any specific investment, strategy, or plan.
INVESTMENT PRODUCTS: NOT FDIC INSURED ■ NO BANK GUARANTEE ■ MAY LOSE VALUE
© 2021 Wells Fargo & Company. All rights reserved.
PAR-0521-00321 06-21
SA238/SAR238 04-21
Semi-Annual Report
April 30, 2021
Wells Fargo Emerging
Markets Equity Income Fund
Reduce clutter.
Save trees.
Sign up for electronic delivery of prospectuses and shareholder reports at wellsfargo.com/ advantagedelivery
The views expressed and any forward-looking statements are as of April 30, 2021, unless otherwise noted, and are those of the Fund's portfolio managers and/or Wells Fargo Asset Management. Discussions of individual securities or the markets generally are not intended as individual recommendations. Future events or results may vary significantly from those expressed in any forward-looking statements. The views expressed are subject to change at any time in response to changing circumstances in the market. Wells Fargo Asset Management and the Fund disclaim any obligation to publicly update or revise any views expressed or forward-looking statements.
INVESTMENT PRODUCTS: NOT FDIC INSURED ■ NO BANK GUARANTEE ■ MAY LOSE VALUE
Wells Fargo Emerging Markets Equity Income Fund | 1
Letter to shareholders (unaudited)
Andrew Owen
President
Wells Fargo Funds
Dear Shareholder:
We are pleased to offer you this semi-annual report for the Wells Fargo Emerging Markets Equity Income Fund for the six-month period that ended April 30, 2021. Global stocks continued to rally as the global economy continued to work through the haze of COVID-19. Tailwinds were provided by global stimulus programs, a rapid vaccination rollout, and recovering consumer and corporate sentiment. Bonds were mixed during the period, with global bonds, municipal bonds, and high-yield bonds delivering positive returns.
For the six-month period, U.S. stocks, based on the S&P 500 Index,1 gained 28.85%. International stocks, as measured by the MSCI ACWI ex USA Index (Net),2 returned 27.40%, while the MSCI EM Index (Net),3 trailed its developed market counterparts with a 22.95% gain. Among bond indexes, the Bloomberg Barclays U.S. Aggregate Bond Index,4 returned -1.52%, the Bloomberg Barclays Global Aggregate ex-USD Index (unhedged),5 returned 0.68%, the Bloomberg Barclays Municipal Bond Index,6 returned 2.62%, and the ICE BofA U.S. High Yield Index,7 returned 8.12%.
Hope drove the stock markets to new highs.
Global stocks rallied in November, propelled by optimism over three promising COVID-19 vaccines. Reversing recent trends, value stocks outperformed growth stocks and cyclical stocks outpaced information technology (IT) stocks. However, U.S. unemployment remained elevated, with a net job loss of 10 million since February. The eurozone services Purchasing Managers’ Index, a monthly survey of purchasing managers, contracted sharply while the region’s manufacturing activity grew. The U.S. election results added to the upbeat mood as investors anticipated more consistent policies in the new administration.
Financial markets ended the year with strength on high expectations for a rapid rollout of the COVID-19 vaccines, the successful passage of a $900 billion stimulus package, and rising expectations of additional economic support from a Democratic-led Congress. U.S. economic data were mixed with still-elevated unemployment and weak retail sales but growth in manufacturing output. In contrast, China’s economic expansion continued in both manufacturing and nonmanufacturing. U.S. COVID-19 infection rates continued to rise even as new state and local lockdown measures were implemented.
“Global stocks rallied in November, propelled by optimism over three promising COVID-19 vaccines.”
| 1 | The S&P 500 Index consists of 500 stocks chosen for market size, liquidity, and industry group representation. It is a market-value-weighted index with each stock's weight in the index proportionate to its market value. You cannot invest directly in an index. |
| 2 | The Morgan Stanley Capital International (MSCI) All Country World Index (ACWI) ex USA Index (Net) is a free-float-adjusted market-capitalization-weighted index that is designed to measure the equity market performance of developed and emerging markets, excluding the United States. Source: MSCI. MSCI makes no express or implied warranties or representations and shall have no liability whatsoever with respect to any MSCI data contained herein. The MSCI data may not be further redistributed or used as a basis for other indices or any securities or financial products. This report is not approved, reviewed, or produced by MSCI. You cannot invest directly in an index. |
| 1 | The S&P 500 Index consists of 500 stocks chosen for market size, liquidity, and industry group representation. It is a market-value-weighted index with each stock's weight in the index proportionate to its market value. You cannot invest directly in an index. |
| 3 | The MSCI Emerging Markets (EM) Index (Net) is a free-float-adjusted market-capitalization-weighted index that is designed to measure equity market performance of emerging markets. You cannot invest directly in an index. |
| 1 | The S&P 500 Index consists of 500 stocks chosen for market size, liquidity, and industry group representation. It is a market-value-weighted index with each stock's weight in the index proportionate to its market value. You cannot invest directly in an index. |
| 4 | The Bloomberg Barclays U.S. Aggregate Bond Index is a broad-based benchmark that measures the investment-grade, U.S. dollar-denominated, fixed-rate taxable bond market, including Treasuries, government-related and corporate securities, mortgage-backed securities (agency fixed-rate and hybrid adjustable-rate mortgage pass-throughs), asset-backed securities, and commercial mortgage-backed securities. You cannot invest directly in an index. |
| 1 | The S&P 500 Index consists of 500 stocks chosen for market size, liquidity, and industry group representation. It is a market-value-weighted index with each stock's weight in the index proportionate to its market value. You cannot invest directly in an index. |
| 5 | The Bloomberg Barclays Global Aggregate ex-USD Index (unhedged) is an unmanaged index that provides a broad-based measure of the global investment-grade fixed-income markets excluding the U.S. dollar-denominated debt market. You cannot invest directly in an index. |
| 1 | The S&P 500 Index consists of 500 stocks chosen for market size, liquidity, and industry group representation. It is a market-value-weighted index with each stock's weight in the index proportionate to its market value. You cannot invest directly in an index. |
| 6 | The Bloomberg Barclays Municipal Bond Index is an unmanaged index composed of long-term tax-exempt bonds with a minimum credit rating of Baa. You cannot invest directly in an index. |
| 1 | The S&P 500 Index consists of 500 stocks chosen for market size, liquidity, and industry group representation. It is a market-value-weighted index with each stock's weight in the index proportionate to its market value. You cannot invest directly in an index. |
| 7 | The ICE BofA U.S. High Yield Index is a market-capitalization-weighted index of domestic and Yankee high-yield bonds. The index tracks the performance of high-yield securities traded in the U.S. bond market. You cannot invest directly in an index. Copyright 2021. ICE Data Indices, LLC. All rights reserved. |
2 | Wells Fargo Emerging Markets Equity Income Fund
Letter to shareholders (unaudited)
The calendar year 2021 began with emerging market stocks leading all major asset classes in January, driven by China’s strong economic growth and a broad recovery in corporate earnings, which propelled China’s stock market higher. In the U.S., positive news on vaccine trials and January's expansion in both the manufacturing and services sectors were offset by a weak December monthly jobs report. This was compounded by technical factors as some hedge funds were forced to sell stocks to protect themselves against a well-publicized short squeeze coordinated by a group of retail investors. Eurozone sentiment and economic growth were particularly weak, reflecting the impact of a new lockdown with stricter social distancing along with a slow vaccine rollout.
February saw major domestic equity indexes driven higher on the hope of a new stimulus bill, improving COVID-19 vaccination numbers, and the gradual reopening of the economy. Most S&P 500 companies reported better-than-expected earnings, with positive surprises coming from the financials, IT, health care, and materials sectors. Japan saw its economy strengthen as a result of strong export numbers. Meanwhile, crude-oil prices continued their climb, rising more than 25% for the year. Domestic government bonds experienced a sharp sell-off in late February as markets priced in a more robust economic recovery and higher future growth and inflation expectations.
The passage of the massive domestic stimulus bill highlighted March activity, leading to increased forecasts for U.S. growth in 2021. Domestic employment surged as COVID-19 vaccinations and an increasingly open economy spurred hiring. A majority of U.S. small companies reported they were operating at pre-pandemic capacity or higher. Value continued its outperformance of growth in the month, continuing the trend that started in late 2020. Meanwhile, most major developed global equity indexes were up month to date on the back of rising optimism regarding the outlook for global growth. While the U.S. and the U.K. have been the most successful in terms of the vaccine rollout, even within markets where the vaccine has lagged, such as the eurozone and Japan, equity indexes in many of those countries are also in positive territory this year.
Equity markets produced another strong showing in April. Domestically, the continued reopening of the economy had a strong impact on positive equity performance as people started leaving their households and jobless claims continued to fall. Domestic corporate bonds performed well and the U.S. dollar weakened. Meanwhile, the U.S. government continued to seek to invest in the recovery, this time by outlining a package of over $2 billion to improve infrastructure. The primary headwind in April was inflation, as investors tried to determine the breadth and longevity of recent price increases. Developed Europe has been supported by a meaningful increase in the pace of vaccinations. Unfortunately many emerging market countries have not been as successful. India in particular has seen COVID-19 cases surge, serving as an example of the need to get vaccinations rolled out to less developed nations.
Don’t let short-term uncertainty derail long-term investment goals.
Periods of investment uncertainty can present challenges, but experience has taught us that maintaining long-term investment goals can be an effective way to plan for the future. Although diversification cannot guarantee an investment profit or prevent losses, we believe it can be an effective way to manage investment risk and potentially smooth out overall portfolio performance. We encourage investors to know their investments and to understand that appropriate levels of risk-taking may unlock opportunities.
Thank you for choosing to invest with Wells Fargo Funds. We appreciate your confidence in us and remain committed to helping you meet your financial needs.
Sincerely,
Andrew Owen
President
Wells Fargo Funds
“The passage of the massive domestic stimulus bill highlighted March activity, leading to increased forecasts for U.S. growth in 2021.”
For further information about your Fund, contact your investment professional, visit our website at wfam.com, or call us directly at 1-800-222-8222.
Wells Fargo Emerging Markets Equity Income Fund | 3
Performance highlights (unaudited)
| Investment objective | The Fund seeks long-term capital appreciation and current income. |
| Manager | Wells Fargo Funds Management, LLC |
| Subadviser | Wells Capital Management Incorporated |
| Portfolio managers | Alison Shimada, Elaine Tse |
| | |
| Average annual total returns (%) as of April 30, 2021 | |
| | | Including sales charge | | Excluding sales charge | | Expense ratios1 (%) |
| | Inception date | 1 year | 5 year | Since
inception | | 1 year | 5 year | Since
inception | | Gross | Net 2 |
| Class A (EQIAX) | 5-31-2012 | 36.42 | 6.80 | 5.34 | | 44.80 | 8.06 | 6.04 | | 1.66 | 1.55 |
| Class C (EQICX) | 5-31-2012 | 42.73 | 7.25 | 5.25 | | 43.73 | 7.25 | 5.25 | | 2.41 | 2.30 |
| Class R (EQIHX)3 | 9-30-2015 | – | – | – | | 44.77 | 7.85 | 5.81 | | 1.91 | 1.80 |
| Class R6 (EQIRX)4 | 9-30-2015 | – | – | – | | 45.34 | 8.53 | 6.49 | | 1.23 | 1.17 |
| Administrator Class (EQIDX) | 5-31-2012 | – | – | – | | 44.90 | 8.24 | 6.23 | | 1.58 | 1.45 |
| Institutional Class (EQIIX) | 5-31-2012 | – | – | – | | 45.19 | 8.46 | 6.44 | | 1.33 | 1.22 |
| MSCI EM Index (Net)5 | – | – | – | – | | 48.71 | 12.50 | 7.04 * | | – | – |
| MSCI EM High Dividend Yield Index (Net)6 | – | – | – | – | | 30.02 | 8.09 | 3.48 * | | – | – |
Figures quoted represent past performance, which is no guarantee of future results, and do not reflect taxes that a shareholder may pay on an investment in a fund. Investment return and principal value of an investment will fluctuate so that an investor’s shares, when redeemed, may be worth more or less than their original cost. Performance shown without sales charges would be lower if sales charges were reflected. Current performance may be lower or higher than the performance data quoted, which assumes the reinvestment of dividends and capital gains. Current month-end performance is available on the Fund’s website, wfam.com.
Please keep in mind that high double-digit returns were primarily achieved during favorable market conditions. You should not expect that such favorable returns can be consistently achieved. A fund’s performance, especially for short time periods, should not be the sole factor in making your investment decision.
Index returns do not include transaction costs associated with buying and selling securities, any mutual fund fees or expenses, or any taxes. It is not possible to invest directly in an index.
For Class A shares, the maximum front-end sales charge is 5.75%. For Class C shares, the maximum contingent deferred sales charge is 1.00%. Performance including a contingent deferred sales charge assumes the sales charge for the corresponding time period. Class R, Class R6, Administrator Class, and Institutional Class shares are sold without a front-end sales charge or contingent deferred sales charge.
| * | Based on the inception date of the oldest Fund class. |
| 1 | Reflects the expense ratios as stated in the most recent prospectuses. The expense ratios shown are subject to change and may differ from the annualized expense ratios shown in the financial highlights of this report. |
| 2 | The manager has contractually committed through February 28, 2022, to waive fees and/or reimburse expenses to the extent necessary to cap total annual fund operating expenses after fee waivers at 1.55% for Class A, 2.30% for Class C, 1.80% for Class R, 1.17% for Class R6, 1.45% for Administrator Class, and 1.22% for Institutional Class. Brokerage commissions, stamp duty fees, interest, taxes, acquired fund fees and expenses (if any), and extraordinary expenses are excluded from the expense caps. Prior to or after the commitment expiration date, the caps may be increased or the commitment to maintain the caps may be terminated only with the approval of the Board of Trustees. Without these caps, the Fund’s returns would have been lower. The expense ratio paid by an investor is the net expense ratio (the total annual fund operating expenses after fee waivers) as stated in the prospectuses. |
| 3 | Historical performance shown for the Class R shares prior to their inception reflects the performance of the Administrator Class shares, adjusted to reflect the higher expenses applicable to the Class R shares. |
| 4 | Historical performance shown for the Class R6 shares prior to their inception reflects the performance of the Institutional Class shares and includes the higher expenses applicable to the Institutional Class shares. If these expenses had not be included, returns for the Class R6 shares would have been higher. |
| 5 | The Morgan Stanley Capital International (MSCI) Emerging Markets (EM) Index (Net) is a free-float-adjusted market-capitalization-weighted index that is designed to measure the equity market performance of emerging markets. Source: MSCI. MSCI makes no express or implied warranties or representations and shall have no liability whatsoever with respect to any MSCI data contained herein. The MSCI data may not be further redistributed or used as a basis for other indices or any securities or financial products. This report is not approved, reviewed, or produced by MSCI. You cannot invest directly in an index. |
4 | Wells Fargo Emerging Markets Equity Income Fund
Performance highlights (unaudited)
| 6 | The MSCI EM High Dividend Yield Index (Net) is based on the MSCI EM Index, its parent index, and includes large and mid-cap stocks. The index is designed to reflect the performance of equities in the parent index (excluding REITs) with higher dividend income and quality characteristics than average dividend yields that are both sustainable and persistent. The index also applies quality screens and reviews 12-month past performance to omit stocks with potentially deteriorating fundamentals that could force them to cut or reduce dividends. You cannot invest directly in an index. |
Stock values fluctuate in response to the activities of individual companies and general market and economic conditions. Foreign investments are especially volatile and can rise or fall dramatically due to differences in the political and economic conditions of the host country. These risks are generally intensified in emerging markets. The use of derivatives may reduce returns and/or increase volatility. Certain investment strategies tend to increase the total risk of an investment (relative to the broader market). The Fund is exposed to smaller-company securities risk. Consult the Fund’s prospectus for additional information on these and other risks.
| Ten largest holdings (%) as of April 30, 20211 |
| Taiwan Semiconductor Manufacturing Company Limited | 6.81 |
| Samsung Electronics Company Limited | 4.94 |
| China Construction Bank Class H | 2.11 |
| Ping An Insurance Group Company Class H | 2.05 |
| Samsung Electronics Company Limited | 1.90 |
| Midea Group Company Limited Class A | 1.87 |
| Infosys Limited | 1.70 |
| KB Financial Group Incorporated | 1.43 |
| Baidu Incorporated ADR | 1.43 |
| SK Hynix Incorporated | 1.39 |
| 1 | Figures represent the percentage of the Fund's net assets. Holdings are subject to change and may have changed since the date specified. |
| Sector allocation as of April 30, 20211 |
| 1 | Figures represent the percentage of the Fund's long-term investments. These amounts are subject to change and may have changed since the date specified. |
| Country allocation as of April 30, 20211 |
| 1 | Figures represent the percentage of the Fund's long-term investments. These amounts are subject to change and may have changed since the date specified. |
Wells Fargo Emerging Markets Equity Income Fund | 5
Fund expenses (unaudited)
As a shareholder of the Fund, you incur two types of costs: (1) transaction costs, including sales charges (loads) on purchase payments and contingent deferred sales charges (if any) on redemptions and (2) ongoing costs, including management fees, distribution (12b-1) and/or shareholder servicing fees, and other Fund expenses. This example is intended to help you understand your ongoing costs (in dollars) of investing in the Fund and to compare these costs with the ongoing costs of investing in other mutual funds.
The example is based on an investment of $1,000 invested at the beginning of the six-month period and held for the entire period from November 1, 2020 to April 30, 2021.
Actual expenses
The “Actual” line of the table below provides information about actual account values and actual expenses. You may use the information in this line, together with the amount you invested, to estimate the expenses that you paid over the period. Simply divide your account value by $1,000 (for example, an $8,600 account value divided by $1,000 = 8.6), then multiply the result by the number in the “Actual” line under the heading entitled “Expenses paid during period” for your applicable class of shares to estimate the expenses you paid on your account during this period.
Hypothetical example for comparison purposes
The “Hypothetical” line of the table below provides information about hypothetical account values and hypothetical expenses based on the Fund’s actual expense ratio and an assumed rate of return of 5% per year before expenses, which is not the Fund’s actual return. The hypothetical account values and expenses may not be used to estimate the actual ending account balance or expenses you paid for the period. You may use this information to compare the ongoing costs of investing in the Fund and other funds. To do so, compare this 5% hypothetical example with the 5% hypothetical examples that appear in the shareholder reports of the other funds.
Please note that the expenses shown in the table are meant to highlight your ongoing costs only and do not reflect any transactional costs, such as sales charges (loads) and contingent deferred sales charges. Therefore, the “Hypothetical” line of the table is useful in comparing ongoing costs only and will not help you determine the relative total costs of owning different funds. In addition, if these transactional costs were included, your costs would have been higher.
| | Beginning
account value
11-1-2020 | Ending
account value
4-30-2021 | Expenses
paid during
the period1 | Annualized net
expense ratio |
| Class A | | | | |
| Actual | $1,000.00 | $1,279.14 | $ 8.70 | 1.54% |
| Hypothetical (5% return before expenses) | $1,000.00 | $1,017.16 | $ 7.70 | 1.54% |
| Class C | | | | |
| Actual | $1,000.00 | $1,274.43 | $12.97 | 2.30% |
| Hypothetical (5% return before expenses) | $1,000.00 | $1,013.39 | $11.48 | 2.30% |
| Class R | | | | |
| Actual | $1,000.00 | $1,276.66 | $10.16 | 1.80% |
| Hypothetical (5% return before expenses) | $1,000.00 | $1,015.87 | $ 9.00 | 1.80% |
| Class R6 | | | | |
| Actual | $1,000.00 | $1,281.57 | $ 6.45 | 1.14% |
| Hypothetical (5% return before expenses) | $1,000.00 | $1,019.14 | $ 5.71 | 1.14% |
| Administrator Class | | | | |
| Actual | $1,000.00 | $1,279.22 | $ 8.19 | 1.45% |
| Hypothetical (5% return before expenses) | $1,000.00 | $1,017.60 | $ 7.25 | 1.45% |
| Institutional Class | | | | |
| Actual | $1,000.00 | $1,280.41 | $ 6.90 | 1.22% |
| Hypothetical (5% return before expenses) | $1,000.00 | $1,018.74 | $ 6.11 | 1.22% |
1 Expenses paid is equal to the annualized net expense ratio of each class multiplied by the average account value over the period, multiplied by the number of days in the most recent fiscal half-year divided by the number of days in the fiscal year (to reflect the one-half-year period).
6 | Wells Fargo Emerging Markets Equity Income Fund
Portfolio of investments—April 30, 2021 (unaudited)
| | | | | | Shares | Value |
| Common stocks: 93.17% | | | | | | |
| Brazil: 4.05% | | | | | | |
| Ambev SA (Consumer staples, Beverages) | | | | | 629,900 | $ 1,732,441 |
| B3 Brasil Bolsa Balcao SA (Financials, Capital markets) | | | | | 196,600 | 1,863,919 |
| Banco BTG Pactual SA (Financials, Diversified financial services) | | | | | 160,143 | 3,176,592 |
| Cury Construtora e Incorporadora SA (Consumer discretionary, Household durables) | | | | | 979,195 | 1,771,981 |
| Petrobras Distribuidora SA (Consumer discretionary, Specialty retail) | | | | | 492,600 | 2,041,297 |
| Vale SA (Materials, Metals & mining) | | | | | 218,074 | 4,376,695 |
| Vinci Partners Investments Limited Class A (Financials, Capital markets) † | | | | | 119,618 | 1,327,760 |
| | | | | | | 16,290,685 |
| Cambodia: 0.38% | | | | | | |
| NagaCorp Limited (Consumer discretionary, Hotels, restaurants & leisure) | | | | | 1,440,000 | 1,542,377 |
| Chile: 0.45% | | | | | | |
| Banco Santander Chile SA (Financials, Banks) | | | | | 32,721,998 | 1,795,559 |
| China: 26.71% | | | | | | |
| Baidu Incorporated ADR (Communication services, Interactive media & services) † | | | | | 27,246 | 5,730,651 |
| China Construction Bank Class H (Financials, Banks) | | | | | 10,737,000 | 8,500,859 |
| China International Capital Corporation Limited Class H (Financials, Capital markets) 144A† | | | | | 1,455,200 | 3,656,851 |
| China Merchants Bank Company Limited Class H (Financials, Banks) | | | | | 498,500 | 4,020,601 |
| China Resources Land Limited (Real estate, Real estate management & development) | | | | | 1,058,000 | 4,964,642 |
| China Yongda Automobile Service Holding Company (Consumer discretionary, Specialty retail) | | | | | 1,788,500 | 3,241,876 |
| ENN Energy Holdings Limited (Utilities, Gas utilities) | | | | | 239,500 | 4,082,237 |
| Gree Electric Appliances Incorporated Class A (Consumer discretionary, Household durables) | | | | | 484,140 | 4,481,933 |
| Huayu Automotive Systems Company Limited Class A (Consumer discretionary, Auto components) | | | | | 418,000 | 1,687,114 |
| Inner Mongolia Yili Industrial Group Company Limited Class A (Consumer staples, Food products) | | | | | 292,678 | 1,851,992 |
| Kunlun Energy Company Limited (Utilities, Gas utilities) | | | | | 4,012,000 | 4,307,564 |
| Lenovo Group Limited (Information technology, Technology hardware, storage & peripherals) | | | | | 3,496,000 | 4,806,705 |
| Lomon Billions Group Company Limited (Materials, Chemicals) | | | | | 462,175 | 2,417,465 |
| Midea Group Company Limited Class A (Consumer discretionary, Household durables) | | | | | 605,359 | 7,499,286 |
| Minth Group Limited (Consumer discretionary, Auto components) | | | | | 484,000 | 1,965,846 |
| Nari Technology Company Limited (Industrials, Electrical equipment) | | | | | 611,568 | 3,022,166 |
| Netease Incorporated (Communication services, Entertainment) | | | | | 189,050 | 4,263,984 |
| Nine Dragons Paper Holdings Limited (Materials, Paper & forest products) | | | | | 1,121,000 | 1,541,280 |
| Ping An Insurance Group Company Class H (Financials, Insurance) | | | | | 755,500 | 8,262,331 |
| Sands China Limited (Consumer discretionary, Hotels, restaurants & leisure) † | | | | | 680,400 | 3,232,179 |
| Shimao Property Holding Limited (Real estate, Real estate management & development) | | | | | 1,361,500 | 3,943,710 |
| Suofeiya Home Collection Company Limited Class A (Consumer discretionary, Household durables) | | | | | 509,091 | 2,290,772 |
| Tingyi Holding Corporation (Consumer staples, Food products) | | | | | 2,204,000 | 3,966,647 |
| Topsports International Holdings Limited (Consumer discretionary, Specialty retail) 144A | | | | | 2,396,000 | 3,238,776 |
The accompanying notes are an integral part of these financial statements.
Wells Fargo Emerging Markets Equity Income Fund | 7
Portfolio of investments—April 30, 2021 (unaudited)
| | | | | | Shares | Value |
| China: (continued) | | | | | | |
| Universal Scientific Industrial Shanghai Company Limited Class A (Information technology, Electronic equipment, instruments & components) | | | | | 772,900 | $ 1,934,788 |
| Weichai Power Company Limited Class H (Industrials, Machinery) | | | | | 1,441,000 | 3,342,901 |
| Xinjiang Goldwind Science & Technology Company Limited (Industrials, Electrical equipment) | | | | | 892,000 | 1,469,872 |
| Zhejiang NHU Company Limited (Health care, Biotechnology) | | | | | 616,599 | 3,726,367 |
| | | | | | | 107,451,395 |
| Hong Kong: 4.78% | | | | | | |
| ASM Pacific Technology (Information technology, Semiconductors & semiconductor equipment) | | | | | 234,600 | 3,557,772 |
| Bosideng International Holdings Limited (Consumer discretionary, Textiles, apparel & luxury goods) | | | | | 4,654,000 | 2,366,618 |
| China Merchants Port Holdings Company Limited (Industrials, Transportation infrastructure) | | | | | 2,142,000 | 3,435,914 |
| Chow Tai Fook Jewellery Company Limited (Consumer discretionary, Specialty retail) | | | | | 2,397,600 | 3,870,607 |
| Hong Kong Exchanges & Clearing Limited (Financials, Capital markets) | | | | | 47,300 | 2,861,961 |
| WH Group Limited (Consumer staples, Food products) 144A | | | | | 3,603,000 | 3,149,480 |
| | | | | | | 19,242,352 |
| India: 9.62% | | | | | | |
| Embassy Office Parks REIT (Real estate, Equity REITs) | | | | | 881,000 | 3,718,106 |
| Gail India Limited (Utilities, Gas utilities) | | | | | 2,345,195 | 4,343,862 |
| Hero Motorcorp Limited (Consumer discretionary, Automobiles) | | | | | 65,065 | 2,476,331 |
| Indus Towers Limited (Communication services, Diversified telecommunication services) | | | | | 527,579 | 1,798,423 |
| Infosys Limited (Information technology, IT services) | | | | | 372,734 | 6,815,111 |
| LIC Housing Finance Limited (Financials, Diversified financial services) | | | | | 1,002,575 | 5,491,170 |
| Mahanagar Gas Limited (Utilities, Gas utilities) | | | | | 274,683 | 4,173,135 |
| Manappuram Finance Limited (Financials, Consumer finance) | | | | | 1,769,810 | 3,561,243 |
| Power Grid Corporation of India Limited (Utilities, Electric utilities) | | | | | 1,104,843 | 3,282,199 |
| Tech Mahindra Limited (Information technology, IT services) | | | | | 233,247 | 3,024,205 |
| | | | | | | 38,683,785 |
| Indonesia: 1.18% | | | | | | |
| PT Bank Rakyat Indonesia Tbk (Financials, Banks) | | | | | 7,691,800 | 2,156,579 |
| PT Telekomunikasi Indonesia Persero Tbk (Communication services, Diversified telecommunication services) | | | | | 11,694,700 | 2,590,726 |
| | | | | | | 4,747,305 |
| Malaysia: 0.44% | | | | | | |
| RHB Bank Bhd (Financials, Banks) | | | | | 1,392,800 | 1,771,431 |
| Mexico: 1.41% | | | | | | |
| America Movil SAB de CV ADR (Communication services, Wireless telecommunication services) | | | | | 125,228 | 1,745,678 |
| Grupo Financiero Banorte SAB de CV (Financials, Banks) | | | | | 334,500 | 1,899,303 |
| Walmart de Mexico SAB de CV (Consumer staples, Food & staples retailing) | | | | | 619,391 | 2,031,206 |
| | | | | | | 5,676,187 |
| Peru: 1.08% | | | | | | |
| Southern Copper Corporation (Materials, Metals & mining) | | | | | 62,735 | 4,354,436 |
The accompanying notes are an integral part of these financial statements.
8 | Wells Fargo Emerging Markets Equity Income Fund
Portfolio of investments—April 30, 2021 (unaudited)
| | | | | | Shares | Value |
| Philippines: 0.45% | | | | | | |
| International Container Terminal Services Incorporated (Industrials, Transportation infrastructure) | | | | | 676,630 | $ 1,825,425 |
| Poland: 0.55% | | | | | | |
| PKO Bank Polski SA (Financials, Banks) † | | | | | 236,757 | 2,201,999 |
| Qatar: 0.65% | | | | | | |
| Qatar National Bank (Financials, Banks) | | | | | 534,231 | 2,626,403 |
| Russia: 4.12% | | | | | | |
| Detsky Mir PJSC (Consumer discretionary, Multiline retail) | | | | | 1,122,660 | 2,242,111 |
| Fix Price Group Limited GDR (Consumer discretionary, Specialty retail) † | | | | | 205,295 | 1,920,535 |
| LUKOIL PJSC ADR (Energy, Oil, gas & consumable fuels) | | | | | 40,496 | 3,105,233 |
| Moscow Exchange MICEX-RTS PJSC (Financials, Capital markets) | | | | | 1,325,340 | 3,118,115 |
| Rosneft Oil Company PJSC (Energy, Oil, gas & consumable fuels) | | | | | 314,980 | 2,196,683 |
| Sberbank PJSC ADR (Financials, Banks) | | | | | 252,753 | 3,978,332 |
| | | | | | | 16,561,009 |
| Saudi Arabia: 1.72% | | | | | | |
| Jarir Marketing Company (Consumer discretionary, Specialty retail) | | | | | 54,464 | 2,890,069 |
| National Commercial Bank (Financials, Banks) † | | | | | 267,142 | 4,046,095 |
| | | | | | | 6,936,164 |
| Singapore: 0.78% | | | | | | |
| BOC Aviation Limited (Industrials, Trading companies & distributors) 144A | | | | | 346,000 | 3,122,476 |
| South Africa: 4.55% | | | | | | |
| Gold Fields Limited ADR (Materials, Metals & mining) | | | | | 265,938 | 2,494,498 |
| Life Healthcare Group Holdings Limited (Health care, Health care providers & services) † | | | | | 1,691,075 | 2,220,174 |
| MTN Group Limited (Communication services, Wireless telecommunication services) † | | | | | 455,426 | 2,877,168 |
| Naspers Limited (Consumer discretionary, Internet & direct marketing retail) | | | | | 17,390 | 3,969,525 |
| Standard Bank Group Limited (Financials, Banks) | | | | | 457,047 | 3,719,091 |
| The Bidvest Group Limited (Industrials, Industrial conglomerates) | | | | | 259,863 | 3,001,169 |
| | | | | | | 18,281,625 |
| South Korea: 11.96% | | | | | | |
| Doosan Bobcat Incorporated (Industrials, Machinery) † | | | | | 83,900 | 3,443,192 |
| Kangwon Land Incorporated (Consumer discretionary, Hotels, restaurants & leisure) † | | | | | 90,811 | 2,065,463 |
| KB Financial Group Incorporated (Financials, Banks) | | | | | 116,905 | 5,748,823 |
| Kia Motors Corporation (Consumer discretionary, Automobiles) | | | | | 31,546 | 2,183,703 |
| POSCO (Materials, Metals & mining) | | | | | 8,334 | 2,727,178 |
| Samsung Electronics Company Limited (Information technology, Technology hardware, storage & peripherals) | | | | | 271,335 | 19,880,256 |
| Samsung Fire & Marine Insurance Company Limited (Financials, Insurance) | | | | | 15,341 | 2,730,721 |
| SK Hynix Incorporated (Information technology, Semiconductors & semiconductor equipment) | | | | | 48,432 | 5,573,152 |
| SK Telecom Company Limited (Communication services, Wireless telecommunication services) | | | | | 13,707 | 3,739,897 |
| | | | | | | 48,092,385 |
The accompanying notes are an integral part of these financial statements.
Wells Fargo Emerging Markets Equity Income Fund | 9
Portfolio of investments—April 30, 2021 (unaudited)
| | | | | | Shares | Value |
| Taiwan: 15.29% | | | | | | |
| Advantech Company Limited (Information technology, Technology hardware, storage & peripherals) | | | | | 159,000 | $ 2,011,804 |
| ASE Technology Holding Company Limited (Information technology, Semiconductors & semiconductor equipment) | | | | | 716,000 | 2,991,976 |
| ASMedia Technology Incorporated (Information technology, Semiconductors & semiconductor equipment) | | | | | 47,000 | 1,953,874 |
| CTBC Financial Holding Company Limited (Financials, Banks) | | | | | 2,592,000 | 2,109,477 |
| Giant Manufacturing Company Limited (Consumer discretionary, Leisure products) | | | | | 155,000 | 1,968,320 |
| Hon Hai Precision Industry Company Limited (Information technology, Electronic equipment, instruments & components) | | | | | 851,704 | 3,501,394 |
| Lite-On Technology Corporation (Information technology, Technology hardware, storage & peripherals) | | | | | 947,000 | 2,146,105 |
| Mediatek Incorporated (Information technology, Semiconductors & semiconductor equipment) | | | | | 76,000 | 3,186,115 |
| Novatek Microelectronics Corporation Limited (Information technology, Semiconductors & semiconductor equipment) | | | | | 114,000 | 2,515,153 |
| Quanta Computer Incorporated (Information technology, Technology hardware, storage & peripherals) | | | | | 1,013,000 | 3,545,501 |
| Simplo Technology Company Limited (Information technology, Electronic equipment, instruments & components) | | | | | 189,000 | 2,516,665 |
| Taiwan Semiconductor Manufacturing Company Limited (Information technology, Semiconductors & semiconductor equipment) | | | | | 1,300,000 | 27,377,489 |
| Unimicron Technology Corporation (Information technology, Electronic equipment, instruments & components) | | | | | 876,000 | 3,577,462 |
| Uni-President Enterprises Corporation (Consumer staples, Food products) | | | | | 777,000 | 2,081,161 |
| | | | | | | 61,482,496 |
| Thailand: 2.49% | | | | | | |
| Bangkok Bank PCL (Financials, Banks) | | | | | 898,500 | 3,505,990 |
| Thai Beverage PCL (Consumer staples, Beverages) | | | | | 3,247,200 | 1,744,691 |
| Tisco Financial Group PCL (Financials, Diversified financial services) | | | | | 956,700 | 2,842,063 |
| WHA Corporation PCL (Real estate, Real estate management & development) | | | | | 17,793,500 | 1,931,498 |
| | | | | | | 10,024,242 |
| United Arab Emirates: 0.51% | | | | | | |
| Aldar Properties PJSC (Real estate, Real estate management & development) | | | | | 2,171,524 | 2,069,462 |
| Total Common stocks (Cost $272,656,641) | | | | | | 374,779,198 |
| | | Dividend
yield | | | | |
| Preferred stocks: 3.46% | | | | | | |
| Brazil: 0.52% | | | | | | |
| Itaúsa SA (Financials, Banks) | | 2.53% | | | 1,131,119 | 2,094,800 |
| South Korea: 2.94% | | | | | | |
| LG Chem Limited (Materials, Chemicals) | | 2.29 | | | 10,441 | 4,181,656 |
| Samsung Electronics Company Limited (Information technology, Technology hardware, storage & peripherals) | | 0.97 | | | 115,884 | 7,636,353 |
| | | | | | | 11,818,009 |
| Total Preferred stocks (Cost $9,239,290) | | | | | | 13,912,809 |
The accompanying notes are an integral part of these financial statements.
10 | Wells Fargo Emerging Markets Equity Income Fund
Portfolio of investments—April 30, 2021 (unaudited)
| | | Yield | | | Shares | Value |
| Short-term investments: 1.44% | | | | | | |
| Investment companies: 1.44% | | | | | | |
| Wells Fargo Government Money Market Fund Select Class ♠∞ | | 0.03% | | | 5,792,079 | $ 5,792,079 |
| Total Short-term investments (Cost $5,792,079) | | | | | | 5,792,079 |
| Total investments in securities (Cost $287,688,010) | 98.07% | | | | | 394,484,086 |
| Other assets and liabilities, net | 1.93 | | | | | 7,768,180 |
| Total net assets | 100.00% | | | | | $402,252,266 |
| † | Non-income-earning security |
| 144A | The security may be resold in transactions exempt from registration, normally to qualified institutional buyers, pursuant to Rule 144A under the Securities Act of 1933. |
| ♠ | The issuer of the security is an affiliate of the Fund as defined in the Investment Company Act of 1940. |
| ∞ | The rate represents the 7-day annualized yield at period end. |
| Abbreviations: |
| ADR | American depositary receipt |
| GDR | Global depositary receipt |
| REIT | Real estate investment trust |
Investments in affiliates
An affiliated investment is an investment in which the Fund owns at least 5% of the outstanding voting shares of the issuer or as a result of other relationships, such as the Fund and the issuer having the same investment manager. Transactions with issuers that were either affiliates of the Fund at the beginning of the period or the end of the period were as follows:
| | Value,
beginning of
period | Purchases | Sales
proceeds | Net
realized
gains
(losses) | Net
change in
unrealized
gains
(losses) | Value,
end of
period | % of
net
assets | Shares,
end
of period | Income
from
affiliated
securities |
| Short-term investments | | | | | | | | | |
| Investment companies | | | | | | | | | |
| Wells Fargo Government Money Market Fund Select Class | $13,498,167 | $112,179,219 | $(119,885,307) | $0 | $0 | $5,792,079 | 1.44% | 5,792,079 | $1,422 |
The accompanying notes are an integral part of these financial statements.
Wells Fargo Emerging Markets Equity Income Fund | 11
Statement of assets and liabilities—April 30, 2021 (unaudited)
| | |
| Assets | |
Investments in unaffiliated securities, at value (cost $281,895,931)
| $ 388,692,007 |
Investments in affiliated securites, at value (cost $5,792,079)
| 5,792,079 |
Foreign currency, at value (cost $4,013,998)
| 4,023,322 |
Receivable for investments sold
| 4,190,337 |
Receivable for Fund shares sold
| 3,972,703 |
Receivable for dividends
| 719,393 |
Prepaid expenses and other assets
| 19,030 |
Total assets
| 407,408,871 |
| Liabilities | |
Payable for investments purchased
| 4,435,869 |
Management fee payable
| 339,643 |
Payable for Fund shares redeemed
| 247,220 |
Administration fees payable
| 49,029 |
Distribution fees payable
| 5,929 |
Trustees’ fees and expenses payable
| 1,968 |
Accrued expenses and other liabilities
| 76,947 |
Total liabilities
| 5,156,605 |
Total net assets
| $402,252,266 |
| Net assets consist of | |
Paid-in capital
| $ 342,198,957 |
Total distributable earnings
| 60,053,309 |
Total net assets
| $402,252,266 |
| Computation of net asset value and offering price per share | |
Net assets – Class A
| $ 101,469,469 |
Shares outstanding – Class A1
| 7,708,914 |
Net asset value per share – Class A
| $13.16 |
Maximum offering price per share – Class A2
| $13.96 |
Net assets – Class C
| $ 8,847,411 |
Shares outstanding – Class C1
| 676,513 |
Net asset value per share – Class C
| $13.08 |
Net assets – Class R
| $ 133,381 |
Shares outstanding – Class R1
| 10,103 |
Net asset value per share – Class R
| $13.20 |
Net assets – Class R6
| $ 51,724,858 |
Shares outstanding – Class R61
| 3,927,419 |
Net asset value per share – Class R6
| $13.17 |
Net assets – Administrator Class
| $ 2,618,161 |
Shares outstanding – Administrator Class1
| 197,254 |
Net asset value per share – Administrator Class
| $13.27 |
Net assets – Institutional Class
| $ 237,458,986 |
Shares outstanding – Institutional Class1
| 17,999,768 |
Net asset value per share – Institutional Class
| $13.19 |
| 1 | The Fund has an unlimited number of authorized shares |
| 2 | Maximum offering price is computed as 100/94.25 of net asset value. On investments of $50,000 or more, the offering price is reduced. |
The accompanying notes are an integral part of these financial statements.
12 | Wells Fargo Emerging Markets Equity Income Fund
Statement of operations—six months ended April 30, 2021 (unaudited)
| | |
| Investment income | |
Dividends (net of foreign withholdings taxes of $685,140)
| $ 4,609,352 |
Income from affiliated securities
| 1,422 |
Total investment income
| 4,610,774 |
| Expenses | |
Management fee
| 2,151,393 |
| Administration fees | |
Class A
| 105,731 |
Class C
| 9,690 |
Class R
| 132 |
Class R6
| 9,543 |
Administrator Class
| 2,413 |
Institutional Class
| 151,066 |
| Shareholder servicing fees | |
Class A
| 125,870 |
Class C
| 11,529 |
Class R
| 157 |
Administrator Class
| 4,478 |
| Distribution fees | |
Class C
| 34,588 |
Class R
| 143 |
Custody and accounting fees
| 52,246 |
Professional fees
| 24,472 |
Registration fees
| 41,390 |
Shareholder report expenses
| 19,922 |
Trustees’ fees and expenses
| 9,610 |
Other fees and expenses
| 14,838 |
Total expenses
| 2,769,211 |
| Less: Fee waivers and/or expense reimbursements | |
Fund-level
| (42,450) |
Class A
| (14,017) |
Class C
| (718) |
Class R
| (1) |
Administrator Class
| (466) |
Institutional Class
| (23,161) |
Net expenses
| 2,688,398 |
Net investment income
| 1,922,376 |
| Realized and unrealized gains (losses) on investments | |
Net realized gains on investments
| 48,154,687 |
Net change in unrealized gains (losses) on investments
| 51,507,458 |
Net realized and unrealized gains (losses) on investments
| 99,662,145 |
Net increase in net assets resulting from operations
| $101,584,521 |
The accompanying notes are an integral part of these financial statements.
Wells Fargo Emerging Markets Equity Income Fund | 13
Statement of changes in net assets
| | | | | |
| | Six months ended
April 30, 2021
(unaudited) | Year ended
October 31, 2020 |
| Operations | | | | |
Net investment income
| | $ 1,922,376 | | $ 9,934,893 |
Payment from affiliate
| | 0 | | 307 |
Net realized gains (losses) on investments
| | 48,154,687 | | (68,712,761) |
Net change in unrealized gains (losses) on investments
| | 51,507,458 | | (850,161) |
Net increase (decrease) in net assets resulting from operations
| | 101,584,521 | | (59,627,722) |
| Distributions to shareholders from | | | | |
| Net investment income and net realized gains | | | | |
Class A
| | (400,754) | | (1,690,538) |
Class C
| | (5,796) | | (134,238) |
Class R
| | (362) | | (1,874) |
Class R6
| | (374,554) | | (1,983,911) |
Administrator Class
| | (17,748) | | (93,407) |
Institutional Class
| | (1,306,351) | | (6,887,065) |
Total distributions to shareholders
| | (2,105,565) | | (10,791,033) |
| Capital share transactions | Shares | | Shares | |
| Proceeds from shares sold | | | | |
Class A
| 306,390 | 3,898,121 | 945,688 | 9,718,414 |
Class C
| 22,270 | 280,265 | 45,343 | 480,559 |
Class R
| 1,225 | 15,472 | 2,230 | 22,366 |
Class R6
| 159,178 | 1,995,154 | 867,814 | 8,492,106 |
Administrator Class
| 5,905 | 78,000 | 41,458 | 415,898 |
Institutional Class
| 2,223,443 | 28,665,041 | 9,817,292 | 95,360,951 |
| | | 34,932,053 | | 114,490,294 |
| Reinvestment of distributions | | | | |
Class A
| 30,975 | 384,708 | 157,763 | 1,629,799 |
Class C
| 471 | 5,588 | 11,657 | 121,723 |
Class R
| 21 | 262 | 126 | 1,312 |
Class R6
| 23,093 | 285,755 | 161,975 | 1,682,407 |
Administrator Class
| 1,321 | 16,461 | 8,405 | 88,277 |
Institutional Class
| 98,891 | 1,235,430 | 609,531 | 6,435,859 |
| | | 1,928,204 | | 9,959,377 |
| Payment for shares redeemed | | | | |
Class A
| (751,892) | (9,597,411) | (2,941,319) | (30,083,007) |
Class C
| (139,207) | (1,750,369) | (430,818) | (4,341,892) |
Class R
| (650) | (8,315) | (1,347) | (13,873) |
Class R6
| (3,412,975) | (42,894,405) | (1,305,123) | (13,709,656) |
Administrator Class
| (178,908) | (2,280,148) | (163,206) | (1,666,880) |
Institutional Class
| (3,913,673) | (50,198,092) | (34,467,483) | (335,110,233) |
| | | (106,728,740) | | (384,925,541) |
| Net asset value of shares issued in acquisition | | | | |
Class A
| 0 | 0 | 8,175,872 | 91,018,144 |
Class C
| 0 | 0 | 94,417 | 1,044,435 |
Administrator Class
| 0 | 0 | 67,995 | 763,172 |
Institutional Class
| 0 | 0 | 1,739,066 | 19,405,947 |
| | | 0 | | 112,231,698 |
Net decrease in net assets resulting from capital share transactions
| | (69,868,483) | | (148,244,172) |
Total increase (decrease) in net assets
| | 29,610,473 | | (218,662,927) |
| Net assets | | | | |
Beginning of period
| | 372,641,793 | | 591,304,720 |
End of period
| | $ 402,252,266 | | $ 372,641,793 |
The accompanying notes are an integral part of these financial statements.
14 | Wells Fargo Emerging Markets Equity Income Fund
Financial highlights
(For a share outstanding throughout each period)
| | | Year ended October 31 |
| Class A | Six months ended
April 30, 2021
(unaudited) | 2020 | 2019 | 2018 | 2017 | 2016 |
Net asset value, beginning of period
| $10.33 | $11.21 | $10.33 | $11.68 | $10.27 | $9.97 |
Net investment income
| 0.05 | 0.20 | 0.24 | 0.27 | 0.18 1 | 0.23 1 |
Net realized and unrealized gains (losses) on investments
| 2.83 | (0.85) | 0.86 | (1.36) | 1.43 | 0.29 |
Total from investment operations
| 2.88 | (0.65) | 1.10 | (1.09) | 1.61 | 0.52 |
| Distributions to shareholders from | | | | | | |
Net investment income
| (0.05) | (0.23) | (0.22) | (0.26) | (0.20) | (0.22) |
Net asset value, end of period
| $13.16 | $10.33 | $11.21 | $10.33 | $11.68 | $10.27 |
Total return2
| 27.91% | (5.83)% | 10.78% | (9.47)% | 15.79% | 5.29% |
| Ratios to average net assets (annualized) | | | | | | |
Gross expenses
| 1.59% | 1.65% | 1.69% | 1.67% | 1.68% | 1.79% |
Net expenses
| 1.54% | 1.52% | 1.62% | 1.62% | 1.63% | 1.65% |
Net investment income
| 0.72% | 2.10% | 2.12% | 2.30% | 1.72% | 2.34% |
| Supplemental data | | | | | | |
Portfolio turnover rate
| 39% | 92% | 73% | 69% | 80% | 64% |
Net assets, end of period (000s omitted)
| $101,469 | $83,889 | $20,017 | $19,684 | $22,774 | $26,459 |
| 1 | Calculated based upon average shares outstanding |
| 2 | Total return calculations do not include any sales charges. Returns for periods of less than one year are not annualized. |
The accompanying notes are an integral part of these financial statements.
Wells Fargo Emerging Markets Equity Income Fund | 15
Financial highlights
(For a share outstanding throughout each period)
| | | Year ended October 31 |
| Class C | Six months ended
April 30, 2021
(unaudited) | 2020 | 2019 | 2018 | 2017 | 2016 |
Net asset value, beginning of period
| $10.26 | $11.15 | $10.27 | $11.63 | $10.23 | $9.94 |
Net investment income (loss)
| (0.02) | 0.11 | 0.15 | 0.18 | 0.13 | 0.16 1 |
Net realized and unrealized gains (losses) on investments
| 2.85 | (0.85) | 0.87 | (1.35) | 1.39 | 0.28 |
Total from investment operations
| 2.83 | (0.74) | 1.02 | (1.17) | 1.52 | 0.44 |
| Distributions to shareholders from | | | | | | |
Net investment income
| (0.01) | (0.15) | (0.14) | (0.19) | (0.12) | (0.15) |
Net asset value, end of period
| $13.08 | $10.26 | $11.15 | $10.27 | $11.63 | $10.23 |
Total return2
| 27.44% | (6.69)% | 10.01% | (10.20)% | 14.91% | 4.53% |
| Ratios to average net assets (annualized) | | | | | | |
Gross expenses
| 2.34% | 2.40% | 2.44% | 2.42% | 2.42% | 2.54% |
Net expenses
| 2.30% | 2.31% | 2.37% | 2.37% | 2.38% | 2.40% |
Net investment income (loss)
| (0.05)% | 1.03% | 1.30% | 1.53% | 1.18% | 1.62% |
| Supplemental data | | | | | | |
Portfolio turnover rate
| 39% | 92% | 73% | 69% | 80% | 64% |
Net assets, end of period (000s omitted)
| $8,847 | $8,138 | $11,958 | $13,896 | $16,898 | $13,327 |
| 1 | Calculated based upon average shares outstanding |
| 2 | Total return calculations do not include any sales charges. Returns for periods of less than one year are not annualized. |
The accompanying notes are an integral part of these financial statements.
16 | Wells Fargo Emerging Markets Equity Income Fund
Financial highlights
(For a share outstanding throughout each period)
| | | Year ended October 31 |
| Class R | Six months ended
April 30, 2021
(unaudited) | 2020 | 2019 | 2018 | 2017 | 2016 |
Net asset value, beginning of period
| $10.36 | $11.22 | $10.34 | $11.71 | $10.30 | $9.99 |
Net investment income
| 0.03 | 0.17 | 0.20 | 0.24 | 0.18 | 0.20 1 |
Payment from affiliate
| 0.00 | 0.03 | 0.00 | 0.00 | 0.00 | 0.00 |
Net realized and unrealized gains (losses) on investments
| 2.85 | (0.85) | 0.88 | (1.37) | 1.40 | 0.30 |
Total from investment operations
| 2.88 | (0.65) | 1.08 | (1.13) | 1.58 | 0.50 |
| Distributions to shareholders from | | | | | | |
Net investment income
| (0.04) | (0.21) | (0.20) | (0.24) | (0.17) | (0.19) |
Net asset value, end of period
| $13.20 | $10.36 | $11.22 | $10.34 | $11.71 | $10.30 |
Total return2
| 27.67% | (5.82)% 3 | 10.61% | (9.70)% | 15.39% | 5.13% |
| Ratios to average net assets (annualized) | | | | | | |
Gross expenses
| 1.82% | 1.84% | 1.93% | 1.94% | 1.91% | 2.04% |
Net expenses
| 1.80% | 1.78% | 1.87% | 1.87% | 1.87% | 1.90% |
Net investment income
| 0.47% | 1.65% | 1.97% | 2.64% | 1.69% | 2.08% |
| Supplemental data | | | | | | |
Portfolio turnover rate
| 39% | 92% | 73% | 69% | 80% | 64% |
Net assets, end of period (000s omitted)
| $133 | $98 | $95 | $92 | $32 | $28 |
| 1 | Calculated based upon average shares outstanding |
| 2 | Returns for periods of less than one year are not annualized. |
| 3 | During the year ended October 31, 2020, the Fund received a payment from an affiliate which had a 0.29% impact on the total return. See Note 4 in the Notes to Financial Statements for additional information. |
The accompanying notes are an integral part of these financial statements.
Wells Fargo Emerging Markets Equity Income Fund | 17
Financial highlights
(For a share outstanding throughout each period)
| | | Year ended October 31 |
| Class R6 | Six months ended
April 30, 2021
(unaudited) | 2020 | 2019 | 2018 | 2017 | 2016 |
Net asset value, beginning of period
| $10.33 | $11.23 | $10.34 | $11.69 | $10.29 | $9.97 |
Net investment income
| 0.07 1 | 0.23 | 0.31 1 | 0.32 | 0.33 1 | 0.30 1 |
Net realized and unrealized gains (losses) on investments
| 2.85 | (0.87) | 0.85 | (1.35) | 1.32 | 0.27 |
Total from investment operations
| 2.92 | (0.63) | 1.16 | (1.03) | 1.65 | 0.57 |
| Distributions to shareholders from | | | | | | |
Net investment income
| (0.08) | (0.27) | (0.27) | (0.32) | (0.25) | (0.25) |
Net asset value, end of period
| $13.17 | $10.33 | $11.23 | $10.34 | $11.69 | $10.29 |
Total return2
| 28.16% | (5.60)% | 11.34% | (9.05)% | 16.25% | 5.90% |
| Ratios to average net assets (annualized) | | | | | | |
Gross expenses
| 1.15% | 1.22% | 1.26% | 1.24% | 1.20% | 1.36% |
Net expenses
| 1.14% | 1.16% | 1.17% | 1.17% | 1.17% | 1.20% |
Net investment income
| 1.14% | 2.27% | 2.81% | 2.58% | 2.96% | 3.03% |
| Supplemental data | | | | | | |
Portfolio turnover rate
| 39% | 92% | 73% | 69% | 80% | 64% |
Net assets, end of period (000s omitted)
| $51,725 | $73,969 | $83,481 | $36,597 | $57,765 | $2,592 |
| 1 | Calculated based upon average shares outstanding |
| 2 | Returns for periods of less than one year are not annualized. |
The accompanying notes are an integral part of these financial statements.
18 | Wells Fargo Emerging Markets Equity Income Fund
Financial highlights
(For a share outstanding throughout each period)
| | | Year ended October 31 |
| Administrator Class | Six months ended
April 30, 2021
(unaudited) | 2020 | 2019 | 2018 | 2017 | 2016 |
Net asset value, beginning of period
| $10.41 | $11.31 | $10.41 | $11.76 | $10.32 | $10.00 |
Net investment income
| 0.05 1 | 0.20 1 | 0.25 1 | 0.22 1 | 0.18 1 | 0.25 1 |
Net realized and unrealized gains (losses) on investments
| 2.87 | (0.87) | 0.89 | (1.29) | 1.46 | 0.29 |
Total from investment operations
| 2.92 | (0.67) | 1.14 | (1.07) | 1.64 | 0.54 |
| Distributions to shareholders from | | | | | | |
Net investment income
| (0.06) | (0.23) | (0.24) | (0.28) | (0.20) | (0.22) |
Net asset value, end of period
| $13.27 | $10.41 | $11.31 | $10.41 | $11.76 | $10.32 |
Total return2
| 27.92% | (5.89)% | 11.01% | (9.29)% | 15.99% | 5.56% |
| Ratios to average net assets (annualized) | | | | | | |
Gross expenses
| 1.50% | 1.56% | 1.61% | 1.57% | 1.58% | 1.71% |
Net expenses
| 1.45% | 1.45% | 1.45% | 1.45% | 1.45% | 1.45% |
Net investment income
| 0.79% | 1.92% | 2.24% | 1.86% | 1.73% | 2.54% |
| Supplemental data | | | | | | |
Portfolio turnover rate
| 39% | 92% | 73% | 69% | 80% | 64% |
Net assets, end of period (000s omitted)
| $2,618 | $3,842 | $4,686 | $4,758 | $13,940 | $50,970 |
| 1 | Calculated based upon average shares outstanding |
| 2 | Returns for periods of less than one year are not annualized. |
The accompanying notes are an integral part of these financial statements.
Wells Fargo Emerging Markets Equity Income Fund | 19
Financial highlights
(For a share outstanding throughout each period)
| | | Year ended October 31 |
| Institutional Class | Six months ended
April 30, 2021
(unaudited) | 2020 | 2019 | 2018 | 2017 | 2016 |
Net asset value, beginning of period
| $10.35 | $11.24 | $10.35 | $11.70 | $10.30 | $9.98 |
Net investment income
| 0.06 | 0.19 1 | 0.28 | 0.32 | 0.25 | 0.27 1 |
Net realized and unrealized gains (losses) on investments
| 2.85 | (0.82) | 0.87 | (1.36) | 1.39 | 0.30 |
Total from investment operations
| 2.91 | (0.63) | 1.15 | (1.04) | 1.64 | 0.57 |
| Distributions to shareholders from | | | | | | |
Net investment income
| (0.07) | (0.26) | (0.26) | (0.31) | (0.24) | (0.25) |
Net asset value, end of period
| $13.19 | $10.35 | $11.24 | $10.35 | $11.70 | $10.30 |
Total return2
| 28.04% | (5.63)% | 11.24% | (9.11)% | 16.11% | 5.84% |
| Ratios to average net assets (annualized) | | | | | | |
Gross expenses
| 1.26% | 1.33% | 1.36% | 1.34% | 1.33% | 1.45% |
Net expenses
| 1.22% | 1.22% | 1.22% | 1.22% | 1.23% | 1.25% |
Net investment income
| 1.02% | 1.85% | 2.54% | 2.73% | 2.32% | 2.75% |
| Supplemental data | | | | | | |
Portfolio turnover rate
| 39% | 92% | 73% | 69% | 80% | 64% |
Net assets, end of period (000s omitted)
| $237,459 | $202,705 | $471,068 | $452,650 | $514,624 | $426,801 |
| 1 | Calculated based upon average shares outstanding |
| 2 | Returns for periods of less than one year are not annualized. |
The accompanying notes are an integral part of these financial statements.
20 | Wells Fargo Emerging Markets Equity Income Fund
Notes to financial statements (unaudited)
1. ORGANIZATION
Wells Fargo Funds Trust (the "Trust"), a Delaware statutory trust organized on March 10, 1999, is an open-end management investment company registered under the Investment Company Act of 1940, as amended (the "1940 Act"). As an investment company, the Trust follows the accounting and reporting guidance in Financial Accounting Standards Board ("FASB") Accounting Standards Codification Topic 946, Financial Services – Investment Companies. These financial statements report on the Wells Fargo Emerging Markets Equity Income Fund (the "Fund") which is a diversified series of the Trust.
On February 23, 2021, Wells Fargo & Company announced that it has entered into a definitive agreement to sell Wells Fargo Asset Management ("WFAM") to GTCR LLC and Reverence Capital Partners, L.P. WFAM is the trade name used by the asset management businesses of Wells Fargo & Company and includes Wells Fargo Funds Management, LLC, the investment manager to the Fund, Wells Capital Management Incorporated and Wells Fargo Asset Management (International) Limited, both registered investment advisers providing sub-advisory services to certain funds, and Wells Fargo Funds Distributor, LLC, the Fund's principal underwriter. As part of the transaction, Wells Fargo & Company will own a 9.9% equity interest and will continue to serve as an important client and distribution partner.
Consummation of the transaction will result in the automatic termination of the Fund's investment management agreement and subadvisory agreement. The Fund's Board of Trustees approved a new investment management and new subadvisory agreement and approved submitting the agreements to the Fund’s shareholders for approval at a special meeting of shareholders expected to be held on July 15, 2021. Shareholders of record of the Fund at the close of business on May 28, 2021 are entitled to vote at the meeting. If shareholders approve the new agreements, they would take effect upon the closing of the transaction. The transaction is expected to close in the second half of 2021, subject to customary closing conditions.
This shareholder report is not asking you for a proxy. A separate proxy statement with more detailed information about the transaction will be provided to Fund shareholders and should be reviewed carefully.
2. SIGNIFICANT ACCOUNTING POLICIES
The following significant accounting policies, which are consistently followed in the preparation of the financial statements of the Fund, are in conformity with U.S. generally accepted accounting principles which require management to make estimates and assumptions that affect the reported amounts of assets and liabilities, disclosure of contingent assets and liabilities at the date of the financial statements, and the reported amounts of income and expenses during the reporting period. Actual results could differ from those estimates.
Securities valuation
All investments are valued each business day as of the close of regular trading on the New York Stock Exchange (generally 4 p.m. Eastern Time), although the Fund may deviate from this calculation time under unusual or unexpected circumstances.
Equity securities that are listed on a foreign or domestic exchange or market are valued at the official closing price or, if none, the last sales price. If no sale occurs on the principal exchange or market that day, a fair value price will be determined in accordance with the Fund’s Valuation Procedures.
The values of securities denominated in foreign currencies are translated into U.S. dollars at rates provided by an independent foreign currency pricing source at a time each business day specified by the Wells Fargo Asset Management Pricing Committee at Wells Fargo Funds Management, LLC ("Funds Management").
Many securities markets and exchanges outside the U.S. close prior to the close of the New York Stock Exchange and therefore may not fully reflect trading or events that occur after the close of the principal exchange in which the foreign securities are traded, but before the close of the New York Stock Exchange. If such trading or events are expected to materially affect the value of such securities, then fair value pricing procedures approved by the Board of Trustees of the Fund are applied. These procedures take into account multiple factors including movements in U.S. securities markets after foreign exchanges close. Foreign securities that are fair valued under these procedures are categorized as Level 2 and the application of these procedures may result in transfers between Level 1 and Level 2. Depending on market activity, such fair valuations may be frequent. Such fair value pricing may result in net asset values that are higher or lower than net asset values based on the last reported sales price or latest quoted bid price. On April 30, 2021, such fair value pricing was used in pricing certain foreign securities.
Forward foreign currency contracts are recorded at the forward rate provided by an independent foreign currency pricing source at a time each business day specified by the Wells Fargo Asset Management Pricing Committee.
Investments in registered open-end investment companies are valued at net asset value.
Wells Fargo Emerging Markets Equity Income Fund | 21
Notes to financial statements (unaudited)
Investments which are not valued using any of the methods discussed above are valued at their fair value, as determined in good faith by the Board of Trustees. The Board of Trustees has established a Valuation Committee comprised of the Trustees and has delegated to it the authority to take any actions regarding the valuation of portfolio securities that the Valuation Committee deems necessary or appropriate, including determining the fair value of portfolio securities, unless the determination has been delegated to the Wells Fargo Asset Management Pricing Committee. The Board of Trustees retains the authority to make or ratify any valuation decisions or approve any changes to the Valuation Procedures as it deems appropriate. On a quarterly basis, the Board of Trustees receives reports on any valuation actions taken by the Valuation Committee or the Wells Fargo Asset Management Pricing Committee which may include items for ratification.
Foreign currency translation
The accounting records of the Fund are maintained in U.S. dollars. The values of other assets and liabilities denominated in foreign currencies are translated into U.S. dollars at rates provided by an independent foreign currency pricing source at a time each business day specified by the Wells Fargo Asset Management Pricing Committee. Purchases and sales of securities, and income and expenses are converted at the rate of exchange on the respective dates of such transactions. Net realized foreign exchange gains or losses arise from sales of foreign currencies, currency gains or losses realized between the trade and settlement dates on securities transactions, and the difference between the amounts of dividends, interest and foreign withholding taxes recorded and the U.S. dollar equivalent of the amounts actually paid or received. Net unrealized foreign exchange gains and losses arise from changes in the fair value of assets and liabilities other than investments in securities resulting from changes in exchange rates. The changes in net assets arising from changes in exchange rates of securities and the changes in net assets resulting from changes in market prices of securities are not separately presented. Such changes are included in net realized and unrealized gains or losses from investments.
Forward foreign currency contracts
A forward foreign currency contract is an agreement between two parties to purchase or sell a specific currency for an agreed-upon price at a future date. The Fund enters into forward foreign currency contracts to facilitate transactions in foreign-denominated securities and to attempt to minimize the risk to the Fund from adverse changes in the relationship between currencies. Forward foreign currency contracts are recorded at the forward rate and marked-to-market daily. When the contracts are closed, realized gains and losses arising from such transactions are recorded as realized gains or losses on forward foreign currency contracts. The Fund is subject to foreign currency risk and may be exposed to risks if the counterparties to the contracts are unable to meet the terms of their contracts or if the value of the foreign currency changes unfavorably. The Fund's maximum risk of loss from counterparty credit risk is the unrealized gains on the contracts. This risk may be mitigated if there is a master netting arrangement between the Fund and the counterparty.
Security transactions and income recognition
Securities transactions are recorded on a trade date basis. Realized gains or losses are recorded on the basis of identified cost.
Dividend income is recognized on the ex-dividend date, except for certain dividends from foreign securities, which are recorded as soon as the custodian verifies the ex-dividend date. Dividend income from foreign securities is recorded net of foreign taxes withheld where recovery of such taxes is not assured.
Distributions to shareholders
Distributions to shareholders are recorded on the ex-dividend date and paid from net investment income monthly and any net realized gains are paid at least annually. Such distributions are determined in accordance with income tax regulations and may differ from U.S. generally accepted accounting principles. Dividend sources are estimated at the time of declaration. The tax character of distributions is determined as of the Fund's fiscal year end. Therefore, a portion of the Fund's distributions made prior to the Fund’s fiscal year end may be categorized as a tax return of capital at year end.
Federal and other taxes
The Fund intends to continue to qualify as a regulated investment company by distributing substantially all of its investment company taxable income and any net realized capital gains (after reduction for capital loss carryforwards) sufficient to relieve it from all, or substantially all, federal income taxes. Accordingly, no provision for federal income taxes was required.
The Fund’s income and federal excise tax returns and all financial records supporting those returns for the prior three fiscal years are subject to examination by the federal and Delaware revenue authorities. Management has analyzed the Fund's tax positions taken on federal, state, and foreign tax returns for all open tax years and does not believe that there are any uncertain tax positions that require recognition of a tax liability.
22 | Wells Fargo Emerging Markets Equity Income Fund
Notes to financial statements (unaudited)
As of April 30, 2021, the aggregate cost of all investments for federal income tax purposes was $290,882,381 and the unrealized gains (losses) consisted of:
| Gross unrealized gains | $104,296,203 |
| Gross unrealized losses | (694,498) |
| Net unrealized gains | $103,601,705 |
As of October 31, 2020, the Fund had capital loss carryforwards which consisted of $47,302,017 in short-term capital losses and $41,827,233 in long-term capital losses.
Class allocations
The separate classes of shares offered by the Fund differ principally in applicable sales charges, distribution, shareholder servicing, and administration fees. Class specific expenses are charged directly to that share class. Investment income, common fund-level expenses, and realized and unrealized gains (losses) on investments are allocated daily to each class of shares based on the relative proportion of net assets of each class.
3. FAIR VALUATION MEASUREMENTS
Fair value measurements of investments are determined within a framework that has established a fair value hierarchy based upon the various data inputs utilized in determining the value of the Fund’s investments. The three-level hierarchy gives the highest priority to unadjusted quoted prices in active markets for identical assets or liabilities (Level 1) and the lowest priority to unobservable inputs (Level 3). The Fund’s investments are classified within the fair value hierarchy based on the lowest level of input that is significant to the fair value measurement. The inputs are summarized into three broad levels as follows:
| ■ | Level 1 – quoted prices in active markets for identical securities |
| ■ | Level 2 – other significant observable inputs (including quoted prices for similar securities, interest rates, prepayment speeds, credit risk, etc.) |
| ■ | Level 3 – significant unobservable inputs (including the Fund’s own assumptions in determining the fair value of investments) |
The inputs or methodologies used for valuing investments in securities are not necessarily an indication of the risk associated with investing in those securities.
Wells Fargo Emerging Markets Equity Income Fund | 23
Notes to financial statements (unaudited)
The following is a summary of the inputs used in valuing the Fund’s assets and liabilities as of April 30, 2021:
| | Quoted prices
(Level 1) | Other significant
observable inputs
(Level 2) | Significant
unobservable inputs
(Level 3) | Total |
| Assets | | | | |
| Investments in: | | | | |
| Common stocks | | | | |
| Brazil | $ 16,290,685 | $ 0 | $0 | $ 16,290,685 |
| Cambodia | 1,542,377 | 0 | 0 | 1,542,377 |
| Chile | 1,795,559 | 0 | 0 | 1,795,559 |
| China | 107,451,395 | 0 | 0 | 107,451,395 |
| Hong Kong | 19,242,352 | 0 | 0 | 19,242,352 |
| India | 38,683,785 | 0 | 0 | 38,683,785 |
| Indonesia | 4,747,305 | 0 | 0 | 4,747,305 |
| Malaysia | 1,771,431 | 0 | 0 | 1,771,431 |
| Mexico | 5,676,187 | 0 | 0 | 5,676,187 |
| Peru | 4,354,436 | 0 | 0 | 4,354,436 |
| Philippines | 1,825,425 | 0 | 0 | 1,825,425 |
| Poland | 2,201,999 | 0 | 0 | 2,201,999 |
| Qatar | 2,626,403 | 0 | 0 | 2,626,403 |
| Russia | 16,561,009 | 0 | 0 | 16,561,009 |
| Saudi Arabia | 6,936,164 | 0 | 0 | 6,936,164 |
| Singapore | 3,122,476 | 0 | 0 | 3,122,476 |
| South Africa | 18,281,625 | 0 | 0 | 18,281,625 |
| South Korea | 48,092,385 | 0 | 0 | 48,092,385 |
| Taiwan | 0 | 61,482,496 | 0 | 61,482,496 |
| Thailand | 10,024,242 | 0 | 0 | 10,024,242 |
| United Arab Emirates | 0 | 2,069,462 | 0 | 2,069,462 |
| Preferred stocks | | | | |
| Brazil | 2,094,800 | 0 | 0 | 2,094,800 |
| South Korea | 11,818,009 | 0 | 0 | 11,818,009 |
| Short-term investments | | | | |
| Investment companies | 5,792,079 | 0 | 0 | 5,792,079 |
| Total assets | $330,932,128 | $63,551,958 | $0 | $394,484,086 |
Additional sector, industry or geographic detail, if any, is included in the Portfolio of Investments.
For the six months ended April 30, 2021, the Fund did not have any transfers into/out of Level 3.
4. TRANSACTIONS WITH AFFILIATES
Management fee
Funds Management, an indirect wholly owned subsidiary of Wells Fargo & Company ("Wells Fargo"), is the manager of the Fund and provides advisory and fund-level administrative services under an investment management agreement. Under the investment management agreement, Funds Management is responsible for, among other services, implementing the investment objectives and strategies of the Fund, supervising the subadviser and providing fund-level administrative services in connection with the Fund’s operations. As compensation for its services under the investment management agreement, Funds Management is entitled to receive a management fee at the following annual rate based on the Fund’s average daily net assets:
24 | Wells Fargo Emerging Markets Equity Income Fund
Notes to financial statements (unaudited)
| Average daily net assets | Management fee |
| First $1 billion | 1.050% |
| Next $1 billion | 1.025 |
| Next $2 billion | 1.000 |
| Next $1 billion | 0.975 |
| Next $3 billion | 0.965 |
| Next $2 billion | 0.955 |
| Over $10 billion | 0.945 |
For the six months ended April 30, 2021, the management fee was equivalent to an annual rate of 1.05% of the Fund’s average daily net assets.
Funds Management has retained the services of a subadviser to provide daily portfolio management to the Fund. The fee for subadvisory services is borne by Funds Management. Wells Capital Management Incorporated, an affiliate of Funds Management and an indirect wholly owned subsidiary of Wells Fargo, is the subadviser to the Fund and is entitled to receive a fee from Funds Management at an annual rate starting at 0.65% and declining to 0.45% as the average daily net assets of the Fund increase.
Administration fees
Under a class-level administration agreement, Funds Management provides class-level administrative services to the Fund, which includes paying fees and expenses for services provided by the transfer agent, sub-transfer agents, omnibus account servicers and record-keepers. As compensation for its services under the class-level administration agreement, Funds Management receives an annual fee which is calculated based on the average daily net assets of each class as follows:
| | Class-level
administration fee |
| Class A | 0.21% |
| Class C | 0.21 |
| Class R | 0.21 |
| Class R6 | 0.03 |
| Administrator Class | 0.13 |
| Institutional Class | 0.13 |
Waivers and/or expense reimbursements
Funds Management has contractually waived and/or reimbursed management and administration fees to the extent necessary to maintain certain net operating expense ratios for the Fund. When each class of the Fund has exceeded its expense cap, Funds Management has waived fees and/or reimbursed expenses from fund-level expenses on a proportionate basis and then from class specific expenses. When only certain classes exceed their expense caps, waivers and/or reimbursements are applied against class specific expenses before fund-level expenses. Funds Management has committed through February 28, 2022 to waive fees and/or reimburse expenses to the extent necessary to cap expenses. Prior to or after the commitment expiration date, the cap may be increased or the commitment to maintain the cap may be terminated only with the approval of the Board of Trustees. The contractual expense caps are as follows:
Wells Fargo Emerging Markets Equity Income Fund | 25
Notes to financial statements (unaudited)
| | Expense ratio caps |
| Class A | 1.55% |
| Class C | 2.30 |
| Class R | 1.80 |
| Class R6 | 1.17 |
| Administrator Class | 1.45 |
| Institutional Class | 1.22 |
Distribution fees
The Trust has adopted a distribution plan for Class C and Class R shares of the Fund pursuant to Rule 12b-1 under the 1940 Act. Distribution fees are charged to Class C and Class R shares and paid to Wells Fargo Funds Distributor, LLC ("Funds Distributor"), the principal underwriter, at an annual rate of 0.75% of the average daily net assets of Class C shares and 0.25% of the average daily net assets of Class R shares.
In addition, Funds Distributor is entitled to receive the front-end sales charge from the purchase of Class A shares and a contingent deferred sales charge on the redemption of certain Class A shares. Funds Distributor is also entitled to receive the contingent deferred sales charges from redemptions of Class C shares. For the six months ended April 30, 2021, Funds Distributor received $1,067 from the sale of Class A shares. No contingent deferred sales charges were incurred by Class A and Class C shares for the six months ended April 30, 2021.
Shareholder servicing fees
The Trust has entered into contracts with one or more shareholder servicing agents, whereby Class A, Class C, Class R, and Administrator Class of the Fund are charged a fee at an annual rate of 0.25% of the average daily net assets of each respective class. A portion of these total shareholder servicing fees were paid to affiliates of Wells Fargo.
Interfund transactions
The Fund may purchase or sell portfolio investment securities to certain other Wells Fargo affiliates pursuant to Rule 17a-7 under the 1940 Act and under procedures adopted by the Board of Trustees. The procedures have been designed to ensure that these interfund transactions, which do not incur broker commissions, are effected at current market prices.
Other transactions
On August 14, 2020, Class R of the Fund was reimbursed by Funds Management in the amount of $307. The reimbursement made in connection with resolving certain fee reimbursements.
5. INVESTMENT PORTFOLIO TRANSACTIONS
Purchases and sales of investments, excluding U.S. government obligations (if any) and short-term securities, for the six months ended April 30, 2021 were $149,415,696 and $221,031,685, respectively.
6. ACQUISITION
After the close of business on December 6, 2019, the Fund acquired the net assets of Wells Fargo Asia Pacific Fund. The purpose of the transaction was to combine two funds with similar investment objectives and strategies. Shareholders holding Class A, Class C, Administrator Class and Institutional Class shares of Wells Fargo Asia Pacific Fund received Class A, Class C, Administrator Class, and Institutional Class shares, respectively, of the Fund in the reorganization. The acquisition was accomplished by a tax-free exchange of all of the shares of Wells Fargo Asia Pacific Fund for 10,077,350 shares of the Fund valued at $112,231,698 at an exchange ratio of 1.01, 0.96, 0.99, and 0.98 for Class A, Class C, Administrator Class, and Institutional Class shares, respectively. The investment portfolio of Wells Fargo Asia Pacific Fund with a fair value of $112,424,413, identified cost of $111,732,421 and unrealized gains of $691,992 at December 6, 2019 were the principal assets acquired by the Fund. The aggregate net assets of Wells Fargo Asia Pacific Fund and the Fund immediately prior to the acquisition were $112,231,698 and $583,919,847, respectively. The aggregate net assets of the Fund immediately after the acquisition were $696,151,545. For financial reporting purposes, assets received and shares issued by the Fund were recorded at fair value; however, the cost basis of the investments received from Wells Fargo Asia Pacific Fund was carried forward to align with ongoing reporting of the Fund’s realized and unrealized gains and losses with amounts distributable to shareholders for tax purposes.
26 | Wells Fargo Emerging Markets Equity Income Fund
Notes to financial statements (unaudited)
Assuming the acquisition had been completed November 1, 2019, the beginning of the annual reporting period for the Fund, the pro forma results of operations for the year ended October 31, 2020 would have been as follows (unaudited):
| Net investment income | $ 9,980,239 |
| Net realized and unrealized gains (losses) on investments | (52,952,460) |
| Net decrease in net assets resulting from operations | $(42,972,221) |
7. BANK BORROWINGS
The Trust (excluding the money market funds), Wells Fargo Master Trust and Wells Fargo Variable Trust are parties to a $350,000,000 revolving credit agreement whereby the Fund is permitted to use bank borrowings for temporary or emergency purposes, such as to fund shareholder redemption requests. Interest under the credit agreement is charged to the Fund based on a borrowing rate equal to the higher of the Federal Funds rate in effect on that day plus 1.25% or the overnight LIBOR rate in effect on that day plus 1.25%. In addition, an annual commitment fee equal to 0.25% of the unused balance is allocated to each participating fund.
For the six months ended April 30, 2021, there were no borrowings by the Fund under the agreement.
8. CONCENTRATION RISKS
As of the end of the period, the Fund concentrated its portfolio of investments in the information technology sector and China and Hong Kong. A fund that invests a substantial portion of its assets in any sector or geographic region may be more affected by changes in that sector or geographic region than would be a fund whose investments are not heavily weighted in any sector or geographic region.
9. INDEMNIFICATION
Under the Fund's organizational documents, the officers and Trustees have been granted certain indemnification rights against certain liabilities that may arise out of performance of their duties to the Fund. The Fund has entered into a separate agreement with each Trustee that converts indemnification rights currently existing under the Fund’s organizational documents into contractual rights that cannot be changed in the future without the consent of the Trustee. Additionally, in the normal course of business, the Fund may enter into contracts with service providers that contain a variety of indemnification clauses. The Fund’s maximum exposure under these arrangements is dependent on future claims that may be made against the Fund and, therefore, cannot be estimated.
10. CORONAVIRUS (COVID-19) PANDEMIC
On March 11, 2020, the World Health Organization announced that it had made the assessment that coronavirus disease 2019 (“COVID-19”) is a pandemic. The impacts of COVID-19 are affecting the entire global economy, individual companies and investment products, the funds, and the market in general. There is significant uncertainty around the extent and duration of business disruptions related to COVID-19 and the impacts may last for an extended period of time. COVID-19 has led to significant uncertainty and volatility in the financial markets.
Wells Fargo Emerging Markets Equity Income Fund | 27
Other information (unaudited)
TAX INFORMATION
Pursuant to Section 853 of the Internal Revenue Code, the following amounts have been designated as foreign taxes paid for the fiscal year ended October 31, 2020. These amounts may be less than the actual foreign taxes paid for financial statement purposes. Foreign taxes paid or withheld should be included in taxable income with an offsetting deduction from gross income or as a credit for taxes paid to foreign governments. None of the income was derived from ineligible foreign sources as defined under Section 901(j) of the Internal Revenue Code.
Creditable
foreign taxes
paid | Per share
amount | Foreign
income as % of
ordinary income
distributions |
| $1,690,944 | $0.0469 | 100% |
PROXY VOTING INFORMATION
A description of the policies and procedures used to determine how to vote proxies relating to portfolio securities is available without charge, upon request, by calling 1-800-222-8222, visiting our website at wfam.com, or visiting the SEC website at sec.gov. Information regarding how the proxies related to portfolio securities were voted during the most recent 12-month period ended June 30 is available on the website at wfam.com or by visiting the SEC website at sec.gov.
QUARTERLY PORTFOLIO HOLDINGS INFORMATION
The Fund files its complete schedule of portfolio holdings with the SEC for the first and third quarters of each fiscal year as an exhibit to its reports on Form N-PORT. Shareholders may view the filed Form N-PORT by visiting the SEC website at sec.gov.
28 | Wells Fargo Emerging Markets Equity Income Fund
Other information (unaudited)
BOARD OF TRUSTEES AND OFFICERS
Each of the Trustees and Officers listed in the table below acts in identical capacities for each fund in the Wells Fargo family of funds, which consists of 139 mutual funds comprising the Wells Fargo Funds Trust, Wells Fargo Variable Trust, Wells Fargo Master Trust and four closed-end funds (collectively the “Fund Complex”). This table should be read in conjunction with the Prospectus and the Statement of Additional Information1. The mailing address of each Trustee and Officer is 525 Market Street, 12th Floor, San Francisco, CA 94105. Each Trustee and Officer serves an indefinite term, however, each Trustee serves such term until reaching the mandatory retirement age established by the Trustees.
Independent Trustees
Name and
year of birth | Position held and
length of service* | Principal occupations during past five years or longer | Current other
public company or
investment
company
directorships |
William R. Ebsworth
(Born 1957) | Trustee,
since 2015 | Retired. From 1984 to 2013, equities analyst, portfolio manager, research director and chief investment officer at Fidelity Management and Research Company in Boston, Tokyo, and Hong Kong, and retired in 2013 as Chief Investment Officer of Fidelity Strategic Advisers, Inc. where he led a team of investment professionals managing client assets. Prior thereto, Board member of Hong Kong Securities Clearing Co., Hong Kong Options Clearing Corp., the Thailand International Fund, Ltd., Fidelity Investments Life Insurance Company, and Empire Fidelity Investments Life Insurance Company. Audit Committee Chair and Investment Committee Chair of the Vincent Memorial Hospital Endowment (non-profit organization). Mr. Ebsworth is a CFA® charterholder. | N/A |
Jane A. Freeman
(Born 1953) | Trustee,
since 2015;
Chair Liaison,
since 2018 | Retired. From 2012 to 2014 and 1999 to 2008, Chief Financial Officer of Scientific Learning Corporation. From 2008 to 2012, Ms. Freeman provided consulting services related to strategic business projects. Prior to 1999, Portfolio Manager at Rockefeller & Co. and Scudder, Stevens & Clark. Board member of the Harding Loevner Funds from 1996 to 2014, serving as both Lead Independent Director and chair of the Audit Committee. Board member of the Russell Exchange Traded Funds Trust from 2011 to 2012 and the chair of the Audit Committee. Ms. Freeman is also an inactive Chartered Financial Analyst. | N/A |
Isaiah Harris, Jr.
(Born 1952) | Trustee,
since 2009; Audit
Committee
Chair,
since 2019 | Retired. Chairman of the Board of CIGNA Corporation since 2009, and Director since 2005. From 2003 to 2011, Director of Deluxe Corporation. Prior thereto, President and CEO of BellSouth Advertising and Publishing Corp. from 2005 to 2007, President and CEO of BellSouth Enterprises from 2004 to 2005 and President of BellSouth Consumer Services from 2000 to 2003. Emeritus member of the Iowa State University Foundation Board of Governors. Emeritus Member of the Advisory Board of Iowa State University School of Business. Advisory Board Member, Palm Harbor Academy (private school). Mr. Harris is a certified public accountant (inactive status). | CIGNA Corporation |
Judith M. Johnson
(Born 1949) | Trustee,
since 2008 | Retired. Prior thereto, Chief Executive Officer and Chief Investment Officer of Minneapolis Employees Retirement Fund from 1996 to 2008. Ms. Johnson is an attorney, certified public accountant and a certified managerial accountant. | N/A |
David F. Larcker
(Born 1950) | Trustee,
since 2009 | James Irvin Miller Professor of Accounting at the Graduate School of Business (Emeritus), Stanford University, Director of the Corporate Governance Research Initiative and Senior Faculty of The Rock Center for Corporate Governance since 2006. From 2005 to 2008, Professor of Accounting at the Graduate School of Business, Stanford University. Prior thereto, Ernst & Young Professor of Accounting at The Wharton School, University of Pennsylvania from 1985 to 2005. | N/A |
Wells Fargo Emerging Markets Equity Income Fund | 29
Other information (unaudited)
Name and
year of birth | Position held and
length of service* | Principal occupations during past five years or longer | Current other
public company or
investment
company
directorships |
Olivia S. Mitchell
(Born 1953) | Trustee,
since 2006;
Nominating and
Governance
Committee Chair,
since 2018 | International Foundation of Employee Benefit Plans Professor, Wharton School of the University of Pennsylvania since 1993. Director of Wharton’s Pension Research Council and Boettner Center on Pensions & Retirement Research, and Research Associate at the National Bureau of Economic Research. Previously, Cornell University Professor from 1978 to 1993. | N/A |
Timothy J. Penny
(Born 1951) | Trustee,
since 1996;
Chair,
since 2018 | President and Chief Executive Officer of Southern Minnesota Initiative Foundation, a non-profit organization, since 2007. Member of the Board of Trustees of NorthStar Education Finance, Inc., a non-profit organization, since 2007. | N/A |
James G. Polisson
(Born 1959) | Trustee,
since 2018 | Retired. Chief Marketing Officer, Source (ETF) UK Services, Ltd, from 2015 to 2017. From 2012 to 2015, Principal of The Polisson Group, LLC, a management consulting, corporate advisory and principal investing company. Chief Executive Officer and Managing Director at Russell Investments, Global Exchange Traded Funds from 2010 to 2012. Managing Director of Barclays Global Investors from 1998 to 2010 and Global Chief Marketing Officer for iShares and Barclays Global Investors from 2000 to 2010. Trustee of the San Francisco Mechanics’ Institute, a non-profit organization, from 2013 to 2015. Board member of the Russell Exchange Traded Fund Trust from 2011 to 2012. Director of Barclays Global Investors Holdings Deutschland GmbH from 2006 to 2009. Mr. Polisson is an attorney and has a retired status with the Massachusetts and District of Columbia Bar Associations. | N/A |
Pamela Wheelock
(Born 1959) | Trustee,
since January
2020; previously
Trustee from
January 2018 to
July 2019 | Board member of the Destination Medical Center Economic Development Agency, Rochester, Minnesota since 2019. Interim President of the McKnight Foundation from January to September 2020. Acting Commissioner, Minnesota Department of Human Services, July 2019 through September 2019. Human Services Manager (part-time), Minnesota Department of Human Services, October 2019 through December 2019. Chief Operating Officer, Twin Cities Habitat for Humanity from 2017 to 2019. Vice President of University Services, University of Minnesota from 2012 to 2016. Prior thereto, on the Board of Directors, Governance Committee and Finance Committee for the Minnesota Philanthropy Partners (Saint Paul Foundation) from 2012 to 2018, Interim Chief Executive Officer of Blue Cross Blue Shield of Minnesota from 2011 to 2012, Chairman of the Board from 2009 to 2012 and Board Director from 2003 to 2015. Vice President, Leadership and Community Engagement, Bush Foundation, Saint Paul, Minnesota (a private foundation) from 2009 to 2011. Executive Vice President and Chief Financial Officer, Minnesota Sports and Entertainment from 2004 to 2009 and Senior Vice President from 2002 to 2004. Executive Vice President of the Minnesota Wild Foundation from 2004 to 2008. Commissioner of Finance, State of Minnesota, from 1999 to 2002. Currently Board Chair of the Minnesota Wild Foundation since 2010. | N/A |
* Length of service dates reflect the Trustee’s commencement of service with the Trust’s predecessor entities, where applicable.
30 | Wells Fargo Emerging Markets Equity Income Fund
Other information (unaudited)
Officers
Name and
year of birth | Position held and
length of service | Principal occupations during past five years or longer |
Andrew Owen
(Born 1960) | President,
since 2017 | Executive Vice President of Wells Fargo & Company and Head of Affiliated Managers, Wells Fargo Asset Management, since 2014. In addition, Mr. Owen is currently President, Chief Executive Officer and Director of Wells Fargo Funds Management, LLC since 2017. Prior thereto, Executive Vice President responsible for marketing, investments and product development for Wells Fargo Funds Management, LLC, from 2009 to 2014. |
Jeremy DePalma
(Born 1974) | Treasurer,
since 2012
(for certain funds in
the Fund Complex);
since 2021 (for
the remaining funds in the
Fund Complex) | Senior Vice President of Wells Fargo Funds Management, LLC since 2009. Senior Vice President of Evergreen Investment Management Company, LLC from 2008 to 2010 and head of the Fund Reporting and Control Team within Fund Administration from 2005 to 2010. |
Michelle Rhee
(Born 1966) | Chief Legal Officer,
since 2019 | Secretary of Wells Fargo Funds Management, LLC and Chief Legal Counsel of Wells Fargo Asset Management since 2018. Deputy General Counsel of Wells Fargo Bank, N.A. since 2020 and Assistant General Counsel of Wells Fargo Bank, N.A. from 2018 to 2020. Associate General Counsel and Managing Director of Bank of America Corporation from 2004 to 2018. |
Catherine Kennedy
(Born 1969) | Secretary,
since 2019 | Vice President of Wells Fargo Funds Management, LLC and Senior Counsel of the Wells Fargo Legal Department since 2010. Vice President and Senior Counsel of Evergreen Investment Management Company, LLC from 1998 to 2010. |
Michael H. Whitaker
(Born 1967) | Chief Compliance Officer,
since 2016 | Chief Compliance Officer of Wells Fargo Asset Management since 2016. Senior Vice President and Chief Compliance Officer for Fidelity Investments from 2007 to 2016. |
1 The Statement of Additional Information includes additional information about the Trustees and is available, without charge, upon request, by calling 1-800-222-8222 or by visiting the website at wfam.com.
Wells Fargo Emerging Markets Equity Income Fund | 31
For more information
More information about Wells Fargo Funds is available free upon request. To obtain literature, please write, visit the Fund's website, or call:
Wells Fargo Funds
P.O. Box 219967
Kansas City, MO 64121-9967
Website: wfam.com
Individual investors: 1-800-222-8222
Retail investment professionals: 1-888-877-9275
Institutional investment professionals: 1-866-765-0778
This report and the financial statements contained herein are submitted for the general information of the shareholders of the Fund. If this report is used for promotional purposes, distribution of the report must be accompanied or preceded by a current prospectus. Before investing, please consider the investment objectives, risks, charges, and expenses of the investment. For a current prospectus and, if available, a summary prospectus, containing this information, call 1-800-222-8222 or visit the Fund's website at wfam.com. Read the prospectus carefully before you invest or send money.
Wells Fargo Asset Management (WFAM) is the trade name for certain investment advisory/management firms owned by Wells Fargo & Company. These firms include but are not limited to Wells Capital Management Incorporated and Wells Fargo Funds Management, LLC. Certain products managed by WFAM entities are distributed by Wells Fargo Funds Distributor, LLC (a broker-dealer and Member FINRA).
This material is for general informational and educational purposes only and is NOT intended to provide investment advice or a recommendation of any kind - including a recommendation for any specific investment, strategy, or plan.
INVESTMENT PRODUCTS: NOT FDIC INSURED ■ NO BANK GUARANTEE ■ MAY LOSE VALUE
© 2021 Wells Fargo & Company. All rights reserved.
PAR-0521-00322 06-21
SA262/SAR262 04-21
Semi-Annual Report
April 30, 2021
Wells Fargo
Global Small Cap Fund
Reduce clutter.
Save trees.
Sign up for electronic delivery of prospectuses and shareholder reports at wellsfargo.com/ advantagedelivery
The views expressed and any forward-looking statements are as of April 30, 2021, unless otherwise noted, and are those of the Fund's portfolio managers and/or Wells Fargo Asset Management. Discussions of individual securities or the markets generally are not intended as individual recommendations. Future events or results may vary significantly from those expressed in any forward-looking statements. The views expressed are subject to change at any time in response to changing circumstances in the market. Wells Fargo Asset Management and the Fund disclaim any obligation to publicly update or revise any views expressed or forward-looking statements.
INVESTMENT PRODUCTS: NOT FDIC INSURED ■ NO BANK GUARANTEE ■ MAY LOSE VALUE
Wells Fargo Global Small Cap Fund | 1
Letter to shareholders (unaudited)
Andrew Owen
President
Wells Fargo Funds
Dear Shareholder:
We are pleased to offer you this semi-annual report for the Wells Fargo Global Small Cap Fund for the six-month period that ended April 30, 2021. Global stocks continued to rally as the global economy continued to work through the haze of COVID-19. Tailwinds were provided by global stimulus programs, a rapid vaccination rollout, and recovering consumer and corporate sentiment. Bonds were mixed during the period, with global bonds, municipal bonds, and high-yield bonds delivering positive returns.
For the six-month period, U.S. stocks, based on the S&P 500 Index,1 gained 28.85%. International stocks, as measured by the MSCI ACWI ex USA Index (Net),2 returned 27.40%, while the MSCI EM Index (Net),3 trailed its developed market counterparts with a 22.95% gain. Among bond indexes, the Bloomberg Barclays U.S. Aggregate Bond Index,4 returned -1.52%, the Bloomberg Barclays Global Aggregate ex-USD Index (unhedged),5 returned 0.68%, the Bloomberg Barclays Municipal Bond Index,6 returned 2.62%, and the ICE BofA U.S. High Yield Index,7 returned 8.12%.
Hope drove the stock markets to new highs.
Global stocks rallied in November, propelled by optimism over three promising COVID-19 vaccines. Reversing recent trends, value stocks outperformed growth stocks and cyclical stocks outpaced information technology (IT) stocks. However, U.S. unemployment remained elevated, with a net job loss of 10 million since February. The eurozone services Purchasing Managers’ Index, a monthly survey of purchasing managers, contracted sharply while the region’s manufacturing activity grew. The U.S. election results added to the upbeat mood as investors anticipated more consistent policies in the new administration.
Financial markets ended the year with strength on high expectations for a rapid rollout of the COVID-19 vaccines, the successful passage of a $900 billion stimulus package, and rising expectations of additional economic support from a Democratic-led Congress. U.S. economic data were mixed with still-elevated unemployment and weak retail sales but growth in manufacturing output. In contrast, China’s economic expansion continued in both manufacturing and nonmanufacturing. U.S. COVID-19 infection rates continued to rise even as new state and local lockdown measures were implemented.
“Global stocks rallied in November, propelled by optimism over three promising COVID-19 vaccines.”
| 1 | The S&P 500 Index consists of 500 stocks chosen for market size, liquidity, and industry group representation. It is a market-value-weighted index with each stock's weight in the index proportionate to its market value. You cannot invest directly in an index. |
| 2 | The Morgan Stanley Capital International (MSCI) All Country World Index (ACWI) ex USA Index (Net) is a free-float-adjusted market-capitalization-weighted index that is designed to measure the equity market performance of developed and emerging markets, excluding the United States. Source: MSCI. MSCI makes no express or implied warranties or representations and shall have no liability whatsoever with respect to any MSCI data contained herein. The MSCI data may not be further redistributed or used as a basis for other indices or any securities or financial products. This report is not approved, reviewed, or produced by MSCI. You cannot invest directly in an index. |
| 1 | The S&P 500 Index consists of 500 stocks chosen for market size, liquidity, and industry group representation. It is a market-value-weighted index with each stock's weight in the index proportionate to its market value. You cannot invest directly in an index. |
| 3 | The MSCI Emerging Markets (EM) Index (Net) is a free-float-adjusted market-capitalization-weighted index that is designed to measure equity market performance of emerging markets. You cannot invest directly in an index. |
| 1 | The S&P 500 Index consists of 500 stocks chosen for market size, liquidity, and industry group representation. It is a market-value-weighted index with each stock's weight in the index proportionate to its market value. You cannot invest directly in an index. |
| 4 | The Bloomberg Barclays U.S. Aggregate Bond Index is a broad-based benchmark that measures the investment-grade, U.S. dollar-denominated, fixed-rate taxable bond market, including Treasuries, government-related and corporate securities, mortgage-backed securities (agency fixed-rate and hybrid adjustable-rate mortgage pass-throughs), asset-backed securities, and commercial mortgage-backed securities. You cannot invest directly in an index. |
| 1 | The S&P 500 Index consists of 500 stocks chosen for market size, liquidity, and industry group representation. It is a market-value-weighted index with each stock's weight in the index proportionate to its market value. You cannot invest directly in an index. |
| 5 | The Bloomberg Barclays Global Aggregate ex-USD Index (unhedged) is an unmanaged index that provides a broad-based measure of the global investment-grade fixed-income markets excluding the U.S. dollar-denominated debt market. You cannot invest directly in an index. |
| 1 | The S&P 500 Index consists of 500 stocks chosen for market size, liquidity, and industry group representation. It is a market-value-weighted index with each stock's weight in the index proportionate to its market value. You cannot invest directly in an index. |
| 6 | The Bloomberg Barclays Municipal Bond Index is an unmanaged index composed of long-term tax-exempt bonds with a minimum credit rating of Baa. You cannot invest directly in an index. |
| 1 | The S&P 500 Index consists of 500 stocks chosen for market size, liquidity, and industry group representation. It is a market-value-weighted index with each stock's weight in the index proportionate to its market value. You cannot invest directly in an index. |
| 7 | The ICE BofA U.S. High Yield Index is a market-capitalization-weighted index of domestic and Yankee high-yield bonds. The index tracks the performance of high-yield securities traded in the U.S. bond market. You cannot invest directly in an index. Copyright 2021. ICE Data Indices, LLC. All rights reserved. |
2 | Wells Fargo Global Small Cap Fund
Letter to shareholders (unaudited)
The calendar year 2021 began with emerging market stocks leading all major asset classes in January, driven by China’s strong economic growth and a broad recovery in corporate earnings, which propelled China’s stock market higher. In the U.S., positive news on vaccine trials and January's expansion in both the manufacturing and services sectors were offset by a weak December monthly jobs report. This was compounded by technical factors as some hedge funds were forced to sell stocks to protect themselves against a well-publicized short squeeze coordinated by a group of retail investors. Eurozone sentiment and economic growth were particularly weak, reflecting the impact of a new lockdown with stricter social distancing along with a slow vaccine rollout.
February saw major domestic equity indexes driven higher on the hope of a new stimulus bill, improving COVID-19 vaccination numbers, and the gradual reopening of the economy. Most S&P 500 companies reported better-than-expected earnings, with positive surprises coming from the financials, IT, health care, and materials sectors. Japan saw its economy strengthen as a result of strong export numbers. Meanwhile, crude-oil prices continued their climb, rising more than 25% for the year. Domestic government bonds experienced a sharp sell-off in late February as markets priced in a more robust economic recovery and higher future growth and inflation expectations.
The passage of the massive domestic stimulus bill highlighted March activity, leading to increased forecasts for U.S. growth in 2021. Domestic employment surged as COVID-19 vaccinations and an increasingly open economy spurred hiring. A majority of U.S. small companies reported they were operating at pre-pandemic capacity or higher. Value continued its outperformance of growth in the month, continuing the trend that started in late 2020. Meanwhile, most major developed global equity indexes were up month to date on the back of rising optimism regarding the outlook for global growth. While the U.S. and the U.K. have been the most successful in terms of the vaccine rollout, even within markets where the vaccine has lagged, such as the eurozone and Japan, equity indexes in many of those countries are also in positive territory this year.
Equity markets produced another strong showing in April. Domestically, the continued reopening of the economy had a strong impact on positive equity performance as people started leaving their households and jobless claims continued to fall. Domestic corporate bonds performed well and the U.S. dollar weakened. Meanwhile, the U.S. government continued to seek to invest in the recovery, this time by outlining a package of over $2 billion to improve infrastructure. The primary headwind in April was inflation, as investors tried to determine the breadth and longevity of recent price increases. Developed Europe has been supported by a meaningful increase in the pace of vaccinations. Unfortunately many emerging market countries have not been as successful. India in particular has seen COVID-19 cases surge, serving as an example of the need to get vaccinations rolled out to less developed nations.
Don’t let short-term uncertainty derail long-term investment goals.
Periods of investment uncertainty can present challenges, but experience has taught us that maintaining long-term investment goals can be an effective way to plan for the future. Although diversification cannot guarantee an investment profit or prevent losses, we believe it can be an effective way to manage investment risk and potentially smooth out overall portfolio performance. We encourage investors to know their investments and to understand that appropriate levels of risk-taking may unlock opportunities.
Thank you for choosing to invest with Wells Fargo Funds. We appreciate your confidence in us and remain committed to helping you meet your financial needs.
Sincerely,
Andrew Owen
President
Wells Fargo Funds
“The passage of the massive domestic stimulus bill highlighted March activity, leading to increased forecasts for U.S. growth in 2021.”
For further information about your Fund, contact your investment professional, visit our website at wfam.com, or call us directly at 1-800-222-8222.
Wells Fargo Global Small Cap Fund | 3
Performance highlights (unaudited)
| Investment objective | The Fund seeks long-term capital appreciation. |
| Manager | Wells Fargo Funds Management, LLC |
| Subadviser | Wells Capital Management Incorporated |
| Portfolio managers | Stephen Giggie, CFA®‡, Oleg Makhorine, Brian Martin, CFA®‡, James M. Tringas, CFA®‡, Bryant VanCronkhite, CFA®‡, CPA |
| Average annual total returns (%) as of April 30, 2021 |
| | | Including sales charge | | Excluding sales charge | | Expense ratios1 (%) |
| | Inception date | 1 year | 5 year | 10 year | | 1 year | 5 year | 10 year | | Gross | Net 2 |
| Class A (EKGAX) | 3-16-1988 | 48.01 | 13.09 | 8.48 | | 57.04 | 14.44 | 9.12 | | 1.54 | 1.54 |
| Class C (EKGCX) | 2-1-1993 | 55.25 | 13.64 | 8.33 | | 56.25 | 13.64 | 8.33 | | 2.29 | 2.29 |
| Administrator Class (EKGYX) | 1-13-1997 | – | – | – | | 57.32 | 14.61 | 9.29 | | 1.46 | 1.40 |
| Institutional Class (EKGIX) | 7-30-2010 | – | – | – | | 57.63 | 14.88 | 9.56 | | 1.21 | 1.15 |
| S&P Developed SmallCap Index3 | – | – | – | – | | 65.07 | 13.86 | 10.06 | | – | – |
Figures quoted represent past performance, which is no guarantee of future results, and do not reflect taxes that a shareholder may pay on an investment in a fund. Investment return and principal value of an investment will fluctuate so that an investor’s shares, when redeemed, may be worth more or less than their original cost. Performance shown without sales charges would be lower if sales charges were reflected. Current performance may be lower or higher than the performance data quoted, which assumes the reinvestment of dividends and capital gains. Current month-end performance is available on the Fund’s website, wfam.com.
Please keep in mind that high double-digit returns were primarily achieved during favorable market conditions. You should not expect that such favorable returns can be consistently achieved. A fund’s performance, especially for short time periods, should not be the sole factor in making your investment decision.
Index returns do not include transaction costs associated with buying and selling securities, any mutual fund fees or expenses, or any taxes. It is not possible to invest directly in an index.
For Class A shares, the maximum front-end sales charge is 5.75%. For Class C shares, the maximum contingent deferred sales charge is 1.00%. Performance including a contingent deferred sales charge assumes the sales charge for the corresponding time period. Administrator Class and Institutional Class shares are sold without a front-end sales charge or contingent deferred sales charge.
| 1 | Reflects the expense ratios as stated in the most recent prospectuses. The expense ratios shown are subject to change and may differ from the annualized expense ratios shown in the financial highlights of this report. |
| 2 | The manager has contractually committed through February 28, 2022, to waive fees and/or reimburse expenses to the extent necessary to cap total annual fund operating expenses after fee waivers at 1.55% for Class A, 2.30% for Class C, 1.40% for Administrator Class and 1.15% for Institutional Class. Brokerage commissions, stamp duty fees, interest, taxes, acquired fund fees and expenses (if any), and extraordinary expenses are excluded from the expense caps. Prior to or after the commitment expiration date, the caps may be increased or the commitment to maintain the caps may be terminated only with the approval of the Board of Trustees. Without these caps, the Fund’s returns would have been lower. The expense ratio paid by an investor is the net expense ratio (the total annual fund operating expenses after fee waivers) as stated in the prospectuses. |
| 3 | The S&P Developed SmallCap Index is a free-float-adjusted market-capitalization-weighted index designed to measure the equity market performance of small-capitalization companies located in developed markets. The index is composed of companies within the bottom 15% of the cumulative market capitalization in developed markets. The index covers all publicly listed equities with float-adjusted market values of U.S. $100 million or more and annual dollar value traded of at least U.S. $50 million in all included countries. You cannot invest directly in an index. |
Stock values fluctuate in response to the activities of individual companies and general market and economic conditions. Foreign investments are especially volatile and can rise or fall dramatically due to differences in the political and economic conditions of the host country. These risks are generally intensified in emerging markets. The use of derivatives may reduce returns and/or increase volatility. Certain investment strategies tend to increase the total risk of an investment (relative to the broader market). The Fund is exposed to geographic risk and smaller-company securities risk. Consult the Fund’s prospectus for additional information on these and other risks.
| ‡ | CFA® and Chartered Financial Analyst® are trademarks owned by CFA Institute. |
4 | Wells Fargo Global Small Cap Fund
Performance highlights (unaudited)
| Ten largest holdings (%) as of April 30, 20211 |
| Novanta Incorporated | 4.03 |
| Helen of Troy Limited | 3.86 |
| Innospec Incorporated | 3.80 |
| Denny’s Corporation | 3.24 |
| Mayville Engineering Company | 2.86 |
| CBIZ Incorporated | 2.67 |
| S4 Capital plc | 2.50 |
| Central Garden & Pet Company Class A | 2.49 |
| Balchem Corporation | 2.39 |
| CSW Industrials Incorporated | 2.29 |
| 1 | Figures represent the percentage of the Fund's net assets. Holdings are subject to change and may have changed since the date specified. |
| Sector allocation as of April 30, 20211 |
| 1 | Figures represent the percentage of the Fund's long-term investments. These amounts are subject to change and may have changed since the date specified. |
| Geographic allocation as of April 30, 20211 |
| 1 | Figures represent the percentage of the Fund's long-term investments. These amounts are subject to change and may have changed since the date specified. |
Wells Fargo Global Small Cap Fund | 5
Fund expenses (unaudited)
As a shareholder of the Fund, you incur two types of costs: (1) transaction costs, including sales charges (loads) on purchase payments and contingent deferred sales charges (if any) on redemptions and (2) ongoing costs, including management fees, distribution (12b-1) and/or shareholder servicing fees, and other Fund expenses. This example is intended to help you understand your ongoing costs (in dollars) of investing in the Fund and to compare these costs with the ongoing costs of investing in other mutual funds.
The example is based on an investment of $1,000 invested at the beginning of the six-month period and held for the entire period from November 1, 2020 to April 30, 2021.
Actual expenses
The “Actual” line of the table below provides information about actual account values and actual expenses. You may use the information in this line, together with the amount you invested, to estimate the expenses that you paid over the period. Simply divide your account value by $1,000 (for example, an $8,600 account value divided by $1,000 = 8.6), then multiply the result by the number in the “Actual” line under the heading entitled “Expenses paid during period” for your applicable class of shares to estimate the expenses you paid on your account during this period.
Hypothetical example for comparison purposes
The “Hypothetical” line of the table below provides information about hypothetical account values and hypothetical expenses based on the Fund’s actual expense ratio and an assumed rate of return of 5% per year before expenses, which is not the Fund’s actual return. The hypothetical account values and expenses may not be used to estimate the actual ending account balance or expenses you paid for the period. You may use this information to compare the ongoing costs of investing in the Fund and other funds. To do so, compare this 5% hypothetical example with the 5% hypothetical examples that appear in the shareholder reports of the other funds.
Please note that the expenses shown in the table are meant to highlight your ongoing costs only and do not reflect any transactional costs, such as sales charges (loads) and contingent deferred sales charges. Therefore, the “Hypothetical” line of the table is useful in comparing ongoing costs only and will not help you determine the relative total costs of owning different funds. In addition, if these transactional costs were included, your costs would have been higher.
| | Beginning
account value
11-1-2020 | Ending
account value
4-30-2021 | Expenses
paid during
the period1 | Annualized net
expense ratio |
| Class A | | | | |
| Actual | $1,000.00 | $1,410.63 | $ 8.97 | 1.50% |
| Hypothetical (5% return before expenses) | $1,000.00 | $1,017.36 | $ 7.50 | 1.50% |
| Class C | | | | |
| Actual | $1,000.00 | $1,404.74 | $13.42 | 2.25% |
| Hypothetical (5% return before expenses) | $1,000.00 | $1,013.64 | $11.23 | 2.25% |
| Administrator Class | | | | |
| Actual | $1,000.00 | $1,411.05 | $ 8.37 | 1.40% |
| Hypothetical (5% return before expenses) | $1,000.00 | $1,017.85 | $ 7.00 | 1.40% |
| Institutional Class | | | | |
| Actual | $1,000.00 | $1,412.75 | $ 6.88 | 1.15% |
| Hypothetical (5% return before expenses) | $1,000.00 | $1,019.09 | $ 5.76 | 1.15% |
1 Expenses paid is equal to the annualized net expense ratio of each class multiplied by the average account value over the period, multiplied by the number of days in the most recent fiscal half-year divided by the number of days in the fiscal year (to reflect the one-half-year period).
6 | Wells Fargo Global Small Cap Fund
Portfolio of investments—April 30, 2021 (unaudited)
| | | | | | Shares | Value |
| Common stocks: 97.20% | | | | | | |
| Australia: 4.47% | | | | | | |
| Ansell Limited (Health care, Health care equipment & supplies) | | | | | 179,676 | $ 5,849,352 |
| Cettire Limited (Consumer discretionary, Internet & direct marketing retail) †« | | | | | 2,557,223 | 3,309,528 |
| Domino's Pizza Enterprises Limited (Consumer discretionary, Hotels, restaurants & leisure) | | | | | 24,681 | 2,027,738 |
| Inghams Group Limited (Consumer staples, Food products) | | | | | 346,046 | 871,705 |
| Orora Limited (Materials, Containers & packaging) | | | | | 472,937 | 1,158,560 |
| | | | | | | 13,216,883 |
| Austria: 0.61% | | | | | | |
| Mayr-Melnhof Karton AG (Materials, Containers & packaging) | | | | | 8,653 | 1,795,569 |
| Belgium: 1.35% | | | | | | |
| Barco NV (Information technology, Electronic equipment, instruments & components) | | | | | 156,331 | 3,980,757 |
| Canada: 4.80% | | | | | | |
| Novanta Incorporated (Information technology, Electronic equipment, instruments & components) † | | | | | 90,419 | 11,909,086 |
| Primo Water Corporation (Consumer staples, Beverages) | | | | | 136,835 | 2,286,613 |
| | | | | | | 14,195,699 |
| Denmark: 0.48% | | | | | | |
| SimCorp AS (Information technology, Software) ♦ | | | | | 10,732 | 1,418,978 |
| France: 2.80% | | | | | | |
| Alten SA (Information technology, IT services) † | | | | | 45,701 | 5,719,672 |
| M6 Métropole Télévision SA (Communication services, Media) | | | | | 90,713 | 2,015,423 |
| Mersen SA (Industrials, Electrical equipment) † | | | | | 15,767 | 547,825 |
| | | | | | | 8,282,920 |
| Germany: 4.33% | | | | | | |
| Cancom SE (Information technology, IT services) | | | | | 27,944 | 1,725,473 |
| Gerresheimer AG (Health care, Life sciences tools & services) | | | | | 46,517 | 5,002,495 |
| Krones AG (Industrials, Machinery) | | | | | 20,928 | 1,824,149 |
| TAG Immobilien AG (Real estate, Real estate management & development) | | | | | 136,860 | 4,230,321 |
| | | | | | | 12,782,438 |
| Ireland: 0.80% | | | | | | |
| Irish Residential Properties REIT plc (Real estate, Equity REITs) | | | | | 1,202,337 | 2,350,398 |
| Italy: 2.91% | | | | | | |
| De'Longhi SpA (Consumer discretionary, Household durables) | | | | | 51,306 | 2,244,014 |
| GVS SpA (Industrials, Machinery) † | | | | | 190,153 | 3,314,865 |
| Interpump Group SpA (Industrials, Machinery) | | | | | 57,040 | 3,037,931 |
| | | | | | | 8,596,810 |
| Japan: 9.10% | | | | | | |
| Aeon Delight Company Limited (Industrials, Commercial services & supplies) | | | | | 92,800 | 2,831,805 |
| Daiseki Company Limited (Industrials, Commercial services & supplies) | | | | | 86,500 | 3,252,951 |
| DTS Corporation (Information technology, IT services) | | | | | 159,200 | 3,736,371 |
| Fuji Seal International Incorporated (Materials, Containers & packaging) | | | | | 125,600 | 2,789,196 |
| Horiba Limited (Information technology, Electronic equipment, instruments & components) | | | | | 24,300 | 1,580,867 |
The accompanying notes are an integral part of these financial statements.
Wells Fargo Global Small Cap Fund | 7
Portfolio of investments—April 30, 2021 (unaudited)
| | | | | | Shares | Value |
| Japan: (continued) | | | | | | |
| Meitec Corporation (Industrials, Professional services) | | | | | 51,400 | $ 2,854,772 |
| Nihon Parkerizing Company Limited (Materials, Chemicals) | | | | | 255,100 | 2,464,870 |
| ORIX JREIT Incorporated (Real estate, Equity REITs) | | | | | 1,685 | 2,972,532 |
| San-A Company Limited (Consumer staples, Food & staples retailing) | | | | | 29,800 | 1,142,483 |
| Sumitomo Warehouse Company Limited (Industrials, Transportation infrastructure) | | | | | 167,600 | 2,166,884 |
| Taikisha Limited (Industrials, Construction & engineering) | | | | | 40,400 | 1,086,797 |
| | | | | | | 26,879,528 |
| Luxembourg: 0.26% | | | | | | |
| Stabilus SA (Industrials, Machinery) | | | | | 9,925 | 775,601 |
| Netherlands: 0.41% | | | | | | |
| Brunel International NV (Consumer discretionary, Professional services) † | | | | | 44,684 | 598,456 |
| TKH Group NV (Industrials, Electrical equipment) | | | | | 12,645 | 604,449 |
| | | | | | | 1,202,905 |
| Norway: 0.52% | | | | | | |
| Atea ASA (Information technology, IT services) | | | | | 80,475 | 1,542,985 |
| Spain: 1.88% | | | | | | |
| Vidrala SA (Materials, Containers & packaging) | | | | | 14,767 | 1,661,739 |
| Viscofan SA (Consumer staples, Food products) | | | | | 56,838 | 3,888,174 |
| | | | | | | 5,549,913 |
| Sweden: 1.89% | | | | | | |
| AAK AB (Consumer staples, Food products) | | | | | 102,574 | 2,351,839 |
| Hexpol AB (Materials, Chemicals) | | | | | 106,559 | 1,309,716 |
| Loomis AB (Industrials, Commercial services & supplies) « | | | | | 58,521 | 1,921,078 |
| | | | | | | 5,582,633 |
| Switzerland: 0.95% | | | | | | |
| Bossard Holding AG (Industrials, Trading companies & distributors) | | | | | 4,487 | 1,078,452 |
| Bucher Industries AG (Industrials, Machinery) | | | | | 3,306 | 1,734,722 |
| | | | | | | 2,813,174 |
| United Kingdom: 9.31% | | | | | | |
| Britvic plc (Consumer staples, Beverages) | | | | | 348,749 | 4,250,470 |
| Domino's Pizza Group plc (Consumer discretionary, Hotels, restaurants & leisure) | | | | | 456,335 | 2,411,226 |
| Elementis plc (Materials, Chemicals) † | | | | | 1,032,539 | 2,133,281 |
| Mears Group plc (Industrials, Commercial services & supplies) † | | | | | 108,042 | 290,962 |
| Micro Focus International plc (Information technology, Software) | | | | | 150,922 | 1,079,671 |
| Morgan Advanced Materials plc (Industrials, Machinery) | | | | | 290,463 | 1,189,391 |
| S4 Capital plc (Communication services, Media) † | | | | | 957,334 | 7,390,682 |
| Samarkand Group plc (Information technology, IT services) † | | | | | 600,000 | 1,286,448 |
| ScION Tech Growth I (Information technology, IT services) † | | | | | 95,400 | 963,540 |
| Spectris plc (Information technology, Electronic equipment, instruments & components) | | | | | 102,390 | 4,601,340 |
| Tate & Lyle plc (Consumer staples, Food products) | | | | | 171,527 | 1,895,098 |
| | | | | | | 27,492,109 |
| United States: 50.33% | | | | | | |
| Acies Acquisition Corporation (Financials, Diversified financial services) † | | | | | 13,500 | 135,000 |
The accompanying notes are an integral part of these financial statements.
8 | Wells Fargo Global Small Cap Fund
Portfolio of investments—April 30, 2021 (unaudited)
| | | | | | Shares | Value |
| United States: (continued) | | | | | | |
| Balchem Corporation (Materials, Chemicals) | | | | | 55,600 | $ 7,071,764 |
| Blackbaud Incorporated (Information technology, Software) † | | | | | 50,000 | 3,556,000 |
| Bottomline Technologies (DE) Incorporated (Information technology, Software) † | | | | | 82,600 | 4,011,056 |
| Brooks Automation Incorporated (Information technology, Semiconductors & semiconductor equipment) | | | | | 20,100 | 2,036,733 |
| CBIZ Incorporated (Industrials, Professional services) † | | | | | 234,939 | 7,891,601 |
| Central Garden & Pet Company Class A (Consumer staples, Household products) † | | | | | 149,046 | 7,343,496 |
| CSW Industrials Incorporated (Industrials, Building products) | | | | | 49,863 | 6,751,949 |
| CyberArk Software Limited (Information technology, Software) † | | | | | 23,600 | 3,315,800 |
| Denny’s Corporation (Consumer discretionary, Hotels, restaurants & leisure) † | | | | | 505,354 | 9,571,405 |
| DSP Group Incorporated (Information technology, Semiconductors & semiconductor equipment) † | | | | | 139,400 | 1,936,266 |
| E2open Parent Holding Incorporated (Information technology, Software) †« | | | | | 362,590 | 3,966,735 |
| Empower Limited Class A (Financials, Diversified financial services) † | | | | | 232,082 | 2,318,499 |
| EnPro Industries Incorporated (Industrials, Machinery) | | | | | 47,800 | 4,094,070 |
| FARO Technologies Incorporated (Information technology, Electronic equipment, instruments & components) † | | | | | 51,440 | 3,901,467 |
| Gibraltar Industries Incorporated (Industrials, Building products) † | | | | | 56,300 | 5,171,718 |
| Global Blue Group Holding AG (Information technology, IT services) ♦† | | | | | 225,000 | 2,308,500 |
| Helen of Troy Limited (Consumer discretionary, Household durables) † | | | | | 54,000 | 11,405,340 |
| ICU Medical Incorporated (Health care, Health care equipment & supplies) † | | | | | 29,540 | 6,152,296 |
| Innospec Incorporated (Materials, Chemicals) | | | | | 115,316 | 11,232,932 |
| ManTech International Corporation Class A (Industrials, Professional services) | | | | | 20,600 | 1,758,210 |
| Mayville Engineering Company (Industrials, Machinery) † | | | | | 540,900 | 8,443,449 |
| Natus Medical Incorporated (Health care, Health care equipment & supplies) † | | | | | 168,700 | 4,310,285 |
| Neogen Corporation (Health care, Health care equipment & supplies) † | | | | | 47,100 | 4,522,071 |
| Owens & Minor Incorporated (Health care, Health care providers & services) | | | | | 84,363 | 3,044,661 |
| PAE Incorporated (Industrials, Aerospace & defense) † | | | | | 218,700 | 1,961,739 |
| Poema Global Holdings Corporation (Financials, Diversified financial services) † | | | | | 115,000 | 1,161,500 |
| Progress Software Corporation (Information technology, Software) | | | | | 110,500 | 4,824,430 |
| Rogers Corporation (Information technology, Electronic equipment, instruments & components) † | | | | | 9,500 | 1,860,480 |
| Standex International Corporation (Industrials, Machinery) | | | | | 22,551 | 2,138,286 |
| Stepan Company (Materials, Chemicals) | | | | | 36,600 | 4,782,156 |
| Tailwind International Acquisition Corporation (Financials, Diversified financial services) † | | | | | 49,569 | 495,194 |
| Telos Corporation (Information technology, Software) † | | | | | 9,623 | 319,291 |
| Tupperware Brands Corporation (Consumer discretionary, Household durables) † | | | | | 98,607 | 2,403,053 |
| UFP Industries Incorporated (Industrials, Building products) | | | | | 12,300 | 1,033,692 |
| Vesper Healthcare Acquisition Corporation (Consumer discretionary, Health care providers & services) †« | | | | | 128,085 | 1,481,943 |
| | | | | | | 148,713,067 |
| Total Common stocks (Cost $207,876,482) | | | | | | 287,172,367 |
| Other instruments: 0.00% | | | | | | |
| Acies Acquisition Corporation (Acquired 2-1-2021, commitment amount $1,500,000, cost $0) ♦‡†>= | | | | | 150,000 | 0 |
The accompanying notes are an integral part of these financial statements.
Wells Fargo Global Small Cap Fund | 9
Portfolio of investments—April 30, 2021 (unaudited)
| | | | | | Shares | Value |
| Other instruments: 0.00% (continued) | | | | | | |
| Fortress Value Acquisition Corporation (Acquired 2-19-2021, commitment amount $2,713,000, cost $0) ♦‡†>= | | | | | 271,300 | $ 0 |
| Tailwind Acquisition Corporation (Acquired 3-1-2021, commitment amount $1,500,000 cost $0) ♦‡†>= | | | | | 150,000 | 0 |
| Total Other instruments (Cost $0) | | | | | | 0 |
| | | Yield | | | | |
| Short-term investments: 5.65% | | | | | | |
| Investment companies: 5.65% | | | | | | |
| Securities Lending Cash Investments LLC ♠∩∞ | | 0.03% | | | 8,360,410 | 8,360,410 |
| Wells Fargo Government Money Market Fund Select Class ♠∞# | | 0.03 | | | 8,338,035 | 8,338,035 |
| Total Short-term investments (Cost $16,698,445) | | | | | | 16,698,445 |
| Total investments in securities (Cost $224,574,927) | 102.85% | | | | | 303,870,812 |
| Other assets and liabilities, net | (2.85) | | | | | (8,423,320) |
| Total net assets | 100.00% | | | | | $295,447,492 |
| † | Non-income-earning security |
| ♦ | The security is fair valued in accordance with procedures approved by the Board of Trustees. |
| ‡ | Security is valued using significant unobservable inputs. |
| > | Restricted security as to resale, excluding Rule 144A securities. The Fund held restricted securities with an aggregate current value of $0 (original aggregate cost of $5,713,000), representing 0.00% of its net assets as of period end. |
| = | All or a portion of the position represents an unfunded purchase commitment. The Fund held securities with an aggregate unfunded commitment amount of $5,713,000 representing 1.93% of its net assets as of period end. |
| # | All or a portion of this security is segregated as collateral for investments in unfunded restricted securities. |
| « | All or a portion of this security is on loan. |
| ♠ | The issuer of the security is an affiliate of the Fund as defined in the Investment Company Act of 1940. |
| ∩ | The investment is a non-registered investment company purchased with cash collateral received from securities on loan. |
| ∞ | The rate represents the 7-day annualized yield at period end. |
| Abbreviations: |
| REIT | Real estate investment trust |
Investments in affiliates
An affiliated investment is an investment in which the Fund owns at least 5% of the outstanding voting shares of the issuer or as a result of other relationships, such as the Fund and the issuer having the same investment manager. Transactions with issuers that were either affiliates of the Fund at the beginning of the period or the end of the period were as follows:
| | Value,
beginning of
period | Purchases | Sales
proceeds | Net
realized
gains
(losses) | | Net
change in
unrealized
gains
(losses) | | Value,
end of
period | | % of
net
assets | Shares,
end
of period | Income
from
affiliated
securities |
| Short-term investments | | | | | | | | | | | | |
| Investment companies | | | | | | | | | | | | |
| Securities Lending Cash Investments LLC | $1,400,775 | $25,779,092 | $(18,819,457) | $0 | | $0 | | $ 8,360,410 | | | 8,360,410 | $ 857# |
| Wells Fargo Government Money Market Fund Select Class | 1,627,131 | 62,911,024 | (56,200,120) | 0 | | 0 | | 8,338,035 | | | 8,338,035 | 1,262 |
| | | | | $0 | | $0 | | $16,698,445 | | 5.65% | | $2,119 |
| # | Amount shown represents income before fees and rebates. |
The accompanying notes are an integral part of these financial statements.
10 | Wells Fargo Global Small Cap Fund
Statement of assets and liabilities—April 30, 2021 (unaudited)
| | |
| Assets | |
Investments in unaffiliated securities (including $7,956,438 of securities loaned), at value (cost $207,876,482)
| $ 287,172,367 |
Investments in affiliated securites, at value (cost $16,698,445)
| 16,698,445 |
Cash
| 83,912 |
Foreign currency, at value (cost $1,224,813)
| 1,224,919 |
Receivable for dividends
| 649,161 |
Receivable for Fund shares sold
| 262,304 |
Receivable for securities lending income, net
| 2,568 |
Prepaid expenses and other assets
| 25,575 |
Total assets
| 306,119,251 |
| Liabilities | |
Payable upon receipt of securities loaned
| 8,357,783 |
Payable for investments purchased
| 1,605,782 |
Payable for Fund shares redeemed
| 248,514 |
Management fee payable
| 247,306 |
Administration fees payable
| 45,025 |
Distribution fee payable
| 3,448 |
Trustees’ fees and expenses payable
| 2,041 |
Accrued expenses and other liabilities
| 161,860 |
Total liabilities
| 10,671,759 |
Total net assets
| $295,447,492 |
| Net assets consist of | |
Paid-in capital
| $ 191,058,518 |
Total distributable earnings
| 104,388,974 |
Total net assets
| $295,447,492 |
| Computation of net asset value and offering price per share | |
Net assets – Class A
| $ 153,145,974 |
Shares outstanding – Class A1
| 2,944,864 |
Net asset value per share – Class A
| $52.00 |
Maximum offering price per share – Class A2
| $55.17 |
Net assets – Class C
| $ 5,145,964 |
Shares outstanding – Class C1
| 149,755 |
Net asset value per share – Class C
| $34.36 |
Net assets – Administrator Class
| $ 27,281,476 |
Shares outstanding – Administrator Class1
| 497,002 |
Net asset value per share – Administrator Class
| $54.89 |
Net assets – Institutional Class
| $ 109,874,078 |
Shares outstanding – Institutional Class1
| 2,007,639 |
Net asset value per share – Institutional Class
| $54.73 |
| 1 | The Fund has an unlimited number of authorized shares |
| 2 | Maximum offering price is computed as 100/94.25 of net asset value. On investments of $50,000 or more, the offering price is reduced. |
The accompanying notes are an integral part of these financial statements.
Wells Fargo Global Small Cap Fund | 11
Statement of operations—six months ended April 30, 2021 (unaudited)
| | |
| Investment income | |
Dividends (net of foreign withholdings taxes of $88,208)
| $ 1,307,674 |
Income from affiliated securities
| 12,779 |
Total investment income
| 1,320,453 |
| Expenses | |
Management fee
| 1,306,582 |
| Administration fees | |
Class A
| 148,852 |
Class C
| 5,392 |
Administrator Class
| 16,281 |
Institutional Class
| 67,030 |
| Shareholder servicing fees | |
Class A
| 177,204 |
Class C
| 6,419 |
Administrator Class
| 31,234 |
| Distribution fee | |
Class C
| 19,258 |
Custody and accounting fees
| 31,916 |
Professional fees
| 29,764 |
Registration fees
| 22,772 |
Shareholder report expenses
| 17,310 |
Trustees’ fees and expenses
| 9,610 |
Other fees and expenses
| 11,967 |
Total expenses
| 1,901,591 |
| Less: Fee waivers and/or expense reimbursements | |
Fund-level
| (6,773) |
Class A
| (420) |
Administrator Class
| (1,319) |
Institutional Class
| (5,035) |
Net expenses
| 1,888,044 |
Net investment loss
| (567,591) |
| Realized and unrealized gains (losses) on investments | |
Net realized gains on investments
| 30,026,744 |
Net change in unrealized gains (losses) on investments
| 60,585,917 |
Net realized and unrealized gains (losses) on investments
| 90,612,661 |
Net increase in net assets resulting from operations
| $90,045,070 |
The accompanying notes are an integral part of these financial statements.
12 | Wells Fargo Global Small Cap Fund
Statement of changes in net assets
| | Global Small Cap |
| | Six months ended
April 30, 2021
(unaudited) | Year ended
October 31, 2020 |
| Operations | | | | |
Net investment loss
| | $ (567,591) | | $ (330,379) |
Payment from affiliate
| | 0 | | 31,816 |
Net realized gains (losses) on investments
| | 30,026,744 | | (2,457,998) |
Net change in unrealized gains (losses) on investments
| | 60,585,917 | | (10,036,656) |
Net increase (decrease) in net assets resulting from operations
| | 90,045,070 | | (12,793,217) |
| Distributions to shareholders from | | | | |
| Net investment income and net realized gains | | | | |
Class A
| | 0 | | (6,017,486) |
Class C
| | 0 | | (322,666) |
Administrator Class
| | 0 | | (1,051,538) |
Institutional Class
| | 0 | | (4,699,341) |
Total distributions to shareholders
| | 0 | | (12,091,031) |
| Capital share transactions | Shares | | Shares | |
| Proceeds from shares sold | | | | |
Class A
| 107,589 | 4,922,401 | 99,738 | 3,668,097 |
Class C
| 1,579 | 48,008 | 38,536 | 1,005,317 |
Administrator Class
| 46,478 | 2,336,399 | 77,261 | 2,930,808 |
Institutional Class
| 129,522 | 6,508,270 | 638,138 | 25,177,197 |
| | | 13,815,078 | | 32,781,419 |
| Reinvestment of distributions | | | | |
Class A
| 0 | 0 | 138,110 | 5,585,707 |
Class C
| 0 | 0 | 11,409 | 301,552 |
Administrator Class
| 0 | 0 | 24,314 | 1,036,690 |
Institutional Class
| 0 | 0 | 107,830 | 4,582,469 |
| | | 0 | | 11,506,418 |
| Payment for shares redeemed | | | | |
Class A
| (233,576) | (10,997,497) | (704,685) | (25,380,114) |
Class C
| (79,838) | (2,252,602) | (105,548) | (2,603,717) |
Administrator Class
| (67,628) | (3,327,265) | (171,844) | (6,616,175) |
Institutional Class
| (375,818) | (18,115,600) | (973,251) | (36,235,708) |
| | | (34,692,964) | | (70,835,714) |
Net decrease in net assets resulting from capital share transactions
| | (20,877,886) | | (26,547,877) |
Total increase (decrease) in net assets
| | 69,167,184 | | (51,432,125) |
| Net assets | | | | |
Beginning of period
| | 226,280,308 | | 277,712,433 |
End of period
| | $295,447,492 | | $226,280,308 |
The accompanying notes are an integral part of these financial statements.
Wells Fargo Global Small Cap Fund | 13
Financial highlights
(For a share outstanding throughout each period)
| | | Year ended October 31 |
| Class A | Six months ended
April 30, 2021
(unaudited) | 2020 | 2019 | 2018 | 2017 | 2016 |
Net asset value, beginning of period
| $36.87 | $39.97 | $39.97 | $45.81 | $38.61 | $37.23 |
Net investment income (loss)
| (0.13) 1 | (0.10) 1 | 0.18 1 | 0.10 | 0.21 1 | 0.26 1 |
Net realized and unrealized gains (losses) on investments
| 15.26 | (1.29) | 3.26 | (0.72) | 9.68 | 2.92 |
Total from investment operations
| 15.13 | (1.39) | 3.44 | (0.62) | 9.89 | 3.18 |
| Distributions to shareholders from | | | | | | |
Net investment income
| 0.00 | (0.54) | (0.03) | (0.22) | (0.34) | (0.21) |
Net realized gains
| 0.00 | (1.17) | (3.41) | (5.00) | (2.35) | (1.59) |
Total distributions to shareholders
| 0.00 | (1.71) | (3.44) | (5.22) | (2.69) | (1.80) |
Net asset value, end of period
| $52.00 | $36.87 | $39.97 | $39.97 | $45.81 | $38.61 |
Total return2
| 41.06% | (3.81)% | 9.75% | (1.82)% | 26.90% | 9.12% |
| Ratios to average net assets (annualized) | | | | | | |
Gross expenses
| 1.50% | 1.54% | 1.53% | 1.54% | 1.54% | 1.55% |
Net expenses
| 1.50% | 1.53% | 1.53% | 1.54% | 1.54% | 1.55% |
Net investment income (loss)
| (0.54)% | (0.27)% | 0.47% | 0.16% | 0.52% | 0.73% |
| Supplemental data | | | | | | |
Portfolio turnover rate
| 29% | 65% | 62% | 51% | 70% | 70% |
Net assets, end of period (000s omitted)
| $153,146 | $113,234 | $141,388 | $132,906 | $155,828 | $138,805 |
| 1 | Calculated based upon average shares outstanding |
| 2 | Total return calculations do not include any sales charges. Returns for periods of less than one year are not annualized. |
The accompanying notes are an integral part of these financial statements.
14 | Wells Fargo Global Small Cap Fund
Financial highlights
(For a share outstanding throughout each period)
| | | Year ended October 31 |
| Class C | Six months ended
April 30, 2021
(unaudited) | 2020 | 2019 | 2018 | 2017 | 2016 |
Net asset value, beginning of period
| $24.46 | $26.68 | $28.02 | $33.65 | $28.98 | $28.39 |
Net investment loss
| (0.20) 1 | (0.25) 1 | (0.07) 1 | (0.20) | (0.06) 1 | (0.01) 1 |
Payment from affiliate
| 0.00 | 0.07 | 0.00 | 0.00 | 0.00 | 0.00 |
Net realized and unrealized gains (losses) on investments
| 10.10 | (0.87) | 2.14 | (0.43) | 7.15 | 2.19 |
Total from investment operations
| 9.90 | (1.05) | 2.07 | (0.63) | 7.09 | 2.18 |
| Distributions to shareholders from | | | | | | |
Net investment income
| 0.00 | 0.00 | 0.00 | 0.00 | (0.07) | 0.00 |
Net realized gains
| 0.00 | (1.17) | (3.41) | (5.00) | (2.35) | (1.59) |
Total distributions to shareholders
| 0.00 | (1.17) | (3.41) | (5.00) | (2.42) | (1.59) |
Net asset value, end of period
| $34.36 | $24.46 | $26.68 | $28.02 | $33.65 | $28.98 |
Total return2
| 40.47% | (4.25)% 3 | 8.90% | (2.56)% | 25.95% | 8.31% |
| Ratios to average net assets (annualized) | | | | | | |
Gross expenses
| 2.25% | 2.29% | 2.28% | 2.29% | 2.29% | 2.30% |
Net expenses
| 2.25% | 2.28% | 2.28% | 2.29% | 2.29% | 2.30% |
Net investment loss
| (1.29)% | (1.00)% | (0.26)% | (0.59)% | (0.20)% | (0.02)% |
| Supplemental data | | | | | | |
Portfolio turnover rate
| 29% | 65% | 62% | 51% | 70% | 70% |
Net assets, end of period (000s omitted)
| $5,146 | $5,576 | $7,567 | $26,167 | $31,487 | $32,863 |
| 1 | Calculated based upon average shares outstanding |
| 2 | Total return calculations do not include any sales charges. Returns for periods of less than one year are not annualized. |
| 3 | During the year ended October 31, 2020, the Fund received a payment from an affiliate which had a 0.28% impact on the total return. See Note 4 in the Notes to Financial Statements for additional information. |
The accompanying notes are an integral part of these financial statements.
Wells Fargo Global Small Cap Fund | 15
Financial highlights
(For a share outstanding throughout each period)
| | | Year ended October 31 |
| Administrator Class | Six months ended
April 30, 2021
(unaudited) | 2020 | 2019 | 2018 | 2017 | 2016 |
Net asset value, beginning of period
| $38.90 | $42.06 | $41.90 | $47.78 | $40.15 | $38.65 |
Net investment income (loss)
| (0.11) 1 | (0.05) 1 | 0.25 1 | 0.14 1 | 0.29 1 | 0.41 |
Payment from affiliate
| 0.00 | 0.03 | 0.00 | 0.00 | 0.00 | 0.00 |
Net realized and unrealized gains (losses) on investments
| 16.10 | (1.36) | 3.42 | (0.73) | 10.07 | 2.95 |
Total from investment operations
| 15.99 | (1.38) | 3.67 | (0.59) | 10.36 | 3.36 |
| Distributions to shareholders from | | | | | | |
Net investment income
| 0.00 | (0.61) | (0.10) | (0.29) | (0.38) | (0.27) |
Net realized gains
| 0.00 | (1.17) | (3.41) | (5.00) | (2.35) | (1.59) |
Total distributions to shareholders
| 0.00 | (1.78) | (3.51) | (5.29) | (2.73) | (1.86) |
Net asset value, end of period
| $54.89 | $38.90 | $42.06 | $41.90 | $47.78 | $40.15 |
Total return2
| 41.11% | (3.61)% 3 | 9.90% | (1.68)% | 27.04% | 9.30% |
| Ratios to average net assets (annualized) | | | | | | |
Gross expenses
| 1.42% | 1.46% | 1.45% | 1.46% | 1.46% | 1.47% |
Net expenses
| 1.40% | 1.40% | 1.40% | 1.40% | 1.40% | 1.40% |
Net investment income (loss)
| (0.44)% | (0.13)% | 0.63% | 0.30% | 0.68% | 0.90% |
| Supplemental data | | | | | | |
Portfolio turnover rate
| 29% | 65% | 62% | 51% | 70% | 70% |
Net assets, end of period (000s omitted)
| $27,281 | $20,157 | $24,746 | $27,965 | $30,327 | $30,832 |
| 1 | Calculated based upon average shares outstanding |
| 2 | Returns for periods of less than one year are not annualized. |
| 3 | During the year ended October 31, 2020, the Fund received a payment from an affiliate which had a 0.08% impact on the total return. See Note 4 in the Notes to Financial Statements for additional information. |
The accompanying notes are an integral part of these financial statements.
16 | Wells Fargo Global Small Cap Fund
Financial highlights
(For a share outstanding throughout each period)
| | | Year ended October 31 |
| Institutional Class | Six months ended
April 30, 2021
(unaudited) | 2020 | 2019 | 2018 | 2017 | 2016 |
Net asset value, beginning of period
| $38.74 | $41.92 | $41.80 | $47.68 | $40.08 | $38.63 |
Net investment income (loss)
| (0.06) | 0.02 | 0.36 | 0.25 | 0.38 | 0.45 |
Net realized and unrealized gains (losses) on investments
| 16.05 | (1.31) | 3.39 | (0.74) | 10.06 | 3.00 |
Total from investment operations
| 15.99 | (1.29) | 3.75 | (0.49) | 10.44 | 3.45 |
| Distributions to shareholders from | | | | | | |
Net investment income
| 0.00 | (0.72) | (0.22) | (0.39) | (0.49) | (0.41) |
Net realized gains
| 0.00 | (1.17) | (3.41) | (5.00) | (2.35) | (1.59) |
Total distributions to shareholders
| 0.00 | (1.89) | (3.63) | (5.39) | (2.84) | (2.00) |
Net asset value, end of period
| $54.73 | $38.74 | $41.92 | $41.80 | $47.68 | $40.08 |
Total return1
| 41.28% | (3.42)% | 10.17% | (1.45)% | 27.38% | 9.56% |
| Ratios to average net assets (annualized) | | | | | | |
Gross expenses
| 1.17% | 1.21% | 1.20% | 1.21% | 1.21% | 1.22% |
Net expenses
| 1.15% | 1.15% | 1.15% | 1.15% | 1.15% | 1.15% |
Net investment income (loss)
| (0.19)% | 0.11% | 0.86% | 0.54% | 1.01% | 1.20% |
| Supplemental data | | | | | | |
Portfolio turnover rate
| 29% | 65% | 62% | 51% | 70% | 70% |
Net assets, end of period (000s omitted)
| $109,874 | $87,313 | $104,011 | $118,625 | $41,087 | $12,531 |
| 1 | Returns for periods of less than one year are not annualized. |
The accompanying notes are an integral part of these financial statements.
Wells Fargo Global Small Cap Fund | 17
Notes to financial statements (unaudited)
1. ORGANIZATION
Wells Fargo Funds Trust (the "Trust"), a Delaware statutory trust organized on March 10, 1999, is an open-end management investment company registered under the Investment Company Act of 1940, as amended (the "1940 Act"). As an investment company, the Trust follows the accounting and reporting guidance in Financial Accounting Standards Board ("FASB") Accounting Standards Codification Topic 946, Financial Services – Investment Companies. These financial statements report on the Wells Fargo Global Small Cap Fund (the "Fund") which is a diversified series of the Trust.
On February 23, 2021, Wells Fargo & Company announced that it has entered into a definitive agreement to sell Wells Fargo Asset Management ("WFAM") to GTCR LLC and Reverence Capital Partners, L.P. WFAM is the trade name used by the asset management businesses of Wells Fargo & Company and includes Wells Fargo Funds Management, LLC, the investment manager to the Fund, Wells Capital Management Incorporated and Wells Fargo Asset Management (International) Limited, both registered investment advisers providing sub-advisory services to certain funds, and Wells Fargo Funds Distributor, LLC, the Fund's principal underwriter. As part of the transaction, Wells Fargo & Company will own a 9.9% equity interest and will continue to serve as an important client and distribution partner.
Consummation of the transaction will result in the automatic termination of the Fund's investment management agreement and subadvisory agreement. The Fund's Board of Trustees approved a new investment management and new subadvisory agreement and approved submitting the agreements to the Fund’s shareholders for approval at a special meeting of shareholders expected to be held on July 15, 2021. Shareholders of record of the Fund at the close of business on May 28, 2021 are entitled to vote at the meeting. If shareholders approve the new agreements, they would take effect upon the closing of the transaction. The transaction is expected to close in the second half of 2021, subject to customary closing conditions.
This shareholder report is not asking you for a proxy. A separate proxy statement with more detailed information about the transaction will be provided to Fund shareholders and should be reviewed carefully.
2. SIGNIFICANT ACCOUNTING POLICIES
The following significant accounting policies, which are consistently followed in the preparation of the financial statements of the Fund, are in conformity with U.S. generally accepted accounting principles which require management to make estimates and assumptions that affect the reported amounts of assets and liabilities, disclosure of contingent assets and liabilities at the date of the financial statements, and the reported amounts of income and expenses during the reporting period. Actual results could differ from those estimates.
Securities valuation
All investments are valued each business day as of the close of regular trading on the New York Stock Exchange (generally 4 p.m. Eastern Time), although the Fund may deviate from this calculation time under unusual or unexpected circumstances.
Equity securities that are listed on a foreign or domestic exchange or market are valued at the official closing price or, if none, the last sales price. If no sale occurs on the principal exchange or market that day, a fair value price will be determined in accordance with the Fund’s Valuation Procedures.
The values of securities denominated in foreign currencies are translated into U.S. dollars at rates provided by an independent foreign currency pricing source at a time each business day specified by the Wells Fargo Asset Management Pricing Committee at Wells Fargo Funds Management, LLC ("Funds Management").
Many securities markets and exchanges outside the U.S. close prior to the close of the New York Stock Exchange and therefore may not fully reflect trading or events that occur after the close of the principal exchange in which the foreign securities are traded, but before the close of the New York Stock Exchange. If such trading or events are expected to materially affect the value of such securities, then fair value pricing procedures approved by the Board of Trustees of the Fund are applied. These procedures take into account multiple factors including movements in U.S. securities markets after foreign exchanges close. Foreign securities that are fair valued under these procedures are categorized as Level 2 and the application of these procedures may result in transfers between Level 1 and Level 2. Depending on market activity, such fair valuations may be frequent. Such fair value pricing may result in net asset values that are higher or lower than net asset values based on the last reported sales price or latest quoted bid price. On April 30, 2021, such fair value pricing was used in pricing certain foreign securities.
Investments in registered open-end investment companies are valued at net asset value. Interests in non-registered investment companies that are redeemable at net asset value are fair valued normally at net asset value.
Investments which are not valued using any of the methods discussed above are valued at their fair value, as determined in good faith by the Board of Trustees. The Board of Trustees has established a Valuation Committee comprised of the Trustees
18 | Wells Fargo Global Small Cap Fund
Notes to financial statements (unaudited)
and has delegated to it the authority to take any actions regarding the valuation of portfolio securities that the Valuation Committee deems necessary or appropriate, including determining the fair value of portfolio securities, unless the determination has been delegated to the Wells Fargo Asset Management Pricing Committee. The Board of Trustees retains the authority to make or ratify any valuation decisions or approve any changes to the Valuation Procedures as it deems appropriate. On a quarterly basis, the Board of Trustees receives reports on any valuation actions taken by the Valuation Committee or the Wells Fargo Asset Management Pricing Committee which may include items for ratification.
Foreign currency translation
The accounting records of the Fund are maintained in U.S. dollars. The values of other assets and liabilities denominated in foreign currencies are translated into U.S. dollars at rates provided by an independent foreign currency pricing source at a time each business day specified by the Wells Fargo Asset Management Pricing Committee. Purchases and sales of securities, and income and expenses are converted at the rate of exchange on the respective dates of such transactions. Net realized foreign exchange gains or losses arise from sales of foreign currencies, currency gains or losses realized between the trade and settlement dates on securities transactions, and the difference between the amounts of dividends, interest and foreign withholding taxes recorded and the U.S. dollar equivalent of the amounts actually paid or received. Net unrealized foreign exchange gains and losses arise from changes in the fair value of assets and liabilities other than investments in securities resulting from changes in exchange rates. The changes in net assets arising from changes in exchange rates of securities and the changes in net assets resulting from changes in market prices of securities are not separately presented. Such changes are included in net realized and unrealized gains or losses from investments.
Securities lending
The Fund may lend its securities from time to time in order to earn additional income in the form of fees or interest on securities received as collateral or the investment of any cash received as collateral. When securities are on loan, the Fund receives interest or dividends on those securities. Cash collateral received in connection with its securities lending transactions is invested in Securities Lending Cash Investments, LLC (the "Securities Lending Fund"). Investments in Securities Lending Fund are valued at the evaluated bid price provided by an independent pricing service. Income earned from investment in the Securities Lending Fund (net of fees and rebates), if any, is included in income from affiliated securities on the Statement of Operations.
In a securities lending transaction, the net asset value of the Fund is affected by an increase or decrease in the value of the securities loaned and by an increase or decrease in the value of the instrument in which collateral is invested. The amount of securities lending activity undertaken by the Fund fluctuates from time to time. The Fund has the right under the lending agreement to recover the securities from the borrower on demand. In the event of default or bankruptcy by the borrower, the Fund may be prevented from recovering the loaned securities or gaining access to the collateral or may experience delays or costs in doing so. In such an event, the terms of the agreement allow the unaffiliated securities lending agent to use the collateral to purchase replacement securities on behalf of the Fund or pay the Fund the market value of the loaned securities. The Fund bears the risk of loss with respect to depreciation of its investment of the cash collateral.
Forward commitments
The Fund may enter into forward commitment agreements, which agreements obligate the Fund, for a set period, to buy a certain amount of a security that may be issued and sold on a private placement basis, at the option of the issuer. The price of a security purchased pursuant to a forward commitment agreement is set at the time of the agreement. There is no assurance that the securities subject to a forward commitment agreement will be issued or, if such securities are issued, the value of the securities on the date of issuance may be more or less than the purchase price. The Fund will record the purchase of a security acquired under a forward commitment agreement, and will reflect the value of the security in the Fund’s net asset value, on the date on which the security can reasonably be expected to be issued.
Security transactions and income recognition
Securities transactions are recorded on a trade date basis. Realized gains or losses are recorded on the basis of identified cost.
Dividend income is recognized on the ex-dividend date, except for certain dividends from foreign securities, which are recorded as soon as the custodian verifies the ex-dividend date. Dividend income from foreign securities is recorded net of foreign taxes withheld where recovery of such taxes is not assured.
Distributions to shareholders
Distributions to shareholders from net investment income and any net realized gains are recorded on the ex-dividend date and paid at least annually. Such distributions are determined in accordance with income tax regulations and may differ from U.S. generally accepted accounting principles. Dividend sources are estimated at the time of declaration. The tax character of
Wells Fargo Global Small Cap Fund | 19
Notes to financial statements (unaudited)
distributions is determined as of the Fund's fiscal year end. Therefore, a portion of the Fund's distributions made prior to the Fund’s fiscal year end may be categorized as a tax return of capital at year end.
Federal and other taxes
The Fund intends to continue to qualify as a regulated investment company by distributing substantially all of its investment company taxable income and any net realized capital gains (after reduction for capital loss carryforwards) sufficient to relieve it from all, or substantially all, federal income taxes. Accordingly, no provision for federal income taxes was required.
The Fund’s income and federal excise tax returns and all financial records supporting those returns for the prior three fiscal years are subject to examination by the federal and Delaware revenue authorities. Management has analyzed the Fund's tax positions taken on federal, state, and foreign tax returns for all open tax years and does not believe that there are any uncertain tax positions that require recognition of a tax liability.
As of April 30, 2021, the aggregate cost of all investments for federal income tax purposes was $224,914,985 and the unrealized gains (losses) consisted of:
| Gross unrealized gains | $81,015,585 |
| Gross unrealized losses | (2,059,758) |
| Net unrealized gains | $78,955,827 |
As of October 31, 2020, the Fund had capital loss carryforwards which consisted of $1,581,392 in long-term capital losses.
As of October 31, 2020, the Fund had a qualified late-year ordinary loss of $201,332 which was recognized on the first day of the current fiscal year.
Class allocations
The separate classes of shares offered by the Fund differ principally in applicable sales charges, distribution, shareholder servicing, and administration fees. Class specific expenses are charged directly to that share class. Investment income, common fund-level expenses, and realized and unrealized gains (losses) on investments are allocated daily to each class of shares based on the relative proportion of net assets of each class.
3. FAIR VALUATION MEASUREMENTS
Fair value measurements of investments are determined within a framework that has established a fair value hierarchy based upon the various data inputs utilized in determining the value of the Fund’s investments. The three-level hierarchy gives the highest priority to unadjusted quoted prices in active markets for identical assets or liabilities (Level 1) and the lowest priority to unobservable inputs (Level 3). The Fund’s investments are classified within the fair value hierarchy based on the lowest level of input that is significant to the fair value measurement. The inputs are summarized into three broad levels as follows:
| ■ | Level 1 – quoted prices in active markets for identical securities |
| ■ | Level 2 – other significant observable inputs (including quoted prices for similar securities, interest rates, prepayment speeds, credit risk, etc.) |
| ■ | Level 3 – significant unobservable inputs (including the Fund’s own assumptions in determining the fair value of investments) |
The inputs or methodologies used for valuing investments in securities are not necessarily an indication of the risk associated with investing in those securities.
20 | Wells Fargo Global Small Cap Fund
Notes to financial statements (unaudited)
The following is a summary of the inputs used in valuing the Fund’s assets and liabilities as of April 30, 2021:
| | Quoted prices
(Level 1) | Other significant
observable inputs
(Level 2) | Significant
unobservable inputs
(Level 3) | Total |
| Assets | | | | |
| Investments in: | | | | |
| Common stocks | | | | |
| Australia | $ 13,216,883 | $ 0 | $0 | $ 13,216,883 |
| Austria | 1,795,569 | 0 | 0 | 1,795,569 |
| Belgium | 3,980,757 | 0 | 0 | 3,980,757 |
| Canada | 14,195,699 | 0 | 0 | 14,195,699 |
| Denmark | 0 | 1,418,978 | 0 | 1,418,978 |
| France | 8,282,920 | 0 | 0 | 8,282,920 |
| Germany | 12,782,438 | 0 | 0 | 12,782,438 |
| Ireland | 2,350,398 | 0 | 0 | 2,350,398 |
| Italy | 8,596,810 | 0 | 0 | 8,596,810 |
| Japan | 26,879,528 | 0 | 0 | 26,879,528 |
| Luxembourg | 775,601 | 0 | 0 | 775,601 |
| Netherlands | 1,202,905 | 0 | 0 | 1,202,905 |
| Norway | 1,542,985 | 0 | 0 | 1,542,985 |
| Spain | 5,549,913 | 0 | 0 | 5,549,913 |
| Sweden | 5,582,633 | 0 | 0 | 5,582,633 |
| Switzerland | 2,813,174 | 0 | 0 | 2,813,174 |
| United Kingdom | 27,492,109 | 0 | 0 | 27,492,109 |
| United States | 146,404,567 | 2,308,500 | 0 | 148,713,067 |
| Other instruments | 0 | 0 | 0 | 0 |
| Short-term investments | | | | |
| Investment companies | 16,698,445 | 0 | 0 | 16,698,445 |
| Total assets | $300,143,334 | $3,727,478 | $0 | $303,870,812 |
Additional sector, industry or geographic detail, if any, is included in the Portfolio of Investments.
For the six months ended April 30, 2021, the Fund did not have any transfers into/out of Level 3.
4. TRANSACTIONS WITH AFFILIATES
Management fee
Funds Management, an indirect wholly owned subsidiary of Wells Fargo & Company ("Wells Fargo"), is the manager of the Fund and provides advisory and fund-level administrative services under an investment management agreement. Under the investment management agreement, Funds Management is responsible for, among other services, implementing the investment objectives and strategies of the Fund, supervising the subadviser and providing fund-level administrative services in connection with the Fund’s operations. As compensation for its services under the investment management agreement, Funds Management is entitled to receive a management fee at the following annual rate based on the Fund’s average daily net assets:
| Average daily net assets | Management fee |
| First $500 million | 0.950% |
| Next $500 million | 0.925 |
| Next $1 billion | 0.900 |
| Next $2 billion | 0.875 |
| Next $1 billion | 0.850 |
| Next $5 billion | 0.840 |
| Over $10 billion | 0.830 |
Wells Fargo Global Small Cap Fund | 21
Notes to financial statements (unaudited)
For the six months ended April 30, 2021, the management fee was equivalent to an annual rate of 0.95% of the Fund’s average daily net assets.
Funds Management has retained the services of a subadviser to provide daily portfolio management to the Fund. The fee for subadvisory services is borne by Funds Management. Wells Capital Management Incorporated ("WellsCap"), an affiliate of Funds Management and an indirect wholly owned subsidiary of Wells Fargo, is the subadviser to the Fund and is entitled to receive a fee from Funds Management at an annual rate starting at 0.55% and declining to 0.40% as the average daily net assets of the Fund increase.
Administration fees
Under a class-level administration agreement, Funds Management provides class-level administrative services to the Fund, which includes paying fees and expenses for services provided by the transfer agent, sub-transfer agents, omnibus account servicers and record-keepers. As compensation for its services under the class-level administration agreement, Funds Management receives an annual fee which is calculated based on the average daily net assets of each class as follows:
| | Class-level
administration fee |
| Class A | 0.21% |
| Class C | 0.21 |
| Administrator Class | 0.13 |
| Institutional Class | 0.13 |
Waivers and/or expense reimbursements
Funds Management has contractually waived and/or reimbursed management and administration fees to the extent necessary to maintain certain net operating expense ratios for the Fund. When each class of the Fund has exceeded its expense cap, Funds Management has waived fees and/or reimbursed expenses from fund-level expenses on a proportionate basis and then from class specific expenses. When only certain classes exceed their expense caps, waivers and/or reimbursements are applied against class specific expenses before fund-level expenses. Funds Management has committed through February 28, 2022 to waive fees and/or reimburse expenses to the extent necessary to cap expenses. Prior to or after the commitment expiration date, the cap may be increased or the commitment to maintain the cap may be terminated only with the approval of the Board of Trustees. The contractual expense caps are as follows:
| | Expense ratio caps |
| Class A | 1.55% |
| Class C | 2.30 |
| Administrator Class | 1.40 |
| Institutional Class | 1.15 |
Distribution fee
The Trust has adopted a distribution plan for Class C shares of the Fund pursuant to Rule 12b-1 under the 1940 Act. A distribution fee is charged to Class C shares and paid to Wells Fargo Funds Distributor, LLC ("Funds Distributor"), the principal underwriter, at an annual rate of 0.75% of the average daily net assets of Class C shares.
In addition, Funds Distributor is entitled to receive the front-end sales charge from the purchase of Class A shares and a contingent deferred sales charge on the redemption of certain Class A shares. Funds Distributor is also entitled to receive the contingent deferred sales charges from redemptions of Class C shares. For the six months ended April 30, 2021, Funds Distributor received $961 from the sale of Class A shares. No contingent deferred sales charges were incurred by Class A and Class C shares for the six months ended April 30, 2021.
Shareholder servicing fees
The Trust has entered into contracts with one or more shareholder servicing agents, whereby Class A, Class C, and Administrator Class of the Fund are charged a fee at an annual rate of 0.25% of the average daily net assets of each respective class. A portion of these total shareholder servicing fees were paid to affiliates of Wells Fargo.
22 | Wells Fargo Global Small Cap Fund
Notes to financial statements (unaudited)
Interfund transactions
The Fund may purchase or sell portfolio investment securities to certain other Wells Fargo affiliates pursuant to Rule 17a-7 under the 1940 Act and under procedures adopted by the Board of Trustees. The procedures have been designed to ensure that these interfund transactions, which do not incur broker commissions, are effected at current market prices. Pursuant to these procedures, the Fund had $1,827,015, $1,827,015 and $(265,070) in interfund purchases, sales and net realized gains (losses), respectively, during the six months ended April 30, 2021.
Other transactions
On August 14, 2020, Class C, and Administrator Class of the Fund was reimbursed by Funds Management in the amount of $16,192, and $15,624, respectively. The reimbursement was made in connection with resolving certain fee reimbursements.
5. INVESTMENT PORTFOLIO TRANSACTIONS
Purchases and sales of investments, excluding U.S. government obligations (if any) and short-term securities, for the six months ended April 30, 2021 were $76,662,054 and $104,743,564, respectively.
6. SECURITIES LENDING TRANSACTIONS
The Fund lends its securities through an unaffiliated securities lending agent and receives collateral in the form of cash or securities with a value at least equal to the value of the securities on loan. The value of the loaned securities is determined at the close of each business day and any increases or decreases in the required collateral are exchanged between the Fund and the counterparty on the next business day. Cash collateral received is invested in the Securities Lending Fund which seeks to provide a positive return compared to the daily Federal Funds Open Rate by investing in high-quality, U.S. dollar-denominated short-term money market instruments and is exempt from registration under Section 3(c)(7) of the 1940 Act. Securities Lending Fund is managed by Funds Management and is subadvised by WellsCap. Funds Management receives an advisory fee starting at 0.05% and declining to 0.01% as the average daily net assets of the Securities Lending Fund increase. All of the fees received by Funds Management are paid to WellsCap for its services as subadviser.
In the event of counterparty default or the failure of a borrower to return a loaned security, the Fund has the right to use the collateral to offset any losses incurred. As of April 30, 2021, the Fund had securities lending transactions with the following counterparties which are subject to offset:
| Counterparty | Value of
securities on
loan | Collateral
received1 | Net amount |
| Barclays Capital Incorporated | $2,136,175 | $(2,136,175) | $0 |
| Nomura Securities International Incorporated | 3,763,360 | (3,763,360) | 0 |
| Citigroup Global Markets Incorporated | 2,056,903 | (2,056,903) | 0 |
1 Collateral received within this table is limited to the collateral for the net transaction with the counterparty.
7. BANK BORROWINGS
The Trust (excluding the money market funds), Wells Fargo Master Trust and Wells Fargo Variable Trust are parties to a $350,000,000 revolving credit agreement whereby the Fund is permitted to use bank borrowings for temporary or emergency purposes, such as to fund shareholder redemption requests. Interest under the credit agreement is charged to the Fund based on a borrowing rate equal to the higher of the Federal Funds rate in effect on that day plus 1.25% or the overnight LIBOR rate in effect on that day plus 1.25%. In addition, an annual commitment fee equal to 0.25% of the unused balance is allocated to each participating fund.
For the six months ended April 30, 2021, there were no borrowings by the Fund under the agreement.
8. CONCENTRATION RISKS
As of the end of the period, the Fund concentrated its portfolio of investments in the information technology sector and in North America and Europe. A fund that invests a substantial portion of its assets in any sector or geographic region may be more affected by changes in that sector or geographic region than would be a fund whose investments are not heavily weighted in any sector or geographic region.
Wells Fargo Global Small Cap Fund | 23
Notes to financial statements (unaudited)
9. INDEMNIFICATION
Under the Fund's organizational documents, the officers and Trustees have been granted certain indemnification rights against certain liabilities that may arise out of performance of their duties to the Fund. The Fund has entered into a separate agreement with each Trustee that converts indemnification rights currently existing under the Fund’s organizational documents into contractual rights that cannot be changed in the future without the consent of the Trustee. Additionally, in the normal course of business, the Fund may enter into contracts with service providers that contain a variety of indemnification clauses. The Fund’s maximum exposure under these arrangements is dependent on future claims that may be made against the Fund and, therefore, cannot be estimated.
10. CORONAVIRUS (COVID-19) PANDEMIC
On March 11, 2020, the World Health Organization announced that it had made the assessment that coronavirus disease 2019 (“COVID-19”) is a pandemic. The impacts of COVID-19 are affecting the entire global economy, individual companies and investment products, the funds, and the market in general. There is significant uncertainty around the extent and duration of business disruptions related to COVID-19 and the impacts may last for an extended period of time. COVID-19 has led to significant uncertainty and volatility in the financial markets.
24 | Wells Fargo Global Small Cap Fund
Other information (unaudited)
PROXY VOTING INFORMATION
A description of the policies and procedures used to determine how to vote proxies relating to portfolio securities is available without charge, upon request, by calling 1-800-222-8222, visiting our website at wfam.com, or visiting the SEC website at sec.gov. Information regarding how the proxies related to portfolio securities were voted during the most recent 12-month period ended June 30 is available on the website at wfam.com or by visiting the SEC website at sec.gov.
QUARTERLY PORTFOLIO HOLDINGS INFORMATION
The Fund files its complete schedule of portfolio holdings with the SEC for the first and third quarters of each fiscal year as an exhibit to its reports on Form N-PORT. Shareholders may view the filed Form N-PORT by visiting the SEC website at sec.gov.
Wells Fargo Global Small Cap Fund | 25
Other information (unaudited)
BOARD OF TRUSTEES AND OFFICERS
Each of the Trustees and Officers listed in the table below acts in identical capacities for each fund in the Wells Fargo family of funds, which consists of 139 mutual funds comprising the Wells Fargo Funds Trust, Wells Fargo Variable Trust, Wells Fargo Master Trust and four closed-end funds (collectively the “Fund Complex”). This table should be read in conjunction with the Prospectus and the Statement of Additional Information1. The mailing address of each Trustee and Officer is 525 Market Street, 12th Floor, San Francisco, CA 94105. Each Trustee and Officer serves an indefinite term, however, each Trustee serves such term until reaching the mandatory retirement age established by the Trustees.
Independent Trustees
Name and
year of birth | Position held and
length of service* | Principal occupations during past five years or longer | Current other
public company or
investment
company
directorships |
William R. Ebsworth
(Born 1957) | Trustee,
since 2015 | Retired. From 1984 to 2013, equities analyst, portfolio manager, research director and chief investment officer at Fidelity Management and Research Company in Boston, Tokyo, and Hong Kong, and retired in 2013 as Chief Investment Officer of Fidelity Strategic Advisers, Inc. where he led a team of investment professionals managing client assets. Prior thereto, Board member of Hong Kong Securities Clearing Co., Hong Kong Options Clearing Corp., the Thailand International Fund, Ltd., Fidelity Investments Life Insurance Company, and Empire Fidelity Investments Life Insurance Company. Audit Committee Chair and Investment Committee Chair of the Vincent Memorial Hospital Endowment (non-profit organization). Mr. Ebsworth is a CFA® charterholder. | N/A |
Jane A. Freeman
(Born 1953) | Trustee,
since 2015;
Chair Liaison,
since 2018 | Retired. From 2012 to 2014 and 1999 to 2008, Chief Financial Officer of Scientific Learning Corporation. From 2008 to 2012, Ms. Freeman provided consulting services related to strategic business projects. Prior to 1999, Portfolio Manager at Rockefeller & Co. and Scudder, Stevens & Clark. Board member of the Harding Loevner Funds from 1996 to 2014, serving as both Lead Independent Director and chair of the Audit Committee. Board member of the Russell Exchange Traded Funds Trust from 2011 to 2012 and the chair of the Audit Committee. Ms. Freeman is also an inactive Chartered Financial Analyst. | N/A |
Isaiah Harris, Jr.
(Born 1952) | Trustee,
since 2009; Audit
Committee
Chair,
since 2019 | Retired. Chairman of the Board of CIGNA Corporation since 2009, and Director since 2005. From 2003 to 2011, Director of Deluxe Corporation. Prior thereto, President and CEO of BellSouth Advertising and Publishing Corp. from 2005 to 2007, President and CEO of BellSouth Enterprises from 2004 to 2005 and President of BellSouth Consumer Services from 2000 to 2003. Emeritus member of the Iowa State University Foundation Board of Governors. Emeritus Member of the Advisory Board of Iowa State University School of Business. Advisory Board Member, Palm Harbor Academy (private school). Mr. Harris is a certified public accountant (inactive status). | CIGNA Corporation |
Judith M. Johnson
(Born 1949) | Trustee,
since 2008 | Retired. Prior thereto, Chief Executive Officer and Chief Investment Officer of Minneapolis Employees Retirement Fund from 1996 to 2008. Ms. Johnson is an attorney, certified public accountant and a certified managerial accountant. | N/A |
David F. Larcker
(Born 1950) | Trustee,
since 2009 | James Irvin Miller Professor of Accounting at the Graduate School of Business (Emeritus), Stanford University, Director of the Corporate Governance Research Initiative and Senior Faculty of The Rock Center for Corporate Governance since 2006. From 2005 to 2008, Professor of Accounting at the Graduate School of Business, Stanford University. Prior thereto, Ernst & Young Professor of Accounting at The Wharton School, University of Pennsylvania from 1985 to 2005. | N/A |
26 | Wells Fargo Global Small Cap Fund
Other information (unaudited)
Name and
year of birth | Position held and
length of service* | Principal occupations during past five years or longer | Current other
public company or
investment
company
directorships |
Olivia S. Mitchell
(Born 1953) | Trustee,
since 2006;
Nominating and
Governance
Committee Chair,
since 2018 | International Foundation of Employee Benefit Plans Professor, Wharton School of the University of Pennsylvania since 1993. Director of Wharton’s Pension Research Council and Boettner Center on Pensions & Retirement Research, and Research Associate at the National Bureau of Economic Research. Previously, Cornell University Professor from 1978 to 1993. | N/A |
Timothy J. Penny
(Born 1951) | Trustee,
since 1996;
Chair,
since 2018 | President and Chief Executive Officer of Southern Minnesota Initiative Foundation, a non-profit organization, since 2007. Member of the Board of Trustees of NorthStar Education Finance, Inc., a non-profit organization, since 2007. | N/A |
James G. Polisson
(Born 1959) | Trustee,
since 2018 | Retired. Chief Marketing Officer, Source (ETF) UK Services, Ltd, from 2015 to 2017. From 2012 to 2015, Principal of The Polisson Group, LLC, a management consulting, corporate advisory and principal investing company. Chief Executive Officer and Managing Director at Russell Investments, Global Exchange Traded Funds from 2010 to 2012. Managing Director of Barclays Global Investors from 1998 to 2010 and Global Chief Marketing Officer for iShares and Barclays Global Investors from 2000 to 2010. Trustee of the San Francisco Mechanics’ Institute, a non-profit organization, from 2013 to 2015. Board member of the Russell Exchange Traded Fund Trust from 2011 to 2012. Director of Barclays Global Investors Holdings Deutschland GmbH from 2006 to 2009. Mr. Polisson is an attorney and has a retired status with the Massachusetts and District of Columbia Bar Associations. | N/A |
Pamela Wheelock
(Born 1959) | Trustee,
since January
2020; previously
Trustee from
January 2018 to
July 2019 | Board member of the Destination Medical Center Economic Development Agency, Rochester, Minnesota since 2019. Interim President of the McKnight Foundation from January to September 2020. Acting Commissioner, Minnesota Department of Human Services, July 2019 through September 2019. Human Services Manager (part-time), Minnesota Department of Human Services, October 2019 through December 2019. Chief Operating Officer, Twin Cities Habitat for Humanity from 2017 to 2019. Vice President of University Services, University of Minnesota from 2012 to 2016. Prior thereto, on the Board of Directors, Governance Committee and Finance Committee for the Minnesota Philanthropy Partners (Saint Paul Foundation) from 2012 to 2018, Interim Chief Executive Officer of Blue Cross Blue Shield of Minnesota from 2011 to 2012, Chairman of the Board from 2009 to 2012 and Board Director from 2003 to 2015. Vice President, Leadership and Community Engagement, Bush Foundation, Saint Paul, Minnesota (a private foundation) from 2009 to 2011. Executive Vice President and Chief Financial Officer, Minnesota Sports and Entertainment from 2004 to 2009 and Senior Vice President from 2002 to 2004. Executive Vice President of the Minnesota Wild Foundation from 2004 to 2008. Commissioner of Finance, State of Minnesota, from 1999 to 2002. Currently Board Chair of the Minnesota Wild Foundation since 2010. | N/A |
* Length of service dates reflect the Trustee’s commencement of service with the Trust’s predecessor entities, where applicable.
Wells Fargo Global Small Cap Fund | 27
Other information (unaudited)
Officers
Name and
year of birth | Position held and
length of service | Principal occupations during past five years or longer |
Andrew Owen
(Born 1960) | President,
since 2017 | Executive Vice President of Wells Fargo & Company and Head of Affiliated Managers, Wells Fargo Asset Management, since 2014. In addition, Mr. Owen is currently President, Chief Executive Officer and Director of Wells Fargo Funds Management, LLC since 2017. Prior thereto, Executive Vice President responsible for marketing, investments and product development for Wells Fargo Funds Management, LLC, from 2009 to 2014. |
Jeremy DePalma
(Born 1974) | Treasurer,
since 2012
(for certain funds in
the Fund Complex);
since 2021 (for
the remaining funds in the
Fund Complex) | Senior Vice President of Wells Fargo Funds Management, LLC since 2009. Senior Vice President of Evergreen Investment Management Company, LLC from 2008 to 2010 and head of the Fund Reporting and Control Team within Fund Administration from 2005 to 2010. |
Michelle Rhee
(Born 1966) | Chief Legal Officer,
since 2019 | Secretary of Wells Fargo Funds Management, LLC and Chief Legal Counsel of Wells Fargo Asset Management since 2018. Deputy General Counsel of Wells Fargo Bank, N.A. since 2020 and Assistant General Counsel of Wells Fargo Bank, N.A. from 2018 to 2020. Associate General Counsel and Managing Director of Bank of America Corporation from 2004 to 2018. |
Catherine Kennedy
(Born 1969) | Secretary,
since 2019 | Vice President of Wells Fargo Funds Management, LLC and Senior Counsel of the Wells Fargo Legal Department since 2010. Vice President and Senior Counsel of Evergreen Investment Management Company, LLC from 1998 to 2010. |
Michael H. Whitaker
(Born 1967) | Chief Compliance Officer,
since 2016 | Chief Compliance Officer of Wells Fargo Asset Management since 2016. Senior Vice President and Chief Compliance Officer for Fidelity Investments from 2007 to 2016. |
1 The Statement of Additional Information includes additional information about the Trustees and is available, without charge, upon request, by calling 1-800-222-8222 or by visiting the website at wfam.com.
28 | Wells Fargo Global Small Cap Fund
For more information
More information about Wells Fargo Funds is available free upon request. To obtain literature, please write, visit the Fund's website, or call:
Wells Fargo Funds
P.O. Box 219967
Kansas City, MO 64121-9967
Website: wfam.com
Individual investors: 1-800-222-8222
Retail investment professionals: 1-888-877-9275
Institutional investment professionals: 1-866-765-0778
This report and the financial statements contained herein are submitted for the general information of the shareholders of the Fund. If this report is used for promotional purposes, distribution of the report must be accompanied or preceded by a current prospectus. Before investing, please consider the investment objectives, risks, charges, and expenses of the investment. For a current prospectus and, if available, a summary prospectus, containing this information, call 1-800-222-8222 or visit the Fund's website at wfam.com. Read the prospectus carefully before you invest or send money.
Wells Fargo Asset Management (WFAM) is the trade name for certain investment advisory/management firms owned by Wells Fargo & Company. These firms include but are not limited to Wells Capital Management Incorporated and Wells Fargo Funds Management, LLC. Certain products managed by WFAM entities are distributed by Wells Fargo Funds Distributor, LLC (a broker-dealer and Member FINRA).
This material is for general informational and educational purposes only and is NOT intended to provide investment advice or a recommendation of any kind - including a recommendation for any specific investment, strategy, or plan.
INVESTMENT PRODUCTS: NOT FDIC INSURED ■ NO BANK GUARANTEE ■ MAY LOSE VALUE
© 2021 Wells Fargo & Company. All rights reserved.
PAR-0521-00323 06-21
SA239/SAR239 04-21
Semi-Annual Report
April 30, 2021
Wells Fargo
International Equity Fund
Reduce clutter.
Save trees.
Sign up for electronic delivery of prospectuses and shareholder reports at wellsfargo.com/ advantagedelivery
The views expressed and any forward-looking statements are as of April 30, 2021, unless otherwise noted, and are those of the Fund's portfolio managers and/or Wells Fargo Asset Management. Discussions of individual securities or the markets generally are not intended as individual recommendations. Future events or results may vary significantly from those expressed in any forward-looking statements. The views expressed are subject to change at any time in response to changing circumstances in the market. Wells Fargo Asset Management and the Fund disclaim any obligation to publicly update or revise any views expressed or forward-looking statements.
INVESTMENT PRODUCTS: NOT FDIC INSURED ■ NO BANK GUARANTEE ■ MAY LOSE VALUE
Wells Fargo International Equity Fund | 1
Letter to shareholders (unaudited)
Andrew Owen
President
Wells Fargo Funds
Dear Shareholder:
We are pleased to offer you this semi-annual report for the Wells Fargo International Equity Fund for the six-month period that ended April 30, 2021. Global stocks continued to rally as the global economy continued to work through the haze of COVID-19. Tailwinds were provided by global stimulus programs, a rapid vaccination rollout, and recovering consumer and corporate sentiment. Bonds were mixed during the period, with global bonds, municipal bonds, and high-yield bonds delivering positive returns.
For the six-month period, U.S. stocks, based on the S&P 500 Index,1 gained 28.85%. International stocks, as measured by the MSCI ACWI ex USA Index (Net),2 returned 27.40%, while the MSCI EM Index (Net),3 trailed its developed market counterparts with a 22.95% gain. Among bond indexes, the Bloomberg Barclays U.S. Aggregate Bond Index,4 returned -1.52%, the Bloomberg Barclays Global Aggregate ex-USD Index (unhedged),5 returned 0.68%, the Bloomberg Barclays Municipal Bond Index,6 returned 2.62%, and the ICE BofA U.S. High Yield Index,7 returned 8.12%.
Hope drove the stock markets to new highs.
Global stocks rallied in November, propelled by optimism over three promising COVID-19 vaccines. Reversing recent trends, value stocks outperformed growth stocks and cyclical stocks outpaced information technology (IT) stocks. However, U.S. unemployment remained elevated, with a net job loss of 10 million since February. The eurozone services Purchasing Managers’ Index, a monthly survey of purchasing managers, contracted sharply while the region’s manufacturing activity grew. The U.S. election results added to the upbeat mood as investors anticipated more consistent policies in the new administration.
Financial markets ended the year with strength on high expectations for a rapid rollout of the COVID-19 vaccines, the successful passage of a $900 billion stimulus package, and rising expectations of additional economic support from a Democratic-led Congress. U.S. economic data were mixed with still-elevated unemployment and weak retail sales but growth in manufacturing output. In contrast, China’s economic expansion continued in both manufacturing and nonmanufacturing. U.S. COVID-19 infection rates continued to rise even as new state and local lockdown measures were implemented.
“Global stocks rallied in November, propelled by optimism over three promising COVID-19 vaccines.”
| 1 | The S&P 500 Index consists of 500 stocks chosen for market size, liquidity, and industry group representation. It is a market-value-weighted index with each stock's weight in the index proportionate to its market value. You cannot invest directly in an index. |
| 2 | The Morgan Stanley Capital International (MSCI) All Country World Index (ACWI) ex USA Index (Net) is a free-float-adjusted market-capitalization-weighted index that is designed to measure the equity market performance of developed and emerging markets, excluding the United States. Source: MSCI. MSCI makes no express or implied warranties or representations and shall have no liability whatsoever with respect to any MSCI data contained herein. The MSCI data may not be further redistributed or used as a basis for other indices or any securities or financial products. This report is not approved, reviewed, or produced by MSCI. You cannot invest directly in an index. |
| 1 | The S&P 500 Index consists of 500 stocks chosen for market size, liquidity, and industry group representation. It is a market-value-weighted index with each stock's weight in the index proportionate to its market value. You cannot invest directly in an index. |
| 3 | The MSCI Emerging Markets (EM) Index (Net) is a free-float-adjusted market-capitalization-weighted index that is designed to measure equity market performance of emerging markets. You cannot invest directly in an index. |
| 1 | The S&P 500 Index consists of 500 stocks chosen for market size, liquidity, and industry group representation. It is a market-value-weighted index with each stock's weight in the index proportionate to its market value. You cannot invest directly in an index. |
| 4 | The Bloomberg Barclays U.S. Aggregate Bond Index is a broad-based benchmark that measures the investment-grade, U.S. dollar-denominated, fixed-rate taxable bond market, including Treasuries, government-related and corporate securities, mortgage-backed securities (agency fixed-rate and hybrid adjustable-rate mortgage pass-throughs), asset-backed securities, and commercial mortgage-backed securities. You cannot invest directly in an index. |
| 1 | The S&P 500 Index consists of 500 stocks chosen for market size, liquidity, and industry group representation. It is a market-value-weighted index with each stock's weight in the index proportionate to its market value. You cannot invest directly in an index. |
| 5 | The Bloomberg Barclays Global Aggregate ex-USD Index (unhedged) is an unmanaged index that provides a broad-based measure of the global investment-grade fixed-income markets excluding the U.S. dollar-denominated debt market. You cannot invest directly in an index. |
| 1 | The S&P 500 Index consists of 500 stocks chosen for market size, liquidity, and industry group representation. It is a market-value-weighted index with each stock's weight in the index proportionate to its market value. You cannot invest directly in an index. |
| 6 | The Bloomberg Barclays Municipal Bond Index is an unmanaged index composed of long-term tax-exempt bonds with a minimum credit rating of Baa. You cannot invest directly in an index. |
| 1 | The S&P 500 Index consists of 500 stocks chosen for market size, liquidity, and industry group representation. It is a market-value-weighted index with each stock's weight in the index proportionate to its market value. You cannot invest directly in an index. |
| 7 | The ICE BofA U.S. High Yield Index is a market-capitalization-weighted index of domestic and Yankee high-yield bonds. The index tracks the performance of high-yield securities traded in the U.S. bond market. You cannot invest directly in an index. Copyright 2021. ICE Data Indices, LLC. All rights reserved. |
2 | Wells Fargo International Equity Fund
Letter to shareholders (unaudited)
The calendar year 2021 began with emerging market stocks leading all major asset classes in January, driven by China’s strong economic growth and a broad recovery in corporate earnings, which propelled China’s stock market higher. In the U.S., positive news on vaccine trials and January's expansion in both the manufacturing and services sectors were offset by a weak December monthly jobs report. This was compounded by technical factors as some hedge funds were forced to sell stocks to protect themselves against a well-publicized short squeeze coordinated by a group of retail investors. Eurozone sentiment and economic growth were particularly weak, reflecting the impact of a new lockdown with stricter social distancing along with a slow vaccine rollout.
February saw major domestic equity indexes driven higher on the hope of a new stimulus bill, improving COVID-19 vaccination numbers, and the gradual reopening of the economy. Most S&P 500 companies reported better-than-expected earnings, with positive surprises coming from the financials, IT, health care, and materials sectors. Japan saw its economy strengthen as a result of strong export numbers. Meanwhile, crude-oil prices continued their climb, rising more than 25% for the year. Domestic government bonds experienced a sharp sell-off in late February as markets priced in a more robust economic recovery and higher future growth and inflation expectations.
The passage of the massive domestic stimulus bill highlighted March activity, leading to increased forecasts for U.S. growth in 2021. Domestic employment surged as COVID-19 vaccinations and an increasingly open economy spurred hiring. A majority of U.S. small companies reported they were operating at pre-pandemic capacity or higher. Value continued its outperformance of growth in the month, continuing the trend that started in late 2020. Meanwhile, most major developed global equity indexes were up month to date on the back of rising optimism regarding the outlook for global growth. While the U.S. and the U.K. have been the most successful in terms of the vaccine rollout, even within markets where the vaccine has lagged, such as the eurozone and Japan, equity indexes in many of those countries are also in positive territory this year.
Equity markets produced another strong showing in April. Domestically, the continued reopening of the economy had a strong impact on positive equity performance as people started leaving their households and jobless claims continued to fall. Domestic corporate bonds performed well and the U.S. dollar weakened. Meanwhile, the U.S. government continued to seek to invest in the recovery, this time by outlining a package of over $2 billion to improve infrastructure. The primary headwind in April was inflation, as investors tried to determine the breadth and longevity of recent price increases. Developed Europe has been supported by a meaningful increase in the pace of vaccinations. Unfortunately many emerging market countries have not been as successful. India in particular has seen COVID-19 cases surge, serving as an example of the need to get vaccinations rolled out to less developed nations.
Don’t let short-term uncertainty derail long-term investment goals.
Periods of investment uncertainty can present challenges, but experience has taught us that maintaining long-term investment goals can be an effective way to plan for the future. Although diversification cannot guarantee an investment profit or prevent losses, we believe it can be an effective way to manage investment risk and potentially smooth out overall portfolio performance. We encourage investors to know their investments and to understand that appropriate levels of risk-taking may unlock opportunities.
Thank you for choosing to invest with Wells Fargo Funds. We appreciate your confidence in us and remain committed to helping you meet your financial needs.
Sincerely,
Andrew Owen
President
Wells Fargo Funds
“The passage of the massive domestic stimulus bill highlighted March activity, leading to increased forecasts for U.S. growth in 2021.”
For further information about your Fund, contact your investment professional, visit our website at wfam.com, or call us directly at 1-800-222-8222.
Wells Fargo International Equity Fund | 3
Performance highlights (unaudited)
| Investment objective | The Fund seeks long-term capital appreciation. |
| Manager | Wells Fargo Funds Management, LLC |
| Subadviser | Wells Capital Management Incorporated |
| Portfolio managers | Venkateshwar (Venk) Lal, Dale A. Winner, CFA®‡ |
| Average annual total returns (%) as of April 30, 2021 |
| | | Including sales charge | | Excluding sales charge | | Expense ratios1 (%) |
| | Inception date | 1 year | 5 year | 10 year | | 1 year | 5 year | 10 year | | Gross | Net 2 |
| Class A (WFEAX) | 1-20-1998 | 39.56 | 6.13 | 3.30 | | 48.01 | 7.40 | 3.92 | | 1.48 | 1.14 |
| Class C (WFEFX) | 3-6-1998 | 45.83 | 6.56 | 3.13 | | 46.83 | 6.56 | 3.13 | | 2.23 | 1.89 |
| Class R (WFERX) | 10-10-2003 | – | – | – | | 47.69 | 7.12 | 3.66 | | 1.73 | 1.39 |
| Class R6 (WFEHX)3 | 9-30-2015 | – | – | – | | 48.49 | 7.73 | 4.20 | | 1.05 | 0.79 |
| Administrator Class (WFEDX) | 7-16-2010 | – | – | – | | 47.88 | 7.39 | 3.92 | | 1.40 | 1.14 |
| Institutional Class (WFENX) | 3-9-1998 | – | – | – | | 48.36 | 7.67 | 4.19 | | 1.15 | 0.84 |
| MSCI ACWI ex USA Index (Net)4 | – | – | – | – | | 42.98 | 9.83 | 4.73 | | – | – |
| MSCI ACWI ex USA Value Index (Net)5 | – | – | – | – | | 42.94 | 6.93 | 2.79 | | – | – |
Figures quoted represent past performance, which is no guarantee of future results, and do not reflect taxes that a shareholder may pay on an investment in a fund. Investment return and principal value of an investment will fluctuate so that an investor’s shares, when redeemed, may be worth more or less than their original cost. Performance shown without sales charges would be lower if sales charges were reflected. Current performance may be lower or higher than the performance data quoted, which assumes the reinvestment of dividends and capital gains. Current month-end performance is available on the Fund’s website, wfam.com.
Please keep in mind that high double-digit returns were primarily achieved during favorable market conditions. You should not expect that such favorable returns can be consistently achieved. A fund’s performance, especially for short time periods, should not be the sole factor in making your investment decision.
Index returns do not include transaction costs associated with buying and selling securities, any mutual fund fees or expenses, or any taxes. It is not possible to invest directly in an index.
For Class A shares, the maximum front-end sales charge is 5.75%. For Class C shares, the maximum contingent deferred sales charge is 1.00%. Performance including a contingent deferred sales charge assumes the sales charge for the corresponding time period. Class R, Class R6, Administrator Class, and Institutional Class shares are sold without a front-end sales charge or contingent deferred sales charge.
| 1 | Reflects the expense ratios as stated in the most recent prospectuses. The expense ratios shown are subject to change and may differ from the annualized expense ratios shown in the financial highlights of this report. |
| 2 | The manager has contractually committed through February 28, 2022, to waive fees and/or reimburse expenses to the extent necessary to cap total annual fund operating expenses after fee waivers at 1.14% for Class A, 1.89% for Class C, 1.39% for Class R, 0.79% for Class R6, 1.14% for Administrator Class, and 0.84% for Institutional Class. Brokerage commissions, stamp duty fees, interest, taxes, acquired fund fees and expenses (if any), and extraordinary expenses are excluded from the expense caps. Prior to or after the commitment expiration date, the caps may be increased or the commitment to maintain the caps may be terminated only with the approval of the Board of Trustees. Without these caps, the Fund’s returns would have been lower. The expense ratio paid by an investor is the net expense ratio (the total annual fund operating expenses after fee waivers) as stated in the prospectuses. |
| 3 | Historical performance shown for the Class R6 shares prior to their inception reflects the performance of the Institutional Class shares and includes the higher expenses applicable to the Institutional Class shares. If these expenses had not be included, returns for the Class R6 shares would have been higher. |
| 4 | The Morgan Stanley Capital International (MSCI) All Country World Index (ACWI) ex USA Index (Net) is a free-float-adjusted market capitalization-weighted index that is designed to measure the equity market performance of developed and emerging markets, excluding the United States. Source: MSCI. MSCI makes no express or implied warranties or representations and shall have no liability whatsoever with respect to any MSCI data contained herein. The MSCI data may not be further redistributed or used as a basis for other indexes or any securities or financial products. This report is not approved, reviewed, or produced by MSCI. You cannot invest directly in an index. |
| 5 | The MSCI ACWI ex USA Value Index (Net) captures large and mid-cap securities exhibiting overall value style characteristics across developed and emerging markets countries excluding the United States. The value investment style characteristics for index construction are defined using three variables: book value to price, 12-month forward earnings to price, and dividend yield. You cannot invest directly in an index. |
| ‡ | CFA® and Chartered Financial Analyst® are trademarks owned by CFA Institute. |
4 | Wells Fargo International Equity Fund
Performance highlights (unaudited)
Stock values fluctuate in response to the activities of individual companies and general market and economic conditions. Foreign investments are especially volatile and can rise or fall dramatically due to differences in the political and economic conditions of the host country. These risks are generally intensified in emerging markets. The use of derivatives may reduce returns and/or increase volatility. Certain investment strategies tend to increase the total risk of an investment (relative to the broader market). The Fund is exposed to focused portfolio risk, geographic risk, and smaller company securities risk. Consult the Fund’s prospectus for additional information on these and other risks.
| Ten largest holdings (%) as of April 30, 20211 |
| Compagnie de Saint-Gobain SA | 3.23 |
| Hana Financial Group Incorporated | 2.94 |
| LafargeHolcim Limited | 2.84 |
| Hitachi Limited | 2.79 |
| Xinyi Glass Holdings Limited | 2.72 |
| Mitsubishi UFJ Financial Group Incorporated | 2.71 |
| Qantas Airways Limited | 2.59 |
| Nomad Foods Limited | 2.54 |
| Siam Commercial Bank plc | 2.47 |
| Sands China Limited | 2.38 |
| 1 | Figures represent the percentage of the Fund's net assets. Holdings are subject to change and may have changed since the date specified. |
| Sector allocation as of April 30, 20211 |
| 1 | Figures represent the percentage of the Fund's long-term investments. These amounts are subject to change and may have changed since the date specified. |
| Geographic allocation as of April 30, 20211 |
| 1 | Figures represent the percentage of the Fund's long-term investments. These amounts are subject to change and may have changed since the date specified. |
Wells Fargo International Equity Fund | 5
Fund expenses (unaudited)
As a shareholder of the Fund, you incur two types of costs: (1) transaction costs, including sales charges (loads) on purchase payments and contingent deferred sales charges (if any) on redemptions and (2) ongoing costs, including management fees, distribution (12b-1) and/or shareholder servicing fees, and other Fund expenses. This example is intended to help you understand your ongoing costs (in dollars) of investing in the Fund and to compare these costs with the ongoing costs of investing in other mutual funds.
The example is based on an investment of $1,000 invested at the beginning of the six-month period and held for the entire period from November 1, 2020 to April 30, 2021.
Actual expenses
The “Actual” line of the table below provides information about actual account values and actual expenses. You may use the information in this line, together with the amount you invested, to estimate the expenses that you paid over the period. Simply divide your account value by $1,000 (for example, an $8,600 account value divided by $1,000 = 8.6), then multiply the result by the number in the “Actual” line under the heading entitled “Expenses paid during period” for your applicable class of shares to estimate the expenses you paid on your account during this period.
Hypothetical example for comparison purposes
The “Hypothetical” line of the table below provides information about hypothetical account values and hypothetical expenses based on the Fund’s actual expense ratio and an assumed rate of return of 5% per year before expenses, which is not the Fund’s actual return. The hypothetical account values and expenses may not be used to estimate the actual ending account balance or expenses you paid for the period. You may use this information to compare the ongoing costs of investing in the Fund and other funds. To do so, compare this 5% hypothetical example with the 5% hypothetical examples that appear in the shareholder reports of the other funds.
Please note that the expenses shown in the table are meant to highlight your ongoing costs only and do not reflect any transactional costs, such as sales charges (loads) and contingent deferred sales charges. Therefore, the “Hypothetical” line of the table is useful in comparing ongoing costs only and will not help you determine the relative total costs of owning different funds. In addition, if these transactional costs were included, your costs would have been higher.
| | Beginning
account value
11-1-2020 | Ending
account value
4-30-2021 | Expenses
paid during
the period1 | Annualized net
expense ratio |
| Class A | | | | |
| Actual | $1,000.00 | $1,307.66 | $ 6.47 | 1.13% |
| Hypothetical (5% return before expenses) | $1,000.00 | $1,019.19 | $ 5.66 | 1.13% |
| Class C | | | | |
| Actual | $1,000.00 | $1,301.65 | $10.79 | 1.89% |
| Hypothetical (5% return before expenses) | $1,000.00 | $1,015.42 | $ 9.44 | 1.89% |
| Class R | | | | |
| Actual | $1,000.00 | $1,306.30 | $ 7.95 | 1.39% |
| Hypothetical (5% return before expenses) | $1,000.00 | $1,017.90 | $ 6.95 | 1.39% |
| Class R6 | | | | |
| Actual | $1,000.00 | $1,309.47 | $ 4.52 | 0.79% |
| Hypothetical (5% return before expenses) | $1,000.00 | $1,020.88 | $ 3.96 | 0.79% |
| Administrator Class | | | | |
| Actual | $1,000.00 | $1,306.74 | $ 6.52 | 1.14% |
| Hypothetical (5% return before expenses) | $1,000.00 | $1,019.14 | $ 5.71 | 1.14% |
| Institutional Class | | | | |
| Actual | $1,000.00 | $1,309.52 | $ 4.81 | 0.84% |
| Hypothetical (5% return before expenses) | $1,000.00 | $1,020.63 | $ 4.21 | 0.84% |
1 Expenses paid is equal to the annualized net expense ratio of each class multiplied by the average account value over the period, multiplied by the number of days in the most recent fiscal half-year divided by the number of days in the fiscal year (to reflect the one-half-year period).
6 | Wells Fargo International Equity Fund
Portfolio of investments—April 30, 2021 (unaudited)
| | | | | | Shares | Value |
| Common stocks: 94.78% | | | | | | |
| Australia: 2.59% | | | | | | |
| Qantas Airways Limited (Industrials, Airlines) † | | | | | 3,383,386 | $ 12,901,640 |
| Brazil: 0.64% | | | | | | |
| CPFL Energia SA (Utilities, Electric utilities) | | | | | 594,400 | 3,211,613 |
| Canada: 3.21% | | | | | | |
| Home Capital Group Incorporated (Financials, Thrifts & mortgage finance) † | | | | | 226,600 | 5,989,695 |
| Lundin Mining Corporation (Materials, Metals & mining) | | | | | 828,228 | 10,006,253 |
| | | | | | | 15,995,948 |
| China: 14.94% | | | | | | |
| Alibaba Group Holding Limited ADR (Consumer discretionary, Internet & direct marketing retail) † | | | | | 385,572 | 11,168,446 |
| China Resources Land Limited (Real estate, Real estate management & development) | | | | | 1,720,000 | 8,071,063 |
| LONGi Green Energy Technology Company Limited Class A (Information technology, Semiconductors & semiconductor equipment) | | | | | 765,501 | 11,757,830 |
| Midea Group Company Limited Class A (Consumer discretionary, Household durables) | | | | | 584,151 | 7,236,558 |
| Oppein Home Group Incorporated Class A (Consumer discretionary, Household durables) | | | | | 265,506 | 6,843,298 |
| Sands China Limited (Consumer discretionary, Hotels, restaurants & leisure) † | | | | | 2,498,800 | 11,870,325 |
| Shanghai Pharmaceuticals Holding Company Limited Class H (Health care, Health care providers & services) | | | | | 4,028,600 | 9,169,405 |
| Topsports International Holdings Limited (Consumer discretionary, Specialty retail) 144A | | | | | 6,177,000 | 8,349,715 |
| | | | | | | 74,466,640 |
| Denmark: 2.29% | | | | | | |
| Danske Bank AS (Financials, Banks) | | | | | 600,597 | 11,415,981 |
| France: 4.15% | | | | | | |
| Compagnie de Saint-Gobain SA (Industrials, Building products) † | | | | | 255,347 | 16,117,019 |
| Faurecia SE (Consumer discretionary, Auto components) † | | | | | 10,220 | 550,334 |
| Sanofi SA (Health care, Pharmaceuticals) | | | | | 38,207 | 4,008,691 |
| | | | | | | 20,676,044 |
| Germany: 4.39% | | | | | | |
| Metro AG (Consumer staples, Food & staples retailing) | | | | | 31,957 | 349,625 |
| Muenchener Rueckversicherungs Gesellschaft AG (Financials, Insurance) | | | | | 9,837 | 2,846,054 |
| Rheinmetall AG (Industrials, Industrial conglomerates) | | | | | 90,855 | 9,470,275 |
| Siemens AG (Industrials, Industrial conglomerates) | | | | | 36,897 | 6,157,973 |
| Siemens Energy AG (Industrials, Electrical equipment) † | | | | | 31,857 | 1,064,742 |
| Siltronic AG (Information technology, Semiconductors & semiconductor equipment) | | | | | 11,900 | 2,005,809 |
| | | | | | | 21,894,478 |
| Hong Kong: 2.72% | | | | | | |
| Xinyi Glass Holdings Limited (Consumer discretionary, Auto components) | | | | | 3,822,000 | 13,555,547 |
| India: 2.31% | | | | | | |
| Tech Mahindra Limited (Information technology, IT services) | | | | | 886,131 | 11,489,287 |
The accompanying notes are an integral part of these financial statements.
Wells Fargo International Equity Fund | 7
Portfolio of investments—April 30, 2021 (unaudited)
| | | | | | Shares | Value |
| Ireland: 1.25% | | | | | | |
| Greencore Group plc (Consumer staples, Food products) † | | | | | 2,850,284 | $ 6,247,040 |
| Israel: 0.83% | | | | | | |
| Check Point Software Technologies Limited (Information technology, Software) † | | | | | 35,490 | 4,145,587 |
| Italy: 0.46% | | | | | | |
| Prysmian SpA (Industrials, Electrical equipment) | | | | | 73,667 | 2,307,148 |
| Japan: 10.44% | | | | | | |
| Alps Electric Company Limited (Information technology, Electronic equipment, instruments & components) | | | | | 549,700 | 6,659,372 |
| Daiwa Securities Group Incorporated (Financials, Capital markets) | | | | | 1,925,900 | 10,257,722 |
| Hitachi Limited (Information technology, Electronic equipment, instruments & components) | | | | | 282,500 | 13,909,164 |
| Mitsubishi UFJ Financial Group Incorporated (Financials, Banks) | | | | | 2,550,000 | 13,486,138 |
| Takeda Pharmaceutical Company Limited (Health care, Pharmaceuticals) | | | | | 231,400 | 7,696,395 |
| | | | | | | 52,008,791 |
| Luxembourg: 2.01% | | | | | | |
| ArcelorMittal SA (Materials, Metals & mining) † | | | | | 342,739 | 9,992,403 |
| Mexico: 0.28% | | | | | | |
| Fresnillo plc (Materials, Metals & mining) | | | | | 121,087 | 1,377,283 |
| Netherlands: 7.03% | | | | | | |
| Koninklijke Philips NV (Health care, Health care equipment & supplies) † | | | | | 155,110 | 8,742,227 |
| NN Group NV (Financials, Insurance) | | | | | 216,314 | 10,810,837 |
| OCI NV (Materials, Chemicals) † | | | | | 194,563 | 4,540,257 |
| Stellantis NV (Consumer discretionary, Automobiles) | | | | | 657,536 | 10,928,182 |
| | | | | | | 35,021,503 |
| Norway: 2.30% | | | | | | |
| Den Norske Bank ASA (Financials, Banks) | | | | | 532,683 | 11,458,060 |
| Russia: 0.56% | | | | | | |
| Mobile TeleSystems PJSC ADR (Communication services, Wireless telecommunication services) | | | | | 329,190 | 2,788,239 |
| South Korea: 7.93% | | | | | | |
| Coway Company Limited (Consumer discretionary, Household durables) | | | | | 124,939 | 7,514,199 |
| Hana Financial Group Incorporated (Financials, Banks) | | | | | 357,578 | 14,674,730 |
| Samsung Electronics Company Limited GDR (Information technology, Technology hardware, storage & peripherals) 144A | | | | | 6,013 | 10,949,673 |
| SK Telecom Company Limited (Communication services, Wireless telecommunication services) | | | | | 23,399 | 6,384,318 |
| | | | | | | 39,522,920 |
| Switzerland: 2.84% | | | | | | |
| LafargeHolcim Limited (Materials, Construction materials) | | | | | 229,733 | 14,162,570 |
| Thailand: 2.47% | | | | | | |
| Siam Commercial Bank plc (Financials, Banks) | | | | | 3,646,300 | 12,295,833 |
| United Kingdom: 11.69% | | | | | | |
| ConvaTec Group plc (Health care, Health care equipment & supplies) 144A | | | | | 1,989,020 | 5,993,812 |
| Kingfisher plc (Consumer discretionary, Specialty retail) † | | | | | 2,294,650 | 11,322,927 |
| Man Group plc (Financials, Capital markets) | | | | | 4,887,200 | 11,349,226 |
The accompanying notes are an integral part of these financial statements.
8 | Wells Fargo International Equity Fund
Portfolio of investments—April 30, 2021 (unaudited)
| | | | | | Shares | Value |
| United Kingdom: (continued) | | | | | | |
| Nomad Foods Limited (Consumer staples, Food products) † | | | | | 433,116 | $ 12,629,663 |
| Sensata Technologies Holding plc (Industrials, Electrical equipment) † | | | | | 93,380 | 5,391,761 |
| Smiths Group plc (Industrials, Industrial conglomerates) | | | | | 514,354 | 11,546,712 |
| | | | | | | 58,234,101 |
| United States: 7.45% | | | | | | |
| Advance Auto Parts Incorporated (Consumer discretionary, Specialty retail) | | | | | 29,731 | 5,950,957 |
| Baker Hughes Incorporated (Energy, Energy equipment & services) | | | | | 196,236 | 3,940,419 |
| Berry Global Group Incorporated (Materials, Containers & packaging) † | | | | | 124,696 | 7,933,160 |
| Gentex Corporation (Consumer discretionary, Auto components) | | | | | 254,144 | 8,940,786 |
| Samsonite International SA (Consumer discretionary, Textiles, apparel & luxury goods) 144A† | | | | | 5,584,200 | 10,366,472 |
| | | | | | | 37,131,794 |
| Total Common stocks (Cost $394,087,025) | | | | | | 472,300,450 |
| | | Yield | | | | |
| Short-term investments: 8.71% | | | | | | |
| Investment companies: 8.71% | | | | | | |
| Wells Fargo Government Money Market Fund Select Class ♠∞ | | 0.03% | | | 43,413,575 | 43,413,575 |
| Total Short-term investments (Cost $43,413,575) | | | | | | 43,413,575 |
| Total investments in securities (Cost $437,500,600) | 103.49% | | | | | 515,714,025 |
| Other assets and liabilities, net | (3.49) | | | | | (17,372,703) |
| Total net assets | 100.00% | | | | | $498,341,322 |
| † | Non-income-earning security |
| 144A | The security may be resold in transactions exempt from registration, normally to qualified institutional buyers, pursuant to Rule 144A under the Securities Act of 1933. |
| ♠ | The issuer of the security is an affiliate of the Fund as defined in the Investment Company Act of 1940. |
| ∞ | The rate represents the 7-day annualized yield at period end. |
| Abbreviations: |
| ADR | American depositary receipt |
| GDR | Global depositary receipt |
The accompanying notes are an integral part of these financial statements.
Wells Fargo International Equity Fund | 9
Portfolio of investments—April 30, 2021 (unaudited)
Investments in affiliates
An affiliated investment is an investment in which the Fund owns at least 5% of the outstanding voting shares of the issuer or as a result of other relationships, such as the Fund and the issuer having the same investment manager. Transactions with issuers that were either affiliates of the Fund at the beginning of the period or the end of the period were as follows:
| | Value,
beginning of
period | Purchases | Sales
proceeds | Net
realized
gains
(losses) | | Net
change in
unrealized
gains
(losses) | | Value,
end of
period | | % of
net
assets | Shares,
end
of period | Income
from
affiliated
securities |
| Short-term investments | | | | | | | | | | | | |
| Investment companies | | | | | | | | | | | | |
| Securities Lending Cash Investments LLC | $ 0 | $ 5,759,354 | $ (5,759,354) | $0 | | $0 | | $ 0 | | | 0 | $ 84# |
| Wells Fargo Government Money Market Fund Select Class | 2,330,238 | 252,096,736 | (211,013,399) | 0 | | 0 | | 43,413,575 | | | 43,413,575 | 1,736 |
| | | | | $0 | | $0 | | $43,413,575 | | 8.71% | | $1,820 |
| # | Amount shown represents income before fees and rebates. |
The accompanying notes are an integral part of these financial statements.
10 | Wells Fargo International Equity Fund
Statement of assets and liabilities—April 30, 2021 (unaudited)
| | |
| Assets | |
Investments in unaffiliated securities, at value (cost $394,087,025)
| $ 472,300,450 |
Investments in affiliated securites, at value (cost $43,413,575)
| 43,413,575 |
Foreign currency, at value (cost $1,122,493)
| 1,122,932 |
Receivable for dividends
| 6,921,389 |
Receivable for investments sold
| 5,236,733 |
Receivable for Fund shares sold
| 241,457 |
Prepaid expenses and other assets
| 183,618 |
Total assets
| 529,420,154 |
| Liabilities | |
Payable for investments purchased
| 29,909,198 |
Payable for Fund shares redeemed
| 390,845 |
Management fee payable
| 287,973 |
Administration fees payable
| 63,724 |
Distribution fees payable
| 4,968 |
Trustees’ fees and expenses payable
| 2,260 |
Accrued expenses and other liabilities
| 419,864 |
Total liabilities
| 31,078,832 |
Total net assets
| $498,341,322 |
| Net assets consist of | |
Paid-in capital
| $ 451,245,578 |
Total distributable earnings
| 47,095,744 |
Total net assets
| $498,341,322 |
| Computation of net asset value and offering price per share | |
Net assets – Class A
| $ 185,581,091 |
Shares outstanding – Class A1
| 13,669,851 |
Net asset value per share – Class A
| $13.58 |
Maximum offering price per share – Class A2
| $14.41 |
Net assets – Class C
| $ 7,625,817 |
Shares outstanding – Class C1
| 568,051 |
Net asset value per share – Class C
| $13.42 |
Net assets – Class R
| $ 367,074 |
Shares outstanding – Class R1
| 26,452 |
Net asset value per share – Class R
| $13.88 |
Net assets – Class R6
| $ 75,057,795 |
Shares outstanding – Class R61
| 5,570,174 |
Net asset value per share – Class R6
| $13.47 |
Net assets – Administrator Class
| $ 16,117,577 |
Shares outstanding – Administrator Class1
| 1,205,657 |
Net asset value per share – Administrator Class
| $13.37 |
Net assets – Institutional Class
| $ 213,591,968 |
Shares outstanding – Institutional Class1
| 15,868,839 |
Net asset value per share – Institutional Class
| $13.46 |
| 1 | The Fund has an unlimited number of authorized shares |
| 2 | Maximum offering price is computed as 100/94.25 of net asset value. On investments of $50,000 or more, the offering price is reduced. |
The accompanying notes are an integral part of these financial statements.
Wells Fargo International Equity Fund | 11
Statement of operations—six months ended April 30, 2021 (unaudited)
| | |
| Investment income | |
Dividends (net of foreign withholdings taxes of $439,229)
| $ 2,530,868 |
Income from affiliated securities
| 23,157 |
Total investment income
| 2,554,025 |
| Expenses | |
Management fee
| 1,088,248 |
| Administration fees | |
Class A
| 92,056 |
Class C
| 6,940 |
Class R
| 366 |
Class R6
| 7,102 |
Administrator Class
| 2,072 |
Institutional Class
| 72,083 |
| Shareholder servicing fees | |
Class A
| 109,564 |
Class C
| 8,256 |
Class R
| 416 |
Administrator Class
| 3,983 |
| Distribution fees | |
Class C
| 24,757 |
Class R
| 416 |
Custody and accounting fees
| 15,551 |
Professional fees
| 29,265 |
Registration fees
| 35,783 |
Shareholder report expenses
| 29,400 |
Trustees’ fees and expenses
| 9,609 |
Interest expense
| 1,464 |
Other fees and expenses
| 16,273 |
Total expenses
| 1,553,604 |
| Less: Fee waivers and/or expense reimbursements | |
Fund-level
| (271,267) |
Institutional Class
| (48,680) |
Net expenses
| 1,233,657 |
Net investment income
| 1,320,368 |
| Realized and unrealized gains (losses) on investments | |
| Net realized gains (losses) on | |
Unaffiliated securities
| 12,024,897 |
Forward foreign currency contracts
| (27,594) |
Net realized gains on investments
| 11,997,303 |
| Net change in unrealized gains (losses) on | |
Unaffiliated securities
| 45,996,159 |
Forward foreign currency contracts
| (33,172) |
Net change in unrealized gains (losses) on investments
| 45,962,987 |
Net realized and unrealized gains (losses) on investments
| 57,960,290 |
Net increase in net assets resulting from operations
| $59,280,658 |
The accompanying notes are an integral part of these financial statements.
12 | Wells Fargo International Equity Fund
Statement of changes in net assets
| | | | | |
| | Six months ended
April 30, 2021
(unaudited) | Year ended
October 31, 2020 |
| Operations | | | | |
Net investment income
| | $ 1,320,368 | | $ 2,835,748 |
Net realized gains (losses) on investments
| | 11,997,303 | | (29,559,491) |
Net change in unrealized gains (losses) on investments
| | 45,962,987 | | 4,272,662 |
Net increase (decrease) in net assets resulting from operations
| | 59,280,658 | | (22,451,081) |
| Distributions to shareholders from | | | | |
| Net investment income and net realized gains | | | | |
Class A
| | (322,278) | | (662,605) |
Class C
| | 0 | | (43,116) |
Class R
| | (813) | | (3,818) |
Class R6
| | (237,116) | | (474,234) |
Administrator Class
| | (2,814) | | (8,337) |
Institutional Class
| | (616,157) | | (1,471,021) |
Total distributions to shareholders
| | (1,179,178) | | (2,663,131) |
| Capital share transactions | Shares | | Shares | |
| Proceeds from shares sold | | | | |
Class A
| 310,726 | 3,974,173 | 441,187 | 4,609,759 |
Class C
| 18,835 | 250,834 | 18,948 | 217,660 |
Class R
| 1,073 | 13,652 | 9,052 | 93,509 |
Class R6
| 1,146,569 | 14,252,503 | 50,929 | 509,198 |
Administrator Class
| 839,318 | 10,788,568 | 2,257 | 25,149 |
Institutional Class
| 1,792,627 | 23,263,839 | 1,376,623 | 14,425,401 |
| | | 52,543,569 | | 19,880,676 |
| Reinvestment of distributions | | | | |
Class A
| 24,095 | 301,651 | 55,305 | 622,252 |
Class C
| 0 | 0 | 3,189 | 38,076 |
Class R
| 64 | 811 | 128 | 1,574 |
Class R6
| 5,871 | 72,500 | 20,969 | 225,470 |
Administrator Class
| 207 | 2,560 | 705 | 7,903 |
Institutional Class
| 43,875 | 549,132 | 118,415 | 1,298,339 |
| | | 926,654 | | 2,193,614 |
| Payment for shares redeemed | | | | |
Class A
| (528,033) | (6,773,101) | (1,601,924) | (16,539,389) |
Class C
| (85,969) | (1,068,775) | (408,169) | (4,212,540) |
Class R
| (2,532) | (32,826) | (49,772) | (546,039) |
Class R6
| (1,630,852) | (21,024,403) | (207,377) | (2,240,668) |
Administrator Class
| (45,562) | (590,366) | (51,651) | (501,027) |
Institutional Class
| (1,140,069) | (14,340,538) | (6,523,658) | (66,426,216) |
| | | (43,830,009) | | (90,465,879) |
| Net asset value of shares issued in acquisition | | | | |
Class A
| 7,842,133 | 105,650,203 | 0 | 0 |
Class C
| 73,140 | 973,663 | 0 | 0 |
Class R6
| 2,957,505 | 39,381,406 | 0 | 0 |
Administrator Class
| 354,359 | 4,729,637 | 0 | 0 |
Institutional Class
| 6,852,407 | 92,322,186 | 0 | 0 |
| | | 243,057,095 | | 0 |
Net increase (decrease) in net assets resulting from capital share transactions
| | 252,697,309 | | (68,391,589) |
Total increase (decrease) in net assets
| | 310,798,789 | | (93,505,801) |
| Net assets | | | | |
Beginning of period
| | 187,542,533 | | 281,048,334 |
End of period
| | $498,341,322 | | $187,542,533 |
The accompanying notes are an integral part of these financial statements.
Wells Fargo International Equity Fund | 13
Financial highlights
(For a share outstanding throughout each period)
| | | Year ended October 31 |
| Class A | Six months ended
April 30, 2021
(unaudited) | 2020 | 2019 | 2018 | 2017 | 2016 |
Net asset value, beginning of period
| $10.43 | $11.38 | $11.81 | $13.43 | $11.07 | $11.53 |
Net investment income
| 0.06 1 | 0.12 | 0.24 1 | 0.27 | 0.22 | 0.22 |
Net realized and unrealized gains (losses) on investments
| 3.14 | (0.97) | (0.16) | (1.40) | 2.47 | (0.54) |
Total from investment operations
| 3.20 | (0.85) | 0.08 | (1.13) | 2.69 | (0.32) |
| Distributions to shareholders from | | | | | | |
Net investment income
| (0.05) | (0.10) | (0.51) | (0.49) | (0.33) | (0.14) |
Net asset value, end of period
| $13.58 | $10.43 | $11.38 | $11.81 | $13.43 | $11.07 |
Total return2
| 30.77% | (7.54)% | 0.93% | (8.81)% | 24.91% | (2.76)% |
| Ratios to average net assets (annualized) | | | | | | |
Gross expenses
| 1.41% | 1.48% | 1.45% | 1.39% | 1.47% | 1.47% |
Net expenses
| 1.13% | 1.13% | 1.14% | 1.14% | 1.14% | 1.12% |
Net investment income
| 0.99% | 1.12% | 2.13% | 1.97% | 1.82% | 2.04% |
| Supplemental data | | | | | | |
Portfolio turnover rate
| 38% | 73% | 49% | 62% | 59% | 65% |
Net assets, end of period (000s omitted)
| $185,581 | $62,800 | $81,110 | $91,206 | $109,655 | $122,248 |
| 1 | Calculated based upon average shares outstanding |
| 2 | Total return calculations do not include any sales charges. Returns for periods of less than one year are not annualized. |
The accompanying notes are an integral part of these financial statements.
14 | Wells Fargo International Equity Fund
Financial highlights
(For a share outstanding throughout each period)
| | | Year ended October 31 |
| Class C | Six months ended
April 30, 2021
(unaudited) | 2020 | 2019 | 2018 | 2017 | 2016 |
Net asset value, beginning of period
| $10.31 | $11.28 | $11.57 | $13.13 | $10.82 | $11.30 |
Net investment income (loss)
| (0.00) 1 | 0.03 2 | 0.12 2 | 0.15 | 0.14 | 0.14 |
Net realized and unrealized gains (losses) on investments
| 3.11 | (0.95) | (0.12) | (1.35) | 2.40 | (0.53) |
Total from investment operations
| 3.11 | (0.92) | 0.00 | (1.20) | 2.54 | (0.39) |
| Distributions to shareholders from | | | | | | |
Net investment income
| 0.00 | (0.05) | (0.29) | (0.36) | (0.23) | (0.09) |
Net asset value, end of period
| $13.42 | $10.31 | $11.28 | $11.57 | $13.13 | $10.82 |
Total return3
| 30.16% | (8.22)% | 0.16% | (9.47)% | 23.91% | (3.43)% |
| Ratios to average net assets (annualized) | | | | | | |
Gross expenses
| 2.17% | 2.22% | 2.19% | 2.14% | 2.22% | 2.22% |
Net expenses
| 1.89% | 1.89% | 1.89% | 1.89% | 1.89% | 1.87% |
Net investment income (loss)
| (0.05)% | 0.28% | 1.07% | 1.22% | 1.26% | 1.33% |
| Supplemental data | | | | | | |
Portfolio turnover rate
| 38% | 73% | 49% | 62% | 59% | 65% |
Net assets, end of period (000s omitted)
| $7,626 | $5,794 | $10,700 | $22,963 | $28,919 | $27,508 |
| 1 | Amount is more than $(0.005) |
| 2 | Calculated based upon average shares outstanding |
| 3 | Total return calculations do not include any sales charges. Returns for periods of less than one year are not annualized. |
The accompanying notes are an integral part of these financial statements.
Wells Fargo International Equity Fund | 15
Financial highlights
(For a share outstanding throughout each period)
| | | Year ended October 31 |
| Class R | Six months ended
April 30, 2021
(unaudited) | 2020 | 2019 | 2018 | 2017 | 2016 |
Net asset value, beginning of period
| $10.65 | $11.61 | $11.98 | $13.58 | $11.20 | $11.66 |
Net investment income
| 0.03 1 | 0.07 1 | 0.22 1 | 0.23 1 | 0.20 1 | 0.19 1 |
Net realized and unrealized gains (losses) on investments
| 3.23 | (0.97) | (0.15) | (1.41) | 2.48 | (0.53) |
Total from investment operations
| 3.26 | (0.90) | 0.07 | (1.18) | 2.68 | (0.34) |
| Distributions to shareholders from | | | | | | |
Net investment income
| (0.03) | (0.06) | (0.44) | (0.42) | (0.30) | (0.12) |
Net asset value, end of period
| $13.88 | $10.65 | $11.61 | $11.98 | $13.58 | $11.20 |
Total return2
| 30.63% | (7.84)% | 0.79% | (9.03)% | 24.47% | (2.94)% |
| Ratios to average net assets (annualized) | | | | | | |
Gross expenses
| 1.65% | 1.67% | 1.64% | 1.64% | 1.72% | 1.72% |
Net expenses
| 1.39% | 1.39% | 1.37% | 1.39% | 1.39% | 1.37% |
Net investment income
| 0.44% | 0.64% | 1.88% | 1.72% | 1.66% | 1.77% |
| Supplemental data | | | | | | |
Portfolio turnover rate
| 38% | 73% | 49% | 62% | 59% | 65% |
Net assets, end of period (000s omitted)
| $367 | $297 | $794 | $1,404 | $1,996 | $2,029 |
| 1 | Calculated based upon average shares outstanding |
| 2 | Returns for periods of less than one year are not annualized. |
The accompanying notes are an integral part of these financial statements.
16 | Wells Fargo International Equity Fund
Financial highlights
(For a share outstanding throughout each period)
| | | Year ended October 31 |
| Class R6 | Six months ended
April 30, 2021
(unaudited) | 2020 | 2019 | 2018 | 2017 | 2016 |
Net asset value, beginning of period
| $10.36 | $11.31 | $11.79 | $13.44 | $11.06 | $11.49 |
Net investment income
| 0.16 | 0.16 | 0.35 | 0.31 | 0.45 | 0.24 |
Net realized and unrealized gains (losses) on investments
| 3.03 | (0.96) | (0.23) | (1.40) | 2.27 | (0.52) |
Total from investment operations
| 3.19 | (0.80) | 0.12 | (1.09) | 2.72 | (0.28) |
| Distributions to shareholders from | | | | | | |
Net investment income
| (0.08) | (0.15) | (0.60) | (0.56) | (0.34) | (0.15) |
Net asset value, end of period
| $13.47 | $10.36 | $11.31 | $11.79 | $13.44 | $11.06 |
Total return1
| 30.95% | (7.15)% | 1.27% | (8.57)% | 25.30% | (2.46)% |
| Ratios to average net assets (annualized) | | | | | | |
Gross expenses
| 0.99% | 1.05% | 1.01% | 0.96% | 1.03% | 1.04% |
Net expenses
| 0.79% | 0.79% | 0.81% | 0.84% | 0.84% | 0.85% |
Net investment income
| 1.24% | 1.51% | 2.23% | 2.23% | 3.55% | 2.31% |
| Supplemental data | | | | | | |
Portfolio turnover rate
| 38% | 73% | 49% | 62% | 59% | 65% |
Net assets, end of period (000s omitted)
| $75,058 | $32,011 | $36,505 | $63,414 | $74,405 | $26 |
| 1 | Returns for periods of less than one year are not annualized. |
The accompanying notes are an integral part of these financial statements.
Wells Fargo International Equity Fund | 17
Financial highlights
(For a share outstanding throughout each period)
| | | Year ended October 31 |
| Administrator Class | Six months ended
April 30, 2021
(unaudited) | 2020 | 2019 | 2018 | 2017 | 2016 |
Net asset value, beginning of period
| $10.28 | $11.22 | $11.62 | $13.20 | $10.88 | $11.33 |
Net investment income
| 0.15 1 | 0.10 1 | 0.23 1 | 0.20 1 | 0.21 1 | 0.22 |
Net realized and unrealized gains (losses) on investments
| 3.00 | (0.94) | (0.14) | (1.31) | 2.43 | (0.53) |
Total from investment operations
| 3.15 | (0.84) | 0.09 | (1.11) | 2.64 | (0.31) |
| Distributions to shareholders from | | | | | | |
Net investment income
| (0.06) | (0.10) | (0.49) | (0.47) | (0.32) | (0.14) |
Net asset value, end of period
| $13.37 | $10.28 | $11.22 | $11.62 | $13.20 | $10.88 |
Total return2
| 30.67% | (7.54)% | 0.98% | (8.79)% | 24.84% | (2.71)% |
| Ratios to average net assets (annualized) | | | | | | |
Gross expenses
| 1.30% | 1.39% | 1.36% | 1.31% | 1.39% | 1.38% |
Net expenses
| 1.14% | 1.14% | 1.14% | 1.14% | 1.14% | 1.12% |
Net investment income
| 2.22% | 0.98% | 2.00% | 1.53% | 1.79% | 1.93% |
| Supplemental data | | | | | | |
Portfolio turnover rate
| 38% | 73% | 49% | 62% | 59% | 65% |
Net assets, end of period (000s omitted)
| $16,118 | $589 | $1,189 | $5,152 | $18,174 | $36,032 |
| 1 | Calculated based upon average shares outstanding |
| 2 | Returns for periods of less than one year are not annualized. |
The accompanying notes are an integral part of these financial statements.
18 | Wells Fargo International Equity Fund
Financial highlights
(For a share outstanding throughout each period)
| | | Year ended October 31 |
| Institutional Class | Six months ended
April 30, 2021
(unaudited) | 2020 | 2019 | 2018 | 2017 | 2016 |
Net asset value, beginning of period
| $10.34 | $11.29 | $11.76 | $13.40 | $11.05 | $11.49 |
Net investment income
| 0.07 1 | 0.14 1 | 0.33 | 0.30 1 | 0.28 1 | 0.23 |
Net realized and unrealized gains (losses) on investments
| 3.12 | (0.96) | (0.22) | (1.39) | 2.43 | (0.52) |
Total from investment operations
| 3.19 | (0.82) | 0.11 | (1.09) | 2.71 | (0.29) |
| Distributions to shareholders from | | | | | | |
Net investment income
| (0.07) | (0.13) | (0.58) | (0.55) | (0.36) | (0.15) |
Net asset value, end of period
| $13.46 | $10.34 | $11.29 | $11.76 | $13.40 | $11.05 |
Total return2
| 30.95% | (7.28)% | 1.19% | (8.56)% | 25.21% | (2.48)% |
| Ratios to average net assets (annualized) | | | | | | |
Gross expenses
| 1.09% | 1.15% | 1.11% | 1.06% | 1.14% | 1.14% |
Net expenses
| 0.84% | 0.84% | 0.86% | 0.89% | 0.89% | 0.87% |
Net investment income
| 1.05% | 1.33% | 2.27% | 2.31% | 2.28% | 2.27% |
| Supplemental data | | | | | | |
Portfolio turnover rate
| 38% | 73% | 49% | 62% | 59% | 65% |
Net assets, end of period (000s omitted)
| $213,592 | $86,052 | $150,749 | $243,235 | $236,946 | $182,639 |
| 1 | Calculated based upon average shares outstanding |
| 2 | Returns for periods of less than one year are not annualized. |
The accompanying notes are an integral part of these financial statements.
Wells Fargo International Equity Fund | 19
Notes to financial statements (unaudited)
1. ORGANIZATION
Wells Fargo Funds Trust (the "Trust"), a Delaware statutory trust organized on March 10, 1999, is an open-end management investment company registered under the Investment Company Act of 1940, as amended (the "1940 Act"). As an investment company, the Trust follows the accounting and reporting guidance in Financial Accounting Standards Board ("FASB") Accounting Standards Codification Topic 946, Financial Services – Investment Companies. These financial statements report on the Wells Fargo International Equity Fund (the "Fund") which is a diversified series of the Trust.
On February 23, 2021, Wells Fargo & Company announced that it has entered into a definitive agreement to sell Wells Fargo Asset Management ("WFAM") to GTCR LLC and Reverence Capital Partners, L.P. WFAM is the trade name used by the asset management businesses of Wells Fargo & Company and includes Wells Fargo Funds Management, LLC, the investment manager to the Fund, Wells Capital Management Incorporated and Wells Fargo Asset Management (International) Limited, both registered investment advisers providing sub-advisory services to certain funds, and Wells Fargo Funds Distributor, LLC, the Fund's principal underwriter. As part of the transaction, Wells Fargo & Company will own a 9.9% equity interest and will continue to serve as an important client and distribution partner.
Consummation of the transaction will result in the automatic termination of the Fund's investment management agreement and subadvisory agreement. The Fund's Board of Trustees approved a new investment management and new subadvisory agreement and approved submitting the agreements to the Fund’s shareholders for approval at a special meeting of shareholders expected to be held on July 15, 2021. Shareholders of record of the Fund at the close of business on May 28, 2021 are entitled to vote at the meeting. If shareholders approve the new agreements, they would take effect upon the closing of the transaction. The transaction is expected to close in the second half of 2021, subject to customary closing conditions.
This shareholder report is not asking you for a proxy. A separate proxy statement with more detailed information about the transaction will be provided to Fund shareholders and should be reviewed carefully.
2. SIGNIFICANT ACCOUNTING POLICIES
The following significant accounting policies, which are consistently followed in the preparation of the financial statements of the Fund, are in conformity with U.S. generally accepted accounting principles which require management to make estimates and assumptions that affect the reported amounts of assets and liabilities, disclosure of contingent assets and liabilities at the date of the financial statements, and the reported amounts of income and expenses during the reporting period. Actual results could differ from those estimates.
Securities valuation
All investments are valued each business day as of the close of regular trading on the New York Stock Exchange (generally 4 p.m. Eastern Time), although the Fund may deviate from this calculation time under unusual or unexpected circumstances.
Equity securities that are listed on a foreign or domestic exchange or market are valued at the official closing price or, if none, the last sales price. If no sale occurs on the principal exchange or market that day, a fair value price will be determined in accordance with the Fund’s Valuation Procedures.
The values of securities denominated in foreign currencies are translated into U.S. dollars at rates provided by an independent foreign currency pricing source at a time each business day specified by the Wells Fargo Asset Management Pricing Committee at Wells Fargo Funds Management, LLC ("Funds Management").
Many securities markets and exchanges outside the U.S. close prior to the close of the New York Stock Exchange and therefore may not fully reflect trading or events that occur after the close of the principal exchange in which the foreign securities are traded, but before the close of the New York Stock Exchange. If such trading or events are expected to materially affect the value of such securities, then fair value pricing procedures approved by the Board of Trustees of the Fund are applied. These procedures take into account multiple factors including movements in U.S. securities markets after foreign exchanges close. Foreign securities that are fair valued under these procedures are categorized as Level 2 and the application of these procedures may result in transfers between Level 1 and Level 2. Depending on market activity, such fair valuations may be frequent. Such fair value pricing may result in net asset values that are higher or lower than net asset values based on the last reported sales price or latest quoted bid price. On April 30, 2021, such fair value pricing was used in pricing certain foreign securities.
Forward foreign currency contracts are recorded at the forward rate provided by an independent foreign currency pricing source at a time each business day specified by the Wells Fargo Asset Management Pricing Committee.
Investments in registered open-end investment companies are valued at net asset value. Interests in non-registered investment companies that are redeemable at net asset value are fair valued normally at net asset value.
20 | Wells Fargo International Equity Fund
Notes to financial statements (unaudited)
Investments which are not valued using any of the methods discussed above are valued at their fair value, as determined in good faith by the Board of Trustees. The Board of Trustees has established a Valuation Committee comprised of the Trustees and has delegated to it the authority to take any actions regarding the valuation of portfolio securities that the Valuation Committee deems necessary or appropriate, including determining the fair value of portfolio securities, unless the determination has been delegated to the Wells Fargo Asset Management Pricing Committee. The Board of Trustees retains the authority to make or ratify any valuation decisions or approve any changes to the Valuation Procedures as it deems appropriate. On a quarterly basis, the Board of Trustees receives reports on any valuation actions taken by the Valuation Committee or the Wells Fargo Asset Management Pricing Committee which may include items for ratification.
Foreign currency translation
The accounting records of the Fund are maintained in U.S. dollars. The values of other assets and liabilities denominated in foreign currencies are translated into U.S. dollars at rates provided by an independent foreign currency pricing source at a time each business day specified by the Wells Fargo Asset Management Pricing Committee. Purchases and sales of securities, and income and expenses are converted at the rate of exchange on the respective dates of such transactions. Net realized foreign exchange gains or losses arise from sales of foreign currencies, currency gains or losses realized between the trade and settlement dates on securities transactions, and the difference between the amounts of dividends, interest and foreign withholding taxes recorded and the U.S. dollar equivalent of the amounts actually paid or received. Net unrealized foreign exchange gains and losses arise from changes in the fair value of assets and liabilities other than investments in securities resulting from changes in exchange rates. The changes in net assets arising from changes in exchange rates of securities and the changes in net assets resulting from changes in market prices of securities are not separately presented. Such changes are included in net realized and unrealized gains or losses from investments.
Forward foreign currency contracts
A forward foreign currency contract is an agreement between two parties to purchase or sell a specific currency for an agreed-upon price at a future date. The Fund enters into forward foreign currency contracts to facilitate transactions in foreign-denominated securities and to attempt to minimize the risk to the Fund from adverse changes in the relationship between currencies. Forward foreign currency contracts are recorded at the forward rate and marked-to-market daily. When the contracts are closed, realized gains and losses arising from such transactions are recorded as realized gains or losses on forward foreign currency contracts. The Fund is subject to foreign currency risk and may be exposed to risks if the counterparties to the contracts are unable to meet the terms of their contracts or if the value of the foreign currency changes unfavorably. The Fund's maximum risk of loss from counterparty credit risk is the unrealized gains on the contracts. This risk may be mitigated if there is a master netting arrangement between the Fund and the counterparty.
Securities lending
The Fund may lend its securities from time to time in order to earn additional income in the form of fees or interest on securities received as collateral or the investment of any cash received as collateral. When securities are on loan, the Fund receives interest or dividends on those securities. Cash collateral received in connection with its securities lending transactions is invested in Securities Lending Cash Investments, LLC (the "Securities Lending Fund"). Investments in Securities Lending Fund are valued at the evaluated bid price provided by an independent pricing service. Income earned from investment in the Securities Lending Fund (net of fees and rebates), if any, is included in income from affiliated securities on the Statement of Operations.
In a securities lending transaction, the net asset value of the Fund is affected by an increase or decrease in the value of the securities loaned and by an increase or decrease in the value of the instrument in which collateral is invested. The amount of securities lending activity undertaken by the Fund fluctuates from time to time. The Fund has the right under the lending agreement to recover the securities from the borrower on demand. In the event of default or bankruptcy by the borrower, the Fund may be prevented from recovering the loaned securities or gaining access to the collateral or may experience delays or costs in doing so. In such an event, the terms of the agreement allow the unaffiliated securities lending agent to use the collateral to purchase replacement securities on behalf of the Fund or pay the Fund the market value of the loaned securities. The Fund bears the risk of loss with respect to depreciation of its investment of the cash collateral.
Security transactions and income recognition
Securities transactions are recorded on a trade date basis. Realized gains or losses are recorded on the basis of identified cost.
Dividend income is recognized on the ex-dividend date, except for certain dividends from foreign securities, which are recorded as soon as the custodian verifies the ex-dividend date. Dividend income from foreign securities is recorded net of foreign taxes withheld where recovery of such taxes is not assured.
Wells Fargo International Equity Fund | 21
Notes to financial statements (unaudited)
Distributions to shareholders
Distributions to shareholders are recorded on the ex-dividend date and paid from net investment income quarterly and any net realized gains are paid at least annually. Such distributions are determined in accordance with income tax regulations and may differ from U.S. generally accepted accounting principles. Dividend sources are estimated at the time of declaration. The tax character of distributions is determined as of the Fund's fiscal year end. Therefore, a portion of the Fund's distributions made prior to the Fund’s fiscal year end may be categorized as a tax return of capital at year end.
Federal and other taxes
The Fund intends to continue to qualify as a regulated investment company by distributing substantially all of its investment company taxable income and any net realized capital gains (after reduction for capital loss carryforwards) sufficient to relieve it from all, or substantially all, federal income taxes. Accordingly, no provision for federal income taxes was required.
The Fund’s income and federal excise tax returns and all financial records supporting those returns for the prior three fiscal years are subject to examination by the federal and Delaware revenue authorities. Management has analyzed the Fund's tax positions taken on federal, state, and foreign tax returns for all open tax years and does not believe that there are any uncertain tax positions that require recognition of a tax liability.
As of April 30, 2021, the aggregate cost of all investments for federal income tax purposes was $441,932,301 and the unrealized gains (losses) consisted of:
| Gross unrealized gains | $75,577,854 |
| Gross unrealized losses | (1,796,130) |
| Net unrealized gains | $73,781,724 |
As of October 31, 2020, the Fund had capital loss carryforwards which consisted of $16,636,686 in short-term capital losses and $21,103,800 in long-term capital losses.
Class allocations
The separate classes of shares offered by the Fund differ principally in applicable sales charges, distribution, shareholder servicing, and administration fees. Class specific expenses are charged directly to that share class. Investment income, common fund-level expenses, and realized and unrealized gains (losses) on investments are allocated daily to each class of shares based on the relative proportion of net assets of each class.
3. FAIR VALUATION MEASUREMENTS
Fair value measurements of investments are determined within a framework that has established a fair value hierarchy based upon the various data inputs utilized in determining the value of the Fund’s investments. The three-level hierarchy gives the highest priority to unadjusted quoted prices in active markets for identical assets or liabilities (Level 1) and the lowest priority to unobservable inputs (Level 3). The Fund’s investments are classified within the fair value hierarchy based on the lowest level of input that is significant to the fair value measurement. The inputs are summarized into three broad levels as follows:
| ■ | Level 1 – quoted prices in active markets for identical securities |
| ■ | Level 2 – other significant observable inputs (including quoted prices for similar securities, interest rates, prepayment speeds, credit risk, etc.) |
| ■ | Level 3 – significant unobservable inputs (including the Fund’s own assumptions in determining the fair value of investments) |
The inputs or methodologies used for valuing investments in securities are not necessarily an indication of the risk associated with investing in those securities.
22 | Wells Fargo International Equity Fund
Notes to financial statements (unaudited)
The following is a summary of the inputs used in valuing the Fund’s assets and liabilities as of April 30, 2021:
| | Quoted prices
(Level 1) | Other significant
observable inputs
(Level 2) | Significant
unobservable inputs
(Level 3) | Total |
| Assets | | | | |
| Investments in: | | | | |
| Common stocks | | | | |
| Australia | $ 12,901,640 | $ 0 | $0 | $ 12,901,640 |
| Brazil | 3,211,613 | 0 | 0 | 3,211,613 |
| Canada | 15,995,948 | 0 | 0 | 15,995,948 |
| China | 74,466,640 | 0 | 0 | 74,466,640 |
| Denmark | 0 | 11,415,981 | 0 | 11,415,981 |
| France | 20,676,044 | 0 | 0 | 20,676,044 |
| Germany | 21,894,478 | 0 | 0 | 21,894,478 |
| Hong Kong | 13,555,547 | 0 | 0 | 13,555,547 |
| India | 11,489,287 | 0 | 0 | 11,489,287 |
| Ireland | 6,247,040 | 0 | 0 | 6,247,040 |
| Israel | 4,145,587 | 0 | 0 | 4,145,587 |
| Italy | 2,307,148 | 0 | 0 | 2,307,148 |
| Japan | 52,008,791 | 0 | 0 | 52,008,791 |
| Luxembourg | 9,992,403 | 0 | 0 | 9,992,403 |
| Mexico | 1,377,283 | 0 | 0 | 1,377,283 |
| Netherlands | 35,021,503 | 0 | 0 | 35,021,503 |
| Norway | 11,458,060 | 0 | 0 | 11,458,060 |
| Russia | 2,788,239 | 0 | 0 | 2,788,239 |
| South Korea | 39,522,920 | 0 | 0 | 39,522,920 |
| Switzerland | 14,162,570 | 0 | 0 | 14,162,570 |
| Thailand | 12,295,833 | 0 | 0 | 12,295,833 |
| United Kingdom | 58,234,101 | 0 | 0 | 58,234,101 |
| United States | 37,131,794 | 0 | 0 | 37,131,794 |
| Short-term investments | | | | |
| Investment companies | 43,413,575 | 0 | 0 | 43,413,575 |
| Total assets | $504,298,044 | $11,415,981 | $0 | $515,714,025 |
Additional sector, industry or geographic detail, if any, is included in the Portfolio of Investments.
For the six months ended April 30, 2021, the Fund did not have any transfers into/out of Level 3.
4. TRANSACTIONS WITH AFFILIATES
Management fee
Funds Management, an indirect wholly owned subsidiary of Wells Fargo & Company ("Wells Fargo"), is the manager of the Fund and provides advisory and fund-level administrative services under an investment management agreement. Under the investment management agreement, Funds Management is responsible for, among other services, implementing the investment objectives and strategies of the Fund, supervising the subadviser and providing fund-level administrative services in connection with the Fund’s operations. As compensation for its services under the investment management agreement, Funds Management is entitled to receive a management fee at the following annual rate based on the Fund’s average daily net assets:
Wells Fargo International Equity Fund | 23
Notes to financial statements (unaudited)
| Average daily net assets | Management fee |
| First $500 million | 0.850% |
| Next $500 million | 0.800 |
| Next $1 billion | 0.750 |
| Next $2 billion | 0.725 |
| Next $1 billion | 0.700 |
| Next $5 billion | 0.690 |
| Over $10 billion | 0.680 |
For the six months ended April 30, 2021, the management fee was equivalent to an annual rate of 0.85% of the Fund’s average daily net assets.
Funds Management has retained the services of a subadviser to provide daily portfolio management to the Fund. The fee for subadvisory services is borne by Funds Management. Wells Capital Management Incorporated ("WellsCap"), an affiliate of Funds Management and an indirect wholly owned subsidiary of Wells Fargo, is the subadviser to the Fund and is entitled to receive a fee from Funds Management at an annual rate starting at 0.45% and declining to 0.40% as the average daily net assets of the Fund increase.
Administration fees
Under a class-level administration agreement, Funds Management provides class-level administrative services to the Fund, which includes paying fees and expenses for services provided by the transfer agent, sub-transfer agents, omnibus account servicers and record-keepers. As compensation for its services under the class-level administration agreement, Funds Management receives an annual fee which is calculated based on the average daily net assets of each class as follows:
| | Class-level
administration fee |
| Class A | 0.21% |
| Class C | 0.21 |
| Class R | 0.21 |
| Class R6 | 0.03 |
| Administrator Class | 0.13 |
| Institutional Class | 0.13 |
Waivers and/or expense reimbursements
Funds Management has contractually waived and/or reimbursed management and administration fees to the extent necessary to maintain certain net operating expense ratios for the Fund. When each class of the Fund has exceeded its expense cap, Funds Management has waived fees and/or reimbursed expenses from fund-level expenses on a proportionate basis and then from class specific expenses. When only certain classes exceed their expense caps, waivers and/or reimbursements are applied against class specific expenses before fund-level expenses. Funds Management has committed through February 28, 2022 to waive fees and/or reimburse expenses to the extent necessary to cap expenses. Prior to or after the commitment expiration date, the cap may be increased or the commitment to maintain the cap may be terminated only with the approval of the Board of Trustees. The contractual expense caps are as follows:
24 | Wells Fargo International Equity Fund
Notes to financial statements (unaudited)
| | Expense ratio caps |
| Class A | 1.14% |
| Class C | 1.89 |
| Class R | 1.39 |
| Class R6 | 0.79 |
| Administrator Class | 1.14 |
| Institutional Class | 0.84 |
Distribution fees
The Trust has adopted a distribution plan for Class C and Class R shares of the Fund pursuant to Rule 12b-1 under the 1940 Act. Distribution fees are charged to Class C and Class R shares and paid to Wells Fargo Funds Distributor, LLC ("Funds Distributor"), the principal underwriter, at an annual rate of 0.75% of the average daily net assets of Class C shares and 0.25% of the average daily net assets of Class R shares.
In addition, Funds Distributor is entitled to receive the front-end sales charge from the purchase of Class A shares and a contingent deferred sales charge on the redemption of certain Class A shares. Funds Distributor is also entitled to receive the contingent deferred sales charges from redemptions of Class C shares. For the six months ended April 30, 2021, Funds Distributor received $513 from the sale of Class A shares. No contingent deferred sales charges were incurred by Class A and Class C shares for the six months ended April 30, 2021.
Shareholder servicing fees
The Trust has entered into contracts with one or more shareholder servicing agents, whereby Class A, Class C, Class R, and Administrator Class of the Fund are charged a fee at an annual rate of 0.25% of the average daily net assets of each respective class. A portion of these total shareholder servicing fees were paid to affiliates of Wells Fargo.
Interfund transactions
The Fund may purchase or sell portfolio investment securities to certain other Wells Fargo affiliates pursuant to Rule 17a-7 under the 1940 Act and under procedures adopted by the Board of Trustees. The procedures have been designed to ensure that these interfund transactions, which do not incur broker commissions, are effected at current market prices.
5. INVESTMENT PORTFOLIO TRANSACTIONS
Purchases and sales of investments, excluding U.S. government obligations (if any) and short-term securities, for the six months ended April 30, 2021 were $224,626,710 and $99,150,879, respectively.
6. SECURITIES LENDING TRANSACTIONS
The Fund lends its securities through an unaffiliated securities lending agent and receives collateral in the form of cash or securities with a value at least equal to the value of the securities on loan. The value of the loaned securities is determined at the close of each business day and any increases or decreases in the required collateral are exchanged between the Fund and the counterparty on the next business day. Cash collateral received is invested in the Securities Lending Fund which seeks to provide a positive return compared to the daily Federal Funds Open Rate by investing in high-quality, U.S. dollar-denominated short-term money market instruments and is exempt from registration under Section 3(c)(7) of the 1940 Act. Securities Lending Fund is managed by Funds Management and is subadvised by WellsCap. Funds Management receives an advisory fee starting at 0.05% and declining to 0.01% as the average daily net assets of the Securities Lending Fund increase. All of the fees received by Funds Management are paid to WellsCap for its services as subadviser.
In the event of counterparty default or the failure of a borrower to return a loaned security, the Fund has the right to use the collateral to offset any losses incurred. As of April 30, 2021, the Fund did not have any securities on loan.
7. DERIVATIVE TRANSACTIONS
During the six months ended April 30, 2021, the Fund entered into forward foreign currency contracts for economic hedging purposes. The Fund had average contract amounts of $1,853,882 in forward foreign currency contracts to buy and $2,040,087 in forward foreign currency contracts to sell during the six months ended April 30, 2021.
Wells Fargo International Equity Fund | 25
Notes to financial statements (unaudited)
8. ACQUISITIONS
After the close of business on April 23, 2021, the Fund acquired the net assets of Wells Fargo International Value Fund (“International Value Fund”). The purpose of the transaction was to combine two funds with similar investment objectives and strategies. The Fund became the accounting and performance survivor in the transaction. The acquisition was accomplished by a tax-free exchange of all of the shares of International Value Fund for shares of the Fund. Shareholders holding Class A, Class C, Class R6, Administrator Class, and Institutional Class shares of International Value Fund each received Class A, Class C, Class R6, Administrator Class, and Institutional Class shares, respectively, of the Fund in the reorganization. The investment portfolio of International Value Fund with a fair value of $23,947,423 (identified cost of $17,147,723) and $128,870,480 in cash at April 23, 2021 were the principal assets acquired by the Fund. For financial reporting purposes, assets received and shares issued by the Fund were recorded at fair value; however, the cost basis of the investments received from International Value Fund were carried forward to align with ongoing reporting of the Fund’s realized and unrealized gains and losses with amounts distributable to shareholders for tax purposes.
After the close of business on March 26, 2021, the Fund acquired the net assets of Wells Fargo Diversified International Fund (“Diversified International Fund”). The purpose of the transaction was to combine two funds with similar investment objectives and strategies. The Fund became the accounting and performance survivor in the transaction. The acquisition was accomplished by a tax-free exchange of all of the shares of Diversified International Fund for shares of the Fund. Shareholders holding Class A, Class C, Class R6, Administrator Class, and Institutional Class shares of Diversified International Fund each received Class A, Class C, Class R6, Administrator Class, and Institutional Class shares, respectively, of the Fund in the reorganization. The investment portfolio of Diversified International Fund with a fair value of $85,802,932 and identified cost of $76,000,775 at March 26, 2021 were the principal assets acquired by the Fund. For financial reporting purposes, assets received and shares issued by the Fund were recorded at fair value; however, the cost basis of the investments received from Diversified International Fund were carried forward to align with ongoing reporting of the Fund’s realized and unrealized gains and losses with amounts distributable to shareholders for tax purposes.
The value of net assets acquired, unrealized gains (losses) acquired, exchange ratio and number of shares issued were as follows:
| Acquired fund | Value of net
assets acquired | Unrealized
gains | Exchange
ratio | Number of
shares issued |
| International Value Fund | $156,960,476 | $6,799,700 | 1.12 | 3,910,472 | Class A |
| | | | 1.11 | 31,972 | Class C |
| | | | 1.12 | 871,897 | Class R6 |
| | | | 1.15 | 287,858 | Administrator Class |
| | | | 1.12 | 6,503,392 | Institutional Class |
| Diversified International Fund | 86,096,619 | 9,802,157 | 1.00 | 3,931,661 | Class A |
| | | | 0.93 | 41,168 | Class C |
| | | | 1.03 | 2,085,608 | Class R6 |
| | | | 1.04 | 66,501 | Administrator Class |
| | | | 0.95 | 349,015 | Institutional Class |
On April 23, 2021, the aggregate net assets of International Value Fund and the Fund immediately prior to the acquisition were $156,960,476 and $343,413,612, respectively. The aggregate net assets of the Fund immediately after the acquisition were $500,374,088.
On March 26, 2021, the aggregate net assets of Diversified International Fund and the Fund immediately prior to the acquisition were $86,096,619 and $246,327,950, respectively. The aggregate net assets of the Fund immediately after the acquisition were $332,424,569.
Assuming the acquisitions had been completed November 1, 2020, the beginning of the reporting period for the Fund, the pro forma results of operations for the six months ended April 30, 2021 would have been as follows (unaudited):
| Net investment income | $ 4,346,084 |
| Net realized and unrealized gains (losses) on investments | 20,825,139 |
| Net increase in net assets resulting from operations | $25,171,223 |
26 | Wells Fargo International Equity Fund
Notes to financial statements (unaudited)
Because the combined investment portfolios have been managed as a single integrated portfolio since each acquisition was completed, it is not practicable to separate the amounts of revenue and earnings of the acquired funds that have been included in the Statement of Operations since each transaction date.
9. BANK BORROWINGS
The Trust (excluding the money market funds), Wells Fargo Master Trust and Wells Fargo Variable Trust are parties to a $350,000,000 revolving credit agreement whereby the Fund is permitted to use bank borrowings for temporary or emergency purposes, such as to fund shareholder redemption requests. Interest under the credit agreement is charged to the Fund based on a borrowing rate equal to the higher of the Federal Funds rate in effect on that day plus 1.25% or the overnight LIBOR rate in effect on that day plus 1.25%. In addition, an annual commitment fee equal to 0.25% of the unused balance is allocated to each participating fund.
During the six months ended April 30, 2021, the Fund had average borrowings outstanding of $106,861 (on an annualized basis) at an average rate of 1.37% and paid interest in the amount of $1,464.
10. CONCENTRATION RISKS
As of the end of the period, the Fund concentrated its portfolio of investments in Europe and Asia/Pacific ex-Japan. A fund that invests a substantial portion of its assets in any country or geographic region will be more vulnerable than a fund that invests its assets more broadly to the economic, financial, political or other developments affecting that country or region. Such developments may have a significant impact on the Fund's investment performance causing such performance to be more volatile than the investment performance of a more geographically diversified fund.
11. INDEMNIFICATION
Under the Fund's organizational documents, the officers and Trustees have been granted certain indemnification rights against certain liabilities that may arise out of performance of their duties to the Fund. The Fund has entered into a separate agreement with each Trustee that converts indemnification rights currently existing under the Fund’s organizational documents into contractual rights that cannot be changed in the future without the consent of the Trustee. Additionally, in the normal course of business, the Fund may enter into contracts with service providers that contain a variety of indemnification clauses. The Fund’s maximum exposure under these arrangements is dependent on future claims that may be made against the Fund and, therefore, cannot be estimated.
12. CORONAVIRUS (COVID-19) PANDEMIC
On March 11, 2020, the World Health Organization announced that it had made the assessment that coronavirus disease 2019 (“COVID-19”) is a pandemic. The impacts of COVID-19 are affecting the entire global economy, individual companies and investment products, the funds, and the market in general. There is significant uncertainty around the extent and duration of business disruptions related to COVID-19 and the impacts may last for an extended period of time. COVID-19 has led to significant uncertainty and volatility in the financial markets.
Wells Fargo International Equity Fund | 27
Other information (unaudited)
TAX INFORMATION
Pursuant to Section 853 of the Internal Revenue Code, the following amounts have been designated as foreign taxes paid for the fiscal year ended October 31, 2020. These amounts may be less than the actual foreign taxes paid for financial statement purposes. Foreign taxes paid or withheld should be included in taxable income with an offsetting deduction from gross income or as a credit for taxes paid to foreign governments. None of the income was derived from ineligible foreign sources as defined under Section 901(j) of the Internal Revenue Code.
Creditable
foreign taxes
paid | Per share
amount | Foreign
income as % of
ordinary income
distributions |
| $491,910 | $0.0272 | 100% |
PROXY VOTING INFORMATION
A description of the policies and procedures used to determine how to vote proxies relating to portfolio securities is available without charge, upon request, by calling 1-800-222-8222, visiting our website at wfam.com, or visiting the SEC website at sec.gov. Information regarding how the proxies related to portfolio securities were voted during the most recent 12-month period ended June 30 is available on the website at wfam.com or by visiting the SEC website at sec.gov.
QUARTERLY PORTFOLIO HOLDINGS INFORMATION
The Fund files its complete schedule of portfolio holdings with the SEC for the first and third quarters of each fiscal year as an exhibit to its reports on Form N-PORT. Shareholders may view the filed Form N-PORT by visiting the SEC website at sec.gov.
28 | Wells Fargo International Equity Fund
Other information (unaudited)
BOARD OF TRUSTEES AND OFFICERS
Each of the Trustees and Officers listed in the table below acts in identical capacities for each fund in the Wells Fargo family of funds, which consists of 139 mutual funds comprising the Wells Fargo Funds Trust, Wells Fargo Variable Trust, Wells Fargo Master Trust and four closed-end funds (collectively the “Fund Complex”). This table should be read in conjunction with the Prospectus and the Statement of Additional Information1. The mailing address of each Trustee and Officer is 525 Market Street, 12th Floor, San Francisco, CA 94105. Each Trustee and Officer serves an indefinite term, however, each Trustee serves such term until reaching the mandatory retirement age established by the Trustees.
Independent Trustees
Name and
year of birth | Position held and
length of service* | Principal occupations during past five years or longer | Current other
public company or
investment
company
directorships |
William R. Ebsworth
(Born 1957) | Trustee,
since 2015 | Retired. From 1984 to 2013, equities analyst, portfolio manager, research director and chief investment officer at Fidelity Management and Research Company in Boston, Tokyo, and Hong Kong, and retired in 2013 as Chief Investment Officer of Fidelity Strategic Advisers, Inc. where he led a team of investment professionals managing client assets. Prior thereto, Board member of Hong Kong Securities Clearing Co., Hong Kong Options Clearing Corp., the Thailand International Fund, Ltd., Fidelity Investments Life Insurance Company, and Empire Fidelity Investments Life Insurance Company. Audit Committee Chair and Investment Committee Chair of the Vincent Memorial Hospital Endowment (non-profit organization). Mr. Ebsworth is a CFA® charterholder. | N/A |
Jane A. Freeman
(Born 1953) | Trustee,
since 2015;
Chair Liaison,
since 2018 | Retired. From 2012 to 2014 and 1999 to 2008, Chief Financial Officer of Scientific Learning Corporation. From 2008 to 2012, Ms. Freeman provided consulting services related to strategic business projects. Prior to 1999, Portfolio Manager at Rockefeller & Co. and Scudder, Stevens & Clark. Board member of the Harding Loevner Funds from 1996 to 2014, serving as both Lead Independent Director and chair of the Audit Committee. Board member of the Russell Exchange Traded Funds Trust from 2011 to 2012 and the chair of the Audit Committee. Ms. Freeman is also an inactive Chartered Financial Analyst. | N/A |
Isaiah Harris, Jr.
(Born 1952) | Trustee,
since 2009; Audit
Committee
Chair,
since 2019 | Retired. Chairman of the Board of CIGNA Corporation since 2009, and Director since 2005. From 2003 to 2011, Director of Deluxe Corporation. Prior thereto, President and CEO of BellSouth Advertising and Publishing Corp. from 2005 to 2007, President and CEO of BellSouth Enterprises from 2004 to 2005 and President of BellSouth Consumer Services from 2000 to 2003. Emeritus member of the Iowa State University Foundation Board of Governors. Emeritus Member of the Advisory Board of Iowa State University School of Business. Advisory Board Member, Palm Harbor Academy (private school). Mr. Harris is a certified public accountant (inactive status). | CIGNA Corporation |
Judith M. Johnson
(Born 1949) | Trustee,
since 2008 | Retired. Prior thereto, Chief Executive Officer and Chief Investment Officer of Minneapolis Employees Retirement Fund from 1996 to 2008. Ms. Johnson is an attorney, certified public accountant and a certified managerial accountant. | N/A |
David F. Larcker
(Born 1950) | Trustee,
since 2009 | James Irvin Miller Professor of Accounting at the Graduate School of Business (Emeritus), Stanford University, Director of the Corporate Governance Research Initiative and Senior Faculty of The Rock Center for Corporate Governance since 2006. From 2005 to 2008, Professor of Accounting at the Graduate School of Business, Stanford University. Prior thereto, Ernst & Young Professor of Accounting at The Wharton School, University of Pennsylvania from 1985 to 2005. | N/A |
Wells Fargo International Equity Fund | 29
Other information (unaudited)
Name and
year of birth | Position held and
length of service* | Principal occupations during past five years or longer | Current other
public company or
investment
company
directorships |
Olivia S. Mitchell
(Born 1953) | Trustee,
since 2006;
Nominating and
Governance
Committee Chair,
since 2018 | International Foundation of Employee Benefit Plans Professor, Wharton School of the University of Pennsylvania since 1993. Director of Wharton’s Pension Research Council and Boettner Center on Pensions & Retirement Research, and Research Associate at the National Bureau of Economic Research. Previously, Cornell University Professor from 1978 to 1993. | N/A |
Timothy J. Penny
(Born 1951) | Trustee,
since 1996;
Chair,
since 2018 | President and Chief Executive Officer of Southern Minnesota Initiative Foundation, a non-profit organization, since 2007. Member of the Board of Trustees of NorthStar Education Finance, Inc., a non-profit organization, since 2007. | N/A |
James G. Polisson
(Born 1959) | Trustee,
since 2018 | Retired. Chief Marketing Officer, Source (ETF) UK Services, Ltd, from 2015 to 2017. From 2012 to 2015, Principal of The Polisson Group, LLC, a management consulting, corporate advisory and principal investing company. Chief Executive Officer and Managing Director at Russell Investments, Global Exchange Traded Funds from 2010 to 2012. Managing Director of Barclays Global Investors from 1998 to 2010 and Global Chief Marketing Officer for iShares and Barclays Global Investors from 2000 to 2010. Trustee of the San Francisco Mechanics’ Institute, a non-profit organization, from 2013 to 2015. Board member of the Russell Exchange Traded Fund Trust from 2011 to 2012. Director of Barclays Global Investors Holdings Deutschland GmbH from 2006 to 2009. Mr. Polisson is an attorney and has a retired status with the Massachusetts and District of Columbia Bar Associations. | N/A |
Pamela Wheelock
(Born 1959) | Trustee,
since January
2020; previously
Trustee from
January 2018 to
July 2019 | Board member of the Destination Medical Center Economic Development Agency, Rochester, Minnesota since 2019. Interim President of the McKnight Foundation from January to September 2020. Acting Commissioner, Minnesota Department of Human Services, July 2019 through September 2019. Human Services Manager (part-time), Minnesota Department of Human Services, October 2019 through December 2019. Chief Operating Officer, Twin Cities Habitat for Humanity from 2017 to 2019. Vice President of University Services, University of Minnesota from 2012 to 2016. Prior thereto, on the Board of Directors, Governance Committee and Finance Committee for the Minnesota Philanthropy Partners (Saint Paul Foundation) from 2012 to 2018, Interim Chief Executive Officer of Blue Cross Blue Shield of Minnesota from 2011 to 2012, Chairman of the Board from 2009 to 2012 and Board Director from 2003 to 2015. Vice President, Leadership and Community Engagement, Bush Foundation, Saint Paul, Minnesota (a private foundation) from 2009 to 2011. Executive Vice President and Chief Financial Officer, Minnesota Sports and Entertainment from 2004 to 2009 and Senior Vice President from 2002 to 2004. Executive Vice President of the Minnesota Wild Foundation from 2004 to 2008. Commissioner of Finance, State of Minnesota, from 1999 to 2002. Currently Board Chair of the Minnesota Wild Foundation since 2010. | N/A |
* Length of service dates reflect the Trustee’s commencement of service with the Trust’s predecessor entities, where applicable.
30 | Wells Fargo International Equity Fund
Other information (unaudited)
Officers
Name and
year of birth | Position held and
length of service | Principal occupations during past five years or longer |
Andrew Owen
(Born 1960) | President,
since 2017 | Executive Vice President of Wells Fargo & Company and Head of Affiliated Managers, Wells Fargo Asset Management, since 2014. In addition, Mr. Owen is currently President, Chief Executive Officer and Director of Wells Fargo Funds Management, LLC since 2017. Prior thereto, Executive Vice President responsible for marketing, investments and product development for Wells Fargo Funds Management, LLC, from 2009 to 2014. |
Jeremy DePalma
(Born 1974) | Treasurer,
since 2012
(for certain funds in
the Fund Complex);
since 2021 (for
the remaining funds in the
Fund Complex) | Senior Vice President of Wells Fargo Funds Management, LLC since 2009. Senior Vice President of Evergreen Investment Management Company, LLC from 2008 to 2010 and head of the Fund Reporting and Control Team within Fund Administration from 2005 to 2010. |
Michelle Rhee
(Born 1966) | Chief Legal Officer,
since 2019 | Secretary of Wells Fargo Funds Management, LLC and Chief Legal Counsel of Wells Fargo Asset Management since 2018. Deputy General Counsel of Wells Fargo Bank, N.A. since 2020 and Assistant General Counsel of Wells Fargo Bank, N.A. from 2018 to 2020. Associate General Counsel and Managing Director of Bank of America Corporation from 2004 to 2018. |
Catherine Kennedy
(Born 1969) | Secretary,
since 2019 | Vice President of Wells Fargo Funds Management, LLC and Senior Counsel of the Wells Fargo Legal Department since 2010. Vice President and Senior Counsel of Evergreen Investment Management Company, LLC from 1998 to 2010. |
Michael H. Whitaker
(Born 1967) | Chief Compliance Officer,
since 2016 | Chief Compliance Officer of Wells Fargo Asset Management since 2016. Senior Vice President and Chief Compliance Officer for Fidelity Investments from 2007 to 2016. |
1 The Statement of Additional Information includes additional information about the Trustees and is available, without charge, upon request, by calling 1-800-222-8222 or by visiting the website at wfam.com.
Wells Fargo International Equity Fund | 31
For more information
More information about Wells Fargo Funds is available free upon request. To obtain literature, please write, visit the Fund's website, or call:
Wells Fargo Funds
P.O. Box 219967
Kansas City, MO 64121-9967
Website: wfam.com
Individual investors: 1-800-222-8222
Retail investment professionals: 1-888-877-9275
Institutional investment professionals: 1-866-765-0778
This report and the financial statements contained herein are submitted for the general information of the shareholders of the Fund. If this report is used for promotional purposes, distribution of the report must be accompanied or preceded by a current prospectus. Before investing, please consider the investment objectives, risks, charges, and expenses of the investment. For a current prospectus and, if available, a summary prospectus, containing this information, call 1-800-222-8222 or visit the Fund's website at wfam.com. Read the prospectus carefully before you invest or send money.
Wells Fargo Asset Management (WFAM) is the trade name for certain investment advisory/management firms owned by Wells Fargo & Company. These firms include but are not limited to Wells Capital Management Incorporated and Wells Fargo Funds Management, LLC. Certain products managed by WFAM entities are distributed by Wells Fargo Funds Distributor, LLC (a broker-dealer and Member FINRA).
This material is for general informational and educational purposes only and is NOT intended to provide investment advice or a recommendation of any kind - including a recommendation for any specific investment, strategy, or plan.
INVESTMENT PRODUCTS: NOT FDIC INSURED ■ NO BANK GUARANTEE ■ MAY LOSE VALUE
© 2021 Wells Fargo & Company. All rights reserved.
PAR-0521-00324 06-21
SA240/SAR240 04-21
Semi-Annual Report
April 30, 2021
Wells Fargo Special
International Small Cap Fund
Reduce clutter.
Save trees.
Sign up for electronic delivery of prospectuses and shareholder reports at wellsfargo.com/ advantagedelivery
The views expressed and any forward-looking statements are as of April 30, 2021, unless otherwise noted, and are those of the Fund's portfolio managers and/or Wells Fargo Asset Management. Discussions of individual securities or the markets generally are not intended as individual recommendations. Future events or results may vary significantly from those expressed in any forward-looking statements. The views expressed are subject to change at any time in response to changing circumstances in the market. Wells Fargo Asset Management and the Fund disclaim any obligation to publicly update or revise any views expressed or forward-looking statements.
INVESTMENT PRODUCTS: NOT FDIC INSURED ■ NO BANK GUARANTEE ■ MAY LOSE VALUE
Wells Fargo Special International Small Cap Fund | 1
Letter to shareholders (unaudited)
Andrew Owen
President
Wells Fargo Funds
Dear Shareholder:
We are pleased to offer you this semi-annual report for the Wells Fargo Special International Small Cap Fund for the six-month period that ended April 30, 2021. Global stocks continued to rally as the global economy continued to work through the haze of COVID-19. Tailwinds were provided by global stimulus programs, a rapid vaccination rollout, and recovering consumer and corporate sentiment. Bonds were mixed during the period, with global bonds, municipal bonds, and high-yield bonds delivering positive returns.
For the six-month period, U.S. stocks, based on the S&P 500 Index,1 gained 28.85%. International stocks, as measured by the MSCI ACWI ex USA Index (Net),2 returned 27.40%, while the MSCI EM Index (Net),3 trailed its developed market counterparts with a 22.95% gain. Among bond indexes, the Bloomberg Barclays U.S. Aggregate Bond Index,4 returned -1.52%, the Bloomberg Barclays Global Aggregate ex-USD Index (unhedged),5 returned 0.68%, the Bloomberg Barclays Municipal Bond Index,6 returned 2.62%, and the ICE BofA U.S. High Yield Index,7 returned 8.12%.
Hope drove the stock markets to new highs.
Global stocks rallied in November, propelled by optimism over three promising COVID-19 vaccines. Reversing recent trends, value stocks outperformed growth stocks and cyclical stocks outpaced information technology (IT) stocks. However, U.S. unemployment remained elevated, with a net job loss of 10 million since February. The eurozone services Purchasing Managers’ Index, a monthly survey of purchasing managers, contracted sharply while the region’s manufacturing activity grew. The U.S. election results added to the upbeat mood as investors anticipated more consistent policies in the new administration.
Financial markets ended the year with strength on high expectations for a rapid rollout of the COVID-19 vaccines, the successful passage of a $900 billion stimulus package, and rising expectations of additional economic support from a Democratic-led Congress. U.S. economic data were mixed with still-elevated unemployment and weak retail sales but growth in manufacturing output. In contrast, China’s economic expansion continued in both manufacturing and nonmanufacturing. U.S. COVID-19 infection rates continued to rise even as new state and local lockdown measures were implemented.
“Global stocks rallied in November, propelled by optimism over three promising COVID-19 vaccines.”
| 1 | The S&P 500 Index consists of 500 stocks chosen for market size, liquidity, and industry group representation. It is a market-value-weighted index with each stock's weight in the index proportionate to its market value. You cannot invest directly in an index. |
| 2 | The Morgan Stanley Capital International (MSCI) All Country World Index (ACWI) ex USA Index (Net) is a free-float-adjusted market-capitalization-weighted index that is designed to measure the equity market performance of developed and emerging markets, excluding the United States. Source: MSCI. MSCI makes no express or implied warranties or representations and shall have no liability whatsoever with respect to any MSCI data contained herein. The MSCI data may not be further redistributed or used as a basis for other indices or any securities or financial products. This report is not approved, reviewed, or produced by MSCI. You cannot invest directly in an index. |
| 1 | The S&P 500 Index consists of 500 stocks chosen for market size, liquidity, and industry group representation. It is a market-value-weighted index with each stock's weight in the index proportionate to its market value. You cannot invest directly in an index. |
| 3 | The MSCI Emerging Markets (EM) Index (Net) is a free-float-adjusted market-capitalization-weighted index that is designed to measure equity market performance of emerging markets. You cannot invest directly in an index. |
| 1 | The S&P 500 Index consists of 500 stocks chosen for market size, liquidity, and industry group representation. It is a market-value-weighted index with each stock's weight in the index proportionate to its market value. You cannot invest directly in an index. |
| 4 | The Bloomberg Barclays U.S. Aggregate Bond Index is a broad-based benchmark that measures the investment-grade, U.S. dollar-denominated, fixed-rate taxable bond market, including Treasuries, government-related and corporate securities, mortgage-backed securities (agency fixed-rate and hybrid adjustable-rate mortgage pass-throughs), asset-backed securities, and commercial mortgage-backed securities. You cannot invest directly in an index. |
| 1 | The S&P 500 Index consists of 500 stocks chosen for market size, liquidity, and industry group representation. It is a market-value-weighted index with each stock's weight in the index proportionate to its market value. You cannot invest directly in an index. |
| 5 | The Bloomberg Barclays Global Aggregate ex-USD Index (unhedged) is an unmanaged index that provides a broad-based measure of the global investment-grade fixed-income markets excluding the U.S. dollar-denominated debt market. You cannot invest directly in an index. |
| 1 | The S&P 500 Index consists of 500 stocks chosen for market size, liquidity, and industry group representation. It is a market-value-weighted index with each stock's weight in the index proportionate to its market value. You cannot invest directly in an index. |
| 6 | The Bloomberg Barclays Municipal Bond Index is an unmanaged index composed of long-term tax-exempt bonds with a minimum credit rating of Baa. You cannot invest directly in an index. |
| 1 | The S&P 500 Index consists of 500 stocks chosen for market size, liquidity, and industry group representation. It is a market-value-weighted index with each stock's weight in the index proportionate to its market value. You cannot invest directly in an index. |
| 7 | The ICE BofA U.S. High Yield Index is a market-capitalization-weighted index of domestic and Yankee high-yield bonds. The index tracks the performance of high-yield securities traded in the U.S. bond market. You cannot invest directly in an index. Copyright 2021. ICE Data Indices, LLC. All rights reserved. |
2 | Wells Fargo Special International Small Cap Fund
Letter to shareholders (unaudited)
The calendar year 2021 began with emerging market stocks leading all major asset classes in January, driven by China’s strong economic growth and a broad recovery in corporate earnings, which propelled China’s stock market higher. In the U.S., positive news on vaccine trials and January's expansion in both the manufacturing and services sectors were offset by a weak December monthly jobs report. This was compounded by technical factors as some hedge funds were forced to sell stocks to protect themselves against a well-publicized short squeeze coordinated by a group of retail investors. Eurozone sentiment and economic growth were particularly weak, reflecting the impact of a new lockdown with stricter social distancing along with a slow vaccine rollout.
February saw major domestic equity indexes driven higher on the hope of a new stimulus bill, improving COVID-19 vaccination numbers, and the gradual reopening of the economy. Most S&P 500 companies reported better-than-expected earnings, with positive surprises coming from the financials, IT, health care, and materials sectors. Japan saw its economy strengthen as a result of strong export numbers. Meanwhile, crude-oil prices continued their climb, rising more than 25% for the year. Domestic government bonds experienced a sharp sell-off in late February as markets priced in a more robust economic recovery and higher future growth and inflation expectations.
The passage of the massive domestic stimulus bill highlighted March activity, leading to increased forecasts for U.S. growth in 2021. Domestic employment surged as COVID-19 vaccinations and an increasingly open economy spurred hiring. A majority of U.S. small companies reported they were operating at pre-pandemic capacity or higher. Value continued its outperformance of growth in the month, continuing the trend that started in late 2020. Meanwhile, most major developed global equity indexes were up month to date on the back of rising optimism regarding the outlook for global growth. While the U.S. and the U.K. have been the most successful in terms of the vaccine rollout, even within markets where the vaccine has lagged, such as the eurozone and Japan, equity indexes in many of those countries are also in positive territory this year.
Equity markets produced another strong showing in April. Domestically, the continued reopening of the economy had a strong impact on positive equity performance as people started leaving their households and jobless claims continued to fall. Domestic corporate bonds performed well and the U.S. dollar weakened. Meanwhile, the U.S. government continued to seek to invest in the recovery, this time by outlining a package of over $2 billion to improve infrastructure. The primary headwind in April was inflation, as investors tried to determine the breadth and longevity of recent price increases. Developed Europe has been supported by a meaningful increase in the pace of vaccinations. Unfortunately many emerging market countries have not been as successful. India in particular has seen COVID-19 cases surge, serving as an example of the need to get vaccinations rolled out to less developed nations.
Don’t let short-term uncertainty derail long-term investment goals.
Periods of investment uncertainty can present challenges, but experience has taught us that maintaining long-term investment goals can be an effective way to plan for the future. Although diversification cannot guarantee an investment profit or prevent losses, we believe it can be an effective way to manage investment risk and potentially smooth out overall portfolio performance. We encourage investors to know their investments and to understand that appropriate levels of risk-taking may unlock opportunities.
Thank you for choosing to invest with Wells Fargo Funds. We appreciate your confidence in us and remain committed to helping you meet your financial needs.
Sincerely,
Andrew Owen
President
Wells Fargo Funds
“The passage of the massive domestic stimulus bill highlighted March activity, leading to increased forecasts for U.S. growth in 2021.”
For further information about your Fund, contact your investment professional, visit our website at wfam.com, or call us directly at 1-800-222-8222.
Wells Fargo Special International Small Cap Fund | 3
Performance highlights (unaudited)
| Investment objective | The Fund seeks long-term capital appreciation. |
| Manager | Wells Fargo Funds Management, LLC |
| Subadviser | Wells Capital Management Incorporated |
| Portfolio managers | Stephen Giggie, CFA®‡, Oleg Makhorine, James Tringas, CFA®‡, Bryant VanCronkhite, CFA®‡, CPA |
| Average annual total returns (%) as of April 30, 2021 |
| | | | | Expense ratios1 (%) |
| | Inception date | 1 year | Since inception | Gross | Net 2 |
| Class R6 (WICRX) | 5-31-2019 | 52.60 | 19.85 | 5.69 | 0.95 |
| Institutional Class (WICIX) | 5-31-2019 | 52.39 | 19.73 | 5.79 | 1.05 |
| MSCI World ex USA Small Cap Index (Net)3 | – | 53.99 | 20.53 * | – | – |
Figures quoted represent past performance, which is no guarantee of future results, and do not reflect taxes that a shareholder may pay on an investment in a fund. Investment return and principal value of an investment will fluctuate so that an investor’s shares, when redeemed, may be worth more or less than their original cost. Current performance may be lower or higher than the performance data quoted, which assumes the reinvestment of dividends and capital gains. Current month-end performance is available on the Fund's website, wfam.com..
Please keep in mind that high double-digit returns were primarily achieved during favorable market conditions. You should not expect that such favorable returns can be consistently achieved. A fund’s performance, especially for short time periods, should not be the sole factor in making your investment decision.
Index returns do not include transaction costs associated with buying and selling securities, any mutual fund fees or expenses, or any taxes. It is not possible to invest directly in an index.
Class R6 and Institutional Class shares are sold without a front-end sales charge or contingent deferred sales charge.
| * | Based on the inception date of the oldest Fund class. |
| 1 | Reflects the expense ratios as stated in the most recent prospectuses. The expense ratios shown are subject to change and may differ from the annualized expense ratios shown in the financial highlights of this report. |
| 2 | The manager has contractually committed through February 28, 2022, to waive fees and/or reimburse expenses to the extent necessary to cap total annual fund operating expenses after fee waivers at 0.95% for Class R6 and 1.05% for Institutional Class. Brokerage commissions, stamp duty fees, interest, taxes, acquired fund fees and expenses (if any), and extraordinary expenses are excluded from the expense caps. Prior to or after the commitment expiration date, the caps may be increased or the commitment to maintain the caps may be terminated only with the approval of the Board of Trustees. Without these caps, the Fund’s returns would have been lower. The expense ratio paid by an investor is the net expense ratio (the total annual fund operating expenses after fee waivers) as stated in the prospectuses. |
| 3 | The Morgan Stanley Capital International (MSCI) World ex USA Small Cap Index (Net) is a free-float-adjusted market-capitalization-weighted index that is designed to measure the equity market performance of developed markets excluding the United States. You cannot invest directly in an index. |
Stock values fluctuate in response to the activities of individual companies and general market and economic conditions. Foreign investments are especially volatile and can rise or fall dramatically due to differences in the political and economic conditions of the host country. These risks are generally intensified in emerging markets. The use of derivatives may reduce returns and/or increase volatility. Certain investment strategies tend to increase the total risk of an investment (relative to the broader market). The Fund is exposed to geographic risk and smaller company securities risk. Consult the Fund’s prospectus for additional information on these and other risks.
| ‡ | CFA® and Chartered Financial Analyst® are trademarks owned by CFA Institute. |
4 | Wells Fargo Special International Small Cap Fund
Performance highlights (unaudited)
| Ten largest holdings (%) as of April 30, 20211 |
| Ansell Limited | 4.42 |
| Alten SA | 4.14 |
| Spectris plc | 3.94 |
| S4 Capital plc | 3.91 |
| Gerresheimer AG | 3.51 |
| TAG Immobilien AG | 3.05 |
| Viscofan SA | 3.03 |
| Britvic plc | 2.99 |
| ORIX JREIT Incorporated | 2.87 |
| Nomad Foods Limited | 2.81 |
| 1 | Figures represent the percentage of the Fund's net assets. Holdings are subject to change and may have changed since the date specified. |
| Sector allocation as of April 30, 20211 |
| 1 | Figures represent the percentage of the Fund's long-term investments. These amounts are subject to change and may have changed since the date specified. |
| Geographic allocation as of April 30, 20211 |
| 1 | Figures represent the percentage of the Fund's long-term investments. These amounts are subject to change and may have changed since the date specified. |
Wells Fargo Special International Small Cap Fund | 5
Fund expenses (unaudited)
As a shareholder of the Fund, you incur ongoing costs, including management fees and other Fund expenses. This example is intended to help you understand your ongoing costs (in dollars) of investing in the Fund and to compare these costs with the ongoing costs of investing in other mutual funds.
The example is based on an investment of $1,000 invested at the beginning of the six-month period and held for the entire period from November 1, 2020 to April 30, 2021.
Actual expenses
The “Actual” line of the table below provides information about actual account values and actual expenses. You may use the information in this line, together with the amount you invested, to estimate the expenses that you paid over the period. Simply divide your account value by $1,000 (for example, an $8,600 account value divided by $1,000 = 8.6), then multiply the result by the number in the “Actual” line under the heading entitled “Expenses paid during period” for your applicable class of shares to estimate the expenses you paid on your account during this period.
Hypothetical example for comparison purposes
The “Hypothetical” line of the table below provides information about hypothetical account values and hypothetical expenses based on the Fund’s actual expense ratio and an assumed rate of return of 5% per year before expenses, which is not the Fund’s actual return. The hypothetical account values and expenses may not be used to estimate the actual ending account balance or expenses you paid for the period. You may use this information to compare the ongoing costs of investing in the Fund and other funds. To do so, compare this 5% hypothetical example with the 5% hypothetical examples that appear in the shareholder reports of the other funds.
Please note that the expenses shown in the table are meant to highlight your ongoing costs only. Therefore, the “Hypothetical” line of the table is useful in comparing ongoing costs only and will not help you determine the relative total costs of owning different funds.
| | Beginning
account value
11-1-2020 | Ending
account value
4-30-2021 | Expenses
paid during
the period1 | Annualized net
expense ratio |
| Class R6 | | | | |
| Actual | $1,000.00 | $1,331.92 | $5.49 | 0.95% |
| Hypothetical (5% return before expenses) | $1,000.00 | $1,020.08 | $4.76 | 0.95% |
| Institutional Class | | | | |
| Actual | $1,000.00 | $1,331.60 | $6.07 | 1.05% |
| Hypothetical (5% return before expenses) | $1,000.00 | $1,019.59 | $5.26 | 1.05% |
1 Expenses paid is equal to the annualized net expense ratio of each class multiplied by the average account value over the period, multiplied by the number of days in the most recent fiscal half-year divided by the number of days in the fiscal year (to reflect the one-half-year period).
6 | Wells Fargo Special International Small Cap Fund
Portfolio of investments—April 30, 2021 (unaudited)
| | | | | | Shares | Value |
| Common stocks: 98.75% | | | | | | |
| Australia: 8.03% | | | | | | |
| Ansell Limited (Health care, Health care equipment & supplies) | | | | | 9,344 | $ 304,194 |
| Domino's Pizza Enterprises Limited (Consumer discretionary, Hotels, restaurants & leisure) | | | | | 866 | 71,149 |
| Inghams Group Limited (Consumer staples, Food products) | | | | | 28,577 | 71,987 |
| Orora Limited (Materials, Containers & packaging) | | | | | 42,808 | 104,867 |
| | | | | | | 552,197 |
| Austria: 1.35% | | | | | | |
| Mayr-Melnhof Karton AG (Materials, Containers & packaging) | | | | | 447 | 92,756 |
| Belgium: 2.62% | | | | | | |
| Barco NV (Information technology, Electronic equipment, instruments & components) | | | | | 7,077 | 180,206 |
| Canada: 3.45% | | | | | | |
| ATS Automation Tooling Systems (Industrials, Machinery) † | | | | | 1,600 | 38,596 |
| Peairiesky Royalty Limited (Energy, Oil, gas & consumable fuels) | | | | | 6,400 | 68,626 |
| Primo Water Corporation (Consumer staples, Beverages) | | | | | 7,800 | 130,344 |
| | | | | | | 237,566 |
| France: 5.32% | | | | | | |
| Alten SA (Information technology, IT services) † | | | | | 2,277 | 284,976 |
| M6 Métropole Télévision SA (Communication services, Media) | | | | | 3,657 | 81,250 |
| | | | | | | 366,226 |
| Germany: 9.31% | | | | | | |
| Cancom SE (Information technology, IT services) | | | | | 1,507 | 93,054 |
| Gerresheimer AG (Health care, Life sciences tools & services) | | | | | 2,245 | 241,430 |
| Krones AG (Industrials, Machinery) | | | | | 1,101 | 95,967 |
| TAG Immobilien AG (Real estate, Real estate management & development) | | | | | 6,780 | 209,569 |
| | | | | | | 640,020 |
| Ireland: 1.00% | | | | | | |
| Irish Residential Properties REIT plc (Real estate, Equity REITs) | | | | | 35,117 | 68,649 |
| Italy: 8.08% | | | | | | |
| Azimut Holding SpA (Financials, Capital markets) | | | | | 2,197 | 52,602 |
| Buzzi Unicem SpA (Materials, Construction materials) | | | | | 3,188 | 85,126 |
| De'Longhi SpA (Consumer discretionary, Household durables) | | | | | 2,492 | 108,995 |
| GVS SpA (Industrials, Machinery) † | | | | | 8,353 | 145,615 |
| Interpump Group SpA (Industrials, Machinery) | | | | | 3,066 | 163,294 |
| | | | | | | 555,632 |
| Japan: 20.23% | | | | | | |
| Aeon Delight Company Limited (Industrials, Commercial services & supplies) | | | | | 5,300 | 161,730 |
| Daiseki Company Limited (Industrials, Commercial services & supplies) | | | | | 3,600 | 135,383 |
| DTS Corporation (Information technology, IT services) | | | | | 7,200 | 168,982 |
| Fuji Seal International Incorporated (Materials, Containers & packaging) | | | | | 4,300 | 95,490 |
| Horiba Limited (Information technology, Electronic equipment, instruments & components) | | | | | 1,600 | 104,090 |
| Kamigumi Company Limited (Industrials, Transportation infrastructure) | | | | | 3,500 | 68,053 |
| Meitec Corporation (Industrials, Professional services) | | | | | 2,300 | 127,743 |
| Nihon Parkerizing Company Limited (Materials, Chemicals) | | | | | 5,800 | 56,042 |
The accompanying notes are an integral part of these financial statements.
Wells Fargo Special International Small Cap Fund | 7
Portfolio of investments—April 30, 2021 (unaudited)
| | | | | | Shares | Value |
| Japan: (continued) | | | | | | |
| ORIX JREIT Incorporated (Real estate, Equity REITs) | | | | | 112 | $ 197,581 |
| San-A Company Limited (Consumer staples, Food & staples retailing) | | | | | 1,700 | 65,175 |
| Sohgo Security Services Company Limited (Industrials, Commercial services & supplies) | | | | | 1,600 | 70,125 |
| Sumitomo Warehouse Company Limited (Industrials, Transportation infrastructure) | | | | | 5,900 | 76,281 |
| Taikisha Limited (Industrials, Construction & engineering) | | | | | 2,400 | 64,562 |
| | | | | | | 1,391,237 |
| Luxembourg: 0.86% | | | | | | |
| Stabilus SA (Industrials, Machinery) | | | | | 753 | 58,844 |
| Netherlands: 2.20% | | | | | | |
| MYT Netherlands Parent BV (Consumer discretionary, Specialty retail) †« | | | | | 2,462 | 73,786 |
| TKH Group NV (Industrials, Electrical equipment) | | | | | 1,623 | 77,582 |
| | | | | | | 151,368 |
| Norway: 1.06% | | | | | | |
| Atea ASA (Information technology, IT services) | | | | | 3,804 | 72,936 |
| Spain: 4.31% | | | | | | |
| Vidrala SA (Materials, Containers & packaging) | | | | | 781 | 87,886 |
| Viscofan SA (Consumer staples, Food products) | | | | | 3,050 | 208,644 |
| | | | | | | 296,530 |
| Sweden: 5.24% | | | | | | |
| AAK AB (Consumer staples, Food products) | | | | | 5,053 | 115,853 |
| Hexpol AB (Materials, Chemicals) | | | | | 4,726 | 58,087 |
| Loomis AB (Industrials, Commercial services & supplies) | | | | | 5,677 | 186,360 |
| | | | | | | 360,300 |
| Switzerland: 2.28% | | | | | | |
| Arbonia AG (Consumer discretionary, Household durables) | | | | | 2,453 | 42,439 |
| Bossard Holding AG (Industrials, Trading companies & distributors) | | | | | 136 | 32,688 |
| Bucher Industries AG (Industrials, Machinery) | | | | | 156 | 81,856 |
| | | | | | | 156,983 |
| United Kingdom: 22.13% | | | | | | |
| Britvic plc (Consumer staples, Beverages) | | | | | 16,887 | 205,815 |
| Domino's Pizza Group plc (Consumer discretionary, Hotels, restaurants & leisure) | | | | | 20,726 | 109,514 |
| Elementis plc (Materials, Chemicals) † | | | | | 47,721 | 98,594 |
| Lancashire Holdings Limited (Financials, Insurance) | | | | | 9,435 | 92,645 |
| Micro Focus International plc (Information technology, Software) | | | | | 9,700 | 69,392 |
| Morgan Advanced Materials plc (Industrials, Machinery) | | | | | 14,269 | 58,429 |
| Nomad Foods Limited (Consumer staples, Food products) † | | | | | 6,623 | 193,127 |
| S4 Capital plc (Communication services, Media) † | | | | | 34,788 | 268,566 |
| Spectris plc (Information technology, Electronic equipment, instruments & components) | | | | | 6,033 | 271,119 |
| SSP Group plc (Consumer discretionary, Hotels, restaurants & leisure) † | | | | | 5,570 | 24,616 |
| Tate & Lyle plc (Consumer staples, Food products) | | | | | 10,532 | 116,362 |
| TechnipFMC plc - BATS Exchange (Energy, Energy equipment & services) | | | | | 1,806 | 13,540 |
| | | | | | | 1,521,719 |
The accompanying notes are an integral part of these financial statements.
8 | Wells Fargo Special International Small Cap Fund
Portfolio of investments—April 30, 2021 (unaudited)
| | | | | | Shares | Value |
| United States: 1.28% | | | | | | |
| Poema Global Holdings Corporation (Financials, Diversified financial services) † | | | | | 6,100 | $ 61,610 |
| Tailwind International Acquisition Corporation (Financials, Diversified financial services) † | | | | | 2,663 | 26,603 |
| | | | | | | 88,213 |
| Total Common stocks (Cost $5,228,660) | | | | | | 6,791,382 |
| | | Yield | | | | |
| Short-term investments: 2.47% | | | | | | |
| Investment companies: 2.47% | | | | | | |
| Securities Lending Cash Investments LLC ♠∩∞ | | 0.03% | | | 73,140 | 73,140 |
| Wells Fargo Government Money Market Fund Select Class ♠∞ | | 0.03 | | | 96,557 | 96,557 |
| Total Short-term investments (Cost $169,697) | | | | | | 169,697 |
| Total investments in securities (Cost $5,398,357) | 101.22% | | | | | 6,961,079 |
| Other assets and liabilities, net | (1.22) | | | | | (84,063) |
| Total net assets | 100.00% | | | | | $6,877,016 |
| † | Non-income-earning security |
| « | All or a portion of this security is on loan. |
| ♠ | The issuer of the security is an affiliate of the Fund as defined in the Investment Company Act of 1940. |
| ∩ | The investment is a non-registered investment company purchased with cash collateral received from securities on loan. |
| ∞ | The rate represents the 7-day annualized yield at period end. |
| Abbreviations: |
| REIT | Real estate investment trust |
Investments in affiliates
An affiliated investment is an investment in which the Fund owns at least 5% of the outstanding voting shares of the issuer or as a result of other relationships, such as the Fund and the issuer having the same investment manager. Transactions with issuers that were either affiliates of the Fund at the beginning of the period or the end of the period were as follows:
| | Value,
beginning of
period | Purchases | Sales
proceeds | Net
realized
gains
(losses) | | Net
change in
unrealized
gains
(losses) | | Value,
end of
period | | % of
net
assets | Shares,
end
of period | Income
from
affiliated
securities |
| Short-term investments | | | | | | | | | | | | |
| Investment companies | | | | | | | | | | | | |
| Securities Lending Cash Investments LLC | $0 | $ 158,425 | $ (85,285) | $0 | | $0 | | $ 73,140 | | | 73,140 | $ 2# |
| Wells Fargo Government Money Market Fund Select Class | 0 | 1,014,219 | (917,662) | 0 | | 0 | | 96,557 | | | 96,557 | 15 |
| | | | | $0 | | $0 | | $169,697 | | 2.47% | | $17 |
| # | Amount shown represents income before fees and rebates. |
The accompanying notes are an integral part of these financial statements.
Wells Fargo Special International Small Cap Fund | 9
Statement of assets and liabilities—April 30, 2021 (unaudited)
| | |
| Assets | |
Investments in unaffiliated securities (including $71,668 of securities loaned), at value (cost $5,228,660)
| $ 6,791,382 |
Investments in affiliated securites, at value (cost $169,697)
| 169,697 |
Foreign currency, at value (cost $30,957)
| 31,268 |
Receivable for dividends
| 28,432 |
Receivable for investments sold
| 22,254 |
Receivable from manager
| 6,774 |
Receivable for securities lending income, net
| 19 |
Total assets
| 7,049,826 |
| Liabilities | |
Payable upon receipt of securities loaned
| 73,140 |
Shareholder report expenses payable
| 41,814 |
Professional fees payable
| 26,172 |
Custodian and accounting fee payable
| 12,173 |
Payable for investments purchased
| 10,528 |
Trustees’ fees and expenses payable
| 1,918 |
Administration fees payable
| 192 |
Accrued expenses and other liabilities
| 6,873 |
Total liabilities
| 172,810 |
Total net assets
| $6,877,016 |
| Net assets consist of | |
Paid-in capital
| $ 5,011,280 |
Total distributable earnings
| 1,865,736 |
Total net assets
| $6,877,016 |
| Computation of net asset value per share | |
Net assets – Class R6
| $ 6,724,237 |
Shares outstanding – Class R61
| 490,000 |
Net asset value per share – Class R6
| $13.72 |
Net assets – Institutional Class
| $ 152,779 |
Shares outstanding – Institutional Class1
| 11,125 |
Net asset value per share – Institutional Class
| $13.73 |
| 1 | The Fund has an unlimited number of authorized shares |
The accompanying notes are an integral part of these financial statements.
10 | Wells Fargo Special International Small Cap Fund
Statement of operations—six months ended April 30, 2021 (unaudited)
| | |
| Investment income | |
Dividends (net of foreign withholdings taxes of $5,109)
| $ 60,300 |
Income from affiliated securities
| 46 |
Total investment income
| 60,346 |
| Expenses | |
Management fee
| 29,691 |
| Administration fees | |
Class R6
| 917 |
Institutional Class
| 90 |
Custody and accounting fees
| 16,728 |
Professional fees
| 20,556 |
Registration fees
| 22,291 |
Shareholder report expenses
| 2,895 |
Trustees’ fees and expenses
| 9,610 |
Other fees and expenses
| 4,714 |
Total expenses
| 107,492 |
| Less: Fee waivers and/or expense reimbursements | |
Fund-level
| (76,724) |
Class R6
| (917) |
Institutional Class
| (90) |
Net expenses
| 29,761 |
Net investment income
| 30,585 |
| Realized and unrealized gains (losses) on investments | |
Net realized gains on investments
| 301,694 |
Net change in unrealized gains (losses) on investments
| 1,389,334 |
Net realized and unrealized gains (losses) on investments
| 1,691,028 |
Net increase in net assets resulting from operations
| $1,721,613 |
The accompanying notes are an integral part of these financial statements.
Wells Fargo Special International Small Cap Fund | 11
Statement of changes in net assets
| | | | | |
| | Six months ended
April 30, 2021
(unaudited) | Year ended
October 31, 2020 |
| Operations | | | | |
Net investment income
| | $ 30,585 | | $ 47,340 |
Net realized gains on investments
| | 301,694 | | 11,607 |
Net change in unrealized gains (losses) on investments
| | 1,389,334 | | (28,658) |
Net increase in net assets resulting from operations
| | 1,721,613 | | 30,289 |
| Distributions to shareholders from | | | | |
| Net investment income and net realized gains | | | | |
Class R6
| | (45,080) | | (126,151) |
Institutional Class
| | (892) | | (2,514) |
Total distributions to shareholders
| | (45,972) | | (128,665) |
| Capital share transactions | Shares | | Shares | |
| Proceeds from shares sold | | | | |
Institutional Class
| 0 | 0 | 1,121 | 11,233 |
| Reinvestment of distributions | | | | |
Institutional Class
| 8 | 90 | 12 | 128 |
| Payment for shares redeemed | | | | |
Institutional Class
| (4) | (43) | (12) | (128) |
Net increase in net assets resulting from capital share transactions
| | 47 | | 11,233 |
Total increase (decrease) in net assets
| | 1,675,688 | | (87,143) |
| Net assets | | | | |
Beginning of period
| | 5,201,328 | | 5,288,471 |
End of period
| | $6,877,016 | | $5,201,328 |
The accompanying notes are an integral part of these financial statements.
12 | Wells Fargo Special International Small Cap Fund
Financial highlights
(For a share outstanding throughout each period)
| | | Year ended October 31 |
| Class R6 | Six months ended
April 30, 2021
(unaudited) | 2020 | 2019 1 |
Net asset value, beginning of period
| $10.38 | $10.58 | $10.00 |
Net investment income
| 0.06 | 0.09 | 0.05 |
Net realized and unrealized gains (losses) on investments
| 3.37 | (0.03) | 0.53 |
Total from investment operations
| 3.43 | (0.06) | 0.58 |
| Distributions to shareholders from | | | |
Net investment income
| (0.05) | (0.15) | 0.00 |
Net realized gains
| (0.04) | (0.11) | 0.00 |
Total distributions to shareholders
| (0.09) | (0.26) | 0.00 |
Net asset value, end of period
| $13.72 | $10.38 | $10.58 |
Total return2
| 33.19% | 0.42% | 5.80% |
| Ratios to average net assets (annualized) | | | |
Gross expenses
| 3.44% | 5.69% | 7.81% |
Net expenses
| 0.95% | 0.95% | 0.95% |
Net investment income
| 0.98% | 0.93% | 1.24% |
| Supplemental data | | | |
Portfolio turnover rate
| 23% | 45% | 14% |
Net assets, end of period (000s omitted)
| $6,724 | $5,086 | $5,183 |
| 1 | For the period from May 31, 2019 (commencement of class operations) to October 31, 2019 |
| 2 | Returns for periods of less than one year are not annualized. |
The accompanying notes are an integral part of these financial statements.
Wells Fargo Special International Small Cap Fund | 13
Financial highlights
(For a share outstanding throughout each period)
| | | Year ended October 31 |
| Institutional Class | Six months ended
April 30, 2021
(unaudited) | 2020 | 2019 1 |
Net asset value, beginning of period
| $10.38 | $10.57 | $10.00 |
Net investment income
| 0.05 | 0.08 | 0.05 |
Net realized and unrealized gains (losses) on investments
| 3.38 | (0.03) | 0.52 |
Total from investment operations
| 3.43 | 0.05 | 0.57 |
| Distributions to shareholders from | | | |
Net investment income
| (0.04) | (0.13) | 0.00 |
Net realized gains
| (0.04) | (0.11) | 0.00 |
Total distributions to shareholders
| (0.08) | (0.24) | 0.00 |
Net asset value, end of period
| $13.73 | $10.38 | $10.57 |
Total return2
| 33.16% | 0.35% | 5.70% |
| Ratios to average net assets (annualized) | | | |
Gross expenses
| 3.54% | 5.76% | 7.91% |
Net expenses
| 1.05% | 1.05% | 1.05% |
Net investment income
| 0.88% | 0.83% | 1.14% |
| Supplemental data | | | |
Portfolio turnover rate
| 23% | 45% | 14% |
Net assets, end of period (000s omitted)
| $153 | $115 | $106 |
| 1 | For the period from May 31, 2019 (commencement of class operations) to October 31, 2019 |
| 2 | Returns for periods of less than one year are not annualized. |
The accompanying notes are an integral part of these financial statements.
14 | Wells Fargo Special International Small Cap Fund
Notes to financial statements (unaudited)
1. ORGANIZATION
Wells Fargo Funds Trust (the "Trust"), a Delaware statutory trust organized on March 10, 1999, is an open-end management investment company registered under the Investment Company Act of 1940, as amended (the "1940 Act"). As an investment company, the Trust follows the accounting and reporting guidance in Financial Accounting Standards Board ("FASB") Accounting Standards Codification Topic 946, Financial Services – Investment Companies. These financial statements report on the Wells Fargo Special International Small Cap Fund (the "Fund") which is a diversified series of the Trust.
On February 23, 2021, Wells Fargo & Company announced that it has entered into a definitive agreement to sell Wells Fargo Asset Management ("WFAM") to GTCR LLC and Reverence Capital Partners, L.P. WFAM is the trade name used by the asset management businesses of Wells Fargo & Company and includes Wells Fargo Funds Management, LLC, the investment manager to the Fund, Wells Capital Management Incorporated and Wells Fargo Asset Management (International) Limited, both registered investment advisers providing sub-advisory services to certain funds, and Wells Fargo Funds Distributor, LLC, the Fund's principal underwriter. As part of the transaction, Wells Fargo & Company will own a 9.9% equity interest and will continue to serve as an important client and distribution partner.
Consummation of the transaction will result in the automatic termination of the Fund's investment management agreement and subadvisory agreement. The Fund's Board of Trustees approved a new investment management and new subadvisory agreement and approved submitting the agreements to the Fund’s shareholders for approval at a special meeting of shareholders expected to be held on July 15, 2021. Shareholders of record of the Fund at the close of business on May 28, 2021 are entitled to vote at the meeting. If shareholders approve the new agreements, they would take effect upon the closing of the transaction. The transaction is expected to close in the second half of 2021, subject to customary closing conditions.
This shareholder report is not asking you for a proxy. A separate proxy statement with more detailed information about the transaction will be provided to Fund shareholders and should be reviewed carefully.
2. SIGNIFICANT ACCOUNTING POLICIES
The following significant accounting policies, which are consistently followed in the preparation of the financial statements of the Fund, are in conformity with U.S. generally accepted accounting principles which require management to make estimates and assumptions that affect the reported amounts of assets and liabilities, disclosure of contingent assets and liabilities at the date of the financial statements, and the reported amounts of income and expenses during the reporting period. Actual results could differ from those estimates.
Securities valuation
All investments are valued each business day as of the close of regular trading on the New York Stock Exchange (generally 4 p.m. Eastern Time), although the Fund may deviate from this calculation time under unusual or unexpected circumstances.
Equity securities that are listed on a foreign or domestic exchange or market are valued at the official closing price or, if none, the last sales price. If no sale occurs on the principal exchange or market that day, a fair value price will be determined in accordance with the Fund’s Valuation Procedures.
The values of securities denominated in foreign currencies are translated into U.S. dollars at rates provided by an independent foreign currency pricing source at a time each business day specified by the Wells Fargo Asset Management Pricing Committee at Wells Fargo Funds Management, LLC ("Funds Management").
Many securities markets and exchanges outside the U.S. close prior to the close of the New York Stock Exchange and therefore may not fully reflect trading or events that occur after the close of the principal exchange in which the foreign securities are traded, but before the close of the New York Stock Exchange. If such trading or events are expected to materially affect the value of such securities, then fair value pricing procedures approved by the Board of Trustees of the Fund are applied. These procedures take into account multiple factors including movements in U.S. securities markets after foreign exchanges close. Foreign securities that are fair valued under these procedures are categorized as Level 2 and the application of these procedures may result in transfers between Level 1 and Level 2. Depending on market activity, such fair valuations may be frequent. Such fair value pricing may result in net asset values that are higher or lower than net asset values based on the last reported sales price or latest quoted bid price. On April 30, 2021, such fair value pricing was not used in pricing foreign securities.
Investments in registered open-end investment companies are valued at net asset value. Interests in non-registered investment companies that are redeemable at net asset value are fair valued normally at net asset value.
Investments which are not valued using any of the methods discussed above are valued at their fair value, as determined in good faith by the Board of Trustees. The Board of Trustees has established a Valuation Committee comprised of the Trustees
Wells Fargo Special International Small Cap Fund | 15
Notes to financial statements (unaudited)
and has delegated to it the authority to take any actions regarding the valuation of portfolio securities that the Valuation Committee deems necessary or appropriate, including determining the fair value of portfolio securities, unless the determination has been delegated to the Wells Fargo Asset Management Pricing Committee. The Board of Trustees retains the authority to make or ratify any valuation decisions or approve any changes to the Valuation Procedures as it deems appropriate. On a quarterly basis, the Board of Trustees receives reports on any valuation actions taken by the Valuation Committee or the Wells Fargo Asset Management Pricing Committee which may include items for ratification.
Foreign currency translation
The accounting records of the Fund are maintained in U.S. dollars. The values of other assets and liabilities denominated in foreign currencies are translated into U.S. dollars at rates provided by an independent foreign currency pricing source at a time each business day specified by the Wells Fargo Asset Management Pricing Committee. Purchases and sales of securities, and income and expenses are converted at the rate of exchange on the respective dates of such transactions. Net realized foreign exchange gains or losses arise from sales of foreign currencies, currency gains or losses realized between the trade and settlement dates on securities transactions, and the difference between the amounts of dividends, interest and foreign withholding taxes recorded and the U.S. dollar equivalent of the amounts actually paid or received. Net unrealized foreign exchange gains and losses arise from changes in the fair value of assets and liabilities other than investments in securities resulting from changes in exchange rates. The changes in net assets arising from changes in exchange rates of securities and the changes in net assets resulting from changes in market prices of securities are not separately presented. Such changes are included in net realized and unrealized gains or losses from investments.
Securities lending
The Fund may lend its securities from time to time in order to earn additional income in the form of fees or interest on securities received as collateral or the investment of any cash received as collateral. When securities are on loan, the Fund receives interest or dividends on those securities. Cash collateral received in connection with its securities lending transactions is invested in Securities Lending Cash Investments, LLC (the "Securities Lending Fund"). Investments in Securities Lending Fund are valued at the evaluated bid price provided by an independent pricing service. Income earned from investment in the Securities Lending Fund (net of fees and rebates), if any, is included in income from affiliated securities on the Statement of Operations.
In a securities lending transaction, the net asset value of the Fund is affected by an increase or decrease in the value of the securities loaned and by an increase or decrease in the value of the instrument in which collateral is invested. The amount of securities lending activity undertaken by the Fund fluctuates from time to time. The Fund has the right under the lending agreement to recover the securities from the borrower on demand. In the event of default or bankruptcy by the borrower, the Fund may be prevented from recovering the loaned securities or gaining access to the collateral or may experience delays or costs in doing so. In such an event, the terms of the agreement allow the unaffiliated securities lending agent to use the collateral to purchase replacement securities on behalf of the Fund or pay the Fund the market value of the loaned securities. The Fund bears the risk of loss with respect to depreciation of its investment of the cash collateral.
Security transactions and income recognition
Securities transactions are recorded on a trade date basis. Realized gains or losses are recorded on the basis of identified cost.
Dividend income is recognized on the ex-dividend date, except for certain dividends from foreign securities, which are recorded as soon as the custodian verifies the ex-dividend date. Dividend income from foreign securities is recorded net of foreign taxes withheld where recovery of such taxes is not assured.
Distributions to shareholders
Distributions to shareholders from net investment income and any net realized gains are recorded on the ex-dividend date and paid at least annually. Such distributions are determined in accordance with income tax regulations and may differ from U.S. generally accepted accounting principles. Dividend sources are estimated at the time of declaration. The tax character of distributions is determined as of the Fund's fiscal year end. Therefore, a portion of the Fund's distributions made prior to the Fund’s fiscal year end may be categorized as a tax return of capital at year end.
Federal and other taxes
The Fund intends to continue to qualify as a regulated investment company by distributing substantially all of its investment company taxable income and any net realized capital gains (after reduction for capital loss carryforwards) sufficient to relieve it from all, or substantially all, federal income taxes. Accordingly, no provision for federal income taxes was required.
The Fund’s income and federal excise tax returns and all financial records supporting those returns for the fiscal years since commencement of operations are subject to examination by the federal and Delaware revenue authorities. Management has
16 | Wells Fargo Special International Small Cap Fund
Notes to financial statements (unaudited)
analyzed the Fund’s tax positions taken on federal, state, and foreign tax returns for all open tax years and does not believe that there are any uncertain tax positions that require recognition of a tax liability.
As of April 30, 2021, the aggregate cost of all investments for federal income tax purposes was $5,419,059 and the unrealized gains (losses) consisted of:
| Gross unrealized gains | $1,592,703 |
| Gross unrealized losses | (50,683) |
| Net unrealized gains | $1,542,020 |
Class allocations
The separate classes of shares offered by the Fund differ principally in administration fees. Class specific expenses are charged directly to that share class. Investment income, common fund-level expenses, and realized and unrealized gains (losses) on investments are allocated daily to each class of shares based on the relative proportion of net assets of each class.
3. FAIR VALUATION MEASUREMENTS
Fair value measurements of investments are determined within a framework that has established a fair value hierarchy based upon the various data inputs utilized in determining the value of the Fund’s investments. The three-level hierarchy gives the highest priority to unadjusted quoted prices in active markets for identical assets or liabilities (Level 1) and the lowest priority to unobservable inputs (Level 3). The Fund’s investments are classified within the fair value hierarchy based on the lowest level of input that is significant to the fair value measurement. The inputs are summarized into three broad levels as follows:
| ■ | Level 1 – quoted prices in active markets for identical securities |
| ■ | Level 2 – other significant observable inputs (including quoted prices for similar securities, interest rates, prepayment speeds, credit risk, etc.) |
| ■ | Level 3 – significant unobservable inputs (including the Fund’s own assumptions in determining the fair value of investments) |
The inputs or methodologies used for valuing investments in securities are not necessarily an indication of the risk associated with investing in those securities.
Wells Fargo Special International Small Cap Fund | 17
Notes to financial statements (unaudited)
The following is a summary of the inputs used in valuing the Fund’s assets and liabilities as of April 30, 2021:
| | Quoted prices
(Level 1) | Other significant
observable inputs
(Level 2) | Significant
unobservable inputs
(Level 3) | Total |
| Assets | | | | |
| Investments in: | | | | |
| Common stocks | | | | |
| Australia | $ 552,197 | $0 | $0 | $ 552,197 |
| Austria | 92,756 | 0 | 0 | 92,756 |
| Belgium | 180,206 | 0 | 0 | 180,206 |
| Canada | 237,566 | 0 | 0 | 237,566 |
| France | 366,226 | 0 | 0 | 366,226 |
| Germany | 640,020 | 0 | 0 | 640,020 |
| Ireland | 68,649 | 0 | 0 | 68,649 |
| Italy | 555,632 | 0 | 0 | 555,632 |
| Japan | 1,391,237 | 0 | 0 | 1,391,237 |
| Luxembourg | 58,844 | 0 | 0 | 58,844 |
| Netherlands | 151,368 | 0 | 0 | 151,368 |
| Norway | 72,936 | 0 | 0 | 72,936 |
| Spain | 296,530 | 0 | 0 | 296,530 |
| Sweden | 360,300 | 0 | 0 | 360,300 |
| Switzerland | 156,983 | 0 | 0 | 156,983 |
| United Kingdom | 1,521,719 | 0 | 0 | 1,521,719 |
| United States | 88,213 | 0 | 0 | 88,213 |
| Short-term investments | | | | |
| Investment companies | 169,697 | 0 | 0 | 169,697 |
| Total assets | $6,961,079 | $0 | $0 | $6,961,079 |
Additional sector, industry or geographic detail, if any, is included in the Portfolio of Investments.
For the six months ended April 30, 2021, the Fund did not have any transfers into/out of Level 3.
4. TRANSACTIONS WITH AFFILIATES
Management fee
Funds Management, an indirect wholly owned subsidiary of Wells Fargo & Company ("Wells Fargo"), is the manager of the Fund and provides advisory and fund-level administrative services under an investment management agreement. Under the investment management agreement, Funds Management is responsible for, among other services, implementing the investment objectives and strategies of the Fund, supervising the subadviser and providing fund-level administrative services in connection with the Fund’s operations. As compensation for its services under the investment management agreement, Funds Management is entitled to receive a management fee at the following annual rate based on the Fund’s average daily net assets:
| Average daily net assets | Management fee |
| First $500 million | 0.950% |
| Next $500 million | 0.925 |
| Next $1 billion | 0.900 |
| Next $2 billion | 0.875 |
| Next $1 billion | 0.850 |
| Next $5 billion | 0.840 |
| Over $10 billion | 0.830 |
For the six months ended April 30, 2021, the management fee was equivalent to an annual rate of 0.95% of the Fund’s average daily net assets.
18 | Wells Fargo Special International Small Cap Fund
Notes to financial statements (unaudited)
Funds Management has retained the services of a subadviser to provide daily portfolio management to the Fund. The fee for subadvisory services is borne by Funds Management. Wells Capital Management Incorporated ("WellsCap"), an affiliate of Funds Management and an indirect wholly owned subsidiary of Wells Fargo, is the subadviser to the Fund and is entitled to receive a fee from Funds Management at an annual rate starting at 0.55% and declining to 0.40% as the average daily net assets of the Fund increase.
Administration fees
Under a class-level administration agreement, Funds Management provides class-level administrative services to the Fund, which includes paying fees and expenses for services provided by the transfer agent, sub-transfer agents, omnibus account servicers and record-keepers. As compensation for its services under the class-level administration agreement, Funds Management receives an annual fee which is calculated based on the average daily net assets of each class as follows:
| | Class-level
administration fee |
| Class R6 | 0.03% |
| Institutional Class | 0.13 |
Waivers and/or expense reimbursements
Funds Management has contractually waived and/or reimbursed management and administration fees to the extent necessary to maintain certain net operating expense ratios for the Fund. When each class of the Fund has exceeded its expense cap, Funds Management has waived fees and/or reimbursed expenses from fund-level expenses on a proportionate basis and then from class specific expenses. When only certain classes exceed their expense caps, waivers and/or reimbursements are applied against class specific expenses before fund-level expenses. Funds Management has committed through February 28, 2022 to waive fees and/or reimburse expenses to the extent necessary to cap expenses. Prior to or after the commitment expiration date, the cap may be increased or the commitment to maintain the cap may be terminated only with the approval of the Board of Trustees. The contractual expense caps are as follows:
| | Expense ratio caps |
| Class R6 | 0.95% |
| Institutional Class | 1.05 |
Interfund transactions
The Fund may purchase or sell portfolio investment securities to certain other Wells Fargo affiliates pursuant to Rule 17a-7 under the 1940 Act and under procedures adopted by the Board of Trustees. The procedures have been designed to ensure that these interfund transactions, which do not incur broker commissions, are effected at current market prices.
5. INVESTMENT PORTFOLIO TRANSACTIONS
Purchases and sales of investments, excluding U.S. government obligations (if any) and short-term securities, for the six months ended April 30, 2021 were $1,404,044 and $1,491,992, respectively.
6. SECURITIES LENDING TRANSACTIONS
The Fund lends its securities through an unaffiliated securities lending agent and receives collateral in the form of cash or securities with a value at least equal to the value of the securities on loan. The value of the loaned securities is determined at the close of each business day and any increases or decreases in the required collateral are exchanged between the Fund and the counterparty on the next business day. Cash collateral received is invested in the Securities Lending Fund which seeks to provide a positive return compared to the daily Federal Funds Open Rate by investing in high-quality, U.S. dollar-denominated short-term money market instruments and is exempt from registration under Section 3(c)(7) of the 1940 Act. Securities Lending Fund is managed by Funds Management and is subadvised by WellsCap. Funds Management receives an advisory fee starting at 0.05% and declining to 0.01% as the average daily net assets of the Securities Lending Fund increase. All of the fees received by Funds Management are paid to WellsCap for its services as subadviser.
Wells Fargo Special International Small Cap Fund | 19
Notes to financial statements (unaudited)
In the event of counterparty default or the failure of a borrower to return a loaned security, the Fund has the right to use the collateral to offset any losses incurred. As of April 30, 2021, the Fund had securities lending transactions with the following counterparties which are subject to offset:
| Counterparty | Value of
securities on
loan | Collateral
received1 | Net amount |
| Citigroup Global Markets Inc. | $71,668 | $(71,668) | $0 |
1 Collateral received within this table is limited to the collateral for the net transaction with the counterparty.
7. BANK BORROWINGS
The Trust (excluding the money market funds), Wells Fargo Master Trust and Wells Fargo Variable Trust are parties to a $350,000,000 revolving credit agreement whereby the Fund is permitted to use bank borrowings for temporary or emergency purposes, such as to fund shareholder redemption requests. Interest under the credit agreement is charged to the Fund based on a borrowing rate equal to the higher of the Federal Funds rate in effect on that day plus 1.25% or the overnight LIBOR rate in effect on that day plus 1.25%. In addition, an annual commitment fee equal to 0.25% of the unused balance is allocated to each participating fund.
For the six months ended April 30, 2021, there were no borrowings by the Fund under the agreement.
8. CONCENTRATION RISK
A fund with a concentration of ownership may be more affected by the investment activity of those shareholders than would be a fund that does not have any ownership concentration. As of April 30, 2021, Wells Fargo owned 100% and 90% of Class R6 shares and Institutional Class shares, respectively.
9. INDEMNIFICATION
Under the Fund's organizational documents, the officers and Trustees have been granted certain indemnification rights against certain liabilities that may arise out of performance of their duties to the Fund. The Fund has entered into a separate agreement with each Trustee that converts indemnification rights currently existing under the Fund’s organizational documents into contractual rights that cannot be changed in the future without the consent of the Trustee. Additionally, in the normal course of business, the Fund may enter into contracts with service providers that contain a variety of indemnification clauses. The Fund’s maximum exposure under these arrangements is dependent on future claims that may be made against the Fund and, therefore, cannot be estimated.
10. CORONAVIRUS (COVID-19) PANDEMIC
On March 11, 2020, the World Health Organization announced that it had made the assessment that coronavirus disease 2019 (“COVID-19”) is a pandemic. The impacts of COVID-19 are affecting the entire global economy, individual companies and investment products, the funds, and the market in general. There is significant uncertainty around the extent and duration of business disruptions related to COVID-19 and the impacts may last for an extended period of time. COVID-19 has led to significant uncertainty and volatility in the financial markets.
20 | Wells Fargo Special International Small Cap Fund
Other information (unaudited)
PROXY VOTING INFORMATION
A description of the policies and procedures used to determine how to vote proxies relating to portfolio securities is available without charge, upon request, by calling 1-800-222-8222, visiting our website at wfam.com, or visiting the SEC website at sec.gov. Information regarding how the proxies related to portfolio securities were voted during the most recent 12-month period ended June 30 is available on the website at wfam.com or by visiting the SEC website at sec.gov.
QUARTERLY PORTFOLIO HOLDINGS INFORMATION
The Fund files its complete schedule of portfolio holdings with the SEC for the first and third quarters of each fiscal year as an exhibit to its reports on Form N-PORT. Shareholders may view the filed Form N-PORT by visiting the SEC website at sec.gov.
Wells Fargo Special International Small Cap Fund | 21
Other information (unaudited)
BOARD OF TRUSTEES AND OFFICERS
Each of the Trustees and Officers listed in the table below acts in identical capacities for each fund in the Wells Fargo family of funds, which consists of 139 mutual funds comprising the Wells Fargo Funds Trust, Wells Fargo Variable Trust, Wells Fargo Master Trust and four closed-end funds (collectively the “Fund Complex”). This table should be read in conjunction with the Prospectus and the Statement of Additional Information1. The mailing address of each Trustee and Officer is 525 Market Street, 12th Floor, San Francisco, CA 94105. Each Trustee and Officer serves an indefinite term, however, each Trustee serves such term until reaching the mandatory retirement age established by the Trustees.
Independent Trustees
Name and
year of birth | Position held and
length of service* | Principal occupations during past five years or longer | Current other
public company or
investment
company
directorships |
William R. Ebsworth
(Born 1957) | Trustee,
since 2015 | Retired. From 1984 to 2013, equities analyst, portfolio manager, research director and chief investment officer at Fidelity Management and Research Company in Boston, Tokyo, and Hong Kong, and retired in 2013 as Chief Investment Officer of Fidelity Strategic Advisers, Inc. where he led a team of investment professionals managing client assets. Prior thereto, Board member of Hong Kong Securities Clearing Co., Hong Kong Options Clearing Corp., the Thailand International Fund, Ltd., Fidelity Investments Life Insurance Company, and Empire Fidelity Investments Life Insurance Company. Audit Committee Chair and Investment Committee Chair of the Vincent Memorial Hospital Endowment (non-profit organization). Mr. Ebsworth is a CFA® charterholder. | N/A |
Jane A. Freeman
(Born 1953) | Trustee,
since 2015;
Chair Liaison,
since 2018 | Retired. From 2012 to 2014 and 1999 to 2008, Chief Financial Officer of Scientific Learning Corporation. From 2008 to 2012, Ms. Freeman provided consulting services related to strategic business projects. Prior to 1999, Portfolio Manager at Rockefeller & Co. and Scudder, Stevens & Clark. Board member of the Harding Loevner Funds from 1996 to 2014, serving as both Lead Independent Director and chair of the Audit Committee. Board member of the Russell Exchange Traded Funds Trust from 2011 to 2012 and the chair of the Audit Committee. Ms. Freeman is also an inactive Chartered Financial Analyst. | N/A |
Isaiah Harris, Jr.
(Born 1952) | Trustee,
since 2009; Audit
Committee
Chair,
since 2019 | Retired. Chairman of the Board of CIGNA Corporation since 2009, and Director since 2005. From 2003 to 2011, Director of Deluxe Corporation. Prior thereto, President and CEO of BellSouth Advertising and Publishing Corp. from 2005 to 2007, President and CEO of BellSouth Enterprises from 2004 to 2005 and President of BellSouth Consumer Services from 2000 to 2003. Emeritus member of the Iowa State University Foundation Board of Governors. Emeritus Member of the Advisory Board of Iowa State University School of Business. Advisory Board Member, Palm Harbor Academy (private school). Mr. Harris is a certified public accountant (inactive status). | CIGNA Corporation |
Judith M. Johnson
(Born 1949) | Trustee,
since 2008 | Retired. Prior thereto, Chief Executive Officer and Chief Investment Officer of Minneapolis Employees Retirement Fund from 1996 to 2008. Ms. Johnson is an attorney, certified public accountant and a certified managerial accountant. | N/A |
David F. Larcker
(Born 1950) | Trustee,
since 2009 | James Irvin Miller Professor of Accounting at the Graduate School of Business (Emeritus), Stanford University, Director of the Corporate Governance Research Initiative and Senior Faculty of The Rock Center for Corporate Governance since 2006. From 2005 to 2008, Professor of Accounting at the Graduate School of Business, Stanford University. Prior thereto, Ernst & Young Professor of Accounting at The Wharton School, University of Pennsylvania from 1985 to 2005. | N/A |
22 | Wells Fargo Special International Small Cap Fund
Other information (unaudited)
Name and
year of birth | Position held and
length of service* | Principal occupations during past five years or longer | Current other
public company or
investment
company
directorships |
Olivia S. Mitchell
(Born 1953) | Trustee,
since 2006;
Nominating and
Governance
Committee Chair,
since 2018 | International Foundation of Employee Benefit Plans Professor, Wharton School of the University of Pennsylvania since 1993. Director of Wharton’s Pension Research Council and Boettner Center on Pensions & Retirement Research, and Research Associate at the National Bureau of Economic Research. Previously, Cornell University Professor from 1978 to 1993. | N/A |
Timothy J. Penny
(Born 1951) | Trustee,
since 1996;
Chair,
since 2018 | President and Chief Executive Officer of Southern Minnesota Initiative Foundation, a non-profit organization, since 2007. Member of the Board of Trustees of NorthStar Education Finance, Inc., a non-profit organization, since 2007. | N/A |
James G. Polisson
(Born 1959) | Trustee,
since 2018 | Retired. Chief Marketing Officer, Source (ETF) UK Services, Ltd, from 2015 to 2017. From 2012 to 2015, Principal of The Polisson Group, LLC, a management consulting, corporate advisory and principal investing company. Chief Executive Officer and Managing Director at Russell Investments, Global Exchange Traded Funds from 2010 to 2012. Managing Director of Barclays Global Investors from 1998 to 2010 and Global Chief Marketing Officer for iShares and Barclays Global Investors from 2000 to 2010. Trustee of the San Francisco Mechanics’ Institute, a non-profit organization, from 2013 to 2015. Board member of the Russell Exchange Traded Fund Trust from 2011 to 2012. Director of Barclays Global Investors Holdings Deutschland GmbH from 2006 to 2009. Mr. Polisson is an attorney and has a retired status with the Massachusetts and District of Columbia Bar Associations. | N/A |
Pamela Wheelock
(Born 1959) | Trustee,
since January
2020; previously
Trustee from
January 2018 to
July 2019 | Board member of the Destination Medical Center Economic Development Agency, Rochester, Minnesota since 2019. Interim President of the McKnight Foundation from January to September 2020. Acting Commissioner, Minnesota Department of Human Services, July 2019 through September 2019. Human Services Manager (part-time), Minnesota Department of Human Services, October 2019 through December 2019. Chief Operating Officer, Twin Cities Habitat for Humanity from 2017 to 2019. Vice President of University Services, University of Minnesota from 2012 to 2016. Prior thereto, on the Board of Directors, Governance Committee and Finance Committee for the Minnesota Philanthropy Partners (Saint Paul Foundation) from 2012 to 2018, Interim Chief Executive Officer of Blue Cross Blue Shield of Minnesota from 2011 to 2012, Chairman of the Board from 2009 to 2012 and Board Director from 2003 to 2015. Vice President, Leadership and Community Engagement, Bush Foundation, Saint Paul, Minnesota (a private foundation) from 2009 to 2011. Executive Vice President and Chief Financial Officer, Minnesota Sports and Entertainment from 2004 to 2009 and Senior Vice President from 2002 to 2004. Executive Vice President of the Minnesota Wild Foundation from 2004 to 2008. Commissioner of Finance, State of Minnesota, from 1999 to 2002. Currently Board Chair of the Minnesota Wild Foundation since 2010. | N/A |
* Length of service dates reflect the Trustee’s commencement of service with the Trust’s predecessor entities, where applicable.
Wells Fargo Special International Small Cap Fund | 23
Other information (unaudited)
Officers
Name and
year of birth | Position held and
length of service | Principal occupations during past five years or longer |
Andrew Owen
(Born 1960) | President,
since 2017 | Executive Vice President of Wells Fargo & Company and Head of Affiliated Managers, Wells Fargo Asset Management, since 2014. In addition, Mr. Owen is currently President, Chief Executive Officer and Director of Wells Fargo Funds Management, LLC since 2017. Prior thereto, Executive Vice President responsible for marketing, investments and product development for Wells Fargo Funds Management, LLC, from 2009 to 2014. |
Jeremy DePalma
(Born 1974) | Treasurer,
since 2012
(for certain funds in
the Fund Complex);
since 2021 (for
the remaining funds in the
Fund Complex) | Senior Vice President of Wells Fargo Funds Management, LLC since 2009. Senior Vice President of Evergreen Investment Management Company, LLC from 2008 to 2010 and head of the Fund Reporting and Control Team within Fund Administration from 2005 to 2010. |
Michelle Rhee
(Born 1966) | Chief Legal Officer,
since 2019 | Secretary of Wells Fargo Funds Management, LLC and Chief Legal Counsel of Wells Fargo Asset Management since 2018. Deputy General Counsel of Wells Fargo Bank, N.A. since 2020 and Assistant General Counsel of Wells Fargo Bank, N.A. from 2018 to 2020. Associate General Counsel and Managing Director of Bank of America Corporation from 2004 to 2018. |
Catherine Kennedy
(Born 1969) | Secretary,
since 2019 | Vice President of Wells Fargo Funds Management, LLC and Senior Counsel of the Wells Fargo Legal Department since 2010. Vice President and Senior Counsel of Evergreen Investment Management Company, LLC from 1998 to 2010. |
Michael H. Whitaker
(Born 1967) | Chief Compliance Officer,
since 2016 | Chief Compliance Officer of Wells Fargo Asset Management since 2016. Senior Vice President and Chief Compliance Officer for Fidelity Investments from 2007 to 2016. |
1 The Statement of Additional Information includes additional information about the Trustees and is available, without charge, upon request, by calling 1-800-222-8222 or by visiting the website at wfam.com.
24 | Wells Fargo Special International Small Cap Fund
For more information
More information about Wells Fargo Funds is available free upon request. To obtain literature, please write, visit the Fund's website, or call:
Wells Fargo Funds
P.O. Box 219967
Kansas City, MO 64121-9967
Website: wfam.com
Individual investors: 1-800-222-8222
Retail investment professionals: 1-888-877-9275
Institutional investment professionals: 1-866-765-0778
This report and the financial statements contained herein are submitted for the general information of the shareholders of the Fund. If this report is used for promotional purposes, distribution of the report must be accompanied or preceded by a current prospectus. Before investing, please consider the investment objectives, risks, charges, and expenses of the investment. For a current prospectus and, if available, a summary prospectus, containing this information, call 1-800-222-8222 or visit the Fund's website at wfam.com. Read the prospectus carefully before you invest or send money.
Wells Fargo Asset Management (WFAM) is the trade name for certain investment advisory/management firms owned by Wells Fargo & Company. These firms include but are not limited to Wells Capital Management Incorporated and Wells Fargo Funds Management, LLC. Certain products managed by WFAM entities are distributed by Wells Fargo Funds Distributor, LLC (a broker-dealer and Member FINRA).
This material is for general informational and educational purposes only and is NOT intended to provide investment advice or a recommendation of any kind - including a recommendation for any specific investment, strategy, or plan.
INVESTMENT PRODUCTS: NOT FDIC INSURED ■ NO BANK GUARANTEE ■ MAY LOSE VALUE
© 2021 Wells Fargo & Company. All rights reserved.
PAR-0521-00325 06-21
SA296/SAR296 04-21
ITEM 2. CODE OF ETHICS
Not applicable.
ITEM 3. AUDIT COMMITTEE FINANCIAL EXPERT
Not applicable.
ITEM 4. PRINCIPAL ACCOUNTANT FEES AND SERVICES
Not applicable.
ITEM 5. AUDIT COMMITTEE OF LISTED REGISTRANTS
Not applicable.
ITEM 6. INVESTMENTS
A Portfolio of Investments for each series of Wells Fargo Funds Trust is included as part of the report to shareholders filed under Item 1 of this Form.
ITEM 7. DISCLOSURE OF PROXY VOTING POLICIES AND PROCEDURES FOR CLOSED-END MANAGEMENT INVESTMENT COMPANIES
Not applicable.
ITEM 8. PORTFOLIO MANAGERS OF CLOSED-END MANAGEMENT INVESTMENT COMPANIES
Not applicable.
ITEM 9. PURCHASES OF EQUITY SECURITIES BY CLOSED-END MANAGEMEENT INVESTMENT COMPANY AND AFFILIATED PURCHASERS
Not applicable.
ITEM 10. SUBMISSION OF MATTERS TO A VOTE OF SECURITY HOLDERS
There have been no material changes to the procedures by which shareholders may recommend nominees to the registrant’s Board of Trustees that have been implemented since the registrant’s last provided disclosure in response to the requirements of this Item.
ITEM 11. CONTROLS AND PROCEDURES
(a) The President and Treasurer have concluded that the Wells Fargo Funds Trust disclosure controls and procedures (as defined in Rule 30a-3(c) under the Investment Company Act of 1940) provide reasonable assurances that material information relating to the registrant is made known to them by the appropriate persons, based on their evaluation of these controls and procedures as of a date within 90 days of the filing of this report.
(b) There were no significant changes in the registrant’s internal controls over financial reporting (as defined in Rule 30a-3(d) under the Investment Company Act of 1940) that occurred during the most recent fiscal half-year of the period covered by this report that materially affected, or is reasonably likely to materially affect, the registrant’s internal control over financial reporting.
ITEM 12. DISCLOSURES OF SECURITIES LENDING ACTIVITES FOR CLOSED-END MANAGEMENT INVESTMENT COMPANIES
Not applicable.
ITEM 13. EXHIBITS
SIGNATURES
Pursuant to the requirements of the Securities Exchange Act of 1934 and the Investment Company Act of 1940, the registrant has duly caused this report to be signed on its behalf by the undersigned, thereunto duly authorized.
| | |
| Wells Fargo Funds Trust |
| |
| By: | | |
| |
| | /s/ Andrew Owen |
| |
| | Andrew Owen |
| | President |
| |
| Date: | | June 25, 2021 |
Pursuant to the requirements of the Securities Exchange Act of 1934 and the Investment Company Act of 1940, this report has been signed below by the following persons on behalf of the registrant and in the capacities and on the date indicated.
| | |
| Wells Fargo Funds Trust |
| |
| By: | | |
| |
| | /s/ Andrew Owen |
| |
| | Andrew Owen |
| | President |
| |
| Date: | | June 25, 2021 |
| |
| By: | | |
| |
| | /s/ Jeremy DePalma |
| |
| | Jeremy DePalma |
| | Treasurer |
| |
| Date: | | June 25, 2021 |