UNITED STATES
SECURITIES AND EXCHANGE COMMISSION
Washington, D.C. 20549
FORM N-CSRS
CERTIFIED SHAREHOLDER REPORT OF REGISTERED
MANAGEMENT INVESTMENT COMPANIES
Investment Company Act file number: 811-09253
Wells Fargo Funds Trust
(Exact name of registrant as specified in charter)
525 Market St., San Francisco, CA 94105
(Address of principal executive offices) (Zip code)
Catherine Kennedy
Wells Fargo Funds Management, LLC
525 Market St., San Francisco, CA 94105
(Name and address of agent for service)
Registrant’s telephone number, including area code: 800-222-8222
Date of fiscal year end: September 30
Registrant is making a filing for 12 of its series:
Wells Fargo Diversified Capital Builder Fund, Wells Fargo Diversified Income Builder Fund, Wells Fargo Index Asset Allocation Fund, Wells Fargo International Bond Fund, Wells Fargo Income Plus Fund
Wells Fargo Global Investment Grade Credit Fund, Wells Fargo C&B Mid Cap Value Fund, Wells Fargo Common Stock Fund, Wells Fargo Discovery Fund, Wells Fargo Enterprise Fund, Wells Fargo Opportunity Fund, and Wells Fargo Special Mid Cap Value Fund;
Date of reporting period: March 31, 2021
| ITEM 1. | REPORT TO STOCKHOLDERS |
Semi-Annual Report
March 31, 2021
Wells Fargo
Diversified Capital Builder Fund
Reduce clutter.
Save trees.
Sign up for electronic delivery of prospectuses and shareholder reports at wellsfargo.com/ advantagedelivery
The views expressed and any forward-looking statements are as of March 31, 2021, unless otherwise noted, and are those of the Fund's portfolio managers and/or Wells Fargo Asset Management. Discussions of individual securities or the markets generally are not intended as individual recommendations. Future events or results may vary significantly from those expressed in any forward-looking statements. The views expressed are subject to change at any time in response to changing circumstances in the market. Wells Fargo Asset Management and the Fund disclaim any obligation to publicly update or revise any views expressed or forward-looking statements.
INVESTMENT PRODUCTS: NOT FDIC INSURED ■ NO BANK GUARANTEE ■ MAY LOSE VALUE
Wells Fargo Diversified Capital Builder Fund | 1
Letter to shareholders (unaudited)
Andrew Owen
President
Wells Fargo Funds
Dear Shareholder:
We are pleased to offer you this semi-annual report for the Wells Fargo Diversified Capital Builder Fund for the six-month period that ended March 31, 2021. Despite a deeply challenging year, dominated by the spread of COVID-19 cases and a sharp drop in economic output throughout much of the world, global stocks performed extremely well, benefiting from ongoing central bank support and rising optimism over the development and distribution of effective COVID-19 vaccines. Bonds also had positive returns, led by global bonds and high-yield bonds.
For the six-month period, U.S. stocks, based on the S&P 500 Index,1 gained 19.07%. International stocks, as measured by the MSCI ACWI ex USA Index (Net),2 returned 21.10%, while the MSCI EM Index (Net),3 had even stronger performance, with a 22.43% gain. Among bond indexes, the Bloomberg Barclays U.S. Aggregate Bond Index,4 returned -2.73%, the Bloomberg Barclays Global Aggregate ex-USD Index (unhedged),5 returned -0.47%, and the Bloomberg Barclays Municipal Bond Index,6 returned 1.46% while the ICE BofA U.S. High Yield Index,7 gained 7.44%.
Hope drove the stock markets to new highs.
In October, capital markets stepped back from their six-month rally. Market volatility rose in advance of the U.S. election and amid a global increase in COVID-19 infections. Europe introduced tighter restrictions affecting economic activity. U.S. markets looked favorably at the prospect of Democratic control of the federal purse strings, which could lead to additional fiscal stimulus and a boost to economic activity. Meanwhile, China reported 4.9% third-quarter gross domestic product growth.
Global stocks rallied in November, propelled by optimism over three promising COVID-19 vaccines. Reversing recent trends, value stocks outperformed growth stocks and cyclical stocks outpaced information technology (IT) stocks. However, U.S. unemployment remained elevated, with a net job loss of 10 million since February. The eurozone services purchasing managers’ index contracted sharply while the region’s manufacturing activity grew. The U.S. election results added to the upbeat mood as investors anticipated more consistent policies in the new administration.
“Global stocks rallied in November, propelled by optimism over three promising COVID-19 vaccines.”
| 1 | The S&P 500 Index consists of 500 stocks chosen for market size, liquidity, and industry group representation. It is a market-value-weighted index with each stock's weight in the index proportionate to its market value. You cannot invest directly in an index. |
| 2 | The Morgan Stanley Capital International (MSCI) All Country World Index (ACWI) ex USA Index (Net) is a free-float-adjusted market-capitalization-weighted index that is designed to measure the equity market performance of developed and emerging markets, excluding the United States. Source: MSCI. MSCI makes no express or implied warranties or representations and shall have no liability whatsoever with respect to any MSCI data contained herein. The MSCI data may not be further redistributed or used as a basis for other indices or any securities or financial products. This report is not approved, reviewed, or produced by MSCI. You cannot invest directly in an index. |
| 1 | The S&P 500 Index consists of 500 stocks chosen for market size, liquidity, and industry group representation. It is a market-value-weighted index with each stock's weight in the index proportionate to its market value. You cannot invest directly in an index. |
| 3 | The MSCI Emerging Markets (EM) Index (Net) is a free-float-adjusted market-capitalization-weighted index that is designed to measure equity market performance of emerging markets. You cannot invest directly in an index. |
| 1 | The S&P 500 Index consists of 500 stocks chosen for market size, liquidity, and industry group representation. It is a market-value-weighted index with each stock's weight in the index proportionate to its market value. You cannot invest directly in an index. |
| 4 | The Bloomberg Barclays U.S. Aggregate Bond Index is a broad-based benchmark that measures the investment-grade, U.S. dollar-denominated, fixed-rate taxable bond market, including Treasuries, government-related and corporate securities, mortgage-backed securities (agency fixed-rate and hybrid adjustable-rate mortgage pass-throughs), asset-backed securities, and commercial mortgage-backed securities. You cannot invest directly in an index. |
| 1 | The S&P 500 Index consists of 500 stocks chosen for market size, liquidity, and industry group representation. It is a market-value-weighted index with each stock's weight in the index proportionate to its market value. You cannot invest directly in an index. |
| 5 | The Bloomberg Barclays Global Aggregate ex-USD Index (unhedged) is an unmanaged index that provides a broad-based measure of the global investment-grade fixed-income markets excluding the U.S. dollar-denominated debt market. You cannot invest directly in an index. |
| 1 | The S&P 500 Index consists of 500 stocks chosen for market size, liquidity, and industry group representation. It is a market-value-weighted index with each stock's weight in the index proportionate to its market value. You cannot invest directly in an index. |
| 6 | The Bloomberg Barclays Municipal Bond Index is an unmanaged index composed of long-term tax-exempt bonds with a minimum credit rating of Baa. You cannot invest directly in an index. |
| 1 | The S&P 500 Index consists of 500 stocks chosen for market size, liquidity, and industry group representation. It is a market-value-weighted index with each stock's weight in the index proportionate to its market value. You cannot invest directly in an index. |
| 7 | The ICE BofA U.S. High Yield Index is a market-capitalization-weighted index of domestic and Yankee high-yield bonds. The index tracks the performance of high-yield securities traded in the U.S. bond market. You cannot invest directly in an index. Copyright 2021. ICE Data Indices, LLC. All rights reserved. |
2 | Wells Fargo Diversified Capital Builder Fund
Letter to shareholders (unaudited)
Financial markets ended the year with strength on high expectations for a rapid rollout of the COVID-19 vaccines, the successful passage of a $900 billion stimulus package, and rising expectations of additional economic support from a Democratic-led Congress. U.S. economic data were mixed with still-elevated unemployment and weak retail sales but growth in manufacturing output. In contrast, China’s economic expansion continued in both manufacturing and nonmanufacturing. U.S. COVID-19 infection rates continued to rise even as new state and local lockdown measures were implemented.
The year 2021 began with emerging market stocks leading all major asset classes in January, driven by China’s strong economic growth and a broad recovery in corporate earnings, which propelled China’s stock market higher. In the U.S., positive news on vaccine trials and January's expansion in both the manufacturing and services sectors were offset by a weak December monthly jobs report. This was compounded by technical factors as some hedge funds were forced to sell stocks to protect themselves against a well-publicized short squeeze coordinated by a group of retail investors. Eurozone sentiment and economic growth were particularly weak, reflecting the impact of a new lockdown with stricter social distancing along with a slow vaccine rollout.
February saw major domestic equity indexes driven higher on the hope of a new stimulus bill, improving COVID-19 vaccination numbers, and the gradual reopening of the economy. Most S&P 500 companies reported better-than-expected earnings, with positive surprises coming from the financials, IT, health care, and materials sectors. Japan saw its economy strengthen as a result of strong export numbers. Meanwhile, crude-oil prices continued their climb, rising more than 25% for the year. Domestic government bonds experienced a sharp sell-off in late February as markets priced in a more robust economic recovery and higher future growth and inflation expectations.
The passage of the massive domestic stimulus bill highlighted March activity, leading to increased forecasts for U.S. growth in 2021. Domestic employment surged as COVID-19 vaccinations and an increasingly open economy spurred hiring. A majority of U.S. small companies reported they are operating at pre-pandemic capacity or higher. Value continued its outperformance of growth in the month, continuing the trend that started in late 2020. Meanwhile, most major developed global equity indexes are up month to date on the back of rising optimism regarding the outlook for global growth. While the U.S. and the U.K. have been the most successful in terms of the vaccine rollout, even within markets where the vaccine has lagged, such as the eurozone and Japan, equity indexes in many of those countries are also in positive territory this year.
Don’t let short-term uncertainty derail long-term investment goals.
Periods of investment uncertainty can present challenges, but experience has taught us that maintaining long-term investment goals can be an effective way to plan for the future. To help you create a sound strategy based on your personal goals and risk tolerance, Wells Fargo Funds offers more than 100 mutual funds spanning a wide range of asset classes and investment styles. Although diversification cannot guarantee an investment profit or prevent losses, we believe it can be an effective way to manage investment risk and potentially smooth out overall portfolio performance. We encourage investors to know their investments and to understand that appropriate levels of risk-taking may unlock opportunities.
Thank you for choosing to invest with Wells Fargo Funds. We appreciate your confidence in us and remain committed to helping you meet your financial needs.
Sincerely,
Andrew Owen
President
Wells Fargo Funds
“The passage of the massive domestic stimulus bill highlighted March activity, leading to increased forecasts for U.S. growth in 2021.”
For further information about your Fund, contact your investment professional, visit our website at wfam.com, or call us directly at 1-800-222-8222.
Wells Fargo Diversified Capital Builder Fund | 3
Performance highlights (unaudited)
| Investment objective | The Fund seeks long-term total returns, consisting of capital appreciation and current income. |
| Manager | Wells Fargo Funds Management, LLC |
| Subadviser | Wells Capital Management Incorporated |
| Portfolio managers | Robert Junkin, Margaret Patel |
| | |
| Average annual total returns (%) as of March 31, 2021 |
| | | Including sales charge | | Excluding sales charge | | Expense ratios1 (%) |
| | Inception date | 1 year | 5 year | 10 year | | 1 year | 5 year | 10 year | | Gross | Net 2 |
| Class A (EKBAX) | 1-20-1998 | 33.38 | 11.48 | 9.79 | | 41.60 | 12.81 | 10.44 | | 1.11 | 1.11 |
| Class C (EKBCX) | 1-22-1998 | 39.57 | 11.98 | 9.61 | | 40.57 | 11.98 | 9.61 | | 1.86 | 1.86 |
| Administrator Class (EKBDX) | 7-30-2010 | – | – | – | | 41.53 | 12.90 | 10.60 | | 1.03 | 1.03 |
| Institutional Class (EKBYX) | 1-26-1998 | – | – | – | | 42.04 | 13.20 | 10.85 | | 0.78 | 0.78 |
| Diversified Capital Builder Blended Index3 | – | – | – | – | | 50.57 | 14.53 | 12.10 | | – | – |
| ICE BofA U.S. Cash Pay High Yield Index4 | – | – | – | – | | 23.15 | 7.90 | 6.30 | | – | – |
| Russell 1000® Index5 | – | – | – | – | | 60.59 | 16.66 | 13.97 | | – | – |
Figures quoted represent past performance, which is no guarantee of future results, and do not reflect taxes that a shareholder may pay on an investment in a fund. Investment return and principal value of an investment will fluctuate so that an investor’s shares, when redeemed, may be worth more or less than their original cost. Performance shown without sales charges would be lower if sales charges were reflected. Current performance may be lower or higher than the performance data quoted, which assumes the reinvestment of dividends and capital gains. Current month-end performance is available on the Fund’s website, wfam.com.
Please keep in mind that high double-digit returns were primarily achieved during favorable market conditions. You should not expect that such favorable returns can be consistently achieved. A fund’s performance, especially for short time periods, should not be the sole factor in making your investment decision.
Index returns do not include transaction costs associated with buying and selling securities, any mutual fund fees or expenses, or any taxes. It is not possible to invest directly in an index.
For Class A shares, the maximum front-end sales charge is 5.75%. For Class C shares, the maximum contingent deferred sales charge is 1.00%. Performance including a contingent deferred sales charge assumes the sales charge for the corresponding time period. Administrator Class and Institutional Class shares are sold without a front-end sales charge or contingent deferred sales charge.
| 1 | Reflects the expense ratios as stated in the most recent prospectuses. The expense ratios shown are subject to change and may differ from the annualized expense ratios shown in the financial highlights of this report. |
| 2 | The manager has contractually committed through January 31, 2022, to waive fees and/or reimburse expenses to the extent necessary to cap total annual fund operating expenses after fee waivers at 1.13% for Class A, 1.88% for Class C, 1.05% for Administrator Class, and 0.78% for Institutional Class. Brokerage commissions, stamp duty fees, interest, taxes, acquired fund fees and expenses (if any), and extraordinary expenses are excluded from the expense caps. Prior to or after the commitment expiration date, the caps may be increased or the commitment to maintain the caps may be terminated only with the approval of the Board of Trustees. Without these caps, the Fund’s returns would have been lower. The expense ratio paid by an investor is the net expense ratio (the total annual fund operating expenses after fee waivers) as stated in the prospectuses. |
| 3 | Source: Wells Fargo Funds Management, LLC. The Diversified Capital Builder Blended Index is composed 75% of the Russell 1000® Index and 25% of the ICE BofA U.S. Cash Pay High Yield Index. You cannot invest directly in an index. |
| 4 | The ICE BofA U.S. Cash Pay High Yield Index is an unmanaged market index that provides a broad-based performance measure of the non-investment grade U.S. domestic bond index. You cannot invest directly in an index. Copyright 2021. ICE Data Indices, LLC. All rights reserved. |
| 5 | The Russell 1000® Index measures the performance of the 1,000 largest companies in the Russell 3000® Index, which represents approximately 92% of the total market capitalization of the Russell 3000® Index. You cannot invest directly in an index. |
4 | Wells Fargo Diversified Capital Builder Fund
Performance highlights (unaudited)
Balanced funds may invest in stocks and bonds. Stock values fluctuate in response to the activities of individual companies and general market and economic conditions. Bond values fluctuate in response to the financial condition of individual issuers, general market and economic conditions, and changes in interest rates. Changes in market conditions and government policies may lead to periods of heightened volatility in the bond market and reduced liquidity for certain bonds held by the Fund. In general, when interest rates rise, bond values fall and investors may lose principal value. Interest rate changes and their impact on the Fund and its share price can be sudden and unpredictable. Certain investment strategies tend to increase the total risk of an investment (relative to the broader market). The Fund is exposed to foreign investment risk, high-yield securities risk, and smaller-company securities risk. Consult the Fund’s prospectus for additional information on these and other risks.
Wells Fargo Diversified Capital Builder Fund | 5
Performance highlights (unaudited)
| Ten largest holdings (%) as of March 31, 20211 |
| Broadcom Incorporated | 6.05 |
| AbbVie Incorporated | 4.89 |
| Bristol-Myers Squibb Company | 3.51 |
| Amphenol Corporation Class A | 3.44 |
| Amgen Incorporated | 3.03 |
| Akamai Technologies Incorporated | 3.01 |
| Leidos Holdings Incorporated | 2.93 |
| Thermo Fisher Scientific Incorporated | 2.78 |
| Danaher Corporation | 2.74 |
| Microchip Technology Incorporated | 2.70 |
| 1 | Figures represent the percentage of the Fund's net assets. Holdings are subject to change and may have changed since the date specified. |
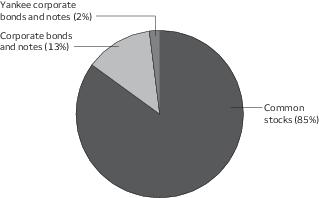
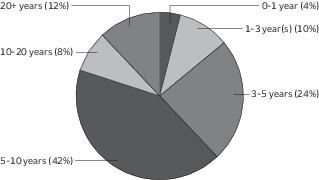
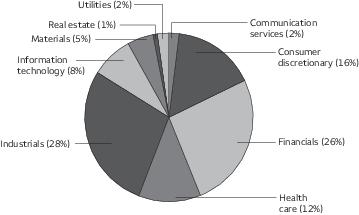
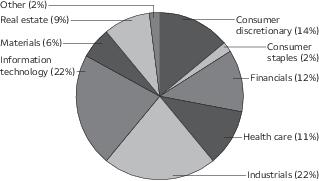
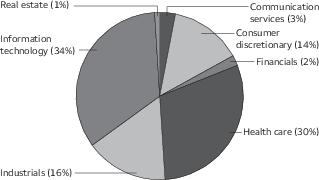
| Portfolio composition as of March 31, 20211 |
| 1 | Figures represent the percentage of the Fund's long-term investments. These amounts are subject to change and may have changed since the date specified. |
6 | Wells Fargo Diversified Capital Builder Fund
Fund expenses (unaudited)
As a shareholder of the Fund, you incur two types of costs: (1) transaction costs, including sales charges (loads) on purchase payments and contingent deferred sales charges (if any) on redemptions and (2) ongoing costs, including management fees, distribution (12b-1) and/or shareholder servicing fees, and other Fund expenses. This example is intended to help you understand your ongoing costs (in dollars) of investing in the Fund and to compare these costs with the ongoing costs of investing in other mutual funds.
The example is based on an investment of $1,000 invested at the beginning of the six-month period and held for the entire period from October 1, 2020 to March 31, 2021.
Actual expenses
The “Actual” line of the table below provides information about actual account values and actual expenses. You may use the information in this line, together with the amount you invested, to estimate the expenses that you paid over the period. Simply divide your account value by $1,000 (for example, an $8,600 account value divided by $1,000 = 8.6), then multiply the result by the number in the “Actual” line under the heading entitled “Expenses paid during period” for your applicable class of shares to estimate the expenses you paid on your account during this period.
Hypothetical example for comparison purposes
The “Hypothetical” line of the table below provides information about hypothetical account values and hypothetical expenses based on the Fund’s actual expense ratio and an assumed rate of return of 5% per year before expenses, which is not the Fund’s actual return. The hypothetical account values and expenses may not be used to estimate the actual ending account balance or expenses you paid for the period. You may use this information to compare the ongoing costs of investing in the Fund and other funds. To do so, compare this 5% hypothetical example with the 5% hypothetical examples that appear in the shareholder reports of the other funds.
Please note that the expenses shown in the table are meant to highlight your ongoing costs only and do not reflect any transactional costs, such as sales charges (loads) and contingent deferred sales charges. Therefore, the “Hypothetical” line of the table is useful in comparing ongoing costs only and will not help you determine the relative total costs of owning different funds. In addition, if these transactional costs were included, your costs would have been higher.
| | Beginning
account value
10-1-2020 | Ending
account value
3-31-2021 | Expenses
paid during
the period1 | Annualized net
expense ratio |
| Class A | | | | |
| Actual | $1,000.00 | $1,136.21 | $5.91 | 1.11% |
| Hypothetical (5% return before expenses) | $1,000.00 | $1,019.40 | $5.59 | 1.11% |
| Class C | | | | |
| Actual | $1,000.00 | $1,131.68 | $9.89 | 1.86% |
| Hypothetical (5% return before expenses) | $1,000.00 | $1,015.66 | $9.35 | 1.86% |
| Administrator Class | | | | |
| Actual | $1,000.00 | $1,135.68 | $5.48 | 1.03% |
| Hypothetical (5% return before expenses) | $1,000.00 | $1,019.80 | $5.19 | 1.03% |
| Institutional Class | | | | |
| Actual | $1,000.00 | $1,137.14 | $4.16 | 0.78% |
| Hypothetical (5% return before expenses) | $1,000.00 | $1,021.04 | $3.93 | 0.78% |
1 Expenses paid is equal to the annualized net expense ratio of each class multiplied by the average account value over the period, multiplied by the number of days in the most recent fiscal half-year divided by the number of days in the fiscal year (to reflect the one-half-year period).
Wells Fargo Diversified Capital Builder Fund | 7
Portfolio of investments—March 31, 2021 (unaudited)
| | | | | Shares | Value |
| Common stocks: 84.79% | | | | | |
| Communication services: 0.83% | | | | | |
| Interactive media & services: 0.36% | | | | | |
| Alphabet Incorporated Class A † | | | | 2,000 | $ 4,125,040 |
| Media: 0.47% | | | | | |
| Comcast Corporation Class A | | | | 100,000 | 5,411,000 |
| Consumer discretionary: 1.06% | | | | | |
| Specialty retail: 1.06% | | | | | |
| The Home Depot Incorporated | | | | 40,000 | 12,210,000 |
| Health care: 32.72% | | | | | |
| Biotechnology: 11.15% | | | | | |
| AbbVie Incorporated | | | | 520,000 | 56,274,400 |
| Alexion Pharmaceuticals Incorporated † | | | | 120,000 | 18,349,200 |
| Amgen Incorporated | | | | 140,000 | 34,833,400 |
| Neurocrine Biosciences Incorporated † | | | | 105,000 | 10,211,250 |
| Vertex Pharmaceuticals Incorporated † | | | | 40,000 | 8,595,600 |
| | | | | | 128,263,850 |
| Health care equipment & supplies: 5.84% | | | | | |
| Abbott Laboratories | | | | 185,000 | 22,170,400 |
| Becton Dickinson & Company | | | | 55,000 | 13,373,250 |
| Danaher Corporation | | | | 140,000 | 31,511,200 |
| ElectroCore LLC † | | | | 30,000 | 61,800 |
| | | | | | 67,116,650 |
| Health care providers & services: 2.79% | | | | | |
| Anthem Incorporated | | | | 35,000 | 12,563,250 |
| McKesson Corporation | | | | 100,000 | 19,504,000 |
| | | | | | 32,067,250 |
| Life sciences tools & services: 4.53% | | | | | |
| Bio-Rad Laboratories Incorporated Class A † | | | | 15,000 | 8,567,550 |
| IQVIA Holdings Incorporated † | | | | 60,000 | 11,588,400 |
| Thermo Fisher Scientific Incorporated | | | | 70,000 | 31,946,600 |
| | | | | | 52,102,550 |
| Pharmaceuticals: 8.41% | | | | | |
| Bausch Health Companies Incorporated † | | | | 540,000 | 17,139,600 |
| Bristol-Myers Squibb Company | | | | 640,000 | 40,403,200 |
| Horizon Therapeutics plc † | | | | 212,000 | 19,512,480 |
| Merck & Company Incorporated | | | | 210,000 | 16,188,900 |
| Merck KGaA ADR | | | | 100,000 | 3,415,000 |
| | | | | | 96,659,180 |
| Industrials: 12.40% | | | | | |
| Aerospace & defense: 2.76% | | | | | |
| Curtiss-Wright Corporation | | | | 45,000 | 5,337,000 |
| L3Harris Technologies Incorporated | | | | 130,000 | 26,348,400 |
| | | | | | 31,685,400 |
The accompanying notes are an integral part of these financial statements.
8 | Wells Fargo Diversified Capital Builder Fund
Portfolio of investments—March 31, 2021 (unaudited)
| | | | | Shares | Value |
| Electrical equipment: 1.61% | | | | | |
| AMETEK Incorporated | | | | 145,000 | $ 18,520,850 |
| Industrial conglomerates: 0.66% | | | | | |
| Honeywell International Incorporated | | | | 35,000 | 7,597,450 |
| Machinery: 4.44% | | | | | |
| IDEX Corporation | | | | 80,000 | 16,745,600 |
| John Bean Technologies Corporation | | | | 160,000 | 21,334,400 |
| The Timken Company | | | | 160,000 | 12,987,200 |
| | | | | | 51,067,200 |
| Professional services: 2.93% | | | | | |
| Leidos Holdings Incorporated | | | | 350,000 | 33,698,000 |
| Information technology: 30.77% | | | | | |
| Electronic equipment, instruments & components: 3.65% | | | | | |
| Amphenol Corporation Class A | | | | 600,000 | 39,582,000 |
| MTS Systems Corporation | | | | 40,000 | 2,328,000 |
| | | | | | 41,910,000 |
| IT services: 3.32% | | | | | |
| Akamai Technologies Incorporated † | | | | 340,000 | 34,646,000 |
| MasterCard Incorporated Class A | | | | 10,000 | 3,560,500 |
| | | | | | 38,206,500 |
| Semiconductors & semiconductor equipment: 14.33% | | | | | |
| Advanced Micro Devices Incorporated † | | | | 181,000 | 14,208,500 |
| Analog Devices Incorporated | | | | 30,000 | 4,652,400 |
| Broadcom Incorporated | | | | 150,000 | 69,549,000 |
| Microchip Technology Incorporated | | | | 200,000 | 31,044,000 |
| Micron Technology Incorporated † | | | | 175,000 | 15,436,750 |
| NVIDIA Corporation | | | | 4,500 | 2,402,685 |
| QUALCOMM Incorporated | | | | 35,000 | 4,640,650 |
| Texas Instruments Incorporated | | | | 75,000 | 14,174,250 |
| Xilinx Incorporated | | | | 70,000 | 8,673,000 |
| | | | | | 164,781,235 |
| Software: 7.35% | | | | | |
| Adobe Incorporated † | | | | 50,000 | 23,768,500 |
| ANSYS Incorporated † | | | | 30,000 | 10,186,800 |
| Microsoft Corporation | | | | 120,000 | 28,292,400 |
| Synopsys Incorporated † | | | | 90,000 | 22,300,200 |
| | | | | | 84,547,900 |
| Technology hardware, storage & peripherals: 2.12% | | | | | |
| Apple Incorporated | | | | 172,000 | 21,009,800 |
| Western Digital Corporation | | | | 50,000 | 3,337,500 |
| | | | | | 24,347,300 |
| Materials: 5.69% | | | | | |
| Chemicals: 2.54% | | | | | |
| Eastman Chemical Company | | | | 90,000 | 9,910,800 |
| Huntsman Corporation | | | | 95,000 | 2,738,850 |
The accompanying notes are an integral part of these financial statements.
Wells Fargo Diversified Capital Builder Fund | 9
Portfolio of investments—March 31, 2021 (unaudited)
| | | | | Shares | Value |
| Chemicals (continued) | | | | | |
| The Sherwin-Williams Company | | | | 20,000 | $ 14,760,200 |
| Tronox Holdings plc Class A | | | | 100,000 | 1,830,000 |
| | | | | | 29,239,850 |
| Containers & packaging: 3.15% | | | | | |
| AptarGroup Incorporated | | | | 76,500 | 10,837,755 |
| Berry Global Group Incorporated † | | | | 395,000 | 24,253,000 |
| Sealed Air Corporation | | | | 25,000 | 1,145,500 |
| | | | | | 36,236,255 |
| Utilities: 1.32% | | | | | |
| Independent power & renewable electricity producers: 1.32% | | | | | |
| Vistra Energy Corporation | | | | 855,000 | 15,116,400 |
| Total Common stocks (Cost $652,852,305) | | | | | 974,909,860 |
| | | Interest
rate | Maturity
date | Principal | |
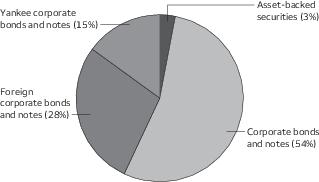
| Corporate bonds and notes: 12.84% | | | | | |
| Consumer discretionary: 0.33% | | | | | |
| Auto components: 0.09% | | | | | |
| Tenneco Incorproated 144A | | 5.13% | 4-15-2029 | $ 1,000,000 | 987,500 |
| Household durables: 0.24% | | | | | |
| Installed Building Company 144A | | 5.75 | 2-1-2028 | 2,700,000 | 2,821,500 |
| Consumer staples: 0.84% | | | | | |
| Food products: 0.31% | | | | | |
| Post Holdings Incorporated 144A | | 4.50 | 9-15-2031 | 3,635,000 | 3,595,015 |
| Household durables: 0.53% | | | | | |
| Spectrum Brands Incorporated 144A | | 3.88 | 3-15-2031 | 6,200,000 | 6,068,250 |
| Health care: 2.88% | | | | | |
| Health care equipment & supplies: 0.47% | | | | | |
| Hologic Incorporated 144A | | 3.25 | 2-15-2029 | 5,440,000 | 5,372,000 |
| Health care providers & services: 2.11% | | | | | |
| AMN Healthcare Incorporated 144A | | 4.00 | 4-15-2029 | 1,000,000 | 995,000 |
| AMN Healthcare Incorporated 144A | | 4.63 | 10-1-2027 | 1,000,000 | 1,022,500 |
| Catalent Pharma Solutions Incorporated 144A | | 3.13 | 2-15-2029 | 1,000,000 | 960,000 |
| Centene Corporation | | 4.63 | 12-15-2029 | 4,500,000 | 4,870,373 |
| Davita Incorporated | | 4.63 | 6-1-2030 | 13,550,000 | 13,805,553 |
| Encompass Health Corporation | | 4.63 | 4-1-2031 | 2,500,000 | 2,587,500 |
| | | | | | 24,240,926 |
| Life sciences tools & services: 0.17% | | | | | |
| Charles River Laboratories Incorporated 144A | | 4.00 | 3-15-2031 | 2,000,000 | 2,033,100 |
| Pharmaceuticals: 0.13% | | | | | |
| Bausch Health Companies Incorporated 144A | | 5.25 | 2-15-2031 | 1,500,000 | 1,492,830 |
The accompanying notes are an integral part of these financial statements.
10 | Wells Fargo Diversified Capital Builder Fund
Portfolio of investments—March 31, 2021 (unaudited)
| | | Interest
rate | Maturity
date | Principal | Value |
| Industrials: 2.33% | | | | | |
| Aerospace & defense: 0.85% | | | | | |
| TransDigm Group Incorporated 144A | | 4.63% | 1-15-2029 | $ 1,000,000 | $ 986,050 |
| TransDigm Group Incorporated | | 6.38 | 6-15-2026 | 7,000,000 | 7,236,250 |
| TransDigm Group Incorporated | | 6.50 | 5-15-2025 | 1,500,000 | 1,528,125 |
| | | | | | 9,750,425 |
| Commercial services & supplies: 0.21% | | | | | |
| ACCO Brands Corporation 144A | | 4.25 | 3-15-2029 | 2,000,000 | 1,945,600 |
| Stericycle Incorporated 144A | | 3.88 | 1-15-2029 | 500,000 | 493,750 |
| | | | | | 2,439,350 |
| Electrical equipment: 0.32% | | | | | |
| Resideo Funding Incorporated 144A | | 6.13 | 11-1-2026 | 723,000 | 761,615 |
| Sensata Technologies BV 144A | | 4.00 | 4-15-2029 | 2,880,000 | 2,931,926 |
| | | | | | 3,693,541 |
| Machinery: 0.95% | | | | | |
| SPX FLOW Incorporated 144A | | 5.88 | 8-15-2026 | 10,500,000 | 10,933,125 |
| Information technology: 2.63% | | | | | |
| Electronic equipment, instruments & components: 0.76% | | | | | |
| TTM Technologies Incorporated 144A | | 4.00 | 3-1-2029 | 8,890,000 | 8,778,875 |
| Semiconductors & semiconductor equipment: 0.67% | | | | | |
| Microchip Technology Incorporated 144A | | 4.25 | 9-1-2025 | 5,000,000 | 5,223,738 |
| Synaptics Incorporated 144A | | 4.00 | 6-15-2029 | 2,500,000 | 2,480,750 |
| | | | | | 7,704,488 |
| Software: 0.36% | | | | | |
| Citrix Systems Incorporated | | 3.30 | 3-1-2030 | 4,000,000 | 4,114,138 |
| Technology hardware, storage & peripherals: 0.84% | | | | | |
| Western Digital Corporation | | 4.75 | 2-15-2026 | 8,700,000 | 9,591,314 |
| Materials: 3.27% | | | | | |
| Chemicals: 2.09% | | | | | |
| Koppers Incorporated 144A | | 6.00 | 2-15-2025 | 8,190,000 | 8,442,170 |
| Olin Corporation | | 5.50 | 8-15-2022 | 1,000,000 | 1,042,500 |
| Tronox Incorporated 144A | | 4.63 | 3-15-2029 | 5,310,000 | 5,316,638 |
| Valvoline Incorporated 144A | | 3.63 | 6-15-2031 | 9,495,000 | 9,186,413 |
| | | | | | 23,987,721 |
| Containers & packaging: 1.18% | | | | | |
| Ball Corporation | | 2.88 | 8-15-2030 | 12,000,000 | 11,559,000 |
| Berry Global Incorporated 144A | | 4.50 | 2-15-2026 | 2,000,000 | 2,050,000 |
| | | | | | 13,609,000 |
The accompanying notes are an integral part of these financial statements.
Wells Fargo Diversified Capital Builder Fund | 11
Portfolio of investments—March 31, 2021 (unaudited)
| | | Interest
rate | Maturity
date | Principal | Value |
| Real estate: 0.47% | | | | | |
| Equity REITs: 0.47% | | | | | |
| Iron Mountain Incorporated 144A | | 4.50% | 2-15-2031 | $ 4,500,000 | $ 4,448,700 |
| SBA Communications Corporation 144A | | 3.13 | 2-1-2029 | 1,000,000 | 961,150 |
| | | | | | 5,409,850 |
| Utilities: 0.09% | | | | | |
| Electric utilities: 0.09% | | | | | |
| NRG Energy Incorporated 144A | | 5.25 | 6-15-2029 | 1,000,000 | 1,070,000 |
| Total Corporate bonds and notes (Cost $146,556,067) | | | | | 147,692,948 |
| Yankee corporate bonds and notes: 2.10% | | | | | |
| Health care: 1.40% | | | | | |
| Pharmaceuticals: 1.40% | | | | | |
| Bausch Health Companies Incorporated 144A | | 5.25 | 1-30-2030 | 16,000,000 | 16,083,200 |
| Information technology: 0.43% | | | | | |
| Technology hardware, storage & peripherals: 0.43% | | | | | |
| Seagate HDD 144A | | 3.13 | 7-15-2029 | 1,500,000 | 1,448,738 |
| Seagate HDD 144A | | 4.09 | 6-1-2029 | 3,488,000 | 3,554,359 |
| | | | | | 5,003,097 |
| Materials: 0.27% | | | | | |
| Chemicals: 0.27% | | | | | |
| Methanex Corporation | | 5.13 | 10-15-2027 | 2,000,000 | 2,045,000 |
| Methanex Corporation | | 5.25 | 12-15-2029 | 1,000,000 | 1,031,435 |
| | | | | | 3,076,435 |
| Total Yankee corporate bonds and notes (Cost $24,187,721) | | | | | 24,162,732 |
| | | Yield | | Shares | |
| Short-term investments: 0.14% | | | | | |
| Investment companies: 0.14% | | | | | |
| Wells Fargo Government Money Market Fund Select Class ♠∞ | | 0.03 | | 1,560,095 | 1,560,095 |
| Total Short-term investments (Cost $1,560,095) | | | | | 1,560,095 |
| Total investments in securities (Cost $825,156,188) | 99.87% | | | | 1,148,325,635 |
| Other assets and liabilities, net | 0.13 | | | | 1,520,378 |
| Total net assets | 100.00% | | | | $1,149,846,013 |
| † | Non-income-earning security |
| 144A | The security may be resold in transactions exempt from registration, normally to qualified institutional buyers, pursuant to Rule 144A under the Securities Act of 1933. |
| ♠ | The issuer of the security is an affiliated person of the Fund as defined in the Investment Company Act of 1940. |
| ∞ | The rate represents the 7-day annualized yield at period end. |
| Abbreviations: |
| ADR | American depositary receipt |
The accompanying notes are an integral part of these financial statements.
12 | Wells Fargo Diversified Capital Builder Fund
Portfolio of investments—March 31, 2021 (unaudited)
Investments in affiliates
An affiliated investment is an investment in which the Fund owns at least 5% of the outstanding voting shares of the issuer or as a result of other relationships, such as the Fund and the issuer having the same investment manager. Transactions with issuers that were either affiliated persons of the Fund at the beginning of the period or the end of the period were as follows:
| | Value,
beginning of
period | Purchases | Sales
proceeds | Net
realized
gains
(losses) | | Net
change in
unrealized
gains
(losses) | | Value,
end of
period | | % of
net
assets | Shares,
end
of period | Income
from
affiliated
securities |
| Short-term investments | | | | | | | | | | | | |
| Investment companies | | | | | | | | | | | | |
| Securities Lending Cash Investments LLC | $ 44,100 | $17,868,450 | $(17,912,550) | $0 | | $0 | | $ 0 | | | 0 | $ 32# |
| Wells Fargo Government Money Market Fund Select Class | 9,255,832 | 87,502,304 | (95,198,041) | 0 | | 0 | | 1,560,095 | | | 1,560,095 | 447 |
| | | | | $0 | | $0 | | $1,560,095 | | 0.14% | | $479 |
| # | Amount shown represents income before fees and rebates. |
The accompanying notes are an integral part of these financial statements.
Wells Fargo Diversified Capital Builder Fund | 13
Statement of assets and liabilities—March 31, 2021 (unaudited)
| | |
| Assets | |
Investments in unaffiliated securities, at value (cost $823,596,093)
| $ 1,146,765,540 |
Investments in affiliated securites, at value (cost $1,560,095)
| 1,560,095 |
Receivable for dividends and interest
| 2,130,609 |
Receivable for investments sold
| 1,055,055 |
Receivable for Fund shares sold
| 653,005 |
Receivable for securities lending income, net
| 261 |
Prepaid expenses and other assets
| 96,514 |
Total assets
| 1,152,261,079 |
| Liabilities | |
Payable for Fund shares redeemed
| 926,884 |
Management fee payable
| 591,665 |
Payable for investments purchased
| 500,083 |
Administration fees payable
| 177,717 |
Distribution fee payable
| 80,898 |
Trustees’ fees and expenses payable
| 2,369 |
Accrued expenses and other liabilities
| 135,450 |
Total liabilities
| 2,415,066 |
Total net assets
| $1,149,846,013 |
| Net assets consist of | |
Paid-in capital
| $ 805,749,983 |
Total distributable earnings
| 344,096,030 |
Total net assets
| $1,149,846,013 |
| Computation of net asset value and offering price per share | |
Net assets – Class A
| $ 662,997,007 |
Shares outstanding – Class A1
| 54,410,447 |
Net asset value per share – Class A
| $12.19 |
Maximum offering price per share – Class A2
| $12.93 |
Net assets – Class C
| $ 129,162,766 |
Shares outstanding – Class C1
| 10,631,062 |
Net asset value per share – Class C
| $12.15 |
Net assets – Administrator Class
| $ 7,735,599 |
Shares outstanding – Administrator Class1
| 634,353 |
Net asset value per share – Administrator Class
| $12.19 |
Net assets – Institutional Class
| $ 349,950,641 |
Shares outstanding – Institutional Class1
| 28,939,225 |
Net asset value per share – Institutional Class
| $12.09 |
| 1 | The Fund has an unlimited number of authorized shares |
| 2 | Maximum offering price is computed as 100/94.25 of net asset value. On investments of $50,000 or more, the offering price is reduced. |
The accompanying notes are an integral part of these financial statements.
14 | Wells Fargo Diversified Capital Builder Fund
Statement of operations—six months ended March 31, 2021 (unaudited)
| | |
| Investment income | |
Dividends (net of foreign withholdings taxes of $13,257)
| $ 7,035,842 |
Interest
| 3,873,971 |
Income from affiliated securities
| 1,731 |
Total investment income
| 10,911,544 |
| Expenses | |
Management fee
| 3,442,195 |
| Administration fees | |
Class A
| 674,531 |
Class C
| 132,600 |
Administrator Class
| 4,629 |
Institutional Class
| 220,935 |
| Shareholder servicing fees | |
Class A
| 803,013 |
Class C
| 157,857 |
Administrator Class
| 8,902 |
| Distribution fee | |
Class C
| 473,572 |
Custody and accounting fees
| 24,191 |
Professional fees
| 25,322 |
Registration fees
| 37,478 |
Shareholder report expenses
| 59,031 |
Trustees’ fees and expenses
| 9,610 |
Other fees and expenses
| 32,747 |
Total expenses
| 6,106,613 |
| Less: Fee waivers and/or expense reimbursements | |
Class A
| (8,551) |
Class C
| (4) |
Administrator Class
| (16) |
Institutional Class
| (3,204) |
Net expenses
| 6,094,838 |
Net investment income
| 4,816,706 |
| Realized and unrealized gains (losses) on investments | |
Net realized gains on investments
| 20,208,353 |
Net change in unrealized gains (losses) on investments
| 115,567,520 |
Net realized and unrealized gains (losses) on investments
| 135,775,873 |
Net increase in net assets resulting from operations
| $140,592,579 |
The accompanying notes are an integral part of these financial statements.
Wells Fargo Diversified Capital Builder Fund | 15
Statement of changes in net assets
| | |
| | Six months ended
March 31, 2021
(unaudited) | Year ended
September 30, 2020 |
| Operations | | | | |
Net investment income
| | $ 4,816,706 | | $ 11,843,245 |
Net realized gains on investments
| | 20,208,353 | | 10,794,415 |
Net change in unrealized gains (losses) on investments
| | 115,567,520 | | 42,479,631 |
Net increase in net assets resulting from operations
| | 140,592,579 | | 65,117,291 |
| Distributions to shareholders from | | | | |
| Net investment income and net realized gains | | | | |
Class A
| | (9,041,533) | | (32,619,920) |
Class C
| | (1,449,746) | | (5,629,511) |
Administrator Class
| | (103,487) | | (491,553) |
Institutional Class
| | (5,363,897) | | (20,579,220) |
Total distributions to shareholders
| | (15,958,663) | | (59,320,204) |
| Capital share transactions | Shares | | Shares | |
| Proceeds from shares sold | | | | |
Class A
| 1,895,579 | 22,342,121 | 3,965,389 | 41,907,199 |
Class C
| 684,418 | 8,098,523 | 2,956,606 | 30,937,431 |
Administrator Class
| 82,799 | 978,213 | 151,606 | 1,529,330 |
Institutional Class
| 2,308,247 | 27,027,439 | 7,957,364 | 82,460,036 |
| | | 58,446,296 | | 156,833,996 |
| Reinvestment of distributions | | | | |
Class A
| 733,265 | 8,627,439 | 3,027,088 | 31,259,543 |
Class C
| 121,718 | 1,425,486 | 523,869 | 5,421,139 |
Administrator Class
| 8,709 | 102,599 | 47,212 | 487,564 |
Institutional Class
| 419,082 | 4,900,417 | 1,851,509 | 18,977,296 |
| | | 15,055,941 | | 56,145,542 |
| Payment for shares redeemed | | | | |
Class A
| (3,562,771) | (41,825,732) | (9,176,945) | (93,301,844) |
Class C
| (1,406,237) | (16,432,052) | (3,315,378) | (33,616,928) |
Administrator Class
| (47,776) | (568,941) | (513,380) | (5,090,942) |
Institutional Class
| (3,362,096) | (39,019,323) | (14,006,603) | (140,839,941) |
| | | (97,846,048) | | (272,849,655) |
Net decrease in net assets resulting from capital share transactions
| | (24,343,811) | | (59,870,117) |
Total increase (decrease) in net assets
| | 100,290,105 | | (54,073,030) |
| Net assets | | | | |
Beginning of period
| | 1,049,555,908 | | 1,103,628,938 |
End of period
| | $1,149,846,013 | | $1,049,555,908 |
The accompanying notes are an integral part of these financial statements.
16 | Wells Fargo Diversified Capital Builder Fund
Financial highlights
(For a share outstanding throughout each period)
| | | Year ended September 30 |
| Class A | Six months ended
March 31, 2021
(unaudited) | 2020 | 2019 | 2018 | 2017 | 2016 |
Net asset value, beginning of period
| $10.88 | $10.71 | $10.88 | $10.30 | $9.96 | $9.12 |
Net investment income
| 0.05 | 0.11 | 0.14 | 0.10 | 0.14 1 | 0.17 |
Net realized and unrealized gains on investments
| 1.42 | 0.63 | 0.37 | 1.06 | 1.12 | 1.71 |
Total from investment operations
| 1.47 | 0.74 | 0.51 | 1.16 | 1.26 | 1.88 |
| Distributions to shareholders from | | | | | | |
Net investment income
| (0.06) | (0.13) | (0.14) | (0.09) | (0.14) | (0.15) |
Net realized gains
| (0.10) | (0.44) | (0.54) | (0.49) | (0.78) | (0.89) |
Total distributions to shareholders
| (0.16) | (0.57) | (0.68) | (0.58) | (0.92) | (1.04) |
Net asset value, end of period
| $12.19 | $10.88 | $10.71 | $10.88 | $10.30 | $9.96 |
Total return2
| 13.62% | 7.26% | 5.60% | 11.72% | 13.62% | 22.85% |
| Ratios to average net assets (annualized) | | | | | | |
Gross expenses
| 1.11% | 1.11% | 1.12% | 1.11% | 1.12% | 1.14% |
Net expenses
| 1.11% | 1.11% | 1.12% | 1.11% | 1.12% | 1.14% |
Net investment income
| 0.85% | 1.09% | 1.38% | 0.96% | 1.43% | 1.77% |
| Supplemental data | | | | | | |
Portfolio turnover rate
| 12% | 44% | 61% | 31% | 54% | 73% |
Net assets, end of period (000s omitted)
| $662,997 | $601,951 | $616,346 | $574,760 | $551,272 | $467,503 |
| 1 | Calculated based upon average shares outstanding |
| 2 | Total return calculations do not include any sales charges. Returns for periods of less than one year are not annualized. |
The accompanying notes are an integral part of these financial statements.
Wells Fargo Diversified Capital Builder Fund | 17
Financial highlights
(For a share outstanding throughout each period)
| | | Year ended September 30 |
| Class C | Six months ended
March 31, 2021
(unaudited) | 2020 | 2019 | 2018 | 2017 | 2016 |
Net asset value, beginning of period
| $10.86 | $10.69 | $10.86 | $10.28 | $9.96 | $9.12 |
Net investment income
| 0.00 1 | 0.03 | 0.06 | 0.02 | 0.08 | 0.10 |
Net realized and unrealized gains on investments
| 1.42 | 0.63 | 0.37 | 1.06 | 1.11 | 1.72 |
Total from investment operations
| 1.42 | 0.66 | 0.43 | 1.08 | 1.19 | 1.82 |
| Distributions to shareholders from | | | | | | |
Net investment income
| (0.03) | (0.05) | (0.06) | (0.01) | (0.09) | (0.09) |
Net realized gains
| (0.10) | (0.44) | (0.54) | (0.49) | (0.78) | (0.89) |
Total distributions to shareholders
| (0.13) | (0.49) | (0.60) | (0.50) | (0.87) | (0.98) |
Net asset value, end of period
| $12.15 | $10.86 | $10.69 | $10.86 | $10.28 | $9.96 |
Total return2
| 13.17% | 6.44% | 4.81% | 10.88% | 12.85% | 21.96% |
| Ratios to average net assets (annualized) | | | | | | |
Gross expenses
| 1.86% | 1.86% | 1.87% | 1.87% | 1.87% | 1.89% |
Net expenses
| 1.86% | 1.86% | 1.87% | 1.87% | 1.87% | 1.89% |
Net investment income
| 0.10% | 0.34% | 0.65% | 0.21% | 0.65% | 1.03% |
| Supplemental data | | | | | | |
Portfolio turnover rate
| 12% | 44% | 61% | 31% | 54% | 73% |
Net assets, end of period (000s omitted)
| $129,163 | $121,947 | $118,297 | $131,601 | $117,346 | $67,630 |
| 1 | Amount is less than $0.005. |
| 2 | Total return calculations do not include any sales charges. Returns for periods of less than one year are not annualized. |
The accompanying notes are an integral part of these financial statements.
18 | Wells Fargo Diversified Capital Builder Fund
Financial highlights
(For a share outstanding throughout each period)
| | | Year ended September 30 |
| Administrator Class | Six months ended
March 31, 2021
(unaudited) | 2020 | 2019 | 2018 | 2017 | 2016 |
Net asset value, beginning of period
| $10.89 | $10.72 | $10.89 | $10.32 | $9.97 | $9.12 |
Net investment income
| 0.05 1 | 0.12 1 | 0.15 1 | 0.11 1 | 0.16 1 | 0.18 1 |
Net realized and unrealized gains on investments
| 1.42 | 0.63 | 0.37 | 1.06 | 1.12 | 1.73 |
Total from investment operations
| 1.47 | 0.75 | 0.52 | 1.17 | 1.28 | 1.91 |
| Distributions to shareholders from | | | | | | |
Net investment income
| (0.07) | (0.14) | (0.15) | (0.11) | (0.15) | (0.17) |
Net realized gains
| (0.10) | (0.44) | (0.54) | (0.49) | (0.78) | (0.89) |
Total distributions to shareholders
| (0.17) | (0.58) | (0.69) | (0.60) | (0.93) | (1.06) |
Net asset value, end of period
| $12.19 | $10.89 | $10.72 | $10.89 | $10.32 | $9.97 |
Total return2
| 13.57% | 7.33% | 5.67% | 11.73% | 13.75% | 23.14% |
| Ratios to average net assets (annualized) | | | | | | |
Gross expenses
| 1.03% | 1.03% | 1.04% | 1.03% | 1.04% | 1.06% |
Net expenses
| 1.03% | 1.03% | 1.04% | 1.03% | 1.04% | 1.03% |
Net investment income
| 0.93% | 1.19% | 1.47% | 1.04% | 1.58% | 1.89% |
| Supplemental data | | | | | | |
Portfolio turnover rate
| 12% | 44% | 61% | 31% | 54% | 73% |
Net assets, end of period (000s omitted)
| $7,736 | $6,429 | $9,708 | $13,821 | $10,225 | $21,398 |
| 1 | Calculated based upon average shares outstanding |
| 2 | Returns for periods of less than one year are not annualized. |
The accompanying notes are an integral part of these financial statements.
Wells Fargo Diversified Capital Builder Fund | 19
Financial highlights
(For a share outstanding throughout each period)
| | | Year ended September 30 |
| Institutional Class | Six months ended
March 31, 2021
(unaudited) | 2020 | 2019 | 2018 | 2017 | 2016 |
Net asset value, beginning of period
| $10.79 | $10.64 | $10.81 | $10.25 | $9.90 | $9.07 |
Net investment income
| 0.07 | 0.14 | 0.18 | 0.14 | 0.19 | 0.20 |
Net realized and unrealized gains on investments
| 1.41 | 0.62 | 0.36 | 1.05 | 1.11 | 1.71 |
Total from investment operations
| 1.48 | 0.76 | 0.54 | 1.19 | 1.30 | 1.91 |
| Distributions to shareholders from | | | | | | |
Net investment income
| (0.08) | (0.17) | (0.17) | (0.14) | (0.17) | (0.19) |
Net realized gains
| (0.10) | (0.44) | (0.54) | (0.49) | (0.78) | (0.89) |
Total distributions to shareholders
| (0.18) | (0.61) | (0.71) | (0.63) | (0.95) | (1.08) |
Net asset value, end of period
| $12.09 | $10.79 | $10.64 | $10.81 | $10.25 | $9.90 |
Total return1
| 13.71% | 7.48% | 5.98% | 12.04% | 14.11% | 23.28% |
| Ratios to average net assets (annualized) | | | | | | |
Gross expenses
| 0.78% | 0.78% | 0.79% | 0.79% | 0.79% | 0.81% |
Net expenses
| 0.78% | 0.78% | 0.78% | 0.78% | 0.78% | 0.78% |
Net investment income
| 1.18% | 1.42% | 1.73% | 1.30% | 1.71% | 2.14% |
| Supplemental data | | | | | | |
Portfolio turnover rate
| 12% | 44% | 61% | 31% | 54% | 73% |
Net assets, end of period (000s omitted)
| $349,951 | $319,229 | $359,278 | $326,283 | $262,754 | $122,769 |
| 1 | Returns for periods of less than one year are not annualized. |
The accompanying notes are an integral part of these financial statements.
20 | Wells Fargo Diversified Capital Builder Fund
Notes to financial statements (unaudited)
1. ORGANIZATION
Wells Fargo Funds Trust (the "Trust"), a Delaware statutory trust organized on March 10, 1999, is an open-end management investment company registered under the Investment Company Act of 1940, as amended (the "1940 Act"). As an investment company, the Trust follows the accounting and reporting guidance in Financial Accounting Standards Board (“FASB”) Accounting Standards Codification Topic 946, Financial Services – Investment Companies. These financial statements report on the Wells Fargo Diversified Capital Builder Fund (the "Fund") which is a diversified series of the Trust.
On February 23, 2021, Wells Fargo & Company announced that it has entered into a definitive agreement to sell Wells Fargo Asset Management ("WFAM") to GTCR LLC and Reverence Capital Partners, L.P. WFAM is the trade name used by the asset management businesses of Wells Fargo & Company and includes Wells Fargo Funds Management, LLC, the investment manager to the Fund, Wells Capital Management Incorporated and Wells Fargo Asset Management (International) Limited, both registered investment advisers providing sub-advisory services to certain funds, and Wells Fargo Funds Distributor, LLC, the Fund's principal underwriter. As part of the transaction, Wells Fargo & Company will own a 9.9% equity interest and will continue to serve as an important client and distribution partner. The transaction is expected to close in the second half of 2021, subject to customary closing conditions.
Consummation of the transaction will result in the automatic termination of the Fund's investment management agreement and sub-advisory agreement. The Fund's Board of Trustees will be asked to approve new investment management arrangements with the new company. If approved by the Board, the new investment management arrangements with the new company will be presented to the shareholders of the Fund for approval, and, if approved by shareholders, would take effect upon the closing of the transaction. The transaction is expected to close in the second half of 2021, subject to customary closing conditions.
2. SIGNIFICANT ACCOUNTING POLICIES
The following significant accounting policies, which are consistently followed in the preparation of the financial statements of the Fund, are in conformity with U.S. generally accepted accounting principles which require management to make estimates and assumptions that affect the reported amounts of assets and liabilities, disclosure of contingent assets and liabilities at the date of the financial statements, and the reported amounts of income and expenses during the reporting period. Actual results could differ from those estimates.
Securities valuation
All investments are valued each business day as of the close of regular trading on the New York Stock Exchange (generally 4 p.m. Eastern Time), although the Fund may deviate from this calculation time under unusual or unexpected circumstances.
Equity securities that are listed on a foreign or domestic exchange or market are valued at the official closing price or, if none, the last sales price. If no sale occurs on the principal exchange or market that day, a fair value price will be determined in accordance with the Fund’s Valuation Procedures.
Debt securities are valued at the evaluated bid price provided by an independent pricing service (e.g. taking into account various factors, including yields, maturities, or credit ratings) or, if a reliable price is not available, the quoted bid price from an independent broker-dealer.
Investments in registered open-end investment companies are valued at net asset value. Interests in non-registered investment companies that are redeemable at net asset value are fair valued normally at net asset value.
Investments which are not valued using any of the methods discussed above are valued at their fair value, as determined in good faith by the Board of Trustees. The Board of Trustees has established a Valuation Committee comprised of the Trustees and has delegated to it the authority to take any actions regarding the valuation of portfolio securities that the Valuation Committee deems necessary or appropriate, including determining the fair value of portfolio securities, unless the determination has been delegated to the Wells Fargo Asset Management Pricing Committee at Wells Fargo Funds Management, LLC ("Funds Management"). The Board of Trustees retains the authority to make or ratify any valuation decisions or approve any changes to the Valuation Procedures as it deems appropriate. On a quarterly basis, the Board of Trustees receives reports on any valuation actions taken by the Valuation Committee or the Wells Fargo Asset Management Pricing Committee which may include items for ratification.
Securities lending
The Fund may lend its securities from time to time in order to earn additional income in the form of fees or interest on securities received as collateral or the investment of any cash received as collateral. When securities are on loan, the Fund receives interest or dividends on those securities. Cash collateral received in connection with its securities lending transactions
Wells Fargo Diversified Capital Builder Fund | 21
Notes to financial statements (unaudited)
is invested in Securities Lending Cash Investments, LLC (the "Securities Lending Fund"). Investments in Securities Lending Fund are valued at the evaluated bid price provided by an independent pricing service. Income earned from investment in the Securities Lending Fund (net of fees and rebates), if any, is included in income from affiliated securities on the Statement of Operations.
In a securities lending transaction, the net asset value of the Fund is affected by an increase or decrease in the value of the securities loaned and by an increase or decrease in the value of the instrument in which collateral is invested. The amount of securities lending activity undertaken by the Fund fluctuates from time to time. The Fund has the right under the lending agreement to recover the securities from the borrower on demand. In the event of default or bankruptcy by the borrower, the Fund may be prevented from recovering the loaned securities or gaining access to the collateral or may experience delays or costs in doing so. In such an event, the terms of the agreement allow the unaffiliated securities lending agent to use the collateral to purchase replacement securities on behalf of the Fund or pay the Fund the market value of the loaned securities. The Fund bears the risk of loss with respect to depreciation of its investment of the cash collateral.
When-issued transactions
The Fund may purchase securities on a forward commitment or when-issued basis. The Fund records a when-issued transaction on the trade date and will segregate assets in an amount at least equal in value to the Fund's commitment to purchase when-issued securities. Securities purchased on a when-issued basis are marked-to-market daily and the Fund begins earning interest on the settlement date. Losses may arise due to changes in the market value of the underlying securities or if the counterparty does not perform under the contract.
Security transactions and income recognition
Securities transactions are recorded on a trade date basis. Realized gains or losses are recorded on the basis of identified cost.
Dividend income is recognized on the ex-dividend date.
Interest income is accrued daily and bond discounts are accreted and premiums are amortized daily. To the extent debt obligations are placed on non-accrual status, any related interest income may be reduced by writing off interest receivables when the collection of all or a portion of interest has been determined to be doubtful based on consistently applied procedures and the fair value has decreased. If the issuer subsequently resumes interest payments or when the collectability of interest is reasonably assured, the debt obligation is removed from non-accrual status.
Income is recorded net of foreign taxes withheld where recovery of such taxes is not assured.
Distributions to shareholders
Distributions to shareholders are recorded on the ex-dividend date and paid from net investment income quarterly and any net realized gains are paid at least annually. Such distributions are determined in accordance with income tax regulations and may differ from U.S. generally accepted accounting principles. Dividend sources are estimated at the time of declaration. The tax character of distributions is determined as of the Fund's fiscal year end. Therefore, a portion of the Fund's distributions made prior to the Fund’s fiscal year end may be categorized as a tax return of capital at year end.
Federal and other taxes
The Fund intends to continue to qualify as a regulated investment company by distributing substantially all of its investment company taxable income and any net realized capital gains (after reduction for capital loss carryforwards) sufficient to relieve it from all, or substantially all, federal income taxes. Accordingly, no provision for federal income taxes was required.
The Fund’s income and federal excise tax returns and all financial records supporting those returns for the prior three fiscal years are subject to examination by the federal and Delaware revenue authorities. Management has analyzed the Fund's tax positions taken on federal, state, and foreign tax returns for all open tax years and does not believe that there are any uncertain tax positions that require recognition of a tax liability.
As of March 31, 2021, the aggregate cost of all investments for federal income tax purposes was $617,659,121 and the unrealized gains (losses) consisted of:
| Gross unrealized gains | $570,994,598 |
| Gross unrealized losses | (40,328,084) |
| Net unrealized gains | $530,666,514 |
22 | Wells Fargo Diversified Capital Builder Fund
Notes to financial statements (unaudited)
Class allocations
The separate classes of shares offered by the Fund differ principally in applicable sales charges, distribution, shareholder servicing, and administration fees. Class specific expenses are charged directly to that share class. Investment income, common fund-level expenses, and realized and unrealized gains (losses) on investments are allocated daily to each class of shares based on the relative proportion of net assets of each class.
3. FAIR VALUATION MEASUREMENTS
Fair value measurements of investments are determined within a framework that has established a fair value hierarchy based upon the various data inputs utilized in determining the value of the Fund’s investments. The three-level hierarchy gives the highest priority to unadjusted quoted prices in active markets for identical assets or liabilities (Level 1) and the lowest priority to unobservable inputs (Level 3). The Fund’s investments are classified within the fair value hierarchy based on the lowest level of input that is significant to the fair value measurement. The inputs are summarized into three broad levels as follows:
| ■ | Level 1 – quoted prices in active markets for identical securities |
| ■ | Level 2 – other significant observable inputs (including quoted prices for similar securities, interest rates, prepayment speeds, credit risk, etc.) |
| ■ | Level 3 – significant unobservable inputs (including the Fund’s own assumptions in determining the fair value of investments) |
The inputs or methodologies used for valuing investments in securities are not necessarily an indication of the risk associated with investing in those securities.
The following is a summary of the inputs used in valuing the Fund’s assets and liabilities as of March 31, 2021:
| | Quoted prices
(Level 1) | Other significant
observable inputs
(Level 2) | Significant
unobservable inputs
(Level 3) | Total |
| Assets | | | | |
| Investments in: | | | | |
| Common stocks | | | | |
| Communication services | $ 9,536,040 | $ 0 | $0 | $ 9,536,040 |
| Consumer discretionary | 12,210,000 | 0 | 0 | 12,210,000 |
| Health care | 376,209,480 | 0 | 0 | 376,209,480 |
| Industrials | 142,568,900 | 0 | 0 | 142,568,900 |
| Information technology | 353,792,935 | 0 | 0 | 353,792,935 |
| Materials | 65,476,105 | 0 | 0 | 65,476,105 |
| Utilities | 15,116,400 | 0 | 0 | 15,116,400 |
| Corporate bonds and notes | 0 | 147,692,948 | 0 | 147,692,948 |
| Yankee corporate bonds and notes | 0 | 24,162,732 | 0 | 24,162,732 |
| Short-term investments | | | | |
| Investment companies | 1,560,095 | 0 | 0 | 1,560,095 |
| Total assets | $976,469,955 | $171,855,680 | $0 | $1,148,325,635 |
Additional sector, industry or geographic detail, if any, is included in the Portfolio of Investments.
For the six months ended March 31, 2021, the Fund did not have any transfers into/out of Level 3.
4. TRANSACTIONS WITH AFFILIATES
Management fee
Funds Management, an indirect wholly owned subsidiary of Wells Fargo & Company ("Wells Fargo"), is the manager of the Fund and provides advisory and fund-level administrative services under an investment management agreement. Under the investment management agreement, Funds Management is responsible for, among other services, implementing the investment objectives and strategies of the Fund, supervising the subadviser and providing fund-level administrative services in connection with the Fund’s operations. As compensation for its services under the investment management agreement, Funds Management is entitled to receive a management fee at the following annual rate based on the Fund’s average daily net assets:
Wells Fargo Diversified Capital Builder Fund | 23
Notes to financial statements (unaudited)
| Average daily net assets | Management fee |
| First $500 million | 0.650% |
| Next $500 million | 0.600 |
| Next $2 billion | 0.550 |
| Next $2 billion | 0.525 |
| Next $5 billion | 0.490 |
| Over $10 billion | 0.480 |
For the six months ended March 31, 2021, the management fee was equivalent to an annual rate of 0.62% of the Fund’s average daily net assets.
Funds Management has retained the services of a subadviser to provide daily portfolio management to the Fund. The fee for subadvisory services is borne by Funds Management. Wells Capital Management Incorporated ("WellsCap"), an affiliate of Funds Management and an indirect wholly owned subsidiary of Wells Fargo, is the subadviser to the Fund and is entitled to receive a fee from Funds Management at an annual rate starting at 0.35% and declining to 0.20% as the average daily net assets of the Fund increase.
Administration fees
Under a class-level administration agreement, Funds Management provides class-level administrative services to the Fund, which includes paying fees and expenses for services provided by the transfer agent, sub-transfer agents, omnibus account servicers and record-keepers. As compensation for its services under the class-level administration agreement, Funds Management receives an annual fee which is calculated based on the average daily net assets of each class as follows:
| | Class-level
administration fee |
| Class A | 0.21% |
| Class C | 0.21 |
| Administrator Class | 0.13 |
| Institutional Class | 0.13 |
Waivers and/or expense reimbursements
Funds Management has contractually waived and/or reimbursed management and administration fees to the extent necessary to maintain certain net operating expense ratios for the Fund. When each class of the Fund has exceeded its expense cap, Funds Management has waived fees and/or reimbursed expenses from fund-level expenses on a proportionate basis and then from class specific expenses. When only certain classes exceed their expense caps, waivers and/or reimbursements are applied against class specific expenses before fund-level expenses. Funds Management has committed through January 31, 2022 to waive fees and/or reimburse expenses to the extent necessary to cap expenses. Prior to or after the commitment expiration date, the cap may be increased or the commitment to maintain the cap may be terminated only with the approval of the Board of Trustees. The contractual expense caps are as follows:
| | Expense ratio caps |
| Class A | 1.13% |
| Class C | 1.88 |
| Administrator Class | 1.05 |
| Institutional Class | 0.78 |
Distribution fee
The Trust has adopted a distribution plan for Class C shares of the Fund pursuant to Rule 12b-1 under the 1940 Act. A distribution fee is charged charged to Class C shares and paid to Wells Fargo Funds Distributor, LLC ("Funds Distributor"), the principal underwriter, at an annual rate of 0.75% of the average daily net assets of Class C shares.
24 | Wells Fargo Diversified Capital Builder Fund
Notes to financial statements (unaudited)
In addition, Funds Distributor is entitled to receive the front-end sales charge from the purchase of Class A shares and a contingent deferred sales charge on the redemption of certain Class A shares. Funds Distributor is also entitled to receive the contingent deferred sales charges from redemptions of Class C shares. For the six months ended March 31, 2021, Funds Distributor received $21,608 from the sale of Class A shares and $42 in contingent deferred sales charges from redemptions of Class C shares. Funds Distributor did not receive any contingent deferred sales charges from Class A for the six months ended March 31, 2021.
Shareholder servicing fees
The Trust has entered into contracts with one or more shareholder servicing agents, whereby Class A, Class C, and Administrator Class of the Fund are charged a fee at an annual rate of 0.25% of the average daily net assets of each respective class. A portion of these total shareholder servicing fees were paid to affiliates of Wells Fargo.
Interfund transactions
The Fund may purchase or sell portfolio investment securities to certain other Wells Fargo affiliates pursuant to Rule 17a-7 under the 1940 Act and under procedures adopted by the Board of Trustees. The procedures have been designed to ensure that these interfund transactions, which do not incur broker commissions, are effected at current market prices.
5. INVESTMENT PORTFOLIO TRANSACTIONS
Purchases and sales of investments, excluding U.S. government obligations (if any) and short-term securities, for the six months ended March 31, 2021 were $135,828,808 and $175,387,334, respectively.
6. SECURITIES LENDING TRANSACTIONS
The Fund lends its securities through an unaffiliated securities lending agent and receives collateral in the form of cash or securities with a value at least equal to the value of the securities on loan. The value of the loaned securities is determined at the close of each business day and any increases or decreases in the required collateral are exchanged between the Fund and the counterparty on the next business day. Cash collateral received is invested in the Securities Lending Fund which seeks to provide a positive return compared to the daily Federal Funds Open Rate by investing in high-quality, U.S. dollar-denominated short-term money market instruments and is exempt from registration under Section 3(c)(7) of the 1940 Act. Securities Lending Fund is managed by Funds Management and is subadvised by WellsCap. Funds Management receives an advisory fee starting at 0.05% and declining to 0.01% as the average daily net assets of the Securities Lending Fund increase. All of the fees received by Funds Management are paid to WellsCap for its services as subadviser.
In the event of counterparty default or the failure of a borrower to return a loaned security, the Fund has the right to use the collateral to offset any losses incurred. As of March 31, 2021, the Fund did not have any securities on loan.
7. BANK BORROWINGS
The Trust (excluding the money market funds), Wells Fargo Master Trust and Wells Fargo Variable Trust are parties to a $350,000,000 revolving credit agreement whereby the Fund is permitted to use bank borrowings for temporary or emergency purposes, such as to fund shareholder redemption requests. Interest under the credit agreement is charged to the Fund based on a borrowing rate equal to the higher of the Federal Funds rate in effect on that day plus 1.25% or the overnight LIBOR rate in effect on that day plus 1.25%. In addition, an annual commitment fee equal to 0.25% of the unused balance is allocated to each participating fund.
For the six months ended March 31, 2021, there were no borrowings by the Fund under the agreement.
8. CONCENTRATION RISKS
As of the end of the period, the Fund concentrated its portfolio of investments in the health care and information technology sectors. A fund that invests a substantial portion of its assets in any sector may be more affected by changes in that sector than would be a fund whose investments are not heavily weighted in any sector.
9. INDEMNIFICATION
Under the Fund's organizational documents, the officers and Trustees have been granted certain indemnification rights against certain liabilities that may arise out of performance of their duties to the Fund. The Fund has entered into a separate agreement with each Trustee that converts indemnification rights currently existing under the Fund’s organizational documents into contractual rights that cannot be changed in the future without the consent of the Trustee. Additionally, in the normal course of business, the Fund may enter into contracts with service providers that contain a variety of indemnification
Wells Fargo Diversified Capital Builder Fund | 25
Notes to financial statements (unaudited)
clauses. The Fund’s maximum exposure under these arrangements is dependent on future claims that may be made against the Fund and, therefore, cannot be estimated.
10. CORONAVIRUS (COVID-19) PANDEMIC
On March 11, 2020, the World Health Organization announced that it had made the assessment that coronavirus disease 2019 (“COVID-19”) is a pandemic. The impacts of COVID-19 are affecting the entire global economy, individual companies and investment products, the funds, and the market in general. There is significant uncertainty around the extent and duration of business disruptions related to COVID-19 and the impacts may last for an extended period of time. COVID-19 has led to significant uncertainty and volatility in the financial markets.
26 | Wells Fargo Diversified Capital Builder Fund
Other information (unaudited)
PROXY VOTING INFORMATION
A description of the policies and procedures used to determine how to vote proxies relating to portfolio securities is available without charge, upon request, by calling 1-800-222-8222, visiting our website at wfam.com, or visiting the SEC website at sec.gov. Information regarding how the proxies related to portfolio securities were voted during the most recent 12-month period ended June 30 is available on the website at wfam.com or by visiting the SEC website at sec.gov.
QUARTERLY PORTFOLIO HOLDINGS INFORMATION
The Fund files its complete schedule of portfolio holdings with the SEC for the first and third quarters of each fiscal year as an exhibit to its reports on Form N-PORT. Shareholders may view the filed Form N-PORT by visiting the SEC website at sec.gov.
Wells Fargo Diversified Capital Builder Fund | 27
Other information (unaudited)
BOARD OF TRUSTEES AND OFFICERS
Each of the Trustees and Officers listed in the table below acts in identical capacities for each fund in the Wells Fargo family of funds, which consists of 142 mutual funds comprising the Wells Fargo Funds Trust, Wells Fargo Variable Trust, Wells Fargo Master Trust and four closed-end funds (collectively the “Fund Complex”). This table should be read in conjunction with the Prospectus and the Statement of Additional Information1. The mailing address of each Trustee and Officer is 525 Market Street, 12th Floor, San Francisco, CA 94105. Each Trustee and Officer serves an indefinite term, however, each Trustee serves such term until reaching the mandatory retirement age established by the Trustees.
Independent Trustees
Name and
year of birth | Position held and
length of service* | Principal occupations during past five years or longer | Current other
public company or
investment
company
directorships |
William R. Ebsworth
(Born 1957) | Trustee,
since 2015 | Retired. From 1984 to 2013, equities analyst, portfolio manager, research director and chief investment officer at Fidelity Management and Research Company in Boston, Tokyo, and Hong Kong, and retired in 2013 as Chief Investment Officer of Fidelity Strategic Advisers, Inc. where he led a team of investment professionals managing client assets. Prior thereto, Board member of Hong Kong Securities Clearing Co., Hong Kong Options Clearing Corp., the Thailand International Fund, Ltd., Fidelity Investments Life Insurance Company, and Empire Fidelity Investments Life Insurance Company. Audit Committee Chair and Investment Committee Chair of the Vincent Memorial Hospital Endowment (non-profit organization). Mr. Ebsworth is a CFA® charterholder. | N/A |
Jane A. Freeman
(Born 1953) | Trustee,
since 2015;
Chair Liaison,
since 2018 | Retired. From 2012 to 2014 and 1999 to 2008, Chief Financial Officer of Scientific Learning Corporation. From 2008 to 2012, Ms. Freeman provided consulting services related to strategic business projects. Prior to 1999, Portfolio Manager at Rockefeller & Co. and Scudder, Stevens & Clark. Board member of the Harding Loevner Funds from 1996 to 2014, serving as both Lead Independent Director and chair of the Audit Committee. Board member of the Russell Exchange Traded Funds Trust from 2011 to 2012 and the chair of the Audit Committee. Ms. Freeman is also an inactive Chartered Financial Analyst. | N/A |
Isaiah Harris, Jr.
(Born 1952) | Trustee,
since 2009; Audit
Committee
Chair,
since 2019 | Retired. Chairman of the Board of CIGNA Corporation since 2009, and Director since 2005. From 2003 to 2011, Director of Deluxe Corporation. Prior thereto, President and CEO of BellSouth Advertising and Publishing Corp. from 2005 to 2007, President and CEO of BellSouth Enterprises from 2004 to 2005 and President of BellSouth Consumer Services from 2000 to 2003. Emeritus member of the Iowa State University Foundation Board of Governors. Emeritus Member of the Advisory Board of Iowa State University School of Business. Advisory Board Member, Palm Harbor Academy (private school). Mr. Harris is a certified public accountant (inactive status). | CIGNA Corporation |
Judith M. Johnson
(Born 1949) | Trustee,
since 2008 | Retired. Prior thereto, Chief Executive Officer and Chief Investment Officer of Minneapolis Employees Retirement Fund from 1996 to 2008. Ms. Johnson is an attorney, certified public accountant and a certified managerial accountant. | N/A |
David F. Larcker
(Born 1950) | Trustee,
since 2009 | James Irvin Miller Professor of Accounting at the Graduate School of Business (Emeritus), Stanford University, Director of the Corporate Governance Research Initiative and Senior Faculty of The Rock Center for Corporate Governance since 2006. From 2005 to 2008, Professor of Accounting at the Graduate School of Business, Stanford University. Prior thereto, Ernst & Young Professor of Accounting at The Wharton School, University of Pennsylvania from 1985 to 2005. | N/A |
28 | Wells Fargo Diversified Capital Builder Fund
Other information (unaudited)
Name and
year of birth | Position held and
length of service* | Principal occupations during past five years or longer | Current other
public company or
investment
company
directorships |
Olivia S. Mitchell
(Born 1953) | Trustee,
since 2006;
Nominating and
Governance
Committee Chair,
since 2018 | International Foundation of Employee Benefit Plans Professor, Wharton School of the University of Pennsylvania since 1993. Director of Wharton’s Pension Research Council and Boettner Center on Pensions & Retirement Research, and Research Associate at the National Bureau of Economic Research. Previously, Cornell University Professor from 1978 to 1993. | N/A |
Timothy J. Penny
(Born 1951) | Trustee,
since 1996;
Chair,
since 2018 | President and Chief Executive Officer of Southern Minnesota Initiative Foundation, a non-profit organization, since 2007. Member of the Board of Trustees of NorthStar Education Finance, Inc., a non-profit organization, since 2007. | N/A |
James G. Polisson
(Born 1959) | Trustee,
since 2018 | Retired. Chief Marketing Officer, Source (ETF) UK Services, Ltd, from 2015 to 2017. From 2012 to 2015, Principal of The Polisson Group, LLC, a management consulting, corporate advisory and principal investing company. Chief Executive Officer and Managing Director at Russell Investments, Global Exchange Traded Funds from 2010 to 2012. Managing Director of Barclays Global Investors from 1998 to 2010 and Global Chief Marketing Officer for iShares and Barclays Global Investors from 2000 to 2010. Trustee of the San Francisco Mechanics’ Institute, a non-profit organization, from 2013 to 2015. Board member of the Russell Exchange Traded Fund Trust from 2011 to 2012. Director of Barclays Global Investors Holdings Deutschland GmbH from 2006 to 2009. Mr. Polisson is an attorney and has a retired status with the Massachusetts and District of Columbia Bar Associations. | N/A |
Pamela Wheelock
(Born 1959) | Trustee,
since January
2020; previously
Trustee from
January 2018 to
July 2019 | Board member of the Destination Medical Center Economic Development Agency, Rochester, Minnesota since 2019. Interim President of the McKnight Foundation from January to September 2020. Acting Commissioner, Minnesota Department of Human Services, July 2019 through September 2019. Human Services Manager (part-time), Minnesota Department of Human Services, October 2019 through December 2019. Chief Operating Officer, Twin Cities Habitat for Humanity from 2017 to 2019. Vice President of University Services, University of Minnesota from 2012 to 2016. Prior thereto, on the Board of Directors, Governance Committee and Finance Committee for the Minnesota Philanthropy Partners (Saint Paul Foundation) from 2012 to 2018, Interim Chief Executive Officer of Blue Cross Blue Shield of Minnesota from 2011 to 2012, Chairman of the Board from 2009 to 2012 and Board Director from 2003 to 2015. Vice President, Leadership and Community Engagement, Bush Foundation, Saint Paul, Minnesota (a private foundation) from 2009 to 2011. Executive Vice President and Chief Financial Officer, Minnesota Sports and Entertainment from 2004 to 2009 and Senior Vice President from 2002 to 2004. Executive Vice President of the Minnesota Wild Foundation from 2004 to 2008. Commissioner of Finance, State of Minnesota, from 1999 to 2002. Currently Board Chair of the Minnesota Wild Foundation since 2010. | N/A |
* Length of service dates reflect the Trustee’s commencement of service with the Trust’s predecessor entities, where applicable.
Wells Fargo Diversified Capital Builder Fund | 29
Other information (unaudited)
Officers
Name and
year of birth | Position held and
length of service | Principal occupations during past five years or longer |
Andrew Owen
(Born 1960) | President,
since 2017 | Executive Vice President of Wells Fargo & Company and Head of Affiliated Managers, Wells Fargo Asset Management, since 2014. In addition, Mr. Owen is currently President, Chief Executive Officer and Director of Wells Fargo Funds Management, LLC since 2017. Prior thereto, Executive Vice President responsible for marketing, investments and product development for Wells Fargo Funds Management, LLC, from 2009 to 2014. |
Jeremy DePalma
(Born 1974) | Treasurer,
since 2012
(for certain funds in
the Fund Complex);
since 2021 (for
the remaining funds in the
Fund Complex) | Senior Vice President of Wells Fargo Funds Management, LLC since 2009. Senior Vice President of Evergreen Investment Management Company, LLC from 2008 to 2010 and head of the Fund Reporting and Control Team within Fund Administration from 2005 to 2010. |
Michelle Rhee
(Born 1966) | Chief Legal Officer,
since 2019 | Secretary of Wells Fargo Funds Management, LLC and Chief Legal Counsel of Wells Fargo Asset Management since 2018. Deputy General Counsel of Wells Fargo Bank, N.A. since 2020 and Assistant General Counsel of Wells Fargo Bank, N.A. from 2018 to 2020. Associate General Counsel and Managing Director of Bank of America Corporation from 2004 to 2018. |
Catherine Kennedy
(Born 1969) | Secretary,
since 2019 | Vice President of Wells Fargo Funds Management, LLC and Senior Counsel of the Wells Fargo Legal Department since 2010. Vice President and Senior Counsel of Evergreen Investment Management Company, LLC from 1998 to 2010. |
Michael H. Whitaker
(Born 1967) | Chief Compliance Officer,
since 2016 | Chief Compliance Officer of Wells Fargo Asset Management since 2016. Senior Vice President and Chief Compliance Officer for Fidelity Investments from 2007 to 2016. |
1 The Statement of Additional Information includes additional information about the Trustees and is available, without charge, upon request, by calling 1-800-222-8222 or by visiting the website at wfam.com.
30 | Wells Fargo Diversified Capital Builder Fund
For more information
More information about Wells Fargo Funds is available free upon request. To obtain literature, please write, visit the Fund's website, or call:
Wells Fargo Funds
P.O. Box 219967
Kansas City, MO 64121-9967
Website: wfam.com
Individual investors: 1-800-222-8222
Retail investment professionals: 1-888-877-9275
Institutional investment professionals: 1-866-765-0778
This report and the financial statements contained herein are submitted for the general information of the shareholders of the Fund. If this report is used for promotional purposes, distribution of the report must be accompanied or preceded by a current prospectus. Before investing, please consider the investment objectives, risks, charges, and expenses of the investment. For a current prospectus and, if available, a summary prospectus, containing this information, call 1-800-222-8222 or visit the Fund's website at wfam.com. Read the prospectus carefully before you invest or send money.
Wells Fargo Asset Management (WFAM) is the trade name for certain investment advisory/management firms owned by Wells Fargo & Company. These firms include but are not limited to Wells Capital Management Incorporated and Wells Fargo Funds Management, LLC. Certain products managed by WFAM entities are distributed by Wells Fargo Funds Distributor, LLC (a broker-dealer and Member FINRA).
This material is for general informational and educational purposes only and is NOT intended to provide investment advice or a recommendation of any kind - including a recommendation for any specific investment, strategy, or plan.
INVESTMENT PRODUCTS: NOT FDIC INSURED ■ NO BANK GUARANTEE ■ MAY LOSE VALUE
© 2021 Wells Fargo & Company. All rights reserved.
PAR-0421-00285 05-21
SA225/SAR225 03-21
Semi-Annual Report
March 31, 2021
Wells Fargo
Diversified Income Builder Fund
Reduce clutter.
Save trees.
Sign up for electronic delivery of prospectuses and shareholder reports at wellsfargo.com/ advantagedelivery
The views expressed and any forward-looking statements are as of March 31, 2021, unless otherwise noted, and are those of the Fund's portfolio managers and/or Wells Fargo Asset Management. Discussions of individual securities or the markets generally are not intended as individual recommendations. Future events or results may vary significantly from those expressed in any forward-looking statements. The views expressed are subject to change at any time in response to changing circumstances in the market. Wells Fargo Asset Management and the Fund disclaim any obligation to publicly update or revise any views expressed or forward-looking statements.
INVESTMENT PRODUCTS: NOT FDIC INSURED ■ NO BANK GUARANTEE ■ MAY LOSE VALUE
Wells Fargo Diversified Income Builder Fund | 1
Letter to shareholders (unaudited)
Andrew Owen
President
Wells Fargo Funds
Dear Shareholder:
We are pleased to offer you this semi-annual report for the Wells Fargo Diversified Income Builder Fund for the six-month period that ended March 31, 2021. Despite a deeply challenging year, dominated by the spread of COVID-19 cases and a sharp drop in economic output throughout much of the world, global stocks performed extremely well, benefiting from ongoing central bank support and rising optimism over the development and distribution of effective COVID-19 vaccines. Bonds also had positive returns, led by global bonds and high-yield bonds.
For the six-month period, U.S. stocks, based on the S&P 500 Index,1 gained 19.07%. International stocks, as measured by the MSCI ACWI ex USA Index (Net),2 returned 21.10%, while the MSCI EM Index (Net),3 had even stronger performance, with a 22.43% gain. Among bond indexes, the Bloomberg Barclays U.S. Aggregate Bond Index,4 returned -2.73%, the Bloomberg Barclays Global Aggregate ex-USD Index (unhedged),5 returned -0.47%, and the Bloomberg Barclays Municipal Bond Index,6 returned 1.46% while the ICE BofA U.S. High Yield Index,7 gained 7.44%.
Hope drove the stock markets to new highs.
In October, capital markets stepped back from their six-month rally. Market volatility rose in advance of the U.S. election and amid a global increase in COVID-19 infections. Europe introduced tighter restrictions affecting economic activity. U.S. markets looked favorably at the prospect of Democratic control of the federal purse strings, which could lead to additional fiscal stimulus and a boost to economic activity. Meanwhile, China reported 4.9% third-quarter gross domestic product growth.
Global stocks rallied in November, propelled by optimism over three promising COVID-19 vaccines. Reversing recent trends, value stocks outperformed growth stocks and cyclical stocks outpaced information technology (IT) stocks. However, U.S. unemployment remained elevated, with a net job loss of 10 million since February. The eurozone services purchasing managers’ index contracted sharply while the region’s manufacturing activity grew. The U.S. election results added to the upbeat mood as investors anticipated more consistent policies in the new administration.
“Global stocks rallied in November, propelled by optimism over three promising COVID-19 vaccines.”
| 1 | The S&P 500 Index consists of 500 stocks chosen for market size, liquidity, and industry group representation. It is a market-value-weighted index with each stock's weight in the index proportionate to its market value. You cannot invest directly in an index. |
| 2 | The Morgan Stanley Capital International (MSCI) All Country World Index (ACWI) ex USA Index (Net) is a free-float-adjusted market-capitalization-weighted index that is designed to measure the equity market performance of developed and emerging markets, excluding the United States. Source: MSCI. MSCI makes no express or implied warranties or representations and shall have no liability whatsoever with respect to any MSCI data contained herein. The MSCI data may not be further redistributed or used as a basis for other indices or any securities or financial products. This report is not approved, reviewed, or produced by MSCI. You cannot invest directly in an index. |
| 1 | The S&P 500 Index consists of 500 stocks chosen for market size, liquidity, and industry group representation. It is a market-value-weighted index with each stock's weight in the index proportionate to its market value. You cannot invest directly in an index. |
| 3 | The MSCI Emerging Markets (EM) Index (Net) is a free-float-adjusted market-capitalization-weighted index that is designed to measure equity market performance of emerging markets. You cannot invest directly in an index. |
| 1 | The S&P 500 Index consists of 500 stocks chosen for market size, liquidity, and industry group representation. It is a market-value-weighted index with each stock's weight in the index proportionate to its market value. You cannot invest directly in an index. |
| 4 | The Bloomberg Barclays U.S. Aggregate Bond Index is a broad-based benchmark that measures the investment-grade, U.S. dollar-denominated, fixed-rate taxable bond market, including Treasuries, government-related and corporate securities, mortgage-backed securities (agency fixed-rate and hybrid adjustable-rate mortgage pass-throughs), asset-backed securities, and commercial mortgage-backed securities. You cannot invest directly in an index. |
| 1 | The S&P 500 Index consists of 500 stocks chosen for market size, liquidity, and industry group representation. It is a market-value-weighted index with each stock's weight in the index proportionate to its market value. You cannot invest directly in an index. |
| 5 | The Bloomberg Barclays Global Aggregate ex-USD Index (unhedged) is an unmanaged index that provides a broad-based measure of the global investment-grade fixed-income markets excluding the U.S. dollar-denominated debt market. You cannot invest directly in an index. |
| 1 | The S&P 500 Index consists of 500 stocks chosen for market size, liquidity, and industry group representation. It is a market-value-weighted index with each stock's weight in the index proportionate to its market value. You cannot invest directly in an index. |
| 6 | The Bloomberg Barclays Municipal Bond Index is an unmanaged index composed of long-term tax-exempt bonds with a minimum credit rating of Baa. You cannot invest directly in an index. |
| 1 | The S&P 500 Index consists of 500 stocks chosen for market size, liquidity, and industry group representation. It is a market-value-weighted index with each stock's weight in the index proportionate to its market value. You cannot invest directly in an index. |
| 7 | The ICE BofA U.S. High Yield Index is a market-capitalization-weighted index of domestic and Yankee high-yield bonds. The index tracks the performance of high-yield securities traded in the U.S. bond market. You cannot invest directly in an index. Copyright 2021. ICE Data Indices, LLC. All rights reserved. |
2 | Wells Fargo Diversified Income Builder Fund
Letter to shareholders (unaudited)
Financial markets ended the year with strength on high expectations for a rapid rollout of the COVID-19 vaccines, the successful passage of a $900 billion stimulus package, and rising expectations of additional economic support from a Democratic-led Congress. U.S. economic data were mixed with still-elevated unemployment and weak retail sales but growth in manufacturing output. In contrast, China’s economic expansion continued in both manufacturing and nonmanufacturing. U.S. COVID-19 infection rates continued to rise even as new state and local lockdown measures were implemented.
The year 2021 began with emerging market stocks leading all major asset classes in January, driven by China’s strong economic growth and a broad recovery in corporate earnings, which propelled China’s stock market higher. In the U.S., positive news on vaccine trials and January's expansion in both the manufacturing and services sectors were offset by a weak December monthly jobs report. This was compounded by technical factors as some hedge funds were forced to sell stocks to protect themselves against a well-publicized short squeeze coordinated by a group of retail investors. Eurozone sentiment and economic growth were particularly weak, reflecting the impact of a new lockdown with stricter social distancing along with a slow vaccine rollout.
February saw major domestic equity indexes driven higher on the hope of a new stimulus bill, improving COVID-19 vaccination numbers, and the gradual reopening of the economy. Most S&P 500 companies reported better-than-expected earnings, with positive surprises coming from the financials, IT, health care, and materials sectors. Japan saw its economy strengthen as a result of strong export numbers. Meanwhile, crude-oil prices continued their climb, rising more than 25% for the year. Domestic government bonds experienced a sharp sell-off in late February as markets priced in a more robust economic recovery and higher future growth and inflation expectations.
The passage of the massive domestic stimulus bill highlighted March activity, leading to increased forecasts for U.S. growth in 2021. Domestic employment surged as COVID-19 vaccinations and an increasingly open economy spurred hiring. A majority of U.S. small companies reported they are operating at pre-pandemic capacity or higher. Value continued its outperformance of growth in the month, continuing the trend that started in late 2020. Meanwhile, most major developed global equity indexes are up month to date on the back of rising optimism regarding the outlook for global growth. While the U.S. and the U.K. have been the most successful in terms of the vaccine rollout, even within markets where the vaccine has lagged, such as the eurozone and Japan, equity indexes in many of those countries are also in positive territory this year.
Don’t let short-term uncertainty derail long-term investment goals.
Periods of investment uncertainty can present challenges, but experience has taught us that maintaining long-term investment goals can be an effective way to plan for the future. To help you create a sound strategy based on your personal goals and risk tolerance, Wells Fargo Funds offers more than 100 mutual funds spanning a wide range of asset classes and investment styles. Although diversification cannot guarantee an investment profit or prevent losses, we believe it can be an effective way to manage investment risk and potentially smooth out overall portfolio performance. We encourage investors to know their investments and to understand that appropriate levels of risk-taking may unlock opportunities.
Thank you for choosing to invest with Wells Fargo Funds. We appreciate your confidence in us and remain committed to helping you meet your financial needs.
Sincerely,
Andrew Owen
President
Wells Fargo Funds
“The passage of the massive domestic stimulus bill highlighted March activity, leading to increased forecasts for U.S. growth in 2021.”
For further information about your Fund, contact your investment professional, visit our website at wfam.com, or call us directly at 1-800-222-8222.
Wells Fargo Diversified Income Builder Fund | 3
Performance highlights (unaudited)
| Investment objective | The Fund seeks long-term total return, consisting of current income and capital appreciation. |
| Manager | Wells Fargo Funds Management, LLC |
| Subadviser | Wells Capital Management Incorporated |
| Portfolio managers | Kandarp R. Acharya, CFA®‡, Margaret Patel |
| Average annual total returns (%) as of March 31, 2021 |
| | | Including sales charge | | Excluding sales charge | | Expense ratios1 (%) |
| | Inception date | 1 year | 5 year | 10 year | | 1 year | 5 year | 10 year | | Gross | Net 2 |
| Class A (EKSAX) | 4-14-1987 | 16.78 | 5.80 | 5.81 | | 23.85 | 7.06 | 6.44 | | 1.07 | 0.85 |
| Class C (EKSCX) | 2-1-1993 | 21.83 | 6.28 | 5.65 | | 22.83 | 6.28 | 5.65 | | 1.82 | 1.60 |
| Class R6 (EKSRX)3 | 7-31-2018 | – | – | – | | 24.63 | 7.54 | 6.86 | | 0.64 | 0.42 |
| Administrator Class (EKSDX) | 7-30-2010 | – | – | – | | 24.18 | 7.20 | 6.58 | | 0.99 | 0.77 |
| Institutional Class (EKSYX) | 1-13-1997 | – | – | – | | 24.29 | 7.45 | 6.82 | | 0.74 | 0.52 |
| Diversified Income Builder Blended Index4 | – | – | – | – | | 26.75 | 10.05 | 8.21 | | – | – |
| ICE BofA U.S. Cash Pay High Yield Index5 | – | – | – | – | | 23.15 | 7.90 | 6.30 | | – | – |
| Russell 1000® Index6 | – | – | – | – | | 60.59 | 16.66 | 13.97 | | – | – |
Figures quoted represent past performance, which is no guarantee of future results, and do not reflect taxes that a shareholder may pay on an investment in a fund. Investment return and principal value of an investment will fluctuate so that an investor’s shares, when redeemed, may be worth more or less than their original cost. Performance shown without sales charges would be lower if sales charges were reflected. Current performance may be lower or higher than the performance data quoted, which assumes the reinvestment of dividends and capital gains. Current month-end performance is available on the Fund’s website, wfam.com.
Index returns do not include transaction costs associated with buying and selling securities, any mutual fund fees or expenses, or any taxes. It is not possible to invest directly in an index.
For Class A shares, the maximum front-end sales charge is 5.75%. For Class C shares, the maximum contingent deferred sales charge is 1.00%. Performance including a contingent deferred sales charge assumes the sales charge for the corresponding time period. Class R6, Administrator Class, and Institutional Class shares are sold without a front-end sales charge or contingent deferred sales charge.
| 1 | Reflects the expense ratios as stated in the most recent prospectuses. The expense ratios shown are subject to change and may differ from the annualized expense ratios shown in the financial highlights of this report. |
| 2 | The manager has contractually committed through January 31, 2022, to waive fees and/or reimburse expenses to the extent necessary to cap total annual fund operating expenses after fee waivers at 0.85% for Class A, 1.60% for Class C, 0.42% for Class R6, 0.77% for Administrator Class, and 0.52% for Institutional Class. Brokerage commissions, stamp duty fees, interest, taxes, acquired fund fees and expenses (if any), and extraordinary expenses are excluded from the expense caps. Prior to or after the commitment expiration date, the caps may be increased or the commitment to maintain the caps may be terminated only with the approval of the Board of Trustees. Without these caps, the Fund’s returns would have been lower. The expense ratio paid by an investor is the net expense ratio (the total annual fund operating expenses after fee waivers) as stated in the prospectuses. |
| 3 | Historical performance shown for the Class R6 shares prior to their inception reflects the performance of the Institutional Class shares, and includes the higher expenses applicable to the Institutional Class shares. If these expenses had not been included, returns for the Class R6 shares would be higher. |
| 4 | Source: Wells Fargo Funds Management, LLC. The Diversified Income Builder Blended Index is composed 60% of the ICE BofA U.S. Cash Pay High Yield Index, 25% of the Morgan Stanley Capital International (MSCI) All Country World Index (ACWI) and 15% of the Bloomberg Barclays U.S. Aggregate Bond Index. Prior to February 1, 2020, the Diversified Income Builder Blended Index was composed 65% of the ICE BofA U.S. Cash Pay High Yield Index, and 35% of the Russell 1000® Index. Prior to January 2, 2018, the Diversified Income Builder Blended Index was composed 75% of the ICE BofA U.S. Cash Pay High Yield Index, and 25% the Russell 1000® Index. You cannot invest directly in an index. |
| 5 | The ICE BofA U.S. Cash Pay High Yield Index is an unmanaged market index that provides a broad-based performance measure of the non-investment grade U.S. domestic bond index. You cannot invest directly in an index. Copyright 2021. ICE Data Indices, LLC. All rights reserved. |
| 6 | The Russell 1000® Index measures the performance of the 1,000 largest companies in the Russell 3000® Index, which represents approximately 92% of the total market capitalization of the Russell 3000® Index. You cannot invest directly in an index. |
| ‡ | CFA® and Chartered Financial Analyst® are trademarks owned by CFA Institute. |
4 | Wells Fargo Diversified Income Builder Fund
Performance highlights (unaudited)
Balanced funds may invest in stocks and bonds. Stock values fluctuate in response to the activities of individual companies and general market and economic conditions. Bond values fluctuate in response to the financial condition of individual issuers, general market and economic conditions, and changes in interest rates. Changes in market conditions and government policies may lead to periods of heightened volatility in the bond market and reduced liquidity for certain bonds held by the Fund. In general, when interest rates rise, bond values fall and investors may lose principal value. Interest rate changes and their impact on the Fund and its share price can be sudden and unpredictable. Certain investment strategies tend to increase the total risk of an investment (relative to the broader market). The Fund is exposed to foreign investment risk, high-yield securities risk, and smaller-company securities risk. Consult the Fund’s prospectus for additional information on these and other risks.
Wells Fargo Diversified Income Builder Fund | 5
Performance highlights (unaudited)
| Ten largest holdings (%) as of March 31, 20211 |
| The Industrial Select Sector SPDR Fund | 1.85 |
| Bausch Health Companies Incorporated | 1.19 |
| Ball Corporation | 1.06 |
| Tenneco Incorporated | 1.05 |
| Installed Building Company | 1.03 |
| CommScope Technologies LLC | 1.02 |
| Davita Incorporated | 1.00 |
| Sensata Technologies BV | 0.93 |
| Energy Select Sector SPDR Fund | 0.92 |
| Synaptics Incorporated | 0.90 |
| 1 | Figures represent the percentage of the Fund's net assets. Holdings are subject to change and may have changed since the date specified. |
| Portfolio composition as of March 31, 20211 |
| 1 | Figures represent the percentage of the Fund's long-term investments. These amounts are subject to change and may have changed since the date specified. |
6 | Wells Fargo Diversified Income Builder Fund
Fund expenses (unaudited)
As a shareholder of the Fund, you incur two types of costs: (1) transaction costs, including sales charges (loads) on purchase payments and contingent deferred sales charges (if any) on redemptions and (2) ongoing costs, including management fees, distribution (12b-1) and/or shareholder servicing fees, and other Fund expenses. This example is intended to help you understand your ongoing costs (in dollars) of investing in the Fund and to compare these costs with the ongoing costs of investing in other mutual funds.
The example is based on an investment of $1,000 invested at the beginning of the six-month period and held for the entire period from October 1, 2020 to March 31, 2021.
Actual expenses
The “Actual” line of the table below provides information about actual account values and actual expenses. You may use the information in this line, together with the amount you invested, to estimate the expenses that you paid over the period. Simply divide your account value by $1,000 (for example, an $8,600 account value divided by $1,000 = 8.6), then multiply the result by the number in the “Actual” line under the heading entitled “Expenses paid during period” for your applicable class of shares to estimate the expenses you paid on your account during this period.
Hypothetical example for comparison purposes
The “Hypothetical” line of the table below provides information about hypothetical account values and hypothetical expenses based on the Fund’s actual expense ratio and an assumed rate of return of 5% per year before expenses, which is not the Fund’s actual return. The hypothetical account values and expenses may not be used to estimate the actual ending account balance or expenses you paid for the period. You may use this information to compare the ongoing costs of investing in the Fund and other funds. To do so, compare this 5% hypothetical example with the 5% hypothetical examples that appear in the shareholder reports of the other funds.
Please note that the expenses shown in the table are meant to highlight your ongoing costs only and do not reflect any transactional costs, such as sales charges (loads) and contingent deferred sales charges. Therefore, the “Hypothetical” line of the table is useful in comparing ongoing costs only and will not help you determine the relative total costs of owning different funds. In addition, if these transactional costs were included, your costs would have been higher.
| | Beginning
account value
10-1-2020 | Ending
account value
3-31-2021 | Expenses
paid during
the period1 | Annualized net
expense ratio |
| Class A | | | | |
| Actual | $1,000.00 | $1,081.36 | $4.41 | 0.85% |
| Hypothetical (5% return before expenses) | $1,000.00 | $1,020.69 | $4.28 | 0.85% |
| Class C | | | | |
| Actual | $1,000.00 | $1,076.97 | $8.29 | 1.60% |
| Hypothetical (5% return before expenses) | $1,000.00 | $1,016.95 | $8.05 | 1.60% |
| Class R6 | | | | |
| Actual | $1,000.00 | $1,083.87 | $2.18 | 0.42% |
| Hypothetical (5% return before expenses) | $1,000.00 | $1,022.84 | $2.12 | 0.42% |
| Administrator Class | | | | |
| Actual | $1,000.00 | $1,082.06 | $4.00 | 0.77% |
| Hypothetical (5% return before expenses) | $1,000.00 | $1,021.09 | $3.88 | 0.77% |
| Institutional Class | | | | |
| Actual | $1,000.00 | $1,083.54 | $2.70 | 0.52% |
| Hypothetical (5% return before expenses) | $1,000.00 | $1,022.34 | $2.62 | 0.52% |
1 Expenses paid is equal to the annualized net expense ratio of each class multiplied by the average account value over the period, multiplied by the number of days in the most recent fiscal half-year divided by the number of days in the fiscal year (to reflect the one-half-year period).
Wells Fargo Diversified Income Builder Fund | 7
Portfolio of investments—March 31, 2021 (unaudited)
| | | Interest
rate | Maturity
date | Principal | Value |
| Asset-backed securities: 2.03% | | | | | | |
| Aqua Finance Trust Series 2019-A Class A 144A | | 3.14% | 7-16-2040 | $ | 337,567 | $ 346,401 |
| Avis Budget Rental Car Funding Series 2019-2A Class C 144A | | 4.24 | 9-22-2025 | | 2,000,000 | 2,145,420 |
| BCC Funding Corporation Series 2019-1A Class D 144A | | 3.94 | 7-20-2027 | | 450,000 | 454,593 |
| Chesapeake Funding II LLC Series 2018-1A Class D 144A | | 3.92 | 4-15-2030 | | 1,980,000 | 2,008,026 |
| CLI Funding LLC Series 2019-1A Class A 144A | | 3.71 | 5-18-2044 | | 816,689 | 819,447 |
| CLI Funding LLC Series 2019-1A Class B 144A | | 4.64 | 5-18-2044 | | 447,551 | 445,696 |
| Conn Funding II LP Series A Class A 144A | | 3.40 | 10-16-2023 | | 118,956 | 119,542 |
| Driven Brands Funding LLC Series 2019-2A Class A2 144A | | 3.98 | 10-20-2049 | | 790,000 | 818,938 |
| Hertz Vehicle Financing LLC Series 2019-1A Class B 144A | | 4.10 | 3-25-2023 | | 1,380,000 | 1,383,086 |
| Mosaic Solar Loans LLC Series 2019-2A Class A 144A | | 2.88 | 9-20-2040 | | 171,285 | 178,817 |
| Santander Retail Auto Lease Trust Series 2019-A Class D 144A | | 3.66 | 5-20-2024 | | 2,000,000 | 2,055,782 |
| SoFi Consumer Loan Program Trust Series 2019-2 Class C 144A | | 3.46 | 4-25-2028 | | 2,000,000 | 2,053,034 |
| Total Asset-backed securities (Cost $12,516,847) | | | | | | 12,828,782 |
| | | | | Shares | |
| Common stocks: 27.75% | | | | | | |
| Communication services: 1.59% | | | | | | |
| Diversified telecommunication services: 0.31% | | | | | | |
| Indus Towers Limited | | | | | 24,599 | 82,430 |
| PT Telekomunikasi Indonesia Persero Tbk | | | | | 412,500 | 97,126 |
| Verizon Communications Incorporated # | | | | | 31,018 | 1,803,697 |
| | | | | | | 1,983,253 |
| Entertainment: 0.21% | | | | | | |
| Netease Incorporated | | | | | 8,625 | 175,515 |
| Nintendo Company Limited | | | | | 2,014 | 1,124,275 |
| | | | | | | 1,299,790 |
| Interactive media & services: 0.36% | | | | | | |
| Alphabet Incorporated Class A †# | | | | | 1,001 | 2,064,583 |
| Baidu Incorporated ADR † | | | | | 793 | 172,517 |
| | | | | | | 2,237,100 |
| Media: 0.26% | | | | | | |
| Comcast Corporation Class A | | | | | 15,000 | 811,650 |
| Eutelsat Communications SA | | | | | 69,832 | 850,039 |
| | | | | | | 1,661,689 |
| Wireless telecommunication services: 0.45% | | | | | | |
| America Movil SAB de CV ADR | | | | | 4,417 | 59,983 |
| MTN Group Limited | | | | | 14,957 | 88,009 |
| SK Telecom Company Limited | | | | | 540 | 131,213 |
The accompanying notes are an integral part of these financial statements.
8 | Wells Fargo Diversified Income Builder Fund
Portfolio of investments—March 31, 2021 (unaudited)
| | | | | Shares | Value |
| Wireless telecommunication services (continued) | | | | | | |
| Vodacom Group Limited | | | | | 138,724 | $ 1,186,673 |
| Vodafone Group plc | | | | | 756,482 | 1,375,357 |
| | | | | | | 2,841,235 |
| Consumer discretionary: 2.17% | | | | | | |
| Auto components: 0.02% | | | | | | |
| Huayu Automotive Systems Company Limited Class A | | | | | 14,200 | 59,724 |
| Minth Group Limited | | | | | 17,300 | 72,101 |
| | | | | | | 131,825 |
| Automobiles: 0.76% | | | | | | |
| Bayerische Motoren Werke AG | | | | | 13,140 | 1,363,259 |
| Ford Motor Company † | | | | | 96,714 | 1,184,747 |
| Hero Motorcorp Limited | | | | | 2,290 | 91,257 |
| Honda Motor Company Limited | | | | | 45,000 | 1,348,882 |
| Kia Motors Corporation | | | | | 1,107 | 81,087 |
| Tesla Motors Incorporated † | | | | | 1,075 | 718,025 |
| | | | | | | 4,787,257 |
| Hotels, restaurants & leisure: 0.28% | | | | | | |
| Evolution Gaming Group | | | | | 10,446 | 1,538,173 |
| Kangwon Land Incorporated † | | | | | 3,218 | 71,938 |
| NagaCorp Limited | | | | | 50,000 | 59,042 |
| Sands China Limited † | | | | | 22,800 | 113,940 |
| | | | | | | 1,783,093 |
| Household durables: 0.09% | | | | | | |
| Cury Construtora e Incorporadora SA † | | | | | 34,309 | 59,369 |
| Gree Electric Appliances Incorporated | | | | | 16,400 | 156,870 |
| Midea Group Company Limited Class A | | | | | 21,299 | 267,188 |
| Suofeiya Home Collection Company Limited Class A | | | | | 17,099 | 85,899 |
| | | | | | | 569,326 |
| Internet & direct marketing retail: 0.45% | | | | | | |
| Alibaba Group Holding Limited ADR † | | | | | 39,216 | 1,109,777 |
| Amazon.com Incorporated †# | | | | | 519 | 1,605,828 |
| Naspers Limited | | | | | 612 | 146,437 |
| | | | | | | 2,862,042 |
| Leisure products: 0.02% | | | | | | |
| Giant Manufacturing Company Limited | | | | | 8,000 | 96,450 |
| Multiline retail: 0.30% | | | | | | |
| Detsky Mir PJSC | | | | | 38,340 | 72,745 |
| Target Corporation # | | | | | 9,025 | 1,787,582 |
| | | | | | | 1,860,327 |
| Specialty retail: 0.24% | | | | | | |
| China Yongda Automobile Service Holding Company | | | | | 63,000 | 115,074 |
| Chow Tai Fook Jewellery Company Limited | | | | | 111,800 | 170,847 |
| Fix Price Group Limited GDR † | | | | | 7,281 | 71,063 |
| Jarir Marketing Company | | | | | 1,917 | 93,031 |
| Petrobras Distribuidora SA | | | | | 16,500 | 64,726 |
The accompanying notes are an integral part of these financial statements.
Wells Fargo Diversified Income Builder Fund | 9
Portfolio of investments—March 31, 2021 (unaudited)
| | | | | Shares | Value |
| Specialty retail (continued) | | | | | | |
| The Home Depot Incorporated # | | | | | 2,800 | $ 854,700 |
| Topsports International Holdings Limited 144A | | | | | 85,000 | 126,613 |
| | | | | | | 1,496,054 |
| Textiles, apparel & luxury goods: 0.01% | | | | | | |
| Bosideng International Holdings Limited | | | | | 164,000 | 73,835 |
| Consumer staples: 1.19% | | | | | | |
| Beverages: 0.02% | | | | | | |
| Ambev SA | | | | | 21,300 | 57,861 |
| Thai Beverage plc | | | | | 114,600 | 63,042 |
| | | | | | | 120,903 |
| Food & staples retailing: 0.61% | | | | | | |
| Seven & I Holdings Company Limited | | | | | 43,200 | 1,741,265 |
| Tesco plc | | | | | 248,370 | 783,589 |
| Walmart de Mexico SAB de CV | | | | | 21,800 | 68,847 |
| Walmart Incorporated # | | | | | 9,308 | 1,264,306 |
| | | | | | | 3,858,007 |
| Food products: 0.20% | | | | | | |
| Inner Mongolia Yili Industrial Group Company Limited Class A | | | | | 10,300 | 62,900 |
| Tingyi Holding Corporation | | | | | 76,000 | 139,602 |
| Uni-President Enterprises Corporation | | | | | 28,000 | 71,636 |
| WH Group Limited | | | | | 1,190,398 | 964,678 |
| | | | | | | 1,238,816 |
| Household products: 0.22% | | | | | | |
| The Procter & Gamble Company # | | | | | 10,326 | 1,398,450 |
| Personal products: 0.14% | | | | | | |
| L'Oréal SA | | | | | 2,268 | 869,185 |
| Energy: 0.66% | | | | | | |
| Oil, gas & consumable fuels: 0.66% | | | | | | |
| China Petroleum & Chemical Corporation Class H | | | | | 1,610,000 | 857,385 |
| ConocoPhillips # | | | | | 17,294 | 916,063 |
| Hindustan Petroleum Corporation Limited | | | | | 25,395 | 81,450 |
| LUKOIL PJSC ADR | | | | | 1,424 | 115,145 |
| Rosneft Oil Company PJSC | | | | | 10,700 | 81,088 |
| Royal Dutch Shell plc | | | | | 55,948 | 1,090,462 |
| Total SA | | | | | 22,499 | 1,049,447 |
| Financials: 3.00% | | | | | | |
| Banks: 1.05% | | | | | | |
| Banco Santander Chile SA | | | | | 1,202,556 | 75,114 |
| Bangkok Bank PCL | | | | | 30,400 | 122,573 |
| BNP Paribas SA | | | | | 14,584 | 887,286 |
| China Construction Bank Class H | | | | | 365,000 | 307,058 |
| China Merchants Bank Company Limited Class H | | | | | 18,000 | 137,418 |
| Citizens Financial Group Incorporated | | | | | 20,080 | 886,532 |
| CTBC Financial Holding Company Limited | | | | | 92,000 | 71,258 |
| Grupo Financiero Banorte SAB de CV † | | | | | 11,800 | 66,535 |
The accompanying notes are an integral part of these financial statements.
10 | Wells Fargo Diversified Income Builder Fund
Portfolio of investments—March 31, 2021 (unaudited)
| | | | | Shares | Value |
| Banks (continued) | | | | | | |
| ING Groep NV | | | | | 102,882 | $ 1,258,618 |
| JPMorgan Chase & Company # | | | | | 12,542 | 1,909,269 |
| KB Financial Group Incorporated | | | | | 3,949 | 196,098 |
| National Commercial Bank | | | | | 9,038 | 127,968 |
| PKO Bank Polski SA † | | | | | 8,327 | 68,965 |
| PT Bank Rakyat Indonesia Tbk | | | | | 366,000 | 110,871 |
| Qatar National Bank | | | | | 18,805 | 92,895 |
| RHB Bank Bhd | | | | | 48,300 | 62,552 |
| Sberbank PJSC ADR | | | | | 7,140 | 109,992 |
| Standard Bank Group Limited | | | | | 16,358 | 139,010 |
| | | | | | | 6,630,012 |
| Capital markets: 0.89% | | | | | | |
| Ares Capital Corporation # | | | | | 68,992 | 1,290,840 |
| Artisan Partners Asset Management Incorporated Class A # | | | | | 26,007 | 1,356,785 |
| B3 Brasil Bolsa Balcao SA | | | | | 6,900 | 66,957 |
| BlackRock Incorporated | | | | | 1,548 | 1,167,130 |
| China International Capital Corporation Limited Class H 144A† | | | | | 51,600 | 125,049 |
| Hong Kong Exchanges & Clearing Limited | | | | | 1,700 | 100,022 |
| Morgan Stanley # | | | | | 17,292 | 1,342,897 |
| Moscow Exchange MICEX-RTS PJSC | | | | | 46,470 | 106,934 |
| Vinci Partners Investments Limited Class A † | | | | | 3,947 | 51,903 |
| | | | | | | 5,608,517 |
| Consumer finance: 0.02% | | | | | | |
| Manappuram Finance Limited | | | | | 62,955 | 128,469 |
| Diversified financial services: 0.26% | | | | | | |
| Banco BTG Pactual SA | | | | | 5,601 | 96,573 |
| Compass Diversified Holdings | | | | | 17,637 | 408,297 |
| LIC Housing Finance Limited | | | | | 34,643 | 202,891 |
| ORIX Corporation | | | | | 50,200 | 846,905 |
| Tisco Financial Group PCL | | | | | 32,300 | 100,518 |
| | | | | | | 1,655,184 |
| Insurance: 0.41% | | | | | | |
| NN Group NV | | | | | 25,180 | 1,231,047 |
| Ping An Insurance Group Company Class H | | | | | 26,700 | 317,861 |
| Samsung Fire & Marine Insurance Company Limited | | | | | 541 | 90,824 |
| Unipol Gruppo SpA † | | | | | 172,334 | 961,169 |
| | | | | | | 2,600,901 |
| Mortgage REITs: 0.37% | | | | | | |
| AGNC Investment Corporation # | | | | | 76,833 | 1,287,721 |
| New Residential Investment Corporation # | | | | | 92,935 | 1,045,519 |
| | | | | | | 2,333,240 |
| Health care: 5.54% | | | | | | |
| Biotechnology: 1.70% | | | | | | |
| AbbVie Incorporated # | | | | | 51,881 | 5,614,562 |
| Alexion Pharmaceuticals Incorporated † | | | | | 8,500 | 1,299,735 |
| Amgen Incorporated # | | | | | 10,000 | 2,488,100 |
The accompanying notes are an integral part of these financial statements.
Wells Fargo Diversified Income Builder Fund | 11
Portfolio of investments—March 31, 2021 (unaudited)
| | | | | Shares | Value |
| Biotechnology (continued) | | | | | | |
| Neurocrine Biosciences Incorporated † | | | | | 6,200 | $ 602,950 |
| Vertex Pharmaceuticals Incorporated † | | | | | 2,800 | 601,692 |
| Zhejiang NHU Company Limited | | | | | 22,700 | 132,391 |
| | | | | | | 10,739,430 |
| Health care equipment & supplies: 0.76% | | | | | | |
| Abbott Laboratories | | | | | 13,000 | 1,557,920 |
| Becton Dickinson & Company | | | | | 4,000 | 972,600 |
| Danaher Corporation | | | | | 10,000 | 2,250,800 |
| | | | | | | 4,781,320 |
| Health care providers & services: 1.08% | | | | | | |
| Anthem Incorporated | | | | | 2,500 | 897,375 |
| CVS Health Corporation # | | | | | 22,043 | 1,658,295 |
| Life Healthcare Group Holdings Limited † | | | | | 59,461 | 74,528 |
| McKesson Corporation | | | | | 7,000 | 1,365,280 |
| Patterson Companies Incorporated | | | | | 43,542 | 1,391,167 |
| UnitedHealth Group Incorporated # | | | | | 3,768 | 1,401,960 |
| | | | | | | 6,788,605 |
| Life sciences tools & services: 0.57% | | | | | | |
| Bio-Rad Laboratories Incorporated Class A † | | | | | 1,000 | 571,170 |
| IQVIA Holdings Incorporated † | | | | | 4,000 | 772,560 |
| Thermo Fisher Scientific Incorporated | | | | | 5,000 | 2,281,900 |
| | | | | | | 3,625,630 |
| Pharmaceuticals: 1.43% | | | | | | |
| Bausch Health Companies Incorporated † | | | | | 37,000 | 1,174,380 |
| Bristol-Myers Squibb Company # | | | | | 66,973 | 4,228,005 |
| Horizon Therapeutics plc † | | | | | 16,000 | 1,472,640 |
| Merck & Company Incorporated | | | | | 13,700 | 1,056,133 |
| Merck KGaA ADR | | | | | 6,000 | 204,900 |
| Novartis AG | | | | | 10,635 | 908,839 |
| | | | | | | 9,044,897 |
| Industrials: 3.70% | | | | | | |
| Aerospace & defense: 0.35% | | | | | | |
| Curtiss-Wright Corporation | | | | | 3,000 | 355,800 |
| L3Harris Technologies Incorporated | | | | | 9,000 | 1,824,120 |
| | | | | | | 2,179,920 |
| Air freight & logistics: 0.20% | | | | | | |
| United Parcel Service Incorporated Class B | | | | | 7,300 | 1,240,927 |
| Electrical equipment: 0.74% | | | | | | |
| AMETEK Incorporated | | | | | 15,000 | 1,915,950 |
| Emerson Electric Company | | | | | 16,649 | 1,502,073 |
| Nari Technology Company Limited | | | | | 31,500 | 149,643 |
| Schneider Electric SE | | | | | 6,994 | 1,068,293 |
| Xinjiang Goldwind Science & Technology Company Limited | | | | | 31,600 | 59,346 |
| | | | | | | 4,695,305 |
The accompanying notes are an integral part of these financial statements.
12 | Wells Fargo Diversified Income Builder Fund
Portfolio of investments—March 31, 2021 (unaudited)
| | | | | Shares | Value |
| Industrial conglomerates: 0.44% | | | | | | |
| Honeywell International Incorporated # | | | | | 7,735 | $ 1,679,036 |
| Siemens AG | | | | | 6,230 | 1,022,829 |
| The Bidvest Group Limited | | | | | 9,129 | 105,386 |
| | | | | | | 2,807,251 |
| Machinery: 1.14% | | | | | | |
| Cummins Incorporated # | | | | | 5,414 | 1,402,822 |
| Epiroc AB Class A | | | | | 44,680 | 1,011,937 |
| IDEX Corporation | | | | | 5,500 | 1,151,260 |
| John Bean Technologies Corporation | | | | | 11,000 | 1,466,740 |
| SKF AB Class B | | | | | 44,169 | 1,255,259 |
| The Timken Company | | | | | 9,600 | 779,232 |
| Weichai Power Company Limited Class H | | | | | 51,000 | 125,957 |
| | | | | | | 7,193,207 |
| Professional services: 0.37% | | | | | | |
| Leidos Holdings Incorporated # | | | | | 24,000 | 2,310,720 |
| Road & rail: 0.15% | | | | | | |
| TFI International Incorporated | | | | | 12,695 | 951,595 |
| Trading companies & distributors: 0.28% | | | | | | |
| BOC Aviation Limited 144A | | | | | 11,900 | 115,264 |
| Ferguson plc | | | | | 7,462 | 891,686 |
| Russel Metals Incorporated | | | | | 38,331 | 762,228 |
| | | | | | | 1,769,178 |
| Transportation infrastructure: 0.03% | | | | | | |
| China Merchants Port Holdings Company Limited | | | | | 74,000 | 113,464 |
| International Container Terminal Services Incorporated | | | | | 22,850 | 56,963 |
| | | | | | | 170,427 |
| Information technology: 7.26% | | | | | | |
| Electronic equipment, instruments & components: 0.78% | | | | | | |
| Amphenol Corporation Class A | | | | | 48,000 | 3,166,560 |
| Delta Electronics Incorporated | | | | | 6,000 | 60,561 |
| Hon Hai Precision Industry Company Limited | | | | | 53,600 | 232,937 |
| Keysight Technologies Incorporated †# | | | | | 9,023 | 1,293,898 |
| Simplo Technology Company Limited | | | | | 6,000 | 78,015 |
| Universal Scientific Industrial Shanghai Company Limited Class A | | | | | 26,100 | 77,046 |
| | | | | | | 4,909,017 |
| IT services: 0.48% | | | | | | |
| Akamai Technologies Incorporated † | | | | | 24,000 | 2,445,600 |
| Infosys Limited ADR | | | | | 11,226 | 210,151 |
| MasterCard Incorporated Class A | | | | | 700 | 249,235 |
| Tech Mahindra Limited | | | | | 8,210 | 111,331 |
| | | | | | | 3,016,317 |
| Semiconductors & semiconductor equipment: 3.13% | | | | | | |
| Advanced Micro Devices Incorporated † | | | | | 13,000 | 1,020,500 |
| Analog Devices Incorporated | | | | | 1,400 | 217,112 |
| ASM Pacific Technology | | | | | 8,000 | 101,928 |
The accompanying notes are an integral part of these financial statements.
Wells Fargo Diversified Income Builder Fund | 13
Portfolio of investments—March 31, 2021 (unaudited)
| | | | | Shares | Value |
| Semiconductors & semiconductor equipment (continued) | | | | | | |
| Broadcom Incorporated | | | | | 10,000 | $ 4,636,600 |
| KLA Corporation # | | | | | 3,125 | 1,032,500 |
| Mediatek Incorporated | | | | | 2,600 | 88,298 |
| Microchip Technology Incorporated | | | | | 14,000 | 2,173,080 |
| Micron Technology Incorporated † | | | | | 12,000 | 1,058,520 |
| Novatek Microelectronics Corporation Limited | | | | | 4,000 | 80,608 |
| NVIDIA Corporation # | | | | | 2,062 | 1,100,964 |
| QUALCOMM Incorporated # | | | | | 14,874 | 1,972,144 |
| SK Hynix Incorporated | | | | | 1,727 | 202,189 |
| Taiwan Semiconductor Manufacturing Company Limited | | | | | 46,000 | 946,343 |
| Taiwan Semiconductor Manufacturing Company Limited ADR # | | | | | 14,551 | 1,721,092 |
| Texas Instruments Incorporated # | | | | | 14,861 | 2,808,580 |
| Xilinx Incorporated | | | | | 5,000 | 619,500 |
| | | | | | | 19,779,958 |
| Software: 1.42% | | | | | | |
| Adobe Incorporated † | | | | | 3,500 | 1,663,795 |
| ANSYS Incorporated † | | | | | 2,000 | 679,120 |
| Microsoft Corporation # | | | | | 21,716 | 5,119,981 |
| Synopsys Incorporated † | | | | | 6,000 | 1,486,680 |
| | | | | | | 8,949,576 |
| Technology hardware, storage & peripherals: 1.45% | | | | | | |
| Advantech Company Limited | | | | | 5,700 | 70,718 |
| Apple Incorporated # | | | | | 34,716 | 4,240,559 |
| Lenovo Group Limited | | | | | 866,000 | 1,232,034 |
| Lite-On Technology Corporation | | | | | 34,000 | 74,833 |
| Logitech International SA | | | | | 10,139 | 1,063,514 |
| Quanta Computer Incorporated | | | | | 34,000 | 116,777 |
| Samsung Electronics Company Limited | | | | | 10,098 | 726,289 |
| Samsung Electronics Company Limited GDR 144A | | | | | 753 | 1,373,472 |
| Western Digital Corporation | | | | | 3,500 | 233,625 |
| | | | | | | 9,131,821 |
| Materials: 1.50% | | | | | | |
| Chemicals: 0.59% | | | | | | |
| Eastman Chemical Company | | | | | 2,000 | 220,240 |
| Huntsman Corporation | | | | | 7,000 | 201,810 |
| Lomon Billions Group Company Limited | | | | | 16,500 | 71,941 |
| LyondellBasell Industries NV Class A # | | | | | 9,616 | 1,000,545 |
| The Sherwin-Williams Company | | | | | 1,500 | 1,107,015 |
| Tronox Holdings plc Class A | | | | | 6,900 | 126,270 |
| Valvoline Incorporated # | | | | | 37,661 | 981,822 |
| | | | | | | 3,709,643 |
| Containers & packaging: 0.36% | | | | | | |
| AptarGroup Incorporated | | | | | 5,300 | 750,851 |
| Berry Global Group Incorporated † | | | | | 23,500 | 1,442,900 |
| Sealed Air Corporation | | | | | 1,500 | 68,730 |
| | | | | | | 2,262,481 |
| Metals & mining: 0.54% | | | | | | |
| Fortescue Metals Group Limited | | | | | 92,022 | 1,397,207 |
The accompanying notes are an integral part of these financial statements.
14 | Wells Fargo Diversified Income Builder Fund
Portfolio of investments—March 31, 2021 (unaudited)
| | | | | Shares | Value |
| Metals & mining (continued) | | | | | | |
| Gold Fields Limited ADR | | | | | 8,997 | $ 85,382 |
| MMC Norilsk Nickel PJSC | | | | | 217 | 67,760 |
| POSCO | | | | | 432 | 122,147 |
| Rio Tinto plc | | | | | 19,390 | 1,483,573 |
| Southern Copper Corporation | | | | | 2,185 | 148,296 |
| Vale SA | | | | | 7,700 | 134,023 |
| | | | | | | 3,438,388 |
| Paper & forest products: 0.01% | | | | | | |
| Nine Dragons Paper Holdings Limited | | | | | 39,000 | 57,090 |
| Real estate: 0.44% | | | | | | |
| Equity REITs: 0.23% | | | | | | |
| Easterly Government Properties Incorporated | | | | | 63,704 | 1,320,584 |
| Embassy Office Parks REIT | | | | | 30,000 | 133,538 |
| | | | | | | 1,454,122 |
| Real estate management & development: 0.21% | | | | | | |
| China Resources Land Limited | | | | | 37,350 | 180,886 |
| Logan Property Holdings Company Limited | | | | | 549,442 | 925,855 |
| Shimao Property Holding Limited | | | | | 37,000 | 116,367 |
| WHA Corporation PCL | | | | | 616,000 | 68,598 |
| | | | | | | 1,291,706 |
| Utilities: 0.70% | | | | | | |
| Electric utilities: 0.18% | | | | | | |
| SSE plc | | | | | 57,941 | 1,162,216 |
| Gas utilities: 0.36% | | | | | | |
| ENN Energy Holdings Limited | | | | | 10,300 | 165,217 |
| Gail India Limited | | | | | 79,428 | 147,202 |
| Kunlun Energy Company Limited | | | | | 136,000 | 142,926 |
| Mahanagar Gas Limited | | | | | 11,934 | 190,802 |
| National Fuel Gas Company # | | | | | 32,640 | 1,631,674 |
| | | | | | | 2,277,821 |
| Independent power & renewable electricity producers: 0.16% | | | | | | |
| Vistra Energy Corporation | | | | | 56,000 | 990,080 |
| Total Common stocks (Cost $136,026,799) | | | | | | 175,044,648 |
| | | Interest
rate | Maturity
date | Principal | |
| Corporate bonds and notes: 44.87% | | | | | | |
| Communication services: 3.11% | | | | | | |
| Diversified telecommunication services: 0.20% | | | | | | |
| Cablevision Lightpath LLC 144A | | 5.63% | 9-15-2028 | $ | 410,000 | 416,027 |
| Frontier Communications 144A | | 5.88 | 10-15-2027 | | 395,000 | 418,700 |
| Windstream Corporation | | 7.75 | 8-15-2028 | | 405,000 | 412,462 |
| | | | | | | 1,247,189 |
The accompanying notes are an integral part of these financial statements.
Wells Fargo Diversified Income Builder Fund | 15
Portfolio of investments—March 31, 2021 (unaudited)
| | | Interest
rate | Maturity
date | Principal | Value |
| Entertainment: 0.20% | | | | | | |
| Live Nation Entertainment Incorporated | | 5.63% | 3-15-2026 | $ | 405,000 | $ 420,633 |
| Live Nation Entertainment Incorporated | | 6.50 | 5-15-2027 | | 750,000 | 832,500 |
| | | | | | | 1,253,133 |
| Interactive media & services: 0.06% | | | | | | |
| Rackspace Technology Company « | | 5.38 | 12-1-2028 | | 410,000 | 416,898 |
| Media: 2.65% | | | | | | |
| Block Communications Incorporated 144A | | 4.88 | 3-1-2028 | | 410,000 | 417,589 |
| CCO Holdings LLC 144A | | 5.13 | 5-1-2027 | | 2,385,000 | 2,521,696 |
| Cinemark USA Incorporated 144A | | 5.88 | 3-15-2026 | | 115,000 | 117,753 |
| Cinemark USA Incorporated 144A | | 8.75 | 5-1-2025 | | 575,000 | 629,625 |
| Consolidated Communications 144A | | 6.50 | 10-1-2028 | | 790,000 | 853,303 |
| CSC Holdings LLC 144A | | 6.50 | 2-1-2029 | | 765,000 | 845,325 |
| CSC Holdings LLC 144A | | 7.50 | 4-1-2028 | | 1,515,000 | 1,670,742 |
| Diamond Sports Group LLC 144A | | 5.38 | 8-15-2026 | | 490,000 | 352,800 |
| Diamond Sports Group LLC 144A | | 6.63 | 8-15-2027 | | 975,000 | 507,000 |
| Gray Television Incorporated | | 5.88 | 7-15-2026 | | 1,210,000 | 1,253,863 |
| Nexstar Broadcasting Incorporated 144A | | 5.63 | 7-15-2027 | | 1,580,000 | 1,656,030 |
| Nielsen Finance LLC 144A | | 5.88 | 10-1-2030 | | 1,945,000 | 2,107,894 |
| QVC Incorporated | | 4.75 | 2-15-2027 | | 405,000 | 419,175 |
| Salem Media Group Incorporated 144A | | 6.75 | 6-1-2024 | | 845,000 | 832,325 |
| The E.W. Scripps Company | | 5.13 | 5-15-2025 | | 1,640,000 | 1,670,750 |
| Townsquare Media Incorporated 144A | | 6.88 | 2-1-2026 | | 800,000 | 852,000 |
| | | | | | | 16,707,870 |
| Consumer discretionary: 5.94% | | | | | | |
| Auto components: 1.90% | | | | | | |
| Clarios Global LP 144A | | 6.25 | 5-15-2026 | | 395,000 | 419,506 |
| Clarios Global LP 144A | | 8.50 | 5-15-2027 | | 545,000 | 586,556 |
| Dana Holding Corporation | | 5.50 | 12-15-2024 | | 2,000,000 | 2,040,400 |
| Speedway Motors Incorporated 144A | | 4.88 | 11-1-2027 | | 1,530,000 | 1,530,000 |
| Tenneco Incorporated « | | 5.00 | 7-15-2026 | | 7,030,000 | 6,625,775 |
| Tenneco Incorproated 144A | | 5.13 | 4-15-2029 | | 800,000 | 790,000 |
| | | | | | | 11,992,237 |
| Automobiles: 0.13% | | | | | | |
| Ford Motor Company | | 4.75 | 1-15-2043 | | 400,000 | 402,960 |
| Ford Motor Company | | 9.00 | 4-22-2025 | | 345,000 | 417,835 |
| | | | | | | 820,795 |
| Diversified consumer services: 0.27% | | | | | | |
| Carriage Services Incorporated | | 6.63 | 6-1-2026 | | 1,600,000 | 1,680,000 |
| Hotels, restaurants & leisure: 1.62% | | | | | | |
| Carnival Corporation 144A | | 5.75 | 3-1-2027 | | 410,000 | 420,763 |
| Carnival Corporation 144A | | 7.63 | 3-1-2026 | | 790,000 | 848,697 |
| Carnival Corporation 144A | | 9.88 | 8-1-2027 | | 730,000 | 859,495 |
| Carnival Corporation 144A | | 11.50 | 4-1-2023 | | 1,100,000 | 1,260,875 |
| CCM Merger Incorporated | | 6.38 | 5-1-2026 | | 1,585,000 | 1,683,064 |
| NCL Corporation Limited 144A | | 5.88 | 3-15-2026 | | 420,000 | 424,200 |
| NCL Corporation Limited 144A | | 12.25 | 5-15-2024 | | 1,055,000 | 1,278,006 |
| Royal Caribbean Cruises Limited 144A | | 5.50 | 4-1-2028 | | 475,000 | 477,375 |
| Royal Caribbean Cruises Limited 144A | | 9.13 | 6-15-2023 | | 1,145,000 | 1,261,710 |
The accompanying notes are an integral part of these financial statements.
16 | Wells Fargo Diversified Income Builder Fund
Portfolio of investments—March 31, 2021 (unaudited)
| | | Interest
rate | Maturity
date | Principal | Value |
| Hotels, restaurants & leisure (continued) | | | | | | |
| Royal Caribbean Cruises Limited 144A | | 10.88% | 6-1-2023 | $ | 740,000 | $ 851,222 |
| Wyndham Hotels & Resorts Company | | 5.38 | 4-15-2026 | | 815,000 | 833,338 |
| | | | | | | 10,198,745 |
| Household durables: 1.09% | | | | | | |
| Installed Building Company 144A | | 5.75 | 2-1-2028 | | 6,190,000 | 6,468,550 |
| Toll Brothers Finance Corporation | | 4.35 | 2-15-2028 | | 380,000 | 410,875 |
| | | | | | | 6,879,425 |
| Multiline retail: 0.33% | | | | | | |
| Macy's Incorporated | | 8.38 | 6-15-2025 | | 765,000 | 845,914 |
| Nordstrom Incorporated 144A | | 8.75 | 5-15-2025 | | 1,125,000 | 1,273,235 |
| | | | | | | 2,119,149 |
| Specialty retail: 0.60% | | | | | | |
| Asbury Automotive Group Incorporated | | 4.75 | 3-1-2030 | | 800,000 | 826,400 |
| Lithia Motors Incorporated 144A | | 4.63 | 12-15-2027 | | 795,000 | 825,806 |
| NMG Holding Company Incorporated 144A | | 7.13 | 4-1-2026 | | 405,000 | 413,100 |
| Rent-A-Center Incorporated 144A | | 6.38 | 2-15-2029 | | 400,000 | 424,000 |
| Sonic Automotive Incorporated | | 6.13 | 3-15-2027 | | 1,230,000 | 1,279,200 |
| | | | | | | 3,768,506 |
| Consumer staples: 1.96% | | | | | | |
| Food & staples retailing: 0.20% | | | | | | |
| PetSmart Incorporated 144A | | 4.75 | 2-15-2028 | | 820,000 | 838,622 |
| PetSmart Incorporated 144A | | 7.75 | 2-15-2029 | | 395,000 | 427,568 |
| | | | | | | 1,266,190 |
| Food products: 1.04% | | | | | | |
| CHS Incorporated 144A | | 6.88 | 4-15-2029 | | 410,000 | 429,217 |
| Kraft Heinz Foods Company | | 3.00 | 6-1-2026 | | 400,000 | 420,938 |
| Kraft Heinz Foods Company | | 4.38 | 6-1-2046 | | 400,000 | 418,148 |
| Lamb Weston Holdings Incorporated 144A | | 4.63 | 11-1-2024 | | 1,395,000 | 1,447,619 |
| Post Holdings Incorporated 144A | | 4.50 | 9-15-2031 | | 3,920,000 | 3,876,880 |
| | | | | | | 6,592,802 |
| Household durables: 0.72% | | | | | | |
| Spectrum Brands Incorporated 144A | | 3.88 | 3-15-2031 | | 4,611,000 | 4,513,016 |
| Energy: 5.29% | | | | | | |
| Energy equipment & services: 1.04% | | | | | | |
| Bristow Group Incorporated 144A | | 6.88 | 3-1-2028 | | 2,485,000 | 2,476,949 |
| Hilcorp Energy Company 144A | | 6.25 | 11-1-2028 | | 1,210,000 | 1,246,300 |
| Pattern Energy Operations LP 144A | | 4.50 | 8-15-2028 | | 1,575,000 | 1,600,594 |
| USA Compression Partners LP | | 6.88 | 4-1-2026 | | 1,225,000 | 1,256,391 |
| | | | | | | 6,580,234 |
| Oil, gas & consumable fuels: 4.25% | | | | | | |
| Aethon United 144A | | 8.25 | 2-15-2026 | | 1,195,000 | 1,236,825 |
| Antero Resources Corporation | | 5.00 | 3-1-2025 | | 1,260,000 | 1,260,970 |
| Apache Corporation | | 4.75 | 4-15-2043 | | 430,000 | 398,825 |
| Archrock Partners LP 144A | | 6.88 | 4-1-2027 | | 795,000 | 828,788 |
The accompanying notes are an integral part of these financial statements.
Wells Fargo Diversified Income Builder Fund | 17
Portfolio of investments—March 31, 2021 (unaudited)
| | | Interest
rate | Maturity
date | Principal | Value |
| Oil, gas & consumable fuels (continued) | | | | | | |
| Buckeye Partners LP | | 5.85% | 11-15-2043 | $ | 425,000 | $ 412,830 |
| Cheniere Corpus Christi Holdings LLC | | 5.13 | 6-30-2027 | | 2,110,000 | 2,413,036 |
| Cheniere Energy Partners LP | | 4.50 | 10-1-2029 | | 1,560,000 | 1,617,751 |
| Continental Resources Incorporated | | 4.50 | 4-15-2023 | | 805,000 | 833,738 |
| DCP Midstream Operating Company | | 5.13 | 5-15-2029 | | 1,175,000 | 1,249,554 |
| EnLink Midstream LLC | | 5.38 | 6-1-2029 | | 850,000 | 794,750 |
| EnLink Midstream Partners LP | | 5.60 | 4-1-2044 | | 1,480,000 | 1,228,400 |
| Enviva Partners LP 144A | | 6.50 | 1-15-2026 | | 2,005,000 | 2,100,238 |
| Harvest Midstream LP | | 7.50 | 9-1-2028 | | 790,000 | 849,013 |
| Indigo Natural Resources LLC | | 5.38 | 2-1-2029 | | 840,000 | 827,576 |
| Murphy Oil Corporation | | 5.75 | 8-15-2025 | | 415,000 | 414,917 |
| Murphy Oil Corporation | | 6.38 | 7-15-2028 | | 115,000 | 115,083 |
| New Fortress Energy Incorporated 144A%% | | 6.50 | 9-30-2026 | | 760,000 | 765,700 |
| Occidental Petroleum Corporation | | 6.45 | 9-15-2036 | | 2,930,000 | 3,234,017 |
| Range Resources Corporation | | 9.25 | 2-1-2026 | | 770,000 | 836,620 |
| Rockies Express Pipeline LLC 144A | | 6.88 | 4-15-2040 | | 370,000 | 399,600 |
| Southwestern Energy Company | | 7.50 | 4-1-2026 | | 1,575,000 | 1,666,382 |
| Tallgrass Energy Partners LP | | 7.50 | 10-1-2025 | | 1,975,000 | 2,125,791 |
| Western Midstream Operating LP | | 5.30 | 2-1-2030 | | 385,000 | 418,064 |
| Western Midstream Operating LP | | 6.50 | 2-1-2050 | | 725,000 | 783,906 |
| | | | | | | 26,812,374 |
| Financials: 3.66% | | | | | | |
| Banks: 1.35% | | | | | | |
| Citigroup Incorporated (U.S. SOFR+3.23%) ʊ± | | 4.70 | 1-30-2025 | | 1,000,000 | 1,007,000 |
| Citizens Financial Group (5 Year Treasury Constant Maturity+5.31%) ʊ± | | 5.65 | 10-6-2025 | | 2,000,000 | 2,209,140 |
| Fifth Third Bancorp (5 Year Treasury Constant Maturity+4.22%) ʊ± | | 4.50 | 9-30-2025 | | 2,000,000 | 2,124,000 |
| JPMorgan Chase & Company (U.S. SOFR+3.13%) ʊ± | | 4.60 | 2-3-2025 | | 1,000,000 | 1,011,250 |
| Truist Financial Corporation (5 Year Treasury Constant Maturity+4.61%) ʊ± | | 4.95 | 9-2-2025 | | 2,000,000 | 2,167,500 |
| | | | | | | 8,518,890 |
| Capital markets: 0.13% | | | | | | |
| Oppenheimer Holdings Incorporated | | 5.50 | 10-1-2025 | | 815,000 | 842,262 |
| Consumer finance: 1.17% | | | | | | |
| Discover Financial Services (5 Year Treasury Constant Maturity+5.78%) ʊ± | | 6.13 | 6-23-2025 | | 1,000,000 | 1,110,000 |
| FirstCash Incorporated | | 4.63 | 9-1-2028 | | 405,000 | 413,100 |
| Ford Motor Credit Company LLC | | 4.39 | 1-8-2026 | | 1,200,000 | 1,261,284 |
| Ford Motor Credit Company LLC | | 5.13 | 6-16-2025 | | 1,555,000 | 1,679,400 |
| Hawaiian Brand Intellectual Property Limited 144A | | 5.75 | 1-20-2026 | | 1,980,000 | 2,103,948 |
| Springleaf Finance Corporation | | 7.13 | 3-15-2026 | | 720,000 | 830,412 |
| | | | | | | 7,398,144 |
| Diversified financial services: 0.27% | | | | | | |
| LPL Holdings Incorporated 144A | | 4.63 | 11-15-2027 | | 815,000 | 845,563 |
| United Shore Financial Services LLC | | 5.50 | 11-15-2025 | | 795,000 | 828,788 |
| | | | | | | 1,674,351 |
The accompanying notes are an integral part of these financial statements.
18 | Wells Fargo Diversified Income Builder Fund
Portfolio of investments—March 31, 2021 (unaudited)
| | | Interest
rate | Maturity
date | Principal | Value |
| Insurance: 0.13% | | | | | | |
| Genworth Mortgage Holding | | 6.50% | 8-15-2025 | $ | 385,000 | $ 416,041 |
| USI Incorporated 144A | | 6.88 | 5-1-2025 | | 410,000 | 417,175 |
| | | | | | | 833,216 |
| Mortgage REITs: 0.27% | | | | | | |
| Starwood Property Trust Incorporated | | 4.75 | 3-15-2025 | | 1,625,000 | 1,687,205 |
| Thrifts & mortgage finance: 0.34% | | | | | | |
| Ladder Capital Finance Holdings LP 144A | | 5.25 | 10-1-2025 | | 1,685,000 | 1,685,000 |
| United Wholesale Mortgage LLC 144A%% | | 5.50 | 4-15-2029 | | 435,000 | 435,000 |
| | | | | | | 2,120,000 |
| Health care: 6.58% | | | | | | |
| Health care equipment & supplies: 1.59% | | | | | | |
| Hologic Incorporated 144A | | 3.25 | 2-15-2029 | | 5,000,000 | 4,937,500 |
| Surgery Center Holdings Incorporated 144A | | 6.75 | 7-1-2025 | | 820,000 | 838,204 |
| Teleflex Incorporated | | 4.63 | 11-15-2027 | | 1,144,000 | 1,211,210 |
| Teleflex Incorporated | | 4.88 | 6-1-2026 | | 3,000,000 | 3,075,000 |
| | | | | | | 10,061,914 |
| Health care providers & services: 3.95% | | | | | | |
| AMN Healthcare Incorporated 144A | | 4.00 | 4-15-2029 | | 4,500,000 | 4,477,500 |
| AMN Healthcare Incorporated 144A | | 4.63 | 10-1-2027 | | 1,350,000 | 1,380,375 |
| Catalent Pharma Solutions Incorporated 144A | | 3.13 | 2-15-2029 | | 2,900,000 | 2,784,000 |
| Centene Corporation | | 3.38 | 2-15-2030 | | 1,480,000 | 1,493,868 |
| Centene Corporation | | 4.63 | 12-15-2029 | | 1,390,000 | 1,504,404 |
| Community Health Systems Incorporated 144A | | 6.63 | 2-15-2025 | | 800,000 | 844,504 |
| Davita Incorporated | | 4.63 | 6-1-2030 | | 6,200,000 | 6,316,932 |
| Encompass Health Corporation | | 4.63 | 4-1-2031 | | 3,000,000 | 3,105,000 |
| HealthSouth Corporation | | 5.13 | 3-15-2023 | | 1,334,000 | 1,335,334 |
| Select Medical Corporation 144A | | 6.25 | 8-15-2026 | | 390,000 | 414,476 |
| Tenet Healthcare Corporation | | 4.88 | 1-1-2026 | | 405,000 | 421,103 |
| Vizient Incorporated 144A | | 6.25 | 5-15-2027 | | 790,000 | 838,388 |
| | | | | | | 24,915,884 |
| Health care technology: 0.52% | | | | | | |
| IQVIA Incorporated 144A | | 5.00 | 10-15-2026 | | 3,160,000 | 3,282,450 |
| Life sciences tools & services: 0.52% | | | | | | |
| Charles River Laboratories Incorporated 144A | | 4.00 | 3-15-2031 | | 2,100,000 | 2,134,755 |
| Charles River Laboratories Incorporated 144A | | 4.25 | 5-1-2028 | | 1,100,000 | 1,133,000 |
| | | | | | | 3,267,755 |
| Industrials: 7.24% | | | | | | |
| Aerospace & defense: 1.70% | | | | | | |
| Moog Incorporated 144A | | 4.25 | 12-15-2027 | | 2,000,000 | 2,040,000 |
| Spirit AeroSystems Holdings Incorporated | | 4.60 | 6-15-2028 | | 425,000 | 416,500 |
| Spirit AeroSystems Holdings Incorporated | | 5.50 | 1-15-2025 | | 1,190,000 | 1,258,425 |
| TransDigm Group Incorporated 144A | | 4.63 | 1-15-2029 | | 1,850,000 | 1,824,193 |
| TransDigm Group Incorporated | | 6.38 | 6-15-2026 | | 5,000,000 | 5,168,750 |
| | | | | | | 10,707,868 |
The accompanying notes are an integral part of these financial statements.
Wells Fargo Diversified Income Builder Fund | 19
Portfolio of investments—March 31, 2021 (unaudited)
| | | Interest
rate | Maturity
date | Principal | Value |
| Airlines: 1.38% | | | | | | |
| American Airlines Group Incorporated 144A | | 3.75% | 3-1-2025 | $ | 325,000 | $ 277,261 |
| American Airlines Group Incorporated 144A | | 5.50 | 4-20-2026 | | 825,000 | 858,569 |
| American Airlines Group Incorporated 144A | | 5.75 | 4-20-2029 | | 1,275,000 | 1,356,154 |
| Delta Air Lines Incorporated | | 3.75 | 10-28-2029 | | 1,275,000 | 1,243,167 |
| Delta Air Lines Incorporated 144A | | 4.75 | 10-20-2028 | | 1,915,000 | 2,082,363 |
| Mileage Plus Holdings LLC 144A | | 6.50 | 6-20-2027 | | 1,540,000 | 1,688,225 |
| United Airlines Pass-Through Trust Certificates Series 2020-1 Class A | | 5.88 | 4-15-2029 | | 1,097,803 | 1,217,127 |
| | | | | | | 8,722,866 |
| Commercial services & supplies: 1.96% | | | | | | |
| ACCO Brands Corporation 144A | | 4.25 | 3-15-2029 | | 3,000,000 | 2,918,400 |
| Clean Harbors Incorporated 144A | | 4.88 | 7-15-2027 | | 1,500,000 | 1,582,500 |
| Clean Harbors Incorporated 144A | | 5.13 | 7-15-2029 | | 2,000,000 | 2,123,260 |
| Covanta Holding Corporation | | 5.88 | 7-1-2025 | | 405,000 | 419,175 |
| Northern Light Health | | 5.02 | 7-1-2036 | | 1,000,000 | 1,059,431 |
| Plastipak Holdings Incorporated | | 6.25 | 10-15-2025 | | 815,000 | 838,431 |
| Stericycle Incorporated 144A | | 3.88 | 1-15-2029 | | 3,470,000 | 3,426,625 |
| | | | | | | 12,367,822 |
| Construction & engineering: 0.34% | | | | | | |
| Aecom Company | | 5.13 | 3-15-2027 | | 1,395,000 | 1,517,934 |
| Dycom Industries Incorporated 144A%% | | 4.50 | 4-15-2029 | | 640,000 | 641,600 |
| | | | | | | 2,159,534 |
| Electrical equipment: 0.93% | | | | | | |
| Sensata Technologies BV 144A | | 4.00 | 4-15-2029 | | 5,750,000 | 5,853,673 |
| Machinery: 0.33% | | | | | | |
| Meritor Incorporated | | 4.50 | 12-15-2028 | | 410,000 | 411,230 |
| Stevens Holding Company Incorporated 144A | | 6.13 | 10-1-2026 | | 1,545,000 | 1,657,013 |
| | | | | | | 2,068,243 |
| Road & rail: 0.26% | | | | | | |
| Uber Technologies Incorporated 144A | | 8.00 | 11-1-2026 | | 1,540,000 | 1,667,050 |
| Trading companies & distributors: 0.34% | | | | | | |
| Fortress Transportation & Infrastructure Investors LLC 144A | | 6.50 | 10-1-2025 | | 2,040,000 | 2,131,800 |
| Information technology: 4.35% | | | | | | |
| Communications equipment: 1.16% | | | | | | |
| CommScope Incorporated 144A | | 8.25 | 3-1-2027 | | 795,000 | 850,650 |
| CommScope Technologies LLC 144A | | 5.00 | 3-15-2027 | | 6,500,000 | 6,439,095 |
| | | | | | | 7,289,745 |
| Electronic equipment, instruments & components: 1.28% | | | | | | |
| MTS Systems Corporation 144A | | 5.75 | 8-15-2027 | | 4,140,000 | 4,510,013 |
| TTM Technologies Incorporated 144A | | 4.00 | 3-1-2029 | | 3,615,000 | 3,569,813 |
| | | | | | | 8,079,826 |
| IT services: 0.13% | | | | | | |
| Sabre GLBL Incorporated 144A | | 9.25 | 4-15-2025 | | 700,000 | 834,750 |
The accompanying notes are an integral part of these financial statements.
20 | Wells Fargo Diversified Income Builder Fund
Portfolio of investments—March 31, 2021 (unaudited)
| | | Interest
rate | Maturity
date | Principal | Value |
| Semiconductors & semiconductor equipment: 0.90% | | | | | | |
| Synaptics Incorporated 144A | | 4.00% | 6-15-2029 | $ | 5,750,000 | $ 5,705,725 |
| Software: 0.20% | | | | | | |
| Logan Merger Sub Incorporated 144A | | 5.50 | 9-1-2027 | | 400,000 | 418,752 |
| MPH Acquisition Holdings Company 144A | | 5.75 | 11-1-2028 | | 855,000 | 833,625 |
| | | | | | | 1,252,377 |
| Technology hardware, storage & peripherals: 0.68% | | | | | | |
| NCR Corporation 144A%% | | 5.13 | 4-15-2029 | | 125,000 | 125,938 |
| NCR Corporation 144A | | 5.75 | 9-1-2027 | | 800,000 | 846,500 |
| Western Digital Corporation | | 4.75 | 2-15-2026 | | 3,000,000 | 3,307,350 |
| | | | | | | 4,279,788 |
| Materials: 4.01% | | | | | | |
| Chemicals: 2.10% | | | | | | |
| Koppers Incorporated 144A | | 6.00 | 2-15-2025 | | 1,564,000 | 1,612,156 |
| Olin Corporation | | 5.13 | 9-15-2027 | | 2,460,000 | 2,546,100 |
| Olin Corporation | | 5.50 | 8-15-2022 | | 2,705,000 | 2,819,963 |
| Tronox Incorporated 144A | | 4.63 | 3-15-2029 | | 3,050,000 | 3,053,813 |
| Valvoline Incorporated 144A | | 3.63 | 6-15-2031 | | 3,322,000 | 3,214,035 |
| | | | | | | 13,246,067 |
| Containers & packaging: 1.37% | | | | | | |
| Ball Corporation | | 2.88 | 8-15-2030 | | 6,950,000 | 6,694,588 |
| Berry Global Incorporated « | | 5.13 | 7-15-2023 | | 676,000 | 683,605 |
| Flex Acquisition Company Incorporated 144A | | 7.88 | 7-15-2026 | | 1,205,000 | 1,263,744 |
| | | | | | | 8,641,937 |
| Metals & mining: 0.40% | | | | | | |
| Arches Buyer Incorporated 144A | | 4.25 | 6-1-2028 | | 420,000 | 419,244 |
| Arches Buyer Incorporated 144A | | 6.13 | 12-1-2028 | | 405,000 | 417,150 |
| Cleveland Cliffs Incorporated | | 5.88 | 6-1-2027 | | 410,000 | 424,350 |
| Cleveland Cliffs Incorporated 144A | | 9.88 | 10-17-2025 | | 355,000 | 415,900 |
| Freeport-McMoRan Incorporated | | 4.13 | 3-1-2028 | | 800,000 | 840,960 |
| | | | | | | 2,517,604 |
| Paper & forest products: 0.14% | | | | | | |
| Vertical US Newco Incorporated | | 5.25 | 7-15-2027 | | 815,000 | 853,203 |
| Real estate: 2.01% | | | | | | |
| Equity REITs: 2.01% | | | | | | |
| Iron Mountain Incorporated 144A | | 4.88 | 9-15-2027 | | 3,570,000 | 3,652,556 |
| Sabra Health Care LP | | 3.90 | 10-15-2029 | | 1,690,000 | 1,724,474 |
| SBA Communications Corporation 144A | | 3.13 | 2-1-2029 | | 3,250,000 | 3,123,738 |
| SBA Communications Corporation | | 3.88 | 2-15-2027 | | 2,475,000 | 2,529,945 |
| Service Properties Trust Company | | 4.95 | 2-15-2027 | | 1,685,000 | 1,666,044 |
| | | | | | | 12,696,757 |
| Utilities: 0.72% | | | | | | |
| Electric utilities: 0.46% | | | | | | |
| NextEra Energy Operating Partners LP | | 4.50 | 9-15-2027 | | 1,120,000 | 1,211,000 |
The accompanying notes are an integral part of these financial statements.
Wells Fargo Diversified Income Builder Fund | 21
Portfolio of investments—March 31, 2021 (unaudited)
| | | Interest
rate | Maturity
date | Principal | Value |
| Electric utilities (continued) | | | | | | |
| NRG Energy Incorporated 144A | | 5.25% | 6-15-2029 | $ | 770,000 | $ 823,900 |
| PG&E Corporation | | 5.25 | 7-1-2030 | | 790,000 | 837,400 |
| | | | | | | 2,872,300 |
| Independent power & renewable electricity producers: 0.26% | | | | | | |
| TerraForm Power Operating LLC | | 5.00 | 1-31-2028 | | 1,530,000 | 1,650,947 |
| Total Corporate bonds and notes (Cost $281,757,251) | | | | | | 283,050,516 |
| | | | | Shares | |
| Exchange-traded funds: 2.77% | | | | | | |
| Energy Select Sector SPDR Fund | | | | | 117,713 | 5,775,000 |
| The Industrial Select Sector SPDR Fund | | | | | 118,835 | 11,699,292 |
| Total Exchange-traded funds (Cost $15,594,947) | | | | | | 17,474,292 |
| | | | | Principal | |
| Foreign corporate bonds and notes: 2.73% | | | | | | |
| Financials: 2.73% | | | | | | |
| Banks: 2.73% | | | | | | |
| ABN AMRO Bank NV (EUR Swap Annual (vs. 6 Month EURIBOR) 5 Year +3.90%) ʊ± | | 4.75 | 9-22-2027 | EUR | 3,000,000 | 3,807,464 |
| AIB Group plc (EUR Swap Annual (vs. 6 Month EURIBOR) 5 Year +6.63%) ± | | 6.25 | 6-23-2025 | EUR | 2,000,000 | 2,629,869 |
| Banco Santander SA (EUR Swap Annual (vs. 6 Month EURIBOR) 5 Year +4.53%) ʊ± | | 4.38 | 1-14-2026 | EUR | 3,000,000 | 3,610,450 |
| Bankia SA (EUR Swap Annual (vs. 6 Month EURIBOR) 5 Year +6.22%) ʊ± | | 6.38 | 9-19-2023 | EUR | 3,000,000 | 3,819,320 |
| Cooperatieve Rabobank UA (EUR Swap Annual (vs. 6 Month EURIBOR) 5 Year +6.63%) ± | | 6.63 | 12-29-2049 | EUR | 2,800,000 | 3,332,813 |
| | | | | | | 17,199,916 |
| Total Foreign corporate bonds and notes (Cost $15,921,075) | | | | | | 17,199,916 |
| Loans: 1.14% | | | | | | |
| Communication services: 0.12% | | | | | | |
| Diversified telecommunication services: 0.03% | | | | | | |
| Consolidated Communications Incorporated (1 Month LIBOR+3.50%) ± | | 4.25 | 10-2-2027 | $ | 204,000 | 203,894 |
| Media: 0.09% | | | | | | |
| Clear Channel Outdoor Holdings (1 Month LIBOR+3.50%) ± | | 3.61 | 8-21-2026 | | 555,000 | 532,339 |
| Consumer discretionary: 0.14% | | | | | | |
| Distributors: 0.07% | | | | | | |
| Spin Holdco Incorporated (1 Month LIBOR+4.00%) ± | | 4.75 | 3-1-2028 | | 420,000 | 416,098 |
| Hotels, restaurants & leisure: 0.00% | | | | | | |
| CCM Merger Incorporated (1 Month LIBOR+3.75%) ± | | 4.50 | 11-4-2025 | | 30,000 | 30,019 |
| Specialty retail: 0.07% | | | | | | |
| Great Outdoors Group LLC (1 Month LIBOR+4.25%) ± | | 5.00 | 3-6-2028 | | 413,963 | 414,169 |
The accompanying notes are an integral part of these financial statements.
22 | Wells Fargo Diversified Income Builder Fund
Portfolio of investments—March 31, 2021 (unaudited)
| | | Interest
rate | Maturity
date | Principal | Value |
| Financials: 0.08% | | | | | | |
| Capital markets: 0.07% | | | | | | |
| Nexus Buyer LLC (1 Month LIBOR+3.75%) ± | | 3.93% | 11-9-2026 | $ | 420,000 | $ 417,640 |
| Diversified financial services: 0.01% | | | | | | |
| Acuris Finance U.S. Incorporated (1 Month LIBOR+4.00%) ౠ| | 4.50 | 2-16-2028 | | 100,000 | 99,125 |
| Health care: 0.33% | | | | | | |
| Health care providers & services: 0.28% | | | | | | |
| Air Methods Corporation (3 Month LIBOR+3.50%) ± | | 4.50 | 4-22-2024 | | 425,000 | 410,818 |
| National Mentor Holdings Incorporated (1 Month LIBOR+3.75%) ± | | 4.50 | 2-18-2028 | | 446,064 | 443,053 |
| National Mentor Holdings Incorporated (1 Month LIBOR+3.75%) ± | | 4.50 | 2-18-2028 | | 14,869 | 14,768 |
| National Mentor Holdings Incorporated (1 Month LIBOR+3.75%) ± | | 4.50 | 2-18-2028 | | 49,067 | 48,736 |
| Surgery Center Holdings Incorporated (3 Month LIBOR+3.25%) ± | | 4.25 | 9-3-2024 | | 835,665 | 826,656 |
| | | | | | | 1,744,031 |
| Health care technology: 0.05% | | | | | | |
| Project Ruby Ultimate Parent Corporation (1 Month LIBOR+3.25%) ± | | 4.00 | 3-3-2028 | | 335,000 | 333,466 |
| Industrials: 0.41% | | | | | | |
| Airlines: 0.14% | | | | | | |
| JetBlue Airways Corporation (1 Month LIBOR+5.25%) ± | | 6.25 | 6-17-2024 | | 625,000 | 639,063 |
| Mileage Plus Holdings LLC (1 Month LIBOR+5.25%) ± | | 6.25 | 6-21-2027 | | 155,000 | 164,519 |
| WestJet Airlines Limited (3 Month LIBOR+3.00%) ± | | 4.00 | 12-11-2026 | | 110,000 | 106,597 |
| | | | | | | 910,179 |
| Industrial conglomerates: 0.10% | | | | | | |
| Werner Finco LP (3 Month LIBOR+4.00%) ౠ| | 5.00 | 7-24-2024 | | 613,411 | 608,810 |
| Professional services: 0.13% | | | | | | |
| The Dun & Bradstreet Corporation (1 Month LIBOR+3.25%) ± | | 3.36 | 2-6-2026 | | 832,913 | 827,707 |
| Road & rail: 0.04% | | | | | | |
| Uber Technologies Incorporated (1 Month LIBOR+3.50%) ± | | 3.61 | 4-4-2025 | | 225,000 | 223,781 |
| Information technology: 0.06% | | | | | | |
| Software: 0.06% | | | | | | |
| Emerald Topco Incorporated (1 Month LIBOR+3.50%) ± | | 3.71 | 7-24-2026 | | 418,937 | 414,957 |
| Total Loans (Cost $7,223,909) | | | | | | 7,176,215 |
| Municipal obligations: 2.71% | | | | | | |
| California: 0.45% | | | | | | |
| Education revenue: 0.35% | | | | | | |
| California School Finance Authority Charter School 144A | | 4.25 | 7-1-2025 | | 935,000 | 924,961 |
| California School Finance Authority Charter School 144A | | 5.00 | 6-15-2031 | | 1,350,000 | 1,299,102 |
| | | | | | | 2,224,063 |
The accompanying notes are an integral part of these financial statements.
Wells Fargo Diversified Income Builder Fund | 23
Portfolio of investments—March 31, 2021 (unaudited)
| | | Interest
rate | Maturity
date | Principal | Value |
| Health revenue: 0.10% | | | | | | |
| California Municipal Finance Authority Series 2019B 144A | | 4.25% | 11-1-2023 | $ | 610,000 | $ 610,001 |
| Colorado: 0.07% | | | | | | |
| Health revenue: 0.07% | | | | | | |
| Denver CO Health & Hospital Authority Series B | | 5.15 | 12-1-2026 | | 445,000 | 467,925 |
| Florida: 0.25% | | | | | | |
| Education revenue: 0.25% | | | | | | |
| Capital Trust Agency Renaissance Charter School Project Series B 144A | | 5.63 | 6-15-2023 | | 495,000 | 501,269 |
| Florida HEFAR Jacksonville University Project Series A2 144A | | 5.43 | 6-1-2027 | | 1,000,000 | 1,077,106 |
| | | | | | | 1,578,375 |
| Georgia: 0.08% | | | | | | |
| Health revenue: 0.08% | | | | | | |
| Cobb County Development Authority Presbyterian Village Austell Project Series 2019B 144A | | 5.75 | 12-1-2028 | | 500,000 | 491,643 |
| Guam: 0.10% | | | | | | |
| Airport revenue: 0.10% | | | | | | |
| Guam Port Authority Series C | | 3.78 | 7-1-2021 | | 635,000 | 637,424 |
| Illinois: 0.50% | | | | | | |
| Miscellaneous revenue: 0.50% | | | | | | |
| Chicago IL Board of Education Taxable Build America Bonds Series E | | 6.04 | 12-1-2029 | | 1,255,000 | 1,438,102 |
| Chicago IL Certificate of Participation River Point Plaza Redevelopment Project Series A 144A | | 4.84 | 4-15-2028 | | 1,640,000 | 1,699,611 |
| | | | | | | 3,137,713 |
| Indiana: 0.08% | | | | | | |
| Health revenue: 0.08% | | | | | | |
| Knox County IN Good Samaritian Hospital Project Industry Economic Development Series B | | 5.90 | 4-1-2034 | | 480,000 | 497,604 |
| Iowa: 0.19% | | | | | | |
| GO revenue: 0.19% | | | | | | |
| Coralville IA Series C | | 5.00 | 5-1-2030 | | 1,200,000 | 1,195,820 |
| Louisiana: 0.14% | | | | | | |
| Health revenue: 0.14% | | | | | | |
| Louisiana Local Government Environmental Facilities and Community Development Authority | | 5.75 | 1-1-2029 | | 935,000 | 924,269 |
| New Jersey: 0.16% | | | | | | |
| Education revenue: 0.16% | | | | | | |
| New Jersey Educational Facilities Authority Georgian Court University Series H | | 4.25 | 7-1-2028 | | 1,000,000 | 1,003,133 |
The accompanying notes are an integral part of these financial statements.
24 | Wells Fargo Diversified Income Builder Fund
Portfolio of investments—March 31, 2021 (unaudited)
| | | Interest
rate | Maturity
date | Principal | Value |
| New York: 0.22% | | | | | | |
| Education revenue: 0.09% | | | | | | |
| Yonkers Economic Development Corporation Series 2019B | | 4.50% | 10-15-2024 | $ | 545,000 | $ 539,606 |
| Health revenue: 0.04% | | | | | | |
| Jefferson County NY Civic Facility Development Corporation Refunding Bond Series B Samaritan Medical Center Obligated Group | | 4.25 | 11-1-2028 | | 275,000 | 281,264 |
| Utilities revenue: 0.09% | | | | | | |
| New York Energy Research & Development Authority Green Bond Series A | | 4.81 | 4-1-2034 | | 500,000 | 549,926 |
| Oklahoma: 0.09% | | | | | | |
| Health revenue: 0.09% | | | | | | |
| Oklahoma Development Finance Authority | | 5.45 | 8-15-2028 | | 500,000 | 554,956 |
| Tennessee: 0.16% | | | | | | |
| Tax revenue: 0.16% | | | | | | |
| Bristol TN Industrial Development Board The Pinnacle Project Series A 144A | | 5.13 | 12-1-2042 | | 1,000,000 | 1,011,833 |
| Wisconsin: 0.22% | | | | | | |
| Education revenue: 0.22% | | | | | | |
| PFA Burrell College of Osteopathic Medicine Project 144A | | 5.13 | 6-1-2028 | | 1,360,000 | 1,369,779 |
| Total Municipal obligations (Cost $16,513,281) | | | | | | 17,075,334 |
| Non-agency mortgage-backed securities: 0.75% | | | | | | |
| AFN LLC Series 2019-1A Class A2 144A | | 4.46 | 5-20-2049 | | 1,000,000 | 1,035,060 |
| Capital Automotive Real Estate Services Series 1A Class A6 144A | | 3.81 | 2-15-2050 | | 499,479 | 504,250 |
| Citigroup Commercial Mortgage Trust Series 2015-GC27 Class B | | 3.77 | 2-10-2048 | | 2,524,616 | 2,686,335 |
| JPMorgan Mortgage Trust Series 2019-2 Class A3 144A±± | | 4.00 | 8-25-2049 | | 213,795 | 218,887 |
| Sequoia Mortgage Trust Series 2018-6 Class A19 144A±± | | 4.00 | 7-25-2048 | | 309,257 | 313,924 |
| Total Non-agency mortgage-backed securities (Cost $4,569,844) | | | | | | 4,758,456 |
| | | Dividend Yield | | | Shares | |
| Preferred stocks: 0.07% | | | | | | |
| Financials: 0.01% | | | | | | |
| Banks: 0.01% | | | | | | |
| Itaúsa SA | | 2.46 | | | 38,000 | 69,672 |
| Information technology: 0.04% | | | | | | |
| Technology hardware, storage & peripherals: 0.04% | | | | | | |
| Samsung Electronics Company Limited | | 4.15 | | | 4,016 | 259,040 |
The accompanying notes are an integral part of these financial statements.
Wells Fargo Diversified Income Builder Fund | 25
Portfolio of investments—March 31, 2021 (unaudited)
| | | Dividend Yield | | | Shares | Value |
| Materials: 0.02% | | | | | | |
| Chemicals: 0.02% | | | | | | |
| LG Chem Limited | | 2.63% | | | 363 | $ 123,165 |
| Total Preferred stocks (Cost $348,225) | | | | | | 451,877 |
| | | Interest
rate | Maturity
date | Principal | |
| Yankee corporate bonds and notes: 10.66% | | | | | | |
| Communication services: 0.14% | | | | | | |
| Wireless telecommunication services: 0.14% | | | | | | |
| Connect U.S. Finco LLC 144A | | 6.75 | 10-1-2026 | $ | 795,000 | 846,468 |
| Energy: 0.53% | | | | | | |
| Oil, gas & consumable fuels: 0.53% | | | | | | |
| Baytex Energy Corporation 144A | | 5.63 | 6-1-2024 | | 2,235,000 | 2,100,900 |
| Northriver Midstream Finance LP 144A | | 5.63 | 2-15-2026 | | 1,215,000 | 1,262,993 |
| | | | | | | 3,363,893 |
| Financials: 5.49% | | | | | | |
| Banks: 4.07% | | | | | | |
| Barclays plc (USD Swap Semi Annual (vs. 3 Month LIBOR) 5 Year+4.84%) ʊ± | | 7.75 | 9-15-2023 | | 2,160,000 | 2,356,992 |
| Credit Agricole SA (USD Swap Semi Annual (vs. 3 Month LIBOR) 5 Year+4.90%) 144A± | | 7.88 | 12-29-2049 | | 1,750,000 | 1,962,188 |
| Credit Agricole SA (USD Swap Semi Annual (vs. 3 Month LIBOR) 5 Year+6.19%) 144A± | | 8.13 | 12-29-2049 | | 1,750,000 | 2,108,750 |
| Danske Bank AS (7 Year Treasury Constant Maturity+4.13%) ʊ± | | 7.00 | 6-26-2025 | | 2,300,000 | 2,581,750 |
| HSBC Holdings plc (USD ICE Swap Rate 11:00am NY 5 Year+4.37%) ± | | 6.38 | 12-29-2049 | | 2,000,000 | 2,204,000 |
| ING Groep NV (USD ICE Swap Rate 11:00am NY 5 Year+4.20%) ʊ± | | 6.75 | 4-16-2024 | | 3,800,000 | 4,142,000 |
| Lloyds Banking Group plc (USD Swap Semi Annual (vs. 3 Month LIBOR) 5 Year+4.76%) ± | | 7.50 | 4-30-2049 | | 3,665,000 | 4,086,475 |
| Skandinaviska Enskilda Banken AB (5 Year Treasury Constant Maturity+3.46%) ʊ± | | 5.13 | 5-13-2025 | | 2,000,000 | 2,110,008 |
| Societe Generale SA (USD ICE Swap Rate 11:00am NY 5 Year+5.87%) 144A± | | 8.00 | 12-29-2049 | | 3,535,000 | 4,145,848 |
| | | | | | | 25,698,011 |
| Capital markets: 1.17% | | | | | | |
| Credit Suisse Group AG (USD Swap Semi Annual (vs. 3 Month LIBOR) 5 Year+4.60%) 144A± | | 7.50 | 12-29-2049 | | 2,395,000 | 2,592,176 |
| Credit Suisse Group AG (5 Year Treasury Constant Maturity+4.89%) 144Aʊ± | | 5.25 | 2-11-2027 | | 1,000,000 | 1,010,000 |
| UBS Group Funding Switzerland AG (USD Swap Semi Annual (vs. 6 Month LIBOR) 5 Year+4.87%) ± | | 7.00 | 12-29-2049 | | 3,330,000 | 3,796,200 |
| | | | | | | 7,398,376 |
| Diversified financial services: 0.25% | | | | | | |
| Tronox Finance plc 144A | | 5.75 | 10-1-2025 | | 1,475,000 | 1,538,617 |
The accompanying notes are an integral part of these financial statements.
26 | Wells Fargo Diversified Income Builder Fund
Portfolio of investments—March 31, 2021 (unaudited)
| | | Interest
rate | Maturity
date | Principal | Value |
| Health care: 1.88% | | | | | | |
| Pharmaceuticals: 1.88% | | | | | | |
| Bausch Health Companies Incorporated 144A | | 5.25% | 1-30-2030 | $ | 7,500,000 | $ 7,539,000 |
| Bausch Health Companies Incorporated 144A | | 5.75 | 8-15-2027 | | 385,000 | 414,356 |
| Bausch Health Companies Incorporated 144A | | 6.25 | 2-15-2029 | | 1,180,000 | 1,254,294 |
| Bausch Health Companies Incorporated 144A | | 8.50 | 1-31-2027 | | 755,000 | 837,578 |
| Endo Luxembourg Finance Company SARL 144A | | 6.13 | 4-1-2029 | | 95,000 | 95,831 |
| Teva Pharmaceutical Finance Netherlands III BV « | | 6.75 | 3-1-2028 | | 1,515,000 | 1,702,103 |
| | | | | | | 11,843,162 |
| Industrials: 0.80% | | | | | | |
| Aerospace & defense: 0.18% | | | | | | |
| Bombardier Incorporated 144A | | 7.88 | 4-15-2027 | | 1,130,000 | 1,108,180 |
| Electrical equipment: 0.28% | | | | | | |
| Sensata Technologies BV 144A | | 5.63 | 11-1-2024 | | 1,605,000 | 1,781,550 |
| Machinery: 0.13% | | | | | | |
| Vertical Holdco GmbH | | 7.63 | 7-15-2028 | | 780,000 | 838,695 |
| Trading companies & distributors: 0.21% | | | | | | |
| FLY Leasing Limited « | | 5.25 | 10-15-2024 | | 1,315,000 | 1,342,122 |
| Information technology: 0.77% | | | | | | |
| Technology hardware, storage & peripherals: 0.77% | | | | | | |
| Seagate HDD 144A | | 3.13 | 7-15-2029 | | 1,000,000 | 965,825 |
| Seagate HDD 144A | | 4.09 | 6-1-2029 | | 1,908,000 | 1,944,300 |
| Seagate HDD 144A | | 4.88 | 6-1-2027 | | 1,761,000 | 1,934,899 |
| | | | | | | 4,845,024 |
| Materials: 1.05% | | | | | | |
| Chemicals: 0.99% | | | | | | |
| Methanex Corporation | | 5.13 | 10-15-2027 | | 3,755,000 | 3,839,488 |
| Methanex Corporation | | 5.25 | 12-15-2029 | | 2,320,000 | 2,392,929 |
| | | | | | | 6,232,417 |
| Containers & packaging: 0.06% | | | | | | |
| Ardagh Packaging Finance plc | | 4.13 | 8-15-2026 | | 405,000 | 415,016 |
| Total Yankee corporate bonds and notes (Cost $63,570,557) | | | | | | 67,251,531 |
| | | Yield | | | Shares | |
| Short-term investments: 4.61% | | | | | | |
| Investment companies: 4.61% | | | | | | |
| Securities Lending Cash Investments LLC ♠∩∞ | | 0.04 | | | 9,937,814 | 9,937,814 |
| Wells Fargo Government Money Market Fund Select Class ♠∞## | | 0.03 | | | 19,137,850 | 19,137,850 |
| Total Short-term investments (Cost $29,075,664) | | | | | | 29,075,664 |
| Total investments in securities (Cost $583,118,399) | 100.09% | | | | | 631,387,231 |
| Other assets and liabilities, net | (0.09) | | | | | (548,033) |
| Total net assets | 100.00% | | | | | $630,839,198 |
The accompanying notes are an integral part of these financial statements.
Wells Fargo Diversified Income Builder Fund | 27
Portfolio of investments—March 31, 2021 (unaudited)
| 144A | The security may be resold in transactions exempt from registration, normally to qualified institutional buyers, pursuant to Rule 144A under the Securities Act of 1933. |
| † | Non-income-earning security |
| ± | Variable rate investment. The rate shown is the rate in effect at period end. |
| ‡ | Security is valued using significant unobservable inputs. |
| ±± | The coupon of the security is adjusted based on the principal and interest payments received from the underlying pool of mortgages as well as the credit quality and the actual prepayment speed of the underlying mortgages. |
| ## | All or a portion of this security is segregated for when-issued securities. |
| « | All or a portion of this security is on loan. |
| ♠ | The issuer of the security is an affiliated person of the Fund as defined in the Investment Company Act of 1940. |
| ∩ | The investment is a non-registered investment company purchased with cash collateral received from securities on loan. |
| ∞ | The rate represents the 7-day annualized yield at period end. |
| # | All or a portion of this security is segregated as collateral for investments in derivative instruments. |
| %% | The security is purchased on a when-issued basis. |
| ʊ | Security is perpetual in nature and has no stated maturity date. The date shown reflects the next call date. |
| Abbreviations: |
| ADR | American depositary receipt |
| EUR | Euro |
| EURIBOR | Euro Interbank Offered Rate |
| GDR | Global depositary receipt |
| GO | General obligation |
| HEFAR | Higher Education Facilities Authority Revenue |
| LIBOR | London Interbank Offered Rate |
| PFA | Public Finance Authority |
| REIT | Real estate investment trust |
| SOFR | Secured Overnight Financing Rate |
Investments in affiliates
An affiliated investment is an investment in which the Fund owns at least 5% of the outstanding voting shares of the issuer or as a result of other relationships, such as the Fund and the issuer having the same investment manager. Transactions with issuers that were either affiliated persons of the Fund at the beginning of the period or the end of the period were as follows:
| | Value,
beginning of
period | Purchases | Sales
proceeds | Net
realized
gains
(losses) | | Net
change in
unrealized
gains
(losses) | | Value,
end of
period | | % of
net
assets | Shares,
end
of period | Income
from
affiliated
securities |
| Short-term investments | | | | | | | | | | | | |
| Investment companies | | | | | | | | | | | | |
| Securities Lending Cash Investments LLC | $ 0 | $ 74,343,849 | $ (64,406,035) | $0 | | $0 | | $ 9,937,814 | | | 9,937,814 | $ 1,405# |
| Wells Fargo Government Money Market Fund Select Class | 24,438,752 | 166,807,351 | (172,108,253) | 0 | | 0 | | 19,137,850 | | | 19,137,850 | 3,294 |
| | | | | $0 | | $0 | | $29,075,664 | | 4.61% | | $4,699 |
| # | Amount shown represents income before fees and rebates. |
Forward foreign currency contracts
Currency to be
received | Currency to be
delivered | Counterparty | Settlement
date | Unrealized
gains | Unrealized
losses |
| 17,674,198 USD | 14,800,000 EUR | Citibank NA | 6-30-2021 | $285,086 | $0 |
The accompanying notes are an integral part of these financial statements.
28 | Wells Fargo Diversified Income Builder Fund
Portfolio of investments—March 31, 2021 (unaudited)
Futures contracts
| Description | Number of
contracts | Expiration
date | Notional
cost | Notional
value | Unrealized
gains | | Unrealized
losses |
| Long | | | | | | | |
| IBEX 35 Index | 286 | 4-16-2021 | $ 28,991,134 | $ 28,799,122 | $ 0 | | $ (192,012) |
| OMX Stockholm 30 Index | 1,115 | 4-16-2021 | 27,494,071 | 27,924,632 | 430,561 | | 0 |
| E-Mini Russell 2000 Index | 171 | 6-18-2021 | 20,084,347 | 19,002,375 | 0 | | (1,081,972) |
| E-Mini S&P 500 Index | 72 | 6-18-2021 | 14,260,402 | 14,282,640 | 22,238 | | 0 |
| MSCI Emerging Markets Index | 338 | 6-18-2021 | 22,557,329 | 22,350,250 | 0 | | (207,079) |
| Short | | | | | | | |
| E-Mini Nasdaq 100 Index | (59) | 6-18-2021 | (15,250,771) | (15,445,905) | 0 | | (195,134) |
| Euro STOXX 50 Futures | (594) | 6-18-2021 | (26,305,171) | (26,929,930) | 0 | | (624,759) |
| Mini-DAX Futures | (331) | 6-18-2021 | (28,224,970) | (29,168,561) | 0 | | (943,591) |
| | | | | | $452,799 | | $(3,244,547) |
Centrally cleared credit default swap contracts
| Reference index | Fixed rate
received | Payment
frequency | Maturity
date | Notional
amount | Value | Premiums
paid
(received) | Unrealized
gains | Unrealized
losses |
| Sell Protection | | | | | | | | | |
| Markit CDX North America High Yield Index | 1.00% | Quarterly | 12-20-2025 | | $1,000,000 | $90,581 | $85,332 | $5,249 | $0 |
Written options
| Description | Counterparty | Number of
contracts | Notional
amount | Exercise
price | Expiration
date | Value |
| Call | | | | | | |
| Dow Jones Industrial Average | Morgan Stanley Company Incorporated | (226) | $ (7,571,000) | $ 335.00 | 4-16-2021 | $ (38,985) |
| iShares MSCI EAFE ETF | Morgan Stanley Company Incorporated | (452) | (3,503,000) | 77.50 | 4-9-2021 | (5,787) |
| iShares MSCI EAFE ETF | Morgan Stanley Company Incorporated | (520) | (4,056,000) | 78.00 | 4-16-2021 | (7,800) |
| iShares MSCI EAFE ETF | Morgan Stanley Company Incorporated | (3,995) | (31,560,500) | 79.00 | 4-23-2021 | (39,950) |
| iShares MSCI Emerging Markets ETF | Morgan Stanley Company Incorporated | (411) | (2,260,500) | 55.00 | 4-1-2021 | (151) |
| iShares MSCI Emerging Markets ETF | Morgan Stanley Company Incorporated | (612) | (3,641,400) | 59.50 | 4-1-2021 | 0 |
| iShares MSCI Emerging Markets ETF | Morgan Stanley Company Incorporated | (4,043) | (24,055,850) | 59.50 | 4-9-2021 | (1,463) |
| iShares MSCI Emerging Markets ETF | Morgan Stanley Company Incorporated | (2,992) | (17,952,000) | 60.00 | 4-16-2021 | (4,488) |
| iShares MSCI Emerging Markets ETF | Morgan Stanley Company Incorporated | (122) | (658,800) | 54.00 | 4-23-2021 | (8,357) |
| Russell 2000 Index | Morgan Stanley Company Incorporated | (2) | (450,000) | 2,250.00 | 4-1-2021 | (580) |
| Russell 2000 Index | Morgan Stanley Company Incorporated | (4) | (478,000) | 2,730.00 | 4-9-2021 | 0 |
| Russell 2000 Index | Morgan Stanley Company Incorporated | (2) | (478,000) | 2,390.00 | 4-16-2021 | (630) |
The accompanying notes are an integral part of these financial statements.
Wells Fargo Diversified Income Builder Fund | 29
Portfolio of investments—March 31, 2021 (unaudited)
Written options (continued)
| Description | Counterparty | Number of
contracts | Notional
amount | Exercise
price | Expiration
date | Value |
| S&P 500 Index | Morgan Stanley Company Incorporated | (28) | $(10,920,000) | $3,900.00 | 4-1-2021 | $(210,700) |
| S&P 500 Index | Morgan Stanley Company Incorporated | (26) | (10,452,000) | 4,020.00 | 4-9-2021 | (31,070) |
| S&P 500 Index | Morgan Stanley Company Incorporated | (18) | (7,695,000) | 4,275.00 | 4-9-2021 | (225) |
| S&P 500 Index | Morgan Stanley Company Incorporated | (28) | (11,914,000) | 4,255.00 | 4-16-2021 | (1,750) |
| S&P 500 Index | Morgan Stanley Company Incorporated | (11) | (4,405,500) | 4,005.00 | 4-16-2021 | (32,670) |
| S&P 500 Index | Morgan Stanley Company Incorporated | (30) | (12,030,000) | 4,010.00 | 4-23-2021 | (112,350) |
| SPDR Euro STOXX 50 ETF | Morgan Stanley Company Incorporated | (6,007) | (26,731,150) | 44.50 | 4-1-2021 | (105,123) |
| | | | | | | $(602,079) |
The accompanying notes are an integral part of these financial statements.
30 | Wells Fargo Diversified Income Builder Fund
Statement of assets and liabilities—March 31, 2021 (unaudited)
| | |
| Assets | |
Investments in unaffiliated securities (including $9,752,021 of securities loaned), at value (cost $554,042,735)
| $ 602,311,567 |
Investments in affiliated securites, at value (cost $29,075,664)
| 29,075,664 |
Cash
| 244,944 |
Cash at broker segregated for forward foreign currency contracts
| 250,000 |
Cash at broker segregated for futures contracts
| 13,430,534 |
Cash at broker segregated for swap contracts
| 82,505 |
Foreign currency, at value (cost $145,358)
| 145,243 |
Receivable for investments sold
| 5,183,299 |
Receivable for dividends and interest
| 5,181,895 |
Receivable for Fund shares sold
| 331,039 |
Unrealized gains on forward foreign currency contracts
| 285,086 |
Receivable for daily variation margin on open futures contracts
| 145,054 |
Receivable for daily variation margin on centrally cleared swap contracts
| 77,559 |
Receivable for securities lending income, net
| 2,730 |
Prepaid expenses and other assets
| 189,178 |
Total assets
| 656,936,297 |
| Liabilities | |
Payable for investments purchased
| 11,149,029 |
Payable upon receipt of securities loaned
| 9,937,814 |
Payable for when-issued transactions
| 1,968,644 |
Cash due to broker (including foreign currency), at value
| 1,376,678 |
Payable for Fund shares redeemed
| 736,327 |
Written options at value (premiums received $592,724)
| 602,079 |
Management fee payable
| 168,354 |
Administration fees payable
| 87,936 |
Distribution fee payable
| 68,014 |
Trustees’ fees and expenses payable
| 2,224 |
Total liabilities
| 26,097,099 |
Total net assets
| $630,839,198 |
| Net assets consist of | |
Paid-in capital
| $ 609,574,853 |
Total distributable earnings
| 21,264,345 |
Total net assets
| $630,839,198 |
| Computation of net asset value and offering price per share | |
Net assets – Class A
| $ 221,067,241 |
Shares outstanding – Class A1
| 34,954,461 |
Net asset value per share – Class A
| $6.32 |
Maximum offering price per share – Class A2
| $6.71 |
Net assets – Class C
| $ 106,578,041 |
Shares outstanding – Class C1
| 16,806,290 |
Net asset value per share – Class C
| $6.34 |
Net assets – Class R6
| $ 48,206,488 |
Shares outstanding – Class R61
| 7,817,624 |
Net asset value per share – Class R6
| $6.17 |
Net assets – Administrator Class
| $ 7,530,556 |
Shares outstanding – Administrator Class1
| 1,221,072 |
Net asset value per share – Administrator Class
| $6.17 |
Net assets – Institutional Class
| $ 247,456,872 |
Shares outstanding – Institutional Class1
| 40,166,134 |
Net asset value per share – Institutional Class
| $6.16 |
| 1 | The Fund has an unlimited number of authorized shares |
| 2 | Maximum offering price is computed as 100/94.25 of net asset value. On investments of $50,000 or more, the offering price is reduced. |
The accompanying notes are an integral part of these financial statements.
Wells Fargo Diversified Income Builder Fund | 31
Statement of operations—six months ended March 31, 2021 (unaudited)
| | |
| Investment income | |
Interest (net of foreign withholding taxes of $22)
| $ 10,337,106 |
Dividends (net of foreign withholdings taxes of $94,244)
| 2,280,678 |
Income from affiliated securities
| 11,908 |
Total investment income
| 12,629,692 |
| Expenses | |
Management fee
| 1,724,171 |
| Administration fees | |
Class A
| 231,801 |
Class C
| 116,360 |
Class R6
| 6,026 |
Administrator Class
| 5,054 |
Institutional Class
| 164,808 |
| Shareholder servicing fees | |
Class A
| 275,920 |
Class C
| 138,474 |
Administrator Class
| 9,711 |
| Distribution fee | |
Class C
| 415,397 |
Custody and accounting fees
| 63,623 |
Professional fees
| 31,429 |
Registration fees
| 51,719 |
Shareholder report expenses
| 55,457 |
Trustees’ fees and expenses
| 9,610 |
Other fees and expenses
| 28,860 |
Total expenses
| 3,328,420 |
| Less: Fee waivers and/or expense reimbursements | |
Fund-level
| (730,095) |
Class A
| (3,203) |
Net expenses
| 2,595,122 |
Net investment income
| 10,034,570 |
| Realized and unrealized gains (losses) on investments | |
| Net realized gains (losses) on | |
Unaffiliated securities
| 19,312,401 |
Forward foreign currency contracts
| 90,445 |
Futures contracts
| 9,199,940 |
Swap contracts
| (12,230) |
Written options
| (1,514,739) |
Net realized gains on investments
| 27,075,817 |
| Net change in unrealized gains (losses) on | |
Unaffiliated securities
| 15,707,037 |
Forward foreign currency contracts
| 151,254 |
Futures contracts
| (2,630,394) |
Swap contracts
| 5,249 |
Written options
| 136,109 |
Net change in unrealized gains (losses) on investments
| 13,369,255 |
Net realized and unrealized gains (losses) on investments
| 40,445,072 |
Net increase in net assets resulting from operations
| $50,479,642 |
The accompanying notes are an integral part of these financial statements.
32 | Wells Fargo Diversified Income Builder Fund
Statement of changes in net assets
| | |
| | Six months ended
March 31, 2021
(unaudited) | Year ended
September 30, 2020 |
| Operations | | | | |
Net investment income
| | $ 10,034,570 | | $ 23,453,612 |
Net realized gains (losses) on investments
| | 27,075,817 | | (26,434,450) |
Net change in unrealized gains (losses) on investments
| | 13,369,255 | | 3,049,280 |
Net increase in net assets resulting from operations
| | 50,479,642 | | 68,442 |
| Distributions to shareholders from | | | | |
| Net investment income and net realized gains | | | | |
Class A
| | (3,963,166) | | (7,974,881) |
Class C
| | (1,543,879) | | (3,442,983) |
Class R6
| | (855,236) | | (73,583) |
Administrator Class
| | (146,498) | | (348,382) |
Institutional Class
| | (5,078,218) | | (11,069,027) |
Total distributions to shareholders
| | (11,586,997) | | (22,908,856) |
| Capital share transactions | Shares | | Shares | |
| Proceeds from shares sold | | | | |
Class A
| 2,803,429 | 17,326,959 | 8,052,563 | 48,385,274 |
Class C
| 895,882 | 5,596,570 | 3,953,049 | 23,706,227 |
Class R6
| 7,646,382 | 44,587,081 | 841,991 | 4,847,478 |
Administrator Class
| 106,268 | 648,490 | 355,491 | 2,049,792 |
Institutional Class
| 3,650,423 | 22,055,732 | 14,351,208 | 83,589,460 |
| | | 90,214,832 | | 162,578,231 |
| Reinvestment of distributions | | | | |
Class A
| 587,548 | 3,659,150 | 1,272,184 | 7,483,676 |
Class C
| 234,157 | 1,461,597 | 528,297 | 3,114,940 |
Class R6
| 139,995 | 854,607 | 12,784 | 72,670 |
Administrator Class
| 23,077 | 140,218 | 51,332 | 294,574 |
Institutional Class
| 680,906 | 4,131,453 | 1,568,325 | 8,983,878 |
| | | 10,247,025 | | 19,949,738 |
| Payment for shares redeemed | | | | |
Class A
| (4,316,404) | (26,863,253) | (14,997,369) | (86,951,189) |
Class C
| (3,751,187) | (23,282,433) | (8,233,132) | (47,960,287) |
Class R6
| (417,278) | (2,555,108) | (410,302) | (2,237,315) |
Administrator Class
| (263,179) | (1,601,398) | (1,068,453) | (6,052,620) |
Institutional Class
| (8,119,391) | (49,127,796) | (24,780,617) | (137,999,151) |
| | | (103,429,988) | | (281,200,562) |
Net decrease in net assets resulting from capital share transactions
| | (2,968,131) | | (98,672,593) |
Total increase (decrease) in net assets
| | 35,924,514 | | (121,513,007) |
| Net assets | | | | |
Beginning of period
| | 594,914,684 | | 716,427,691 |
End of period
| | $ 630,839,198 | | $ 594,914,684 |
The accompanying notes are an integral part of these financial statements.
Wells Fargo Diversified Income Builder Fund | 33
Financial highlights
(For a share outstanding throughout each period)
| | | Year ended September 30 |
| Class A | Six months ended
March 31, 2021
(unaudited) | 2020 | 2019 | 2018 | 2017 | 2016 |
Net asset value, beginning of period
| $5.95 | $6.06 | $6.33 | $6.42 | $6.13 | $5.71 |
Net investment income
| 0.10 | 0.21 | 0.22 | 0.21 | 0.20 | 0.20 |
Net realized and unrealized gains (losses) on investments
| 0.38 | (0.12) | 0.02 | (0.01) | 0.35 | 0.64 |
Total from investment operations
| 0.48 | 0.09 | 0.24 | 0.20 | 0.55 | 0.84 |
| Distributions to shareholders from | | | | | | |
Net investment income
| (0.11) | (0.20) | (0.23) | (0.19) | (0.22) | (0.21) |
Net realized gains
| 0.00 | 0.00 | (0.28) | (0.10) | (0.04) | (0.21) |
Total distributions to shareholders
| (0.11) | (0.20) | (0.51) | (0.29) | (0.26) | (0.42) |
Net asset value, end of period
| $6.32 | $5.95 | $6.06 | $6.33 | $6.42 | $6.13 |
Total return1
| 8.14% | 1.59% | 4.51% | 3.23% | 9.16% | 15.39% |
| Ratios to average net assets (annualized) | | | | | | |
Gross expenses
| 1.08% | 1.07% | 1.05% | 1.04% | 1.05% | 1.08% |
Net expenses
| 0.85% | 0.85% | 0.85% | 0.90% | 1.05% | 1.08% |
Net investment income
| 3.15% | 3.50% | 3.75% | 3.34% | 3.29% | 3.55% |
| Supplemental data | | | | | | |
Portfolio turnover rate
| 58% | 39% | 43% | 50% | 29% | 38% |
Net assets, end of period (000s omitted)
| $221,067 | $213,551 | $251,673 | $231,176 | $220,977 | $154,496 |
| 1 | Total return calculations do not include any sales charges. Returns for periods of less than one year are not annualized. |
The accompanying notes are an integral part of these financial statements.
34 | Wells Fargo Diversified Income Builder Fund
Financial highlights
(For a share outstanding throughout each period)
| | | Year ended September 30 |
| Class C | Six months ended
March 31, 2021
(unaudited) | 2020 | 2019 | 2018 | 2017 | 2016 |
Net asset value, beginning of period
| $5.97 | $6.07 | $6.34 | $6.44 | $6.14 | $5.72 |
Net investment income
| 0.08 | 0.17 | 0.18 | 0.17 | 0.16 | 0.16 1 |
Net realized and unrealized gains (losses) on investments
| 0.38 | (0.11) | 0.02 | (0.02) | 0.35 | 0.63 |
Total from investment operations
| 0.46 | 0.06 | 0.20 | 0.15 | 0.51 | 0.79 |
| Distributions to shareholders from | | | | | | |
Net investment income
| (0.09) | (0.16) | (0.19) | (0.15) | (0.17) | (0.16) |
Net realized gains
| 0.00 | 0.00 | (0.28) | (0.10) | (0.04) | (0.21) |
Total distributions to shareholders
| (0.09) | (0.16) | (0.47) | (0.25) | (0.21) | (0.37) |
Net asset value, end of period
| $6.34 | $5.97 | $6.07 | $6.34 | $6.44 | $6.14 |
Total return2
| 7.70% | 0.98% | 3.71% | 2.32% | 8.51% | 14.51% |
| Ratios to average net assets (annualized) | | | | | | |
Gross expenses
| 1.83% | 1.82% | 1.80% | 1.79% | 1.80% | 1.83% |
Net expenses
| 1.60% | 1.60% | 1.60% | 1.65% | 1.80% | 1.83% |
Net investment income
| 2.38% | 2.75% | 2.99% | 2.59% | 2.54% | 2.80% |
| Supplemental data | | | | | | |
Portfolio turnover rate
| 58% | 39% | 43% | 50% | 29% | 38% |
Net assets, end of period (000s omitted)
| $106,578 | $115,929 | $140,722 | $166,750 | $165,513 | $129,856 |
| 1 | Calculated based upon average shares outstanding |
| 2 | Total return calculations do not include any sales charges. Returns for periods of less than one year are not annualized. |
The accompanying notes are an integral part of these financial statements.
Wells Fargo Diversified Income Builder Fund | 35
Financial highlights
(For a share outstanding throughout each period)
| | | Year ended September 30 |
| Class R6 | Six months ended
March 31, 2021
(unaudited) | 2020 | 2019 | 2018 1 |
Net asset value, beginning of period
| $5.81 | $5.91 | $6.18 | $6.17 |
Net investment income
| 0.11 2 | 0.22 | 0.24 2 | 0.02 2 |
Net realized and unrealized gains (losses) on investments
| 0.37 | (0.09) | 0.03 | 0.02 |
Total from investment operations
| 0.48 | 0.13 | 0.27 | 0.04 |
| Distributions to shareholders from | | | | |
Net investment income
| (0.12) | (0.23) | (0.26) | (0.03) |
Net realized gains
| 0.00 | 0.00 | (0.28) | 0.00 |
Total distributions to shareholders
| (0.12) | (0.23) | (0.54) | (0.03) |
Net asset value, end of period
| $6.17 | $5.81 | $5.91 | $6.18 |
Total return3
| 8.39% | 2.25% | 5.07% | 0.71% |
| Ratios to average net assets (annualized) | | | | |
Gross expenses
| 0.65% | 0.64% | 0.61% | 0.64% |
Net expenses
| 0.42% | 0.42% | 0.42% | 0.41% |
Net investment income
| 3.60% | 3.89% | 4.17% | 2.31% |
| Supplemental data | | | | |
Portfolio turnover rate
| 58% | 39% | 43% | 50% |
Net assets, end of period (000s omitted)
| $48,206 | $2,605 | $24 | $25 |
| 1 | For the period from July 31, 2018 (commencement of class operations) to September 30, 2018 |
| 2 | Calculated based upon average shares outstanding |
| 3 | Returns for periods of less than one year are not annualized. |
The accompanying notes are an integral part of these financial statements.
36 | Wells Fargo Diversified Income Builder Fund
Financial highlights
(For a share outstanding throughout each period)
| | | Year ended September 30 |
| Administrator Class | Six months ended
March 31, 2021
(unaudited) | 2020 | 2019 | 2018 | 2017 | 2016 |
Net asset value, beginning of period
| $5.81 | $5.91 | $6.19 | $6.29 | $6.00 | $5.60 |
Net investment income
| 0.10 1 | 0.21 1 | 0.22 1 | 0.21 1 | 0.21 1 | 0.21 1 |
Net realized and unrealized gains (losses) on investments
| 0.37 | (0.10) | 0.02 | (0.01) | 0.34 | 0.61 |
Total from investment operations
| 0.47 | 0.11 | 0.24 | 0.20 | 0.55 | 0.82 |
| Distributions to shareholders from | | | | | | |
Net investment income
| (0.11) | (0.21) | (0.24) | (0.20) | (0.22) | (0.21) |
Net realized gains
| 0.00 | 0.00 | (0.28) | (0.10) | (0.04) | (0.21) |
Total distributions to shareholders
| (0.11) | 5.81 | 5.91 | 6.19 | 6.29 | 6.00 |
Net asset value, end of period
| $6.17 | $5.81 | $5.91 | $6.19 | $6.29 | $6.00 |
Total return2
| 8.21% | 1.89% | 4.52% | 3.21% | 9.45% | 15.45% |
| Ratios to average net assets (annualized) | | | | | | |
Gross expenses
| 1.00% | 0.99% | 0.97% | 0.96% | 0.97% | 1.00% |
Net expenses
| 0.77% | 0.77% | 0.77% | 0.81% | 0.90% | 0.90% |
Net investment income
| 3.21% | 3.57% | 3.77% | 3.40% | 3.51% | 3.72% |
| Supplemental data | | | | | | |
Portfolio turnover rate
| 58% | 39% | 43% | 50% | 29% | 38% |
Net assets, end of period (000s omitted)
| $7,531 | $7,868 | $11,916 | $32,938 | $41,975 | $70,051 |
| 1 | Calculated based upon average shares outstanding |
| 2 | Returns for periods of less than one year are not annualized. |
The accompanying notes are an integral part of these financial statements.
Wells Fargo Diversified Income Builder Fund | 37
Financial highlights
(For a share outstanding throughout each period)
| | | Year ended September 30 |
| Institutional Class | Six months ended
March 31, 2021
(unaudited) | 2020 | 2019 | 2018 | 2017 | 2016 |
Net asset value, beginning of period
| $5.80 | $5.91 | $6.19 | $6.28 | $6.00 | $5.59 |
Net investment income
| 0.11 | 0.22 1 | 0.24 | 0.23 | 0.24 | 0.23 |
Net realized and unrealized gains (losses) on investments
| 0.37 | (0.11) | 0.01 | (0.01) | 0.31 | 0.61 |
Total from investment operations
| 0.48 | 0.11 | 0.25 | 0.22 | 0.55 | 0.84 |
| Distributions to shareholders from | | | | | | |
Net investment income
| (0.12) | (0.22) | (0.25) | (0.21) | (0.23) | (0.22) |
Net realized gains
| 0.00 | 0.00 | (0.28) | (0.10) | (0.04) | (0.21) |
Total distributions to shareholders
| (0.12) | (0.22) | (0.53) | (0.31) | (0.27) | (0.43) |
Net asset value, end of period
| $6.16 | $5.80 | $5.91 | $6.19 | $6.28 | $6.00 |
Total return2
| 8.35% | 1.98% | 4.80% | 3.62% | 9.49% | 15.88% |
| Ratios to average net assets (annualized) | | | | | | |
Gross expenses
| 0.75% | 0.74% | 0.72% | 0.71% | 0.72% | 0.75% |
Net expenses
| 0.52% | 0.52% | 0.52% | 0.57% | 0.71% | 0.71% |
Net investment income
| 3.47% | 3.83% | 4.07% | 3.67% | 3.60% | 3.92% |
| Supplemental data | | | | | | |
Portfolio turnover rate
| 58% | 39% | 43% | 50% | 29% | 38% |
Net assets, end of period (000s omitted)
| $247,457 | $254,963 | $312,093 | $335,589 | $315,413 | $124,116 |
| 1 | Calculated based upon average shares outstanding |
| 2 | Returns for periods of less than one year are not annualized. |
The accompanying notes are an integral part of these financial statements.
38 | Wells Fargo Diversified Income Builder Fund
Notes to financial statements (unaudited)
1. ORGANIZATION
Wells Fargo Funds Trust (the "Trust"), a Delaware statutory trust organized on March 10, 1999, is an open-end management investment company registered under the Investment Company Act of 1940, as amended (the "1940 Act"). As an investment company, the Trust follows the accounting and reporting guidance in Financial Accounting Standards Board (“FASB”) Accounting Standards Codification Topic 946, Financial Services – Investment Companies. These financial statements report on the Wells Fargo Diversified Income Builder Fund (the "Fund") which is a diversified series of the Trust.
On February 23, 2021, Wells Fargo & Company announced that it has entered into a definitive agreement to sell Wells Fargo Asset Management ("WFAM") to GTCR LLC and Reverence Capital Partners, L.P. WFAM is the trade name used by the asset management businesses of Wells Fargo & Company and includes Wells Fargo Funds Management, LLC, the investment manager to the Fund, Wells Capital Management Incorporated and Wells Fargo Asset Management (International) Limited, both registered investment advisers providing sub-advisory services to certain funds, and Wells Fargo Funds Distributor, LLC, the Fund's principal underwriter. As part of the transaction, Wells Fargo & Company will own a 9.9% equity interest and will continue to serve as an important client and distribution partner. The transaction is expected to close in the second half of 2021, subject to customary closing conditions.
Consummation of the transaction will result in the automatic termination of the Fund's investment management agreement and sub-advisory agreement. The Fund's Board of Trustees will be asked to approve new investment management arrangements with the new company. If approved by the Board, the new investment management arrangements with the new company will be presented to the shareholders of the Fund for approval, and, if approved by shareholders, would take effect upon the closing of the transaction. The transaction is expected to close in the second half of 2021, subject to customary closing conditions.
2. SIGNIFICANT ACCOUNTING POLICIES
The following significant accounting policies, which are consistently followed in the preparation of the financial statements of the Fund, are in conformity with U.S. generally accepted accounting principles which require management to make estimates and assumptions that affect the reported amounts of assets and liabilities, disclosure of contingent assets and liabilities at the date of the financial statements, and the reported amounts of income and expenses during the reporting period. Actual results could differ from those estimates.
Securities valuation
All investments are valued each business day as of the close of regular trading on the New York Stock Exchange (generally 4 p.m. Eastern Time), although the Fund may deviate from this calculation time under unusual or unexpected circumstances.
Debt securities are valued at the evaluated bid price provided by an independent pricing service (e.g. taking into account various factors, including yields, maturities, or credit ratings) or, if a reliable price is not available, the quoted bid price from an independent broker-dealer.
Equity securities and futures contracts that are listed on a foreign or domestic exchange or market are valued at the official closing price or, if none, the last sales price. If no sale occurs on the principal exchange or market that day, a fair value price will be determined in accordance with the Fund’s Valuation Procedures.
The values of securities denominated in foreign currencies are translated into U.S. dollars at rates provided by an independent foreign currency pricing source at a time each business day specified by the Wells Fargo Asset Management Pricing Committee at Wells Fargo Funds Management, LLC ("Funds Management").
Many securities markets and exchanges outside the U.S. close prior to the close of the New York Stock Exchange and therefore may not fully reflect trading or events that occur after the close of the principal exchange in which the foreign securities are traded, but before the close of the New York Stock Exchange. If such trading or events are expected to materially affect the value of such securities, then fair value pricing procedures approved by the Board of Trustees of the Fund are applied. These procedures take into account multiple factors including movements in U.S. securities markets after foreign exchanges close. Foreign securities that are fair valued under these procedures are categorized as Level 2 and the application of these procedures may result in transfers between Level 1 and Level 2. Depending on market activity, such fair valuations may be frequent. Such fair value pricing may result in net asset values that are higher or lower than net asset values based on the last reported sales price or latest quoted bid price. On March 31, 2021, such fair value pricing was not used in pricing foreign securities.
Forward foreign currency contracts are recorded at the forward rate provided by an independent foreign currency pricing source at a time each business day specified by the Wells Fargo Asset Management Pricing Committee.
Wells Fargo Diversified Income Builder Fund | 39
Notes to financial statements (unaudited)
Options that are listed on a foreign or domestic exchange or market are valued at the closing mid-price. Non-listed options and swap contracts are valued at the evaluated price provided by an independent pricing service or, if a reliable price is not available, the quoted bid price from an independent broker-dealer.
Swap contracts are valued at the evaluated price provided by an independent pricing service or, if a reliable price is not available, the quoted bid price from an independent broker-dealer.
Investments in registered open-end investment companies are valued at net asset value. Interests in non-registered investment companies that are redeemable at net asset value are fair valued normally at net asset value.
Investments which are not valued using any of the methods discussed above are valued at their fair value, as determined in good faith by the Board of Trustees. The Board of Trustees has established a Valuation Committee comprised of the Trustees and has delegated to it the authority to take any actions regarding the valuation of portfolio securities that the Valuation Committee deems necessary or appropriate, including determining the fair value of portfolio securities, unless the determination has been delegated to the Wells Fargo Asset Management Pricing Committee. The Board of Trustees retains the authority to make or ratify any valuation decisions or approve any changes to the Valuation Procedures as it deems appropriate. On a quarterly basis, the Board of Trustees receives reports on any valuation actions taken by the Valuation Committee or the Wells Fargo Asset Management Pricing Committee which may include items for ratification.
Foreign currency translation
The accounting records of the Fund are maintained in U.S. dollars. The values of other assets and liabilities denominated in foreign currencies are translated into U.S. dollars at rates provided by an independent foreign currency pricing source at a time each business day specified by the Wells Fargo Asset Management Pricing Committee. Purchases and sales of securities, and income and expenses are converted at the rate of exchange on the respective dates of such transactions. Net realized foreign exchange gains or losses arise from sales of foreign currencies, currency gains or losses realized between the trade and settlement dates on securities transactions, and the difference between the amounts of dividends, interest and foreign withholding taxes recorded and the U.S. dollar equivalent of the amounts actually paid or received. Net unrealized foreign exchange gains and losses arise from changes in the fair value of assets and liabilities other than investments in securities resulting from changes in exchange rates. The changes in net assets arising from changes in exchange rates of securities and the changes in net assets resulting from changes in market prices of securities are not separately presented. Such changes are included in net realized and unrealized gains or losses from investments.
When-issued transactions
The Fund may purchase securities on a forward commitment or when-issued basis. The Fund records a when-issued transaction on the trade date and will segregate assets in an amount at least equal in value to the Fund's commitment to purchase when-issued securities. Securities purchased on a when-issued basis are marked-to-market daily and the Fund begins earning interest on the settlement date. Losses may arise due to changes in the market value of the underlying securities or if the counterparty does not perform under the contract.
Loans
The Fund may invest in direct debt instruments which are interests in amounts owed to lenders by corporate or other borrowers. The loans pay interest at rates which are periodically reset by reference to a base lending rate plus a spread. Investments in loans may be in the form of participations in loans or assignments of all or a portion of loans from third parties. When the Fund purchases participations, it generally has no rights to enforce compliance with the terms of the loan agreement with the borrower. As a result, the Fund assumes the credit risk of both the borrower and the lender that is selling the participation. When the Fund purchases assignments from lenders, it acquires direct rights against the borrower on the loan and may enforce compliance by the borrower with the terms of the loan agreement. Loans may include fully funded term loans or unfunded loan commitments, which are contractual obligations for future funding.
Forward foreign currency contracts
A forward foreign currency contract is an agreement between two parties to purchase or sell a specific currency for an agreed-upon price at a future date. The Fund enters into forward foreign currency contracts to facilitate transactions in foreign-denominated securities and to attempt to minimize the risk to the Fund from adverse changes in the relationship between currencies. Forward foreign currency contracts are recorded at the forward rate and marked-to-market daily. When the contracts are closed, realized gains and losses arising from such transactions are recorded as realized gains or losses on forward foreign currency contracts. The Fund is subject to foreign currency risk and may be exposed to risks if the counterparties to the contracts are unable to meet the terms of their contracts or if the value of the foreign currency changes unfavorably. The Fund's maximum risk of loss from counterparty credit risk is the unrealized gains on the contracts. This risk may be mitigated if there is a master netting arrangement between the Fund and the counterparty.
40 | Wells Fargo Diversified Income Builder Fund
Notes to financial statements (unaudited)
Futures contracts
Futures contracts are agreements between the Fund and a counterparty to buy or sell a specific amount of a commodity, financial instrument or currency at a specified price on a specified date. The Fund may buy and sell futures contracts in order to gain exposure to, or protect against, changes in interest rates, security values and foreign exchange rates and is subject to interest rate risk, equity price risk and foreign currency risk. The primary risks associated with the use of futures contracts are the imperfect correlation between changes in market values of securities held by the Fund and the prices of futures contracts, and the possibility of an illiquid market. Futures contracts are generally entered into on a regulated futures exchange and cleared through a clearinghouse associated with the exchange. With futures contracts, there is minimal counterparty risk to the Fund since futures contracts are exchange traded and the exchange’s clearinghouse, as the counterparty to all exchange traded futures, guarantees the futures contracts against default.
Upon entering into a futures contract, the Fund is required to deposit either cash or securities (initial margin) with the broker in an amount equal to a certain percentage of the contract value. Subsequent payments (variation margin) are paid to or from the broker each day equal to the daily changes in the contract value. Such payments are recorded as unrealized gains or losses and, if any, shown as variation margin receivable (payable) in the Statement of Assets and Liabilities. Should the Fund fail to make requested variation margin payments, the broker can gain access to the initial margin to satisfy the Fund’s payment obligations. When the contracts are closed, a realized gain or loss is recorded in the Statement of Operations.
Options
The Fund may write covered call options or secured put options on individual securities and/or indexes. When the Fund writes an option, an amount equal to the premium received is recorded as a liability and is subsequently adjusted to the current market value of the written option. Premiums received from written options that expire unexercised are recognized as realized gains on the expiration date. For exercised options, the difference between the premium received and the amount paid on effecting a closing purchase transaction, including brokerage commissions, is treated as a realized gain or loss. If a call option is exercised, the premium is added to the proceeds from the sale of the underlying security in calculating the realized gain or loss on the sale. If a put option is exercised, the premium reduces the cost of the security purchased. The Fund, as a writer of an option, bears the market risk of an unfavorable change in the price of the security and/or index underlying the written option.
The Fund may also purchase call or put options. Premiums paid are included in the Statement of Assets and Liabilities as investments, the values of which are subsequently adjusted based on the current market values of the options. Premiums paid for purchased options that expire are recognized as realized losses on the expiration date. Premiums paid for purchased options that are exercised or closed are added to the amount paid or offset against the proceeds received for the underlying security to determine the realized gain or loss. The risk of loss associated with purchased options is limited to the premium paid.
Options traded on an exchange are regulated and terms of the options are standardized. The Fund is subject to equity price risk. Purchased options traded over-the-counter expose the Fund to counterparty risk in the event the counterparty does not perform. This risk can be mitigated by having a master netting arrangement between the Fund and the counterparty and by having the counterparty post collateral to cover the Fund’s exposure to the counterparty.
Swap contracts
Swap contracts are agreements between the Fund and a counterparty to exchange a series of cash flows over a specified period. Swap agreements are privately negotiated contracts between the Fund that are entered into as bilateral contracts in the OTC market (“OTC swaps”) or centrally cleared (“centrally cleared swaps”) with a central clearinghouse.
The Fund entered into centrally cleared swaps. In a centrally cleared swap, immediately following execution of the swap contract, the swap contract is novated to a central counterparty (the “CCP”) and the Fund’s counterparty on the swap agreement becomes the CCP. Upon entering into a centrally cleared swap, the Fund is required to deposit an initial margin with the broker in the form of cash or securities. Securities deposited as initial margin are designated in the Portfolio of Investments and cash deposited is shown as cash segregated for centrally cleared swaps in the Statement of Assets and Liabilities. Pursuant to the contract, the Fund agrees to receive from or pay to the broker an amount of cash equal to the daily fluctuation in market value of the contract (“variation margin”). The variation margin is recorded as an unrealized gain (or loss) and shown as variation margin receivable (or payable) on centrally cleared swaps in the Statement of Assets and Liabilities. Payments received from (paid to) the counterparty, including at termination, are recorded as realized gains (losses) in the Statement of Operations.
Credit default swaps
The Fund may enter into credit default swaps for hedging or speculative purposes to provide or receive a measure of protection against default on a referenced entity, obligation or index or a basket of single-name issuers or traded indexes. An index credit default swap references all the names in the index, and if a credit event is triggered, the credit event is settled based on that name’s weight in the index. Credit default swaps are agreements in which the protection buyer pays
Wells Fargo Diversified Income Builder Fund | 41
Notes to financial statements (unaudited)
fixed periodic payments to the protection seller in consideration for a promise from the protection seller to make a specific payment should a negative credit event take place with respect to the referenced entity (e.g., bankruptcy, failure to pay, obligation acceleration, repudiation, moratorium or restructuring).
The Fund may enter into credit default swaps as either the seller of protection or the buyer of protection. If the Fund is the buyer of protection and a credit event occurs, the Fund will either receive from the seller an amount equal to the notional amount of the swap and deliver the referenced security or underlying securities comprising the index, or receive a net settlement of cash equal to the notional amount of the swap less the recovery value of the security or underlying securities comprising the index. If the Fund is the seller of protection and a credit event occurs, the Fund will either pay the buyer an amount equal to the notional amount of the swap and take delivery of the referenced security or underlying securities comprising the index or pay a net settlement of cash equal to the notional amount of the swap less the recovery value of the security or underlying securities comprising the index.
As the seller of protection, the Fund is subject to investment exposure on the notional amount of the swap and has assumed the risk of default of the underlying security or index. As the buyer of protection, the Fund could be exposed to risks if the seller of the protection defaults on its obligation to perform, or if there are unfavorable changes in the fluctuation of interest rates.
By entering into credit default swap contracts, the Fund is exposed to credit risk. In addition, certain credit default swap contracts entered into by the Fund provide for conditions that result in events of default or termination that enable the counterparty to the agreement to cause an early termination of the transactions under those agreements.
Securities lending
The Fund may lend its securities from time to time in order to earn additional income in the form of fees or interest on securities received as collateral or the investment of any cash received as collateral. When securities are on loan, the Fund receives interest or dividends on those securities. Cash collateral received in connection with its securities lending transactions is invested in Securities Lending Cash Investments, LLC (the "Securities Lending Fund"). Investments in Securities Lending Fund are valued at the evaluated bid price provided by an independent pricing service. Income earned from investment in the Securities Lending Fund (net of fees and rebates), if any, is included in income from affiliated securities on the Statement of Operations.
In a securities lending transaction, the net asset value of the Fund is affected by an increase or decrease in the value of the securities loaned and by an increase or decrease in the value of the instrument in which collateral is invested. The amount of securities lending activity undertaken by the Fund fluctuates from time to time. The Fund has the right under the lending agreement to recover the securities from the borrower on demand. In the event of default or bankruptcy by the borrower, the Fund may be prevented from recovering the loaned securities or gaining access to the collateral or may experience delays or costs in doing so. In such an event, the terms of the agreement allow the unaffiliated securities lending agent to use the collateral to purchase replacement securities on behalf of the Fund or pay the Fund the market value of the loaned securities. The Fund bears the risk of loss with respect to depreciation of its investment of the cash collateral.
Security transactions and income recognition
Securities transactions are recorded on a trade date basis. Realized gains or losses are recorded on the basis of identified cost.
Interest income is accrued daily and bond discounts are accreted and premiums are amortized daily. To the extent debt obligations are placed on non-accrual status, any related interest income may be reduced by writing off interest receivables when the collection of all or a portion of interest has been determined to be doubtful based on consistently applied procedures and the fair value has decreased. If the issuer subsequently resumes interest payments or when the collectability of interest is reasonably assured, the debt obligation is removed from non-accrual status.
Dividend income is recognized on the ex-dividend date.
Income is recorded net of foreign taxes withheld where recovery of such taxes is not assured.
Income dividends and capital gain distributions from investment companies are recorded on the ex-dividend date. Capital gain distributions from investment companies are treated as realized gains.
Distributions to shareholders
Distributions to shareholders are recorded on the ex-dividend date and paid from net investment income monthly and any net realized gains are paid at least annually. Such distributions are determined in accordance with income tax regulations and may differ from U.S. generally accepted accounting principles. Dividend sources are estimated at the time of declaration. The tax
42 | Wells Fargo Diversified Income Builder Fund
Notes to financial statements (unaudited)
character of distributions is determined as of the Fund’s fiscal year end. Therefore, a portion of the Fund’s distributions made prior to the Fund’s fiscal year end may be categorized as a tax return of capital at year end.
Federal and other taxes
The Fund intends to continue to qualify as a regulated investment company by distributing substantially all of its investment company taxable income and any net realized capital gains (after reduction for capital loss carryforwards) sufficient to relieve it from all, or substantially all, federal income taxes. Accordingly, no provision for federal income taxes was required.
The Fund’s income and federal excise tax returns and all financial records supporting those returns for the prior three fiscal years are subject to examination by the federal and Delaware revenue authorities. Management has analyzed the Fund's tax positions taken on federal, state, and foreign tax returns for all open tax years and does not believe that there are any uncertain tax positions that require recognition of a tax liability.
As of March 31, 2021, the aggregate cost of all investments for federal income tax purposes was $584,719,310 and the unrealized gains (losses) consisted of:
| Gross unrealized gains | $53,688,682 |
| Gross unrealized losses | (9,535,067) |
| Net unrealized gains | $44,153,615 |
As of September 30, 2020, the Fund had capital loss carryforwards which consisted of $20,392,779 in short-term capital losses and $29,814,193 in long-term capital losses.
Class allocations
The separate classes of shares offered by the Fund differ principally in applicable sales charges, distribution, shareholder servicing, and administration fees. Class specific expenses are charged directly to that share class. Investment income, common fund-level expenses, and realized and unrealized gains (losses) on investments are allocated daily to each class of shares based on the relative proportion of net assets of each class.
3. FAIR VALUATION MEASUREMENTS
Fair value measurements of investments are determined within a framework that has established a fair value hierarchy based upon the various data inputs utilized in determining the value of the Fund’s investments. The three-level hierarchy gives the highest priority to unadjusted quoted prices in active markets for identical assets or liabilities (Level 1) and the lowest priority to unobservable inputs (Level 3). The Fund’s investments are classified within the fair value hierarchy based on the lowest level of input that is significant to the fair value measurement. The inputs are summarized into three broad levels as follows:
| ■ | Level 1 – quoted prices in active markets for identical securities |
| ■ | Level 2 – other significant observable inputs (including quoted prices for similar securities, interest rates, prepayment speeds, credit risk, etc.) |
| ■ | Level 3 – significant unobservable inputs (including the Fund’s own assumptions in determining the fair value of investments) |
The inputs or methodologies used for valuing investments in securities are not necessarily an indication of the risk associated with investing in those securities.
Wells Fargo Diversified Income Builder Fund | 43
Notes to financial statements (unaudited)
The following is a summary of the inputs used in valuing the Fund’s assets and liabilities as of March 31, 2021:
| | Quoted prices
(Level 1) | Other significant
observable inputs
(Level 2) | Significant
unobservable inputs
(Level 3) | Total |
| Assets | | | | |
| Investments in: | | | | |
| Asset-backed securities | $ 0 | $ 12,828,782 | $ 0 | $ 12,828,782 |
| Common stocks | | | | |
| Communication services | 10,023,067 | 0 | 0 | 10,023,067 |
| Consumer discretionary | 13,660,209 | 0 | 0 | 13,660,209 |
| Consumer staples | 7,485,361 | 0 | 0 | 7,485,361 |
| Energy | 4,191,040 | 0 | 0 | 4,191,040 |
| Financials | 18,956,323 | 0 | 0 | 18,956,323 |
| Health care | 34,979,882 | 0 | 0 | 34,979,882 |
| Industrials | 23,318,530 | 0 | 0 | 23,318,530 |
| Information technology | 45,786,689 | 0 | 0 | 45,786,689 |
| Materials | 9,467,602 | 0 | 0 | 9,467,602 |
| Real estate | 2,745,828 | 0 | 0 | 2,745,828 |
| Utilities | 4,430,117 | 0 | 0 | 4,430,117 |
| Corporate bonds and notes | 0 | 283,050,516 | 0 | 283,050,516 |
| Exchange-traded funds | 17,474,292 | 0 | 0 | 17,474,292 |
| Foreign corporate bonds and notes | 0 | 17,199,916 | 0 | 17,199,916 |
| Loans | 0 | 6,468,280 | 707,935 | 7,176,215 |
| Municipal obligations | 0 | 17,075,334 | 0 | 17,075,334 |
| Non-agency mortgage-backed securities | 0 | 4,758,456 | 0 | 4,758,456 |
| Preferred stocks | | | | |
| Financials | 69,672 | 0 | 0 | 69,672 |
| Information technology | 259,040 | 0 | 0 | 259,040 |
| Materials | 123,165 | 0 | 0 | 123,165 |
| Yankee corporate bonds and notes | 0 | 67,251,531 | 0 | 67,251,531 |
| Short-term investments | | | | |
| Investment companies | 29,075,664 | 0 | 0 | 29,075,664 |
| | 222,046,481 | 408,632,815 | 707,935 | 631,387,231 |
| Forward foreign currency contract | 0 | 285,086 | 0 | 285,086 |
| Futures contracts | 452,799 | 0 | 0 | 452,799 |
| Swap contracts | 0 | 5,249 | 0 | 5,249 |
| Total assets | $222,499,280 | $408,923,150 | $707,935 | $632,130,365 |
| Liabilities | | | | |
| Futures contracts | $ 3,244,547 | $ 0 | $ 0 | $ 3,244,547 |
| Written options | 0 | 602,079 | 0 | 602,079 |
| Total liabilities | $ 3,244,547 | $ 602,079 | $ 0 | $ 3,846,626 |
Futures contracts, forward foreign currency contracts and swap contracts are reported at their cumulative unrealized gains (losses) at measurement date as reported in the tables following the Portfolio of Investments. For futures contracts and centrally cleared swap contracts, the current day’s variation margin is reported on the Statement of Assets and Liabilities. All other assets and liabilities are reported at their market value at measurement date.
Additional sector, industry or geographic detail, if any, is included in the Portfolio of Investments.
For the six months ended March 31, 2021, the Fund did not have any transfers into/out of Level 3.
44 | Wells Fargo Diversified Income Builder Fund
Notes to financial statements (unaudited)
4. TRANSACTIONS WITH AFFILIATES
Management fee
Funds Management, an indirect wholly owned subsidiary of Wells Fargo & Company ("Wells Fargo"), is the manager of the Fund and provides advisory and fund-level administrative services under an investment management agreement. Under the investment management agreement, Funds Management is responsible for, among other services, implementing the investment objectives and strategies of the Fund, supervising the subadviser and providing fund-level administrative services in connection with the Fund’s operations. As compensation for its services under the investment management agreement, Funds Management is entitled to receive a management fee at the following annual rate based on the Fund’s average daily net assets:
| Average daily net assets | Management fee |
| First $500 million | 0.550% |
| Next $500 million | 0.525 |
| Next $2 billion | 0.500 |
| Next $2 billion | 0.475 |
| Next $5 billion | 0.440 |
| Over $10 billion | 0.430 |
For the six months ended March 31, 2021, the management fee was equivalent to an annual rate of 0.54% of the Fund’s average daily net assets.
Funds Management has retained the services of a subadviser to provide daily portfolio management to the Fund. The fee for subadvisory services is borne by Funds Management. Wells Capital Management Incorporated ("WellsCap"), an affiliate of Funds Management and an indirect wholly owned subsidiary of Wells Fargo, is the subadviser to the Fund and is entitled to receive a fee from Funds Management at an annual rate starting at 0.35% and declining to 0.20% as the average daily net assets of the Fund increase.
Administration fees
Under a class-level administration agreement, Funds Management provides class-level administrative services to the Fund, which includes paying fees and expenses for services provided by the transfer agent, sub-transfer agents, omnibus account servicers and record-keepers. As compensation for its services under the class-level administration agreement, Funds Management receives an annual fee which is calculated based on the average daily net assets of each class as follows:
| | Class-level
administration fee |
| Class A | 0.21% |
| Class C | 0.21 |
| Class R6 | 0.03 |
| Administrator Class | 0.13 |
| Institutional Class | 0.13 |
Waivers and/or expense reimbursements
Funds Management has contractually waived and/or reimbursed management and administration fees to the extent necessary to maintain certain net operating expense ratios for the Fund. When each class of the Fund has exceeded its expense cap, Funds Management has waived fees and/or reimbursed expenses from fund-level expenses on a proportionate basis and then from class specific expenses. When only certain classes exceed their expense caps, waivers and/or reimbursements are applied against class specific expenses before fund-level expenses. Funds Management has committed through January 31, 2022 to waive fees and/or reimburse expenses to the extent necessary to cap expenses. Prior to or after the commitment expiration date, the cap may be increased or the commitment to maintain the cap may be terminated only with the approval of the Board of Trustees. The contractual expense caps are as follows:
Wells Fargo Diversified Income Builder Fund | 45
Notes to financial statements (unaudited)
| | Expense ratio caps |
| Class A | 0.85% |
| Class C | 1.60 |
| Class R6 | 0.42 |
| Administrator Class | 0.77 |
| Institutional Class | 0.52 |
Distribution fee
The Trust has adopted a distribution plan for Class C shares of the Fund pursuant to Rule 12b-1 under the 1940 Act. A distribution fee is charged charged to Class C shares and paid to Wells Fargo Funds Distributor, LLC (“Funds Distributor”), the principal underwriter, at an annual rate of 0.75% of the average daily net assets of Class C shares.
In addition, Funds Distributor is entitled to receive the front-end sales charge from the purchase of Class A shares and a contingent deferred sales charge on the redemption of certain Class A shares. Funds Distributor is also entitled to receive the contingent deferred sales charges from redemptions of Class C shares. For the six months ended March 31, 2021, Funds Distributor received $9,193 from the sale of Class A shares. No contingent deferred sales charges were incurred by Class A and Class C shares for the six months ended March 31, 2021.
Shareholder servicing fees
The Trust has entered into contracts with one or more shareholder servicing agents, whereby Class A, Class C, and Administrator Class of the Fund are charged a fee at an annual rate of 0.25% of the average daily net assets of each respective class. A portion of these total shareholder servicing fees were paid to affiliates of Wells Fargo.
Interfund transactions
The Fund may purchase or sell portfolio investment securities to certain other Wells Fargo affiliates pursuant to Rule 17a-7 under the 1940 Act and under procedures adopted by the Board of Trustees. The procedures have been designed to ensure that these interfund transactions, which do not incur broker commissions, are effected at current market prices.
5. INVESTMENT PORTFOLIO TRANSACTIONS
Purchases and sales of investments, excluding U.S. government obligations (if any) and short-term securities, for the six months ended March 31, 2021 were $363,930,146 and $346,825,414, respectively.
6. SECURITIES LENDING TRANSACTIONS
The Fund lends its securities through an unaffiliated securities lending agent and receives collateral in the form of cash or securities with a value at least equal to the value of the securities on loan. The value of the loaned securities is determined at the close of each business day and any increases or decreases in the required collateral are exchanged between the Fund and the counterparty on the next business day. Cash collateral received is invested in the Securities Lending Fund which seeks to provide a positive return compared to the daily Federal Funds Open Rate by investing in high-quality, U.S. dollar-denominated short-term money market instruments and is exempt from registration under Section 3(c)(7) of the 1940 Act. Securities Lending Fund is managed by Funds Management and is subadvised by WellsCap. Funds Management receives an advisory fee starting at 0.05% and declining to 0.01% as the average daily net assets of the Securities Lending Fund increase. All of the fees received by Funds Management are paid to WellsCap for its services as subadviser.
In the event of counterparty default or the failure of a borrower to return a loaned security, the Fund has the right to use the collateral to offset any losses incurred. As of March 31, 2021, the Fund had securities lending transactions with the following counterparties which are subject to offset:
46 | Wells Fargo Diversified Income Builder Fund
Notes to financial statements (unaudited)
| Counterparty | Value of
securities on
loan | Collateral
received1 | Net amount |
| Barclays Capital Incorporated | $3,617,417 | $(3,617,417) | $0 |
| BNP Paribas Securities Corporation | 2,314,648 | (2,314,648) | 0 |
| Citigroup Global Markets Incorporated | 1,881,171 | (1,881,171) | 0 |
| Credit Suisse Securities (USA) LLC | 499,588 | (499,588) | 0 |
| JPMorgan Securities LLC | 1,439,197 | (1,439,197) | 0 |
1 Collateral received within this table is limited to the collateral for the net transaction with the counterparty.
7. DERIVATIVE TRANSACTIONS
During the six months ended March 31, 2021, the Fund entered into futures contracts for economic hedging purposes. The Fund also entered into forward foreign currency contracts for economic hedging purposes and entered into credit default swap contracts for hedging or cash management purposes.
The volume of the Fund's derivative activity during the six months ended March 31, 2021 was as follows:
| Options | |
| Average number of contracts written | 14,806 |
| Futures contracts | |
| Average notional balance on long futures | $120,535,143 |
| Average notional balance on short futures | 60,819,523 |
| Forward foreign currency contracts | |
| Average contract amounts to buy | $ 2,917,060 |
| Average contract amounts to sell | 17,260,024 |
| Swap contracts | |
| Average notional balance | $ 109,890 |
The Fund's swap transactions may contain provisions for early termination in the event the net assets of the Fund declines below specific levels identified by the counterparty. If these levels are triggered, the counterparty may terminate the transaction and seek payment or request full collateralization of the derivative transactions in net liability positions.
A summary of the location of derivative instruments on the financial statements by primary risk exposure is outlined in the following tables.
The fair value of derivative instruments as of March 31, 2021 by risk type was as follows for the Fund:
| | Asset derivatives | | Liability derivatives |
| | Statement of
Assets and Liabilities location | Fair value | | Statement of
Assets and Liabilities location | Fair value |
| Equity risk | Unrealized gains on futures contracts | $ 452,799* | | Unrealized losses on futures contracts | $ 3,244,547* |
| Equity risk | | | | Written options, at value | 602,079 |
| Foreign currency risk | Unrealized gains on forward foreign currency contracts | 285,086 | | Unrealized losses on forward foreign currency contracts | 0 |
| Credit risk | Net unrealized gains on swap contracts | 5,249* | | Net unrealized losses on swap contracts | 0* |
| | | $743,134 | | | $3,846,626 |
* Amount represents the cumulative unrealized gains (losses) as reported in the tables following the Portfolio of Investments. For futures contracts and centrally cleared swap contracts, only the current day's variation margin as of March 31, 2021 is reported separately on the Statement of Assets and Liabilities.
Wells Fargo Diversified Income Builder Fund | 47
Notes to financial statements (unaudited)
The effect of derivative instruments on the Statement of Operations for the six months ended March 31, 2021 was as follows for the Fund:
| | Amount of realized gains (losses) on derivatives |
| | Futures
contracts | Forward
foreign
currency
contracts | Swap
contracts | Written
options | Total |
| Equity risk | $ 9,199,940 | $ 0 | $ 0 | $ (1,514,739) | $ 7,685,201 |
| Foreign currency risk | 0 | 90,455 | 0 | 0 | 90,445 |
| Credit risk | 0 | 0 | (12,230) | 0 | (12,230) |
| | $9,199,940 | $90,445 | $(12,230) | $(1,514,739) | $7,763,416 |
| | Change in unrealized gains (losses) on derivatives |
| | Futures
contracts | Forward
foreign
currency
contracts | Swap
contracts | Written
options | Total |
| Interest rate risk | $ 272,361 | $ 0 | $ 0 | $ 0 | $ 272,361 |
| Equity risk | (3,031,692) | 0 | 0 | 136,109 | (2,895,583) |
| Foreign currency risk | 128,937 | 151,254 | 0 | 0 | 280,191 |
| Credit risk | 0 | 0 | 5,249 | 0 | 5,249 |
| | $(2,630,394) | $151,254 | $5,249 | $136,109 | $(2,337,782) |
For certain types of derivative transactions, the Fund has entered into International Swaps and Derivatives Association, Inc. master agreements (“ISDA Master Agreements”) or similar agreements with approved counterparties. The ISDA Master Agreements or similar agreements may have requirements to deliver/deposit securities or cash to/with an exchange or broker-dealer as collateral and allows the Fund to offset, with each counterparty, certain derivative financial instrument’s assets and/or liabilities with collateral held or pledged. Collateral requirements differ by type of derivative. Collateral or margin requirements are set by the broker or exchange clearinghouse for exchange traded derivatives while collateral terms are contract specific for over-the-counter traded derivatives. Cash collateral that has been pledged to cover obligations of the Fund under ISDA Master Agreements or similar agreements, if any, are reported separately in the Statement of Assets and Liabilities. Securities pledged as collateral, if any, are noted in the Portfolio of Investments. With respect to balance sheet offsetting, absent an event of default by the counterparty or a termination of the agreement, the reported amounts of financial assets and financial liabilities in the Statement of Assets and Liabilities are not offset across transactions between the Fund and the applicable counterparty. A reconciliation of the gross amounts on the Statement of Assets and Liabilities to the net amounts by counterparty, including any collateral exposure, for OTC derivatives is as follows:
| Counterparty | Gross amounts
of assets in the
Statement of
Assets and
Liabilities | Amounts
subject to
netting
agreements | Collateral
pledged1 | Net amount
of assets |
| Citibank NA | $285,086 | $0 | $(250,000) | $35,086 |
1 Collateral pledged within this table is limited to the collateral for the net transaction with the counterparty.
8. BANK BORROWINGS
The Trust (excluding the money market funds), Wells Fargo Master Trust and Wells Fargo Variable Trust are parties to a $350,000,000 revolving credit agreement whereby the Fund is permitted to use bank borrowings for temporary or emergency purposes, such as to fund shareholder redemption requests. Interest under the credit agreement is charged to the Fund based on a borrowing rate equal to the higher of the Federal Funds rate in effect on that day plus 1.25% or the overnight LIBOR rate in effect on that day plus 1.25%. In addition, an annual commitment fee equal to 0.25% of the unused balance is allocated to each participating fund.
For the six months ended March 31, 2021, there were no borrowings by the Fund under the agreement.
48 | Wells Fargo Diversified Income Builder Fund
Notes to financial statements (unaudited)
9. INDEMNIFICATION
Under the Fund's organizational documents, the officers and Trustees have been granted certain indemnification rights against certain liabilities that may arise out of performance of their duties to the Fund. The Fund has entered into a separate agreement with each Trustee that converts indemnification rights currently existing under the Fund’s organizational documents into contractual rights that cannot be changed in the future without the consent of the Trustee. Additionally, in the normal course of business, the Fund may enter into contracts with service providers that contain a variety of indemnification clauses. The Fund’s maximum exposure under these arrangements is dependent on future claims that may be made against the Fund and, therefore, cannot be estimated.
10. CORONAVIRUS (COVID-19) PANDEMIC
On March 11, 2020, the World Health Organization announced that it had made the assessment that coronavirus disease 2019 (“COVID-19”) is a pandemic. The impacts of COVID-19 are affecting the entire global economy, individual companies and investment products, the funds, and the market in general. There is significant uncertainty around the extent and duration of business disruptions related to COVID-19 and the impacts may last for an extended period of time. COVID-19 has led to significant uncertainty and volatility in the financial markets.
Wells Fargo Diversified Income Builder Fund | 49
Other information (unaudited)
PROXY VOTING INFORMATION
A description of the policies and procedures used to determine how to vote proxies relating to portfolio securities is available without charge, upon request, by calling 1-800-222-8222, visiting our website at wfam.com, or visiting the SEC website at sec.gov. Information regarding how the proxies related to portfolio securities were voted during the most recent 12-month period ended June 30 is available on the website at wfam.com or by visiting the SEC website at sec.gov.
QUARTERLY PORTFOLIO HOLDINGS INFORMATION
The Fund files its complete schedule of portfolio holdings with the SEC for the first and third quarters of each fiscal year as an exhibit to its reports on Form N-PORT. Shareholders may view the filed Form N-PORT by visiting the SEC website at sec.gov.
50 | Wells Fargo Diversified Income Builder Fund
Other information (unaudited)
BOARD OF TRUSTEES AND OFFICERS
Each of the Trustees and Officers listed in the table below acts in identical capacities for each fund in the Wells Fargo family of funds, which consists of 142 mutual funds comprising the Wells Fargo Funds Trust, Wells Fargo Variable Trust, Wells Fargo Master Trust and four closed-end funds (collectively the “Fund Complex”). This table should be read in conjunction with the Prospectus and the Statement of Additional Information1. The mailing address of each Trustee and Officer is 525 Market Street, 12th Floor, San Francisco, CA 94105. Each Trustee and Officer serves an indefinite term, however, each Trustee serves such term until reaching the mandatory retirement age established by the Trustees.
Independent Trustees
Name and
year of birth | Position held and
length of service* | Principal occupations during past five years or longer | Current other
public company or
investment
company
directorships |
William R. Ebsworth
(Born 1957) | Trustee,
since 2015 | Retired. From 1984 to 2013, equities analyst, portfolio manager, research director and chief investment officer at Fidelity Management and Research Company in Boston, Tokyo, and Hong Kong, and retired in 2013 as Chief Investment Officer of Fidelity Strategic Advisers, Inc. where he led a team of investment professionals managing client assets. Prior thereto, Board member of Hong Kong Securities Clearing Co., Hong Kong Options Clearing Corp., the Thailand International Fund, Ltd., Fidelity Investments Life Insurance Company, and Empire Fidelity Investments Life Insurance Company. Audit Committee Chair and Investment Committee Chair of the Vincent Memorial Hospital Endowment (non-profit organization). Mr. Ebsworth is a CFA® charterholder. | N/A |
Jane A. Freeman
(Born 1953) | Trustee,
since 2015;
Chair Liaison,
since 2018 | Retired. From 2012 to 2014 and 1999 to 2008, Chief Financial Officer of Scientific Learning Corporation. From 2008 to 2012, Ms. Freeman provided consulting services related to strategic business projects. Prior to 1999, Portfolio Manager at Rockefeller & Co. and Scudder, Stevens & Clark. Board member of the Harding Loevner Funds from 1996 to 2014, serving as both Lead Independent Director and chair of the Audit Committee. Board member of the Russell Exchange Traded Funds Trust from 2011 to 2012 and the chair of the Audit Committee. Ms. Freeman is also an inactive Chartered Financial Analyst. | N/A |
Isaiah Harris, Jr.
(Born 1952) | Trustee,
since 2009; Audit
Committee
Chair,
since 2019 | Retired. Chairman of the Board of CIGNA Corporation since 2009, and Director since 2005. From 2003 to 2011, Director of Deluxe Corporation. Prior thereto, President and CEO of BellSouth Advertising and Publishing Corp. from 2005 to 2007, President and CEO of BellSouth Enterprises from 2004 to 2005 and President of BellSouth Consumer Services from 2000 to 2003. Emeritus member of the Iowa State University Foundation Board of Governors. Emeritus Member of the Advisory Board of Iowa State University School of Business. Advisory Board Member, Palm Harbor Academy (private school). Mr. Harris is a certified public accountant (inactive status). | CIGNA Corporation |
Judith M. Johnson
(Born 1949) | Trustee,
since 2008 | Retired. Prior thereto, Chief Executive Officer and Chief Investment Officer of Minneapolis Employees Retirement Fund from 1996 to 2008. Ms. Johnson is an attorney, certified public accountant and a certified managerial accountant. | N/A |
David F. Larcker
(Born 1950) | Trustee,
since 2009 | James Irvin Miller Professor of Accounting at the Graduate School of Business (Emeritus), Stanford University, Director of the Corporate Governance Research Initiative and Senior Faculty of The Rock Center for Corporate Governance since 2006. From 2005 to 2008, Professor of Accounting at the Graduate School of Business, Stanford University. Prior thereto, Ernst & Young Professor of Accounting at The Wharton School, University of Pennsylvania from 1985 to 2005. | N/A |
Wells Fargo Diversified Income Builder Fund | 51
Other information (unaudited)
Name and
year of birth | Position held and
length of service* | Principal occupations during past five years or longer | Current other
public company or
investment
company
directorships |
Olivia S. Mitchell
(Born 1953) | Trustee,
since 2006;
Nominating and
Governance
Committee Chair,
since 2018 | International Foundation of Employee Benefit Plans Professor, Wharton School of the University of Pennsylvania since 1993. Director of Wharton’s Pension Research Council and Boettner Center on Pensions & Retirement Research, and Research Associate at the National Bureau of Economic Research. Previously, Cornell University Professor from 1978 to 1993. | N/A |
Timothy J. Penny
(Born 1951) | Trustee,
since 1996;
Chair,
since 2018 | President and Chief Executive Officer of Southern Minnesota Initiative Foundation, a non-profit organization, since 2007. Member of the Board of Trustees of NorthStar Education Finance, Inc., a non-profit organization, since 2007. | N/A |
James G. Polisson
(Born 1959) | Trustee,
since 2018 | Retired. Chief Marketing Officer, Source (ETF) UK Services, Ltd, from 2015 to 2017. From 2012 to 2015, Principal of The Polisson Group, LLC, a management consulting, corporate advisory and principal investing company. Chief Executive Officer and Managing Director at Russell Investments, Global Exchange Traded Funds from 2010 to 2012. Managing Director of Barclays Global Investors from 1998 to 2010 and Global Chief Marketing Officer for iShares and Barclays Global Investors from 2000 to 2010. Trustee of the San Francisco Mechanics’ Institute, a non-profit organization, from 2013 to 2015. Board member of the Russell Exchange Traded Fund Trust from 2011 to 2012. Director of Barclays Global Investors Holdings Deutschland GmbH from 2006 to 2009. Mr. Polisson is an attorney and has a retired status with the Massachusetts and District of Columbia Bar Associations. | N/A |
Pamela Wheelock
(Born 1959) | Trustee,
since January
2020; previously
Trustee from
January 2018 to
July 2019 | Board member of the Destination Medical Center Economic Development Agency, Rochester, Minnesota since 2019. Interim President of the McKnight Foundation from January to September 2020. Acting Commissioner, Minnesota Department of Human Services, July 2019 through September 2019. Human Services Manager (part-time), Minnesota Department of Human Services, October 2019 through December 2019. Chief Operating Officer, Twin Cities Habitat for Humanity from 2017 to 2019. Vice President of University Services, University of Minnesota from 2012 to 2016. Prior thereto, on the Board of Directors, Governance Committee and Finance Committee for the Minnesota Philanthropy Partners (Saint Paul Foundation) from 2012 to 2018, Interim Chief Executive Officer of Blue Cross Blue Shield of Minnesota from 2011 to 2012, Chairman of the Board from 2009 to 2012 and Board Director from 2003 to 2015. Vice President, Leadership and Community Engagement, Bush Foundation, Saint Paul, Minnesota (a private foundation) from 2009 to 2011. Executive Vice President and Chief Financial Officer, Minnesota Sports and Entertainment from 2004 to 2009 and Senior Vice President from 2002 to 2004. Executive Vice President of the Minnesota Wild Foundation from 2004 to 2008. Commissioner of Finance, State of Minnesota, from 1999 to 2002. Currently Board Chair of the Minnesota Wild Foundation since 2010. | N/A |
* Length of service dates reflect the Trustee’s commencement of service with the Trust’s predecessor entities, where applicable.
52 | Wells Fargo Diversified Income Builder Fund
Other information (unaudited)
Officers
Name and
year of birth | Position held and
length of service | Principal occupations during past five years or longer |
Andrew Owen
(Born 1960) | President,
since 2017 | Executive Vice President of Wells Fargo & Company and Head of Affiliated Managers, Wells Fargo Asset Management, since 2014. In addition, Mr. Owen is currently President, Chief Executive Officer and Director of Wells Fargo Funds Management, LLC since 2017. Prior thereto, Executive Vice President responsible for marketing, investments and product development for Wells Fargo Funds Management, LLC, from 2009 to 2014. |
Jeremy DePalma
(Born 1974) | Treasurer,
since 2012
(for certain funds in
the Fund Complex);
since 2021 (for
the remaining funds in the
Fund Complex) | Senior Vice President of Wells Fargo Funds Management, LLC since 2009. Senior Vice President of Evergreen Investment Management Company, LLC from 2008 to 2010 and head of the Fund Reporting and Control Team within Fund Administration from 2005 to 2010. |
Michelle Rhee
(Born 1966) | Chief Legal Officer,
since 2019 | Secretary of Wells Fargo Funds Management, LLC and Chief Legal Counsel of Wells Fargo Asset Management since 2018. Deputy General Counsel of Wells Fargo Bank, N.A. since 2020 and Assistant General Counsel of Wells Fargo Bank, N.A. from 2018 to 2020. Associate General Counsel and Managing Director of Bank of America Corporation from 2004 to 2018. |
Catherine Kennedy
(Born 1969) | Secretary,
since 2019 | Vice President of Wells Fargo Funds Management, LLC and Senior Counsel of the Wells Fargo Legal Department since 2010. Vice President and Senior Counsel of Evergreen Investment Management Company, LLC from 1998 to 2010. |
Michael H. Whitaker
(Born 1967) | Chief Compliance Officer,
since 2016 | Chief Compliance Officer of Wells Fargo Asset Management since 2016. Senior Vice President and Chief Compliance Officer for Fidelity Investments from 2007 to 2016. |
1 The Statement of Additional Information includes additional information about the Trustees and is available, without charge, upon request, by calling 1-800-222-8222 or by visiting the website at wfam.com.
Wells Fargo Diversified Income Builder Fund | 53
For more information
More information about Wells Fargo Funds is available free upon request. To obtain literature, please write, visit the Fund's website, or call:
Wells Fargo Funds
P.O. Box 219967
Kansas City, MO 64121-9967
Website: wfam.com
Individual investors: 1-800-222-8222
Retail investment professionals: 1-888-877-9275
Institutional investment professionals: 1-866-765-0778
This report and the financial statements contained herein are submitted for the general information of the shareholders of the Fund. If this report is used for promotional purposes, distribution of the report must be accompanied or preceded by a current prospectus. Before investing, please consider the investment objectives, risks, charges, and expenses of the investment. For a current prospectus and, if available, a summary prospectus, containing this information, call 1-800-222-8222 or visit the Fund's website at wfam.com. Read the prospectus carefully before you invest or send money.
Wells Fargo Asset Management (WFAM) is the trade name for certain investment advisory/management firms owned by Wells Fargo & Company. These firms include but are not limited to Wells Capital Management Incorporated and Wells Fargo Funds Management, LLC. Certain products managed by WFAM entities are distributed by Wells Fargo Funds Distributor, LLC (a broker-dealer and Member FINRA).
This material is for general informational and educational purposes only and is NOT intended to provide investment advice or a recommendation of any kind - including a recommendation for any specific investment, strategy, or plan.
INVESTMENT PRODUCTS: NOT FDIC INSURED ■ NO BANK GUARANTEE ■ MAY LOSE VALUE
© 2021 Wells Fargo & Company. All rights reserved.
PAR-0421-00288 05-21
SA226/SAR226 03-21
Semi-Annual Report
March 31, 2021
Wells Fargo
Index Asset Allocation Fund
Reduce clutter.
Save trees.
Sign up for electronic delivery of prospectuses and shareholder reports at wellsfargo.com/ advantagedelivery
The views expressed and any forward-looking statements are as of March 31, 2021, unless otherwise noted, and are those of the Fund's portfolio managers and/or Wells Fargo Asset Management. Discussions of individual securities or the markets generally are not intended as individual recommendations. Future events or results may vary significantly from those expressed in any forward-looking statements. The views expressed are subject to change at any time in response to changing circumstances in the market. Wells Fargo Asset Management and the Fund disclaim any obligation to publicly update or revise any views expressed or forward-looking statements.
INVESTMENT PRODUCTS: NOT FDIC INSURED ■ NO BANK GUARANTEE ■ MAY LOSE VALUE
Wells Fargo Index Asset Allocation Fund | 1
Letter to shareholders (unaudited)
Andrew Owen
President
Wells Fargo Funds
Dear Shareholder:
We are pleased to offer you this semi-annual report for the Wells Fargo Index Asset Allocation Fund for the six-month period that ended March 31, 2021. Despite a deeply challenging year, dominated by the spread of COVID-19 cases and a sharp drop in economic output throughout much of the world, global stocks performed extremely well, benefiting from ongoing central bank support and rising optimism over the development and distribution of effective COVID-19 vaccines. Bonds also had positive returns, led by global bonds and high-yield bonds.
For the six-month period, U.S. stocks, based on the S&P 500 Index,1 gained 19.07%. International stocks, as measured by the MSCI ACWI ex USA Index (Net),2 returned 21.10%, while the MSCI EM Index (Net),3 had even stronger performance, with a 22.43% gain. Among bond indexes, the Bloomberg Barclays U.S. Aggregate Bond Index,4 returned -2.73%, the Bloomberg Barclays Global Aggregate ex-USD Index (unhedged),5 returned -0.47%, and the Bloomberg Barclays Municipal Bond Index,6 returned 1.46% while the ICE BofA U.S. High Yield Index,7 gained 7.44%.
Hope drove the stock markets to new highs.
In October, capital markets stepped back from their six-month rally. Market volatility rose in advance of the U.S. election and amid a global increase in COVID-19 infections. Europe introduced tighter restrictions affecting economic activity. U.S. markets looked favorably at the prospect of Democratic control of the federal purse strings, which could lead to additional fiscal stimulus and a boost to economic activity. Meanwhile, China reported 4.9% third-quarter gross domestic product growth.
Global stocks rallied in November, propelled by optimism over three promising COVID-19 vaccines. Reversing recent trends, value stocks outperformed growth stocks and cyclical stocks outpaced information technology (IT) stocks. However, U.S. unemployment remained elevated, with a net job loss of 10 million since February. The eurozone services purchasing managers’ index contracted sharply while the region’s manufacturing activity grew. The U.S. election results added to the upbeat mood as investors anticipated more consistent policies in the new administration.
“Global stocks rallied in November, propelled by optimism over three promising COVID-19 vaccines.”
| 1 | The S&P 500 Index consists of 500 stocks chosen for market size, liquidity, and industry group representation. It is a market-value-weighted index with each stock's weight in the index proportionate to its market value. You cannot invest directly in an index. |
| 2 | The Morgan Stanley Capital International (MSCI) All Country World Index (ACWI) ex USA Index (Net) is a free-float-adjusted market-capitalization-weighted index that is designed to measure the equity market performance of developed and emerging markets, excluding the United States. Source: MSCI. MSCI makes no express or implied warranties or representations and shall have no liability whatsoever with respect to any MSCI data contained herein. The MSCI data may not be further redistributed or used as a basis for other indices or any securities or financial products. This report is not approved, reviewed, or produced by MSCI. You cannot invest directly in an index. |
| 1 | The S&P 500 Index consists of 500 stocks chosen for market size, liquidity, and industry group representation. It is a market-value-weighted index with each stock's weight in the index proportionate to its market value. You cannot invest directly in an index. |
| 3 | The MSCI Emerging Markets (EM) Index (Net) is a free-float-adjusted market-capitalization-weighted index that is designed to measure equity market performance of emerging markets. You cannot invest directly in an index. |
| 1 | The S&P 500 Index consists of 500 stocks chosen for market size, liquidity, and industry group representation. It is a market-value-weighted index with each stock's weight in the index proportionate to its market value. You cannot invest directly in an index. |
| 4 | The Bloomberg Barclays U.S. Aggregate Bond Index is a broad-based benchmark that measures the investment-grade, U.S. dollar-denominated, fixed-rate taxable bond market, including Treasuries, government-related and corporate securities, mortgage-backed securities (agency fixed-rate and hybrid adjustable-rate mortgage pass-throughs), asset-backed securities, and commercial mortgage-backed securities. You cannot invest directly in an index. |
| 1 | The S&P 500 Index consists of 500 stocks chosen for market size, liquidity, and industry group representation. It is a market-value-weighted index with each stock's weight in the index proportionate to its market value. You cannot invest directly in an index. |
| 5 | The Bloomberg Barclays Global Aggregate ex-USD Index (unhedged) is an unmanaged index that provides a broad-based measure of the global investment-grade fixed-income markets excluding the U.S. dollar-denominated debt market. You cannot invest directly in an index. |
| 1 | The S&P 500 Index consists of 500 stocks chosen for market size, liquidity, and industry group representation. It is a market-value-weighted index with each stock's weight in the index proportionate to its market value. You cannot invest directly in an index. |
| 6 | The Bloomberg Barclays Municipal Bond Index is an unmanaged index composed of long-term tax-exempt bonds with a minimum credit rating of Baa. You cannot invest directly in an index. |
| 1 | The S&P 500 Index consists of 500 stocks chosen for market size, liquidity, and industry group representation. It is a market-value-weighted index with each stock's weight in the index proportionate to its market value. You cannot invest directly in an index. |
| 7 | The ICE BofA U.S. High Yield Index is a market-capitalization-weighted index of domestic and Yankee high-yield bonds. The index tracks the performance of high-yield securities traded in the U.S. bond market. You cannot invest directly in an index. Copyright 2021. ICE Data Indices, LLC. All rights reserved. |
2 | Wells Fargo Index Asset Allocation Fund
Letter to shareholders (unaudited)
Financial markets ended the year with strength on high expectations for a rapid rollout of the COVID-19 vaccines, the successful passage of a $900 billion stimulus package, and rising expectations of additional economic support from a Democratic-led Congress. U.S. economic data were mixed with still-elevated unemployment and weak retail sales but growth in manufacturing output. In contrast, China’s economic expansion continued in both manufacturing and nonmanufacturing. U.S. COVID-19 infection rates continued to rise even as new state and local lockdown measures were implemented.
The year 2021 began with emerging market stocks leading all major asset classes in January, driven by China’s strong economic growth and a broad recovery in corporate earnings, which propelled China’s stock market higher. In the U.S., positive news on vaccine trials and January's expansion in both the manufacturing and services sectors were offset by a weak December monthly jobs report. This was compounded by technical factors as some hedge funds were forced to sell stocks to protect themselves against a well-publicized short squeeze coordinated by a group of retail investors. Eurozone sentiment and economic growth were particularly weak, reflecting the impact of a new lockdown with stricter social distancing along with a slow vaccine rollout.
February saw major domestic equity indexes driven higher on the hope of a new stimulus bill, improving COVID-19 vaccination numbers, and the gradual reopening of the economy. Most S&P 500 companies reported better-than-expected earnings, with positive surprises coming from the financials, IT, health care, and materials sectors. Japan saw its economy strengthen as a result of strong export numbers. Meanwhile, crude-oil prices continued their climb, rising more than 25% for the year. Domestic government bonds experienced a sharp sell-off in late February as markets priced in a more robust economic recovery and higher future growth and inflation expectations.
The passage of the massive domestic stimulus bill highlighted March activity, leading to increased forecasts for U.S. growth in 2021. Domestic employment surged as COVID-19 vaccinations and an increasingly open economy spurred hiring. A majority of U.S. small companies reported they are operating at pre-pandemic capacity or higher. Value continued its outperformance of growth in the month, continuing the trend that started in late 2020. Meanwhile, most major developed global equity indexes are up month to date on the back of rising optimism regarding the outlook for global growth. While the U.S. and the U.K. have been the most successful in terms of the vaccine rollout, even within markets where the vaccine has lagged, such as the eurozone and Japan, equity indexes in many of those countries are also in positive territory this year.
Don’t let short-term uncertainty derail long-term investment goals.
Periods of investment uncertainty can present challenges, but experience has taught us that maintaining long-term investment goals can be an effective way to plan for the future. To help you create a sound strategy based on your personal goals and risk tolerance, Wells Fargo Funds offers more than 100 mutual funds spanning a wide range of asset classes and investment styles. Although diversification cannot guarantee an investment profit or prevent losses, we believe it can be an effective way to manage investment risk and potentially smooth out overall portfolio performance. We encourage investors to know their investments and to understand that appropriate levels of risk-taking may unlock opportunities.
Thank you for choosing to invest with Wells Fargo Funds. We appreciate your confidence in us and remain committed to helping you meet your financial needs.
Sincerely,
Andrew Owen
President
Wells Fargo Funds
“The passage of the massive domestic stimulus bill highlighted March activity, leading to increased forecasts for U.S. growth in 2021.”
For further information about your Fund, contact your investment professional, visit our website at wfam.com, or call us directly at 1-800-222-8222.
Wells Fargo Index Asset Allocation Fund | 3
Letter to shareholders (unaudited)
Preparing for LIBOR Transition
The global financial industry is preparing to transition away from the London Interbank Offered Rate (LIBOR), a key benchmark interest rate, to new alternative rates. LIBOR underpins more than $350 trillion of financial contracts. It is the benchmark rate for a wide spectrum of products ranging from residential mortgages to corporate bonds to derivatives. Regulators have called for a market-wide transition away from LIBOR to successor reference rates by the end of 2021 (expected to be extended through June 30, 2023 for most tenors of the U.S. dollar LIBOR), which requires proactive steps be taken by issuers, counterparties, and asset managers to identify impacted products and adopt new reference rates.
The Fund holds at least one security that uses LIBOR as a floating reference rate and has a maturity date after December 31, 2021.
Although the transition process away from LIBOR has become increasingly well-defined in advance of the anticipated discontinuation date, there remains uncertainty regarding the nature of successor reference rates, and any potential effects of the transition away from LIBOR on investment instruments that use it as a benchmark rate. The transition process may result in, among other things, increased volatility or illiquidity in markets for instruments that currently rely on LIBOR and could negatively impact the value of certain instruments held by the Fund.
Wells Fargo Asset Management is monitoring LIBOR exposure closely and has put resources and controls in place to manage this transition effectively. The Fund’s portfolio management team is evaluating LIBOR holdings to understand what happens to those securities when LIBOR ceases to exist, including examining security documentation to identify the presence or absence of fallback language identifying a replacement rate to LIBOR.
While the pace of transition away from LIBOR will differ by asset class and investment strategy, the portfolio management team will monitor market conditions for those holdings to identify and mitigate deterioration or volatility in pricing and liquidity and ensure appropriate actions are taken in a timely manner.
Further information regarding the potential risks associated with the discontinuation of LIBOR can be found in the Fund’s Statement of Additional Information.
4 | Wells Fargo Index Asset Allocation Fund
This page is intentionally left blank.
Performance highlights (unaudited)
| Investment objective | The Fund seeks long-term total return, consisting of capital appreciation and current income. |
| Manager | Wells Fargo Funds Management, LLC |
| Subadviser | Wells Capital Mangagement Incorporated |
| Portfolio managers | Kandarp R. Acharya, CFA®‡, FRM, Petros N. Bocray, CFA®‡, FRM, Christian L. Chan, CFA®‡ |
| Average annual total returns (%) as of March 31, 2021 |
| | | Including sales charge | | Excluding sales charge | | Expense ratios1 (%) |
| | Inception date | 1 year | 5 year | 10 year | | 1 year | 5 year | 10 year | | Gross | Net 2 |
| Class A (SFAAX) | 11-13-1986 | 22.19 | 9.08 | 9.90 | | 29.64 | 10.38 | 10.55 | | 1.10 | 1.08 |
| Class C (WFALX) | 4-1-1998 | 27.69 | 9.56 | 9.72 | | 28.69 | 9.56 | 9.72 | | 1.85 | 1.83 |
| Administrator Class (WFAIX) | 11-8-1999 | – | – | – | | 29.89 | 10.57 | 10.78 | | 1.02 | 0.90 |
| Institutional Class (WFATX)3 | 10-31-2016 | – | – | – | | 30.07 | 10.72 | 10.86 | | 0.77 | 0.75 |
| Index Asset Allocation Blended Index4 | – | – | – | – | | 29.07 | 10.84 | 11.29 | | – | – |
| Bloomberg Barclays U.S. Treasury Index5 | – | – | – | – | | -4.43 | 2.23 | 2.90 | | – | – |
| S&P 500 Index6 | – | – | – | – | | 56.35 | 16.29 | 13.91 | | – | – |
Figures quoted represent past performance, which is no guarantee of future results, and do not reflect taxes that a shareholder may pay on an investment in a fund. Investment return and principal value of an investment will fluctuate so that an investor’s shares, when redeemed, may be worth more or less than their original cost. Performance shown without sales charges would be lower if sales charges were reflected. Current performance may be lower or higher than the performance data quoted, which assumes the reinvestment of dividends and capital gains. Current month-end performance is available on the Fund’s website, wfam.com.
Please keep in mind that high double-digit returns were primarily achieved during favorable market conditions. You should not expect that such favorable returns can be consistently achieved. A fund’s performance, especially for short time periods, should not be the sole factor in making your investment decision.
Index returns do not include transaction costs associated with buying and selling securities, any mutual fund fees or expenses, or any taxes. It is not possible to invest directly in an index.
For Class A shares, the maximum front-end sales charge is 5.75%. For Class C shares, the maximum contingent deferred sales charge is 1.00%. Performance including a contingent deferred sales charge assumes the sales charge for the corresponding time period. Administrator Class and Institutional Class shares are sold without a front-end sales charge or contingent deferred sales charge.
| 1 | Reflects the expense ratios as stated in the most recent prospectuses. The expense ratios shown are subject to change and may differ from the annualized expense ratios shown in the financial highlights of this report. |
| 2 | The manager has contractually committed through January 31, 2022, to waive fees and/or reimburse expenses to the extent necessary to cap total annual fund operating expenses after fee waivers at 1.08% for Class A, 1.83% for Class C, 0.90% for Administrator Class, and 0.75% for Institutional Class. Brokerage commissions, stamp duty fees, interest, taxes, acquired fund fees and expenses (if any), and extraordinary expenses are excluded from the expense caps. Prior to or after the commitment expiration date, the caps may be increased or the commitment to maintain the caps may be terminated only with the approval of the Board of Trustees. Without these caps, the Fund’s returns would have been lower. The expense ratio paid by an investor is the net expense ratio (the total annual fund operating expenses after fee waivers) as stated in the prospectuses. |
| 3 | Historical performance shown for the Institutional Class shares prior to their inception reflects the performance of the Administrator Class shares, and includes the higher expenses applicable to the Administrator Class shares. If these expenses had not been included, returns for the Institutional Class shares would be higher. |
| 4 | Source: Wells Fargo Funds Management, LLC. Index Asset Allocation Blended Index is composed 60% of the S&P 500 Index and 40% of the Bloomberg Barclays U.S. Treasury Index. Prior to April 1, 2015, the Index Asset Allocation Blended Index was composed 60% of the S&P 500 Index and 40% of the Bloomberg Barclays U.S. Treasury 20+ Year Index. You cannot invest directly in an index. |
| 5 | The Bloomberg Barclays U.S. Treasury Index is an unmanaged index of prices of U.S. Treasury bonds with maturities of 1 to 30 years. You cannot invest directly in an index. |
| 6 | The S&P 500 Index consists of 500 stocks chosen for market size, liquidity, and industry group representation. It is a market-value weighted index with each stock’s weight in the index proportionate to its market value. You cannot invest directly in an index. |
| ‡ | CFA® and Chartered Financial Analyst® are trademarks owned by CFA Institute. |
6 | Wells Fargo Index Asset Allocation Fund
Performance highlights (unaudited)
Balanced funds may invest in stocks and bonds. Stock values fluctuate in response to the activities of individual companies and general market and economic conditions. Bond values fluctuate in response to the financial condition of individual issuers, general market and economic conditions, and changes in interest rates. Changes in market conditions and government policies may lead to periods of heightened volatility in the bond market and reduced liquidity for certain bonds held by the Fund. In general, when interest rates rise, bond values fall and investors may lose principal value. Interest rate changes and their impact on the Fund and its share price can be sudden and unpredictable. The use of derivatives may reduce returns and/or increase volatility. Consult the Fund’s prospectus for additional information on these and other risks.
Wells Fargo Index Asset Allocation Fund | 7
Performance highlights (unaudited)
| Ten largest holdings (%) as of March 31, 20211 |
| Apple Incorporated | 3.44 |
| Microsoft Corporation | 3.16 |
| Amazon.com Incorporated | 2.36 |
| Facebook Incorporated Class A | 1.26 |
| Alphabet Incorporated Class A | 1.10 |
| Alphabet Incorporated Class C | 1.06 |
| Tesla Motors Incorporated | 0.94 |
| Berkshire Hathaway Incorporated Class B | 0.87 |
| JPMorgan Chase & Company | 0.83 |
| Johnson & Johnson | 0.77 |
| 1 | Figures represent the percentage of the Fund's net assets. Holdings are subject to change and may have changed since the date specified. |
| Allocation (%) as of March 31, 2021 |
| | Neutral
allocation | Effective
allocation1 |
| Bonds | 40 | 38 |
| Stocks | 60 | 67 |
| Effective cash | 0 | (5) |
| 1 | The effective allocation reflects the effect of the tactical futures overlay that may be in place. Effective cash, if any, represents the net offset to such future positions. Effective allocations are subject to change and may have changed since the date specified. |
8 | Wells Fargo Index Asset Allocation Fund
Fund expenses (unaudited)
As a shareholder of the Fund, you incur two types of costs: (1) transaction costs, including sales charges (loads) on purchase payments and contingent deferred sales charges (if any) on redemptions and (2) ongoing costs, including management fees, distribution (12b-1) and/or shareholder servicing fees, and other Fund expenses. This example is intended to help you understand your ongoing costs (in dollars) of investing in the Fund and to compare these costs with the ongoing costs of investing in other mutual funds.
The example is based on an investment of $1,000 invested at the beginning of the six-month period and held for the entire period from October 1, 2020 to March 31, 2021.
Actual expenses
The “Actual” line of the table below provides information about actual account values and actual expenses. You may use the information in this line, together with the amount you invested, to estimate the expenses that you paid over the period. Simply divide your account value by $1,000 (for example, an $8,600 account value divided by $1,000 = 8.6), then multiply the result by the number in the “Actual” line under the heading entitled “Expenses paid during period” for your applicable class of shares to estimate the expenses you paid on your account during this period.
Hypothetical example for comparison purposes
The “Hypothetical” line of the table below provides information about hypothetical account values and hypothetical expenses based on the Fund’s actual expense ratio and an assumed rate of return of 5% per year before expenses, which is not the Fund’s actual return. The hypothetical account values and expenses may not be used to estimate the actual ending account balance or expenses you paid for the period. You may use this information to compare the ongoing costs of investing in the Fund and other funds. To do so, compare this 5% hypothetical example with the 5% hypothetical examples that appear in the shareholder reports of the other funds.
Please note that the expenses shown in the table are meant to highlight your ongoing costs only and do not reflect any transactional costs, such as sales charges (loads) and contingent deferred sales charges. Therefore, the “Hypothetical” line of the table is useful in comparing ongoing costs only and will not help you determine the relative total costs of owning different funds. In addition, if these transactional costs were included, your costs would have been higher.
| | Beginning
account value
10-1-2020 | Ending
account value
3-31-2021 | Expenses
paid during
the period1 | Annualized net
expense ratio |
| Class A | | | | |
| Actual | $1,000.00 | $1,095.09 | $5.64 | 1.08% |
| Hypothetical (5% return before expenses) | $1,000.00 | $1,019.55 | $5.44 | 1.08% |
| Class C | | | | |
| Actual | $1,000.00 | $1,091.23 | $9.54 | 1.83% |
| Hypothetical (5% return before expenses) | $1,000.00 | $1,015.81 | $9.20 | 1.83% |
| Administrator Class | | | | |
| Actual | $1,000.00 | $1,096.20 | $4.70 | 0.90% |
| Hypothetical (5% return before expenses) | $1,000.00 | $1,020.44 | $4.53 | 0.90% |
| Institutional Class | | | | |
| Actual | $1,000.00 | $1,097.03 | $3.92 | 0.75% |
| Hypothetical (5% return before expenses) | $1,000.00 | $1,021.19 | $3.78 | 0.75% |
1 Expenses paid is equal to the annualized net expense ratio of each class multiplied by the average account value over the period, multiplied by the number of days in the most recent fiscal half-year divided by the number of days in the fiscal year (to reflect the one-half-year period).
Wells Fargo Index Asset Allocation Fund | 9
Portfolio of investments—March 31, 2021 (unaudited)
| | | Interest
rate | Maturity
date | Principal | Value |
| Agency securities: 0.00% | | | | | |
| FNMA Series 2002-T1 Class A4 | | 9.50% | 11-25-2031 | $ 27,470 | $ 33,606 |
| Total Agency securities (Cost $27,470) | | | | | 33,606 |
| | | | | Shares | |
| Common stocks: 59.87% | | | | | |
| Communication services: 6.54% | | | | | |
| Diversified telecommunication services: 0.84% | | | | | |
| AT&T Incorporated | | | | 206,425 | 6,248,485 |
| Lumen Technologies Incorporated | | | | 28,561 | 381,289 |
| Verizon Communications Incorporated | | | | 119,532 | 6,950,786 |
| | | | | | 13,580,560 |
| Entertainment: 1.27% | | | | | |
| Activision Blizzard Incorporated | | | | 22,488 | 2,091,384 |
| Electronic Arts Incorporated | | | | 8,321 | 1,126,414 |
| Live Nation Entertainment Incorporated † | | | | 4,163 | 352,398 |
| Netflix Incorporated † | | | | 12,824 | 6,689,768 |
| Take-Two Interactive Software Incorporated † | | | | 3,334 | 589,118 |
| The Walt Disney Company † | | | | 52,461 | 9,680,104 |
| | | | | | 20,529,186 |
| Interactive media & services: 3.51% | | | | | |
| Alphabet Incorporated Class A † | | | | 8,665 | 17,871,736 |
| Alphabet Incorporated Class C † | | | | 8,308 | 17,186,180 |
| Facebook Incorporated Class A † | | | | 69,020 | 20,328,461 |
| Twitter Incorporated † | | | | 22,998 | 1,463,363 |
| | | | | | 56,849,740 |
| Media: 0.79% | | | | | |
| Charter Communications Incorporated Class A † | | | | 4,076 | 2,514,974 |
| Comcast Corporation Class A | | | | 131,977 | 7,141,275 |
| Discovery Incorporated Class A † | | | | 4,617 | 200,655 |
| Discovery Incorporated Class C † | | | | 8,330 | 307,294 |
| DISH Network Corporation Class A † | | | | 7,169 | 259,518 |
| Fox Corporation Class A | | | | 9,613 | 347,125 |
| Fox Corporation Class B | | | | 4,434 | 154,880 |
| Interpublic Group of Companies Incorporated | | | | 11,344 | 331,245 |
| News Corporation Class A | | | | 11,298 | 287,308 |
| News Corporation Class B | | | | 3,524 | 82,673 |
| Omnicom Group Incorporated | | | | 6,212 | 460,620 |
| ViacomCBS Incorporated Class B | | | | 16,876 | 761,108 |
| | | | | | 12,848,675 |
| Wireless telecommunication services: 0.13% | | | | | |
| T-Mobile US Incorporated † | | | | 16,876 | 2,114,394 |
The accompanying notes are an integral part of these financial statements.
10 | Wells Fargo Index Asset Allocation Fund
Portfolio of investments—March 31, 2021 (unaudited)
| | | | | Shares | Value |
| Consumer discretionary: 7.49% | | | | | |
| Auto components: 0.09% | | | | | |
| Aptiv plc † | | | | 7,832 | $ 1,080,033 |
| BorgWarner Incorporated | | | | 6,932 | 321,368 |
| | | | | | 1,401,401 |
| Automobiles: 1.16% | | | | | |
| Ford Motor Company † | | | | 113,509 | 1,390,485 |
| General Motors Company † | | | | 36,981 | 2,124,928 |
| Tesla Motors Incorporated † | | | | 22,782 | 15,216,781 |
| | | | | | 18,732,194 |
| Distributors: 0.08% | | | | | |
| Genuine Parts Company | | | | 4,170 | 482,010 |
| LKQ Corporation † | | | | 8,128 | 344,058 |
| Pool Corporation | | | | 1,169 | 403,586 |
| | | | | | 1,229,654 |
| Hotels, restaurants & leisure: 1.29% | | | | | |
| Booking Holdings Incorporated † | | | | 1,178 | 2,744,552 |
| Caesars Entertainment Incorporated † | | | | 6,108 | 534,145 |
| Carnival Corporation † | | | | 23,229 | 616,498 |
| Chipotle Mexican Grill Incorporated † | | | | 809 | 1,149,443 |
| Darden Restaurants Incorporated | | | | 3,764 | 534,488 |
| Domino's Pizza Incorporated | | | | 1,119 | 411,557 |
| Expedia Group Incorporated | | | | 3,997 | 687,964 |
| Hilton Worldwide Holdings Incorporated † | | | | 8,034 | 971,471 |
| Las Vegas Sands Corporation | | | | 9,490 | 576,612 |
| Marriott International Incorporated Class A † | | | | 7,687 | 1,138,522 |
| McDonald's Corporation | | | | 21,468 | 4,811,838 |
| MGM Resorts International | | | | 11,920 | 452,841 |
| Norwegian Cruise Line Holdings Limited † | | | | 10,591 | 292,206 |
| Penn National Gaming Incorporated † | | | | 4,380 | 459,199 |
| Royal Caribbean Cruises Limited † | | | | 6,351 | 543,709 |
| Starbucks Corporation | | | | 34,079 | 3,723,812 |
| Wynn Resorts Limited † | | | | 3,034 | 380,373 |
| Yum! Brands Incorporated | | | | 8,635 | 934,134 |
| | | | | | 20,963,364 |
| Household durables: 0.27% | | | | | |
| D.R. Horton Incorporated | | | | 9,604 | 855,908 |
| Garmin Limited | | | | 4,316 | 569,065 |
| Leggett & Platt Incorporated | | | | 3,850 | 175,753 |
| Lennar Corporation Class A | | | | 7,973 | 807,107 |
| Mohawk Industries Incorporated † | | | | 1,711 | 329,042 |
| Newell Rubbermaid Incorporated | | | | 10,931 | 292,732 |
| NVR Incorporated † | | | | 100 | 471,093 |
| PulteGroup Incorporated | | | | 7,737 | 405,728 |
| Whirlpool Corporation | | | | 1,824 | 401,918 |
| | | | | | 4,308,346 |
| Internet & direct marketing retail: 2.47% | | | | | |
| Amazon.com Incorporated † | | | | 12,350 | 38,211,888 |
The accompanying notes are an integral part of these financial statements.
Wells Fargo Index Asset Allocation Fund | 11
Portfolio of investments—March 31, 2021 (unaudited)
| | | | | Shares | Value |
| Internet & direct marketing retail (continued) | | | | | |
| eBay Incorporated | | | | 18,725 | $ 1,146,719 |
| Etsy Incorporated † | | | | 3,644 | 734,885 |
| | | | | | 40,093,492 |
| Leisure products: 0.02% | | | | | |
| Hasbro Incorporated | | | | 3,669 | 352,664 |
| Multiline retail: 0.31% | | | | | |
| Dollar General Corporation | | | | 7,030 | 1,424,419 |
| Dollar Tree Incorporated † | | | | 6,807 | 779,129 |
| Target Corporation | | | | 14,438 | 2,859,735 |
| | | | | | 5,063,283 |
| Specialty retail: 1.38% | | | | | |
| Advance Auto Parts Incorporated | | | | 1,897 | 348,081 |
| AutoZone Incorporated † | | | | 642 | 901,561 |
| Best Buy Company Incorporated | | | | 6,684 | 767,390 |
| CarMax Incorporated † | | | | 4,691 | 622,308 |
| L Brands Incorporated † | | | | 6,811 | 421,328 |
| Lowe's Companies Incorporated | | | | 21,130 | 4,018,503 |
| O'Reilly Automotive Incorporated † | | | | 2,026 | 1,027,689 |
| Ross Stores Incorporated | | | | 10,276 | 1,232,195 |
| The Gap Incorporated | | | | 5,992 | 178,442 |
| The Home Depot Incorporated | | | | 31,174 | 9,515,864 |
| The TJX Companies Incorporated | | | | 34,788 | 2,301,226 |
| Tractor Supply Company | | | | 3,343 | 591,978 |
| Ulta Beauty Incorporated † | | | | 1,617 | 499,928 |
| | | | | | 22,426,493 |
| Textiles, apparel & luxury goods: 0.42% | | | | | |
| HanesBrands Incorporated | | | | 10,074 | 198,156 |
| Nike Incorporated Class B | | | | 36,821 | 4,893,143 |
| PVH Corporation | | | | 2,063 | 218,059 |
| Ralph Lauren Corporation | | | | 1,397 | 172,055 |
| Tapestry Incorporated † | | | | 8,136 | 335,285 |
| Under Armour Incorporated Class A † | | | | 5,466 | 121,127 |
| Under Armour Incorporated Class C † | | | | 5,654 | 104,373 |
| VF Corporation | | | | 9,305 | 743,656 |
| | | | | | 6,785,854 |
| Consumer staples: 3.67% | | | | | |
| Beverages: 0.88% | | | | | |
| Brown-Forman Corporation Class B | | | | 5,282 | 364,300 |
| Constellation Brands Incorporated Class A | | | | 4,895 | 1,116,060 |
| Molson Coors Brewing Company Class B | | | | 5,426 | 277,540 |
| Monster Beverage Corporation † | | | | 10,662 | 971,202 |
| PepsiCo Incorporated | | | | 39,704 | 5,616,131 |
| The Coca-Cola Company | | | | 111,749 | 5,890,290 |
| | | | | | 14,235,523 |
| Food & staples retailing: 0.80% | | | | | |
| Costco Wholesale Corporation | | | | 12,733 | 4,488,128 |
| Sysco Corporation | | | | 14,705 | 1,157,872 |
| The Kroger Company | | | | 22,007 | 792,032 |
The accompanying notes are an integral part of these financial statements.
12 | Wells Fargo Index Asset Allocation Fund
Portfolio of investments—March 31, 2021 (unaudited)
| | | | | Shares | Value |
| Food & staples retailing (continued) | | | | | |
| Walgreens Boots Alliance Incorporated | | | | 20,689 | $ 1,135,826 |
| Walmart Incorporated | | | | 39,838 | 5,411,196 |
| | | | | | 12,985,054 |
| Food products: 0.58% | | | | | |
| Archer Daniels Midland Company | | | | 16,100 | 917,700 |
| Campbell Soup Company | | | | 5,827 | 292,923 |
| ConAgra Foods Incorporated | | | | 14,013 | 526,889 |
| General Mills Incorporated | | | | 17,514 | 1,073,958 |
| Hormel Foods Corporation | | | | 8,080 | 386,062 |
| Kellogg Company | | | | 7,279 | 460,761 |
| Lamb Weston Holdings Incorporated | | | | 4,215 | 326,578 |
| McCormick & Company Incorporated | | | | 6,979 | 622,248 |
| Mondelez International Incorporated Class A | | | | 40,483 | 2,369,470 |
| The Hershey Company | | | | 4,211 | 666,012 |
| The J.M. Smucker Company | | | | 3,128 | 395,786 |
| The Kraft Heinz Company | | | | 18,491 | 739,640 |
| Tyson Foods Incorporated Class A | | | | 8,475 | 629,693 |
| | | | | | 9,407,720 |
| Household products: 0.88% | | | | | |
| Church & Dwight Company Incorporated | | | | 7,078 | 618,263 |
| Colgate-Palmolive Company | | | | 24,453 | 1,927,630 |
| Kimberly-Clark Corporation | | | | 9,730 | 1,352,957 |
| The Clorox Company | | | | 3,618 | 697,840 |
| The Procter & Gamble Company | | | | 70,860 | 9,596,570 |
| | | | | | 14,193,260 |
| Personal products: 0.12% | | | | | |
| The Estee Lauder Companies Incorporated Class A | | | | 6,650 | 1,934,153 |
| Tobacco: 0.41% | | | | | |
| Altria Group Incorporated | | | | 53,326 | 2,728,158 |
| Philip Morris International Incorporated | | | | 44,714 | 3,967,920 |
| | | | | | 6,696,078 |
| Energy: 1.68% | | | | | |
| Energy equipment & services: 0.14% | | | | | |
| Baker Hughes Incorporated | | | | 20,901 | 451,671 |
| Halliburton Company | | | | 25,650 | 550,449 |
| NOV Incorporated | | | | 11,144 | 152,896 |
| Schlumberger Limited | | | | 40,091 | 1,090,074 |
| | | | | | 2,245,090 |
| Oil, gas & consumable fuels: 1.54% | | | | | |
| APA Corporation | | | | 11,020 | 197,258 |
| Cabot Oil & Gas Corporation | | | | 11,512 | 216,195 |
| Chevron Corporation | | | | 55,438 | 5,809,348 |
| ConocoPhillips | | | | 39,024 | 2,067,101 |
| Devon Energy Corporation | | | | 17,240 | 376,694 |
| Diamondback Energy Incorporated | | | | 5,219 | 383,544 |
| EOG Resources Incorporated | | | | 16,883 | 1,224,524 |
| Exxon Mobil Corporation | | | | 121,694 | 6,794,176 |
| Hess Corporation | | | | 7,875 | 557,235 |
The accompanying notes are an integral part of these financial statements.
Wells Fargo Index Asset Allocation Fund | 13
Portfolio of investments—March 31, 2021 (unaudited)
| | | | | Shares | Value |
| Oil, gas & consumable fuels (continued) | | | | | |
| HollyFrontier Corporation | | | | 4,287 | $ 153,389 |
| Kinder Morgan Incorporated | | | | 56,096 | 933,998 |
| Marathon Oil Corporation | | | | 22,873 | 244,284 |
| Marathon Petroleum Corporation | | | | 18,755 | 1,003,205 |
| Occidental Petroleum Corporation | | | | 24,209 | 644,444 |
| ONEOK Incorporated | | | | 12,844 | 650,677 |
| Phillips 66 | | | | 12,581 | 1,025,855 |
| Pioneer Natural Resources Company | | | | 5,943 | 943,867 |
| The Williams Companies Incorporated | | | | 35,002 | 829,197 |
| Valero Energy Corporation | | | | 11,765 | 842,374 |
| | | | | | 24,897,365 |
| Financials: 6.77% | | | | | |
| Banks: 2.67% | | | | | |
| Bank of America Corporation | | | | 218,358 | 8,448,271 |
| Citigroup Incorporated | | | | 60,329 | 4,388,935 |
| Citizens Financial Group Incorporated | | | | 12,286 | 542,427 |
| Comerica Incorporated | | | | 4,029 | 289,040 |
| Fifth Third Bancorp | | | | 20,559 | 769,935 |
| First Republic Bank | | | | 5,068 | 845,089 |
| Huntington Bancshares Incorporated | | | | 29,375 | 461,775 |
| JPMorgan Chase & Company | | | | 87,860 | 13,374,928 |
| KeyCorp | | | | 28,039 | 560,219 |
| M&T Bank Corporation | | | | 3,715 | 563,231 |
| People's United Financial Incorporated | | | | 12,286 | 219,919 |
| PNC Financial Services Group Incorporated | | | | 12,225 | 2,144,387 |
| Regions Financial Corporation | | | | 27,749 | 573,294 |
| SVB Financial Group † | | | | 1,572 | 776,034 |
| Truist Financial Corporation | | | | 39,025 | 2,275,938 |
| US Bancorp | | | | 39,446 | 2,181,758 |
| Wells Fargo & Company ♠ | | | | 119,524 | 4,669,803 |
| Zions Bancorporation | | | | 4,766 | 261,939 |
| | | | | | 43,346,922 |
| Capital markets: 1.73% | | | | | |
| Ameriprise Financial Incorporated | | | | 3,371 | 783,589 |
| Bank of New York Mellon Corporation | | | | 23,262 | 1,100,060 |
| BlackRock Incorporated | | | | 4,076 | 3,073,141 |
| Cboe Global Markets Incorporated | | | | 3,075 | 303,472 |
| CME Group Incorporated | | | | 10,314 | 2,106,428 |
| Franklin Resources Incorporated | | | | 7,846 | 232,242 |
| Intercontinental Exchange Incorporated | | | | 16,147 | 1,803,297 |
| Invesco Limited | | | | 10,879 | 274,368 |
| MarketAxess Holdings Incorporated | | | | 1,085 | 540,243 |
| Moody's Corporation | | | | 4,628 | 1,381,967 |
| Morgan Stanley | | | | 43,199 | 3,354,834 |
| MSCI Incorporated | | | | 2,377 | 996,629 |
| Northern Trust Corporation | | | | 6,012 | 631,921 |
| Raymond James Financial Incorporated | | | | 3,532 | 432,882 |
| S&P Global Incorporated | | | | 6,911 | 2,438,685 |
| State Street Corporation | | | | 10,140 | 851,861 |
| T. Rowe Price Group Incorporated | | | | 6,542 | 1,122,607 |
| The Charles Schwab Corporation | | | | 43,242 | 2,818,514 |
The accompanying notes are an integral part of these financial statements.
14 | Wells Fargo Index Asset Allocation Fund
Portfolio of investments—March 31, 2021 (unaudited)
| | | | | Shares | Value |
| Capital markets (continued) | | | | | |
| The Goldman Sachs Group Incorporated | | | | 9,923 | $ 3,244,821 |
| The NASDAQ Incorporated | | | | 3,311 | 488,240 |
| | | | | | 27,979,801 |
| Consumer finance: 0.36% | | | | | |
| American Express Company | | | | 18,808 | 2,660,204 |
| Capital One Financial Corporation | | | | 13,302 | 1,692,413 |
| Discover Financial Services | | | | 8,874 | 842,941 |
| Synchrony Financial | | | | 15,679 | 637,508 |
| | | | | | 5,833,066 |
| Diversified financial services: 0.87% | | | | | |
| Berkshire Hathaway Incorporated Class B † | | | | 54,927 | 14,032,201 |
| Insurance: 1.14% | | | | | |
| AFLAC Incorporated | | | | 18,494 | 946,523 |
| American International Group Incorporated | | | | 25,004 | 1,155,435 |
| Aon plc Class A | | | | 6,506 | 1,497,096 |
| Arthur J. Gallagher & Company | | | | 5,578 | 695,967 |
| Assurant Incorporated | | | | 1,676 | 237,607 |
| Chubb Limited | | | | 12,973 | 2,049,345 |
| Cincinnati Financial Corporation | | | | 4,326 | 445,967 |
| Everest Reinsurance Group Limited | | | | 1,151 | 285,229 |
| Globe Life Incorporated | | | | 2,745 | 265,249 |
| Lincoln National Corporation | | | | 5,225 | 325,361 |
| Loews Corporation | | | | 6,553 | 336,038 |
| Marsh & McLennan Companies Incorporated | | | | 14,666 | 1,786,319 |
| MetLife Incorporated | | | | 21,714 | 1,319,994 |
| Principal Financial Group Incorporated | | | | 7,322 | 439,027 |
| Progressive Corporation | | | | 16,915 | 1,617,243 |
| Prudential Financial Incorporated | | | | 11,454 | 1,043,459 |
| The Allstate Corporation | | | | 8,721 | 1,002,043 |
| The Hartford Financial Services Group Incorporated | | | | 10,489 | 700,560 |
| The Travelers Companies Incorporated | | | | 7,274 | 1,094,010 |
| UnumProvident Corporation | | | | 5,906 | 164,364 |
| W.R. Berkley Corporation | | | | 4,046 | 304,866 |
| Willis Towers Watson plc | | | | 3,705 | 848,000 |
| | | | | | 18,559,702 |
| Health care: 7.77% | | | | | |
| Biotechnology: 1.09% | | | | | |
| AbbVie Incorporated | | | | 50,981 | 5,517,164 |
| Alexion Pharmaceuticals Incorporated † | | | | 6,327 | 967,462 |
| Amgen Incorporated | | | | 16,613 | 4,133,481 |
| Biogen Incorporated † | | | | 4,385 | 1,226,704 |
| Gilead Sciences Incorporated | | | | 36,195 | 2,339,283 |
| Incyte Corporation † | | | | 5,405 | 439,264 |
| Regeneron Pharmaceuticals Incorporated † | | | | 3,024 | 1,430,775 |
| Vertex Pharmaceuticals Incorporated † | | | | 7,483 | 1,608,022 |
| | | | | | 17,662,155 |
| Health care equipment & supplies: 2.17% | | | | | |
| Abbott Laboratories | | | | 50,984 | 6,109,923 |
| ABIOMED Incorporated † | | | | 1,309 | 417,218 |
| Align Technology Incorporated † | | | | 2,083 | 1,128,007 |
The accompanying notes are an integral part of these financial statements.
Wells Fargo Index Asset Allocation Fund | 15
Portfolio of investments—March 31, 2021 (unaudited)
| | | | | Shares | Value |
| Health care equipment & supplies (continued) | | | | | |
| Baxter International Incorporated | | | | 14,571 | $ 1,228,918 |
| Becton Dickinson & Company | | | | 8,365 | 2,033,950 |
| Boston Scientific Corporation † | | | | 40,953 | 1,582,833 |
| Danaher Corporation | | | | 18,242 | 4,105,909 |
| Dentsply Sirona Incorporated | | | | 6,356 | 405,576 |
| DexCom Incorporated † | | | | 2,781 | 999,464 |
| Edwards Lifesciences Corporation † | | | | 18,044 | 1,509,200 |
| Hologic Incorporated † | | | | 7,428 | 552,495 |
| IDEXX Laboratories Incorporated † | | | | 2,469 | 1,208,106 |
| Intuitive Surgical Incorporated † | | | | 3,407 | 2,517,569 |
| Medtronic plc | | | | 38,876 | 4,592,422 |
| ResMed Incorporated | | | | 4,207 | 816,242 |
| STERIS plc | | | | 2,459 | 468,390 |
| Stryker Corporation | | | | 9,435 | 2,298,177 |
| Teleflex Incorporated | | | | 1,347 | 559,625 |
| The Cooper Companies Incorporated | | | | 1,419 | 545,024 |
| Varian Medical Systems Incorporated † | | | | 2,652 | 468,158 |
| West Pharmaceutical Services Incorporated | | | | 2,136 | 601,882 |
| Zimmer Biomet Holdings Incorporated | | | | 6,013 | 962,561 |
| | | | | | 35,111,649 |
| Health care providers & services: 1.60% | | | | | |
| AmerisourceBergen Corporation | | | | 4,238 | 500,381 |
| Anthem Incorporated | | | | 7,044 | 2,528,444 |
| Cardinal Health Incorporated | | | | 8,455 | 513,641 |
| Centene Corporation † | | | | 16,745 | 1,070,173 |
| Cigna Corporation | | | | 10,137 | 2,450,518 |
| CVS Health Corporation | | | | 37,783 | 2,842,415 |
| DaVita HealthCare Partners Incorporated † | | | | 2,084 | 224,593 |
| HCA Healthcare Incorporated | | | | 7,647 | 1,440,236 |
| Henry Schein Incorporated † | | | | 4,114 | 284,853 |
| Humana Incorporated | | | | 3,711 | 1,555,837 |
| Laboratory Corporation of America Holdings † | | | | 2,827 | 720,970 |
| McKesson Corporation | | | | 4,578 | 892,893 |
| Quest Diagnostics Incorporated | | | | 3,866 | 496,162 |
| UnitedHealth Group Incorporated | | | | 27,154 | 10,103,189 |
| Universal Health Services Incorporated Class B | | | | 2,257 | 301,061 |
| | | | | | 25,925,366 |
| Health care technology: 0.04% | | | | | |
| Cerner Corporation | | | | 8,837 | 635,204 |
| Life sciences tools & services: 0.68% | | | | | |
| Agilent Technologies Incorporated | | | | 8,781 | 1,116,416 |
| Bio-Rad Laboratories Incorporated Class A † | | | | 620 | 354,125 |
| Illumina Incorporated † | | | | 4,013 | 1,541,233 |
| IQVIA Holdings Incorporated † | | | | 5,514 | 1,064,974 |
| Mettler-Toledo International Incorporated † | | | | 672 | 776,624 |
| PerkinElmer Incorporated | | | | 3,229 | 414,248 |
| Thermo Fisher Scientific Incorporated | | | | 11,316 | 5,164,396 |
| Waters Corporation † | | | | 1,791 | 508,948 |
| | | | | | 10,940,964 |
| Pharmaceuticals: 2.19% | | | | | |
| Bristol-Myers Squibb Company | | | | 64,503 | 4,072,074 |
| Catalent Incorporated † | | | | 4,920 | 518,125 |
The accompanying notes are an integral part of these financial statements.
16 | Wells Fargo Index Asset Allocation Fund
Portfolio of investments—March 31, 2021 (unaudited)
| | | | | Shares | Value |
| Pharmaceuticals (continued) | | | | | |
| Eli Lilly & Company | | | | 22,908 | $ 4,279,673 |
| Johnson & Johnson | | | | 75,807 | 12,458,880 |
| Merck & Company Incorporated | | | | 72,766 | 5,609,531 |
| Perrigo Company plc | | | | 3,838 | 155,324 |
| Pfizer Incorporated | | | | 160,601 | 5,818,574 |
| Viatris Incorporated † | | | | 34,949 | 488,238 |
| Zoetis Incorporated | | | | 13,690 | 2,155,901 |
| | | | | | 35,556,320 |
| Industrials: 5.31% | | | | | |
| Aerospace & defense: 1.00% | | | | | |
| General Dynamics Corporation | | | | 6,667 | 1,210,461 |
| Howmet Aerospace Incorporated | | | | 11,271 | 362,137 |
| Huntington Ingalls Industries Incorporated | | | | 1,160 | 238,786 |
| L3Harris Technologies Incorporated | | | | 5,925 | 1,200,879 |
| Lockheed Martin Corporation | | | | 7,104 | 2,624,928 |
| Northrop Grumman Corporation | | | | 4,466 | 1,445,376 |
| Raytheon Technologies Corporation | | | | 43,743 | 3,380,022 |
| Teledyne Technologies Incorporated † | | | | 1,068 | 441,778 |
| Textron Incorporated | | | | 6,574 | 368,670 |
| The Boeing Company † | | | | 15,849 | 4,037,057 |
| TransDigm Group Incorporated † | | | | 1,577 | 927,150 |
| | | | | | 16,237,244 |
| Air freight & logistics: 0.40% | | | | | |
| C.H. Robinson Worldwide Incorporated | | | | 3,858 | 368,169 |
| Expeditors International of Washington Incorporated | | | | 4,868 | 524,235 |
| FedEx Corporation | | | | 7,047 | 2,001,630 |
| United Parcel Service Incorporated Class B | | | | 20,733 | 3,524,403 |
| | | | | | 6,418,437 |
| Airlines: 0.19% | | | | | |
| Alaska Air Group Incorporated † | | | | 3,594 | 248,741 |
| American Airlines Group Incorporated †« | | | | 18,710 | 447,169 |
| Delta Air Lines Incorporated † | | | | 18,540 | 895,111 |
| Southwest Airlines Company † | | | | 17,045 | 1,040,768 |
| United Airlines Holdings Incorporated † | | | | 9,248 | 532,130 |
| | | | | | 3,163,919 |
| Building products: 0.30% | | | | | |
| A.O. Smith Corporation | | | | 3,901 | 263,747 |
| Allegion plc | | | | 2,616 | 328,622 |
| Carrier Global Corporation | | | | 23,532 | 993,521 |
| Fortune Brands Home & Security Incorporated | | | | 4,028 | 385,963 |
| Johnson Controls International plc | | | | 20,804 | 1,241,375 |
| Masco Corporation | | | | 7,417 | 444,278 |
| Trane Technologies plc | | | | 6,877 | 1,138,556 |
| | | | | | 4,796,062 |
| Commercial services & supplies: 0.23% | | | | | |
| Cintas Corporation | | | | 2,545 | 868,634 |
| Copart Incorporated † | | | | 6,012 | 652,963 |
| Republic Services Incorporated | | | | 6,062 | 602,260 |
The accompanying notes are an integral part of these financial statements.
Wells Fargo Index Asset Allocation Fund | 17
Portfolio of investments—March 31, 2021 (unaudited)
| | | | | Shares | Value |
| Commercial services & supplies (continued) | | | | | |
| Rollins Incorporated | | | | 6,379 | $ 219,565 |
| Waste Management Incorporated | | | | 11,223 | 1,447,991 |
| | | | | | 3,791,413 |
| Construction & engineering: 0.02% | | | | | |
| Quanta Services Incorporated | | | | 4,008 | 352,624 |
| Electrical equipment: 0.34% | | | | | |
| AMETEK Incorporated | | | | 6,627 | 846,467 |
| Eaton Corporation plc | | | | 11,485 | 1,588,146 |
| Emerson Electric Company | | | | 17,299 | 1,560,716 |
| Generac Holdings Incorporated † | | | | 1,831 | 599,561 |
| Rockwell Automation Incorporated | | | | 3,340 | 886,570 |
| | | | | | 5,481,460 |
| Industrial conglomerates: 0.75% | | | | | |
| 3M Company | | | | 16,681 | 3,214,095 |
| General Electric Company | | | | 254,322 | 3,339,248 |
| Honeywell International Incorporated | | | | 20,051 | 4,352,471 |
| Roper Technologies Incorporated | | | | 3,019 | 1,217,683 |
| | | | | | 12,123,497 |
| Machinery: 1.09% | | | | | |
| Caterpillar Incorporated | | | | 15,732 | 3,647,779 |
| Cummins Incorporated | | | | 4,265 | 1,105,104 |
| Deere & Company | | | | 9,072 | 3,394,198 |
| Dover Corporation | | | | 4,142 | 567,992 |
| Fortive Corporation | | | | 9,754 | 689,023 |
| IDEX Corporation | | | | 2,192 | 458,829 |
| Illinois Tool Works Incorporated | | | | 8,305 | 1,839,724 |
| Ingersoll Rand Incorporated † | | | | 10,741 | 528,565 |
| Otis Worldwide Corporation | | | | 11,750 | 804,288 |
| PACCAR Incorporated | | | | 10,009 | 930,036 |
| Parker-Hannifin Corporation | | | | 3,714 | 1,171,507 |
| Pentair plc | | | | 4,781 | 297,952 |
| Snap-on Incorporated | | | | 1,568 | 361,800 |
| Stanley Black & Decker Incorporated | | | | 4,638 | 926,069 |
| Wabtec Corporation | | | | 5,122 | 405,458 |
| Xylem Incorporated | | | | 5,218 | 548,829 |
| | | | | | 17,677,153 |
| Professional services: 0.24% | | | | | |
| Equifax Incorporated | | | | 3,524 | 638,302 |
| IHS Markit Limited | | | | 10,709 | 1,036,417 |
| Jacobs Engineering Group Incorporated | | | | 3,755 | 485,409 |
| Leidos Holdings Incorporated | | | | 3,849 | 370,582 |
| Nielsen Holdings plc | | | | 10,371 | 260,831 |
| Robert Half International Incorporated | | | | 3,264 | 254,820 |
| Verisk Analytics Incorporated | | | | 4,681 | 827,086 |
| | | | | | 3,873,447 |
| Road & rail: 0.62% | | | | | |
| CSX Corporation | | | | 21,950 | 2,116,419 |
| J.B. Hunt Transport Services Incorporated | | | | 2,409 | 404,881 |
| Kansas City Southern | | | | 2,634 | 695,165 |
The accompanying notes are an integral part of these financial statements.
18 | Wells Fargo Index Asset Allocation Fund
Portfolio of investments—March 31, 2021 (unaudited)
| | | | | Shares | Value |
| Road & rail (continued) | | | | | |
| Norfolk Southern Corporation | | | | 7,255 | $ 1,948,113 |
| Old Dominion Freight Line Incorporated | | | | 2,774 | 666,897 |
| Union Pacific Corporation | | | | 19,287 | 4,251,048 |
| | | | | | 10,082,523 |
| Trading companies & distributors: 0.13% | | | | | |
| Fastenal Company | | | | 16,600 | 834,648 |
| United Rentals Incorporated † | | | | 2,090 | 688,258 |
| W.W. Grainger Incorporated | | | | 1,266 | 507,577 |
| | | | | | 2,030,483 |
| Information technology: 15.96% | | | | | |
| Communications equipment: 0.51% | | | | | |
| Arista Networks Incorporated † | | | | 1,578 | 476,382 |
| Cisco Systems Incorporated | | | | 121,934 | 6,305,207 |
| F5 Networks Incorporated † | | | | 1,780 | 371,344 |
| Juniper Networks Incorporated | | | | 9,481 | 240,154 |
| Motorola Solutions Incorporated | | | | 4,870 | 915,804 |
| | | | | | 8,308,891 |
| Electronic equipment, instruments & components: 0.40% | | | | | |
| Amphenol Corporation Class A | | | | 17,275 | 1,139,632 |
| CDW Corporation of Delaware | | | | 4,087 | 677,420 |
| Corning Incorporated | | | | 22,261 | 968,576 |
| FLIR Systems Incorporated | | | | 3,791 | 214,078 |
| IPG Photonics Corporation † | | | | 1,039 | 219,167 |
| Keysight Technologies Incorporated † | | | | 5,367 | 769,628 |
| TE Connectivity Limited | | | | 9,522 | 1,229,385 |
| Trimble Incorporated † | | | | 7,209 | 560,788 |
| Zebra Technologies Corporation Class A † | | | | 1,553 | 753,485 |
| | | | | | 6,532,159 |
| IT services: 3.10% | | | | | |
| Accenture plc Class A | | | | 18,293 | 5,053,441 |
| Akamai Technologies Incorporated † | | | | 4,698 | 478,726 |
| Automatic Data Processing Incorporated | | | | 12,295 | 2,317,239 |
| Broadridge Financial Solutions Incorporated | | | | 3,327 | 509,364 |
| Cognizant Technology Solutions Corporation Class A | | | | 15,365 | 1,200,314 |
| DXC Technology Company | | | | 7,462 | 233,262 |
| Fidelity National Information Services Incorporated | | | | 17,844 | 2,509,045 |
| Fiserv Incorporated † | | | | 16,654 | 1,982,492 |
| FleetCor Technologies Incorporated † | | | | 2,404 | 645,787 |
| Gartner Incorporated † | | | | 2,556 | 466,598 |
| Global Payments Incorporated | | | | 8,499 | 1,713,228 |
| International Business Machines Corporation | | | | 25,751 | 3,431,578 |
| Jack Henry & Associates Incorporated | | | | 2,182 | 331,053 |
| MasterCard Incorporated Class A | | | | 25,192 | 8,969,612 |
| Paychex Incorporated | | | | 9,257 | 907,371 |
| PayPal Holdings Incorporated † | | | | 33,861 | 8,222,805 |
| The Western Union Company | | | | 11,863 | 292,542 |
| VeriSign Incorporated † | | | | 2,852 | 566,864 |
| Visa Incorporated Class A | | | | 48,784 | 10,329,036 |
| | | | | | 50,160,357 |
The accompanying notes are an integral part of these financial statements.
Wells Fargo Index Asset Allocation Fund | 19
Portfolio of investments—March 31, 2021 (unaudited)
| | | �� | | Shares | Value |
| Semiconductors & semiconductor equipment: 3.34% | | | | | |
| Advanced Micro Devices Incorporated † | | | | 35,107 | $ 2,755,900 |
| Analog Devices Incorporated | | | | 10,642 | 1,650,361 |
| Applied Materials Incorporated | | | | 26,508 | 3,541,469 |
| Broadcom Incorporated | | | | 11,772 | 5,458,206 |
| Enphase Energy Incorporated † | | | | 3,816 | 618,803 |
| Intel Corporation | | | | 117,428 | 7,515,392 |
| KLA Corporation | | | | 4,462 | 1,474,245 |
| Lam Research Corporation | | | | 4,136 | 2,461,913 |
| Maxim Integrated Products Incorporated | | | | 7,727 | 706,016 |
| Microchip Technology Incorporated | | | | 7,765 | 1,205,283 |
| Micron Technology Incorporated † | | | | 32,318 | 2,850,771 |
| Monolithic Power Systems Incorporated | | | | 1,246 | 440,100 |
| NVIDIA Corporation | | | | 17,903 | 9,558,949 |
| NXP Semiconductors NV | | | | 8,028 | 1,616,358 |
| Qorvo Incorporated † | | | | 3,267 | 596,881 |
| QUALCOMM Incorporated | | | | 32,788 | 4,347,361 |
| Skyworks Solutions Incorporated | | | | 4,772 | 875,567 |
| Teradyne Incorporated | | | | 4,823 | 586,863 |
| Texas Instruments Incorporated | | | | 26,516 | 5,011,259 |
| Xilinx Incorporated | | | | 7,103 | 880,062 |
| | | | | | 54,151,759 |
| Software: 4.97% | | | | | |
| Adobe Incorporated † | | | | 13,827 | 6,572,941 |
| ANSYS Incorporated † | | | | 2,495 | 847,202 |
| Autodesk Incorporated † | | | | 6,332 | 1,754,914 |
| Cadence Design Systems Incorporated † | | | | 8,048 | 1,102,496 |
| Citrix Systems Incorporated | | | | 3,569 | 500,945 |
| Fortinet Incorporated † | | | | 3,896 | 718,500 |
| Intuit Incorporated | | | | 7,898 | 3,025,408 |
| Microsoft Corporation | | | | 217,341 | 51,242,488 |
| NortonLifeLock Incorporated | | | | 16,726 | 355,595 |
| Oracle Corporation | | | | 53,513 | 3,755,007 |
| Paycom Software Incorporated † | | | | 1,415 | 523,635 |
| Salesforce.com Incorporated † | | | | 26,514 | 5,617,521 |
| ServiceNow Incorporated † | | | | 5,681 | 2,841,125 |
| Synopsys Incorporated † | | | | 4,411 | 1,092,958 |
| Tyler Technologies Incorporated † | | | | 1,171 | 497,125 |
| | | | | | 80,447,860 |
| Technology hardware, storage & peripherals: 3.64% | | | | | |
| Apple Incorporated | | | | 455,799 | 55,675,818 |
| Hewlett Packard Enterprise Company | | | | 37,571 | 591,368 |
| HP Incorporated | | | | 36,344 | 1,153,922 |
| NetApp Incorporated | | | | 6,451 | 468,794 |
| Seagate Technology plc | | | | 5,802 | 445,304 |
| Western Digital Corporation | | | | 8,840 | 590,070 |
| | | | | | 58,925,276 |
| Materials: 1.61% | | | | | |
| Chemicals: 1.11% | | | | | |
| Air Products & Chemicals Incorporated | | | | 6,367 | 1,791,292 |
| Albemarle Corporation | | | | 3,361 | 491,076 |
| Celanese Corporation Series A | | | | 3,278 | 491,077 |
| CF Industries Holdings Incorporated | | | | 6,160 | 279,541 |
The accompanying notes are an integral part of these financial statements.
20 | Wells Fargo Index Asset Allocation Fund
Portfolio of investments—March 31, 2021 (unaudited)
| | | | | Shares | Value |
| Chemicals (continued) | | | | | |
| Corteva Incorporated | | | | 21,388 | $ 997,109 |
| Dow Incorporated | | | | 21,559 | 1,378,482 |
| DuPont de Nemours Incorporated | | | | 15,526 | 1,199,849 |
| Eastman Chemical Company | | | | 3,917 | 431,340 |
| Ecolab Incorporated | | | | 7,134 | 1,527,175 |
| FMC Corporation | | | | 3,728 | 412,354 |
| International Flavors & Fragrances Incorporated | | | | 7,149 | 998,072 |
| Linde plc | | | | 15,057 | 4,218,068 |
| LyondellBasell Industries NV Class A | | | | 7,429 | 772,987 |
| PPG Industries Incorporated | | | | 6,790 | 1,020,265 |
| The Mosaic Company | | | | 10,011 | 316,448 |
| The Sherwin-Williams Company | | | | 2,323 | 1,714,397 |
| | | | | | 18,039,532 |
| Construction materials: 0.08% | | | | | |
| Martin Marietta Materials Incorporated | | | | 1,798 | 603,804 |
| Vulcan Materials Company | | | | 3,813 | 643,444 |
| | | | | | 1,247,248 |
| Containers & packaging: 0.21% | | | | | |
| Amcor plc | | | | 45,087 | 526,616 |
| Avery Dennison Corporation | | | | 2,399 | 440,576 |
| Ball Corporation | | | | 9,471 | 802,573 |
| International Paper Company | | | | 11,372 | 614,884 |
| Packaging Corporation of America | | | | 2,733 | 367,534 |
| Sealed Air Corporation | | | | 4,469 | 204,770 |
| WestRock Company | | | | 7,625 | 396,881 |
| | | | | | 3,353,834 |
| Metals & mining: 0.21% | | | | | |
| Freeport-McMoRan Incorporated † | | | | 42,497 | 1,399,426 |
| Newmont Corporation | | | | 22,943 | 1,382,775 |
| Nucor Corporation | | | | 8,619 | 691,847 |
| | | | | | 3,474,048 |
| Real estate: 1.47% | | | | | |
| Equity REITs: 1.42% | | | | | |
| Alexandria Real Estate Equities Incorporated | | | | 3,662 | 601,667 |
| American Tower Corporation | | | | 12,782 | 3,055,665 |
| AvalonBay Communities Incorporated | | | | 4,029 | 743,391 |
| Boston Properties Incorporated | | | | 4,098 | 414,963 |
| Crown Castle International Corporation | | | | 12,407 | 2,135,617 |
| Digital Realty Trust Incorporated | | | | 8,086 | 1,138,832 |
| Duke Realty Corporation | | | | 10,767 | 451,460 |
| Equinix Incorporated | | | | 2,569 | 1,745,867 |
| Equity Residential | | | | 9,901 | 709,209 |
| Essex Property Trust Incorporated | | | | 1,876 | 509,972 |
| Extra Space Storage Incorporated | | | | 3,807 | 504,618 |
| Federal Realty Investment Trust | | | | 2,015 | 204,422 |
| Healthpeak Properties Incorporated | | | | 15,538 | 493,176 |
| Host Hotels & Resorts Incorporated | | | | 20,310 | 342,224 |
| Iron Mountain Incorporated | | | | 8,327 | 308,182 |
| Kimco Realty Corporation | | | | 12,503 | 234,431 |
| Mid-America Apartment Communities Incorporated | | | | 3,303 | 476,821 |
The accompanying notes are an integral part of these financial statements.
Wells Fargo Index Asset Allocation Fund | 21
Portfolio of investments—March 31, 2021 (unaudited)
| | | | | Shares | Value |
| Equity REITs (continued) | | | | | |
| Prologis Incorporated | | | | 21,360 | $ 2,264,160 |
| Public Storage Incorporated | | | | 4,384 | 1,081,796 |
| Realty Income Corporation | | | | 10,776 | 684,276 |
| Regency Centers Corporation | | | | 4,563 | 258,768 |
| SBA Communications Corporation | | | | 3,152 | 874,838 |
| Simon Property Group Incorporated | | | | 9,480 | 1,078,540 |
| UDR Incorporated | | | | 8,549 | 374,959 |
| Ventas Incorporated | | | | 10,773 | 574,632 |
| Vornado Realty Trust | | | | 4,530 | 205,617 |
| Welltower Incorporated | | | | 12,001 | 859,632 |
| Weyerhaeuser Company | | | | 21,568 | 767,821 |
| | | | | | 23,095,556 |
| Real estate management & development: 0.05% | | | | | |
| CBRE Group Incorporated Class A † | | | | 9,758 | 771,955 |
| Utilities: 1.60% | | | | | |
| Electric utilities: 1.01% | | | | | |
| Alliant Energy Corporation | | | | 7,212 | 390,602 |
| American Electric Power Company Incorporated | | | | 14,353 | 1,215,699 |
| Duke Energy Corporation | | | | 22,169 | 2,139,974 |
| Edison International | | | | 10,951 | 641,729 |
| Entergy Corporation | | | | 5,800 | 576,926 |
| Evergy Incorporated | | | | 6,545 | 389,624 |
| Eversource Energy | | | | 9,906 | 857,761 |
| Exelon Corporation | | | | 28,219 | 1,234,299 |
| FirstEnergy Corporation | | | | 15,586 | 540,678 |
| NextEra Energy Incorporated | | | | 56,553 | 4,275,972 |
| NRG Energy Incorporated | | | | 7,029 | 265,204 |
| Pinnacle West Capital Corporation | | | | 3,261 | 265,282 |
| PPL Corporation | | | | 22,204 | 640,363 |
| The Southern Company | | | | 30,491 | 1,895,321 |
| Xcel Energy Incorporated | | | | 15,514 | 1,031,836 |
| | | | | | 16,361,270 |
| Gas utilities: 0.02% | | | | | |
| Atmos Energy Corporation | | | | 3,710 | 366,734 |
| Independent power & renewable electricity producers: 0.03% | | | | | |
| AES Corporation | | | | 19,436 | 521,079 |
| Multi-utilities: 0.49% | | | | | |
| Ameren Corporation | | | | 7,312 | 594,904 |
| CenterPoint Energy Incorporated | | | | 16,027 | 363,012 |
| CMS Energy Corporation | | | | 8,328 | 509,840 |
| Consolidated Edison Incorporated | | | | 9,868 | 738,126 |
| Dominion Energy Incorporated | | | | 23,223 | 1,764,019 |
| DTE Energy Company | | | | 5,603 | 745,983 |
| NiSource Incorporated | | | | 11,328 | 273,118 |
| Public Service Enterprise Group Incorporated | | | | 14,609 | 879,608 |
| Sempra Energy | | | | 8,737 | 1,158,351 |
| WEC Energy Group Incorporated | | | | 9,091 | 850,827 |
| | | | | | 7,877,788 |
The accompanying notes are an integral part of these financial statements.
22 | Wells Fargo Index Asset Allocation Fund
Portfolio of investments—March 31, 2021 (unaudited)
| | | | | Shares | Value |
| Water utilities: 0.05% | | | | | |
| American Water Works Company Incorporated | | | | 5,231 | $ 784,232 |
| Total Common stocks (Cost $305,427,784) | | | | | 969,904,733 |
| | | Interest
rate | | Principal | |
| Non-agency mortgage-backed securities: 0.00% | | | | | |
| Citigroup Mortgage Loan Trust Incorporated Series 2004-HYB4 Class AA (1 Month LIBOR +0.33%) ± | | 0.45% | 12-25-2034 | $ 4,431 | 4,612 |
| Total Non-agency mortgage-backed securities (Cost $4,431) | | | | | 4,612 |
| U.S. Treasury securities: 35.05% | | | | | |
| U.S. Treasury Bond | | 1.13 | 5-15-2040 | 2,251,000 | 1,836,675 |
| U.S. Treasury Bond | | 1.13 | 8-15-2040 | 2,981,000 | 2,423,926 |
| U.S. Treasury Bond | | 1.25 | 5-15-2050 | 3,785,000 | 2,856,344 |
| U.S. Treasury Bond | | 1.38 | 11-15-2040 | 1,746,000 | 1,485,191 |
| U.S. Treasury Bond | | 1.38 | 8-15-2050 | 3,103,000 | 2,421,310 |
| U.S. Treasury Bond | | 1.63 | 11-15-2050 | 1,737,000 | 1,447,410 |
| U.S. Treasury Bond | | 2.00 | 2-15-2050 | 3,135,000 | 2,866,933 |
| U.S. Treasury Bond | | 2.25 | 8-15-2046 | 1,961,000 | 1,903,013 |
| U.S. Treasury Bond | | 2.25 | 8-15-2049 | 3,118,000 | 3,015,082 |
| U.S. Treasury Bond | | 2.38 | 11-15-2049 | 2,096,000 | 2,082,327 |
| U.S. Treasury Bond | | 2.50 | 2-15-2045 | 2,144,000 | 2,188,723 |
| U.S. Treasury Bond | | 2.50 | 2-15-2046 | 1,960,000 | 1,997,669 |
| U.S. Treasury Bond | | 2.50 | 5-15-2046 | 1,949,000 | 1,986,153 |
| U.S. Treasury Bond | | 2.75 | 8-15-2042 | 1,218,000 | 1,306,495 |
| U.S. Treasury Bond | | 2.75 | 11-15-2042 | 1,369,000 | 1,467,076 |
| U.S. Treasury Bond | | 2.75 | 8-15-2047 | 1,864,000 | 1,992,296 |
| U.S. Treasury Bond | | 2.75 | 11-15-2047 | 1,853,000 | 1,981,190 |
| U.S. Treasury Bond | | 2.88 | 5-15-2043 | 1,822,000 | 1,993,168 |
| U.S. Treasury Bond | | 2.88 | 8-15-2045 | 2,027,000 | 2,213,231 |
| U.S. Treasury Bond | | 2.88 | 11-15-2046 | 1,779,000 | 1,943,696 |
| U.S. Treasury Bond | | 2.88 | 5-15-2049 | 2,582,000 | 2,835,359 |
| U.S. Treasury Bond | | 3.00 | 5-15-2042 | 776,000 | 866,604 |
| U.S. Treasury Bond | | 3.00 | 11-15-2044 | 1,951,000 | 2,175,060 |
| U.S. Treasury Bond | | 3.00 | 5-15-2045 | 1,907,000 | 2,125,709 |
| U.S. Treasury Bond | | 3.00 | 11-15-2045 | 1,791,000 | 1,999,204 |
| U.S. Treasury Bond | | 3.00 | 2-15-2047 | 1,889,000 | 2,114,204 |
| U.S. Treasury Bond | | 3.00 | 5-15-2047 | 1,921,000 | 2,150,169 |
| U.S. Treasury Bond | | 3.00 | 2-15-2048 | 2,119,000 | 2,375,349 |
| U.S. Treasury Bond | | 3.00 | 8-15-2048 | 2,099,000 | 2,355,472 |
| U.S. Treasury Bond | | 3.00 | 2-15-2049 | 2,614,000 | 2,936,666 |
| U.S. Treasury Bond | | 3.13 | 11-15-2041 | 846,000 | 963,482 |
| U.S. Treasury Bond | | 3.13 | 2-15-2042 | 919,000 | 1,047,445 |
| U.S. Treasury Bond | | 3.13 | 2-15-2043 | 1,334,000 | 1,517,790 |
| U.S. Treasury Bond | | 3.13 | 8-15-2044 | 1,999,000 | 2,274,800 |
| U.S. Treasury Bond | | 3.13 | 5-15-2048 | 2,283,000 | 2,618,137 |
| U.S. Treasury Bond | | 3.38 | 5-15-2044 | 1,848,000 | 2,187,714 |
| U.S. Treasury Bond | | 3.38 | 11-15-2048 | 2,541,000 | 3,051,681 |
| U.S. Treasury Bond | | 3.50 | 2-15-2039 | 731,000 | 876,543 |
| U.S. Treasury Bond | | 3.63 | 8-15-2043 | 1,504,000 | 1,845,984 |
| U.S. Treasury Bond | | 3.63 | 2-15-2044 | 1,897,000 | 2,332,124 |
| U.S. Treasury Bond | | 3.75 | 8-15-2041 | 929,000 | 1,155,335 |
| U.S. Treasury Bond | | 3.75 | 11-15-2043 | 1,660,000 | 2,076,297 |
| U.S. Treasury Bond | | 3.88 | 8-15-2040 | 946,000 | 1,192,773 |
The accompanying notes are an integral part of these financial statements.
Wells Fargo Index Asset Allocation Fund | 23
Portfolio of investments—March 31, 2021 (unaudited)
| | | Interest
rate | Maturitydate | Principal | Value |
| U.S. Treasury securities (continued) | | | | | |
| U.S. Treasury Bond | | 4.25% | 5-15-2039 | $ 681,000 | $ 894,690 |
| U.S. Treasury Bond | | 4.25 | 11-15-2040 | 977,000 | 1,292,617 |
| U.S. Treasury Bond | | 4.38 | 2-15-2038 | 381,000 | 503,932 |
| U.S. Treasury Bond | | 4.38 | 11-15-2039 | 757,000 | 1,011,778 |
| U.S. Treasury Bond | | 4.38 | 5-15-2040 | 1,078,000 | 1,445,152 |
| U.S. Treasury Bond | | 4.38 | 5-15-2041 | 842,000 | 1,134,135 |
| U.S. Treasury Bond | | 4.50 | 2-15-2036 | 837,000 | 1,107,259 |
| U.S. Treasury Bond | | 4.50 | 5-15-2038 | 428,000 | 574,406 |
| U.S. Treasury Bond | | 4.50 | 8-15-2039 | 721,000 | 976,392 |
| U.S. Treasury Bond | | 4.63 | 2-15-2040 | 730,000 | 1,006,744 |
| U.S. Treasury Bond | | 4.75 | 2-15-2037 | 264,000 | 361,061 |
| U.S. Treasury Bond | | 4.75 | 2-15-2041 | 1,084,000 | 1,526,153 |
| U.S. Treasury Bond | | 5.00 | 5-15-2037 | 375,000 | 526,538 |
| U.S. Treasury Bond | | 5.25 | 11-15-2028 | 479,000 | 609,864 |
| U.S. Treasury Bond | | 5.25 | 2-15-2029 | 349,000 | 446,488 |
| U.S. Treasury Bond | | 5.38 | 2-15-2031 | 752,000 | 1,006,006 |
| U.S. Treasury Bond | | 5.50 | 8-15-2028 | 369,000 | 474,079 |
| U.S. Treasury Bond | | 6.13 | 11-15-2027 | 525,000 | 686,458 |
| U.S. Treasury Bond | | 6.13 | 8-15-2029 | 293,000 | 399,178 |
| U.S. Treasury Bond | | 6.25 | 5-15-2030 | 478,000 | 667,071 |
| U.S. Treasury Bond | | 6.38 | 8-15-2027 | 224,000 | 294,814 |
| U.S. Treasury Bond | | 6.88 | 8-15-2025 | 224,000 | 283,089 |
| U.S. Treasury Note | | 0.13 | 4-30-2022 | 2,499,000 | 2,499,976 |
| U.S. Treasury Note | | 0.13 | 5-31-2022 | 2,659,000 | 2,659,727 |
| U.S. Treasury Note | | 0.13 | 5-15-2023 | 2,501,000 | 2,497,678 |
| U.S. Treasury Note | | 0.13 | 7-15-2023 | 2,396,000 | 2,391,320 |
| U.S. Treasury Note | | 0.13 | 8-15-2023 | 2,616,000 | 2,609,971 |
| U.S. Treasury Note | | 0.13 | 9-15-2023 | 2,914,000 | 2,906,032 |
| U.S. Treasury Note | | 0.13 | 10-15-2023 | 2,974,000 | 2,964,242 |
| U.S. Treasury Note | | 0.25 | 4-15-2023 | 2,385,000 | 2,388,447 |
| U.S. Treasury Note | | 0.25 | 11-15-2023 | 3,497,000 | 3,495,224 |
| U.S. Treasury Note | | 0.25 | 5-31-2025 | 2,714,000 | 2,662,264 |
| U.S. Treasury Note | | 0.25 | 6-30-2025 | 2,925,000 | 2,865,814 |
| U.S. Treasury Note | | 0.25 | 7-31-2025 | 3,039,000 | 2,972,759 |
| U.S. Treasury Note | | 0.25 | 8-31-2025 | 3,153,000 | 3,079,594 |
| U.S. Treasury Note | | 0.25 | 9-30-2025 | 3,464,000 | 3,378,618 |
| U.S. Treasury Note | | 0.25 | 10-31-2025 | 3,586,000 | 3,491,727 |
| U.S. Treasury Note | | 0.38 | 4-30-2025 | 2,591,000 | 2,558,511 |
| U.S. Treasury Note | | 0.38 | 11-30-2025 | 3,685,000 | 3,604,535 |
| U.S. Treasury Note | | 0.38 | 7-31-2027 | 2,771,000 | 2,617,621 |
| U.S. Treasury Note | | 0.38 | 9-30-2027 | 3,141,000 | 2,955,853 |
| U.S. Treasury Note | | 0.50 | 3-15-2023 | 2,052,000 | 2,065,306 |
| U.S. Treasury Note | | 0.50 | 3-31-2025 | 2,469,000 | 2,453,279 |
| U.S. Treasury Note | | 0.50 | 4-30-2027 | 2,015,000 | 1,929,835 |
| U.S. Treasury Note | | 0.50 | 5-31-2027 | 2,282,000 | 2,181,182 |
| U.S. Treasury Note | | 0.50 | 6-30-2027 | 2,520,000 | 2,404,927 |
| U.S. Treasury Note | | 0.50 | 8-31-2027 | 2,918,000 | 2,773,696 |
| U.S. Treasury Note | | 0.50 | 10-31-2027 | 3,418,000 | 3,237,353 |
| U.S. Treasury Note | | 0.63 | 3-31-2027 | 1,681,000 | 1,625,251 |
| U.S. Treasury Note | | 0.63 | 11-30-2027 | 3,631,000 | 3,462,499 |
| U.S. Treasury Note | | 0.63 | 5-15-2030 | 3,675,000 | 3,344,250 |
| U.S. Treasury Note | | 0.63 | 8-15-2030 | 4,582,000 | 4,152,438 |
| U.S. Treasury Note | | 0.88 | 11-15-2030 | 2,681,000 | 2,479,506 |
| U.S. Treasury Note | | 1.13 | 8-31-2021 | 1,807,000 | 1,815,188 |
| U.S. Treasury Note | | 1.13 | 9-30-2021 | 2,188,000 | 2,199,624 |
The accompanying notes are an integral part of these financial statements.
24 | Wells Fargo Index Asset Allocation Fund
Portfolio of investments—March 31, 2021 (unaudited)
| | | Interest
rate | Maturitydate | Principal | Value |
| U.S. Treasury securities (continued) | | | | | |
| U.S. Treasury Note | | 1.13% | 2-28-2025 | $ 2,444,000 | $ 2,490,016 |
| U.S. Treasury Note | | 1.13 | 2-28-2027 | 964,000 | 961,326 |
| U.S. Treasury Note | | 1.25 | 10-31-2021 | 2,188,000 | 2,203,213 |
| U.S. Treasury Note | | 1.25 | 7-31-2023 | 1,829,000 | 1,873,010 |
| U.S. Treasury Note | | 1.25 | 8-31-2024 | 1,400,000 | 1,436,367 |
| U.S. Treasury Note | | 1.38 | 1-31-2022 | 2,315,000 | 2,340,049 |
| U.S. Treasury Note | | 1.38 | 10-15-2022 | 2,223,000 | 2,265,115 |
| U.S. Treasury Note | | 1.38 | 2-15-2023 | 1,589,000 | 1,625,187 |
| U.S. Treasury Note | | 1.38 | 6-30-2023 | 1,733,000 | 1,778,491 |
| U.S. Treasury Note | | 1.38 | 8-31-2023 | 1,817,000 | 1,867,464 |
| U.S. Treasury Note | | 1.38 | 9-30-2023 | 1,778,000 | 1,828,354 |
| U.S. Treasury Note | | 1.38 | 1-31-2025 | 2,372,000 | 2,440,566 |
| U.S. Treasury Note | | 1.38 | 8-31-2026 | 1,787,000 | 1,817,923 |
| U.S. Treasury Note | | 1.50 | 10-31-2021 | 2,358,000 | 2,377,804 |
| U.S. Treasury Note | | 1.50 | 11-30-2021 | 2,360,000 | 2,382,494 |
| U.S. Treasury Note | | 1.50 | 1-31-2022 | 1,625,000 | 1,644,297 |
| U.S. Treasury Note | | 1.50 | 8-15-2022 | 2,254,000 | 2,296,703 |
| U.S. Treasury Note | | 1.50 | 9-15-2022 | 2,264,000 | 2,309,015 |
| U.S. Treasury Note | | 1.50 | 1-15-2023 | 2,250,000 | 2,304,053 |
| U.S. Treasury Note | | 1.50 | 2-28-2023 | 1,635,000 | 1,676,641 |
| U.S. Treasury Note | | 1.50 | 3-31-2023 | 1,679,000 | 1,723,598 |
| U.S. Treasury Note | | 1.50 | 9-30-2024 | 2,442,000 | 2,526,135 |
| U.S. Treasury Note | | 1.50 | 10-31-2024 | 2,391,000 | 2,472,817 |
| U.S. Treasury Note | | 1.50 | 11-30-2024 | 2,394,000 | 2,475,359 |
| U.S. Treasury Note | | 1.50 | 8-15-2026 | 3,430,000 | 3,512,534 |
| U.S. Treasury Note | | 1.50 | 1-31-2027 | 1,873,000 | 1,910,021 |
| U.S. Treasury Note | | 1.50 | 2-15-2030 | 4,305,000 | 4,252,028 |
| U.S. Treasury Note | | 1.63 | 12-31-2021 | 2,357,000 | 2,384,437 |
| U.S. Treasury Note | | 1.63 | 8-15-2022 | 1,250,000 | 1,275,732 |
| U.S. Treasury Note | | 1.63 | 8-31-2022 | 1,827,000 | 1,865,681 |
| U.S. Treasury Note | | 1.63 | 11-15-2022 | 3,435,000 | 3,517,252 |
| U.S. Treasury Note | | 1.63 | 12-15-2022 | 2,239,000 | 2,295,500 |
| U.S. Treasury Note | | 1.63 | 4-30-2023 | 1,711,000 | 1,762,063 |
| U.S. Treasury Note | | 1.63 | 5-31-2023 | 1,714,000 | 1,766,692 |
| U.S. Treasury Note | | 1.63 | 10-31-2023 | 1,824,000 | 1,888,196 |
| U.S. Treasury Note | | 1.63 | 2-15-2026 | 3,342,000 | 3,456,098 |
| U.S. Treasury Note | | 1.63 | 5-15-2026 | 3,385,000 | 3,495,938 |
| U.S. Treasury Note | | 1.63 | 9-30-2026 | 1,851,000 | 1,906,675 |
| U.S. Treasury Note | | 1.63 | 10-31-2026 | 1,800,000 | 1,852,242 |
| U.S. Treasury Note | | 1.63 | 11-30-2026 | 1,912,000 | 1,966,373 |
| U.S. Treasury Note | | 1.63 | 8-15-2029 | 2,854,000 | 2,864,145 |
| U.S. Treasury Note | | 1.75 | 11-30-2021 | 2,003,000 | 2,025,377 |
| U.S. Treasury Note | | 1.75 | 2-28-2022 | 1,637,000 | 1,661,811 |
| U.S. Treasury Note | | 1.75 | 3-31-2022 | 1,640,000 | 1,667,291 |
| U.S. Treasury Note | | 1.75 | 4-30-2022 | 1,612,000 | 1,640,840 |
| U.S. Treasury Note | | 1.75 | 5-15-2022 | 1,448,000 | 1,474,698 |
| U.S. Treasury Note | | 1.75 | 5-31-2022 | 1,819,000 | 1,853,746 |
| U.S. Treasury Note | | 1.75 | 6-15-2022 | 2,235,000 | 2,279,176 |
| U.S. Treasury Note | | 1.75 | 6-30-2022 | 1,819,000 | 1,856,091 |
| U.S. Treasury Note | | 1.75 | 7-15-2022 | 2,129,000 | 2,173,992 |
| U.S. Treasury Note | | 1.75 | 9-30-2022 | 1,771,000 | 1,813,753 |
| U.S. Treasury Note | | 1.75 | 1-31-2023 | 1,684,000 | 1,732,941 |
| U.S. Treasury Note | | 1.75 | 5-15-2023 | 3,117,000 | 3,219,520 |
| U.S. Treasury Note | | 1.75 | 6-30-2024 | 2,424,000 | 2,527,399 |
| U.S. Treasury Note | | 1.75 | 7-31-2024 | 2,406,000 | 2,509,665 |
The accompanying notes are an integral part of these financial statements.
Wells Fargo Index Asset Allocation Fund | 25
Portfolio of investments—March 31, 2021 (unaudited)
| | | Interest
rate | Maturitydate | Principal | Value |
| U.S. Treasury securities (continued) | | | | | |
| U.S. Treasury Note | | 1.75% | 12-31-2024 | $ 2,381,000 | $ 2,483,867 |
| U.S. Treasury Note | | 1.75 | 12-31-2026 | 1,893,000 | 1,959,107 |
| U.S. Treasury Note | | 1.75 | 11-15-2029 | 3,007,000 | 3,042,591 |
| U.S. Treasury Note | | 1.88 | 11-30-2021 | 1,649,000 | 1,668,968 |
| U.S. Treasury Note | | 1.88 | 1-31-2022 | 1,826,000 | 1,853,533 |
| U.S. Treasury Note | | 1.88 | 2-28-2022 | 1,725,000 | 1,753,233 |
| U.S. Treasury Note | | 1.88 | 3-31-2022 | 1,810,000 | 1,842,382 |
| U.S. Treasury Note | | 1.88 | 4-30-2022 | 1,812,000 | 1,846,754 |
| U.S. Treasury Note | | 1.88 | 5-31-2022 | 1,795,000 | 1,832,022 |
| U.S. Treasury Note | | 1.88 | 7-31-2022 | 1,815,000 | 1,857,468 |
| U.S. Treasury Note | | 1.88 | 8-31-2022 | 1,754,000 | 1,797,302 |
| U.S. Treasury Note | | 1.88 | 9-30-2022 | 2,248,000 | 2,306,571 |
| U.S. Treasury Note | | 1.88 | 10-31-2022 | 1,650,000 | 1,695,182 |
| U.S. Treasury Note | | 1.88 | 8-31-2024 | 1,345,000 | 1,408,782 |
| U.S. Treasury Note | | 1.88 | 6-30-2026 | 1,825,000 | 1,907,125 |
| U.S. Treasury Note | | 1.88 | 7-31-2026 | 1,828,000 | 1,909,403 |
| U.S. Treasury Note | | 2.00 | 8-31-2021 | 1,641,000 | 1,654,333 |
| U.S. Treasury Note | | 2.00 | 10-31-2021 | 1,649,000 | 1,667,680 |
| U.S. Treasury Note | | 2.00 | 11-15-2021 | 2,485,000 | 2,515,092 |
| U.S. Treasury Note | | 2.00 | 12-31-2021 | 1,821,000 | 1,847,177 |
| U.S. Treasury Note | | 2.00 | 2-15-2022 | 1,679,000 | 1,707,333 |
| U.S. Treasury Note | | 2.00 | 7-31-2022 | 1,778,000 | 1,822,658 |
| U.S. Treasury Note | | 2.00 | 10-31-2022 | 2,238,000 | 2,303,654 |
| U.S. Treasury Note | | 2.00 | 11-30-2022 | 3,346,000 | 3,449,125 |
| U.S. Treasury Note | | 2.00 | 2-15-2023 | 3,077,000 | 3,182,291 |
| U.S. Treasury Note | | 2.00 | 4-30-2024 | 1,930,000 | 2,025,671 |
| U.S. Treasury Note | | 2.00 | 5-31-2024 | 1,934,000 | 2,030,927 |
| U.S. Treasury Note | | 2.00 | 6-30-2024 | 1,939,000 | 2,037,238 |
| U.S. Treasury Note | | 2.00 | 2-15-2025 | 3,537,000 | 3,725,318 |
| U.S. Treasury Note | | 2.00 | 8-15-2025 | 3,491,000 | 3,678,505 |
| U.S. Treasury Note | | 2.00 | 11-15-2026 | 3,370,000 | 3,535,867 |
| U.S. Treasury Note | | 2.13 | 8-15-2021 | 2,440,000 | 2,459,063 |
| U.S. Treasury Note | | 2.13 | 9-30-2021 | 1,633,000 | 1,649,968 |
| U.S. Treasury Note | | 2.13 | 12-31-2021 | 1,626,000 | 1,651,089 |
| U.S. Treasury Note | | 2.13 | 5-15-2022 | 2,105,000 | 2,152,691 |
| U.S. Treasury Note | | 2.13 | 6-30-2022 | 1,615,000 | 1,655,501 |
| U.S. Treasury Note | | 2.13 | 12-31-2022 | 3,385,000 | 3,501,227 |
| U.S. Treasury Note | | 2.13 | 11-30-2023 | 1,638,000 | 1,718,748 |
| U.S. Treasury Note | | 2.13 | 2-29-2024 | 1,298,000 | 1,365,232 |
| U.S. Treasury Note | | 2.13 | 3-31-2024 | 1,961,000 | 2,064,259 |
| U.S. Treasury Note | | 2.13 | 7-31-2024 | 1,927,000 | 2,033,964 |
| U.S. Treasury Note | | 2.13 | 9-30-2024 | 1,844,000 | 1,947,869 |
| U.S. Treasury Note | | 2.13 | 11-30-2024 | 1,852,000 | 1,957,694 |
| U.S. Treasury Note | | 2.13 | 5-15-2025 | 3,005,000 | 3,180,839 |
| U.S. Treasury Note | | 2.13 | 5-31-2026 | 1,793,000 | 1,897,008 |
| U.S. Treasury Note | | 2.25 | 7-31-2021 | 1,573,000 | 1,584,675 |
| U.S. Treasury Note | | 2.25 | 4-15-2022 | 2,204,000 | 2,253,590 |
| U.S. Treasury Note | | 2.25 | 12-31-2023 | 1,247,000 | 1,313,539 |
| U.S. Treasury Note | | 2.25 | 1-31-2024 | 1,334,000 | 1,406,745 |
| U.S. Treasury Note | | 2.25 | 4-30-2024 | 2,418,000 | 2,556,374 |
| U.S. Treasury Note | | 2.25 | 10-31-2024 | 1,882,000 | 1,996,831 |
| U.S. Treasury Note | | 2.25 | 11-15-2024 | 3,535,000 | 3,751,381 |
| U.S. Treasury Note | | 2.25 | 12-31-2024 | 1,911,000 | 2,030,363 |
| U.S. Treasury Note | | 2.25 | 11-15-2025 | 3,473,000 | 3,698,338 |
| U.S. Treasury Note | | 2.25 | 3-31-2026 | 1,872,000 | 1,992,949 |
The accompanying notes are an integral part of these financial statements.
26 | Wells Fargo Index Asset Allocation Fund
Portfolio of investments—March 31, 2021 (unaudited)
| | | Interest
rate | Maturitydate | Principal | Value |
| U.S. Treasury securities (continued) | | | | | |
| U.S. Treasury Note | | 2.25% | 2-15-2027 | $ 3,350,000 | $ 3,558,066 |
| U.S. Treasury Note | | 2.25 | 8-15-2027 | 3,338,000 | 3,537,889 |
| U.S. Treasury Note | | 2.25 | 11-15-2027 | 3,248,000 | 3,438,186 |
| U.S. Treasury Note | | 2.38 | 3-15-2022 | 2,243,000 | 2,292,241 |
| U.S. Treasury Note | | 2.38 | 1-31-2023 | 2,325,000 | 2,419,272 |
| U.S. Treasury Note | | 2.38 | 2-29-2024 | 1,671,000 | 1,769,759 |
| U.S. Treasury Note | | 2.38 | 8-15-2024 | 3,101,000 | 3,300,263 |
| U.S. Treasury Note | | 2.38 | 4-30-2026 | 1,812,000 | 1,940,397 |
| U.S. Treasury Note | | 2.38 | 5-15-2027 | 3,375,000 | 3,607,163 |
| U.S. Treasury Note | | 2.38 | 5-15-2029 | 3,295,000 | 3,501,452 |
| U.S. Treasury Note | | 2.50 | 1-15-2022 | 2,241,000 | 2,284,069 |
| U.S. Treasury Note | | 2.50 | 2-15-2022 | 2,245,000 | 2,292,531 |
| U.S. Treasury Note | | 2.50 | 3-31-2023 | 2,278,000 | 2,384,158 |
| U.S. Treasury Note | | 2.50 | 8-15-2023 | 2,662,000 | 2,806,018 |
| U.S. Treasury Note | | 2.50 | 1-31-2024 | 1,876,000 | 1,991,345 |
| U.S. Treasury Note | | 2.50 | 5-15-2024 | 3,424,000 | 3,649,235 |
| U.S. Treasury Note | | 2.50 | 1-31-2025 | 1,936,000 | 2,076,284 |
| U.S. Treasury Note | | 2.50 | 2-28-2026 | 1,888,000 | 2,032,919 |
| U.S. Treasury Note | | 2.63 | 12-15-2021 | 2,277,000 | 2,318,182 |
| U.S. Treasury Note | | 2.63 | 2-28-2023 | 2,359,000 | 2,469,670 |
| U.S. Treasury Note | | 2.63 | 6-30-2023 | 2,304,000 | 2,429,460 |
| U.S. Treasury Note | | 2.63 | 12-31-2023 | 2,404,000 | 2,557,161 |
| U.S. Treasury Note | | 2.63 | 3-31-2025 | 1,884,000 | 2,031,114 |
| U.S. Treasury Note | | 2.63 | 12-31-2025 | 1,914,000 | 2,071,157 |
| U.S. Treasury Note | | 2.63 | 1-31-2026 | 1,869,000 | 2,023,339 |
| U.S. Treasury Note | | 2.63 | 2-15-2029 | 3,512,000 | 3,798,722 |
| U.S. Treasury Note | | 2.75 | 4-30-2023 | 2,279,000 | 2,400,072 |
| U.S. Treasury Note | | 2.75 | 5-31-2023 | 2,334,000 | 2,462,735 |
| U.S. Treasury Note | | 2.75 | 7-31-2023 | 2,347,000 | 2,485,253 |
| U.S. Treasury Note | | 2.75 | 8-31-2023 | 2,402,000 | 2,547,621 |
| U.S. Treasury Note | | 2.75 | 11-15-2023 | 3,078,000 | 3,277,830 |
| U.S. Treasury Note | | 2.75 | 2-15-2024 | 2,325,000 | 2,486,479 |
| U.S. Treasury Note | | 2.75 | 2-28-2025 | 1,955,000 | 2,115,982 |
| U.S. Treasury Note | | 2.75 | 6-30-2025 | 1,959,000 | 2,125,438 |
| U.S. Treasury Note | | 2.75 | 8-31-2025 | 2,020,000 | 2,194,067 |
| U.S. Treasury Note | | 2.75 | 2-15-2028 | 3,068,000 | 3,346,397 |
| U.S. Treasury Note | | 2.88 | 10-15-2021 | 2,081,000 | 2,112,703 |
| U.S. Treasury Note | | 2.88 | 11-15-2021 | 2,137,000 | 2,174,564 |
| U.S. Treasury Note | | 2.88 | 9-30-2023 | 2,444,000 | 2,604,101 |
| U.S. Treasury Note | | 2.88 | 10-31-2023 | 2,318,000 | 2,473,560 |
| U.S. Treasury Note | | 2.88 | 11-30-2023 | 2,370,000 | 2,533,308 |
| U.S. Treasury Note | | 2.88 | 4-30-2025 | 1,884,000 | 2,051,499 |
| U.S. Treasury Note | | 2.88 | 5-31-2025 | 1,939,000 | 2,112,525 |
| U.S. Treasury Note | | 2.88 | 7-31-2025 | 1,949,000 | 2,125,933 |
| U.S. Treasury Note | | 2.88 | 11-30-2025 | 1,880,000 | 2,055,663 |
| U.S. Treasury Note | | 2.88 | 5-15-2028 | 3,462,000 | 3,805,631 |
| U.S. Treasury Note | | 2.88 | 8-15-2028 | 3,133,000 | 3,446,055 |
| U.S. Treasury Note | | 3.00 | 9-30-2025 | 1,994,000 | 2,189,116 |
| U.S. Treasury Note | | 3.00 | 10-31-2025 | 1,814,000 | 1,992,353 |
| U.S. Treasury Note | | 3.13 | 11-15-2028 | 3,621,000 | 4,049,438 |
| U.S. Treasury Note | | 6.00 | 2-15-2026 | 445,000 | 553,729 |
| U.S. Treasury Note | | 6.25 | 8-15-2023 | 378,000 | 431,909 |
| U.S. Treasury Note | | 6.50 | 11-15-2026 | 296,000 | 383,725 |
| U.S. Treasury Note | | 6.63 | 2-15-2027 | 215,000 | 282,389 |
| U.S. Treasury Note | | 6.75 | 8-15-2026 | 221,000 | 287,274 |
The accompanying notes are an integral part of these financial statements.
Wells Fargo Index Asset Allocation Fund | 27
Portfolio of investments—March 31, 2021 (unaudited)
| | | Interest
rate | Maturitydate | Principal | Value |
| U.S. Treasury securities (continued) | | | | | |
| U.S. Treasury Note | | 7.13% | 2-15-2023 | $ 260,000 | $ 294,034 |
| U.S. Treasury Note | | 7.25 | 8-15-2022 | 261,000 | 286,611 |
| U.S. Treasury Note | | 7.50 | 11-15-2024 | 240,000 | 300,441 |
| U.S. Treasury Note | | 7.63 | 11-15-2022 | 140,000 | 157,057 |
| U.S. Treasury Note | | 7.63 | 2-15-2025 | 216,000 | 274,244 |
| U.S. Treasury Note | | 8.00 | 11-15-2021 | 511,000 | 536,191 |
| U.S. Treasury Note | | 8.13 | 8-15-2021 | 175,000 | 180,305 |
| Total U.S. Treasury securities (Cost $549,161,943) | | | | | 567,841,244 |
| | | Yield | | Shares | |
| Short-term investments: 3.24% | | | | | |
| Investment companies: 3.24% | | | | | |
| Securities Lending Cash Investments LLC ♠∩∞ | | 0.04 | | 440,550 | 440,550 |
| Wells Fargo Government Money Market Fund Select Class ♠∞ | | 0.03 | | 52,020,585 | 52,020,585 |
| Total Short-term investments (Cost $52,461,135) | | | | | 52,461,135 |
| Total investments in securities (Cost $907,082,763) | 98.16% | | | | 1,590,245,330 |
| Other assets and liabilities, net | 1.84 | | | | 29,821,888 |
| Total net assets | 100.00% | | | | $1,620,067,218 |
| † | Non-income-earning security |
| « | All or a portion of this security is on loan. |
| ± | Variable rate investment. The rate shown is the rate in effect at period end. |
| ♠ | The issuer of the security is an affiliated person of the Fund as defined in the Investment Company Act of 1940. |
| ∩ | The investment is a non-registered investment company purchased with cash collateral received from securities on loan. |
| ∞ | The rate represents the 7-day annualized yield at period end. |
| Abbreviations: |
| FNMA | Federal National Mortgage Association |
| LIBOR | London Interbank Offered Rate |
| REIT | Real estate investment trust |
The accompanying notes are an integral part of these financial statements.
28 | Wells Fargo Index Asset Allocation Fund
Portfolio of investments—March 31, 2021 (unaudited)
Investments in affiliates
An affiliated investment is an investment in which the Fund owns at least 5% of the outstanding voting shares of the issuer or as a result of other relationships, such as the Fund and the issuer having the same investment manager. Transactions with issuers that were either affiliated persons of the Fund at the beginning of the period or the end of the period were as follows:
| | Value,
beginning of
period | Purchases | Sales
proceeds | Net
realized
gains
(losses) | | Net
change in
unrealized
gains
(losses) | | Value,
end of
period | | % of
net
assets | Shares,
end
of period | Income
from
affiliated
securities |
| Common stocks | | | | | | | | | | | |
| Financials | | | | | | | | | |
| Banks | | | | | | | | | |
| Wells Fargo & Company | $ 3,071,582 | $ 45,062 | $ (419,996) | $ 17,396 | | $ 1,955,759 | | $ 4,669,803 | | 0.29% | 119,524 | $ 25,699 |
| Short-term investments | | | | | | | | | | | | |
Investment
companies | | | | | | | | | | | | |
| Securities Lending Cash Investments LLC | 727,900 | 8,362,700 | (8,650,050) | 0 | | 0 | | 440,550 | | | 440,550 | 341 # |
| Wells Fargo Government Money Market Fund Select Class | 46,480,772 | 130,999,407 | (125,459,594) | 0 | | 0 | | 52,020,585 | | | 52,020,585 | 4,336 |
| | | | | | | | | 52,461,135 | | 3.24 | | |
| | | | | $17,396 | | $1,955,759 | | $57,130,938 | | 3.53% | | $30,376 |
| # | Amount shown represents income before fees and rebates. |
Futures contracts
| Description | Number of
contracts | Expiration
date | Notional
cost | Notional
value | Unrealized
gains | | Unrealized
losses |
| Long | | | | | | | |
| E-Mini S&P 500 Index | 591 | 6-18-2021 | $117,063,034 | $117,236,670 | $ 173,636 | | $ 0 |
| 10-Year U.S. Treasury Notes | 87 | 6-21-2021 | 11,582,311 | 11,391,563 | 0 | | (190,748) |
| U.S. Long Term Bonds | 39 | 6-21-2021 | 6,177,230 | 6,029,156 | 0 | | (148,074) |
| U.S. Ultra Bond | 71 | 6-21-2021 | 13,322,180 | 12,866,531 | 0 | | (455,649) |
| 2-Year U.S. Treasury Notes | 71 | 6-30-2021 | 15,682,689 | 15,671,586 | 0 | | (11,103) |
| 5-Year U.S. Treasury Notes | 190 | 6-30-2021 | 23,600,973 | 23,445,703 | 0 | | (155,270) |
| Short | | | | | | | |
| 10-Year U.S. Treasury Notes | (194) | 6-21-2021 | (25,807,153) | (25,401,875) | 405,278 | | 0 |
| | | | | | $578,914 | | $(960,844) |
The accompanying notes are an integral part of these financial statements.
Wells Fargo Index Asset Allocation Fund | 29
Statement of assets and liabilities—March 31, 2021 (unaudited)
| | |
| Assets | |
Investments in unaffiliated securities (including $429,336 of securities loaned), at value (cost $851,335,838)
| $ 1,533,114,392 |
Investments in affiliated securites, at value (cost $55,746,925)
| 57,130,938 |
Cash at broker segregated for futures contracts
| 7,718,235 |
Receivable for investments sold
| 19,586,743 |
Receivable for dividends and interest
| 3,215,257 |
Receivable for Fund shares sold
| 1,376,977 |
Receivable for daily variation margin on open futures contracts
| 486,374 |
Receivable for securities lending income, net
| 25 |
Prepaid expenses and other assets
| 535,218 |
Total assets
| 1,623,164,159 |
| Liabilities | |
Payable for Fund shares redeemed
| 1,069,453 |
Management fee payable
| 772,498 |
Payable upon receipt of securities loaned
| 440,550 |
Shareholder servicing fees payable
| 306,863 |
Administration fees payable
| 253,170 |
Payable for investments purchased
| 157,068 |
Distribution fee payable
| 94,511 |
Trustees’ fees and expenses payable
| 2,828 |
Total liabilities
| 3,096,941 |
Total net assets
| $1,620,067,218 |
| Net assets consist of | |
Paid-in capital
| $ 919,412,383 |
Total distributable earnings
| 700,654,835 |
Total net assets
| $1,620,067,218 |
| Computation of net asset value and offering price per share | |
Net assets – Class A
| $ 979,420,077 |
Shares outstanding – Class A1
| 23,752,441 |
Net asset value per share – Class A
| $41.23 |
Maximum offering price per share – Class A2
| $43.75 |
Net assets – Class C
| $ 149,815,463 |
Shares outstanding – Class C1
| 5,983,163 |
Net asset value per share – Class C
| $25.04 |
Net assets – Administrator Class
| $ 333,180,769 |
Shares outstanding – Administrator Class1
| 8,076,421 |
Net asset value per share – Administrator Class
| $41.25 |
Net assets – Institutional Class
| $ 157,650,909 |
Shares outstanding – Institutional Class1
| 3,825,109 |
Net asset value per share – Institutional Class
| $41.21 |
| 1 | The Fund has an unlimited number of authorized shares |
| 2 | Maximum offering price is computed as 100/94.25 of net asset value. On investments of $50,000 or more, the offering price is reduced. |
The accompanying notes are an integral part of these financial statements.
30 | Wells Fargo Index Asset Allocation Fund
Statement of operations—six months ended March 31, 2021 (unaudited)
| | |
| Investment income | |
Dividends
| $ 7,865,383 |
Interest
| 5,095,431 |
Income from affiliated securities
| 34,021 |
Total investment income
| 12,994,835 |
| Expenses | |
Management fee
| 4,655,681 |
| Administration fees | |
Class A
| 997,000 |
Class C
| 154,603 |
Administrator Class
| 198,784 |
Institutional Class
| 100,359 |
| Shareholder servicing fees | |
Class A
| 1,186,904 |
Class C
| 184,051 |
Administrator Class
| 382,270 |
| Distribution fee | |
Class C
| 552,154 |
Custody and accounting fees
| 40,391 |
Professional fees
| 24,735 |
Registration fees
| 43,839 |
Shareholder report expenses
| 54,938 |
Trustees’ fees and expenses
| 9,611 |
Other fees and expenses
| 87,538 |
Total expenses
| 8,672,858 |
| Less: Fee waivers and/or expense reimbursements | |
Fund-level
| (139,770) |
Class A
| (34,657) |
Class C
| (9) |
Administrator Class
| (85,617) |
Net expenses
| 8,412,805 |
Net investment income
| 4,582,030 |
| Realized and unrealized gains (losses) on investments | |
| Net realized gains on | |
Unaffiliated securities
| 41,707,779 |
Affiliated securities
| 17,396 |
Futures contracts
| 9,401,317 |
Net realized gains on investments
| 51,126,492 |
| Net change in unrealized gains (losses) on | |
Unaffiliated securities
| 82,287,081 |
Affiliated securities
| 1,955,759 |
Futures contracts
| 637,065 |
Net change in unrealized gains (losses) on investments
| 84,879,905 |
Net realized and unrealized gains (losses) on investments
| 136,006,397 |
Net increase in net assets resulting from operations
| $140,588,427 |
The accompanying notes are an integral part of these financial statements.
Wells Fargo Index Asset Allocation Fund | 31
Statement of changes in net assets
| | |
| | Six months ended
March 31, 2021
(unaudited) | Year ended
September 30, 2020 |
| Operations | | | | |
Net investment income
| | $ 4,582,030 | | $ 11,189,860 |
Net realized gains on investments
| | 51,126,492 | | 40,044,032 |
Net change in unrealized gains (losses) on investments
| | 84,879,905 | | 115,732,110 |
Net increase in net assets resulting from operations
| | 140,588,427 | | 166,966,002 |
| Distributions to shareholders from | | | | |
| Net investment income and net realized gains | | | | |
Class A
| | (30,498,112) | | (17,758,837) |
Class C
| | (4,333,665) | | (2,008,094) |
Administrator Class
| | (9,785,404) | | (5,552,976) |
Institutional Class
| | (5,192,391) | | (3,074,796) |
Total distributions to shareholders
| | (49,809,572) | | (28,394,703) |
| Capital share transactions | Shares | | Shares | |
| Proceeds from shares sold | | | | |
Class A
| 876,039 | 35,345,353 | 1,620,062 | 59,463,146 |
Class C
| 597,424 | 14,653,825 | 1,140,277 | 25,072,330 |
Administrator Class
| 1,537,022 | 62,084,863 | 2,246,311 | 82,510,100 |
Institutional Class
| 683,823 | 27,569,799 | 941,118 | 34,233,056 |
| | | 139,653,840 | | 201,278,632 |
| Reinvestment of distributions | | | | |
Class A
| 737,326 | 29,412,718 | 487,086 | 17,291,503 |
Class C
| 169,584 | 4,105,876 | 82,795 | 1,783,971 |
Administrator Class
| 244,129 | 9,743,414 | 155,359 | 5,523,135 |
Institutional Class
| 97,312 | 3,879,807 | 59,824 | 2,126,023 |
| | | 47,141,815 | | 26,724,632 |
| Payment for shares redeemed | | | | |
Class A
| (1,189,283) | (47,930,581) | (2,527,189) | (90,588,709) |
Class C
| (910,357) | (22,301,438) | (1,850,849) | (40,492,095) |
Administrator Class
| (955,678) | (38,518,983) | (1,679,186) | (60,419,227) |
Institutional Class
| (557,769) | (22,602,728) | (918,575) | (32,675,213) |
| | | (131,353,730) | | (224,175,244) |
Net increase in net assets resulting from capital share transactions
| | 55,441,925 | | 3,828,020 |
Total increase in net assets
| | 146,220,780 | | 142,399,319 |
| Net assets | | | | |
Beginning of period
| | 1,473,846,438 | | 1,331,447,119 |
End of period
| | $1,620,067,218 | | $1,473,846,438 |
The accompanying notes are an integral part of these financial statements.
32 | Wells Fargo Index Asset Allocation Fund
Financial highlights
(For a share outstanding throughout each period)
| | | Year ended September 30 |
| Class A | Six months ended
March 31, 2021
(unaudited) | 2020 | 2019 | 2018 | 2017 | 2016 |
Net asset value, beginning of period
| $38.89 | $35.13 | $34.63 | $31.99 | $29.61 | $28.72 |
Net investment income
| 0.12 | 0.30 | 0.33 | 0.27 | 0.25 | 0.22 |
Net realized and unrealized gains on investments
| 3.53 | 4.22 | 1.46 | 2.83 | 2.67 | 2.45 |
Total from investment operations
| 3.65 | 4.52 | 1.79 | 3.10 | 2.92 | 2.67 |
| Distributions to shareholders from | | | | | | |
Net investment income
| (0.12) | (0.30) | (0.33) | (0.27) | (0.27) | (0.21) |
Net realized gains
| (1.19) | (0.46) | (0.96) | (0.19) | (0.27) | (1.57) |
Total distributions to shareholders
| (1.31) | (0.76) | (1.29) | (0.46) | (0.54) | (1.78) |
Net asset value, end of period
| $41.23 | $38.89 | $35.13 | $34.63 | $31.99 | $29.61 |
Total return1
| 9.51% | 13.08% | 5.54% | 9.76% | 9.99% | 9.68% |
| Ratios to average net assets (annualized) | | | | | | |
Gross expenses
| 1.09% | 1.10% | 1.11% | 1.08% | 1.09% | 1.10% |
Net expenses
| 1.08% | 1.08% | 1.08% | 1.07% | 1.09% | 1.10% |
Net investment income
| 0.59% | 0.83% | 0.99% | 0.80% | 0.79% | 0.79% |
| Supplemental data | | | | | | |
Portfolio turnover rate
| 5% | 19% | 14% | 9% | 9% | 8% |
Net assets, end of period (000s omitted)
| $979,420 | $907,134 | $834,289 | $830,487 | $822,769 | $828,421 |
| 1 | Total return calculations do not include any sales charges. Returns for periods of less than one year are not annualized. |
The accompanying notes are an integral part of these financial statements.
Wells Fargo Index Asset Allocation Fund | 33
Financial highlights
(For a share outstanding throughout each period)
| | | Year ended September 30 |
| Class C | Six months ended
March 31, 2021
(unaudited) | 2020 | 2019 | 2018 | 2017 | 2016 |
Net asset value, beginning of period
| $23.64 | $21.36 | $21.07 | $19.45 | $17.99 | $17.47 |
Net investment income (loss)
| (0.02) | 0.01 | 0.05 | 0.01 | 0.01 | 0.01 1 |
Net realized and unrealized gains on investments
| 2.15 | 2.57 | 0.88 | 1.73 | 1.62 | 1.48 |
Total from investment operations
| 2.13 | 2.58 | 0.93 | 1.74 | 1.63 | 1.49 |
| Distributions to shareholders from | | | | | | |
Net investment income
| (0.01) | (0.02) | (0.06) | (0.00) 2 | (0.01) | (0.02) |
Net realized gains
| (0.72) | (0.28) | (0.58) | (0.12) | (0.16) | (0.95) |
Total distributions to shareholders
| (0.73) | (0.30) | (0.64) | (0.12) | (0.17) | (0.97) |
Net asset value, end of period
| $25.04 | $23.64 | $21.36 | $21.07 | $19.45 | $17.99 |
Total return3
| 9.12% | 12.22% | 4.75% | 8.97% | 9.14% | 8.86% |
| Ratios to average net assets (annualized) | | | | | | |
Gross expenses
| 1.84% | 1.85% | 1.86% | 1.83% | 1.84% | 1.85% |
Net expenses
| 1.83% | 1.83% | 1.83% | 1.82% | 1.84% | 1.85% |
Net investment income (loss)
| (0.16)% | 0.08% | 0.24% | 0.05% | 0.04% | 0.03% |
| Supplemental data | | | | | | |
Portfolio turnover rate
| 5% | 19% | 14% | 9% | 9% | 8% |
Net assets, end of period (000s omitted)
| $149,815 | $144,828 | $144,264 | $153,322 | $152,820 | $136,881 |
| 1 | Calculated based upon average shares outstanding |
| 2 | Amount is less than $0.005. |
| 3 | Total return calculations do not include any sales charges. Returns for periods of less than one year are not annualized. |
The accompanying notes are an integral part of these financial statements.
34 | Wells Fargo Index Asset Allocation Fund
Financial highlights
(For a share outstanding throughout each period)
| | | Year ended September 30 |
| Administrator Class | Six months ended
March 31, 2021
(unaudited) | 2020 | 2019 | 2018 | 2017 | 2016 |
Net asset value, beginning of period
| $38.89 | $35.14 | $34.64 | $31.99 | $29.63 | $28.75 |
Net investment income
| 0.15 | 0.37 | 0.39 | 0.32 | 0.30 | 0.28 |
Net realized and unrealized gains on investments
| 3.54 | 4.20 | 1.46 | 2.84 | 2.68 | 2.45 |
Total from investment operations
| 3.69 | 4.57 | 1.85 | 3.16 | 2.98 | 2.73 |
| Distributions to shareholders from | | | | | | |
Net investment income
| (0.14) | (0.36) | (0.39) | (0.32) | (0.35) | (0.28) |
Net realized gains
| (1.19) | (0.46) | (0.96) | (0.19) | (0.27) | (1.57) |
Total distributions to shareholders
| (1.33) | (0.82) | (1.35) | (0.51) | (0.62) | (1.85) |
Net asset value, end of period
| $41.25 | $38.89 | $35.14 | $34.64 | $31.99 | $29.63 |
Total return1
| 9.62% | 13.26% | 5.73% | 9.94% | 10.20% | 9.91% |
| Ratios to average net assets (annualized) | | | | | | |
Gross expenses
| 1.01% | 1.02% | 1.03% | 1.00% | 0.99% | 1.02% |
Net expenses
| 0.90% | 0.90% | 0.90% | 0.90% | 0.90% | 0.90% |
Net investment income
| 0.77% | 1.01% | 1.17% | 0.97% | 0.96% | 0.98% |
| Supplemental data | | | | | | |
Portfolio turnover rate
| 5% | 19% | 14% | 9% | 9% | 8% |
Net assets, end of period (000s omitted)
| $333,181 | $281,988 | $229,390 | $216,611 | $268,512 | $206,908 |
| 1 | Returns for periods of less than one year are not annualized. |
The accompanying notes are an integral part of these financial statements.
Wells Fargo Index Asset Allocation Fund | 35
Financial highlights
(For a share outstanding throughout each period)
| | | Year ended September 30 |
| Institutional Class | Six months ended
March 31, 2021
(unaudited) | 2020 | 2019 | 2018 | 2017 1 |
Net asset value, beginning of period
| $38.84 | $35.09 | $34.59 | $31.96 | $29.27 |
Net investment income
| 0.18 | 0.42 | 0.44 | 0.39 | 0.35 |
Net realized and unrealized gains on investments
| 3.54 | 4.21 | 1.46 | 2.81 | 3.03 |
Total from investment operations
| 3.72 | 4.63 | 1.90 | 3.20 | 3.38 |
| Distributions to shareholders from | | | | | |
Net investment income
| (0.16) | (0.42) | (0.44) | (0.38) | (0.42) |
Net realized gains
| (1.19) | (0.46) | (0.96) | (0.19) | (0.27) |
Total distributions to shareholders
| (1.35) | (0.88) | (1.40) | (0.57) | (0.69) |
Net asset value, end of period
| $41.21 | $38.84 | $35.09 | $34.59 | $31.96 |
Total return2
| 9.70% | 13.44% | 5.89% | 10.11% | 11.70% |
| Ratios to average net assets (annualized) | | | | | |
Gross expenses
| 0.76% | 0.77% | 0.78% | 0.75% | 0.74% |
Net expenses
| 0.75% | 0.75% | 0.75% | 0.74% | 0.74% |
Net investment income
| 0.92% | 1.16% | 1.32% | 1.13% | 1.08% |
| Supplemental data | | | | | |
Portfolio turnover rate
| 5% | 19% | 14% | 9% | 9% |
Net assets, end of period (000s omitted)
| $157,651 | $139,896 | $123,504 | $110,566 | $61,060 |
| 1 | For the period from October 31, 2016 (commencement of class operations) to September 30, 2017 |
| 2 | Returns for periods of less than one year are not annualized. |
The accompanying notes are an integral part of these financial statements.
36 | Wells Fargo Index Asset Allocation Fund
Notes to financial statements (unaudited)
1. ORGANIZATION
Wells Fargo Funds Trust (the "Trust"), a Delaware statutory trust organized on March 10, 1999, is an open-end management investment company registered under the Investment Company Act of 1940, as amended (the "1940 Act"). As an investment company, the Trust follows the accounting and reporting guidance in Financial Accounting Standards Board (“FASB”) Accounting Standards Codification Topic 946, Financial Services – Investment Companies. These financial statements report on the Wells Fargo Index Asset Allocation Fund (the "Fund") which is a diversified series of the Trust.
On February 23, 2021, Wells Fargo & Company announced that it has entered into a definitive agreement to sell Wells Fargo Asset Management ("WFAM") to GTCR LLC and Reverence Capital Partners, L.P. WFAM is the trade name used by the asset management businesses of Wells Fargo & Company and includes Wells Fargo Funds Management, LLC, the investment manager to the Fund, Wells Capital Management Incorporated and Wells Fargo Asset Management (International) Limited, both registered investment advisers providing sub-advisory services to certain funds, and Wells Fargo Funds Distributor, LLC, the Fund's principal underwriter. As part of the transaction, Wells Fargo & Company will own a 9.9% equity interest and will continue to serve as an important client and distribution partner. The transaction is expected to close in the second half of 2021, subject to customary closing conditions.
Consummation of the transaction will result in the automatic termination of the Fund's investment management agreement and sub-advisory agreement. The Fund's Board of Trustees will be asked to approve new investment management arrangements with the new company. If approved by the Board, the new investment management arrangements with the new company will be presented to the shareholders of the Fund for approval, and, if approved by shareholders, would take effect upon the closing of the transaction. The transaction is expected to close in the second half of 2021, subject to customary closing conditions.
2. SIGNIFICANT ACCOUNTING POLICIES
The following significant accounting policies, which are consistently followed in the preparation of the financial statements of the Fund, are in conformity with U.S. generally accepted accounting principles which require management to make estimates and assumptions that affect the reported amounts of assets and liabilities, disclosure of contingent assets and liabilities at the date of the financial statements, and the reported amounts of income and expenses during the reporting period. Actual results could differ from those estimates.
Securities valuation
All investments are valued each business day as of the close of regular trading on the New York Stock Exchange (generally 4 p.m. Eastern Time), although the Fund may deviate from this calculation time under unusual or unexpected circumstances.
Equity securities and futures contracts that are listed on a foreign or domestic exchange or market are valued at the official closing price or, if none, the last sales price. If no sale occurs on the principal exchange or market that day, a fair value price will be determined in accordance with the Fund’s Valuation Procedures.
Debt securities are valued at the evaluated bid price provided by an independent pricing service (e.g. taking into account various factors, including yields, maturities, or credit ratings) or, if a reliable price is not available, the quoted bid price from an independent broker-dealer.
Investments in registered open-end investment companies are valued at net asset value. Interests in non-registered investment companies that are redeemable at net asset value are fair valued normally at net asset value.
Investments which are not valued using any of the methods discussed above are valued at their fair value, as determined in good faith by the Board of Trustees. The Board of Trustees has established a Valuation Committee comprised of the Trustees and has delegated to it the authority to take any actions regarding the valuation of portfolio securities that the Valuation Committee deems necessary or appropriate, including determining the fair value of portfolio securities, unless the determination has been delegated to the Wells Fargo Asset Management Pricing Committee at Wells Fargo Funds Management, LLC ("Funds Management"). The Board of Trustees retains the authority to make or ratify any valuation decisions or approve any changes to the Valuation Procedures as it deems appropriate. On a quarterly basis, the Board of Trustees receives reports on any valuation actions taken by the Valuation Committee or the Wells Fargo Asset Management Pricing Committee which may include items for ratification.
Securities lending
The Fund may lend its securities from time to time in order to earn additional income in the form of fees or interest on securities received as collateral or the investment of any cash received as collateral. When securities are on loan, the Fund receives interest or dividends on those securities. Cash collateral received in connection with its securities lending transactions
Wells Fargo Index Asset Allocation Fund | 37
Notes to financial statements (unaudited)
is invested in Securities Lending Cash Investments, LLC (the "Securities Lending Fund"). Investments in Securities Lending Fund are valued at the evaluated bid price provided by an independent pricing service. Income earned from investment in the Securities Lending Fund (net of fees and rebates), if any, is included in income from affiliated securities on the Statement of Operations.
In a securities lending transaction, the net asset value of the Fund is affected by an increase or decrease in the value of the securities loaned and by an increase or decrease in the value of the instrument in which collateral is invested. The amount of securities lending activity undertaken by the Fund fluctuates from time to time. The Fund has the right under the lending agreement to recover the securities from the borrower on demand. In the event of default or bankruptcy by the borrower, the Fund may be prevented from recovering the loaned securities or gaining access to the collateral or may experience delays or costs in doing so. In such an event, the terms of the agreement allow the unaffiliated securities lending agent to use the collateral to purchase replacement securities on behalf of the Fund or pay the Fund the market value of the loaned securities. The Fund bears the risk of loss with respect to depreciation of its investment of the cash collateral.
Futures contracts
Futures contracts are agreements between the Fund and a counterparty to buy or sell a specific amount of a commodity, financial instrument or currency at a specified price on a specified date. The Fund may buy and sell futures contracts in order to gain exposure to, or protect against, changes in interest rates and security values and is subject to interest rate risk and equity price risk. The primary risks associated with the use of futures contracts are the imperfect correlation between changes in market values of securities held by the Fund and the prices of futures contracts, and the possibility of an illiquid market. Futures contracts are generally entered into on a regulated futures exchange and cleared through a clearinghouse associated with the exchange. With futures contracts, there is minimal counterparty risk to the Fund since futures contracts are exchange traded and the exchange’s clearinghouse, as the counterparty to all exchange traded futures, guarantees the futures contracts against default.
Upon entering into a futures contract, the Fund is required to deposit either cash or securities (initial margin) with the broker in an amount equal to a certain percentage of the contract value. Subsequent payments (variation margin) are paid to or from the broker each day equal to the daily changes in the contract value. Such payments are recorded as unrealized gains or losses and, if any, shown as variation margin receivable (payable) in the Statement of Assets and Liabilities. Should the Fund fail to make requested variation margin payments, the broker can gain access to the initial margin to satisfy the Fund’s payment obligations. When the contracts are closed, a realized gain or loss is recorded in the Statement of Operations.
Security transactions and income recognition
Securities transactions are recorded on a trade date basis. Realized gains or losses are recorded on the basis of identified cost.
Dividend income is recognized on the ex-dividend date.
Interest income is accrued daily and bond discounts are accreted and premiums are amortized daily. To the extent debt obligations are placed on non-accrual status, any related interest income may be reduced by writing off interest receivables when the collection of all or a portion of interest has been determined to be doubtful based on consistently applied procedures and the fair value has decreased. If the issuer subsequently resumes interest payments or when the collectability of interest is reasonably assured, the debt obligation is removed from non-accrual status.
Distributions to shareholders
Distributions to shareholders are recorded on the ex-dividend date and paid from net investment income quarterly and any net realized gains are paid at least annually. Such distributions are determined in accordance with income tax regulations and may differ from U.S. generally accepted accounting principles. Dividend sources are estimated at the time of declaration. The tax character of distributions is determined as of the Fund's fiscal year end. Therefore, a portion of the Fund's distributions made prior to the Fund’s fiscal year end may be categorized as a tax return of capital at year end.
Federal and other taxes
The Fund intends to continue to qualify as a regulated investment company by distributing substantially all of its investment company taxable income and any net realized capital gains (after reduction for capital loss carryforwards) sufficient to relieve it from all, or substantially all, federal income taxes. Accordingly, no provision for federal income taxes was required.
The Fund’s income and federal excise tax returns and all financial records supporting those returns for the prior three fiscal years are subject to examination by the federal and Delaware revenue authorities. Management has analyzed the Fund's tax positions taken on federal, state, and foreign tax returns for all open tax years and does not believe that there are any uncertain tax positions that require recognition of a tax liability.
38 | Wells Fargo Index Asset Allocation Fund
Notes to financial statements (unaudited)
As of March 31, 2021, the aggregate cost of all investments for federal income tax purposes was $916,831,224 and the unrealized gains (losses) consisted of:
| Gross unrealized gains | $698,197,887 |
| Gross unrealized losses | (25,165,711) |
| Net unrealized gains | $673,032,176 |
Class allocations
The separate classes of shares offered by the Fund differ principally in applicable sales charges, distribution, shareholder servicing, and administration fees. Class specific expenses are charged directly to that share class. Investment income, common fund-level expenses, and realized and unrealized gains (losses) on investments are allocated daily to each class of shares based on the relative proportion of net assets of each class.
3. FAIR VALUATION MEASUREMENTS
Fair value measurements of investments are determined within a framework that has established a fair value hierarchy based upon the various data inputs utilized in determining the value of the Fund’s investments. The three-level hierarchy gives the highest priority to unadjusted quoted prices in active markets for identical assets or liabilities (Level 1) and the lowest priority to unobservable inputs (Level 3). The Fund’s investments are classified within the fair value hierarchy based on the lowest level of input that is significant to the fair value measurement. The inputs are summarized into three broad levels as follows:
| ■ | Level 1 – quoted prices in active markets for identical securities |
| ■ | Level 2 – other significant observable inputs (including quoted prices for similar securities, interest rates, prepayment speeds, credit risk, etc.) |
| ■ | Level 3 – significant unobservable inputs (including the Fund’s own assumptions in determining the fair value of investments) |
The inputs or methodologies used for valuing investments in securities are not necessarily an indication of the risk associated with investing in those securities.
Wells Fargo Index Asset Allocation Fund | 39
Notes to financial statements (unaudited)
The following is a summary of the inputs used in valuing the Fund’s assets and liabilities as of March 31, 2021:
| | Quoted prices
(Level 1) | Other significant
observable inputs
(Level 2) | Significant
unobservable inputs
(Level 3) | Total |
| Assets | | | | |
| Investments in: | | | | |
| Agency securities | $ 0 | $ 33,606 | $0 | $ 33,606 |
| Common stocks | | | | |
| Communication services | 105,922,555 | 0 | 0 | 105,922,555 |
| Consumer discretionary | 121,356,745 | 0 | 0 | 121,356,745 |
| Consumer staples | 59,451,788 | 0 | 0 | 59,451,788 |
| Energy | 27,142,455 | 0 | 0 | 27,142,455 |
| Financials | 109,751,692 | 0 | 0 | 109,751,692 |
| Health care | 125,831,658 | 0 | 0 | 125,831,658 |
| Industrials | 86,028,262 | 0 | 0 | 86,028,262 |
| Information technology | 258,526,302 | 0 | 0 | 258,526,302 |
| Materials | 26,114,662 | 0 | 0 | 26,114,662 |
| Real estate | 23,867,511 | 0 | 0 | 23,867,511 |
| Utilities | 25,911,103 | 0 | 0 | 25,911,103 |
| Non-agency mortgage-backed securities | 0 | 4,612 | 0 | 4,612 |
| U.S. Treasury securities | 567,841,244 | 0 | 0 | 567,841,244 |
| Short-term investments | | | | |
| Investment companies | 52,461,135 | 0 | 0 | 52,461,135 |
| | 1,590,207,112 | 38,218 | 0 | 1,590,245,330 |
| Futures contracts | 578,914 | 0 | 0 | 578,914 |
| Total assets | $1,590,786,026 | $38,218 | $0 | $1,590,824,244 |
| Liabilities | | | | |
| Futures contracts | $ 960,844 | $ 0 | $0 | $ 960,844 |
| Total liabilities | $ 960,844 | $ 0 | $0 | $ 960,844 |
Futures contracts are reported at their cumulative unrealized gains (losses) at measurement date as reported in the table following the Portfolio of Investments. For futures contracts, the current day’s variation margin is reported on the Statement of Assets and Liabilities. All other assets and liabilities are reported at their market value at measurement date.
Additional sector, industry or geographic detail, if any, is included in the Portfolio of Investments.
For the six months ended March 31, 2021, the Fund did not have any transfers into/out of Level 3.
4. TRANSACTIONS WITH AFFILIATES
Management fee
Funds Management, an indirect wholly owned subsidiary of Wells Fargo & Company ("Wells Fargo"), is the manager of the Fund and provides advisory and fund-level administrative services under an investment management agreement. Under the investment management agreement, Funds Management is responsible for, among other services, implementing the investment objectives and strategies of the Fund, supervising the subadviser and providing fund-level administrative services in connection with the Fund’s operations. As compensation for its services under the investment management agreement, Funds Management is entitled to receive a management fee at the following annual rate based on the Fund’s average daily net assets:
40 | Wells Fargo Index Asset Allocation Fund
Notes to financial statements (unaudited)
| Average daily net assets | Management fee |
| First $500 million | 0.650% |
| Next $500 million | 0.600 |
| Next $2 billion | 0.550 |
| Next $2 billion | 0.525 |
| Next $5 billion | 0.490 |
| Over $10 billion | 0.480 |
For the six months ended March 31, 2021, the management fee was equivalent to an annual rate of 0.60% of the Fund’s average daily net assets.
Funds Management has retained the services of a subadviser to provide daily portfolio management to the Fund. The fee for subadvisory services is borne by Funds Management. Wells Capital Management Incorporated ("WellsCap"), an affiliate of Funds Management and an indirect wholly owned subsidiary of Wells Fargo, is the subadviser to the Fund and is entitled to receive a fee from Funds Management at an annual rate starting at 0.15% and declining to 0.10% as the average daily net assets of the Fund increase.
Administration fees
Under a class-level administration agreement, Funds Management provides class-level administrative services to the Fund, which includes paying fees and expenses for services provided by the transfer agent, sub-transfer agents, omnibus account servicers and record-keepers. As compensation for its services under the class-level administration agreement, Funds Management receives an annual fee which is calculated based on the average daily net assets of each class as follows:
| | Class-level
administration fee |
| Class A | 0.21% |
| Class C | 0.21 |
| Administrator Class | 0.13 |
| Institutional Class | 0.13 |
Waivers and/or expense reimbursements
Funds Management has contractually waived and/or reimbursed management and administration fees to the extent necessary to maintain certain net operating expense ratios for the Fund. When each class of the Fund has exceeded its expense cap, Funds Management has waived fees and/or reimbursed expenses from fund-level expenses on a proportionate basis and then from class specific expenses. When only certain classes exceed their expense caps, waivers and/or reimbursements are applied against class specific expenses before fund-level expenses. Funds Management has committed through January 31, 2022 to waive fees and/or reimburse expenses to the extent necessary to cap expenses. Prior to or after the commitment expiration date, the cap may be increased or the commitment to maintain the cap may be terminated only with the approval of the Board of Trustees. The contractual expense caps are as follows:
| | Expense ratio caps |
| Class A | 1.08% |
| Class C | 1.83 |
| Administrator Class | 0.90 |
| Institutional Class | 0.75 |
Distribution fee
The Trust has adopted a distribution plan for Class C shares of the Fund pursuant to Rule 12b-1 under the 1940 Act. A distribution fee is charged charged to Class C shares and paid to Wells Fargo Funds Distributor, LLC ("Funds Distributor"), the principal underwriter, at an annual rate of 0.75% of the average daily net assets of Class C shares.
Wells Fargo Index Asset Allocation Fund | 41
Notes to financial statements (unaudited)
In addition, Funds Distributor is entitled to receive the front-end sales charge from the purchase of Class A shares and a contingent deferred sales charge on the redemption of certain Class A shares. Funds Distributor is also entitled to receive the contingent deferred sales charges from redemptions of Class C shares. For the six months ended March 31, 2021, Funds Distributor received $31,588 from the sale of Class A shares and $271 in contingent deferred sales charges from redemptions of Class C shares. Funds Distributor did not receive any contingent deferred sales charges from Class A for the six months ended March 31, 2021.
Shareholder servicing fees
The Trust has entered into contracts with one or more shareholder servicing agents, whereby Class A, Class C, and Administrator Class of the Fund are charged a fee at an annual rate of 0.25% of the average daily net assets of each respective class. A portion of these total shareholder servicing fees were paid to affiliates of Wells Fargo.
Interfund transactions
The Fund may purchase or sell portfolio investment securities to certain other Wells Fargo affiliates pursuant to Rule 17a-7 under the 1940 Act and under procedures adopted by the Board of Trustees. The procedures have been designed to ensure that these interfund transactions, which do not incur broker commissions, are effected at current market prices.
5. INVESTMENT PORTFOLIO TRANSACTIONS
Purchases and sales of investments, excluding short-term securities, for the six months ended March 31, 2021 were as follows:
| Purchases at cost | | Sales proceeds |
U.S.
government | Non-U.S.
government | | U.S.
government | Non-U.S.
government |
| $41,162,650 | $35,199,088 | | $0 | $108,264,927 |
6. SECURITIES LENDING TRANSACTIONS
The Fund lends its securities through an unaffiliated securities lending agent and receives collateral in the form of cash or securities with a value at least equal to the value of the securities on loan. The value of the loaned securities is determined at the close of each business day and any increases or decreases in the required collateral are exchanged between the Fund and the counterparty on the next business day. Cash collateral received is invested in the Securities Lending Fund which seeks to provide a positive return compared to the daily Federal Funds Open Rate by investing in high-quality, U.S. dollar-denominated short-term money market instruments and is exempt from registration under Section 3(c)(7) of the 1940 Act. Securities Lending Fund is managed by Funds Management and is subadvised by WellsCap. Funds Management receives an advisory fee starting at 0.05% and declining to 0.01% as the average daily net assets of the Securities Lending Fund increase. All of the fees received by Funds Management are paid to WellsCap for its services as subadviser.
In the event of counterparty default or the failure of a borrower to return a loaned security, the Fund has the right to use the collateral to offset any losses incurred. As of March 31, 2021, the Fund had securities lending transactions with the following counterparties which are subject to offset:
| Counterparty | Value of
securities on
loan | Collateral
received1 | Net amount |
| BNP Paribas Securities Corporation | $429,336 | $(429,336) | $0 |
1 Collateral received within this table is limited to the collateral for the net transaction with the counterparty.
7. DERIVATIVE TRANSACTIONS
During the six months ended March 31, 2021, the Fund entered into futures contracts to manage the duration of the portfolio and to gain market exposure to certain asset classes by implementing tactical asset allocation shifts. The Fund had an average notional amount of $185,787,218 in long futures contract and $38,449,486 in short futures contracts during the six months ended March 31, 2021.
A summary of the location of derivative instruments on the financial statements by primary risk exposure is outlined in the following tables.
42 | Wells Fargo Index Asset Allocation Fund
Notes to financial statements (unaudited)
The fair value of derivative instruments as of March 31, 2021 by risk type was as follows for the Fund:
| | Asset derivatives | | Liability derivatives |
| | Statement of
Assets and Liabilities location | Fair value | | Statement of
Assets and Liabilities location | Fair value |
| Interest rate risk | Unrealized gains on futures contracts | $ 405,278* | | Unrealized losses on futures contracts | $ 960,844* |
| Equity rate risk | Unrealized gains on futures contracts | 173,636* | | Unrealized losses on futures contracts | 0* |
| | | $578,914 | | | $960,844 |
* Amount represents the cumulative unrealized gains (losses) as reported in the tables following the Portfolio of Investments. For futures contracts, only the current day's variation margin as of March 31, 2021 is reported separately on the Statement of Assets and Liabilities.
The effect of derivative instruments on the Statement of Operations for the six months ended March 31, 2021 was as follows for the Fund:
| | Amount of realized
gains (losses) on
derivatives | Change in unrealized
gains (losses) on
derivatives |
| Equity risk | $ 9,818,401 | $ 173,636 |
| Interest rate risk | (417,084) | 463,429 |
| | $9,401,317 | $637,065 |
8. BANK BORROWINGS
The Trust (excluding the money market funds), Wells Fargo Master Trust and Wells Fargo Variable Trust are parties to a $350,000,000 revolving credit agreement whereby the Fund is permitted to use bank borrowings for temporary or emergency purposes, such as to fund shareholder redemption requests. Interest under the credit agreement is charged to the Fund based on a borrowing rate equal to the higher of the Federal Funds rate in effect on that day plus 1.25% or the overnight LIBOR rate in effect on that day plus 1.25%. In addition, an annual commitment fee equal to 0.25% of the unused balance is allocated to each participating fund.
For the six months ended March 31, 2021, there were no borrowings by the Fund under the agreement.
9. INDEMNIFICATION
Under the Fund's organizational documents, the officers and Trustees have been granted certain indemnification rights against certain liabilities that may arise out of performance of their duties to the Fund. The Fund has entered into a separate agreement with each Trustee that converts indemnification rights currently existing under the Fund’s organizational documents into contractual rights that cannot be changed in the future without the consent of the Trustee. Additionally, in the normal course of business, the Fund may enter into contracts with service providers that contain a variety of indemnification clauses. The Fund’s maximum exposure under these arrangements is dependent on future claims that may be made against the Fund and, therefore, cannot be estimated.
10. CORONAVIRUS (COVID-19) PANDEMIC
On March 11, 2020, the World Health Organization announced that it had made the assessment that coronavirus disease 2019 (“COVID-19”) is a pandemic. The impacts of COVID-19 are affecting the entire global economy, individual companies and investment products, the funds, and the market in general. There is significant uncertainty around the extent and duration of business disruptions related to COVID-19 and the impacts may last for an extended period of time. COVID-19 has led to significant uncertainty and volatility in the financial markets.
Wells Fargo Index Asset Allocation Fund | 43
Other information (unaudited)
PROXY VOTING INFORMATION
A description of the policies and procedures used to determine how to vote proxies relating to portfolio securities is available without charge, upon request, by calling 1-800-222-8222, visiting our website at wfam.com, or visiting the SEC website at sec.gov. Information regarding how the proxies related to portfolio securities were voted during the most recent 12-month period ended June 30 is available on the website at wfam.com or by visiting the SEC website at sec.gov.
QUARTERLY PORTFOLIO HOLDINGS INFORMATION
The Fund files its complete schedule of portfolio holdings with the SEC for the first and third quarters of each fiscal year as an exhibit to its reports on Form N-PORT. Shareholders may view the filed Form N-PORT by visiting the SEC website at sec.gov.
44 | Wells Fargo Index Asset Allocation Fund
Other information (unaudited)
BOARD OF TRUSTEES AND OFFICERS
Each of the Trustees and Officers listed in the table below acts in identical capacities for each fund in the Wells Fargo family of funds, which consists of 142 mutual funds comprising the Wells Fargo Funds Trust, Wells Fargo Variable Trust, Wells Fargo Master Trust and four closed-end funds (collectively the “Fund Complex”). This table should be read in conjunction with the Prospectus and the Statement of Additional Information1. The mailing address of each Trustee and Officer is 525 Market Street, 12th Floor, San Francisco, CA 94105. Each Trustee and Officer serves an indefinite term, however, each Trustee serves such term until reaching the mandatory retirement age established by the Trustees.
Independent Trustees
Name and
year of birth | Position held and
length of service* | Principal occupations during past five years or longer | Current other
public company or
investment
company
directorships |
William R. Ebsworth
(Born 1957) | Trustee,
since 2015 | Retired. From 1984 to 2013, equities analyst, portfolio manager, research director and chief investment officer at Fidelity Management and Research Company in Boston, Tokyo, and Hong Kong, and retired in 2013 as Chief Investment Officer of Fidelity Strategic Advisers, Inc. where he led a team of investment professionals managing client assets. Prior thereto, Board member of Hong Kong Securities Clearing Co., Hong Kong Options Clearing Corp., the Thailand International Fund, Ltd., Fidelity Investments Life Insurance Company, and Empire Fidelity Investments Life Insurance Company. Audit Committee Chair and Investment Committee Chair of the Vincent Memorial Hospital Endowment (non-profit organization). Mr. Ebsworth is a CFA® charterholder. | N/A |
Jane A. Freeman
(Born 1953) | Trustee,
since 2015;
Chair Liaison,
since 2018 | Retired. From 2012 to 2014 and 1999 to 2008, Chief Financial Officer of Scientific Learning Corporation. From 2008 to 2012, Ms. Freeman provided consulting services related to strategic business projects. Prior to 1999, Portfolio Manager at Rockefeller & Co. and Scudder, Stevens & Clark. Board member of the Harding Loevner Funds from 1996 to 2014, serving as both Lead Independent Director and chair of the Audit Committee. Board member of the Russell Exchange Traded Funds Trust from 2011 to 2012 and the chair of the Audit Committee. Ms. Freeman is also an inactive Chartered Financial Analyst. | N/A |
Isaiah Harris, Jr.
(Born 1952) | Trustee,
since 2009; Audit
Committee
Chair,
since 2019 | Retired. Chairman of the Board of CIGNA Corporation since 2009, and Director since 2005. From 2003 to 2011, Director of Deluxe Corporation. Prior thereto, President and CEO of BellSouth Advertising and Publishing Corp. from 2005 to 2007, President and CEO of BellSouth Enterprises from 2004 to 2005 and President of BellSouth Consumer Services from 2000 to 2003. Emeritus member of the Iowa State University Foundation Board of Governors. Emeritus Member of the Advisory Board of Iowa State University School of Business. Advisory Board Member, Palm Harbor Academy (private school). Mr. Harris is a certified public accountant (inactive status). | CIGNA Corporation |
Judith M. Johnson
(Born 1949) | Trustee,
since 2008 | Retired. Prior thereto, Chief Executive Officer and Chief Investment Officer of Minneapolis Employees Retirement Fund from 1996 to 2008. Ms. Johnson is an attorney, certified public accountant and a certified managerial accountant. | N/A |
David F. Larcker
(Born 1950) | Trustee,
since 2009 | James Irvin Miller Professor of Accounting at the Graduate School of Business (Emeritus), Stanford University, Director of the Corporate Governance Research Initiative and Senior Faculty of The Rock Center for Corporate Governance since 2006. From 2005 to 2008, Professor of Accounting at the Graduate School of Business, Stanford University. Prior thereto, Ernst & Young Professor of Accounting at The Wharton School, University of Pennsylvania from 1985 to 2005. | N/A |
Wells Fargo Index Asset Allocation Fund | 45
Other information (unaudited)
Name and
year of birth | Position held and
length of service* | Principal occupations during past five years or longer | Current other
public company or
investment
company
directorships |
Olivia S. Mitchell
(Born 1953) | Trustee,
since 2006;
Nominating and
Governance
Committee Chair,
since 2018 | International Foundation of Employee Benefit Plans Professor, Wharton School of the University of Pennsylvania since 1993. Director of Wharton’s Pension Research Council and Boettner Center on Pensions & Retirement Research, and Research Associate at the National Bureau of Economic Research. Previously, Cornell University Professor from 1978 to 1993. | N/A |
Timothy J. Penny
(Born 1951) | Trustee,
since 1996;
Chair,
since 2018 | President and Chief Executive Officer of Southern Minnesota Initiative Foundation, a non-profit organization, since 2007. Member of the Board of Trustees of NorthStar Education Finance, Inc., a non-profit organization, since 2007. | N/A |
James G. Polisson
(Born 1959) | Trustee,
since 2018 | Retired. Chief Marketing Officer, Source (ETF) UK Services, Ltd, from 2015 to 2017. From 2012 to 2015, Principal of The Polisson Group, LLC, a management consulting, corporate advisory and principal investing company. Chief Executive Officer and Managing Director at Russell Investments, Global Exchange Traded Funds from 2010 to 2012. Managing Director of Barclays Global Investors from 1998 to 2010 and Global Chief Marketing Officer for iShares and Barclays Global Investors from 2000 to 2010. Trustee of the San Francisco Mechanics’ Institute, a non-profit organization, from 2013 to 2015. Board member of the Russell Exchange Traded Fund Trust from 2011 to 2012. Director of Barclays Global Investors Holdings Deutschland GmbH from 2006 to 2009. Mr. Polisson is an attorney and has a retired status with the Massachusetts and District of Columbia Bar Associations. | N/A |
Pamela Wheelock
(Born 1959) | Trustee,
since January
2020; previously
Trustee from
January 2018 to
July 2019 | Board member of the Destination Medical Center Economic Development Agency, Rochester, Minnesota since 2019. Interim President of the McKnight Foundation from January to September 2020. Acting Commissioner, Minnesota Department of Human Services, July 2019 through September 2019. Human Services Manager (part-time), Minnesota Department of Human Services, October 2019 through December 2019. Chief Operating Officer, Twin Cities Habitat for Humanity from 2017 to 2019. Vice President of University Services, University of Minnesota from 2012 to 2016. Prior thereto, on the Board of Directors, Governance Committee and Finance Committee for the Minnesota Philanthropy Partners (Saint Paul Foundation) from 2012 to 2018, Interim Chief Executive Officer of Blue Cross Blue Shield of Minnesota from 2011 to 2012, Chairman of the Board from 2009 to 2012 and Board Director from 2003 to 2015. Vice President, Leadership and Community Engagement, Bush Foundation, Saint Paul, Minnesota (a private foundation) from 2009 to 2011. Executive Vice President and Chief Financial Officer, Minnesota Sports and Entertainment from 2004 to 2009 and Senior Vice President from 2002 to 2004. Executive Vice President of the Minnesota Wild Foundation from 2004 to 2008. Commissioner of Finance, State of Minnesota, from 1999 to 2002. Currently Board Chair of the Minnesota Wild Foundation since 2010. | N/A |
* Length of service dates reflect the Trustee’s commencement of service with the Trust’s predecessor entities, where applicable.
46 | Wells Fargo Index Asset Allocation Fund
Other information (unaudited)
Officers
Name and
year of birth | Position held and
length of service | Principal occupations during past five years or longer |
Andrew Owen
(Born 1960) | President,
since 2017 | Executive Vice President of Wells Fargo & Company and Head of Affiliated Managers, Wells Fargo Asset Management, since 2014. In addition, Mr. Owen is currently President, Chief Executive Officer and Director of Wells Fargo Funds Management, LLC since 2017. Prior thereto, Executive Vice President responsible for marketing, investments and product development for Wells Fargo Funds Management, LLC, from 2009 to 2014. |
Jeremy DePalma
(Born 1974) | Treasurer,
since 2012
(for certain funds in
the Fund Complex);
since 2021 (for
the remaining funds in the
Fund Complex) | Senior Vice President of Wells Fargo Funds Management, LLC since 2009. Senior Vice President of Evergreen Investment Management Company, LLC from 2008 to 2010 and head of the Fund Reporting and Control Team within Fund Administration from 2005 to 2010. |
Michelle Rhee
(Born 1966) | Chief Legal Officer,
since 2019 | Secretary of Wells Fargo Funds Management, LLC and Chief Legal Counsel of Wells Fargo Asset Management since 2018. Deputy General Counsel of Wells Fargo Bank, N.A. since 2020 and Assistant General Counsel of Wells Fargo Bank, N.A. from 2018 to 2020. Associate General Counsel and Managing Director of Bank of America Corporation from 2004 to 2018. |
Catherine Kennedy
(Born 1969) | Secretary,
since 2019 | Vice President of Wells Fargo Funds Management, LLC and Senior Counsel of the Wells Fargo Legal Department since 2010. Vice President and Senior Counsel of Evergreen Investment Management Company, LLC from 1998 to 2010. |
Michael H. Whitaker
(Born 1967) | Chief Compliance Officer,
since 2016 | Chief Compliance Officer of Wells Fargo Asset Management since 2016. Senior Vice President and Chief Compliance Officer for Fidelity Investments from 2007 to 2016. |
1 The Statement of Additional Information includes additional information about the Trustees and is available, without charge, upon request, by calling 1-800-222-8222 or by visiting the website at wfam.com.
Wells Fargo Index Asset Allocation Fund | 47
For more information
More information about Wells Fargo Funds is available free upon request. To obtain literature, please write, visit the Fund's website, or call:
Wells Fargo Funds
P.O. Box 219967
Kansas City, MO 64121-9967
Website: wfam.com
Individual investors: 1-800-222-8222
Retail investment professionals: 1-888-877-9275
Institutional investment professionals: 1-866-765-0778
This report and the financial statements contained herein are submitted for the general information of the shareholders of the Fund. If this report is used for promotional purposes, distribution of the report must be accompanied or preceded by a current prospectus. Before investing, please consider the investment objectives, risks, charges, and expenses of the investment. For a current prospectus and, if available, a summary prospectus, containing this information, call 1-800-222-8222 or visit the Fund's website at wfam.com. Read the prospectus carefully before you invest or send money.
Wells Fargo Asset Management (WFAM) is the trade name for certain investment advisory/management firms owned by Wells Fargo & Company. These firms include but are not limited to Wells Capital Management Incorporated and Wells Fargo Funds Management, LLC. Certain products managed by WFAM entities are distributed by Wells Fargo Funds Distributor, LLC (a broker-dealer and Member FINRA).
This material is for general informational and educational purposes only and is NOT intended to provide investment advice or a recommendation of any kind - including a recommendation for any specific investment, strategy, or plan.
INVESTMENT PRODUCTS: NOT FDIC INSURED ■ NO BANK GUARANTEE ■ MAY LOSE VALUE
© 2021 Wells Fargo & Company. All rights reserved.
PAR-0421-00289 05-21
SA227/SAR227 03-21
Semi-Annual Report
March 31, 2021
Wells Fargo
International Bond Fund
Reduce clutter.
Save trees.
Sign up for electronic delivery of prospectuses and shareholder reports at wellsfargo.com/ advantagedelivery
The views expressed and any forward-looking statements are as of March 31, 2021, unless otherwise noted, and are those of the Fund's portfolio managers and/or Wells Fargo Asset Management. Discussions of individual securities or the markets generally are not intended as individual recommendations. Future events or results may vary significantly from those expressed in any forward-looking statements. The views expressed are subject to change at any time in response to changing circumstances in the market. Wells Fargo Asset Management and the Fund disclaim any obligation to publicly update or revise any views expressed or forward-looking statements.
INVESTMENT PRODUCTS: NOT FDIC INSURED ■ NO BANK GUARANTEE ■ MAY LOSE VALUE
Wells Fargo International Bond Fund | 1
Letter to shareholders (unaudited)
Andrew Owen
President
Wells Fargo Funds
Dear Shareholder:
We are pleased to offer you this semi-annual report for the Wells Fargo International Bond Fund for the six-month period that ended March 31, 2021. Despite a deeply challenging year, dominated by the spread of COVID-19 cases and a sharp drop in economic output throughout much of the world, global stocks performed extremely well, benefiting from ongoing central bank support and rising optimism over the development and distribution of effective COVID-19 vaccines. Bonds also had positive returns, led by global bonds and high-yield bonds.
For the six-month period, U.S. stocks, based on the S&P 500 Index,1 gained 19.07%. International stocks, as measured by the MSCI ACWI ex USA Index (Net),2 returned 21.10%, while the MSCI EM Index (Net),3 had even stronger performance, with a 22.43% gain. Among bond indexes, the Bloomberg Barclays U.S. Aggregate Bond Index,4 returned -2.73%, the Bloomberg Barclays Global Aggregate ex-USD Index (unhedged),5 returned -0.47%, and the Bloomberg Barclays Municipal Bond Index,6 returned 1.46% while the ICE BofA U.S. High Yield Index,7 gained 7.44%.
Hope drove the stock markets to new highs.
In October, capital markets stepped back from their six-month rally. Market volatility rose in advance of the U.S. election and amid a global increase in COVID-19 infections. Europe introduced tighter restrictions affecting economic activity. U.S. markets looked favorably at the prospect of Democratic control of the federal purse strings, which could lead to additional fiscal stimulus and a boost to economic activity. Meanwhile, China reported 4.9% third-quarter gross domestic product growth.
Global stocks rallied in November, propelled by optimism over three promising COVID-19 vaccines. Reversing recent trends, value stocks outperformed growth stocks and cyclical stocks outpaced information technology (IT) stocks. However, U.S. unemployment remained elevated, with a net job loss of 10 million since February. The eurozone services purchasing managers’ index contracted sharply while the region’s manufacturing activity grew. The U.S. election results added to the upbeat mood as investors anticipated more consistent policies in the new administration.
“Global stocks rallied in November, propelled by optimism over three promising COVID-19 vaccines.”
| 1 | The S&P 500 Index consists of 500 stocks chosen for market size, liquidity, and industry group representation. It is a market-value-weighted index with each stock's weight in the index proportionate to its market value. You cannot invest directly in an index. |
| 2 | The Morgan Stanley Capital International (MSCI) All Country World Index (ACWI) ex USA Index (Net) is a free-float-adjusted market-capitalization-weighted index that is designed to measure the equity market performance of developed and emerging markets, excluding the United States. Source: MSCI. MSCI makes no express or implied warranties or representations and shall have no liability whatsoever with respect to any MSCI data contained herein. The MSCI data may not be further redistributed or used as a basis for other indices or any securities or financial products. This report is not approved, reviewed, or produced by MSCI. You cannot invest directly in an index. |
| 1 | The S&P 500 Index consists of 500 stocks chosen for market size, liquidity, and industry group representation. It is a market-value-weighted index with each stock's weight in the index proportionate to its market value. You cannot invest directly in an index. |
| 3 | The MSCI Emerging Markets (EM) Index (Net) is a free-float-adjusted market-capitalization-weighted index that is designed to measure equity market performance of emerging markets. You cannot invest directly in an index. |
| 1 | The S&P 500 Index consists of 500 stocks chosen for market size, liquidity, and industry group representation. It is a market-value-weighted index with each stock's weight in the index proportionate to its market value. You cannot invest directly in an index. |
| 4 | The Bloomberg Barclays U.S. Aggregate Bond Index is a broad-based benchmark that measures the investment-grade, U.S. dollar-denominated, fixed-rate taxable bond market, including Treasuries, government-related and corporate securities, mortgage-backed securities (agency fixed-rate and hybrid adjustable-rate mortgage pass-throughs), asset-backed securities, and commercial mortgage-backed securities. You cannot invest directly in an index. |
| 1 | The S&P 500 Index consists of 500 stocks chosen for market size, liquidity, and industry group representation. It is a market-value-weighted index with each stock's weight in the index proportionate to its market value. You cannot invest directly in an index. |
| 5 | The Bloomberg Barclays Global Aggregate ex-USD Index (unhedged) is an unmanaged index that provides a broad-based measure of the global investment-grade fixed-income markets excluding the U.S. dollar-denominated debt market. You cannot invest directly in an index. |
| 1 | The S&P 500 Index consists of 500 stocks chosen for market size, liquidity, and industry group representation. It is a market-value-weighted index with each stock's weight in the index proportionate to its market value. You cannot invest directly in an index. |
| 6 | The Bloomberg Barclays Municipal Bond Index is an unmanaged index composed of long-term tax-exempt bonds with a minimum credit rating of Baa. You cannot invest directly in an index. |
| 1 | The S&P 500 Index consists of 500 stocks chosen for market size, liquidity, and industry group representation. It is a market-value-weighted index with each stock's weight in the index proportionate to its market value. You cannot invest directly in an index. |
| 7 | The ICE BofA U.S. High Yield Index is a market-capitalization-weighted index of domestic and Yankee high-yield bonds. The index tracks the performance of high-yield securities traded in the U.S. bond market. You cannot invest directly in an index. Copyright 2021. ICE Data Indices, LLC. All rights reserved. |
2 | Wells Fargo International Bond Fund
Letter to shareholders (unaudited)
Financial markets ended the year with strength on high expectations for a rapid rollout of the COVID-19 vaccines, the successful passage of a $900 billion stimulus package, and rising expectations of additional economic support from a Democratic-led Congress. U.S. economic data were mixed with still-elevated unemployment and weak retail sales but growth in manufacturing output. In contrast, China’s economic expansion continued in both manufacturing and nonmanufacturing. U.S. COVID-19 infection rates continued to rise even as new state and local lockdown measures were implemented.
The year 2021 began with emerging market stocks leading all major asset classes in January, driven by China’s strong economic growth and a broad recovery in corporate earnings, which propelled China’s stock market higher. In the U.S., positive news on vaccine trials and January's expansion in both the manufacturing and services sectors were offset by a weak December monthly jobs report. This was compounded by technical factors as some hedge funds were forced to sell stocks to protect themselves against a well-publicized short squeeze coordinated by a group of retail investors. Eurozone sentiment and economic growth were particularly weak, reflecting the impact of a new lockdown with stricter social distancing along with a slow vaccine rollout.
February saw major domestic equity indexes driven higher on the hope of a new stimulus bill, improving COVID-19 vaccination numbers, and the gradual reopening of the economy. Most S&P 500 companies reported better-than-expected earnings, with positive surprises coming from the financials, IT, health care, and materials sectors. Japan saw its economy strengthen as a result of strong export numbers. Meanwhile, crude-oil prices continued their climb, rising more than 25% for the year. Domestic government bonds experienced a sharp sell-off in late February as markets priced in a more robust economic recovery and higher future growth and inflation expectations.
The passage of the massive domestic stimulus bill highlighted March activity, leading to increased forecasts for U.S. growth in 2021. Domestic employment surged as COVID-19 vaccinations and an increasingly open economy spurred hiring. A majority of U.S. small companies reported they are operating at pre-pandemic capacity or higher. Value continued its outperformance of growth in the month, continuing the trend that started in late 2020. Meanwhile, most major developed global equity indexes are up month to date on the back of rising optimism regarding the outlook for global growth. While the U.S. and the U.K. have been the most successful in terms of the vaccine rollout, even within markets where the vaccine has lagged, such as the eurozone and Japan, equity indexes in many of those countries are also in positive territory this year.
Don’t let short-term uncertainty derail long-term investment goals.
Periods of investment uncertainty can present challenges, but experience has taught us that maintaining long-term investment goals can be an effective way to plan for the future. To help you create a sound strategy based on your personal goals and risk tolerance, Wells Fargo Funds offers more than 100 mutual funds spanning a wide range of asset classes and investment styles. Although diversification cannot guarantee an investment profit or prevent losses, we believe it can be an effective way to manage investment risk and potentially smooth out overall portfolio performance. We encourage investors to know their investments and to understand that appropriate levels of risk-taking may unlock opportunities.
Thank you for choosing to invest with Wells Fargo Funds. We appreciate your confidence in us and remain committed to helping you meet your financial needs.
Sincerely,
Andrew Owen
President
Wells Fargo Funds
“The passage of the massive domestic stimulus bill highlighted March activity, leading to increased forecasts for U.S. growth in 2021.”
For further information about your Fund, contact your investment professional, visit our website at wfam.com, or call us directly at 1-800-222-8222.
Wells Fargo International Bond Fund | 3
Letter to shareholders (unaudited)
Preparing for LIBOR Transition
The global financial industry is preparing to transition away from the London Interbank Offered Rate (LIBOR), a key benchmark interest rate, to new alternative rates. LIBOR underpins more than $350 trillion of financial contracts. It is the benchmark rate for a wide spectrum of products ranging from residential mortgages to corporate bonds to derivatives. Regulators have called for a market-wide transition away from LIBOR to successor reference rates by the end of 2021 (expected to be extended through June 30, 2023 for most tenors of the U.S. dollar LIBOR), which requires proactive steps be taken by issuers, counterparties, and asset managers to identify impacted products and adopt new reference rates.
The Fund holds at least one security that uses LIBOR as a floating reference rate and has a maturity date after December 31, 2021.
Although the transition process away from LIBOR has become increasingly well-defined in advance of the anticipated discontinuation date, there remains uncertainty regarding the nature of successor reference rates, and any potential effects of the transition away from LIBOR on investment instruments that use it as a benchmark rate. The transition process may result in, among other things, increased volatility or illiquidity in markets for instruments that currently rely on LIBOR and could negatively impact the value of certain instruments held by the Fund.
Wells Fargo Asset Management is monitoring LIBOR exposure closely and has put resources and controls in place to manage this transition effectively. The Fund’s portfolio management team is evaluating LIBOR holdings to understand what happens to those securities when LIBOR ceases to exist, including examining security documentation to identify the presence or absence of fallback language identifying a replacement rate to LIBOR.
While the pace of transition away from LIBOR will differ by asset class and investment strategy, the portfolio management team will monitor market conditions for those holdings to identify and mitigate deterioration or volatility in pricing and liquidity and ensure appropriate actions are taken in a timely manner.
Further information regarding the potential risks associated with the discontinuation of LIBOR can be found in the Fund’s Statement of Additional Information.
4 | Wells Fargo International Bond Fund
This page is intentionally left blank.
Performance highlights (unaudited)
| Investment objective | The Fund seeks total return, consisting of income and capital appreciation. |
| Manager | Wells Fargo Funds Management, LLC |
| Subadviser | Wells Fargo Aseet Management (International) Limited |
| Portfolio managers | Michael Lee, Alex Perrin, Lauren van Biljon, CFA®‡, Peter Wilson |
| Average annual total returns (%) as of March 31, 2021 |
| | | Including sales charge | | Excluding sales charge | | Expense ratios1 (%) |
| | Inception date | 1 year | 5 year | 10 year | | 1 year | 5 year | 10 year | | Gross | Net 2 |
| Class A (ESIYX) | 9-30-2003 | 4.33 | 1.03 | 0.59 | | 9.26 | 1.96 | 1.05 | | 1.50 | 1.03 |
| Class C (ESIVX) | 9-30-2003 | 8.01 | 1.32 | 0.34 | | 9.01 | 1.32 | 0.34 | | 2.25 | 1.78 |
| Class R6 (ESIRX)3 | 11-30-2012 | – | – | – | | 9.62 | 2.34 | 1.43 | | 1.12 | 0.65 |
| Administrator Class (ESIDX) | 7-30-2010 | – | – | – | | 9.37 | 2.14 | 1.23 | | 1.44 | 0.85 |
| Institutional Class (ESICX) | 12-15-1993 | – | – | – | | 9.57 | 2.29 | 1.37 | | 1.17 | 0.70 |
| Bloomberg Barclays Global Aggregate ex-USD Index4 | – | – | – | – | | 7.15 | 2.13 | 1.26 | | – | – |
Figures quoted represent past performance, which is no guarantee of future results, and do not reflect taxes that a shareholder may pay on an investment in a fund. Investment return and principal value of an investment will fluctuate so that an investor’s shares, when redeemed, may be worth more or less than their original cost. Performance shown without sales charges would be lower if sales charges were reflected. Current performance may be lower or higher than the performance data quoted, which assumes the reinvestment of dividends and capital gains. Current month-end performance is available on the Fund’s website, wfam.com.
Index returns do not include transaction costs associated with buying and selling securities, any mutual fund fees or expenses, or any taxes. It is not possible to invest directly in an index.
For Class A shares, the maximum front-end sales charge is 4.50%. For Class C shares, the maximum contingent deferred sales charge is 1.00%. Performance including a contingent deferred sales charge assumes the sales charge for the corresponding time period. Class R6, Administrator Class, and Institutional Class shares are sold without a front-end sales charge or contingent deferred sales charge.
| 1 | Reflects the expense ratios as stated in the most recent prospectuses. The expense ratios shown are subject to change and may differ from the annualized expense ratios shown in the financial highlights of this report. |
| 2 | The manager has contractually committed through January 31, 2022, to waive fees and/or reimburse expenses to the extent necessary to cap total annual fund operating expenses after fee waivers at 1.03% for Class A, 1.78% for Class C, 0.65% for Class R6, 0.85% Administrator Class, and 0.70% for Institutional Class. Brokerage commissions, stamp duty fees, interest, taxes, acquired fund fees and expenses (if any), and extraordinary expenses are excluded from the expense caps. Prior to or after the commitment expiration date, the caps may be increased or the commitment to maintain the caps may be terminated only with the approval of the Board of Trustees. Without these caps, the Fund’s returns would have been lower. The expense ratio paid by an investor is the net expense ratio (the total annual fund operating expenses after fee waivers) as stated in the prospectuses. |
| 3 | Historical performance shown for the Class R6 shares prior to their inception reflects the performance of the Institutional Class shares, and includes the higher expenses applicable to the Institutional Class shares. If these expenses had not been included, returns for the Class R6 shares would be higher. |
| 4 | The Bloomberg Barclays Global Aggregate ex-USD Index is an unmanaged index that provides a broad-based measure of the global investment grade fixed income markets excluding the U.S. dollar denominated debt market. You cannot invest directly in an index. |
Bond values fluctuate in response to the financial condition of individual issuers, general market and economic conditions, and changes in interest rates. Changes in market conditions and government policies may lead to periods of heightened volatility in the bond market and reduced liquidity for certain bonds held by the Fund. In general, when interest rates rise, bond values fall and investors may lose principal value. Interest rate changes and their impact on the Fund and its share price can be sudden and unpredictable. The use of derivatives may reduce returns and/or increase volatility. Securities issued by U.S. government agencies or government-sponsored entities may not be guaranteed by the U.S. Treasury. Certain investment strategies tend to increase the total risk of an investment (relative to the broader market). The Fund is exposed to mortgage- and asset-backed securities risk. The U.S. government guarantee applies to certain underlying securities and not to shares of the Fund. Consult the Fund’s prospectus for additional information on these and other risks.
| ‡ | CFA® and Chartered Financial Analyst® are trademarks owned by CFA Institute. |
6 | Wells Fargo International Bond Fund
Performance highlights (unaudited)
| Ten largest holdings (%) as of March 31, 20211 |
| Japan, 0.10%, 6-20-2030 | 12.16 |
| Canada, 2.55%, 3-15-2025 | 4.86 |
| United Kingdom Treasury Bond, 0.25%, 7-31-2031 | 4.25 |
| Italy Buoni Poliennali del Tesoro , 0.95%, 8-1-2030 | 3.73 |
| Nordea Kredit Realkredit AS, 1.00%, 10-1-2050 | 3.60 |
| Nykredit Realkredit AS, 1.00%, 10-1-2050 | 3.50 |
| Spain Bonos y Obligaciones del Estado, 1.25%, 10-31-2030 | 3.49 |
| Realkredit Danmark AS, 1.00%, 10-1-2050 | 3.47 |
| Norway, 1.50%, 2-19-2026 | 2.83 |
| Japan, 0.10%, 3-20-2027 | 2.63 |
| 1 | Figures represent the percentage of the Fund's net assets. Holdings are subject to change and may have changed since the date specified. |
| Portfolio allocation as of March 31, 20211 |
| 1 | Figures represent the percentage of the Fund's long-term investments. These amounts are subject to change and may have changed since the date specified. |
Wells Fargo International Bond Fund | 7
Fund expenses (unaudited)
As a shareholder of the Fund, you incur two types of costs: (1) transaction costs, including sales charges (loads) on purchase payments and contingent deferred sales charges (if any) on redemptions and (2) ongoing costs, including management fees, distribution (12b-1) and/or shareholder servicing fees, and other Fund expenses. This example is intended to help you understand your ongoing costs (in dollars) of investing in the Fund and to compare these costs with the ongoing costs of investing in other mutual funds.
The example is based on an investment of $1,000 invested at the beginning of the six-month period and held for the entire period from October 1, 2020 to March 31, 2021.
Actual expenses
The “Actual” line of the table below provides information about actual account values and actual expenses. You may use the information in this line, together with the amount you invested, to estimate the expenses that you paid over the period. Simply divide your account value by $1,000 (for example, an $8,600 account value divided by $1,000 = 8.6), then multiply the result by the number in the “Actual” line under the heading entitled “Expenses paid during period” for your applicable class of shares to estimate the expenses you paid on your account during this period.
Hypothetical example for comparison purposes
The “Hypothetical” line of the table below provides information about hypothetical account values and hypothetical expenses based on the Fund’s actual expense ratio and an assumed rate of return of 5% per year before expenses, which is not the Fund’s actual return. The hypothetical account values and expenses may not be used to estimate the actual ending account balance or expenses you paid for the period. You may use this information to compare the ongoing costs of investing in the Fund and other funds. To do so, compare this 5% hypothetical example with the 5% hypothetical examples that appear in the shareholder reports of the other funds.
Please note that the expenses shown in the table are meant to highlight your ongoing costs only and do not reflect any transactional costs, such as sales charges (loads) and contingent deferred sales charges. Therefore, the “Hypothetical” line of the table is useful in comparing ongoing costs only and will not help you determine the relative total costs of owning different funds. In addition, if these transactional costs were included, your costs would have been higher.
| | Beginning
account value
10-1-2020 | Ending
account value
3-31-2021 | Expenses
paid during
the period1 | Annualized net
expense ratio |
| Class A | | | | |
| Actual | $1,000.00 | $1,000.90 | $5.14 | 1.03% |
| Hypothetical (5% return before expenses) | $1,000.00 | $1,019.80 | $5.19 | 1.03% |
| Class C | | | | |
| Actual | $1,000.00 | $ 997.16 | $8.86 | 1.78% |
| Hypothetical (5% return before expenses) | $1,000.00 | $1,016.06 | $8.95 | 1.78% |
| Class R6 | | | | |
| Actual | $1,000.00 | $1,002.64 | $3.25 | 0.65% |
| Hypothetical (5% return before expenses) | $1,000.00 | $1,021.69 | $3.28 | 0.65% |
| Administrator Class | | | | |
| Actual | $1,000.00 | $1,001.79 | $4.24 | 0.85% |
| Hypothetical (5% return before expenses) | $1,000.00 | $1,020.69 | $4.28 | 0.85% |
| Institutional Class | | | | |
| Actual | $1,000.00 | $1,002.65 | $3.50 | 0.70% |
| Hypothetical (5% return before expenses) | $1,000.00 | $1,021.44 | $3.53 | 0.70% |
1 Expenses paid is equal to the annualized net expense ratio of each class multiplied by the average account value over the period, multiplied by the number of days in the most recent fiscal half-year divided by the number of days in the fiscal year (to reflect the one-half-year period).
8 | Wells Fargo International Bond Fund
Portfolio of investments—March 31, 2021 (unaudited)
| | | Interest
rate | Maturity
date | | Principal | Value |
| Corporate bonds and notes: 4.43% | | | | | | |
| United States: 4.43% | | | | | | |
| AbbVie Incorporated (Health care, Biotechnology)144A | | 2.60% | 11-21-2024 | $ | 200,000 | $ 211,160 |
| Amthem Incorporated (Health care, Health care providers & services) | | 2.55 | 3-15-2031 | | 325,000 | 325,053 |
| Anthem Incorporated (Health care, Health care providers & services) | | 2.25 | 5-15-2030 | | 275,000 | 270,646 |
| Apple Incorporated (Information technology, Technology hardware, storage & peripherals) | | 1.20 | 2-8-2028 | | 475,000 | 457,387 |
| AT&T Incorporated (Communication services, Diversified telecommunication services) | | 4.35 | 3-1-2029 | | 250,000 | 282,794 |
| Bank of America Corporation (3 Month LIBOR +1.21%) (Financials, Banks)± | | 3.97 | 2-7-2030 | | 300,000 | 332,966 |
| Berry Global Incorporated (Materials, Containers & packaging) | | 1.00 | 1-15-2025 | | 275,000 | 323,460 |
| BP Capital Markets America Incorporated (Energy, Oil, gas & consumable fuels) | | 1.75 | 8-10-2030 | | 400,000 | 377,830 |
| Chevron USA Incorporated (Energy, Oil, gas & consumable fuels) | | 0.69 | 8-12-2025 | | 375,000 | 367,805 |
| Citigroup Incorporated (Financials, Banks) | | 3.20 | 10-21-2026 | | 150,000 | 161,187 |
| Crown Castle International Corporation (Real estate, Equity REITs) | | 1.05 | 7-15-2026 | | 525,000 | 508,319 |
| CVS Health Corporation (Health care, Health care providers & services) | | 1.88 | 2-28-2031 | | 225,000 | 211,338 |
| Discovery Communications LLC (Communication services, Media) | | 3.95 | 3-20-2028 | | 300,000 | 327,706 |
| Ford Motor Company (Consumer discretionary, Automobiles) | | 8.50 | 4-21-2023 | | 75,000 | 83,625 |
| General Motors Company (Consumer discretionary, Automobiles) | | 1.25 | 1-8-2026 | | 600,000 | 588,715 |
| General Motors Company (Consumer discretionary, Automobiles) | | 5.40 | 10-2-2023 | | 50,000 | 54,291 |
| Global Payments Incorporated (Information technology, IT services) | | 3.20 | 8-15-2029 | | 350,000 | 368,624 |
| IQVIA Incorporated (Health care, Health care providers & services) | | 2.88 | 6-15-2028 | | 225,000 | 271,140 |
| Qualcomm Incorporated (Information technology, Semiconductors & semiconductor equipment) | | 2.15 | 5-20-2030 | | 250,000 | 247,857 |
| Verizon Communications Incorporated (Communication services, Diversified telecommunication services) | | 1.45 | 3-20-2026 | | 525,000 | 525,043 |
| Total Corporate bonds and notes (Cost $6,262,778) | | | | | | 6,296,946 |
| Foreign corporate bonds and notes: 20.35% | | | | | | |
| Denmark: 10.57% | | | | | | |
| Nordea Kredit Realkredit AS (Financials, Thrifts & mortgage finance) | | 1.00 | 10-1-2050 | DKK | 33,263,795 | 5,120,734 |
| Nykredit Realkredit AS (Financials, Thrifts & mortgage finance) | | 1.00 | 10-1-2050 | DKK | 32,295,931 | 4,966,647 |
| Realkredit Danmark AS (Financials, Thrifts & mortgage finance) | | 1.00 | 10-1-2050 | DKK | 32,088,259 | 4,932,180 |
| | | | | | | 15,019,561 |
The accompanying notes are an integral part of these financial statements.
Wells Fargo International Bond Fund | 9
Portfolio of investments—March 31, 2021 (unaudited)
| | | Interest
rate | Maturity
date | | Principal | Value |
| France: 0.51% | | | | | | |
| Altice France SA (Communication services, Diversified telecommunication services) | | 4.13% | 1-15-2029 | EUR | 200,000 | $ 234,578 |
| Rubis Terminal Infra SAS (Energy, Oil, gas & consumable fuels) | | 5.63 | 5-15-2025 | EUR | 200,000 | 246,865 |
| SPCM SA (Materials, Chemicals)144A | | 2.00 | 2-1-2026 | EUR | 200,000 | 238,171 |
| | | | | | | 719,614 |
| Germany: 0.26% | | | | | | |
| Cheplapharm Arzneimittel (Health care, Pharmaceuticals) | | 4.38 | 1-15-2028 | EUR | 100,000 | 122,547 |
| Rebecca Bidco (Consumer discretionary, Diversified consumer services) | | 5.75 | 7-15-2025 | EUR | 200,000 | 244,848 |
| | | | | | | 367,395 |
| India: 1.26% | | | | | | |
| International Finance Corporation (Financials, Capital markets) | | 6.30 | 11-25-2024 | INR | 127,750,000 | 1,793,580 |
| Ireland: 0.17% | | | | | | |
| Smurfit Kappa Treasury Company (Materials, Paper & forest products) | | 1.50 | 9-15-2027 | EUR | 200,000 | 246,614 |
| Italy: 0.26% | | | | | | |
| Brunello Bidco SpA (Information technology, Software)144A | | 3.50 | 2-15-2028 | EUR | 100,000 | 116,707 |
| Gamma Bidco SpA (Industrials, Electrical equipment) | | 6.25 | 7-15-2025 | EUR | 200,000 | 244,367 |
| | | | | | | 361,074 |
| Luxembourg: 3.93% | | | | | | |
| ContourGlobal Power Holdings SA (Utilities, Electric utilities)144A | | 2.75 | 1-1-2026 | EUR | 200,000 | 234,639 |
| European Investment Bank (Financials, Banks)¤ | | 0.00 | 1-18-2033 | JPY | 290,000,000 | 2,549,786 |
| European Investment Bank (Financials, Banks) | | 0.13 | 12-14-2026 | GBP | 2,000,000 | 2,675,908 |
| PLT VII Finance (Financials, Diversified financial services) | | 4.63 | 1-5-2026 | EUR | 100,000 | 121,897 |
| | | | | | | 5,582,230 |
| Netherlands: 0.63% | | | | | | |
| Maxeda DIY Holding BV (Consumer discretionary, Household durables) | | 5.88 | 10-1-2026 | EUR | 200,000 | 242,471 |
| United Group BV (Communication services, Media) | | 3.13 | 2-15-2026 | EUR | 225,000 | 255,150 |
| VZ Vendor Financing BV (Financials, Diversified financial services)144A | | 2.88 | 1-15-2029 | EUR | 250,000 | 287,312 |
| Ziggo Bond Company BV (Communication services, Media) | | 3.38 | 2-28-2030 | EUR | 100,000 | 115,511 |
| | | | | | | 900,444 |
| Philippines: 0.76% | | | | | | |
| Asian Development Bank (Financials, Capital markets) | | 5.90 | 12-20-2022 | INR | 78,000,000 | 1,077,499 |
The accompanying notes are an integral part of these financial statements.
10 | Wells Fargo International Bond Fund
Portfolio of investments—March 31, 2021 (unaudited)
| | | Interest
rate | Maturity
date | | Principal | Value |
| Sweden: 0.30% | | | | | | |
| Verisure Holding AB (Industrials, Commercial services & supplies)144A | | 3.25% | 2-15-2027 | EUR | 150,000 | $ 177,224 |
| Verisure Holding AB (Industrials, Commercial services & supplies) | | 3.88 | 7-15-2026 | EUR | 200,000 | 241,777 |
| | | | | | | 419,001 |
| United Kingdom: 1.70% | | | | | | |
| AA Bond Company Limited (Consumer discretionary, Diversified consumer services)144A | | 6.50 | 1-31-2026 | GBP | 125,000 | 177,710 |
| European Bank for Reconstruction and Development (Financials, Capital markets) | | 6.50 | 6-19-2023 | INR | 55,000,000 | 769,404 |
| Galaxy Bidco Limited (Financials, Insurance) | | 6.50 | 7-31-2026 | GBP | 200,000 | 291,794 |
| Ineos Finance plc (Financials, Diversified financial services)144A | | 3.38 | 3-31-2026 | EUR | 200,000 | 240,990 |
| INEOS Quattro Finance plc (Financials, Diversified financial services)144A | | 2.50 | 1-15-2026 | EUR | 100,000 | 117,235 |
| Pinewood Finance Company Limited (Financials, Diversified financial services) | | 3.25 | 9-30-2025 | GBP | 100,000 | 140,617 |
| Playtech plc (Consumer discretionary, Hotels, restaurants & leisure) | | 3.75 | 10-12-2023 | EUR | 175,000 | 208,342 |
| Synthomer plc (Materials, Chemicals) | | 3.88 | 7-1-2025 | EUR | 100,000 | 122,182 |
| Virgin Media Secured Finance plc (Communication services, Media) | | 4.25 | 1-15-2030 | GBP | 250,000 | 344,650 |
| | | | | | | 2,412,924 |
| Total Foreign corporate bonds and notes (Cost $28,944,233) | | | | | | 28,899,936 |
| Foreign government bonds: 67.74% | | | | | | |
| Brazil Government Bond | | 10.00 | 1-1-2023 | BRL | 2,100,000 | 392,784 |
| Brazil Government Bond | | 10.00 | 1-1-2025 | BRL | 9,550,000 | 1,788,405 |
| Canada 144A | | 2.55 | 3-15-2025 | CAD | 8,175,000 | 6,906,694 |
| Colombia | | 6.00 | 4-28-2028 | COP | 1,235,000,000 | 329,759 |
| Hungary | | 1.50 | 4-22-2026 | HUF | 985,000,000 | 3,127,198 |
| India | | 7.32 | 1-28-2024 | INR | 24,000,000 | 348,739 |
| Indonesia | | 5.50 | 4-15-2026 | IDR | 25,000,000,000 | 1,689,329 |
| Indonesia | | 6.50 | 6-15-2025 | IDR | 10,050,000,000 | 707,838 |
| Indonesia | | 7.25 | 2-15-2026 | IDR | 23,750,000,000 | 1,711,275 |
| Italy Buoni Poliennali del Tesoro | | 0.35 | 2-1-2025 | EUR | 3,125,000 | 3,732,924 |
| Italy Buoni Poliennali del Tesoro | | 0.95 | 8-1-2030 | EUR | 4,375,000 | 5,300,579 |
| Japan | | 0.10 | 3-20-2027 | JPY | 410,000,000 | 3,738,156 |
| Japan | | 0.10 | 6-20-2030 | JPY | 1,905,000,000 | 17,267,756 |
| Japan | | 0.10 | 9-20-2030 | JPY | 370,000,000 | 3,349,465 |
| Korea Treasury Bond | | 1.88 | 6-10-2029 | KRW | 1,920,000,000 | 1,690,762 |
| Korea Treasury Bond | | 2.38 | 3-10-2023 | KRW | 1,706,000,000 | 1,549,006 |
| Malaysia Government Bond | | 3.90 | 11-30-2026 | MYR | 1,100,000 | 279,494 |
| Malaysia Government Bond | | 3.96 | 9-15-2025 | MYR | 12,250,000 | 3,112,058 |
| Mexico | | 5.75 | 3-5-2026 | MXN | 73,200,000 | 3,550,896 |
| Mexico | | 8.00 | 11-7-2047 | MXN | 3,050,000 | 153,072 |
| Mexico | | 8.50 | 5-31-2029 | MXN | 6,815,000 | 374,151 |
| New South Wales | | 3.00 | 5-20-2027 | AUD | 1,815,000 | 1,529,116 |
| New South Wales | | 5.00 | 8-20-2024 | AUD | 2,025,000 | 1,773,031 |
| Norway 144A | | 1.50 | 2-19-2026 | NOK | 33,700,000 | 4,020,289 |
| Poland | | 2.50 | 1-25-2023 | PLN | 1,000,000 | 264,219 |
| Poland | | 2.75 | 10-25-2029 | PLN | 425,000 | 119,018 |
The accompanying notes are an integral part of these financial statements.
Wells Fargo International Bond Fund | 11
Portfolio of investments—March 31, 2021 (unaudited)
| | | Interest
rate | Maturity
date | | Principal | Value |
| Foreign government bonds: 67.74% (continued) | | | | | | |
| Queensland Treasury Corporation 144A | | 2.75% | 8-20-2027 | AUD | 2,000,000 | $ 1,660,615 |
| Queensland Treasury Corporation 144A | | 4.75 | 7-21-2025 | AUD | 2,050,000 | 1,824,204 |
| Republic of Peru | | 5.70 | 8-12-2024 | PEN | 400,000 | 121,684 |
| Republic of South Africa | | 8.75 | 2-28-2048 | ZAR | 25,750,000 | 1,367,053 |
| Republic of South Africa | | 8.75 | 2-28-2048 | ZAR | 11,185,000 | 593,805 |
| Republic of South Africa | | 10.50 | 12-21-2026 | ZAR | 26,585,000 | 2,045,208 |
| Romania | | 3.25 | 4-29-2024 | RON | 4,240,000 | 1,036,658 |
| Romania | | 3.40 | 3-8-2022 | RON | 600,000 | 144,787 |
| Romania | | 4.85 | 4-22-2026 | RON | 6,550,000 | 1,719,182 |
| Romania | | 5.00 | 2-12-2029 | RON | 3,535,000 | 959,601 |
| Russia | | 4.50 | 7-16-2025 | RUB | 221,000,000 | 2,713,244 |
| Russia | | 6.50 | 2-28-2024 | RUB | 38,600,000 | 516,768 |
| Russia | | 7.00 | 12-15-2021 | RUB | 26,000,000 | 348,708 |
| Spain Bonos y Obligaciones del Estado ¤ | | 0.00 | 1-31-2025 | EUR | 1,150,000 | 1,367,972 |
| Spain Bonos y Obligaciones del Estado 144A | | 1.25 | 10-31-2030 | EUR | 3,875,000 | 4,963,507 |
| United Kingdom Treasury Bond | | 0.25 | 7-31-2031 | GBP | 4,700,000 | 6,034,099 |
| Total Foreign government bonds (Cost $97,103,965) | | | | | | 96,223,108 |
| U.S. Treasury securities: 1.65% | | | | | | |
| U.S. Treasury Note | | 0.25 | 8-31-2025 | $ | 2,400,000 | 2,344,125 |
| Total U.S. Treasury securities (Cost $2,392,533) | | | | | | 2,344,125 |
| Yankee corporate bonds and notes: 0.92% | | | | | | |
| France: 0.32% | | | | | | |
| Electricite de France SA (Utilities, Electric utilities) | | 4.50 | 9-21-2028 | | 400,000 | 455,706 |
| Japan: 0.14% | | | | | | |
| Takeda Pharmaceutical (Health care, Pharmaceuticals) | | 2.05 | 3-31-2030 | | 200,000 | 192,758 |
| Spain: 0.22% | | | | | | |
| Telefonica Emisiones SAU (Communication services, Wireless telecommunication services) | | 4.10 | 3-8-2027 | | 275,000 | 307,490 |
| United Kingdom: 0.24% | | | | | | |
| Vodafone Group plc (Communication services, Wireless telecommunication services) | | 4.38 | 5-30-2028 | | 300,000 | 344,530 |
| Total Yankee corporate bonds and notes (Cost $1,203,531) | | | | | | 1,300,484 |
| Yankee government bonds: 0.31% | | | | | | |
| British Columbia | | 1.30 | 1-29-2031 | | 475,000 | 446,862 |
| Total Yankee government bonds (Cost $474,304) | | | | | | 446,862 |
The accompanying notes are an integral part of these financial statements.
12 | Wells Fargo International Bond Fund
Portfolio of investments—March 31, 2021 (unaudited)
| | | Yield | | | Shares | Value |
| Short-term investments: 3.18% | | | | | | |
| Investment companies: 3.18% | | | | | | |
| Wells Fargo Government Money Market Fund Select Class ♠∞ | | 0.03% | | | 4,517,014 | $ 4,517,014 |
| Total Short-term investments (Cost $4,517,014) | | | | | | 4,517,014 |
| Total investments in securities (Cost $140,898,358) | 98.58% | | | | | 140,028,475 |
| Other assets and liabilities, net | 1.42 | | | | | 2,022,759 |
| Total net assets | 100.00% | | | | | $142,051,234 |
| 144A | The security may be resold in transactions exempt from registration, normally to qualified institutional buyers, pursuant to Rule 144A under the Securities Act of 1933. |
| ± | Variable rate investment. The rate shown is the rate in effect at period end. |
| ¤ | The security is issued in zero coupon form with no periodic interest payments. |
| ♠ | The issuer of the security is an affiliated person of the Fund as defined in the Investment Company Act of 1940. |
| ∞ | The rate represents the 7-day annualized yield at period end. |
| Abbreviations: |
| AUD | Australian dollar |
| BRL | Brazilian real |
| CAD | Canadian dollar |
| COP | Colombian peso |
| DKK | Danish krone |
| EUR | Euro |
| GBP | Great British pound |
| HUF | Hungarian forint |
| IDR | Indonesian rupiah |
| INR | Indian rupee |
| JPY | Japanese yen |
| KRW | Republic of Korea won |
| LIBOR | London Interbank Offered Rate |
| MXN | Mexican peso |
| MYR | Malaysian ringgit |
| NOK | Norwegian krone |
| PEN | Peruvian sol |
| PLN | Polish zloty |
| REIT | Real estate investment trust |
| RON | Romanian lei |
| RUB | Russian ruble |
| ZAR | South African rand |
Investments in affiliates
An affiliated investment is an investment in which the Fund owns at least 5% of the outstanding voting shares of the issuer or as a result of other relationships, such as the Fund and the issuer having the same investment manager. Transactions with issuers that were either affiliated persons of the Fund at the beginning of the period or the end of the period were as follows:
| | Value,
beginning of
period | Purchases | Sales
proceeds | Net
realized
gains
(losses) | Net
change in
unrealized
gains
(losses) | Value,
end of
period | % of
net
assets | Shares,
end
of period | Income
from
affiliated
securities |
| Short-term investments | | | | | | | | | |
| Investment companies | | | | | | | | | |
| Wells Fargo Government Money Market Fund Select Class | $1,002,714 | $42,276,128 | $(38,761,828) | $0 | $0 | $4,517,014 | 3.18% | 4,517,014 | $473 |
The accompanying notes are an integral part of these financial statements.
Wells Fargo International Bond Fund | 13
Portfolio of investments—March 31, 2021 (unaudited)
Forward foreign currency contracts
Currency to be
received | Currency to be
delivered | Counterparty | Settlement
date | Unrealized
gains | | Unrealized
losses |
| 3,500,000 DKK | 571,857 USD | State Street Bank & Trust Company | 4-8-2021 | $ 0 | | $ (20,081) |
| 79,000,000 CNY | 12,158,710 USD | State Street Bank & Trust Company | 4-14-2021 | 0 | | (118,027) |
| 8,800,000 CNY | 1,356,037 USD | State Street Bank & Trust Company | 4-14-2021 | 0 | | (14,796) |
| 3,359,027 USD | 4,350,000 AUD | State Street Bank & Trust Company | 4-14-2021 | 54,793 | | 0 |
| 348,296 USD | 450,000 AUD | State Street Bank & Trust Company | 4-14-2021 | 6,479 | | 0 |
| 90,275,000 JPY | 832,133 USD | State Street Bank & Trust Company | 4-20-2021 | 0 | | (16,679) |
| 74,000,000 JPY | 668,137 USD | State Street Bank & Trust Company | 4-20-2021 | 304 | | 0 |
| 285,000,000 JPY | 2,744,207 USD | State Street Bank & Trust Company | 4-30-2021 | 0 | | (169,567) |
| 4,350,000 CAD | 3,420,403 USD | State Street Bank & Trust Company | 5-10-2021 | 41,271 | | 0 |
| 866,671 USD | 1,100,000 CAD | State Street Bank & Trust Company | 5-10-2021 | 0 | | (8,695) |
| 2,927,907 USD | 43,450,000 ZAR | State Street Bank & Trust Company | 5-12-2021 | 0 | | (1,528) |
| 2,100,000 DKK | 333,468 USD | State Street Bank & Trust Company | 4-8-2021 | 0 | | (2,403) |
| 1,175,000 TRY | 160,036 USD | State Street Bank & Trust Company | 5-12-2021 | 0 | | (21,766) |
| 1,180,000 ZAR | 77,762 USD | State Street Bank & Trust Company | 5-12-2021 | 1,795 | | 0 |
| 751,350 USD | 11,150,000 ZAR | State Street Bank & Trust Company | 5-12-2021 | 0 | | (392) |
| 187,853 USD | 14,000,000 RUB | State Street Bank & Trust Company | 5-12-2021 | 3,610 | | 0 |
| 124,780 USD | 9,200,000 INR | State Street Bank & Trust Company | 5-18-2021 | 0 | | (350) |
| 3,662,010 USD | 270,000,000 INR | State Street Bank & Trust Company | 5-18-2021 | 0 | | (10,257) |
| 1,500,000 BRL | 276,350 USD | State Street Bank & Trust Company | 5-24-2021 | 0 | | (10,684) |
| 320,142 USD | 1,800,000 BRL | State Street Bank & Trust Company | 5-24-2021 | 1,343 | | 0 |
| 1,262,783 USD | 7,100,000 BRL | State Street Bank & Trust Company | 5-24-2021 | 5,297 | | 0 |
| 230,292 USD | 1,250,000 BRL | State Street Bank & Trust Company | 5-24-2021 | 8,903 | | 0 |
| 17,414,134 USD | 104,800,000 DKK | State Street Bank & Trust Company | 4-12-2021 | 892,400 | | 0 |
| 70,279 USD | 1,000,000,000 IDR | State Street Bank & Trust Company | 5-28-2021 | 1,707 | | 0 |
| 17,875,000 THB | 585,954 USD | State Street Bank & Trust Company | 6-9-2021 | 0 | | (14,102) |
| 13,400,000 EUR | 16,053,279 USD | State Street Bank & Trust Company | 6-15-2021 | 0 | | (315,923) |
| 575,000 EUR | 675,129 USD | State Street Bank & Trust Company | 6-15-2021 | 168 | | 0 |
| 925,000 PLN | 240,050 USD | State Street Bank & Trust Company | 6-24-2021 | 0 | | (5,883) |
| 189,133 USD | 3,950,000 MXN | State Street Bank & Trust Company | 6-24-2021 | 0 | | (2,458) |
| 1,783,594 USD | 37,250,000 MXN | State Street Bank & Trust Company | 6-24-2021 | 0 | | (23,180) |
| 186,309 USD | 3,900,000 MXN | State Street Bank & Trust Company | 6-24-2021 | 0 | | (2,857) |
| 451,440 USD | 9,450,000 MXN | State Street Bank & Trust Company | 6-24-2021 | 0 | | (6,923) |
| 97,000,000 HUF | 314,151 USD | State Street Bank & Trust Company | 6-29-2021 | 0 | | (482) |
| 3,600,000 GBP | 4,899,974 USD | State Street Bank & Trust Company | 4-12-2021 | 63,075 | | 0 |
| 410,552 USD | 300,000 GBP | State Street Bank & Trust Company | 4-12-2021 | 0 | | (3,036) |
| 2,715,071 USD | 1,940,000 GBP | State Street Bank & Trust Company | 4-14-2021 | 40,538 | | 0 |
| 2,100,000 CNY | 323,600 USD | State Street Bank & Trust Company | 4-14-2021 | 0 | | (3,531) |
| 4,800,000 AUD | 3,710,515 USD | State Street Bank & Trust Company | 4-14-2021 | 0 | | (64,464) |
| 3,214,000 CNY | 494,659 USD | State Street Bank & Trust Company | 4-14-2021 | 0 | | (4,802) |
| | | | | $1,121,683 | | $(842,866) |
The accompanying notes are an integral part of these financial statements.
14 | Wells Fargo International Bond Fund
Statement of assets and liabilities—March 31, 2021 (unaudited)
| | |
| Assets | |
Investments in unaffiliated securities, at value (cost $136,381,344)
| $ 135,511,461 |
Investments in affiliated securites, at value (cost $4,517,014)
| 4,517,014 |
Foreign currency, at value (cost $345,110)
| 341,033 |
Unrealized gains on forward foreign currency contracts
| 1,121,683 |
Receivable for interest
| 761,945 |
Receivable for investments sold
| 506,313 |
Receivable for Fund shares sold
| 263,210 |
Prepaid expenses and other assets
| 110,439 |
Total assets
| 143,133,098 |
| Liabilities | |
Unrealized losses on forward foreign currency contracts
| 842,866 |
Payable for Fund shares redeemed
| 95,916 |
Management fee payable
| 41,675 |
Administration fees payable
| 10,918 |
Trustees’ fees and expenses payable
| 2,192 |
Distribution fee payable
| 317 |
Accrued expenses and other liabilities
| 87,980 |
Total liabilities
| 1,081,864 |
Total net assets
| $142,051,234 |
| Net assets consist of | |
Paid-in capital
| $ 145,906,686 |
Total distributable loss
| (3,855,452) |
Total net assets
| $142,051,234 |
| Computation of net asset value and offering price per share | |
Net assets – Class A
| $ 10,943,913 |
Shares outstanding – Class A1
| 987,122 |
Net asset value per share – Class A
| $11.09 |
Maximum offering price per share – Class A2
| $11.61 |
Net assets – Class C
| $ 493,186 |
Shares outstanding – Class C1
| 46,851 |
Net asset value per share – Class C
| $10.53 |
Net assets – Class R6
| $ 5,445,740 |
Shares outstanding – Class R61
| 478,014 |
Net asset value per share – Class R6
| $11.39 |
Net assets – Administrator Class
| $ 37,086,064 |
Shares outstanding – Administrator Class1
| 3,308,992 |
Net asset value per share – Administrator Class
| $11.21 |
Net assets – Institutional Class
| $ 88,082,331 |
Shares outstanding – Institutional Class1
| 7,766,470 |
Net asset value per share – Institutional Class
| $11.34 |
| 1 | The Fund has an unlimited number of authorized shares |
| 2 | Maximum offering price is computed as 100/95.50 of net asset value. On investments of $50,000 or more, the offering price is reduced. |
The accompanying notes are an integral part of these financial statements.
Wells Fargo International Bond Fund | 15
Statement of operations—six months ended March 31, 2021 (unaudited)
| | |
| Investment income | |
Interest (net of foreign withholding taxes of $43,820)
| $ 1,266,636 |
Income from affiliated securities
| 473 |
Total investment income
| 1,267,109 |
| Expenses | |
Management fee
| 405,099 |
| Administration fees | |
Class A
| 9,220 |
Class C
| 443 |
Class R6
| 873 |
Administrator Class
| 17,948 |
Institutional Class
| 32,495 |
| Shareholder servicing fees | |
Class A
| 14,405 |
Class C
| 691 |
Administrator Class
| 44,870 |
| Distribution fee | |
Class C
| 2,074 |
Custody and accounting fees
| 56,006 |
Professional fees
| 30,665 |
Registration fees
| 41,588 |
Shareholder report expenses
| 27,062 |
Trustees’ fees and expenses
| 9,609 |
Other fees and expenses
| 10,740 |
Total expenses
| 703,788 |
| Less: Fee waivers and/or expense reimbursements | |
Fund-level
| (183,700) |
Class A
| (20) |
Net expenses
| 520,068 |
Net investment income
| 747,041 |
| Realized and unrealized gains (losses) on investments | |
| Net realized gains (losses) on | |
Unaffiliated securities
| 1,731,646 |
Forward foreign currency contracts
| (433,895) |
Net realized gains on investments
| 1,297,751 |
| Net change in unrealized gains (losses) on | |
Unaffiliated securities
| (2,760,172) |
Forward foreign currency contracts
| 224,237 |
Net change in unrealized gains (losses) on investments
| (2,535,935) |
Net realized and unrealized gains (losses) on investments
| (1,238,184) |
Net decrease in net assets resulting from operations
| $ (491,143) |
The accompanying notes are an integral part of these financial statements.
16 | Wells Fargo International Bond Fund
Statement of changes in net assets
| | |
| | Six months ended
March 31, 2021
(unaudited) | Year ended
September 30, 2020 |
| Operations | | | | |
Net investment income
| | $ 747,041 | | $ 1,935,486 |
Payment from affiliate
| | 0 | | 3,879 |
Net realized gains on investments
| | 1,297,751 | | 259,027 |
Net change in unrealized gains (losses) on investments
| | (2,535,935) | | 2,913,403 |
Net increase (decrease) in net assets resulting from operations
| | (491,143) | | 5,111,795 |
| Capital share transactions | Shares | | Shares | |
| Proceeds from shares sold | | | | |
Class A
| 65,772 | 748,602 | 163,139 | 1,732,816 |
Class C
| 1,309 | 14,069 | 18,134 | 168,996 |
Class R6
| 379 | 4,381 | 976 | 10,383 |
Administrator Class
| 428,470 | 4,943,619 | 2,400,187 | 26,527,800 |
Institutional Class
| 3,376,539 | 39,164,840 | 1,866,137 | 20,194,483 |
| | | 44,875,511 | | 48,634,478 |
| Payment for shares redeemed | | | | |
Class A
| (93,229) | (1,060,465) | (328,420) | (3,481,337) |
Class C
| (21,157) | (228,359) | (54,324) | (544,461) |
Class R6
| (52,340) | (608,196) | (312,094) | (3,404,671) |
Administrator Class
| (178,646) | (2,056,041) | (1,070,419) | (11,406,831) |
Institutional Class
| (672,815) | (7,826,544) | (4,110,389) | (43,737,008) |
| | | (11,779,605) | | (62,574,308) |
Net increase (decrease) in net assets resulting from capital share transactions
| | 33,095,906 | | (13,939,830) |
Total increase (decrease) in net assets
| | 32,604,763 | | (8,828,035) |
| Net assets | | | | |
Beginning of period
| | 109,446,471 | | 118,274,506 |
End of period
| | $142,051,234 | | $109,446,471 |
The accompanying notes are an integral part of these financial statements.
Wells Fargo International Bond Fund | 17
Financial highlights
(For a share outstanding throughout each period)
| | | Year ended September 30 | |
| Class A | Six months ended
March 31, 2021
(unaudited) | 2020 | 2019 | 2018 | 2017 | 2016 1 | Year ended
October 31, 2015 |
Net asset value, beginning of period
| $11.08 | $10.45 | $9.69 | $10.31 | $10.77 | $9.74 | $10.84 |
Net investment income
| 0.05 2 | 0.18 2 | 0.32 2 | 0.27 2 | 0.26 2 | 0.24 2 | 0.31 2 |
Payment from affiliate
| 0.00 | 0.00 3 | 0.00 | 0.00 | 0.00 | 0.00 | 0.00 |
Net realized and unrealized gains (losses) on investments
| (0.04) | 0.45 | 0.44 | (0.89) | (0.57) | 0.85 | (1.33) |
Total from investment operations
| 0.01 | 0.63 | 0.76 | (0.62) | (0.31) | 1.09 | (1.02) |
| Distributions to shareholders from | | | | | | | |
Net investment income
| 0.00 | 0.00 | 0.00 | 0.00 | 0.00 | 0.00 | (0.05) |
Net realized gains
| 0.00 | 0.00 | 0.00 | 0.00 | (0.15) | (0.06) | (0.03) |
Total distributions to shareholders
| 0.00 | 0.00 | 0.00 | 0.00 | (0.15) | (0.06) | (0.08) |
Net asset value, end of period
| $11.09 | $11.08 | $10.45 | $9.69 | $10.31 | $10.77 | $9.74 |
Total return4
| 0.09% | 6.03% 5 | 7.84% | (6.01)% | (2.78)% | 11.24% | (9.50)% |
| Ratios to average net assets (annualized) | | | | | | | |
Gross expenses
| 1.27% | 1.50% | 1.30% | 1.08% | 1.03% | 1.08% | 1.06% |
Net expenses
| 1.03% | 1.03% | 1.03% | 1.03% | 1.03% | 1.03% | 1.03% |
Net investment income
| 0.86% | 1.68% | 3.21% | 2.75% | 2.61% | 2.64% | 3.07% |
| Supplemental data | | | | | | | |
Portfolio turnover rate
| 33% | 158% | 129% | 99% | 68% | 96% | 136% |
Net assets, end of period (000s omitted)
| $10,944 | $11,237 | $12,329 | $44,519 | $69,885 | $54,399 | $79,727 |
| 1 | For the eleven months ended September 30, 2016. The Fund changed its fiscal year end from October 31 to September 30, effective September 30, 2016. |
| 2 | Calculated based upon average shares outstanding |
| 3 | Amount is less than $0.005. |
| 4 | Total return calculations do not include any sales charges. Returns for periods of less than one year are not annualized. |
| 5 | During the year ended September 30, 2020, the Fund received a payment from an affiliate that had an impact of less than 0.005% on total return. |
The accompanying notes are an integral part of these financial statements.
18 | Wells Fargo International Bond Fund
Financial highlights
(For a share outstanding throughout each period)
| | | Year ended September 30 | |
| Class C | Six months ended
March 31, 2021
(unaudited) | 2020 | 2019 | 2018 | 2017 | 2016 1 | Year ended
October 31, 2015 |
Net asset value, beginning of period
| $10.56 | $9.98 | $9.32 | $10.00 | $10.52 | $9.58 | $10.70 |
Net investment income
| 0.01 2 | 0.09 2 | 0.24 2 | 0.19 2 | 0.18 2 | 0.17 2 | 0.23 2 |
Payment from affiliate
| 0.00 | 0.06 | 0.00 | 0.00 | 0.00 | 0.00 | 0.00 |
Net realized and unrealized gains (losses) on investments
| (0.04) | 0.43 | 0.42 | (0.87) | (0.55) | 0.83 | (1.32) |
Total from investment operations
| (0.03) | 0.58 | 0.66 | (0.68) | (0.37) | 1.00 | (1.09) |
| Distributions to shareholders from | | | | | | | |
Net realized gains
| 0.00 | 0.00 | 0.00 | 0.00 | (0.15) | (0.06) | (0.03) |
Net asset value, end of period
| $10.53 | $10.56 | $9.98 | $9.32 | $10.00 | $10.52 | $9.58 |
Total return3
| (0.28)% | 5.81% 4 | 7.08% | (6.80)% | (3.43)% | 10.49% | (10.21)% |
| Ratios to average net assets (annualized) | | | | | | | |
Gross expenses
| 2.02% | 2.25% | 2.04% | 1.83% | 1.78% | 1.83% | 1.81% |
Net expenses
| 1.78% | 1.78% | 1.78% | 1.78% | 1.78% | 1.78% | 1.78% |
Net investment income
| 0.13% | 0.94% | 2.51% | 2.00% | 1.88% | 1.86% | 2.33% |
| Supplemental data | | | | | | | |
Portfolio turnover rate
| 33% | 158% | 129% | 99% | 68% | 96% | 136% |
Net assets, end of period (000s omitted)
| $493 | $704 | $1,027 | $2,652 | $3,493 | $5,520 | $6,895 |
| 1 | For the eleven months ended September 30, 2016. The Fund changed its fiscal year end from October 31 to September 30, effective September 30, 2016. |
| 2 | Calculated based upon average shares outstanding |
| 3 | Total return calculations do not include any sales charges. Returns for periods of less than one year are not annualized. |
| 4 | During the year ended September 30, 2020, the Fund received a payment from an affiliate which had a 0.58% impact on the total return. |
The accompanying notes are an integral part of these financial statements.
Wells Fargo International Bond Fund | 19
Financial highlights
(For a share outstanding throughout each period)
| | | Year ended September 30 | |
| Class R6 | Six months ended
March 31, 2021
(unaudited) | 2020 | 2019 | 2018 | 2017 | 2016 1 | Year ended
October 31, 2015 |
Net asset value, beginning of period
| $11.36 | $10.68 | $9.86 | $10.45 | $10.88 | $9.80 | $10.88 |
Net investment income
| 0.07 2 | 0.23 2 | 0.37 2 | 0.31 2 | 0.30 2 | 0.28 2 | 0.35 2 |
Net realized and unrealized gains (losses) on investments
| (0.04) | 0.45 | 0.45 | (0.90) | (0.58) | 0.86 | (1.34) |
Total from investment operations
| 0.03 | 0.68 | 0.82 | (0.59) | (0.28) | 1.14 | (0.99) |
| Distributions to shareholders from | | | | | | | |
Net investment income
| 0.00 | 0.00 | 0.00 | 0.00 | 0.00 | 0.00 | (0.06) |
Net realized gains
| 0.00 | 0.00 | 0.00 | 0.00 | (0.15) | (0.06) | (0.03) |
Total distributions to shareholders
| 0.00 | 0.00 | 0.00 | 0.00 | (0.15) | (0.06) | (0.09) |
Net asset value, end of period
| $11.39 | $11.36 | $10.68 | $9.86 | $10.45 | $10.88 | $9.80 |
Total return3
| 0.26% | 6.37% | 8.32% | (5.65)% | (2.48)% | 11.69% | (9.18)% |
| Ratios to average net assets (annualized) | | | | | | | |
Gross expenses
| 0.89% | 1.13% | 0.90% | 0.72% | 0.65% | 0.70% | 0.68% |
Net expenses
| 0.65% | 0.65% | 0.65% | 0.65% | 0.65% | 0.65% | 0.65% |
Net investment income
| 1.24% | 2.08% | 3.68% | 3.18% | 3.01% | 3.00% | 3.46% |
| Supplemental data | | | | | | | |
Portfolio turnover rate
| 33% | 158% | 129% | 99% | 68% | 96% | 136% |
Net assets, end of period (000s omitted)
| $5,446 | $6,020 | $8,979 | $49,749 | $30,876 | $12,501 | $13,152 |
| 1 | For the eleven months ended September 30, 2016. The Fund changed its fiscal year end from October 31 to September 30, effective September 30, 2016. |
| 2 | Calculated based upon average shares outstanding |
| 3 | Returns for periods of less than one year are not annualized. |
The accompanying notes are an integral part of these financial statements.
20 | Wells Fargo International Bond Fund
Financial highlights
(For a share outstanding throughout each period)
| | | Year ended September 30 | |
| Administrator Class | Six months ended
March 31, 2021
(unaudited) | 2020 | 2019 | 2018 | 2017 | 2016 1 | Year ended
October 31, 2015 |
Net asset value, beginning of period
| $11.19 | $10.53 | $9.75 | $10.36 | $10.80 | $9.75 | $10.84 |
Net investment income
| 0.06 2 | 0.20 2 | 0.34 2 | 0.29 2 | 0.28 2 | 0.26 2 | 0.33 2 |
Net realized and unrealized gains (losses) on investments
| (0.04) | 0.46 | 0.44 | (0.90) | (0.57) | 0.85 | (1.34) |
Total from investment operations
| 0.02 | 0.66 | 0.78 | (0.61) | (0.29) | 1.11 | (1.01) |
| Distributions to shareholders from | | | | | | | |
Net investment income
| 0.00 | 0.00 | 0.00 | 0.00 | 0.00 | 0.00 | (0.05) |
Net realized gains
| 0.00 | 0.00 | 0.00 | 0.00 | (0.15) | (0.06) | (0.03) |
Total distributions to shareholders
| 0.00 | 0.00 | 0.00 | 0.00 | (0.15) | (0.06) | (0.08) |
Net asset value, end of period
| $11.21 | $11.19 | $10.53 | $9.75 | $10.36 | $10.80 | $9.75 |
Total return3
| 0.18% | 6.27% | 8.00% | (5.89)% | (2.59)% | 11.44% | (9.36)% |
| Ratios to average net assets (annualized) | | | | | | | |
Gross expenses
| 1.21% | 1.44% | 1.24% | 1.01% | 0.97% | 1.02% | 0.99% |
Net expenses
| 0.85% | 0.85% | 0.85% | 0.85% | 0.85% | 0.85% | 0.85% |
Net investment income
| 1.04% | 1.87% | 3.37% | 2.93% | 2.80% | 2.85% | 3.26% |
| Supplemental data | | | | | | | |
Portfolio turnover rate
| 33% | 158% | 129% | 99% | 68% | 96% | 136% |
Net assets, end of period (000s omitted)
| $37,086 | $34,221 | $18,213 | $27,911 | $41,045 | $50,825 | $266,849 |
| 1 | For the eleven months ended September 30, 2016. The Fund changed its fiscal year end from October 31 to September 30, effective September 30, 2016. |
| 2 | Calculated based upon average shares outstanding |
| 3 | Returns for periods of less than one year are not annualized. |
The accompanying notes are an integral part of these financial statements.
Wells Fargo International Bond Fund | 21
Financial highlights
(For a share outstanding throughout each period)
| | | Year ended September 30 | |
| Institutional Class | Six months ended
March 31, 2021
(unaudited) | 2020 | 2019 | 2018 | 2017 | 2016 1 | Year ended
October 31, 2015 |
Net asset value, beginning of period
| $11.31 | $10.64 | $9.83 | $10.43 | $10.86 | $9.79 | $10.87 |
Net investment income
| 0.07 2 | 0.22 2 | 0.37 2 | 0.31 2 | 0.29 2 | 0.27 2 | 0.35 2 |
Net realized and unrealized gains (losses) on investments
| (0.04) | 0.45 | 0.44 | (0.91) | (0.57) | 0.86 | (1.34) |
Total from investment operations
| 0.03 | 0.67 | 0.81 | (0.60) | (0.28) | 1.13 | (0.99) |
| Distributions to shareholders from | | | | | | | |
Net investment income
| 0.00 | 0.00 | 0.00 | 0.00 | 0.00 | 0.00 | (0.06) |
Net realized gains
| 0.00 | 0.00 | 0.00 | 0.00 | (0.15) | (0.06) | (0.03) |
Total distributions to shareholders
| 0.00 | 0.00 | 0.00 | 0.00 | (0.15) | (0.06) | (0.09) |
Net asset value, end of period
| $11.34 | $11.31 | $10.64 | $9.83 | $10.43 | $10.86 | $9.79 |
Total return3
| 0.27% | 6.30% | 8.24% | (5.75)% | (2.48)% | 11.60% | (9.20)% |
| Ratios to average net assets (annualized) | | | | | | | |
Gross expenses
| 0.94% | 1.17% | 0.95% | 0.74% | 0.70% | 0.75% | 0.73% |
Net expenses
| 0.70% | 0.70% | 0.70% | 0.70% | 0.70% | 0.70% | 0.70% |
Net investment income
| 1.17% | 2.04% | 3.61% | 3.06% | 2.96% | 2.95% | 3.41% |
| Supplemental data | | | | | | | |
Portfolio turnover rate
| 33% | 158% | 129% | 99% | 68% | 96% | 136% |
Net assets, end of period (000s omitted)
| $88,082 | $57,264 | $77,727 | $245,633 | $443,888 | $553,208 | $689,964 |
| 1 | For the eleven months ended September 30, 2016. The Fund changed its fiscal year end from October 31 to September 30, effective September 30, 2016. |
| 2 | Calculated based upon average shares outstanding |
| 3 | Returns for periods of less than one year are not annualized. |
The accompanying notes are an integral part of these financial statements.
22 | Wells Fargo International Bond Fund
Notes to financial statements (unaudited)
1. ORGANIZATION
Wells Fargo Funds Trust (the "Trust"), a Delaware statutory trust organized on March 10, 1999, is an open-end management investment company registered under the Investment Company Act of 1940, as amended (the "1940 Act"). As an investment company, the Trust follows the accounting and reporting guidance in Financial Accounting Standards Board (“FASB”) Accounting Standards Codification Topic 946, Financial Services – Investment Companies. These financial statements report on the Wells Fargo International Bond Fund (the "Fund") which is a diversified series of the Trust.
On February 23, 2021, Wells Fargo & Company announced that it has entered into a definitive agreement to sell Wells Fargo Asset Management ("WFAM") to GTCR LLC and Reverence Capital Partners, L.P. WFAM is the trade name used by the asset management businesses of Wells Fargo & Company and includes Wells Fargo Funds Management, LLC, the investment manager to the Fund, Wells Capital Management Incorporated and Wells Fargo Asset Management (International) Limited, both registered investment advisers providing sub-advisory services to certain funds, and Wells Fargo Funds Distributor, LLC, the Fund's principal underwriter. As part of the transaction, Wells Fargo & Company will own a 9.9% equity interest and will continue to serve as an important client and distribution partner. The transaction is expected to close in the second half of 2021, subject to customary closing conditions.
Consummation of the transaction will result in the automatic termination of the Fund's investment management agreement and sub-advisory agreement. The Fund's Board of Trustees will be asked to approve new investment management arrangements with the new company. If approved by the Board, the new investment management arrangements with the new company will be presented to the shareholders of the Fund for approval, and, if approved by shareholders, would take effect upon the closing of the transaction. The transaction is expected to close in the second half of 2021, subject to customary closing conditions.
2. SIGNIFICANT ACCOUNTING POLICIES
The following significant accounting policies, which are consistently followed in the preparation of the financial statements of the Fund, are in conformity with U.S. generally accepted accounting principles which require management to make estimates and assumptions that affect the reported amounts of assets and liabilities, disclosure of contingent assets and liabilities at the date of the financial statements, and the reported amounts of income and expenses during the reporting period. Actual results could differ from those estimates.
Securities valuation
All investments are valued each business day as of the close of regular trading on the New York Stock Exchange (generally 4 p.m. Eastern Time), although the Fund may deviate from this calculation time under unusual or unexpected circumstances.
Debt securities are valued at the evaluated bid price provided by an independent pricing service (e.g. taking into account various factors, including yields, maturities, or credit ratings) or, if a reliable price is not available, the quoted bid price from an independent broker-dealer.
The values of securities denominated in foreign currencies are translated into U.S. dollars at rates provided by an independent foreign currency pricing source at a time each business day specified by the Wells Fargo Asset Management Pricing Committee at Wells Fargo Funds Management, LLC ("Funds Management").
Forward foreign currency contracts are recorded at the forward rate provided by an independent foreign currency pricing source at a time each business day specified by the Wells Fargo Asset Management Pricing Committee.
Investments in registered open-end investment companies are valued at net asset value.
Investments which are not valued using any of the methods discussed above are valued at their fair value, as determined in good faith by the Board of Trustees. The Board of Trustees has established a Valuation Committee comprised of the Trustees and has delegated to it the authority to take any actions regarding the valuation of portfolio securities that the Valuation Committee deems necessary or appropriate, including determining the fair value of portfolio securities, unless the determination has been delegated to the Wells Fargo Asset Management Pricing Committee. The Board of Trustees retains the authority to make or ratify any valuation decisions or approve any changes to the Valuation Procedures as it deems appropriate. On a quarterly basis, the Board of Trustees receives reports on any valuation actions taken by the Valuation Committee or the Wells Fargo Asset Management Pricing Committee which may include items for ratification.
Foreign currency translation
The accounting records of the Fund are maintained in U.S. dollars. The values of other assets and liabilities denominated in foreign currencies are translated into U.S. dollars at rates provided by an independent foreign currency pricing source at a time each business day specified by the Wells Fargo Asset Management Pricing Committee. Purchases and sales of securities, and
Wells Fargo International Bond Fund | 23
Notes to financial statements (unaudited)
income and expenses are converted at the rate of exchange on the respective dates of such transactions. Net realized foreign exchange gains or losses arise from sales of foreign currencies, currency gains or losses realized between the trade and settlement dates on securities transactions, and the difference between the amounts of dividends, interest and foreign withholding taxes recorded and the U.S. dollar equivalent of the amounts actually paid or received. Net unrealized foreign exchange gains and losses arise from changes in the fair value of assets and liabilities other than investments in securities resulting from changes in exchange rates. The changes in net assets arising from changes in exchange rates of securities and the changes in net assets resulting from changes in market prices of securities are not separately presented. Such changes are included in net realized and unrealized gains or losses from investments.
Forward foreign currency contracts
A forward foreign currency contract is an agreement between two parties to purchase or sell a specific currency for an agreed-upon price at a future date. The Fund enters into forward foreign currency contracts to facilitate transactions in foreign-denominated securities and to attempt to minimize the risk to the Fund from adverse changes in the relationship between currencies. Forward foreign currency contracts are recorded at the forward rate and marked-to-market daily. When the contracts are closed, realized gains and losses arising from such transactions are recorded as realized gains or losses on forward foreign currency contracts. The Fund is subject to foreign currency risk and may be exposed to risks if the counterparties to the contracts are unable to meet the terms of their contracts or if the value of the foreign currency changes unfavorably. The Fund's maximum risk of loss from counterparty credit risk is the unrealized gains on the contracts. This risk may be mitigated if there is a master netting arrangement between the Fund and the counterparty.
Security transactions and income recognition
Securities transactions are recorded on a trade date basis. Realized gains or losses are recorded on the basis of identified cost.
Interest income is accrued daily and bond discounts are accreted and premiums are amortized daily. To the extent debt obligations are placed on non-accrual status, any related interest income may be reduced by writing off interest receivables when the collection of all or a portion of interest has been determined to be doubtful based on consistently applied procedures and the fair value has decreased. If the issuer subsequently resumes interest payments or when the collectability of interest is reasonably assured, the debt obligation is removed from non-accrual status. Interest income is recorded net of foreign taxes withheld where recovery of such taxes is not assured.
Distributions to shareholders
Distributions to shareholders are recorded on the ex-dividend date and paid from net investment income quarterly and any net realized gains are paid at least annually. Such distributions are determined in accordance with income tax regulations and may differ from U.S. generally accepted accounting principles. Dividend sources are estimated at the time of declaration. The tax character of distributions is determined as of the Fund's fiscal year end. Therefore, a portion of the Fund's distributions made prior to the Fund’s fiscal year end may be categorized as a tax return of capital at year end.
Federal and other taxes
The Fund intends to continue to qualify as a regulated investment company by distributing substantially all of its investment company taxable income and any net realized capital gains (after reduction for capital loss carryforwards) sufficient to relieve it from all, or substantially all, federal income taxes. Accordingly, no provision for federal income taxes was required.
The Fund’s income and federal excise tax returns and all financial records supporting those returns for the prior three fiscal years are subject to examination by the federal and Delaware revenue authorities. Management has analyzed the Fund's tax positions taken on federal, state, and foreign tax returns for all open tax years and does not believe that there are any uncertain tax positions that require recognition of a tax liability.
As of March 31, 2021, the aggregate cost of all investments for federal income tax purposes was $140,763,624 and the unrealized gains (losses) consisted of:
| Gross unrealized gains | $ 3,488,058 |
| Gross unrealized losses | (3,944,390) |
| Net unrealized losses | $ (456,332) |
As of September 30, 2020, the Fund had capital loss carryforwards which consisted of $810,128 in short-term capital losses and $3,299,562 in long-term capital losses.
As of September 30, 2020, the Fund had a qualified late-year ordinary loss of $1,142,908 which was recognized on the first day of the current fiscal year.
24 | Wells Fargo International Bond Fund
Notes to financial statements (unaudited)
Class allocations
The separate classes of shares offered by the Fund differ principally in applicable sales charges, distribution, shareholder servicing, and administration fees. Class specific expenses are charged directly to that share class. Investment income, common fund-level expenses, and realized and unrealized gains (losses) on investments are allocated daily to each class of shares based on the relative proportion of net assets of each class.
3. FAIR VALUATION MEASUREMENTS
Fair value measurements of investments are determined within a framework that has established a fair value hierarchy based upon the various data inputs utilized in determining the value of the Fund’s investments. The three-level hierarchy gives the highest priority to unadjusted quoted prices in active markets for identical assets or liabilities (Level 1) and the lowest priority to unobservable inputs (Level 3). The Fund’s investments are classified within the fair value hierarchy based on the lowest level of input that is significant to the fair value measurement. The inputs are summarized into three broad levels as follows:
| ■ | Level 1 – quoted prices in active markets for identical securities |
| ■ | Level 2 – other significant observable inputs (including quoted prices for similar securities, interest rates, prepayment speeds, credit risk, etc.) |
| ■ | Level 3 – significant unobservable inputs (including the Fund’s own assumptions in determining the fair value of investments) |
The inputs or methodologies used for valuing investments in securities are not necessarily an indication of the risk associated with investing in those securities.
The following is a summary of the inputs used in valuing the Fund’s assets and liabilities as of March 31, 2021:
| | Quoted prices
(Level 1) | Other significant
observable inputs
(Level 2) | Significant
unobservable inputs
(Level 3) | Total |
| Assets | | | | |
| Investments in: | | | | |
| Corporate bonds and notes | $ 0 | $ 6,296,946 | $0 | $ 6,296,946 |
| Foreign corporate bonds and notes | 0 | 28,899,936 | 0 | 28,899,936 |
| Foreign government bonds | 0 | 96,223,108 | 0 | 96,223,108 |
| U.S. Treasury securities | 2,344,125 | 0 | 0 | 2,344,125 |
| Yankee corporate bonds and notes | 0 | 1,300,484 | 0 | 1,300,484 |
| Yankee government bonds | 0 | 446,862 | 0 | 446,862 |
| Short-term investments | | | | |
| Investment companies | 4,517,014 | 0 | 0 | 4,517,014 |
| | 6,861,139 | 133,167,336 | 0 | 140,028,475 |
| Forward foreign currency contracts | 0 | 1,121,683 | 0 | 1,121,683 |
| Total assets | $6,861,139 | $134,289,019 | $0 | $141,150,158 |
| Liabilities | | | | |
| Forward foreign currency contracts | $ 0 | $ 842,866 | $0 | $ 842,866 |
| Total liabilities | $ 0 | $ 842,866 | $0 | $ 842,866 |
Forward foreign currency contracts are reported at their cumulative unrealized gains (losses) at measurement date as reported in the table following the Portfolio of Investments. All other assets and liabilities are reported at their market value at measurement date.
Additional sector, industry or geographic detail, if any, is included in the Portfolio of Investments.
For the six months ended March 31, 2021, the Fund did not have any transfers into/out of Level 3.
Wells Fargo International Bond Fund | 25
Notes to financial statements (unaudited)
4. TRANSACTIONS WITH AFFILIATES
Management fee
Funds Management, an indirect wholly owned subsidiary of Wells Fargo & Company ("Wells Fargo"), is the manager of the Fund and provides advisory and fund-level administrative services under an investment management agreement. Under the investment management agreement, Funds Management is responsible for, among other services, implementing the investment objectives and strategies of the Fund, supervising the subadviser and providing fund-level administrative services in connection with the Fund’s operations. As compensation for its services under the investment management agreement, Funds Management is entitled to receive a management fee at the following annual rate based on the Fund’s average daily net assets:
| Average daily net assets | Management fee |
| First $500 million | 0.600% |
| Next $500 million | 0.575 |
| Next $2 billion | 0.550 |
| Next $2 billion | 0.525 |
| Next $5 billion | 0.490 |
| Over $10 billion | 0.480 |
For the six months ended March 31, 2021, the management fee was equivalent to an annual rate of 0.60% of the Fund’s average daily net assets.
Funds Management has retained the services of a subadviser to provide daily portfolio management to the Fund. The fee for subadvisory services is borne by Funds Management. Wells Fargo Asset Management (International) Limited, an affiliate of Funds Management and an indirect wholly owned subsidiary of Wells Fargo, is the subadviser to the Fund and is entitled to receive a fee from Funds Management at an annual rate starting at 0.35% and declining to 0.20% as the average daily net assets of the Fund increase.
Administration fees
Under a class-level administration agreement, Funds Management provides class-level administrative services to the Fund, which includes paying fees and expenses for services provided by the transfer agent, sub-transfer agents, omnibus account servicers and record-keepers. As compensation for its services under the class-level administration agreement, Funds Management receives an annual fee which is calculated based on the average daily net assets of each class as follows:
| | Class-level
administration fee |
| Class A | 0.16% |
| Class C | 0.16 |
| Class R6 | 0.03 |
| Administrator Class | 0.10 |
| Institutional Class | 0.08 |
Waivers and/or expense reimbursements
Funds Management has contractually waived and/or reimbursed management and administration fees to the extent necessary to maintain certain net operating expense ratios for the Fund. When each class of the Fund has exceeded its expense cap, Funds Management has waived fees and/or reimbursed expenses from fund-level expenses on a proportionate basis and then from class specific expenses. When only certain classes exceed their expense caps, waivers and/or reimbursements are applied against class specific expenses before fund-level expenses. Funds Management has committed through January 31, 2022 to waive fees and/or reimburse expenses to the extent necessary to cap expenses. Prior to or after the commitment expiration date, the cap may be increased or the commitment to maintain the cap may be terminated only with the approval of the Board of Trustees. The contractual expense caps are as follows:
26 | Wells Fargo International Bond Fund
Notes to financial statements (unaudited)
| | Expense ratio caps |
| Class A | 1.03% |
| Class C | 1.78 |
| Class R6 | 0.65 |
| Administrator Class | 0.85 |
| Institutional Class | 0.70 |
Distribution fee
The Trust has adopted a distribution plan for Class C shares of the Fund pursuant to Rule 12b-1 under the 1940 Act. A distribution fee is charged charged to Class C shares and paid to Wells Fargo Funds Distributor, LLC (“Funds Distributor”), the principal underwriter, at an annual rate of 0.75% of the average daily net assets of Class C shares.
In addition, Funds Distributor is entitled to receive the front-end sales charge from the purchase of Class A shares and a contingent deferred sales charge on the redemption of certain Class A shares. Funds Distributor is also entitled to receive the contingent deferred sales charges from redemptions of Class C shares. For the six months ended March 31, 2021, Funds Distributor received $490 from the sale of Class A shares. No contingent deferred sales charges were incurred by Class A and Class C shares for the six months ended March 31, 2021.
Shareholder servicing fees
The Trust has entered into contracts with one or more shareholder servicing agents, whereby Class A, Class C, and Administrator Class of the Fund are charged a fee at an annual rate of 0.25% of the average daily net assets of each respective class. A portion of these total shareholder servicing fees were paid to affiliates of Wells Fargo.
Interfund transactions
The Fund may purchase or sell portfolio investment securities to certain other Wells Fargo affiliates pursuant to Rule 17a-7 under the 1940 Act and under procedures adopted by the Board of Trustees. The procedures have been designed to ensure that these interfund transactions, which do not incur broker commissions, are effected at current market prices.
Other transactions
On August 14, 2020, Class A and Class C of the Fund was reimbursed by Funds Management in the amount of $11 and $3,868, respectively. The reimbursements were made in connection with resolving certain fee reimbursements.
5. INVESTMENT PORTFOLIO TRANSACTIONS
Purchases and sales of investments, excluding short-term securities, for the six months ended March 31, 2021 were as follows:
| Purchases at cost | | Sales proceeds |
U.S.
government | Non-U.S.
government | | U.S.
government | Non-U.S.
government |
| $1,742,623 | $69,674,403 | | $3,449,669 | $38,771,877 |
6. DERIVATIVE TRANSACTIONS
During the six months ended March 31, 2021, the Fund entered into forward foreign currency contracts for economic hedging purposes. The Fund had average contract amounts of $55,751,618 in forward foreign currency contracts to buy and $43,242,509 in forward foreign currency contracts to sell during the six months ended March 31, 2021.
The fair value, realized gains or losses and change in unrealized gains or losses, if any, on derivative instruments are reflected in the corresponding financial statement captions.
For certain types of derivative transactions, the Fund has entered into International Swaps and Derivatives Association, Inc. master agreements (“ISDA Master Agreements”) or similar agreements with approved counterparties. The ISDA Master Agreements or similar agreements may have requirements to deliver/deposit securities or cash to/with an exchange or broker-dealer as collateral and allows the Fund to offset, with each counterparty, certain derivative financial instrument’s assets and/or liabilities with collateral held or pledged. Collateral requirements differ by type of derivative. Collateral or margin requirements are set by the broker or exchange clearinghouse for exchange traded derivatives while collateral terms are contract specific for over-the-counter traded derivatives. Cash collateral that has been pledged to cover obligations of the Fund under ISDA Master
Wells Fargo International Bond Fund | 27
Notes to financial statements (unaudited)
Agreements or similar agreements, if any, are reported separately in the Statement of Assets and Liabilities. Securities pledged as collateral, if any, are noted in the Portfolio of Investments. With respect to balance sheet offsetting, absent an event of default by the counterparty or a termination of the agreement, the reported amounts of financial assets and financial liabilities in the Statement of Assets and Liabilities are not offset across transactions between the Fund and the applicable counterparty. A reconciliation of the gross amounts on the Statement of Assets and Liabilities to the net amounts by counterparty, including any collateral exposure, for OTC derivatives is as follows:
| Counterparty | Gross amounts
of assets in the
Statement of
Assets and
Liabilities | Amounts
subject to
netting
agreements | Collateral
received | Net amount
of assets |
| State Street Bank & Trust Company | $1,121,683 | $(842,866) | $0 | $278,817 |
| Counterparty | Gross amounts
of liabilities in the
Statement of
Assets and
Liabilities | Amounts
subject to
netting
agreements | Collateral
pledged | Net amount
of assets |
| State Street Bank & Trust Company | $842,866 | $(842,866) | $0 | $0 |
7. BANK BORROWINGS
The Trust (excluding the money market funds), Wells Fargo Master Trust and Wells Fargo Variable Trust are parties to a $350,000,000 revolving credit agreement whereby the Fund is permitted to use bank borrowings for temporary or emergency purposes, such as to fund shareholder redemption requests. Interest under the credit agreement is charged to the Fund based on a borrowing rate equal to the higher of the Federal Funds rate in effect on that day plus 1.25% or the overnight LIBOR rate in effect on that day plus 1.25%. In addition, an annual commitment fee equal to 0.25% of the unused balance is allocated to each participating fund.
For the six months ended March 31, 2021, there were no borrowings by the Fund under the agreement.
8. INDEMNIFICATION
Under the Fund's organizational documents, the officers and Trustees have been granted certain indemnification rights against certain liabilities that may arise out of performance of their duties to the Fund. The Fund has entered into a separate agreement with each Trustee that converts indemnification rights currently existing under the Fund’s organizational documents into contractual rights that cannot be changed in the future without the consent of the Trustee. Additionally, in the normal course of business, the Fund may enter into contracts with service providers that contain a variety of indemnification clauses. The Fund’s maximum exposure under these arrangements is dependent on future claims that may be made against the Fund and, therefore, cannot be estimated.
9. CORONAVIRUS (COVID-19) PANDEMIC
On March 11, 2020, the World Health Organization announced that it had made the assessment that coronavirus disease 2019 (“COVID-19”) is a pandemic. The impacts of COVID-19 are affecting the entire global economy, individual companies and investment products, the funds, and the market in general. There is significant uncertainty around the extent and duration of business disruptions related to COVID-19 and the impacts may last for an extended period of time. COVID-19 has led to significant uncertainty and volatility in the financial markets.
28 | Wells Fargo International Bond Fund
Other information (unaudited)
PROXY VOTING INFORMATION
A description of the policies and procedures used to determine how to vote proxies relating to portfolio securities is available without charge, upon request, by calling 1-800-222-8222, visiting our website at wfam.com, or visiting the SEC website at sec.gov. Information regarding how the proxies related to portfolio securities were voted during the most recent 12-month period ended June 30 is available on the website at wfam.com or by visiting the SEC website at sec.gov.
QUARTERLY PORTFOLIO HOLDINGS INFORMATION
The Fund files its complete schedule of portfolio holdings with the SEC for the first and third quarters of each fiscal year as an exhibit to its reports on Form N-PORT. Shareholders may view the filed Form N-PORT by visiting the SEC website at sec.gov.
Wells Fargo International Bond Fund | 29
Other information (unaudited)
BOARD OF TRUSTEES AND OFFICERS
Each of the Trustees and Officers listed in the table below acts in identical capacities for each fund in the Wells Fargo family of funds, which consists of 142 mutual funds comprising the Wells Fargo Funds Trust, Wells Fargo Variable Trust, Wells Fargo Master Trust and four closed-end funds (collectively the “Fund Complex”). This table should be read in conjunction with the Prospectus and the Statement of Additional Information1. The mailing address of each Trustee and Officer is 525 Market Street, 12th Floor, San Francisco, CA 94105. Each Trustee and Officer serves an indefinite term, however, each Trustee serves such term until reaching the mandatory retirement age established by the Trustees.
Independent Trustees
Name and
year of birth | Position held and
length of service* | Principal occupations during past five years or longer | Current other
public company or
investment
company
directorships |
William R. Ebsworth
(Born 1957) | Trustee,
since 2015 | Retired. From 1984 to 2013, equities analyst, portfolio manager, research director and chief investment officer at Fidelity Management and Research Company in Boston, Tokyo, and Hong Kong, and retired in 2013 as Chief Investment Officer of Fidelity Strategic Advisers, Inc. where he led a team of investment professionals managing client assets. Prior thereto, Board member of Hong Kong Securities Clearing Co., Hong Kong Options Clearing Corp., the Thailand International Fund, Ltd., Fidelity Investments Life Insurance Company, and Empire Fidelity Investments Life Insurance Company. Audit Committee Chair and Investment Committee Chair of the Vincent Memorial Hospital Endowment (non-profit organization). Mr. Ebsworth is a CFA® charterholder. | N/A |
Jane A. Freeman
(Born 1953) | Trustee,
since 2015;
Chair Liaison,
since 2018 | Retired. From 2012 to 2014 and 1999 to 2008, Chief Financial Officer of Scientific Learning Corporation. From 2008 to 2012, Ms. Freeman provided consulting services related to strategic business projects. Prior to 1999, Portfolio Manager at Rockefeller & Co. and Scudder, Stevens & Clark. Board member of the Harding Loevner Funds from 1996 to 2014, serving as both Lead Independent Director and chair of the Audit Committee. Board member of the Russell Exchange Traded Funds Trust from 2011 to 2012 and the chair of the Audit Committee. Ms. Freeman is also an inactive Chartered Financial Analyst. | N/A |
Isaiah Harris, Jr.
(Born 1952) | Trustee,
since 2009; Audit
Committee
Chair,
since 2019 | Retired. Chairman of the Board of CIGNA Corporation since 2009, and Director since 2005. From 2003 to 2011, Director of Deluxe Corporation. Prior thereto, President and CEO of BellSouth Advertising and Publishing Corp. from 2005 to 2007, President and CEO of BellSouth Enterprises from 2004 to 2005 and President of BellSouth Consumer Services from 2000 to 2003. Emeritus member of the Iowa State University Foundation Board of Governors. Emeritus Member of the Advisory Board of Iowa State University School of Business. Advisory Board Member, Palm Harbor Academy (private school). Mr. Harris is a certified public accountant (inactive status). | CIGNA Corporation |
Judith M. Johnson
(Born 1949) | Trustee,
since 2008 | Retired. Prior thereto, Chief Executive Officer and Chief Investment Officer of Minneapolis Employees Retirement Fund from 1996 to 2008. Ms. Johnson is an attorney, certified public accountant and a certified managerial accountant. | N/A |
David F. Larcker
(Born 1950) | Trustee,
since 2009 | James Irvin Miller Professor of Accounting at the Graduate School of Business (Emeritus), Stanford University, Director of the Corporate Governance Research Initiative and Senior Faculty of The Rock Center for Corporate Governance since 2006. From 2005 to 2008, Professor of Accounting at the Graduate School of Business, Stanford University. Prior thereto, Ernst & Young Professor of Accounting at The Wharton School, University of Pennsylvania from 1985 to 2005. | N/A |
30 | Wells Fargo International Bond Fund
Other information (unaudited)
Name and
year of birth | Position held and
length of service* | Principal occupations during past five years or longer | Current other
public company or
investment
company
directorships |
Olivia S. Mitchell
(Born 1953) | Trustee,
since 2006;
Nominating and
Governance
Committee Chair,
since 2018 | International Foundation of Employee Benefit Plans Professor, Wharton School of the University of Pennsylvania since 1993. Director of Wharton’s Pension Research Council and Boettner Center on Pensions & Retirement Research, and Research Associate at the National Bureau of Economic Research. Previously, Cornell University Professor from 1978 to 1993. | N/A |
Timothy J. Penny
(Born 1951) | Trustee,
since 1996;
Chair,
since 2018 | President and Chief Executive Officer of Southern Minnesota Initiative Foundation, a non-profit organization, since 2007. Member of the Board of Trustees of NorthStar Education Finance, Inc., a non-profit organization, since 2007. | N/A |
James G. Polisson
(Born 1959) | Trustee,
since 2018 | Retired. Chief Marketing Officer, Source (ETF) UK Services, Ltd, from 2015 to 2017. From 2012 to 2015, Principal of The Polisson Group, LLC, a management consulting, corporate advisory and principal investing company. Chief Executive Officer and Managing Director at Russell Investments, Global Exchange Traded Funds from 2010 to 2012. Managing Director of Barclays Global Investors from 1998 to 2010 and Global Chief Marketing Officer for iShares and Barclays Global Investors from 2000 to 2010. Trustee of the San Francisco Mechanics’ Institute, a non-profit organization, from 2013 to 2015. Board member of the Russell Exchange Traded Fund Trust from 2011 to 2012. Director of Barclays Global Investors Holdings Deutschland GmbH from 2006 to 2009. Mr. Polisson is an attorney and has a retired status with the Massachusetts and District of Columbia Bar Associations. | N/A |
Pamela Wheelock
(Born 1959) | Trustee,
since January
2020; previously
Trustee from
January 2018 to
July 2019 | Board member of the Destination Medical Center Economic Development Agency, Rochester, Minnesota since 2019. Interim President of the McKnight Foundation from January to September 2020. Acting Commissioner, Minnesota Department of Human Services, July 2019 through September 2019. Human Services Manager (part-time), Minnesota Department of Human Services, October 2019 through December 2019. Chief Operating Officer, Twin Cities Habitat for Humanity from 2017 to 2019. Vice President of University Services, University of Minnesota from 2012 to 2016. Prior thereto, on the Board of Directors, Governance Committee and Finance Committee for the Minnesota Philanthropy Partners (Saint Paul Foundation) from 2012 to 2018, Interim Chief Executive Officer of Blue Cross Blue Shield of Minnesota from 2011 to 2012, Chairman of the Board from 2009 to 2012 and Board Director from 2003 to 2015. Vice President, Leadership and Community Engagement, Bush Foundation, Saint Paul, Minnesota (a private foundation) from 2009 to 2011. Executive Vice President and Chief Financial Officer, Minnesota Sports and Entertainment from 2004 to 2009 and Senior Vice President from 2002 to 2004. Executive Vice President of the Minnesota Wild Foundation from 2004 to 2008. Commissioner of Finance, State of Minnesota, from 1999 to 2002. Currently Board Chair of the Minnesota Wild Foundation since 2010. | N/A |
* Length of service dates reflect the Trustee’s commencement of service with the Trust’s predecessor entities, where applicable.
Wells Fargo International Bond Fund | 31
Other information (unaudited)
Officers
Name and
year of birth | Position held and
length of service | Principal occupations during past five years or longer |
Andrew Owen
(Born 1960) | President,
since 2017 | Executive Vice President of Wells Fargo & Company and Head of Affiliated Managers, Wells Fargo Asset Management, since 2014. In addition, Mr. Owen is currently President, Chief Executive Officer and Director of Wells Fargo Funds Management, LLC since 2017. Prior thereto, Executive Vice President responsible for marketing, investments and product development for Wells Fargo Funds Management, LLC, from 2009 to 2014. |
Jeremy DePalma
(Born 1974) | Treasurer,
since 2012
(for certain funds in
the Fund Complex);
since 2021 (for
the remaining funds in the
Fund Complex) | Senior Vice President of Wells Fargo Funds Management, LLC since 2009. Senior Vice President of Evergreen Investment Management Company, LLC from 2008 to 2010 and head of the Fund Reporting and Control Team within Fund Administration from 2005 to 2010. |
Michelle Rhee
(Born 1966) | Chief Legal Officer,
since 2019 | Secretary of Wells Fargo Funds Management, LLC and Chief Legal Counsel of Wells Fargo Asset Management since 2018. Deputy General Counsel of Wells Fargo Bank, N.A. since 2020 and Assistant General Counsel of Wells Fargo Bank, N.A. from 2018 to 2020. Associate General Counsel and Managing Director of Bank of America Corporation from 2004 to 2018. |
Catherine Kennedy
(Born 1969) | Secretary,
since 2019 | Vice President of Wells Fargo Funds Management, LLC and Senior Counsel of the Wells Fargo Legal Department since 2010. Vice President and Senior Counsel of Evergreen Investment Management Company, LLC from 1998 to 2010. |
Michael H. Whitaker
(Born 1967) | Chief Compliance Officer,
since 2016 | Chief Compliance Officer of Wells Fargo Asset Management since 2016. Senior Vice President and Chief Compliance Officer for Fidelity Investments from 2007 to 2016. |
1 The Statement of Additional Information includes additional information about the Trustees and is available, without charge, upon request, by calling 1-800-222-8222 or by visiting the website at wfam.com.
32 | Wells Fargo International Bond Fund
For more information
More information about Wells Fargo Funds is available free upon request. To obtain literature, please write, visit the Fund's website, or call:
Wells Fargo Funds
P.O. Box 219967
Kansas City, MO 64121-9967
Website: wfam.com
Individual investors: 1-800-222-8222
Retail investment professionals: 1-888-877-9275
Institutional investment professionals: 1-866-765-0778
This report and the financial statements contained herein are submitted for the general information of the shareholders of the Fund. If this report is used for promotional purposes, distribution of the report must be accompanied or preceded by a current prospectus. Before investing, please consider the investment objectives, risks, charges, and expenses of the investment. For a current prospectus and, if available, a summary prospectus, containing this information, call 1-800-222-8222 or visit the Fund's website at wfam.com. Read the prospectus carefully before you invest or send money.
Wells Fargo Asset Management (WFAM) is the trade name for certain investment advisory/management firms owned by Wells Fargo & Company. These firms include but are not limited to Wells Capital Management Incorporated and Wells Fargo Funds Management, LLC. Certain products managed by WFAM entities are distributed by Wells Fargo Funds Distributor, LLC (a broker-dealer and Member FINRA).
This material is for general informational and educational purposes only and is NOT intended to provide investment advice or a recommendation of any kind - including a recommendation for any specific investment, strategy, or plan.
INVESTMENT PRODUCTS: NOT FDIC INSURED ■ NO BANK GUARANTEE ■ MAY LOSE VALUE
© 2021 Wells Fargo & Company. All rights reserved.
PAR-0421-00290 05-21
SA235/SAR235 03-21
Semi-Annual Report
March 31, 2021
Wells Fargo Income Plus Fund
Reduce clutter.
Save trees.
Sign up for electronic delivery of prospectuses and shareholder reports at wellsfargo.com/ advantagedelivery
The views expressed and any forward-looking statements are as of March 31, 2021, unless otherwise noted, and are those of the Fund's portfolio managers and/or Wells Fargo Asset Management. Discussions of individual securities or the markets generally are not intended as individual recommendations. Future events or results may vary significantly from those expressed in any forward-looking statements. The views expressed are subject to change at any time in response to changing circumstances in the market. Wells Fargo Asset Management and the Fund disclaim any obligation to publicly update or revise any views expressed or forward-looking statements.
INVESTMENT PRODUCTS: NOT FDIC INSURED ■ NO BANK GUARANTEE ■ MAY LOSE VALUE
Wells Fargo Income Plus Fund | 1
Letter to shareholders (unaudited)
Andrew Owen
President
Wells Fargo Funds
Dear Shareholder:
We are pleased to offer you this semi-annual report for the Wells Fargo Income Plus Fund for the six-month period that ended March 31, 2021. Despite a deeply challenging year, dominated by the spread of COVID-19 cases and a sharp drop in economic output throughout much of the world, global stocks performed extremely well, benefiting from ongoing central bank support and rising optimism over the development and distribution of effective COVID-19 vaccines. Bonds also had positive returns, led by global bonds and high-yield bonds.
For the six-month period, U.S. stocks, based on the S&P 500 Index,1 gained 19.07%. International stocks, as measured by the MSCI ACWI ex USA Index (Net),2 returned 21.10%, while the MSCI EM Index (Net),3 had even stronger performance, with a 22.43% gain. Among bond indexes, the Bloomberg Barclays U.S. Aggregate Bond Index,4 returned -2.73%, the Bloomberg Barclays Global Aggregate ex-USD Index (unhedged),5 returned -0.47%, and the Bloomberg Barclays Municipal Bond Index,6 returned 1.46% while the ICE BofA U.S. High Yield Index,7 gained 7.44%.
Hope drove the stock markets to new highs.
In October, capital markets stepped back from their six-month rally. Market volatility rose in advance of the U.S. election and amid a global increase in COVID-19 infections. Europe introduced tighter restrictions affecting economic activity. U.S. markets looked favorably at the prospect of Democratic control of the federal purse strings, which could lead to additional fiscal stimulus and a boost to economic activity. Meanwhile, China reported 4.9% third-quarter gross domestic product growth.
Global stocks rallied in November, propelled by optimism over three promising COVID-19 vaccines. Reversing recent trends, value stocks outperformed growth stocks and cyclical stocks outpaced information technology (IT) stocks. However, U.S. unemployment remained elevated, with a net job loss of 10 million since February. The eurozone services purchasing managers’ index contracted sharply while the region’s manufacturing activity grew. The U.S. election results added to the upbeat mood as investors anticipated more consistent policies in the new administration.
“Global stocks rallied in November, propelled by optimism over three promising COVID-19 vaccines.”
| 1 | The S&P 500 Index consists of 500 stocks chosen for market size, liquidity, and industry group representation. It is a market-value-weighted index with each stock's weight in the index proportionate to its market value. You cannot invest directly in an index. |
| 2 | The Morgan Stanley Capital International (MSCI) All Country World Index (ACWI) ex USA Index (Net) is a free-float-adjusted market-capitalization-weighted index that is designed to measure the equity market performance of developed and emerging markets, excluding the United States. Source: MSCI. MSCI makes no express or implied warranties or representations and shall have no liability whatsoever with respect to any MSCI data contained herein. The MSCI data may not be further redistributed or used as a basis for other indices or any securities or financial products. This report is not approved, reviewed, or produced by MSCI. You cannot invest directly in an index. |
| 1 | The S&P 500 Index consists of 500 stocks chosen for market size, liquidity, and industry group representation. It is a market-value-weighted index with each stock's weight in the index proportionate to its market value. You cannot invest directly in an index. |
| 3 | The MSCI Emerging Markets (EM) Index (Net) is a free-float-adjusted market-capitalization-weighted index that is designed to measure equity market performance of emerging markets. You cannot invest directly in an index. |
| 1 | The S&P 500 Index consists of 500 stocks chosen for market size, liquidity, and industry group representation. It is a market-value-weighted index with each stock's weight in the index proportionate to its market value. You cannot invest directly in an index. |
| 4 | The Bloomberg Barclays U.S. Aggregate Bond Index is a broad-based benchmark that measures the investment-grade, U.S. dollar-denominated, fixed-rate taxable bond market, including Treasuries, government-related and corporate securities, mortgage-backed securities (agency fixed-rate and hybrid adjustable-rate mortgage pass-throughs), asset-backed securities, and commercial mortgage-backed securities. You cannot invest directly in an index. |
| 1 | The S&P 500 Index consists of 500 stocks chosen for market size, liquidity, and industry group representation. It is a market-value-weighted index with each stock's weight in the index proportionate to its market value. You cannot invest directly in an index. |
| 5 | The Bloomberg Barclays Global Aggregate ex-USD Index (unhedged) is an unmanaged index that provides a broad-based measure of the global investment-grade fixed-income markets excluding the U.S. dollar-denominated debt market. You cannot invest directly in an index. |
| 1 | The S&P 500 Index consists of 500 stocks chosen for market size, liquidity, and industry group representation. It is a market-value-weighted index with each stock's weight in the index proportionate to its market value. You cannot invest directly in an index. |
| 6 | The Bloomberg Barclays Municipal Bond Index is an unmanaged index composed of long-term tax-exempt bonds with a minimum credit rating of Baa. You cannot invest directly in an index. |
| 1 | The S&P 500 Index consists of 500 stocks chosen for market size, liquidity, and industry group representation. It is a market-value-weighted index with each stock's weight in the index proportionate to its market value. You cannot invest directly in an index. |
| 7 | The ICE BofA U.S. High Yield Index is a market-capitalization-weighted index of domestic and Yankee high-yield bonds. The index tracks the performance of high-yield securities traded in the U.S. bond market. You cannot invest directly in an index. Copyright 2021. ICE Data Indices, LLC. All rights reserved. |
2 | Wells Fargo Income Plus Fund
Letter to shareholders (unaudited)
Financial markets ended the year with strength on high expectations for a rapid rollout of the COVID-19 vaccines, the successful passage of a $900 billion stimulus package, and rising expectations of additional economic support from a Democratic-led Congress. U.S. economic data were mixed with still-elevated unemployment and weak retail sales but growth in manufacturing output. In contrast, China’s economic expansion continued in both manufacturing and nonmanufacturing. U.S. COVID-19 infection rates continued to rise even as new state and local lockdown measures were implemented.
The year 2021 began with emerging market stocks leading all major asset classes in January, driven by China’s strong economic growth and a broad recovery in corporate earnings, which propelled China’s stock market higher. In the U.S., positive news on vaccine trials and January's expansion in both the manufacturing and services sectors were offset by a weak December monthly jobs report. This was compounded by technical factors as some hedge funds were forced to sell stocks to protect themselves against a well-publicized short squeeze coordinated by a group of retail investors. Eurozone sentiment and economic growth were particularly weak, reflecting the impact of a new lockdown with stricter social distancing along with a slow vaccine rollout.
February saw major domestic equity indexes driven higher on the hope of a new stimulus bill, improving COVID-19 vaccination numbers, and the gradual reopening of the economy. Most S&P 500 companies reported better-than-expected earnings, with positive surprises coming from the financials, IT, health care, and materials sectors. Japan saw its economy strengthen as a result of strong export numbers. Meanwhile, crude-oil prices continued their climb, rising more than 25% for the year. Domestic government bonds experienced a sharp sell-off in late February as markets priced in a more robust economic recovery and higher future growth and inflation expectations.
The passage of the massive domestic stimulus bill highlighted March activity, leading to increased forecasts for U.S. growth in 2021. Domestic employment surged as COVID-19 vaccinations and an increasingly open economy spurred hiring. A majority of U.S. small companies reported they are operating at pre-pandemic capacity or higher. Value continued its outperformance of growth in the month, continuing the trend that started in late 2020. Meanwhile, most major developed global equity indexes are up month to date on the back of rising optimism regarding the outlook for global growth. While the U.S. and the U.K. have been the most successful in terms of the vaccine rollout, even within markets where the vaccine has lagged, such as the eurozone and Japan, equity indexes in many of those countries are also in positive territory this year.
Don’t let short-term uncertainty derail long-term investment goals.
Periods of investment uncertainty can present challenges, but experience has taught us that maintaining long-term investment goals can be an effective way to plan for the future. To help you create a sound strategy based on your personal goals and risk tolerance, Wells Fargo Funds offers more than 100 mutual funds spanning a wide range of asset classes and investment styles. Although diversification cannot guarantee an investment profit or prevent losses, we believe it can be an effective way to manage investment risk and potentially smooth out overall portfolio performance. We encourage investors to know their investments and to understand that appropriate levels of risk-taking may unlock opportunities.
Thank you for choosing to invest with Wells Fargo Funds. We appreciate your confidence in us and remain committed to helping you meet your financial needs.
Sincerely,
Andrew Owen
President
Wells Fargo Funds
“The passage of the massive domestic stimulus bill highlighted March activity, leading to increased forecasts for U.S. growth in 2021.”
For further information about your Fund, contact your investment professional, visit our website at wfam.com, or call us directly at 1-800-222-8222.
Wells Fargo Income Plus Fund | 3
Letter to shareholders (unaudited)
Preparing for LIBOR Transition
The global financial industry is preparing to transition away from the London Interbank Offered Rate (LIBOR), a key benchmark interest rate, to new alternative rates. LIBOR underpins more than $350 trillion of financial contracts. It is the benchmark rate for a wide spectrum of products ranging from residential mortgages to corporate bonds to derivatives. Regulators have called for a market-wide transition away from LIBOR to successor reference rates by the end of 2021 (expected to be extended through June 30, 2023 for most tenors of the U.S. dollar LIBOR), which requires proactive steps be taken by issuers, counterparties, and asset managers to identify impacted products and adopt new reference rates.
The Fund holds at least one security that uses LIBOR as a floating reference rate and has a maturity date after December 31, 2021.
Although the transition process away from LIBOR has become increasingly well-defined in advance of the anticipated discontinuation date, there remains uncertainty regarding the nature of successor reference rates, and any potential effects of the transition away from LIBOR on investment instruments that use it as a benchmark rate. The transition process may result in, among other things, increased volatility or illiquidity in markets for instruments that currently rely on LIBOR and could negatively impact the value of certain instruments held by the Fund.
Wells Fargo Asset Management is monitoring LIBOR exposure closely and has put resources and controls in place to manage this transition effectively. The Fund’s portfolio management team is evaluating LIBOR holdings to understand what happens to those securities when LIBOR ceases to exist, including examining security documentation to identify the presence or absence of fallback language identifying a replacement rate to LIBOR.
While the pace of transition away from LIBOR will differ by asset class and investment strategy, the portfolio management team will monitor market conditions for those holdings to identify and mitigate deterioration or volatility in pricing and liquidity and ensure appropriate actions are taken in a timely manner.
Further information regarding the potential risks associated with the discontinuation of LIBOR can be found in the Fund’s Statement of Additional Information.
4 | Wells Fargo Income Plus Fund
This page is intentionally left blank.
Performance highlights (unaudited)
| Investment objective | The Fund seeks total return, consisting of a high level of current income and capital appreciation. |
| Manager | Wells Fargo Management, LLC |
| Subadviser | Wells Capital Management Incorporated |
| Portfolio managers | Christopher Kauffman, CFA®‡, Jay Mueller, CFA®‡, Janet Rilling, CFA®‡, Michael Schueeler, CFA®‡, Noah Wise, CFA®‡ |
| Average annual total returns (%) as of March 31, 2021 | |
| | | Including sales charge | | Excluding sales charge | | Expense ratios1 (%) |
| | Inception date | 1 year | 5 year | Since
inception | | 1 year | 5 year | Since
inception | | Gross | Net 2 |
| Class A (WSIAX) | 1-31-2013 | 14.21 | 4.60 | 2.49 | | 18.92 | 5.45 | 3.01 | | 1.10 | 0.92 |
| Class C (WSICX) | 1-31-2013 | 17.78 | 4.81 | 2.32 | | 18.78 | 4.81 | 2.32 | | 1.85 | 1.67 |
| Administrator Class (WSIDX) | 1-31-2013 | – | – | – | | 18.98 | 5.54 | 3.13 | | 1.04 | 0.77 |
| Institutional Class (WSINX) | 1-31-2013 | – | – | – | | 19.11 | 5.77 | 3.32 | | 0.77 | 0.62 |
| Bloomberg Barclays U.S. Aggregate Bond Index3 | – | – | – | – | | 0.71 | 3.10 | 2.89 * | | – | – |
| Bloomberg Barclays U.S. Universal Bond Index4 | – | – | – | – | | 2.95 | 3.59 | 3.20 * | | – | – |
| ICE BofA 3-Month LIBOR Constant Maturity Index5 | – | – | – | – | | 0.64 | 1.49 | 1.02 * | | – | – |
Figures quoted represent past performance, which is no guarantee of future results, and do not reflect taxes that a shareholder may pay on an investment in a fund. Investment return and principal value of an investment will fluctuate so that an investor’s shares, when redeemed, may be worth more or less than their original cost. Performance shown without sales charges would be lower if sales charges were reflected. Current performance may be lower or higher than the performance data quoted, which assumes the reinvestment of dividends and capital gains. Current month-end performance is available on the Fund’s website, wfam.com.
Index returns do not include transaction costs associated with buying and selling securities, any mutual fund fees or expenses, or any taxes. It is not possible to invest directly in an index.
For Class A shares, the maximum front-end sales charge is 4.00%. For Class C shares, the maximum contingent deferred sales charge is 1.00%. Performance including a contingent deferred sales charge assumes the sales charge for the corresponding time period. Administrator Class and Institutional Class shares are sold without a front-end sales charge or contingent deferred sales charge.
| * | Based on the inception date of the oldest Fund class. |
| 1 | Reflects the expense ratios as stated in the most recent prospectuses, which include the impact of 0.02% in acquired fund fees and expenses. The expense ratios shown are subject to change and may differ from the annualized expense ratios shown in the financial highlights of this report, which do not include acquired fund fees and expenses. |
| 2 | The manager has contractually committed through January 31, 2022, to waive fees and/or reimburse expenses to the extent necessary to cap total annual fund operating expenses after fee waivers at 0.90% for Class A, 1.65% for Class C, 0.75% for Administrator Class, and 0.60% for Institutional Class. Brokerage commissions, stamp duty fees, interest, taxes, acquired fund fees and expenses (if any), and extraordinary expenses are excluded from the expense caps. Prior to or after the commitment expiration date, the caps may be increased or the commitment to maintain the caps may be terminated only with the approval of the Board of Trustees. Without these caps, the Fund’s returns would have been lower. The expense ratio paid by an investor is the net expense ratio (the total annual fund operating expenses after fee waivers) as stated in the prospectuses. |
| 3 | The Bloomberg Barclays U.S. Aggregate Bond Index is a broad-based benchmark that measures the investment-grade, U.S. dollar–denominated, fixed-rate taxable bond market, including Treasuries, government-related and corporate securities, mortgage-backed securities (agency fixed-rate and hybrid adjustable-rate mortgage pass-throughs), asset-backed securities, and commercial mortgage-backed securities. You cannot invest directly in an index. |
| 4 | The Bloomberg Barclays U.S. Universal Bond Index is an unmanaged market-value-weighted performance benchmark for the U.S. dollar-denominated bond market, which includes investment-grade, high-yield, and emerging markets debt securities with maturities of one year or more. You cannot invest directly in an index. |
| 5 | The ICE BofA 3-Month LIBOR Constant Maturity Index is based on the assumed purchase of a synthetic instrument having three months to maturity and with a coupon equal to the closing quote for three-month LIBOR. That issue is sold the following day (priced at a yield equal to the current-day closing three-month LIBOR) and is rolled into a new three-month instrument. The index, therefore, will always have a constant maturity equal to exactly three months. You cannot invest directly in an index. Copyright 2021. ICE Data Indices, LLC. All rights reserved. |
| ‡ | CFA® and Chartered Financial Analyst® are trademarks owned by CFA Institute. |
6 | Wells Fargo Income Plus Fund
Performance highlights (unaudited)
Bond values fluctuate in response to the financial condition of individual issuers, general market and economic conditions, and changes in interest rates. Changes in market conditions and government policies may lead to periods of heightened volatility in the bond market and reduced liquidity for certain bonds held by the Fund. In general, when interest rates rise, bond values fall and investors may lose principal value. Interest rate changes and their impact on the Fund and its share price can be sudden and unpredictable. The use of derivatives may reduce returns and/or increase volatility. Securities issued by U.S. government agencies or government-sponsored entities may not be guaranteed by the U.S. Treasury. Certain investment strategies tend to increase the total risk of an investment (relative to the broader market). The Fund is exposed to mortgage- and asset-backed securities risk. The U.S. government guarantee applies to certain underlying securities and not to shares of the Fund. Consult the Fund’s prospectus for additional information on these and other risks.
Wells Fargo Income Plus Fund | 7
Performance highlights (unaudited)
| Ten largest holdings (%) as of March 31, 20211 |
| FNMA , 2.50%, 4-14-2051 | 9.93 |
| Xtrackers USD High Yield Corporate Bond ETF | 3.69 |
| U.S. Treasury Note, 0.13%, 1-15-2024 | 3.62 |
| GS Mortgage Security Trust Series 2018-LUAU Class B, 1.51%, 11-15-2032 | 1.16 |
| Longtrain Leasing III LLC Series 2015-1A Class A2, 4.06%, 1-15-2045 | 1.16 |
| Hertz Fleet Lease Funding LP Series 2019-1 Class E, 4.62%, 1-10-2033 | 1.15 |
| Ellington Financial Mortgage Trust Series 2019-1 Class M1, 3.59%, 6-25-2059 | 1.09 |
| VanEck Vectors JPMorgan Emerging Markets Local Currency Bond ETF | 1.00 |
| BCC Funding Corporation Series 2019-1A Class D, 3.94%, 7-20-2027 | 0.96 |
| Credit Agricole SA, 8.13%, 12-29-2049 | 0.88 |
| 1 | Figures represent the percentage of the Fund's net assets. Holdings are subject to change and may have changed since the date specified. |
| Portfolio composition as of March 31, 20211 |
| 1 | Figures represent the percentage of the Fund's long-term investments. These amounts are subject to change and may have changed since the date specified. |
8 | Wells Fargo Income Plus Fund
Fund expenses (unaudited)
As a shareholder of the Fund, you incur two types of costs: (1) transaction costs, including sales charges (loads) on purchase payments and contingent deferred sales charges (if any) on redemptions and (2) ongoing costs, including management fees, distribution (12b-1) and/or shareholder servicing fees, and other Fund expenses. This example is intended to help you understand your ongoing costs (in dollars) of investing in the Fund and to compare these costs with the ongoing costs of investing in other mutual funds.
The example is based on an investment of $1,000 invested at the beginning of the six-month period and held for the entire period from October 1, 2020 to March 31, 2021.
Actual expenses
The “Actual” line of the table below provides information about actual account values and actual expenses. You may use the information in this line, together with the amount you invested, to estimate the expenses that you paid over the period. Simply divide your account value by $1,000 (for example, an $8,600 account value divided by $1,000 = 8.6), then multiply the result by the number in the “Actual” line under the heading entitled “Expenses paid during period” for your applicable class of shares to estimate the expenses you paid on your account during this period.
Hypothetical example for comparison purposes
The “Hypothetical” line of the table below provides information about hypothetical account values and hypothetical expenses based on the Fund’s actual expense ratio and an assumed rate of return of 5% per year before expenses, which is not the Fund’s actual return. The hypothetical account values and expenses may not be used to estimate the actual ending account balance or expenses you paid for the period. You may use this information to compare the ongoing costs of investing in the Fund and other funds. To do so, compare this 5% hypothetical example with the 5% hypothetical examples that appear in the shareholder reports of the other funds.
Please note that the expenses shown in the table are meant to highlight your ongoing costs only and do not reflect any transactional costs, such as sales charges (loads) and contingent deferred sales charges. Therefore, the “Hypothetical” line of the table is useful in comparing ongoing costs only and will not help you determine the relative total costs of owning different funds. In addition, if these transactional costs were included, your costs would have been higher.
| | Beginning
account value
10-1-2020 | Ending
account value
3-31-2021 | Consolidated
expenses
paid during
the period1 | Annualized net
expense ratio |
| Class A | | | | |
| Actual | $1,000.00 | $1,058.45 | $4.62 | 0.90% |
| Hypothetical (5% return before expenses) | $1,000.00 | $1,020.44 | $4.53 | 0.90% |
| Class C | | | | |
| Actual | $1,000.00 | $1,054.36 | $8.45 | 1.65% |
| Hypothetical (5% return before expenses) | $1,000.00 | $1,016.70 | $8.30 | 1.65% |
| Administrator Class | | | | |
| Actual | $1,000.00 | $1,058.28 | $3.85 | 0.75% |
| Hypothetical (5% return before expenses) | $1,000.00 | $1,021.19 | $3.78 | 0.75% |
| Institutional Class | | | | |
| Actual | $1,000.00 | $1,059.18 | $3.08 | 0.60% |
| Hypothetical (5% return before expenses) | $1,000.00 | $1,021.94 | $3.02 | 0.60% |
1 Consolidated expenses paid is equal to the annualized net expense ratio of each class multiplied by the average account value over the period, multiplied by the number of days in the most recent fiscal half-year divided by the number of days in the fiscal year (to reflect the one-half-year period).
Wells Fargo Income Plus Fund | 9
Consolidated portfolio of investments—March 31, 2021 (unaudited)
| | | Interest
rate | Maturity
date | Principal | Value |
| Agency securities: 9.93% | | | | | | |
| FNMA %% | | 2.50% | 4-14-2051 | $ | 13,285,000 | $ 13,632,692 |
| Total Agency securities (Cost $13,685,625) | | | | | | 13,632,692 |
| Asset-backed securities: 4.50% | | | | | | |
| Avis Budget Rental Car Funding LLC Series 2017-1A Class C 144A | | 4.15 | 9-20-2023 | | 650,000 | 671,574 |
| Chesapeake Funding II LLC Series 2017-3A Class C 144A | | 2.78 | 8-15-2029 | | 800,000 | 802,085 |
| Chesapeake Funding II LLC Series 2017-3A Class D 144A | | 3.38 | 8-15-2029 | | 120,000 | 120,591 |
| Harley Marine Financing LLC Barge Series 2018-1A Class A2 144A | | 5.68 | 5-15-2043 | | 636,631 | 590,467 |
| Hertz Fleet Lease Funding LP Series 2019-1 Class E 144A | | 4.62 | 1-10-2033 | | 1,550,000 | 1,582,700 |
| Hertz Vehicle Financing LLC Series 2015-3A Class B 144A | | 3.71 | 9-25-2021 | | 750,000 | 749,602 |
| SMB Private Education Loan Trust Series 2015-C Class C 144A | | 4.50 | 9-17-2046 | | 290,000 | 310,051 |
| SoFi Consumer Loan Program Trust Series 2018-1 Class C 144A | | 3.97 | 2-25-2027 | | 700,000 | 721,721 |
| SoFi Consumer Loan Program Trust Series 2018-4 Class D 144A | | 4.76 | 11-26-2027 | | 300,000 | 313,027 |
| SoFi Professional Loan Program LLC Series 2017-E Class B 144A | | 3.49 | 11-26-2040 | | 300,000 | 310,637 |
| Total Asset-backed securities (Cost $6,089,399) | | | | | | 6,172,455 |
| | | | | Shares | |
| Common stocks: 0.42% | | | | | | |
| Energy: 0.42% | | | | | | |
| Oil, gas & consumable fuels: 0.42% | | | | | | |
| Denbury Incorporated † | | | | | 11,918 | 570,753 |
| Total Common stocks (Cost $388,252) | | | | | | 570,753 |
| | | | | Principal | |
| Corporate bonds and notes: 30.62% | | | | | | |
| Communication services: 2.92% | | | | | | |
| Diversified telecommunication services: 0.10% | | | | | | |
| Cablevision Lightpath LLC 144A | | 5.63 | 9-15-2028 | $ | 100,000 | 101,470 |
| Frontier Communications 144A | | 5.88 | 10-15-2027 | | 30,000 | 31,800 |
| | | | | | | 133,270 |
| Media: 2.82% | | | | | | |
| Block Communications Incorporated 144A | | 4.88 | 3-1-2028 | | 150,000 | 152,777 |
| CCO Holdings LLC 144A | | 4.50 | 8-15-2030 | | 175,000 | 178,360 |
| Cinemark USA Incorporated | | 4.88 | 6-1-2023 | | 500,000 | 496,975 |
| Cinemark USA Incorporated 144A | | 5.88 | 3-15-2026 | | 30,000 | 30,718 |
| Consolidated Communications 144A | | 6.50 | 10-1-2028 | | 105,000 | 113,414 |
| CSC Holdings LLC 144A | | 4.63 | 12-1-2030 | | 200,000 | 196,723 |
| Diamond Sports Group LLC 144A | | 5.38 | 8-15-2026 | | 200,000 | 144,000 |
| Diamond Sports Group LLC 144A | | 6.63 | 8-15-2027 | | 200,000 | 104,000 |
The accompanying notes are an integral part of these consolidated financial statements.
10 | Wells Fargo Income Plus Fund
Consolidated portfolio of investments—March 31, 2021 (unaudited)
| | | Interest
rate | Maturity
date | Principal | Value |
| Media (continued) | | | | | | |
| Gray Television Incorporated 144A | | 4.75% | 10-15-2030 | $ | 150,000 | $ 148,688 |
| Nexstar Broadcasting Incorporated 144A | | 4.75 | 11-1-2028 | | 160,000 | 161,686 |
| Nexstar Broadcasting Incorporated 144A | | 5.63 | 7-15-2027 | | 150,000 | 157,218 |
| Nielsen Finance LLC 144A | | 5.88 | 10-1-2030 | | 275,000 | 298,031 |
| Outfront Media Capital Corporation 144A | | 4.63 | 3-15-2030 | | 175,000 | 168,438 |
| QVC Incorporated | | 4.75 | 2-15-2027 | | 250,000 | 258,750 |
| Salem Media Group Incorporated 144A | | 6.75 | 6-1-2024 | | 175,000 | 172,375 |
| Scripps Escrow II Incorporated 144A | | 5.38 | 1-15-2031 | | 545,000 | 540,913 |
| Scripps Escrow II Incorporated 144A | | 5.88 | 7-15-2027 | | 125,000 | 129,375 |
| Townsquare Media Incorporated 144A | | 6.88 | 2-1-2026 | | 400,000 | 426,000 |
| | | | | | | 3,878,441 |
| Consumer discretionary: 3.69% | | | | | | |
| Auto components: 0.78% | | | | | | |
| Adient Global Holdings 144A | | 3.50 | 8-15-2024 | | 515,000 | 625,018 |
| Allison Transmission Incorporated 144A | | 4.75 | 10-1-2027 | | 225,000 | 239,130 |
| Clarios Global LP 144A | | 6.25 | 5-15-2026 | | 200,000 | 212,408 |
| | | | | | | 1,076,556 |
| Automobiles: 0.41% | | | | | | |
| Ford Motor Company | | 4.75 | 1-15-2043 | | 110,000 | 110,814 |
| Ford Motor Company | | 7.45 | 7-16-2031 | | 80,000 | 100,866 |
| Ford Motor Company | | 9.00 | 4-22-2025 | | 260,000 | 314,890 |
| Ford Motor Company | | 9.63 | 4-22-2030 | | 25,000 | 34,889 |
| | | | | | | 561,459 |
| Hotels, restaurants & leisure: 1.72% | | | | | | |
| Carnival Corporation 144A | | 5.75 | 3-1-2027 | | 80,000 | 82,100 |
| Carnival Corporation 144A | | 7.63 | 3-1-2026 | | 485,000 | 521,036 |
| Carnival Corporation 144A | | 11.50 | 4-1-2023 | | 200,000 | 229,250 |
| NCL Corporation Limited 144A | | 5.88 | 3-15-2026 | | 30,000 | 30,300 |
| NCL Corporation Limited 144A | | 12.25 | 5-15-2024 | | 400,000 | 484,552 |
| Royal Caribbean Cruises Limited | | 4.25 | 6-15-2023 | | 250,000 | 351,375 |
| Royal Caribbean Cruises Limited 144A | | 5.50 | 4-1-2028 | | 150,000 | 150,750 |
| Royal Caribbean Cruises Limited 144A | | 9.13 | 6-15-2023 | | 200,000 | 220,386 |
| Royal Caribbean Cruises Limited 144A | | 10.88 | 6-1-2023 | | 250,000 | 287,575 |
| | | | | | | 2,357,324 |
| Specialty retail: 0.78% | | | | | | |
| Asbury Automotive Group Incorporated | | 4.75 | 3-1-2030 | | 110,000 | 113,630 |
| Lithia Motors Incorporated 144A | | 4.63 | 12-15-2027 | | 200,000 | 207,750 |
| NMG Holding Company Incorporated 144A | | 7.13 | 4-1-2026 | | 500,000 | 510,000 |
| Rent-A-Center Incorporated 144A | | 6.38 | 2-15-2029 | | 30,000 | 31,800 |
| Sonic Automotive Incorporated | | 6.13 | 3-15-2027 | | 200,000 | 208,000 |
| | | | | | | 1,071,180 |
| Consumer staples: 0.73% | | | | | | |
| Food & staples retailing: 0.42% | | | | | | |
| PetSmart Incorporated 144A | | 4.75 | 2-15-2028 | | 35,000 | 35,795 |
The accompanying notes are an integral part of these consolidated financial statements.
Wells Fargo Income Plus Fund | 11
Consolidated portfolio of investments—March 31, 2021 (unaudited)
| | | Interest
rate | Maturity
date | Principal | Value |
| Food & staples retailing (continued) | | | | | | |
| PetSmart Incorporated 144A | | 7.75% | 2-15-2029 | $ | 35,000 | $ 37,886 |
| Walgreens Boots Alliance | | 4.10 | 4-15-2050 | | 500,000 | 506,808 |
| | | | | | | 580,489 |
| Food products: 0.31% | | | | | | |
| CHS Incorporated 144A | | 6.88 | 4-15-2029 | | 400,000 | 418,748 |
| Energy: 7.09% | | | | | | |
| Energy equipment & services: 0.96% | | | | | | |
| Bristow Group Incorporated 144A | | 6.88 | 3-1-2028 | | 500,000 | 498,380 |
| Hilcorp Energy Company 144A | | 5.75 | 2-1-2029 | | 55,000 | 55,481 |
| Hilcorp Energy Company 144A | | 6.00 | 2-1-2031 | | 55,000 | 55,825 |
| Oceaneering International Incorporated | | 6.00 | 2-1-2028 | | 150,000 | 143,501 |
| Pattern Energy Operations LP 144A | | 4.50 | 8-15-2028 | | 300,000 | 304,875 |
| USA Compression Partners LP | | 6.88 | 4-1-2026 | | 250,000 | 256,406 |
| | | | | | | 1,314,468 |
| Oil, gas & consumable fuels: 6.13% | | | | | | |
| Aethon United 144A | | 8.25 | 2-15-2026 | | 500,000 | 517,500 |
| Antero Resources Corporation | | 5.00 | 3-1-2025 | | 260,000 | 260,200 |
| Antero Resources Corporation 144A | | 8.38 | 7-15-2026 | | 35,000 | 38,587 |
| Apache Corporation | | 4.75 | 4-15-2043 | | 100,000 | 92,750 |
| Archrock Partners LP 144A | | 6.88 | 4-1-2027 | | 300,000 | 312,750 |
| Buckeye Partners LP | | 5.85 | 11-15-2043 | | 100,000 | 97,137 |
| Cheniere Energy Partners LP | | 5.63 | 10-1-2026 | | 200,000 | 209,140 |
| DCP Midstream Operating Company | | 5.13 | 5-15-2029 | | 500,000 | 531,725 |
| EnLink Midstream Partners LP | | 5.05 | 4-1-2045 | | 175,000 | 135,368 |
| EnLink Midstream Partners LP | | 5.45 | 6-1-2047 | | 362,000 | 291,996 |
| EnLink Midstream Partners LP 144A | | 5.63 | 1-15-2028 | | 30,000 | 29,009 |
| EQT Corporation | | 1.75 | 5-1-2026 | | 750,000 | 1,101,600 |
| Murphy Oil Corporation | | 5.75 | 8-15-2025 | | 155,000 | 154,969 |
| Murphy Oil Corporation | | 5.88 | 12-1-2027 | | 200,000 | 196,000 |
| Murphy Oil Corporation | | 6.38 | 7-15-2028 | | 30,000 | 30,022 |
| New Fortress Energy Incorporated 144A%% | | 6.50 | 9-30-2026 | | 220,000 | 221,650 |
| Occidental Petroleum Corporation | | 4.63 | 6-15-2045 | | 200,000 | 175,020 |
| Occidental Petroleum Corporation | | 6.20 | 3-15-2040 | | 50,000 | 51,375 |
| Occidental Petroleum Corporation | | 6.45 | 9-15-2036 | | 420,000 | 463,579 |
| Occidental Petroleum Corporation | | 6.60 | 3-15-2046 | | 25,000 | 26,628 |
| ONEOK Incorporated | | 7.15 | 1-15-2051 | | 500,000 | 674,150 |
| Range Resources Corporation 144A | | 8.25 | 1-15-2029 | | 35,000 | 37,450 |
| Range Resources Corporation | | 9.25 | 2-1-2026 | | 750,000 | 814,890 |
| Rockies Express Pipeline LLC 144A | | 6.88 | 4-15-2040 | | 375,000 | 405,000 |
| Southwestern Energy Company | | 7.75 | 10-1-2027 | | 225,000 | 240,469 |
| Sunoco Logistics Partner LP | | 5.40 | 10-1-2047 | | 750,000 | 809,844 |
| Tallgrass Energy Partners LP 144A | | 5.50 | 9-15-2024 | | 79,000 | 80,185 |
| Tallgrass Energy Partners LP 144A | | 6.00 | 12-31-2030 | | 165,000 | 163,103 |
| Western Midstream Operating LP | | 5.30 | 2-1-2030 | | 50,000 | 54,294 |
| Western Midstream Operating LP | | 5.30 | 3-1-2048 | | 175,000 | 175,620 |
| Western Midstream Operating LP | | 6.50 | 2-1-2050 | | 25,000 | 27,031 |
| | | | | | | 8,419,041 |
The accompanying notes are an integral part of these consolidated financial statements.
12 | Wells Fargo Income Plus Fund
Consolidated portfolio of investments—March 31, 2021 (unaudited)
| | | Interest
rate | Maturity
date | Principal | Value |
| Financials: 6.44% | | | | | | |
| Banks: 2.07% | | | | | | |
| Bank of America Corporation (3 Month LIBOR+4.55%) ± | | 6.30% | 12-29-2049 | $ | 265,000 | $ 304,750 |
| Citigroup Incorporated (5 Year Treasury Constant Maturity+3.42%) ʊ± | | 3.88 | 2-18-2026 | | 750,000 | 746,498 |
| JPMorgan Chase & Company (U.S. SOFR+3.13%) ʊ± | | 4.60 | 2-3-2025 | | 500,000 | 505,625 |
| JPMorgan Chase & Company (3 Month LIBOR+3.25%) ± | | 5.15 | 12-29-2049 | | 350,000 | 362,040 |
| JPMorgan Chase & Company (3 Month LIBOR+3.30%) ± | | 6.00 | 8-1-2023 | | 100,000 | 104,823 |
| PNC Financial Services (3 Month LIBOR+3.30%) ± | | 5.00 | 12-29-2049 | | 250,000 | 272,813 |
| Truist Financial Corporation (5 Year Treasury Constant Maturity+4.61%) ʊ± | | 4.95 | 9-2-2025 | | 500,000 | 541,875 |
| | | | | | | 2,838,424 |
| Capital markets: 0.75% | | | | | | |
| Bank of NY Mellon Corporation (5 Year Treasury Constant Maturity+4.36%) ʊ± | | 4.70 | 9-20-2025 | | 185,000 | 200,438 |
| Charles Schwab Corporation (5 Year Treasury Constant Maturity+4.97%) ʊ± | | 5.38 | 6-1-2025 | | 750,000 | 828,503 |
| | | | | | | 1,028,941 |
| Consumer finance: 1.33% | | | | | | |
| Ford Motor Credit Company LLC | | 4.39 | 1-8-2026 | | 175,000 | 183,937 |
| Ford Motor Credit Company LLC | | 5.11 | 5-3-2029 | | 275,000 | 295,199 |
| Ford Motor Credit Company LLC | | 5.13 | 6-16-2025 | | 25,000 | 27,000 |
| General Motors Financial Company (5 Year Treasury Constant Maturity+5.00%) ʊ± | | 5.70 | 9-30-2030 | | 500,000 | 540,000 |
| Hawaiian Brand Intellectual Property Limited 144A | | 5.75 | 1-20-2026 | | 500,000 | 531,300 |
| Springleaf Finance Corporation | | 6.63 | 1-15-2028 | | 225,000 | 254,995 |
| | | | | | | 1,832,431 |
| Insurance: 1.55% | | | | | | |
| Guardian Life Insurance Company 144A | | 4.85 | 1-24-2077 | | 200,000 | 232,352 |
| HUB International Limited 144A | | 7.00 | 5-1-2026 | | 75,000 | 77,881 |
| Markel Corporation (5 Year Treasury Constant Maturity+5.66%) ʊ± | | 6.00 | 6-1-2025 | | 1,000,000 | 1,087,500 |
| MetLife Incorporated | | 6.40 | 12-15-2066 | | 200,000 | 251,009 |
| OneAmerica Financial Partners Incorporated 144A | | 4.25 | 10-15-2050 | | 130,000 | 125,411 |
| Prudential Financial Incorporated (5 Year Treasury Constant Maturity+3.04%) ± | | 3.70 | 10-1-2050 | | 270,000 | 273,024 |
| USI Incorporated 144A | | 6.88 | 5-1-2025 | | 75,000 | 76,313 |
| | | | | | | 2,123,490 |
| Mortgage REITs: 0.56% | | | | | | |
| Blackstone Mortgage Trust | | 4.38 | 5-5-2022 | | 750,000 | 766,425 |
| Thrifts & mortgage finance: 0.18% | | | | | | |
| Ladder Capital Finance Holdings LP 144A | | 4.25 | 2-1-2027 | | 25,000 | 24,625 |
| Ladder Capital Finance Holdings LP 144A | | 5.25 | 3-15-2022 | | 25,000 | 25,188 |
| Ladder Capital Finance Holdings LP 144A | | 5.25 | 10-1-2025 | | 200,000 | 200,000 |
| | | | | | | 249,813 |
The accompanying notes are an integral part of these consolidated financial statements.
Wells Fargo Income Plus Fund | 13
Consolidated portfolio of investments—March 31, 2021 (unaudited)
| | | Interest
rate | Maturity
date | Principal | Value |
| Health care: 1.50% | | | | | | |
| Health care providers & services: 1.38% | | | | | | |
| AdaptHealth LLC 144A | | 4.63% | 8-1-2029 | $ | 45,000 | $ 44,784 |
| Community Health Systems Incorporated 144A | | 6.63 | 2-15-2025 | | 220,000 | 232,239 |
| Highmark Incorporated 144A | | 6.13 | 5-15-2041 | | 850,000 | 985,809 |
| MPT Operating Partnership LP | | 4.63 | 8-1-2029 | | 250,000 | 263,008 |
| Select Medical Corporation 144A | | 6.25 | 8-15-2026 | | 125,000 | 132,845 |
| Tenet Healthcare Corporation | | 5.13 | 5-1-2025 | | 125,000 | 126,756 |
| Vizient Incorporated 144A | | 6.25 | 5-15-2027 | | 105,000 | 111,431 |
| | | | | | | 1,896,872 |
| Pharmaceuticals: 0.12% | | | | | | |
| Bausch Health Companies Incorporated 144A | | 5.00 | 1-30-2028 | | 25,000 | 25,313 |
| Bausch Health Companies Incorporated 144A | | 6.25 | 2-15-2029 | | 125,000 | 132,870 |
| | | | | | | 158,183 |
| Industrials: 4.26% | | | | | | |
| Aerospace & defense: 0.36% | | | | | | |
| RBS Global & Rexnord LLC 144A | | 4.88 | 12-15-2025 | | 150,000 | 153,045 |
| Spirit AeroSystems Holdings Incorporated | | 4.60 | 6-15-2028 | | 350,000 | 343,000 |
| | | | | | | 496,045 |
| Airlines: 2.13% | | | | | | |
| Alaska Airlines 144A | | 4.80 | 2-15-2029 | | 177,749 | 194,604 |
| American Airlines Group Incorporated 144A | | 3.75 | 3-1-2025 | | 195,000 | 166,355 |
| American Airlines Group Incorporated 144A | | 5.50 | 4-20-2026 | | 195,000 | 202,933 |
| American Airlines Group Incorporated 144A | | 5.75 | 4-20-2029 | | 300,000 | 319,093 |
| Delta Air Lines Incorporated | | 3.75 | 10-28-2029 | | 345,000 | 336,386 |
| Delta Air Lines Incorporated 144A | | 4.50 | 10-20-2025 | | 400,000 | 426,959 |
| Delta Air Lines Incorporated 144A | | 4.75 | 10-20-2028 | | 150,000 | 163,109 |
| Mileage Plus Holdings LLC 144A | | 6.50 | 6-20-2027 | | 750,000 | 822,188 |
| United Airlines Pass-Through Trust Certificates Series 2020-1 Class A | | 5.88 | 4-15-2029 | | 263,473 | 292,110 |
| | | | | | | 2,923,737 |
| Commercial services & supplies: 0.31% | | | | | | |
| CoreCivic Incorporated « | | 4.63 | 5-1-2023 | | 225,000 | 221,625 |
| IAA Spinco Incorporated 144A | | 5.50 | 6-15-2027 | | 200,000 | 209,750 |
| | | | | | | 431,375 |
| Industrial conglomerates: 0.69% | | | | | | |
| General Electric Company (3 Month LIBOR+3.33%) ± | | 3.51 | 12-29-2049 | | 1,000,000 | 945,000 |
| Machinery: 0.20% | | | | | | |
| Stevens Holding Company Incorporated 144A | | 6.13 | 10-1-2026 | | 150,000 | 160,875 |
| Trimas Corporation 144A | | 4.88 | 10-15-2025 | | 110,000 | 112,728 |
| | | | | | | 273,603 |
| Road & rail: 0.14% | | | | | | |
| Uber Technologies Incorporated 144A | | 8.00 | 11-1-2026 | | 175,000 | 189,438 |
The accompanying notes are an integral part of these consolidated financial statements.
14 | Wells Fargo Income Plus Fund
Consolidated portfolio of investments—March 31, 2021 (unaudited)
| | | Interest
rate | Maturity
date | Principal | Value |
| Trading companies & distributors: 0.32% | | | | | | |
| Fortress Transportation & Infrastructure Investors LLC 144A | | 6.50% | 10-1-2025 | $ | 414,000 | $ 432,630 |
| Transportation infrastructure: 0.11% | | | | | | |
| Toll Road Investors Partnership II LP 144A¤ | | 0.00 | 2-15-2027 | | 200,000 | 156,201 |
| Information technology: 0.81% | | | | | | |
| Communications equipment: 0.17% | | | | | | |
| CommScope Incorporated 144A | | 8.25 | 3-1-2027 | | 225,000 | 240,750 |
| Software: 0.52% | | | | | | |
| Logan Merger Sub Incorporated 144A | | 5.50 | 9-1-2027 | | 300,000 | 314,064 |
| MPH Acquisition Holdings Company 144A« | | 5.75 | 11-1-2028 | | 220,000 | 214,500 |
| SS&C Technologies Incorporated 144A | | 5.50 | 9-30-2027 | | 175,000 | 186,384 |
| | | | | | | 714,948 |
| Technology hardware, storage & peripherals: 0.12% | | | | | | |
| NCR Corporation 144A | | 5.75 | 9-1-2027 | | 150,000 | 158,719 |
| Materials: 0.59% | | | | | | |
| Containers & packaging: 0.15% | | | | | | |
| Flex Acquisition Company Incorporated 144A | | 7.88 | 7-15-2026 | | 200,000 | 209,750 |
| Metals & mining: 0.42% | | | | | | |
| Arches Buyer Incorporated 144A | | 4.25 | 6-1-2028 | | 30,000 | 29,946 |
| Arches Buyer Incorporated 144A | | 6.13 | 12-1-2028 | | 80,000 | 82,400 |
| Cleveland Cliffs Incorporated | | 5.88 | 6-1-2027 | | 275,000 | 284,625 |
| Cleveland Cliffs Incorporated 144A | | 9.88 | 10-17-2025 | | 66,000 | 77,322 |
| Freeport-McMoRan Incorporated | | 4.13 | 3-1-2028 | | 100,000 | 105,120 |
| | | | | | | 579,413 |
| Paper & forest products: 0.02% | | | | | | |
| Clearwater Paper Corporation 144A | | 5.38 | 2-1-2025 | | 25,000 | 26,500 |
| Real estate: 1.38% | | | | | | |
| Equity REITs: 1.38% | | | | | | |
| GLP Capital LP | | 4.00 | 1-15-2031 | | 1,000,000 | 1,033,475 |
| Service Properties Trust Company | | 3.95 | 1-15-2028 | | 50,000 | 46,125 |
| Service Properties Trust Company | | 4.38 | 2-15-2030 | | 50,000 | 45,935 |
| Service Properties Trust Company | | 4.75 | 10-1-2026 | | 25,000 | 24,375 |
| Service Properties Trust Company | | 4.95 | 2-15-2027 | | 75,000 | 74,156 |
| Service Properties Trust Company | | 5.25 | 2-15-2026 | | 50,000 | 50,625 |
| Simon Property Group LP | | 3.80 | 7-15-2050 | | 120,000 | 121,124 |
| WEA Finance LLC 144A | | 4.75 | 9-17-2044 | | 500,000 | 507,882 |
| | | | | | | 1,903,697 |
| Utilities: 1.21% | | | | | | |
| Electric utilities: 1.08% | | | | | | |
| FirstEnergy Transmission Corporation 144A | | 2.87 | 9-15-2028 | | 500,000 | 504,053 |
| Oglethorpe Power Corporation | | 4.25 | 4-1-2046 | | 400,000 | 402,756 |
| PG&E Corporation | | 5.00 | 7-1-2028 | | 25,000 | 26,412 |
The accompanying notes are an integral part of these consolidated financial statements.
Wells Fargo Income Plus Fund | 15
Consolidated portfolio of investments—March 31, 2021 (unaudited)
| | | Interest
rate | Maturity
date | Principal | Value |
| Electric utilities (continued) | | | | | | |
| PG&E Corporation | | 5.25% | 7-1-2030 | $ | 25,000 | $ 26,500 |
| The Southern Company (5 Year Treasury Constant Maturity+3.73%) ± | | 4.00 | 1-15-2051 | | 500,000 | 527,625 |
| | | | | | | 1,487,346 |
Independent power & renewable electricity producers:
0.13% | | | | | | |
| NSG Holdings LLC 144A | | 7.75 | 12-15-2025 | | 61,622 | 65,628 |
| TerraForm Power Operating LLC 144A | | 4.75 | 1-15-2030 | | 100,000 | 103,831 |
| | | | | | | 169,459 |
| Total Corporate bonds and notes (Cost $39,034,271) | | | | | | 42,044,166 |
| | | | | Shares | |
| Exchange-traded funds: 6.36% | | | | | | |
| Invesco Taxable Municipal Bond ETF « | | | | | 30,600 | 980,118 |
| iShares Broad USD High Yield Corporate Bond ETF | | | | | 12,750 | 525,173 |
| SPDR Bloomberg Barclays High Yield Bond ETF « | | | | | 7,258 | 789,670 |
| VanEck Vectors JPMorgan Emerging Markets Local Currency Bond ETF | | | | | 44,700 | 1,371,396 |
| Xtrackers USD High Yield Corporate Bond ETF « | | | | | 101,500 | 5,073,985 |
| Total Exchange-traded funds (Cost $7,994,164) | | | | | | 8,740,342 |
| | | | | Principal | |
| Foreign corporate bonds and notes: 11.74% | | | | | | |
| Communication services: 0.69% | | | | | | |
| Media: 0.69% | | | | | | |
| Tele Columbus AG 144A | | 3.88 | 5-2-2025 | EUR | 510,000 | 607,048 |
| Ziggo Bond Company BV 144A | | 3.38 | 2-28-2030 | EUR | 300,000 | 346,533 |
| | | | | | | 953,581 |
| Consumer discretionary: 1.82% | | | | | | |
| Auto components: 0.67% | | | | | | |
| HP Pelzer Holding GmbH 144A | | 4.13 | 4-1-2024 | EUR | 800,000 | 914,331 |
| Automobiles: 0.45% | | | | | | |
| Peugeot SA Company | | 2.00 | 3-20-2025 | EUR | 500,000 | 622,705 |
| Diversified consumer services: 0.35% | | | | | | |
| Intertrust Group BV 144A | | 3.38 | 11-15-2025 | EUR | 400,000 | 480,807 |
| Hotels, restaurants & leisure: 0.35% | | | | | | |
| Accor SA | | 2.50 | 1-25-2024 | EUR | 400,000 | 485,403 |
| Consumer staples: 2.44% | | | | | | |
| Food & staples retailing: 0.64% | | | | | | |
| Casino Guichard Perracho SA | | 3.58 | 2-7-2025 | EUR | 400,000 | 457,925 |
| Tasty Bondco 1 SA 144A | | 6.25 | 5-15-2026 | EUR | 400,000 | 427,571 |
| | | | | | | 885,496 |
The accompanying notes are an integral part of these consolidated financial statements.
16 | Wells Fargo Income Plus Fund
Consolidated portfolio of investments—March 31, 2021 (unaudited)
| | | Interest
rate | Maturity
date | Principal | Value |
| Food products: 0.76% | | | | | | |
| Danone SA (EUR Swap Annual (vs. 6 Month EURIBOR) 5 Year +1.43%) ʊ± | | 1.75% | 3-27-2023 | EUR | 400,000 | $ 479,048 |
| Sigma Holdings Company BV 144A | | 5.75 | 5-15-2026 | EUR | 500,000 | 563,752 |
| | | | | | | 1,042,800 |
| Household products: 0.35% | | | | | | |
| Energizer Gamma Acquisition BV 144A | | 4.63 | 7-15-2026 | EUR | 400,000 | 481,637 |
| Tobacco: 0.69% | | | | | | |
| BAT International Finance plc | | 2.25 | 1-16-2030 | EUR | 750,000 | 946,193 |
| Energy: 0.81% | | | | | | |
| Oil, gas & consumable fuels: 0.81% | | | | | | |
| Eni SpA | | 1.13 | 9-19-2028 | EUR | 800,000 | 994,026 |
| Total SA (EUR Swap Annual (vs. 6 Month EURIBOR) 5 Year +3.78%) ± | | 3.88 | 12-29-2049 | EUR | 100,000 | 121,521 |
| | | | | | | 1,115,547 |
| Financials: 3.23% | | | | | | |
| Banks: 1.99% | | | | | | |
| Asian Development Bank | | 6.20 | 10-6-2026 | INR | 18,450,000 | 256,737 |
| Bankia SA (EUR Swap Annual (vs. 6 Month EURIBOR) 5 Year +5.82%) ʊ± | | 6.00 | 7-18-2022 | EUR | 600,000 | 735,283 |
| Caixa Geral de Depositos SA (EUR Swap Annual (vs. 6 Month EURIBOR) 5 Year +5.50%) ± | | 5.75 | 6-28-2028 | EUR | 400,000 | 512,489 |
| Caixa Geral de Depositos SA (EUR Swap Annual (vs. 6 Month EURIBOR) 5 Year +10.93%) ʊ± | | 10.75 | 3-30-2022 | EUR | 400,000 | 511,117 |
| Permanent TSB Group (EUR Swap Annual (vs. 6 Month EURIBOR) 1 Year +2.55%) ± | | 2.13 | 9-26-2024 | EUR | 600,000 | 710,466 |
| | | | | | | 2,726,092 |
| Capital markets: 0.46% | | | | | | |
| International Finance Corporation | | 6.30 | 11-25-2024 | INR | 45,000,000 | 631,790 |
| Diversified financial services: 0.43% | | | | | | |
| LKQ European Holdings BV Company 144A | | 3.63 | 4-1-2026 | EUR | 500,000 | 596,981 |
| Thrifts & mortgage finance: 0.35% | | | | | | |
| Deutsche Pfandbriefbank AG (EUR Swap Annual (vs. 6 Month EURIBOR) 5 Year +2.75%) ± | | 2.88 | 6-28-2027 | EUR | 400,000 | 473,771 |
| Health care: 0.69% | | | | | | |
| Pharmaceuticals: 0.69% | | | | | | |
| Takeda Pharmaceutical Company Limited | | 2.00 | 7-9-2040 | EUR | 750,000 | 940,393 |
| Industrials: 0.93% | | | | | | |
| Commercial services & supplies: 0.75% | | | | | | |
| Paprec Holding SA 144A | | 4.00 | 3-31-2025 | EUR | 450,000 | 534,691 |
| Prosegur Cash SA | | 1.38 | 2-4-2026 | EUR | 400,000 | 493,816 |
| | | | | | | 1,028,507 |
| Electrical equipment: 0.18% | | | | | | |
| Gamma Bidco SpA 144A | | 6.25 | 7-15-2025 | EUR | 200,000 | 244,367 |
The accompanying notes are an integral part of these consolidated financial statements.
Wells Fargo Income Plus Fund | 17
Consolidated portfolio of investments—March 31, 2021 (unaudited)
| | | Interest
rate | Maturity
date | Principal | Value |
| Real estate: 0.78% | | | | | | |
| Equity REITs: 0.33% | | | | | | |
| Unibail Rodamco SE (EUR Swap Annual (vs. 6 Month EURIBOR) 5 Year +1.68%) ʊ± | | 2.13% | 7-25-2023 | EUR | 400,000 | $ 452,409 |
| Real estate management & development: 0.45% | | | | | | |
| Akelius Residential Property AB (EURIBOR ICE Swap Rate 11:00am +3.49%) ± | | 3.88 | 10-5-2078 | EUR | 500,000 | 617,133 |
| Utilities: 0.35% | | | | | | |
| Multi-utilities: 0.35% | | | | | | |
| EP Infrastructure AS | | 1.66 | 4-26-2024 | EUR | 400,000 | 484,919 |
| Total Foreign corporate bonds and notes (Cost $15,135,783) | | | | | | 16,124,862 |
| Foreign government bonds: 5.23% | | | | | | |
| Brazil Government Bond ¤ | | 0.00 | 1-1-2024 | BRL | 7,000,000 | 1,011,695 |
| Brazil Government Bond | | 10.00 | 1-1-2023 | BRL | 2,765,000 | 529,286 |
| Colombia | | 7.00 | 5-4-2022 | COP | 2,000,000,000 | 572,555 |
| Indonesia | | 6.50 | 6-15-2025 | IDR | 13,500,000,000 | 950,828 |
| Malaysia Government Bond | | 3.88 | 3-14-2025 | MYR | 2,300,000 | 580,561 |
| Malaysia Government Bond | | 3.96 | 9-15-2025 | MYR | 2,300,000 | 584,305 |
| Mexico | | 6.50 | 6-9-2022 | MXN | 13,260,000 | 661,550 |
| Mexico | | 6.50 | 6-9-2022 | MXN | 7,600,000 | 379,169 |
| Republic of South Africa | | 8.75 | 2-28-2048 | ZAR | 9,100,000 | 483,114 |
| Romania | | 3.40 | 3-8-2022 | RON | 1,500,000 | 361,969 |
| Russia | | 6.50 | 2-28-2024 | RUB | 35,000,000 | 468,572 |
| Russia | | 7.00 | 12-15-2021 | RUB | 45,000,000 | 603,533 |
| Total Foreign government bonds (Cost $7,706,647) | | | | | | 7,187,137 |
| Loans: 2.33% | | | | | | |
| Communication services: 0.57% | | | | | | |
| Media: 0.57% | | | | | | |
| Charter Communications Operating LLC (1 Month LIBOR+1.75%) ± | | 1.86 | 4-30-2025 | $ | 487,406 | 486,133 |
| Clear Channel Outdoor Holdings (1 Month LIBOR+3.50%) <± | | 3.61 | 8-21-2026 | | 150,000 | 143,876 |
| Gray Television Incorporated (3 Month LIBOR+2.50%) ± | | 2.61 | 1-2-2026 | | 84,964 | 84,341 |
| Nexstar Broadcasting Incorporated (3 Month LIBOR+2.25%) ± | | 2.36 | 1-17-2024 | | 75,609 | 75,091 |
| | | | | | | 789,441 |
| Consumer discretionary: 0.20% | | | | | | |
| Distributors: 0.20% | | | | | | |
| Spin Holdco Incorporated (1 Month LIBOR+4.00%) ± | | 4.75 | 3-1-2028 | | 282,951 | 280,323 |
| Financials: 0.41% | | | | | | |
| Capital markets: 0.27% | | | | | | |
| Nexus Buyer LLC (1 Month LIBOR+3.75%) ± | | 3.93 | 11-9-2026 | | 198,000 | 196,887 |
| VFH Parent LLC (1 Month LIBOR+3.00%) ± | | 3.11 | 3-1-2026 | | 168,864 | 168,268 |
| | | | | | | 365,155 |
The accompanying notes are an integral part of these consolidated financial statements.
18 | Wells Fargo Income Plus Fund
Consolidated portfolio of investments—March 31, 2021 (unaudited)
| | | Interest
rate | Maturity
date | Principal | Value |
| Diversified financial services: 0.10% | | | | | | |
| Intelsat Jackson Holdings SA (1 Month LIBOR+3.75%) ± | | 8.00% | 11-27-2023 | $ | 140,332 | $ 142,437 |
| Insurance: 0.04% | | | | | | |
| HUB International Limited (1 Month LIBOR+3.25%) ± | | 4.00 | 4-25-2025 | | 24,750 | 24,715 |
| USI Incorporated (1 Month LIBOR+3.25%) ± | | 3.45 | 12-2-2026 | | 24,750 | 24,489 |
| | | | | | | 49,204 |
| Health care: 0.19% | | | | | | |
| Pharmaceuticals: 0.19% | | | | | | |
| Valeant Pharmaceuticals International Incorporated (3 Month LIBOR+3.00%) ± | | 3.10 | 6-2-2025 | | 263,364 | 262,366 |
| Industrials: 0.60% | | | | | | |
| Airlines: 0.25% | | | | | | |
| Mileage Plus Holdings LLC (1 Month LIBOR+5.25%) ± | | 6.25 | 6-21-2027 | | 325,000 | 344,958 |
| Commercial services & supplies: 0.02% | | | | | | |
| KAR Auction Services Incorporated (1 Month LIBOR+2.25%) ± | | 2.38 | 9-19-2026 | | 22,429 | 21,953 |
| Industrial conglomerates: 0.22% | | | | | | |
| Werner Finco LP (3 Month LIBOR+4.00%) ‡<± | | 5.00 | 7-24-2024 | | 309,199 | 306,880 |
| Machinery: 0.11% | | | | | | |
| Columbus McKinnon Corporation (3 Month LIBOR+2.50%) ౠ| | 3.50 | 1-31-2024 | | 145,465 | 144,466 |
| Information technology: 0.04% | | | | | | |
| Software: 0.04% | | | | | | |
| Emerald Topco Incorporated (1 Month LIBOR+3.50%) ± | | 3.71 | 7-24-2026 | | 49,250 | 48,782 |
| Materials: 0.32% | | | | | | |
| Containers & packaging: 0.14% | | | | | | |
| RING Container Technologies (3 Month LIBOR+2.75%) ± | | 2.85 | 10-31-2024 | | 198,309 | 196,161 |
| Paper & forest products: 0.18% | | | | | | |
| Vertical US Newco Incorporated (1 Month LIBOR+4.25%) ± | | 4.47 | 7-30-2027 | | 249,375 | 249,749 |
| Total Loans (Cost $3,201,734) | | | | | | 3,201,875 |
| Municipal obligations: 0.26% | | | | | | |
| Illinois: 0.07% | | | | | | |
| GO revenue: 0.07% | | | | | | |
| Chicago IL Refunding Bonds Taxable Project Series E | | 6.05 | 1-1-2029 | | 90,000 | 98,611 |
| Kansas: 0.05% | | | | | | |
| Health revenue: 0.05% | | | | | | |
| Kansas Development Finance Authority Village Shalom Project Series 2018-B | | 4.00 | 11-15-2025 | | 60,000 | 60,199 |
The accompanying notes are an integral part of these consolidated financial statements.
Wells Fargo Income Plus Fund | 19
Consolidated portfolio of investments—March 31, 2021 (unaudited)
| | | Interest
rate | Maturity
date | Principal | Value |
| Maryland: 0.07% | | | | | | |
| Education revenue: 0.07% | | | | | | |
| Maryland Health & HEFAR Green Street Academy Series B 144A | | 6.75% | 7-1-2023 | $ | 100,000 | $ 100,330 |
| Pennsylvania: 0.07% | | | | | | |
| Health revenue: 0.07% | | | | | | |
| Quakertown PA General Authority U.S. Department of Agriculture Loan Anticipation Notes Series 2017-B | | 3.80 | 7-1-2021 | | 100,000 | 99,951 |
| Total Municipal obligations (Cost $346,276) | | | | | | 359,091 |
| Non-agency mortgage-backed securities: 12.63% | | | | | | |
| AFN LLC Series 2019-1A Class A2 144A | | 4.46 | 5-20-2049 | | 700,000 | 724,540 |
| ALM Loan Funding Series 2016-18A Class A2R (3 Month LIBOR+1.65%)144A± | | 1.89 | 1-15-2028 | | 600,000 | 600,084 |
| Aqua Finance Trust Series 2019-A Class A 144A | | 3.14 | 7-16-2040 | | 309,437 | 317,534 |
| BB-UBS Trust Series 2012-TFT Class C 144A±± | | 3.47 | 6-5-2030 | | 150,000 | 96,981 |
| BCC Funding Corporation Series 2019-1A Class D 144A | | 3.94 | 7-20-2027 | | 1,300,000 | 1,313,267 |
| Bojangles Issuer LLC Series 2020-1A Class A2 144A | | 3.83 | 10-20-2050 | | 705,000 | 736,013 |
| BX Trust Series 2019-11 Class D 144A±± | | 4.08 | 12-9-2041 | | 500,000 | 519,332 |
| CFCRE Commercial Mortgage Trust Series 2016-C7 Class AM | | 4.16 | 12-10-2054 | | 400,000 | 442,706 |
| CIFC Funding Limited Series 2018-1A Class B (3 Month LIBOR+1.40%)144A± | | 1.62 | 4-18-2031 | | 1,000,000 | 1,000,002 |
| CLI Funding LLC Series 2019-1A Class B 144A | | 4.64 | 5-18-2044 | | 490,020 | 487,989 |
| Coinstar Funding LLC Series 2017-1A Class A2 144A | | 5.22 | 4-25-2047 | | 1,073,188 | 1,076,708 |
| CommonBond Student Loan Trust Series 2018-CGS Class C 144A | | 4.35 | 2-25-2046 | | 144,098 | 147,465 |
| Consumer Lending Receivables LLC Series 2019-A Class A 144A | | 3.52 | 4-15-2026 | | 28,220 | 28,247 |
| Consumer Loan Underlying Bond Credit Trust Series 2018-P2 Class B 144A | | 4.10 | 10-15-2025 | | 264,272 | 265,567 |
| Deephaven Residential Mortgage Trust Series 2019-3A Class B1 144A±± | | 4.26 | 7-25-2059 | | 500,000 | 497,724 |
| DRB Prime Student Loan Trust Series 2017-C Class C 144A | | 3.29 | 11-25-2042 | | 295,202 | 303,802 |
| Driven Brands Funding LLC Series 2019-2A Class A2 144A | | 3.98 | 10-20-2049 | | 345,625 | 358,285 |
| Ellington Financial Mortgage Trust Series 2019-1 Class M1 144A±± | | 3.59 | 6-25-2059 | | 1,500,000 | 1,503,683 |
| Foundation Finance Trust Series 2019-1A Class A 144A | | 3.86 | 11-15-2034 | | 470,301 | 486,693 |
| FREMF Mortgage Trust Series 2017-K724 Class B 144A±± | | 3.48 | 11-25-2023 | | 400,000 | 424,061 |
| FREMF Mortgage Trust Series 2020-KF76 Class B (1 Month LIBOR+2.75%)144A± | | 2.87 | 1-25-2030 | | 410,000 | 408,800 |
| GS Mortgage Security Trust Series 2018-LUAU Class B (1 Month LIBOR+1.40%)144A± | | 1.51 | 11-15-2032 | | 1,600,000 | 1,596,964 |
| Longtrain Leasing III LLC Series 2015-1A Class A2 144A | | 4.06 | 1-15-2045 | | 1,568,304 | 1,587,510 |
| OneMain Financial Issuance Trust Series 2019-1A Class D 144A | | 4.22 | 2-14-2031 | | 1,100,000 | 1,132,968 |
| Oxford Finance Funding Trust Series 2019-1A Class A2 144A | | 4.46 | 2-15-2027 | | 800,000 | 828,513 |
The accompanying notes are an integral part of these consolidated financial statements.
20 | Wells Fargo Income Plus Fund
Consolidated portfolio of investments—March 31, 2021 (unaudited)
| | | Interest
rate | Maturity
date | Principal | Value |
| Non-agency mortgage-backed securities (continued) | | | | | | |
| Store Master Funding LLC Series 2014-1A Class A2 144A | | 5.00% | 4-20-2044 | $ | 96,583 | $ 100,329 |
| Wingstop Funding LLC Series 2020-1A Class A2 144A | | 2.84 | 12-5-2050 | | 360,000 | 364,583 |
| Total Non-agency mortgage-backed securities (Cost $17,134,020) | | | | | | 17,350,350 |
| U.S. Treasury securities: 3.62% | | | | | | |
| U.S. Treasury Note | | 0.13 | 1-15-2024 | | 5,000,000 | 4,975,000 |
| Total U.S. Treasury securities (Cost $4,992,836) | | | | | | 4,975,000 |
| Yankee corporate bonds and notes: 9.40% | | | | | | |
| Consumer discretionary: 0.33% | | | | | | |
| Internet & direct marketing retail: 0.33% | | | | | | |
| Prosus NV 144A | | 4.03 | 8-3-2050 | | 500,000 | 454,772 |
| Energy: 1.69% | | | | | | |
| Oil, gas & consumable fuels: 1.69% | | | | | | |
| Baytex Energy Corporation 144A | | 5.63 | 6-1-2024 | | 425,000 | 399,500 |
| BP Capital Markets plc (5 Year Treasury Constant Maturity+4.40%) ʊ± | | 4.88 | 3-22-2030 | | 325,000 | 348,155 |
| Comision Federal de Electricidad 144A | | 4.75 | 2-23-2027 | | 250,000 | 274,250 |
| Enbrige Incorporated (5 Year Treasury Constant Maturity+5.31%) ± | | 5.75 | 7-15-2080 | | 1,000,000 | 1,070,000 |
| Northriver Midstream Finance LP 144A | | 5.63 | 2-15-2026 | | 220,000 | 228,690 |
| | | | | | | 2,320,595 |
| Financials: 6.74% | | | | | | |
| Banks: 4.35% | | | | | | |
| Banco de Bogota SA 144A | | 6.25 | 5-12-2026 | | 400,000 | 448,800 |
| Banco General SA 144A | | 4.13 | 8-7-2027 | | 300,000 | 319,878 |
| Banco Internacional del Peru 144A | | 3.25 | 10-4-2026 | | 525,000 | 542,719 |
| Credit Agricole SA (USD Swap Semi Annual (vs. 3 Month LIBOR) 5 Year+6.19%) 144A± | | 8.13 | 12-29-2049 | | 1,000,000 | 1,205,000 |
| Deutsche Bank AG (USD ICE Swap Rate 11:00am NY 5 Year+2.55%) ± | | 4.88 | 12-1-2032 | | 500,000 | 533,445 |
| Intesa Sanpaolo SpA 144A | | 5.71 | 1-15-2026 | | 635,000 | 711,702 |
| Itau Unibanco Holding SA 144A | | 3.25 | 1-24-2025 | | 800,000 | 814,344 |
| Royal Bank Scotland Group plc (5 Year Treasury Constant Maturity+5.63%) ʊ± | | 6.00 | 12-29-2025 | | 700,000 | 768,040 |
| Unicredit SpA (5 Year Treasury Constant Maturity+4.75%) 144A± | | 5.46 | 6-30-2035 | | 600,000 | 635,962 |
| | | | | | | 5,979,890 |
| Capital markets: 0.37% | | | | | | |
| Credit Suisse Group AG (5 Year Treasury Constant Maturity+4.89%) 144Aʊ± | | 5.25 | 2-11-2027 | | 500,000 | 505,000 |
| Consumer finance: 0.37% | | | | | | |
| Credito Real SAB de CV 144A« | | 8.00 | 1-21-2028 | | 300,000 | 303,466 |
| Unifin Financiera SAB de CV 144A | | 9.88 | 1-28-2029 | | 200,000 | 205,724 |
| | | | | | | 509,190 |
The accompanying notes are an integral part of these consolidated financial statements.
Wells Fargo Income Plus Fund | 21
Consolidated portfolio of investments—March 31, 2021 (unaudited)
| | | Interest
rate | Maturity
date | Principal | Value |
| Diversified financial services: 0.14% | | | | | | |
| DAE Funding LLC 144A | | 3.38% | 3-20-2028 | $ | 200,000 | $ 198,420 |
| Insurance: 1.31% | | | | | | |
| Fairfax Financial Holdings Limited | | 4.63 | 4-29-2030 | | 1,000,000 | 1,091,394 |
| Swiss Re Finance (Luxembourg) SA (5 Year Treasury Constant Maturity+3.58%) 144A± | | 5.00 | 4-2-2049 | | 400,000 | 453,000 |
| Validus Holdings Limited | | 8.88 | 1-26-2040 | | 160,000 | 248,594 |
| | | | | | | 1,792,988 |
| Thrifts & mortgage finance: 0.20% | | | | | | |
| Nationwide Building Society (USD ICE Swap Rate 11:00am NY 5 Year+1.85%) 144A± | | 4.13 | 10-18-2032 | | 250,000 | 269,684 |
| Health care: 0.43% | | | | | | |
| Pharmaceuticals: 0.43% | | | | | | |
| Bausch Health Companies Incorporated 144A | | 5.25 | 1-30-2030 | | 100,000 | 100,520 |
| Bausch Health Companies Incorporated 144A | | 6.13 | 4-15-2025 | | 225,000 | 230,670 |
| Endo Luxembourg Finance Company SARL 144A | | 6.13 | 4-1-2029 | | 30,000 | 30,263 |
| Teva Pharmaceutical Finance Netherlands III BV « | | 6.75 | 3-1-2028 | | 200,000 | 224,700 |
| | | | | | | 586,153 |
| Industrials: 0.21% | | | | | | |
| Aerospace & defense: 0.21% | | | | | | |
| Bombardier Incorporated 144A | | 7.88 | 4-15-2027 | | 300,000 | 294,207 |
| Total Yankee corporate bonds and notes (Cost $12,263,863) | | | | | | 12,910,899 |
| Yankee government bonds: 2.15% | | | | | | |
| Commonwealth of Bahamas | | 6.00 | 11-21-2028 | | 200,000 | 190,952 |
| Dominican Republic 144A | | 4.50 | 1-30-2030 | | 200,000 | 202,000 |
| Dominican Republic 144A | | 4.88 | 9-23-2032 | | 200,000 | 204,000 |
| Mongolia Government | | 5.63 | 5-1-2023 | | 200,000 | 208,966 |
| Provincia de Cordoba 144A | | 3.00 | 12-10-2025 | | 254,472 | 173,680 |
| Provincia de Cordoba 144A | | 3.00 | 2-1-2029 | | 557,619 | 315,060 |
| Provincia de Santa Fe | | 7.00 | 3-23-2023 | | 350,000 | 276,504 |
| Republic of Angola | | 9.50 | 11-12-2025 | | 400,000 | 418,000 |
| Republic of Rwanda | | 6.63 | 5-2-2023 | | 200,000 | 208,574 |
| Republic of Sri Lanka | | 5.75 | 1-18-2022 | | 200,000 | 174,204 |
| Republic of Turkey | | 5.88 | 6-26-2031 | | 300,000 | 270,744 |
| Sultanate of Oman 144A | | 6.25 | 1-25-2031 | | 300,000 | 313,500 |
| Total Yankee government bonds (Cost $3,154,493) | | | | | | 2,956,184 |
The accompanying notes are an integral part of these consolidated financial statements.
22 | Wells Fargo Income Plus Fund
Consolidated portfolio of investments—March 31, 2021 (unaudited)
| | | Yield | | | Shares | Value |
| Short-term investments: 13.20% | | | | | | |
| Investment companies: 13.20% | | | | | | |
| Securities Lending Cash Investments LLC ♠∩∞ | | 0.04% | | | 7,219,970 | $ 7,219,970 |
| Wells Fargo Government Money Market Fund Select Class ♠∞*## | | 0.03 | | | 10,901,557 | 10,901,557 |
| Total Short-term investments (Cost $18,121,527) | | | | | | 18,121,527 |
| Total investments in securities (Cost $149,248,890) | 112.39% | | | | | 154,347,333 |
| Other assets and liabilities, net | (12.39) | | | | | (17,015,718) |
| Total net assets | 100.00% | | | | | $137,331,615 |
| 144A | The security may be resold in transactions exempt from registration, normally to qualified institutional buyers, pursuant to Rule 144A under the Securities Act of 1933. |
| † | Non-income-earning security |
| ± | Variable rate investment. The rate shown is the rate in effect at period end. |
| ¤ | The security is issued in zero coupon form with no periodic interest payments. |
| < | All or a portion of the position represents an unfunded loan commitment. The rate represents current interest rate if the loan is partially funded. |
| ‡ | Security is valued using significant unobservable inputs. |
| ±± | The coupon of the security is adjusted based on the principal and interest payments received from the underlying pool of mortgages as well as the credit quality and the actual prepayment speed of the underlying mortgages. |
| * | A portion of the holding represents an investment held in Strategic Income Special Investment (Cayman) Ltd., the consolidated entity. |
| ## | All or a portion of this security is segregated for when-issued and/or unfunded loans. |
| « | All or a portion of this security is on loan. |
| ♠ | The issuer of the security is an affiliated person of the Fund as defined in the Investment Company Act of 1940. |
| ∩ | The investment is a non-registered investment company purchased with cash collateral received from securities on loan. |
| ∞ | The rate represents the 7-day annualized yield at period end. |
| %% | The security is purchased on a when-issued basis. |
| ʊ | Security is perpetual in nature and has no stated maturity date. The date shown reflects the next call date. |
| Abbreviations: |
| BRL | Brazilian real |
| COP | Colombian peso |
| EUR | Euro |
| EURIBOR | Euro Interbank Offered Rate |
| FNMA | Federal National Mortgage Association |
| GO | General obligation |
| HEFAR | Higher Education Facilities Authority Revenue |
| IDR | Indonesian rupiah |
| INR | Indian rupee |
| LIBOR | London Interbank Offered Rate |
| MXN | Mexican peso |
| MYR | Malaysian ringgit |
| REIT | Real estate investment trust |
| RON | Romanian lei |
| RUB | Russian ruble |
| SOFR | Secured Overnight Financing Rate |
| ZAR | South African rand |
The accompanying notes are an integral part of these consolidated financial statements.
Wells Fargo Income Plus Fund | 23
Consolidated portfolio of investments—March 31, 2021 (unaudited)
Investments in affiliates
An affiliated investment is an investment in which the Fund owns at least 5% of the outstanding voting shares of the issuer or as a result of other relationships, such as the Fund and the issuer having the same investment manager. Transactions with issuers that were either affiliated persons of the Fund at the beginning of the period or the end of the period were as follows:
| | Value,
beginning of
period | Purchases | Sales
proceeds | Net
realized
gains
(losses) | | Net
change in
unrealized
gains
(losses) | | Value,
end of
period | | % of
net
assets | Shares,
end
of period | Income
from
affiliated
securities |
| Short-term investments | | | | | | | | | | | | |
| Investment companies | | | | | | | | | | | | |
| Securities Lending Cash Investments LLC | $4,723,600 | $67,220,008 | $(64,723,638) | $0 | | $0 | | $ 7,219,970 | | | 7,219,970 | $ 8,819# |
| Wells Fargo Government Money Market Fund Select Class* | 6,620,735 | 38,690,658 | (34,409,836) | 0 | | 0 | | 10,901,557 | | | 10,901,557 | 750 |
| | | | | $0 | | $0 | | $18,121,527 | | 13.20% | | $9,569 |
| # | Amount shown represents income before fees and rebates. |
| * | A portion of the holding represents an investment held in Strategic Income Special Investment (Cayman) Ltd., the consolidated entity. |
Forward foreign currency contracts
Currency to be
received | Currency to be
delivered | Counterparty | Settlement
date | Unrealized
gains | | Unrealized
losses |
| 1,100,000 AUD | 713,734 EUR | Citibank NA | 6-30-2021 | $ 0 | | $ (17,409) |
| 1,100,000 CAD | 738,928 EUR | Citibank NA | 6-30-2021 | 0 | | (6,453) |
| 2,150,000,000 COP | 604,051 USD | Morgan Stanley Company Incorporated | 4-9-2021 | 0 | | (16,916) |
| 625,182 USD | 2,150,000,000 COP | Morgan Stanley Company Incorporated | 4-9-2021 | 38,047 | | 0 |
| 601,012 USD | 2,150,000,000 COP | Morgan Stanley Company Incorporated | 7-9-2021 | 15,589 | | 0 |
| 1,100,000 AUD | 713,734 EUR | Citibank NA | 6-30-2021 | 14,705 | | 0 |
| 1,100,000 CAD | 738,928 EUR | Citibank NA | 6-30-2021 | 13,761 | | 0 |
| 18,556,096 USD | 15,535,000 EUR | Citibank NA | 6-30-2021 | 305,226 | | 0 |
| 7,950,000,000 IRD | 551,356 USD | Morgan Stanley Company Incorporated | 4-9-2021 | 0 | | (4,185) |
| 553,718 USD | 7,950,000,000 IRD | Morgan Stanley Company Incorporated | 4-9-2021 | 6,547 | | 0 |
| 543,070 USD | 7,950,000,000 IRD | Morgan Stanley Company Incorporated | 7-9-2021 | 0 | | (466) |
| 1,026,067 USD | 21,410,000 MXN | Citibank NA | 6-30-2021 | 0 | | (11,721) |
| 37,500,000 RUB | 515,596 USD | Morgan Stanley Company Incorporated | 4-9-2021 | 0 | | (20,042) |
| 507,897 USD | 37,500,000 RUB | Morgan Stanley Company Incorporated | 4-9-2021 | 12,344 | | 0 |
| 509,986 USD | 37,500,000 RUB | Morgan Stanley Company Incorporated | 7-9-2021 | 20,181 | | 0 |
| 850,458 USD | 12,795,000 ZAR | Citibank NA | 6-30-2021 | 0 | | (6,755) |
| | | | | $426,400 | | $(83,947) |
The accompanying notes are an integral part of these consolidated financial statements.
24 | Wells Fargo Income Plus Fund
Consolidated portfolio of investments—March 31, 2021 (unaudited)
Futures contracts
| Description | Number of
contracts | Expiration
date | Notional
cost | Notional
value | Unrealized
gains | | Unrealized
losses |
| Long | | | | | | | |
| 10-Year Ultra Futures | 35 | 6-21-2021 | $ 5,210,505 | $ 5,029,063 | $ 0 | | $ (181,442) |
| 5-Year U.S. Treasury Notes | 9 | 6-30-2021 | 1,125,014 | 1,110,586 | 0 | | (14,428) |
| Short | | | | | | | |
| Euro-Bund Futures | (85) | 6-8-2021 | (17,054,026) | (17,073,105) | 0 | | (19,079) |
| 10-Year U.S. Treasury Notes | (59) | 6-21-2021 | (7,895,901) | (7,725,313) | 170,588 | | 0 |
| U.S. Ultra Bond | (17) | 6-21-2021 | (3,177,228) | (3,080,719) | 96,509 | | 0 |
| | | | | | $267,097 | | $(214,949) |
Centrally cleared credit default swap contracts
| Reference index | Fixed rate
received | Payment
frequency | Maturity
date | Notional
amount | Value | Premiums
paid
(received) | Unrealized
gains | | Unrealized
losses |
| Sell Protection | | | | | | | | | | |
| Markit CDX North American High Yield Index * | 1.00% | Quarterly | 12-20-2025 | EUR | 4,000,000 | $ 11,058 | $ (38,304) | $ 49,362 | | $ 0 |
| Markit CDX North American High Yield Index * | 1.00 | Quarterly | 12-20-2025 | USD | 8,000,000 | (724,651) | (686,222) | 0 | | (38,429) |
| Markit iTraxx Europe Crossover Index * | 1.00 | Quarterly | 6-20-2025 | EUR | 8,000,000 | 68,189 | (295,845) | 364,034 | | 0 |
| Markit iTraxx Europe Subordinated Financial Index * | 1.00 | Quarterly | 6-20-2025 | EUR | 3,000,000 | 391,729 | (31,891) | 423,620 | | 0 |
| | | | | | | | | $837,016 | | $(38,429) |
| * | Represents an investment held in Strategic Income Special Investment (Cayman) Ltd., the consolidated entity. |
The accompanying notes are an integral part of these consolidated financial statements.
Wells Fargo Income Plus Fund | 25
Consolidated statement of assets and liabilities—March 31, 2021 (unaudited)
| | |
| Assets | |
Investments in unaffiliated securities (including $7,061,202 of securities loaned), at value (cost $131,127,363)
| $ 136,225,806 |
Investments in affiliated securites, at value (cost $18,121,527)
| 18,121,527 |
Cash
| 85,729 |
Cash at broker segregated for futures contracts
| 1,462,207 |
Cash at broker segregated for swap contracts
| 937,098 |
Foreign currency, at value (cost $586,439)
| 636,976 |
Receivable for interest
| 1,165,624 |
Unrealized gains on forward foreign currency contracts
| 426,400 |
Receivable for investments sold
| 426,052 |
Receivable for Fund shares sold
| 70,130 |
Receivable for securities lending income, net
| 2,636 |
Prepaid expenses and other assets
| 68,763 |
Total assets
| 159,628,948 |
| Liabilities | |
Payable for when-issued transactions
| 13,697,619 |
Payable upon receipt of securities loaned
| 7,219,970 |
Payable for investments purchased
| 675,424 |
Cash collateral due to broker for forward foreign currency contracts
| 460,000 |
Unrealized losses on forward foreign currency contracts
| 83,947 |
Management fee payable
| 42,155 |
Payable for daily variation margin on centrally cleared swap contracts
| 31,245 |
Payable for Fund shares redeemed
| 12,112 |
Administration fees payable
| 9,532 |
Trustees’ fees and expenses payable
| 2,984 |
Payable for daily variation margin on open futures contracts
| 2,395 |
Distribution fee payable
| 628 |
Accrued expenses and other liabilities
| 59,322 |
Total liabilities
| 22,297,333 |
Total net assets
| $137,331,615 |
| Net assets consist of | |
Paid-in capital
| $ 128,081,269 |
Total distributable earnings
| 9,250,346 |
Total net assets
| $137,331,615 |
| Computation of net asset value and offering price per share | |
Net assets – Class A
| $ 1,844,982 |
Shares outstanding – Class A1
| 183,827 |
Net asset value per share – Class A
| $10.04 |
Maximum offering price per share – Class A2
| $10.46 |
Net assets – Class C
| $ 1,045,361 |
Shares outstanding – Class C1
| 103,744 |
Net asset value per share – Class C
| $10.08 |
Net assets – Administrator Class
| $ 144,716 |
Shares outstanding – Administrator Class1
| 14,313 |
Net asset value per share – Administrator Class
| $10.11 |
Net assets – Institutional Class
| $ 134,296,556 |
Shares outstanding – Institutional Class1
| 13,404,642 |
Net asset value per share – Institutional Class
| $10.02 |
| 1 | The Fund has an unlimited number of authorized shares |
| 2 | Maximum offering price is computed as 100/96 of net asset value. On investments of $50,000 or more, the offering price is reduced. |
The accompanying notes are an integral part of these consolidated financial statements.
26 | Wells Fargo Income Plus Fund
Consolidated statement of operations— six months ended March 31, 2021 (unaudited)
| | |
| Investment income | |
Interest (net of foreign withholding taxes of $7,312)
| $ 2,822,428 |
Dividends
| 249,129 |
Income from affiliated securities
| 9,569 |
Total investment income
| 3,081,126 |
| Expenses | |
Management fee
| 382,497 |
| Administration fees | |
Class A
| 1,292 |
Class C
| 584 |
Administrator Class
| 38 |
Institutional Class
| 57,317 |
| Shareholder servicing fees | |
Class A
| 2,018 |
Class C
| 913 |
Administrator Class
| 95 |
| Distribution fee | |
Class C
| 2,736 |
Custody and accounting fees
| 21,767 |
Professional fees
| 27,712 |
Registration fees
| 27,723 |
Shareholder report expenses
| 14,655 |
Trustees’ fees and expenses
| 9,609 |
Other fees and expenses
| 6,988 |
Total expenses
| 555,944 |
| Less: Fee waivers and/or expense reimbursements | |
Fund-level
| (112,491) |
Class A
| (29) |
Class C
| (1) |
Net expenses
| 443,423 |
Net investment income
| 2,637,703 |
| Realized and unrealized gains (losses) on investments | |
| Net realized gains (losses) on | |
Unaffiliated securities
| 2,164,935 |
Forward foreign currency contracts
| (147,476) |
Futures contracts
| 524,100 |
Swap contracts
| 667,044 |
Net realized gains on investments
| 3,208,603 |
| Net change in unrealized gains (losses) on | |
Unaffiliated securities
| 2,498,725 |
Forward foreign currency contracts
| 83,527 |
Futures contracts
| 191,367 |
Swap contracts
| (47,020) |
Net change in unrealized gains (losses) on investments
| 2,726,599 |
Net realized and unrealized gains (losses) on investments
| 5,935,202 |
Net increase in net assets resulting from operations
| $8,572,905 |
The accompanying notes are an integral part of these consolidated financial statements.
Wells Fargo Income Plus Fund | 27
Consolidated statement of changes in net assets
| | |
| | Six months ended
March 31, 2021
(unaudited) | Year ended
September 30, 2020 |
| Operations | | | | |
Net investment income
| | $ 2,637,703 | | $ 5,542,707 |
Payment from affiliate
| | 0 | | 4,844 |
Net realized gains on investments
| | 3,208,603 | | 661,045 |
Net change in unrealized gains (losses) on investments
| | 2,726,599 | | 1,116,077 |
Net increase in net assets resulting from operations
| | 8,572,905 | | 7,324,673 |
| Distributions to shareholders from | | | | |
| Net investment income and net realized gains | | | | |
Class A
| | (25,933) | | (39,988) |
Class C
| | (9,122) | | (14,146) |
Administrator Class
| | (1,163) | | (1,190) |
Institutional Class
| | (2,549,477) | | (5,017,004) |
Total distributions to shareholders
| | (2,585,695) | | (5,071,328) |
| Capital share transactions | Shares | | Shares | |
| Proceeds from shares sold | | | | |
Class A
| 100,235 | 1,001,629 | 150,512 | 1,444,612 |
Class C
| 56,305 | 568,352 | 29,426 | 280,500 |
Administrator Class
| 11,144 | 112,532 | 657 | 6,322 |
Institutional Class
| 2,355,176 | 22,934,429 | 3,895,449 | 36,532,793 |
| | | 24,616,942 | | 38,264,227 |
| Reinvestment of distributions | | | | |
Class A
| 2,584 | 25,696 | 4,067 | 38,988 |
Class C
| 911 | 9,122 | 1,475 | 14,146 |
Administrator Class
| 98 | 988 | 91 | 872 |
Institutional Class
| 247,786 | 2,458,143 | 495,225 | 4,735,565 |
| | | 2,493,949 | | 4,789,571 |
| Payment for shares redeemed | | | | |
Class A
| (91,414) | (905,520) | (128,840) | (1,233,596) |
Class C
| (20,291) | (198,072) | (18,931) | (178,945) |
Administrator Class
| (1,048) | (10,514) | (4,466) | (42,955) |
Institutional Class
| (4,749,547) | (46,723,816) | (4,996,793) | (47,183,521) |
| | | (47,837,922) | | (48,639,017) |
Net decrease in net assets resulting from capital share transactions
| | (20,727,031) | | (5,585,219) |
Total decrease in net assets
| | (14,739,821) | | (3,331,874) |
| Net assets | | | | |
Beginning of period
| | 152,071,436 | | 155,403,310 |
End of period
| | $137,331,615 | | $152,071,436 |
The accompanying notes are an integral part of these consolidated financial statements.
28 | Wells Fargo Income Plus Fund
Consolidated financial highlights
(For a share outstanding throughout each period)
| | | Year ended September 30 | |
| Class A | Six months ended
March 31, 2021
(unaudited) | 2020 | 2019 | 2018 | 2017 | 2016 1 | Year ended
October 31, 2015 |
Net asset value, beginning of period
| $9.64 | $9.50 | $9.43 | $9.59 | $9.25 | $9.13 | $9.72 |
Net investment income
| 0.16 2 | 0.29 | 0.34 2 | 0.31 2 | 0.33 2 | 0.31 | 0.34 |
Net realized and unrealized gains (losses) on investments
| 0.40 | 0.14 | 0.09 | (0.16) | 0.22 | (0.01) | (0.69) |
Total from investment operations
| 0.56 | 0.43 | 0.43 | 0.15 | 0.55 | 0.30 | (0.35) |
| Distributions to shareholders from | | | | | | | |
Net investment income
| (0.16) | (0.29) | (0.36) | (0.31) | (0.21) | (0.13) | (0.22) |
Tax basis return of capital
| 0.00 | 0.00 | 0.00 | 0.00 | 0.00 | (0.05) | (0.02) |
Total distributions to shareholders
| (0.16) | (0.29) | (0.36) | (0.31) | (0.21) | (0.18) | 0.24 |
Net asset value, end of period
| $10.04 | $9.64 | $9.50 | $9.43 | $9.59 | $9.25 | $9.13 |
Total return3
| 5.85% | 4.60% | 4.66% | 1.59% | 6.05% | 3.34% | (3.64)% |
| Ratios to average net assets (annualized) | | | | | | | |
Gross expenses
| 1.09% | 1.08% | 1.09% | 1.45% | 1.78% | 1.80% | 1.63% |
Net expenses
| 0.90% | 0.90% | 0.90% | 0.90% | 0.90% | 0.90% | 0.90% |
Net investment income
| 3.35% | 3.43% | 3.65% | 3.26% | 3.47% | 3.85% | 3.77% |
| Supplemental data | | | | | | | |
Portfolio turnover rate
| 52% | 88% | 116% | 50% | 65% | 52% | 53% |
Net assets, end of period (000s omitted)
| $1,845 | $1,662 | $1,394 | $1,266 | $896 | $1,047 | $928 |
| 1 | For the eleven months ended September 30, 2016. The Fund changed its fiscal year end from October 31 to September 30, effective September 30, 2016. |
| 2 | Calculated based upon average shares outstanding |
| 3 | Total return calculations do not include any sales charges. Returns for periods of less than one year are not annualized. |
The accompanying notes are an integral part of these consolidated financial statements.
Wells Fargo Income Plus Fund | 29
Consolidated financial highlights
(For a share outstanding throughout each period)
| | | Year ended September 30 | |
| Class C | Six months ended
March 31, 2021
(unaudited) | 2020 | 2019 | 2018 | 2017 | 2016 1 | Year ended
October 31, 2015 |
Net asset value, beginning of period
| $9.68 | $9.49 | $9.41 | $9.57 | $9.22 | $9.10 | $9.71 |
Net investment income
| 0.11 | 0.23 | 0.27 | 0.23 | 0.29 | 0.25 | 0.28 |
Payment from affiliate
| 0.00 | 0.07 | 0.00 | 0.00 | 0.00 | 0.00 | 0.00 |
Net realized and unrealized gains (losses) on investments
| 0.41 | 0.12 | 0.10 | (0.15) | 0.18 | (0.02) | (0.68) |
Total from investment operations
| 0.52 | 0.42 | 0.37 | 0.08 | 0.47 | 0.23 | (0.40) |
| Distributions to shareholders from | | | | | | | |
Net investment income
| (0.12) | (0.23) | (0.29) | (0.24) | (0.12) | (0.08) | (0.19) |
Tax basis return of capital
| 0.00 | 0.00 | 0.00 | 0.00 | 0.00 | (0.03) | (0.02) |
Total distributions to shareholders
| (0.12) | (0.23) | (0.29) | (0.24) | (0.12) | (0.11) | (0.21) |
Net asset value, end of period
| $10.08 | $9.68 | $9.49 | $9.41 | $9.57 | $9.22 | $9.10 |
Total return2
| 5.44% | 4.45% 3 | 4.00% | 0.88% | 5.20% | 2.67% | (4.35)% |
| Ratios to average net assets (annualized) | | | | | | | |
Gross expenses
| 1.84% | 1.83% | 1.84% | 2.20% | 2.59% | 2.54% | 2.37% |
Net expenses
| 1.65% | 1.65% | 1.65% | 1.65% | 1.65% | 1.65% | 1.65% |
Net investment income
| 2.52% | 2.67% | 2.92% | 2.52% | 2.80% | 3.10% | 3.02% |
| Supplemental data | | | | | | | |
Portfolio turnover rate
| 52% | 88% | 116% | 50% | 65% | 52% | 53% |
Net assets, end of period (000s omitted)
| $1,045 | $647 | $520 | $517 | $403 | $766 | $711 |
| 1 | For the eleven months ended September 30, 2016. The Fund changed its fiscal year end from October 31 to September 30, effective September 30, 2016. |
| 2 | Total return calculations do not include any sales charges. Returns for periods of less than one year are not annualized. |
| 3 | During the year ended September 30, 2020, the Fund received a payment from an affiliate which had a 0.79% impact on the total return. See Note 5 in the Notes to Consolidated Financial Statements for additional information. |
The accompanying notes are an integral part of these consolidated financial statements.
30 | Wells Fargo Income Plus Fund
Consolidated financial highlights
(For a share outstanding throughout each period)
| | | Year ended September 30 | |
| Administrator Class | Six months ended
March 31, 2021
(unaudited) | 2020 | 2019 | 2018 | 2017 | 2016 1 | Year ended
October 31, 2015 |
Net asset value, beginning of period
| $9.71 | $9.56 | $9.46 | $9.61 | $9.29 | $9.16 | $9.74 |
Net investment income
| 0.17 2 | 0.34 2 | 0.36 2 | 0.33 2 | 0.34 2 | 0.33 2 | 0.37 |
Net realized and unrealized gains (losses) on investments
| 0.39 | 0.11 | 0.09 | (0.16) | 0.20 | (0.01) | (0.70) |
Total from investment operations
| 0.56 | 0.45 | 0.45 | 0.17 | 0.54 | 0.32 | (0.33) |
| Distributions to shareholders from | | | | | | | |
Net investment income
| (0.16) | (0.30) | (0.35) | (0.32) | (0.22) | (0.14) | (0.22) |
Tax basis return of capital
| 0.00 | 0.00 | 0.00 | 0.00 | 0.00 | (0.05) | (0.03) |
Total distributions to shareholders
| (0.16) | (0.30) | (0.35) | (0.32) | (0.22) | (0.19) | (0.25) |
Net asset value, end of period
| $10.11 | $9.71 | $9.56 | $9.46 | $9.61 | $9.29 | $9.16 |
Total return3
| 5.83% | 4.72% | 4.83% | 1.81% | 5.91% | 3.52% | (3.51)% |
| Ratios to average net assets (annualized) | | | | | | | |
Gross expenses
| 1.03% | 1.02% | 1.08% | 1.38% | 1.72% | 1.74% | 1.56% |
Net expenses
| 0.75% | 0.75% | 0.75% | 0.75% | 0.75% | 0.75% | 0.75% |
Net investment income
| 3.41% | 3.61% | 3.80% | 3.48% | 3.64% | 4.00% | 3.92% |
| Supplemental data | | | | | | | |
Portfolio turnover rate
| 52% | 88% | 116% | 50% | 65% | 52% | 53% |
Net assets, end of period (000s omitted)
| $145 | $40 | $75 | $5,471 | $562 | $597 | $496 |
| 1 | For the eleven months ended September 30, 2016. The Fund changed its fiscal year end from October 31 to September 30, effective September 30, 2016. |
| 2 | Calculated based upon average shares outstanding |
| 3 | Returns for periods of less than one year are not annualized. |
The accompanying notes are an integral part of these consolidated financial statements.
Wells Fargo Income Plus Fund | 31
Consolidated financial highlights
(For a share outstanding throughout each period)
| | | Year ended September 30 | |
| Institutional Class | Six months ended
March 31, 2021
(unaudited) | 2020 | 2019 | 2018 | 2017 | 2016 1 | Year ended
October 31, 2015 |
Net asset value, beginning of period
| $9.63 | $9.49 | $9.42 | $9.58 | $9.24 | $9.14 | $9.71 |
Net investment income
| 0.18 | 0.36 | 0.37 2 | 0.34 | 0.35 2 | 0.34 | 0.40 |
Net realized and unrealized gains (losses) on investments
| 0.39 | 0.10 | 0.09 | (0.16) | 0.24 | (0.02) | (0.71) |
Total from investment operations
| 0.57 | 0.46 | 0.46 | 0.18 | 0.59 | 0.32 | (0.31) |
| Distributions to shareholders from | | | | | | | |
Net investment income
| (0.18) | (0.32) | (0.39) | (0.34) | (0.25) | (0.16) | (0.23) |
Tax basis return of capital
| 0.00 | 0.00 | 0.00 | 0.00 | 0.00 | (0.06) | (0.03) |
Total distributions to shareholders
| (0.18) | (0.32) | (0.39) | (0.34) | (0.25) | (0.22) | (0.26) |
Net asset value, end of period
| $10.02 | $9.63 | $9.49 | $9.42 | $9.58 | $9.24 | $9.14 |
Total return3
| 5.92% | 4.96% | 5.00% | 1.93% | 6.430% | 3.55% | (3.28)% |
| Ratios to average net assets (annualized) | | | | | | | |
Gross expenses
| 0.75% | 0.75% | 0.75% | 1.12% | 1.40% | 1.46% | 1.19% |
Net expenses
| 0.60% | 0.60% | 0.60% | 0.60% | 0.60% | 0.60% | 0.60% |
Net investment income
| 3.63% | 3.72% | 3.97% | 3.54% | 3.71% | 4.16% | 4.04% |
| Supplemental data | | | | | | | |
Portfolio turnover rate
| 52% | 88% | 116% | 50% | 65% | 52% | 53% |
Net assets, end of period (000s omitted)
| $134,297 | $149,722 | $153,414 | $45,175 | $45,862 | $23,190 | $17,564 |
| 1 | For the eleven months ended September 30, 2016. The Fund changed its fiscal year end from October 31 to September 30, effective September 30, 2016. |
| 2 | Calculated based upon average shares outstanding |
| 3 | Returns for periods of less than one year are not annualized. |
The accompanying notes are an integral part of these consolidated financial statements.
32 | Wells Fargo Income Plus Fund
Notes to consolidated financial statements (unaudited)
1. ORGANIZATION
Wells Fargo Funds Trust (the "Trust"), a Delaware statutory trust organized on March 10, 1999, is an open-end management investment company registered under the Investment Company Act of 1940, as amended (the "1940 Act"). As an investment company, the Trust follows the accounting and reporting guidance in Financial Accounting Standards Board (“FASB”) Accounting Standards Codification Topic 946, Financial Services – Investment Companies. These consolidated financial statements report on the Wells Fargo Income Plus Fund (the "Fund") which is a diversified series of the Trust.
On February 23, 2021, Wells Fargo & Company announced that it has entered into a definitive agreement to sell Wells Fargo Asset Management ("WFAM") to GTCR LLC and Reverence Capital Partners, L.P. WFAM is the trade name used by the asset management businesses of Wells Fargo & Company and includes Wells Fargo Funds Management, LLC, the investment manager to the Fund, Wells Capital Management Incorporated and Wells Fargo Asset Management (International) Limited, both registered investment advisers providing sub-advisory services to certain funds, and Wells Fargo Funds Distributor, LLC, the Fund's principal underwriter. As part of the transaction, Wells Fargo & Company will own a 9.9% equity interest and will continue to serve as an important client and distribution partner. The transaction is expected to close in the second half of 2021, subject to customary closing conditions.
Consummation of the transaction will result in the automatic termination of the Fund's investment management agreement and sub-advisory agreement. The Fund's Board of Trustees will be asked to approve new investment management arrangements with the new company. If approved by the Board, the new investment management arrangements with the new company will be presented to the shareholders of the Fund for approval, and, if approved by shareholders, would take effect upon the closing of the transaction. The transaction is expected to close in the second half of 2021, subject to customary closing conditions.
2. INVESTMENT IN SUBSIDIARY
The Fund invests in Strategic Income Special Investment (Cayman) Ltd. (the “Subsidiary”), a wholly-owned subsidiary incorporated on July 11, 2019 under the laws of the Cayman Islands as an exempted segregated portfolio company with limited liability. As of March 31, 2021, the Subsidiary had $6,656,635 invested in swap contracts and cash equivalents and had $1,210,898 in cash segregated at the broker for the swap contracts which in the aggregate represented 100.17% of its net assets. The Fund is the sole shareholder of the Subsidiary. As of March 31, 2021, the Fund held $7,854,149 in the Subsidiary, representing 5.72% of the Fund’s net assets prior to consolidation.
The consolidated financial statements of the Fund include the financial results of its wholly-owned subsidiary. The Consolidated Portfolio of Investments includes positions of the Fund and the Subsidiary and the consolidated financial statements include the accounts of the Fund and the Subsidiary. Accordingly, all interfund balances and transactions between the Fund and the Subsidiary have been eliminated in consolidation.
3. SIGNIFICANT ACCOUNTING POLICIES
The following significant accounting policies, which are consistently followed in the preparation of the consolidated financial statements of the Fund, are in conformity with U.S. generally accepted accounting principles which require management to make estimates and assumptions that affect the reported amounts of assets and liabilities, disclosure of contingent assets and liabilities at the date of the consolidated financial statements, and the reported amounts of income and expenses during the reporting period. Actual results could differ from those estimates.
Securities valuation
All investments are valued each business day as of the close of regular trading on the New York Stock Exchange (generally 4 p.m. Eastern Time), although the Fund may deviate from this calculation time under unusual or unexpected circumstances.
Debt securities are valued at the evaluated bid price provided by an independent pricing service (e.g. taking into account various factors, including yields, maturities, or credit ratings) or, if a reliable price is not available, the quoted bid price from an independent broker-dealer.
Equity securities and futures contracts that are listed on a foreign or domestic exchange or market are valued at the official closing price or, if none, the last sales price. If no sale occurs on the principal exchange or market that day, a fair value price will be determined in accordance with the Fund’s Valuation Procedures.
The values of securities denominated in foreign currencies are translated into U.S. dollars at rates provided by an independent foreign currency pricing source at a time each business day specified by the Wells Fargo Asset Management Pricing Committee at Wells Fargo Funds Management, LLC ("Funds Management").
Wells Fargo Income Plus Fund | 33
Notes to consolidated financial statements (unaudited)
Forward foreign currency contracts are recorded at the forward rate provided by an independent foreign currency pricing source at a time each business day specified by the Wells Fargo Asset Management Pricing Committee.
Swap contracts are valued at the evaluated price provided by an independent pricing service or, if a reliable price is not available, the quoted bid price from an independent broker-dealer.
Investments in registered open-end investment companies are valued at net asset value. Interests in non-registered investment companies that are redeemable at net asset value are fair valued normally at net asset value.
Investments which are not valued using any of the methods discussed above are valued at their fair value, as determined in good faith by the Board of Trustees. The Board of Trustees has established a Valuation Committee comprised of the Trustees and has delegated to it the authority to take any actions regarding the valuation of portfolio securities that the Valuation Committee deems necessary or appropriate, including determining the fair value of portfolio securities, unless the determination has been delegated to the Wells Fargo Asset Management Pricing Committee. The Board of Trustees retains the authority to make or ratify any valuation decisions or approve any changes to the Valuation Procedures as it deems appropriate. On a quarterly basis, the Board of Trustees receives reports on any valuation actions taken by the Valuation Committee or the Wells Fargo Asset Management Pricing Committee which may include items for ratification.
Foreign currency translation
The accounting records of the Fund are maintained in U.S. dollars. The values of other assets and liabilities denominated in foreign currencies are translated into U.S. dollars at rates provided by an independent foreign currency pricing source at a time each business day specified by the Wells Fargo Asset Management Pricing Committee. Purchases and sales of securities, and income and expenses are converted at the rate of exchange on the respective dates of such transactions. Net realized foreign exchange gains or losses arise from sales of foreign currencies, currency gains or losses realized between the trade and settlement dates on securities transactions, and the difference between the amounts of dividends, interest and foreign withholding taxes recorded and the U.S. dollar equivalent of the amounts actually paid or received. Net unrealized foreign exchange gains and losses arise from changes in the fair value of assets and liabilities other than investments in securities resulting from changes in exchange rates. The changes in net assets arising from changes in exchange rates of securities and the changes in net assets resulting from changes in market prices of securities are not separately presented. Such changes are included in net realized and unrealized gains or losses from investments.
Loans
The Fund may invest in direct debt instruments which are interests in amounts owed to lenders by corporate or other borrowers. The loans pay interest at rates which are periodically reset by reference to a base lending rate plus a spread. Investments in loans may be in the form of participations in loans or assignments of all or a portion of loans from third parties. When the Fund purchases participations, it generally has no rights to enforce compliance with the terms of the loan agreement with the borrower. As a result, the Fund assumes the credit risk of both the borrower and the lender that is selling the participation. When the Fund purchases assignments from lenders, it acquires direct rights against the borrower on the loan and may enforce compliance by the borrower with the terms of the loan agreement. Loans may include fully funded term loans or unfunded loan commitments, which are contractual obligations for future funding.
Forward foreign currency contracts
A forward foreign currency contract is an agreement between two parties to purchase or sell a specific currency for an agreed-upon price at a future date. The Fund enters into forward foreign currency contracts to facilitate transactions in foreign-denominated securities and to attempt to minimize the risk to the Fund from adverse changes in the relationship between currencies. Forward foreign currency contracts are recorded at the forward rate and marked-to-market daily. When the contracts are closed, realized gains and losses arising from such transactions are recorded as realized gains or losses on forward foreign currency contracts. The Fund is subject to foreign currency risk and may be exposed to risks if the counterparties to the contracts are unable to meet the terms of their contracts or if the value of the foreign currency changes unfavorably. The Fund's maximum risk of loss from counterparty credit risk is the unrealized gains on the contracts. This risk may be mitigated if there is a master netting arrangement between the Fund and the counterparty.
Futures contracts
Futures contracts are agreements between the Fund and a counterparty to buy or sell a specific amount of a commodity, financial instrument or currency at a specified price on a specified date. The Fund may buy and sell futures contracts in order to gain exposure to, or protect against, changes in interest rates and is subject to interest rate risk. The primary risks associated with the use of futures contracts are the imperfect correlation between changes in market values of securities held by the Fund and the prices of futures contracts, and the possibility of an illiquid market. Futures contracts are generally entered into on a regulated futures exchange and cleared through a clearinghouse associated with the exchange. With futures contracts, there is
34 | Wells Fargo Income Plus Fund
Notes to consolidated financial statements (unaudited)
minimal counterparty risk to the Fund since futures contracts are exchange traded and the exchange’s clearinghouse, as the counterparty to all exchange traded futures, guarantees the futures contracts against default.
Upon entering into a futures contract, the Fund is required to deposit either cash or securities (initial margin) with the broker in an amount equal to a certain percentage of the contract value. Subsequent payments (variation margin) are paid to or from the broker each day equal to the daily changes in the contract value. Such payments are recorded as unrealized gains or losses and, if any, shown as variation margin receivable (payable) in the Consolidated Statement of Assets and Liabilities. Should the Fund fail to make requested variation margin payments, the broker can gain access to the initial margin to satisfy the Fund’s payment obligations. When the contracts are closed, a realized gain or loss is recorded in the Consolidated Statement of Operations.
Swap contracts
Swap contracts are agreements between the Fund and a counterparty to exchange a series of cash flows over a specified period. Swap agreements are privately negotiated contracts between the Fund that are entered into as bilateral contracts in the OTC market (“OTC swaps”) or centrally cleared (“centrally cleared swaps”) with a central clearinghouse.
The Fund entered into centrally cleared swaps. In a centrally cleared swap, immediately following execution of the swap contract, the swap contract is novated to a central counterparty (the “CCP”) and the Fund’s counterparty on the swap agreement becomes the CCP. Upon entering into a centrally cleared swap, the Fund is required to deposit an initial margin with the broker in the form of cash or securities. Securities deposited as initial margin are designated in the Consolidated Portfolio of Investments and cash deposited is shown as cash segregated for centrally cleared swaps in the Consolidated Statement of Assets and Liabilities. Pursuant to the contract, the Fund agrees to receive from or pay to the broker an amount of cash equal to the daily fluctuation in market value of the contract (“variation margin”). The variation margin is recorded as an unrealized gain (or loss) and shown as variation margin receivable (or payable) on centrally cleared swaps in the Consolidated Statement of Assets and Liabilities. Payments received from (paid to) the counterparty, including at termination, are recorded as realized gains (losses) in the Consolidated Statement of Operations.
Credit default swaps
The Fund may enter into credit default swaps for hedging or speculative purposes to provide or receive a measure of protection against default on a referenced entity, obligation or index or a basket of single-name issuers or traded indexes. An index credit default swap references all the names in the index, and if a credit event is triggered, the credit event is settled based on that name’s weight in the index. Credit default swaps are agreements in which the protection buyer pays fixed periodic payments to the protection seller in consideration for a promise from the protection seller to make a specific payment should a negative credit event take place with respect to the referenced entity (e.g., bankruptcy, failure to pay, obligation acceleration, repudiation, moratorium or restructuring).
The Fund may enter into credit default swaps as either the seller of protection or the buyer of protection. If the Fund is the buyer of protection and a credit event occurs, the Fund will either receive from the seller an amount equal to the notional amount of the swap and deliver the referenced security or underlying securities comprising the index, or receive a net settlement of cash equal to the notional amount of the swap less the recovery value of the security or underlying securities comprising the index. If the Fund is the seller of protection and a credit event occurs, the Fund will either pay the buyer an amount equal to the notional amount of the swap and take delivery of the referenced security or underlying securities comprising the index or pay a net settlement of cash equal to the notional amount of the swap less the recovery value of the security or underlying securities comprising the index.
As the seller of protection, the Fund is subject to investment exposure on the notional amount of the swap and has assumed the risk of default of the underlying security or index. As the buyer of protection, the Fund could be exposed to risks if the seller of the protection defaults on its obligation to perform, or if there are unfavorable changes in the fluctuation of interest rates.
By entering into credit default swap contracts, the Fund is exposed to credit risk. In addition, certain credit default swap contracts entered into by the Fund provide for conditions that result in events of default or termination that enable the counterparty to the agreement to cause an early termination of the transactions under those agreements.
Securities lending
The Fund may lend its securities from time to time in order to earn additional income in the form of fees or interest on securities received as collateral or the investment of any cash received as collateral. When securities are on loan, the Fund receives interest or dividends on those securities. Cash collateral received in connection with its securities lending transactions is invested in Securities Lending Cash Investments, LLC (the "Securities Lending Fund"). Investments in Securities Lending Fund
Wells Fargo Income Plus Fund | 35
Notes to consolidated financial statements (unaudited)
are valued at the evaluated bid price provided by an independent pricing service. Income earned from investment in the Securities Lending Fund (net of fees and rebates), if any, is included in income from affiliated securities on the Consolidated Statement of Operations.
In a securities lending transaction, the net asset value of the Fund is affected by an increase or decrease in the value of the securities loaned and by an increase or decrease in the value of the instrument in which collateral is invested. The amount of securities lending activity undertaken by the Fund fluctuates from time to time. The Fund has the right under the lending agreement to recover the securities from the borrower on demand. In the event of default or bankruptcy by the borrower, the Fund may be prevented from recovering the loaned securities or gaining access to the collateral or may experience delays or costs in doing so. In such an event, the terms of the agreement allow the unaffiliated securities lending agent to use the collateral to purchase replacement securities on behalf of the Fund or pay the Fund the market value of the loaned securities. The Fund bears the risk of loss with respect to depreciation of its investment of the cash collateral.
When-issued transactions
The Fund may purchase securities on a forward commitment or when-issued basis. The Fund records a when-issued transaction on the trade date and will segregate assets in an amount at least equal in value to the Fund's commitment to purchase when-issued securities. Securities purchased on a when-issued basis are marked-to-market daily and the Fund begins earning interest on the settlement date. Losses may arise due to changes in the market value of the underlying securities or if the counterparty does not perform under the contract.
Security transactions and income recognition
Securities transactions are recorded on a trade date basis. Realized gains or losses are recorded on the basis of identified cost.
Interest income is accrued daily and bond discounts are accreted and premiums are amortized daily. To the extent debt obligations are placed on non-accrual status, any related interest income may be reduced by writing off interest receivables when the collection of all or a portion of interest has been determined to be doubtful based on consistently applied procedures and the fair value has decreased. If the issuer subsequently resumes interest payments or when the collectability of interest is reasonably assured, the debt obligation is removed from non-accrual status.
Dividend income is recognized on the ex-dividend date.
Income is recorded net of foreign taxes withheld where recovery of such taxes is not assured.
Income dividends and capital gain distributions from investment companies are recorded on the ex-dividend date. Capital gain distributions from investment companies are treated as realized gains.
Distributions to shareholders
Distributions to shareholders are recorded on the ex-dividend date and paid from net investment income monthly and any net realized gains are paid at least annually. Such distributions are determined in accordance with income tax regulations and may differ from U.S. generally accepted accounting principles. Dividend sources are estimated at the time of declaration. The tax character of distributions is determined as of the Fund’s fiscal year end. Therefore, a portion of the Fund’s distributions made prior to the Fund’s fiscal year end may be categorized as a tax return of capital at year end.
Federal and other taxes
The Fund intends to continue to qualify as a regulated investment company by distributing substantially all of its investment company taxable income and any net realized capital gains (after reduction for capital loss carryforwards) sufficient to relieve it from all, or substantially all, federal income taxes. Accordingly, no provision for federal income taxes was required.
The Fund’s income and federal excise tax returns and all financial records supporting those returns for the prior three fiscal years are subject to examination by the federal and Delaware revenue authorities. Management has analyzed the Fund's tax positions taken on federal, state, and foreign tax returns for all open tax years and does not believe that there are any uncertain tax positions that require recognition of a tax liability.
As of March 31, 2021, the aggregate cost of all investments for federal income tax purposes was $149,356,592 and the unrealized gains (losses) consisted of:
| Gross unrealized gains | $ 7,850,849 |
| Gross unrealized losses | (1,666,920) |
| Net unrealized gains | $ 6,183,929 |
36 | Wells Fargo Income Plus Fund
Notes to consolidated financial statements (unaudited)
Class allocations
The separate classes of shares offered by the Fund differ principally in applicable sales charges, distribution, shareholder servicing, and administration fees. Class specific expenses are charged directly to that share class. Investment income, common fund-level expenses, and realized and unrealized gains (losses) on investments are allocated daily to each class of shares based on the relative proportion of net assets of each class.
4. FAIR VALUATION MEASUREMENTS
Fair value measurements of investments are determined within a framework that has established a fair value hierarchy based upon the various data inputs utilized in determining the value of the Fund’s investments. The three-level hierarchy gives the highest priority to unadjusted quoted prices in active markets for identical assets or liabilities (Level 1) and the lowest priority to unobservable inputs (Level 3). The Fund’s investments are classified within the fair value hierarchy based on the lowest level of input that is significant to the fair value measurement. The inputs are summarized into three broad levels as follows:
| ■ | Level 1 – quoted prices in active markets for identical securities |
| ■ | Level 2 – other significant observable inputs (including quoted prices for similar securities, interest rates, prepayment speeds, credit risk, etc.) |
| ■ | Level 3 – significant unobservable inputs (including the Fund’s own assumptions in determining the fair value of investments) |
The inputs or methodologies used for valuing investments in securities are not necessarily an indication of the risk associated with investing in those securities.
Wells Fargo Income Plus Fund | 37
Notes to consolidated financial statements (unaudited)
The following is a summary of the inputs used in valuing the Fund’s assets and liabilities as of March 31, 2021:
| | Quoted prices
(Level 1) | Other significant
observable inputs
(Level 2) | Significant
unobservable inputs
(Level 3) | Total |
| Assets | | | | |
| Investments in: | | | | |
| Agency securities | $ 0 | $ 13,632,692 | $ 0 | $ 13,632,692 |
| Asset-backed securities | 0 | 6,172,455 | 0 | 6,172,455 |
| Common stocks | | | | |
| Energy | 570,753 | 0 | 0 | 570,753 |
| Corporate bonds and notes | 0 | 42,044,166 | 0 | 42,044,166 |
| Exchange-traded funds | 8,740,342 | 0 | 0 | 8,740,342 |
| Foreign corporate bonds and notes | 0 | 16,124,862 | 0 | 16,124,862 |
| Foreign government bonds | 0 | 7,187,137 | 0 | 7,187,137 |
| Loans | 0 | 2,750,529 | 451,346 | 3,201,875 |
| Municipal obligations | 0 | 359,091 | 0 | 359,091 |
| Non-agency mortgage-backed securities | 0 | 17,350,350 | 0 | 17,350,350 |
| U.S. Treasury securities | 4,975,000 | 0 | 0 | 4,975,000 |
| Yankee corporate bonds and notes | 0 | 12,910,899 | 0 | 12,910,899 |
| Yankee government bonds | 0 | 2,956,184 | 0 | 2,956,184 |
| Short-term investments | | | | |
| Investment companies | 18,121,527 | 0 | 0 | 18,121,527 |
| | 32,407,622 | 121,488,365 | 451,346 | 154,347,333 |
| Forward foreign currency contracts | 0 | 426,400 | 0 | 426,400 |
| Futures contracts | 267,097 | 0 | 0 | 267,097 |
| Centrally cleared swap contracts | 0 | 837,016 | 0 | 837,016 |
| Total assets | $32,674,719 | $122,751,781 | $451,346 | $155,877,846 |
| Liabilities | | | | |
| Forward foreign currency contracts | $ 0 | $ 83,947 | $ 0 | $ 83,947 |
| Futures contracts | 214,949 | 0 | 0 | 214,949 |
| Centrally cleared swap contracts | 0 | 38,429 | 0 | 38,429 |
| Total liabilities | $ 214,949 | $ 122,376 | $ 0 | $ 337,325 |
Futures contracts, forward foreign currency contracts and swap contracts are reported at their cumulative unrealized gains (losses) at measurement date as reported in the tables following the Consolidated Portfolio of Investments. For futures contracts and centrally cleared swap contracts, the current day’s variation margin is reported on the Consolidated Statement of Assets and Liabilities. All other assets and liabilities are reported at their market value at measurement date.
Additional sector, industry or geographic detail, if any, is included in the Consolidated Portfolio of Investments.
For the six months ended March 31, 2021, the Fund had no material transfers into/out of Level 3.
5. TRANSACTIONS WITH AFFILIATES
Management fee
Funds Management, an indirect wholly owned subsidiary of Wells Fargo & Company ("Wells Fargo"), is the manager of the Fund and provides advisory and fund-level administrative services under an investment management agreement. Under the investment management agreement, Funds Management is responsible for, among other services, implementing the investment objectives and strategies of the Fund, supervising the subadviser and providing fund-level administrative services in connection with the Fund’s operations. As compensation for its services under the investment management agreement, Funds Management is entitled to receive a management fee at the following annual rate based on the Fund’s average daily net assets:
38 | Wells Fargo Income Plus Fund
Notes to consolidated financial statements (unaudited)
| Average daily net assets | Management fee |
| First $500 million | 0.525% |
| Next $500 million | 0.500 |
| Next $2 billion | 0.475 |
| Next $2 billion | 0.450 |
| Next $5 billion | 0.415 |
| Over $10 billion | 0.405 |
For the six months ended March 31, 2021, the management fee was equivalent to an annual rate of 0.525% of the Fund’s average daily net assets.
Funds Management has retained the services of a subadviser to provide daily portfolio management to the Fund. The fee for subadvisory services is borne by Funds Management. Wells Capital Management Incorporated ("WellsCap"), an affiliate of Funds Management and an indirect wholly owned subsidiary of Wells Fargo, is the subadviser to the Fund and is entitled to receive a fee from Funds Management at an annual rate starting at 0.35% and declining to 0.20% as the average daily net assets of the Fund increase.
Administration fees
Under a class-level administration agreement, Funds Management provides class-level administrative services to the Fund, which includes paying fees and expenses for services provided by the transfer agent, sub-transfer agents, omnibus account servicers and record-keepers. As compensation for its services under the class-level administration agreement, Funds Management receives an annual fee which is calculated based on the average daily net assets of each class as follows:
| | Class-level
administration fee |
| Class A | 0.16% |
| Class C | 0.16 |
| Administrator Class | 0.10 |
| Institutional Class | 0.08 |
Waivers and/or expense reimbursements
Funds Management has contractually waived and/or reimbursed management and administration fees to the extent necessary to maintain certain net operating expense ratios for the Fund. When each class of the Fund has exceeded its expense cap, Funds Management has waived fees and/or reimbursed expenses from fund-level expenses on a proportionate basis and then from class specific expenses. When only certain classes exceed their expense caps, waivers and/or reimbursements are applied against class specific expenses before fund-level expenses. Funds Management has committed through January 31, 2022 to waive fees and/or reimburse expenses to the extent necessary to cap expenses. Prior to or after the commitment expiration date, the cap may be increased or the commitment to maintain the cap may be terminated only with the approval of the Board of Trustees. The contractual expense caps are as follows:
| | Expense ratio caps |
| Class A | 0.90% |
| Class C | 1.65 |
| Administrator Class | 0.75 |
| Institutional Class | 0.60 |
Distribution fee
The Trust has adopted a distribution plan for Class C shares of the Fund pursuant to Rule 12b-1 under the 1940 Act. A distribution fee is charged charged to Class C shares and paid to Wells Fargo Funds Distributor, LLC ("Funds Distributor"), the principal underwriter, at an annual rate of 0.75% of the average daily net assets of Class C shares.
Wells Fargo Income Plus Fund | 39
Notes to consolidated financial statements (unaudited)
In addition, Funds Distributor is entitled to receive the front-end sales charge from the purchase of Class A shares and a contingent deferred sales charge on the redemption of certain Class A shares. Funds Distributor is also entitled to receive the contingent deferred sales charges from redemptions of Class C shares. For the six months ended March 31, 2021, Funds Distributor received $97 from the sale of Class A shares. No contingent deferred sales charges were incurred by Class A and Class C shares for the six months ended March 31, 2021.
Shareholder servicing fees
The Trust has entered into contracts with one or more shareholder servicing agents, whereby Class A, Class C, and Administrator Class of the Fund are charged a fee at an annual rate of 0.25% of the average daily net assets of each respective class. A portion of these total shareholder servicing fees were paid to affiliates of Wells Fargo.
Interfund transactions
The Fund may purchase or sell portfolio investment securities to certain other Wells Fargo affiliates pursuant to Rule 17a-7 under the 1940 Act and under procedures adopted by the Board of Trustees. The procedures have been designed to ensure that these interfund transactions, which do not incur broker commissions, are effected at current market prices. Pursuant to these procedures, the Fund had $0, $918,724 and $30,920 in interfund purchases, sales and net realized gains (losses), respectively, during the six months ended March 31, 2021.
Other transactions
On August 14, 2020, Class C of the Fund was reimbursed by Funds Management in the amount of $4,844. The reimbursement was made in connection with resolving certain fee reimbursements.
6. INVESTMENT PORTFOLIO TRANSACTIONS
Purchases and sales of investments, excluding short-term securities, for the six months ended March 31, 2021 were as follows:
| Purchases at cost | | Sales proceeds |
U.S.
government | Non-U.S.
government | | U.S.
government | Non-U.S.
government |
| $46,634,630 | $25,672,479 | | $31,980,707 | $46,608,999 |
As of March 31, 2021, the Fund had unfunded loan commitments of $454,324.
7. SECURITIES LENDING TRANSACTIONS
The Fund lends its securities through an unaffiliated securities lending agent and receives collateral in the form of cash or securities with a value at least equal to the value of the securities on loan. The value of the loaned securities is determined at the close of each business day and any increases or decreases in the required collateral are exchanged between the Fund and the counterparty on the next business day. Cash collateral received is invested in the Securities Lending Fund which seeks to provide a positive return compared to the daily Federal Funds Open Rate by investing in high-quality, U.S. dollar-denominated short-term money market instruments and is exempt from registration under Section 3(c)(7) of the 1940 Act. Securities Lending Fund is managed by Funds Management and is subadvised by WellsCap. Funds Management receives an advisory fee starting at 0.05% and declining to 0.01% as the average daily net assets of the Securities Lending Fund increase. All of the fees received by Funds Management are paid to WellsCap for its services as subadviser.
In the event of counterparty default or the failure of a borrower to return a loaned security, the Fund has the right to use the collateral to offset any losses incurred. As of March 31, 2021, the Fund had securities lending transactions with the following counterparties which are subject to offset:
40 | Wells Fargo Income Plus Fund
Notes to consolidated financial statements (unaudited)
| Counterparty | Value of
securities on
loan | Collateral
received1 | Net amount |
| Bank of America Securities Incorporated | $ 97,542 | $ (97,542) | 0 |
| Barclays Capital Incorporated | 4,918,027 | (4,918,027) | 0 |
| Citigroup Global Markets Incorporated | 927,112 | (927,112) | 0 |
| Credit Suisse Securities (USA) LLC | 479,079 | (479,079) | 0 |
| UBS Securities LLC | 639,442 | (639,442) | 0 |
1 Collateral received within this table is limited to the collateral for the net transaction with the counterparty.
8. DERIVATIVE TRANSACTIONS
During the six months ended March 31, 2021, the Fund entered into futures contracts for economic hedging purposes. The Fund also entered into forward foreign currency contracts for economic hedging purposes and entered into credit default swap contracts as a substitute for taking a position in the underlying security or index to potentially enhance the Fund’s total return.
The volume of the Fund's derivative activity during the six months ended March 31, 2021 was as follows:
| Futures contracts | |
| Average notional balance on long futures | $ 7,714,203 |
| Average notional balance on short futures | 29,042,136 |
| Forward foreign currency contracts | |
| Average contract amounts to buy | $10,569,845 |
| Average contract amounts to sell | 28,293,044 |
| Credit default swap contracts | |
| Average notional balance | $24,147,218 |
The Fund's swap transactions may contain provisions for early termination in the event the net assets of the Fund declines below specific levels identified by the counterparty. If these levels are triggered, the counterparty may terminate the transaction and seek payment or request full collateralization of the derivative transactions in net liability positions.
A summary of the location of derivative instruments on the financial statements by primary risk exposure is outlined in the following tables.
The fair value of derivative instruments as of March 31, 2021 by risk type was as follows for the Fund:
| | Asset derivatives | | Liability derivatives |
| | Consolidated Statement of
Assets and Liabilities location | Fair value | | Consolidated Statement of
Assets and Liabilities location | Fair value |
| Interest rate risk | Unrealized gains on futures contracts | $ 267,097* | | Unrealized losses on futures contracts | $ 214,949* |
| Foreign currency risk | Unrealized gains on forward foreign currency contracts | 426,400 | | Unrealized losses on forward foreign currency contracts | 83,947 |
| Credit risk | Unrealized gains on swaps contracts | 837,016 * | | Unrealized losses on swaps contracts | 38,429 * |
| | | $1,530,514 | | | $337,325 |
* Amount represents the cumulative unrealized gains (losses) as reported in the tables following the Consolidated Portfolio of Investments. For futures contracts and centrally cleared swap contracts, only the current day's variation margin as of March 31, 2021 is reported separately on the Consolidated Statement of Assets and Liabilities.
Wells Fargo Income Plus Fund | 41
Notes to consolidated financial statements (unaudited)
The effect of derivative instruments on the Consolidated Statement of Operations for the six months ended March 31, 2021 was as follows for the Fund:
| | Amount of realized gains (losses) on derivatives |
| | Futures
contracts | Forward
foreign
currency
contracts | Swap
contracts | Total |
| Interest rate risk | $ 524,100 | $ 0 | $ 0 | $ 524,100 |
| Credit risk | 0 | 0 | 667,044 | 667,044 |
| Foreign currency risk | 0 | (147,476) | 0 | (147,476) |
| | $524,100 | $(147,476) | $667,044 | $1,043,668 |
| | Change in unrealized gains (losses) on derivatives |
| | Futures
contracts | Forward
foreign
currency
contracts | Swap
contracts | Total |
| Interest rate risk | $ 191,367 | $ 0 | $ 0 | $ 191,367 |
| Credit risk | 0 | 0 | (47,020) | (47,020) |
| Foreign currency risk | 0 | 83,527 | 0 | 83,527 |
| | $191,367 | $83,527 | $(47,020) | $227,874 |
For certain types of derivative transactions, the Fund has entered into International Swaps and Derivatives Association, Inc. master agreements (“ISDA Master Agreements”) or similar agreements with approved counterparties. The ISDA Master Agreements or similar agreements may have requirements to deliver/deposit securities or cash to/with an exchange or broker-dealer as collateral and allows the Fund to offset, with each counterparty, certain derivative financial instrument’s assets and/or liabilities with collateral held or pledged. Collateral requirements differ by type of derivative. Collateral or margin requirements are set by the broker or exchange clearinghouse for exchange traded derivatives while collateral terms are contract specific for over-the-counter traded derivatives. Cash collateral that has been pledged to cover obligations of the Fund under ISDA Master Agreements or similar agreements, if any, are reported separately in the Consolidated Statement of Assets and Liabilities. Securities pledged as collateral, if any, are noted in the Consolidated Portfolio of Investments. With respect to balance sheet offsetting, absent an event of default by the counterparty or a termination of the agreement, the reported amounts of financial assets and financial liabilities in the Consolidated Statement of Assets and Liabilities are not offset across transactions between the Fund and the applicable counterparty. A reconciliation of the gross amounts on the Consolidated Statement of Assets and Liabilities to the net amounts by counterparty, including any collateral exposure, for OTC derivatives is as follows:
| Counterparty | Gross amounts
of assets in the
Consolidated
Statement of
Assets and
Liabilities | Amounts
subject to
netting
agreements | Collateral
received1 | Net amount
of assets |
| Citibank NA | $333,692 | $(42,338) | $291,354 | $ 0 |
| Morgan Stanley Company Incorporated | 92,708 | (41,609) | 0 | 51,099 |
| Counterparty | Gross amounts
of assets in the
Consolidated
Statement of
Assets and
Liabilities | Amounts
subject to
netting
agreements | Collateral
pledged | Net amount
of liabilities |
| Citibank NA | $42,338 | $(42,338) | $0 | $0 |
| Morgan Stanley Company Incorporated | 41,609 | (41,609) | 0 | 0 |
1 Collateral received within this table is limited to the collateral for the net transaction with the counterparty.
42 | Wells Fargo Income Plus Fund
Notes to consolidated financial statements (unaudited)
9. BANK BORROWINGS
The Trust (excluding the money market funds), Wells Fargo Master Trust and Wells Fargo Variable Trust are parties to a $350,000,000 revolving credit agreement whereby the Fund is permitted to use bank borrowings for temporary or emergency purposes, such as to fund shareholder redemption requests. Interest under the credit agreement is charged to the Fund based on a borrowing rate equal to the higher of the Federal Funds rate in effect on that day plus 1.25% or the overnight LIBOR rate in effect on that day plus 1.25%. In addition, an annual commitment fee equal to 0.25% of the unused balance is allocated to each participating fund.
For the six months ended March 31, 2021, there were no borrowings by the Fund under the agreement.
10. INDEMNIFICATION
Under the Fund's organizational documents, the officers and Trustees have been granted certain indemnification rights against certain liabilities that may arise out of performance of their duties to the Fund. The Fund has entered into a separate agreement with each Trustee that converts indemnification rights currently existing under the Fund’s organizational documents into contractual rights that cannot be changed in the future without the consent of the Trustee. Additionally, in the normal course of business, the Fund may enter into contracts with service providers that contain a variety of indemnification clauses. The Fund’s maximum exposure under these arrangements is dependent on future claims that may be made against the Fund and, therefore, cannot be estimated.
11. CORONAVIRUS (COVID-19) PANDEMIC
On March 11, 2020, the World Health Organization announced that it had made the assessment that coronavirus disease 2019 (“COVID-19”) is a pandemic. The impacts of COVID-19 are affecting the entire global economy, individual companies and investment products, the funds, and the market in general. There is significant uncertainty around the extent and duration of business disruptions related to COVID-19 and the impacts may last for an extended period of time. COVID-19 has led to significant uncertainty and volatility in the financial markets.
Wells Fargo Income Plus Fund | 43
Other information (unaudited)
PROXY VOTING INFORMATION
A description of the policies and procedures used to determine how to vote proxies relating to portfolio securities is available without charge, upon request, by calling 1-800-222-8222, visiting our website at wfam.com, or visiting the SEC website at sec.gov. Information regarding how the proxies related to portfolio securities were voted during the most recent 12-month period ended June 30 is available on the website at wfam.com or by visiting the SEC website at sec.gov.
QUARTERLY PORTFOLIO HOLDINGS INFORMATION
The Fund files its complete schedule of portfolio holdings with the SEC for the first and third quarters of each fiscal year as an exhibit to its reports on Form N-PORT. Shareholders may view the filed Form N-PORT by visiting the SEC website at sec.gov.
44 | Wells Fargo Income Plus Fund
Other information (unaudited)
BOARD OF TRUSTEES AND OFFICERS
Each of the Trustees and Officers listed in the table below acts in identical capacities for each fund in the Wells Fargo family of funds, which consists of 142 mutual funds comprising the Wells Fargo Funds Trust, Wells Fargo Variable Trust, Wells Fargo Master Trust and four closed-end funds (collectively the “Fund Complex”). This table should be read in conjunction with the Prospectus and the Statement of Additional Information1. The mailing address of each Trustee and Officer is 525 Market Street, 12th Floor, San Francisco, CA 94105. Each Trustee and Officer serves an indefinite term, however, each Trustee serves such term until reaching the mandatory retirement age established by the Trustees.
Independent Trustees
Name and
year of birth | Position held and
length of service* | Principal occupations during past five years or longer | Current other
public company or
investment
company
directorships |
William R. Ebsworth
(Born 1957) | Trustee,
since 2015 | Retired. From 1984 to 2013, equities analyst, portfolio manager, research director and chief investment officer at Fidelity Management and Research Company in Boston, Tokyo, and Hong Kong, and retired in 2013 as Chief Investment Officer of Fidelity Strategic Advisers, Inc. where he led a team of investment professionals managing client assets. Prior thereto, Board member of Hong Kong Securities Clearing Co., Hong Kong Options Clearing Corp., the Thailand International Fund, Ltd., Fidelity Investments Life Insurance Company, and Empire Fidelity Investments Life Insurance Company. Audit Committee Chair and Investment Committee Chair of the Vincent Memorial Hospital Endowment (non-profit organization). Mr. Ebsworth is a CFA® charterholder. | N/A |
Jane A. Freeman
(Born 1953) | Trustee,
since 2015;
Chair Liaison,
since 2018 | Retired. From 2012 to 2014 and 1999 to 2008, Chief Financial Officer of Scientific Learning Corporation. From 2008 to 2012, Ms. Freeman provided consulting services related to strategic business projects. Prior to 1999, Portfolio Manager at Rockefeller & Co. and Scudder, Stevens & Clark. Board member of the Harding Loevner Funds from 1996 to 2014, serving as both Lead Independent Director and chair of the Audit Committee. Board member of the Russell Exchange Traded Funds Trust from 2011 to 2012 and the chair of the Audit Committee. Ms. Freeman is also an inactive Chartered Financial Analyst. | N/A |
Isaiah Harris, Jr.
(Born 1952) | Trustee,
since 2009; Audit
Committee
Chair,
since 2019 | Retired. Chairman of the Board of CIGNA Corporation since 2009, and Director since 2005. From 2003 to 2011, Director of Deluxe Corporation. Prior thereto, President and CEO of BellSouth Advertising and Publishing Corp. from 2005 to 2007, President and CEO of BellSouth Enterprises from 2004 to 2005 and President of BellSouth Consumer Services from 2000 to 2003. Emeritus member of the Iowa State University Foundation Board of Governors. Emeritus Member of the Advisory Board of Iowa State University School of Business. Advisory Board Member, Palm Harbor Academy (private school). Mr. Harris is a certified public accountant (inactive status). | CIGNA Corporation |
Judith M. Johnson
(Born 1949) | Trustee,
since 2008 | Retired. Prior thereto, Chief Executive Officer and Chief Investment Officer of Minneapolis Employees Retirement Fund from 1996 to 2008. Ms. Johnson is an attorney, certified public accountant and a certified managerial accountant. | N/A |
David F. Larcker
(Born 1950) | Trustee,
since 2009 | James Irvin Miller Professor of Accounting at the Graduate School of Business (Emeritus), Stanford University, Director of the Corporate Governance Research Initiative and Senior Faculty of The Rock Center for Corporate Governance since 2006. From 2005 to 2008, Professor of Accounting at the Graduate School of Business, Stanford University. Prior thereto, Ernst & Young Professor of Accounting at The Wharton School, University of Pennsylvania from 1985 to 2005. | N/A |
Wells Fargo Income Plus Fund | 45
Other information (unaudited)
Name and
year of birth | Position held and
length of service* | Principal occupations during past five years or longer | Current other
public company or
investment
company
directorships |
Olivia S. Mitchell
(Born 1953) | Trustee,
since 2006;
Nominating and
Governance
Committee Chair,
since 2018 | International Foundation of Employee Benefit Plans Professor, Wharton School of the University of Pennsylvania since 1993. Director of Wharton’s Pension Research Council and Boettner Center on Pensions & Retirement Research, and Research Associate at the National Bureau of Economic Research. Previously, Cornell University Professor from 1978 to 1993. | N/A |
Timothy J. Penny
(Born 1951) | Trustee,
since 1996;
Chair,
since 2018 | President and Chief Executive Officer of Southern Minnesota Initiative Foundation, a non-profit organization, since 2007. Member of the Board of Trustees of NorthStar Education Finance, Inc., a non-profit organization, since 2007. | N/A |
James G. Polisson
(Born 1959) | Trustee,
since 2018 | Retired. Chief Marketing Officer, Source (ETF) UK Services, Ltd, from 2015 to 2017. From 2012 to 2015, Principal of The Polisson Group, LLC, a management consulting, corporate advisory and principal investing company. Chief Executive Officer and Managing Director at Russell Investments, Global Exchange Traded Funds from 2010 to 2012. Managing Director of Barclays Global Investors from 1998 to 2010 and Global Chief Marketing Officer for iShares and Barclays Global Investors from 2000 to 2010. Trustee of the San Francisco Mechanics’ Institute, a non-profit organization, from 2013 to 2015. Board member of the Russell Exchange Traded Fund Trust from 2011 to 2012. Director of Barclays Global Investors Holdings Deutschland GmbH from 2006 to 2009. Mr. Polisson is an attorney and has a retired status with the Massachusetts and District of Columbia Bar Associations. | N/A |
Pamela Wheelock
(Born 1959) | Trustee,
since January
2020; previously
Trustee from
January 2018 to
July 2019 | Board member of the Destination Medical Center Economic Development Agency, Rochester, Minnesota since 2019. Interim President of the McKnight Foundation from January to September 2020. Acting Commissioner, Minnesota Department of Human Services, July 2019 through September 2019. Human Services Manager (part-time), Minnesota Department of Human Services, October 2019 through December 2019. Chief Operating Officer, Twin Cities Habitat for Humanity from 2017 to 2019. Vice President of University Services, University of Minnesota from 2012 to 2016. Prior thereto, on the Board of Directors, Governance Committee and Finance Committee for the Minnesota Philanthropy Partners (Saint Paul Foundation) from 2012 to 2018, Interim Chief Executive Officer of Blue Cross Blue Shield of Minnesota from 2011 to 2012, Chairman of the Board from 2009 to 2012 and Board Director from 2003 to 2015. Vice President, Leadership and Community Engagement, Bush Foundation, Saint Paul, Minnesota (a private foundation) from 2009 to 2011. Executive Vice President and Chief Financial Officer, Minnesota Sports and Entertainment from 2004 to 2009 and Senior Vice President from 2002 to 2004. Executive Vice President of the Minnesota Wild Foundation from 2004 to 2008. Commissioner of Finance, State of Minnesota, from 1999 to 2002. Currently Board Chair of the Minnesota Wild Foundation since 2010. | N/A |
* Length of service dates reflect the Trustee’s commencement of service with the Trust’s predecessor entities, where applicable.
46 | Wells Fargo Income Plus Fund
Other information (unaudited)
Officers
Name and
year of birth | Position held and
length of service | Principal occupations during past five years or longer |
Andrew Owen
(Born 1960) | President,
since 2017 | Executive Vice President of Wells Fargo & Company and Head of Affiliated Managers, Wells Fargo Asset Management, since 2014. In addition, Mr. Owen is currently President, Chief Executive Officer and Director of Wells Fargo Funds Management, LLC since 2017. Prior thereto, Executive Vice President responsible for marketing, investments and product development for Wells Fargo Funds Management, LLC, from 2009 to 2014. |
Jeremy DePalma
(Born 1974) | Treasurer,
since 2012
(for certain funds in
the Fund Complex);
since 2021 (for
the remaining funds in the
Fund Complex) | Senior Vice President of Wells Fargo Funds Management, LLC since 2009. Senior Vice President of Evergreen Investment Management Company, LLC from 2008 to 2010 and head of the Fund Reporting and Control Team within Fund Administration from 2005 to 2010. |
Michelle Rhee
(Born 1966) | Chief Legal Officer,
since 2019 | Secretary of Wells Fargo Funds Management, LLC and Chief Legal Counsel of Wells Fargo Asset Management since 2018. Deputy General Counsel of Wells Fargo Bank, N.A. since 2020 and Assistant General Counsel of Wells Fargo Bank, N.A. from 2018 to 2020. Associate General Counsel and Managing Director of Bank of America Corporation from 2004 to 2018. |
Catherine Kennedy
(Born 1969) | Secretary,
since 2019 | Vice President of Wells Fargo Funds Management, LLC and Senior Counsel of the Wells Fargo Legal Department since 2010. Vice President and Senior Counsel of Evergreen Investment Management Company, LLC from 1998 to 2010. |
Michael H. Whitaker
(Born 1967) | Chief Compliance Officer,
since 2016 | Chief Compliance Officer of Wells Fargo Asset Management since 2016. Senior Vice President and Chief Compliance Officer for Fidelity Investments from 2007 to 2016. |
1 The Statement of Additional Information includes additional information about the Trustees and is available, without charge, upon request, by calling 1-800-222-8222 or by visiting the website at wfam.com.
Wells Fargo Income Plus Fund | 47
For more information
More information about Wells Fargo Funds is available free upon request. To obtain literature, please write, visit the Fund's website, or call:
Wells Fargo Funds
P.O. Box 219967
Kansas City, MO 64121-9967
Website: wfam.com
Individual investors: 1-800-222-8222
Retail investment professionals: 1-888-877-9275
Institutional investment professionals: 1-866-765-0778
This report and the financial statements contained herein are submitted for the general information of the shareholders of the Fund. If this report is used for promotional purposes, distribution of the report must be accompanied or preceded by a current prospectus. Before investing, please consider the investment objectives, risks, charges, and expenses of the investment. For a current prospectus and, if available, a summary prospectus, containing this information, call 1-800-222-8222 or visit the Fund's website at wfam.com. Read the prospectus carefully before you invest or send money.
Wells Fargo Asset Management (WFAM) is the trade name for certain investment advisory/management firms owned by Wells Fargo & Company. These firms include but are not limited to Wells Capital Management Incorporated and Wells Fargo Funds Management, LLC. Certain products managed by WFAM entities are distributed by Wells Fargo Funds Distributor, LLC (a broker-dealer and Member FINRA).
This material is for general informational and educational purposes only and is NOT intended to provide investment advice or a recommendation of any kind - including a recommendation for any specific investment, strategy, or plan.
INVESTMENT PRODUCTS: NOT FDIC INSURED ■ NO BANK GUARANTEE ■ MAY LOSE VALUE
© 2021 Wells Fargo & Company. All rights reserved.
PAR-0421-00291 05-21
SA263/SAR263 03-21
Semi-Annual Report
March 31, 2021
Wells Fargo Global
Investment Grade Credit Fund
Reduce clutter.
Save trees.
Sign up for electronic delivery of prospectuses and shareholder reports at wellsfargo.com/ advantagedelivery
The views expressed and any forward-looking statements are as of March 31, 2021, unless otherwise noted, and are those of the Fund's portfolio managers and/or Wells Fargo Asset Management. Discussions of individual securities or the markets generally are not intended as individual recommendations. Future events or results may vary significantly from those expressed in any forward-looking statements. The views expressed are subject to change at any time in response to changing circumstances in the market. Wells Fargo Asset Management and the Fund disclaim any obligation to publicly update or revise any views expressed or forward-looking statements.
INVESTMENT PRODUCTS: NOT FDIC INSURED ■ NO BANK GUARANTEE ■ MAY LOSE VALUE
Wells Fargo Global Investment Grade Credit Fund | 1
Letter to shareholders (unaudited)
Andrew Owen
President
Wells Fargo Funds
Dear Shareholder:
We are pleased to offer you this semi-annual report for the Wells Fargo Global Investment Grade Credit Fund for the six-month period that ended March 31, 2021. Despite a deeply challenging year, dominated by the spread of COVID-19 cases and a sharp drop in economic output throughout much of the world, global stocks performed extremely well, benefiting from ongoing central bank support and rising optimism over the development and distribution of effective COVID-19 vaccines. Bonds also had positive returns, led by global bonds and high-yield bonds.
For the six-month period, U.S. stocks, based on the S&P 500 Index,1 gained 19.07%. International stocks, as measured by the MSCI ACWI ex USA Index (Net),2 returned 21.10%, while the MSCI EM Index (Net),3 had even stronger performance, with a 22.43% gain. Among bond indexes, the Bloomberg Barclays U.S. Aggregate Bond Index,4 returned -2.73%, the Bloomberg Barclays Global Aggregate ex-USD Index (unhedged),5 returned -0.47%, and the Bloomberg Barclays Municipal Bond Index,6 returned 1.46% while the ICE BofA U.S. High Yield Index,7 gained 7.44%.
Hope drove the stock markets to new highs.
In October, capital markets stepped back from their six-month rally. Market volatility rose in advance of the U.S. election and amid a global increase in COVID-19 infections. Europe introduced tighter restrictions affecting economic activity. U.S. markets looked favorably at the prospect of Democratic control of the federal purse strings, which could lead to additional fiscal stimulus and a boost to economic activity. Meanwhile, China reported 4.9% third-quarter gross domestic product growth.
Global stocks rallied in November, propelled by optimism over three promising COVID-19 vaccines. Reversing recent trends, value stocks outperformed growth stocks and cyclical stocks outpaced information technology (IT) stocks. However, U.S. unemployment remained elevated, with a net job loss of 10 million since February. The eurozone services purchasing managers’ index contracted sharply while the region’s manufacturing activity grew. The U.S. election results added to the upbeat mood as investors anticipated more consistent policies in the new administration.
“Global stocks rallied in November, propelled by optimism over three promising COVID-19 vaccines.”
| 1 | The S&P 500 Index consists of 500 stocks chosen for market size, liquidity, and industry group representation. It is a market-value-weighted index with each stock's weight in the index proportionate to its market value. You cannot invest directly in an index. |
| 2 | The Morgan Stanley Capital International (MSCI) All Country World Index (ACWI) ex USA Index (Net) is a free-float-adjusted market-capitalization-weighted index that is designed to measure the equity market performance of developed and emerging markets, excluding the United States. Source: MSCI. MSCI makes no express or implied warranties or representations and shall have no liability whatsoever with respect to any MSCI data contained herein. The MSCI data may not be further redistributed or used as a basis for other indices or any securities or financial products. This report is not approved, reviewed, or produced by MSCI. You cannot invest directly in an index. |
| 1 | The S&P 500 Index consists of 500 stocks chosen for market size, liquidity, and industry group representation. It is a market-value-weighted index with each stock's weight in the index proportionate to its market value. You cannot invest directly in an index. |
| 3 | The MSCI Emerging Markets (EM) Index (Net) is a free-float-adjusted market-capitalization-weighted index that is designed to measure equity market performance of emerging markets. You cannot invest directly in an index. |
| 1 | The S&P 500 Index consists of 500 stocks chosen for market size, liquidity, and industry group representation. It is a market-value-weighted index with each stock's weight in the index proportionate to its market value. You cannot invest directly in an index. |
| 4 | The Bloomberg Barclays U.S. Aggregate Bond Index is a broad-based benchmark that measures the investment-grade, U.S. dollar-denominated, fixed-rate taxable bond market, including Treasuries, government-related and corporate securities, mortgage-backed securities (agency fixed-rate and hybrid adjustable-rate mortgage pass-throughs), asset-backed securities, and commercial mortgage-backed securities. You cannot invest directly in an index. |
| 1 | The S&P 500 Index consists of 500 stocks chosen for market size, liquidity, and industry group representation. It is a market-value-weighted index with each stock's weight in the index proportionate to its market value. You cannot invest directly in an index. |
| 5 | The Bloomberg Barclays Global Aggregate ex-USD Index (unhedged) is an unmanaged index that provides a broad-based measure of the global investment-grade fixed-income markets excluding the U.S. dollar-denominated debt market. You cannot invest directly in an index. |
| 1 | The S&P 500 Index consists of 500 stocks chosen for market size, liquidity, and industry group representation. It is a market-value-weighted index with each stock's weight in the index proportionate to its market value. You cannot invest directly in an index. |
| 6 | The Bloomberg Barclays Municipal Bond Index is an unmanaged index composed of long-term tax-exempt bonds with a minimum credit rating of Baa. You cannot invest directly in an index. |
| 1 | The S&P 500 Index consists of 500 stocks chosen for market size, liquidity, and industry group representation. It is a market-value-weighted index with each stock's weight in the index proportionate to its market value. You cannot invest directly in an index. |
| 7 | The ICE BofA U.S. High Yield Index is a market-capitalization-weighted index of domestic and Yankee high-yield bonds. The index tracks the performance of high-yield securities traded in the U.S. bond market. You cannot invest directly in an index. Copyright 2021. ICE Data Indices, LLC. All rights reserved. |
2 | Wells Fargo Global Investment Grade Credit Fund
Letter to shareholders (unaudited)
Financial markets ended the year with strength on high expectations for a rapid rollout of the COVID-19 vaccines, the successful passage of a $900 billion stimulus package, and rising expectations of additional economic support from a Democratic-led Congress. U.S. economic data were mixed with still-elevated unemployment and weak retail sales but growth in manufacturing output. In contrast, China’s economic expansion continued in both manufacturing and nonmanufacturing. U.S. COVID-19 infection rates continued to rise even as new state and local lockdown measures were implemented.
The year 2021 began with emerging market stocks leading all major asset classes in January, driven by China’s strong economic growth and a broad recovery in corporate earnings, which propelled China’s stock market higher. In the U.S., positive news on vaccine trials and January's expansion in both the manufacturing and services sectors were offset by a weak December monthly jobs report. This was compounded by technical factors as some hedge funds were forced to sell stocks to protect themselves against a well-publicized short squeeze coordinated by a group of retail investors. Eurozone sentiment and economic growth were particularly weak, reflecting the impact of a new lockdown with stricter social distancing along with a slow vaccine rollout.
February saw major domestic equity indexes driven higher on the hope of a new stimulus bill, improving COVID-19 vaccination numbers, and the gradual reopening of the economy. Most S&P 500 companies reported better-than-expected earnings, with positive surprises coming from the financials, IT, health care, and materials sectors. Japan saw its economy strengthen as a result of strong export numbers. Meanwhile, crude-oil prices continued their climb, rising more than 25% for the year. Domestic government bonds experienced a sharp sell-off in late February as markets priced in a more robust economic recovery and higher future growth and inflation expectations.
The passage of the massive domestic stimulus bill highlighted March activity, leading to increased forecasts for U.S. growth in 2021. Domestic employment surged as COVID-19 vaccinations and an increasingly open economy spurred hiring. A majority of U.S. small companies reported they are operating at pre-pandemic capacity or higher. Value continued its outperformance of growth in the month, continuing the trend that started in late 2020. Meanwhile, most major developed global equity indexes are up month to date on the back of rising optimism regarding the outlook for global growth. While the U.S. and the U.K. have been the most successful in terms of the vaccine rollout, even within markets where the vaccine has lagged, such as the eurozone and Japan, equity indexes in many of those countries are also in positive territory this year.
Don’t let short-term uncertainty derail long-term investment goals.
Periods of investment uncertainty can present challenges, but experience has taught us that maintaining long-term investment goals can be an effective way to plan for the future. To help you create a sound strategy based on your personal goals and risk tolerance, Wells Fargo Funds offers more than 100 mutual funds spanning a wide range of asset classes and investment styles. Although diversification cannot guarantee an investment profit or prevent losses, we believe it can be an effective way to manage investment risk and potentially smooth out overall portfolio performance. We encourage investors to know their investments and to understand that appropriate levels of risk-taking may unlock opportunities.
Thank you for choosing to invest with Wells Fargo Funds. We appreciate your confidence in us and remain committed to helping you meet your financial needs.
Sincerely,
Andrew Owen
President
Wells Fargo Funds
“The passage of the massive domestic stimulus bill highlighted March activity, leading to increased forecasts for U.S. growth in 2021.”
For further information about your Fund, contact your investment professional, visit our website at wfam.com, or call us directly at 1-800-222-8222.
Wells Fargo Global Investment Grade Credit Fund | 3
Letter to shareholders (unaudited)
Preparing for LIBOR Transition
The global financial industry is preparing to transition away from the London Interbank Offered Rate (LIBOR), a key benchmark interest rate, to new alternative rates. LIBOR underpins more than $350 trillion of financial contracts. It is the benchmark rate for a wide spectrum of products ranging from residential mortgages to corporate bonds to derivatives. Regulators have called for a market-wide transition away from LIBOR to successor reference rates by the end of 2021 (expected to be extended through June 30, 2023 for most tenors of the U.S. dollar LIBOR), which requires proactive steps be taken by issuers, counterparties, and asset managers to identify impacted products and adopt new reference rates.
The Fund holds at least one security that uses LIBOR as a floating reference rate and has a maturity date after December 31, 2021.
Although the transition process away from LIBOR has become increasingly well-defined in advance of the anticipated discontinuation date, there remains uncertainty regarding the nature of successor reference rates, and any potential effects of the transition away from LIBOR on investment instruments that use it as a benchmark rate. The transition process may result in, among other things, increased volatility or illiquidity in markets for instruments that currently rely on LIBOR and could negatively impact the value of certain instruments held by the Fund.
Wells Fargo Asset Management is monitoring LIBOR exposure closely and has put resources and controls in place to manage this transition effectively. The Fund’s portfolio management team is evaluating LIBOR holdings to understand what happens to those securities when LIBOR ceases to exist, including examining security documentation to identify the presence or absence of fallback language identifying a replacement rate to LIBOR.
While the pace of transition away from LIBOR will differ by asset class and investment strategy, the portfolio management team will monitor market conditions for those holdings to identify and mitigate deterioration or volatility in pricing and liquidity and ensure appropriate actions are taken in a timely manner.
Further information regarding the potential risks associated with the discontinuation of LIBOR can be found in the Fund’s Statement of Additional Information.
4 | Wells Fargo Global Investment Grade Credit Fund
This page is intentionally left blank.
Performance highlights (unaudited)
| Investment objective | The Fund seeks total return, consisting of income and capital appreciation. |
| Manager | Wells Fargo Funds Management, LLC |
| Subadvisers | Wells Capital Management Incorporated |
| | Wells Fargo Asset Management (International) Limited |
| Portfolio managers | Henrietta Pacquement, CFA®‡, Scott M. Smith, CFA®‡, Alex Temple, Jonathan Terry, CFA®‡ |
| Average annual total returns (%) as of March 31, 2021 |
| | | | | Expense ratios1 (%) |
| | Inception date | 1 year | Since inception | Gross | Net 2 |
| Class R6 (WGCRX) | 2-28-2019 | 11.12 | 7.29 | 0.77 | 0.45 |
| Institutional Class (WGCIX) | 2-28-2019 | 11.05 | 7.24 | 0.82 | 0.50 |
| Bloomberg Barclays Global Aggregate Credit Index Hedged (USD)3 | – | 7.98 | 6.63 * | – | – |
Figures quoted represent past performance, which is no guarantee of future results, and do not reflect taxes that a shareholder may pay on an investment in a fund. Investment return and principal value of an investment will fluctuate so that an investor’s shares, when redeemed, may be worth more or less than their original cost. Current performance may be lower or higher than the performance data quoted, which assumes the reinvestment of dividends and capital gains. Current month-end performance is available on the Fund’s website, wfam.com
Index returns do not include transaction costs associated with buying and selling securities, any mutual fund fees or expenses, or any taxes. It is not possible to invest directly in an index.
Class R6 and Institutional Class shares are sold without a front-end sales charge or contingent deferred sales charge.
| * | Based on the inception date of the oldest Fund class. |
| 1 | Reflects the expense ratios as stated in the most recent prospectuses. The expense ratios shown are subject to change and may differ from the annualized expense ratios shown in the financial highlights of this report. |
| 2 | The manager has contractually committed through January 31, 2022, to waive fees and/or reimburse expenses to the extent necessary to cap total annual fund operating expenses after fee waivers at 0.45% for Class R6 and 0.50% for Institutional Class. Brokerage commissions, stamp duty fees, interest, taxes, acquired fund fees and expenses (if any), and extraordinary expenses are excluded from the expense caps. Prior to or after the commitment expiration date, the caps may be increased or the commitment to maintain the caps may be terminated only with the approval of the Board of Trustees. Without these caps, the Fund’s returns would have been lower. The expense ratio paid by an investor is the net expense ratio (the total annual fund operating expenses after fee waivers) as stated in the prospectuses. |
| 3 | Bloomberg Barclays Global Aggregate Credit Index Hedged (USD) measures the credit sector of the global investment grade fixed-rate bond market, including corporate, government and agency securities, hedged in USD. You cannot invest directly in an index. |
Bond values fluctuate in response to the financial condition of individual issuers, general market and economic conditions, and changes in interest rates. Changes in market conditions and government policies may lead to periods of heightened volatility in the bond market and reduced liquidity for certain bonds held by the Fund. In general, when interest rates rise, bond values fall and investors may lose principal value. Interest rate changes and their impact on the Fund and its share price can be sudden and unpredictable. Foreign investments are especially volatile and can rise or fall dramatically due to differences in the political and economic conditions of the host country. These risks are generally intensified in emerging markets. The use of derivatives may reduce returns and/or increase volatility. Securities issued by U.S. government agencies or government-sponsored entities may not be guaranteed by the U.S. Treasury. Certain investment strategies tend to increase the total risk of an investment (relative to the broader market). The Fund is exposed to municipal securities risk, high-yield securities risk, and mortgage- and asset backed securities risk. Consult the Fund’s prospectus for additional information on these and other risks.
| ‡ | CFA® and Chartered Financial Analyst® are trademarks owned by CFA Institute. |
6 | Wells Fargo Global Investment Grade Credit Fund
Performance highlights (unaudited)
| Ten largest holdings (%) as of March 31, 20211 |
| Morgan Stanley, 3.13%, 7-27-2026 | 1.37 |
| Bank of America Corporation, 4.13%, 1-22-2024 | 1.36 |
| Citigroup Incorporated, 3.30%, 4-27-2025 | 1.27 |
| Toronto Dominion Bank, 3.23%, 7-24-2024 | 1.25 |
| American International Group Incorporated, 4.75%, 4-1-2048 | 1.18 |
| GE Capital International Funding Company, 4.42%, 11-15-2035 | 1.14 |
| Tencent Holdings Limited, 3.60%, 1-19-2028 | 1.08 |
| Goldman Sachs Group Incorporated, 3.63%, 1-22-2023 | 1.05 |
| Energy Transfer Operating Partners LP, 6.25%, 4-15-2049 | 1.03 |
| Verizon Communications Incorporated, 3.40%, 3-22-2041 | 1.02 |
| 1 | Figures represent the percentage of the Fund's net assets. Holdings are subject to change and may have changed since the date specified. |
| Portfolio composition as of March 31, 20211 |
| 1 | Figures represent the percentage of the Fund's long-term investments. These amounts are subject to change and may have changed since the date specified. |
| Credit quality as of March 31, 20211 |
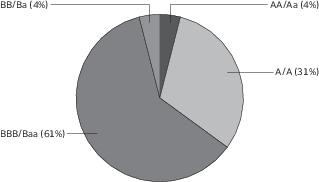
| 1 | The credit quality distribution of portfolio holdings reflected in the chart is based on ratings from Standard & Poor’s, Moody’s Investors Service, and/ or Fitch Ratings Ltd. Credit quality ratings apply to the underlying holdings of the Fund and not to the Fund itself. The percentages of the Fund’s portfolio with the ratings depicted in the chart are calculated based on the market value of fixed income securities held by the Fund. If a security was rated by all three rating agencies, the middle rating was utilized. If rated by two of the three rating agencies, the lower rating was utilized, and if rated by one of the rating agencies, that rating was utilized. Standard & Poor’s rates the creditworthiness of bonds, ranging from AAA (highest) to D (lowest). Ratings from A to CCC may be modified by the addition of a plus (+) or minus (-) sign to show relative standing within the rating categories. Standard & Poor’s rates the creditworthiness of short-term notes from SP-1 (highest) to SP-3 (lowest). Moody’s rates the creditworthiness of bonds, ranging from Aaa (highest) to C (lowest). Ratings Aa to B may be modified by the addition of a number 1 (highest) to 3 (lowest) to show relative standing within the ratings categories. Moody’s rates the creditworthiness of short-term U.S. tax-exempt municipal securities from MIG 1/VMIG 1 (highest) to SG (lowest). Fitch rates the creditworthiness of bonds, ranging from AAA (highest) to D (lowest). Credit quality distribution is subject to change and may have changed since the date specified. |
| Effective maturity distribution as of March 31, 20211 |
| 1 | Amounts are calculated based on the total long-term investments of the Fund. These amounts are subject to change and may have changed since the date specified. |
Wells Fargo Global Investment Grade Credit Fund | 7
Fund expenses (unaudited)
As a shareholder of the Fund, you incur ongoing costs, including management fees, and other Fund expenses. This example is intended to help you understand your ongoing costs (in dollars) of investing in the Fund and to compare these costs with the ongoing costs of investing in other mutual funds.
The example is based on an investment of $1,000 invested at the beginning of the six-month period and held for the entire period from October 1, 2020 to March 31, 2021.
Actual expenses
The “Actual” line of the table below provides information about actual account values and actual expenses. You may use the information in this line, together with the amount you invested, to estimate the expenses that you paid over the period. Simply divide your account value by $1,000 (for example, an $8,600 account value divided by $1,000 = 8.6), then multiply the result by the number in the “Actual” line under the heading entitled “Expenses paid during period” for your applicable class of shares to estimate the expenses you paid on your account during this period.
Hypothetical example for comparison purposes
The “Hypothetical” line of the table below provides information about hypothetical account values and hypothetical expenses based on the Fund’s actual expense ratio and an assumed rate of return of 5% per year before expenses, which is not the Fund’s actual return. The hypothetical account values and expenses may not be used to estimate the actual ending account balance or expenses you paid for the period. You may use this information to compare the ongoing costs of investing in the Fund and other funds. To do so, compare this 5% hypothetical example with the 5% hypothetical examples that appear in the shareholder reports of the other funds.
Please note that the expenses shown in the table are meant to highlight your ongoing costs only. Therefore, the “Hypothetical” line of the table is useful in comparing ongoing costs only and will not help you determine the relative total costs of owning different funds.
| | Beginning
account value
10-1-2020 | Ending
account value
3-31-2021 | Expenses
paid during
the period1 | Annualized net
expense ratio |
| Class R6 | | | | |
| Actual | $1,000.00 | $1,004.52 | $2.25 | 0.45% |
| Hypothetical (5% return before expenses) | $1,000.00 | $1,022.69 | $2.27 | 0.45% |
| Institutional Class | | | | |
| Actual | $1,000.00 | $1,004.27 | $2.50 | 0.50% |
| Hypothetical (5% return before expenses) | $1,000.00 | $1,022.44 | $2.52 | 0.50% |
1 Expenses paid is equal to the annualized net expense ratio of each class multiplied by the average account value over the period, multiplied by the number of days in the most recent fiscal half-year divided by the number of days in the fiscal year (to reflect the one-half-year period).
8 | Wells Fargo Global Investment Grade Credit Fund
Portfolio of investments—March 31, 2021 (unaudited)
| | | Interest
rate | Maturity
date | Principal | Value |
| Asset-backed securities: 2.62% | | | | | | |
| American Airlines Series 2014-1 Class A Pass-Through Trust | | 3.70% | 4-1-2028 | $ | 247,124 | $ 245,295 |
| Avolon Holdings Limited 144A | | 4.38 | 5-1-2026 | | 485,000 | 507,016 |
| British Airways Series 2019-1 Class AA Pass-Through Trust 144A | | 3.30 | 6-15-2034 | | 615,232 | 612,860 |
| Delta Air Lines Series 2019-1 Class AA Pass-Through Trust | | 3.20 | 10-25-2025 | | 400,000 | 414,354 |
| Total Asset-backed securities (Cost $1,783,785) | | | | | | 1,779,525 |
| Corporate bonds and notes: 51.64% | | | | | | |
| Communication services: 7.60% | | | | | | |
| Diversified telecommunication services: 4.50% | | | | | | |
| AT&T Incorporated | | 3.65 | 6-1-2051 | | 460,000 | 444,909 |
| AT&T Incorporated | | 4.25 | 3-1-2027 | | 505,000 | 567,520 |
| T-Mobile USA Incorporated 144A | | 2.55 | 2-15-2031 | | 60,000 | 58,781 |
| T-Mobile USA Incorporated 144A | | 3.30 | 2-15-2051 | | 235,000 | 219,624 |
| T-Mobile USA Incorporated 144A | | 3.75 | 4-15-2027 | | 220,000 | 240,495 |
| Verizon Communications Incorporated | | 2.88 | 1-15-2038 | | 200,000 | 289,453 |
| Verizon Communications Incorporated | | 3.40 | 3-22-2041 | | 685,000 | 695,402 |
| Verizon Communications Incorporated | | 4.13 | 8-15-2046 | | 500,000 | 547,475 |
| | | | | | | 3,063,659 |
| Entertainment: 0.24% | | | | | | |
| The Walt Disney Company | | 3.60 | 1-13-2051 | | 150,000 | 159,602 |
| Media: 2.86% | | | | | | |
| Charter Communications Operating LLC | | 2.80 | 4-1-2031 | | 135,000 | 133,230 |
| Charter Communications Operating LLC | | 4.20 | 3-15-2028 | | 275,000 | 303,129 |
| Charter Communications Operating LLC | | 4.91 | 7-23-2025 | | 85,000 | 96,360 |
| Comcast Corporation | | 3.40 | 4-1-2030 | | 155,000 | 167,822 |
| Cox Communications Incorporated 144A | | 4.60 | 8-15-2047 | | 355,000 | 406,828 |
| Fox Corporation | | 4.71 | 1-25-2029 | | 525,000 | 604,312 |
| ViacomCBS Incorporated | | 4.95 | 1-15-2031 | | 200,000 | 235,875 |
| | | | | | | 1,947,556 |
| Consumer discretionary: 2.51% | | | | | | |
| Automobiles: 0.80% | | | | | | |
| Ford Motor Company | | 9.00 | 4-22-2025 | | 170,000 | 205,890 |
| General Motors Company | | 6.13 | 10-1-2025 | | 285,000 | 335,134 |
| | | | | | | 541,024 |
| Hotels, restaurants & leisure: 0.68% | | | | | | |
| Las Vegas Sands Corporation | | 3.90 | 8-8-2029 | | 200,000 | 205,521 |
| McDonald's Corporation | | 1.45 | 9-1-2025 | | 200,000 | 201,912 |
| McDonald's Corporation | | 4.20 | 4-1-2050 | | 50,000 | 56,788 |
| | | | | | | 464,221 |
| Internet & direct marketing retail: 0.37% | | | | | | |
| Booking Holdings Incorporated | | 1.80 | 3-3-2027 | | 200,000 | 254,905 |
The accompanying notes are an integral part of these financial statements.
Wells Fargo Global Investment Grade Credit Fund | 9
Portfolio of investments—March 31, 2021 (unaudited)
| | | Interest
rate | Maturity
date | Principal | Value |
| Specialty retail: 0.42% | | | | | | |
| Home Depot Incorporated | | 2.70% | 4-15-2030 | $ | 65,000 | $ 67,760 |
| TJX Companies Incorporated | | 1.60 | 5-15-2031 | | 230,000 | 214,538 |
| | | | | | | 282,298 |
| Textiles, apparel & luxury goods: 0.24% | | | | | | |
| Ralph Lauren Corporation | | 2.95 | 6-15-2030 | | 160,000 | 165,045 |
| Consumer staples: 2.38% | | | | | | |
| Beverages: 0.99% | | | | | | |
| Coca-Cola Company | | 0.13 | 3-15-2029 | | 200,000 | 232,126 |
| Keurig Dr Pepper Incorporated | | 4.60 | 5-25-2028 | | 380,000 | 438,942 |
| | | | | | | 671,068 |
| Food products: 0.80% | | | | | | |
| Mars Incorporated 144A | | 3.95 | 4-1-2049 | | 290,000 | 326,649 |
| Smithfield Foods Incorporated 144A | | 3.00 | 10-15-2030 | | 220,000 | 218,788 |
| | | | | | | 545,437 |
| Tobacco: 0.59% | | | | | | |
| BAT Capital Corporation | | 4.54 | 8-15-2047 | | 400,000 | 402,755 |
| Energy: 4.99% | | | | | | |
| Oil, gas & consumable fuels: 4.99% | | | | | | |
| Energy Transfer Operating Partners LP | | 3.75 | 5-15-2030 | | 245,000 | 252,587 |
| Energy Transfer Operating Partners LP | | 6.25 | 4-15-2049 | | 595,000 | 698,415 |
| Exxon Mobil Corporation | | 2.61 | 10-15-2030 | | 395,000 | 402,523 |
| Kinder Morgan Energy Partners LP | | 5.40 | 9-1-2044 | | 305,000 | 357,445 |
| Marathon Petroleum Corporation | | 3.80 | 4-1-2028 | | 340,000 | 367,436 |
| MPLX LP | | 4.00 | 3-15-2028 | | 485,000 | 535,619 |
| Sabine Pass Liquefaction LLC | | 4.50 | 5-15-2030 | | 165,000 | 185,161 |
| Sabine Pass Liquefaction LLC | | 5.75 | 5-15-2024 | | 530,000 | 598,024 |
| | | | | | | 3,397,210 |
| Financials: 17.56% | | | | | | |
| Banks: 3.90% | | | | | | |
| Bank of America Corporation | | 4.13 | 1-22-2024 | | 850,000 | 929,045 |
| Citigroup Incorporated | | 3.30 | 4-27-2025 | | 800,000 | 861,782 |
| JPMorgan Chase & Company (U.S. SOFR+2.52%) ± | | 2.96 | 5-13-2031 | | 225,000 | 229,161 |
| JPMorgan Chase & Company (3 Month LIBOR+1.34%) ± | | 3.78 | 2-1-2028 | | 220,000 | 242,480 |
| Santander Holdings USA Incorporated | | 4.40 | 7-13-2027 | | 355,000 | 394,892 |
| | | | | | | 2,657,360 |
| Capital markets: 8.31% | | | | | | |
| Belrose Funding Trust 144A | | 2.33 | 8-15-2030 | | 285,000 | 274,492 |
| Blackrock Incorporated | | 1.90 | 1-28-2031 | | 55,000 | 53,197 |
| BP Capital Markets America Incorporated | | 2.94 | 6-4-2051 | | 530,000 | 472,699 |
| Cantor Fitzgerald LP 144A | | 4.88 | 5-1-2024 | | 610,000 | 675,327 |
| Credit Suisse Group AG | | 3.63 | 9-9-2024 | | 580,000 | 628,543 |
| Five Corners Funding Trust 144A | | 2.85 | 5-15-2030 | | 100,000 | 103,061 |
| Five Corners Funding Trust 144A | | 4.42 | 11-15-2023 | | 10,000 | 10,970 |
| FS KKR Capital Corporation | | 3.40 | 1-15-2026 | | 240,000 | 238,049 |
| Goldman Sachs Group Incorporated | | 3.63 | 1-22-2023 | | 675,000 | 711,732 |
The accompanying notes are an integral part of these financial statements.
10 | Wells Fargo Global Investment Grade Credit Fund
Portfolio of investments—March 31, 2021 (unaudited)
| | | Interest
rate | Maturity
date | Principal | Value |
| Capital markets (continued) | | | | | | |
| Intercontinental Exchange Incorporated | | 3.00% | 6-15-2050 | $ | 215,000 | $ 200,346 |
| Intercontinental Exchange Incorporated | | 3.75 | 12-1-2025 | | 200,000 | 219,298 |
| Morgan Stanley | | 3.13 | 7-27-2026 | | 865,000 | 930,982 |
| Morgan Stanley | | 3.70 | 10-23-2024 | | 475,000 | 520,010 |
| Raymond James Financial Services Incorporated | | 4.65 | 4-1-2030 | | 135,000 | 157,083 |
| S&P Global Incorporated | | 1.25 | 8-15-2030 | | 155,000 | 141,911 |
| S&P Global Incorporated | | 2.30 | 8-15-2060 | | 140,000 | 113,751 |
| State Street Corporation | | 2.40 | 1-24-2030 | | 200,000 | 203,475 |
| | | | | | | 5,654,926 |
| Consumer finance: 3.61% | | | | | | |
| American Express Credit Corporation | | 3.30 | 5-3-2027 | | 430,000 | 470,448 |
| Anheuser-Busch InBev Finance Incorporated | | 3.65 | 2-1-2026 | | 445,000 | 487,758 |
| Aviation Capital Group Corporation 144A | | 2.88 | 1-20-2022 | | 395,000 | 400,725 |
| Aviation Capital Group Corporation 144A | | 5.50 | 12-15-2024 | | 465,000 | 519,935 |
| Hyundai Capital America Corporation 144A | | 1.80 | 10-15-2025 | | 455,000 | 454,538 |
| Hyundai Capital America Corporation 144A | | 1.80 | 1-10-2028 | | 130,000 | 124,309 |
| | | | | | | 2,457,713 |
| Insurance: 1.74% | | | | | | |
| American International Group Incorporated | | 4.75 | 4-1-2048 | | 675,000 | 803,866 |
| Berkshire Hathaway Incorporated | | 2.38 | 6-19-2039 | | 100,000 | 145,036 |
| Brighthouse Financial Incorporated | | 4.70 | 6-22-2047 | | 149,000 | 152,035 |
| Unum Group | | 4.50 | 12-15-2049 | | 80,000 | 80,253 |
| | | | | | | 1,181,190 |
| Health care: 3.11% | | | | | | |
| Biotechnology: 0.95% | | | | | | |
| AbbVie Incorporated 144A | | 2.60 | 11-21-2024 | | 370,000 | 390,645 |
| AbbVie Incorporated 144A | | 4.25 | 11-21-2049 | | 225,000 | 254,596 |
| | | | | | | 645,241 |
| Health care providers & services: 1.46% | | | | | | |
| Anthem Incorporated | | 2.25 | 5-15-2030 | | 30,000 | 29,525 |
| CVS Health Corporation | | 4.25 | 4-1-2050 | | 165,000 | 185,213 |
| CVS Health Corporation | | 4.30 | 3-25-2028 | | 102,000 | 115,829 |
| Magellan Health Incorporated | | 4.90 | 9-22-2024 | | 240,000 | 257,400 |
| UnitedHealth Group Incorporated | | 2.90 | 5-15-2050 | | 195,000 | 186,735 |
| Walgreen Company | | 4.40 | 9-15-2042 | | 210,000 | 220,097 |
| | | | | | | 994,799 |
| Life sciences tools & services: 0.35% | | | | | | |
| Thermo Fisher Scientific Incorporated | | 1.50 | 10-1-2039 | | 200,000 | 239,484 |
| Pharmaceuticals: 0.35% | | | | | | |
| Bristol-Myers Squibb Company | | 2.55 | 11-13-2050 | | 265,000 | 235,509 |
| Industrials: 2.63% | | | | | | |
| Aerospace & defense: 0.69% | | | | | | |
| United Technologies Corporation | | 4.13 | 11-16-2028 | | 415,000 | 467,345 |
| Airlines: 0.42% | | | | | | |
| US Airways Group Incorporated | | 4.63 | 12-3-2026 | | 307,851 | 290,253 |
The accompanying notes are an integral part of these financial statements.
Wells Fargo Global Investment Grade Credit Fund | 11
Portfolio of investments—March 31, 2021 (unaudited)
| | | Interest
rate | Maturity
date | Principal | Value |
| Professional services: 0.41% | | | | | | |
| Equifax Incorporated | | 3.10% | 5-15-2030 | $ | 270,000 | $ 280,258 |
| Road & rail: 1.11% | | | | | | |
| Penske Truck Leasing Company LP 144A | | 3.45 | 7-1-2024 | | 370,000 | 398,726 |
| Union Pacific Corporation | | 2.40 | 2-5-2030 | | 355,000 | 355,747 |
| | | | | | | 754,473 |
| Information technology: 5.67% | | | | | | |
| Communications equipment: 0.90% | | | | | | |
| Motorola Solutions Incorporated | | 4.60 | 2-23-2028 | | 540,000 | 614,705 |
| Electronic equipment, instruments & components: 0.35% | | | | | | |
| Jabil Incorporated | | 3.60 | 1-15-2030 | | 230,000 | 240,871 |
| IT services: 1.11% | | | | | | |
| Fiserv Incorporated | | 2.65 | 6-1-2030 | | 70,000 | 70,499 |
| Fiserv Incorporated | | 3.50 | 7-1-2029 | | 215,000 | 231,899 |
| Western Union Company | | 4.25 | 6-9-2023 | | 420,000 | 450,352 |
| | | | | | | 752,750 |
| Semiconductors & semiconductor equipment: 1.33% | | | | | | |
| Marvell Technology Group Limited | | 4.88 | 6-22-2028 | | 120,000 | 137,556 |
| Microchip Technology Incorporated 144A | | 2.67 | 9-1-2023 | | 230,000 | 239,529 |
| Qualcomm Incorporated | | 3.25 | 5-20-2027 | | 485,000 | 529,626 |
| | | | | | | 906,711 |
| Software: 0.94% | | | | | | |
| Oracle Corporation | | 2.88 | 3-25-2031 | | 545,000 | 554,774 |
| Oracle Corporation | | 3.60 | 4-1-2050 | | 85,000 | 82,329 |
| | | | | | | 637,103 |
| Technology hardware, storage & peripherals: 1.04% | | | | | | |
| Apple Incorporated | | 3.60 | 7-31-2042 | | 100,000 | 180,678 |
| Dell International LLC / EMC Corporation 144A | | 5.45 | 6-15-2023 | | 260,000 | 284,143 |
| Dell International LLC / EMC Corporation 144A | | 6.20 | 7-15-2030 | | 145,000 | 180,047 |
| NetApp Incorporated | | 2.70 | 6-22-2030 | | 60,000 | 59,569 |
| | | | | | | 704,437 |
| Materials: 1.03% | | | | | | |
| Chemicals: 1.03% | | | | | | |
| Nutrition and Biosciences Incorporated 144A | | 2.30 | 11-1-2030 | | 475,000 | 460,420 |
| Westlake Chemical Corporation | | 1.63 | 7-17-2029 | | 200,000 | 243,947 |
| | | | | | | 704,367 |
| Real estate: 2.14% | | | | | | |
| Equity REITs: 1.27% | | | | | | |
| Equinix Incorporated | | 2.15 | 7-15-2030 | | 425,000 | 404,065 |
| Sabra Health Care LP / Sabra Capital Corporation | | 4.80 | 6-1-2024 | | 160,000 | 174,180 |
| Simon Property Group LP | | 1.75 | 2-1-2028 | | 95,000 | 92,185 |
| VEREIT Operating Partnership LP | | 2.85 | 12-15-2032 | | 200,000 | 193,690 |
| | | | | | | 864,120 |
The accompanying notes are an integral part of these financial statements.
12 | Wells Fargo Global Investment Grade Credit Fund
Portfolio of investments—March 31, 2021 (unaudited)
| | | Interest
rate | Maturity
date | Principal | Value |
| Real estate management & development: 0.87% | | | | | | |
| American Campus Communities Incorporated | | 3.88% | 1-30-2031 | $ | 210,000 | $ 225,828 |
| Simon Property Group LP | | 3.25 | 9-13-2049 | | 390,000 | 364,873 |
| | | | | | | 590,701 |
| Utilities: 2.02% | | | | | | |
| Electric utilities: 2.02% | | | | | | |
| Duke Energy Florida LLC | | 1.75 | 6-15-2030 | | 140,000 | 132,410 |
| Nevada Power Company | | 2.40 | 5-1-2030 | | 195,000 | 194,332 |
| New York State Electric & Gas Corporation 144A | | 3.25 | 12-1-2026 | | 220,000 | 237,812 |
| Oglethorpe Power Corporation 144A | | 3.75 | 8-1-2050 | | 195,000 | 189,377 |
| Pacificorp | | 3.50 | 6-15-2029 | | 450,000 | 490,100 |
| Union Electric Company | | 2.95 | 3-15-2030 | | 125,000 | 131,072 |
| | | | | | | 1,375,103 |
| Total Corporate bonds and notes (Cost $33,510,879) | | | | | | 35,144,199 |
| Foreign corporate bonds and notes: 26.84% | | | | | | |
| Communication services: 0.51% | | | | | | |
| Diversified telecommunication services: 0.32% | | | | | | |
| Deutsche Telekom International Finance BV | | 2.25 | 4-13-2029 | GBP | 150,000 | 215,697 |
| Wireless telecommunication services: 0.19% | | | | | | |
| Tele2 AB | | 2.13 | 5-15-2028 | EUR | 100,000 | 130,229 |
| Consumer discretionary: 0.75% | | | | | | |
| Automobiles: 0.35% | | | | | | |
| Renault SA | | 2.38 | 5-25-2026 | EUR | 200,000 | 237,218 |
| Textiles, apparel & luxury goods: 0.40% | | | | | | |
| Burberry Group plc | | 1.13 | 9-21-2025 | GBP | 200,000 | 272,539 |
| Consumer staples: 1.21% | | | | | | |
| Beverages: 0.18% | | | | | | |
| Coca-Cola European Partners plc | | 1.50 | 11-8-2027 | EUR | 100,000 | 125,884 |
| Food & staples retailing: 0.36% | | | | | | |
| Tesco Corporate Treasury Services plc | | 0.88 | 5-29-2026 | EUR | 200,000 | 241,775 |
| Household products: 0.67% | | | | | | |
| Essity AB | | 0.25 | 2-8-2031 | EUR | 400,000 | 452,666 |
| Energy: 1.40% | | | | | | |
| Oil, gas & consumable fuels: 1.40% | | | | | | |
| BP Capital Markets plc (EUR Swap Annual (vs. 6 Month EURIBOR) 5 Year +3.88%) ʊ± | | 3.25 | 3-22-2026 | EUR | 100,000 | 125,625 |
| BP Capital Markets plc (U.S. Treasury 3 Month Bill +4.17%) ʊ± | | 4.25 | 3-22-2027 | GBP | 100,000 | 146,132 |
| National Grid Gas plc | | 1.13 | 1-14-2033 | GBP | 200,000 | 247,481 |
| Shell International Finance BV | | 1.00 | 12-10-2030 | GBP | 150,000 | 193,245 |
| Total SA (EUR Swap Annual (vs. 6 Month EURIBOR) 5 Year +2.75%) ± | | 2.71 | 12-29-2049 | EUR | 200,000 | 243,247 |
| | | | | | | 955,730 |
The accompanying notes are an integral part of these financial statements.
Wells Fargo Global Investment Grade Credit Fund | 13
Portfolio of investments—March 31, 2021 (unaudited)
| | | Interest
rate | Maturity
date | Principal | Value |
| Financials: 13.04% | | | | | | |
| Banks: 8.62% | | | | | | |
| Argenta Spaarbank NV (EUR Swap Annual (vs. 6 Month EURIBOR) 5 Year +3.95%) ± | | 3.88% | 5-24-2026 | EUR | 200,000 | $ 235,713 |
| Australia and New Zealand Banking Group (EUR Swap Annual (vs. 6 Month EURIBOR) 5 Year +1.12%) ± | | 0.67 | 5-5-2031 | EUR | 100,000 | 117,019 |
| Banco BPM SpA | | 2.50 | 6-21-2024 | EUR | 200,000 | 247,745 |
| Banco de Sabadell SA | | 1.13 | 3-27-2025 | EUR | 200,000 | 236,706 |
| Bankia SA | | 1.13 | 11-12-2026 | EUR | 100,000 | 120,468 |
| Bankinter SA | | 0.63 | 10-6-2027 | EUR | 200,000 | 234,899 |
| Banque Federative du Credit Mutuel | | 3.00 | 5-21-2024 | EUR | 100,000 | 127,676 |
| Barclays plc (GBP Swap Semi Annual (vs. 6 Month LIBOR) 1 Year +1.32%) ± | | 2.38 | 10-6-2023 | GBP | 100,000 | 140,970 |
| Bawag Group AG (EUR Swap Annual (vs. 6 Month EURIBOR) 5 Year +2.30%) ± | | 2.38 | 3-26-2029 | EUR | 100,000 | 121,804 |
| BNP Paribas | | 1.25 | 3-19-2025 | EUR | 300,000 | 367,603 |
| Credit Agricole Assurances | | 2.00 | 7-17-2030 | EUR | 300,000 | 368,145 |
| FCA Bank SpA | | 1.63 | 9-29-2021 | GBP | 100,000 | 138,471 |
| Jyske Bank AS (EUR Swap Annual (vs. 6 Month EURIBOR) 5 Year +1.90%) ± | | 2.25 | 4-5-2029 | EUR | 150,000 | 183,439 |
| Landesbank Baden-Wurttemberg (EUR Swap Annual (vs. 6 Month EURIBOR) 5 Year +1.77%) ± | | 2.88 | 5-27-2026 | EUR | 100,000 | 117,621 |
| Landsbankinn HF | | 1.38 | 3-14-2022 | EUR | 100,000 | 118,761 |
| Lloyds Banking Group plc (EUR Swap Annual (vs. 6 Month EURIBOR) 1 Year +0.85%) ± | | 0.50 | 11-12-2025 | EUR | 200,000 | 237,406 |
| Lloyds Banking Group plc | | 2.25 | 10-16-2024 | GBP | 100,000 | 143,036 |
| Mizuho Financial Group | | 0.80 | 4-15-2030 | EUR | 200,000 | 238,341 |
| NIBC Bank NV | | 2.00 | 4-9-2024 | EUR | 200,000 | 244,839 |
| Raiffeisen Bank International AG (EURIBOR ICE Swap Rate 11:00am +3.15%) ± | | 2.88 | 6-18-2032 | EUR | 200,000 | 252,347 |
| Royal Bank of Canada | | 1.97 | 3-2-2022 | CAD | 200,000 | 161,569 |
| Royal Bank of Canada | | 2.00 | 3-21-2022 | CAD | 400,000 | 323,533 |
| Royal Bank of Scotland Group plc (GBP Swap Semi Annual (vs. 6 Month LIBOR) 1 Year +1.49%) ± | | 2.88 | 9-19-2026 | GBP | 200,000 | 292,742 |
| Toronto Dominion Bank | | 3.23 | 7-24-2024 | CAD | 1,000,000 | 853,107 |
| Unicredit SpA (EUR Swap Annual (vs. 6 Month EURIBOR) 5 Year +2.80%) ± | | 2.73 | 1-15-2032 | EUR | 200,000 | 238,987 |
| | | | | | | 5,862,947 |
| Capital markets: 0.96% | | | | | | |
| Credit Suisse Group AG (UK Gilts 1 Year +2.23%) ± | | 2.25 | 6-9-2028 | GBP | 300,000 | 420,056 |
| UBS Group AG (EUR Swap Annual (vs. 6 Month EURIBOR) 1 Year +0.55%) ± | | 0.25 | 1-29-2026 | EUR | 200,000 | 235,147 |
| | | | | | | 655,203 |
| Consumer finance: 0.45% | | | | | | |
| PSA Banque France | | 0.63 | 6-21-2024 | EUR | 100,000 | 119,322 |
| Transurban Finance Company | | 1.75 | 3-29-2028 | EUR | 150,000 | 190,013 |
| | | | | | | 309,335 |
| Diversified financial services: 0.26% | | | | | | |
| Nykredit Realkredit AS | | 0.88 | 1-17-2024 | EUR | 150,000 | 180,274 |
| Insurance: 2.75% | | | | | | |
| Aviva plc (ICE LIBOR GBP 6 Month +4.14%) ± | | 6.63 | 6-3-2041 | GBP | 200,000 | 278,237 |
The accompanying notes are an integral part of these financial statements.
14 | Wells Fargo Global Investment Grade Credit Fund
Portfolio of investments—March 31, 2021 (unaudited)
| | | Interest
rate | Maturity
date | Principal | Value |
| Insurance (continued) | | | | | | |
| Legal & General Group plc (U.S. Treasury 3 Month Bill +9.33%) ± | | 10.00% | 7-23-2041 | GBP | 200,000 | $ 283,172 |
| Mandatum Life Insurance Company Limited (3 Month EURIBOR +2.30%) ± | | 1.88 | 10-4-2049 | EUR | 300,000 | 358,741 |
| Munich Re Group (ICE LIBOR GBP 3 Month +4.95%) ± | | 6.63 | 5-26-2042 | GBP | 200,000 | 293,402 |
| Sampo Oyj | | 1.63 | 2-21-2028 | EUR | 100,000 | 128,747 |
| Sampo Oyj (3 Month EURIBOR +4.05%) ± | | 3.38 | 5-23-2049 | EUR | 200,000 | 268,633 |
| Swiss Re Finance (Luxembourg) SA (EURIBOR ICE Swap Rate 11:00am +2.85%) ± | | 2.53 | 4-30-2050 | EUR | 200,000 | 257,365 |
| | | | | | | 1,868,297 |
| Health care: 2.47% | | | | | | |
| Biotechnology: 0.48% | | | | | | |
| GlaxoSmithKline Capital Incorporated | | 1.63 | 5-12-2035 | GBP | 250,000 | 327,297 |
| Health care equipment & supplies: 0.65% | | | | | | |
| Molnlycke Holding AB | | 0.63 | 1-15-2031 | EUR | 200,000 | 227,024 |
| Motability Operations Group plc | | 2.38 | 7-3-2039 | GBP | 150,000 | 217,247 |
| | | | | | | 444,271 |
| Health care providers & services: 0.27% | | | | | | |
| Fresenius Medical Care AG & Company | | 1.50 | 5-29-2030 | EUR | 150,000 | 186,042 |
| Pharmaceuticals: 1.07% | | | | | | |
| Bayer AG (EURIBOR ICE Swap Rate 11:00am +2.65%) ± | | 2.38 | 11-12-2079 | EUR | 100,000 | 119,402 |
| Bayer AG (EUR Swap Annual (vs. 6 Month EURIBOR) 5 Year +3.11%) ± | | 3.13 | 11-12-2079 | EUR | 100,000 | 121,926 |
| Merck KGaA (EURIBOR ICE Swap Rate 11:00am +1.95%) ± | | 1.63 | 6-25-2079 | EUR | 200,000 | 241,342 |
| Phoenix PIB Dutch Finance BV | | 2.38 | 8-5-2025 | EUR | 200,000 | 242,186 |
| | | | | | | 724,856 |
| Industrials: 0.72% | | | | | | |
| Aerospace & defense: 0.38% | | | | | | |
| MTU Aero Engines AG | | 3.00 | 7-1-2025 | EUR | 200,000 | 256,871 |
| Commercial services & supplies: 0.34% | | | | | | |
| Rentokil Initial plc | | 0.50 | 10-14-2028 | EUR | 200,000 | 233,599 |
| Information technology: 0.18% | | | | | | |
| Semiconductors & semiconductor equipment: 0.18% | | | | | | |
| ASML Holding NV | | 0.63 | 5-7-2029 | EUR | 100,000 | 120,905 |
| Materials: 1.62% | | | | | | |
| Chemicals: 1.29% | | | | | | |
| Arkema SA (EUR Swap Annual (vs. 6 Month EURIBOR) 5 Year +1.57%) ʊ± | | 1.50 | 10-21-2025 | EUR | 100,000 | 116,892 |
| Arkema SA (EUR Swap Annual (vs. 6 Month EURIBOR) 5 Year +2.87%) ʊ± | | 2.75 | 6-17-2024 | EUR | 100,000 | 123,187 |
| Sika Capital BV | | 1.50 | 4-29-2031 | EUR | 100,000 | 128,976 |
| Solvay SA (EUR Swap Annual (vs. 6 Month EURIBOR) 5 Year +3.92%) ʊ± | | 4.25 | 12-4-2023 | EUR | 200,000 | 251,586 |
| Syngenta Finance NV | | 3.38 | 4-16-2026 | EUR | 200,000 | 254,748 |
| | | | | | | 875,389 |
The accompanying notes are an integral part of these financial statements.
Wells Fargo Global Investment Grade Credit Fund | 15
Portfolio of investments—March 31, 2021 (unaudited)
| | | Interest
rate | Maturity
date | Principal | Value |
| Construction materials: 0.33% | | | | | | |
| Holcim Finance (Luxembourg) SA | | 0.50% | 4-23-2031 | EUR | 200,000 | $ 227,081 |
| Real estate: 1.60% | | | | | | |
| Equity REITs: 0.37% | | | | | | |
| Inmobiliaria Colonial SA | | 1.45 | 10-28-2024 | EUR | 100,000 | 122,236 |
| Tritax Big Box REIT plc | | 1.50 | 11-27-2033 | GBP | 100,000 | 130,507 |
| | | | | | | 252,743 |
| Real estate management & development: 1.23% | | | | | | |
| Akelius Residential Property AB (EUR Swap Annual (vs. 6 Month EURIBOR) 5 Year +2.48%) ± | | 2.25 | 5-17-2081 | EUR | 100,000 | 115,951 |
| Akelius Residential Property AB (EURIBOR ICE Swap Rate 11:00am +3.49%) ± | | 3.88 | 10-5-2078 | EUR | 200,000 | 246,853 |
| Grand City Properties SA (EUR Swap Annual (vs. 6 Month EURIBOR) 5 Year +2.18%) ʊ± | | 1.50 | 3-11-2026 | EUR | 200,000 | 230,396 |
| Heimstaden Bostad AB | | 1.13 | 1-21-2026 | EUR | 200,000 | 241,389 |
| | | | | | | 834,589 |
| Utilities: 3.34% | | | | | | |
| Electric utilities: 2.40% | | | | | | |
| Electricite de France SA (EUR Swap Annual (vs. 6 Month EURIBOR) 5 Year +3.37%) ʊ± | | 2.88 | 12-15-2026 | EUR | 200,000 | 243,942 |
| Electricite de France SA | | 5.50 | 10-17-2041 | GBP | 200,000 | 396,240 |
| Enel Finance International NV | | 0.38 | 6-17-2027 | EUR | 100,000 | 119,031 |
| ESB Finance Designated Activity Company | | 1.13 | 6-11-2030 | EUR | 100,000 | 124,520 |
| Fortum Oyj | | 0.88 | 2-27-2023 | EUR | 100,000 | 119,450 |
| Iberdrola International BV (EUR Swap Annual (vs. 6 Month EURIBOR) 5 Year +2.32%) ʊ± | | 1.87 | 1-28-2026 | EUR | 300,000 | 359,726 |
| Reseau de Transport d'Electricite | | 1.88 | 10-23-2037 | EUR | 200,000 | 270,622 |
| | | | | | | 1,633,531 |
| Gas utilities: 0.59% | | | | | | |
| APT Pipelines Limited | | 2.00 | 7-15-2030 | EUR | 180,000 | 230,938 |
| Snam SpA | | 1.50 | 12-7-2028 | EUR | 150,000 | 170,582 |
| | | | | | | 401,520 |
| Water utilities: 0.35% | | | | | | |
| FCC Aqualia SA | | 1.41 | 6-8-2022 | EUR | 200,000 | 237,434 |
| Total Foreign corporate bonds and notes (Cost $17,164,817) | | | | | | 18,263,922 |
| Municipal obligations: 0.38% | | | | | | |
| New Jersey: 0.38% | | | | | | |
| Transportation revenue: 0.38% | | | | | | |
| New Jersey State Transportation Trust Fund Authority Transportation System Refunding Bond Series B | | 4.13 | 6-15-2042 | $ | 250,000 | 261,199 |
| Total Municipal obligations (Cost $250,000) | | | | | | 261,199 |
The accompanying notes are an integral part of these financial statements.
16 | Wells Fargo Global Investment Grade Credit Fund
Portfolio of investments—March 31, 2021 (unaudited)
| | | Interest
rate | Maturity
date | Principal | Value |
| Yankee corporate bonds and notes: 14.46% | | | | | | |
| Communication services: 2.99% | | | | | | |
| Interactive media & services: 1.08% | | | | | | |
| Tencent Holdings Limited 144A | | 3.60% | 1-19-2028 | $ | 685,000 | $ 733,592 |
| Media: 0.41% | | | | | | |
| WPP Finance Limited 2010 | | 3.75 | 9-19-2024 | | 255,000 | 277,619 |
| Wireless telecommunication services: 1.50% | | | | | | |
| Telefonica Emisiones SAU | | 4.10 | 3-8-2027 | | 400,000 | 447,258 |
| Vodafone Group plc | | 4.38 | 5-30-2028 | | 500,000 | 574,216 |
| | | | | | | 1,021,474 |
| Consumer discretionary: 1.12% | | | | | | |
| Automobiles: 0.82% | | | | | | |
| Nissan Motor Company 144A | | 3.52 | 9-17-2025 | | 260,000 | 275,426 |
| Nissan Motor Company 144A | | 4.35 | 9-17-2027 | | 260,000 | 282,756 |
| | | | | | | 558,182 |
| Internet & direct marketing retail: 0.30% | | | | | | |
| Prosus NV 144A | | 3.83 | 2-8-2051 | | 230,000 | 202,003 |
| Consumer staples: 0.86% | | | | | | |
| Household products: 0.86% | | | | | | |
| Reckitt Benckiser Treasury Services plc 144A | | 2.75 | 6-26-2024 | | 555,000 | 587,259 |
| Energy: 0.76% | | | | | | |
| Oil, gas & consumable fuels: 0.76% | | | | | | |
| Equinor ASA | | 2.38 | 5-22-2030 | | 45,000 | 44,890 |
| Saudi Arabian Oil Company 144A | | 4.38 | 4-16-2049 | | 75,000 | 81,354 |
| Siemens Financieringsmaatschappij NV 144A | | 2.35 | 10-15-2026 | | 380,000 | 393,061 |
| | | | | | | 519,305 |
| Financials: 7.29% | | | | | | |
| Banks: 4.45% | | | | | | |
| Banco Santander SA | | 3.49 | 5-28-2030 | | 400,000 | 416,437 |
| HSBC Holdings plc (U.S. SOFR+2.39%) ± | | 2.85 | 6-4-2031 | | 200,000 | 200,019 |
| HSBC Holdings plc | | 4.30 | 3-8-2026 | | 430,000 | 481,347 |
| Mitsubishi UFJ Financial Group Incorporated | | 2.56 | 2-25-2030 | | 200,000 | 199,857 |
| National Australia Bank 144A | | 2.33 | 8-21-2030 | | 260,000 | 245,606 |
| Royal Bank of Scotland Group plc | | 3.88 | 9-12-2023 | | 490,000 | 525,465 |
| Sumitomo Mitsui Financial Group | | 2.13 | 7-8-2030 | | 200,000 | 193,065 |
| Sumitomo Mitsui Financial Group | | 3.10 | 1-17-2023 | | 335,000 | 350,570 |
| Westpac Banking Corporation (5 Year Treasury Constant Maturity+1.35%) ± | | 2.89 | 2-4-2030 | | 105,000 | 108,151 |
| Westpac Banking Corporation | | 3.65 | 5-15-2023 | | 290,000 | 309,500 |
| | | | | | | 3,030,017 |
| Capital markets: 1.01% | | | | | | |
| Credit Suisse Group AG (U.S. SOFR+3.73%) 144A± | | 4.19 | 4-1-2031 | | 250,000 | 271,956 |
The accompanying notes are an integral part of these financial statements.
Wells Fargo Global Investment Grade Credit Fund | 17
Portfolio of investments—March 31, 2021 (unaudited)
| | | Interest
rate | Maturity
date | Principal | Value |
| Capital markets (continued) | | | | | | |
| Credit Suisse Group AG (5 Year Treasury Constant Maturity+3.55%) 144Aʊ± | | 4.50% | 9-3-2030 | $ | 200,000 | $ 187,500 |
| Macquarie Group Limited (3 Month LIBOR+1.02%) 144A± | | 3.19 | 11-28-2023 | | 220,000 | 228,991 |
| | | | | | | 688,447 |
| Diversified financial services: 1.14% | | | | | | |
| GE Capital International Funding Company | | 4.42 | 11-15-2035 | | 680,000 | 778,437 |
| Insurance: 0.69% | | | | | | |
| Athene Holding Limited | | 3.50 | 1-15-2031 | | 455,000 | 467,552 |
| Information technology: 0.82% | | | | | | |
| Semiconductors & semiconductor equipment: 0.82% | | | | | | |
| NXP BV 144A | | 3.40 | 5-1-2030 | | 130,000 | 137,274 |
| NXP BV 144A | | 3.88 | 6-18-2026 | | 380,000 | 418,259 |
| | | | | | | 555,533 |
| Real estate: 0.44% | | | | | | |
| Equity REITs: 0.44% | | | | | | |
| Scentre Group Trust 2 Company (5 Year Treasury Constant Maturity+4.69%) 144A± | | 5.13 | 9-24-2080 | | 285,000 | 296,528 |
| Utilities: 0.18% | | | | | | |
| Electric utilities: 0.18% | | | | | | |
| ESB Finance Designated Activity Company | | 1.13 | 6-11-2030 | | 100,000 | 124,520 |
| Total Yankee corporate bonds and notes (Cost $9,441,661) | | | | | | 9,840,468 |
| | | Yield | | | Shares | |
| Short-term investments: 2.77% | | | | | | |
| Investment companies: 2.77% | | | | | | |
| Wells Fargo Government Money Market Fund Select Class ♠∞ | | 0.03 | | | 1,885,887 | 1,885,887 |
| Total Short-term investments (Cost $1,885,887) | | | | | | 1,885,887 |
| Total investments in securities (Cost $64,037,029) | 98.71% | | | | | 67,175,200 |
| Other assets and liabilities, net | 1.29 | | | | | 876,263 |
| Total net assets | 100.00% | | | | | $68,051,463 |
| 144A | The security may be resold in transactions exempt from registration, normally to qualified institutional buyers, pursuant to Rule 144A under the Securities Act of 1933. |
| ± | Variable rate investment. The rate shown is the rate in effect at period end. |
| ♠ | The issuer of the security is an affiliated person of the Fund as defined in the Investment Company Act of 1940. |
| ∞ | The rate represents the 7-day annualized yield at period end. |
| ʊ | Security is perpetual in nature and has no stated maturity date. The date shown reflects the next call date. |
| Abbreviations: |
| CAD | Canadian dollar |
| EUR | Euro |
| EURIBOR | Euro Interbank Offered Rate |
| GBP | Great British pound |
| LIBOR | London Interbank Offered Rate |
| REIT | Real estate investment trust |
| SOFR | Secured Overnight Financing Rate |
The accompanying notes are an integral part of these financial statements.
18 | Wells Fargo Global Investment Grade Credit Fund
Portfolio of investments—March 31, 2021 (unaudited)
Investments in affiliates
An affiliated investment is an investment in which the Fund owns at least 5% of the outstanding voting shares of the issuer or as a result of other relationships, such as the Fund and the issuer having the same investment manager. Transactions with issuers that were either affiliated persons of the Fund at the beginning of the period or the end of the period were as follows:
| | Value,
beginning of
period | Purchases | Sales
proceeds | Net
realized
gains
(losses) | Net
change in
unrealized
gains
(losses) | Value,
end of
period | % of
net
assets | Shares,
end
of period | Income
from
affiliated
securities |
| Short-term investments | | | | | | | | | |
| Investment companies | | | | | | | | | |
| Wells Fargo Government Money Market Fund Select Class | $1,157,095 | $13,009,390 | $(12,280,598) | $0 | $0 | $1,885,887 | 2.77% | 1,885,887 | $210 |
Forward foreign currency contracts
Currency to be
received | Currency to be
delivered | Counterparty | Settlement
date | Unrealized
gains | | Unrealized
losses |
| 1,335,814 USD | 1,670,000 CAD | JPMorgan Chase & Company | 4-21-2021 | $ 6,873 | | $0 |
| 4,640,538 USD | 3,350,000 GBP | State Street Bank & Trust Company | 4-21-2021 | 22,002 | | 0 |
| 14,534,714 USD | 12,200,000 EUR | State Street Bank & Trust Company | 4-21-2021 | 223,324 | | 0 |
| | | | | $252,199 | | $0 |
Futures contracts
| Description | Number of
contracts | Expiration
date | Notional
cost | Notional
value | Unrealized
gains | Unrealized
losses |
| Long | | | | | | |
| Euro-Bund Futures | 6 | 6-8-2021 | $1,205,591 | $1,205,160 | $0 | $(431) |
The accompanying notes are an integral part of these financial statements.
Wells Fargo Global Investment Grade Credit Fund | 19
Statement of assets and liabilities—March 31, 2021 (unaudited)
| | |
| Assets | |
Investments in unaffiliated securities, at value (cost $62,151,142)
| $ 65,289,313 |
Investments in affiliated securites, at value (cost $1,885,887)
| 1,885,887 |
Cash at broker segregated for futures contracts
| 16,758 |
Foreign currency, at value (cost $72,264)
| 72,272 |
Receivable for interest
| 631,898 |
Unrealized gains on forward foreign currency contracts
| 252,199 |
Receivable for daily variation margin on open futures contracts
| 2,116 |
Total assets
| 68,150,443 |
| Liabilities | |
Professional fees payable
| 31,284 |
Custodian and accounting fee payable
| 16,315 |
Shareholder report expenses payable
| 16,273 |
Management fee payable
| 8,997 |
Trustees’ fees and expenses payable
| 2,466 |
Administration fees payable
| 1,737 |
Accrued expenses and other liabilities
| 21,908 |
Total liabilities
| 98,980 |
Total net assets
| $68,051,463 |
| Net assets consist of | |
Paid-in capital
| $ 65,135,565 |
Total distributable earnings
| 2,915,898 |
Total net assets
| $68,051,463 |
| Computation of net asset value per share | |
Net assets – Class R6
| $ 68,025,137 |
Shares outstanding – Class R61
| 6,460,392 |
Net asset value per share – Class R6
| $10.53 |
Net assets – Institutional Class
| $ 26,326 |
Shares outstanding – Institutional Class1
| 2,500 |
Net asset value per share – Institutional Class
| $10.53 |
| 1 | The Fund has an unlimited number of authorized shares |
The accompanying notes are an integral part of these financial statements.
20 | Wells Fargo Global Investment Grade Credit Fund
Statement of operations—six months ended March 31, 2021 (unaudited)
| | |
| Investment income | |
Interest
| $ 968,593 |
Income from affiliated securities
| 210 |
Total investment income
| 968,803 |
| Expenses | |
Management fee
| 142,248 |
| Administration fees | |
Class R6
| 10,665 |
Institutional Class
| 11 |
Custody and accounting fees
| 18,573 |
Professional fees
| 26,292 |
Registration fees
| 21,135 |
Shareholder report expenses
| 10,890 |
Trustees’ fees and expenses
| 9,610 |
Other fees and expenses
| 3,207 |
Total expenses
| 242,631 |
Less: Fee waivers and/or expense reimbursements
| (82,595) |
Net expenses
| 160,036 |
Net investment income
| 808,767 |
| Realized and unrealized gains (losses) on investments | |
| Net realized gains (losses) on | |
Unaffiliated securities
| 976,751 |
Forward foreign currency contracts
| (116,009) |
Futures contracts
| (17,878) |
Net realized gains on investments
| 842,864 |
| Net change in unrealized gains (losses) on | |
Unaffiliated securities
| (1,338,701) |
Forward foreign currency contracts
| 56,168 |
Futures contracts
| (2,361) |
Net change in unrealized gains (losses) on investments
| (1,284,894) |
Net realized and unrealized gains (losses) on investments
| (442,030) |
Net increase in net assets resulting from operations
| $ 366,737 |
The accompanying notes are an integral part of these financial statements.
Wells Fargo Global Investment Grade Credit Fund | 21
Statement of changes in net assets
| | |
| | Six months ended
March 31, 2021
(unaudited) | Year ended
September 30, 2020 |
| Operations | | | | |
Net investment income
| | $ 808,767 | | $ 1,660,408 |
Net realized gains on investments
| | 842,864 | | 553,022 |
Net change in unrealized gains (losses) on investments
| | (1,284,894) | | 1,862,765 |
Net increase in net assets resulting from operations
| | 366,737 | | 4,076,195 |
| Distributions to shareholders from | | | | |
| Net investment income and net realized gains | | | | |
Class R6
| | (2,822,451) | | (3,157,773) |
Institutional Class
| | (1,086) | | (1,164) |
Total distributions to shareholders
| | (2,823,537) | | (3,158,937) |
| Capital share transactions | Shares | | Shares | |
| Proceeds from shares sold | | | | |
Class R6
| 1,027,079 | 11,206,094 | 2,217,342 | 23,933,431 |
| Reinvestment of distributions | | | | |
Class R6
| 169,021 | 1,835,751 | 197,523 | 2,091,911 |
| Payment for shares redeemed | | | | |
Class R6
| (1,780,154) | (19,408,327) | (4,376,341) | (46,930,121) |
Net decrease in net assets resulting from capital share transactions
| | (6,366,482) | | (20,904,779) |
Total decrease in net assets
| | (8,823,282) | | (19,987,521) |
| Net assets | | | | |
Beginning of period
| | 76,874,745 | | 96,862,266 |
End of period
| | $ 68,051,463 | | $ 76,874,745 |
The accompanying notes are an integral part of these financial statements.
22 | Wells Fargo Global Investment Grade Credit Fund
Financial highlights
(For a share outstanding throughout each period)
| | | Year ended September 30 |
| Class R6 | Six months ended
March 31, 2021
(unaudited) | 2020 | 2019 1 |
Net asset value, beginning of period
| $10.91 | $10.75 | $10.00 |
Net investment income
| 0.12 | 0.24 2 | 0.13 |
Net realized and unrealized gains (losses) on investments
| (0.06) | 0.39 | 0.73 |
Total from investment operations
| 0.06 | 0.63 | 0.86 |
| Distributions to shareholders from | | | |
Net investment income
| (0.19) | (0.34) | (0.11) |
Net realized gains
| (0.25) | (0.13) | 0.00 |
Total distributions to shareholders
| (0.44) | (0.47) | (0.11) |
Net asset value, end of period
| $10.53 | $10.91 | $10.75 |
Total return3
| 0.45% | 6.10% | 8.64% |
| Ratios to average net assets (annualized) | | | |
Gross expenses
| 0.68% | 0.77% | 0.86% |
Net expenses
| 0.45% | 0.45% | 0.45% |
Net investment income
| 2.27% | 2.29% | 2.34% |
| Supplemental data | | | |
Portfolio turnover rate
| 17% | 79% | 36% |
Net assets, end of period (000s omitted)
| $68,025 | $76,847 | $96,835 |
| 1 | For the period from February 28, 2019 (commencement of class operations) to September 30, 2019 |
| 2 | Calculated based upon average shares outstanding |
| 3 | Total return calculations do not include any sales charges. Returns for periods of less than one year are not annualized. |
The accompanying notes are an integral part of these financial statements.
Wells Fargo Global Investment Grade Credit Fund | 23
Financial highlights
(For a share outstanding throughout each period)
| | | Year ended September 30 |
| Institutional Class | Six months ended
March 31, 2021
(unaudited) | 2020 | 2019 1 |
Net asset value, beginning of period
| $10.91 | $10.75 | $10.00 |
Net investment income
| 0.12 | 0.24 | 0.14 |
Net realized and unrealized gains (losses) on investments
| (0.07) | 0.38 | 0.72 |
Total from investment operations
| 0.05 | 0.62 | 0.86 |
| Distributions to shareholders from | | | |
Net investment income
| (0.18) | (0.33) | (0.11) |
Net realized gains
| (0.25) | (0.13) | 0.00 |
Total distributions to shareholders
| (0.43) | (0.46) | (0.11) |
Net asset value, end of period
| $10.53 | $10.91 | $10.75 |
Total return2
| 0.43% | 6.04% | 8.64% |
| Ratios to average net assets (annualized) | | | |
Gross expenses
| 0.72% | 0.83% | 0.97% |
Net expenses
| 0.50% | 0.50% | 0.50% |
Net investment income
| 2.23% | 2.24% | 2.34% |
| Supplemental data | | | |
Portfolio turnover rate
| 17% | 79% | 36% |
Net assets, end of period (000s omitted)
| $26 | $27 | $27 |
| 1 | For the period from February 28, 2019 (commencement of class operations) to September 30, 2019 |
| 2 | Total return calculations do not include any sales charges. Returns for periods of less than one year are not annualized. |
The accompanying notes are an integral part of these financial statements.
24 | Wells Fargo Global Investment Grade Credit Fund
Notes to financial statements (unaudited)
1. ORGANIZATION
Wells Fargo Funds Trust (the "Trust"), a Delaware statutory trust organized on March 10, 1999, is an open-end management investment company registered under the Investment Company Act of 1940, as amended (the "1940 Act"). As an investment company, the Trust follows the accounting and reporting guidance in Financial Accounting Standards Board (“FASB”) Accounting Standards Codification Topic 946, Financial Services – Investment Companies. These financial statements report on the Wells Fargo Global Investment Grade Credit Fund (the "Fund") which is a diversified series of the Trust.
On February 23, 2021, Wells Fargo & Company announced that it has entered into a definitive agreement to sell Wells Fargo Asset Management ("WFAM") to GTCR LLC and Reverence Capital Partners, L.P. WFAM is the trade name used by the asset management businesses of Wells Fargo & Company and includes Wells Fargo Funds Management, LLC, the investment manager to the Fund, Wells Capital Management Incorporated and Wells Fargo Asset Management (International) Limited, both registered investment advisers providing sub-advisory services to certain funds, and Wells Fargo Funds Distributor, LLC, the Fund's principal underwriter. As part of the transaction, Wells Fargo & Company will own a 9.9% equity interest and will continue to serve as an important client and distribution partner. The transaction is expected to close in the second half of 2021, subject to customary closing conditions.
Consummation of the transaction will result in the automatic termination of the Fund's investment management agreement and sub-advisory agreement. The Fund's Board of Trustees will be asked to approve new investment management arrangements with the new company. If approved by the Board, the new investment management arrangements with the new company will be presented to the shareholders of the Fund for approval, and, if approved by shareholders, would take effect upon the closing of the transaction. The transaction is expected to close in the second half of 2021, subject to customary closing conditions.
2. SIGNIFICANT ACCOUNTING POLICIES
The following significant accounting policies, which are consistently followed in the preparation of the financial statements of the Fund, are in conformity with U.S. generally accepted accounting principles which require management to make estimates and assumptions that affect the reported amounts of assets and liabilities, disclosure of contingent assets and liabilities at the date of the financial statements, and the reported amounts of income and expenses during the reporting period. Actual results could differ from those estimates.
Securities valuation
All investments are valued each business day as of the close of regular trading on the New York Stock Exchange (generally 4 p.m. Eastern Time), although the Fund may deviate from this calculation time under unusual or unexpected circumstances.
Debt securities are valued at the evaluated bid price provided by an independent pricing service (e.g. taking into account various factors, including yields, maturities, or credit ratings) or, if a reliable price is not available, the quoted bid price from an independent broker-dealer.
The values of securities denominated in foreign currencies are translated into U.S. dollars at rates provided by an independent foreign currency pricing source at a time each business day specified by the Wells Fargo Asset Management Pricing Committee at Wells Fargo Funds Management, LLC ("Funds Management").
Futures contracts that are listed on a foreign or domestic exchange or market are valued at the official closing price or, if none, the last sales price.
Forward foreign currency contracts are recorded at the forward rate provided by an independent foreign currency pricing source at a time each business day specified by the Wells Fargo Asset Management Pricing Committee.
Investments in registered open-end investment companies are valued at net asset value.
Investments which are not valued using any of the methods discussed above are valued at their fair value, as determined in good faith by the Board of Trustees. The Board of Trustees has established a Valuation Committee comprised of the Trustees and has delegated to it the authority to take any actions regarding the valuation of portfolio securities that the Valuation Committee deems necessary or appropriate, including determining the fair value of portfolio securities, unless the determination has been delegated to the Wells Fargo Asset Management Pricing Committee. The Board of Trustees retains the authority to make or ratify any valuation decisions or approve any changes to the Valuation Procedures as it deems appropriate. On a quarterly basis, the Board of Trustees receives reports on any valuation actions taken by the Valuation Committee or the Wells Fargo Asset Management Pricing Committee which may include items for ratification.
Wells Fargo Global Investment Grade Credit Fund | 25
Notes to financial statements (unaudited)
Foreign currency translation
The accounting records of the Fund are maintained in U.S. dollars. The values of other assets and liabilities denominated in foreign currencies are translated into U.S. dollars at rates provided by an independent foreign currency pricing source at a time each business day specified by the Wells Fargo Asset Management Pricing Committee. Purchases and sales of securities, and income and expenses are converted at the rate of exchange on the respective dates of such transactions. Net realized foreign exchange gains or losses arise from sales of foreign currencies, currency gains or losses realized between the trade and settlement dates on securities transactions, and the difference between the amounts of dividends, interest and foreign withholding taxes recorded and the U.S. dollar equivalent of the amounts actually paid or received. Net unrealized foreign exchange gains and losses arise from changes in the fair value of assets and liabilities other than investments in securities resulting from changes in exchange rates. The changes in net assets arising from changes in exchange rates of securities and the changes in net assets resulting from changes in market prices of securities are not separately presented. Such changes are included in net realized and unrealized gains or losses from investments.
When-issued transactions
The Fund may purchase securities on a forward commitment or when-issued basis. The Fund records a when-issued transaction on the trade date and will segregate assets in an amount at least equal in value to the Fund's commitment to purchase when-issued securities. Securities purchased on a when-issued basis are marked-to-market daily and the Fund begins earning interest on the settlement date. Losses may arise due to changes in the market value of the underlying securities or if the counterparty does not perform under the contract.
Forward foreign currency contracts
A forward foreign currency contract is an agreement between two parties to purchase or sell a specific currency for an agreed-upon price at a future date. The Fund enters into forward foreign currency contracts to facilitate transactions in foreign-denominated securities and to attempt to minimize the risk to the Fund from adverse changes in the relationship between currencies. Forward foreign currency contracts are recorded at the forward rate and marked-to-market daily. When the contracts are closed, realized gains and losses arising from such transactions are recorded as realized gains or losses on forward foreign currency contracts. The Fund is subject to foreign currency risk and may be exposed to risks if the counterparties to the contracts are unable to meet the terms of their contracts or if the value of the foreign currency changes unfavorably. The Fund's maximum risk of loss from counterparty credit risk is the unrealized gains on the contracts. This risk may be mitigated if there is a master netting arrangement between the Fund and the counterparty.
Futures contracts
Futures contracts are agreements between the Fund and a counterparty to buy or sell a specific amount of a commodity, financial instrument or currency at a specified price on a specified date. The Fund may buy and sell futures contracts in order to gain exposure to, or protect against, changes in interest rates and is subject to interest rate risk. The primary risks associated with the use of futures contracts are the imperfect correlation between changes in market values of securities held by the Fund and the prices of futures contracts, and the possibility of an illiquid market. Futures contracts are generally entered into on a regulated futures exchange and cleared through a clearinghouse associated with the exchange. With futures contracts, there is minimal counterparty risk to the Fund since futures contracts are exchange traded and the exchange’s clearinghouse, as the counterparty to all exchange traded futures, guarantees the futures contracts against default.
Upon entering into a futures contract, the Fund is required to deposit either cash or securities (initial margin) with the broker in an amount equal to a certain percentage of the contract value. Subsequent payments (variation margin) are paid to or from the broker each day equal to the daily changes in the contract value. Such payments are recorded as unrealized gains or losses and, if any, shown as variation margin receivable (payable) in the Statement of Assets and Liabilities. Should the Fund fail to make requested variation margin payments, the broker can gain access to the initial margin to satisfy the Fund’s payment obligations. When the contracts are closed, a realized gain or loss is recorded in the Statement of Operations.
Security transactions and income recognition
Securities transactions are recorded on a trade date basis. Realized gains or losses are recorded on the basis of identified cost.
Interest income is accrued daily and bond discounts are accreted and premiums are amortized daily. To the extent debt obligations are placed on non-accrual status, any related interest income may be reduced by writing off interest receivables when the collection of all or a portion of interest has been determined to be doubtful based on consistently applied procedures and the fair value has decreased. If the issuer subsequently resumes interest payments or when the collectability of interest is reasonably assured, the debt obligation is removed from non-accrual status. Paydown gains and losses are included in interest income.
26 | Wells Fargo Global Investment Grade Credit Fund
Notes to financial statements (unaudited)
Distributions to shareholders
Distributions to shareholders are recorded on the ex-dividend date and paid from net investment income monthly and any net realized gains are paid at least annually. Such distributions are determined in accordance with income tax regulations and may differ from U.S. generally accepted accounting principles. Dividend sources are estimated at the time of declaration. The tax character of distributions is determined as of the Fund's fiscal year end. Therefore, a portion of the Fund's distributions made prior to the Fund’s fiscal year end may be categorized as a tax return of capital at year end.
Federal and other taxes
The Fund intends to continue to qualify as a regulated investment company by distributing substantially all of its investment company taxable income and any net realized capital gains (after reduction for capital loss carryforwards) sufficient to relieve it from all, or substantially all, federal income taxes. Accordingly, no provision for federal income taxes was required.
The Fund’s income and federal excise tax returns and all financial records supporting those returns for the prior three fiscal years are subject to examination by the federal and Delaware revenue authorities. Management has analyzed the Fund's tax positions taken on federal, state, and foreign tax returns for all open tax years and does not believe that there are any uncertain tax positions that require recognition of a tax liability.
As of March 31, 2021, the aggregate cost of all investments for federal income tax purposes was $65,081,444 and the unrealized gains (losses) consisted of:
| Gross unrealized gains | $3,060,424 |
| Gross unrealized losses | (714,900) |
| Net unrealized gains | $2,345,524 |
Class allocations
The separate classes of shares offered by the Fund differ principally in administration fees. Class specific expenses are charged directly to that share class. Investment income, common fund-level expenses, and realized and unrealized gains (losses) on investments are allocated daily to each class of shares based on the relative proportion of net assets of each class.
3. FAIR VALUATION MEASUREMENTS
Fair value measurements of investments are determined within a framework that has established a fair value hierarchy based upon the various data inputs utilized in determining the value of the Fund’s investments. The three-level hierarchy gives the highest priority to unadjusted quoted prices in active markets for identical assets or liabilities (Level 1) and the lowest priority to unobservable inputs (Level 3). The Fund’s investments are classified within the fair value hierarchy based on the lowest level of input that is significant to the fair value measurement. The inputs are summarized into three broad levels as follows:
| ■ | Level 1 – quoted prices in active markets for identical securities |
| ■ | Level 2 – other significant observable inputs (including quoted prices for similar securities, interest rates, prepayment speeds, credit risk, etc.) |
| ■ | Level 3 – significant unobservable inputs (including the Fund’s own assumptions in determining the fair value of investments) |
The inputs or methodologies used for valuing investments in securities are not necessarily an indication of the risk associated with investing in those securities.
Wells Fargo Global Investment Grade Credit Fund | 27
Notes to financial statements (unaudited)
The following is a summary of the inputs used in valuing the Fund’s assets and liabilities as of March 31, 2021:
| | Quoted prices
(Level 1) | Other significant
observable inputs
(Level 2) | Significant
unobservable inputs
(Level 3) | Total |
| Assets | | | | |
| Investments in: | | | | |
| Asset-backed securities | $ 0 | $ 1,779,525 | $0 | $ 1,779,525 |
| Corporate bonds and notes | 0 | 35,144,199 | 0 | 35,144,199 |
| Foreign corporate bonds and notes | 0 | 18,263,922 | 0 | 18,263,922 |
| Municipal obligations | 0 | 261,199 | 0 | 261,199 |
| Yankee corporate bonds and notes | 0 | 9,840,468 | 0 | 9,840,468 |
| Short-term investments | | | | |
| Investment companies | 1,885,887 | 0 | 0 | 1,885,887 |
| | 1,885,887 | 65,289,313 | 0 | 67,175,200 |
| Forward foreign currency contracts | 0 | 252,199 | 0 | 252,199 |
| Total assets | $1,885,887 | $65,541,512 | $0 | $67,427,399 |
| Liabilities | | | | |
| Futures contracts | $ 431 | $ 0 | $0 | $ 431 |
| Total liabilities | $ 431 | $ 0 | $0 | $ 431 |
Futures contracts and forward foreign currency contracts are reported at their cumulative unrealized gains (losses) at measurement date as reported in the tables following the Portfolio of Investments. For futures contracts, the current day’s variation margin is reported on the Statement of Assets and Liabilities. All other assets and liabilities are reported at their market value at measurement date.
Additional sector, industry or geographic detail, if any, is included in the Portfolio of Investments.
For the six months ended March 31, 2021, the Fund did not have any transfers into/out of Level 3.
4. TRANSACTIONS WITH AFFILIATES
Management fee
Funds Management, an indirect wholly owned subsidiary of Wells Fargo & Company ("Wells Fargo"), is the manager of the Fund and provides advisory and fund-level administrative services under an investment management agreement. Under the investment management agreement, Funds Management is responsible for, among other services, implementing the investment objectives and strategies of the Fund, supervising the subadvisers and providing fund-level administrative services in connection with the Fund’s operations. As compensation for its services under the investment management agreement, Funds Management is entitled to receive a management fee at the following annual rate based on the Fund’s average daily net assets:
| Average daily net assets | Management fee |
| First $500 million | 0.400% |
| Next $500 million | 0.375 |
| Next $2 billion | 0.350 |
| Next $2 billion | 0.325 |
| Next $5 billion | 0.290 |
| Over $10 billion | 0.280 |
For the six months ended March 31, 2021, the management fee was equivalent to an annual rate of 0.40% of the Fund’s average daily net assets.
28 | Wells Fargo Global Investment Grade Credit Fund
Notes to financial statements (unaudited)
Funds Management has retained the services of subadvisers to provide daily portfolio management to the Fund. The fee for subadvisory services is borne by Funds Management. Wells Capital Management Incorporated and Wells Fargo Asset Management (International) Limited, each an affiliate of Funds Management and an indirect wholly owned subsidiary of Wells Fargo, are subadvisers to the Fund and are each entitled to receive a fee from Funds Management at an annual rate starting at 0.10% and declining to 0.05% as the average daily net assets of the Fund increase.
Administration fees
Under a class-level administration agreement, Funds Management provides class-level administrative services to the Fund, which includes paying fees and expenses for services provided by the transfer agent, sub-transfer agents, omnibus account servicers and record-keepers. As compensation for its services under the class-level administration agreement, Funds Management receives an annual fee which is calculated based on the average daily net assets of each class as follows:
| | Class-level
administration fee |
| Class R6 | 0.03% |
| Institutional Class | 0.08 |
Waivers and/or expense reimbursements
Funds Management has contractually waived and/or reimbursed management and administration fees to the extent necessary to maintain certain net operating expense ratios for the Fund. When each class of the Fund has exceeded its expense cap, Funds Management has waived fees and/or reimbursed expenses from fund-level expenses on a proportionate basis and then from class specific expenses. When only certain classes exceed their expense caps, waivers and/or reimbursements are applied against class specific expenses before fund-level expenses. Funds Management has committed through January 31, 2022 to waive fees and/or reimburse expenses to the extent necessary to cap expenses. Prior to or after the commitment expiration date, the cap may be increased or the commitment to maintain the cap may be terminated only with the approval of the Board of Trustees. The contractual expense caps are as follows:
| | Expense ratio caps |
| Class R6 | 0.45% |
| Institutional Class | 0.50 |
Interfund transactions
The Fund may purchase or sell portfolio investment securities to certain other Wells Fargo affiliates pursuant to Rule 17a-7 under the 1940 Act and under procedures adopted by the Board of Trustees. The procedures have been designed to ensure that these interfund transactions, which do not incur broker commissions, are effected at current market prices.
5. INVESTMENT PORTFOLIO TRANSACTIONS
Purchases and sales of investments, excluding short-term securities, for the six months ended March 31, 2021 were as follows:
| Purchases at cost | | Sales proceeds |
U.S.
government | Non-U.S.
government | | U.S.
government | Non-U.S.
government |
| $1,385,866 | $10,513,758 | | $2,081,292 | $18,721,065 |
6. DERIVATIVE TRANSACTIONS
During the six months ended March 31, 2021, the Fund entered into futures contracts for economic hedging purposes. The Fund had an average notional amount of $1,052,139 in long futures contracts during the six months ended March 31, 2021.
During the six months ended March 31, 2021, the Fund entered into forward foreign currency contracts for economic hedging purposes. The Fund had average contract amounts of $621,298 in forward foreign currency contracts to buy and $24,135,092 in forward foreign currency contracts to sell during the six months ended March 31, 2021.
A summary of the location of derivative instruments on the financial statements by primary risk exposure is outlined in the following tables.
Wells Fargo Global Investment Grade Credit Fund | 29
Notes to financial statements (unaudited)
The fair value of derivative instruments as of March 31, 2021 by risk type was as follows for the Fund:
| | Asset derivatives | | Liability derivatives |
| | Statement of
Assets and Liabilities location | Fair value | | Statement of
Assets and Liabilities location | Fair value |
| Interest rate risk | Unrealized gains on futures contracts | $ 0* | | Unrealized losses on futures contracts | $431* |
| Foreign currency risk | Unrealized gains on forward foreign currency contracts | 252,199 | | Unrealized losses on forward foreign currency contracts | 0 |
| | | $252,199 | | | $431 |
* Amount represents the cumulative unrealized gains (losses) as reported in the tables following the Portfolio of Investments. For futures contracts, only the current day's variation margin as of March 31, 2021 is reported separately on the Statement of Assets and Liabilities.
The effect of derivative instruments on the Statement of Operations for the six months ended March 31, 2021 was as follows for the Fund:
| | Amount of realized gains (losses) on derivatives |
| | Futures
contracts | Forward
foreign
currency
contracts | Total |
| Interest rate risk | $ (17,878) | $ 0 | $ (17,878) |
| Foreign currency risk | 0 | (116,009) | (116,009) |
| | $(17,878) | $(116,009) | $(133,887) |
| | Change in unrealized gains (losses) on derivatives |
| | Futures
contracts | Forward
foreign
currency
contracts | Total |
| Interest rate risk | $ (2,361) | $ 0 | $ (2,361) |
| Foreign currency risk | 0 | 56,168 | 56,168 |
| | $(2,361) | $56,168 | $53,807 |
For certain types of derivative transactions, the Fund has entered into International Swaps and Derivatives Association, Inc. master agreements (“ISDA Master Agreements”) or similar agreements with approved counterparties. The ISDA Master Agreements or similar agreements may have requirements to deliver/deposit securities or cash to/with an exchange or broker-dealer as collateral and allows the Fund to offset, with each counterparty, certain derivative financial instrument’s assets and/or liabilities with collateral held or pledged. Collateral requirements differ by type of derivative. Collateral or margin requirements are set by the broker or exchange clearinghouse for exchange traded derivatives while collateral terms are contract specific for over-the-counter traded derivatives. Cash collateral that has been pledged to cover obligations of the Fund under ISDA Master Agreements or similar agreements, if any, are reported separately in the Statement of Assets and Liabilities. Securities pledged as collateral, if any, are noted in the Portfolio of Investments. With respect to balance sheet offsetting, absent an event of default by the counterparty or a termination of the agreement, the reported amounts of financial assets and financial liabilities in the Statement of Assets and Liabilities are not offset across transactions between the Fund and the applicable counterparty. A reconciliation of the gross amounts on the Statement of Assets and Liabilities to the net amounts by counterparty, including any collateral exposure, for OTC derivatives is as follows:
| Counterparty | Gross amounts
of assets in the
Statement of
Assets and
Liabilities | Amounts
subject to
netting
agreements | Collateral
received | Net amount
of assets |
| JPMorgan Chase & Company | $ 6,873 | $0 | $0 | $ 6,873 |
| State Street Bank & Trust Company | 245,326 | 0 | 0 | 245,326 |
30 | Wells Fargo Global Investment Grade Credit Fund
Notes to financial statements (unaudited)
7. BANK BORROWINGS
The Trust (excluding the money market funds), Wells Fargo Master Trust and Wells Fargo Variable Trust are parties to a $350,000,000 revolving credit agreement whereby the Fund is permitted to use bank borrowings for temporary or emergency purposes, such as to fund shareholder redemption requests. Interest under the credit agreement is charged to the Fund based on a borrowing rate equal to the higher of the Federal Funds rate in effect on that day plus 1.25% or the overnight LIBOR rate in effect on that day plus 1.25%. In addition, an annual commitment fee equal to 0.25% of the unused balance is allocated to each participating fund.
For the six months ended March 31, 2021, there were no borrowings by the Fund under the agreement.
8. CONCENTRATION RISK
A fund with a concentration of ownership may be more affected by the investment activity of those shareholders than would be a fund that does not have any ownership concentration. As of March 31, 2021, Wells Fargo, including its affiliates, was the sole shareholder of the Institutional Class. Wells Fargo, including its affiliates, and certain Wells Fargo Funds were the only shareholders of Class R6.
9. INDEMNIFICATION
Under the Fund's organizational documents, the officers and Trustees have been granted certain indemnification rights against certain liabilities that may arise out of performance of their duties to the Fund. The Fund has entered into a separate agreement with each Trustee that converts indemnification rights currently existing under the Fund’s organizational documents into contractual rights that cannot be changed in the future without the consent of the Trustee. Additionally, in the normal course of business, the Fund may enter into contracts with service providers that contain a variety of indemnification clauses. The Fund’s maximum exposure under these arrangements is dependent on future claims that may be made against the Fund and, therefore, cannot be estimated.
10. CORONAVIRUS (COVID-19) PANDEMIC
On March 11, 2020, the World Health Organization announced that it had made the assessment that coronavirus disease 2019 (“COVID-19”) is a pandemic. The impacts of COVID-19 are affecting the entire global economy, individual companies and investment products, the funds, and the market in general. There is significant uncertainty around the extent and duration of business disruptions related to COVID-19 and the impacts may last for an extended period of time. COVID-19 has led to significant uncertainty and volatility in the financial markets.
Wells Fargo Global Investment Grade Credit Fund | 31
Other information (unaudited)
PROXY VOTING INFORMATION
A description of the policies and procedures used to determine how to vote proxies relating to portfolio securities is available without charge, upon request, by calling 1-800-222-8222, visiting our website at wfam.com, or visiting the SEC website at sec.gov. Information regarding how the proxies related to portfolio securities were voted during the most recent 12-month period ended June 30 is available on the website at wfam.com or by visiting the SEC website at sec.gov.
QUARTERLY PORTFOLIO HOLDINGS INFORMATION
The Fund files its complete schedule of portfolio holdings with the SEC for the first and third quarters of each fiscal year as an exhibit to its reports on Form N-PORT. Shareholders may view the filed Form N-PORT by visiting the SEC website at sec.gov.
32 | Wells Fargo Global Investment Grade Credit Fund
Other information (unaudited)
BOARD OF TRUSTEES AND OFFICERS
Each of the Trustees and Officers listed in the table below acts in identical capacities for each fund in the Wells Fargo family of funds, which consists of 142 mutual funds comprising the Wells Fargo Funds Trust, Wells Fargo Variable Trust, Wells Fargo Master Trust and four closed-end funds (collectively the “Fund Complex”). This table should be read in conjunction with the Prospectus and the Statement of Additional Information1. The mailing address of each Trustee and Officer is 525 Market Street, 12th Floor, San Francisco, CA 94105. Each Trustee and Officer serves an indefinite term, however, each Trustee serves such term until reaching the mandatory retirement age established by the Trustees.
Independent Trustees
Name and
year of birth | Position held and
length of service* | Principal occupations during past five years or longer | Current other
public company or
investment
company
directorships |
William R. Ebsworth
(Born 1957) | Trustee,
since 2015 | Retired. From 1984 to 2013, equities analyst, portfolio manager, research director and chief investment officer at Fidelity Management and Research Company in Boston, Tokyo, and Hong Kong, and retired in 2013 as Chief Investment Officer of Fidelity Strategic Advisers, Inc. where he led a team of investment professionals managing client assets. Prior thereto, Board member of Hong Kong Securities Clearing Co., Hong Kong Options Clearing Corp., the Thailand International Fund, Ltd., Fidelity Investments Life Insurance Company, and Empire Fidelity Investments Life Insurance Company. Audit Committee Chair and Investment Committee Chair of the Vincent Memorial Hospital Endowment (non-profit organization). Mr. Ebsworth is a CFA® charterholder. | N/A |
Jane A. Freeman
(Born 1953) | Trustee,
since 2015;
Chair Liaison,
since 2018 | Retired. From 2012 to 2014 and 1999 to 2008, Chief Financial Officer of Scientific Learning Corporation. From 2008 to 2012, Ms. Freeman provided consulting services related to strategic business projects. Prior to 1999, Portfolio Manager at Rockefeller & Co. and Scudder, Stevens & Clark. Board member of the Harding Loevner Funds from 1996 to 2014, serving as both Lead Independent Director and chair of the Audit Committee. Board member of the Russell Exchange Traded Funds Trust from 2011 to 2012 and the chair of the Audit Committee. Ms. Freeman is also an inactive Chartered Financial Analyst. | N/A |
Isaiah Harris, Jr.
(Born 1952) | Trustee,
since 2009; Audit
Committee
Chair,
since 2019 | Retired. Chairman of the Board of CIGNA Corporation since 2009, and Director since 2005. From 2003 to 2011, Director of Deluxe Corporation. Prior thereto, President and CEO of BellSouth Advertising and Publishing Corp. from 2005 to 2007, President and CEO of BellSouth Enterprises from 2004 to 2005 and President of BellSouth Consumer Services from 2000 to 2003. Emeritus member of the Iowa State University Foundation Board of Governors. Emeritus Member of the Advisory Board of Iowa State University School of Business. Advisory Board Member, Palm Harbor Academy (private school). Mr. Harris is a certified public accountant (inactive status). | CIGNA Corporation |
Judith M. Johnson
(Born 1949) | Trustee,
since 2008 | Retired. Prior thereto, Chief Executive Officer and Chief Investment Officer of Minneapolis Employees Retirement Fund from 1996 to 2008. Ms. Johnson is an attorney, certified public accountant and a certified managerial accountant. | N/A |
David F. Larcker
(Born 1950) | Trustee,
since 2009 | James Irvin Miller Professor of Accounting at the Graduate School of Business (Emeritus), Stanford University, Director of the Corporate Governance Research Initiative and Senior Faculty of The Rock Center for Corporate Governance since 2006. From 2005 to 2008, Professor of Accounting at the Graduate School of Business, Stanford University. Prior thereto, Ernst & Young Professor of Accounting at The Wharton School, University of Pennsylvania from 1985 to 2005. | N/A |
Wells Fargo Global Investment Grade Credit Fund | 33
Other information (unaudited)
Name and
year of birth | Position held and
length of service* | Principal occupations during past five years or longer | Current other
public company or
investment
company
directorships |
Olivia S. Mitchell
(Born 1953) | Trustee,
since 2006;
Nominating and
Governance
Committee Chair,
since 2018 | International Foundation of Employee Benefit Plans Professor, Wharton School of the University of Pennsylvania since 1993. Director of Wharton’s Pension Research Council and Boettner Center on Pensions & Retirement Research, and Research Associate at the National Bureau of Economic Research. Previously, Cornell University Professor from 1978 to 1993. | N/A |
Timothy J. Penny
(Born 1951) | Trustee,
since 1996;
Chair,
since 2018 | President and Chief Executive Officer of Southern Minnesota Initiative Foundation, a non-profit organization, since 2007. Member of the Board of Trustees of NorthStar Education Finance, Inc., a non-profit organization, since 2007. | N/A |
James G. Polisson
(Born 1959) | Trustee,
since 2018 | Retired. Chief Marketing Officer, Source (ETF) UK Services, Ltd, from 2015 to 2017. From 2012 to 2015, Principal of The Polisson Group, LLC, a management consulting, corporate advisory and principal investing company. Chief Executive Officer and Managing Director at Russell Investments, Global Exchange Traded Funds from 2010 to 2012. Managing Director of Barclays Global Investors from 1998 to 2010 and Global Chief Marketing Officer for iShares and Barclays Global Investors from 2000 to 2010. Trustee of the San Francisco Mechanics’ Institute, a non-profit organization, from 2013 to 2015. Board member of the Russell Exchange Traded Fund Trust from 2011 to 2012. Director of Barclays Global Investors Holdings Deutschland GmbH from 2006 to 2009. Mr. Polisson is an attorney and has a retired status with the Massachusetts and District of Columbia Bar Associations. | N/A |
Pamela Wheelock
(Born 1959) | Trustee,
since January
2020; previously
Trustee from
January 2018 to
July 2019 | Board member of the Destination Medical Center Economic Development Agency, Rochester, Minnesota since 2019. Interim President of the McKnight Foundation from January to September 2020. Acting Commissioner, Minnesota Department of Human Services, July 2019 through September 2019. Human Services Manager (part-time), Minnesota Department of Human Services, October 2019 through December 2019. Chief Operating Officer, Twin Cities Habitat for Humanity from 2017 to 2019. Vice President of University Services, University of Minnesota from 2012 to 2016. Prior thereto, on the Board of Directors, Governance Committee and Finance Committee for the Minnesota Philanthropy Partners (Saint Paul Foundation) from 2012 to 2018, Interim Chief Executive Officer of Blue Cross Blue Shield of Minnesota from 2011 to 2012, Chairman of the Board from 2009 to 2012 and Board Director from 2003 to 2015. Vice President, Leadership and Community Engagement, Bush Foundation, Saint Paul, Minnesota (a private foundation) from 2009 to 2011. Executive Vice President and Chief Financial Officer, Minnesota Sports and Entertainment from 2004 to 2009 and Senior Vice President from 2002 to 2004. Executive Vice President of the Minnesota Wild Foundation from 2004 to 2008. Commissioner of Finance, State of Minnesota, from 1999 to 2002. Currently Board Chair of the Minnesota Wild Foundation since 2010. | N/A |
* Length of service dates reflect the Trustee’s commencement of service with the Trust’s predecessor entities, where applicable.
34 | Wells Fargo Global Investment Grade Credit Fund
Other information (unaudited)
Officers
Name and
year of birth | Position held and
length of service | Principal occupations during past five years or longer |
Andrew Owen
(Born 1960) | President,
since 2017 | Executive Vice President of Wells Fargo & Company and Head of Affiliated Managers, Wells Fargo Asset Management, since 2014. In addition, Mr. Owen is currently President, Chief Executive Officer and Director of Wells Fargo Funds Management, LLC since 2017. Prior thereto, Executive Vice President responsible for marketing, investments and product development for Wells Fargo Funds Management, LLC, from 2009 to 2014. |
Jeremy DePalma
(Born 1974) | Treasurer,
since 2012
(for certain funds in
the Fund Complex);
since 2021 (for
the remaining funds in the
Fund Complex) | Senior Vice President of Wells Fargo Funds Management, LLC since 2009. Senior Vice President of Evergreen Investment Management Company, LLC from 2008 to 2010 and head of the Fund Reporting and Control Team within Fund Administration from 2005 to 2010. |
Michelle Rhee
(Born 1966) | Chief Legal Officer,
since 2019 | Secretary of Wells Fargo Funds Management, LLC and Chief Legal Counsel of Wells Fargo Asset Management since 2018. Deputy General Counsel of Wells Fargo Bank, N.A. since 2020 and Assistant General Counsel of Wells Fargo Bank, N.A. from 2018 to 2020. Associate General Counsel and Managing Director of Bank of America Corporation from 2004 to 2018. |
Catherine Kennedy
(Born 1969) | Secretary,
since 2019 | Vice President of Wells Fargo Funds Management, LLC and Senior Counsel of the Wells Fargo Legal Department since 2010. Vice President and Senior Counsel of Evergreen Investment Management Company, LLC from 1998 to 2010. |
Michael H. Whitaker
(Born 1967) | Chief Compliance Officer,
since 2016 | Chief Compliance Officer of Wells Fargo Asset Management since 2016. Senior Vice President and Chief Compliance Officer for Fidelity Investments from 2007 to 2016. |
1 The Statement of Additional Information includes additional information about the Trustees and is available, without charge, upon request, by calling 1-800-222-8222 or by visiting the website at wfam.com.
Wells Fargo Global Investment Grade Credit Fund | 35
Wells Fargo Funds
P.O. Box 219967
Kansas City, MO 64121-9967
Website: wfam.com
Individual investors: 1-800-222-8222
Retail investment professionals: 1-888-877-9275
Institutional investment professionals: 1-866-765-0778
This report and the financial statements contained herein are submitted for the general information of the shareholders of the Fund. If this report is used for promotional purposes, distribution of the report must be accompanied or preceded by a current prospectus. Before investing, please consider the investment objectives, risks, charges, and expenses of the investment. For a current prospectus and, if available, a summary prospectus, containing this information, call 1-800-222-8222 or visit the Fund's website at wfam.com. Read the prospectus carefully before you invest or send money.
Wells Fargo Asset Management (WFAM) is the trade name for certain investment advisory/management firms owned by Wells Fargo & Company. These firms include but are not limited to Wells Capital Management Incorporated and Wells Fargo Funds Management, LLC. Certain products managed by WFAM entities are distributed by Wells Fargo Funds Distributor, LLC (a broker-dealer and Member FINRA).
This material is for general informational and educational purposes only and is NOT intended to provide investment advice or a recommendation of any kind - including a recommendation for any specific investment, strategy, or plan.
INVESTMENT PRODUCTS: NOT FDIC INSURED ■ NO BANK GUARANTEE ■ MAY LOSE VALUE
© 2021 Wells Fargo & Company. All rights reserved.
PAR-0421-00292 05-21
SA294/SAR294 03-21
Semi-Annual Report
March 31, 2021
Wells Fargo
C&B Mid Cap Value Fund
Reduce clutter.
Save trees.
Sign up for electronic delivery of prospectuses and shareholder reports at wellsfargo.com/ advantagedelivery
The views expressed and any forward-looking statements are as of March 31, 2021, unless otherwise noted, and are those of the Fund's portfolio managers and/or Wells Fargo Asset Management. Discussions of individual securities or the markets generally are not intended as individual recommendations. Future events or results may vary significantly from those expressed in any forward-looking statements. The views expressed are subject to change at any time in response to changing circumstances in the market. Wells Fargo Asset Management and the Fund disclaim any obligation to publicly update or revise any views expressed or forward-looking statements.
INVESTMENT PRODUCTS: NOT FDIC INSURED ■ NO BANK GUARANTEE ■ MAY LOSE VALUE
Wells Fargo C&B Mid Cap Value Fund | 1
Letter to shareholders (unaudited)
Andrew Owen
President
Wells Fargo Funds
Dear Shareholder:
We are pleased to offer you this semi-annual report for the Wells Fargo C&B Mid Cap Value Fund for the six-month period that ended March 31, 2021. Despite a deeply challenging year, dominated by the spread of COVID-19 cases and a sharp drop in economic output throughout much of the world, global stocks performed extremely well, benefiting from ongoing central bank support and rising optimism over the development and distribution of effective COVID-19 vaccines. Bonds also had positive returns, led by global bonds and high-yield bonds.
For the six-month period, U.S. stocks, based on the S&P 500 Index,1 gained 19.07%. International stocks, as measured by the MSCI ACWI ex USA Index (Net),2 returned 21.10%, while the MSCI EM Index (Net),3 had even stronger performance, with a 22.43% gain. Among bond indexes, the Bloomberg Barclays U.S. Aggregate Bond Index,4 returned -2.73%, the Bloomberg Barclays Global Aggregate ex-USD Index (unhedged),5 returned -0.47%, and the Bloomberg Barclays Municipal Bond Index,6 returned 1.46% while the ICE BofA U.S. High Yield Index,7 gained 7.44%.
Hope drove the stock markets to new highs.
In October, capital markets stepped back from their six-month rally. Market volatility rose in advance of the U.S. election and amid a global increase in COVID-19 infections. Europe introduced tighter restrictions affecting economic activity. U.S. markets looked favorably at the prospect of Democratic control of the federal purse strings, which could lead to additional fiscal stimulus and a boost to economic activity. Meanwhile, China reported 4.9% third-quarter gross domestic product growth.
Global stocks rallied in November, propelled by optimism over three promising COVID-19 vaccines. Reversing recent trends, value stocks outperformed growth stocks and cyclical stocks outpaced information technology (IT) stocks. However, U.S. unemployment remained elevated, with a net job loss of 10 million since February. The eurozone services purchasing managers’ index contracted sharply while the region’s manufacturing activity grew. The U.S. election results added to the upbeat mood as investors anticipated more consistent policies in the new administration.
“Global stocks rallied in November, propelled by optimism over three promising COVID-19 vaccines.”
| 1 | The S&P 500 Index consists of 500 stocks chosen for market size, liquidity, and industry group representation. It is a market-value-weighted index with each stock's weight in the index proportionate to its market value. You cannot invest directly in an index. |
| 2 | The Morgan Stanley Capital International (MSCI) All Country World Index (ACWI) ex USA Index (Net) is a free-float-adjusted market-capitalization-weighted index that is designed to measure the equity market performance of developed and emerging markets, excluding the United States. Source: MSCI. MSCI makes no express or implied warranties or representations and shall have no liability whatsoever with respect to any MSCI data contained herein. The MSCI data may not be further redistributed or used as a basis for other indices or any securities or financial products. This report is not approved, reviewed, or produced by MSCI. You cannot invest directly in an index. |
| 1 | The S&P 500 Index consists of 500 stocks chosen for market size, liquidity, and industry group representation. It is a market-value-weighted index with each stock's weight in the index proportionate to its market value. You cannot invest directly in an index. |
| 3 | The MSCI Emerging Markets (EM) Index (Net) is a free-float-adjusted market-capitalization-weighted index that is designed to measure equity market performance of emerging markets. You cannot invest directly in an index. |
| 1 | The S&P 500 Index consists of 500 stocks chosen for market size, liquidity, and industry group representation. It is a market-value-weighted index with each stock's weight in the index proportionate to its market value. You cannot invest directly in an index. |
| 4 | The Bloomberg Barclays U.S. Aggregate Bond Index is a broad-based benchmark that measures the investment-grade, U.S. dollar-denominated, fixed-rate taxable bond market, including Treasuries, government-related and corporate securities, mortgage-backed securities (agency fixed-rate and hybrid adjustable-rate mortgage pass-throughs), asset-backed securities, and commercial mortgage-backed securities. You cannot invest directly in an index. |
| 1 | The S&P 500 Index consists of 500 stocks chosen for market size, liquidity, and industry group representation. It is a market-value-weighted index with each stock's weight in the index proportionate to its market value. You cannot invest directly in an index. |
| 5 | The Bloomberg Barclays Global Aggregate ex-USD Index (unhedged) is an unmanaged index that provides a broad-based measure of the global investment-grade fixed-income markets excluding the U.S. dollar-denominated debt market. You cannot invest directly in an index. |
| 1 | The S&P 500 Index consists of 500 stocks chosen for market size, liquidity, and industry group representation. It is a market-value-weighted index with each stock's weight in the index proportionate to its market value. You cannot invest directly in an index. |
| 6 | The Bloomberg Barclays Municipal Bond Index is an unmanaged index composed of long-term tax-exempt bonds with a minimum credit rating of Baa. You cannot invest directly in an index. |
| 1 | The S&P 500 Index consists of 500 stocks chosen for market size, liquidity, and industry group representation. It is a market-value-weighted index with each stock's weight in the index proportionate to its market value. You cannot invest directly in an index. |
| 7 | The ICE BofA U.S. High Yield Index is a market-capitalization-weighted index of domestic and Yankee high-yield bonds. The index tracks the performance of high-yield securities traded in the U.S. bond market. You cannot invest directly in an index. Copyright 2021. ICE Data Indices, LLC. All rights reserved. |
2 | Wells Fargo C&B Mid Cap Value Fund
Letter to shareholders (unaudited)
Financial markets ended the year with strength on high expectations for a rapid rollout of the COVID-19 vaccines, the successful passage of a $900 billion stimulus package, and rising expectations of additional economic support from a Democratic-led Congress. U.S. economic data were mixed with still-elevated unemployment and weak retail sales but growth in manufacturing output. In contrast, China’s economic expansion continued in both manufacturing and nonmanufacturing. U.S. COVID-19 infection rates continued to rise even as new state and local lockdown measures were implemented.
The year 2021 began with emerging market stocks leading all major asset classes in January, driven by China’s strong economic growth and a broad recovery in corporate earnings, which propelled China’s stock market higher. In the U.S., positive news on vaccine trials and January's expansion in both the manufacturing and services sectors were offset by a weak December monthly jobs report. This was compounded by technical factors as some hedge funds were forced to sell stocks to protect themselves against a well-publicized short squeeze coordinated by a group of retail investors. Eurozone sentiment and economic growth were particularly weak, reflecting the impact of a new lockdown with stricter social distancing along with a slow vaccine rollout.
February saw major domestic equity indexes driven higher on the hope of a new stimulus bill, improving COVID-19 vaccination numbers, and the gradual reopening of the economy. Most S&P 500 companies reported better-than-expected earnings, with positive surprises coming from the financials, IT, health care, and materials sectors. Japan saw its economy strengthen as a result of strong export numbers. Meanwhile, crude-oil prices continued their climb, rising more than 25% for the year. Domestic government bonds experienced a sharp sell-off in late February as markets priced in a more robust economic recovery and higher future growth and inflation expectations.
The passage of the massive domestic stimulus bill highlighted March activity, leading to increased forecasts for U.S. growth in 2021. Domestic employment surged as COVID-19 vaccinations and an increasingly open economy spurred hiring. A majority of U.S. small companies reported they are operating at pre-pandemic capacity or higher. Value continued its outperformance of growth in the month, continuing the trend that started in late 2020. Meanwhile, most major developed global equity indexes are up month to date on the back of rising optimism regarding the outlook for global growth. While the U.S. and the U.K. have been the most successful in terms of the vaccine rollout, even within markets where the vaccine has lagged, such as the eurozone and Japan, equity indexes in many of those countries are also in positive territory this year.
Don’t let short-term uncertainty derail long-term investment goals.
Periods of investment uncertainty can present challenges, but experience has taught us that maintaining long-term investment goals can be an effective way to plan for the future. To help you create a sound strategy based on your personal goals and risk tolerance, Wells Fargo Funds offers more than 100 mutual funds spanning a wide range of asset classes and investment styles. Although diversification cannot guarantee an investment profit or prevent losses, we believe it can be an effective way to manage investment risk and potentially smooth out overall portfolio performance. We encourage investors to know their investments and to understand that appropriate levels of risk-taking may unlock opportunities.
Thank you for choosing to invest with Wells Fargo Funds. We appreciate your confidence in us and remain committed to helping you meet your financial needs.
Sincerely,
Andrew Owen
President
Wells Fargo Funds
“The passage of the massive domestic stimulus bill highlighted March activity, leading to increased forecasts for U.S. growth in 2021.”
For further information about your Fund, contact your investment professional, visit our website at wfam.com, or call us directly at 1-800-222-8222.
Wells Fargo C&B Mid Cap Value Fund | 3
Performance highlights (unaudited)
| Investment objective | The Fund seeks maximum long-term return (current income and capital appreciation), consistent with minimizing risk to principal. |
| Manager | Wells Fargo Funds Management, LLC |
| Subadviser | Cooke & Bieler, L.P. |
| Portfolio managers | Andrew B. Armstrong, CFA®‡, Wesley Lim, CFA®‡, Steve Lyons, CFA®‡, Michael M. Meyer, CFA®‡, Edward W. O'Connor, CFA®‡, R. James O'Neil, CFA®‡, Mehul Trivedi, CFA®‡, William Weber, CFA®‡ |
| Average annual total returns (%) as of March 31, 2021 |
| | | Including sales charge | | Excluding sales charge | | Expense ratios1 (%) |
| | Inception date | 1 year | 5 year | 10 year | | 1 year | 5 year | 10 year | | Gross | Net 2 |
| Class A (CBMAX) | 7-26-2004 | 63.87 | 11.39 | 10.64 | | 73.85 | 12.72 | 11.29 | | 1.27 | 1.25 |
| Class C (CBMCX) | 7-26-2004 | 71.85 | 11.92 | 10.48 | | 72.85 | 11.92 | 10.48 | | 2.02 | 2.00 |
| Class R6 (CBMYX)3 | 7-31-2018 | – | – | – | | 74.63 | 13.18 | 11.69 | | 0.84 | 0.80 |
| Administrator Class (CBMIX) | 7-26-2004 | – | – | – | | 73.99 | 12.83 | 11.38 | | 1.19 | 1.15 |
| Institutional Class (CBMSX) | 7-26-2004 | – | – | – | | 74.41 | 13.11 | 11.66 | | 0.94 | 0.90 |
| Russell Midcap® Value Index4 | – | – | – | – | | 73.76 | 11.60 | 11.05 | | – | – |
Figures quoted represent past performance, which is no guarantee of future results, and do not reflect taxes that a shareholder may pay on an investment in a fund. Investment return and principal value of an investment will fluctuate so that an investor’s shares, when redeemed, may be worth more or less than their original cost. Performance shown without sales charges would be lower if sales charges were reflected. Current performance may be lower or higher than the performance data quoted, which assumes the reinvestment of dividends and capital gains. Current month-end performance is available on the Fund’s website, wfam.com.
Please keep in mind that high double-digit returns were primarily achieved during favorable market conditions. You should not expect that such favorable returns can be consistently achieved. A fund’s performance, especially for short time periods, should not be the sole factor in making your investment decision.
Index returns do not include transaction costs associated with buying and selling securities, any mutual fund fees or expenses, or any taxes. It is not possible to invest directly in an index.
For Class A shares, the maximum front-end sales charge is 5.75%. For Class C shares, the maximum contingent deferred sales charge is 1.00%. Performance including a contingent deferred sales charge assumes the sales charge for the corresponding time period. Class R6, Administrator Class, and Institutional Class shares are sold without a front-end sales charge or contingent deferred sales charge.
| 1 | Reflects the expense ratios as stated in the most recent prospectuses. The expense ratios shown are subject to change and may differ from the annualized expense ratios shown in the financial highlights of this report. |
| 2 | The manager has contractually committed through January 31, 2022, to waive fees and/or reimburse expenses to the extent necessary to cap total annual fund operating expenses after fee waivers at 1.25% for Class A, 2.00% for Class C, 0.80% for Class R6, 1.15% for Administrator Class, and 0.90% for Institutional Class. Brokerage commissions, stamp duty fees, interest, taxes, acquired fund fees and expenses (if any), and extraordinary expenses are excluded from the expense caps. Prior to or after the commitment expiration date, the caps may be increased or the commitment to maintain the caps may be terminated only with the approval of the Board of Trustees. Without these caps, the Fund’s returns would have been lower. The expense ratio paid by an investor is the net expense ratio (the total annual fund operating expenses after fee waivers) as stated in the prospectuses. |
| 3 | Historical performance shown for the Class R6 shares prior to their inception reflects the performance of the Institutional Class shares, and includes the higher expenses applicable to the Institutional Class shares. If these expenses had not been included, returns for the Class R6 shares would be higher. |
| 4 | The Russell Midcap® Value Index measures the performance of those Russell Midcap companies with lower price/book ratios and lower forecasted growth values. The stocks are also members of the Russell 1000® Value Index. You cannot invest directly in an index |
Stock values fluctuate in response to the activities of individual companies and general market and economic conditions. Smaller-company stocks tend to be more volatile and less liquid than those of larger companies. The use of derivatives may reduce returns and/or increase volatility. Consult the Fund’s prospectus for additional information on these and other risks.
| ‡ | CFA® and Chartered Financial Analyst® are trademarks owned by CFA Institute. |
4 | Wells Fargo C&B Mid Cap Value Fund
Performance highlights (unaudited)
| Ten largest holdings (%) as of March 31, 20211 |
| Arrow Electronics Incorporated | 3.43 |
| Gildan Activewear Incorporated | 3.39 |
| AerCap Holdings NV | 3.16 |
| FirstCash Financial Services Incorporated | 3.11 |
| Fidelity National Financial Incorporated | 2.96 |
| Colfax Corporation | 2.95 |
| Leidos Holdings Incorporated | 2.86 |
| Arch Capital Group Limited | 2.76 |
| Helen of Troy Limited | 2.70 |
| Integra LifeSciences Holdings Corporation | 2.66 |
| 1 | Figures represent the percentage of the Fund's net assets. Holdings are subject to change and may have changed since the date specified. |
| Sector allocation as of March 31, 20211 |
| 1 | Figures represent the percentage of the Fund's long-term investments. These amounts are subject to change and may have changed since the date specified. |
Wells Fargo C&B Mid Cap Value Fund | 5
Fund expenses (unaudited)
As a shareholder of the Fund, you incur two types of costs: (1) transaction costs, including sales charges (loads) on purchase payments and contingent deferred sales charges (if any) on redemptions and (2) ongoing costs, including management fees, distribution (12b-1) and/or shareholder servicing fees, and other Fund expenses. This example is intended to help you understand your ongoing costs (in dollars) of investing in the Fund and to compare these costs with the ongoing costs of investing in other mutual funds.
The example is based on an investment of $1,000 invested at the beginning of the six-month period and held for the entire period from October 1, 2020 to March 31, 2021.
Actual expenses
The “Actual” line of the table below provides information about actual account values and actual expenses. You may use the information in this line, together with the amount you invested, to estimate the expenses that you paid over the period. Simply divide your account value by $1,000 (for example, an $8,600 account value divided by $1,000 = 8.6), then multiply the result by the number in the “Actual” line under the heading entitled “Expenses paid during period” for your applicable class of shares to estimate the expenses you paid on your account during this period.
Hypothetical example for comparison purposes
The “Hypothetical” line of the table below provides information about hypothetical account values and hypothetical expenses based on the Fund’s actual expense ratio and an assumed rate of return of 5% per year before expenses, which is not the Fund’s actual return. The hypothetical account values and expenses may not be used to estimate the actual ending account balance or expenses you paid for the period. You may use this information to compare the ongoing costs of investing in the Fund and other funds. To do so, compare this 5% hypothetical example with the 5% hypothetical examples that appear in the shareholder reports of the other funds.
Please note that the expenses shown in the table are meant to highlight your ongoing costs only and do not reflect any transactional costs, such as sales charges (loads) and contingent deferred sales charges. Therefore, the “Hypothetical” line of the table is useful in comparing ongoing costs only and will not help you determine the relative total costs of owning different funds. In addition, if these transactional costs were included, your costs would have been higher.
| | Beginning
account value
10-1-2020 | Ending
account value
3-31-2021 | Expenses
paid during
the period1 | Annualized net
expense ratio |
| Class A | | | | |
| Actual | $1,000.00 | $1,384.76 | $ 7.43 | 1.25% |
| Hypothetical (5% return before expenses) | $1,000.00 | $1,018.70 | $ 6.29 | 1.25% |
| Class C | | | | |
| Actual | $1,000.00 | $1,379.46 | $11.86 | 2.00% |
| Hypothetical (5% return before expenses) | $1,000.00 | $1,014.96 | $10.05 | 2.00% |
| Class R6 | | | | |
| Actual | $1,000.00 | $1,387.68 | $ 4.76 | 0.80% |
| Hypothetical (5% return before expenses) | $1,000.00 | $1,020.94 | $ 4.03 | 0.80% |
| Administrator Class | | | | |
| Actual | $1,000.00 | $1,385.40 | $ 6.84 | 1.15% |
| Hypothetical (5% return before expenses) | $1,000.00 | $1,019.20 | $ 5.79 | 1.15% |
| Institutional Class | | | | |
| Actual | $1,000.00 | $1,387.12 | $ 5.36 | 0.90% |
| Hypothetical (5% return before expenses) | $1,000.00 | $1,020.44 | $ 4.53 | 0.90% |
1 Expenses paid is equal to the annualized net expense ratio of each class multiplied by the average account value over the period, multiplied by the number of days in the most recent fiscal half-year divided by the number of days in the fiscal year (to reflect the one-half-year period).
6 | Wells Fargo C&B Mid Cap Value Fund
Portfolio of investments—March 31, 2021 (unaudited)
| | | | | Shares | Value |
| Common stocks: 94.75% | | | | | |
| Communication services: 1.78% | | | | | |
| Media: 1.78% | | | | | |
| Omnicom Group Incorporated | | | | 158,000 | $ 11,715,700 |
| Consumer discretionary: 15.52% | | | | | |
| Auto components: 2.26% | | | | | |
| Gentex Corporation | | | | 415,200 | 14,810,184 |
| Hotels, restaurants & leisure: 1.17% | | | | | |
| Extended Stay America Incorporated | | | | 387,350 | 7,650,163 |
| Household durables: 4.85% | | | | | |
| Helen of Troy Limited † | | | | 83,970 | 17,689,120 |
| Whirlpool Corporation | | | | 64,200 | 14,146,470 |
| | | | | | 31,835,590 |
| Specialty retail: 2.46% | | | | | |
| American Eagle Outfitters Incorporated | | | | 552,430 | 16,153,053 |
| Textiles, apparel & luxury goods: 4.78% | | | | | |
| Gildan Activewear Incorporated | | | | 725,200 | 22,234,632 |
| HanesBrands Incorporated | | | | 462,900 | 9,105,243 |
| | | | | | 31,339,875 |
| Financials: 24.68% | | | | | |
| Banks: 1.02% | | | | | |
| Commerce Bancshares Incorporated | | | | 86,998 | 6,664,917 |
| Capital markets: 2.30% | | | | | |
| State Street Corporation | | | | 179,300 | 15,062,993 |
| Consumer finance: 4.69% | | | | | |
| FirstCash Financial Services Incorporated | | | | 310,740 | 20,406,296 |
| Synchrony Financial | | | | 255,500 | 10,388,630 |
| | | | | | 30,794,926 |
| Insurance: 14.16% | | | | | |
| Alleghany Corporation † | | | | 25,300 | 15,845,137 |
| Arch Capital Group Limited † | | | | 471,500 | 18,091,455 |
| Fidelity National Financial Incorporated | | | | 477,300 | 19,407,018 |
| Globe Life Incorporated | | | | 137,800 | 13,315,614 |
| Progressive Corporation | | | | 96,500 | 9,226,365 |
| RenaissanceRe Holdings Limited | | | | 67,500 | 10,816,875 |
| The Allstate Corporation | | | | 54,000 | 6,204,600 |
| | | | | | 92,907,064 |
| Thrifts & mortgage finance: 2.51% | | | | | |
| Essent Group Limited | | | | 346,100 | 16,436,289 |
The accompanying notes are an integral part of these financial statements.
Wells Fargo C&B Mid Cap Value Fund | 7
Portfolio of investments—March 31, 2021 (unaudited)
| | | | | Shares | Value |
| Health care: 11.02% | | | | | |
| Health care equipment & supplies: 5.22% | | | | | |
| Hill-Rom Holdings Incorporated | | | | 152,200 | $ 16,815,056 |
| Integra LifeSciences Holdings Corporation † | | | | 252,010 | 17,411,371 |
| | | | | | 34,226,427 |
| Health care providers & services: 1.41% | | | | | |
| Laboratory Corporation of America Holdings † | | | | 36,300 | 9,257,589 |
| Life sciences tools & services: 2.49% | | | | | |
| Syneos Health Incorporated † | | | | 215,900 | 16,376,015 |
| Pharmaceuticals: 1.90% | | | | | |
| Perrigo Company plc | | | | 307,700 | 12,452,619 |
| Industrials: 26.23% | | | | | |
| Aerospace & defense: 5.89% | | | | | |
| BWX Technologies Incorporated | | | | 260,100 | 17,150,994 |
| Hexcel Corporation † | | | | 120,100 | 6,725,600 |
| Huntington Ingalls Industries Incorporated | | | | 71,800 | 14,780,030 |
| | | | | | 38,656,624 |
| Building products: 0.97% | | | | | |
| Armstrong World Industries Incorporated | | | | 70,810 | 6,379,273 |
| Commercial services & supplies: 3.49% | | | | | |
| IAA Incorporated † | | | | 305,700 | 16,856,298 |
| Steelcase Incorporated Class A | | | | 418,400 | 6,020,776 |
| | | | | | 22,877,074 |
| Electrical equipment: 3.11% | | | | | |
| Acuity Brands Incorporated | | | | 70,297 | 11,599,005 |
| AMETEK Incorporated | | | | 68,700 | 8,775,051 |
| | | | | | 20,374,056 |
| Machinery: 6.75% | | | | | |
| Colfax Corporation † | | | | 441,602 | 19,346,584 |
| Gates Industrial Corporation plc † | | | | 393,770 | 6,296,382 |
| Stanley Black & Decker Incorporated | | | | 29,950 | 5,980,117 |
| Woodward Governor Company | | | | 105,100 | 12,678,213 |
| | | | | | 44,301,296 |
| Professional services: 2.86% | | | | | |
| Leidos Holdings Incorporated | | | | 194,650 | 18,740,902 |
| Trading companies & distributors: 3.16% | | | | | |
| AerCap Holdings NV † | | | | 352,400 | 20,699,976 |
| Information technology: 7.75% | | | | | |
| Electronic equipment, instruments & components: 4.97% | | | | | |
| Arrow Electronics Incorporated † | | | | 202,606 | 22,452,795 |
| TE Connectivity Limited | | | | 78,300 | 10,109,313 |
| | | | | | 32,562,108 |
The accompanying notes are an integral part of these financial statements.
8 | Wells Fargo C&B Mid Cap Value Fund
Portfolio of investments—March 31, 2021 (unaudited)
| | | | | Shares | Value |
| IT services: 2.04% | | | | | |
| Amdocs Limited | | | | 191,100 | $ 13,405,665 |
| Semiconductors & semiconductor equipment: 0.74% | | | | | |
| MKS Instruments Incorporated | | | | 26,250 | 4,867,275 |
| Materials: 4.72% | | | | | |
| Chemicals: 1.20% | | | | | |
| Axalta Coating Systems Limited † | | | | 267,200 | 7,903,776 |
| Metals & mining: 2.35% | | | | | |
| Reliance Steel & Aluminum Company | | | | 101,200 | 15,411,748 |
| Paper & forest products: 1.17% | | | | | |
| Schweitzer-Mauduit International Incorporated | | | | 156,900 | 7,683,393 |
| Real estate: 1.00% | | | | | |
| Real estate management & development: 1.00% | | | | | |
| CBRE Group Incorporated Class A † | | | | 82,600 | 6,534,486 |
| Utilities: 2.05% | | | | | |
| Gas utilities: 2.05% | | | | | |
| Atmos Energy Corporation | | | | 135,870 | 13,430,750 |
| Total Common stocks (Cost $456,509,128) | | | | | 621,511,806 |
| | | Yield | | | |
| Short-term investments: 4.45% | | | | | |
| Investment companies: 4.45% | | | | | |
| Wells Fargo Government Money Market Fund Select Class ♠∞ | | 0.03% | | 29,167,756 | 29,167,756 |
| Total Short-term investments (Cost $29,167,756) | | | | | 29,167,756 |
| Total investments in securities (Cost $485,676,884) | 99.20% | | | | 650,679,562 |
| Other assets and liabilities, net | 0.80 | | | | 5,259,894 |
| Total net assets | 100.00% | | | | $655,939,456 |
| † | Non-income-earning security |
| ♠ | The issuer of the security is an affiliated person of the Fund as defined in the Investment Company Act of 1940. |
| ∞ | The rate represents the 7-day annualized yield at period end. |
The accompanying notes are an integral part of these financial statements.
Wells Fargo C&B Mid Cap Value Fund | 9
Portfolio of investments—March 31, 2021 (unaudited)
Investments in affiliates
An affiliated investment is an investment in which the Fund owns at least 5% of the outstanding voting shares of the issuer or as a result of other relationships, such as the Fund and the issuer having the same investment manager. Transactions with issuers that were either affiliated persons of the Fund at the beginning of the period or the end of the period were as follows:
| | Value,
beginning of
period | Purchases | Sales
proceeds | Net
realized
gains
(losses) | Net
change in
unrealized
gains
(losses) | Value,
end of
period | % of
net
assets | Shares,
end
of period | Income
from
affiliated
securities |
| Short-term investments | | | | | | | | | |
| Investment companies | | | | | | | | | |
| Wells Fargo Government Money Market Fund Select Class | $10,498,142 | $135,451,992 | $(116,782,378) | $0 | $0 | $29,167,756 | 4.45% | 29,167,756 | $3,556 |
The accompanying notes are an integral part of these financial statements.
10 | Wells Fargo C& B Mid Cap Value Fund
Statement of assets and liabilities—March 31, 2021 (unaudited)
| | |
| Assets | |
Investments in unaffiliated securities, at value (cost $456,509,128)
| $ 621,511,806 |
Investments in affiliated securites, at value (cost $29,167,756)
| 29,167,756 |
Receivable for Fund shares sold
| 4,661,154 |
Receivable for investments sold
| 3,733,852 |
Receivable for dividends
| 313,818 |
Prepaid expenses and other assets
| 79,729 |
Total assets
| 659,468,115 |
| Liabilities | |
Payable for investments purchased
| 2,437,321 |
Payable for Fund shares redeemed
| 576,155 |
Management fee payable
| 391,495 |
Administration fees payable
| 78,107 |
Trustees’ fees and expenses payable
| 2,960 |
Distribution fee payable
| 2,369 |
Accrued expenses and other liabilities
| 40,252 |
Total liabilities
| 3,528,659 |
Total net assets
| $655,939,456 |
| Net assets consist of | |
Paid-in capital
| $ 473,004,757 |
Total distributable earnings
| 182,934,699 |
Total net assets
| $655,939,456 |
| Computation of net asset value and offering price per share | |
Net assets – Class A
| $ 140,252,737 |
Shares outstanding – Class A1
| 2,950,082 |
Net asset value per share – Class A
| $47.54 |
Maximum offering price per share – Class A2
| $50.44 |
Net assets – Class C
| $ 4,202,876 |
Shares outstanding – Class C1
| 95,406 |
Net asset value per share – Class C
| $44.05 |
Net assets – Class R6
| $ 16,857,820 |
Shares outstanding – Class R61
| 351,399 |
Net asset value per share – Class R6
| $47.97 |
Net assets – Administrator Class
| $ 26,996,521 |
Shares outstanding – Administrator Class1
| 561,161 |
Net asset value per share – Administrator Class
| $48.11 |
Net assets – Institutional Class
| $ 467,629,502 |
Shares outstanding – Institutional Class1
| 9,751,691 |
Net asset value per share – Institutional Class
| $47.95 |
| 1 | The Fund has an unlimited number of authorized shares |
| 2 | Maximum offering price is computed as 100/94.25 of net asset value. On investments of $50,000 or more, the offering price is reduced. |
The accompanying notes are an integral part of these financial statements.
Wells Fargo C&B Mid Cap Value Fund | 11
Statement of operations—six months ended March 31, 2021 (unaudited)
| | |
| Investment income | |
Dividends
| $ 3,929,162 |
Income from affiliated securities
| 3,556 |
Total investment income
| 3,932,718 |
| Expenses | |
Management fee
| 2,045,935 |
| Administration fees | |
Class A
| 130,981 |
Class C
| 3,934 |
Class R6
| 2,180 |
Administrator Class
| 17,222 |
Institutional Class
| 245,644 |
| Shareholder servicing fees | |
Class A
| 155,930 |
Class C
| 4,683 |
Administrator Class
| 33,108 |
| Distribution fee | |
Class C
| 13,977 |
Custody and accounting fees
| 11,201 |
Professional fees
| 20,985 |
Registration fees
| 53,301 |
Shareholder report expenses
| 41,019 |
Trustees’ fees and expenses
| 9,610 |
Other fees and expenses
| 6,976 |
Total expenses
| 2,796,686 |
| Less: Fee waivers and/or expense reimbursements | |
Fund-level
| (44,809) |
Class A
| (2,371) |
Class R6
| (811) |
Administrator Class
| (1,342) |
Institutional Class
| (21,814) |
Net expenses
| 2,725,539 |
Net investment income
| 1,207,179 |
| Realized and unrealized gains (losses) on investments | |
Net realized gains on investments
| 33,618,934 |
Net change in unrealized gains (losses) on investments
| 137,902,899 |
Net realized and unrealized gains (losses) on investments
| 171,521,833 |
Net increase in net assets resulting from operations
| $172,729,012 |
The accompanying notes are an integral part of these financial statements.
12 | Wells Fargo C& B Mid Cap Value Fund
Statement of changes in net assets
| | |
| | Six months ended
March 31, 2021
(unaudited) | Year ended
September 30, 2020 |
| Operations | | | | |
Net investment income
| | $ 1,207,179 | | $ 2,315,458 |
Net realized gains (losses) on investments
| | 33,618,934 | | (13,737,886) |
Net change in unrealized gains (losses) on investments
| | 137,902,899 | | (31,020,572) |
Net increase (decrease) in net assets resulting from operations
| | 172,729,012 | | (42,443,000) |
| Distributions to shareholders from | | | | |
| Net investment income and net realized gains | | | | |
Class A
| | (227,113) | | (3,368,775) |
Class C
| | 0 | | (116,894) |
Class R6
| | (81,410) | | (485,361) |
Administrator Class
| | (56,758) | | (945,399) |
Institutional Class
| | (1,735,541) | | (8,727,328) |
Total distributions to shareholders
| | (2,100,822) | | (13,643,757) |
| Capital share transactions | Shares | | Shares | |
| Proceeds from shares sold | | | | |
Class A
| 166,831 | 6,929,732 | 960,999 | 33,921,828 |
Class C
| 49,223 | 1,939,106 | 27,501 | 911,966 |
Class R6
| 20,060 | 868,182 | 81,470 | 2,854,895 |
Administrator Class
| 60,198 | 2,628,302 | 317,699 | 12,268,162 |
Institutional Class
| 2,790,760 | 121,005,779 | 7,166,530 | 244,342,104 |
| | | 133,371,101 | | 294,298,955 |
| Reinvestment of distributions | | | | |
Class A
| 5,249 | 219,839 | 79,402 | 3,248,552 |
Class C
| 0 | 0 | 2,989 | 113,505 |
Class R6
| 1,185 | 50,016 | 6,228 | 257,557 |
Administrator Class
| 1,331 | 56,369 | 22,658 | 938,447 |
Institutional Class
| 41,072 | 1,733,252 | 210,740 | 8,708,954 |
| | | 2,059,476 | | 13,267,015 |
| Payment for shares redeemed | | | | |
Class A
| (272,120) | (11,346,899) | (686,660) | (23,231,821) |
Class C
| (54,551) | (2,110,941) | (53,935) | (1,754,560) |
Class R6
| (19,494) | (796,381) | (115,303) | (4,078,132) |
Administrator Class
| (181,068) | (7,911,465) | (258,443) | (8,985,442) |
Institutional Class
| (2,160,494) | (87,388,525) | (4,458,883) | (151,411,494) |
| | | (109,554,211) | | (189,461,449) |
Net increase in net assets resulting from capital share transactions
| | 25,876,366 | | 118,104,521 |
Total increase in net assets
| | 196,504,556 | | 62,017,764 |
| Net assets | | | | |
Beginning of period
| | 459,434,900 | | 397,417,136 |
End of period
| | $ 655,939,456 | | $ 459,434,900 |
The accompanying notes are an integral part of these financial statements.
Wells Fargo C&B Mid Cap Value Fund | 13
Financial highlights
(For a share outstanding throughout each period)
| | | Year ended September 30 |
| Class A | Six months ended
March 31, 2021
(unaudited) | 2020 | 2019 | 2018 | 2017 | 2016 |
Net asset value, beginning of period
| $34.40 | $39.67 | $37.88 | $35.07 | $29.27 | $25.12 |
Net investment income (loss)
| 0.04 | 0.10 1 | 0.16 | 0.06 | (0.00) 1,2 | 0.07 1 |
Net realized and unrealized gains (losses) on investments
| 13.18 | (4.21) | 1.69 | 2.75 | 5.82 | 4.13 |
Total from investment operations
| 13.22 | (4.11) | 1.85 | 2.81 | 5.82 | 4.20 |
| Distributions to shareholders from | | | | | | |
Net investment income
| (0.08) | (0.15) | (0.06) | (0.00) 3 | (0.02) | (0.05) |
Net realized gains
| 0.00 | (1.01) | 0.00 | 0.00 | 0.00 | 0.00 |
Total distributions to shareholders
| (0.08) | (1.16) | (0.06) | (0.00) 3 | (0.02) | (0.05) |
Net asset value, end of period
| $47.54 | $34.40 | $39.67 | $37.88 | $35.07 | $29.27 |
Total return4
| 38.48% | (10.81)% | 4.91% | 8.02% | 19.89% | 16.73% |
| Ratios to average net assets (annualized) | | | | | | |
Gross expenses
| 1.26% | 1.27% | 1.29% | 1.29% | 1.30% | 1.33% |
Net expenses
| 1.25% | 1.25% | 1.25% | 1.25% | 1.25% | 1.24% |
Net investment income (loss)
| 0.19% | 0.29% | 0.43% | 0.16% | (0.00)% | 0.27% |
| Supplemental data | | | | | | |
Portfolio turnover rate
| 31% | 45% | 42% | 39% | 54% | 35% |
Net assets, end of period (000s omitted)
| $140,253 | $104,922 | $106,975 | $111,354 | $115,258 | $120,020 |
| 1 | Calculated based upon average shares outstanding |
| 2 | Amount is more than $(0.005) |
| 3 | Amount is less than $0.005. |
| 4 | Total return calculations do not include any sales charges. Returns for periods of less than one year are not annualized. |
The accompanying notes are an integral part of these financial statements.
14 | Wells Fargo C& B Mid Cap Value Fund
Financial highlights
(For a share outstanding throughout each period)
| | | Year ended September 30 |
| Class C | Six months ended
March 31, 2021
(unaudited) | 2020 | 2019 | 2018 | 2017 | 2016 |
Net asset value, beginning of period
| $31.94 | $36.98 | $35.51 | $33.12 | $27.83 | $24.02 |
Net investment loss
| (0.12) 1 | (0.16) 1 | (0.12) 1 | (0.20) 1 | (0.26) 1 | (0.14) 1 |
Net realized and unrealized gains (losses) on investments
| 12.23 | (3.87) | 1.59 | 2.59 | 5.55 | 3.95 |
Total from investment operations
| 12.11 | (4.03) | 1.47 | 2.39 | 5.29 | 3.81 |
| Distributions to shareholders from | | | | | | |
Net realized gains
| 0.00 | (1.01) | 0.00 | 0.00 | 0.00 | 0.00 |
Net asset value, end of period
| $44.05 | $31.94 | $36.98 | $35.51 | $33.12 | $27.83 |
Total return2
| 37.95% | (11.32)% | 4.14% | 7.22% | 19.01% | 15.86% |
| Ratios to average net assets (annualized) | | | | | | |
Gross expenses
| 2.01% | 2.01% | 2.04% | 2.04% | 2.05% | 2.08% |
Net expenses
| 2.00% | 2.00% | 2.00% | 2.00% | 2.00% | 1.98% |
Net investment loss
| (0.61)% | (0.47)% | (0.36)% | (0.59)% | (0.74)% | (0.55)% |
| Supplemental data | | | | | | |
Portfolio turnover rate
| 31% | 45% | 42% | 39% | 54% | 35% |
Net assets, end of period (000s omitted)
| $4,203 | $3,217 | $4,592 | $8,371 | $8,567 | $7,314 |
| 1 | Calculated based upon average shares outstanding |
| 2 | Total return calculations do not include any sales charges. Returns for periods of less than one year are not annualized. |
The accompanying notes are an integral part of these financial statements.
Wells Fargo C&B Mid Cap Value Fund | 15
Financial highlights
(For a share outstanding throughout each period)
| | | Year ended September 30 |
| Class R6 | Six months ended
March 31, 2021
(unaudited) | 2020 | 2019 | 2018 1 |
Net asset value, beginning of period
| $34.77 | $40.06 | $38.27 | $37.39 |
Net investment income
| 0.14 | 0.27 | 0.35 2 | 0.08 2 |
Net realized and unrealized gains (losses) on investments
| 13.30 | (4.25) | 1.67 | 0.80 |
Total from investment operations
| 13.44 | (3.98) | 2.02 | 0.88 |
| Distributions to shareholders from | | | | |
Net investment income
| (0.24) | (0.30) | (0.23) | 0.00 |
Net realized gains
| 0.00 | (1.01) | 0.00 | 0.00 |
Total distributions to shareholders
| (0.24) | (1.31) | (0.23) | 0.00 |
Net asset value, end of period
| $47.97 | $34.77 | $40.06 | $38.27 |
Total return3
| 38.77% | (10.42)% | 5.39% | 2.35% |
| Ratios to average net assets (annualized) | | | | |
Gross expenses
| 0.83% | 0.84% | 0.86% | 0.86% |
Net expenses
| 0.80% | 0.80% | 0.80% | 0.80% |
Net investment income
| 0.64% | 0.73% | 0.95% | 1.24% |
| Supplemental data | | | | |
Portfolio turnover rate
| 31% | 45% | 42% | 39% |
Net assets, end of period (000s omitted)
| $16,858 | $12,156 | $15,112 | $26 |
| 1 | For the period from July 31, 2018 (commencement of class operations) to September 30, 2018 |
| 2 | Calculated based upon average shares outstanding |
| 3 | Returns for periods of less than one year are not annualized. |
The accompanying notes are an integral part of these financial statements.
16 | Wells Fargo C& B Mid Cap Value Fund
Financial highlights
(For a share outstanding throughout each period)
| | | Year ended September 30 |
| Administrator Class | Six months ended
March 31, 2021
(unaudited) | 2020 | 2019 | 2018 | 2017 | 2016 |
Net asset value, beginning of period
| $34.80 | $40.14 | $38.35 | $35.52 | $29.63 | $25.42 |
Net investment income
| 0.06 1 | 0.14 1 | 0.20 1 | 0.10 1 | 0.04 1 | 0.08 1 |
Net realized and unrealized gains (losses) on investments
| 13.34 | (4.27) | 1.70 | 2.78 | 5.89 | 4.19 |
Total from investment operations
| 13.40 | (4.13) | 1.90 | 2.88 | 5.93 | 4.27 |
| Distributions to shareholders from | | | | | | |
Net investment income
| (0.09) | (0.20) | (0.11) | (0.05) | (0.04) | (0.06) |
Net realized gains
| 0.00 | (1.01) | 0.00 | 0.00 | 0.00 | 0.00 |
Total distributions to shareholders
| (0.09) | (1.21) | (0.11) | (0.05) | (0.04) | (0.06) |
Net asset value, end of period
| $48.11 | $34.80 | $40.14 | $38.35 | $35.52 | $29.63 |
Total return2
| 38.54% | (10.74)% | 5.03% | 8.13% | 20.02% | 16.82% |
| Ratios to average net assets (annualized) | | | | | | |
Gross expenses
| 1.18% | 1.19% | 1.21% | 1.21% | 1.22% | 1.25% |
Net expenses
| 1.15% | 1.15% | 1.15% | 1.15% | 1.15% | 1.15% |
Net investment income
| 0.28% | 0.38% | 0.53% | 0.26% | 0.12% | 0.28% |
| Supplemental data | | | | | | |
Portfolio turnover rate
| 31% | 45% | 42% | 39% | 54% | 35% |
Net assets, end of period (000s omitted)
| $26,997 | $23,691 | $24,036 | $20,960 | $21,267 | $8,302 |
| 1 | Calculated based upon average shares outstanding |
| 2 | Returns for periods of less than one year are not annualized. |
The accompanying notes are an integral part of these financial statements.
Wells Fargo C&B Mid Cap Value Fund | 17
Financial highlights
(For a share outstanding throughout each period)
| | | Year ended September 30 |
| Institutional Class | Six months ended
March 31, 2021
(unaudited) | 2020 | 2019 | 2018 | 2017 | 2016 |
Net asset value, beginning of period
| $34.74 | $40.04 | $38.26 | $35.41 | $29.53 | $25.34 |
Net investment income
| 0.12 | 0.23 1 | 0.28 | 0.19 | 0.16 | 0.16 |
Net realized and unrealized gains (losses) on investments
| 13.29 | (4.25) | 1.70 | 2.78 | 5.82 | 4.17 |
Total from investment operations
| 13.41 | (4.02) | 1.98 | 2.97 | 5.98 | 4.33 |
| Distributions to shareholders from | | | | | | |
Net investment income
| (0.20) | (0.27) | (0.20) | (0.12) | (0.10) | (0.14) |
Net realized gains
| 0.00 | (1.01) | 0.00 | 0.00 | 0.00 | 0.00 |
Total distributions to shareholders
| (0.20) | (1.28) | (0.20) | (0.12) | (0.10) | (0.14) |
Net asset value, end of period
| $47.95 | $34.74 | $40.04 | $38.26 | $35.41 | $29.53 |
Total return2
| 38.71% | (10.52)% | 5.29% | 8.41% | 20.30% | 17.11% |
| Ratios to average net assets (annualized) | | | | | | |
Gross expenses
| 0.93% | 0.94% | 0.96% | 0.96% | 0.97% | 1.00% |
Net expenses
| 0.90% | 0.90% | 0.90% | 0.90% | 0.90% | 0.90% |
Net investment income
| 0.54% | 0.64% | 0.79% | 0.56% | 0.37% | 0.54% |
| Supplemental data | | | | | | |
Portfolio turnover rate
| 31% | 45% | 42% | 39% | 54% | 35% |
Net assets, end of period (000s omitted)
| $467,630 | $315,449 | $246,702 | $200,335 | $105,550 | $38,161 |
| 1 | Calculated based upon average shares outstanding |
| 2 | Returns for periods of less than one year are not annualized. |
The accompanying notes are an integral part of these financial statements.
18 | Wells Fargo C& B Mid Cap Value Fund
Notes to financial statements (unaudited)
1. ORGANIZATION
Wells Fargo Funds Trust (the "Trust"), a Delaware statutory trust organized on March 10, 1999, is an open-end management investment company registered under the Investment Company Act of 1940, as amended (the "1940 Act"). As an investment company, the Trust follows the accounting and reporting guidance in Financial Accounting Standards Board (“FASB”) Accounting Standards Codification Topic 946, Financial Services – Investment Companies. These financial statements report on the Wells Fargo C&B Mid Cap Value Fund (the "Fund") which is a diversified series of the Trust.
On February 23, 2021, Wells Fargo & Company announced that it has entered into a definitive agreement to sell Wells Fargo Asset Management ("WFAM") to GTCR LLC and Reverence Capital Partners, L.P. WFAM is the trade name used by the asset management businesses of Wells Fargo & Company and includes Wells Fargo Funds Management, LLC, the investment manager to the Fund, Wells Capital Management Incorporated and Wells Fargo Asset Management (International) Limited, both registered investment advisers providing sub-advisory services to certain funds, and Wells Fargo Funds Distributor, LLC, the Fund's principal underwriter. As part of the transaction, Wells Fargo & Company will own a 9.9% equity interest and will continue to serve as an important client and distribution partner. The transaction is expected to close in the second half of 2021, subject to customary closing conditions.
Consummation of the transaction will result in the automatic termination of the Fund's investment management agreement and sub-advisory agreement. The Fund's Board of Trustees will be asked to approve new investment management arrangements with the new company. If approved by the Board, the new investment management arrangements with the new company will be presented to the shareholders of the Fund for approval, and, if approved by shareholders, would take effect upon the closing of the transaction. The transaction is expected to close in the second half of 2021, subject to customary closing conditions.
2. SIGNIFICANT ACCOUNTING POLICIES
The following significant accounting policies, which are consistently followed in the preparation of the financial statements of the Fund, are in conformity with U.S. generally accepted accounting principles which require management to make estimates and assumptions that affect the reported amounts of assets and liabilities, disclosure of contingent assets and liabilities at the date of the financial statements, and the reported amounts of income and expenses during the reporting period. Actual results could differ from those estimates.
Securities valuation
All investments are valued each business day as of the close of regular trading on the New York Stock Exchange (generally 4 p.m. Eastern Time), although the Fund may deviate from this calculation time under unusual or unexpected circumstances.
Equity securities that are listed on a foreign or domestic exchange or market are valued at the official closing price or, if none, the last sales price. If no sale occurs on the principal exchange or market that day, a fair value price will be determined in accordance with the Fund’s Valuation Procedures.
Investments in registered open-end investment companies are valued at net asset value. Interests in non-registered investment companies that are redeemable at net asset value are fair valued normally at net asset value.
Investments which are not valued using any of the methods discussed above are valued at their fair value, as determined in good faith by the Board of Trustees. The Board of Trustees has established a Valuation Committee comprised of the Trustees and has delegated to it the authority to take any actions regarding the valuation of portfolio securities that the Valuation Committee deems necessary or appropriate, including determining the fair value of portfolio securities, unless the determination has been delegated to the Wells Fargo Asset Management Pricing Committee at Wells Fargo Funds Management, LLC ("Funds Management"). The Board of Trustees retains the authority to make or ratify any valuation decisions or approve any changes to the Valuation Procedures as it deems appropriate. On a quarterly basis, the Board of Trustees receives reports on any valuation actions taken by the Valuation Committee or the Wells Fargo Asset Management Pricing Committee which may include items for ratification.
Foreign currency translation
The accounting records of the Fund are maintained in U.S. dollars. The values of other assets and liabilities denominated in foreign currencies are translated into U.S. dollars at rates provided by an independent foreign currency pricing source at a time each business day specified by the Wells Fargo Asset Management Pricing Committee. Purchases and sales of securities, and income and expenses are converted at the rate of exchange on the respective dates of such transactions. Net realized foreign exchange gains or losses arise from sales of foreign currencies, currency gains or losses realized between the trade and settlement dates on securities transactions, and the difference between the amounts of dividends, interest and foreign withholding taxes recorded and the U.S. dollar equivalent of the amounts actually paid or received. Net unrealized foreign
Wells Fargo C&B Mid Cap Value Fund | 19
Notes to financial statements (unaudited)
exchange gains and losses arise from changes in the fair value of assets and liabilities other than investments in securities resulting from changes in exchange rates. The changes in net assets arising from changes in exchange rates of securities and the changes in net assets resulting from changes in market prices of securities are not separately presented. Such changes are included in net realized and unrealized gains or losses from investments.
Securities lending
The Fund may lend its securities from time to time in order to earn additional income in the form of fees or interest on securities received as collateral or the investment of any cash received as collateral. When securities are on loan, the Fund receives interest or dividends on those securities. Cash collateral received in connection with its securities lending transactions is invested in Securities Lending Cash Investments, LLC (the "Securities Lending Fund"). Investments in Securities Lending Fund are valued at the evaluated bid price provided by an independent pricing service. Income earned from investment in the Securities Lending Fund (net of fees and rebates), if any, is included in income from affiliated securities on the Statement of Operations.
In a securities lending transaction, the net asset value of the Fund is affected by an increase or decrease in the value of the securities loaned and by an increase or decrease in the value of the instrument in which collateral is invested. The amount of securities lending activity undertaken by the Fund fluctuates from time to time. The Fund has the right under the lending agreement to recover the securities from the borrower on demand. In the event of default or bankruptcy by the borrower, the Fund may be prevented from recovering the loaned securities or gaining access to the collateral or may experience delays or costs in doing so. In such an event, the terms of the agreement allow the unaffiliated securities lending agent to use the collateral to purchase replacement securities on behalf of the Fund or pay the Fund the market value of the loaned securities. The Fund bears the risk of loss with respect to depreciation of its investment of the cash collateral.
Security transactions and income recognition
Securities transactions are recorded on a trade date basis. Realized gains or losses are recorded on the basis of identified cost.
Dividend income is recognized on the ex-dividend date.
Distributions to shareholders
Distributions to shareholders from net investment income and any net realized gains are recorded on the ex-dividend date and paid at least annually. Such distributions are determined in accordance with income tax regulations and may differ from U.S. generally accepted accounting principles. Dividend sources are estimated at the time of declaration. The tax character of distributions is determined as of the Fund's fiscal year end. Therefore, a portion of the Fund's distributions made prior to the Fund’s fiscal year end may be categorized as a tax return of capital at year end.
Federal and other taxes
The Fund intends to continue to qualify as a regulated investment company by distributing substantially all of its investment company taxable income and any net realized capital gains (after reduction for capital loss carryforwards) sufficient to relieve it from all, or substantially all, federal income taxes. Accordingly, no provision for federal income taxes was required.
The Fund’s income and federal excise tax returns and all financial records supporting those returns for the prior three fiscal years are subject to examination by the federal and Delaware revenue authorities. Management has analyzed the Fund's tax positions taken on federal, state, and foreign tax returns for all open tax years and does not believe that there are any uncertain tax positions that require recognition of a tax liability.
As of March 31, 2021, the aggregate cost of all investments for federal income tax purposes was $486,211,678 and the unrealized gains (losses) consisted of:
| Gross unrealized gains | $167,816,456 |
| Gross unrealized losses | (3,348,572) |
| Net unrealized gains | $164,467,884 |
As of September 30, 2020, the Fund had capital loss carryforwards which consisted of $5,283,545 in short-term capital losses.
Class allocations
The separate classes of shares offered by the Fund differ principally in applicable sales charges, distribution, shareholder servicing, and administration fees. Class specific expenses are charged directly to that share class. Investment income, common fund-level expenses, and realized and unrealized gains (losses) on investments are allocated daily to each class of shares based on the relative proportion of net assets of each class.
20 | Wells Fargo C& B Mid Cap Value Fund
Notes to financial statements (unaudited)
3. FAIR VALUATION MEASUREMENTS
Fair value measurements of investments are determined within a framework that has established a fair value hierarchy based upon the various data inputs utilized in determining the value of the Fund’s investments. The three-level hierarchy gives the highest priority to unadjusted quoted prices in active markets for identical assets or liabilities (Level 1) and the lowest priority to unobservable inputs (Level 3). The Fund’s investments are classified within the fair value hierarchy based on the lowest level of input that is significant to the fair value measurement. The inputs are summarized into three broad levels as follows:
| ■ | Level 1 – quoted prices in active markets for identical securities |
| ■ | Level 2 – other significant observable inputs (including quoted prices for similar securities, interest rates, prepayment speeds, credit risk, etc.) |
| ■ | Level 3 – significant unobservable inputs (including the Fund’s own assumptions in determining the fair value of investments) |
The inputs or methodologies used for valuing investments in securities are not necessarily an indication of the risk associated with investing in those securities.
The following is a summary of the inputs used in valuing the Fund’s assets and liabilities as of March 31, 2021:
| | Quoted prices
(Level 1) | Other significant
observable inputs
(Level 2) | Significant
unobservable inputs
(Level 3) | Total |
| Assets | | | | |
| Investments in: | | | | |
| Common stocks | | | | |
| Communication services | $ 11,715,700 | $0 | $0 | $ 11,715,700 |
| Consumer discretionary | 101,788,865 | 0 | 0 | 101,788,865 |
| Financials | 161,866,189 | 0 | 0 | 161,866,189 |
| Health care | 72,312,650 | 0 | 0 | 72,312,650 |
| Industrials | 172,029,201 | 0 | 0 | 172,029,201 |
| Information technology | 50,835,048 | 0 | 0 | 50,835,048 |
| Materials | 30,998,917 | 0 | 0 | 30,998,917 |
| Real estate | 6,534,486 | 0 | 0 | 6,534,486 |
| Utilities | 13,430,750 | 0 | 0 | 13,430,750 |
| Short-term investments | | | | |
| Investment companies | 29,167,756 | 0 | 0 | 29,167,756 |
| Total assets | $650,679,562 | $0 | $0 | $650,679,562 |
Additional sector, industry or geographic detail, if any, is included in the Portfolio of Investments.
For the six months ended March 31, 2021, the Fund did not have any transfers into/out of Level 3.
4. TRANSACTIONS WITH AFFILIATES AND OTHER EXPENSES
Management fee
Funds Management, an indirect wholly owned subsidiary of Wells Fargo & Company ("Wells Fargo"), is the manager of the Fund and provides advisory and fund-level administrative services under an investment management agreement. Under the investment management agreement, Funds Management is responsible for, among other services, implementing the investment objectives and strategies of the Fund, supervising the subadviser and providing fund-level administrative services in connection with the Fund’s operations. As compensation for its services under the investment management agreement, Funds Management is entitled to receive a management fee at the following annual rate based on the Fund’s average daily net assets:
Wells Fargo C&B Mid Cap Value Fund | 21
Notes to financial statements (unaudited)
| Average daily net assets | Management fee |
| First $500 million | 0.750% |
| Next $500 million | 0.725 |
| Next $1 billion | 0.700 |
| Next $2 billion | 0.675 |
| Next $1 billion | 0.650 |
| Next $5 billion | 0.640 |
| Next $2 billion | 0.630 |
| Next $4 billion | 0.620 |
| Over $16 billion | 0.610 |
For the six months ended March 31, 2021, the management fee was equivalent to an annual rate of 0.75% of the Fund’s average daily net assets.
Funds Management has retained the services of a subadviser to provide daily portfolio management to the Fund. The fee for subadvisory services is borne by Funds Management. Cooke & Bieler, L.P., which is not an affiliate of the Funds Management, is the subadviser to the Fund and is entitled to receive a fee from Funds Management at an annual rate starting at 0.45% and declining to 0.35% as the average daily net assets of the Fund increase.
Administration fees
Under a class-level administration agreement, Funds Management provides class-level administrative services to the Fund, which includes paying fees and expenses for services provided by the transfer agent, sub-transfer agents, omnibus account servicers and record-keepers. As compensation for its services under the class-level administration agreement, Funds Management receives an annual fee which is calculated based on the average daily net assets of each class as follows:
| | Class-level
administration fee |
| Class A | 0.21% |
| Class C | 0.21 |
| Class R6 | 0.03 |
| Administrator Class | 0.13 |
| Institutional Class | 0.13 |
Waivers and/or expense reimbursements
Funds Management has contractually waived and/or reimbursed management and administration fees to the extent necessary to maintain certain net operating expense ratios for the Fund. When each class of the Fund has exceeded its expense cap, Funds Management has waived fees and/or reimbursed expenses from fund-level expenses on a proportionate basis and then from class specific expenses. When only certain classes exceed their expense caps, waivers and/or reimbursements are applied against class specific expenses before fund-level expenses. Funds Management has committed through January 31, 2022 to waive fees and/or reimburse expenses to the extent necessary to cap expenses. Prior to or after the commitment expiration date, the cap may be increased or the commitment to maintain the cap may be terminated only with the approval of the Board of Trustees. The contractual expense caps are as follows:
| | Expense ratio caps |
| Class A | 1.25% |
| Class C | 2.00 |
| Class R6 | 0.80 |
| Administrator Class | 1.15 |
| Institutional Class | 0.90 |
22 | Wells Fargo C& B Mid Cap Value Fund
Notes to financial statements (unaudited)
Distribution fee
The Trust has adopted a distribution plan for Class C shares of the Fund pursuant to Rule 12b-1 under the 1940 Act. A distribution fee is charged charged to Class C shares and paid to Wells Fargo Funds Distributor, LLC (“Funds Distributor”), the principal underwriter, at an annual rate of 0.75% of the average daily net assets of Class C shares.
In addition, Funds Distributor is entitled to receive the front-end sales charge from the purchase of Class A shares and a contingent deferred sales charge on the redemption of certain Class A shares. Funds Distributor is also entitled to receive the contingent deferred sales charges from redemptions of Class C shares. For the six months ended March 31, 2021, Funds Distributor received $644 from the sale of Class A shares. No contingent deferred sales charges were incurred by Class A and Class C shares for the six months ended March 31, 2021.
Shareholder servicing fees
The Trust has entered into contracts with one or more shareholder servicing agents, whereby Class A, Class C, and Administrator Class of the Fund are charged a fee at an annual rate of 0.25% of the average daily net assets of each respective class. A portion of these total shareholder servicing fees were paid to affiliates of Wells Fargo.
Interfund transactions
The Fund may purchase or sell portfolio investment securities to certain other Wells Fargo affiliates pursuant to Rule 17a-7 under the 1940 Act and under procedures adopted by the Board of Trustees. The procedures have been designed to ensure that these interfund transactions, which do not incur broker commissions, are effected at current market prices.
5. INVESTMENT PORTFOLIO TRANSACTIONS
Purchases and sales of investments, excluding U.S. government obligations (if any) and short-term securities, for the six months ended March 31, 2021 were $159,789,753 and $160,005,352, respectively.
6. SECURITIES LENDING TRANSACTIONS
The Fund lends its securities through an unaffiliated securities lending agent and receives collateral in the form of cash or securities with a value at least equal to the value of the securities on loan. The value of the loaned securities is determined at the close of each business day and any increases or decreases in the required collateral are exchanged between the Fund and the counterparty on the next business day. Cash collateral received is invested in the Securities Lending Fund which seeks to provide a positive return compared to the daily Federal Funds Open Rate by investing in high-quality, U.S. dollar-denominated short-term money market instruments and is exempt from registration under Section 3(c)(7) of the 1940 Act. Securities Lending Fund is managed by Funds Management and is subadvised by Wells Capital Management Incorporated ("WellsCap"), an affiliate of Funds Management and an indirect wholly owned subsidiary of Wells Fargo. Funds Management receives an advisory fee starting at 0.05% and declining to 0.01% as the average daily net assets of the Securities Lending Fund increase. All of the fees received by Funds Management are paid to WellsCap for its services as subadviser.
In the event of counterparty default or the failure of a borrower to return a loaned security, the Fund has the right to use the collateral to offset any losses incurred. As of March 31, 2021, the Fund did not have any securities on loan.
7. BANK BORROWINGS
The Trust (excluding the money market funds), Wells Fargo Master Trust and Wells Fargo Variable Trust are parties to a $350,000,000 revolving credit agreement whereby the Fund is permitted to use bank borrowings for temporary or emergency purposes, such as to fund shareholder redemption requests. Interest under the credit agreement is charged to the Fund based on a borrowing rate equal to the higher of the Federal Funds rate in effect on that day plus 1.25% or the overnight LIBOR rate in effect on that day plus 1.25%. In addition, an annual commitment fee equal to 0.25% of the unused balance is allocated to each participating fund.
For the six months ended March 31, 2021, there were no borrowings by the Fund under the agreement.
8. CONCENTRATION RISKS
As of the end of the period, the Fund concentrated its portfolio of investments in the financials and industrials sectors. A fund that invests a substantial portion of its assets in any sector may be more affected by changes in that sector than would be a fund whose investments are not heavily weighted in any sector.
Wells Fargo C&B Mid Cap Value Fund | 23
Notes to financial statements (unaudited)
9. INDEMNIFICATION
Under the Fund's organizational documents, the officers and Trustees have been granted certain indemnification rights against certain liabilities that may arise out of performance of their duties to the Fund. The Fund has entered into a separate agreement with each Trustee that converts indemnification rights currently existing under the Fund’s organizational documents into contractual rights that cannot be changed in the future without the consent of the Trustee. Additionally, in the normal course of business, the Fund may enter into contracts with service providers that contain a variety of indemnification clauses. The Fund’s maximum exposure under these arrangements is dependent on future claims that may be made against the Fund and, therefore, cannot be estimated.
10. CORONAVIRUS (COVID-19) PANDEMIC
On March 11, 2020, the World Health Organization announced that it had made the assessment that coronavirus disease 2019 (“COVID-19”) is a pandemic. The impacts of COVID-19 are affecting the entire global economy, individual companies and investment products, the funds, and the market in general. There is significant uncertainty around the extent and duration of business disruptions related to COVID-19 and the impacts may last for an extended period of time. COVID-19 has led to significant uncertainty and volatility in the financial markets.
24 | Wells Fargo C& B Mid Cap Value Fund
Other information (unaudited)
PROXY VOTING INFORMATION
A description of the policies and procedures used to determine how to vote proxies relating to portfolio securities is available without charge, upon request, by calling 1-800-222-8222, visiting our website at wfam.com, or visiting the SEC website at sec.gov. Information regarding how the proxies related to portfolio securities were voted during the most recent 12-month period ended June 30 is available on the website at wfam.com or by visiting the SEC website at sec.gov.
QUARTERLY PORTFOLIO HOLDINGS INFORMATION
The Fund files its complete schedule of portfolio holdings with the SEC for the first and third quarters of each fiscal year as an exhibit to its reports on Form N-PORT. Shareholders may view the filed Form N-PORT by visiting the SEC website at sec.gov.
Wells Fargo C&B Mid Cap Value Fund | 25
Other information (unaudited)
BOARD OF TRUSTEES AND OFFICERS
Each of the Trustees and Officers listed in the table below acts in identical capacities for each fund in the Wells Fargo family of funds, which consists of 142 mutual funds comprising the Wells Fargo Funds Trust, Wells Fargo Variable Trust, Wells Fargo Master Trust and four closed-end funds (collectively the “Fund Complex”). This table should be read in conjunction with the Prospectus and the Statement of Additional Information1. The mailing address of each Trustee and Officer is 525 Market Street, 12th Floor, San Francisco, CA 94105. Each Trustee and Officer serves an indefinite term, however, each Trustee serves such term until reaching the mandatory retirement age established by the Trustees.
Independent Trustees
Name and
year of birth | Position held and
length of service* | Principal occupations during past five years or longer | Current other
public company or
investment
company
directorships |
William R. Ebsworth
(Born 1957) | Trustee,
since 2015 | Retired. From 1984 to 2013, equities analyst, portfolio manager, research director and chief investment officer at Fidelity Management and Research Company in Boston, Tokyo, and Hong Kong, and retired in 2013 as Chief Investment Officer of Fidelity Strategic Advisers, Inc. where he led a team of investment professionals managing client assets. Prior thereto, Board member of Hong Kong Securities Clearing Co., Hong Kong Options Clearing Corp., the Thailand International Fund, Ltd., Fidelity Investments Life Insurance Company, and Empire Fidelity Investments Life Insurance Company. Audit Committee Chair and Investment Committee Chair of the Vincent Memorial Hospital Endowment (non-profit organization). Mr. Ebsworth is a CFA® charterholder. | N/A |
Jane A. Freeman
(Born 1953) | Trustee,
since 2015;
Chair Liaison,
since 2018 | Retired. From 2012 to 2014 and 1999 to 2008, Chief Financial Officer of Scientific Learning Corporation. From 2008 to 2012, Ms. Freeman provided consulting services related to strategic business projects. Prior to 1999, Portfolio Manager at Rockefeller & Co. and Scudder, Stevens & Clark. Board member of the Harding Loevner Funds from 1996 to 2014, serving as both Lead Independent Director and chair of the Audit Committee. Board member of the Russell Exchange Traded Funds Trust from 2011 to 2012 and the chair of the Audit Committee. Ms. Freeman is also an inactive Chartered Financial Analyst. | N/A |
Isaiah Harris, Jr.
(Born 1952) | Trustee,
since 2009; Audit
Committee
Chair,
since 2019 | Retired. Chairman of the Board of CIGNA Corporation since 2009, and Director since 2005. From 2003 to 2011, Director of Deluxe Corporation. Prior thereto, President and CEO of BellSouth Advertising and Publishing Corp. from 2005 to 2007, President and CEO of BellSouth Enterprises from 2004 to 2005 and President of BellSouth Consumer Services from 2000 to 2003. Emeritus member of the Iowa State University Foundation Board of Governors. Emeritus Member of the Advisory Board of Iowa State University School of Business. Advisory Board Member, Palm Harbor Academy (private school). Mr. Harris is a certified public accountant (inactive status). | CIGNA Corporation |
Judith M. Johnson
(Born 1949) | Trustee,
since 2008 | Retired. Prior thereto, Chief Executive Officer and Chief Investment Officer of Minneapolis Employees Retirement Fund from 1996 to 2008. Ms. Johnson is an attorney, certified public accountant and a certified managerial accountant. | N/A |
David F. Larcker
(Born 1950) | Trustee,
since 2009 | James Irvin Miller Professor of Accounting at the Graduate School of Business (Emeritus), Stanford University, Director of the Corporate Governance Research Initiative and Senior Faculty of The Rock Center for Corporate Governance since 2006. From 2005 to 2008, Professor of Accounting at the Graduate School of Business, Stanford University. Prior thereto, Ernst & Young Professor of Accounting at The Wharton School, University of Pennsylvania from 1985 to 2005. | N/A |
26 | Wells Fargo C& B Mid Cap Value Fund
Other information (unaudited)
Name and
year of birth | Position held and
length of service* | Principal occupations during past five years or longer | Current other
public company or
investment
company
directorships |
Olivia S. Mitchell
(Born 1953) | Trustee,
since 2006;
Nominating and
Governance
Committee Chair,
since 2018 | International Foundation of Employee Benefit Plans Professor, Wharton School of the University of Pennsylvania since 1993. Director of Wharton’s Pension Research Council and Boettner Center on Pensions & Retirement Research, and Research Associate at the National Bureau of Economic Research. Previously, Cornell University Professor from 1978 to 1993. | N/A |
Timothy J. Penny
(Born 1951) | Trustee,
since 1996;
Chair,
since 2018 | President and Chief Executive Officer of Southern Minnesota Initiative Foundation, a non-profit organization, since 2007. Member of the Board of Trustees of NorthStar Education Finance, Inc., a non-profit organization, since 2007. | N/A |
James G. Polisson
(Born 1959) | Trustee,
since 2018 | Retired. Chief Marketing Officer, Source (ETF) UK Services, Ltd, from 2015 to 2017. From 2012 to 2015, Principal of The Polisson Group, LLC, a management consulting, corporate advisory and principal investing company. Chief Executive Officer and Managing Director at Russell Investments, Global Exchange Traded Funds from 2010 to 2012. Managing Director of Barclays Global Investors from 1998 to 2010 and Global Chief Marketing Officer for iShares and Barclays Global Investors from 2000 to 2010. Trustee of the San Francisco Mechanics’ Institute, a non-profit organization, from 2013 to 2015. Board member of the Russell Exchange Traded Fund Trust from 2011 to 2012. Director of Barclays Global Investors Holdings Deutschland GmbH from 2006 to 2009. Mr. Polisson is an attorney and has a retired status with the Massachusetts and District of Columbia Bar Associations. | N/A |
Pamela Wheelock
(Born 1959) | Trustee,
since January
2020; previously
Trustee from
January 2018 to
July 2019 | Board member of the Destination Medical Center Economic Development Agency, Rochester, Minnesota since 2019. Interim President of the McKnight Foundation from January to September 2020. Acting Commissioner, Minnesota Department of Human Services, July 2019 through September 2019. Human Services Manager (part-time), Minnesota Department of Human Services, October 2019 through December 2019. Chief Operating Officer, Twin Cities Habitat for Humanity from 2017 to 2019. Vice President of University Services, University of Minnesota from 2012 to 2016. Prior thereto, on the Board of Directors, Governance Committee and Finance Committee for the Minnesota Philanthropy Partners (Saint Paul Foundation) from 2012 to 2018, Interim Chief Executive Officer of Blue Cross Blue Shield of Minnesota from 2011 to 2012, Chairman of the Board from 2009 to 2012 and Board Director from 2003 to 2015. Vice President, Leadership and Community Engagement, Bush Foundation, Saint Paul, Minnesota (a private foundation) from 2009 to 2011. Executive Vice President and Chief Financial Officer, Minnesota Sports and Entertainment from 2004 to 2009 and Senior Vice President from 2002 to 2004. Executive Vice President of the Minnesota Wild Foundation from 2004 to 2008. Commissioner of Finance, State of Minnesota, from 1999 to 2002. Currently Board Chair of the Minnesota Wild Foundation since 2010. | N/A |
* Length of service dates reflect the Trustee’s commencement of service with the Trust’s predecessor entities, where applicable.
Wells Fargo C&B Mid Cap Value Fund | 27
Other information (unaudited)
Officers
Name and
year of birth | Position held and
length of service | Principal occupations during past five years or longer |
Andrew Owen
(Born 1960) | President,
since 2017 | Executive Vice President of Wells Fargo & Company and Head of Affiliated Managers, Wells Fargo Asset Management, since 2014. In addition, Mr. Owen is currently President, Chief Executive Officer and Director of Wells Fargo Funds Management, LLC since 2017. Prior thereto, Executive Vice President responsible for marketing, investments and product development for Wells Fargo Funds Management, LLC, from 2009 to 2014. |
Jeremy DePalma
(Born 1974) | Treasurer,
since 2012
(for certain funds in
the Fund Complex);
since 2021 (for
the remaining funds in the
Fund Complex) | Senior Vice President of Wells Fargo Funds Management, LLC since 2009. Senior Vice President of Evergreen Investment Management Company, LLC from 2008 to 2010 and head of the Fund Reporting and Control Team within Fund Administration from 2005 to 2010. |
Michelle Rhee
(Born 1966) | Chief Legal Officer,
since 2019 | Secretary of Wells Fargo Funds Management, LLC and Chief Legal Counsel of Wells Fargo Asset Management since 2018. Deputy General Counsel of Wells Fargo Bank, N.A. since 2020 and Assistant General Counsel of Wells Fargo Bank, N.A. from 2018 to 2020. Associate General Counsel and Managing Director of Bank of America Corporation from 2004 to 2018. |
Catherine Kennedy
(Born 1969) | Secretary,
since 2019 | Vice President of Wells Fargo Funds Management, LLC and Senior Counsel of the Wells Fargo Legal Department since 2010. Vice President and Senior Counsel of Evergreen Investment Management Company, LLC from 1998 to 2010. |
Michael H. Whitaker
(Born 1967) | Chief Compliance Officer,
since 2016 | Chief Compliance Officer of Wells Fargo Asset Management since 2016. Senior Vice President and Chief Compliance Officer for Fidelity Investments from 2007 to 2016. |
1 The Statement of Additional Information includes additional information about the Trustees and is available, without charge, upon request, by calling 1-800-222-8222 or by visiting the website at wfam.com.
28 | Wells Fargo C& B Mid Cap Value Fund
For more information
More information about Wells Fargo Funds is available free upon request. To obtain literature, please write, visit the Fund's website, or call:
Wells Fargo Funds
P.O. Box 219967
Kansas City, MO 64121-9967
Website: wfam.com
Individual investors: 1-800-222-8222
Retail investment professionals: 1-888-877-9275
Institutional investment professionals: 1-866-765-0778
This report and the financial statements contained herein are submitted for the general information of the shareholders of the Fund. If this report is used for promotional purposes, distribution of the report must be accompanied or preceded by a current prospectus. Before investing, please consider the investment objectives, risks, charges, and expenses of the investment. For a current prospectus and, if available, a summary prospectus, containing this information, call 1-800-222-8222 or visit the Fund's website at wfam.com. Read the prospectus carefully before you invest or send money.
Wells Fargo Asset Management (WFAM) is the trade name for certain investment advisory/management firms owned by Wells Fargo & Company. These firms include but are not limited to Wells Capital Management Incorporated and Wells Fargo Funds Management, LLC. Certain products managed by WFAM entities are distributed by Wells Fargo Funds Distributor, LLC (a broker-dealer and Member FINRA).
This material is for general informational and educational purposes only and is NOT intended to provide investment advice or a recommendation of any kind - including a recommendation for any specific investment, strategy, or plan.
INVESTMENT PRODUCTS: NOT FDIC INSURED ■ NO BANK GUARANTEE ■ MAY LOSE VALUE
© 2021 Wells Fargo & Company. All rights reserved.
PAR-0421-00293 05-21
SA228/SAR228 03-21
Semi-Annual Report
March 31, 2021
Wells Fargo Common Stock Fund
Reduce clutter.
Save trees.
Sign up for electronic delivery of prospectuses and shareholder reports at wellsfargo.com/ advantagedelivery
The views expressed and any forward-looking statements are as of March 31, 2021, unless otherwise noted, and are those of the Fund's portfolio managers and/or Wells Fargo Asset Management. Discussions of individual securities or the markets generally are not intended as individual recommendations. Future events or results may vary significantly from those expressed in any forward-looking statements. The views expressed are subject to change at any time in response to changing circumstances in the market. Wells Fargo Asset Management and the Fund disclaim any obligation to publicly update or revise any views expressed or forward-looking statements.
INVESTMENT PRODUCTS: NOT FDIC INSURED ■ NO BANK GUARANTEE ■ MAY LOSE VALUE
Wells Fargo Common Stock Fund | 1
Letter to shareholders (unaudited)
Andrew Owen
President
Wells Fargo Funds
Dear Shareholder:
We are pleased to offer you this semi-annual report for the Wells Fargo Common Stock Fund for the six-month period that ended March 31, 2021. Despite a deeply challenging year, dominated by the spread of COVID-19 cases and a sharp drop in economic output throughout much of the world, global stocks performed extremely well, benefiting from ongoing central bank support and rising optimism over the development and distribution of effective COVID-19 vaccines. Bonds also had positive returns, led by global bonds and high-yield bonds.
For the six-month period, U.S. stocks, based on the S&P 500 Index,1 gained 19.07%. International stocks, as measured by the MSCI ACWI ex USA Index (Net),2 returned 21.10%, while the MSCI EM Index (Net),3 had even stronger performance, with a 22.43% gain. Among bond indexes, the Bloomberg Barclays U.S. Aggregate Bond Index,4 returned -2.73%, the Bloomberg Barclays Global Aggregate ex-USD Index (unhedged),5 returned -0.47%, and the Bloomberg Barclays Municipal Bond Index,6 returned 1.46% while the ICE BofA U.S. High Yield Index,7 gained 7.44%.
Hope drove the stock markets to new highs.
In October, capital markets stepped back from their six-month rally. Market volatility rose in advance of the U.S. election and amid a global increase in COVID-19 infections. Europe introduced tighter restrictions affecting economic activity. U.S. markets looked favorably at the prospect of Democratic control of the federal purse strings, which could lead to additional fiscal stimulus and a boost to economic activity. Meanwhile, China reported 4.9% third-quarter gross domestic product growth.
Global stocks rallied in November, propelled by optimism over three promising COVID-19 vaccines. Reversing recent trends, value stocks outperformed growth stocks and cyclical stocks outpaced information technology (IT) stocks. However, U.S. unemployment remained elevated, with a net job loss of 10 million since February. The eurozone services purchasing managers’ index contracted sharply while the region’s manufacturing activity grew. The U.S. election results added to the upbeat mood as investors anticipated more consistent policies in the new administration.
“Global stocks rallied in November, propelled by optimism over three promising COVID-19 vaccines.”
| 1 | The S&P 500 Index consists of 500 stocks chosen for market size, liquidity, and industry group representation. It is a market-value-weighted index with each stock's weight in the index proportionate to its market value. You cannot invest directly in an index. |
| 2 | The Morgan Stanley Capital International (MSCI) All Country World Index (ACWI) ex USA Index (Net) is a free-float-adjusted market-capitalization-weighted index that is designed to measure the equity market performance of developed and emerging markets, excluding the United States. Source: MSCI. MSCI makes no express or implied warranties or representations and shall have no liability whatsoever with respect to any MSCI data contained herein. The MSCI data may not be further redistributed or used as a basis for other indices or any securities or financial products. This report is not approved, reviewed, or produced by MSCI. You cannot invest directly in an index. |
| 1 | The S&P 500 Index consists of 500 stocks chosen for market size, liquidity, and industry group representation. It is a market-value-weighted index with each stock's weight in the index proportionate to its market value. You cannot invest directly in an index. |
| 3 | The MSCI Emerging Markets (EM) Index (Net) is a free-float-adjusted market-capitalization-weighted index that is designed to measure equity market performance of emerging markets. You cannot invest directly in an index. |
| 1 | The S&P 500 Index consists of 500 stocks chosen for market size, liquidity, and industry group representation. It is a market-value-weighted index with each stock's weight in the index proportionate to its market value. You cannot invest directly in an index. |
| 4 | The Bloomberg Barclays U.S. Aggregate Bond Index is a broad-based benchmark that measures the investment-grade, U.S. dollar-denominated, fixed-rate taxable bond market, including Treasuries, government-related and corporate securities, mortgage-backed securities (agency fixed-rate and hybrid adjustable-rate mortgage pass-throughs), asset-backed securities, and commercial mortgage-backed securities. You cannot invest directly in an index. |
| 1 | The S&P 500 Index consists of 500 stocks chosen for market size, liquidity, and industry group representation. It is a market-value-weighted index with each stock's weight in the index proportionate to its market value. You cannot invest directly in an index. |
| 5 | The Bloomberg Barclays Global Aggregate ex-USD Index (unhedged) is an unmanaged index that provides a broad-based measure of the global investment-grade fixed-income markets excluding the U.S. dollar-denominated debt market. You cannot invest directly in an index. |
| 1 | The S&P 500 Index consists of 500 stocks chosen for market size, liquidity, and industry group representation. It is a market-value-weighted index with each stock's weight in the index proportionate to its market value. You cannot invest directly in an index. |
| 6 | The Bloomberg Barclays Municipal Bond Index is an unmanaged index composed of long-term tax-exempt bonds with a minimum credit rating of Baa. You cannot invest directly in an index. |
| 1 | The S&P 500 Index consists of 500 stocks chosen for market size, liquidity, and industry group representation. It is a market-value-weighted index with each stock's weight in the index proportionate to its market value. You cannot invest directly in an index. |
| 7 | The ICE BofA U.S. High Yield Index is a market-capitalization-weighted index of domestic and Yankee high-yield bonds. The index tracks the performance of high-yield securities traded in the U.S. bond market. You cannot invest directly in an index. Copyright 2021. ICE Data Indices, LLC. All rights reserved. |
2 | Wells Fargo Common Stock Fund
Letter to shareholders (unaudited)
Financial markets ended the year with strength on high expectations for a rapid rollout of the COVID-19 vaccines, the successful passage of a $900 billion stimulus package, and rising expectations of additional economic support from a Democratic-led Congress. U.S. economic data were mixed with still-elevated unemployment and weak retail sales but growth in manufacturing output. In contrast, China’s economic expansion continued in both manufacturing and nonmanufacturing. U.S. COVID-19 infection rates continued to rise even as new state and local lockdown measures were implemented.
The year 2021 began with emerging market stocks leading all major asset classes in January, driven by China’s strong economic growth and a broad recovery in corporate earnings, which propelled China’s stock market higher. In the U.S., positive news on vaccine trials and January's expansion in both the manufacturing and services sectors were offset by a weak December monthly jobs report. This was compounded by technical factors as some hedge funds were forced to sell stocks to protect themselves against a well-publicized short squeeze coordinated by a group of retail investors. Eurozone sentiment and economic growth were particularly weak, reflecting the impact of a new lockdown with stricter social distancing along with a slow vaccine rollout.
February saw major domestic equity indexes driven higher on the hope of a new stimulus bill, improving COVID-19 vaccination numbers, and the gradual reopening of the economy. Most S&P 500 companies reported better-than-expected earnings, with positive surprises coming from the financials, IT, health care, and materials sectors. Japan saw its economy strengthen as a result of strong export numbers. Meanwhile, crude-oil prices continued their climb, rising more than 25% for the year. Domestic government bonds experienced a sharp sell-off in late February as markets priced in a more robust economic recovery and higher future growth and inflation expectations.
The passage of the massive domestic stimulus bill highlighted March activity, leading to increased forecasts for U.S. growth in 2021. Domestic employment surged as COVID-19 vaccinations and an increasingly open economy spurred hiring. A majority of U.S. small companies reported they are operating at pre-pandemic capacity or higher. Value continued its outperformance of growth in the month, continuing the trend that started in late 2020. Meanwhile, most major developed global equity indexes are up month to date on the back of rising optimism regarding the outlook for global growth. While the U.S. and the U.K. have been the most successful in terms of the vaccine rollout, even within markets where the vaccine has lagged, such as the eurozone and Japan, equity indexes in many of those countries are also in positive territory this year.
Don’t let short-term uncertainty derail long-term investment goals.
Periods of investment uncertainty can present challenges, but experience has taught us that maintaining long-term investment goals can be an effective way to plan for the future. To help you create a sound strategy based on your personal goals and risk tolerance, Wells Fargo Funds offers more than 100 mutual funds spanning a wide range of asset classes and investment styles. Although diversification cannot guarantee an investment profit or prevent losses, we believe it can be an effective way to manage investment risk and potentially smooth out overall portfolio performance. We encourage investors to know their investments and to understand that appropriate levels of risk-taking may unlock opportunities.
Thank you for choosing to invest with Wells Fargo Funds. We appreciate your confidence in us and remain committed to helping you meet your financial needs.
Sincerely,
Andrew Owen
President
Wells Fargo Funds
“The passage of the massive domestic stimulus bill highlighted March activity, leading to increased forecasts for U.S. growth in 2021.”
For further information about your Fund, contact your investment professional, visit our website at wfam.com, or call us directly at 1-800-222-8222.
Wells Fargo Common Stock Fund | 3
Performance highlights (unaudited)
| Investment objective | The Fund seeks long-term capital appreciation. |
| Manager | Wells Fargo Funds Management, LLC |
| Subadviser | Wells Capital Management Incorporated |
| Portfolio managers | Christopher G. Miller, CFA®‡, Garth B. Newport, CFA®‡ |
| Average annual total returns (%) as of March 31, 2021 |
| | | Including sales charge | | Excluding sales charge | | Expense ratios1 (%) |
| | Inception date | 1 year | 5 year | 10 year | | 1 year | 5 year | 10 year | | Gross | Net 2 |
| Class A (SCSAX) | 11-30-2000 | 72.50 | 12.10 | 10.04 | | 83.01 | 13.43 | 10.70 | | 1.27 | 1.26 |
| Class C (STSAX) | 11-30-2000 | 81.39 | 12.67 | 9.91 | | 82.39 | 12.67 | 9.91 | | 2.02 | 2.01 |
| Class R6 (SCSRX)3 | 6-28-2013 | – | – | – | | 83.77 | 13.90 | 11.16 | | 0.84 | 0.83 |
| Administrator Class (SCSDX) | 7-30-2010 | – | – | – | | 86.44 | 13.98 | 11.06 | | 1.19 | 1.10 |
| Institutional Class (SCNSX) | 7-30-2010 | – | – | – | | 83.78 | 13.89 | 11.14 | | 0.94 | 0.85 |
| Russell 2500™ Index4 | – | – | – | – | | 89.40 | 15.93 | 12.20 | | – | – |
Figures quoted represent past performance, which is no guarantee of future results, and do not reflect taxes that a shareholder may pay on an investment in a fund. Investment return and principal value of an investment will fluctuate so that an investor’s shares, when redeemed, may be worth more or less than their original cost. Performance shown without sales charges would be lower if sales charges were reflected. Current performance may be lower or higher than the performance data quoted, which assumes the reinvestment of dividends and capital gains. Current month-end performance is available on the Fund’s website, wfam.com.
Please keep in mind that high double-digit returns were primarily achieved during favorable market conditions. You should not expect that such favorable returns can be consistently achieved. A fund’s performance, especially for short time periods, should not be the sole factor in making your investment decision.
Index returns do not include transaction costs associated with buying and selling securities, any mutual fund fees or expenses, or any taxes. It is not possible to invest directly in an index.
For Class A shares, the maximum front-end sales charge is 5.75%. For Class C shares, the maximum contingent deferred sales charge is 1.00%. Performance including a contingent deferred sales charge assumes the sales charge for the corresponding time period. Class R6, Administrator Class, and Institutional Class shares are sold without a front-end sales charge or contingent deferred sales charge.
| 1 | Reflects the expense ratios as stated in the most recent prospectuses. The expense ratios shown are subject to change and may differ from the annualized expense ratios shown in the financial highlights of this report. |
| 2 | The manager has contractually committed through January 31, 2022, to waive fees and/or reimburse expenses to the extent necessary to cap total annual fund operating expenses after fee waivers at 1.26% for Class A, 2.01% for Class C, 0.83% for Class R6, 1.10% for Administrator Class, and 0.85% for Institutional Class. Brokerage commissions, stamp duty fees, interest, taxes, acquired fund fees and expenses (if any), and extraordinary expenses are excluded from the expense caps. Prior to or after the commitment expiration date, the caps may be increased or the commitment to maintain the caps may be terminated only with the approval of the Board of Trustees. Without these caps, the Fund’s returns would have been lower. The expense ratio paid by an investor is the net expense ratio (the total annual fund operating expenses after fee waivers) as stated in the prospectuses. |
| 3 | Historical performance shown for the Class R6 shares prior to their inception reflects the performance of the Institutional Class shares, and includes the higher expenses applicable to the Institutional Class shares. If these expenses had not been included, returns for the Class R6 shares would be higher. |
| 4 | The Russell 2500TM Index measures the performance of the 2,500 smallest companies in the Russell 3000® Index, which represents approximately 16% of the total market capitalization of the Russell 3000® Index. You cannot invest directly in an index. |
Stock values fluctuate in response to the activities of individual companies and general market and economic conditions. Smaller-company stocks tend to be more volatile and less liquid than those of larger companies. Certain investment strategies tend to increase the total risk of an investment (relative to the broader market). The Fund is exposed to foreign investment risk. Consult the Fund’s prospectus for additional information on these and other risks.
| ‡ | CFA® and Chartered Financial Analyst® are trademarks owned by CFA Institute. |
4 | Wells Fargo Common Stock Fund
Performance highlights (unaudited)
| Ten largest holdings (%) as of March 31, 20211 |
| Masonite International Corporation | 2.37 |
| Bio-Rad Laboratories Incorporated Class A | 2.16 |
| LivaNova plc | 1.96 |
| Carlisle Companies Incorporated | 1.89 |
| United Rentals Incorporated | 1.88 |
| Sun Communities Incorporated | 1.88 |
| ON Semiconductor Corporation | 1.81 |
| Air Lease Corporation | 1.80 |
| Armstrong World Industries Incorporated | 1.80 |
| Marvell Technology Group Limited | 1.79 |
| 1 | Figures represent the percentage of the Fund's net assets. Holdings are subject to change and may have changed since the date specified. |
| Sector allocation as of March 31, 20211 |
| 1 | Figures represent the percentage of the Fund's long-term investments. These amounts are subject to change and may have changed since the date specified. |
Wells Fargo Common Stock Fund | 5
Fund expenses (unaudited)
As a shareholder of the Fund, you incur two types of costs: (1) transaction costs, including sales charges (loads) on purchase payments and contingent deferred sales charges (if any) on redemptions and (2) ongoing costs, including management fees, distribution (12b-1) and/or shareholder servicing fees, and other Fund expenses. This example is intended to help you understand your ongoing costs (in dollars) of investing in the Fund and to compare these costs with the ongoing costs of investing in other mutual funds.
The example is based on an investment of $1,000 invested at the beginning of the six-month period and held for the entire period from October 1, 2020 to March 31, 2021.
Actual expenses
The “Actual” line of the table below provides information about actual account values and actual expenses. You may use the information in this line, together with the amount you invested, to estimate the expenses that you paid over the period. Simply divide your account value by $1,000 (for example, an $8,600 account value divided by $1,000 = 8.6), then multiply the result by the number in the “Actual” line under the heading entitled “Expenses paid during period” for your applicable class of shares to estimate the expenses you paid on your account during this period.
Hypothetical example for comparison purposes
The “Hypothetical” line of the table below provides information about hypothetical account values and hypothetical expenses based on the Fund’s actual expense ratio and an assumed rate of return of 5% per year before expenses, which is not the Fund’s actual return. The hypothetical account values and expenses may not be used to estimate the actual ending account balance or expenses you paid for the period. You may use this information to compare the ongoing costs of investing in the Fund and other funds. To do so, compare this 5% hypothetical example with the 5% hypothetical examples that appear in the shareholder reports of the other funds.
Please note that the expenses shown in the table are meant to highlight your ongoing costs only and do not reflect any transactional costs, such as sales charges (loads) and contingent deferred sales charges. Therefore, the “Hypothetical” line of the table is useful in comparing ongoing costs only and will not help you determine the relative total costs of owning different funds. In addition, if these transactional costs were included, your costs would have been higher.
| | Beginning
account value
10-1-2020 | Ending
account value
3-31-2021 | Expenses
paid during
the period1 | Annualized net
expense ratio |
| Class A | | | | |
| Actual | $1,000.00 | $1,361.32 | $ 7.24 | 1.23% |
| Hypothetical (5% return before expenses) | $1,000.00 | $1,018.80 | $ 6.19 | 1.23% |
| Class C | | | | |
| Actual | $1,000.00 | $1,356.23 | $11.81 | 2.01% |
| Hypothetical (5% return before expenses) | $1,000.00 | $1,014.91 | $10.10 | 2.01% |
| Class R6 | | | | |
| Actual | $1,000.00 | $1,363.86 | $ 4.89 | 0.83% |
| Hypothetical (5% return before expenses) | $1,000.00 | $1,020.79 | $ 4.18 | 0.83% |
| Administrator Class | | | | |
| Actual | $1,000.00 | $1,362.13 | $ 6.48 | 1.10% |
| Hypothetical (5% return before expenses) | $1,000.00 | $1,019.45 | $ 5.54 | 1.10% |
| Institutional Class | | | | |
| Actual | $1,000.00 | $1,364.18 | $ 5.01 | 0.85% |
| Hypothetical (5% return before expenses) | $1,000.00 | $1,020.69 | $ 4.28 | 0.85% |
1 Expenses paid is equal to the annualized net expense ratio of each class multiplied by the average account value over the period, multiplied by the number of days in the most recent fiscal half-year divided by the number of days in the fiscal year (to reflect the one-half-year period).
6 | Wells Fargo Common Stock Fund
Portfolio of investments—March 31, 2021 (unaudited)
| | | | | Shares | Value |
| Common stocks: 97.83% | | | | | |
| Consumer discretionary: 14.07% | | | | | |
| Auto components: 1.70% | | | | | |
| Dana Incorporated | | | | 747,297 | $ 18,181,736 |
| Diversified consumer services: 1.55% | | | | | |
| Houghton Mifflin Harcourt Company † | | | | 533,749 | 4,067,167 |
| Service Corporation International | | | | 245,056 | 12,510,109 |
| | | | | | 16,577,276 |
| Hotels, restaurants & leisure: 2.64% | | | | | |
| Jack In The Box Incorporated | | | | 119,988 | 13,172,283 |
| Planet Fitness Incorporated Class A † | | | | 193,703 | 14,973,242 |
| | | | | | 28,145,525 |
| Household durables: 1.45% | | | | | |
| Mohawk Industries Incorporated † | | | | 80,268 | 15,436,339 |
| Internet & direct marketing retail: 0.98% | | | | | |
| The RealReal Incorporated † | | | | 461,005 | 10,432,543 |
| Specialty retail: 4.46% | | | | | |
| Burlington Stores Incorporated † | | | | 61,939 | 18,507,373 |
| Tractor Supply Company | | | | 86,865 | 15,382,054 |
| Ulta Beauty Incorporated † | | | | 44,050 | 13,618,939 |
| | | | | | 47,508,366 |
| Textiles, apparel & luxury goods: 1.29% | | | | | |
| Levi Strauss & Company Class A | | | | 574,983 | 13,747,844 |
| Consumer staples: 2.24% | | | | | |
| Food products: 1.28% | | | | | |
| Nomad Foods Limited † | | | | 498,405 | 13,686,201 |
| Household products: 0.96% | | | | | |
| Church & Dwight Company Incorporated | | | | 116,671 | 10,191,212 |
| Financials: 12.38% | | | | | |
| Banks: 2.53% | | | | | |
| Pinnacle Financial Partners Incorporated | | | | 124,879 | 11,071,772 |
| Sterling Bancorp | | | | 421,397 | 9,700,559 |
| Veritex Holdings Incorporated | | | | 188,206 | 6,158,100 |
| | | | | | 26,930,431 |
| Capital markets: 1.87% | | | | | |
| Cboe Global Markets Incorporated | | | | 117,378 | 11,584,035 |
| Raymond James Financial Incorporated | | | | 68,145 | 8,351,851 |
| | | | | | 19,935,886 |
| Consumer finance: 1.52% | | | | | |
| Discover Financial Services | | | | 170,892 | 16,233,031 |
| Insurance: 5.32% | | | | | |
| Arch Capital Group Limited † | | | | 323,739 | 12,421,865 |
| Axis Capital Holdings Limited | | | | 232,866 | 11,543,168 |
The accompanying notes are an integral part of these financial statements.
Wells Fargo Common Stock Fund | 7
Portfolio of investments—March 31, 2021 (unaudited)
| | | | | Shares | Value |
| Insurance (continued) | | | | | |
| CNO Financial Group Incorporated | | | | 385,992 | $ 9,375,746 |
| First American Financial Corporation | | | | 176,884 | 10,020,479 |
| Reinsurance Group of America Incorporated | | | | 106,147 | 13,379,829 |
| | | | | | 56,741,087 |
| Thrifts & mortgage finance: 1.14% | | | | | |
| Essent Group Limited | | | | 256,010 | 12,157,915 |
| Health care: 11.05% | | | | | |
| Biotechnology: 1.42% | | | | | |
| Acceleron Pharma Incorporated † | | | | 26,504 | 3,594,207 |
| Agios Pharmaceuticals Incorporated † | | | | 62,335 | 3,218,979 |
| Neurocrine Biosciences Incorporated † | | | | 50,183 | 4,880,297 |
| Sage Therapeutics Incorporated † | | | | 45,992 | 3,442,501 |
| | | | | | 15,135,984 |
| Health care equipment & supplies: 4.75% | | | | | |
| Haemonetics Corporation † | | | | 138,191 | 15,340,583 |
| Integer Holdings Corporation † | | | | 156,377 | 14,402,322 |
| LivaNova plc † | | | | 283,494 | 20,902,013 |
| | | | | | 50,644,918 |
| Health care providers & services: 2.25% | | | | | |
| Humana Incorporated | | | | 33,776 | 14,160,588 |
| Laboratory Corporation of America Holdings † | | | | 38,338 | 9,777,340 |
| | | | | | 23,937,928 |
| Life sciences tools & services: 2.63% | | | | | |
| Bio-Rad Laboratories Incorporated Class A † | | | | 40,399 | 23,074,697 |
| Codexis Incorporated † | | | | 219,267 | 5,019,022 |
| | | | | | 28,093,719 |
| Industrials: 21.49% | | | | | |
| Aerospace & defense: 1.52% | | | | | |
| MTU Aero Engines AG | | | | 68,731 | 16,176,590 |
| Building products: 4.17% | | | | | |
| Armstrong World Industries Incorporated | | | | 212,182 | 19,115,476 |
| Masonite International Corporation † | | | | 219,507 | 25,295,987 |
| | | | | | 44,411,463 |
| Commercial services & supplies: 3.69% | | | | | |
| IAA Incorporated † | | | | 274,478 | 15,134,717 |
| Republic Services Incorporated | | | | 133,659 | 13,279,022 |
| Stericycle Incorporated † | | | | 161,770 | 10,921,093 |
| | | | | | 39,334,832 |
| Construction & engineering: 1.11% | | | | | |
| APi Group Corporation 144A† | | | | 571,601 | 11,820,707 |
The accompanying notes are an integral part of these financial statements.
8 | Wells Fargo Common Stock Fund
Portfolio of investments—March 31, 2021 (unaudited)
| | | | | Shares | Value |
| Electrical equipment: 2.43% | | | | | |
| AMETEK Incorporated | | | | 94,871 | $ 12,117,873 |
| Sensata Technologies Holding plc † | | | | 238,523 | 13,822,408 |
| | | | | | 25,940,281 |
| Industrial conglomerates: 1.89% | | | | | |
| Carlisle Companies Incorporated | | | | 122,315 | 20,130,603 |
| Machinery: 1.94% | | | | | |
| Ingersoll Rand Incorporated † | | | | 201,512 | 9,916,406 |
| ITT Incorporated | | | | 118,806 | 10,800,653 |
| | | | | | 20,717,059 |
| Professional services: 1.06% | | | | | |
| Dun & Bradstreet Holdings † | | | | 476,438 | 11,343,989 |
| Trading companies & distributors: 3.68% | | | | | |
| Air Lease Corporation | | | | 391,828 | 19,199,572 |
| United Rentals Incorporated † | | | | 60,989 | 20,084,288 |
| | | | | | 39,283,860 |
| Information technology: 21.62% | | | | | |
| IT services: 4.66% | | | | | |
| Black Knight Incorporated † | | | | 175,979 | 13,020,686 |
| EVO Payments Incorporated Class A † | | | | 514,755 | 14,166,058 |
| Genpact Limited | | | | 347,484 | 14,879,265 |
| Paya Holdings Incorporated Class A †« | | | | 702,100 | 7,695,016 |
| | | | | | 49,761,025 |
| Semiconductors & semiconductor equipment: 5.62% | | | | | |
| Brooks Automation Incorporated | | | | 134,389 | 10,972,862 |
| Marvell Technology Group Limited | | | | 388,632 | 19,035,195 |
| Maxim Integrated Products Incorporated | | | | 115,866 | 10,586,676 |
| ON Semiconductor Corporation † | | | | 464,950 | 19,346,570 |
| | | | | | 59,941,303 |
| Software: 11.34% | | | | | |
| 8x8 Incorporated † | | | | 580,924 | 18,845,175 |
| Cloudera Incorporated † | | | | 1,152,448 | 14,025,292 |
| Fair Isaac Corporation † | | | | 32,531 | 15,811,693 |
| Medallia Incorporated † | | | | 414,663 | 11,564,951 |
| New Relic Incorporated † | | | | 87,428 | 5,375,073 |
| Nuance Communications Incorporated † | | | | 350,229 | 15,283,994 |
| Proofpoint Incorporated † | | | | 111,994 | 14,087,725 |
| SPS Commerce Incorporated † | | | | 97,722 | 9,704,772 |
| Zendesk Incorporated † | | | | 122,183 | 16,203,909 |
| | | | | | 120,902,584 |
| Materials: 5.89% | | | | | |
| Chemicals: 2.81% | | | | | |
| Ashland Global Holdings Incorporated | | | | 157,620 | 13,991,927 |
| Quaker Chemical Corporation | | | | 21,793 | 5,312,480 |
| Westlake Chemical Corporation | | | | 120,282 | 10,679,839 |
| | | | | | 29,984,246 |
The accompanying notes are an integral part of these financial statements.
Wells Fargo Common Stock Fund | 9
Portfolio of investments—March 31, 2021 (unaudited)
| | | | | Shares | Value |
| Containers & packaging: 1.45% | | | | | |
| Crown Holdings Incorporated | | | | 159,461 | $ 15,474,095 |
| Metals & mining: 1.63% | | | | | |
| Steel Dynamics Incorporated | | | | 342,497 | 17,385,148 |
| Real estate: 9.09% | | | | | |
| Equity REITs: 9.09% | | | | | |
| American Homes 4 Rent Class A | | | | 339,082 | 11,304,994 |
| CoreSite Realty Corporation | | | | 117,817 | 14,120,367 |
| Four Corners Property Trust Incorporated | | | | 304,126 | 8,333,052 |
| SBA Communications Corporation | | | | 55,364 | 15,366,278 |
| STAG Industrial Incorporated | | | | 289,407 | 9,726,969 |
| Sun Communities Incorporated | | | | 133,854 | 20,083,454 |
| VICI Properties Incorporated | | | | 636,667 | 17,979,476 |
| | | | | | 96,914,590 |
| Total Common stocks (Cost $661,726,341) | | | | | 1,043,240,316 |
| | | | | | |
| Exchange-traded funds: 1.07% | | | | | |
| SPDR S&P Biotech ETF « | | | | 84,460 | 11,456,999 |
| Total Exchange-traded funds (Cost $4,517,041) | | | | | 11,456,999 |
| | | Yield | | | |
| Short-term investments: 3.09% | | | | | |
| Investment companies: 3.09% | | | | | |
| Securities Lending Cash Investments LLC ♠∩∞ | | 0.04% | | 13,803,300 | 13,803,300 |
| Wells Fargo Government Money Market Fund Select Class ♠∞ | | 0.03 | | 19,118,324 | 19,118,324 |
| Total Short-term investments (Cost $32,921,624) | | | | | 32,921,624 |
| Total investments in securities (Cost $699,165,006) | 101.99% | | | | 1,087,618,939 |
| Other assets and liabilities, net | (1.99) | | | | (21,258,467) |
| Total net assets | 100.00% | | | | $1,066,360,472 |
| † | Non-income-earning security |
| 144A | The security may be resold in transactions exempt from registration, normally to qualified institutional buyers, pursuant to Rule 144A under the Securities Act of 1933. |
| « | All or a portion of this security is on loan. |
| ♠ | The issuer of the security is an affiliated person of the Fund as defined in the Investment Company Act of 1940. |
| ∩ | The investment is a non-registered investment company purchased with cash collateral received from securities on loan. |
| ∞ | The rate represents the 7-day annualized yield at period end. |
| Abbreviations: |
| REIT | Real estate investment trust |
The accompanying notes are an integral part of these financial statements.
10 | Wells Fargo Common Stock Fund
Portfolio of investments—March 31, 2021 (unaudited)
Investments in affiliates
An affiliated investment is an investment in which the Fund owns at least 5% of the outstanding voting shares of the issuer or as a result of other relationships, such as the Fund and the issuer having the same investment manager. Transactions with issuers that were either affiliated persons of the Fund at the beginning of the period or the end of the period were as follows:
| | Value,
beginning of
period | Purchases | Sales
proceeds | Net
realized
gains
(losses) | | Net
change in
unrealized
gains
(losses) | | Value,
end of
period | | % of
net
assets | Shares,
end
of period | Income
from
affiliated
securities |
| Short-term investments | | | | | | | | | | | | |
| Investment companies | | | | | | | | | | | | |
| Securities Lending Cash Investments LLC | $14,083,400 | $108,922,800 | $(109,202,900) | $0 | | $0 | | $ 13,803,300 | | | 13,803,300 | $ 7,031# |
| Wells Fargo Government Money Market Fund Select Class | 1,768,345 | 201,625,194 | (184,275,215) | 0 | | 0 | | 19,118,324 | | | 19,118,324 | 1,199 |
| | | | | $0 | | $0 | | $32,921,624 | | 3.09% | | $8,230 |
| # | Amount shown represents income before fees and rebates. |
The accompanying notes are an integral part of these financial statements.
Wells Fargo Common Stock Fund | 11
Statement of assets and liabilities—March 31, 2021 (unaudited)
| | |
| Assets | |
Investments in unaffiliated securities (including $13,507,392 of securities loaned), at value (cost $666,243,382)
| $ 1,054,697,315 |
Investments in affiliated securites, at value (cost $32,921,624)
| 32,921,624 |
Foreign currency, at value (cost $162)
| 161 |
Receivable for dividends
| 1,002,546 |
Receivable for Fund shares sold
| 128,159 |
Receivable for securities lending income, net
| 12,537 |
Total assets
| 1,088,762,342 |
| Liabilities | |
Payable upon receipt of securities loaned
| 13,803,300 |
Payable for investments purchased
| 6,637,807 |
Payable for Fund shares redeemed
| 701,273 |
Management fee payable
| 687,202 |
Administration fees payable
| 176,576 |
Trustees’ fees and expenses payable
| 2,910 |
Distribution fee payable
| 1,743 |
Accrued expenses and other liabilities
| 391,059 |
Total liabilities
| 22,401,870 |
Total net assets
| $1,066,360,472 |
| Net assets consist of | |
Paid-in capital
| $ 617,298,757 |
Total distributable earnings
| 449,061,715 |
Total net assets
| $1,066,360,472 |
| Computation of net asset value and offering price per share | |
Net assets – Class A
| $ 925,288,319 |
Shares outstanding – Class A1
| 39,949,965 |
Net asset value per share – Class A
| $23.16 |
Maximum offering price per share – Class A2
| $24.57 |
Net assets – Class C
| $ 2,711,154 |
Shares outstanding – Class C1
| 184,584 |
Net asset value per share – Class C
| $14.69 |
Net assets – Class R6
| $ 36,376,918 |
Shares outstanding – Class R61
| 1,457,711 |
Net asset value per share – Class R6
| $24.95 |
Net assets – Administrator Class
| $ 3,132,595 |
Shares outstanding – Administrator Class1
| 129,165 |
Net asset value per share – Administrator Class
| $24.25 |
Net assets – Institutional Class
| $ 98,851,486 |
Shares outstanding – Institutional Class1
| 3,977,090 |
Net asset value per share – Institutional Class
| $24.86 |
| 1 | The Fund has an unlimited number of authorized shares |
| 2 | Maximum offering price is computed as 100/94.25 of net asset value. On investments of $50,000 or more, the offering price is reduced. |
The accompanying notes are an integral part of these financial statements.
12 | Wells Fargo Common Stock Fund
Statement of operations—six months ended March 31, 2021 (unaudited)
| | |
| Investment income | |
Dividends
| $ 4,341,474 |
Income from affiliated securities
| 84,016 |
Total investment income
| 4,425,490 |
| Expenses | |
Management fee
| 3,890,926 |
| Administration fees | |
Class A
| 898,983 |
Class C
| 2,922 |
Class R6
| 4,992 |
Administrator Class
| 1,899 |
Institutional Class
| 72,170 |
| Shareholder servicing fees | |
Class A
| 1,070,218 |
Class C
| 3,475 |
Administrator Class
| 3,652 |
| Distribution fee | |
Class C
| 10,416 |
Custody and accounting fees
| 24,976 |
Professional fees
| 26,844 |
Registration fees
| 32,369 |
Shareholder report expenses
| 19,536 |
Trustees’ fees and expenses
| 9,610 |
Other fees and expenses
| 13,159 |
Total expenses
| 6,086,147 |
| Less: Fee waivers and/or expense reimbursements | |
Fund-level
| (6,375) |
Class A
| (99,034) |
Class C
| (1) |
Administrator Class
| (1,098) |
Institutional Class
| (42,303) |
Net expenses
| 5,937,336 |
Net investment loss
| (1,511,846) |
| Realized and unrealized gains (losses) on investments | |
Net realized gains on investments
| 106,902,487 |
Net change in unrealized gains (losses) on investments
| 196,620,235 |
Net realized and unrealized gains (losses) on investments
| 303,522,722 |
Net increase in net assets resulting from operations
| $302,010,876 |
The accompanying notes are an integral part of these financial statements.
Wells Fargo Common Stock Fund | 13
Statement of changes in net assets
| | |
| | Six months ended
March 31, 2021
(unaudited) | Year ended
September 30, 2020 |
| Operations | | | | |
Net investment loss
| | $ (1,511,846) | | $ (664,027) |
Payment from affiliate
| | 0 | | 50,779 |
Net realized gains on investments
| | 106,902,487 | | 27,866,230 |
Net change in unrealized gains (losses) on investments
| | 196,620,235 | | (71,534,111) |
Net increase (decrease) in net assets resulting from operations
| | 302,010,876 | | (44,281,129) |
| Distributions to shareholders from | | | | |
| Net investment income and net realized gains | | | | |
Class A
| | (41,250,405) | | (106,772,268) |
Class C
| | (198,543) | | (1,096,288) |
Class R6
| | (1,470,087) | | (4,612,059) |
Administrator Class
| | (144,145) | | (452,132) |
Institutional Class
| | (4,334,480) | | (18,968,188) |
Total distributions to shareholders
| | (47,397,660) | | (131,900,935) |
| Capital share transactions | Shares | | Shares | |
| Proceeds from shares sold | | | | |
Class A
| 277,327 | 5,976,259 | 829,934 | 14,670,933 |
Class C
| 13,571 | 188,827 | 30,986 | 364,118 |
Class R6
| 171,787 | 4,123,766 | 435,113 | 8,658,699 |
Administrator Class
| 24,333 | 510,342 | 40,426 | 781,386 |
Institutional Class
| 371,512 | 8,524,550 | 936,815 | 17,943,308 |
| | | 19,323,744 | | 42,418,444 |
| Reinvestment of distributions | | | | |
Class A
| 1,909,343 | 39,351,568 | 5,292,160 | 101,875,798 |
Class C
| 14,844 | 194,453 | 74,887 | 945,077 |
Class R6
| 65,677 | 1,456,720 | 222,029 | 4,582,449 |
Administrator Class
| 6,031 | 130,085 | 20,980 | 414,636 |
Institutional Class
| 189,157 | 4,178,481 | 903,544 | 18,584,525 |
| | | 45,311,307 | | 126,402,485 |
| Payment for shares redeemed | | | | |
Class A
| (2,644,887) | (55,717,753) | (7,019,117) | (123,527,409) |
Class C
| (101,936) | (1,346,630) | (386,221) | (4,798,830) |
Class R6
| (221,614) | (5,197,784) | (826,169) | (14,778,156) |
Administrator Class
| (21,127) | (474,175) | (107,155) | (1,980,852) |
Institutional Class
| (3,198,114) | (71,864,093) | (2,368,945) | (43,202,567) |
| | | (134,600,435) | | (188,287,814) |
Net decrease in net assets resulting from capital share transactions
| | (69,965,384) | | (19,466,885) |
Total increase (decrease) in net assets
| | 184,647,832 | | (195,648,949) |
| Net assets | | | | |
Beginning of period
| | 881,712,640 | | 1,077,361,589 |
End of period
| | $1,066,360,472 | | $ 881,712,640 |
The accompanying notes are an integral part of these financial statements.
14 | Wells Fargo Common Stock Fund
Financial highlights
(For a share outstanding throughout each period)
| | | Year ended September 30 |
| Class A | Six months ended
March 31, 2021
(unaudited) | 2020 | 2019 | 2018 | 2017 | 2016 |
Net asset value, beginning of period
| $17.88 | $21.07 | $24.58 | $24.06 | $21.50 | $21.62 |
Net investment loss
| (0.04) | (0.03) | (0.01) | (0.04) | (0.09) | (0.01) 1 |
Net realized and unrealized gains (losses) on investments
| 6.37 | (0.52) | (0.20) | 3.10 | 3.48 | 2.45 |
Total from investment operations
| 6.33 | (0.55) | (0.21) | 3.06 | 3.39 | 2.44 |
| Distributions to shareholders from | | | | | | |
Net investment income
| 0.00 | (0.00) 2 | 0.00 | 0.00 | 0.00 | 0.00 |
Net realized gains
| (1.05) | (2.64) | (3.30) | (2.54) | (0.83) | (2.56) |
Total distributions to shareholders
| (1.05) | (2.64) | (3.30) | (2.54) | (0.83) | (2.56) |
Net asset value, end of period
| $23.16 | $17.88 | $21.07 | $24.58 | $24.06 | $21.50 |
Total return3
| 36.13% | (3.48)% | 0.91% | 13.62% | 16.10% | 12.43% |
| Ratios to average net assets (annualized) | | | | | | |
Gross expenses
| 1.26% | 1.27% | 1.26% | 1.25% | 1.25% | 1.25% |
Net expenses
| 1.23% | 1.23% | 1.26% | 1.25% | 1.25% | 1.25% |
Net investment loss
| (0.35)% | (0.14)% | (0.03)% | (0.18)% | (0.38)% | (0.05)% |
| Supplemental data | | | | | | |
Portfolio turnover rate
| 25% | 61% | 40% | 33% | 35% | 32% |
Net assets, end of period (000s omitted)
| $925,288 | $722,547 | $870,369 | $971,731 | $942,596 | $924,864 |
| 1 | Calculated based upon average shares outstanding |
| 2 | Amount is less than $0.005. |
| 3 | Total return calculations do not include any sales charges. Returns for periods of less than one year are not annualized. |
The accompanying notes are an integral part of these financial statements.
Wells Fargo Common Stock Fund | 15
Financial highlights
(For a share outstanding throughout each period)
| | | Year ended September 30 |
| Class C | Six months ended
March 31, 2021
(unaudited) | 2020 | 2019 | 2018 | 2017 | 2016 |
Net asset value, beginning of period
| $11.70 | $14.72 | $18.40 | $18.75 | $17.04 | $17.77 |
Net investment loss
| (0.08) 1 | (0.11) 1 | (0.11) 1 | (0.17) 1 | (0.20) 1 | (0.14) 1 |
Payment from affiliate
| 0.00 | 0.05 | 0.00 | 0.00 | 0.00 | 0.00 |
Net realized and unrealized gains (losses) on investments
| 4.12 | (0.32) | (0.27) | 2.36 | 2.74 | 1.97 |
Total from investment operations
| 4.04 | (0.38) | (0.38) | 2.19 | 2.54 | 1.83 |
| Distributions to shareholders from | | | | | | |
Net realized gains
| (1.05) | (2.64) | (3.30) | (2.54) | (0.83) | (2.56) |
Net asset value, end of period
| $14.69 | $11.70 | $14.72 | $18.40 | $18.75 | $17.04 |
Total return2
| 35.62% | (3.88)% 3 | 0.17% | 12.74% | 15.29% | 11.52% |
| Ratios to average net assets (annualized) | | | | | | |
Gross expenses
| 2.01% | 2.01% | 2.01% | 2.00% | 2.00% | 2.00% |
Net expenses
| 2.01% | 2.01% | 2.01% | 2.00% | 2.00% | 2.00% |
Net investment loss
| (1.16)% | (0.92)% | (0.78)% | (0.94)% | (1.14)% | (0.87)% |
| Supplemental data | | | | | | |
Portfolio turnover rate
| 25% | 61% | 40% | 33% | 35% | 32% |
Net assets, end of period (000s omitted)
| $2,711 | $3,020 | $7,925 | $16,541 | $18,978 | $22,902 |
| 1 | Calculated based upon average shares outstanding |
| 2 | Total return calculations do not include any sales charges. Returns for periods of less than one year are not annualized. |
| 3 | During the year ended September 30, 2020, the Fund received a payment from an affiliate which had a 0.39% impact on the total return. See Note 4 in the Notes to Financial Statements for additional information. |
The accompanying notes are an integral part of these financial statements.
16 | Wells Fargo Common Stock Fund
Financial highlights
(For a share outstanding throughout each period)
| | | Year ended September 30 |
| Class R6 | Six months ended
March 31, 2021
(unaudited) | 2020 | 2019 | 2018 | 2017 | 2016 |
Net asset value, beginning of period
| $19.16 | $22.39 | $25.80 | $25.03 | $22.25 | $22.20 |
Net investment income
| 0.01 1 | 0.05 1 | 0.09 1 | 0.05 1 | 0.01 | 0.07 1 |
Net realized and unrealized gains (losses) on investments
| 6.83 | (0.56) | (0.20) | 3.26 | 3.60 | 2.54 |
Total from investment operations
| 6.84 | (0.51) | (0.11) | 3.31 | 3.61 | 2.61 |
| Distributions to shareholders from | | | | | | |
Net investment income
| 0.00 | (0.08) | 0.00 | 0.00 | 0.00 | 0.00 |
Net realized gains
| (1.05) | (2.64) | (3.30) | (2.54) | (0.83) | (2.56) |
Total distributions to shareholders
| (1.05) | (2.72) | (3.30) | (2.54) | (0.83) | (2.56) |
Net asset value, end of period
| $24.95 | $19.16 | $22.39 | $25.80 | $25.03 | $22.25 |
Total return2
| 36.39% | (3.10)% | 1.31% | 14.12% | 16.56% | 12.91% |
| Ratios to average net assets (annualized) | | | | | | |
Gross expenses
| 0.83% | 0.84% | 0.83% | 0.82% | 0.82% | 0.82% |
Net expenses
| 0.83% | 0.83% | 0.83% | 0.82% | 0.82% | 0.82% |
Net investment income
| 0.06% | 0.27% | 0.40% | 0.20% | 0.05% | 0.32% |
| Supplemental data | | | | | | |
Portfolio turnover rate
| 25% | 61% | 40% | 33% | 35% | 32% |
Net assets, end of period (000s omitted)
| $36,377 | $27,628 | $36,069 | $36,477 | $115,641 | $101,436 |
| 1 | Calculated based upon average shares outstanding |
| 2 | Returns for periods of less than one year are not annualized. |
The accompanying notes are an integral part of these financial statements.
Wells Fargo Common Stock Fund | 17
Financial highlights
(For a share outstanding throughout each period)
| | | Year ended September 30 |
| Administrator Class | Six months ended
March 31, 2021
(unaudited) | 2020 | 2019 | 2018 | 2017 | 2016 |
Net asset value, beginning of period
| $18.67 | $21.56 | $25.04 | $24.42 | $21.78 | $21.84 |
Net investment income (loss)
| (0.02) 1 | 0.00 1,2 | 0.03 | (0.01) 1 | (0.06) 1 | 0.02 |
Payment from affiliate
| 0.00 | 0.32 | 0.00 | 0.00 | 0.00 | 0.00 |
Net realized and unrealized gains (losses) on investments
| 6.65 | (0.54) | (0.21) | 3.17 | 3.53 | 2.48 |
Total from investment operations
| 6.63 | (0.22) | (0.18) | 3.16 | 3.47 | 2.50 |
| Distributions to shareholders from | | | | | | |
Net investment income
| 0.00 | (0.03) | 0.00 | 0.00 | 0.00 | 0.00 |
Net realized gains
| (1.05) | (2.64) | (3.30) | (2.54) | (0.83) | (2.56) |
Total distributions to shareholders
| (1.05) | (2.67) | (3.30) | (2.54) | (0.83) | (2.56) |
Net asset value, end of period
| $24.25 | $18.67 | $21.56 | $25.04 | $24.42 | $21.78 |
Total return3
| 36.21% | (1.68)% 4 | 1.03% | 13.84% | 16.26% | 12.59% |
| Ratios to average net assets (annualized) | | | | | | |
Gross expenses
| 1.18% | 1.17% | 1.18% | 1.17% | 1.17% | 1.17% |
Net expenses
| 1.10% | 1.10% | 1.10% | 1.10% | 1.10% | 1.10% |
Net investment income (loss)
| (0.20)% | 0.01% | 0.14% | (0.04)% | (0.27)% | 0.03% |
| Supplemental data | | | | | | |
Portfolio turnover rate
| 25% | 61% | 40% | 33% | 35% | 32% |
Net assets, end of period (000s omitted)
| $3,133 | $2,239 | $3,572 | $6,141 | $6,336 | $16,720 |
| 1 | Calculated based upon average shares outstanding |
| 2 | Amount is less than $0.005. |
| 3 | Returns for periods of less than one year are not annualized. |
| 4 | During the year ended September 30, 2020, the Fund received a payment from an affiliate which had a 1.69% impact on the total return. See Note 4 in the Notes to Financial Statements for additional information. |
The accompanying notes are an integral part of these financial statements.
18 | Wells Fargo Common Stock Fund
Financial highlights
(For a share outstanding throughout each period)
| | | Year ended September 30 |
| Institutional Class | Six months ended
March 31, 2021
(unaudited) | 2020 | 2019 | 2018 | 2017 | 2016 |
Net asset value, beginning of period
| $19.09 | $22.32 | $25.73 | $24.97 | $22.20 | $22.16 |
Net investment income (loss)
| (0.00) 1,2 | 0.05 1 | 0.08 1 | 0.05 1 | 0.00 1,3 | 0.06 1 |
Net realized and unrealized gains (losses) on investments
| 6.82 | (0.56) | (0.19) | 3.25 | 3.60 | 2.54 |
Total from investment operations
| 6.82 | (0.51) | (0.11) | 3.30 | 3.60 | 2.60 |
| Distributions to shareholders from | | | | | | |
Net investment income
| 0.00 | (0.08) | 0.00 | 0.00 | 0.00 | 0.00 |
Net realized gains
| (1.05) | (2.64) | (3.30) | (2.54) | (0.83) | (2.56) |
Total distributions to shareholders
| (1.05) | (2.72) | (3.30) | (2.54) | (0.83) | (2.56) |
Net asset value, end of period
| $24.86 | $19.09 | $22.32 | $25.73 | $24.97 | $22.20 |
Total return4
| 36.42% | (3.13)% | 1.31% | 14.12% | 16.55% | 12.88% |
| Ratios to average net assets (annualized) | | | | | | |
Gross expenses
| 0.93% | 0.94% | 0.93% | 0.92% | 0.92% | 0.92% |
Net expenses
| 0.85% | 0.85% | 0.85% | 0.85% | 0.85% | 0.85% |
Net investment income (loss)
| (0.03)% | 0.24% | 0.37% | 0.21% | 0.02% | 0.28% |
| Supplemental data | | | | | | |
Portfolio turnover rate
| 25% | 61% | 40% | 33% | 35% | 32% |
Net assets, end of period (000s omitted)
| $98,851 | $126,279 | $159,426 | $172,197 | $167,552 | $173,175 |
| 1 | Calculated based upon average shares outstanding |
| 2 | Amount is more than $(0.005) |
| 3 | Amount is less than $0.005. |
| 4 | Returns for periods of less than one year are not annualized. |
The accompanying notes are an integral part of these financial statements.
Wells Fargo Common Stock Fund | 19
Notes to financial statements (unaudited)
1. ORGANIZATION
Wells Fargo Funds Trust (the "Trust"), a Delaware statutory trust organized on March 10, 1999, is an open-end management investment company registered under the Investment Company Act of 1940, as amended (the "1940 Act"). As an investment company, the Trust follows the accounting and reporting guidance in Financial Accounting Standards Board (“FASB”) Accounting Standards Codification Topic 946, Financial Services – Investment Companies. These financial statements report on the Wells Fargo Common Stock Fund (the "Fund") which is a diversified series of the Trust.
On February 23, 2021, Wells Fargo & Company announced that it has entered into a definitive agreement to sell Wells Fargo Asset Management ("WFAM") to GTCR LLC and Reverence Capital Partners, L.P. WFAM is the trade name used by the asset management businesses of Wells Fargo & Company and includes Wells Fargo Funds Management, LLC, the investment manager to the Fund, Wells Capital Management Incorporated and Wells Fargo Asset Management (International) Limited, both registered investment advisers providing sub-advisory services to certain funds, and Wells Fargo Funds Distributor, LLC, the Fund's principal underwriter. As part of the transaction, Wells Fargo & Company will own a 9.9% equity interest and will continue to serve as an important client and distribution partner. The transaction is expected to close in the second half of 2021, subject to customary closing conditions.
Consummation of the transaction will result in the automatic termination of the Fund's investment management agreement and sub-advisory agreement. The Fund's Board of Trustees will be asked to approve new investment management arrangements with the new company. If approved by the Board, the new investment management arrangements with the new company will be presented to the shareholders of the Fund for approval, and, if approved by shareholders, would take effect upon the closing of the transaction. The transaction is expected to close in the second half of 2021, subject to customary closing conditions.
2. SIGNIFICANT ACCOUNTING POLICIES
The following significant accounting policies, which are consistently followed in the preparation of the financial statements of the Fund, are in conformity with U.S. generally accepted accounting principles which require management to make estimates and assumptions that affect the reported amounts of assets and liabilities, disclosure of contingent assets and liabilities at the date of the financial statements, and the reported amounts of income and expenses during the reporting period. Actual results could differ from those estimates.
Securities valuation
All investments are valued each business day as of the close of regular trading on the New York Stock Exchange (generally 4 p.m. Eastern Time), although the Fund may deviate from this calculation time under unusual or unexpected circumstances.
Equity securities that are listed on a foreign or domestic exchange or market are valued at the official closing price or, if none, the last sales price. If no sale occurs on the principal exchange or market that day, a fair value price will be determined in accordance with the Fund’s Valuation Procedures.
The values of securities denominated in foreign currencies are translated into U.S. dollars at rates provided by an independent foreign currency pricing source at a time each business day specified by the Wells Fargo Asset Management Pricing Committee at Wells Fargo Funds Management, LLC ("Funds Management").
Many securities markets and exchanges outside the U.S. close prior to the close of the New York Stock Exchange and therefore may not fully reflect trading or events that occur after the close of the principal exchange in which the foreign securities are traded, but before the close of the New York Stock Exchange. If such trading or events are expected to materially affect the value of such securities, then fair value pricing procedures approved by the Board of Trustees of the Fund are applied. These procedures take into account multiple factors including movements in U.S. securities markets after foreign exchanges close. Foreign securities that are fair valued under these procedures are categorized as Level 2 and the application of these procedures may result in transfers between Level 1 and Level 2. Depending on market activity, such fair valuations may be frequent. Such fair value pricing may result in net asset values that are higher or lower than net asset values based on the last reported sales price or latest quoted bid price. On March 31, 2021, such fair value pricing was not used in pricing foreign securities.
Investments in registered open-end investment companies are valued at net asset value. Interests in non-registered investment companies that are redeemable at net asset value are fair valued normally at net asset value.
Investments which are not valued using any of the methods discussed above are valued at their fair value, as determined in good faith by the Board of Trustees. The Board of Trustees has established a Valuation Committee comprised of the Trustees and has delegated to it the authority to take any actions regarding the valuation of portfolio securities that the Valuation
20 | Wells Fargo Common Stock Fund
Notes to financial statements (unaudited)
Committee deems necessary or appropriate, including determining the fair value of portfolio securities, unless the determination has been delegated to the Wells Fargo Asset Management Pricing Committee. The Board of Trustees retains the authority to make or ratify any valuation decisions or approve any changes to the Valuation Procedures as it deems appropriate. On a quarterly basis, the Board of Trustees receives reports on any valuation actions taken by the Valuation Committee or the Wells Fargo Asset Management Pricing Committee which may include items for ratification.
Foreign currency translation
The accounting records of the Fund are maintained in U.S. dollars. The values of other assets and liabilities denominated in foreign currencies are translated into U.S. dollars at rates provided by an independent foreign currency pricing source at a time each business day specified by the Wells Fargo Asset Management Pricing Committee. Purchases and sales of securities, and income and expenses are converted at the rate of exchange on the respective dates of such transactions. Net realized foreign exchange gains or losses arise from sales of foreign currencies, currency gains or losses realized between the trade and settlement dates on securities transactions, and the difference between the amounts of dividends, interest and foreign withholding taxes recorded and the U.S. dollar equivalent of the amounts actually paid or received. Net unrealized foreign exchange gains and losses arise from changes in the fair value of assets and liabilities other than investments in securities resulting from changes in exchange rates. The changes in net assets arising from changes in exchange rates of securities and the changes in net assets resulting from changes in market prices of securities are not separately presented. Such changes are included in net realized and unrealized gains or losses from investments.
Securities lending
The Fund may lend its securities from time to time in order to earn additional income in the form of fees or interest on securities received as collateral or the investment of any cash received as collateral. When securities are on loan, the Fund receives interest or dividends on those securities. Cash collateral received in connection with its securities lending transactions is invested in Securities Lending Cash Investments, LLC (the "Securities Lending Fund"). Investments in Securities Lending Fund are valued at the evaluated bid price provided by an independent pricing service. Income earned from investment in the Securities Lending Fund (net of fees and rebates), if any, is included in income from affiliated securities on the Statement of Operations.
In a securities lending transaction, the net asset value of the Fund is affected by an increase or decrease in the value of the securities loaned and by an increase or decrease in the value of the instrument in which collateral is invested. The amount of securities lending activity undertaken by the Fund fluctuates from time to time. The Fund has the right under the lending agreement to recover the securities from the borrower on demand. In the event of default or bankruptcy by the borrower, the Fund may be prevented from recovering the loaned securities or gaining access to the collateral or may experience delays or costs in doing so. In such an event, the terms of the agreement allow the unaffiliated securities lending agent to use the collateral to purchase replacement securities on behalf of the Fund or pay the Fund the market value of the loaned securities. The Fund bears the risk of loss with respect to depreciation of its investment of the cash collateral.
Security transactions and income recognition
Securities transactions are recorded on a trade date basis. Realized gains or losses are recorded on the basis of identified cost.
Dividend income is recognized on the ex-dividend date.
Income dividends and capital gain distributions from investment companies are recorded on the ex-dividend date. Capital gain distributions from investment companies are treated as realized gains.
Distributions to shareholders
Distributions to shareholders from net investment income and any net realized gains are recorded on the ex-dividend date and paid at least annually. Such distributions are determined in accordance with income tax regulations and may differ from U.S. generally accepted accounting principles. Dividend sources are estimated at the time of declaration. The tax character of distributions is determined as of the Fund's fiscal year end. Therefore, a portion of the Fund's distributions made prior to the Fund’s fiscal year end may be categorized as a tax return of capital at year end.
Federal and other taxes
The Fund intends to continue to qualify as a regulated investment company by distributing substantially all of its investment company taxable income and any net realized capital gains (after reduction for capital loss carryforwards) sufficient to relieve it from all, or substantially all, federal income taxes. Accordingly, no provision for federal income taxes was required.
The Fund’s income and federal excise tax returns and all financial records supporting those returns for the prior three fiscal years are subject to examination by the federal and Delaware revenue authorities. Management has analyzed the Fund's tax
Wells Fargo Common Stock Fund | 21
Notes to financial statements (unaudited)
positions taken on federal, state, and foreign tax returns for all open tax years and does not believe that there are any uncertain tax positions that require recognition of a tax liability.
As of March 31, 2021, the aggregate cost of all investments for federal income tax purposes was $699,936,845 and the unrealized gains (losses) consisted of:
| Gross unrealized gains | $375,449,715 |
| Gross unrealized losses | 12,232,379 |
| Net unrealized gains | $387,682,094 |
Class allocations
The separate classes of shares offered by the Fund differ principally in applicable sales charges, distribution, shareholder servicing, and administration fees. Class specific expenses are charged directly to that share class. Investment income, common fund-level expenses, and realized and unrealized gains (losses) on investments are allocated daily to each class of shares based on the relative proportion of net assets of each class.
3. FAIR VALUATION MEASUREMENTS
Fair value measurements of investments are determined within a framework that has established a fair value hierarchy based upon the various data inputs utilized in determining the value of the Fund’s investments. The three-level hierarchy gives the highest priority to unadjusted quoted prices in active markets for identical assets or liabilities (Level 1) and the lowest priority to unobservable inputs (Level 3). The Fund’s investments are classified within the fair value hierarchy based on the lowest level of input that is significant to the fair value measurement. The inputs are summarized into three broad levels as follows:
| ■ | Level 1 – quoted prices in active markets for identical securities |
| ■ | Level 2 – other significant observable inputs (including quoted prices for similar securities, interest rates, prepayment speeds, credit risk, etc.) |
| ■ | Level 3 – significant unobservable inputs (including the Fund’s own assumptions in determining the fair value of investments) |
The inputs or methodologies used for valuing investments in securities are not necessarily an indication of the risk associated with investing in those securities.
The following is a summary of the inputs used in valuing the Fund’s assets and liabilities as of March 31, 2021:
| | Quoted prices
(Level 1) | Other significant
observable inputs
(Level 2) | Significant
unobservable inputs
(Level 3) | Total |
| Assets | | | | |
| Investments in: | | | | |
| Common stocks | | | | |
| Consumer discretionary | $ 150,029,629 | $0 | $0 | $ 150,029,629 |
| Consumer staples | 23,877,413 | 0 | 0 | 23,877,413 |
| Financials | 131,998,350 | 0 | 0 | 131,998,350 |
| Health care | 117,812,549 | 0 | 0 | 117,812,549 |
| Industrials | 229,159,384 | 0 | 0 | 229,159,384 |
| Information technology | 230,604,912 | 0 | 0 | 230,604,912 |
| Materials | 62,843,489 | 0 | 0 | 62,843,489 |
| Real estate | 96,914,590 | 0 | 0 | 96,914,590 |
| Exchange-traded funds | 11,456,999 | 0 | 0 | 11,456,999 |
| Short-term investments | | | | |
| Investment companies | 32,921,624 | 0 | 0 | 32,921,624 |
| Total assets | $1,087,618,939 | $0 | $0 | $1,087,618,939 |
Additional sector, industry or geographic detail, if any, is included in the Portfolio of Investments.
For the six months ended March 31, 2021, the Fund did not have any transfers into/out of Level 3.
22 | Wells Fargo Common Stock Fund
Notes to financial statements (unaudited)
4. TRANSACTIONS WITH AFFILIATES
Management fee
Funds Management, an indirect wholly owned subsidiary of Wells Fargo & Company ("Wells Fargo"), is the manager of the Fund and provides advisory and fund-level administrative services under an investment management agreement. Under the investment management agreement, Funds Management is responsible for, among other services, implementing the investment objectives and strategies of the Fund, supervising the subadviser and providing fund-level administrative services in connection with the Fund’s operations. As compensation for its services under the investment management agreement, Funds Management is entitled to receive a management fee at the following annual rate based on the Fund’s average daily net assets:
| Average daily net assets | Management fee |
| First $500 million | 0.800% |
| Next $500 million | 0.750 |
| Next $1 billion | 0.700 |
| Next $2 billion | 0.675 |
| Next $1 billion | 0.650 |
| Next $5 billion | 0.640 |
| Over $10 billion | 0.630 |
For the six months ended March 31, 2021, the management fee was equivalent to an annual rate of 0.77% of the Fund’s average daily net assets.
Funds Management has retained the services of a subadviser to provide daily portfolio management to the Fund. The fee for subadvisory services is borne by Funds Management. Wells Capital Management Incorporated ("WellsCap"), an affiliate of Funds Management and an indirect wholly owned subsidiary of Wells Fargo, is the subadviser to the Fund and is entitled to receive a fee from Funds Management at an annual rate starting at 0.45% and declining to 0.30% as the average daily net assets of the Fund increase.
Administration fees
Under a class-level administration agreement, Funds Management provides class-level administrative services to the Fund, which includes paying fees and expenses for services provided by the transfer agent, sub-transfer agents, omnibus account servicers and record-keepers. As compensation for its services under the class-level administration agreement, Funds Management receives an annual fee which is calculated based on the average daily net assets of each class as follows:
| | Class-level
administration fee |
| Class A | 0.21% |
| Class C | 0.21 |
| Class R6 | 0.03 |
| Administrator Class | 0.13 |
| Institutional Class | 0.13 |
Waivers and/or expense reimbursements
Funds Management has contractually waived and/or reimbursed management and administration fees to the extent necessary to maintain certain net operating expense ratios for the Fund. When each class of the Fund has exceeded its expense cap, Funds Management has waived fees and/or reimbursed expenses from fund-level expenses on a proportionate basis and then from class specific expenses. When only certain classes exceed their expense caps, waivers and/or reimbursements are applied against class specific expenses before fund-level expenses. Funds Management has committed through January 31, 2022 to waive fees and/or reimburse expenses to the extent necessary to cap expenses. Prior to or after the commitment expiration date, the cap may be increased or the commitment to maintain the cap may be terminated only with the approval of the Board of Trustees. The contractual expense caps are as follows:
Wells Fargo Common Stock Fund | 23
Notes to financial statements (unaudited)
| | Expense ratio caps |
| Class A | 1.26% |
| Class C | 2.01 |
| Class R6 | 0.83 |
| Administrator Class | 1.10 |
| Institutional Class | 0.85 |
Distribution fee
The Trust has adopted a distribution plan for Class C shares of the Fund pursuant to Rule 12b-1 under the 1940 Act. A distribution fee is charged charged to Class C shares and paid to Wells Fargo Funds Distributor, LLC ("Funds Distributor"), the principal underwriter, at an annual rate of 0.75% of the average daily net assets of Class C shares.
In addition, Funds Distributor is entitled to receive the front-end sales charge from the purchase of Class A shares and a contingent deferred sales charge on the redemption of certain Class A shares. Funds Distributor is also entitled to receive the contingent deferred sales charges from redemptions of Class C shares. For the six months ended March 31, 2021, Funds Distributor received $597 from the sale of Class A shares. No contingent deferred sales charges were incurred by Class A and Class C shares for the six months ended March 31, 2021.
Shareholder servicing fees
The Trust has entered into contracts with one or more shareholder servicing agents, whereby Class A, Class C, and Administrator Class of the Fund are charged a fee at an annual rate of 0.25% of the average daily net assets of each respective class. A portion of these total shareholder servicing fees were paid to affiliates of Wells Fargo.
Interfund transactions
The Fund may purchase or sell portfolio investment securities to certain other Wells Fargo affiliates pursuant to Rule 17a-7 under the 1940 Act and under procedures adopted by the Board of Trustees. The procedures have been designed to ensure that these interfund transactions, which do not incur broker commissions, are effected at current market prices.
Other transactions
On August 14, 2020, Class C and Administrator Class of the Fund was reimbursed by Funds Management in the amount of $12,380 and $38,399, respectively. The reimbursements were made in connection with resolving certain fee reimbursements.
5. INVESTMENT PORTFOLIO TRANSACTIONS
Purchases and sales of investments, excluding U.S. government obligations (if any) and short-term securities, for the six months ended March 31, 2021 were $238,904,832 and $368,358,175, respectively.
6. SECURITIES LENDING TRANSACTIONS
The Fund lends its securities through an unaffiliated securities lending agent and receives collateral in the form of cash or securities with a value at least equal to the value of the securities on loan. The value of the loaned securities is determined at the close of each business day and any increases or decreases in the required collateral are exchanged between the Fund and the counterparty on the next business day. Cash collateral received is invested in the Securities Lending Fund which seeks to provide a positive return compared to the daily Federal Funds Open Rate by investing in high-quality, U.S. dollar-denominated short-term money market instruments and is exempt from registration under Section 3(c)(7) of the 1940 Act. Securities Lending Fund is managed by Funds Management and is subadvised by WellsCap. Funds Management receives an advisory fee starting at 0.05% and declining to 0.01% as the average daily net assets of the Securities Lending Fund increase. All of the fees received by Funds Management are paid to WellsCap for its services as subadviser.
In the event of counterparty default or the failure of a borrower to return a loaned security, the Fund has the right to use the collateral to offset any losses incurred. As of March 31, 2021, the Fund had securities lending transactions with the following counterparties which are subject to offset:
24 | Wells Fargo Common Stock Fund
Notes to financial statements (unaudited)
| Counterparty | Value of
securities on
loan | Collateral
received1 | Net amount |
| Citigroup Global Markets Inc. | $2,550,156 | $(2,550,156) | $0 |
| SG Americas Securities LLC | 7,884,666 | (7,884,666) | 0 |
| UBS Securities LLC | 3,072,570 | (3,072,570) | 0 |
1 Collateral received within this table is limited to the collateral for the net transaction with the counterparty.
7. BANK BORROWINGS
The Trust (excluding the money market funds), Wells Fargo Master Trust and Wells Fargo Variable Trust are parties to a $350,000,000 revolving credit agreement whereby the Fund is permitted to use bank borrowings for temporary or emergency purposes, such as to fund shareholder redemption requests. Interest under the credit agreement is charged to the Fund based on a borrowing rate equal to the higher of the Federal Funds rate in effect on that day plus 1.25% or the overnight LIBOR rate in effect on that day plus 1.25%. In addition, an annual commitment fee equal to 0.25% of the unused balance is allocated to each participating fund.
For the six months ended March 31, 2021, there were no borrowings by the Fund under the agreement.
8. INDEMNIFICATION
Under the Fund's organizational documents, the officers and Trustees have been granted certain indemnification rights against certain liabilities that may arise out of performance of their duties to the Fund. The Fund has entered into a separate agreement with each Trustee that converts indemnification rights currently existing under the Fund’s organizational documents into contractual rights that cannot be changed in the future without the consent of the Trustee. Additionally, in the normal course of business, the Fund may enter into contracts with service providers that contain a variety of indemnification clauses. The Fund’s maximum exposure under these arrangements is dependent on future claims that may be made against the Fund and, therefore, cannot be estimated.
9. CORONAVIRUS (COVID-19) PANDEMIC
On March 11, 2020, the World Health Organization announced that it had made the assessment that coronavirus disease 2019 (“COVID-19”) is a pandemic. The impacts of COVID-19 are affecting the entire global economy, individual companies and investment products, the funds, and the market in general. There is significant uncertainty around the extent and duration of business disruptions related to COVID-19 and the impacts may last for an extended period of time. COVID-19 has led to significant uncertainty and volatility in the financial markets.
Wells Fargo Common Stock Fund | 25
Other information (unaudited)
PROXY VOTING INFORMATION
A description of the policies and procedures used to determine how to vote proxies relating to portfolio securities is available without charge, upon request, by calling 1-800-222-8222, visiting our website at wfam.com, or visiting the SEC website at sec.gov. Information regarding how the proxies related to portfolio securities were voted during the most recent 12-month period ended June 30 is available on the website at wfam.com or by visiting the SEC website at sec.gov.
QUARTERLY PORTFOLIO HOLDINGS INFORMATION
The Fund files its complete schedule of portfolio holdings with the SEC for the first and third quarters of each fiscal year as an exhibit to its reports on Form N-PORT. Shareholders may view the filed Form N-PORT by visiting the SEC website at sec.gov.
26 | Wells Fargo Common Stock Fund
Other information (unaudited)
BOARD OF TRUSTEES AND OFFICERS
Each of the Trustees and Officers listed in the table below acts in identical capacities for each fund in the Wells Fargo family of funds, which consists of 142 mutual funds comprising the Wells Fargo Funds Trust, Wells Fargo Variable Trust, Wells Fargo Master Trust and four closed-end funds (collectively the “Fund Complex”). This table should be read in conjunction with the Prospectus and the Statement of Additional Information1. The mailing address of each Trustee and Officer is 525 Market Street, 12th Floor, San Francisco, CA 94105. Each Trustee and Officer serves an indefinite term, however, each Trustee serves such term until reaching the mandatory retirement age established by the Trustees.
Independent Trustees
Name and
year of birth | Position held and
length of service* | Principal occupations during past five years or longer | Current other
public company or
investment
company
directorships |
William R. Ebsworth
(Born 1957) | Trustee,
since 2015 | Retired. From 1984 to 2013, equities analyst, portfolio manager, research director and chief investment officer at Fidelity Management and Research Company in Boston, Tokyo, and Hong Kong, and retired in 2013 as Chief Investment Officer of Fidelity Strategic Advisers, Inc. where he led a team of investment professionals managing client assets. Prior thereto, Board member of Hong Kong Securities Clearing Co., Hong Kong Options Clearing Corp., the Thailand International Fund, Ltd., Fidelity Investments Life Insurance Company, and Empire Fidelity Investments Life Insurance Company. Audit Committee Chair and Investment Committee Chair of the Vincent Memorial Hospital Endowment (non-profit organization). Mr. Ebsworth is a CFA® charterholder. | N/A |
Jane A. Freeman
(Born 1953) | Trustee,
since 2015;
Chair Liaison,
since 2018 | Retired. From 2012 to 2014 and 1999 to 2008, Chief Financial Officer of Scientific Learning Corporation. From 2008 to 2012, Ms. Freeman provided consulting services related to strategic business projects. Prior to 1999, Portfolio Manager at Rockefeller & Co. and Scudder, Stevens & Clark. Board member of the Harding Loevner Funds from 1996 to 2014, serving as both Lead Independent Director and chair of the Audit Committee. Board member of the Russell Exchange Traded Funds Trust from 2011 to 2012 and the chair of the Audit Committee. Ms. Freeman is also an inactive Chartered Financial Analyst. | N/A |
Isaiah Harris, Jr.
(Born 1952) | Trustee,
since 2009; Audit
Committee
Chair,
since 2019 | Retired. Chairman of the Board of CIGNA Corporation since 2009, and Director since 2005. From 2003 to 2011, Director of Deluxe Corporation. Prior thereto, President and CEO of BellSouth Advertising and Publishing Corp. from 2005 to 2007, President and CEO of BellSouth Enterprises from 2004 to 2005 and President of BellSouth Consumer Services from 2000 to 2003. Emeritus member of the Iowa State University Foundation Board of Governors. Emeritus Member of the Advisory Board of Iowa State University School of Business. Advisory Board Member, Palm Harbor Academy (private school). Mr. Harris is a certified public accountant (inactive status). | CIGNA Corporation |
Judith M. Johnson
(Born 1949) | Trustee,
since 2008 | Retired. Prior thereto, Chief Executive Officer and Chief Investment Officer of Minneapolis Employees Retirement Fund from 1996 to 2008. Ms. Johnson is an attorney, certified public accountant and a certified managerial accountant. | N/A |
David F. Larcker
(Born 1950) | Trustee,
since 2009 | James Irvin Miller Professor of Accounting at the Graduate School of Business (Emeritus), Stanford University, Director of the Corporate Governance Research Initiative and Senior Faculty of The Rock Center for Corporate Governance since 2006. From 2005 to 2008, Professor of Accounting at the Graduate School of Business, Stanford University. Prior thereto, Ernst & Young Professor of Accounting at The Wharton School, University of Pennsylvania from 1985 to 2005. | N/A |
Wells Fargo Common Stock Fund | 27
Other information (unaudited)
Name and
year of birth | Position held and
length of service* | Principal occupations during past five years or longer | Current other
public company or
investment
company
directorships |
Olivia S. Mitchell
(Born 1953) | Trustee,
since 2006;
Nominating and
Governance
Committee Chair,
since 2018 | International Foundation of Employee Benefit Plans Professor, Wharton School of the University of Pennsylvania since 1993. Director of Wharton’s Pension Research Council and Boettner Center on Pensions & Retirement Research, and Research Associate at the National Bureau of Economic Research. Previously, Cornell University Professor from 1978 to 1993. | N/A |
Timothy J. Penny
(Born 1951) | Trustee,
since 1996;
Chair,
since 2018 | President and Chief Executive Officer of Southern Minnesota Initiative Foundation, a non-profit organization, since 2007. Member of the Board of Trustees of NorthStar Education Finance, Inc., a non-profit organization, since 2007. | N/A |
James G. Polisson
(Born 1959) | Trustee,
since 2018 | Retired. Chief Marketing Officer, Source (ETF) UK Services, Ltd, from 2015 to 2017. From 2012 to 2015, Principal of The Polisson Group, LLC, a management consulting, corporate advisory and principal investing company. Chief Executive Officer and Managing Director at Russell Investments, Global Exchange Traded Funds from 2010 to 2012. Managing Director of Barclays Global Investors from 1998 to 2010 and Global Chief Marketing Officer for iShares and Barclays Global Investors from 2000 to 2010. Trustee of the San Francisco Mechanics’ Institute, a non-profit organization, from 2013 to 2015. Board member of the Russell Exchange Traded Fund Trust from 2011 to 2012. Director of Barclays Global Investors Holdings Deutschland GmbH from 2006 to 2009. Mr. Polisson is an attorney and has a retired status with the Massachusetts and District of Columbia Bar Associations. | N/A |
Pamela Wheelock
(Born 1959) | Trustee,
since January
2020; previously
Trustee from
January 2018 to
July 2019 | Board member of the Destination Medical Center Economic Development Agency, Rochester, Minnesota since 2019. Interim President of the McKnight Foundation from January to September 2020. Acting Commissioner, Minnesota Department of Human Services, July 2019 through September 2019. Human Services Manager (part-time), Minnesota Department of Human Services, October 2019 through December 2019. Chief Operating Officer, Twin Cities Habitat for Humanity from 2017 to 2019. Vice President of University Services, University of Minnesota from 2012 to 2016. Prior thereto, on the Board of Directors, Governance Committee and Finance Committee for the Minnesota Philanthropy Partners (Saint Paul Foundation) from 2012 to 2018, Interim Chief Executive Officer of Blue Cross Blue Shield of Minnesota from 2011 to 2012, Chairman of the Board from 2009 to 2012 and Board Director from 2003 to 2015. Vice President, Leadership and Community Engagement, Bush Foundation, Saint Paul, Minnesota (a private foundation) from 2009 to 2011. Executive Vice President and Chief Financial Officer, Minnesota Sports and Entertainment from 2004 to 2009 and Senior Vice President from 2002 to 2004. Executive Vice President of the Minnesota Wild Foundation from 2004 to 2008. Commissioner of Finance, State of Minnesota, from 1999 to 2002. Currently Board Chair of the Minnesota Wild Foundation since 2010. | N/A |
* Length of service dates reflect the Trustee’s commencement of service with the Trust’s predecessor entities, where applicable.
28 | Wells Fargo Common Stock Fund
Other information (unaudited)
Officers
Name and
year of birth | Position held and
length of service | Principal occupations during past five years or longer |
Andrew Owen
(Born 1960) | President,
since 2017 | Executive Vice President of Wells Fargo & Company and Head of Affiliated Managers, Wells Fargo Asset Management, since 2014. In addition, Mr. Owen is currently President, Chief Executive Officer and Director of Wells Fargo Funds Management, LLC since 2017. Prior thereto, Executive Vice President responsible for marketing, investments and product development for Wells Fargo Funds Management, LLC, from 2009 to 2014. |
Jeremy DePalma
(Born 1974) | Treasurer,
since 2012
(for certain funds in
the Fund Complex);
since 2021 (for
the remaining funds in the
Fund Complex) | Senior Vice President of Wells Fargo Funds Management, LLC since 2009. Senior Vice President of Evergreen Investment Management Company, LLC from 2008 to 2010 and head of the Fund Reporting and Control Team within Fund Administration from 2005 to 2010. |
Michelle Rhee
(Born 1966) | Chief Legal Officer,
since 2019 | Secretary of Wells Fargo Funds Management, LLC and Chief Legal Counsel of Wells Fargo Asset Management since 2018. Deputy General Counsel of Wells Fargo Bank, N.A. since 2020 and Assistant General Counsel of Wells Fargo Bank, N.A. from 2018 to 2020. Associate General Counsel and Managing Director of Bank of America Corporation from 2004 to 2018. |
Catherine Kennedy
(Born 1969) | Secretary,
since 2019 | Vice President of Wells Fargo Funds Management, LLC and Senior Counsel of the Wells Fargo Legal Department since 2010. Vice President and Senior Counsel of Evergreen Investment Management Company, LLC from 1998 to 2010. |
Michael H. Whitaker
(Born 1967) | Chief Compliance Officer,
since 2016 | Chief Compliance Officer of Wells Fargo Asset Management since 2016. Senior Vice President and Chief Compliance Officer for Fidelity Investments from 2007 to 2016. |
1 The Statement of Additional Information includes additional information about the Trustees and is available, without charge, upon request, by calling 1-800-222-8222 or by visiting the website at wfam.com.
Wells Fargo Common Stock Fund | 29
For more information
More information about Wells Fargo Funds is available free upon request. To obtain literature, please write, visit the Fund's website, or call:
Wells Fargo Funds
P.O. Box 219967
Kansas City, MO 64121-9967
Website: wfam.com
Individual investors: 1-800-222-8222
Retail investment professionals: 1-888-877-9275
Institutional investment professionals: 1-866-765-0778
This report and the financial statements contained herein are submitted for the general information of the shareholders of the Fund. If this report is used for promotional purposes, distribution of the report must be accompanied or preceded by a current prospectus. Before investing, please consider the investment objectives, risks, charges, and expenses of the investment. For a current prospectus and, if available, a summary prospectus, containing this information, call 1-800-222-8222 or visit the Fund's website at wfam.com. Read the prospectus carefully before you invest or send money.
Wells Fargo Asset Management (WFAM) is the trade name for certain investment advisory/management firms owned by Wells Fargo & Company. These firms include but are not limited to Wells Capital Management Incorporated and Wells Fargo Funds Management, LLC. Certain products managed by WFAM entities are distributed by Wells Fargo Funds Distributor, LLC (a broker-dealer and Member FINRA).
This material is for general informational and educational purposes only and is NOT intended to provide investment advice or a recommendation of any kind - including a recommendation for any specific investment, strategy, or plan.
INVESTMENT PRODUCTS: NOT FDIC INSURED ■ NO BANK GUARANTEE ■ MAY LOSE VALUE
© 2021 Wells Fargo & Company. All rights reserved.
PAR-0421-00294 05-21
SA229/SAR229 03-21
Semi-Annual Report
March 31, 2021
Wells Fargo Discovery Fund
Reduce clutter.
Save trees.
Sign up for electronic delivery of prospectuses and shareholder reports at wellsfargo.com/ advantagedelivery
The views expressed and any forward-looking statements are as of March 31, 2021, unless otherwise noted, and are those of the Fund's portfolio managers and/or Wells Fargo Asset Management. Discussions of individual securities or the markets generally are not intended as individual recommendations. Future events or results may vary significantly from those expressed in any forward-looking statements. The views expressed are subject to change at any time in response to changing circumstances in the market. Wells Fargo Asset Management and the Fund disclaim any obligation to publicly update or revise any views expressed or forward-looking statements.
INVESTMENT PRODUCTS: NOT FDIC INSURED ■ NO BANK GUARANTEE ■ MAY LOSE VALUE
Wells Fargo Discovery Fund | 1
Letter to shareholders (unaudited)
Andrew Owen
President
Wells Fargo Funds
Dear Shareholder:
We are pleased to offer you this semi-annual report for the Wells Fargo Discovery Fund for the six-month period that ended March 31, 2021. Despite a deeply challenging year, dominated by the spread of COVID-19 cases and a sharp drop in economic output throughout much of the world, global stocks performed extremely well, benefiting from ongoing central bank support and rising optimism over the development and distribution of effective COVID-19 vaccines. Bonds also had positive returns, led by global bonds and high-yield bonds.
For the six-month period, U.S. stocks, based on the S&P 500 Index,1 gained 19.07%. International stocks, as measured by the MSCI ACWI ex USA Index (Net),2 returned 21.10%, while the MSCI EM Index (Net),3 had even stronger performance, with a 22.43% gain. Among bond indexes, the Bloomberg Barclays U.S. Aggregate Bond Index,4 returned -2.73%, the Bloomberg Barclays Global Aggregate ex-USD Index (unhedged),5 returned -0.47%, and the Bloomberg Barclays Municipal Bond Index,6 returned 1.46% while the ICE BofA U.S. High Yield Index,7 gained 7.44%.
Hope drove the stock markets to new highs.
In October, capital markets stepped back from their six-month rally. Market volatility rose in advance of the U.S. election and amid a global increase in COVID-19 infections. Europe introduced tighter restrictions affecting economic activity. U.S. markets looked favorably at the prospect of Democratic control of the federal purse strings, which could lead to additional fiscal stimulus and a boost to economic activity. Meanwhile, China reported 4.9% third-quarter gross domestic product growth.
Global stocks rallied in November, propelled by optimism over three promising COVID-19 vaccines. Reversing recent trends, value stocks outperformed growth stocks and cyclical stocks outpaced information technology (IT) stocks. However, U.S. unemployment remained elevated, with a net job loss of 10 million since February. The eurozone services purchasing managers’ index contracted sharply while the region’s manufacturing activity grew. The U.S. election results added to the upbeat mood as investors anticipated more consistent policies in the new administration.
“Global stocks rallied in November, propelled by optimism over three promising COVID-19 vaccines.”
| 1 | The S&P 500 Index consists of 500 stocks chosen for market size, liquidity, and industry group representation. It is a market-value-weighted index with each stock's weight in the index proportionate to its market value. You cannot invest directly in an index. |
| 2 | The Morgan Stanley Capital International (MSCI) All Country World Index (ACWI) ex USA Index (Net) is a free-float-adjusted market-capitalization-weighted index that is designed to measure the equity market performance of developed and emerging markets, excluding the United States. Source: MSCI. MSCI makes no express or implied warranties or representations and shall have no liability whatsoever with respect to any MSCI data contained herein. The MSCI data may not be further redistributed or used as a basis for other indices or any securities or financial products. This report is not approved, reviewed, or produced by MSCI. You cannot invest directly in an index. |
| 1 | The S&P 500 Index consists of 500 stocks chosen for market size, liquidity, and industry group representation. It is a market-value-weighted index with each stock's weight in the index proportionate to its market value. You cannot invest directly in an index. |
| 3 | The MSCI Emerging Markets (EM) Index (Net) is a free-float-adjusted market-capitalization-weighted index that is designed to measure equity market performance of emerging markets. You cannot invest directly in an index. |
| 1 | The S&P 500 Index consists of 500 stocks chosen for market size, liquidity, and industry group representation. It is a market-value-weighted index with each stock's weight in the index proportionate to its market value. You cannot invest directly in an index. |
| 4 | The Bloomberg Barclays U.S. Aggregate Bond Index is a broad-based benchmark that measures the investment-grade, U.S. dollar-denominated, fixed-rate taxable bond market, including Treasuries, government-related and corporate securities, mortgage-backed securities (agency fixed-rate and hybrid adjustable-rate mortgage pass-throughs), asset-backed securities, and commercial mortgage-backed securities. You cannot invest directly in an index. |
| 1 | The S&P 500 Index consists of 500 stocks chosen for market size, liquidity, and industry group representation. It is a market-value-weighted index with each stock's weight in the index proportionate to its market value. You cannot invest directly in an index. |
| 5 | The Bloomberg Barclays Global Aggregate ex-USD Index (unhedged) is an unmanaged index that provides a broad-based measure of the global investment-grade fixed-income markets excluding the U.S. dollar-denominated debt market. You cannot invest directly in an index. |
| 1 | The S&P 500 Index consists of 500 stocks chosen for market size, liquidity, and industry group representation. It is a market-value-weighted index with each stock's weight in the index proportionate to its market value. You cannot invest directly in an index. |
| 6 | The Bloomberg Barclays Municipal Bond Index is an unmanaged index composed of long-term tax-exempt bonds with a minimum credit rating of Baa. You cannot invest directly in an index. |
| 1 | The S&P 500 Index consists of 500 stocks chosen for market size, liquidity, and industry group representation. It is a market-value-weighted index with each stock's weight in the index proportionate to its market value. You cannot invest directly in an index. |
| 7 | The ICE BofA U.S. High Yield Index is a market-capitalization-weighted index of domestic and Yankee high-yield bonds. The index tracks the performance of high-yield securities traded in the U.S. bond market. You cannot invest directly in an index. Copyright 2021. ICE Data Indices, LLC. All rights reserved. |
2 | Wells Fargo Discovery Fund
Letter to shareholders (unaudited)
Financial markets ended the year with strength on high expectations for a rapid rollout of the COVID-19 vaccines, the successful passage of a $900 billion stimulus package, and rising expectations of additional economic support from a Democratic-led Congress. U.S. economic data were mixed with still-elevated unemployment and weak retail sales but growth in manufacturing output. In contrast, China’s economic expansion continued in both manufacturing and nonmanufacturing. U.S. COVID-19 infection rates continued to rise even as new state and local lockdown measures were implemented.
The year 2021 began with emerging market stocks leading all major asset classes in January, driven by China’s strong economic growth and a broad recovery in corporate earnings, which propelled China’s stock market higher. In the U.S., positive news on vaccine trials and January's expansion in both the manufacturing and services sectors were offset by a weak December monthly jobs report. This was compounded by technical factors as some hedge funds were forced to sell stocks to protect themselves against a well-publicized short squeeze coordinated by a group of retail investors. Eurozone sentiment and economic growth were particularly weak, reflecting the impact of a new lockdown with stricter social distancing along with a slow vaccine rollout.
February saw major domestic equity indexes driven higher on the hope of a new stimulus bill, improving COVID-19 vaccination numbers, and the gradual reopening of the economy. Most S&P 500 companies reported better-than-expected earnings, with positive surprises coming from the financials, IT, health care, and materials sectors. Japan saw its economy strengthen as a result of strong export numbers. Meanwhile, crude-oil prices continued their climb, rising more than 25% for the year. Domestic government bonds experienced a sharp sell-off in late February as markets priced in a more robust economic recovery and higher future growth and inflation expectations.
The passage of the massive domestic stimulus bill highlighted March activity, leading to increased forecasts for U.S. growth in 2021. Domestic employment surged as COVID-19 vaccinations and an increasingly open economy spurred hiring. A majority of U.S. small companies reported they are operating at pre-pandemic capacity or higher. Value continued its outperformance of growth in the month, continuing the trend that started in late 2020. Meanwhile, most major developed global equity indexes are up month to date on the back of rising optimism regarding the outlook for global growth. While the U.S. and the U.K. have been the most successful in terms of the vaccine rollout, even within markets where the vaccine has lagged, such as the eurozone and Japan, equity indexes in many of those countries are also in positive territory this year.
“The passage of the massive domestic stimulus bill highlighted March activity, leading to increased forecasts for U.S. growth in 2021.”
For further information about your Fund, contact your investment professional, visit our website at wfam.com, or call us directly at 1-800-222-8222.
Wells Fargo Discovery Fund | 3
Letter to shareholders (unaudited)
Don’t let short-term uncertainty derail long-term investment goals.
Periods of investment uncertainty can present challenges, but experience has taught us that maintaining long-term investment goals can be an effective way to plan for the future. To help you create a sound strategy based on your personal goals and risk tolerance, Wells Fargo Funds offers more than 100 mutual funds spanning a wide range of asset classes and investment styles. Although diversification cannot guarantee an investment profit or prevent losses, we believe it can be an effective way to manage investment risk and potentially smooth out overall portfolio performance. We encourage investors to know their investments and to understand that appropriate levels of risk-taking may unlock opportunities.
Thank you for choosing to invest with Wells Fargo Funds. We appreciate your confidence in us and remain committed to helping you meet your financial needs.
Sincerely,
Andrew Owen
President
Wells Fargo Funds
4 | Wells Fargo Discovery Fund
This page is intentionally left blank.
Performance highlights (unaudited)
| Investment objective | The Fund seeks long-term capital appreciation. |
| Manager | Wells Fargo Funds Management, LLC |
| Subadviser | Wells Capital Management Incorporated |
| Portfolio managers | Michael T. Smith, CFA®‡, Christopher J. Warner, CFA®‡ |
| Average annual total returns (%) as of March 31, 2021 |
| | | Including sales charge | | Excluding sales charge | | Expense ratios1 (%) |
| | Inception date | 1 year | 5 year | 10 year | | 1 year | 5 year | 10 year | | Gross | Net 2 |
| Class A (WFDAX) | 7-31-2007 | 74.96 | 21.80 | 14.37 | | 85.61 | 23.25 | 15.05 | | 1.21 | 1.21 |
| Class C (WDSCX) | 7-31-2007 | 83.31 | 22.33 | 14.20 | | 84.31 | 22.33 | 14.20 | | 1.96 | 1.96 |
| Class R6 (WFDRX)3 | 6-28-2013 | – | – | – | | 86.44 | 23.78 | 15.54 | | 0.78 | 0.78 |
| Administrator Class (WFDDX) | 4-8-2005 | – | – | – | | 85.75 | 23.35 | 15.16 | | 1.13 | 1.13 |
| Institutional Class (WFDSX) | 8-31-2006 | – | – | – | | 86.21 | 23.65 | 15.46 | | 0.88 | 0.88 |
| Russell 2500™ Growth Index4 | – | – | – | – | | 87.50 | 19.91 | 14.21 | | – | – |
Figures quoted represent past performance, which is no guarantee of future results, and do not reflect taxes that a shareholder may pay on an investment in a fund. Investment return and principal value of an investment will fluctuate so that an investor’s shares, when redeemed, may be worth more or less than their original cost. Performance shown without sales charges would be lower if sales charges were reflected. Current performance may be lower or higher than the performance data quoted, which assumes the reinvestment of dividends and capital gains. Current month-end performance is available on the Fund’s website, wfam.com.
Please keep in mind that high double-digit returns were primarily achieved during favorable market conditions. You should not expect that such favorable returns can be consistently achieved. A fund’s performance, especially for short time periods, should not be the sole factor in making your investment decision.
Index returns do not include transaction costs associated with buying and selling securities, any mutual fund fees or expenses, or any taxes. It is not possible to invest directly in an index.
For Class A shares, the maximum front-end sales charge is 5.75%. For Class C shares, the maximum contingent deferred sales charge is 1.00%. Performance including a contingent deferred sales charge assumes the sales charge for the corresponding time period. Class R6, Administrator Class, and Institutional Class shares are sold without a front-end sales charge or contingent deferred sales charge.
| 1 | Reflects the expense ratios as stated in the most recent prospectuses. The expense ratios shown are subject to change and may differ from the annualized expense ratios shown in the financial highlights of this report. |
| 2 | The manager has contractually committed through January 31, 2022, to waive fees and/or reimburse expenses to the extent necessary to cap total annual fund operating expenses after fee waivers at 1.22% for Class A, 1.97% for Class C, 0.79% for Class R6, 1.14% for Administrator Class, and 0.89% for Institutional Class. Brokerage commissions, stamp duty fees, interest, taxes, acquired fund fees and expenses (if any), and extraordinary expenses are excluded from the expense caps. Prior to or after the commitment expiration date, the caps may be increased or the commitment to maintain the caps may be terminated only with the approval of the Board of Trustees. Without these caps, the Fund’s returns would have been lower. The expense ratio paid by an investor is the net expense ratio (the total annual fund operating expenses after fee waivers) as stated in the prospectuses. |
| 3 | Historical performance shown for the Class R6 shares prior to their inception reflects the performance of the Institutional Class shares, and includes the higher expenses applicable to the Institutional Class shares. If these expenses had not been included, returns for the Class R6 shares would be higher. |
| 4 | The Russell 2500™ Growth Index measures the performance of those Russell 2500 companies with higher price/book ratios and higher forecasted growth values. You cannot invest directly in an index. |
Stock values fluctuate in response to the activities of individual companies and general market and economic conditions. Smaller-company stocks tend to be more volatile and less liquid than those of larger companies. The use of derivatives may reduce returns and/or increase volatility. Consult the Fund’s prospectus for additional information on these and other risks.
| ‡ | CFA® and Chartered Financial Analyst® are trademarks owned by CFA Institute. |
6 | Wells Fargo Discovery Fund
Performance highlights (unaudited)
| Ten largest holdings (%) as of March 31, 20211 |
| Generac Holdings Incorporated | 2.89 |
| MercadoLibre Incorporated | 2.84 |
| Etsy Incorporated | 2.38 |
| StoneCo Limited Class A | 2.24 |
| Chipotle Mexican Grill Incorporated | 2.16 |
| Five9 Incorporated | 2.13 |
| MKS Instruments Incorporated | 2.10 |
| MongoDB Incorporated | 2.09 |
| Casella Waste Systems Incorporated Class A | 2.09 |
| Twilio Incorporated Class A | 2.03 |
| 1 | Figures represent the percentage of the Fund's net assets. Holdings are subject to change and may have changed since the date specified. |
| Sector allocation as of March 31, 20211 |
| 1 | Figures represent the percentage of the Fund's long-term investments. These amounts are subject to change and may have changed since the date specified. |
Wells Fargo Discovery Fund | 7
Fund expenses (unaudited)
As a shareholder of the Fund, you incur two types of costs: (1) transaction costs, including sales charges (loads) on purchase payments and contingent deferred sales charges (if any) on redemptions and (2) ongoing costs, including management fees, distribution (12b-1) and/or shareholder servicing fees, and other Fund expenses. This example is intended to help you understand your ongoing costs (in dollars) of investing in the Fund and to compare these costs with the ongoing costs of investing in other mutual funds.
The example is based on an investment of $1,000 invested at the beginning of the six-month period and held for the entire period from October 1, 2020 to March 31, 2021.
Actual expenses
The “Actual” line of the table below provides information about actual account values and actual expenses. You may use the information in this line, together with the amount you invested, to estimate the expenses that you paid over the period. Simply divide your account value by $1,000 (for example, an $8,600 account value divided by $1,000 = 8.6), then multiply the result by the number in the “Actual” line under the heading entitled “Expenses paid during period” for your applicable class of shares to estimate the expenses you paid on your account during this period.
Hypothetical example for comparison purposes
The “Hypothetical” line of the table below provides information about hypothetical account values and hypothetical expenses based on the Fund’s actual expense ratio and an assumed rate of return of 5% per year before expenses, which is not the Fund’s actual return. The hypothetical account values and expenses may not be used to estimate the actual ending account balance or expenses you paid for the period. You may use this information to compare the ongoing costs of investing in the Fund and other funds. To do so, compare this 5% hypothetical example with the 5% hypothetical examples that appear in the shareholder reports of the other funds.
Please note that the expenses shown in the table are meant to highlight your ongoing costs only and do not reflect any transactional costs, such as sales charges (loads) and contingent deferred sales charges. Therefore, the “Hypothetical” line of the table is useful in comparing ongoing costs only and will not help you determine the relative total costs of owning different funds. In addition, if these transactional costs were included, your costs would have been higher.
| | Beginning
account value
10-1-2020 | Ending
account value
3-31-2021 | Expenses
paid during
the period1 | Annualized net
expense ratio |
| Class A | | | | |
| Actual | $1,000.00 | $1,182.91 | $ 6.42 | 1.18% |
| Hypothetical (5% return before expenses) | $1,000.00 | $1,019.05 | $ 5.94 | 1.18% |
| Class C | | | | |
| Actual | $1,000.00 | $1,178.26 | $10.54 | 1.94% |
| Hypothetical (5% return before expenses) | $1,000.00 | $1,015.26 | $ 9.75 | 1.94% |
| Class R6 | | | | |
| Actual | $1,000.00 | $1,185.43 | $ 4.14 | 0.76% |
| Hypothetical (5% return before expenses) | $1,000.00 | $1,021.14 | $ 3.83 | 0.76% |
| Administrator Class | | | | |
| Actual | $1,000.00 | $1,183.24 | $ 6.04 | 1.11% |
| Hypothetical (5% return before expenses) | $1,000.00 | $1,019.40 | $ 5.59 | 1.11% |
| Institutional Class | | | | |
| Actual | $1,000.00 | $1,184.88 | $ 4.68 | 0.86% |
| Hypothetical (5% return before expenses) | $1,000.00 | $1,020.64 | $ 4.33 | 0.86% |
1 Expenses paid is equal to the annualized net expense ratio of each class multiplied by the average account value over the period, multiplied by the number of days in the most recent fiscal half-year divided by the number of days in the fiscal year (to reflect the one-half-year period).
8 | Wells Fargo Discovery Fund
Portfolio of investments—March 31, 2021 (unaudited)
| | | | | Shares | Value |
| Common stocks: 99.36% | | | | | |
| Communication services: 3.06% | | | | | |
| Interactive media & services: 3.06% | | | | | |
| Bumble Incorporated Class A † | | | | 42,844 | $ 2,672,609 |
| InterActiveCorp † | | | | 227,792 | 49,273,688 |
| Match Group Incorporated † | | | | 339,470 | 46,636,389 |
| | | | | | 98,582,686 |
| Consumer discretionary: 13.50% | | | | | |
| Diversified consumer services: 1.64% | | | | | |
| Chegg Incorporated † | | | | 615,097 | 52,689,209 |
| Hotels, restaurants & leisure: 3.28% | | | | | |
| Chipotle Mexican Grill Incorporated † | | | | 48,896 | 69,472,415 |
| Domino's Pizza Incorporated | | | | 97,893 | 36,004,066 |
| | | | | | 105,476,481 |
| Internet & direct marketing retail: 7.37% | | | | | |
| Chewy Incorporated Class A † | | | | 422,967 | 35,829,535 |
| Etsy Incorporated † | | | | 379,374 | 76,508,355 |
| Magnite Incorporated † | | | | 806,300 | 33,550,143 |
| MercadoLibre Incorporated † | | | | 62,182 | 91,540,609 |
| | | | | | 237,428,642 |
| Leisure products: 1.21% | | | | | |
| Callaway Golf Company | | | | 1,462,774 | 39,129,205 |
| Financials: 2.19% | | | | | |
| Capital markets: 1.47% | | | | | |
| MarketAxess Holdings Incorporated | | | | 95,100 | 47,352,192 |
| Consumer finance: 0.72% | | | | | |
| LendingTree Incorporated † | | | | 108,160 | 23,038,080 |
| Health care: 29.61% | | | | | |
| Biotechnology: 6.03% | | | | | |
| Black Diamond Therapeutics Incorporated † | | | | 325,032 | 7,885,276 |
| CRISPR Therapeutics AG † | | | | 97,321 | 11,858,564 |
| Deciphera Pharmaceuticals Incorporated † | | | | 260,427 | 11,677,547 |
| Mirati Therapeutics Incorporated † | | | | 79,657 | 13,645,244 |
| Natera Incorporated † | | | | 460,869 | 46,796,638 |
| ORIC Pharmaceuticals Incorporated † | | | | 578,363 | 14,169,894 |
| Turning Point Therapeutics Incorporated † | | | | 248,510 | 23,506,561 |
| Twist Bioscience Corporation † | | | | 201,922 | 25,010,059 |
| Zai Lab Limited ADR † | | | | 238,851 | 31,869,889 |
| Zymeworks Incorporated † | | | | 241,075 | 7,613,149 |
| | | | | | 194,032,821 |
| Health care equipment & supplies: 10.94% | | | | | |
| ABIOMED Incorporated † | | | | 114,777 | 36,582,872 |
| Align Technology Incorporated † | | | | 118,455 | 64,146,935 |
| DexCom Incorporated † | | | | 128,451 | 46,164,005 |
| Inari Medical Incorporated † | | | | 584,214 | 62,510,898 |
| Insulet Corporation † | | | | 170,536 | 44,496,253 |
The accompanying notes are an integral part of these financial statements.
Wells Fargo Discovery Fund | 9
Portfolio of investments—March 31, 2021 (unaudited)
| | | | | Shares | Value |
| Health care equipment & supplies (continued) | | | | | |
| iRhythm Technologies Incorporated † | | | | 265,223 | $ 36,828,866 |
| Shockwave Medical Incorporated † | | | | 472,589 | 61,559,443 |
| | | | | | 352,289,272 |
| Health care providers & services: 8.25% | | | | | |
| Amedisys Incorporated † | | | | 171,338 | 45,368,588 |
| Chemed Corporation | | | | 76,836 | 35,330,730 |
| Guardant Health Incorporated † | | | | 411,165 | 62,764,337 |
| HealthEquity Incorporated † | | | | 599,586 | 40,771,848 |
| Oak Street Health Incorporated † | | | | 780,499 | 42,357,681 |
| Option Care Health Incorporated † | | | | 2,192,700 | 38,898,498 |
| | | | | | 265,491,682 |
| Health care technology: 0.32% | | | | | |
| Schrodinger Incorporated † | | | | 134,100 | 10,230,489 |
| Life sciences tools & services: 4.07% | | | | | |
| 10x Genomics Incorporated Class A † | | | | 307,600 | 55,675,600 |
| Berkeley Lights Incorporated † | | | | 555,307 | 27,893,070 |
| Bio-Rad Laboratories Incorporated Class A † | | | | 83,348 | 47,605,877 |
| | | | | | 131,174,547 |
| Industrials: 15.83% | | | | | |
| Aerospace & defense: 2.85% | | | | | |
| Mercury Systems Incorporated † | | | | 491,653 | 34,735,284 |
| Teledyne Technologies Incorporated † | | | | 138,191 | 57,162,707 |
| | | | | | 91,897,991 |
| Building products: 1.72% | | | | | |
| Trex Company Incorporated † | | | | 604,794 | 55,362,843 |
| Commercial services & supplies: 2.98% | | | | | |
| Casella Waste Systems Incorporated Class A † | | | | 1,055,443 | 67,094,512 |
| IAA Incorporated † | | | | 521,857 | 28,775,195 |
| | | | | | 95,869,707 |
| Electrical equipment: 2.89% | | | | | |
| Generac Holdings Incorporated † | | | | 284,042 | 93,009,553 |
| Machinery: 0.38% | | | | | |
| Desktop Metal Incorporated †« | | | | 819,400 | 12,209,060 |
| Professional services: 1.64% | | | | | |
| Clarivate plc † | | | | 1,995,253 | 52,654,727 |
| Road & rail: 1.86% | | | | | |
| Saia Incorporated † | | | | 260,414 | 60,046,260 |
| Trading companies & distributors: 1.51% | | | | | |
| SiteOne Landscape Supply Incorporated † | | | | 285,042 | 48,668,071 |
| Information technology: 33.71% | | | | | |
| Electronic equipment, instruments & components: 1.16% | | | | | |
| Novanta Incorporated † | | | | 283,279 | 37,361,667 |
The accompanying notes are an integral part of these financial statements.
10 | Wells Fargo Discovery Fund
Portfolio of investments—March 31, 2021 (unaudited)
| | | | | Shares | Value |
| IT services: 15.90% | | | | | |
| Black Knight Incorporated † | | | | 793,738 | $ 58,728,675 |
| EPAM Systems Incorporated † | | | | 143,302 | 56,846,470 |
| Globant SA † | | | | 275,444 | 57,184,929 |
| MongoDB Incorporated † | | | | 251,897 | 67,364,815 |
| Paysafe Limited †« | | | | 3,099,000 | 41,836,500 |
| StoneCo Limited Class A † | | | | 1,175,875 | 71,987,068 |
| Twilio Incorporated Class A † | | | | 191,878 | 65,384,347 |
| WEX Incorporated † | | | | 241,352 | 50,495,665 |
| WNS Holdings Limited ADR † | | | | 582,106 | 42,167,759 |
| | | | | | 511,996,228 |
| Semiconductors & semiconductor equipment: 5.84% | | | | | |
| Enphase Energy Incorporated † | | | | 247,900 | 40,199,464 |
| Lattice Semiconductor Corporation † | | | | 722,498 | 32,526,860 |
| MKS Instruments Incorporated | | | | 364,720 | 67,626,382 |
| Universal Display Corporation | | | | 201,233 | 47,645,937 |
| | | | | | 187,998,643 |
| Software: 10.81% | | | | | |
| Avalara Incorporated † | | | | 424,006 | 56,575,120 |
| Bill.com Holdings Incorporated † | | | | 361,528 | 52,602,324 |
| Crowdstrike Holdings Incorporated Class A † | | | | 283,359 | 51,715,851 |
| Elastic NV † | | | | 479,518 | 53,322,402 |
| Five9 Incorporated † | | | | 438,485 | 68,548,360 |
| Lightspeed POS Incorporated † | | | | 687,200 | 43,163,032 |
| Unity Software Incorporated †« | | | | 220,248 | 22,093,077 |
| | | | | | 348,020,166 |
| Real estate: 1.46% | | | | | |
| Equity REITs: 1.46% | | | | | |
| QTS Realty Trust Incorporated Class A | | | | 757,896 | 47,019,868 |
| Total Common stocks (Cost $1,975,208,316) | | | | | 3,199,030,090 |
| | | Yield | | | |
| Short-term investments: 1.76% | | | | | |
| Investment companies: 1.76% | | | | | |
| Securities Lending Cash Investments LLC ♠∩∞ | | 0.04% | | 35,559,727 | 35,559,727 |
| Wells Fargo Government Money Market Fund Select Class ♠∞ | | 0.03 | | 21,231,848 | 21,231,848 |
| Total Short-term investments (Cost $56,791,575) | | | | | 56,791,575 |
| Total investments in securities (Cost $2,031,999,891) | 101.12% | | | | 3,255,821,665 |
| Other assets and liabilities, net | (1.12) | | | | (36,028,583) |
| Total net assets | 100.00% | | | | $3,219,793,082 |
| † | Non-income-earning security |
| « | All or a portion of this security is on loan. |
| ♠ | The issuer of the security is an affiliated person of the Fund as defined in the Investment Company Act of 1940. |
| ∩ | The investment is a non-registered investment company purchased with cash collateral received from securities on loan. |
| ∞ | The rate represents the 7-day annualized yield at period end. |
The accompanying notes are an integral part of these financial statements.
Wells Fargo Discovery Fund | 11
Portfolio of investments—March 31, 2021 (unaudited)
| Abbreviations: |
| ADR | American depositary receipt |
| REIT | Real estate investment trust |
Investments in affiliates
An affiliated investment is an investment in which the Fund owns at least 5% of the outstanding voting shares of the issuer or as a result of other relationships, such as the Fund and the issuer having the same investment manager. Transactions with issuers that were either affiliated persons of the Fund at the beginning of the period or the end of the period were as follows:
| | Value,
beginning of
period | Purchases | Sales
proceeds | Net
realized
gains
(losses) | | Net
change in
unrealized
gains
(losses) | | Value,
end of
period | | % of
net
assets | Shares,
end
of period | Income
from
affiliated
securities |
| Short-term investments | | | | | | | | | | | | |
| Investment companies | | | | | | | | | | | | |
| Securities Lending Cash Investments LLC | $11,803,125 | $346,947,018 | $(323,190,416) | $0 | | $0 | | $ 35,559,727 | | | 35,559,727 | $ 22,556# |
| Wells Fargo Government Money Market Fund Select Class | 10,524,388 | 367,697,067 | (356,989,607) | 0 | | 0 | | 21,231,848 | | | 21,231,848 | 3,038 |
| | | | | $0 | | $0 | | $56,791,575 | | 1.76% | | $25,594 |
| # | Amount shown represents income before fees and rebates. |
The accompanying notes are an integral part of these financial statements.
12 | Wells Fargo Discovery Fund
Statement of assets and liabilities—March 31, 2021 (unaudited)
| | |
| Assets | |
Investments in unaffiliated securities (including $34,615,622 of securities loaned), at value (cost $1,975,208,316)
| $ 3,199,030,090 |
Investments in affiliated securites, at value (cost $56,791,575)
| 56,791,575 |
Receivable for Fund shares sold
| 3,559,364 |
Receivable for investments sold
| 3,121,427 |
Receivable for dividends
| 379,714 |
Receivable for securities lending income, net
| 25,712 |
Total assets
| 3,262,907,882 |
| Liabilities | |
Payable upon receipt of securities loaned
| 35,559,727 |
Payable for Fund shares redeemed
| 4,546,112 |
Management fee payable
| 1,974,747 |
Administration fees payable
| 358,703 |
Distribution fee payable
| 14,261 |
Trustees’ fees and expenses payable
| 3,193 |
Accrued expenses and other liabilities
| 658,057 |
Total liabilities
| 43,114,800 |
Total net assets
| $3,219,793,082 |
| Net assets consist of | |
Paid-in capital
| $ 1,635,533,297 |
Total distributable earnings
| 1,584,259,785 |
Total net assets
| $3,219,793,082 |
| Computation of net asset value and offering price per share | |
Net assets – Class A
| $ 862,392,785 |
Shares outstanding – Class A1
| 19,266,944 |
Net asset value per share – Class A
| $44.76 |
Maximum offering price per share – Class A2
| $47.49 |
Net assets – Class C
| $ 21,961,982 |
Shares outstanding – Class C1
| 605,777 |
Net asset value per share – Class C
| $36.25 |
Net assets – Class R6
| $ 732,797,573 |
Shares outstanding – Class R61
| 14,420,231 |
Net asset value per share – Class R6
| $50.82 |
Net assets – Administrator Class
| $ 508,866,868 |
Shares outstanding – Administrator Class1
| 10,838,974 |
Net asset value per share – Administrator Class
| $46.95 |
Net assets – Institutional Class
| $ 1,093,773,874 |
Shares outstanding – Institutional Class1
| 21,741,335 |
Net asset value per share – Institutional Class
| $50.31 |
| 1 | The Fund has an unlimited number of authorized shares |
| 2 | Maximum offering price is computed as 100/94.25 of net asset value. On investments of $50,000 or more, the offering price is reduced. |
The accompanying notes are an integral part of these financial statements.
Wells Fargo Discovery Fund | 13
Statement of operations—six months ended March 31, 2021 (unaudited)
| | |
| Investment income | |
Dividends (net of foreign withholdings taxes of $3,509)
| $ 1,522,090 |
Securities lending income from affiliates, net
| 138,207 |
Income from affiliated securities
| 3,038 |
Total investment income
| 1,663,335 |
| Expenses | |
Management fee
| 11,485,824 |
| Administration fees | |
Class A
| 933,540 |
Class C
| 27,479 |
Class R6
| 107,988 |
Administrator Class
| 312,645 |
Institutional Class
| 716,532 |
| Shareholder servicing fees | |
Class A
| 1,111,357 |
Class C
| 32,714 |
Administrator Class
| 599,663 |
| Distribution fee | |
Class C
| 98,141 |
Custody and accounting fees
| 73,999 |
Professional fees
| 22,087 |
Registration fees
| 37,963 |
Shareholder report expenses
| 49,627 |
Trustees’ fees and expenses
| 9,610 |
Other fees and expenses
| 20,611 |
Total expenses
| 15,639,780 |
| Less: Fee waivers and/or expense reimbursements | |
Class A
| (40,729) |
Administrator Class
| (14) |
Net expenses
| 15,599,037 |
Net investment loss
| (13,935,702) |
| Realized and unrealized gains (losses) on investments | |
Net realized gains on investments
| 388,031,369 |
Net change in unrealized gains (losses) on investments
| 117,583,746 |
Net realized and unrealized gains (losses) on investments
| 505,615,115 |
Net increase in net assets resulting from operations
| $491,679,413 |
The accompanying notes are an integral part of these financial statements.
14 | Wells Fargo Discovery Fund
Statement of changes in net assets
| | |
| | Six months ended
March 31, 2021
(unaudited) | Year ended
September 30, 2020 |
| Operations | | | | |
Net investment loss
| | $ (13,935,702) | | $ (16,267,793) |
Net realized gains on investments
| | 388,031,369 | | 196,913,932 |
Net change in unrealized gains (losses) on investments
| | 117,583,746 | | 560,078,695 |
Net increase in net assets resulting from operations
| | 491,679,413 | | 740,724,834 |
| Distributions to shareholders from | | | | |
| Net investment income and net realized gains | | | | |
Class A
| | (46,293,679) | | (80,675,264) |
Class C
| | (1,627,880) | | (4,218,619) |
Class R6
| | (34,087,214) | | (47,628,599) |
Administrator Class
| | (21,096,480) | | (40,537,083) |
Institutional Class
| | (50,727,287) | | (104,185,623) |
Total distributions to shareholders
| | (153,832,540) | | (277,245,188) |
| Capital share transactions | Shares | | Shares | |
| Proceeds from shares sold | | | | |
Class A
| 1,282,268 | 59,842,045 | 1,810,982 | 59,278,614 |
Class C
| 51,988 | 1,961,255 | 108,226 | 2,824,773 |
Class R6
| 3,206,322 | 166,583,797 | 5,528,146 | 196,888,388 |
Administrator Class
| 2,726,921 | 130,942,647 | 1,559,841 | 48,274,606 |
Institutional Class
| 4,106,579 | 214,731,695 | 6,616,298 | 239,218,211 |
| | | 574,061,439 | | 546,484,592 |
| Reinvestment of distributions | | | | |
Class A
| 1,020,425 | 44,898,707 | 2,585,318 | 78,180,006 |
Class C
| 45,382 | 1,621,040 | 155,290 | 3,886,912 |
Class R6
| 650,728 | 32,464,798 | 1,396,303 | 47,376,552 |
Administrator Class
| 456,861 | 21,079,565 | 1,269,437 | 40,126,892 |
Institutional Class
| 976,337 | 48,231,041 | 2,676,859 | 90,076,315 |
| | | 148,295,151 | | 259,646,677 |
| Payment for shares redeemed | | | | |
Class A
| (2,126,895) | (98,584,104) | (4,177,689) | (132,866,024) |
Class C
| (358,644) | (13,500,325) | (492,255) | (13,351,854) |
Class R6
| (2,727,624) | (144,444,330) | (4,667,957) | (169,978,976) |
Administrator Class
| (1,303,507) | (62,337,712) | (3,531,376) | (112,276,268) |
Institutional Class
| (3,715,338) | (193,185,527) | (18,973,610) | (664,126,116) |
| | | (512,051,998) | | (1,092,599,238) |
Net increase (decrease) in net assets resulting from capital share transactions
| | 210,304,592 | | (286,467,969) |
Total increase in net assets
| | 548,151,465 | | 177,011,677 |
| Net assets | | | | |
Beginning of period
| | 2,671,641,617 | | 2,494,629,940 |
End of period
| | $3,219,793,082 | | $ 2,671,641,617 |
The accompanying notes are an integral part of these financial statements.
Wells Fargo Discovery Fund | 15
Financial highlights
(For a share outstanding throughout each period)
| | | Year ended September 30 |
| Class A | Six months ended
March 31, 2021
(unaudited) | 2020 | 2019 | 2018 | 2017 | 2016 |
Net asset value, beginning of period
| $39.95 | $33.24 | $38.03 | $36.47 | $29.94 | $30.48 |
Net investment loss
| (0.25) | (0.31) | (0.26) | (0.26) | (0.23) | (0.18) 1 |
Net realized and unrealized gains on investments
| 7.51 | 11.37 | 0.53 | 7.85 | 7.17 | 2.23 |
Total from investment operations
| 7.26 | 11.06 | 0.27 | 7.59 | 6.94 | 2.05 |
| Distributions to shareholders from | | | | | | |
Net realized gains
| (2.45) | (4.35) | (5.06) | (6.03) | (0.41) | (2.59) |
Net asset value, end of period
| $44.76 | $39.95 | $33.24 | $38.03 | $36.47 | $29.94 |
Total return2
| 18.29% | 37.49% | 3.81% | 23.86% | 23.42% | 7.33% |
| Ratios to average net assets (annualized) | | | | | | |
Gross expenses
| 1.19% | 1.21% | 1.21% | 1.20% | 1.21% | 1.20% |
Net expenses
| 1.18% | 1.19% | 1.20% | 1.20% | 1.21% | 1.20% |
Net investment loss
| (1.07)% | (0.91)% | (0.77)% | (0.69)% | (0.70)% | (0.64)% |
| Supplemental data | | | | | | |
Portfolio turnover rate
| 29% | 53% | 71% | 67% | 73% | 78% |
Net assets, end of period (000s omitted)
| $862,393 | $762,758 | $627,336 | $676,930 | $607,318 | $641,786 |
| 1 | Calculated based upon average shares outstanding |
| 2 | Total return calculations do not include any sales charges. Returns for periods of less than one year are not annualized. |
The accompanying notes are an integral part of these financial statements.
16 | Wells Fargo Discovery Fund
Financial highlights
(For a share outstanding throughout each period)
| | | Year ended September 30 |
| Class C | Six months ended
March 31, 2021
(unaudited) | 2020 | 2019 | 2018 | 2017 | 2016 |
Net asset value, beginning of period
| $32.88 | $28.27 | $33.46 | $32.99 | $27.32 | $28.24 |
Net investment loss
| (0.34) 1 | (0.45) 1 | (0.41) 1 | (0.46) | (0.42) 1 | (0.37) 1 |
Net realized and unrealized gains on investments
| 6.16 | 9.41 | 0.28 | 6.96 | 6.50 | 2.04 |
Total from investment operations
| 5.82 | 8.96 | (0.13) | 6.50 | 6.08 | 1.67 |
| Distributions to shareholders from | | | | | | |
Net realized gains
| (2.45) | (4.35) | (5.06) | (6.03) | (0.41) | (2.59) |
Net asset value, end of period
| $36.25 | $32.88 | $28.27 | $33.46 | $32.99 | $27.32 |
Total return2
| 17.83% | 36.54% | 3.01% | 22.94% | 22.51% | 6.51% |
| Ratios to average net assets (annualized) | | | | | | |
Gross expenses
| 1.94% | 1.96% | 1.95% | 1.95% | 1.96% | 1.95% |
Net expenses
| 1.94% | 1.96% | 1.95% | 1.95% | 1.96% | 1.95% |
Net investment loss
| (1.84)% | (1.66)% | (1.51)% | (1.45)% | (1.45)% | (1.41)% |
| Supplemental data | | | | | | |
Portfolio turnover rate
| 29% | 53% | 71% | 67% | 73% | 78% |
Net assets, end of period (000s omitted)
| $21,962 | $28,509 | $30,982 | $40,860 | $40,070 | $49,538 |
| 1 | Calculated based upon average shares outstanding |
| 2 | Total return calculations do not include any sales charges. Returns for periods of less than one year are not annualized. |
The accompanying notes are an integral part of these financial statements.
Wells Fargo Discovery Fund | 17
Financial highlights
(For a share outstanding throughout each period)
| | | Year ended September 30 |
| Class R6 | Six months ended
March 31, 2021
(unaudited) | 2020 | 2019 | 2018 | 2017 | 2016 |
Net asset value, beginning of period
| $44.98 | $36.76 | $41.26 | $38.93 | $31.80 | $32.08 |
Net investment loss
| (0.17) 1 | (0.18) 1 | (0.12) 1 | (0.10) 1 | (0.08) | (0.07) |
Net realized and unrealized gains on investments
| 8.46 | 12.75 | 0.68 | 8.46 | 7.62 | 2.38 |
Total from investment operations
| 8.29 | 12.57 | 0.56 | 8.36 | 7.54 | 2.31 |
| Distributions to shareholders from | | | | | | |
Net realized gains
| (2.45) | (4.35) | (5.06) | (6.03) | (0.41) | (2.59) |
Net asset value, end of period
| $50.82 | $44.98 | $36.76 | $41.26 | $38.93 | $31.80 |
Total return2
| 18.54% | 38.06% | 4.26% | 24.39% | 23.98% | 7.77% |
| Ratios to average net assets (annualized) | | | | | | |
Gross expenses
| 0.76% | 0.78% | 0.77% | 0.78% | 0.78% | 0.77% |
Net expenses
| 0.76% | 0.78% | 0.77% | 0.78% | 0.78% | 0.77% |
Net investment loss
| (0.65)% | (0.50)% | (0.33)% | (0.26)% | (0.27)% | (0.22)% |
| Supplemental data | | | | | | |
Portfolio turnover rate
| 29% | 53% | 71% | 67% | 73% | 78% |
Net assets, end of period (000s omitted)
| $732,798 | $597,851 | $405,610 | $530,879 | $351,268 | $300,118 |
| 1 | Calculated based upon average shares outstanding |
| 2 | Returns for periods of less than one year are not annualized. |
The accompanying notes are an integral part of these financial statements.
18 | Wells Fargo Discovery Fund
Financial highlights
(For a share outstanding throughout each period)
| | | Year ended September 30 |
| Administrator Class | Six months ended
March 31, 2021
(unaudited) | 2020 | 2019 | 2018 | 2017 | 2016 |
Net asset value, beginning of period
| $41.79 | $34.55 | $39.27 | $37.44 | $30.70 | $31.17 |
Net investment loss
| (0.24) 1 | (0.29) 1 | (0.23) 1 | (0.23) | (0.20) 1 | (0.17) 1 |
Net realized and unrealized gains on investments
| 7.85 | 11.88 | 0.57 | 8.09 | 7.35 | 2.29 |
Total from investment operations
| 7.61 | 11.59 | 0.34 | 7.86 | 7.15 | 2.12 |
| Distributions to shareholders from | | | | | | |
Net realized gains
| (2.45) | (4.35) | (5.06) | (6.03) | (0.41) | (2.59) |
Net asset value, end of period
| $46.95 | $41.79 | $34.55 | $39.27 | $37.44 | $30.70 |
Total return2
| 18.32% | 37.61% | 3.88% | 23.97% | 23.52% | 7.40% |
| Ratios to average net assets (annualized) | | | | | | |
Gross expenses
| 1.11% | 1.13% | 1.13% | 1.12% | 1.13% | 1.12% |
Net expenses
| 1.11% | 1.13% | 1.13% | 1.12% | 1.13% | 1.12% |
Net investment loss
| (1.00)% | (0.84)% | (0.70)% | (0.62)% | (0.62)% | (0.58)% |
| Supplemental data | | | | | | |
Portfolio turnover rate
| 29% | 53% | 71% | 67% | 73% | 78% |
Net assets, end of period (000s omitted)
| $508,867 | $374,366 | $333,814 | $353,042 | $335,898 | $400,997 |
| 1 | Calculated based upon average shares outstanding |
| 2 | Returns for periods of less than one year are not annualized. |
The accompanying notes are an integral part of these financial statements.
Wells Fargo Discovery Fund | 19
Financial highlights
(For a share outstanding throughout each period)
| | | Year ended September 30 |
| Institutional Class | Six months ended
March 31, 2021
(unaudited) | 2020 | 2019 | 2018 | 2017 | 2016 |
Net asset value, beginning of period
| $44.57 | $36.50 | $41.05 | $38.79 | $31.72 | $32.04 |
Net investment loss
| (0.19) 1 | (0.21) 1 | (0.15) 1 | (0.18) | (0.13) 1 | (0.10) |
Net realized and unrealized gains on investments
| 8.38 | 12.63 | 0.66 | 8.47 | 7.61 | 2.37 |
Total from investment operations
| 8.19 | 12.42 | 0.51 | 8.29 | 7.48 | 2.27 |
| Distributions to shareholders from | | | | | | |
Net realized gains
| (2.45) | (4.35) | (5.06) | (6.03) | (0.41) | (2.59) |
Net asset value, end of period
| $50.31 | $44.57 | $36.50 | $41.05 | $38.79 | $31.72 |
Total return2
| 18.49% | 37.91% | 4.15% | 24.25% | 23.88% | 7.68% |
| Ratios to average net assets (annualized) | | | | | | |
Gross expenses
| 0.86% | 0.88% | 0.87% | 0.87% | 0.88% | 0.87% |
Net expenses
| 0.86% | 0.88% | 0.87% | 0.87% | 0.88% | 0.87% |
Net investment loss
| (0.75)% | (0.58)% | (0.42)% | (0.36)% | (0.37)% | (0.32)% |
| Supplemental data | | | | | | |
Portfolio turnover rate
| 29% | 53% | 71% | 67% | 73% | 78% |
Net assets, end of period (000s omitted)
| $1,093,774 | $908,157 | $1,096,888 | $1,352,027 | $1,157,148 | $1,316,107 |
| 1 | Calculated based upon average shares outstanding |
| 2 | Returns for periods of less than one year are not annualized. |
The accompanying notes are an integral part of these financial statements.
20 | Wells Fargo Discovery Fund
Notes to financial statements (unaudited)
1. ORGANIZATION
Wells Fargo Funds Trust (the "Trust"), a Delaware statutory trust organized on March 10, 1999, is an open-end management investment company registered under the Investment Company Act of 1940, as amended (the "1940 Act"). As an investment company, the Trust follows the accounting and reporting guidance in Financial Accounting Standards Board (“FASB”) Accounting Standards Codification Topic 946, Financial Services – Investment Companies. These financial statements report on the Wells Fargo Discovery Fund (the "Fund") which is a diversified series of the Trust.
On February 23, 2021, Wells Fargo & Company announced that it has entered into a definitive agreement to sell Wells Fargo Asset Management ("WFAM") to GTCR LLC and Reverence Capital Partners, L.P. WFAM is the trade name used by the asset management businesses of Wells Fargo & Company and includes Wells Fargo Funds Management, LLC, the investment manager to the Fund, Wells Capital Management Incorporated and Wells Fargo Asset Management (International) Limited, both registered investment advisers providing sub-advisory services to certain funds, and Wells Fargo Funds Distributor, LLC, the Fund's principal underwriter. As part of the transaction, Wells Fargo & Company will own a 9.9% equity interest and will continue to serve as an important client and distribution partner. The transaction is expected to close in the second half of 2021, subject to customary closing conditions.
Consummation of the transaction will result in the automatic termination of the Fund's investment management agreement and sub-advisory agreement. The Fund's Board of Trustees will be asked to approve new investment management arrangements with the new company. If approved by the Board, the new investment management arrangements with the new company will be presented to the shareholders of the Fund for approval, and, if approved by shareholders, would take effect upon the closing of the transaction. The transaction is expected to close in the second half of 2021, subject to customary closing conditions.
2. SIGNIFICANT ACCOUNTING POLICIES
The following significant accounting policies, which are consistently followed in the preparation of the financial statements of the Fund, are in conformity with U.S. generally accepted accounting principles which require management to make estimates and assumptions that affect the reported amounts of assets and liabilities, disclosure of contingent assets and liabilities at the date of the financial statements, and the reported amounts of income and expenses during the reporting period. Actual results could differ from those estimates.
Securities valuation
All investments are valued each business day as of the close of regular trading on the New York Stock Exchange (generally 4 p.m. Eastern Time), although the Fund may deviate from this calculation time under unusual or unexpected circumstances.
Equity securities that are listed on a foreign or domestic exchange or market are valued at the official closing price or, if none, the last sales price. If no sale occurs on the principal exchange or market that day, a fair value price will be determined in accordance with the Fund’s Valuation Procedures.
Investments in registered open-end investment companies are valued at net asset value. Interests in non-registered investment companies that are redeemable at net asset value are fair valued normally at net asset value.
Investments which are not valued using any of the methods discussed above are valued at their fair value, as determined in good faith by the Board of Trustees. The Board of Trustees has established a Valuation Committee comprised of the Trustees and has delegated to it the authority to take any actions regarding the valuation of portfolio securities that the Valuation Committee deems necessary or appropriate, including determining the fair value of portfolio securities, unless the determination has been delegated to the Wells Fargo Asset Management Pricing Committee at Wells Fargo Funds Management, LLC ("Funds Management"). The Board of Trustees retains the authority to make or ratify any valuation decisions or approve any changes to the Valuation Procedures as it deems appropriate. On a quarterly basis, the Board of Trustees receives reports on any valuation actions taken by the Valuation Committee or the Wells Fargo Asset Management Pricing Committee which may include items for ratification.
Foreign currency translation
The accounting records of the Fund are maintained in U.S. dollars. The values of other assets and liabilities denominated in foreign currencies are translated into U.S. dollars at rates provided by an independent foreign currency pricing source at a time each business day specified by the Wells Fargo Asset Management Pricing Committee. Purchases and sales of securities, and income and expenses are converted at the rate of exchange on the respective dates of such transactions. Net realized foreign exchange gains or losses arise from sales of foreign currencies, currency gains or losses realized between the trade and settlement dates on securities transactions, and the difference between the amounts of dividends, interest and foreign withholding taxes recorded and the U.S. dollar equivalent of the amounts actually paid or received. Net unrealized foreign
Wells Fargo Discovery Fund | 21
Notes to financial statements (unaudited)
exchange gains and losses arise from changes in the fair value of assets and liabilities other than investments in securities resulting from changes in exchange rates. The changes in net assets arising from changes in exchange rates of securities and the changes in net assets resulting from changes in market prices of securities are not separately presented. Such changes are included in net realized and unrealized gains or losses from investments.
Securities lending
The Fund may lend its securities from time to time in order to earn additional income in the form of fees or interest on securities received as collateral or the investment of any cash received as collateral. When securities are on loan, the Fund receives interest or dividends on those securities. Cash collateral received in connection with its securities lending transactions is invested in Securities Lending Cash Investments, LLC (the "Securities Lending Fund"). Investments in Securities Lending Fund are valued at the evaluated bid price provided by an independent pricing service. Income earned from investment in the Securities Lending Fund, if any, is included in securities lending income from affiliates (net of fees and rebates) on the Statement of Operations.
In a securities lending transaction, the net asset value of the Fund is affected by an increase or decrease in the value of the securities loaned and by an increase or decrease in the value of the instrument in which collateral is invested. The amount of securities lending activity undertaken by the Fund fluctuates from time to time. The Fund has the right under the lending agreement to recover the securities from the borrower on demand. In the event of default or bankruptcy by the borrower, the Fund may be prevented from recovering the loaned securities or gaining access to the collateral or may experience delays or costs in doing so. In such an event, the terms of the agreement allow the unaffiliated securities lending agent to use the collateral to purchase replacement securities on behalf of the Fund or pay the Fund the market value of the loaned securities. The Fund bears the risk of loss with respect to depreciation of its investment of the cash collateral.
Security transactions and income recognition
Securities transactions are recorded on a trade date basis. Realized gains or losses are recorded on the basis of identified cost.
Dividend income is recognized on the ex-dividend date. Income is recorded net of foreign taxes withheld where recovery of such taxes is not assured.
Distributions to shareholders
Distributions to shareholders from net investment income and any net realized gains are recorded on the ex-dividend date and paid at least annually. Such distributions are determined in accordance with income tax regulations and may differ from U.S. generally accepted accounting principles. Dividend sources are estimated at the time of declaration. The tax character of distributions is determined as of the Fund's fiscal year end. Therefore, a portion of the Fund's distributions made prior to the Fund’s fiscal year end may be categorized as a tax return of capital at year end.
Federal and other taxes
The Fund intends to continue to qualify as a regulated investment company by distributing substantially all of its investment company taxable income and any net realized capital gains (after reduction for capital loss carryforwards) sufficient to relieve it from all, or substantially all, federal income taxes. Accordingly, no provision for federal income taxes was required.
The Fund’s income and federal excise tax returns and all financial records supporting those returns for the prior three fiscal years are subject to examination by the federal and Delaware revenue authorities. Management has analyzed the Fund's tax positions taken on federal, state, and foreign tax returns for all open tax years and does not believe that there are any uncertain tax positions that require recognition of a tax liability.
As of March 31, 2021, the aggregate cost of all investments for federal income tax purposes was $2,037,195,358 and the unrealized gains (losses) consisted of:
| Gross unrealized gains | $1,280,629,005 |
| Gross unrealized losses | (62,002,698) |
| Net unrealized gains | $1,218,626,307 |
Class allocations
The separate classes of shares offered by the Fund differ principally in applicable sales charges, distribution, shareholder servicing, and administration fees. Class specific expenses are charged directly to that share class. Investment income, common fund-level expenses, and realized and unrealized gains (losses) on investments are allocated daily to each class of shares based on the relative proportion of net assets of each class.
22 | Wells Fargo Discovery Fund
Notes to financial statements (unaudited)
3. FAIR VALUATION MEASUREMENTS
Fair value measurements of investments are determined within a framework that has established a fair value hierarchy based upon the various data inputs utilized in determining the value of the Fund’s investments. The three-level hierarchy gives the highest priority to unadjusted quoted prices in active markets for identical assets or liabilities (Level 1) and the lowest priority to unobservable inputs (Level 3). The Fund’s investments are classified within the fair value hierarchy based on the lowest level of input that is significant to the fair value measurement. The inputs are summarized into three broad levels as follows:
| ■ | Level 1 – quoted prices in active markets for identical securities |
| ■ | Level 2 – other significant observable inputs (including quoted prices for similar securities, interest rates, prepayment speeds, credit risk, etc.) |
| ■ | Level 3 – significant unobservable inputs (including the Fund’s own assumptions in determining the fair value of investments) |
The inputs or methodologies used for valuing investments in securities are not necessarily an indication of the risk associated with investing in those securities.
The following is a summary of the inputs used in valuing the Fund’s assets and liabilities as of March 31, 2021:
| | Quoted prices
(Level 1) | Other significant
observable inputs
(Level 2) | Significant
unobservable inputs
(Level 3) | Total |
| Assets | | | | |
| Investments in: | | | | |
| Common stocks | | | | |
| Communication services | $ 98,582,686 | $0 | $0 | $ 98,582,686 |
| Consumer discretionary | 434,723,537 | 0 | 0 | 434,723,537 |
| Financials | 70,390,272 | 0 | 0 | 70,390,272 |
| Health care | 953,218,811 | 0 | 0 | 953,218,811 |
| Industrials | 509,718,212 | 0 | 0 | 509,718,212 |
| Information technology | 1,085,376,704 | 0 | 0 | 1,085,376,704 |
| Real estate | 47,019,868 | 0 | 0 | 47,019,868 |
| Short-term investments | | | | |
| Investment companies | 56,791,575 | 0 | 0 | 56,791,575 |
| Total assets | $3,255,821,665 | $0 | $0 | $3,255,821,665 |
Additional sector, industry or geographic detail, if any, is included in the Portfolio of Investments.
For the six months ended March 31, 2021, the Fund did not have any transfers into/out of Level 3.
4. TRANSACTIONS WITH AFFILIATES
Management fee
Funds Management, an indirect wholly owned subsidiary of Wells Fargo & Company ("Wells Fargo"), is the manager of the Fund and provides advisory and fund-level administrative services under an investment management agreement. Under the investment management agreement, Funds Management is responsible for, among other services, implementing the investment objectives and strategies of the Fund, supervising the subadviser and providing fund-level administrative services in connection with the Fund’s operations. As compensation for its services under the investment management agreement, Funds Management is entitled to receive a management fee at the following annual rate based on the Fund’s average daily net assets:
Wells Fargo Discovery Fund | 23
Notes to financial statements (unaudited)
| Average daily net assets | Management fee |
| First $500 million | 0.800% |
| Next $500 million | 0.750 |
| Next $1 billion | 0.700 |
| Next $2 billion | 0.675 |
| Next $1 billion | 0.650 |
| Next $5 billion | 0.640 |
| Over $10 billion | 0.630 |
For the six months ended March 31, 2021, the management fee was equivalent to an annual rate of 0.71% of the Fund’s average daily net assets.
Funds Management has retained the services of a subadviser to provide daily portfolio management to the Fund. The fee for subadvisory services is borne by Funds Management. Wells Capital Management Incorporated ("WellsCap"), an affiliate of Funds Management and an indirect wholly owned subsidiary of Wells Fargo, is the subadviser to the Fund and is entitled to receive a fee from Funds Management at an annual rate starting at 0.45% and declining to 0.35% as the average daily net assets of the Fund increase.
Administration fees
Under a class-level administration agreement, Funds Management provides class-level administrative services to the Fund, which includes paying fees and expenses for services provided by the transfer agent, sub-transfer agents, omnibus account servicers and record-keepers. As compensation for its services under the class-level administration agreement, Funds Management receives an annual fee which is calculated based on the average daily net assets of each class as follows:
| | Class-level
administration fee |
| Class A | 0.21% |
| Class C | 0.21 |
| Class R6 | 0.03 |
| Administrator Class | 0.13 |
| Institutional Class | 0.13 |
Waivers and/or expense reimbursements
Funds Management has contractually waived and/or reimbursed management and administration fees to the extent necessary to maintain certain net operating expense ratios for the Fund. When each class of the Fund has exceeded its expense cap, Funds Management has waived fees and/or reimbursed expenses from fund-level expenses on a proportionate basis and then from class specific expenses. When only certain classes exceed their expense caps, waivers and/or reimbursements are applied against class specific expenses before fund-level expenses. Funds Management has committed through January 31, 2022 to waive fees and/or reimburse expenses to the extent necessary to cap expenses. Prior to or after the commitment expiration date, the cap may be increased or the commitment to maintain the cap may be terminated only with the approval of the Board of Trustees. The contractual expense caps are as follows:
| | Expense ratio caps |
| Class A | 1.22% |
| Class C | 1.97 |
| Class R6 | 0.79 |
| Administrator Class | 1.14 |
| Institutional Class | 0.89 |
24 | Wells Fargo Discovery Fund
Notes to financial statements (unaudited)
Distribution fee
The Trust has adopted a distribution plan for Class C shares of the Fund pursuant to Rule 12b-1 under the 1940 Act. A distribution fee is charged charged to Class C shares and paid to Wells Fargo Funds Distributor, LLC (“Funds Distributor”), the principal underwriter, at an annual rate of 0.75% of the average daily net assets of Class C shares.
In addition, Funds Distributor is entitled to receive the front-end sales charge from the purchase of Class A shares and a contingent deferred sales charge on the redemption of certain Class A shares. Funds Distributor is also entitled to receive the contingent deferred sales charges from redemptions of Class C shares. For the six months ended March 31, 2021, Funds Distributor received $11,192 from the sale of Class A shares. No contingent deferred sales charges were incurred by Class A and Class C shares for the six months ended March 31, 2021.
Shareholder servicing fees
The Trust has entered into contracts with one or more shareholder servicing agents, whereby Class A, Class C, and Administrator Class of the Fund are charged a fee at an annual rate of 0.25% of the average daily net assets of each respective class. A portion of these total shareholder servicing fees were paid to affiliates of Wells Fargo.
Interfund transactions
The Fund may purchase or sell portfolio investment securities to certain other Wells Fargo affiliates pursuant to Rule 17a-7 under the 1940 Act and under procedures adopted by the Board of Trustees. The procedures have been designed to ensure that these interfund transactions, which do not incur broker commissions, are effected at current market prices.
5. INVESTMENT PORTFOLIO TRANSACTIONS
Purchases and sales of investments, excluding U.S. government obligations (if any) and short-term securities, for the six months ended March 31, 2021 were $925,217,068 and $895,614,260, respectively.
6. SECURITIES LENDING TRANSACTIONS
The Fund lends its securities through an unaffiliated securities lending agent and receives collateral in the form of cash or securities with a value at least equal to the value of the securities on loan. The value of the loaned securities is determined at the close of each business day and any increases or decreases in the required collateral are exchanged between the Fund and the counterparty on the next business day. Cash collateral received is invested in the Securities Lending Fund which seeks to provide a positive return compared to the daily Federal Funds Open Rate by investing in high-quality, U.S. dollar-denominated short-term money market instruments and is exempt from registration under Section 3(c)(7) of the 1940 Act. Securities Lending Fund is managed by Funds Management and is subadvised by WellsCap. Funds Management receives an advisory fee starting at 0.05% and declining to 0.01% as the average daily net assets of the Securities Lending Fund increase. All of the fees received by Funds Management are paid to WellsCap for its services as subadviser.
In the event of counterparty default or the failure of a borrower to return a loaned security, the Fund has the right to use the collateral to offset any losses incurred. As of March 31, 2021, the Fund had securities lending transactions with the following counterparties which are subject to offset:
| Counterparty | Value of
securities on
loan | Collateral
received1 | Net amount |
| Bank of America Securities Incorporated | $ 3,015,804 | $ (3,015,804) | 0 |
| Barclays Capital Incorporated | 1,899,986 | (1,899,986) | 0 |
| BNP Paribas Securities Corporation | 120,868 | (120,868) | 0 |
| Citigroup Global Markets Incorporated | 1,362,448 | (1,362,448) | 0 |
| Deutsche Bank Securities Incorporated | 256,476 | (256,476) | 0 |
| JPMorgan Securities LLC | 14,992,000 | (14,992,000) | 0 |
| Morgan Stanley & Company LLC | 12,968,040 | (12,968,040) | 0 |
1 Collateral received within this table is limited to the collateral for the net transaction with the counterparty.
7. BANK BORROWINGS
The Trust (excluding the money market funds), Wells Fargo Master Trust and Wells Fargo Variable Trust are parties to a $350,000,000 revolving credit agreement whereby the Fund is permitted to use bank borrowings for temporary or emergency
Wells Fargo Discovery Fund | 25
Notes to financial statements (unaudited)
purposes, such as to fund shareholder redemption requests. Interest under the credit agreement is charged to the Fund based on a borrowing rate equal to the higher of the Federal Funds rate in effect on that day plus 1.25% or the overnight LIBOR rate in effect on that day plus 1.25%. In addition, an annual commitment fee equal to 0.25% of the unused balance is allocated to each participating fund.
For the six months ended March 31, 2021, there were no borrowings by the Fund under the agreement.
8. CONCENTRATION RISKS
As of the end of the period, the Fund concentrated its portfolio of investments in the information technology and health care sectors. A fund that invests a substantial portion of its assets in any sector may be more affected by changes in that sector than would be a fund whose investments are not heavily weighted in any sector.
9. INDEMNIFICATION
Under the Fund's organizational documents, the officers and Trustees have been granted certain indemnification rights against certain liabilities that may arise out of performance of their duties to the Fund. The Fund has entered into a separate agreement with each Trustee that converts indemnification rights currently existing under the Fund’s organizational documents into contractual rights that cannot be changed in the future without the consent of the Trustee. Additionally, in the normal course of business, the Fund may enter into contracts with service providers that contain a variety of indemnification clauses. The Fund’s maximum exposure under these arrangements is dependent on future claims that may be made against the Fund and, therefore, cannot be estimated.
10. CORONAVIRUS (COVID-19) PANDEMIC
On March 11, 2020, the World Health Organization announced that it had made the assessment that coronavirus disease 2019 (“COVID-19”) is a pandemic. The impacts of COVID-19 are affecting the entire global economy, individual companies and investment products, the funds, and the market in general. There is significant uncertainty around the extent and duration of business disruptions related to COVID-19 and the impacts may last for an extended period of time. COVID-19 has led to significant uncertainty and volatility in the financial markets.
26 | Wells Fargo Discovery Fund
Other information (unaudited)
PROXY VOTING INFORMATION
A description of the policies and procedures used to determine how to vote proxies relating to portfolio securities is available without charge, upon request, by calling 1-800-222-8222, visiting our website at wfam.com, or visiting the SEC website at sec.gov. Information regarding how the proxies related to portfolio securities were voted during the most recent 12-month period ended June 30 is available on the website at wfam.com or by visiting the SEC website at sec.gov.
QUARTERLY PORTFOLIO HOLDINGS INFORMATION
The Fund files its complete schedule of portfolio holdings with the SEC for the first and third quarters of each fiscal year as an exhibit to its reports on Form N-PORT. Shareholders may view the filed Form N-PORT by visiting the SEC website at sec.gov.
Wells Fargo Discovery Fund | 27
Other information (unaudited)
BOARD OF TRUSTEES AND OFFICERS
Each of the Trustees and Officers listed in the table below acts in identical capacities for each fund in the Wells Fargo family of funds, which consists of 142 mutual funds comprising the Wells Fargo Funds Trust, Wells Fargo Variable Trust, Wells Fargo Master Trust and four closed-end funds (collectively the “Fund Complex”). This table should be read in conjunction with the Prospectus and the Statement of Additional Information1. The mailing address of each Trustee and Officer is 525 Market Street, 12th Floor, San Francisco, CA 94105. Each Trustee and Officer serves an indefinite term, however, each Trustee serves such term until reaching the mandatory retirement age established by the Trustees.
Independent Trustees
Name and
year of birth | Position held and
length of service* | Principal occupations during past five years or longer | Current other
public company or
investment
company
directorships |
William R. Ebsworth
(Born 1957) | Trustee,
since 2015 | Retired. From 1984 to 2013, equities analyst, portfolio manager, research director and chief investment officer at Fidelity Management and Research Company in Boston, Tokyo, and Hong Kong, and retired in 2013 as Chief Investment Officer of Fidelity Strategic Advisers, Inc. where he led a team of investment professionals managing client assets. Prior thereto, Board member of Hong Kong Securities Clearing Co., Hong Kong Options Clearing Corp., the Thailand International Fund, Ltd., Fidelity Investments Life Insurance Company, and Empire Fidelity Investments Life Insurance Company. Audit Committee Chair and Investment Committee Chair of the Vincent Memorial Hospital Endowment (non-profit organization). Mr. Ebsworth is a CFA® charterholder. | N/A |
Jane A. Freeman
(Born 1953) | Trustee,
since 2015;
Chair Liaison,
since 2018 | Retired. From 2012 to 2014 and 1999 to 2008, Chief Financial Officer of Scientific Learning Corporation. From 2008 to 2012, Ms. Freeman provided consulting services related to strategic business projects. Prior to 1999, Portfolio Manager at Rockefeller & Co. and Scudder, Stevens & Clark. Board member of the Harding Loevner Funds from 1996 to 2014, serving as both Lead Independent Director and chair of the Audit Committee. Board member of the Russell Exchange Traded Funds Trust from 2011 to 2012 and the chair of the Audit Committee. Ms. Freeman is also an inactive Chartered Financial Analyst. | N/A |
Isaiah Harris, Jr.
(Born 1952) | Trustee,
since 2009; Audit
Committee
Chair,
since 2019 | Retired. Chairman of the Board of CIGNA Corporation since 2009, and Director since 2005. From 2003 to 2011, Director of Deluxe Corporation. Prior thereto, President and CEO of BellSouth Advertising and Publishing Corp. from 2005 to 2007, President and CEO of BellSouth Enterprises from 2004 to 2005 and President of BellSouth Consumer Services from 2000 to 2003. Emeritus member of the Iowa State University Foundation Board of Governors. Emeritus Member of the Advisory Board of Iowa State University School of Business. Advisory Board Member, Palm Harbor Academy (private school). Mr. Harris is a certified public accountant (inactive status). | CIGNA Corporation |
Judith M. Johnson
(Born 1949) | Trustee,
since 2008 | Retired. Prior thereto, Chief Executive Officer and Chief Investment Officer of Minneapolis Employees Retirement Fund from 1996 to 2008. Ms. Johnson is an attorney, certified public accountant and a certified managerial accountant. | N/A |
David F. Larcker
(Born 1950) | Trustee,
since 2009 | James Irvin Miller Professor of Accounting at the Graduate School of Business (Emeritus), Stanford University, Director of the Corporate Governance Research Initiative and Senior Faculty of The Rock Center for Corporate Governance since 2006. From 2005 to 2008, Professor of Accounting at the Graduate School of Business, Stanford University. Prior thereto, Ernst & Young Professor of Accounting at The Wharton School, University of Pennsylvania from 1985 to 2005. | N/A |
28 | Wells Fargo Discovery Fund
Other information (unaudited)
Name and
year of birth | Position held and
length of service* | Principal occupations during past five years or longer | Current other
public company or
investment
company
directorships |
Olivia S. Mitchell
(Born 1953) | Trustee,
since 2006;
Nominating and
Governance
Committee Chair,
since 2018 | International Foundation of Employee Benefit Plans Professor, Wharton School of the University of Pennsylvania since 1993. Director of Wharton’s Pension Research Council and Boettner Center on Pensions & Retirement Research, and Research Associate at the National Bureau of Economic Research. Previously, Cornell University Professor from 1978 to 1993. | N/A |
Timothy J. Penny
(Born 1951) | Trustee,
since 1996;
Chair,
since 2018 | President and Chief Executive Officer of Southern Minnesota Initiative Foundation, a non-profit organization, since 2007. Member of the Board of Trustees of NorthStar Education Finance, Inc., a non-profit organization, since 2007. | N/A |
James G. Polisson
(Born 1959) | Trustee,
since 2018 | Retired. Chief Marketing Officer, Source (ETF) UK Services, Ltd, from 2015 to 2017. From 2012 to 2015, Principal of The Polisson Group, LLC, a management consulting, corporate advisory and principal investing company. Chief Executive Officer and Managing Director at Russell Investments, Global Exchange Traded Funds from 2010 to 2012. Managing Director of Barclays Global Investors from 1998 to 2010 and Global Chief Marketing Officer for iShares and Barclays Global Investors from 2000 to 2010. Trustee of the San Francisco Mechanics’ Institute, a non-profit organization, from 2013 to 2015. Board member of the Russell Exchange Traded Fund Trust from 2011 to 2012. Director of Barclays Global Investors Holdings Deutschland GmbH from 2006 to 2009. Mr. Polisson is an attorney and has a retired status with the Massachusetts and District of Columbia Bar Associations. | N/A |
Pamela Wheelock
(Born 1959) | Trustee,
since January
2020; previously
Trustee from
January 2018 to
July 2019 | Board member of the Destination Medical Center Economic Development Agency, Rochester, Minnesota since 2019. Interim President of the McKnight Foundation from January to September 2020. Acting Commissioner, Minnesota Department of Human Services, July 2019 through September 2019. Human Services Manager (part-time), Minnesota Department of Human Services, October 2019 through December 2019. Chief Operating Officer, Twin Cities Habitat for Humanity from 2017 to 2019. Vice President of University Services, University of Minnesota from 2012 to 2016. Prior thereto, on the Board of Directors, Governance Committee and Finance Committee for the Minnesota Philanthropy Partners (Saint Paul Foundation) from 2012 to 2018, Interim Chief Executive Officer of Blue Cross Blue Shield of Minnesota from 2011 to 2012, Chairman of the Board from 2009 to 2012 and Board Director from 2003 to 2015. Vice President, Leadership and Community Engagement, Bush Foundation, Saint Paul, Minnesota (a private foundation) from 2009 to 2011. Executive Vice President and Chief Financial Officer, Minnesota Sports and Entertainment from 2004 to 2009 and Senior Vice President from 2002 to 2004. Executive Vice President of the Minnesota Wild Foundation from 2004 to 2008. Commissioner of Finance, State of Minnesota, from 1999 to 2002. Currently Board Chair of the Minnesota Wild Foundation since 2010. | N/A |
* Length of service dates reflect the Trustee’s commencement of service with the Trust’s predecessor entities, where applicable.
Wells Fargo Discovery Fund | 29
Other information (unaudited)
Officers
Name and
year of birth | Position held and
length of service | Principal occupations during past five years or longer |
Andrew Owen
(Born 1960) | President,
since 2017 | Executive Vice President of Wells Fargo & Company and Head of Affiliated Managers, Wells Fargo Asset Management, since 2014. In addition, Mr. Owen is currently President, Chief Executive Officer and Director of Wells Fargo Funds Management, LLC since 2017. Prior thereto, Executive Vice President responsible for marketing, investments and product development for Wells Fargo Funds Management, LLC, from 2009 to 2014. |
Jeremy DePalma
(Born 1974) | Treasurer,
since 2012
(for certain funds in
the Fund Complex);
since 2021 (for
the remaining funds in the
Fund Complex) | Senior Vice President of Wells Fargo Funds Management, LLC since 2009. Senior Vice President of Evergreen Investment Management Company, LLC from 2008 to 2010 and head of the Fund Reporting and Control Team within Fund Administration from 2005 to 2010. |
Michelle Rhee
(Born 1966) | Chief Legal Officer,
since 2019 | Secretary of Wells Fargo Funds Management, LLC and Chief Legal Counsel of Wells Fargo Asset Management since 2018. Deputy General Counsel of Wells Fargo Bank, N.A. since 2020 and Assistant General Counsel of Wells Fargo Bank, N.A. from 2018 to 2020. Associate General Counsel and Managing Director of Bank of America Corporation from 2004 to 2018. |
Catherine Kennedy
(Born 1969) | Secretary,
since 2019 | Vice President of Wells Fargo Funds Management, LLC and Senior Counsel of the Wells Fargo Legal Department since 2010. Vice President and Senior Counsel of Evergreen Investment Management Company, LLC from 1998 to 2010. |
Michael H. Whitaker
(Born 1967) | Chief Compliance Officer,
since 2016 | Chief Compliance Officer of Wells Fargo Asset Management since 2016. Senior Vice President and Chief Compliance Officer for Fidelity Investments from 2007 to 2016. |
1 The Statement of Additional Information includes additional information about the Trustees and is available, without charge, upon request, by calling 1-800-222-8222 or by visiting the website at wfam.com.
30 | Wells Fargo Discovery Fund
For more information
More information about Wells Fargo Funds is available free upon request. To obtain literature, please write, visit the Fund's website, or call:
Wells Fargo Funds
P.O. Box 219967
Kansas City, MO 64121-9967
Website: wfam.com
Individual investors: 1-800-222-8222
Retail investment professionals: 1-888-877-9275
Institutional investment professionals: 1-866-765-0778
This report and the financial statements contained herein are submitted for the general information of the shareholders of the Fund. If this report is used for promotional purposes, distribution of the report must be accompanied or preceded by a current prospectus. Before investing, please consider the investment objectives, risks, charges, and expenses of the investment. For a current prospectus and, if available, a summary prospectus, containing this information, call 1-800-222-8222 or visit the Fund's website at wfam.com. Read the prospectus carefully before you invest or send money.
Wells Fargo Asset Management (WFAM) is the trade name for certain investment advisory/management firms owned by Wells Fargo & Company. These firms include but are not limited to Wells Capital Management Incorporated and Wells Fargo Funds Management, LLC. Certain products managed by WFAM entities are distributed by Wells Fargo Funds Distributor, LLC (a broker-dealer and Member FINRA).
This material is for general informational and educational purposes only and is NOT intended to provide investment advice or a recommendation of any kind - including a recommendation for any specific investment, strategy, or plan.
INVESTMENT PRODUCTS: NOT FDIC INSURED ■ NO BANK GUARANTEE ■ MAY LOSE VALUE
© 2021 Wells Fargo & Company. All rights reserved.
PAR-0421-00295 05-21
SA230/SAR230 03-21
Semi-Annual Report
March 31, 2021
Wells Fargo Enterprise Fund
Reduce clutter.
Save trees.
Sign up for electronic delivery of prospectuses and shareholder reports at wellsfargo.com/ advantagedelivery
The views expressed and any forward-looking statements are as of March 31, 2021, unless otherwise noted, and are those of the Fund's portfolio managers and/or Wells Fargo Asset Management. Discussions of individual securities or the markets generally are not intended as individual recommendations. Future events or results may vary significantly from those expressed in any forward-looking statements. The views expressed are subject to change at any time in response to changing circumstances in the market. Wells Fargo Asset Management and the Fund disclaim any obligation to publicly update or revise any views expressed or forward-looking statements.
INVESTMENT PRODUCTS: NOT FDIC INSURED ■ NO BANK GUARANTEE ■ MAY LOSE VALUE
Wells Fargo Enterprise Fund | 1
Letter to shareholders (unaudited)
Andrew Owen
President
Wells Fargo Funds
Dear Shareholder:
We are pleased to offer you this semi-annual report for the Wells Fargo Enterprise Fund for the six-month period that ended March 31, 2021. Despite a deeply challenging year, dominated by the spread of COVID-19 cases and a sharp drop in economic output throughout much of the world, global stocks performed extremely well, benefiting from ongoing central bank support and rising optimism over the development and distribution of effective COVID-19 vaccines. Bonds also had positive returns, led by global bonds and high-yield bonds.
For the six-month period, U.S. stocks, based on the S&P 500 Index,1 gained 19.07%. International stocks, as measured by the MSCI ACWI ex USA Index (Net),2 returned 21.10%, while the MSCI EM Index (Net),3 had even stronger performance, with a 22.43% gain. Among bond indexes, the Bloomberg Barclays U.S. Aggregate Bond Index,4 returned -2.73%, the Bloomberg Barclays Global Aggregate ex-USD Index (unhedged),5 returned -0.47%, and the Bloomberg Barclays Municipal Bond Index,6 returned 1.46% while the ICE BofA U.S. High Yield Index,7 gained 7.44%.
Hope drove the stock markets to new highs.
In October, capital markets stepped back from their six-month rally. Market volatility rose in advance of the U.S. election and amid a global increase in COVID-19 infections. Europe introduced tighter restrictions affecting economic activity. U.S. markets looked favorably at the prospect of Democratic control of the federal purse strings, which could lead to additional fiscal stimulus and a boost to economic activity. Meanwhile, China reported 4.9% third-quarter gross domestic product growth.
Global stocks rallied in November, propelled by optimism over three promising COVID-19 vaccines. Reversing recent trends, value stocks outperformed growth stocks and cyclical stocks outpaced information technology (IT) stocks. However, U.S. unemployment remained elevated, with a net job loss of 10 million since February. The eurozone services purchasing managers’ index contracted sharply while the region’s manufacturing activity grew. The U.S. election results added to the upbeat mood as investors anticipated more consistent policies in the new administration.
“Global stocks rallied in November, propelled by optimism over three promising COVID-19 vaccines.”
| 1 | The S&P 500 Index consists of 500 stocks chosen for market size, liquidity, and industry group representation. It is a market-value-weighted index with each stock's weight in the index proportionate to its market value. You cannot invest directly in an index. |
| 2 | The Morgan Stanley Capital International (MSCI) All Country World Index (ACWI) ex USA Index (Net) is a free-float-adjusted market-capitalization-weighted index that is designed to measure the equity market performance of developed and emerging markets, excluding the United States. Source: MSCI. MSCI makes no express or implied warranties or representations and shall have no liability whatsoever with respect to any MSCI data contained herein. The MSCI data may not be further redistributed or used as a basis for other indices or any securities or financial products. This report is not approved, reviewed, or produced by MSCI. You cannot invest directly in an index. |
| 1 | The S&P 500 Index consists of 500 stocks chosen for market size, liquidity, and industry group representation. It is a market-value-weighted index with each stock's weight in the index proportionate to its market value. You cannot invest directly in an index. |
| 3 | The MSCI Emerging Markets (EM) Index (Net) is a free-float-adjusted market-capitalization-weighted index that is designed to measure equity market performance of emerging markets. You cannot invest directly in an index. |
| 1 | The S&P 500 Index consists of 500 stocks chosen for market size, liquidity, and industry group representation. It is a market-value-weighted index with each stock's weight in the index proportionate to its market value. You cannot invest directly in an index. |
| 4 | The Bloomberg Barclays U.S. Aggregate Bond Index is a broad-based benchmark that measures the investment-grade, U.S. dollar-denominated, fixed-rate taxable bond market, including Treasuries, government-related and corporate securities, mortgage-backed securities (agency fixed-rate and hybrid adjustable-rate mortgage pass-throughs), asset-backed securities, and commercial mortgage-backed securities. You cannot invest directly in an index. |
| 1 | The S&P 500 Index consists of 500 stocks chosen for market size, liquidity, and industry group representation. It is a market-value-weighted index with each stock's weight in the index proportionate to its market value. You cannot invest directly in an index. |
| 5 | The Bloomberg Barclays Global Aggregate ex-USD Index (unhedged) is an unmanaged index that provides a broad-based measure of the global investment-grade fixed-income markets excluding the U.S. dollar-denominated debt market. You cannot invest directly in an index. |
| 1 | The S&P 500 Index consists of 500 stocks chosen for market size, liquidity, and industry group representation. It is a market-value-weighted index with each stock's weight in the index proportionate to its market value. You cannot invest directly in an index. |
| 6 | The Bloomberg Barclays Municipal Bond Index is an unmanaged index composed of long-term tax-exempt bonds with a minimum credit rating of Baa. You cannot invest directly in an index. |
| 1 | The S&P 500 Index consists of 500 stocks chosen for market size, liquidity, and industry group representation. It is a market-value-weighted index with each stock's weight in the index proportionate to its market value. You cannot invest directly in an index. |
| 7 | The ICE BofA U.S. High Yield Index is a market-capitalization-weighted index of domestic and Yankee high-yield bonds. The index tracks the performance of high-yield securities traded in the U.S. bond market. You cannot invest directly in an index. Copyright 2021. ICE Data Indices, LLC. All rights reserved. |
2 | Wells Fargo Enterprise Fund
Letter to shareholders (unaudited)
Financial markets ended the year with strength on high expectations for a rapid rollout of the COVID-19 vaccines, the successful passage of a $900 billion stimulus package, and rising expectations of additional economic support from a Democratic-led Congress. U.S. economic data were mixed with still-elevated unemployment and weak retail sales but growth in manufacturing output. In contrast, China’s economic expansion continued in both manufacturing and nonmanufacturing. U.S. COVID-19 infection rates continued to rise even as new state and local lockdown measures were implemented.
The year 2021 began with emerging market stocks leading all major asset classes in January, driven by China’s strong economic growth and a broad recovery in corporate earnings, which propelled China’s stock market higher. In the U.S., positive news on vaccine trials and January's expansion in both the manufacturing and services sectors were offset by a weak December monthly jobs report. This was compounded by technical factors as some hedge funds were forced to sell stocks to protect themselves against a well-publicized short squeeze coordinated by a group of retail investors. Eurozone sentiment and economic growth were particularly weak, reflecting the impact of a new lockdown with stricter social distancing along with a slow vaccine rollout.
February saw major domestic equity indexes driven higher on the hope of a new stimulus bill, improving COVID-19 vaccination numbers, and the gradual reopening of the economy. Most S&P 500 companies reported better-than-expected earnings, with positive surprises coming from the financials, IT, health care, and materials sectors. Japan saw its economy strengthen as a result of strong export numbers. Meanwhile, crude-oil prices continued their climb, rising more than 25% for the year. Domestic government bonds experienced a sharp sell-off in late February as markets priced in a more robust economic recovery and higher future growth and inflation expectations.
The passage of the massive domestic stimulus bill highlighted March activity, leading to increased forecasts for U.S. growth in 2021. Domestic employment surged as COVID-19 vaccinations and an increasingly open economy spurred hiring. A majority of U.S. small companies reported they are operating at pre-pandemic capacity or higher. Value continued its outperformance of growth in the month, continuing the trend that started in late 2020. Meanwhile, most major developed global equity indexes are up month to date on the back of rising optimism regarding the outlook for global growth. While the U.S. and the U.K. have been the most successful in terms of the vaccine rollout, even within markets where the vaccine has lagged, such as the eurozone and Japan, equity indexes in many of those countries are also in positive territory this year.
Don’t let short-term uncertainty derail long-term investment goals.
Periods of investment uncertainty can present challenges, but experience has taught us that maintaining long-term investment goals can be an effective way to plan for the future. To help you create a sound strategy based on your personal goals and risk tolerance, Wells Fargo Funds offers more than 100 mutual funds spanning a wide range of asset classes and investment styles. Although diversification cannot guarantee an investment profit or prevent losses, we believe it can be an effective way to manage investment risk and potentially smooth out overall portfolio performance. We encourage investors to know their investments and to understand that appropriate levels of risk-taking may unlock opportunities.
Thank you for choosing to invest with Wells Fargo Funds. We appreciate your confidence in us and remain committed to helping you meet your financial needs.
Sincerely,
Andrew Owen
President
Wells Fargo Funds
“The passage of the massive domestic stimulus bill highlighted March activity, leading to increased forecasts for U.S. growth in 2021.”
For further information about your Fund, contact your investment professional, visit our website at wfam.com, or call us directly at 1-800-222-8222.
Wells Fargo Enterprise Fund | 3
Performance highlights (unaudited)
| Investment objective | The Fund seeks long-term capital appreciation. |
| Manager | Wells Fargo Funds Management, LLC |
| Subadviser | Wells Capital Management Incorporated |
| Portfolio managers | Michael T. Smith, CFA®‡, Christopher J. Warner, CFA®‡ |
| Average annual total returns (%) as of March 31, 2021 |
| | | Including sales charge | | Excluding sales charge | | Expense ratios1 (%) |
| | Inception date | 1 year | 5 year | 10 year | | 1 year | 5 year | 10 year | | Gross | Net 2 |
| Class A (SENAX) | 2-24-2000 | 72.00 | 21.49 | 13.75 | | 82.50 | 22.94 | 14.43 | | 1.24 | 1.18 |
| Class C (WENCX) | 3-31-2008 | 80.13 | 22.01 | 13.58 | | 81.13 | 22.01 | 13.58 | | 1.99 | 1.93 |
| Class R6 (WENRX)3 | 10-31-2014 | – | – | – | | 83.21 | 23.40 | 14.85 | | 0.81 | 0.80 |
| Administrator Class (SEPKX) | 8-30-2002 | – | – | – | | 82.63 | 23.03 | 14.54 | | 1.16 | 1.10 |
| Institutional Class (WFEIX) | 6-30-2003 | – | – | – | | 83.09 | 23.34 | 14.81 | | 0.91 | 0.85 |
| Russell Midcap® Growth Index4 | – | – | – | – | | 68.61 | 18.39 | 14.11 | | – | – |
Figures quoted represent past performance, which is no guarantee of future results, and do not reflect taxes that a shareholder may pay on an investment in a fund. Investment return and principal value of an investment will fluctuate so that an investor’s shares, when redeemed, may be worth more or less than their original cost. Performance shown without sales charges would be lower if sales charges were reflected. Current performance may be lower or higher than the performance data quoted, which assumes the reinvestment of dividends and capital gains. Current month-end performance is available on the Fund’s website, wfam.com.
Please keep in mind that high double-digit returns were primarily achieved during favorable market conditions. You should not expect that such favorable returns can be consistently achieved. A fund’s performance, especially for short time periods, should not be the sole factor in making your investment decision.
Index returns do not include transaction costs associated with buying and selling securities, any mutual fund fees or expenses, or any taxes. It is not possible to invest directly in an index.
For Class A shares, the maximum front-end sales charge is 5.75%. For Class C shares, the maximum contingent deferred sales charge is 1.00%. Performance including a contingent deferred sales charge assumes the sales charge for the corresponding time period. Class R6, Administrator Class, and Institutional Class shares are sold without a front-end sales charge or contingent deferred sales charge.
| 1 | Reflects the expense ratios as stated in the most recent prospectuses. The expense ratios shown are subject to change and may differ from the annualized expense ratios shown in the financial highlights of this report. |
| 2 | The manager has contractually committed through January 31, 2022, to waive fees and/or reimburse expenses to the extent necessary to cap total annual fund operating expenses after fee waivers at 1.18% for Class A, 1.93% for Class C, 0.80% for Class R6, 1.10% for Administrator Class, and 0.85% for Institutional Class. Brokerage commissions, stamp duty fees, interest, taxes, acquired fund fees and expenses (if any), and extraordinary expenses are excluded from the expense caps. Prior to or after the commitment expiration date, the caps may be increased or the commitment to maintain the caps may be terminated only with the approval of the Board of Trustees. Without these caps, the Fund’s returns would have been lower. The expense ratio paid by an investor is the net expense ratio (the total annual fund operating expenses after fee waivers) as stated in the prospectuses. |
| 3 | Historical performance shown for the Class R6 shares prior to their inception reflects the performance of the Institutional Class shares, and includes the higher expenses applicable to the Institutional Class shares. If these expenses had not been included, returns for the Class R6 shares would be higher. |
| 4 | The Russell Midcap® Growth Index measures the performance of those Russell Midcap companies with higher price/book ratios and higher forecasted growth values. The stocks are also members of the Russell 1000® Growth index. You cannot invest directly in an index. |
Stock values fluctuate in response to the activities of individual companies and general market and economic conditions. Smaller-company stocks tend to be more volatile and less liquid than those of larger companies. The use of derivatives may reduce returns and/or increase volatility. Consult the Fund’s prospectus for additional information on these and other risks.
| ‡ | CFA® and Chartered Financial Analyst® are trademarks owned by CFA Institute. |
4 | Wells Fargo Enterprise Fund
Performance highlights (unaudited)
| Ten largest holdings (%) as of March 31, 20211 |
| Twilio Incorporated Class A | 3.47 |
| Align Technology Incorporated | 3.33 |
| Cadence Design Systems Incorporated | 3.10 |
| Chipotle Mexican Grill Incorporated | 3.01 |
| MercadoLibre Incorporated | 2.80 |
| EPAM Systems Incorporated | 2.61 |
| Crowdstrike Holdings Incorporated Class A | 2.50 |
| Veeva Systems Incorporated Class A | 2.41 |
| Pinterest Incorporated Class A | 2.36 |
| Generac Holdings Incorporated | 2.33 |
| 1 | Figures represent the percentage of the Fund's net assets. Holdings are subject to change and may have changed since the date specified. |
| Sector allocation as of March 31, 20211 |
| 1 | Figures represent the percentage of the Fund's long-term investments. These amounts are subject to change and may have changed since the date specified. |
Wells Fargo Enterprise Fund | 5
Fund expenses (unaudited)
As a shareholder of the Fund, you incur two types of costs: (1) transaction costs, including sales charges (loads) on purchase payments and contingent deferred sales charges (if any) on redemptions and (2) ongoing costs, including management fees, distribution (12b-1) and/or shareholder servicing fees, and other Fund expenses. This example is intended to help you understand your ongoing costs (in dollars) of investing in the Fund and to compare these costs with the ongoing costs of investing in other mutual funds.
The example is based on an investment of $1,000 invested at the beginning of the six-month period and held for the entire period from October 1, 2020 to March 31, 2021.
Actual expenses
The “Actual” line of the table below provides information about actual account values and actual expenses. You may use the information in this line, together with the amount you invested, to estimate the expenses that you paid over the period. Simply divide your account value by $1,000 (for example, an $8,600 account value divided by $1,000 = 8.6), then multiply the result by the number in the “Actual” line under the heading entitled “Expenses paid during period” for your applicable class of shares to estimate the expenses you paid on your account during this period.
Hypothetical example for comparison purposes
The “Hypothetical” line of the table below provides information about hypothetical account values and hypothetical expenses based on the Fund’s actual expense ratio and an assumed rate of return of 5% per year before expenses, which is not the Fund’s actual return. The hypothetical account values and expenses may not be used to estimate the actual ending account balance or expenses you paid for the period. You may use this information to compare the ongoing costs of investing in the Fund and other funds. To do so, compare this 5% hypothetical example with the 5% hypothetical examples that appear in the shareholder reports of the other funds.
Please note that the expenses shown in the table are meant to highlight your ongoing costs only and do not reflect any transactional costs, such as sales charges (loads) and contingent deferred sales charges. Therefore, the “Hypothetical” line of the table is useful in comparing ongoing costs only and will not help you determine the relative total costs of owning different funds. In addition, if these transactional costs were included, your costs would have been higher.
| | Beginning
account value
10-1-2020 | Ending
account value
3-31-2021 | Expenses
paid during
the period1 | Annualized net
expense ratio |
| Class A | | | | |
| Actual | $1,000.00 | $1,173.01 | $ 6.34 | 1.17% |
| Hypothetical (5% return before expenses) | $1,000.00 | $1,019.10 | $ 5.89 | 1.17% |
| Class C | | | | |
| Actual | $1,000.00 | $1,168.60 | $10.43 | 1.93% |
| Hypothetical (5% return before expenses) | $1,000.00 | $1,015.31 | $ 9.70 | 1.93% |
| Class R6 | | | | |
| Actual | $1,000.00 | $1,175.30 | $ 4.23 | 0.78% |
| Hypothetical (5% return before expenses) | $1,000.00 | $1,021.04 | $ 3.93 | 0.78% |
| Administrator Class | | | | |
| Actual | $1,000.00 | $1,173.47 | $ 5.96 | 1.10% |
| Hypothetical (5% return before expenses) | $1,000.00 | $1,019.45 | $ 5.54 | 1.10% |
| Institutional Class | | | | |
| Actual | $1,000.00 | $1,174.72 | $ 4.61 | 0.85% |
| Hypothetical (5% return before expenses) | $1,000.00 | $1,020.69 | $ 4.28 | 0.85% |
1 Expenses paid is equal to the annualized net expense ratio of each class multiplied by the average account value over the period, multiplied by the number of days in the most recent fiscal half-year divided by the number of days in the fiscal year (to reflect the one-half-year period).
6 | Wells Fargo Enterprise Fund
Portfolio of investments—March 31, 2021 (unaudited)
| | | | | Shares | Value |
| Common stocks: 99.94% | | | | | |
| Communication services: 8.53% | | | | | |
| Entertainment: 4.05% | | | | | |
| Roku Incorporated † | | | | 70,800 | $ 23,064,516 |
| Spotify Technology † | | | | 79,800 | 21,382,410 |
| | | | | | 44,446,926 |
| Interactive media & services: 4.48% | | | | | |
| Bumble Incorporated Class A † | | | | 14,591 | 910,187 |
| Match Group Incorporated † | | | | 163,158 | 22,414,646 |
| Pinterest Incorporated Class A † | | | | 349,700 | 25,888,291 |
| | | | | | 49,213,124 |
| Consumer discretionary: 15.60% | | | | | |
| Automobiles: 1.38% | | | | | |
| Ferrari NV | | | | 72,241 | 15,118,596 |
| Hotels, restaurants & leisure: 4.56% | | | | | |
| Chipotle Mexican Grill Incorporated † | | | | 23,235 | 33,012,753 |
| Domino's Pizza Incorporated | | | | 46,400 | 17,065,456 |
| | | | | | 50,078,209 |
| Internet & direct marketing retail: 4.31% | | | | | |
| Chewy Incorporated Class A † | | | | 195,348 | 16,547,929 |
| MercadoLibre Incorporated † | | | | 20,904 | 30,773,615 |
| | | | | | 47,321,544 |
| Leisure products: 2.15% | | | | | |
| Callaway Golf Company | | | | 493,800 | 13,209,150 |
| Peloton Interactive Incorporated Class A † | | | | 92,600 | 10,411,944 |
| | | | | | 23,621,094 |
| Specialty retail: 1.25% | | | | | |
| Carvana Company † | | | | 52,000 | 13,644,800 |
| Textiles, apparel & luxury goods: 1.95% | | | | | |
| lululemon athletica Incorporated † | | | | 69,700 | 21,377,687 |
| Financials: 1.91% | | | | | |
| Capital markets: 1.91% | | | | | |
| MarketAxess Holdings Incorporated | | | | 42,000 | 20,912,640 |
| Health care: 19.36% | | | | | |
| Biotechnology: 2.26% | | | | | |
| Natera Incorporated † | | | | 108,200 | 10,986,628 |
| Turning Point Therapeutics Incorporated † | | | | 67,000 | 6,337,530 |
| Zai Lab Limited ADR † | | | | 56,300 | 7,512,109 |
| | | | | | 24,836,267 |
| Health care equipment & supplies: 8.81% | | | | | |
| ABIOMED Incorporated † | | | | 56,275 | 17,936,528 |
| Align Technology Incorporated † | | | | 67,410 | 36,504,537 |
| DexCom Incorporated † | | | | 45,577 | 16,379,918 |
The accompanying notes are an integral part of these financial statements.
Wells Fargo Enterprise Fund | 7
Portfolio of investments—March 31, 2021 (unaudited)
| | | | | Shares | Value |
| Health care equipment & supplies (continued) | | | | | |
| Insulet Corporation † | | | | 80,639 | $ 21,040,328 |
| iRhythm Technologies Incorporated † | | | | 34,800 | 4,832,328 |
| | | | | | 96,693,639 |
| Health care providers & services: 2.82% | | | | | |
| Chemed Corporation | | | | 28,382 | 13,050,611 |
| Guardant Health Incorporated † | | | | 117,000 | 17,860,050 |
| | | | | | 30,910,661 |
| Health care technology: 2.41% | | | | | |
| Veeva Systems Incorporated Class A † | | | | 101,305 | 26,464,918 |
| Life sciences tools & services: 3.06% | | | | | |
| 10x Genomics Incorporated Class A † | | | | 104,600 | 18,932,600 |
| Bio-Rad Laboratories Incorporated Class A † | | | | 25,686 | 14,671,073 |
| | | | | | 33,603,673 |
| Industrials: 13.31% | | | | | |
| Aerospace & defense: 1.78% | | | | | |
| Teledyne Technologies Incorporated † | | | | 47,300 | 19,565,645 |
| Commercial services & supplies: 2.92% | | | | | |
| IAA Incorporated † | | | | 205,540 | 11,333,476 |
| Waste Connections Incorporated | | | | 191,812 | 20,711,860 |
| | | | | | 32,045,336 |
| Electrical equipment: 2.33% | | | | | |
| Generac Holdings Incorporated † | | | | 78,100 | 25,573,845 |
| Professional services: 3.32% | | | | | |
| Clarivate plc † | | | | 581,333 | 15,341,378 |
| Equifax Incorporated | | | | 116,700 | 21,137,871 |
| | | | | | 36,479,249 |
| Road & rail: 1.54% | | | | | |
| Saia Incorporated † | | | | 73,041 | 16,841,794 |
| Trading companies & distributors: 1.42% | | | | | |
| SiteOne Landscape Supply Incorporated † | | | | 91,300 | 15,588,562 |
| Information technology: 41.23% | | | | | |
| Electronic equipment, instruments & components: 2.28% | | | | | |
| Zebra Technologies Corporation Class A † | | | | 51,468 | 24,971,244 |
| IT services: 19.75% | | | | | |
| Adyen NV ADR † | | | | 280,000 | 12,524,400 |
| Black Knight Incorporated † | | | | 231,007 | 17,092,208 |
| EPAM Systems Incorporated † | | | | 72,165 | 28,627,134 |
| Euronet Worldwide Incorporated † | | | | 104,400 | 14,438,520 |
| Fiserv Incorporated † | | | | 122,600 | 14,594,304 |
| MongoDB Incorporated † | | | | 72,802 | 19,469,439 |
| Paysafe Limited † | | | | 1,047,000 | 14,134,500 |
| Square Incorporated Class A † | | | | 91,390 | 20,750,100 |
| StoneCo Limited Class A † | | | | 348,283 | 21,321,885 |
The accompanying notes are an integral part of these financial statements.
8 | Wells Fargo Enterprise Fund
Portfolio of investments—March 31, 2021 (unaudited)
| | | | | Shares | Value |
| IT services (continued) | | | | | |
| Twilio Incorporated Class A † | | | | 111,710 | $ 38,066,300 |
| WEX Incorporated † | | | | 75,000 | 15,691,500 |
| | | | | | 216,710,290 |
| Semiconductors & semiconductor equipment: 4.69% | | | | | |
| Advanced Micro Devices Incorporated † | | | | 248,640 | 19,518,240 |
| Micron Technology Incorporated † | | | | 220,847 | 19,480,914 |
| Universal Display Corporation | | | | 52,800 | 12,501,456 |
| | | | | | 51,500,610 |
| Software: 14.51% | | | | | |
| Atlassian Corporation plc Class A † | | | | 95,134 | 20,050,442 |
| Autodesk Incorporated † | | | | 45,612 | 12,641,366 |
| Avalara Incorporated † | | | | 120,100 | 16,024,943 |
| Cadence Design Systems Incorporated † | | | | 248,316 | 34,016,809 |
| Crowdstrike Holdings Incorporated Class A † | | | | 150,583 | 27,482,903 |
| Datadog Incorporated Class A † | | | | 239,900 | 19,993,266 |
| Five9 Incorporated † | | | | 108,100 | 16,899,273 |
| Unity Software Incorporated †« | | | | 121,371 | 12,174,725 |
| | | | | | 159,283,727 |
| Total Common stocks (Cost $661,299,208) | | | | | 1,096,804,080 |
| | | Yield | | | |
| Short-term investments: 0.78% | | | | | |
| Investment companies: 0.78% | | | | | |
| Securities Lending Cash Investments LLC ♠∩∞ | | 0.04% | | 5,749,200 | 5,749,200 |
| Wells Fargo Government Money Market Fund Select Class ♠∞ | | 0.03 | | 2,857,533 | 2,857,533 |
| Total Short-term investments (Cost $8,606,733) | | | | | 8,606,733 |
| Total investments in securities (Cost $669,905,941) | 100.72% | | | | 1,105,410,813 |
| Other assets and liabilities, net | (0.72) | | | | (7,941,533) |
| Total net assets | 100.00% | | | | $1,097,469,280 |
| † | Non-income-earning security |
| « | All or a portion of this security is on loan. |
| ♠ | The issuer of the security is an affiliated person of the Fund as defined in the Investment Company Act of 1940. |
| ∩ | The investment is a non-registered investment company purchased with cash collateral received from securities on loan. |
| ∞ | The rate represents the 7-day annualized yield at period end. |
| Abbreviations: |
| ADR | American depositary receipt |
The accompanying notes are an integral part of these financial statements.
Wells Fargo Enterprise Fund | 9
Portfolio of investments—March 31, 2021 (unaudited)
Investments in affiliates
An affiliated investment is an investment in which the Fund owns at least 5% of the outstanding voting shares of the issuer or as a result of other relationships, such as the Fund and the issuer having the same investment manager. Transactions with issuers that were either affiliated persons of the Fund at the beginning of the period or the end of the period were as follows:
| | Value,
beginning of
period | Purchases | Sales
proceeds | Net
realized
gains
(losses) | | Net
change in
unrealized
gains
(losses) | | Value,
end of
period | | % of
net
assets | Shares,
end
of period | Income
from
affiliated
securities |
| Short-term investments | | | | | | | | | | | | |
| Investment companies | | | | | | | | | | | | |
| Securities Lending Cash Investments LLC | $2,915,185 | $133,028,745 | $(130,194,730) | $0 | | $0 | | $ 5,749,200 | | | 5,749,200 | $ 7,715# |
| Wells Fargo Government Money Market Fund Select Class | 5,703,013 | 68,640,838 | (71,486,318) | 0 | | 0 | | 2,857,533 | | | 2,857,533 | 484 |
| | | | | $0 | | $0 | | $8,606,733 | | 0.78% | | $8,199 |
| # | Amount shown represents income before fees and rebates. |
The accompanying notes are an integral part of these financial statements.
10 | Wells Fargo Enterprise Fund
Statement of assets and liabilities—March 31, 2021 (unaudited)
| | |
| Assets | |
Investments in unaffiliated securities (including $5,011,593 of securities loaned), at value (cost $661,299,208)
| $ 1,096,804,080 |
Investments in affiliated securites, at value (cost $8,606,733)
| 8,606,733 |
Receivable for Fund shares sold
| 271,328 |
Receivable for dividends
| 14,257 |
Receivable for securities lending income, net
| 4,299 |
Prepaid expenses and other assets
| 54,849 |
Total assets
| 1,105,755,546 |
| Liabilities | |
Payable upon receipt of securities loaned
| 5,749,200 |
Payable for Fund shares redeemed
| 1,368,321 |
Management fee payable
| 659,124 |
Administration fees payable
| 178,330 |
Trustees’ fees and expenses payable
| 1,476 |
Distribution fee payable
| 1,387 |
Accrued expenses and other liabilities
| 328,428 |
Total liabilities
| 8,286,266 |
Total net assets
| $1,097,469,280 |
| Net assets consist of | |
Paid-in capital
| $ 561,043,124 |
Total distributable earnings
| 536,426,156 |
Total net assets
| $1,097,469,280 |
| Computation of net asset value and offering price per share | |
Net assets – Class A
| $ 921,548,794 |
Shares outstanding – Class A1
| 13,426,242 |
Net asset value per share – Class A
| $68.64 |
Maximum offering price per share – Class A2
| $72.83 |
Net assets – Class C
| $ 2,181,600 |
Shares outstanding – Class C1
| 38,564 |
Net asset value per share – Class C
| $56.57 |
Net assets – Class R6
| $ 82,964,272 |
Shares outstanding – Class R61
| 1,049,686 |
Net asset value per share – Class R6
| $79.04 |
Net assets – Administrator Class
| $ 9,292,051 |
Shares outstanding – Administrator Class1
| 125,997 |
Net asset value per share – Administrator Class
| $73.75 |
Net assets – Institutional Class
| $ 81,482,563 |
Shares outstanding – Institutional Class1
| 1,035,693 |
Net asset value per share – Institutional Class
| $78.67 |
| 1 | The Fund has an unlimited number of authorized shares |
| 2 | Maximum offering price is computed as 100/94.25 of net asset value. On investments of $50,000 or more, the offering price is reduced. |
The accompanying notes are an integral part of these financial statements.
Wells Fargo Enterprise Fund | 11
Statement of operations—six months ended March 31, 2021 (unaudited)
| | |
| Investment income | |
Dividends (net of foreign withholdings taxes of $12,182)
| $ 691,046 |
Income from affiliated securities
| 33,434 |
Total investment income
| 724,480 |
| Expenses | |
Management fee
| 4,078,584 |
| Administration fees | |
Class A
| 986,680 |
Class C
| 2,395 |
Class R6
| 12,473 |
Administrator Class
| 4,008 |
Institutional Class
| 52,418 |
| Shareholder servicing fees | |
Class A
| 1,174,619 |
Class C
| 2,849 |
Administrator Class
| 7,595 |
| Distribution fee | |
Class C
| 8,537 |
Custody and accounting fees
| 22,206 |
Professional fees
| 22,242 |
Registration fees
| 26,565 |
Shareholder report expenses
| 22,445 |
Trustees’ fees and expenses
| 9,610 |
Other fees and expenses
| 12,825 |
Total expenses
| 6,446,051 |
| Less: Fee waivers and/or expense reimbursements | |
Fund-level
| (62,268) |
Class A
| (159,559) |
Class C
| (192) |
Administrator Class
| (493) |
Institutional Class
| (7,043) |
Net expenses
| 6,216,496 |
Net investment loss
| (5,492,016) |
| Realized and unrealized gains (losses) on investments | |
Net realized gains on investments
| 113,227,428 |
Net change in unrealized gains (losses) on investments
| 57,634,816 |
Net realized and unrealized gains (losses) on investments
| 170,862,244 |
Net increase in net assets resulting from operations
| $165,370,228 |
The accompanying notes are an integral part of these financial statements.
12 | Wells Fargo Enterprise Fund
Statement of changes in net assets
| | |
| | Six months ended
March 31, 2021
(unaudited) | Year ended
September 30, 2020 |
| Operations | | | | |
Net investment loss
| | $ (5,492,016) | | $ (5,965,756) |
Net realized gains on investments
| | 113,227,428 | | 105,472,696 |
Net change in unrealized gains (losses) on investments
| | 57,634,816 | | 164,486,707 |
Net increase in net assets resulting from operations
| | 165,370,228 | | 263,993,647 |
| Distributions to shareholders from | | | | |
| Net investment income and net realized gains | | | | |
Class A
| | (82,781,779) | | (41,991,432) |
Class C
| | (233,168) | | (169,192) |
Class R6
| | (6,340,447) | | (3,065,210) |
Administrator Class
| | (384,491) | | (233,637) |
Institutional Class
| | (6,296,069) | | (3,042,253) |
Total distributions to shareholders
| | (96,035,954) | | (48,501,724) |
| Capital share transactions | Shares | | Shares | |
| Proceeds from shares sold | | | | |
Class A
| 195,777 | 14,109,637 | 209,379 | 10,822,879 |
Class C
| 6,637 | 395,136 | 12,820 | 570,917 |
Class R6
| 72,484 | 5,895,044 | 117,768 | 7,229,301 |
Administrator Class
| 74,971 | 5,895,414 | 13,354 | 720,970 |
Institutional Class
| 170,474 | 14,020,861 | 454,409 | 25,643,025 |
| | | 40,316,092 | | 44,987,092 |
| Reinvestment of distributions | | | | |
Class A
| 1,158,617 | 78,565,767 | 824,197 | 40,006,548 |
Class C
| 4,081 | 228,661 | 4,042 | 166,374 |
Class R6
| 78,532 | 6,125,450 | 54,701 | 3,007,434 |
Administrator Class
| 5,171 | 376,713 | 4,403 | 228,012 |
Institutional Class
| 76,277 | 5,922,914 | 52,410 | 2,871,023 |
| | | 91,219,505 | | 46,279,391 |
| Payment for shares redeemed | | | | |
Class A
| (600,951) | (42,692,474) | (1,348,785) | (68,998,770) |
Class C
| (13,245) | (790,433) | (34,314) | (1,501,923) |
Class R6
| (83,483) | (6,751,401) | (130,426) | (7,451,430) |
Administrator Class
| (15,493) | (1,198,365) | (25,846) | (1,339,682) |
Institutional Class
| (143,316) | (11,497,076) | (508,996) | (28,322,291) |
| | | (62,929,749) | | (107,614,096) |
Net increase (decrease) in net assets resulting from capital share transactions
| | 68,605,848 | | (16,347,613) |
Total increase in net assets
| | 137,940,122 | | 199,144,310 |
| Net assets | | | | |
Beginning of period
| | 959,529,158 | | 760,384,848 |
End of period
| | $1,097,469,280 | | $ 959,529,158 |
The accompanying notes are an integral part of these financial statements.
Wells Fargo Enterprise Fund | 13
Financial highlights
(For a share outstanding throughout each period)
| | | Year ended September 30 |
| Class A | Six months ended
March 31, 2021
(unaudited) | 2020 | 2019 | 2018 | 2017 | 2016 |
Net asset value, beginning of period
| $64.21 | $49.98 | $52.96 | $48.80 | $41.94 | $41.90 |
Net investment loss
| (0.37) 1 | (0.41) 1 | (0.29) | (0.31) | (0.25) | (0.21) 1 |
Net realized and unrealized gains on investments
| 11.40 | 17.93 | 3.05 | 9.66 | 8.94 | 3.61 |
Total from investment operations
| 11.03 | 17.52 | 2.76 | 9.35 | 8.69 | 3.40 |
| Distributions to shareholders from | | | | | | |
Net realized gains
| (6.60) | (3.29) | (5.74) | (5.19) | (1.83) | (3.36) |
Net asset value, end of period
| $68.64 | $64.21 | $49.98 | $52.96 | $48.80 | $41.94 |
Total return2
| 17.30% | 37.19% | 8.00% | 20.83% | 21.55% | 8.63% |
| Ratios to average net assets (annualized) | | | | | | |
Gross expenses
| 1.21% | 1.24% | 1.25% | 1.25% | 1.26% | 1.26% |
Net expenses
| 1.17% | 1.16% | 1.18% | 1.18% | 1.18% | 1.18% |
Net investment loss
| (1.04)% | (0.79)% | (0.59)% | (0.61)% | (0.55)% | (0.52)% |
| Supplemental data | | | | | | |
Portfolio turnover rate
| 24% | 62% | 50% | 62% | 75% | 99% |
Net assets, end of period (000s omitted)
| $921,549 | $813,725 | $649,106 | $655,338 | $591,002 | $542,077 |
| 1 | Calculated based upon average shares outstanding |
| 2 | Total return calculations do not include any sales charges. Returns for periods of less than one year are not annualized. |
The accompanying notes are an integral part of these financial statements.
14 | Wells Fargo Enterprise Fund
Financial highlights
(For a share outstanding throughout each period)
| | | Year ended September 30 |
| Class C | Six months ended
March 31, 2021
(unaudited) | 2020 | 2019 | 2018 | 2017 | 2016 |
Net asset value, beginning of period
| $54.11 | $42.93 | $46.74 | $43.95 | $38.23 | $38.75 |
Net investment loss
| (0.53) 1 | (0.68) 1 | (0.52) 1 | (0.60) 1 | (0.85) | (0.47) 1 |
Net realized and unrealized gains on investments
| 9.59 | 15.15 | 2.45 | 8.58 | 8.40 | 3.31 |
Total from investment operations
| 9.06 | 14.47 | 1.93 | 7.98 | 7.55 | 2.84 |
| Distributions to shareholders from | | | | | | |
Net realized gains
| (6.60) | (3.29) | (5.74) | (5.19) | (1.83) | (3.36) |
Net asset value, end of period
| $56.57 | $54.11 | $42.93 | $46.74 | $43.95 | $38.23 |
Total return2
| 16.86% | 36.13% | 7.20% | 19.93% | 20.66% | 7.80% |
| Ratios to average net assets (annualized) | | | | | | |
Gross expenses
| 1.96% | 1.98% | 2.00% | 2.00% | 2.01% | 2.01% |
Net expenses
| 1.93% | 1.93% | 1.93% | 1.93% | 1.93% | 1.93% |
Net investment loss
| (1.80)% | (1.55)% | (1.29)% | (1.37)% | (1.13)% | (1.28)% |
| Supplemental data | | | | | | |
Portfolio turnover rate
| 24% | 62% | 50% | 62% | 75% | 99% |
Net assets, end of period (000s omitted)
| $2,182 | $2,224 | $2,513 | $7,629 | $8,898 | $9,181 |
| 1 | Calculated based upon average shares outstanding |
| 2 | Total return calculations do not include any sales charges. Returns for periods of less than one year are not annualized. |
The accompanying notes are an integral part of these financial statements.
Wells Fargo Enterprise Fund | 15
Financial highlights
(For a share outstanding throughout each period)
| | | Year ended September 30 |
| Class R6 | Six months ended
March 31, 2021
(unaudited) | 2020 | 2019 | 2018 | 2017 | 2016 |
Net asset value, beginning of period
| $72.94 | $56.15 | $58.47 | $53.17 | $45.37 | $44.89 |
Net investment loss
| (0.27) 1 | (0.25) 1 | (0.11) 1 | (0.13) 1 | (0.08) | (0.06) 1 |
Net realized and unrealized gains on investments
| 12.97 | 20.33 | 3.53 | 10.62 | 9.71 | 3.90 |
Total from investment operations
| 12.70 | 20.08 | 3.42 | 10.49 | 9.63 | 3.84 |
| Distributions to shareholders from | | | | | | |
Net realized gains
| (6.60) | (3.29) | (5.74) | (5.19) | (1.83) | (3.36) |
Net asset value, end of period
| $79.04 | $72.94 | $56.15 | $58.47 | $53.17 | $45.37 |
Total return2
| 17.53% | 37.69% | 8.41% | 21.30% | 22.01% | 9.06% |
| Ratios to average net assets (annualized) | | | | | | |
Gross expenses
| 0.78% | 0.81% | 0.82% | 0.82% | 0.82% | 0.83% |
Net expenses
| 0.78% | 0.80% | 0.80% | 0.80% | 0.80% | 0.80% |
Net investment loss
| (0.65)% | (0.43)% | (0.21)% | (0.23)% | (0.17)% | (0.14)% |
| Supplemental data | | | | | | |
Portfolio turnover rate
| 24% | 62% | 50% | 62% | 75% | 99% |
Net assets, end of period (000s omitted)
| $82,964 | $71,641 | $52,783 | $48,363 | $35,923 | $29,861 |
| 1 | Calculated based upon average shares outstanding |
| 2 | Returns for periods of less than one year are not annualized. |
The accompanying notes are an integral part of these financial statements.
16 | Wells Fargo Enterprise Fund
Financial highlights
(For a share outstanding throughout each period)
| | | Year ended September 30 |
| Administrator Class | Six months ended
March 31, 2021
(unaudited) | 2020 | 2019 | 2018 | 2017 | 2016 |
Net asset value, beginning of period
| $68.54 | $53.10 | $55.82 | $51.12 | $43.81 | $43.58 |
Net investment loss
| (0.37) 1 | (0.40) 1 | (0.25) 1 | (0.28) 1 | (0.20) 1 | (0.18) 1 |
Net realized and unrealized gains on investments
| 12.18 | 19.13 | 3.27 | 10.17 | 9.34 | 3.77 |
Total from investment operations
| 11.81 | 18.73 | 3.02 | 9.89 | 9.14 | 3.59 |
| Distributions to shareholders from | | | | | | |
Net realized gains
| (6.60) | (3.29) | (5.74) | (5.19) | (1.83) | (3.36) |
Net asset value, end of period
| $73.75 | $68.54 | $53.10 | $55.82 | $51.12 | $43.81 |
Total return2
| 17.35% | 37.29% | 8.06% | 20.95% | 21.66% | 8.74% |
| Ratios to average net assets (annualized) | | | | | | |
Gross expenses
| 1.13% | 1.15% | 1.16% | 1.16% | 1.18% | 1.15% |
Net expenses
| 1.10% | 1.10% | 1.10% | 1.10% | 1.10% | 1.07% |
Net investment loss
| (0.97)% | (0.72)% | (0.51)% | (0.53)% | (0.44)% | (0.41)% |
| Supplemental data | | | | | | |
Portfolio turnover rate
| 24% | 62% | 50% | 62% | 75% | 99% |
Net assets, end of period (000s omitted)
| $9,292 | $4,205 | $3,687 | $3,687 | $3,705 | $4,693 |
| 1 | Calculated based upon average shares outstanding |
| 2 | Returns for periods of less than one year are not annualized. |
The accompanying notes are an integral part of these financial statements.
Wells Fargo Enterprise Fund | 17
Financial highlights
(For a share outstanding throughout each period)
| | | Year ended September 30 |
| Institutional Class | Six months ended
March 31, 2021
(unaudited) | 2020 | 2019 | 2018 | 2017 | 2016 |
Net asset value, beginning of period
| $72.66 | $55.97 | $58.33 | $53.08 | $45.32 | $44.87 |
Net investment loss
| (0.29) 1 | (0.28) 1 | (0.14) 1 | (0.15) 1 | (0.09) 1 | (0.09) 1 |
Net realized and unrealized gains on investments
| 12.90 | 20.26 | 3.52 | 10.59 | 9.68 | 3.90 |
Total from investment operations
| 12.61 | 19.98 | 3.38 | 10.44 | 9.59 | 3.81 |
| Distributions to shareholders from | | | | | | |
Net realized gains
| (6.60) | (3.29) | (5.74) | (5.19) | (1.83) | (3.36) |
Net asset value, end of period
| $78.67 | $72.66 | $55.97 | $58.33 | $53.08 | $45.32 |
Total return2
| 17.47% | 37.63% | 8.36% | 21.24% | 21.97% | 8.97% |
| Ratios to average net assets (annualized) | | | | | | |
Gross expenses
| 0.88% | 0.91% | 0.92% | 0.92% | 0.93% | 0.93% |
Net expenses
| 0.85% | 0.85% | 0.85% | 0.85% | 0.85% | 0.85% |
Net investment loss
| (0.72)% | (0.48)% | (0.26)% | (0.29)% | (0.19)% | (0.21)% |
| Supplemental data | | | | | | |
Portfolio turnover rate
| 24% | 62% | 50% | 62% | 75% | 99% |
Net assets, end of period (000s omitted)
| $81,483 | $67,735 | $52,296 | $48,446 | $54,877 | $61,563 |
| 1 | Calculated based upon average shares outstanding |
| 2 | Returns for periods of less than one year are not annualized. |
The accompanying notes are an integral part of these financial statements.
18 | Wells Fargo Enterprise Fund
Notes to financial statements (unaudited)
1. ORGANIZATION
Wells Fargo Funds Trust (the "Trust"), a Delaware statutory trust organized on March 10, 1999, is an open-end management investment company registered under the Investment Company Act of 1940, as amended (the "1940 Act"). As an investment company, the Trust follows the accounting and reporting guidance in Financial Accounting Standards Board (“FASB”) Accounting Standards Codification Topic 946, Financial Services – Investment Companies. These financial statements report on the Wells Fargo Enterprise Fund (the "Fund") which is a diversified series of the Trust.
On February 23, 2021, Wells Fargo & Company announced that it has entered into a definitive agreement to sell Wells Fargo Asset Management ("WFAM") to GTCR LLC and Reverence Capital Partners, L.P. WFAM is the trade name used by the asset management businesses of Wells Fargo & Company and includes Wells Fargo Funds Management, LLC, the investment manager to the Fund, Wells Capital Management Incorporated and Wells Fargo Asset Management (International) Limited, both registered investment advisers providing sub-advisory services to certain funds, and Wells Fargo Funds Distributor, LLC, the Fund's principal underwriter. As part of the transaction, Wells Fargo & Company will own a 9.9% equity interest and will continue to serve as an important client and distribution partner. The transaction is expected to close in the second half of 2021, subject to customary closing conditions.
Consummation of the transaction will result in the automatic termination of the Fund's investment management agreement and sub-advisory agreement. The Fund's Board of Trustees will be asked to approve new investment management arrangements with the new company. If approved by the Board, the new investment management arrangements with the new company will be presented to the shareholders of the Fund for approval, and, if approved by shareholders, would take effect upon the closing of the transaction. The transaction is expected to close in the second half of 2021, subject to customary closing conditions.
2. SIGNIFICANT ACCOUNTING POLICIES
The following significant accounting policies, which are consistently followed in the preparation of the financial statements of the Fund, are in conformity with U.S. generally accepted accounting principles which require management to make estimates and assumptions that affect the reported amounts of assets and liabilities, disclosure of contingent assets and liabilities at the date of the financial statements, and the reported amounts of income and expenses during the reporting period. Actual results could differ from those estimates.
Securities valuation
All investments are valued each business day as of the close of regular trading on the New York Stock Exchange (generally 4 p.m. Eastern Time), although the Fund may deviate from this calculation time under unusual or unexpected circumstances.
Equity securities that are listed on a foreign or domestic exchange or market are valued at the official closing price or, if none, the last sales price. If no sale occurs on the principal exchange or market that day, a fair value price will be determined in accordance with the Fund’s Valuation Procedures.
Investments in registered open-end investment companies are valued at net asset value. Interests in non-registered investment companies that are redeemable at net asset value are fair valued normally at net asset value.
Investments which are not valued using any of the methods discussed above are valued at their fair value, as determined in good faith by the Board of Trustees. The Board of Trustees has established a Valuation Committee comprised of the Trustees and has delegated to it the authority to take any actions regarding the valuation of portfolio securities that the Valuation Committee deems necessary or appropriate, including determining the fair value of portfolio securities, unless the determination has been delegated to the Wells Fargo Asset Management Pricing Committee at Wells Fargo Funds Management, LLC ("Funds Management"). The Board of Trustees retains the authority to make or ratify any valuation decisions or approve any changes to the Valuation Procedures as it deems appropriate. On a quarterly basis, the Board of Trustees receives reports on any valuation actions taken by the Valuation Committee or the Wells Fargo Asset Management Pricing Committee which may include items for ratification.
Securities lending
The Fund may lend its securities from time to time in order to earn additional income in the form of fees or interest on securities received as collateral or the investment of any cash received as collateral. When securities are on loan, the Fund receives interest or dividends on those securities. Cash collateral received in connection with its securities lending transactions is invested in Securities Lending Cash Investments, LLC (the "Securities Lending Fund"). Investments in Securities Lending Fund are valued at the evaluated bid price provided by an independent pricing service. Income earned from investment in the Securities Lending Fund (net of fees and rebates), if any, is included in income from affiliated securities on the Statement of Operations.
Wells Fargo Enterprise Fund | 19
Notes to financial statements (unaudited)
In a securities lending transaction, the net asset value of the Fund is affected by an increase or decrease in the value of the securities loaned and by an increase or decrease in the value of the instrument in which collateral is invested. The amount of securities lending activity undertaken by the Fund fluctuates from time to time. The Fund has the right under the lending agreement to recover the securities from the borrower on demand. In the event of default or bankruptcy by the borrower, the Fund may be prevented from recovering the loaned securities or gaining access to the collateral or may experience delays or costs in doing so. In such an event, the terms of the agreement allow the unaffiliated securities lending agent to use the collateral to purchase replacement securities on behalf of the Fund or pay the Fund the market value of the loaned securities. The Fund bears the risk of loss with respect to depreciation of its investment of the cash collateral.
Security transactions and income recognition
Securities transactions are recorded on a trade date basis. Realized gains or losses are recorded on the basis of identified cost.
Dividend income is recognized on the ex-dividend date. Dividend income is recorded net of foreign taxes withheld where recovery of such taxes is not assured.
Distributions to shareholders
Distributions to shareholders from net investment income and any net realized gains are recorded on the ex-dividend date and paid at least annually. Such distributions are determined in accordance with income tax regulations and may differ from U.S. generally accepted accounting principles. Dividend sources are estimated at the time of declaration. The tax character of distributions is determined as of the Fund's fiscal year end. Therefore, a portion of the Fund's distributions made prior to the Fund’s fiscal year end may be categorized as a tax return of capital at year end.
Federal and other taxes
The Fund intends to continue to qualify as a regulated investment company by distributing substantially all of its investment company taxable income and any net realized capital gains (after reduction for capital loss carryforwards) sufficient to relieve it from all, or substantially all, federal income taxes. Accordingly, no provision for federal income taxes was required.
The Fund’s income and federal excise tax returns and all financial records supporting those returns for the prior three fiscal years are subject to examination by the federal and Delaware revenue authorities. Management has analyzed the Fund's tax positions taken on federal, state, and foreign tax returns for all open tax years and does not believe that there are any uncertain tax positions that require recognition of a tax liability.
As of March 31, 2021, the aggregate cost of all investments for federal income tax purposes was $670,023,235 and the unrealized gains (losses) consisted of:
| Gross unrealized gains | $449,530,838 |
| Gross unrealized losses | (14,143,260) |
| Net unrealized gains | $435,387,578 |
As of September 30, 2020, the Fund had a qualified late-year ordinary loss of $4,881,867 which was recognized on the first day of the current fiscal year.
Class allocations
The separate classes of shares offered by the Fund differ principally in applicable sales charges, distribution, shareholder servicing, and administration fees. Class specific expenses are charged directly to that share class. Investment income, common fund-level expenses, and realized and unrealized gains (losses) on investments are allocated daily to each class of shares based on the relative proportion of net assets of each class.
20 | Wells Fargo Enterprise Fund
Notes to financial statements (unaudited)
3. FAIR VALUATION MEASUREMENTS
Fair value measurements of investments are determined within a framework that has established a fair value hierarchy based upon the various data inputs utilized in determining the value of the Fund’s investments. The three-level hierarchy gives the highest priority to unadjusted quoted prices in active markets for identical assets or liabilities (Level 1) and the lowest priority to unobservable inputs (Level 3). The Fund’s investments are classified within the fair value hierarchy based on the lowest level of input that is significant to the fair value measurement. The inputs are summarized into three broad levels as follows:
| ■ | Level 1 – quoted prices in active markets for identical securities |
| ■ | Level 2 – other significant observable inputs (including quoted prices for similar securities, interest rates, prepayment speeds, credit risk, etc.) |
| ■ | Level 3 – significant unobservable inputs (including the Fund’s own assumptions in determining the fair value of investments) |
The inputs or methodologies used for valuing investments in securities are not necessarily an indication of the risk associated with investing in those securities.
The following is a summary of the inputs used in valuing the Fund’s assets and liabilities as of March 31, 2021:
| | Quoted prices
(Level 1) | Other significant
observable inputs
(Level 2) | Significant
unobservable inputs
(Level 3) | Total |
| Assets | | | | |
| Investments in: | | | | |
| Common stocks | | | | |
| Communication services | $ 93,660,050 | $0 | $0 | $ 93,660,050 |
| Consumer discretionary | 171,161,930 | 0 | 0 | 171,161,930 |
| Financials | 20,912,640 | 0 | 0 | 20,912,640 |
| Health care | 212,509,158 | 0 | 0 | 212,509,158 |
| Industrials | 146,094,431 | 0 | 0 | 146,094,431 |
| Information technology | 452,465,871 | 0 | 0 | 452,465,871 |
| Short-term investments | | | | |
| Investment companies | 8,606,733 | 0 | 0 | 8,606,733 |
| Total assets | $1,105,410,813 | $0 | $0 | $1,105,410,813 |
Additional sector, industry or geographic detail, if any, is included in the Portfolio of Investments.
For the six months ended March 31, 2021, the Fund did not have any transfers into/out of Level 3.
4. TRANSACTIONS WITH AFFILIATES
Management fee
Funds Management, an indirect wholly owned subsidiary of Wells Fargo & Company ("Wells Fargo"), is the manager of the Fund and provides advisory and fund-level administrative services under an investment management agreement. Under the investment management agreement, Funds Management is responsible for, among other services, implementing the investment objectives and strategies of the Fund, supervising the subadviser and providing fund-level administrative services in connection with the Fund’s operations. As compensation for its services under the investment management agreement, Funds Management is entitled to receive a management fee at the following annual rate based on the Fund’s average daily net assets:
Wells Fargo Enterprise Fund | 21
Notes to financial statements (unaudited)
| Average daily net assets | Management fee |
| First $500 million | 0.750% |
| Next $500 million | 0.725 |
| Next $1 billion | 0.700 |
| Next $2 billion | 0.675 |
| Next $1 billion | 0.650 |
| Next $5 billion | 0.640 |
| Next $2 billion | 0.630 |
| Next $4 billion | 0.620 |
| Over $16 billion | 0.610 |
For the six months ended March 31, 2021, the management fee was equivalent to an annual rate of 0.73% of the Fund’s average daily net assets.
Funds Management has retained the services of a subadviser to provide daily portfolio management to the Fund. The fee for subadvisory services is borne by Funds Management. Wells Capital Management Incorporated ("WellsCap"), an affiliate of Funds Management and an indirect wholly owned subsidiary of Wells Fargo, is the subadviser to the Fund and is entitled to receive a fee from Funds Management at an annual rate starting at 0.45% and declining to 0.30% as the average daily net assets of the Fund increase.
Administration fees
Under a class-level administration agreement, Funds Management provides class-level administrative services to the Fund, which includes paying fees and expenses for services provided by the transfer agent, sub-transfer agents, omnibus account servicers and record-keepers. As compensation for its services under the class-level administration agreement, Funds Management receives an annual fee which is calculated based on the average daily net assets of each class as follows:
| | Class-level
administration fee |
| Class A | 0.21% |
| Class C | 0.21 |
| Class R6 | 0.03 |
| Administrator Class | 0.13 |
| Institutional Class | 0.13 |
Waivers and/or expense reimbursements
Funds Management has contractually waived and/or reimbursed management and administration fees to the extent necessary to maintain certain net operating expense ratios for the Fund. When each class of the Fund has exceeded its expense cap, Funds Management has waived fees and/or reimbursed expenses from fund-level expenses on a proportionate basis and then from class specific expenses. When only certain classes exceed their expense caps, waivers and/or reimbursements are applied against class specific expenses before fund-level expenses. Funds Management has committed through January 31, 2022 to waive fees and/or reimburse expenses to the extent necessary to cap expenses. Prior to or after the commitment expiration date, the cap may be increased or the commitment to maintain the cap may be terminated only with the approval of the Board of Trustees. The contractual expense caps are as follows:
22 | Wells Fargo Enterprise Fund
Notes to financial statements (unaudited)
| | Expense ratio caps |
| Class A | 1.18% |
| Class C | 1.93 |
| Class R6 | 0.80 |
| Administrator Class | 1.10 |
| Institutional Class | 0.85 |
Distribution fee
The Trust has adopted a distribution plan for Class C shares of the Fund pursuant to Rule 12b-1 under the 1940 Act. A distribution fee is charged charged to Class C shares and paid to Wells Fargo Funds Distributor, LLC ("Funds Distributor"), the principal underwriter, at an annual rate of 0.75% of the average daily net assets of Class C shares.
In addition, Funds Distributor is entitled to receive the front-end sales charge from the purchase of Class A shares and a contingent deferred sales charge on the redemption of certain Class A shares. Funds Distributor is also entitled to receive the contingent deferred sales charges from redemptions of Class C shares. For the six months ended March 31, 2021, Funds Distributor received $2,457 from the sale of Class A shares. No contingent deferred sales charges were incurred by Class A and Class C shares for the six months ended March 31, 2021.
Shareholder servicing fees
The Trust has entered into contracts with one or more shareholder servicing agents, whereby Class A, Class C, and Administrator Class of the Fund are charged a fee at an annual rate of 0.25% of the average daily net assets of each respective class. A portion of these total shareholder servicing fees were paid to affiliates of Wells Fargo.
Interfund transactions
The Fund may purchase or sell portfolio investment securities to certain other Wells Fargo affiliates pursuant to Rule 17a-7 under the 1940 Act and under procedures adopted by the Board of Trustees. The procedures have been designed to ensure that these interfund transactions, which do not incur broker commissions, are effected at current market prices.
5. INVESTMENT PORTFOLIO TRANSACTIONS
Purchases and sales of investments, excluding U.S. government obligations (if any) and short-term securities, for the six months ended March 31, 2021 were $257,626,443 and $288,228,243, respectively.
6. SECURITIES LENDING TRANSACTIONS
The Fund lends its securities through an unaffiliated securities lending agent and receives collateral in the form of cash or securities with a value at least equal to the value of the securities on loan. The value of the loaned securities is determined at the close of each business day and any increases or decreases in the required collateral are exchanged between the Fund and the counterparty on the next business day. Cash collateral received is invested in the Securities Lending Fund which seeks to provide a positive return compared to the daily Federal Funds Open Rate by investing in high-quality, U.S. dollar-denominated short-term money market instruments and is exempt from registration under Section 3(c)(7) of the 1940 Act. Securities Lending Fund is managed by Funds Management and is subadvised by WellsCap. Funds Management receives an advisory fee starting at 0.05% and declining to 0.01% as the average daily net assets of the Securities Lending Fund increase. All of the fees received by Funds Management are paid to WellsCap for its services as subadviser.
In the event of counterparty default or the failure of a borrower to return a loaned security, the Fund has the right to use the collateral to offset any losses incurred. As of March 31, 2021, the Fund had securities lending transactions with the following counterparties which are subject to offset:
| Counterparty | Value of
securities on
loan | Collateral
received1 | Net amount |
| Barclays Capital Incorporated | $2,260,293 | $(2,260,293) | $0 |
| Morgan Stanley & Company LLC | 2,751,300 | (2,751,300) | 0 |
1 Collateral received within this table is limited to the collateral for the net transaction with the counterparty.
Wells Fargo Enterprise Fund | 23
Notes to financial statements (unaudited)
7. BANK BORROWINGS
The Trust (excluding the money market funds), Wells Fargo Master Trust and Wells Fargo Variable Trust are parties to a $350,000,000 revolving credit agreement whereby the Fund is permitted to use bank borrowings for temporary or emergency purposes, such as to fund shareholder redemption requests. Interest under the credit agreement is charged to the Fund based on a borrowing rate equal to the higher of the Federal Funds rate in effect on that day plus 1.25% or the overnight LIBOR rate in effect on that day plus 1.25%. In addition, an annual commitment fee equal to 0.25% of the unused balance is allocated to each participating fund.
For the six months ended March 31, 2021, there were no borrowings by the Fund under the agreement.
8. CONCENTRATION RISKS
As of the end of the period, the Fund concentrated its portfolio of investments in the information technology sector. A fund that invests a substantial portion of its assets in any sector may be more affected by changes in that sector than would be a fund whose investments are not heavily weighted in any sector.
9. INDEMNIFICATION
Under the Fund's organizational documents, the officers and Trustees have been granted certain indemnification rights against certain liabilities that may arise out of performance of their duties to the Fund. The Fund has entered into a separate agreement with each Trustee that converts indemnification rights currently existing under the Fund’s organizational documents into contractual rights that cannot be changed in the future without the consent of the Trustee. Additionally, in the normal course of business, the Fund may enter into contracts with service providers that contain a variety of indemnification clauses. The Fund’s maximum exposure under these arrangements is dependent on future claims that may be made against the Fund and, therefore, cannot be estimated.
10. CORONAVIRUS (COVID-19) PANDEMIC
On March 11, 2020, the World Health Organization announced that it had made the assessment that coronavirus disease 2019 (“COVID-19”) is a pandemic. The impacts of COVID-19 are affecting the entire global economy, individual companies and investment products, the funds, and the market in general. There is significant uncertainty around the extent and duration of business disruptions related to COVID-19 and the impacts may last for an extended period of time. COVID-19 has led to significant uncertainty and volatility in the financial markets.
24 | Wells Fargo Enterprise Fund
Other information (unaudited)
PROXY VOTING INFORMATION
A description of the policies and procedures used to determine how to vote proxies relating to portfolio securities is available without charge, upon request, by calling 1-800-222-8222, visiting our website at wfam.com, or visiting the SEC website at sec.gov. Information regarding how the proxies related to portfolio securities were voted during the most recent 12-month period ended June 30 is available on the website at wfam.com or by visiting the SEC website at sec.gov.
QUARTERLY PORTFOLIO HOLDINGS INFORMATION
The Fund files its complete schedule of portfolio holdings with the SEC for the first and third quarters of each fiscal year as an exhibit to its reports on Form N-PORT. Shareholders may view the filed Form N-PORT by visiting the SEC website at sec.gov.
Wells Fargo Enterprise Fund | 25
Other information (unaudited)
BOARD OF TRUSTEES AND OFFICERS
Each of the Trustees and Officers listed in the table below acts in identical capacities for each fund in the Wells Fargo family of funds, which consists of 142 mutual funds comprising the Wells Fargo Funds Trust, Wells Fargo Variable Trust, Wells Fargo Master Trust and four closed-end funds (collectively the “Fund Complex”). This table should be read in conjunction with the Prospectus and the Statement of Additional Information1. The mailing address of each Trustee and Officer is 525 Market Street, 12th Floor, San Francisco, CA 94105. Each Trustee and Officer serves an indefinite term, however, each Trustee serves such term until reaching the mandatory retirement age established by the Trustees.
Independent Trustees
Name and
year of birth | Position held and
length of service* | Principal occupations during past five years or longer | Current other
public company or
investment
company
directorships |
William R. Ebsworth
(Born 1957) | Trustee,
since 2015 | Retired. From 1984 to 2013, equities analyst, portfolio manager, research director and chief investment officer at Fidelity Management and Research Company in Boston, Tokyo, and Hong Kong, and retired in 2013 as Chief Investment Officer of Fidelity Strategic Advisers, Inc. where he led a team of investment professionals managing client assets. Prior thereto, Board member of Hong Kong Securities Clearing Co., Hong Kong Options Clearing Corp., the Thailand International Fund, Ltd., Fidelity Investments Life Insurance Company, and Empire Fidelity Investments Life Insurance Company. Audit Committee Chair and Investment Committee Chair of the Vincent Memorial Hospital Endowment (non-profit organization). Mr. Ebsworth is a CFA® charterholder. | N/A |
Jane A. Freeman
(Born 1953) | Trustee,
since 2015;
Chair Liaison,
since 2018 | Retired. From 2012 to 2014 and 1999 to 2008, Chief Financial Officer of Scientific Learning Corporation. From 2008 to 2012, Ms. Freeman provided consulting services related to strategic business projects. Prior to 1999, Portfolio Manager at Rockefeller & Co. and Scudder, Stevens & Clark. Board member of the Harding Loevner Funds from 1996 to 2014, serving as both Lead Independent Director and chair of the Audit Committee. Board member of the Russell Exchange Traded Funds Trust from 2011 to 2012 and the chair of the Audit Committee. Ms. Freeman is also an inactive Chartered Financial Analyst. | N/A |
Isaiah Harris, Jr.
(Born 1952) | Trustee,
since 2009; Audit
Committee
Chair,
since 2019 | Retired. Chairman of the Board of CIGNA Corporation since 2009, and Director since 2005. From 2003 to 2011, Director of Deluxe Corporation. Prior thereto, President and CEO of BellSouth Advertising and Publishing Corp. from 2005 to 2007, President and CEO of BellSouth Enterprises from 2004 to 2005 and President of BellSouth Consumer Services from 2000 to 2003. Emeritus member of the Iowa State University Foundation Board of Governors. Emeritus Member of the Advisory Board of Iowa State University School of Business. Advisory Board Member, Palm Harbor Academy (private school). Mr. Harris is a certified public accountant (inactive status). | CIGNA Corporation |
Judith M. Johnson
(Born 1949) | Trustee,
since 2008 | Retired. Prior thereto, Chief Executive Officer and Chief Investment Officer of Minneapolis Employees Retirement Fund from 1996 to 2008. Ms. Johnson is an attorney, certified public accountant and a certified managerial accountant. | N/A |
David F. Larcker
(Born 1950) | Trustee,
since 2009 | James Irvin Miller Professor of Accounting at the Graduate School of Business (Emeritus), Stanford University, Director of the Corporate Governance Research Initiative and Senior Faculty of The Rock Center for Corporate Governance since 2006. From 2005 to 2008, Professor of Accounting at the Graduate School of Business, Stanford University. Prior thereto, Ernst & Young Professor of Accounting at The Wharton School, University of Pennsylvania from 1985 to 2005. | N/A |
26 | Wells Fargo Enterprise Fund
Other information (unaudited)
Name and
year of birth | Position held and
length of service* | Principal occupations during past five years or longer | Current other
public company or
investment
company
directorships |
Olivia S. Mitchell
(Born 1953) | Trustee,
since 2006;
Nominating and
Governance
Committee Chair,
since 2018 | International Foundation of Employee Benefit Plans Professor, Wharton School of the University of Pennsylvania since 1993. Director of Wharton’s Pension Research Council and Boettner Center on Pensions & Retirement Research, and Research Associate at the National Bureau of Economic Research. Previously, Cornell University Professor from 1978 to 1993. | N/A |
Timothy J. Penny
(Born 1951) | Trustee,
since 1996;
Chair,
since 2018 | President and Chief Executive Officer of Southern Minnesota Initiative Foundation, a non-profit organization, since 2007. Member of the Board of Trustees of NorthStar Education Finance, Inc., a non-profit organization, since 2007. | N/A |
James G. Polisson
(Born 1959) | Trustee,
since 2018 | Retired. Chief Marketing Officer, Source (ETF) UK Services, Ltd, from 2015 to 2017. From 2012 to 2015, Principal of The Polisson Group, LLC, a management consulting, corporate advisory and principal investing company. Chief Executive Officer and Managing Director at Russell Investments, Global Exchange Traded Funds from 2010 to 2012. Managing Director of Barclays Global Investors from 1998 to 2010 and Global Chief Marketing Officer for iShares and Barclays Global Investors from 2000 to 2010. Trustee of the San Francisco Mechanics’ Institute, a non-profit organization, from 2013 to 2015. Board member of the Russell Exchange Traded Fund Trust from 2011 to 2012. Director of Barclays Global Investors Holdings Deutschland GmbH from 2006 to 2009. Mr. Polisson is an attorney and has a retired status with the Massachusetts and District of Columbia Bar Associations. | N/A |
Pamela Wheelock
(Born 1959) | Trustee,
since January
2020; previously
Trustee from
January 2018 to
July 2019 | Board member of the Destination Medical Center Economic Development Agency, Rochester, Minnesota since 2019. Interim President of the McKnight Foundation from January to September 2020. Acting Commissioner, Minnesota Department of Human Services, July 2019 through September 2019. Human Services Manager (part-time), Minnesota Department of Human Services, October 2019 through December 2019. Chief Operating Officer, Twin Cities Habitat for Humanity from 2017 to 2019. Vice President of University Services, University of Minnesota from 2012 to 2016. Prior thereto, on the Board of Directors, Governance Committee and Finance Committee for the Minnesota Philanthropy Partners (Saint Paul Foundation) from 2012 to 2018, Interim Chief Executive Officer of Blue Cross Blue Shield of Minnesota from 2011 to 2012, Chairman of the Board from 2009 to 2012 and Board Director from 2003 to 2015. Vice President, Leadership and Community Engagement, Bush Foundation, Saint Paul, Minnesota (a private foundation) from 2009 to 2011. Executive Vice President and Chief Financial Officer, Minnesota Sports and Entertainment from 2004 to 2009 and Senior Vice President from 2002 to 2004. Executive Vice President of the Minnesota Wild Foundation from 2004 to 2008. Commissioner of Finance, State of Minnesota, from 1999 to 2002. Currently Board Chair of the Minnesota Wild Foundation since 2010. | N/A |
* Length of service dates reflect the Trustee’s commencement of service with the Trust’s predecessor entities, where applicable.
Wells Fargo Enterprise Fund | 27
Other information (unaudited)
Officers
Name and
year of birth | Position held and
length of service | Principal occupations during past five years or longer |
Andrew Owen
(Born 1960) | President,
since 2017 | Executive Vice President of Wells Fargo & Company and Head of Affiliated Managers, Wells Fargo Asset Management, since 2014. In addition, Mr. Owen is currently President, Chief Executive Officer and Director of Wells Fargo Funds Management, LLC since 2017. Prior thereto, Executive Vice President responsible for marketing, investments and product development for Wells Fargo Funds Management, LLC, from 2009 to 2014. |
Jeremy DePalma
(Born 1974) | Treasurer,
since 2012
(for certain funds in
the Fund Complex);
since 2021 (for
the remaining funds in the
Fund Complex) | Senior Vice President of Wells Fargo Funds Management, LLC since 2009. Senior Vice President of Evergreen Investment Management Company, LLC from 2008 to 2010 and head of the Fund Reporting and Control Team within Fund Administration from 2005 to 2010. |
Michelle Rhee
(Born 1966) | Chief Legal Officer,
since 2019 | Secretary of Wells Fargo Funds Management, LLC and Chief Legal Counsel of Wells Fargo Asset Management since 2018. Deputy General Counsel of Wells Fargo Bank, N.A. since 2020 and Assistant General Counsel of Wells Fargo Bank, N.A. from 2018 to 2020. Associate General Counsel and Managing Director of Bank of America Corporation from 2004 to 2018. |
Catherine Kennedy
(Born 1969) | Secretary,
since 2019 | Vice President of Wells Fargo Funds Management, LLC and Senior Counsel of the Wells Fargo Legal Department since 2010. Vice President and Senior Counsel of Evergreen Investment Management Company, LLC from 1998 to 2010. |
Michael H. Whitaker
(Born 1967) | Chief Compliance Officer,
since 2016 | Chief Compliance Officer of Wells Fargo Asset Management since 2016. Senior Vice President and Chief Compliance Officer for Fidelity Investments from 2007 to 2016. |
1 The Statement of Additional Information includes additional information about the Trustees and is available, without charge, upon request, by calling 1-800-222-8222 or by visiting the website at wfam.com.
28 | Wells Fargo Enterprise Fund
For more information
More information about Wells Fargo Funds is available free upon request. To obtain literature, please write, visit the Fund's website, or call:
Wells Fargo Funds
P.O. Box 219967
Kansas City, MO 64121-9967
Website: wfam.com
Individual investors: 1-800-222-8222
Retail investment professionals: 1-888-877-9275
Institutional investment professionals: 1-866-765-0778
This report and the financial statements contained herein are submitted for the general information of the shareholders of the Fund. If this report is used for promotional purposes, distribution of the report must be accompanied or preceded by a current prospectus. Before investing, please consider the investment objectives, risks, charges, and expenses of the investment. For a current prospectus and, if available, a summary prospectus, containing this information, call 1-800-222-8222 or visit the Fund's website at wfam.com. Read the prospectus carefully before you invest or send money.
Wells Fargo Asset Management (WFAM) is the trade name for certain investment advisory/management firms owned by Wells Fargo & Company. These firms include but are not limited to Wells Capital Management Incorporated and Wells Fargo Funds Management, LLC. Certain products managed by WFAM entities are distributed by Wells Fargo Funds Distributor, LLC (a broker-dealer and Member FINRA).
This material is for general informational and educational purposes only and is NOT intended to provide investment advice or a recommendation of any kind - including a recommendation for any specific investment, strategy, or plan.
INVESTMENT PRODUCTS: NOT FDIC INSURED ■ NO BANK GUARANTEE ■ MAY LOSE VALUE
© 2021 Wells Fargo & Company. All rights reserved.
PAR-0421-00296 05-21
SA231/SAR231 03-21
Semi-Annual Report
March 31, 2021
Wells Fargo Opportunity Fund
Reduce clutter.
Save trees.
Sign up for electronic delivery of prospectuses and shareholder reports at wellsfargo.com/ advantagedelivery
The views expressed and any forward-looking statements are as of March 31, 2021, unless otherwise noted, and are those of the Fund's portfolio managers and/or Wells Fargo Asset Management. Discussions of individual securities or the markets generally are not intended as individual recommendations. Future events or results may vary significantly from those expressed in any forward-looking statements. The views expressed are subject to change at any time in response to changing circumstances in the market. Wells Fargo Asset Management and the Fund disclaim any obligation to publicly update or revise any views expressed or forward-looking statements.
INVESTMENT PRODUCTS: NOT FDIC INSURED ■ NO BANK GUARANTEE ■ MAY LOSE VALUE
Wells Fargo Opportunity Fund | 1
Letter to shareholders (unaudited)
Andrew Owen
President
Wells Fargo Funds
Dear Shareholder:
We are pleased to offer you this semi-annual report for the Wells Fargo Opportunity Fund for the six-month period that ended March 31, 2021. Despite a deeply challenging year, dominated by the spread of COVID-19 cases and a sharp drop in economic output throughout much of the world, global stocks performed extremely well, benefiting from ongoing central bank support and rising optimism over the development and distribution of effective COVID-19 vaccines. Bonds also had positive returns, led by global bonds and high-yield bonds.
For the six-month period, U.S. stocks, based on the S&P 500 Index,1 gained 19.07%. International stocks, as measured by the MSCI ACWI ex USA Index (Net),2 returned 21.10%, while the MSCI EM Index (Net),3 had even stronger performance, with a 22.43% gain. Among bond indexes, the Bloomberg Barclays U.S. Aggregate Bond Index,4 returned -2.73%, the Bloomberg Barclays Global Aggregate ex-USD Index (unhedged),5 returned -0.47%, and the Bloomberg Barclays Municipal Bond Index,6 returned 1.46% while the ICE BofA U.S. High Yield Index,7 gained 7.44%.
Hope drove the stock markets to new highs.
In October, capital markets stepped back from their six-month rally. Market volatility rose in advance of the U.S. election and amid a global increase in COVID-19 infections. Europe introduced tighter restrictions affecting economic activity. U.S. markets looked favorably at the prospect of Democratic control of the federal purse strings, which could lead to additional fiscal stimulus and a boost to economic activity. Meanwhile, China reported 4.9% third-quarter gross domestic product growth.
Global stocks rallied in November, propelled by optimism over three promising COVID-19 vaccines. Reversing recent trends, value stocks outperformed growth stocks and cyclical stocks outpaced information technology (IT) stocks. However, U.S. unemployment remained elevated, with a net job loss of 10 million since February. The eurozone services purchasing managers’ index contracted sharply while the region’s manufacturing activity grew. The U.S. election results added to the upbeat mood as investors anticipated more consistent policies in the new administration.
“Global stocks rallied in November, propelled by optimism over three promising COVID-19 vaccines.”
| 1 | The S&P 500 Index consists of 500 stocks chosen for market size, liquidity, and industry group representation. It is a market-value-weighted index with each stock's weight in the index proportionate to its market value. You cannot invest directly in an index. |
| 2 | The Morgan Stanley Capital International (MSCI) All Country World Index (ACWI) ex USA Index (Net) is a free-float-adjusted market-capitalization-weighted index that is designed to measure the equity market performance of developed and emerging markets, excluding the United States. Source: MSCI. MSCI makes no express or implied warranties or representations and shall have no liability whatsoever with respect to any MSCI data contained herein. The MSCI data may not be further redistributed or used as a basis for other indices or any securities or financial products. This report is not approved, reviewed, or produced by MSCI. You cannot invest directly in an index. |
| 1 | The S&P 500 Index consists of 500 stocks chosen for market size, liquidity, and industry group representation. It is a market-value-weighted index with each stock's weight in the index proportionate to its market value. You cannot invest directly in an index. |
| 3 | The MSCI Emerging Markets (EM) Index (Net) is a free-float-adjusted market-capitalization-weighted index that is designed to measure equity market performance of emerging markets. You cannot invest directly in an index. |
| 1 | The S&P 500 Index consists of 500 stocks chosen for market size, liquidity, and industry group representation. It is a market-value-weighted index with each stock's weight in the index proportionate to its market value. You cannot invest directly in an index. |
| 4 | The Bloomberg Barclays U.S. Aggregate Bond Index is a broad-based benchmark that measures the investment-grade, U.S. dollar-denominated, fixed-rate taxable bond market, including Treasuries, government-related and corporate securities, mortgage-backed securities (agency fixed-rate and hybrid adjustable-rate mortgage pass-throughs), asset-backed securities, and commercial mortgage-backed securities. You cannot invest directly in an index. |
| 1 | The S&P 500 Index consists of 500 stocks chosen for market size, liquidity, and industry group representation. It is a market-value-weighted index with each stock's weight in the index proportionate to its market value. You cannot invest directly in an index. |
| 5 | The Bloomberg Barclays Global Aggregate ex-USD Index (unhedged) is an unmanaged index that provides a broad-based measure of the global investment-grade fixed-income markets excluding the U.S. dollar-denominated debt market. You cannot invest directly in an index. |
| 1 | The S&P 500 Index consists of 500 stocks chosen for market size, liquidity, and industry group representation. It is a market-value-weighted index with each stock's weight in the index proportionate to its market value. You cannot invest directly in an index. |
| 6 | The Bloomberg Barclays Municipal Bond Index is an unmanaged index composed of long-term tax-exempt bonds with a minimum credit rating of Baa. You cannot invest directly in an index. |
| 1 | The S&P 500 Index consists of 500 stocks chosen for market size, liquidity, and industry group representation. It is a market-value-weighted index with each stock's weight in the index proportionate to its market value. You cannot invest directly in an index. |
| 7 | The ICE BofA U.S. High Yield Index is a market-capitalization-weighted index of domestic and Yankee high-yield bonds. The index tracks the performance of high-yield securities traded in the U.S. bond market. You cannot invest directly in an index. Copyright 2021. ICE Data Indices, LLC. All rights reserved. |
2 | Wells Fargo Opportunity Fund
Letter to shareholders (unaudited)
Financial markets ended the year with strength on high expectations for a rapid rollout of the COVID-19 vaccines, the successful passage of a $900 billion stimulus package, and rising expectations of additional economic support from a Democratic-led Congress. U.S. economic data were mixed with still-elevated unemployment and weak retail sales but growth in manufacturing output. In contrast, China’s economic expansion continued in both manufacturing and nonmanufacturing. U.S. COVID-19 infection rates continued to rise even as new state and local lockdown measures were implemented.
The year 2021 began with emerging market stocks leading all major asset classes in January, driven by China’s strong economic growth and a broad recovery in corporate earnings, which propelled China’s stock market higher. In the U.S., positive news on vaccine trials and January's expansion in both the manufacturing and services sectors were offset by a weak December monthly jobs report. This was compounded by technical factors as some hedge funds were forced to sell stocks to protect themselves against a well-publicized short squeeze coordinated by a group of retail investors. Eurozone sentiment and economic growth were particularly weak, reflecting the impact of a new lockdown with stricter social distancing along with a slow vaccine rollout.
February saw major domestic equity indexes driven higher on the hope of a new stimulus bill, improving COVID-19 vaccination numbers, and the gradual reopening of the economy. Most S&P 500 companies reported better-than-expected earnings, with positive surprises coming from the financials, IT, health care, and materials sectors. Japan saw its economy strengthen as a result of strong export numbers. Meanwhile, crude-oil prices continued their climb, rising more than 25% for the year. Domestic government bonds experienced a sharp sell-off in late February as markets priced in a more robust economic recovery and higher future growth and inflation expectations.
The passage of the massive domestic stimulus bill highlighted March activity, leading to increased forecasts for U.S. growth in 2021. Domestic employment surged as COVID-19 vaccinations and an increasingly open economy spurred hiring. A majority of U.S. small companies reported they are operating at pre-pandemic capacity or higher. Value continued its outperformance of growth in the month, continuing the trend that started in late 2020. Meanwhile, most major developed global equity indexes are up month to date on the back of rising optimism regarding the outlook for global growth. While the U.S. and the U.K. have been the most successful in terms of the vaccine rollout, even within markets where the vaccine has lagged, such as the eurozone and Japan, equity indexes in many of those countries are also in positive territory this year.
Don’t let short-term uncertainty derail long-term investment goals.
Periods of investment uncertainty can present challenges, but experience has taught us that maintaining long-term investment goals can be an effective way to plan for the future. To help you create a sound strategy based on your personal goals and risk tolerance, Wells Fargo Funds offers more than 100 mutual funds spanning a wide range of asset classes and investment styles. Although diversification cannot guarantee an investment profit or prevent losses, we believe it can be an effective way to manage investment risk and potentially smooth out overall portfolio performance. We encourage investors to know their investments and to understand that appropriate levels of risk-taking may unlock opportunities.
Thank you for choosing to invest with Wells Fargo Funds. We appreciate your confidence in us and remain committed to helping you meet your financial needs.
Sincerely,
Andrew Owen
President
Wells Fargo Funds
“The passage of the massive domestic stimulus bill highlighted March activity, leading to increased forecasts for U.S. growth in 2021.”
For further information about your Fund, contact your investment professional, visit our website at wfam.com, or call us directly at 1-800-222-8222.
Wells Fargo Opportunity Fund | 3
Performance highlights (unaudited)
| Investment objective | The Fund seeks long-term capital appreciation. |
| Manager | Wells Fargo Funds Management, LLC |
| Subadviser | Wells Capital Management Incorporated |
| Portfolio managers | Kurt Gunderson, Christopher G. Miller, CFA®‡ |
| Average annual total returns (%) as of March 31, 2021 |
| | | Including sales charge | | Excluding sales charge | | Expense ratios1 (%) |
| | Inception date | 1 year | 5 year | 10 year | | 1 year | 5 year | 10 year | | Gross | Net 2 |
| Class A (SOPVX) | 2-24-2000 | 51.78 | 13.79 | 10.36 | | 61.03 | 15.14 | 11.02 | | 1.21 | 1.18 |
| Class C (WFOPX) | 3-31-2008 | 60.83 | 14.56 | 10.32 | | 61.83 | 14.56 | 10.32 | | 1.96 | 1.93 |
| Class R6 (WOFRX)3 | 5-29-2020 | – | – | – | | 61.74 | 15.66 | 11.52 | | 0.78 | 0.72 |
| Administrator Class (WOFDX) | 8-30-2002 | – | – | – | | 61.34 | 15.38 | 11.25 | | 1.13 | 1.00 |
| Institutional Class (WOFNX) | 7-30-2010 | – | – | – | | 61.70 | 15.66 | 11.52 | | 0.88 | 0.75 |
| Russell 3000® Index4 | – | – | – | – | | 62.53 | 16.64 | 13.79 | | – | – |
Figures quoted represent past performance, which is no guarantee of future results, and do not reflect taxes that a shareholder may pay on an investment in a fund. Investment return and principal value of an investment will fluctuate so that an investor’s shares, when redeemed, may be worth more or less than their original cost. Performance shown without sales charges would be lower if sales charges were reflected. Current performance may be lower or higher than the performance data quoted, which assumes the reinvestment of dividends and capital gains. Current month-end performance is available on the Fund’s website, wfam.com.
Please keep in mind that high double-digit returns were primarily achieved during favorable market conditions. You should not expect that such favorable returns can be consistently achieved. A fund’s performance, especially for short time periods, should not be the sole factor in making your investment decision.
Index returns do not include transaction costs associated with buying and selling securities, any mutual fund fees or expenses, or any taxes. It is not possible to invest directly in an index.
For Class A shares, the maximum front-end sales charge is 5.75%. For Class C shares, the maximum contingent deferred sales charge is 1.00%. Performance including a contingent deferred sales charge assumes the sales charge for the corresponding time period. Class R6, Administrator Class, and Institutional Class shares are sold without a front-end sales charge or contingent deferred sales charge.
| 1 | Reflects the expense ratios as stated in the most recent prospectuses. The expense ratios shown are subject to change and may differ from the annualized expense ratios shown in the financial highlights of this report. |
| 2 | The manager has contractually committed through January 31, 2022, to waive fees and/or reimburse expenses to the extent necessary to cap total annual fund operating expenses after fee waivers at 1.18% for Class A, 1.93% for Class C, 0.72% for Class R6, 1.00% for Administrator Class, and 0.75% for Institutional Class. Brokerage commissions, stamp duty fees, interest, taxes, acquired fund fees and expenses (if any), and extraordinary expenses are excluded from the expense caps. Prior to or after the commitment expiration date, the caps may be increased or the commitment to maintain the caps may be terminated only with the approval of the Board of Trustees. Without these caps, the Fund’s returns would have been lower. The expense ratio paid by an investor is the net expense ratio (the total annual fund operating expenses after fee waivers) as stated in the prospectuses. |
| 3 | Historical performance shown for the Class R6 shares prior to their inception reflects the performance of the Institutional Class shares, and includes the higher expenses applicable to the Institutional Class shares. If these expenses had not been included, returns for the Class R6 shares would be higher. |
| 4 | The Russell 3000® Index measures the performance of the 3,000 largest U.S. companies based on total market capitalization, which represents approximately 98% of the investable U.S. equity market. You cannot invest directly in an index. |
Stock values fluctuate in response to the activities of individual companies and general market and economic conditions. Smaller-company stocks tend to be more volatile and less liquid than those of larger companies. Certain investment strategies tend to increase the total risk of an investment (relative to the broader market). The Fund is exposed to foreign investment risk. Consult the Fund’s prospectus for additional information on these and other risks.
| ‡ | CFA® and Chartered Financial Analyst® are trademarks owned by CFA Institute. |
4 | Wells Fargo Opportunity Fund
Performance highlights (unaudited)
| Ten largest holdings (%) as of March 31, 20211 |
| Alphabet Incorporated Class C | 5.01 |
| Apple Incorporated | 3.77 |
| Amazon.com Incorporated | 3.57 |
| Facebook Incorporated Class A | 3.08 |
| Texas Instruments Incorporated | 2.97 |
| Salesforce.com Incorporated | 2.88 |
| MasterCard Incorporated Class A | 2.75 |
| Burlington Stores Incorporated | 2.27 |
| Carlisle Companies Incorporated | 2.17 |
| Teledyne Technologies Incorporated | 2.04 |
| 1 | Figures represent the percentage of the Fund's net assets. Holdings are subject to change and may have changed since the date specified. |
| Sector allocation as of March 31, 20211 |
| 1 | Figures represent the percentage of the Fund's long-term investments. These amounts are subject to change and may have changed since the date specified. |
Wells Fargo Opportunity Fund | 5
Fund expenses (unaudited)
As a shareholder of the Fund, you incur two types of costs: (1) transaction costs, including sales charges (loads) on purchase payments and contingent deferred sales charges (if any) on redemptions and (2) ongoing costs, including management fees, distribution (12b-1) and/or shareholder servicing fees, and other Fund expenses. This example is intended to help you understand your ongoing costs (in dollars) of investing in the Fund and to compare these costs with the ongoing costs of investing in other mutual funds.
The example is based on an investment of $1,000 invested at the beginning of the six-month period and held for the entire period from October 1, 2020 to March 31, 2021.
Actual expenses
The “Actual” line of the table below provides information about actual account values and actual expenses. You may use the information in this line, together with the amount you invested, to estimate the expenses that you paid over the period. Simply divide your account value by $1,000 (for example, an $8,600 account value divided by $1,000 = 8.6), then multiply the result by the number in the “Actual” line under the heading entitled “Expenses paid during period” for your applicable class of shares to estimate the expenses you paid on your account during this period.
Hypothetical example for comparison purposes
The “Hypothetical” line of the table below provides information about hypothetical account values and hypothetical expenses based on the Fund’s actual expense ratio and an assumed rate of return of 5% per year before expenses, which is not the Fund’s actual return. The hypothetical account values and expenses may not be used to estimate the actual ending account balance or expenses you paid for the period. You may use this information to compare the ongoing costs of investing in the Fund and other funds. To do so, compare this 5% hypothetical example with the 5% hypothetical examples that appear in the shareholder reports of the other funds.
Please note that the expenses shown in the table are meant to highlight your ongoing costs only and do not reflect any transactional costs, such as sales charges (loads) and contingent deferred sales charges. Therefore, the “Hypothetical” line of the table is useful in comparing ongoing costs only and will not help you determine the relative total costs of owning different funds. In addition, if these transactional costs were included, your costs would have been higher.
| | Beginning
account value
10-1-2020 | Ending
account value
3-31-2021 | Expenses
paid during
the period1 | Annualized net
expense ratio |
| Class A | | | | |
| Actual | $1,000.00 | $1,209.86 | $ 6.39 | 1.16% |
| Hypothetical (5% return before expenses) | $1,000.00 | $1,019.15 | $ 5.84 | 1.16% |
| Class C | | | | |
| Actual | $1,000.00 | $1,205.54 | $10.56 | 1.92% |
| Hypothetical (5% return before expenses) | $1,000.00 | $1,015.36 | $ 9.65 | 1.92% |
| Class R6 | | | | |
| Actual | $1,000.00 | $1,212.67 | $ 3.97 | 0.72% |
| Hypothetical (5% return before expenses) | $1,000.00 | $1,021.34 | $ 3.63 | 0.72% |
| Administrator Class | | | | |
| Actual | $1,000.00 | $1,211.01 | $ 5.40 | 0.98% |
| Hypothetical (5% return before expenses) | $1,000.00 | $1,020.04 | $ 4.94 | 0.98% |
| Institutional Class | | | | |
| Actual | $1,000.00 | $1,212.39 | $ 4.14 | 0.75% |
| Hypothetical (5% return before expenses) | $1,000.00 | $1,021.19 | $ 3.78 | 0.75% |
1 Expenses paid is equal to the annualized net expense ratio of each class multiplied by the average account value over the period, multiplied by the number of days in the most recent fiscal half-year divided by the number of days in the fiscal year (to reflect the one-half-year period).
6 | Wells Fargo Opportunity Fund
Portfolio of investments—March 31, 2021 (unaudited)
| | | | | Shares | Value |
| Common stocks: 99.08% | | | | | |
| Communication services: 9.88% | | | | | |
| Interactive media & services: 8.09% | | | | | |
| Alphabet Incorporated Class C † | | | | 47,601 | $ 98,468,857 |
| Facebook Incorporated Class A † | | | | 205,606 | 60,557,135 |
| | | | | | 159,025,992 |
| Wireless telecommunication services: 1.79% | | | | | |
| T-Mobile US Incorporated † | | | | 279,739 | 35,048,499 |
| Consumer discretionary: 10.96% | | | | | |
| Automobiles: 1.91% | | | | | |
| General Motors Company † | | | | 654,205 | 37,590,619 |
| Internet & direct marketing retail: 3.57% | | | | | |
| Amazon.com Incorporated † | | | | 22,687 | 70,195,393 |
| Multiline retail: 1.69% | | | | | |
| Dollar General Corporation | | | | 163,460 | 33,120,265 |
| Specialty retail: 3.79% | | | | | |
| Burlington Stores Incorporated † | | | | 149,165 | 44,570,502 |
| Ulta Beauty Incorporated † | | | | 96,897 | 29,957,645 |
| | | | | | 74,528,147 |
| Consumer staples: 2.80% | | | | | |
| Food & staples retailing: 1.60% | | | | | |
| Sysco Corporation | | | | 400,229 | 31,514,031 |
| Household products: 1.20% | | | | | |
| Church & Dwight Company Incorporated | | | | 269,679 | 23,556,461 |
| Financials: 7.35% | | | | | |
| Capital markets: 4.83% | | | | | |
| CME Group Incorporated | | | | 78,020 | 15,934,025 |
| Intercontinental Exchange Incorporated | | | | 239,129 | 26,705,927 |
| S&P Global Incorporated | | | | 89,832 | 31,699,018 |
| The Charles Schwab Corporation | | | | 314,904 | 20,525,443 |
| | | | | | 94,864,413 |
| Insurance: 2.52% | | | | | |
| Chubb Limited | | | | 129,098 | 20,393,611 |
| Marsh & McLennan Companies Incorporated | | | | 239,732 | 29,199,358 |
| | | | | | 49,592,969 |
| Health care: 14.32% | | | | | |
| Biotechnology: 1.10% | | | | | |
| Alexion Pharmaceuticals Incorporated † | | | | 140,946 | 21,552,053 |
| Health care equipment & supplies: 6.28% | | | | | |
| Align Technology Incorporated † | | | | 54,243 | 29,374,212 |
| Boston Scientific Corporation † | | | | 776,148 | 29,998,120 |
The accompanying notes are an integral part of these financial statements.
Wells Fargo Opportunity Fund | 7
Portfolio of investments—March 31, 2021 (unaudited)
| | | | | Shares | Value |
| Health care equipment & supplies (continued) | | | | | |
| LivaNova plc † | | | | 464,781 | $ 34,268,303 |
| Medtronic plc | | | | 252,429 | 29,819,438 |
| | | | | | 123,460,073 |
| Health care providers & services: 1.97% | | | | | |
| UnitedHealth Group Incorporated | | | | 103,922 | 38,666,259 |
| Life sciences tools & services: 4.46% | | | | | |
| Agilent Technologies Incorporated | | | | 203,614 | 25,887,482 |
| Bio-Rad Laboratories Incorporated Class A † | | | | 49,874 | 28,486,533 |
| Thermo Fisher Scientific Incorporated | | | | 73,028 | 33,328,519 |
| | | | | | 87,702,534 |
| Pharmaceuticals: 0.51% | | | | | |
| Viatris Incorporated † | | | | 719,739 | 10,054,754 |
| Industrials: 17.58% | | | | | |
| Aerospace & defense: 3.22% | | | | | |
| MTU Aero Engines AG | | | | 98,089 | 23,086,315 |
| Teledyne Technologies Incorporated † | | | | 97,083 | 40,158,383 |
| | | | | | 63,244,698 |
| Commercial services & supplies: 1.67% | | | | | |
| Republic Services Incorporated | | | | 329,510 | 32,736,819 |
| Industrial conglomerates: 2.17% | | | | | |
| Carlisle Companies Incorporated | | | | 259,377 | 42,688,267 |
| Machinery: 6.57% | | | | | |
| Fortive Corporation | | | | 550,164 | 38,863,585 |
| Ingersoll Rand Incorporated † | | | | 397,735 | 19,572,539 |
| ITT Incorporated | | | | 288,297 | 26,209,080 |
| Otis Worldwide Corporation | | | | 367,579 | 25,160,783 |
| SPX Corporation † | | | | 331,447 | 19,313,417 |
| | | | | | 129,119,404 |
| Professional services: 1.38% | | | | | |
| Dun & Bradstreet Holdings † | | | | 1,140,951 | 27,166,043 |
| Trading companies & distributors: 2.57% | | | | | |
| Air Lease Corporation | | | | 488,793 | 23,950,857 |
| United Rentals Incorporated † | | | | 80,856 | 26,626,689 |
| | | | | | 50,577,546 |
| Information technology: 26.58% | | | | | |
| Electronic equipment, instruments & components: 1.73% | | | | | |
| Amphenol Corporation Class A | | | | 515,070 | 33,979,168 |
| IT services: 6.01% | | | | | |
| Fidelity National Information Services Incorporated | | | | 229,409 | 32,257,199 |
| Genpact Limited | | | | 743,992 | 31,857,737 |
| MasterCard Incorporated Class A | | | | 151,726 | 54,022,042 |
| | | | | | 118,136,978 |
The accompanying notes are an integral part of these financial statements.
8 | Wells Fargo Opportunity Fund
Portfolio of investments—March 31, 2021 (unaudited)
| | | | | Shares | Value |
| Semiconductors & semiconductor equipment: 5.01% | | | | | |
| Marvell Technology Group Limited | | | | 818,060 | $ 40,068,579 |
| Texas Instruments Incorporated | | | | 308,667 | 58,334,976 |
| | | | | | 98,403,555 |
| Software: 10.06% | | | | | |
| Fair Isaac Corporation † | | | | 62,295 | 30,278,485 |
| Palo Alto Networks Incorporated † | | | | 91,306 | 29,406,010 |
| Proofpoint Incorporated † | | | | 202,000 | 25,409,580 |
| Salesforce.com Incorporated † | | | | 267,283 | 56,629,249 |
| ServiceNow Incorporated † | | | | 36,872 | 18,440,056 |
| Workday Incorporated Class A † | | | | 150,758 | 37,452,810 |
| | | | | | 197,616,190 |
| Technology hardware, storage & peripherals: 3.77% | | | | | |
| Apple Incorporated | | | | 606,549 | 74,089,960 |
| Materials: 2.68% | | | | | |
| Chemicals: 1.84% | | | | | |
| The Sherwin-Williams Company | | | | 24,798 | 18,301,172 |
| Westlake Chemical Corporation | | | | 200,386 | 17,792,273 |
| | | | | | 36,093,445 |
| Metals & mining: 0.84% | | | | | |
| Steel Dynamics Incorporated | | | | 325,361 | 16,515,324 |
| Real estate: 6.93% | | | | | |
| Equity REITs: 6.93% | | | | | |
| American Tower Corporation | | | | 144,777 | 34,610,390 |
| Equinix Incorporated | | | | 46,166 | 31,373,952 |
| Sun Communities Incorporated | | | | 228,572 | 34,294,943 |
| VICI Properties Incorporated | | | | 1,273,482 | 35,963,132 |
| | | | | | 136,242,417 |
| Total Common stocks (Cost $1,078,430,372) | | | | | 1,947,082,276 |
| | | Yield | | | |
| Short-term investments: 1.03% | | | | | |
| Investment companies: 1.03% | | | | | |
| Wells Fargo Government Money Market Fund Select Class ♠∞ | | 0.03% | | 20,331,913 | 20,331,913 |
| Total Short-term investments (Cost $20,331,913) | | | | | 20,331,913 |
| Total investments in securities (Cost $1,098,762,285) | 100.11% | | | | 1,967,414,189 |
| Other assets and liabilities, net | (0.11) | | | | (2,206,951) |
| Total net assets | 100.00% | | | | $1,965,207,238 |
| † | Non-income-earning security |
| ♠ | The issuer of the security is an affiliated person of the Fund as defined in the Investment Company Act of 1940. |
| ∞ | The rate represents the 7-day annualized yield at period end. |
| Abbreviations: |
| REIT | Real estate investment trust |
The accompanying notes are an integral part of these financial statements.
Wells Fargo Opportunity Fund | 9
Portfolio of investments—March 31, 2021 (unaudited)
Investments in affiliates
An affiliated investment is an investment in which the Fund owns at least 5% of the outstanding voting shares of the issuer or as a result of other relationships, such as the Fund and the issuer having the same investment manager. Transactions with issuers that were either affiliated persons of the Fund at the beginning of the period or the end of the period were as follows:
| | Value,
beginning of
period | Purchases | Sales
proceeds | Net
realized
gains
(losses) | Net
change in
unrealized
gains
(losses) | Value,
end of
period | % of
net
assets | Shares,
end
of period | Income
from
affiliated
securities |
| Short-term investments | | | | | | | | | |
| Investment companies | | | | | | | | | |
| Wells Fargo Government Money Market Fund Select Class | $22,715,468 | $159,925,451 | $(162,309,006) | $0 | $0 | $20,331,913 | 1.03% | 20,331,913 | $3,639 |
The accompanying notes are an integral part of these financial statements.
10 | Wells Fargo Opportunity Fund
Statement of assets and liabilities—March 31, 2021 (unaudited)
| | |
| Assets | |
Investments in unaffiliated securities, at value (cost $1,078,430,372)
| $ 1,947,082,276 |
Investments in affiliated securites, at value (cost $20,331,913)
| 20,331,913 |
Foreign currency, at value (cost $63)
| 63 |
Receivable for dividends
| 2,451,664 |
Receivable for Fund shares sold
| 251,534 |
Prepaid expenses and other assets
| 58,844 |
Total assets
| 1,970,176,294 |
| Liabilities | |
Payable for investments purchased
| 2,025,033 |
Management fee payable
| 1,127,320 |
Payable for Fund shares redeemed
| 789,395 |
Shareholder servicing fees payable
| 404,717 |
Administration fees payable
| 325,729 |
Trustees’ fees and expenses payable
| 2,432 |
Distribution fee payable
| 1,175 |
Accrued expenses and other liabilities
| 293,255 |
Total liabilities
| 4,969,056 |
Total net assets
| $1,965,207,238 |
| Net assets consist of | |
Paid-in capital
| $ 1,018,580,907 |
Total distributable earnings
| 946,626,331 |
Total net assets
| $1,965,207,238 |
| Computation of net asset value and offering price per share | |
Net assets – Class A
| $ 1,675,481,950 |
Shares outstanding – Class A1
| 32,293,344 |
Net asset value per share – Class A
| $51.88 |
Maximum offering price per share – Class A2
| $55.05 |
Net assets – Class C
| $ 1,976,756 |
Shares outstanding – Class C1
| 41,574 |
Net asset value per share – Class C
| $47.55 |
Net assets – Class R6
| $ 31,675 |
Shares outstanding – Class R61
| 534 |
Net asset value per share – Class R6
| $59.32 |
Net assets – Administrator Class
| $ 260,306,720 |
Shares outstanding – Administrator Class1
| 4,491,279 |
Net asset value per share – Administrator Class
| $57.96 |
Net assets – Institutional Class
| $ 27,410,137 |
Shares outstanding – Institutional Class1
| 462,135 |
Net asset value per share – Institutional Class
| $59.31 |
| 1 | The Fund has an unlimited number of authorized shares |
| 2 | Maximum offering price is computed as 100/94.25 of net asset value. On investments of $50,000 or more, the offering price is reduced. |
The accompanying notes are an integral part of these financial statements.
Wells Fargo Opportunity Fund | 11
Statement of operations—six months ended March 31, 2021 (unaudited)
| | |
| Investment income | |
Dividends (net of foreign withholdings taxes of $172,114)
| $ 8,278,840 |
Income from affiliated securities
| 3,639 |
Total investment income
| 8,282,479 |
| Expenses | |
Management fee
| 6,733,367 |
| Administration fees | |
Class A
| 1,673,515 |
Class C
| 2,109 |
Class R6
| 5 |
Administrator Class
| 161,031 |
Institutional Class
| 17,415 |
| Shareholder servicing fees | |
Class A
| 1,992,279 |
Class C
| 2,511 |
Administrator Class
| 309,209 |
| Distribution fee | |
Class C
| 7,399 |
Custody and accounting fees
| 36,696 |
Professional fees
| 26,562 |
Registration fees
| 27,842 |
Shareholder report expenses
| 46,007 |
Trustees’ fees and expenses
| 9,610 |
Other fees and expenses
| 38,231 |
Total expenses
| 11,083,788 |
| Less: Fee waivers and/or expense reimbursements | |
Fund-level
| (201,584) |
Class A
| (128,095) |
Class C
| (13) |
Class R6
| (1) |
Administrator Class
| (134,387) |
Institutional Class
| (11,718) |
Net expenses
| 10,607,990 |
Net investment loss
| (2,325,511) |
| Realized and unrealized gains (losses) on investments | |
Net realized gains on investments
| 90,884,220 |
Net change in unrealized gains (losses) on investments
| 263,244,177 |
Net realized and unrealized gains (losses) on investments
| 354,128,397 |
Net increase in net assets resulting from operations
| $351,802,886 |
The accompanying notes are an integral part of these financial statements.
12 | Wells Fargo Opportunity Fund
Statement of changes in net assets
| | |
| | Six months ended
March 31, 2021
(unaudited) | Year ended
September 30, 2020 |
| Operations | | | | |
Net investment income (loss)
| | $ (2,325,511) | | $ 1,110,749 |
Payment from affiliate
| | 0 | | 34,135 |
Net realized gains on investments
| | 90,884,220 | | 104,293,081 |
Net change in unrealized gains (losses) on investments
| | 263,244,177 | | 74,954,479 |
Net increase in net assets resulting from operations
| | 351,802,886 | | 180,392,444 |
| Distributions to shareholders from | | | | |
| Net investment income and net realized gains | | | | |
Class A
| | (96,777,520) | | (85,913,524) |
Class C
| | (127,070) | | (177,607) |
Class R6
| | (1,744) | | 0 1 |
Administrator Class
| | (13,847,101) | | (12,052,779) |
Institutional Class
| | (1,540,976) | | (1,499,585) |
Total distributions to shareholders
| | (112,294,411) | | (99,643,495) |
| Capital share transactions | Shares | | Shares | |
| Proceeds from shares sold | | | | |
Class A
| 164,570 | 8,124,374 | 366,718 | 15,359,130 |
Class C
| 1,527 | 69,059 | 7,277 | 279,818 |
Class R6
| 0 | 0 | 534 1 | 25,000 1 |
Administrator Class
| 30,011 | 1,665,604 | 33,759 | 1,562,280 |
Institutional Class
| 55,670 | 3,114,808 | 161,022 | 7,664,409 |
| | | 12,973,845 | | 24,890,637 |
| Reinvestment of distributions | | | | |
Class A
| 1,960,933 | 94,208,894 | 1,957,543 | 83,556,394 |
Class C
| 2,836 | 125,099 | 4,247 | 166,102 |
Administrator Class
| 245,777 | 13,201,487 | 242,678 | 11,500,332 |
Institutional Class
| 25,254 | 1,390,102 | 27,588 | 1,337,917 |
| | | 108,925,582 | | 96,560,745 |
| Payment for shares redeemed | | | | |
Class A
| (1,690,365) | (83,558,545) | (4,164,215) | (173,332,142) |
Class C
| (16,549) | (743,326) | (51,203) | (1,993,712) |
Administrator Class
| (236,411) | (13,073,837) | (588,564) | (27,709,639) |
Institutional Class
| (95,537) | (5,409,665) | (252,821) | (12,074,682) |
| | | (102,785,373) | | (215,110,175) |
Net increase (decrease) in net assets resulting from capital share transactions
| | 19,114,054 | | (93,658,793) |
Total increase (decrease) in net assets
| | 258,622,529 | | (12,909,844) |
| Net assets | | | | |
Beginning of period
| | 1,706,584,709 | | 1,719,494,553 |
End of period
| | $1,965,207,238 | | $1,706,584,709 |
| 1 | For the period from May 29, 2020 (commencement of class operations) to September 30, 2020 |
The accompanying notes are an integral part of these financial statements.
Wells Fargo Opportunity Fund | 13
Financial highlights
(For a share outstanding throughout each period)
| | | Year ended September 30 |
| Class A | Six months ended
March 31, 2021
(unaudited) | 2020 | 2019 | 2018 | 2017 | 2016 |
Net asset value, beginning of period
| $45.64 | $43.37 | $46.31 | $45.83 | $41.86 | $43.35 |
Net investment income (loss)
| (0.07) | 0.01 | 0.10 | (0.01) 1 | 0.04 | 0.13 1 |
Payment from affiliate
| 0.00 | 0.00 2 | 0.00 | 0.00 | 0.00 | 0.00 |
Net realized and unrealized gains on investments
| 9.40 | 4.85 | 1.54 | 6.41 | 6.60 | 4.72 |
Total from investment operations
| 9.33 | 4.86 | 1.64 | 6.40 | 6.64 | 4.85 |
| Distributions to shareholders from | | | | | | |
Net investment income
| (0.02) | (0.10) | 0.00 | (0.17) | (0.13) | (0.57) |
Net realized gains
| (3.07) | (2.49) | (4.58) | (5.75) | (2.54) | (5.77) |
Total distributions to shareholders
| (3.09) | (2.59) | (4.58) | (5.92) | (2.67) | (6.34) |
Net asset value, end of period
| $51.88 | $45.64 | $43.37 | $46.31 | $45.83 | $41.86 |
Total return3
| 20.99% | 11.62% 4 | 5.18% | 15.16% | 16.49% | 12.46% |
| Ratios to average net assets (annualized) | | | | | | |
Gross expenses
| 1.20% | 1.21% | 1.21% | 1.20% | 1.21% | 1.21% |
Net expenses
| 1.16% | 1.16% | 1.19% | 1.20% | 1.21% | 1.21% |
Net investment income (loss)
| (0.28)% | 0.04% | 0.23% | (0.01)% | 0.11% | 0.33% |
| Supplemental data | | | | | | |
Portfolio turnover rate
| 16% | 43% | 28% | 30% | 43% | 34% |
Net assets, end of period (000s omitted)
| $1,675,482 | $1,453,975 | $1,461,345 | $1,528,852 | $1,479,457 | $1,418,614 |
| 1 | Calculated based upon average shares outstanding |
| 2 | Amount is less than $0.005. |
| 3 | Total return calculations do not include any sales charges. Returns for periods of less than one year are not annualized. |
| 4 | During the year ended September 30, 2020, the Fund received a payment from an affiliate that had an impact of less than 0.005% on the total return. See Note 4 in the Notes to Financial Statements for additional information. |
The accompanying notes are an integral part of these financial statements.
14 | Wells Fargo Opportunity Fund
Financial highlights
(For a share outstanding throughout each period)
| | | Year ended September 30 |
| Class C | Six months ended
March 31, 2021
(unaudited) | 2020 | 2019 | 2018 | 2017 | 2016 |
Net asset value, beginning of period
| $42.19 | $40.02 | $43.43 | $43.46 | $39.99 | $41.60 |
Net investment loss
| (0.24) 1 | (0.28) 1 | (0.26) 1 | (0.43) | (0.26) 1 | (0.16) 1 |
Payment from affiliate
| 0.00 | 0.54 | 0.00 | 0.00 | 0.00 | 0.00 |
Net realized and unrealized gains on investments
| 8.67 | 4.40 | 1.43 | 6.15 | 6.27 | 4.51 |
Total from investment operations
| 8.43 | 4.66 | 1.17 | 5.72 | 6.01 | 4.35 |
| Distributions to shareholders from | | | | | | |
Net investment income
| 0.00 | 0.00 | 0.00 | 0.00 | 0.00 | (0.19) |
Net realized gains
| (3.07) | (2.49) | (4.58) | (5.75) | (2.54) | (5.77) |
Total distributions to shareholders
| (3.07) | (2.49) | (4.58) | (5.75) | (2.54) | (5.96) |
Net asset value, end of period
| $47.55 | $42.19 | $40.02 | $43.43 | $43.46 | $39.99 |
Total return2
| 20.55% | 12.13% 3 | 4.37% | 14.31% | 15.62% | 11.62% |
| Ratios to average net assets (annualized) | | | | | | |
Gross expenses
| 1.94% | 1.94% | 1.96% | 1.95% | 1.96% | 1.96% |
Net expenses
| 1.92% | 1.92% | 1.95% | 1.95% | 1.96% | 1.96% |
Net investment loss
| (1.06)% | (0.71)% | (0.69)% | (0.76)% | (0.64)% | (0.40)% |
| Supplemental data | | | | | | |
Portfolio turnover rate
| 16% | 43% | 28% | 30% | 43% | 34% |
Net assets, end of period (000s omitted)
| $1,977 | $2,268 | $3,739 | $31,381 | $33,057 | $34,721 |
| 1 | Calculated based upon average shares outstanding |
| 2 | Total return calculations do not include any sales charges. Returns for periods of less than one year are not annualized. |
| 3 | During the year ended September 30, 2020, the Fund received a payment from an affiliate which had a 1.44% impact on the total return. See Note 4 in the Notes to Financial Statements for additional information. |
The accompanying notes are an integral part of these financial statements.
Wells Fargo Opportunity Fund | 15
Financial highlights
(For a share outstanding throughout each period)
| | | Year ended September 30 |
| Class R6 | Six months ended
March 31, 2021
(unaudited) | 2020 1 |
Net asset value, beginning of period
| $51.83 | $46.84 |
Net investment income
| 0.05 | 0.04 |
Net realized and unrealized gains on investments
| 10.71 | 4.95 |
Total from investment operations
| 10.76 | 4.99 |
| Distributions to shareholders from | | |
Net investment income
| (0.20) | 0.00 |
Net realized gains
| (3.07) | 0.00 |
Total distributions to shareholders
| (3.27) | 0.00 |
Net asset value, end of period
| $59.32 | $51.83 |
Total return2
| 21.27% | 10.65% |
| Ratios to average net assets (annualized) | | |
Gross expenses
| 0.76% | 0.76% |
Net expenses
| 0.72% | 0.72% |
Net investment income
| 0.16% | 0.25% |
| Supplemental data | | |
Portfolio turnover rate
| 16% | 43% |
Net assets, end of period (000s omitted)
| $32 | $28 |
| 1 | For the period from May 29, 2020 (commencement of class operations) to September 30, 2020 |
| 2 | Returns for periods of less than one year are not annualized. |
The accompanying notes are an integral part of these financial statements.
16 | Wells Fargo Opportunity Fund
Financial highlights
(For a share outstanding throughout each period)
| | | Year ended September 30 |
| Administrator Class | Six months ended
March 31, 2021
(unaudited) | 2020 | 2019 | 2018 | 2017 | 2016 |
Net asset value, beginning of period
| $50.68 | $47.85 | $50.50 | $49.45 | $44.93 | $46.11 |
Net investment income (loss)
| (0.04) | 0.18 | 0.21 | 0.07 | 0.15 1 | 0.24 1 |
Net realized and unrealized gains on investments
| 10.48 | 5.30 | 1.73 | 6.97 | 7.09 | 5.04 |
Total from investment operations
| 10.44 | 5.48 | 1.94 | 7.04 | 7.24 | 5.28 |
| Distributions to shareholders from | | | | | | |
Net investment income
| (0.09) | (0.16) | (0.01) | (0.24) | (0.18) | (0.69) |
Net realized gains
| (3.07) | (2.49) | (4.58) | (5.75) | (2.54) | (5.77) |
Total distributions to shareholders
| (3.16) | (2.65) | (4.59) | (5.99) | (2.72) | (6.46) |
Net asset value, end of period
| $57.96 | $50.68 | $47.85 | $50.50 | $49.45 | $44.93 |
Total return2
| 21.10% | 11.85% | 5.37% | 15.38% | 16.74% | 12.68% |
| Ratios to average net assets (annualized) | | | | | | |
Gross expenses
| 1.12% | 1.13% | 1.13% | 1.12% | 1.13% | 1.13% |
Net expenses
| 0.98% | 0.97% | 1.00% | 1.00% | 1.00% | 1.00% |
Net investment income (loss)
| (0.09)% | 0.22% | 0.42% | 0.19% | 0.31% | 0.56% |
| Supplemental data | | | | | | |
Portfolio turnover rate
| 16% | 43% | 28% | 30% | 43% | 34% |
Net assets, end of period (000s omitted)
| $260,307 | $225,604 | $227,963 | $244,110 | $237,315 | $226,140 |
| 1 | Calculated based upon average shares outstanding |
| 2 | Returns for periods of less than one year are not annualized. |
The accompanying notes are an integral part of these financial statements.
Wells Fargo Opportunity Fund | 17
Financial highlights
(For a share outstanding throughout each period)
| | | Year ended September 30 |
| Institutional Class | Six months ended
March 31, 2021
(unaudited) | 2020 | 2019 | 2018 | 2017 | 2016 |
Net asset value, beginning of period
| $51.83 | $48.89 | $51.50 | $50.30 | $45.63 | $46.76 |
Net investment income
| 0.04 1 | 0.34 | 0.35 | 0.22 | 0.22 1 | 0.35 1 |
Net realized and unrealized gains on investments
| 10.70 | 5.37 | 1.74 | 7.08 | 7.25 | 5.12 |
Total from investment operations
| 10.74 | 5.71 | 2.09 | 7.30 | 7.47 | 5.47 |
| Distributions to shareholders from | | | | | | |
Net investment income
| (0.19) | (0.28) | (0.12) | (0.35) | (0.26) | (0.83) |
Net realized gains
| (3.07) | (2.49) | (4.58) | (5.75) | (2.54) | (5.77) |
Total distributions to shareholders
| (3.26) | (2.77) | (4.70) | (6.10) | (2.80) | (6.60) |
Net asset value, end of period
| $59.31 | $51.83 | $48.89 | $51.50 | $50.30 | $45.63 |
Total return2
| 21.24% | 12.09% | 5.63% | 15.69% | 17.02% | 12.97% |
| Ratios to average net assets (annualized) | | | | | | |
Gross expenses
| 0.87% | 0.88% | 0.88% | 0.87% | 0.88% | 0.88% |
Net expenses
| 0.75% | 0.75% | 0.75% | 0.75% | 0.75% | 0.75% |
Net investment income
| 0.13% | 0.44% | 0.66% | 0.44% | 0.47% | 0.79% |
| Supplemental data | | | | | | |
Portfolio turnover rate
| 16% | 43% | 28% | 30% | 43% | 34% |
Net assets, end of period (000s omitted)
| $27,410 | $24,710 | $26,447 | $29,562 | $29,709 | $17,222 |
| 1 | Calculated based upon average shares outstanding |
| 2 | Returns for periods of less than one year are not annualized. |
The accompanying notes are an integral part of these financial statements.
18 | Wells Fargo Opportunity Fund
Notes to financial statements (unaudited)
1. ORGANIZATION
Wells Fargo Funds Trust (the "Trust"), a Delaware statutory trust organized on March 10, 1999, is an open-end management investment company registered under the Investment Company Act of 1940, as amended (the "1940 Act"). As an investment company, the Trust follows the accounting and reporting guidance in Financial Accounting Standards Board (“FASB”) Accounting Standards Codification Topic 946, Financial Services – Investment Companies. These financial statements report on the Wells Fargo Opportunity Fund (the "Fund") which is a diversified series of the Trust.
On February 23, 2021, Wells Fargo & Company announced that it has entered into a definitive agreement to sell Wells Fargo Asset Management ("WFAM") to GTCR LLC and Reverence Capital Partners, L.P. WFAM is the trade name used by the asset management businesses of Wells Fargo & Company and includes Wells Fargo Funds Management, LLC, the investment manager to the Fund, Wells Capital Management Incorporated and Wells Fargo Asset Management (International) Limited, both registered investment advisers providing sub-advisory services to certain funds, and Wells Fargo Funds Distributor, LLC, the Fund's principal underwriter. As part of the transaction, Wells Fargo & Company will own a 9.9% equity interest and will continue to serve as an important client and distribution partner. The transaction is expected to close in the second half of 2021, subject to customary closing conditions.
Consummation of the transaction will result in the automatic termination of the Fund's investment management agreement and sub-advisory agreement. The Fund's Board of Trustees will be asked to approve new investment management arrangements with the new company. If approved by the Board, the new investment management arrangements with the new company will be presented to the shareholders of the Fund for approval, and, if approved by shareholders, would take effect upon the closing of the transaction. The transaction is expected to close in the second half of 2021, subject to customary closing conditions.
2. SIGNIFICANT ACCOUNTING POLICIES
The following significant accounting policies, which are consistently followed in the preparation of the financial statements of the Fund, are in conformity with U.S. generally accepted accounting principles which require management to make estimates and assumptions that affect the reported amounts of assets and liabilities, disclosure of contingent assets and liabilities at the date of the financial statements, and the reported amounts of income and expenses during the reporting period. Actual results could differ from those estimates.
Securities valuation
All investments are valued each business day as of the close of regular trading on the New York Stock Exchange (generally 4 p.m. Eastern Time), although the Fund may deviate from this calculation time under unusual or unexpected circumstances.
Equity securities that are listed on a foreign or domestic exchange or market are valued at the official closing price or, if none, the last sales price. If no sale occurs on the principal exchange or market that day, a fair value price will be determined in accordance with the Fund’s Valuation Procedures.
The values of securities denominated in foreign currencies are translated into U.S. dollars at rates provided by an independent foreign currency pricing source at a time each business day specified by the Wells Fargo Asset Management Pricing Committee at Wells Fargo Funds Management, LLC ("Funds Management").
Many securities markets and exchanges outside the U.S. close prior to the close of the New York Stock Exchange and therefore may not fully reflect trading or events that occur after the close of the principal exchange in which the foreign securities are traded, but before the close of the New York Stock Exchange. If such trading or events are expected to materially affect the value of such securities, then fair value pricing procedures approved by the Board of Trustees of the Fund are applied. These procedures take into account multiple factors including movements in U.S. securities markets after foreign exchanges close. Foreign securities that are fair valued under these procedures are categorized as Level 2 and the application of these procedures may result in transfers between Level 1 and Level 2. Depending on market activity, such fair valuations may be frequent. Such fair value pricing may result in net asset values that are higher or lower than net asset values based on the last reported sales price or latest quoted bid price. On March 31, 2021, such fair value pricing was not used in pricing foreign securities.
Investments in registered open-end investment companies are valued at net asset value. Interests in non-registered investment companies that are redeemable at net asset value are fair valued normally at net asset value.
Investments which are not valued using any of the methods discussed above are valued at their fair value, as determined in good faith by the Board of Trustees. The Board of Trustees has established a Valuation Committee comprised of the Trustees and has delegated to it the authority to take any actions regarding the valuation of portfolio securities that the Valuation
Wells Fargo Opportunity Fund | 19
Notes to financial statements (unaudited)
Committee deems necessary or appropriate, including determining the fair value of portfolio securities, unless the determination has been delegated to the Wells Fargo Asset Management Pricing Committee. The Board of Trustees retains the authority to make or ratify any valuation decisions or approve any changes to the Valuation Procedures as it deems appropriate. On a quarterly basis, the Board of Trustees receives reports on any valuation actions taken by the Valuation Committee or the Wells Fargo Asset Management Pricing Committee which may include items for ratification.
Foreign currency translation
The accounting records of the Fund are maintained in U.S. dollars. The values of other assets and liabilities denominated in foreign currencies are translated into U.S. dollars at rates provided by an independent foreign currency pricing source at a time each business day specified by the Wells Fargo Asset Management Pricing Committee. Purchases and sales of securities, and income and expenses are converted at the rate of exchange on the respective dates of such transactions. Net realized foreign exchange gains or losses arise from sales of foreign currencies, currency gains or losses realized between the trade and settlement dates on securities transactions, and the difference between the amounts of dividends, interest and foreign withholding taxes recorded and the U.S. dollar equivalent of the amounts actually paid or received. Net unrealized foreign exchange gains and losses arise from changes in the fair value of assets and liabilities other than investments in securities resulting from changes in exchange rates. The changes in net assets arising from changes in exchange rates of securities and the changes in net assets resulting from changes in market prices of securities are not separately presented. Such changes are included in net realized and unrealized gains or losses from investments.
Securities lending
The Fund may lend its securities from time to time in order to earn additional income in the form of fees or interest on securities received as collateral or the investment of any cash received as collateral. When securities are on loan, the Fund receives interest or dividends on those securities. Cash collateral received in connection with its securities lending transactions is invested in Securities Lending Cash Investments, LLC (the "Securities Lending Fund"). Investments in Securities Lending Fund are valued at the evaluated bid price provided by an independent pricing service. Income earned from investment in the Securities Lending Fund (net of fees and rebates), if any, is included in income from affiliated securities on the Statement of Operations.
In a securities lending transaction, the net asset value of the Fund is affected by an increase or decrease in the value of the securities loaned and by an increase or decrease in the value of the instrument in which collateral is invested. The amount of securities lending activity undertaken by the Fund fluctuates from time to time. The Fund has the right under the lending agreement to recover the securities from the borrower on demand. In the event of default or bankruptcy by the borrower, the Fund may be prevented from recovering the loaned securities or gaining access to the collateral or may experience delays or costs in doing so. In such an event, the terms of the agreement allow the unaffiliated securities lending agent to use the collateral to purchase replacement securities on behalf of the Fund or pay the Fund the market value of the loaned securities. The Fund bears the risk of loss with respect to depreciation of its investment of the cash collateral.
Security transactions and income recognition
Securities transactions are recorded on a trade date basis. Realized gains or losses are recorded on the basis of identified cost.
Dividend income is recognized on the ex-dividend date, except for certain dividends from foreign securities, which are recorded as soon as the custodian verifies the ex-dividend date. Dividend income from foreign securities is recorded net of foreign taxes withheld where recovery of such taxes is not assured.
Distributions to shareholders
Distributions to shareholders from net investment income and any net realized gains are recorded on the ex-dividend date and paid at least annually. Such distributions are determined in accordance with income tax regulations and may differ from U.S. generally accepted accounting principles. Dividend sources are estimated at the time of declaration. The tax character of distributions is determined as of the Fund's fiscal year end. Therefore, a portion of the Fund's distributions made prior to the Fund’s fiscal year end may be categorized as a tax return of capital at year end.
Federal and other taxes
The Fund intends to continue to qualify as a regulated investment company by distributing substantially all of its investment company taxable income and any net realized capital gains (after reduction for capital loss carryforwards) sufficient to relieve it from all, or substantially all, federal income taxes. Accordingly, no provision for federal income taxes was required.
The Fund’s income and federal excise tax returns and all financial records supporting those returns for the prior three fiscal years are subject to examination by the federal and Delaware revenue authorities. Management has analyzed the Fund's tax
20 | Wells Fargo Opportunity Fund
Notes to financial statements (unaudited)
positions taken on federal, state, and foreign tax returns for all open tax years and does not believe that there are any uncertain tax positions that require recognition of a tax liability.
As of March 31, 2021, the aggregate cost of all investments for federal income tax purposes was $1,100,906,842 and the unrealized gains (losses) consisted of:
| Gross unrealized gains | $873,747,992 |
| Gross unrealized losses | (7,240,645) |
| Net unrealized gains | $866,507,347 |
Class allocations
The separate classes of shares offered by the Fund differ principally in applicable sales charges, distribution, shareholder servicing, and administration fees. Class specific expenses are charged directly to that share class. Investment income, common fund-level expenses, and realized and unrealized gains (losses) on investments are allocated daily to each class of shares based on the relative proportion of net assets of each class.
3. FAIR VALUATION MEASUREMENTS
Fair value measurements of investments are determined within a framework that has established a fair value hierarchy based upon the various data inputs utilized in determining the value of the Fund’s investments. The three-level hierarchy gives the highest priority to unadjusted quoted prices in active markets for identical assets or liabilities (Level 1) and the lowest priority to unobservable inputs (Level 3). The Fund’s investments are classified within the fair value hierarchy based on the lowest level of input that is significant to the fair value measurement. The inputs are summarized into three broad levels as follows:
| ■ | Level 1 – quoted prices in active markets for identical securities |
| ■ | Level 2 – other significant observable inputs (including quoted prices for similar securities, interest rates, prepayment speeds, credit risk, etc.) |
| ■ | Level 3 – significant unobservable inputs (including the Fund’s own assumptions in determining the fair value of investments) |
The inputs or methodologies used for valuing investments in securities are not necessarily an indication of the risk associated with investing in those securities.
The following is a summary of the inputs used in valuing the Fund’s assets and liabilities as of March 31, 2021:
| | Quoted prices
(Level 1) | Other significant
observable inputs
(Level 2) | Significant
unobservable inputs
(Level 3) | Total |
| Assets | | | | |
| Investments in: | | | | |
| Common stocks | | | | |
| Communication services | $ 194,074,491 | $0 | $0 | $ 194,074,491 |
| Consumer discretionary | 215,434,424 | 0 | 0 | 215,434,424 |
| Consumer staples | 55,070,492 | 0 | 0 | 55,070,492 |
| Financials | 144,457,382 | 0 | 0 | 144,457,382 |
| Health care | 281,435,673 | 0 | 0 | 281,435,673 |
| Industrials | 345,532,777 | 0 | 0 | 345,532,777 |
| Information technology | 522,225,851 | 0 | 0 | 522,225,851 |
| Materials | 52,608,769 | 0 | 0 | 52,608,769 |
| Real estate | 136,242,417 | 0 | 0 | 136,242,417 |
| Short-term investments | | | | |
| Investment companies | 20,331,913 | 0 | 0 | 20,331,913 |
| Total assets | $1,967,414,189 | $0 | $0 | $1,967,414,189 |
Additional sector, industry or geographic detail, if any, is included in the Portfolio of Investments.
For the six months ended March 31, 2021, the Fund did not have any transfers into/out of Level 3.
Wells Fargo Opportunity Fund | 21
Notes to financial statements (unaudited)
4. TRANSACTIONS WITH AFFILIATES
Management fee
Funds Management, an indirect wholly owned subsidiary of Wells Fargo & Company ("Wells Fargo"), is the manager of the Fund and provides advisory and fund-level administrative services under an investment management agreement. Under the investment management agreement, Funds Management is responsible for, among other services, implementing the investment objectives and strategies of the Fund, supervising the subadviser and providing fund-level administrative services in connection with the Fund’s operations. As compensation for its services under the investment management agreement, Funds Management is entitled to receive a management fee at the following annual rate based on the Fund’s average daily net assets:
| Average daily net assets | Management fee |
| First $500 million | 0.750% |
| Next $500 million | 0.725 |
| Next $1 billion | 0.700 |
| Next $2 billion | 0.675 |
| Next $1 billion | 0.650 |
| Next $5 billion | 0.640 |
| Next $2 billion | 0.630 |
| Next $4 billion | 0.620 |
| Over $16 billion | 0.610 |
For the six months ended March 31, 2021, the management fee was equivalent to an annual rate of 0.72% of the Fund’s average daily net assets.
Funds Management has retained the services of a subadviser to provide daily portfolio management to the Fund. The fee for subadvisory services is borne by Funds Management. Wells Capital Management Incorporated ("WellsCap"), an affiliate of Funds Management and an indirect wholly owned subsidiary of Wells Fargo, is the subadviser to the Fund and is entitled to receive a fee from Funds Management at an annual rate starting at 0.45% and declining to 0.30% as the average daily net assets of the Fund increase.
Administration fees
Under a class-level administration agreement, Funds Management provides class-level administrative services to the Fund, which includes paying fees and expenses for services provided by the transfer agent, sub-transfer agents, omnibus account servicers and record-keepers. As compensation for its services under the class-level administration agreement, Funds Management receives an annual fee which is calculated based on the average daily net assets of each class as follows:
| | Class-level
administration fee |
| Class A | 0.21% |
| Class C | 0.21 |
| Class R6 | 0.03 |
| Administrator Class | 0.13 |
| Institutional Class | 0.13 |
Waivers and/or expense reimbursements
Funds Management has contractually waived and/or reimbursed management and administration fees to the extent necessary to maintain certain net operating expense ratios for the Fund. When each class of the Fund has exceeded its expense cap, Funds Management has waived fees and/or reimbursed expenses from fund-level expenses on a proportionate basis and then from class specific expenses. When only certain classes exceed their expense caps, waivers and/or reimbursements are applied against class specific expenses before fund-level expenses. Funds Management has committed through January 31, 2022 to waive fees and/or reimburse expenses to the extent necessary to cap expenses. Prior to or after the commitment expiration
22 | Wells Fargo Opportunity Fund
Notes to financial statements (unaudited)
date, the cap may be increased or the commitment to maintain the cap may be terminated only with the approval of the Board of Trustees. The contractual expense caps are as follows:
| | Expense ratio caps |
| Class A | 1.18% |
| Class C | 1.93 |
| Class R6 | 0.72 |
| Administrator Class | 1.00 |
| Institutional Class | 0.75 |
Distribution fee
The Trust has adopted a distribution plan for Class C shares of the Fund pursuant to Rule 12b-1 under the 1940 Act. A distribution fee is charged charged to Class C shares and paid to Wells Fargo Funds Distributor, LLC (“Funds Distributor”), the principal underwriter, at an annual rate of 0.75% of the average daily net assets of Class C shares.
In addition, Funds Distributor is entitled to receive the front-end sales charge from the purchase of Class A shares and a contingent deferred sales charge on the redemption of certain Class A shares. Funds Distributor is also entitled to receive the contingent deferred sales charges from redemptions of Class C shares. For the six months ended March 31, 2021, Funds Distributor received $3,651 from the sale of Class A shares. No contingent deferred sales charges were incurred by Class A and Class C shares for the six months ended March 31, 2021.
Shareholder servicing fees
The Trust has entered into contracts with one or more shareholder servicing agents, whereby Class A, Class C, and Administrator Class of the Fund are charged a fee at an annual rate of 0.25% of the average daily net assets of each respective class. A portion of these total shareholder servicing fees were paid to affiliates of Wells Fargo.
Interfund transactions
The Fund may purchase or sell portfolio investment securities to certain other Wells Fargo affiliates pursuant to Rule 17a-7 under the 1940 Act and under procedures adopted by the Board of Trustees. The procedures have been designed to ensure that these interfund transactions, which do not incur broker commissions, are effected at current market prices.
Other transactions
On August 14, 2020, Class A and Class C of the Fund was reimbursed by Funds Management in the amount of $5,051 and $29,084, respectively. The reimbursements were made in connection with resolving certain fee reimbursements.
5. INVESTMENT PORTFOLIO TRANSACTIONS
Purchases and sales of investments, excluding U.S. government obligations (if any) and short-term securities, for the six months ended March 31, 2021 were $284,512,562 and $375,805,281, respectively.
6. SECURITIES LENDING TRANSACTIONS
The Fund lends its securities through an unaffiliated securities lending agent and receives collateral in the form of cash or securities with a value at least equal to the value of the securities on loan. The value of the loaned securities is determined at the close of each business day and any increases or decreases in the required collateral are exchanged between the Fund and the counterparty on the next business day. Cash collateral received is invested in the Securities Lending Fund which seeks to provide a positive return compared to the daily Federal Funds Open Rate by investing in high-quality, U.S. dollar-denominated short-term money market instruments and is exempt from registration under Section 3(c)(7) of the 1940 Act. Securities Lending Fund is managed by Funds Management and is subadvised by WellsCap. Funds Management receives an advisory fee starting at 0.05% and declining to 0.01% as the average daily net assets of the Securities Lending Fund increase. All of the fees received by Funds Management are paid to WellsCap for its services as subadviser.
In the event of counterparty default or the failure of a borrower to return a loaned security, the Fund has the right to use the collateral to offset any losses incurred. As of March 31, 2021, the Fund did not have any securities on loan.
Wells Fargo Opportunity Fund | 23
Notes to financial statements (unaudited)
7. BANK BORROWINGS
The Trust (excluding the money market funds), Wells Fargo Master Trust and Wells Fargo Variable Trust are parties to a $350,000,000 revolving credit agreement whereby the Fund is permitted to use bank borrowings for temporary or emergency purposes, such as to fund shareholder redemption requests. Interest under the credit agreement is charged to the Fund based on a borrowing rate equal to the higher of the Federal Funds rate in effect on that day plus 1.25% or the overnight LIBOR rate in effect on that day plus 1.25%. In addition, an annual commitment fee equal to 0.25% of the unused balance is allocated to each participating fund.
For the six months ended March 31, 2021, there were no borrowings by the Fund under the agreement.
8. CONCENTRATION RISKS
As of the end of the period, the Fund concentrated its portfolio of investments in the information technology sector. A fund that invests a substantial portion of its assets in any sector may be more affected by changes in that sector than would be a fund whose investments are not heavily weighted in any sector.
9. INDEMNIFICATION
Under the Fund's organizational documents, the officers and Trustees have been granted certain indemnification rights against certain liabilities that may arise out of performance of their duties to the Fund. The Fund has entered into a separate agreement with each Trustee that converts indemnification rights currently existing under the Fund’s organizational documents into contractual rights that cannot be changed in the future without the consent of the Trustee. Additionally, in the normal course of business, the Fund may enter into contracts with service providers that contain a variety of indemnification clauses. The Fund’s maximum exposure under these arrangements is dependent on future claims that may be made against the Fund and, therefore, cannot be estimated.
10. CORONAVIRUS (COVID-19) PANDEMIC
On March 11, 2020, the World Health Organization announced that it had made the assessment that coronavirus disease 2019 (“COVID-19”) is a pandemic. The impacts of COVID-19 are affecting the entire global economy, individual companies and investment products, the funds, and the market in general. There is significant uncertainty around the extent and duration of business disruptions related to COVID-19 and the impacts may last for an extended period of time. COVID-19 has led to significant uncertainty and volatility in the financial markets.
24 | Wells Fargo Opportunity Fund
Other information (unaudited)
PROXY VOTING INFORMATION
A description of the policies and procedures used to determine how to vote proxies relating to portfolio securities is available without charge, upon request, by calling 1-800-222-8222, visiting our website at wfam.com, or visiting the SEC website at sec.gov. Information regarding how the proxies related to portfolio securities were voted during the most recent 12-month period ended June 30 is available on the website at wfam.com or by visiting the SEC website at sec.gov.
QUARTERLY PORTFOLIO HOLDINGS INFORMATION
The Fund files its complete schedule of portfolio holdings with the SEC for the first and third quarters of each fiscal year as an exhibit to its reports on Form N-PORT. Shareholders may view the filed Form N-PORT by visiting the SEC website at sec.gov.
Wells Fargo Opportunity Fund | 25
Other information (unaudited)
BOARD OF TRUSTEES AND OFFICERS
Each of the Trustees and Officers listed in the table below acts in identical capacities for each fund in the Wells Fargo family of funds, which consists of 142 mutual funds comprising the Wells Fargo Funds Trust, Wells Fargo Variable Trust, Wells Fargo Master Trust and four closed-end funds (collectively the “Fund Complex”). This table should be read in conjunction with the Prospectus and the Statement of Additional Information1. The mailing address of each Trustee and Officer is 525 Market Street, 12th Floor, San Francisco, CA 94105. Each Trustee and Officer serves an indefinite term, however, each Trustee serves such term until reaching the mandatory retirement age established by the Trustees.
Independent Trustees
Name and
year of birth | Position held and
length of service* | Principal occupations during past five years or longer | Current other
public company or
investment
company
directorships |
William R. Ebsworth
(Born 1957) | Trustee,
since 2015 | Retired. From 1984 to 2013, equities analyst, portfolio manager, research director and chief investment officer at Fidelity Management and Research Company in Boston, Tokyo, and Hong Kong, and retired in 2013 as Chief Investment Officer of Fidelity Strategic Advisers, Inc. where he led a team of investment professionals managing client assets. Prior thereto, Board member of Hong Kong Securities Clearing Co., Hong Kong Options Clearing Corp., the Thailand International Fund, Ltd., Fidelity Investments Life Insurance Company, and Empire Fidelity Investments Life Insurance Company. Audit Committee Chair and Investment Committee Chair of the Vincent Memorial Hospital Endowment (non-profit organization). Mr. Ebsworth is a CFA® charterholder. | N/A |
Jane A. Freeman
(Born 1953) | Trustee,
since 2015;
Chair Liaison,
since 2018 | Retired. From 2012 to 2014 and 1999 to 2008, Chief Financial Officer of Scientific Learning Corporation. From 2008 to 2012, Ms. Freeman provided consulting services related to strategic business projects. Prior to 1999, Portfolio Manager at Rockefeller & Co. and Scudder, Stevens & Clark. Board member of the Harding Loevner Funds from 1996 to 2014, serving as both Lead Independent Director and chair of the Audit Committee. Board member of the Russell Exchange Traded Funds Trust from 2011 to 2012 and the chair of the Audit Committee. Ms. Freeman is also an inactive Chartered Financial Analyst. | N/A |
Isaiah Harris, Jr.
(Born 1952) | Trustee,
since 2009; Audit
Committee
Chair,
since 2019 | Retired. Chairman of the Board of CIGNA Corporation since 2009, and Director since 2005. From 2003 to 2011, Director of Deluxe Corporation. Prior thereto, President and CEO of BellSouth Advertising and Publishing Corp. from 2005 to 2007, President and CEO of BellSouth Enterprises from 2004 to 2005 and President of BellSouth Consumer Services from 2000 to 2003. Emeritus member of the Iowa State University Foundation Board of Governors. Emeritus Member of the Advisory Board of Iowa State University School of Business. Advisory Board Member, Palm Harbor Academy (private school). Mr. Harris is a certified public accountant (inactive status). | CIGNA Corporation |
Judith M. Johnson
(Born 1949) | Trustee,
since 2008 | Retired. Prior thereto, Chief Executive Officer and Chief Investment Officer of Minneapolis Employees Retirement Fund from 1996 to 2008. Ms. Johnson is an attorney, certified public accountant and a certified managerial accountant. | N/A |
David F. Larcker
(Born 1950) | Trustee,
since 2009 | James Irvin Miller Professor of Accounting at the Graduate School of Business (Emeritus), Stanford University, Director of the Corporate Governance Research Initiative and Senior Faculty of The Rock Center for Corporate Governance since 2006. From 2005 to 2008, Professor of Accounting at the Graduate School of Business, Stanford University. Prior thereto, Ernst & Young Professor of Accounting at The Wharton School, University of Pennsylvania from 1985 to 2005. | N/A |
26 | Wells Fargo Opportunity Fund
Other information (unaudited)
Name and
year of birth | Position held and
length of service* | Principal occupations during past five years or longer | Current other
public company or
investment
company
directorships |
Olivia S. Mitchell
(Born 1953) | Trustee,
since 2006;
Nominating and
Governance
Committee Chair,
since 2018 | International Foundation of Employee Benefit Plans Professor, Wharton School of the University of Pennsylvania since 1993. Director of Wharton’s Pension Research Council and Boettner Center on Pensions & Retirement Research, and Research Associate at the National Bureau of Economic Research. Previously, Cornell University Professor from 1978 to 1993. | N/A |
Timothy J. Penny
(Born 1951) | Trustee,
since 1996;
Chair,
since 2018 | President and Chief Executive Officer of Southern Minnesota Initiative Foundation, a non-profit organization, since 2007. Member of the Board of Trustees of NorthStar Education Finance, Inc., a non-profit organization, since 2007. | N/A |
James G. Polisson
(Born 1959) | Trustee,
since 2018 | Retired. Chief Marketing Officer, Source (ETF) UK Services, Ltd, from 2015 to 2017. From 2012 to 2015, Principal of The Polisson Group, LLC, a management consulting, corporate advisory and principal investing company. Chief Executive Officer and Managing Director at Russell Investments, Global Exchange Traded Funds from 2010 to 2012. Managing Director of Barclays Global Investors from 1998 to 2010 and Global Chief Marketing Officer for iShares and Barclays Global Investors from 2000 to 2010. Trustee of the San Francisco Mechanics’ Institute, a non-profit organization, from 2013 to 2015. Board member of the Russell Exchange Traded Fund Trust from 2011 to 2012. Director of Barclays Global Investors Holdings Deutschland GmbH from 2006 to 2009. Mr. Polisson is an attorney and has a retired status with the Massachusetts and District of Columbia Bar Associations. | N/A |
Pamela Wheelock
(Born 1959) | Trustee,
since January
2020; previously
Trustee from
January 2018 to
July 2019 | Board member of the Destination Medical Center Economic Development Agency, Rochester, Minnesota since 2019. Interim President of the McKnight Foundation from January to September 2020. Acting Commissioner, Minnesota Department of Human Services, July 2019 through September 2019. Human Services Manager (part-time), Minnesota Department of Human Services, October 2019 through December 2019. Chief Operating Officer, Twin Cities Habitat for Humanity from 2017 to 2019. Vice President of University Services, University of Minnesota from 2012 to 2016. Prior thereto, on the Board of Directors, Governance Committee and Finance Committee for the Minnesota Philanthropy Partners (Saint Paul Foundation) from 2012 to 2018, Interim Chief Executive Officer of Blue Cross Blue Shield of Minnesota from 2011 to 2012, Chairman of the Board from 2009 to 2012 and Board Director from 2003 to 2015. Vice President, Leadership and Community Engagement, Bush Foundation, Saint Paul, Minnesota (a private foundation) from 2009 to 2011. Executive Vice President and Chief Financial Officer, Minnesota Sports and Entertainment from 2004 to 2009 and Senior Vice President from 2002 to 2004. Executive Vice President of the Minnesota Wild Foundation from 2004 to 2008. Commissioner of Finance, State of Minnesota, from 1999 to 2002. Currently Board Chair of the Minnesota Wild Foundation since 2010. | N/A |
* Length of service dates reflect the Trustee’s commencement of service with the Trust’s predecessor entities, where applicable.
Wells Fargo Opportunity Fund | 27
Other information (unaudited)
Officers
Name and
year of birth | Position held and
length of service | Principal occupations during past five years or longer |
Andrew Owen
(Born 1960) | President,
since 2017 | Executive Vice President of Wells Fargo & Company and Head of Affiliated Managers, Wells Fargo Asset Management, since 2014. In addition, Mr. Owen is currently President, Chief Executive Officer and Director of Wells Fargo Funds Management, LLC since 2017. Prior thereto, Executive Vice President responsible for marketing, investments and product development for Wells Fargo Funds Management, LLC, from 2009 to 2014. |
Jeremy DePalma
(Born 1974) | Treasurer,
since 2012
(for certain funds in
the Fund Complex);
since 2021 (for
the remaining funds in the
Fund Complex) | Senior Vice President of Wells Fargo Funds Management, LLC since 2009. Senior Vice President of Evergreen Investment Management Company, LLC from 2008 to 2010 and head of the Fund Reporting and Control Team within Fund Administration from 2005 to 2010. |
Michelle Rhee
(Born 1966) | Chief Legal Officer,
since 2019 | Secretary of Wells Fargo Funds Management, LLC and Chief Legal Counsel of Wells Fargo Asset Management since 2018. Deputy General Counsel of Wells Fargo Bank, N.A. since 2020 and Assistant General Counsel of Wells Fargo Bank, N.A. from 2018 to 2020. Associate General Counsel and Managing Director of Bank of America Corporation from 2004 to 2018. |
Catherine Kennedy
(Born 1969) | Secretary,
since 2019 | Vice President of Wells Fargo Funds Management, LLC and Senior Counsel of the Wells Fargo Legal Department since 2010. Vice President and Senior Counsel of Evergreen Investment Management Company, LLC from 1998 to 2010. |
Michael H. Whitaker
(Born 1967) | Chief Compliance Officer,
since 2016 | Chief Compliance Officer of Wells Fargo Asset Management since 2016. Senior Vice President and Chief Compliance Officer for Fidelity Investments from 2007 to 2016. |
1 The Statement of Additional Information includes additional information about the Trustees and is available, without charge, upon request, by calling 1-800-222-8222 or by visiting the website at wfam.com.
28 | Wells Fargo Opportunity Fund
For more information
More information about Wells Fargo Funds is available free upon request. To obtain literature, please write, visit the Fund's website, or call:
Wells Fargo Funds
P.O. Box 219967
Kansas City, MO 64121-9967
Website: wfam.com
Individual investors: 1-800-222-8222
Retail investment professionals: 1-888-877-9275
Institutional investment professionals: 1-866-765-0778
This report and the financial statements contained herein are submitted for the general information of the shareholders of the Fund. If this report is used for promotional purposes, distribution of the report must be accompanied or preceded by a current prospectus. Before investing, please consider the investment objectives, risks, charges, and expenses of the investment. For a current prospectus and, if available, a summary prospectus, containing this information, call 1-800-222-8222 or visit the Fund's website at wfam.com. Read the prospectus carefully before you invest or send money.
Wells Fargo Asset Management (WFAM) is the trade name for certain investment advisory/management firms owned by Wells Fargo & Company. These firms include but are not limited to Wells Capital Management Incorporated and Wells Fargo Funds Management, LLC. Certain products managed by WFAM entities are distributed by Wells Fargo Funds Distributor, LLC (a broker-dealer and Member FINRA).
This material is for general informational and educational purposes only and is NOT intended to provide investment advice or a recommendation of any kind - including a recommendation for any specific investment, strategy, or plan.
INVESTMENT PRODUCTS: NOT FDIC INSURED ■ NO BANK GUARANTEE ■ MAY LOSE VALUE
© 2021 Wells Fargo & Company. All rights reserved.
PAR-0421-00298 05-21
SA232/SAR232 03-21
Semi-Annual Report
March 31, 2021
Wells Fargo
Special Mid Cap Value Fund
Reduce clutter.
Save trees.
Sign up for electronic delivery of prospectuses and shareholder reports at wellsfargo.com/ advantagedelivery
The views expressed and any forward-looking statements are as of March 31, 2021, unless otherwise noted, and are those of the Fund's portfolio managers and/or Wells Fargo Asset Management. Discussions of individual securities or the markets generally are not intended as individual recommendations. Future events or results may vary significantly from those expressed in any forward-looking statements. The views expressed are subject to change at any time in response to changing circumstances in the market. Wells Fargo Asset Management and the Fund disclaim any obligation to publicly update or revise any views expressed or forward-looking statements.
INVESTMENT PRODUCTS: NOT FDIC INSURED ■ NO BANK GUARANTEE ■ MAY LOSE VALUE
Wells Fargo Special Mid Cap Value Fund | 1
Letter to shareholders (unaudited)
Andrew Owen
President
Wells Fargo Funds
Dear Shareholder:
We are pleased to offer you this semi-annual report for the Wells Fargo Special Mid Cap Value Fund for the six-month period that ended March 31, 2021. Despite a deeply challenging year, dominated by the spread of COVID-19 cases and a sharp drop in economic output throughout much of the world, global stocks performed extremely well, benefiting from ongoing central bank support and rising optimism over the development and distribution of effective COVID-19 vaccines. Bonds also had positive returns, led by global bonds and high-yield bonds.
For the six-month period, U.S. stocks, based on the S&P 500 Index,1 gained 19.07%. International stocks, as measured by the MSCI ACWI ex USA Index (Net),2 returned 21.10%, while the MSCI EM Index (Net),3 had even stronger performance, with a 22.43% gain. Among bond indexes, the Bloomberg Barclays U.S. Aggregate Bond Index,4 returned -2.73%, the Bloomberg Barclays Global Aggregate ex-USD Index (unhedged),5 returned -0.47%, and the Bloomberg Barclays Municipal Bond Index,6 returned 1.46% while the ICE BofA U.S. High Yield Index,7 gained 7.44%.
Hope drove the stock markets to new highs.
In October, capital markets stepped back from their six-month rally. Market volatility rose in advance of the U.S. election and amid a global increase in COVID-19 infections. Europe introduced tighter restrictions affecting economic activity. U.S. markets looked favorably at the prospect of Democratic control of the federal purse strings, which could lead to additional fiscal stimulus and a boost to economic activity. Meanwhile, China reported 4.9% third-quarter gross domestic product growth.
Global stocks rallied in November, propelled by optimism over three promising COVID-19 vaccines. Reversing recent trends, value stocks outperformed growth stocks and cyclical stocks outpaced information technology (IT) stocks. However, U.S. unemployment remained elevated, with a net job loss of 10 million since February. The eurozone services purchasing managers’ index contracted sharply while the region’s manufacturing activity grew. The U.S. election results added to the upbeat mood as investors anticipated more consistent policies in the new administration.
“Global stocks rallied in November, propelled by optimism over three promising COVID-19 vaccines.”
| 1 | The S&P 500 Index consists of 500 stocks chosen for market size, liquidity, and industry group representation. It is a market-value-weighted index with each stock's weight in the index proportionate to its market value. You cannot invest directly in an index. |
| 2 | The Morgan Stanley Capital International (MSCI) All Country World Index (ACWI) ex USA Index (Net) is a free-float-adjusted market-capitalization-weighted index that is designed to measure the equity market performance of developed and emerging markets, excluding the United States. Source: MSCI. MSCI makes no express or implied warranties or representations and shall have no liability whatsoever with respect to any MSCI data contained herein. The MSCI data may not be further redistributed or used as a basis for other indices or any securities or financial products. This report is not approved, reviewed, or produced by MSCI. You cannot invest directly in an index. |
| 1 | The S&P 500 Index consists of 500 stocks chosen for market size, liquidity, and industry group representation. It is a market-value-weighted index with each stock's weight in the index proportionate to its market value. You cannot invest directly in an index. |
| 3 | The MSCI Emerging Markets (EM) Index (Net) is a free-float-adjusted market-capitalization-weighted index that is designed to measure equity market performance of emerging markets. You cannot invest directly in an index. |
| 1 | The S&P 500 Index consists of 500 stocks chosen for market size, liquidity, and industry group representation. It is a market-value-weighted index with each stock's weight in the index proportionate to its market value. You cannot invest directly in an index. |
| 4 | The Bloomberg Barclays U.S. Aggregate Bond Index is a broad-based benchmark that measures the investment-grade, U.S. dollar-denominated, fixed-rate taxable bond market, including Treasuries, government-related and corporate securities, mortgage-backed securities (agency fixed-rate and hybrid adjustable-rate mortgage pass-throughs), asset-backed securities, and commercial mortgage-backed securities. You cannot invest directly in an index. |
| 1 | The S&P 500 Index consists of 500 stocks chosen for market size, liquidity, and industry group representation. It is a market-value-weighted index with each stock's weight in the index proportionate to its market value. You cannot invest directly in an index. |
| 5 | The Bloomberg Barclays Global Aggregate ex-USD Index (unhedged) is an unmanaged index that provides a broad-based measure of the global investment-grade fixed-income markets excluding the U.S. dollar-denominated debt market. You cannot invest directly in an index. |
| 1 | The S&P 500 Index consists of 500 stocks chosen for market size, liquidity, and industry group representation. It is a market-value-weighted index with each stock's weight in the index proportionate to its market value. You cannot invest directly in an index. |
| 6 | The Bloomberg Barclays Municipal Bond Index is an unmanaged index composed of long-term tax-exempt bonds with a minimum credit rating of Baa. You cannot invest directly in an index. |
| 1 | The S&P 500 Index consists of 500 stocks chosen for market size, liquidity, and industry group representation. It is a market-value-weighted index with each stock's weight in the index proportionate to its market value. You cannot invest directly in an index. |
| 7 | The ICE BofA U.S. High Yield Index is a market-capitalization-weighted index of domestic and Yankee high-yield bonds. The index tracks the performance of high-yield securities traded in the U.S. bond market. You cannot invest directly in an index. Copyright 2021. ICE Data Indices, LLC. All rights reserved. |
2 | Wells Fargo Special Mid Cap Value Fund
Letter to shareholders (unaudited)
Financial markets ended the year with strength on high expectations for a rapid rollout of the COVID-19 vaccines, the successful passage of a $900 billion stimulus package, and rising expectations of additional economic support from a Democratic-led Congress. U.S. economic data were mixed with still-elevated unemployment and weak retail sales but growth in manufacturing output. In contrast, China’s economic expansion continued in both manufacturing and nonmanufacturing. U.S. COVID-19 infection rates continued to rise even as new state and local lockdown measures were implemented.
The year 2021 began with emerging market stocks leading all major asset classes in January, driven by China’s strong economic growth and a broad recovery in corporate earnings, which propelled China’s stock market higher. In the U.S., positive news on vaccine trials and January's expansion in both the manufacturing and services sectors were offset by a weak December monthly jobs report. This was compounded by technical factors as some hedge funds were forced to sell stocks to protect themselves against a well-publicized short squeeze coordinated by a group of retail investors. Eurozone sentiment and economic growth were particularly weak, reflecting the impact of a new lockdown with stricter social distancing along with a slow vaccine rollout.
February saw major domestic equity indexes driven higher on the hope of a new stimulus bill, improving COVID-19 vaccination numbers, and the gradual reopening of the economy. Most S&P 500 companies reported better-than-expected earnings, with positive surprises coming from the financials, IT, health care, and materials sectors. Japan saw its economy strengthen as a result of strong export numbers. Meanwhile, crude-oil prices continued their climb, rising more than 25% for the year. Domestic government bonds experienced a sharp sell-off in late February as markets priced in a more robust economic recovery and higher future growth and inflation expectations.
The passage of the massive domestic stimulus bill highlighted March activity, leading to increased forecasts for U.S. growth in 2021. Domestic employment surged as COVID-19 vaccinations and an increasingly open economy spurred hiring. A majority of U.S. small companies reported they are operating at pre-pandemic capacity or higher. Value continued its outperformance of growth in the month, continuing the trend that started in late 2020. Meanwhile, most major developed global equity indexes are up month to date on the back of rising optimism regarding the outlook for global growth. While the U.S. and the U.K. have been the most successful in terms of the vaccine rollout, even within markets where the vaccine has lagged, such as the eurozone and Japan, equity indexes in many of those countries are also in positive territory this year.
Don’t let short-term uncertainty derail long-term investment goals.
Periods of investment uncertainty can present challenges, but experience has taught us that maintaining long-term investment goals can be an effective way to plan for the future. To help you create a sound strategy based on your personal goals and risk tolerance, Wells Fargo Funds offers more than 100 mutual funds spanning a wide range of asset classes and investment styles. Although diversification cannot guarantee an investment profit or prevent losses, we believe it can be an effective way to manage investment risk and potentially smooth out overall portfolio performance. We encourage investors to know their investments and to understand that appropriate levels of risk-taking may unlock opportunities.
Thank you for choosing to invest with Wells Fargo Funds. We appreciate your confidence in us and remain committed to helping you meet your financial needs.
Sincerely,
Andrew Owen
President
Wells Fargo Funds
“The passage of the massive domestic stimulus bill highlighted March activity, leading to increased forecasts for U.S. growth in 2021.”
For further information about your Fund, contact your investment professional, visit our website at wfam.com, or call us directly at 1-800-222-8222.
Wells Fargo Special Mid Cap Value Fund | 3
Performance highlights (unaudited)
| Investment objective | The Fund seeks long-term capital appreciation. |
| Manager | Wells Fargo Funds Management, LLC |
| Subadviser | Wells Capital Management Incorporated |
| Portfolio managers | James M. Tringas, CFA®‡, Bryant VonCronkhite, CFA®‡, CPA, Shane Zweck, CFA®‡ |
| Average annual total returns (%) as of March 31, 2021 |
| | | Including sales charge | | Excluding sales charge | | Expense ratios1 (%) |
| | Inception date | 1 year | 5 year | 10 year | | 1 year | 5 year | 10 year | | Gross | Net 2 |
| Class A (WFPAX) | 7-31-2007 | 57.99 | 10.39 | 10.72 | | 67.63 | 11.70 | 11.38 | | 1.14 | 1.14 |
| Class C (WFPCX) | 7-31-2007 | 65.41 | 10.87 | 10.55 | | 66.41 | 10.87 | 10.55 | | 1.89 | 1.89 |
| Class R (WFHHX)3 | 9-30-2015 | – | – | – | | 67.18 | 11.42 | 11.11 | | 1.39 | 1.39 |
| Class R6 (WFPRX)4 | 6-28-2013 | – | – | – | | 68.32 | 12.18 | 11.86 | | 0.71 | 0.71 |
| Administrator Class (WFMDX) | 4-8-2005 | – | – | – | | 67.75 | 11.79 | 11.49 | | 1.06 | 1.06 |
| Institutional Class (WFMIX) | 4-8-2005 | – | – | – | | 68.20 | 12.07 | 11.79 | | 0.81 | 0.81 |
| Russell Midcap® Value Index5 | – | – | – | – | | 73.76 | 11.60 | 11.05 | | – | – |
Figures quoted represent past performance, which is no guarantee of future results, and do not reflect taxes that a shareholder may pay on an investment in a fund. Investment return and principal value of an investment will fluctuate so that an investor’s shares, when redeemed, may be worth more or less than their original cost. Performance shown without sales charges would be lower if sales charges were reflected. Current performance may be lower or higher than the performance data quoted, which assumes the reinvestment of dividends and capital gains. Current month-end performance is available on the Fund’s website, wfam.com.
Please keep in mind that high double-digit returns were primarily achieved during favorable market conditions. You should not expect that such favorable returns can be consistently achieved. A fund’s performance, especially for short time periods, should not be the sole factor in making your investment decision.
Index returns do not include transaction costs associated with buying and selling securities, any mutual fund fees or expenses, or any taxes. It is not possible to invest directly in an index.
For Class A shares, the maximum front-end sales charge is 5.75%. For Class C shares, the maximum contingent deferred sales charge is 1.00%. Performance including a contingent deferred sales charge assumes the sales charge for the corresponding time period. Class R, Class R6, Administrator Class, and Institutional Class shares are sold without a front-end sales charge or contingent deferred sales charge.
| 1 | Reflects the expense ratios as stated in the most recent prospectuses. The expense ratios shown are subject to change and may differ from the annualized expense ratios shown in the financial highlights of this report. |
| 2 | The manager has contractually committed through January 31, 2022, to waive fees and/or reimburse expenses to the extent necessary to cap total annual fund operating expenses after fee waivers at 1.16% for Class A, 1.91% for Class C, 1.41% for Class R, 0.73% for Class R6, 1.08% for Administrator Class and 0.83% for Institutional Class. Brokerage commissions, stamp duty fees, interest, taxes, acquired fund fees and expenses (if any), and extraordinary expenses are excluded from the expense caps. Prior to or after the commitment expiration date, the caps may be increased or the commitment to maintain the caps may be terminated only with the approval of the Board of Trustees. Without these caps, the Fund’s returns would have been lower. The expense ratio paid by an investor is the net expense ratio (the total annual fund operating expenses after fee waivers) as stated in the prospectuses. |
| 3 | Historical performance shown for the Class R shares prior to their inception reflects the performance of the Institutional Class shares adjusted to reflect the higher expenses applicable to the Class R shares. |
| 4 | Historical performance shown for the Class R6 shares prior to their inception reflects the performance of the Institutional Class shares, and includes the higher expenses applicable to the Institutional Class shares. If these expenses had not been included, returns for the Class R6 shares would be higher. |
| 5 | The Russell Midcap® Value Index measures the performance of those Russell Midcap companies with lower price/book ratios and lower forecasted growth values. The stocks are also members of the Russell 1000® Value Index. You cannot invest directly in an index |
Stock values fluctuate in response to the activities of individual companies and general market and economic conditions. Smaller-company stocks tend to be more volatile and less liquid than those of larger companies. The use of derivatives may reduce returns and/or increase volatility. Consult the Fund’s prospectus for additional information on these and other risks.
| ‡ | CFA® and Chartered Financial Analyst® are trademarks owned by CFA Institute. |
4 | Wells Fargo Special Mid Cap Value Fund
Performance highlights (unaudited)
| Ten largest holdings (%) as of March 31, 20211 |
| Carlisle Companies Incorporated | 2.99 |
| AerCap Holdings NV | 2.90 |
| CBRE Group Incorporated Class A | 2.87 |
| Arch Capital Group Limited | 2.76 |
| Stanley Black & Decker Incorporated | 2.75 |
| Amdocs Limited | 2.47 |
| Republic Services Incorporated | 2.45 |
| Reynolds Consumer Products Incorporated | 2.42 |
| Alcon Incorporated | 2.28 |
| Euronet Worldwide Incorporated | 2.26 |
| 1 | Figures represent the percentage of the Fund's net assets. Holdings are subject to change and may have changed since the date specified. |
| Sector allocation as of March 31, 20211 |
| 1 | Figures represent the percentage of the Fund's long-term investments. These amounts are subject to change and may have changed since the date specified. |
Wells Fargo Special Mid Cap Value Fund | 5
Fund expenses (unaudited)
As a shareholder of the Fund, you incur two types of costs: (1) transaction costs, including sales charges (loads) on purchase payments and contingent deferred sales charges (if any) on redemptions and (2) ongoing costs, including management fees, distribution (12b-1) and/or shareholder servicing fees, and other Fund expenses. This example is intended to help you understand your ongoing costs (in dollars) of investing in the Fund and to compare these costs with the ongoing costs of investing in other mutual funds.
The example is based on an investment of $1,000 invested at the beginning of the six-month period and held for the entire period from October 1, 2020 to March 31, 2021.
Actual expenses
The “Actual” line of the table below provides information about actual account values and actual expenses. You may use the information in this line, together with the amount you invested, to estimate the expenses that you paid over the period. Simply divide your account value by $1,000 (for example, an $8,600 account value divided by $1,000 = 8.6), then multiply the result by the number in the “Actual” line under the heading entitled “Expenses paid during period” for your applicable class of shares to estimate the expenses you paid on your account during this period.
Hypothetical example for comparison purposes
The “Hypothetical” line of the table below provides information about hypothetical account values and hypothetical expenses based on the Fund’s actual expense ratio and an assumed rate of return of 5% per year before expenses, which is not the Fund’s actual return. The hypothetical account values and expenses may not be used to estimate the actual ending account balance or expenses you paid for the period. You may use this information to compare the ongoing costs of investing in the Fund and other funds. To do so, compare this 5% hypothetical example with the 5% hypothetical examples that appear in the shareholder reports of the other funds.
Please note that the expenses shown in the table are meant to highlight your ongoing costs only and do not reflect any transactional costs, such as sales charges (loads) and contingent deferred sales charges. Therefore, the “Hypothetical” line of the table is useful in comparing ongoing costs only and will not help you determine the relative total costs of owning different funds. In addition, if these transactional costs were included, your costs would have been higher.
| | Beginning
account value
10-1-2020 | Ending
account value
3-31-2021 | Expenses
paid during
the period1 | Annualized net
expense ratio |
| Class A | | | | |
| Actual | $1,000.00 | $1,330.39 | $ 6.59 | 1.13% |
| Hypothetical (5% return before expenses) | $1,000.00 | $1,019.30 | $ 5.69 | 1.13% |
| Class C | | | | |
| Actual | $1,000.00 | $1,325.60 | $10.96 | 1.89% |
| Hypothetical (5% return before expenses) | $1,000.00 | $1,015.51 | $ 9.50 | 1.89% |
| Class R | | | | |
| Actual | $1,000.00 | $1,328.96 | $ 8.07 | 1.39% |
| Hypothetical (5% return before expenses) | $1,000.00 | $1,018.00 | $ 6.99 | 1.39% |
| Class R6 | | | | |
| Actual | $1,000.00 | $1,333.54 | $ 4.13 | 0.71% |
| Hypothetical (5% return before expenses) | $1,000.00 | $1,021.39 | $ 3.58 | 0.71% |
| Administrator Class | | | | |
| Actual | $1,000.00 | $1,331.00 | $ 6.16 | 1.06% |
| Hypothetical (5% return before expenses) | $1,000.00 | $1,019.65 | $ 5.34 | 1.06% |
| Institutional Class | | | | |
| Actual | $1,000.00 | $1,332.90 | $ 4.71 | 0.81% |
| Hypothetical (5% return before expenses) | $1,000.00 | $1,020.89 | $ 4.08 | 0.81% |
1 Expenses paid is equal to the annualized net expense ratio of each class multiplied by the average account value over the period, multiplied by the number of days in the most recent fiscal half-year divided by the number of days in the fiscal year (to reflect the one-half-year period).
6 | Wells Fargo Special Mid Cap Value Fund
Portfolio of investments—March 31, 2021 (unaudited)
| | | | | Shares | Value |
| Common stocks: 98.84% | | | | | |
| Consumer discretionary: 12.72% | | | | | |
| Auto components: 3.30% | | | | | |
| Aptiv plc † | | | | 1,256,430 | $ 173,261,697 |
| Lear Corporation | | | | 1,101,100 | 199,574,375 |
| | | | | | 372,836,072 |
| Distributors: 1.83% | | | | | |
| LKQ Corporation † | | | | 4,883,700 | 206,727,021 |
| Diversified consumer services: 0.39% | | | | | |
| Terminix Global Holdings Incorporated † | | | | 931,900 | 44,423,673 |
| Hotels, restaurants & leisure: 3.45% | | | | | |
| Expedia Group Incorporated | | | | 1,179,800 | 203,067,176 |
| Yum China Holdings Incorporated | | | | 3,143,600 | 186,132,556 |
| | | | | | 389,199,732 |
| Household durables: 2.04% | | | | | |
| D.R. Horton Incorporated | | | | 2,081,500 | 185,503,280 |
| Helen of Troy Limited † | | | | 214,400 | 45,165,504 |
| | | | | | 230,668,784 |
| Specialty retail: 1.71% | | | | | |
| Best Buy Company Incorporated | | | | 1,675,800 | 192,398,598 |
| Consumer staples: 7.38% | | | | | |
| Beverages: 1.65% | | | | | |
| Keurig Dr. Pepper Incorporated | | | | 5,438,669 | 186,927,054 |
| Food & staples retailing: 1.83% | | | | | |
| BJ's Wholesale Club Holdings Incorporated † | | | | 4,606,100 | 206,629,646 |
| Food products: 1.48% | | | | | |
| Lamb Weston Holdings Incorporated | | | | 2,158,100 | 167,209,588 |
| Household products: 2.42% | | | | | |
| Reynolds Consumer Products Incorporated | | | | 9,165,500 | 272,948,590 |
| Energy: 3.68% | | | | | |
| Energy equipment & services: 0.99% | | | | | |
| Baker Hughes Incorporated | | | | 1,271,700 | 27,481,437 |
| NOV Incorporated | | | | 6,097,600 | 83,659,072 |
| | | | | | 111,140,509 |
| Oil, gas & consumable fuels: 2.69% | | | | | |
| Devon Energy Corporation | | | | 3,083,900 | 67,383,215 |
| EOG Resources Incorporated | | | | 1,181,600 | 85,701,448 |
| Hess Corporation | | | | 1,008,500 | 71,361,460 |
| Valero Energy Corporation | | | | 1,111,800 | 79,604,880 |
| | | | | | 304,051,003 |
The accompanying notes are an integral part of these financial statements.
Wells Fargo Special Mid Cap Value Fund | 7
Portfolio of investments—March 31, 2021 (unaudited)
| | | | | Shares | Value |
| Financials: 18.73% | | | | | |
| Banks: 5.21% | | | | | |
| Fifth Third Bancorp | | | | 5,717,300 | $ 214,112,885 |
| PacWest Bancorp | | | | 2,400,600 | 91,582,890 |
| Regions Financial Corporation | | | | 9,313,200 | 192,410,712 |
| Zions Bancorporation | | | | 1,649,600 | 90,662,016 |
| | | | | | 588,768,503 |
| Capital markets: 3.35% | | | | | |
| LPL Financial Holdings Incorporated | | | | 1,386,800 | 197,147,488 |
| Pershing Square Tontine Holdings †« | | | | 7,565,100 | 181,638,051 |
| | | | | | 378,785,539 |
| Consumer finance: 1.49% | | | | | |
| Discover Financial Services | | | | 1,766,400 | 167,790,336 |
| Diversified financial services: 0.59% | | | | | |
| Liberty Media Acquisition Corporation † | | | | 1,774,923 | 19,009,425 |
| Thoma Bravo Advantage Class A †« | | | | 4,556,100 | 47,611,245 |
| | | | | | 66,620,670 |
| Insurance: 8.09% | | | | | |
| Arch Capital Group Limited † | | | | 8,111,100 | 311,222,907 |
| Brown & Brown Incorporated | | | | 5,589,700 | 255,505,187 |
| Loews Corporation | | | | 3,062,700 | 157,055,256 |
| The Allstate Corporation | | | | 1,652,000 | 189,814,800 |
| | | | | | 913,598,150 |
| Health care: 7.39% | | | | | |
| Health care equipment & supplies: 4.31% | | | | | |
| Alcon Incorporated † | | | | 3,670,500 | 257,595,690 |
| Zimmer Biomet Holdings Incorporated | | | | 1,435,100 | 229,730,808 |
| | | | | | 487,326,498 |
| Health care providers & services: 3.08% | | | | | |
| Humana Incorporated | | | | 424,000 | 177,762,000 |
| Universal Health Services Incorporated Class B | | | | 1,271,700 | 169,632,063 |
| | | | | | 347,394,063 |
| Industrials: 23.06% | | | | | |
| Aerospace & defense: 2.56% | | | | | |
| General Dynamics Corporation | | | | 800,700 | 145,375,092 |
| L3Harris Technologies Incorporated | | | | 707,400 | 143,375,832 |
| | | | | | 288,750,924 |
| Building products: 1.35% | | | | | |
| Masco Corporation | | | | 2,539,500 | 152,116,050 |
| Commercial services & supplies: 2.45% | | | | | |
| Republic Services Incorporated | | | | 2,784,600 | 276,650,010 |
| Construction & engineering: 1.03% | | | | | |
| MasTec Incorporated † | | | | 1,248,400 | 116,975,080 |
The accompanying notes are an integral part of these financial statements.
8 | Wells Fargo Special Mid Cap Value Fund
Portfolio of investments—March 31, 2021 (unaudited)
| | | | | Shares | Value |
| Industrial conglomerates: 2.99% | | | | | |
| Carlisle Companies Incorporated | | | | 2,052,300 | $ 337,767,534 |
| Machinery: 4.69% | | | | | |
| Donaldson Company Incorporated | | | | 1,533,700 | 89,199,992 |
| Gates Industrial Corporation plc † | | | | 4,400,200 | 70,359,198 |
| Pentair plc | | | | 951,700 | 59,309,944 |
| Stanley Black & Decker Incorporated | | | | 1,555,200 | 310,526,783 |
| | | | | | 529,395,917 |
| Professional services: 2.13% | | | | | |
| Jacobs Engineering Group Incorporated | | | | 1,865,700 | 241,179,039 |
| Road & rail: 2.15% | | | | | |
| Kansas City Southern | | | | 922,000 | 243,334,240 |
| Trading companies & distributors: 3.71% | | | | | |
| AerCap Holdings NV † | | | | 5,574,800 | 327,463,752 |
| United Rentals Incorporated † | | | | 277,600 | 91,416,456 |
| | | | | | 418,880,208 |
| Information technology: 9.53% | | | | | |
| Communications equipment: 0.92% | | | | | |
| Juniper Networks Incorporated | | | | 4,095,700 | 103,744,081 |
| Electronic equipment, instruments & components: 0.63% | | | | | |
| Keysight Technologies Incorporated † | | | | 494,900 | 70,968,660 |
| IT services: 4.73% | | | | | |
| Amdocs Limited | | | | 3,983,200 | 279,421,480 |
| Euronet Worldwide Incorporated † | | | | 1,848,300 | 255,619,890 |
| | | | | | 535,041,370 |
| Semiconductors & semiconductor equipment: 1.60% | | | | | |
| Analog Devices Incorporated | | | | 1,163,900 | 180,497,612 |
| Technology hardware, storage & peripherals: 1.65% | | | | | |
| NCR Corporation † | | | | 4,903,900 | 186,103,005 |
| Materials: 4.72% | | | | | |
| Chemicals: 2.19% | | | | | |
| Celanese Corporation Series A | | | | 1,349,200 | 202,123,652 |
| Diversey Holdings Limited †« | | | | 3,092,812 | 45,495,265 |
| | | | | | 247,618,917 |
| Containers & packaging: 1.77% | | | | | |
| AptarGroup Incorporated | | | | 883,089 | 125,107,219 |
| Packaging Corporation of America | | | | 551,200 | 74,125,376 |
| | | | | | 199,232,595 |
| Metals & mining: 0.76% | | | | | |
| Freeport-McMoRan Incorporated † | | | | 2,614,500 | 86,095,485 |
The accompanying notes are an integral part of these financial statements.
Wells Fargo Special Mid Cap Value Fund | 9
Portfolio of investments—March 31, 2021 (unaudited)
| | | | | Shares | Value |
| Real estate: 6.73% | | | | | |
| Equity REITs: 3.86% | | | | | |
| American Campus Communities Incorporated | | | | 3,300,805 | $ 142,495,752 |
| Americold Realty Trust | | | | 1,007,111 | 38,743,560 |
| Equity Lifestyle Properties Incorporated | | | | 612,100 | 38,954,044 |
| Invitation Homes Incorporated | | | | 6,726,400 | 215,177,536 |
| | | | | | 435,370,892 |
| Real estate management & development: 2.87% | | | | | |
| CBRE Group Incorporated Class A † | | | | 4,103,000 | 324,588,330 |
| Utilities: 4.90% | | | | | |
| Electric utilities: 2.91% | | | | | |
| American Electric Power Company Incorporated | | | | 1,947,900 | 164,987,130 |
| FirstEnergy Corporation | | | | 4,734,500 | 164,239,805 |
| | | | | | 329,226,935 |
| Water utilities: 1.99% | | | | | |
| American Water Works Company Incorporated | | | | 1,499,500 | 224,805,040 |
| Total Common stocks (Cost $8,052,473,312) | | | | | 11,163,785,953 |
| | | | | | |
| Exchange-traded funds: 0.69% | | | | | |
| SPDR S&P Oil & Gas Exploration & Production ETF « | | | | 956,800 | 77,826,112 |
| Total Exchange-traded funds (Cost $45,668,523) | | | | | 77,826,112 |
| | | | Expiration
date | | |
| Warrants: 0.07% | | | | | |
| Financials: 0.07% | | | | | |
| Capital markets: 0.07% | | | | | |
| Pershing Square Tontine Holdings Limited Class A † | | | 7-24-2025 | 968,690 | 7,894,824 |
| Total Warrants (Cost $6,444,761) | | | | | 7,894,824 |
| | | Yield | | | |
| Short-term investments: 2.14% | | | | | |
| Investment companies: 2.14% | | | | | |
| Securities Lending Cash Investments LLC ♠∩∞ | | 0.04% | | 147,797,195 | 147,797,195 |
| Wells Fargo Government Money Market Fund Select Class ♠∞ | | 0.03 | | 94,631,370 | 94,631,370 |
| Total Short-term investments (Cost $242,428,565) | | | | | 242,428,565 |
| Total investments in securities (Cost $8,347,015,161) | 101.74% | | | | 11,491,935,454 |
| Other assets and liabilities, net | (1.74) | | | | (197,087,065) |
| Total net assets | 100.00% | | | | $11,294,848,389 |
| † | Non-income-earning security |
| « | All or a portion of this security is on loan. |
| ♠ | The issuer of the security is an affiliated person of the Fund as defined in the Investment Company Act of 1940. |
| ∩ | The investment is a non-registered investment company purchased with cash collateral received from securities on loan. |
| ∞ | The rate represents the 7-day annualized yield at period end. |
The accompanying notes are an integral part of these financial statements.
10 | Wells Fargo Special Mid Cap Value Fund
Portfolio of investments—March 31, 2021 (unaudited)
| Abbreviations: |
| REIT | Real estate investment trust |
Investments in affiliates
An affiliated investment is an investment in which the Fund owns at least 5% of the outstanding voting shares of the issuer or as a result of other relationships, such as the Fund and the issuer having the same investment manager. Transactions with issuers that were either affiliated persons of the Fund at the beginning of the period or the end of the period were as follows:
| | Value,
beginning of
period | Purchases | Sales
proceeds | Net
realized
gains
(losses) | | Net
change in
unrealized
gains
(losses) | | Value,
end of
period | | % of
net
assets | Shares,
end
of period | Income
from
affiliated
securities |
Short-term
investments | | | | | | | | | | | | |
Investment
companies | | | | | | | | | | | | |
| Securities Lending Cash Investments LLC | $ 500 | $332,833,445 | $ (185,036,750) | $0 | | $0 | | $ 147,797,195 | | | 147,797,195 | $ 23,762# |
| Wells Fargo Government Money Market Fund Select Class | 239,359,353 | 968,377,240 | (1,113,105,223) | 0 | | 0 | | 94,631,370 | | | 94,631,370 | 21,730 |
| | | | | $0 | | $0 | | $242,428,565 | | 2.14% | | $45,492 |
| # | Amount shown represents income before fees and rebates. |
The accompanying notes are an integral part of these financial statements.
Wells Fargo Special Mid Cap Value Fund | 11
Statement of assets and liabilities—March 31, 2021 (unaudited)
| | |
| Assets | |
Investments in unaffiliated securities (including $144,744,408 of securities loaned), at value (cost $8,104,586,596)
| $ 11,249,506,889 |
Investments in affiliated securites, at value (cost $242,428,565)
| 242,428,565 |
Cash
| 3,181,627 |
Receivable for Fund shares sold
| 25,897,104 |
Receivable for dividends
| 11,070,866 |
Receivable for investments sold
| 7,504,755 |
Receivable for securities lending income, net
| 23,335 |
Total assets
| 11,539,613,141 |
| Liabilities | |
Payable upon receipt of securities loaned
| 150,978,822 |
Payable for Fund shares redeemed
| 43,464,021 |
Payable for investments purchased
| 41,476,348 |
Management fee payable
| 6,265,874 |
Administration fees payable
| 1,090,450 |
Distribution fees payable
| 89,906 |
Trustees’ fees and expenses payable
| 2,685 |
Accrued expenses and other liabilities
| 1,396,646 |
Total liabilities
| 244,764,752 |
Total net assets
| $11,294,848,389 |
| Net assets consist of | |
Paid-in capital
| $ 7,756,959,901 |
Total distributable earnings
| 3,537,888,488 |
Total net assets
| $11,294,848,389 |
| Computation of net asset value and offering price per share | |
Net assets – Class A
| $ 1,115,856,940 |
Shares outstanding – Class A1
| 23,828,297 |
Net asset value per share – Class A
| $46.83 |
Maximum offering price per share – Class A2
| $49.69 |
Net assets – Class C
| $ 133,671,323 |
Shares outstanding – Class C1
| 2,998,695 |
Net asset value per share – Class C
| $44.58 |
Net assets – Class R
| $ 28,345,416 |
Shares outstanding – Class R1
| 597,374 |
Net asset value per share – Class R
| $47.45 |
Net assets – Class R6
| $ 2,743,267,777 |
Shares outstanding – Class R61
| 56,966,730 |
Net asset value per share – Class R6
| $48.16 |
Net assets – Administrator Class
| $ 378,300,967 |
Shares outstanding – Administrator Class1
| 7,920,434 |
Net asset value per share – Administrator Class
| $47.76 |
Net assets – Institutional Class
| $ 6,895,405,966 |
Shares outstanding – Institutional Class1
| 143,367,094 |
Net asset value per share – Institutional Class
| $48.10 |
| 1 | The Fund has an unlimited number of authorized shares |
| 2 | Maximum offering price is computed as 100/94.25 of net asset value. On investments of $50,000 or more, the offering price is reduced. |
The accompanying notes are an integral part of these financial statements.
12 | Wells Fargo Special Mid Cap Value Fund
Statement of operations—six months ended March 31, 2021 (unaudited)
| | |
| Investment income | |
Dividends
| $ 78,172,750 |
Income from affiliated securities
| 108,995 |
Total investment income
| 78,281,745 |
| Expenses | |
Management fee
| 33,546,750 |
| Administration fees | |
Class A
| 1,064,967 |
Class C
| 128,187 |
Class R
| 28,335 |
Class R6
| 367,123 |
Administrator Class
| 245,444 |
Institutional Class
| 3,985,267 |
| Shareholder servicing fees | |
Class A
| 1,267,818 |
Class C
| 152,604 |
Class R
| 33,732 |
Administrator Class
| 471,760 |
| Distribution fees | |
Class C
| 457,812 |
Class R
| 33,732 |
Custody and accounting fees
| 155,708 |
Professional fees
| 22,172 |
Registration fees
| 97,447 |
Shareholder report expenses
| 369,997 |
Trustees’ fees and expenses
| 9,610 |
Other fees and expenses
| 79,502 |
Total expenses
| 42,517,967 |
| Less: Fee waivers and/or expense reimbursements | |
Class A
| (20,065) |
Administrator Class
| (95) |
Net expenses
| 42,497,807 |
Net investment income
| 35,783,938 |
| Realized and unrealized gains (losses) on investments | |
| Net realized gains on | |
Unaffiliated securities
| 586,563,425 |
Written options
| 7,554,540 |
Net realized gains on investments
| 594,117,965 |
| Net change in unrealized gains (losses) on | |
Unaffiliated securities
| 2,225,516,721 |
Written options
| (1,597,817) |
Net change in unrealized gains (losses) on investments
| 2,223,918,904 |
Net realized and unrealized gains (losses) on investments
| 2,818,036,869 |
Net increase in net assets resulting from operations
| $2,853,820,807 |
The accompanying notes are an integral part of these financial statements.
Wells Fargo Special Mid Cap Value Fund | 13
Statement of changes in net assets
| | |
| | Six months ended
March 31, 2021
(unaudited) | Year ended
September 30, 2020 |
| Operations | | | | |
Net investment income
| | $ 35,783,938 | | $ 78,026,108 |
Net realized gains (losses) on investments
| | 594,117,965 | | (179,710,870) |
Net change in unrealized gains (losses) on investments
| | 2,223,918,904 | | (519,469,127) |
Net increase (decrease) in net assets resulting from operations
| | 2,853,820,807 | | (621,153,889) |
| Distributions to shareholders from | | | | |
| Net investment income and net realized gains | | | | |
Class A
| | (3,690,728) | | (42,557,946) |
Class C
| | 0 | | (5,334,641) |
Class R
| | (26,900) | | (1,279,526) |
Class R6
| | (18,362,088) | | (100,004,255) |
Administrator Class
| | (1,423,815) | | (24,372,266) |
Institutional Class
| | (40,723,017) | | (243,751,453) |
Total distributions to shareholders
| | (64,226,548) | | (417,300,087) |
| Capital share transactions | Shares | | Shares | |
| Proceeds from shares sold | | | | |
Class A
| 2,648,234 | 112,657,273 | 9,854,743 | 348,696,853 |
Class C
| 180,916 | 7,373,173 | 407,609 | 14,546,860 |
Class R
| 53,091 | 2,245,258 | 219,967 | 7,988,211 |
Class R6
| 9,397,987 | 399,172,162 | 25,955,043 | 962,352,547 |
Administrator Class
| 2,656,824 | 100,705,100 | 2,021,462 | 74,053,375 |
Institutional Class
| 20,205,502 | 872,653,806 | 73,446,153 | 2,568,631,752 |
| | | 1,494,806,772 | | 3,976,269,598 |
| Reinvestment of distributions | | | | |
Class A
| 81,671 | 3,375,452 | 982,408 | 39,537,339 |
Class C
| 0 | 0 | 131,467 | 5,025,996 |
Class R
| 641 | 26,865 | 31,409 | 1,278,194 |
Class R6
| 396,774 | 16,843,042 | 2,282,372 | 94,677,008 |
Administrator Class
| 33,647 | 1,418,220 | 592,191 | 24,283,965 |
Institutional Class
| 914,588 | 38,787,662 | 5,501,267 | 227,806,608 |
| | | 60,451,241 | | 392,609,110 |
| Payment for shares redeemed | | | | |
Class A
| (6,345,490) | (251,550,935) | (8,719,115) | (308,529,296) |
Class C
| (462,529) | (17,934,983) | (1,144,867) | (38,288,578) |
Class R
| (147,508) | (6,202,258) | (357,364) | (13,041,741) |
Class R6
| (10,638,236) | (449,982,043) | (21,827,939) | (779,801,393) |
Administrator Class
| (3,784,484) | (155,682,557) | (8,570,743) | (280,525,180) |
Institutional Class
| (20,795,093) | (899,167,309) | (67,358,421) | (2,411,269,322) |
| | | (1,780,520,085) | | (3,831,455,510) |
Net increase (decrease) in net assets resulting from capital share transactions
| | (225,262,072) | | 537,423,198 |
Total increase (decrease) in net assets
| | 2,564,332,187 | | (501,030,778) |
| Net assets | | | | |
Beginning of period
| | 8,730,516,202 | | 9,231,546,980 |
End of period
| | $11,294,848,389 | | $ 8,730,516,202 |
The accompanying notes are an integral part of these financial statements.
14 | Wells Fargo Special Mid Cap Value Fund
Financial highlights
(For a share outstanding throughout each period)
| | | Year ended September 30 |
| Class A | Six months ended
March 31, 2021
(unaudited) | 2020 | 2019 | 2018 | 2017 | 2016 |
Net asset value, beginning of period
| $35.33 | $39.63 | $37.59 | $37.49 | $33.12 | $29.91 |
Net investment income
| 0.09 1 | 0.18 | 0.26 | 0.15 | 0.33 | 0.19 |
Net realized and unrealized gains (losses) on investments
| 11.56 | (2.85) | 2.54 | 1.50 | 4.42 | 4.23 |
Total from investment operations
| 11.65 | (2.67) | 2.80 | 1.65 | 4.75 | 4.42 |
| Distributions to shareholders from | | | | | | |
Net investment income
| (0.15) | (0.23) | (0.17) | (0.23) | (0.19) | (0.08) |
Net realized gains
| 0.00 | (1.40) | (0.59) | (1.32) | (0.19) | (1.13) |
Total distributions to shareholders
| (0.15) | (1.63) | (0.76) | (1.55) | (0.38) | (1.21) |
Net asset value, end of period
| $46.83 | $35.33 | $39.63 | $37.59 | $37.49 | $33.12 |
Total return2
| 33.04% | (7.22)% | 7.81% | 4.50% | 14.41% | 15.34% |
| Ratios to average net assets (annualized) | | | | | | |
Gross expenses
| 1.14% | 1.14% | 1.15% | 1.15% | 1.18% | 1.19% |
Net expenses
| 1.13% | 1.14% | 1.15% | 1.15% | 1.18% | 1.19% |
Net investment income
| 0.41% | 0.56% | 0.67% | 0.40% | 0.78% | 0.82% |
| Supplemental data | | | | | | |
Portfolio turnover rate
| 26% | 51% | 37% | 37% | 46% | 30% |
Net assets, end of period (000s omitted)
| $1,115,857 | $969,508 | $1,003,560 | $1,038,883 | $1,070,690 | $1,363,213 |
| 1 | Calculated based upon average shares outstanding |
| 2 | Total return calculations do not include any sales charges. Returns for periods of less than one year are not annualized. |
The accompanying notes are an integral part of these financial statements.
Wells Fargo Special Mid Cap Value Fund | 15
Financial highlights
(For a share outstanding throughout each period)
| | | Year ended September 30 |
| Class C | Six months ended
March 31, 2021
(unaudited) | 2020 | 2019 | 2018 | 2017 | 2016 |
Net asset value, beginning of period
| $33.63 | $37.85 | $36.02 | $36.03 | $31.91 | $29.00 |
Net investment income (loss)
| (0.10) | (0.11) | (0.07) | (0.14) | 0.06 | 0.03 |
Net realized and unrealized gains (losses) on investments
| 11.05 | (2.71) | 2.49 | 1.46 | 4.26 | 4.02 |
Total from investment operations
| 10.95 | (2.82) | 2.42 | 1.32 | 4.32 | 4.05 |
| Distributions to shareholders from | | | | | | |
Net investment income
| 0.00 | 0.00 | 0.00 | (0.01) | (0.01) | (0.01) |
Net realized gains
| 0.00 | (1.40) | (0.59) | (1.32) | (0.19) | (1.13) |
Total distributions to shareholders
| 0.00 | (1.40) | (0.59) | (1.33) | (0.20) | (1.14) |
Net asset value, end of period
| $44.58 | $33.63 | $37.85 | $36.02 | $36.03 | $31.91 |
Total return1
| 32.56% | (7.89)% | 7.00% | 3.72% | 13.56% | 14.47% |
| Ratios to average net assets (annualized) | | | | | | |
Gross expenses
| 1.89% | 1.89% | 1.90% | 1.90% | 1.92% | 1.94% |
Net expenses
| 1.89% | 1.89% | 1.90% | 1.90% | 1.92% | 1.94% |
Net investment income (loss)
| (0.35)% | (0.19)% | (0.09)% | (0.35)% | 0.14% | 0.03% |
| Supplemental data | | | | | | |
Portfolio turnover rate
| 26% | 51% | 37% | 37% | 46% | 30% |
Net assets, end of period (000s omitted)
| $133,671 | $110,318 | $147,086 | $174,839 | $191,954 | $116,022 |
| 1 | Total return calculations do not include any sales charges. Returns for periods of less than one year are not annualized. |
The accompanying notes are an integral part of these financial statements.
16 | Wells Fargo Special Mid Cap Value Fund
Financial highlights
(For a share outstanding throughout each period)
| | | Year ended September 30 |
| Class R | Six months ended
March 31, 2021
(unaudited) | 2020 | 2019 | 2018 | 2017 | 2016 |
Net asset value, beginning of period
| $35.74 | $40.10 | $38.09 | $38.08 | $33.78 | $30.70 |
Net investment income
| 0.03 1 | 0.09 | 0.17 | 0.09 | 0.32 | 0.12 1 |
Net realized and unrealized gains (losses) on investments
| 11.72 | (2.90) | 2.57 | 1.49 | 4.43 | 4.32 |
Total from investment operations
| 11.75 | (2.81) | 2.74 | 1.58 | 4.75 | 4.44 |
| Distributions to shareholders from | | | | | | |
Net investment income
| (0.04) | (0.15) | (0.14) | (0.25) | (0.26) | (0.23) |
Net realized gains
| 0.00 | (1.40) | (0.59) | (1.32) | (0.19) | (1.13) |
Total distributions to shareholders
| (0.04) | (1.55) | (0.73) | (1.57) | (0.45) | (1.36) |
Net asset value, end of period
| $47.45 | $35.74 | $40.10 | $38.09 | $38.08 | $33.78 |
Total return2
| 32.90% | (7.45)% | 7.52% | 4.23% | 14.13% | 15.05% |
| Ratios to average net assets (annualized) | | | | | | |
Gross expenses
| 1.39% | 1.39% | 1.40% | 1.40% | 1.42% | 1.44% |
Net expenses
| 1.39% | 1.39% | 1.40% | 1.40% | 1.42% | 1.44% |
Net investment income
| 0.15% | 0.31% | 0.43% | 0.18% | 0.77% | 0.37% |
| Supplemental data | | | | | | |
Portfolio turnover rate
| 26% | 51% | 37% | 37% | 46% | 30% |
Net assets, end of period (000s omitted)
| $28,345 | $24,705 | $31,961 | $24,575 | $14,505 | $1,778 |
| 1 | Calculated based upon average shares outstanding |
| 2 | Returns for periods of less than one year are not annualized. |
The accompanying notes are an integral part of these financial statements.
Wells Fargo Special Mid Cap Value Fund | 17
Financial highlights
(For a share outstanding throughout each period)
| | | Year ended September 30 |
| Class R6 | Six months ended
March 31, 2021
(unaudited) | 2020 | 2019 | 2018 | 2017 | 2016 |
Net asset value, beginning of period
| $36.39 | $40.76 | $38.67 | $38.52 | $34.03 | $30.71 |
Net investment income
| 0.18 | 0.36 | 0.40 | 0.32 1 | 0.50 1 | 0.38 1 |
Net realized and unrealized gains (losses) on investments
| 11.91 | (2.94) | 2.62 | 1.55 | 4.53 | 4.30 |
Total from investment operations
| 12.09 | (2.58) | 3.02 | 1.87 | 5.03 | 4.68 |
| Distributions to shareholders from | | | | | | |
Net investment income
| (0.32) | (0.39) | (0.34) | (0.40) | (0.35) | (0.23) |
Net realized gains
| 0.00 | (1.40) | (0.59) | (1.32) | (0.19) | (1.13) |
Total distributions to shareholders
| (0.32) | (1.79) | (0.93) | (1.72) | (0.54) | (1.36) |
Net asset value, end of period
| $48.16 | $36.39 | $40.76 | $38.67 | $38.52 | $34.03 |
Total return2
| 33.35% | (6.84)% | 8.28% | 4.95% | 14.88% | 15.84% |
| Ratios to average net assets (annualized) | | | | | | |
Gross expenses
| 0.71% | 0.71% | 0.72% | 0.72% | 0.74% | 0.76% |
Net expenses
| 0.71% | 0.71% | 0.72% | 0.72% | 0.74% | 0.76% |
Net investment income
| 0.84% | 0.99% | 1.12% | 0.85% | 1.37% | 1.21% |
| Supplemental data | | | | | | |
Portfolio turnover rate
| 26% | 51% | 37% | 37% | 46% | 30% |
Net assets, end of period (000s omitted)
| $2,743,268 | $2,103,895 | $2,094,860 | $1,493,787 | $906,784 | $374,557 |
| 1 | Calculated based upon average shares outstanding |
| 2 | Returns for periods of less than one year are not annualized. |
The accompanying notes are an integral part of these financial statements.
18 | Wells Fargo Special Mid Cap Value Fund
Financial highlights
(For a share outstanding throughout each period)
| | | Year ended September 30 |
| Administrator Class | Six months ended
March 31, 2021
(unaudited) | 2020 | 2019 | 2018 | 2017 | 2016 |
Net asset value, beginning of period
| $36.02 | $40.35 | $38.23 | $38.12 | $33.67 | $30.45 |
Net investment income
| 0.10 1 | 0.24 1 | 0.27 1 | 0.18 1 | 0.34 1 | 0.26 |
Net realized and unrealized gains (losses) on investments
| 11.80 | (2.93) | 2.61 | 1.52 | 4.52 | 4.26 |
Total from investment operations
| 11.90 | (2.69) | 2.88 | 1.70 | 4.86 | 4.52 |
| Distributions to shareholders from | | | | | | |
Net investment income
| (0.16) | (0.24) | (0.17) | (0.27) | (0.22) | (0.17) |
Net realized gains
| 0.00 | (1.40) | (0.59) | (1.32) | (0.19) | (1.13) |
Total distributions to shareholders
| (0.16) | (1.64) | (0.76) | (1.59) | (0.41) | (1.30) |
Net asset value, end of period
| $47.76 | $36.02 | $40.35 | $38.23 | $38.12 | $33.67 |
Total return2
| 33.10% | (7.15)% | 7.88% | 4.58% | 14.50% | 15.42% |
| Ratios to average net assets (annualized) | | | | | | |
Gross expenses
| 1.06% | 1.06% | 1.07% | 1.07% | 1.09% | 1.10% |
Net expenses
| 1.06% | 1.06% | 1.07% | 1.07% | 1.09% | 1.10% |
Net investment income
| 0.47% | 0.65% | 0.72% | 0.47% | 0.95% | 0.88% |
| Supplemental data | | | | | | |
Portfolio turnover rate
| 26% | 51% | 37% | 37% | 46% | 30% |
Net assets, end of period (000s omitted)
| $378,301 | $324,727 | $604,126 | $978,368 | $1,156,796 | $834,134 |
| 1 | Calculated based upon average shares outstanding |
| 2 | Returns for periods of less than one year are not annualized. |
The accompanying notes are an integral part of these financial statements.
Wells Fargo Special Mid Cap Value Fund | 19
Financial highlights
(For a share outstanding throughout each period)
| | | Year ended September 30 |
| Institutional Class | Six months ended
March 31, 2021
(unaudited) | 2020 | 2019 | 2018 | 2017 | 2016 |
Net asset value, beginning of period
| $36.33 | $40.70 | $38.61 | $38.47 | $34.00 | $30.70 |
Net investment income
| 0.16 | 0.32 | 0.38 1 | 0.26 | 0.41 | 0.35 1 |
Net realized and unrealized gains (losses) on investments
| 11.90 | (2.94) | 2.60 | 1.56 | 4.58 | 4.29 |
Total from investment operations
| 12.06 | (2.62) | 2.98 | 1.82 | 4.99 | 4.64 |
| Distributions to shareholders from | | | | | | |
Net investment income
| (0.29) | (0.35) | (0.30) | (0.36) | (0.33) | (0.21) |
Net realized gains
| 0.00 | (1.40) | (0.59) | (1.32) | (0.19) | (1.13) |
Total distributions to shareholders
| (0.29) | (1.75) | (0.89) | (1.68) | (0.52) | (1.34) |
Net asset value, end of period
| $48.10 | $36.33 | $40.70 | $38.61 | $38.47 | $34.00 |
Total return2
| 33.29% | (6.93)% | 8.17% | 4.84% | 14.76% | 15.73% |
| Ratios to average net assets (annualized) | | | | | | |
Gross expenses
| 0.81% | 0.81% | 0.82% | 0.82% | 0.84% | 0.86% |
Net expenses
| 0.81% | 0.81% | 0.82% | 0.82% | 0.84% | 0.86% |
Net investment income
| 0.74% | 0.89% | 1.00% | 0.73% | 1.24% | 1.07% |
| Supplemental data | | | | | | |
Portfolio turnover rate
| 26% | 51% | 37% | 37% | 46% | 30% |
Net assets, end of period (000s omitted)
| $6,895,406 | $5,197,362 | $5,349,953 | $4,937,901 | $4,595,274 | $2,325,777 |
| 1 | Calculated based upon average shares outstanding |
| 2 | Returns for periods of less than one year are not annualized. |
The accompanying notes are an integral part of these financial statements.
20 | Wells Fargo Special Mid Cap Value Fund
Notes to financial statements (unaudited)
1. ORGANIZATION
Wells Fargo Funds Trust (the "Trust"), a Delaware statutory trust organized on March 10, 1999, is an open-end management investment company registered under the Investment Company Act of 1940, as amended (the "1940 Act"). As an investment company, the Trust follows the accounting and reporting guidance in Financial Accounting Standards Board (“FASB”) Accounting Standards Codification Topic 946, Financial Services – Investment Companies. These financial statements report on the Wells Fargo Special Mid Cap Value Fund (the "Fund") which is a diversified series of the Trust.
On February 23, 2021, Wells Fargo & Company announced that it has entered into a definitive agreement to sell Wells Fargo Asset Management ("WFAM") to GTCR LLC and Reverence Capital Partners, L.P. WFAM is the trade name used by the asset management businesses of Wells Fargo & Company and includes Wells Fargo Funds Management, LLC, the investment manager to the Fund, Wells Capital Management Incorporated and Wells Fargo Asset Management (International) Limited, both registered investment advisers providing sub-advisory services to certain funds, and Wells Fargo Funds Distributor, LLC, the Fund's principal underwriter. As part of the transaction, Wells Fargo & Company will own a 9.9% equity interest and will continue to serve as an important client and distribution partner. The transaction is expected to close in the second half of 2021, subject to customary closing conditions.
Consummation of the transaction will result in the automatic termination of the Fund's investment management agreement and sub-advisory agreement. The Fund's Board of Trustees will be asked to approve new investment management arrangements with the new company. If approved by the Board, the new investment management arrangements with the new company will be presented to the shareholders of the Fund for approval, and, if approved by shareholders, would take effect upon the closing of the transaction. The transaction is expected to close in the second half of 2021, subject to customary closing conditions.
2. SIGNIFICANT ACCOUNTING POLICIES
The following significant accounting policies, which are consistently followed in the preparation of the financial statements of the Fund, are in conformity with U.S. generally accepted accounting principles which require management to make estimates and assumptions that affect the reported amounts of assets and liabilities, disclosure of contingent assets and liabilities at the date of the financial statements, and the reported amounts of income and expenses during the reporting period. Actual results could differ from those estimates.
Securities valuation
All investments are valued each business day as of the close of regular trading on the New York Stock Exchange (generally 4 p.m. Eastern Time), although the Fund may deviate from this calculation time under unusual or unexpected circumstances.
Equity securities that are listed on a foreign or domestic exchange or market are valued at the official closing price or, if none, the last sales price. If no sale occurs on the principal exchange or market that day, a fair value price will be determined in accordance with the Fund’s Valuation Procedures.
Options that are listed on a foreign or domestic exchange or market are valued at the closing mid-price. Non-listed options are valued at the evaluated price provided by an independent pricing service or, if a reliable price is not available, the quoted bid price from an independent broker-dealer.
Investments in registered open-end investment companies are valued at net asset value. Interests in non-registered investment companies that are redeemable at net asset value are fair valued normally at net asset value.
Investments which are not valued using any of the methods discussed above are valued at their fair value, as determined in good faith by the Board of Trustees. The Board of Trustees has established a Valuation Committee comprised of the Trustees and has delegated to it the authority to take any actions regarding the valuation of portfolio securities that the Valuation Committee deems necessary or appropriate, including determining the fair value of portfolio securities, unless the determination has been delegated to the Wells Fargo Asset Management Pricing Committee at Wells Fargo Funds Management, LLC ("Funds Management"). The Board of Trustees retains the authority to make or ratify any valuation decisions or approve any changes to the Valuation Procedures as it deems appropriate. On a quarterly basis, the Board of Trustees receives reports on any valuation actions taken by the Valuation Committee or the Wells Fargo Asset Management Pricing Committee which may include items for ratification.
Securities lending
The Fund may lend its securities from time to time in order to earn additional income in the form of fees or interest on securities received as collateral or the investment of any cash received as collateral. When securities are on loan, the Fund receives interest or dividends on those securities. Cash collateral received in connection with its securities lending transactions
Wells Fargo Special Mid Cap Value Fund | 21
Notes to financial statements (unaudited)
is invested in Securities Lending Cash Investments, LLC (the "Securities Lending Fund"). Investments in Securities Lending Fund are valued at the evaluated bid price provided by an independent pricing service. Income earned from investment in the Securities Lending Fund (net of fees and rebates), if any, is included in income from affiliated securities on the Statement of Operations.
In a securities lending transaction, the net asset value of the Fund is affected by an increase or decrease in the value of the securities loaned and by an increase or decrease in the value of the instrument in which collateral is invested. The amount of securities lending activity undertaken by the Fund fluctuates from time to time. The Fund has the right under the lending agreement to recover the securities from the borrower on demand. In the event of default or bankruptcy by the borrower, the Fund may be prevented from recovering the loaned securities or gaining access to the collateral or may experience delays or costs in doing so. In such an event, the terms of the agreement allow the unaffiliated securities lending agent to use the collateral to purchase replacement securities on behalf of the Fund or pay the Fund the market value of the loaned securities. The Fund bears the risk of loss with respect to depreciation of its investment of the cash collateral.
Options
The Fund may write covered call options or secured put options on individual securities and/or indexes. When the Fund writes an option, an amount equal to the premium received is recorded as a liability and is subsequently adjusted to the current market value of the written option. Premiums received from written options that expire unexercised are recognized as realized gains on the expiration date. For exercised options, the difference between the premium received and the amount paid on effecting a closing purchase transaction, including brokerage commissions, is treated as a realized gain or loss. If a call option is exercised, the premium is added to the proceeds from the sale of the underlying security in calculating the realized gain or loss on the sale. If a put option is exercised, the premium reduces the cost of the security purchased. The Fund, as a writer of an option, bears the market risk of an unfavorable change in the price of the security and/or index underlying the written option.
The Fund may also purchase call or put options. Premiums paid are included in the Statement of Assets and Liabilities as investments, the values of which are subsequently adjusted based on the current market values of the options. Premiums paid for purchased options that expire are recognized as realized losses on the expiration date. Premiums paid for purchased options that are exercised or closed are added to the amount paid or offset against the proceeds received for the underlying security to determine the realized gain or loss. The risk of loss associated with purchased options is limited to the premium paid.
Options traded on an exchange are regulated and terms of the options are standardized. The Fund is subject to . Purchased options traded over-the-counter expose the Fund to counterparty risk in the event the counterparty does not perform. This risk can be mitigated by having a master netting arrangement between the Fund and the counterparty and by having the counterparty post collateral to cover the Fund’s exposure to the counterparty.
Security transactions and income recognition
Securities transactions are recorded on a trade date basis. Realized gains or losses are recorded on the basis of identified cost.
Dividend income is recognized on the ex-dividend date.
Income dividends and capital gain distributions from investment companies are recorded on the ex-dividend date. Capital gain distributions from investment companies are treated as realized gains.
Distributions to shareholders
Distributions to shareholders from net investment income and any net realized gains are recorded on the ex-dividend date and paid at least annually. Such distributions are determined in accordance with income tax regulations and may differ from U.S. generally accepted accounting principles. Dividend sources are estimated at the time of declaration. The tax character of distributions is determined as of the Fund's fiscal year end. Therefore, a portion of the Fund's distributions made prior to the Fund’s fiscal year end may be categorized as a tax return of capital at year end.
Federal and other taxes
The Fund intends to continue to qualify as a regulated investment company by distributing substantially all of its investment company taxable income and any net realized capital gains (after reduction for capital loss carryforwards) sufficient to relieve it from all, or substantially all, federal income taxes. Accordingly, no provision for federal income taxes was required.
The Fund’s income and federal excise tax returns and all financial records supporting those returns for the prior three fiscal years are subject to examination by the federal and Delaware revenue authorities. Management has analyzed the Fund's tax positions taken on federal, state, and foreign tax returns for all open tax years and does not believe that there are any uncertain tax positions that require recognition of a tax liability.
22 | Wells Fargo Special Mid Cap Value Fund
Notes to financial statements (unaudited)
As of March 31, 2021, the aggregate cost of all investments for federal income tax purposes was $8,377,382,431 and the unrealized gains (losses) consisted of:
| Gross unrealized gains | $3,239,305,769 |
| Gross unrealized losses | (124,752,746) |
| Net unrealized gains | $3,114,553,023 |
As of September 30, 2020, the Fund had current year deferred post-October capital losses consisting of $205,403,024 in short-term losses and $3,124,039 in long-term capital lossses
Class allocations
The separate classes of shares offered by the Fund differ principally in applicable sales charges, distribution, shareholder servicing, and administration fees. Class specific expenses are charged directly to that share class. Investment income, common fund-level expenses, and realized and unrealized gains (losses) on investments are allocated daily to each class of shares based on the relative proportion of net assets of each class.
3. FAIR VALUATION MEASUREMENTS
Fair value measurements of investments are determined within a framework that has established a fair value hierarchy based upon the various data inputs utilized in determining the value of the Fund’s investments. The three-level hierarchy gives the highest priority to unadjusted quoted prices in active markets for identical assets or liabilities (Level 1) and the lowest priority to unobservable inputs (Level 3). The Fund’s investments are classified within the fair value hierarchy based on the lowest level of input that is significant to the fair value measurement. The inputs are summarized into three broad levels as follows:
| ■ | Level 1 – quoted prices in active markets for identical securities |
| ■ | Level 2 – other significant observable inputs (including quoted prices for similar securities, interest rates, prepayment speeds, credit risk, etc.) |
| ■ | Level 3 – significant unobservable inputs (including the Fund’s own assumptions in determining the fair value of investments) |
The inputs or methodologies used for valuing investments in securities are not necessarily an indication of the risk associated with investing in those securities.
Wells Fargo Special Mid Cap Value Fund | 23
Notes to financial statements (unaudited)
The following is a summary of the inputs used in valuing the Fund’s assets and liabilities as of March 31, 2021:
| | Quoted prices
(Level 1) | Other significant
observable inputs
(Level 2) | Significant
unobservable inputs
(Level 3) | Total |
| Assets | | | | |
| Investments in: | | | | |
| Common stocks | | | | |
| Consumer discretionary | $ 1,436,253,880 | $ 0 | $0 | $ 1,436,253,880 |
| Consumer staples | 833,714,878 | 0 | 0 | 833,714,878 |
| Energy | 415,191,512 | 0 | 0 | 415,191,512 |
| Financials | 2,115,563,198 | 0 | 0 | 2,115,563,198 |
| Health care | 834,720,561 | 0 | 0 | 834,720,561 |
| Industrials | 2,605,049,002 | 0 | 0 | 2,605,049,002 |
| Information technology | 1,076,354,728 | 0 | 0 | 1,076,354,728 |
| Materials | 532,946,997 | 0 | 0 | 532,946,997 |
| Real estate | 759,959,222 | 0 | 0 | 759,959,222 |
| Utilities | 554,031,975 | 0 | 0 | 554,031,975 |
| Exchange-traded funds | 77,826,112 | 0 | 0 | 77,826,112 |
| Warrants | | | | |
| Financials | 0 | 7,894,824 | 0 | 7,894,824 |
| Short-term investments | | | | |
| Investment companies | 242,428,565 | 0 | 0 | 242,428,565 |
| Total assets | $11,484,040,630 | $7,894,824 | $0 | $11,491,935,454 |
Additional sector, industry or geographic detail, if any, is included in the Portfolio of Investments.
For the six months ended March 31, 2021, the Fund did not have any transfers into/out of Level 3.
4. TRANSACTIONS WITH AFFILIATES
Management fee
Funds Management, an indirect wholly owned subsidiary of Wells Fargo & Company ("Wells Fargo"), is the manager of the Fund and provides advisory and fund-level administrative services under an investment management agreement. Under the investment management agreement, Funds Management is responsible for, among other services, implementing the investment objectives and strategies of the Fund, supervising the subadviser and providing fund-level administrative services in connection with the Fund’s operations. As compensation for its services under the investment management agreement, Funds Management is entitled to receive a management fee at the following annual rate based on the Fund’s average daily net assets:
| Average daily net assets | Management fee |
| First $500 million | 0.750% |
| Next $500 million | 0.725 |
| Next $1 billion | 0.700 |
| Next $2 billion | 0.675 |
| Next $1 billion | 0.650 |
| Next $5 billion | 0.640 |
| Next $2 billion | 0.630 |
| Next $4 billion | 0.620 |
| Over $16 billion | 0.610 |
For the six months ended March 31, 2021, the management fee was equivalent to an annual rate of 0.66% of the Fund’s average daily net assets.
24 | Wells Fargo Special Mid Cap Value Fund
Notes to financial statements (unaudited)
Funds Management has retained the services of a subadviser to provide daily portfolio management to the Fund. The fee for subadvisory services is borne by Funds Management. Wells Capital Management Incorporated ("WellsCap"), an affiliate of Funds Management and an indirect wholly owned subsidiary of Wells Fargo, is the subadviser to the Fund and is entitled to receive a fee from Funds Management at an annual rate starting at 0.45% and declining to 0.30% as the average daily net assets of the Fund increase.
Administration fees
Under a class-level administration agreement, Funds Management provides class-level administrative services to the Fund, which includes paying fees and expenses for services provided by the transfer agent, sub-transfer agents, omnibus account servicers and record-keepers. As compensation for its services under the class-level administration agreement, Funds Management receives an annual fee which is calculated based on the average daily net assets of each class as follows:
| | Class-level
administration fee |
| Class A | 0.21% |
| Class C | 0.21 |
| Class R | 0.21 |
| Class R6 | 0.03 |
| Administrator Class | 0.13 |
| Institutional Class | 0.13 |
Waivers and/or expense reimbursements
Funds Management has contractually waived and/or reimbursed management and administration fees to the extent necessary to maintain certain net operating expense ratios for the Fund. When each class of the Fund has exceeded its expense cap, Funds Management has waived fees and/or reimbursed expenses from fund-level expenses on a proportionate basis and then from class specific expenses. When only certain classes exceed their expense caps, waivers and/or reimbursements are applied against class specific expenses before fund-level expenses. Funds Management has committed through January 31, 2022 to waive fees and/or reimburse expenses to the extent necessary to cap expenses. Prior to or after the commitment expiration date, the cap may be increased or the commitment to maintain the cap may be terminated only with the approval of the Board of Trustees. The contractual expense caps are as follows:
| | Expense ratio caps |
| Class A | 1.16% |
| Class C | 1.91 |
| Class R | 1.41 |
| Class R6 | 0.73 |
| Administrator Class | 1.08 |
| Institutional Class | 0.83 |
Distribution fees
The Trust has adopted a distribution plan for Class C and Class R shares of the Fund pursuant to Rule 12b-1 under the 1940 Act. Distribution fees are charged to Class C and Class R shares and paid to Wells Fargo Funds Distributor, LLC (“Funds Distributor”), the principal underwriter, at an annual rate of 0.75% of the average daily net assets of Class C shares and 0.25% of the average daily net assets of Class R shares.
In addition, Funds Distributor is entitled to receive the front-end sales charge from the purchase of Class A shares and a contingent deferred sales charge on the redemption of certain Class A shares. Funds Distributor is also entitled to receive the contingent deferred sales charges from redemptions of Class C shares. For the six months ended March 31, 2021, Funds Distributor received $17,154 from the sale of Class A shares. No contingent deferred sales charges were incurred by Class A and Class C shares for the six months ended March 31, 2021.
Wells Fargo Special Mid Cap Value Fund | 25
Notes to financial statements (unaudited)
Shareholder servicing fees
The Trust has entered into contracts with one or more shareholder servicing agents, whereby Class A, Class C, Class R, and Administrator Class of the Fund are charged a fee at an annual rate of 0.25% of the average daily net assets of each respective class. A portion of these total shareholder servicing fees were paid to affiliates of Wells Fargo.
Interfund transactions
The Fund may purchase or sell portfolio investment securities to certain other Wells Fargo affiliates pursuant to Rule 17a-7 under the 1940 Act and under procedures adopted by the Board of Trustees. The procedures have been designed to ensure that these interfund transactions, which do not incur broker commissions, are effected at current market prices.
5. INVESTMENT PORTFOLIO TRANSACTIONS
Purchases and sales of investments, excluding U.S. government obligations (if any) and short-term securities, for the six months ended March 31, 2021 were $2,544,821,480 and $2,566,014,596, respectively.
6. SECURITIES LENDING TRANSACTIONS
The Fund lends its securities through an unaffiliated securities lending agent and receives collateral in the form of cash or securities with a value at least equal to the value of the securities on loan. The value of the loaned securities is determined at the close of each business day and any increases or decreases in the required collateral are exchanged between the Fund and the counterparty on the next business day. Cash collateral received is invested in the Securities Lending Fund which seeks to provide a positive return compared to the daily Federal Funds Open Rate by investing in high-quality, U.S. dollar-denominated short-term money market instruments and is exempt from registration under Section 3(c)(7) of the 1940 Act. Securities Lending Fund is managed by Funds Management and is subadvised by WellsCap. Funds Management receives an advisory fee starting at 0.05% and declining to 0.01% as the average daily net assets of the Securities Lending Fund increase. All of the fees received by Funds Management are paid to WellsCap for its services as subadviser.
In the event of counterparty default or the failure of a borrower to return a loaned security, the Fund has the right to use the collateral to offset any losses incurred. As of March 31, 2021, the Fund had securities lending transactions with the following counterparties which are subject to offset:
| Counterparty | Value of
securities on
loan | Collateral
received1 | Net amount |
| Citigroup Global Markets Inc. | $119,037,724 | $(119,037,724) | $0 |
| Morgan Stanley & Co. LLC | 22,119,872 | (22,119,872) | 0 |
| UBS Securities LLC | 3,586,812 | (3,586,812) | 0 |
1 Collateral received within this table is limited to the collateral for the net transaction with the counterparty.
7. DERIVATIVE TRANSACTIONS
During the six months ended March 31, 2021, the Fund entered into written options for hedging purposes and had an average of 3,446 written option contracts.
The fair value, realized gains or losses and change in unrealized gains or losses, if any, on derivative instruments are reflected in the corresponding financial statement captions.
8. BANK BORROWINGS
The Trust (excluding the money market funds), Wells Fargo Master Trust and Wells Fargo Variable Trust are parties to a $350,000,000 revolving credit agreement whereby the Fund is permitted to use bank borrowings for temporary or emergency purposes, such as to fund shareholder redemption requests. Interest under the credit agreement is charged to the Fund based on a borrowing rate equal to the higher of the Federal Funds rate in effect on that day plus 1.25% or the overnight LIBOR rate in effect on that day plus 1.25%. In addition, an annual commitment fee equal to 0.25% of the unused balance is allocated to each participating fund.
For the six months ended March 31, 2021, there were no borrowings by the Fund under the agreement.
26 | Wells Fargo Special Mid Cap Value Fund
Notes to financial statements (unaudited)
9. INDEMNIFICATION
Under the Fund's organizational documents, the officers and Trustees have been granted certain indemnification rights against certain liabilities that may arise out of performance of their duties to the Fund. The Fund has entered into a separate agreement with each Trustee that converts indemnification rights currently existing under the Fund’s organizational documents into contractual rights that cannot be changed in the future without the consent of the Trustee. Additionally, in the normal course of business, the Fund may enter into contracts with service providers that contain a variety of indemnification clauses. The Fund’s maximum exposure under these arrangements is dependent on future claims that may be made against the Fund and, therefore, cannot be estimated.
10. CORONAVIRUS (COVID-19) PANDEMIC
On March 11, 2020, the World Health Organization announced that it had made the assessment that coronavirus disease 2019 (“COVID-19��) is a pandemic. The impacts of COVID-19 are affecting the entire global economy, individual companies and investment products, the funds, and the market in general. There is significant uncertainty around the extent and duration of business disruptions related to COVID-19 and the impacts may last for an extended period of time. COVID-19 has led to significant uncertainty and volatility in the financial markets.
Wells Fargo Special Mid Cap Value Fund | 27
Other information (unaudited)
PROXY VOTING INFORMATION
A description of the policies and procedures used to determine how to vote proxies relating to portfolio securities is available without charge, upon request, by calling 1-800-222-8222, visiting our website at wfam.com, or visiting the SEC website at sec.gov. Information regarding how the proxies related to portfolio securities were voted during the most recent 12-month period ended June 30 is available on the website at wfam.com or by visiting the SEC website at sec.gov.
QUARTERLY PORTFOLIO HOLDINGS INFORMATION
The Fund files its complete schedule of portfolio holdings with the SEC for the first and third quarters of each fiscal year as an exhibit to its reports on Form N-PORT. Shareholders may view the filed Form N-PORT by visiting the SEC website at sec.gov.
28 | Wells Fargo Special Mid Cap Value Fund
Other information (unaudited)
BOARD OF TRUSTEES AND OFFICERS
Each of the Trustees and Officers listed in the table below acts in identical capacities for each fund in the Wells Fargo family of funds, which consists of 142 mutual funds comprising the Wells Fargo Funds Trust, Wells Fargo Variable Trust, Wells Fargo Master Trust and four closed-end funds (collectively the “Fund Complex”). This table should be read in conjunction with the Prospectus and the Statement of Additional Information1. The mailing address of each Trustee and Officer is 525 Market Street, 12th Floor, San Francisco, CA 94105. Each Trustee and Officer serves an indefinite term, however, each Trustee serves such term until reaching the mandatory retirement age established by the Trustees.
Independent Trustees
Name and
year of birth | Position held and
length of service* | Principal occupations during past five years or longer | Current other
public company or
investment
company
directorships |
William R. Ebsworth
(Born 1957) | Trustee,
since 2015 | Retired. From 1984 to 2013, equities analyst, portfolio manager, research director and chief investment officer at Fidelity Management and Research Company in Boston, Tokyo, and Hong Kong, and retired in 2013 as Chief Investment Officer of Fidelity Strategic Advisers, Inc. where he led a team of investment professionals managing client assets. Prior thereto, Board member of Hong Kong Securities Clearing Co., Hong Kong Options Clearing Corp., the Thailand International Fund, Ltd., Fidelity Investments Life Insurance Company, and Empire Fidelity Investments Life Insurance Company. Audit Committee Chair and Investment Committee Chair of the Vincent Memorial Hospital Endowment (non-profit organization). Mr. Ebsworth is a CFA® charterholder. | N/A |
Jane A. Freeman
(Born 1953) | Trustee,
since 2015;
Chair Liaison,
since 2018 | Retired. From 2012 to 2014 and 1999 to 2008, Chief Financial Officer of Scientific Learning Corporation. From 2008 to 2012, Ms. Freeman provided consulting services related to strategic business projects. Prior to 1999, Portfolio Manager at Rockefeller & Co. and Scudder, Stevens & Clark. Board member of the Harding Loevner Funds from 1996 to 2014, serving as both Lead Independent Director and chair of the Audit Committee. Board member of the Russell Exchange Traded Funds Trust from 2011 to 2012 and the chair of the Audit Committee. Ms. Freeman is also an inactive Chartered Financial Analyst. | N/A |
Isaiah Harris, Jr.
(Born 1952) | Trustee,
since 2009; Audit
Committee
Chair,
since 2019 | Retired. Chairman of the Board of CIGNA Corporation since 2009, and Director since 2005. From 2003 to 2011, Director of Deluxe Corporation. Prior thereto, President and CEO of BellSouth Advertising and Publishing Corp. from 2005 to 2007, President and CEO of BellSouth Enterprises from 2004 to 2005 and President of BellSouth Consumer Services from 2000 to 2003. Emeritus member of the Iowa State University Foundation Board of Governors. Emeritus Member of the Advisory Board of Iowa State University School of Business. Advisory Board Member, Palm Harbor Academy (private school). Mr. Harris is a certified public accountant (inactive status). | CIGNA Corporation |
Judith M. Johnson
(Born 1949) | Trustee,
since 2008 | Retired. Prior thereto, Chief Executive Officer and Chief Investment Officer of Minneapolis Employees Retirement Fund from 1996 to 2008. Ms. Johnson is an attorney, certified public accountant and a certified managerial accountant. | N/A |
David F. Larcker
(Born 1950) | Trustee,
since 2009 | James Irvin Miller Professor of Accounting at the Graduate School of Business (Emeritus), Stanford University, Director of the Corporate Governance Research Initiative and Senior Faculty of The Rock Center for Corporate Governance since 2006. From 2005 to 2008, Professor of Accounting at the Graduate School of Business, Stanford University. Prior thereto, Ernst & Young Professor of Accounting at The Wharton School, University of Pennsylvania from 1985 to 2005. | N/A |
Wells Fargo Special Mid Cap Value Fund | 29
Other information (unaudited)
Name and
year of birth | Position held and
length of service* | Principal occupations during past five years or longer | Current other
public company or
investment
company
directorships |
Olivia S. Mitchell
(Born 1953) | Trustee,
since 2006;
Nominating and
Governance
Committee Chair,
since 2018 | International Foundation of Employee Benefit Plans Professor, Wharton School of the University of Pennsylvania since 1993. Director of Wharton’s Pension Research Council and Boettner Center on Pensions & Retirement Research, and Research Associate at the National Bureau of Economic Research. Previously, Cornell University Professor from 1978 to 1993. | N/A |
Timothy J. Penny
(Born 1951) | Trustee,
since 1996;
Chair,
since 2018 | President and Chief Executive Officer of Southern Minnesota Initiative Foundation, a non-profit organization, since 2007. Member of the Board of Trustees of NorthStar Education Finance, Inc., a non-profit organization, since 2007. | N/A |
James G. Polisson
(Born 1959) | Trustee,
since 2018 | Retired. Chief Marketing Officer, Source (ETF) UK Services, Ltd, from 2015 to 2017. From 2012 to 2015, Principal of The Polisson Group, LLC, a management consulting, corporate advisory and principal investing company. Chief Executive Officer and Managing Director at Russell Investments, Global Exchange Traded Funds from 2010 to 2012. Managing Director of Barclays Global Investors from 1998 to 2010 and Global Chief Marketing Officer for iShares and Barclays Global Investors from 2000 to 2010. Trustee of the San Francisco Mechanics’ Institute, a non-profit organization, from 2013 to 2015. Board member of the Russell Exchange Traded Fund Trust from 2011 to 2012. Director of Barclays Global Investors Holdings Deutschland GmbH from 2006 to 2009. Mr. Polisson is an attorney and has a retired status with the Massachusetts and District of Columbia Bar Associations. | N/A |
Pamela Wheelock
(Born 1959) | Trustee,
since January
2020; previously
Trustee from
January 2018 to
July 2019 | Board member of the Destination Medical Center Economic Development Agency, Rochester, Minnesota since 2019. Interim President of the McKnight Foundation from January to September 2020. Acting Commissioner, Minnesota Department of Human Services, July 2019 through September 2019. Human Services Manager (part-time), Minnesota Department of Human Services, October 2019 through December 2019. Chief Operating Officer, Twin Cities Habitat for Humanity from 2017 to 2019. Vice President of University Services, University of Minnesota from 2012 to 2016. Prior thereto, on the Board of Directors, Governance Committee and Finance Committee for the Minnesota Philanthropy Partners (Saint Paul Foundation) from 2012 to 2018, Interim Chief Executive Officer of Blue Cross Blue Shield of Minnesota from 2011 to 2012, Chairman of the Board from 2009 to 2012 and Board Director from 2003 to 2015. Vice President, Leadership and Community Engagement, Bush Foundation, Saint Paul, Minnesota (a private foundation) from 2009 to 2011. Executive Vice President and Chief Financial Officer, Minnesota Sports and Entertainment from 2004 to 2009 and Senior Vice President from 2002 to 2004. Executive Vice President of the Minnesota Wild Foundation from 2004 to 2008. Commissioner of Finance, State of Minnesota, from 1999 to 2002. Currently Board Chair of the Minnesota Wild Foundation since 2010. | N/A |
* Length of service dates reflect the Trustee’s commencement of service with the Trust’s predecessor entities, where applicable.
30 | Wells Fargo Special Mid Cap Value Fund
Other information (unaudited)
Officers
Name and
year of birth | Position held and
length of service | Principal occupations during past five years or longer |
Andrew Owen
(Born 1960) | President,
since 2017 | Executive Vice President of Wells Fargo & Company and Head of Affiliated Managers, Wells Fargo Asset Management, since 2014. In addition, Mr. Owen is currently President, Chief Executive Officer and Director of Wells Fargo Funds Management, LLC since 2017. Prior thereto, Executive Vice President responsible for marketing, investments and product development for Wells Fargo Funds Management, LLC, from 2009 to 2014. |
Jeremy DePalma
(Born 1974) | Treasurer,
since 2012
(for certain funds in
the Fund Complex);
since 2021 (for
the remaining funds in the
Fund Complex) | Senior Vice President of Wells Fargo Funds Management, LLC since 2009. Senior Vice President of Evergreen Investment Management Company, LLC from 2008 to 2010 and head of the Fund Reporting and Control Team within Fund Administration from 2005 to 2010. |
Michelle Rhee
(Born 1966) | Chief Legal Officer,
since 2019 | Secretary of Wells Fargo Funds Management, LLC and Chief Legal Counsel of Wells Fargo Asset Management since 2018. Deputy General Counsel of Wells Fargo Bank, N.A. since 2020 and Assistant General Counsel of Wells Fargo Bank, N.A. from 2018 to 2020. Associate General Counsel and Managing Director of Bank of America Corporation from 2004 to 2018. |
Catherine Kennedy
(Born 1969) | Secretary,
since 2019 | Vice President of Wells Fargo Funds Management, LLC and Senior Counsel of the Wells Fargo Legal Department since 2010. Vice President and Senior Counsel of Evergreen Investment Management Company, LLC from 1998 to 2010. |
Michael H. Whitaker
(Born 1967) | Chief Compliance Officer,
since 2016 | Chief Compliance Officer of Wells Fargo Asset Management since 2016. Senior Vice President and Chief Compliance Officer for Fidelity Investments from 2007 to 2016. |
1 The Statement of Additional Information includes additional information about the Trustees and is available, without charge, upon request, by calling 1-800-222-8222 or by visiting the website at wfam.com.
Wells Fargo Special Mid Cap Value Fund | 31
For more information
More information about Wells Fargo Funds is available free upon request. To obtain literature, please write, visit the Fund's website, or call:
Wells Fargo Funds
P.O. Box 219967
Kansas City, MO 64121-9967
Website: wfam.com
Individual investors: 1-800-222-8222
Retail investment professionals: 1-888-877-9275
Institutional investment professionals: 1-866-765-0778
This report and the financial statements contained herein are submitted for the general information of the shareholders of the Fund. If this report is used for promotional purposes, distribution of the report must be accompanied or preceded by a current prospectus. Before investing, please consider the investment objectives, risks, charges, and expenses of the investment. For a current prospectus and, if available, a summary prospectus, containing this information, call 1-800-222-8222 or visit the Fund's website at wfam.com. Read the prospectus carefully before you invest or send money.
Wells Fargo Asset Management (WFAM) is the trade name for certain investment advisory/management firms owned by Wells Fargo & Company. These firms include but are not limited to Wells Capital Management Incorporated and Wells Fargo Funds Management, LLC. Certain products managed by WFAM entities are distributed by Wells Fargo Funds Distributor, LLC (a broker-dealer and Member FINRA).
This material is for general informational and educational purposes only and is NOT intended to provide investment advice or a recommendation of any kind - including a recommendation for any specific investment, strategy, or plan.
INVESTMENT PRODUCTS: NOT FDIC INSURED ■ NO BANK GUARANTEE ■ MAY LOSE VALUE
© 2021 Wells Fargo & Company. All rights reserved.
PAR-0421-00300 05-21
SA234/SAR234 03-21
Not applicable.
| ITEM 3. | AUDIT COMMITTEE FINANCIAL EXPERT |
Not applicable.
| ITEM 4. | PRINCIPAL ACCOUNTANT FEES AND SERVICES |
Not applicable.
| ITEM 5. | AUDIT COMMITTEE OF LISTED REGISTRANTS |
Not applicable.
A Portfolio of Investments for each series of Wells Fargo Funds Trust is included as part of the report to shareholders filed under Item 1 of this Form.
| ITEM 7. | DISCLOSURE OF PROXY VOTING POLICIES AND PROCEDURES FOR CLOSED-END MANAGEMENT INVESTMENT COMPANIES |
Not applicable.
| ITEM 8. | PORTFOLIO MANAGERS OF CLOSED-END MANAGEMENT INVESTMENT COMPANIES |
Not applicable.
| ITEM 9. | PURCHASES OF EQUITY SECURITIES BY CLOSED-END MANAGEMEENT INVESTMENT COMPANY AND AFFILIATED PURCHASERS |
Not applicable.
| ITEM 10. | SUBMISSION OF MATTERS TO A VOTE OF SECURITY HOLDERS |
There have been no material changes to the procedures by which shareholders may recommend nominees to the registrant’s Board of Trustees that have been implemented since the registrant’s last provided disclosure in response to the requirements of this Item.
| ITEM 11. | CONTROLS AND PROCEDURES |
(a) The President and Treasurer have concluded that the Wells Fargo Funds Trust disclosure controls and procedures (as defined in Rule 30a-3(c) under the Investment Company Act of 1940) provide reasonable assurances that material information relating to the registrant is made known to them by the appropriate persons, based on their evaluation of these controls and procedures as of a date within 90 days of the filing of this report.
(b) There were no significant changes in the registrant’s internal controls over financial reporting (as defined in Rule 30a-3(d) under the Investment Company Act of 1940) that occurred during the most recent fiscal half-year of the period covered by this report that materially affected, or is reasonably likely to materially affect, the registrant’s internal control over financial reporting.
| ITEM 12. | DISCLOSURES OF SECURITIES LENDING ACTIVITES FOR CLOSED-END MANAGEMENT INVESTMENT COMPANIES |
Not applicable.
(a)(1) Not applicable.
(a)(2) Certifications pursuant to Section 302 of the Sarbanes-Oxley Act of 2002.
(b) Certifications pursuant to Section 906 of the Sarbanes-Oxley Act of 2002.
SIGNATURES
Pursuant to the requirements of the Securities Exchange Act of 1934 and the Investment Company Act of 1940, the registrant has duly caused this report to be signed on its behalf by the undersigned, thereunto duly authorized.
| | |
| Wells Fargo Funds Trust |
| |
| By: | | /s/ Andrew Owen |
| | Andrew Owen |
| | President |
|
| Date: May 26, 2021 |
Pursuant to the requirements of the Securities Exchange Act of 1934 and the Investment Company Act of 1940, this report has been signed below by the following persons on behalf of the registrant and in the capacities and on the date indicated.
| | |
| Wells Fargo Funds Trust |
| |
| By: | | /s/ Andrew Owen |
| | Andrew Owen |
| | President |
|
| Date: May 26, 2021 |
| | |
| |
| By: | | /s/ Jeremy DePalma |
| | Jeremy DePalma |
| | Treasurer |
|
| Date: May 26, 2021 |