UNITED STATES
SECURITIES AND EXCHANGE COMMISSION
Washington, D.C. 20549
FORM N-CSRS
CERTIFIED SHAREHOLDER REPORT OF REGISTERED
MANAGEMENT INVESTMENT COMPANIES
Investment Company Act file number: 811-09253
Wells Fargo Funds Trust
(Exact name of registrant as specified in charter)
525 Market St., San Francisco, CA 94105
(Address of principal executive offices) (Zip code)
Catherine Kennedy
Wells Fargo Funds Management, LLC
525 Market St., San Francisco, CA 94105
(Name and address of agent for service)
Registrant’s telephone number, including area code: 800-222-8222
Date of fiscal year end: July 31
Registrant is making a filing for 10 of its series:
Wells Fargo Disciplined U.S. Core Fund, Wells Fargo Endeavor Select Fund, Wells Fargo Growth Fund, Wells Fargo Classic Value Fund, Wells Fargo Large Cap Core Fund, Wells Fargo Large Cap Growth Fund, Wells Fargo Large Company Value Fund, Wells Fargo Low Volatility U.S. Equity Fund, Wells Fargo Omega Growth Fund, and Wells Fargo Premier Large Company Growth Fund.
Date of reporting period: January 31, 2021
| ITEM 1. | REPORT TO STOCKHOLDERS |
Semi-Annual Report
January 31, 2021
Wells Fargo Classic Value Fund
Reduce clutter.
Save trees.
Sign up for electronic delivery of prospectuses and shareholder reports at wellsfargo.com/ advantagedelivery
The views expressed and any forward-looking statements are as of January 31, 2021, unless otherwise noted, and are those of the Fund's portfolio managers and/or Wells Fargo Asset Management. Discussions of individual securities or the markets generally are not intended as individual recommendations. Future events or results may vary significantly from those expressed in any forward-looking statements. The views expressed are subject to change at any time in response to changing circumstances in the market. Wells Fargo Asset Management and the Fund disclaim any obligation to publicly update or revise any views expressed or forward-looking statements.
INVESTMENT PRODUCTS: NOT FDIC INSURED ■ NO BANK GUARANTEE ■ MAY LOSE VALUE
Wells Fargo Classic Value Fund | 1
Letter to shareholders (unaudited)
Dear Shareholder:
We are pleased to offer you this semi-annual report for the Wells Fargo Classic Value Fund for the six-month period that ended January 31, 2021. Despite a deeply challenging year, dominated by the spread of COVID-19 cases and a sharp drop in economic output throughout much of the world, global stocks performed extremely well, benefiting from ongoing central bank support and rising optimism over the development and distribution of effective COVID-19 vaccines. Bonds also had positive returns, led by global bonds and high-yield bonds.
For the six-month period, U.S. stocks, based on the S&P 500 Index1, gained 14.47%. International stocks, as measured by the MSCI ACWI ex USA Index (Net)2, returned 19.28%, while the MSCI EM Index (Net)3, had stronger performance, with a 24.07% gain. Among bond indexes, the Bloomberg Barclays U.S. Aggregate Bond Index4 returned -0.91%, the Bloomberg Barclays Global Aggregate ex-USD Index (unhedged)5 gained 3.71%, and the Bloomberg Barclays Municipal Bond Index6 returned 2.01% while the ICE BofA U.S. High Yield Index7 returned 6.82%.
The stock market rally continued in August.
The stock market continued a months-long rally in August despite concerns over rising numbers of U.S. and European COVID-19 cases. Relatively strong second-quarter earnings boosted investor sentiment along with the U.S. Federal Reserve’s announcement of a monetary policy shift expected to support longer-term low interest rates. U.S. manufacturing and services activity indexes beat expectations, while the U.S. housing market maintained strength. In Europe, retail sales expanded and consumer confidence was steady. China’s economy continued to expand.
Stocks grew more volatile in September on mixed economic data. U.S. economic activity continued to grow. However, U.S. unemployment remained elevated at 7.9% in September. With U.S. Congress delaying further fiscal relief and uncertainties surrounding a possible vaccine, doubts crept back into the financial markets. In the U.K., a lack of progress in Brexit talks weighed on markets. China’s economy picked up steam, fueled by increased global demand.
Andrew Owen
President
Wells Fargo Funds
“The stock market continued a months-long rally in August despite concerns over rising numbers of U.S. and European COVID-19 cases.”
| 1 | The S&P 500 Index consists of 500 stocks chosen for market size, liquidity, and industry group representation. It is a market-value-weighted index with each stock's weight in the index proportionate to its market value. You cannot invest directly in an index. |
| 2 | The Morgan Stanley Capital International (MSCI) All Country World Index (ACWI) ex USA Index (Net) is a free-float-adjusted market-capitalization-weighted index that is designed to measure the equity market performance of developed and emerging markets, excluding the United States. Source: MSCI. MSCI makes no express or implied warranties or representations and shall have no liability whatsoever with respect to any MSCI data contained herein. The MSCI data may not be further redistributed or used as a basis for other indices or any securities or financial products. This report is not approved, reviewed, or produced by MSCI. You cannot invest directly in an index. |
| 1 | The S&P 500 Index consists of 500 stocks chosen for market size, liquidity, and industry group representation. It is a market-value-weighted index with each stock's weight in the index proportionate to its market value. You cannot invest directly in an index. |
| 3 | The MSCI Emerging Markets (EM) Index (Net) is a free-float-adjusted market-capitalization-weighted index that is designed to measure equity market performance of emerging markets. You cannot invest directly in an index. |
| 1 | The S&P 500 Index consists of 500 stocks chosen for market size, liquidity, and industry group representation. It is a market-value-weighted index with each stock's weight in the index proportionate to its market value. You cannot invest directly in an index. |
| 4 | The Bloomberg Barclays U.S. Aggregate Bond Index is a broad-based benchmark that measures the investment-grade, U.S. dollar-denominated, fixed-rate taxable bond market, including Treasuries, government-related and corporate securities, mortgage-backed securities (agency fixed-rate and hybrid adjustable-rate mortgage pass-throughs), asset-backed securities, and commercial mortgage-backed securities. You cannot invest directly in an index. |
| 1 | The S&P 500 Index consists of 500 stocks chosen for market size, liquidity, and industry group representation. It is a market-value-weighted index with each stock's weight in the index proportionate to its market value. You cannot invest directly in an index. |
| 5 | The Bloomberg Barclays Global Aggregate ex-USD Index (unhedged) is an unmanaged index that provides a broad-based measure of the global investment-grade fixed-income markets excluding the U.S. dollar-denominated debt market. You cannot invest directly in an index. |
| 1 | The S&P 500 Index consists of 500 stocks chosen for market size, liquidity, and industry group representation. It is a market-value-weighted index with each stock's weight in the index proportionate to its market value. You cannot invest directly in an index. |
| 6 | The Bloomberg Barclays Municipal Bond Index is an unmanaged index composed of long-term tax-exempt bonds with a minimum credit rating of Baa. You cannot invest directly in an index. |
| 1 | The S&P 500 Index consists of 500 stocks chosen for market size, liquidity, and industry group representation. It is a market-value-weighted index with each stock's weight in the index proportionate to its market value. You cannot invest directly in an index. |
| 7 | The ICE BofA U.S. High Yield Index is a market-capitalization-weighted index of domestic and Yankee high-yield bonds. The index tracks the performance of high-yield securities traded in the U.S. bond market. You cannot invest directly in an index. Copyright 2021. ICE Data Indices, LLC. All rights reserved. |
2 | Wells Fargo Classic Value Fund
Letter to shareholders (unaudited)
In October, capital markets stepped back from their six-month rally. Market volatility rose in advance of the U.S. election and amid a global increase in COVID-19 infections. Europe introduced tighter restrictions affecting economic activity. U.S. markets looked favorably at the prospect of Democratic control of the federal purse strings, which could lead to additional fiscal stimulus and a boost to economic activity. Meanwhile, China reported 4.9% third-quarter GDP growth.
Global stocks rallied in November, propelled by optimism over three promising COVID-19 vaccines. Reversing recent trends, value stocks outperformed growth stocks and cyclical stocks outpaced technology stocks. However, U.S. unemployment remained elevated, with a net job loss of 10 million since February. The eurozone services purchasing managers’ index contracted sharply while the region’s manufacturing activity grew. The U.S. election results added to the upbeat mood as investors anticipated more consistent policies in the new administration.
Financial markets ended the year with strength on high expectations for a rapid rollout of the COVID-19 vaccines, the successful passage of a $900 billion stimulus package, and rising expectations of additional economic support from a Democratic-led Congress. U.S. economic data were mixed with still-elevated unemployment and weak retail sales but growth in manufacturing output. In contrast, China’s economic expansion continued in both manufacturing and nonmanufacturing. U.S. COVID-19 infection rates continued to rise even as new state and local lockdown measures were implemented.
The year 2021 began with emerging market stocks leading all major asset classes in January, driven by China’s strong economic growth and a broad recovery in corporate earnings, which propelled China’s stock market higher. In the United States, positive news on vaccine trials and January expansion in both the manufacturing and services sectors was offset by a weak December monthly jobs report. This was compounded by technical factors as some hedge funds were forced to sell stocks to protect themselves against a well-publicized short squeeze coordinated by a group of retail investors. Eurozone sentiment and economic growth were particularly weak, reflecting the impact of a new lockdown with stricter social distancing along with a slow vaccine rollout.
Don’t let short-term uncertainty derail long-term investment goals.
Periods of investment uncertainty can present challenges, but experience has taught us that maintaining long-term investment goals can be an effective way to plan for the future. To help you create a sound strategy based on your personal goals and risk tolerance, Wells Fargo Funds offers more than 100 mutual funds spanning a wide range of asset classes and investment styles. Although diversification cannot guarantee an investment profit or prevent losses, we believe it can be an effective way to manage investment risk and potentially smooth out overall portfolio performance. We encourage investors to know their investments and to understand that appropriate levels of risk-taking may unlock opportunities.
Thank you for choosing to invest with Wells Fargo Funds. We appreciate your confidence in us and remain committed to helping you meet your financial needs.
Sincerely,
Andrew Owen
President
Wells Fargo Funds
“Global stocks rallied in November, propelled by optimism over three promising COVID-19 vaccines.”
For further information about your Fund, contact your investment professional, visit our website at wfam.com, or call us directly at 1-800-222-8222.
Wells Fargo Classic Value Fund | 3
Performance highlights (unaudited)
Investment objective
The Fund seeks long-term capital appreciation.
Manager
Wells Fargo Funds Management, LLC
Subadviser
Wells Capital Management Incorporated
Portfolio managers
Miguel E. Giaconi, CFA®‡
Jean-Baptiste Nadal, CFA®‡
Average annual total returns (%) as of January 31, 2021
| | | Including sales charge | | Excluding sales charge | | Expense ratios1 (%) |
| | Inception date | 1 year | 5 year | 10 year | | 1 year | 5 year | 10 year | | Gross | Net 2 |
| Class A (EIVAX) | 8-1-2006 | -3.83 | 9.04 | 8.80 | | 2.03 | 10.34 | 9.45 | | 1.19 | 1.11 |
| Class C (EIVCX) | 8-1-2006 | 0.49 | 9.55 | 8.64 | | 1.49 | 9.55 | 8.64 | | 1.94 | 1.86 |
| Class R (EIVTX)3 | 3-1-2013 | – | – | – | | 2.03 | 10.11 | 9.21 | | 1.44 | 1.36 |
| Class R6 (EIVFX)4 | 11-30-2012 | – | – | – | | 2.56 | 11.00 | 9.96 | | 0.76 | 0.65 |
| Administrator Class (EIVDX) | 7-30-2010 | – | – | – | | 2.23 | 10.52 | 9.64 | | 1.11 | 0.95 |
| Institutional Class (EIVIX) | 8-1-2006 | – | – | – | | 2.42 | 10.77 | 9.88 | | 0.86 | 0.70 |
| Russell 1000® Value Index5 | – | – | – | – | | 4.09 | 10.71 | 10.15 | | – | – |
Figures quoted represent past performance, which is no guarantee of future results, and do not reflect taxes that a shareholder may pay on an investment in a fund. Investment return and principal value of an investment will fluctuate so that an investor’s shares, when redeemed, may be worth more or less than their original cost. Performance shown without sales charges would be lower if sales charges were reflected. Current performance may be lower or higher than the performance data quoted, which assumes the reinvestment of dividends and capital gains. Current month-end performance is available on the Fund’s website, wfam.com.
Index returns do not include transaction costs associated with buying and selling securities, any mutual fund fees or expenses, or any taxes. It is not possible to invest directly in an index.
For Class A shares, the maximum front-end sales charge is 5.75%. For Class C shares, the maximum contingent deferred sales charge is 1.00%. Performance including a contingent deferred sales charge assumes the sales charge for the corresponding time period. Class R, Class R6, Administrator Class, and Institutional Class shares are sold without a front-end sales charge or contingent deferred sales charge.
Stock values fluctuate in response to the activities of individual companies and general market and economic conditions. Certain investment strategies tend to increase the total risk of an investment (relative to the broader market). The Fund is exposed to foreign investment risk and smaller-company securities risk. Consult the Fund’s prospectus for additional information on these and other risks.
Please see footnotes on page 5.
4 | Wells Fargo Classic Value Fund
Performance highlights (unaudited)
| Ten largest holdings (%) as of January 31, 20216 |
| NextEra Energy Incorporated | 3.88 |
| Mondelez International Incorporated Class A | 3.72 |
| JPMorgan Chase & Company | 3.63 |
| Honeywell International Incorporated | 3.52 |
| Bank of America Corporation | 3.38 |
| The Goldman Sachs Group Incorporated | 3.33 |
| Northrop Grumman Corporation | 3.14 |
| Merck & Company Incorporated | 3.08 |
| Kellogg Company | 2.96 |
| Intercontinental Exchange Incorporated | 2.84 |
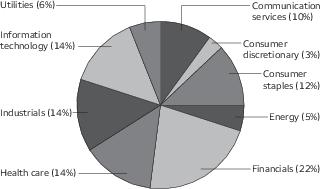
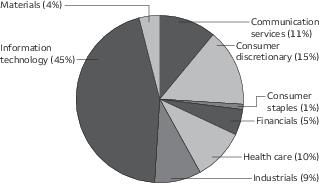
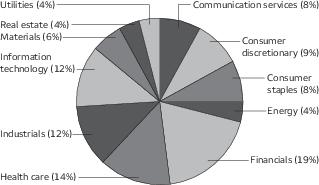
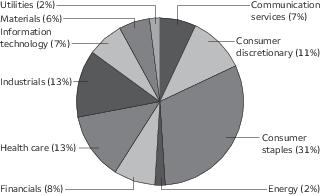
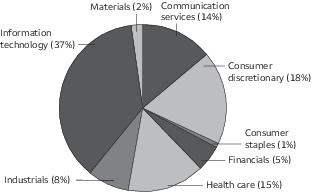
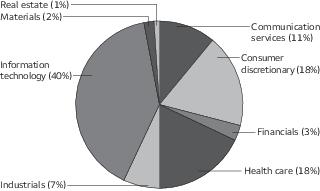
| Sector allocation as of January 31, 20217 |
| ‡ | CFA® and Chartered Financial Analyst® are trademarks owned by CFA Institute. |
| 1 | Reflects the expense ratios as stated in the most recent prospectuses. The expense ratios shown are subject to change and may differ from the annualized expense ratios shown in the financial highlights of this report. |
| 2 | The manager has contractually committed through November 30, 2021, to waive fees and/or reimburse expenses to the extent necessary to cap total annual fund operating expenses after fee waivers at 1.11% for Class A, 1.86% for Class C, 1.36% for Class R, 0.65% for Class R6, 0.95% for Administrator Class, and 0.70% for Institutional Class. Brokerage commissions, stamp duty fees, interest, taxes, acquired fund fees and expenses (if any), and extraordinary expenses are excluded from the expense caps. Prior to or after the commitment expiration date, the caps may be increased or the commitment to maintain the caps may be terminated only with the approval of the Board of Trustees. Without these caps, the Fund’s returns would have been lower. The expense ratio paid by an investor is the net expense ratio (the total annual fund operating expenses after fee waivers) as stated in the prospectuses. |
| 3 | Historical performance shown for the Class R shares prior to their inception reflects the performance of the Institutional Class shares, adjusted to reflect the higher expenses applicable to the Class R shares. |
| 4 | Historical performance shown for the Class R6 shares prior to their inception reflects the performance of the Institutional Class shares, and includes the higher expenses applicable to the Institutional Class shares. If these expenses had not been included, returns for the Class R6 shares would be higher. |
| 5 | The Russell 1000® Value Index measures the performance of those Russell 1000 companies with lower price/book ratios and lower forecasted growth values. You cannot invest directly in an index. |
| 6 | Figures represent the percentage of the Fund's net assets. Holdings are subject to change and may have changed since the date specified. |
| 7 | Figures represent the percentage of the Fund's long-term investments. These amounts are subject to change and may have changed since the date specified. |
Wells Fargo Classic Value Fund | 5
Fund expenses (unaudited)
As a shareholder of the Fund, you incur two types of costs: (1) transaction costs, including sales charges (loads) on purchase payments and contingent deferred sales charges (if any) on redemptions and (2) ongoing costs, including management fees, distribution (12b-1) and/or shareholder servicing fees, and other Fund expenses. This example is intended to help you understand your ongoing costs (in dollars) of investing in the Fund and to compare these costs with the ongoing costs of investing in other mutual funds.
The example is based on an investment of $1,000 invested at the beginning of the six-month period and held for the entire period from August 1, 2020 to January 31, 2021.
Actual expenses
The “Actual” line of the table below provides information about actual account values and actual expenses. You may use the information in this line, together with the amount you invested, to estimate the expenses that you paid over the period. Simply divide your account value by $1,000 (for example, an $8,600 account value divided by $1,000 = 8.6), then multiply the result by the number in the “Actual” line under the heading entitled “Expenses paid during period” for your applicable class of shares to estimate the expenses you paid on your account during this period.
Hypothetical example for comparison purposes
The “Hypothetical” line of the table below provides information about hypothetical account values and hypothetical expenses based on the Fund’s actual expense ratio and an assumed rate of return of 5% per year before expenses, which is not the Fund’s actual return. The hypothetical account values and expenses may not be used to estimate the actual ending account balance or expenses you paid for the period. You may use this information to compare the ongoing costs of investing in the Fund and other funds. To do so, compare this 5% hypothetical example with the 5% hypothetical examples that appear in the shareholder reports of the other funds.
Please note that the expenses shown in the table are meant to highlight your ongoing costs only and do not reflect any transactional costs, such as sales charges (loads) and contingent deferred sales charges. Therefore, the “Hypothetical” line of the table is useful in comparing ongoing costs only and will not help you determine the relative total costs of owning different funds. In addition, if these transactional costs were included, your costs would have been higher
| | Beginning
account value
8-1-2020 | Ending
account value
1-31-2021 | Expenses
paid during
the period1 | Annualized net
expense ratio |
| Class A | | | | |
| Actual | $1,000.00 | $1,119.22 | $5.82 | 1.09% |
| Hypothetical (5% return before expenses) | $1,000.00 | $1,019.71 | $5.55 | 1.09% |
| Class C | | | | |
| Actual | $1,000.00 | $1,117.38 | $9.93 | 1.86% |
| Hypothetical (5% return before expenses) | $1,000.00 | $1,015.83 | $9.45 | 1.86% |
| Class R | | | | |
| Actual | $1,000.00 | $1,121.24 | $7.27 | 1.36% |
| Hypothetical (5% return before expenses) | $1,000.00 | $1,018.35 | $6.92 | 1.36% |
| Class R6 | | | | |
| Actual | $1,000.00 | $1,122.09 | $3.48 | 0.65% |
| Hypothetical (5% return before expenses) | $1,000.00 | $1,021.93 | $3.31 | 0.65% |
| Administrator Class | | | | |
| Actual | $1,000.00 | $1,121.17 | $4.87 | 0.91% |
| Hypothetical (5% return before expenses) | $1,000.00 | $1,020.62 | $4.63 | 0.91% |
| Institutional Class | | | | |
| Actual | $1,000.00 | $1,120.91 | $3.74 | 0.70% |
| Hypothetical (5% return before expenses) | $1,000.00 | $1,021.68 | $3.57 | 0.70% |
1 Expenses paid is equal to the annualized net expense ratio of each class multiplied by the average account value over the period, multiplied by the number of days in the most recent fiscal half-year divided by the number of days in the fiscal year (to reflect the one-half-year period).
6 | Wells Fargo Classic Value Fund
Portfolio of investments—January 31, 2021
| | | | | Shares | Value |
| Common stocks: 94.00% | | | | | |
| Communication services: 9.85% | | | | | |
| Diversified telecommunication services: 2.50% | | | | | |
| Verizon Communications Incorporated | | | | 362,400 | $ 19,841,400 |
| Entertainment: 2.47% | | | | | |
| The Walt Disney Company | | | | 116,800 | 19,642,256 |
| Interactive media & services: 2.20% | | | | | |
| Alphabet Incorporated Class C † | | | | 9,500 | 17,439,530 |
| Media: 2.68% | | | | | |
| Comcast Corporation Class A | | | | 429,300 | 21,280,401 |
| Consumer discretionary: 3.31% | | | | | |
| Multiline retail: 2.41% | | | | | |
| Dollar Tree Incorporated † | | | | 188,300 | 19,142,578 |
| Specialty retail: 0.90% | | | | | |
| Advance Auto Parts Incorporated | | | | 48,000 | 7,158,720 |
| Consumer staples: 11.14% | | | | | |
| Beverages: 1.82% | | | | | |
| The Coca-Cola Company | | | | 300,600 | 14,473,890 |
| Food & staples retailing: 0.43% | | | | | |
| The Kroger Company | | | | 97,500 | 3,363,750 |
| Food products: 6.68% | | | | | |
| Kellogg Company | | | | 398,600 | 23,493,484 |
| Mondelez International Incorporated Class A | | | | 532,700 | 29,532,888 |
| | | | | | 53,026,372 |
| Household products: 2.21% | | | | | |
| The Procter & Gamble Company | | | | 137,000 | 17,564,770 |
| Energy: 4.49% | | | | | |
| Oil, gas & consumable fuels: 4.49% | | | | | |
| Chevron Corporation | | | | 170,800 | 14,552,160 |
| ConocoPhillips | | | | 289,703 | 11,596,811 |
| EOG Resources Incorporated | | | | 186,200 | 9,488,752 |
| | | | | | 35,637,723 |
| Financials: 20.27% | | | | | |
| Banks: 9.64% | | | | | |
| Bank of America Corporation | | | | 905,600 | 26,851,040 |
| JPMorgan Chase & Company | | | | 223,900 | 28,809,213 |
| Truist Financial Corporation | | | | 435,800 | 20,909,684 |
| | | | | | 76,569,937 |
The accompanying notes are an integral part of these financial statements.
Wells Fargo Classic Value Fund | 7
Portfolio of investments—January 31, 2021
| | | | | Shares | Value |
| Capital markets: 6.17% | | | | | |
| Intercontinental Exchange Incorporated | | | | 204,800 | $ 22,599,680 |
| The Goldman Sachs Group Incorporated | | | | 97,500 | 26,439,075 |
| | | | | | 49,038,755 |
| Insurance: 4.46% | | | | | |
| American International Group Incorporated | | | | 383,300 | 14,350,752 |
| The Allstate Corporation | | | | 196,300 | 21,039,434 |
| | | | | | 35,390,186 |
| Health care: 12.78% | | | | | |
| Biotechnology: 1.20% | | | | | |
| Gilead Sciences Incorporated | | | | 145,000 | 9,512,000 |
| Health care equipment & supplies: 4.62% | | | | | |
| Medtronic plc | | | | 152,000 | 16,922,160 |
| Stryker Corporation | | | | 89,581 | 19,798,297 |
| | | | | | 36,720,457 |
| Health care providers & services: 2.53% | | | | | |
| Cigna Corporation | | | | 92,500 | 20,077,125 |
| Pharmaceuticals: 4.43% | | | | | |
| Eli Lilly & Company | | | | 51,500 | 10,710,455 |
| Merck & Company Incorporated | | | | 318,000 | 24,508,260 |
| | | | | | 35,218,715 |
| Industrials: 13.52% | | | | | |
| Aerospace & defense: 7.63% | | | | | |
| General Dynamics Corporation | | | | 120,300 | 17,645,604 |
| Northrop Grumman Corporation | | | | 87,000 | 24,935,070 |
| The Boeing Company | | | | 92,800 | 18,020,832 |
| | | | | | 60,601,506 |
| Commercial services & supplies: 2.37% | | | | | |
| Waste Management Incorporated | | | | 169,000 | 18,813,080 |
| Industrial conglomerates: 3.52% | | | | | |
| Honeywell International Incorporated | | | | 143,200 | 27,976,984 |
| Information technology: 12.92% | | | | | |
| Communications equipment: 4.81% | | | | | |
| Cisco Systems Incorporated | | | | 369,700 | 16,481,226 |
| Motorola Solutions Incorporated | | | | 129,500 | 21,697,725 |
| | | | | | 38,178,951 |
| IT services: 3.45% | | | | | |
| Fiserv Incorporated † | | | | 190,800 | 19,593,252 |
| Visa Incorporated Class A | | | | 40,300 | 7,787,975 |
| | | | | | 27,381,227 |
| Semiconductors & semiconductor equipment: 2.15% | | | | | |
| NXP Semiconductors NV | | | | 106,600 | 17,106,102 |
The accompanying notes are an integral part of these financial statements.
8 | Wells Fargo Classic Value Fund
Portfolio of investments—January 31, 2021
| | | | | Shares | Value |
| Software: 2.51% | | | | | |
| Microsoft Corporation | | | | 86,100 | $ 19,971,756 |
| Utilities: 5.72% | | | | | |
| Electric utilities: 3.88% | | | | | |
| NextEra Energy Incorporated | | | | 380,800 | 30,795,296 |
| Multi-utilities: 1.84% | | | | | |
| WEC Energy Group Incorporated | | | | 164,500 | 14,624,050 |
| Total Common stocks (Cost $566,142,236) | | | | | 746,547,517 |
| | | Yield | | | |
| Short-term investments: 1.49% | | | | | |
| Investment companies: 1.49% | | | | | |
| Wells Fargo Government Money Market Fund Select Class ♠∞ | | 0.03% | | 11,820,114 | 11,820,114 |
| Total Short-term investments (Cost $11,820,114) | | | | | 11,820,114 |
| Total investments in securities (Cost $577,962,350) | 95.49% | | | | 758,367,631 |
| Other assets and liabilities, net | 4.51 | | | | 35,795,297 |
| Total net assets | 100.00% | | | | $794,162,928 |
| † | Non-income-earning security |
| ♠ | The issuer of the security is an affiliated person of the Fund as defined in the Investment Company Act of 1940. |
| ∞ | The rate represents the 7-day annualized yield at period end. |
Investments in affiliates
An affiliated investment is an investment in which the Fund owns at least 5% of the outstanding voting shares of the issuer or as a result of other relationships, such as the Fund and the issuer having the same investment manager. Transactions with issuers that were either affiliated persons of the Fund at the beginning of the period or the end of the period were as follows:
| | Value,
beginning of
period | Purchases | Sales
proceeds | Net
realized
gains
(losses) | | Net
change in
unrealized
gains
(losses) | | Value,
end of
period | | % of
net
assets | Shares,
end
of period | Income
from
affiliated
securities |
| Short-term investments | | | | | | | | | | | | |
| Investment companies | | | | | | | | | | | | |
| Securities Lending Cash Investments LLC* | $ 0 | $29,888,005 | $(29,888,005) | $0 | | $0 | | $ 0 | | | 0 | $ 1,815# |
| Wells Fargo Government Money Market Fund Select Class | 19,155,681 | 67,809,666 | (75,145,233) | 0 | | 0 | | 11,820,114 | | | 11,820,114 | 3,502 |
| | | | | $0 | | $0 | | $11,820,114 | | 1.49% | | $5,317 |
| * | No longer held at the end of period. |
| # | Amount shown represents income before fees and rebates. |
The accompanying notes are an integral part of these financial statements.
Wells Fargo Classic Value Fund | 9
Statement of assets and liabilities—January 31, 2021 (unaudited)
| | |
| Assets | |
Investments in unaffiliated securities, at value (cost $566,142,236)
| $ 746,547,517 |
Investments in affiliated securites, at value (cost $11,820,114)
| 11,820,114 |
Receivable for investments sold
| 36,097,998 |
Receivable for dividends
| 830,657 |
Receivable for Fund shares sold
| 19,758 |
Prepaid expenses and other assets
| 2,690 |
Total assets
| 795,318,734 |
| Liabilities | |
Management fee payable
| 390,599 |
Payable for Fund shares redeemed
| 343,546 |
Shareholder servicing fees payable
| 151,016 |
Administration fees payable
| 108,246 |
Trustees’ fees and expenses payable
| 2,218 |
Distribution fees payable
| 1,692 |
Accrued expenses and other liabilities
| 158,489 |
Total liabilities
| 1,155,806 |
Total net assets
| $794,162,928 |
| Net assets consist of | |
Paid-in capital
| $ 568,040,945 |
Total distributable earnings
| 226,121,983 |
Total net assets
| $794,162,928 |
| Computation of net asset value and offering price per share | |
Net assets – Class A
| $ 256,889,607 |
Shares outstanding – Class A1
| 20,448,447 |
Net asset value per share – Class A
| $12.56 |
Maximum offering price per share – Class A2
| $13.33 |
Net assets – Class C
| $ 2,409,624 |
Shares outstanding – Class C1
| 196,160 |
Net asset value per share – Class C
| $12.28 |
Net assets – Class R
| $ 90,885 |
Shares outstanding – Class R1
| 7,161 |
Net asset value per share – Class R
| $12.69 |
Net assets – Class R6
| $ 13,432,447 |
Shares outstanding – Class R61
| 1,089,439 |
Net asset value per share – Class R6
| $12.33 |
Net assets – Administrator Class
| $ 433,338,819 |
Shares outstanding – Administrator Class1
| 32,651,629 |
Net asset value per share – Administrator Class
| $13.27 |
Net assets – Institutional Class
| $ 88,001,546 |
Shares outstanding – Institutional Class1
| 6,963,670 |
Net asset value per share – Institutional Class
| $12.64 |
| 1 | The Fund has an unlimited number of authorized shares. |
| 2 | Maximum offering price is computed as 100/94.25 of net asset value. On investments of $50,000 or more, the offering price is reduced. |
The accompanying notes are an integral part of these financial statements.
10 | Wells Fargo Classic Value Fund
Statement of operations—six months ended January 31, 2021 (unaudited)
| | |
| Investment income | |
Dividends (net of foreign withholdings taxes of $16,026)
| $ 7,817,436 |
Income from affiliated securities
| 9,582 |
Total investment income
| 7,827,018 |
| Expenses | |
Management fee
| 2,688,084 |
| Administration fees | |
Class A
| 266,561 |
Class C
| 3,679 |
Class R
| 87 |
Class R6
| 1,930 |
Administrator Class
| 274,634 |
Institutional Class
| 55,356 |
| Shareholder servicing fees | |
Class A
| 304,971 |
Class C
| 4,379 |
Class R
| 103 |
Administrator Class
| 527,881 |
| Distribution fees | |
Class C
| 13,082 |
Class R
| 95 |
Custody and accounting fees
| 19,768 |
Professional fees
| 22,706 |
Registration fees
| 49,681 |
Shareholder report expenses
| 36,568 |
Trustees’ fees and expenses
| 9,708 |
Other fees and expenses
| 23,982 |
Total expenses
| 4,303,255 |
| Less: Fee waivers and/or expense reimbursements | |
Fund-level
| (294,144) |
Class A
| (33,832) |
Class C
| (274) |
Class R6
| (1,930) |
Administrator Class
| (257,796) |
Institutional Class
| (34,643) |
Net expenses
| 3,680,636 |
Net investment income
| 4,146,382 |
Payment from affiliate
| 91,336 |
| Realized and unrealized gains (losses) on investments | |
Net realized gains on investments
| 56,414,693 |
Net change in unrealized gains (losses) on investments
| 27,649,934 |
Net realized and unrealized gains (losses) on investments
| 84,064,627 |
Net increase in net assets resulting from operations
| 88,302,345 |
The accompanying notes are an integral part of these financial statements.
Wells Fargo Classic Value Fund | 11
Statement of changes in net assets
| | |
| | Six months ended
January 31, 2021
(unaudited) | Year ended
July 31, 2020 |
| Operations | | | | |
Net investment income
| | $ 4,146,382 | | $ 10,772,949 |
Payment from affiliate
| | 91,336 | | 0 |
Net realized gains (losses) on investments
| | 56,414,693 | | (3,781,048) |
Net change in unrealized gains (losses) on investments
| | 27,649,934 | | (43,117,237) |
Net increase (decrease) in net assets resulting from operations
| | 88,302,345 | | (36,125,336) |
| Distributions to shareholders from | | | | |
| Net investment income and net realized gains | | | | |
Class A
| | (2,978,223) | | (28,687,356) |
Class C
| | 0 | | (597,397) |
Class R
| | (777) | | (9,076) |
Class R6
| | (209,259) | | (458,181) |
Administrator Class
| | (5,693,424) | | (45,185,976) |
Institutional Class
| | (1,346,136) | | (10,686,553) |
Total distributions to shareholders
| | (10,227,819) | | (85,624,539) |
| Capital share transactions | Shares | | Shares | |
| Proceeds from shares sold | | | | |
Class A
| 271,257 | 3,280,747 | 374,915 | 4,569,597 |
Class C
| 13,217 | 162,725 | 58,656 | 692,729 |
Class R
| 565 | 7,203 | 705 | 8,409 |
Class R6
| 123,143 | 1,445,198 | 774,821 | 8,508,694 |
Administrator Class
| 75,466 | 1,003,074 | 365,622 | 4,856,780 |
Institutional Class
| 352,790 | 4,270,429 | 1,902,355 | 21,368,302 |
| | | 10,169,376 | | 40,004,511 |
| Reinvestment of distributions | | | | |
Class A
| 224,806 | 2,850,540 | 2,187,382 | 27,522,364 |
Class C
| 0 | 0 | 46,079 | 559,402 |
Class R
| 49 | 634 | 588 | 7,444 |
Class R6
| 9,762 | 121,435 | 36,211 | 448,674 |
Administrator Class
| 399,009 | 5,342,733 | 3,206,695 | 42,691,455 |
Institutional Class
| 105,063 | 1,339,551 | 812,821 | 10,324,119 |
| | | 9,654,893 | | 81,553,458 |
| Payment for shares redeemed | | | | |
Class A
| (1,725,772) | (20,894,383) | (3,055,060) | (36,802,224) |
Class C
| (217,493) | (2,537,916) | (282,178) | (3,247,977) |
Class R
| (72) | (896) | (1,307) | (13,014) |
Class R6
| (78,792) | (958,490) | (103,056) | (1,219,499) |
Administrator Class
| (1,390,155) | (17,901,448) | (3,608,759) | (45,625,921) |
Institutional Class
| (887,351) | (10,559,713) | (3,405,957) | (37,492,113) |
| | | (52,852,846) | | (124,400,748) |
Net decrease in net assets resulting from capital share transactions
| | (33,028,577) | | (2,842,779) |
Total increase (decrease) in net assets
| | 45,045,949 | | (124,592,654) |
| Net assets | | | | |
Beginning of period
| | 749,116,979 | | 873,709,633 |
End of period
| | $794,162,928 | | $ 749,116,979 |
The accompanying notes are an integral part of these financial statements.
12 | Wells Fargo Classic Value Fund
Financial highlights
(For a share outstanding throughout each period)
| | | Year ended July 31 |
| Class A | Six months ended
January 31, 2021
(unaudited) | 2020 | 2019 | 2018 | 2017 | 2016 |
Net asset value, beginning of period
| $11.35 | $13.13 | $13.05 | $12.61 | $12.01 | $13.73 |
Net investment income
| 0.06 | 0.14 | 0.10 | 0.11 | 0.12 1 | 0.13 |
Payment from affiliate
| 0.00 2 | 0.00 | 0.00 | 0.00 | 0.00 | 0.00 |
Net realized and unrealized gains (losses) on investments
| 1.29 | (0.58) | 0.94 | 1.39 | 1.43 | (0.42) |
Total from investment operations
| 1.35 | (0.44) | 1.04 | 1.50 | 1.55 | (0.29) |
| Distributions to shareholders from | | | | | | |
Net investment income
| (0.14) | (0.10) | (0.12) | (0.06) | (0.14) | (0.11) |
Net realized gains
| 0.00 | (1.24) | (0.84) | (1.00) | (0.81) | (1.32) |
Total distributions to shareholders
| (0.14) | (1.34) | (0.96) | (1.06) | (0.95) | (1.43) |
Net asset value, end of period
| $12.56 | $11.35 | $13.13 | $13.05 | $12.61 | $12.01 |
Total return3
| 11.92% 4 | (4.25)% | 9.03% | 12.43% | 13.50% | (1.73)% |
| Ratios to average net assets (annualized) | | | | | | |
Gross expenses
| 1.18% | 1.18% | 1.18% | 1.18% | 1.17% | 1.17% |
Net expenses
| 1.09% | 1.10% | 1.10% | 1.10% | 1.10% | 1.10% |
Net investment income
| 0.92% | 1.20% | 0.81% | 0.83% | 0.95% | 1.12% |
| Supplemental data | | | | | | |
Portfolio turnover rate
| 12% | 34% | 27% | 21% | 27% | 34% |
Net assets, end of period (000s omitted)
| $256,890 | $245,977 | $291,111 | $289,683 | $293,599 | $318,543 |
| 1 | Calculated based upon average shares outstanding |
| 2 | Amount is less than $0.005. |
| 3 | Total return calculations do not include any sales charges. Returns for periods of less than one year are not annualized. |
| 4 | During the six months ended January 31, 2021, the Fund received a payment from an affiliate that had an impact of less than 0.005% on total return. See Note 4 in the Notes to Financial Statements for additional information. |
The accompanying notes are an integral part of these financial statements.
Wells Fargo Classic Value Fund | 13
Financial highlights
(For a share outstanding throughout each period)
| | | Year ended July 31 |
| Class C | Six months ended
January 31, 2021
(unaudited) | 2020 | 2019 | 2018 | 2017 | 2016 |
Net asset value, beginning of period
| $10.99 | $12.75 | $12.69 | $12.31 | $11.74 | $13.45 |
Net investment income
| 0.01 | 0.05 1 | 0.00 1,2 | 0.01 1 | 0.02 1 | 0.03 |
Payment from affiliate
| 0.05 | 0.00 | 0.00 | 0.00 | 0.00 | 0.00 |
Net realized and unrealized gains (losses) on investments
| 1.23 | (0.57) | 0.92 | 1.37 | 1.40 | (0.41) |
Total from investment operations
| 1.29 | (0.52) | 0.92 | 1.38 | 1.42 | (0.38) |
| Distributions to shareholders from | | | | | | |
Net investment income
| 0.00 | 0.00 | (0.02) | 0.00 | (0.04) | (0.01) |
Net realized gains
| 0.00 | (1.24) | (0.84) | (1.00) | (0.81) | (1.32) |
Total distributions to shareholders
| 0.00 | (1.24) | (0.86) | (1.00) | (0.85) | (1.33) |
Net asset value, end of period
| $12.28 | $10.99 | $12.75 | $12.69 | $12.31 | $11.74 |
Total return3
| 11.74% 4 | (4.990)% | 8.16% | 11.65% | 12.58% | (2.47)% |
| Ratios to average net assets (annualized) | | | | | | |
Gross expenses
| 1.94% | 1.94% | 1.94% | 1.93% | 1.93% | 1.93% |
Net expenses
| 1.86% | 1.86% | 1.86% | 1.86% | 1.86% | 1.86% |
Net investment income
| 0.17% | 0.44% | 0.03% | 0.08% | 0.20% | 0.37% |
| Supplemental data | | | | | | |
Portfolio turnover rate
| 12% | 34% | 27% | 21% | 27% | 34% |
Net assets, end of period (000s omitted)
| $2,410 | $4,401 | $7,370 | $19,874 | $21,727 | $28,756 |
| 1 | Calculated based upon average shares outstanding |
| 2 | Amount is less than $0.005. |
| 3 | Total return calculations do not include any sales charges. Returns for periods of less than one year are not annualized. |
| 4 | During the six months ended January 31, 2021, the Fund received a payment from an affiliate that had an impact of 0.41% on total return. See Note 4 in the Notes to Financial Statements for additional information. |
The accompanying notes are an integral part of these financial statements.
14 | Wells Fargo Classic Value Fund
Financial highlights
(For a share outstanding throughout each period)
| | | Year ended July 31 |
| Class R | Six months ended
January 31, 2021
(unaudited) | 2020 | 2019 | 2018 | 2017 | 2016 |
Net asset value, beginning of period
| $11.42 | $13.22 | $13.15 | $12.70 | $12.09 | $13.81 |
Net investment income
| 0.04 | 0.11 | 0.06 | 0.05 | 0.08 1 | 0.10 |
Payment from affiliate
| 0.03 | 0.00 | 0.00 | 0.00 | 0.00 | 0.00 |
Net realized and unrealized gains (losses) on investments
| 1.32 | (0.59) | 0.95 | 1.44 | 1.45 | (0.43) |
Total from investment operations
| 1.39 | (0.48) | 1.01 | 1.49 | 1.53 | (0.33) |
| Distributions to shareholders from | | | | | | |
Net investment income
| (0.12) | (0.08) | (0.10) | (0.04) | (0.11) | (0.07) |
Net realized gains
| 0.00 | (1.24) | (0.84) | (1.00) | (0.81) | (1.32) |
Total distributions to shareholders
| (0.12) | (1.32) | (0.94) | (1.04) | (0.92) | (1.39) |
Net asset value, end of period
| $12.69 | $11.42 | $13.22 | $13.15 | $12.70 | $12.09 |
Total return2
| 12.12% 3 | (4.56)% | 8.70% | 12.21% | 13.22% | (1.99)% |
| Ratios to average net assets (annualized) | | | | | | |
Gross expenses
| 1.42% | 1.41% | 1.43% | 1.44% | 1.44% | 1.44% |
Net expenses
| 1.36% | 1.36% | 1.36% | 1.36% | 1.36% | 1.36% |
Net investment income
| 0.64% | 0.95% | 0.55% | 0.56% | 0.69% | 0.86% |
| Supplemental data | | | | | | |
Portfolio turnover rate
| 12% | 34% | 27% | 21% | 27% | 34% |
Net assets, end of period (000s omitted)
| $91 | $76 | $88 | $74 | $48 | $43 |
| 1 | Calculated based upon average shares outstanding |
| 2 | Returns for periods of less than one year are not annualized. |
| 3 | During the six months ended January 31, 2021, the Fund received a payment from an affiliate that had an impact of 0.23% on total return. See Note 4 in the Notes to Financial Statements for additional information. |
The accompanying notes are an integral part of these financial statements.
Wells Fargo Classic Value Fund | 15
Financial highlights
(For a share outstanding throughout each period)
| | | Year ended July 31 |
| Class R6 | Six months ended
January 31, 2021
(unaudited) | 2020 | 2019 | 2018 | 2017 | 2016 |
Net asset value, beginning of period
| $11.16 | $12.93 | $12.92 | $12.49 | $11.90 | $13.62 |
Net investment income
| 0.08 | 0.19 1 | 0.16 1 | 0.16 | 0.17 1 | 0.17 |
Net realized and unrealized gains (losses) on investments
| 1.28 | (0.57) | 1.00 | 1.39 | 1.42 | (0.40) |
Total from investment operations
| 1.36 | (0.38) | 1.16 | 1.55 | 1.59 | (0.23) |
| Distributions to shareholders from | | | | | | |
Net investment income
| (0.19) | (0.15) | (0.31) | (0.12) | (0.19) | (0.17) |
Net realized gains
| 0.00 | (1.24) | (0.84) | (1.00) | (0.81) | (1.32) |
Total distributions to shareholders
| (0.19) | (1.39) | (1.15) | (1.12) | (1.00) | (1.49) |
Net asset value, end of period
| $12.33 | $11.16 | $12.93 | $12.92 | $12.49 | $11.90 |
Total return2
| 12.21% | (3.87)% | 10.38% | 12.96% | 14.03% | (1.30)% |
| Ratios to average net assets (annualized) | | | | | | |
Gross expenses
| 0.76% | 0.76% | 0.76% | 0.75% | 0.75% | 0.75% |
Net expenses
| 0.65% | 0.65% | 0.65% | 0.65% | 0.65% | 0.65% |
Net investment income
| 1.36% | 1.67% | 1.27% | 1.29% | 1.40% | 1.47% |
| Supplemental data | | | | | | |
Portfolio turnover rate
| 12% | 34% | 27% | 21% | 27% | 34% |
Net assets, end of period (000s omitted)
| $13,432 | $11,552 | $4,231 | $2,578 | $2,397 | $2,842 |
| 1 | Calculated based upon average shares outstanding |
| 2 | Returns for periods of less than one year are not annualized. |
The accompanying notes are an integral part of these financial statements.
16 | Wells Fargo Classic Value Fund
Financial highlights
(For a share outstanding throughout each period)
| | | Year ended July 31 |
| Administrator Class | Six months ended
January 31, 2021
(unaudited) | 2020 | 2019 | 2018 | 2017 | 2016 |
Net asset value, beginning of period
| $11.99 | $13.81 | $13.68 | $13.17 | $12.51 | $14.25 |
Net investment income
| 0.07 | 0.17 | 0.12 | 0.13 | 0.14 1 | 0.15 |
Payment from affiliate
| 0.00 2 | 0.00 | 0.00 | 0.00 | 0.00 | 0.00 |
Net realized and unrealized gains (losses) on investments
| 1.38 | (0.62) | 1.00 | 1.47 | 1.49 | (0.43) |
Total from investment operations
| 1.45 | (0.45) | 1.12 | 1.60 | 1.63 | (0.28) |
| Distributions to shareholders from | | | | | | |
Net investment income
| (0.17) | (0.13) | (0.15) | (0.09) | (0.16) | (0.14) |
Net realized gains
| 0.00 | (1.24) | (0.84) | (1.00) | (0.81) | (1.32) |
Total distributions to shareholders
| (0.17) | (1.37) | (0.99) | (1.09) | (0.97) | (1.46) |
Net asset value, end of period
| $13.27 | $11.99 | $13.81 | $13.68 | $13.17 | $12.51 |
Total return3
| 12.12% 4 | (4.15)% | 9.21% | 12.63% | 13.66% | (1.58)% |
| Ratios to average net assets (annualized) | | | | | | |
Gross expenses
| 1.11% | 1.11% | 1.11% | 1.10% | 1.10% | 1.10% |
Net expenses
| 0.91% | 0.93% | 0.95% | 0.95% | 0.95% | 0.95% |
Net investment income
| 1.10% | 1.37% | 0.96% | 0.98% | 1.10% | 1.27% |
| Supplemental data | | | | | | |
Portfolio turnover rate
| 12% | 34% | 27% | 21% | 27% | 34% |
Net assets, end of period (000s omitted)
| $433,339 | $402,567 | $464,041 | $469,464 | $459,650 | $470,152 |
| 1 | Calculated based upon average shares outstanding |
| 2 | Amount is less than $0.005. |
| 3 | Returns for periods of less than one year are not annualized. |
| 4 | During the six months ended January 31, 2021, the Fund received a payment from an affiliate that had an impact of 0.02% on total return. See Note 4 in the Notes to Financial Statements for additional information. |
The accompanying notes are an integral part of these financial statements.
Wells Fargo Classic Value Fund | 17
Financial highlights
(For a share outstanding throughout each period)
| | | Year ended July 31 |
| Institutional Class | Six months ended
January 31, 2021
(unaudited) | 2020 | 2019 | 2018 | 2017 | 2016 |
Net asset value, beginning of period
| $11.44 | $13.22 | $13.14 | $12.68 | $12.08 | $13.80 |
Net investment income
| 0.12 | 0.19 1 | 0.15 1 | 0.22 | 0.17 1 | 0.18 |
Net realized and unrealized gains (losses) on investments
| 1.28 | (0.58) | 0.94 | 1.35 | 1.43 | (0.41) |
Total from investment operations
| 1.40 | (0.39) | 1.09 | 1.57 | 1.60 | (0.23) |
| Distributions to shareholders from | | | | | | |
Net investment income
| (0.20) | (0.15) | (0.17) | (0.11) | (0.19) | (0.17) |
Net realized gains
| 0.00 | (1.24) | (0.84) | (1.00) | (0.81) | (1.32) |
Total distributions to shareholders
| (0.20) | (1.39) | (1.01) | (1.11) | (1.00) | (1.49) |
Net asset value, end of period
| $12.64 | $11.44 | $13.22 | $13.14 | $12.68 | $12.08 |
Total return2
| 12.09% | (3.86)% | 9.44% | 12.96% | 13.88% | (1.27)% |
| Ratios to average net assets (annualized) | | | | | | |
Gross expenses
| 0.86% | 0.86% | 0.86% | 0.85% | 0.85% | 0.85% |
Net expenses
| 0.70% | 0.70% | 0.70% | 0.70% | 0.70% | 0.70% |
Net investment income
| 1.31% | 1.59% | 1.22% | 1.24% | 1.36% | 1.52% |
| Supplemental data | | | | | | |
Portfolio turnover rate
| 12% | 34% | 27% | 21% | 27% | 34% |
Net assets, end of period (000s omitted)
| $88,002 | $84,544 | $106,869 | $137,263 | $162,480 | $215,175 |
| 1 | Calculated based upon average shares outstanding |
| 2 | Returns for periods of less than one year are not annualized. |
The accompanying notes are an integral part of these financial statements.
18 | Wells Fargo Classic Value Fund
Notes to financial statements (unaudited)
1. ORGANIZATION
Wells Fargo Funds Trust (the “Trust”), a Delaware statutory trust organized on March 10, 1999, is an open-end management investment company registered under the Investment Company Act of 1940, as amended (the “1940 Act”). As an investment company, the Trust follows the accounting and reporting guidance in Financial Accounting Standards Board (“FASB”) Accounting Standards Codification Topic 946, Financial Services – Investment Companies. These financial statements report on the Wells Fargo Classic Value Fund (the “Fund”) which is a diversified series of the Trust.
2. SIGNIFICANT ACCOUNTING POLICIES
The following significant accounting policies, which are consistently followed in the preparation of the financial statements of the Fund, are in conformity with U.S. generally accepted accounting principles which require management to make estimates and assumptions that affect the reported amounts of assets and liabilities, disclosure of contingent assets and liabilities at the date of the financial statements, and the reported amounts of income and expenses during the reporting period. Actual results could differ from those estimates.
Securities valuation
All investments are valued each business day as of the close of regular trading on the New York Stock Exchange (generally 4 p.m. Eastern Time), although the Fund may deviate from this calculation time under unusual or unexpected circumstances.
Equity securities that are listed on a foreign or domestic exchange or market are valued at the official closing price or, if none, the last sales price. If no sale occurs on the principal exchange or market that day, a fair value price will be determined in accordance with the Fund’s Valuation Procedures.
Investments in registered open-end investment companies are valued at net asset value. Interests in non-registered investment companies that are redeemable at net asset value are fair valued normally at net asset value.
Investments which are not valued using any of the methods discussed above are valued at their fair value, as determined in good faith by the Board of Trustees. The Board of Trustees has established a Valuation Committee comprised of the Trustees and has delegated to it the authority to take any actions regarding the valuation of portfolio securities that the Valuation Committee deems necessary or appropriate, including determining the fair value of portfolio securities, unless the determination has been delegated to the Wells Fargo Asset Management Pricing Committee at Wells Fargo Funds Management, LLC (“Funds Management”). The Board of Trustees retains the authority to make or ratify any valuation decisions or approve any changes to the Valuation Procedures as it deems appropriate. On a quarterly basis, the Board of Trustees receives reports on any valuation actions taken by the Valuation Committee or the Wells Fargo Asset Management Pricing Committee which may include items for ratification.
Securities lending
The Fund may lend its securities from time to time in order to earn additional income in the form of fees or interest on securities received as collateral or the investment of any cash received as collateral. When securities are on loan, the Fund receives interest or dividends on those securities. Cash collateral received in connection with its securities lending transactions is invested in Securities Lending Cash Investments, LLC (the “Securities Lending Fund”). Investments in Securities Lending Fund are valued at the evaluated bid price provided by an independent pricing service. Income earned from investment in the Securities Lending Fund (net of fees and rebates), if any, is included in income from affiliated securities on the Statement of Operations.
In a securities lending transaction, the net asset value of the Fund is affected by an increase or decrease in the value of the securities loaned and by an increase or decrease in the value of the instrument in which collateral is invested. The amount of securities lending activity undertaken by the Fund fluctuates from time to time. The Fund has the right under the lending agreement to recover the securities from the borrower on demand. In the event of default or bankruptcy by the borrower, the Fund may be prevented from recovering the loaned securities or gaining access to the collateral or may experience delays or costs in doing so. In such an event, the terms of the agreement allow the unaffiliated securities lending agent to use the collateral to purchase replacement securities on behalf of the Fund or pay the Fund the market value of the loaned securities. The Fund bears the risk of loss with respect to depreciation of its investment of the cash collateral.
Security transactions and income recognition
Securities transactions are recorded on a trade date basis. Realized gains or losses are recorded on the basis of identified cost.
Dividend income is recognized on the ex-dividend date. Dividend income is recorded net of foreign taxes withheld where recovery of such taxes is not assured.
Wells Fargo Classic Value Fund | 19
Notes to financial statements (unaudited)
Distributions to shareholders
Distributions to shareholders from net investment income and any net realized gains are recorded on the ex-dividend date and paid at least annually. Such distributions are determined in accordance with income tax regulations and may differ from U.S. generally accepted accounting principles. Dividend sources are estimated at the time of declaration. The tax character of distributions is determined as of the Fund’s fiscal year end. Therefore, a portion of the Fund’s distributions made prior to the Fund’s fiscal year end may be categorized as a tax return of capital at year end.
Federal and other taxes
The Fund intends to continue to qualify as a regulated investment company by distributing substantially all of its investment company taxable income and any net realized capital gains (after reduction for capital loss carryforwards) sufficient to relieve it from all, or substantially all, federal income taxes. Accordingly, no provision for federal income taxes was required.
The Fund’s income and federal excise tax returns and all financial records supporting those returns for the prior three fiscal years are subject to examination by the federal and Delaware revenue authorities. Management has analyzed the Fund’s tax positions taken on federal, state, and foreign tax returns for all open tax years and does not believe that there are any uncertain tax positions that require recognition of a tax liability.
As of January 31, 2021, the aggregate cost of all investments for federal income tax purposes was $426,605,796 and the unrealized gains (losses) consisted of:
| Gross unrealized gains | $402,466,571 |
| Gross unrealized losses | (70,704,736) |
| Net unrealized gains | $331,761,835 |
As of July 31, 2020, the Fund had current year net deferred post-October capital losses consisting of $7,846,262 in short-term losses which was recognized on the first day of the current fiscal year.
Class allocations
The separate classes of shares offered by the Fund differ principally in applicable sales charges, distribution, shareholder servicing, and administration fees. Class specific expenses are charged directly to that share class. Investment income, common fund-level expenses, and realized and unrealized gains (losses) on investments are allocated daily to each class of shares based on the relative proportion of net assets of each class.
3. FAIR VALUATION MEASUREMENTS
Fair value measurements of investments are determined within a framework that has established a fair value hierarchy based upon the various data inputs utilized in determining the value of the Fund’s investments. The three-level hierarchy gives the highest priority to unadjusted quoted prices in active markets for identical assets or liabilities (Level 1) and the lowest priority to unobservable inputs (Level 3). The Fund’s investments are classified within the fair value hierarchy based on the lowest level of input that is significant to the fair value measurement. The inputs are summarized into three broad levels as follows:
| ■ | Level 1 – quoted prices in active markets for identical securities |
| ■ | Level 2 – other significant observable inputs (including quoted prices for similar securities, interest rates, prepayment speeds, credit risk, etc.) |
| ■ | Level 3 – significant unobservable inputs (including the Fund’s own assumptions in determining the fair value of investments) |
The inputs or methodologies used for valuing investments in securities are not necessarily an indication of the risk associated with investing in those securities.
20 | Wells Fargo Classic Value Fund
Notes to financial statements (unaudited)
The following is a summary of the inputs used in valuing the Fund’s assets and liabilities as of January 31, 2021:
| | Quoted prices
(Level 1) | Other significant
observable inputs
(Level 2) | Significant
unobservable inputs
(Level 3) | Total |
| Assets | | | | |
| Investments in: | | | | |
| Common stocks | | | | |
| Communication services | $ 78,203,587 | $0 | $0 | $ 78,203,587 |
| Consumer discretionary | 26,301,298 | 0 | 0 | 26,301,298 |
| Consumer staples | 88,428,782 | 0 | 0 | 88,428,782 |
| Energy | 35,637,723 | 0 | 0 | 35,637,723 |
| Financials | 160,998,878 | 0 | 0 | 160,998,878 |
| Health care | 101,528,297 | 0 | 0 | 101,528,297 |
| Industrials | 107,391,570 | 0 | 0 | 107,391,570 |
| Information technology | 102,638,036 | 0 | 0 | 102,638,036 |
| Utilities | 45,419,346 | 0 | 0 | 45,419,346 |
| Short-term investments | | | | |
| Investment companies | 11,820,114 | 0 | 0 | 11,820,114 |
| Total assets | $758,367,631 | $0 | $0 | $758,367,631 |
Additional sector, industry or geographic detail, if any, is included in the Portfolio of Investments.
For the six months ended January 31, 2021, the Fund did not have any transfers into/out of Level 3.
4. TRANSACTIONS WITH AFFILIATES
Management fee
Funds Management, an indirect wholly owned subsidiary of Wells Fargo & Company (“Wells Fargo”), is the manager of the Fund and provides advisory and fund-level administrative services under an investment management agreement. Under the investment management agreement, Funds Management is responsible for, among other services, implementing the investment objectives and strategies of the Fund, supervising the subadviser and providing fund-level administrative services in connection with the Fund’s operations. As compensation for its services under the investment management agreement, Funds Management is entitled to receive a management fee at the following annual rate based on the Fund’s average daily net assets:
| Average daily net assets | Management fee |
| First $500 million | 0.700% |
| Next $500 million | 0.675 |
| Next $1 billion | 0.650 |
| Next $2 billion | 0.625 |
| Next $1 billion | 0.600 |
| Next $3 billion | 0.590 |
| Next $2 billion | 0.565 |
| Next $2 billion | 0.555 |
| Next $4 billion | 0.530 |
| Over $16 billion | 0.505 |
For the six months ended January 31, 2021, the management fee was equivalent to an annual rate of 0.69% of the Fund’s average daily net assets.
Funds Management has retained the services of a subadviser to provide daily portfolio management to the Fund. The fee for subadvisory services is borne by Funds Management. Wells Capital Management Incorporated ("WellsCap"), an affiliate of
Wells Fargo Classic Value Fund | 21
Notes to financial statements (unaudited)
Funds Management and an indirect wholly owned subsidiary of Wells Fargo, is the subadviser to the Fund and is entitled to receive a fee from Funds Management at an annual rate starting at 0.35% and declining to 0.25% as the average daily net assets of the Fund increase.
Administration fees
Under a class-level administration agreement, Funds Management provides class-level administrative services to the Fund, which includes paying fees and expenses for services provided by the transfer agent, sub-transfer agents, omnibus account servicers and record-keepers. As compensation for its services under the class-level administration agreement, Funds Management receives an annual fee which is calculated based on the average daily net assets of each class as follows:
| | Class-level
administration fee |
| Class A | 0.21% |
| Class C | 0.21 |
| Class R | 0.21 |
| Class R6 | 0.03 |
| Administrator Class | 0.13 |
| Institutional Class | 0.13 |
Waivers and/or expense reimbursements
Funds Management has contractually waived and/or reimbursed management and administration fees to the extent necessary to maintain certain net operating expense ratios for the Fund. When each class of the Fund has exceeded its expense cap, Funds Management has waived fees and/or reimbursed expenses from fund-level expenses on a proportionate basis and then from class specific expenses. When only certain classes exceed their expense caps, waivers and/or reimbursements are applied against class specific expenses before fund-level expenses. Funds Management has committed through November 30, 2021 to waive fees and/or reimburse expenses to the extent necessary to cap expenses. Prior to or after the commitment expiration date, the cap may be increased or the commitment to maintain the cap may be terminated only with the approval of the Board of Trustees. The expense caps are as follows:
| | Expense ratio caps |
| Class A | 1.11% |
| Class C | 1.86 |
| Class R | 1.36 |
| Class R6 | 0.65 |
| Administrator Class | 0.95 |
| Institutional Class | 0.70 |
Distribution fees
The Trust has adopted a distribution plan for Class C and Class R shares of the Fund pursuant to Rule 12b-1 under the 1940 Act. Distribution fees are charged to Class C and Class R shares and paid to Wells Fargo Funds Distributor, LLC (“Funds Distributor”), the principal underwriter, at an annual rate of 0.75% of the average daily net assets of Class C shares and 0.25% of the average daily net assets of Class R shares.
In addition, Funds Distributor is entitled to receive the front-end sales charge from the purchase of Class A shares and a contingent deferred sales charge on the redemption of certain Class A shares. Funds Distributor is also entitled to receive the contingent deferred sales charges from redemptions of Class C shares. For the six months ended January 31, 2021, Funds Distributor received $1,301 from the sale of Class A shares. No contingent deferred sales charges were incurred by Class A and Class C shares for the six months ended January 31, 2021.
Shareholder servicing fees
The Trust has entered into contracts with one or more shareholder servicing agents, whereby Class A, Class C, Class R, and Administrator Class of the Fund are charged a fee at an annual rate of 0.25% of the average daily net assets of each respective class. A portion of these total shareholder servicing fees were paid to affiliates of Wells Fargo.
22 | Wells Fargo Classic Value Fund
Notes to financial statements (unaudited)
Interfund transactions
The Fund may purchase or sell portfolio investment securities to certain other Wells Fargo affiliates pursuant to Rule 17a-7 under the 1940 Act and under procedures adopted by the Board of Trustees. The procedures have been designed to ensure that these interfund transactions, which do not incur broker commissions, are effected at current market prices.
Other transactions
On August 14, 2020, Class A, Class C, Class R, and Administrator Class of the Fund was reimbursed by Funds Management in the amount of $111, $8,863, $191 and $82,171, respectively. The reimbursements were made in connection with resolving certain fee reimbursements.
5. INVESTMENT PORTFOLIO TRANSACTIONS
Purchases and sales of investments, excluding U.S. government obligations (if any) and short-term securities, for the six months ended January 31, 2021 were $88,139,313 and $154,069,456, respectively.
6. SECURITIES LENDING TRANSACTIONS
The Fund lends its securities through an unaffiliated securities lending agent and receives collateral in the form of cash or securities with a value at least equal to the value of the securities on loan. The value of the loaned securities is determined at the close of each business day and any increases or decreases in the required collateral are exchanged between the Fund and the counterparty on the next business day. Cash collateral received is invested in the Securities Lending Fund which seeks to provide a positive return compared to the daily Federal Funds Open Rate by investing in high-quality, U.S. dollar-denominated short-term money market instruments and is exempt from registration under Section 3(c)(7) of the 1940 Act. Securities Lending Fund is managed by Funds Management and is subadvised by WellsCap. Funds Management receives an advisory fee starting at 0.05% and declining to 0.01% as the average daily net assets of the Securities Lending Fund increase. All of the fees received by Funds Management are paid to WellsCap for its services as subadviser.
In the event of counterparty default or the failure of a borrower to return a loaned security, the Fund has the right to use the collateral to offset any losses incurred. As of January 31, 2021, the Fund did not have any securities on loan.
7. BANK BORROWINGS
The Trust (excluding the money market funds), Wells Fargo Master Trust and Wells Fargo Variable Trust are parties to a $350,000,000 revolving credit agreement whereby the Fund is permitted to use bank borrowings for temporary or emergency purposes, such as to fund shareholder redemption requests. Interest under the credit agreement is charged to the Fund based on a borrowing rate equal to the higher of the Federal Funds rate in effect on that day plus 1.25% or the overnight LIBOR rate in effect on that day plus 1.25%. In addition, an annual commitment fee equal to 0.25% of the unused balance is allocated to each participating fund.
For the six months ended January 31, 2021, there were no borrowings by the Fund under the agreement.
8. INDEMNIFICATION
Under the Fund's organizational documents, the officers and Trustees have been granted certain indemnification rights against certain liabilities that may arise out of performance of their duties to the Fund. The Fund has entered into a separate agreement with each Trustee that converts indemnification rights currently existing under the Fund’s organizational documents into contractual rights that cannot be changed in the future without the consent of the Trustee. Additionally, in the normal course of business, the Fund may enter into contracts with service providers that contain a variety of indemnification clauses. The Fund’s maximum exposure under these arrangements is dependent on future claims that may be made against the Fund and, therefore, cannot be estimated.
9. NEW ACCOUNTING PRONOUNCEMENT
In August 2018, FASB issued Accounting Standards Update (“ASU”) No. 2018-13, Fair Value Measurement (Topic 820) Disclosure Framework - Changes to the Disclosure Requirements for Fair Value Measurement. ASU 2018-13 updates the disclosure requirements on fair value measurements in Topic 820, Fair Value Measurements. The amendments are effective for fiscal years, and interim periods within those fiscal years, beginning after December 15, 2019. Management has adopted this guidance which did not have a material impact on the financial statements.
Wells Fargo Classic Value Fund | 23
Notes to financial statements (unaudited)
10. CORONAVIRUS (COVID-19) PANDEMIC
On March 11, 2020, the World Health Organization announced that it had made the assessment that coronavirus disease 2019 (“COVID-19”) is a pandemic. The impacts of COVID-19 are affecting the entire global economy, individual companies and investment products, the funds, and the market in general. There is significant uncertainty around the extent and duration of business disruptions related to COVID-19 and the impacts may be short term or may last for an extended period of time. The risk of further spreading of COVID-19 has led to significant uncertainty and volatility in the financial markets.
11. SUBSEQUENT EVENT
On February 23, 2021, Wells Fargo announced that it has entered into a definitive agreement to sell Wells Fargo Asset Management (“WFAM”) to GTCR LLC and Reverence Capital Partners, L.P. WFAM is the trade name used by the asset management businesses of Wells Fargo and includes Wells Fargo Funds Management, LLC, the investment manager to the Fund, Wells Capital Management Incorporated and Wells Fargo Asset Management (International) Limited, both registered investment advisers providing sub-advisory services to certain funds, and Wells Fargo Funds Distributor, LLC, the Fund’s principal underwriter. As part of the transaction, Wells Fargo will own a 9.9% equity interest and will continue to serve as an important client and distribution partner.
Consummation of the transaction will result in the automatic termination of the Fund’s investment management agreement and sub-advisory agreement. The Fund’s Board of Trustees will be asked to approve new investment management arrangements with the new company. If approved by the Board, the new investment management arrangements with the new company will be presented to the shareholders of the Fund for approval, and, if approved by shareholders, would take effect upon the closing of the transaction. The transaction is expected to close in the second half of 2021, subject to customary closing conditions.
24 | Wells Fargo Classic Value Fund
Other information (unaudited)
PROXY VOTING INFORMATION
A description of the policies and procedures used to determine how to vote proxies relating to portfolio securities is available without charge, upon request, by calling 1-800-222-8222, visiting our website at wfam.com, or visiting the SEC website at sec.gov. Information regarding how the proxies related to portfolio securities were voted during the most recent 12-month period ended June 30 is available on the website at wfam.com or by visiting the SEC website at sec.gov.
QUARTERLY PORTFOLIO HOLDINGS INFORMATION
The Fund files its complete schedule of portfolio holdings with the SEC for the first and third quarters of each fiscal year as an exhibit to its reports on Form N-PORT. Shareholders may view the filed Form N-PORT by visiting the SEC website at sec.gov.
Wells Fargo Classic Value Fund | 25
Other information (unaudited)
BOARD OF TRUSTEES AND OFFICERS
Each of the Trustees and Officers listed in the table below acts in identical capacities for each fund in the Wells Fargo family of funds, which consists of 144 mutual funds comprising the Wells Fargo Funds Trust, Wells Fargo Variable Trust, Wells Fargo Master Trust and four closed-end funds (collectively the “Fund Complex”). This table should be read in conjunction with the Prospectus and the Statement of Additional Information1. The mailing address of each Trustee and Officer is 525 Market Street, 12th Floor, San Francisco, CA 94105. Each Trustee and Officer serves an indefinite term, however, each Trustee serves such term until reaching the mandatory retirement age established by the Trustees.
Independent Trustees
Name and
year of birth | Position held and
length of service* | Principal occupations during past five years or longer | Current other
public company or
investment
company
directorships |
William R. Ebsworth
(Born 1957) | Trustee,
since 2015 | Retired. From 1984 to 2013, equities analyst, portfolio manager, research director and chief investment officer at Fidelity Management and Research Company in Boston, Tokyo, and Hong Kong, and retired in 2013 as Chief Investment Officer of Fidelity Strategic Advisers, Inc. where he led a team of investment professionals managing client assets. Prior thereto, Board member of Hong Kong Securities Clearing Co., Hong Kong Options Clearing Corp., the Thailand International Fund, Ltd., Fidelity Investments Life Insurance Company, and Empire Fidelity Investments Life Insurance Company. Audit Committee Chair and Investment Committee Chair of the Vincent Memorial Hospital Endowment (non-profit organization). Mr. Ebsworth is a CFA® charterholder. | N/A |
Jane A. Freeman
(Born 1953) | Trustee,
since 2015;
Chair Liaison,
since 2018 | Retired. From 2012 to 2014 and 1999 to 2008, Chief Financial Officer of Scientific Learning Corporation. From 2008 to 2012, Ms. Freeman provided consulting services related to strategic business projects. Prior to 1999, Portfolio Manager at Rockefeller & Co. and Scudder, Stevens & Clark. Board member of the Harding Loevner Funds from 1996 to 2014, serving as both Lead Independent Director and chair of the Audit Committee. Board member of the Russell Exchange Traded Funds Trust from 2011 to 2012 and the chair of the Audit Committee. Ms. Freeman is also an inactive Chartered Financial Analyst. | N/A |
Isaiah Harris, Jr.
(Born 1952) | Trustee,
since 2009; Audit
Committee
Chair,
since 2019 | Retired. Chairman of the Board of CIGNA Corporation since 2009, and Director since 2005. From 2003 to 2011, Director of Deluxe Corporation. Prior thereto, President and CEO of BellSouth Advertising and Publishing Corp. from 2005 to 2007, President and CEO of BellSouth Enterprises from 2004 to 2005 and President of BellSouth Consumer Services from 2000 to 2003. Emeritus member of the Iowa State University Foundation Board of Governors. Emeritus Member of the Advisory Board of Iowa State University School of Business. Advisory Board Member, Palm Harbor Academy (private school). Mr. Harris is a certified public accountant (inactive status). | CIGNA Corporation |
Judith M. Johnson
(Born 1949) | Trustee,
since 2008 | Retired. Prior thereto, Chief Executive Officer and Chief Investment Officer of Minneapolis Employees Retirement Fund from 1996 to 2008. Ms. Johnson is an attorney, certified public accountant and a certified managerial accountant. | N/A |
David F. Larcker
(Born 1950) | Trustee,
since 2009 | James Irvin Miller Professor of Accounting at the Graduate School of Business (Emeritus), Stanford University, Director of the Corporate Governance Research Initiative and Senior Faculty of The Rock Center for Corporate Governance since 2006. From 2005 to 2008, Professor of Accounting at the Graduate School of Business, Stanford University. Prior thereto, Ernst & Young Professor of Accounting at The Wharton School, University of Pennsylvania from 1985 to 2005. | N/A |
26 | Wells Fargo Classic Value Fund
Other information (unaudited)
Name and
year of birth | Position held and
length of service* | Principal occupations during past five years or longer | Current other
public company or
investment
company
directorships |
Olivia S. Mitchell
(Born 1953) | Trustee,
since 2006;
Nominating and
Governance
Committee Chair,
since 2018 | International Foundation of Employee Benefit Plans Professor, Wharton School of the University of Pennsylvania since 1993. Director of Wharton’s Pension Research Council and Boettner Center on Pensions & Retirement Research, and Research Associate at the National Bureau of Economic Research. Previously, Cornell University Professor from 1978 to 1993. | N/A |
Timothy J. Penny
(Born 1951) | Trustee,
since 1996;
Chair,
since 2018 | President and Chief Executive Officer of Southern Minnesota Initiative Foundation, a non-profit organization, since 2007. Member of the Board of Trustees of NorthStar Education Finance, Inc., a non-profit organization, since 2007. | N/A |
James G. Polisson
(Born 1959) | Trustee,
since 2018 | Retired. Chief Marketing Officer, Source (ETF) UK Services, Ltd, from 2015 to 2017. From 2012 to 2015, Principal of The Polisson Group, LLC, a management consulting, corporate advisory and principal investing company. Chief Executive Officer and Managing Director at Russell Investments, Global Exchange Traded Funds from 2010 to 2012. Managing Director of Barclays Global Investors from 1998 to 2010 and Global Chief Marketing Officer for iShares and Barclays Global Investors from 2000 to 2010. Trustee of the San Francisco Mechanics’ Institute, a non-profit organization, from 2013 to 2015. Board member of the Russell Exchange Traded Fund Trust from 2011 to 2012. Director of Barclays Global Investors Holdings Deutschland GmbH from 2006 to 2009. Mr. Polisson is an attorney and has a retired status with the Massachusetts and District of Columbia Bar Associations. | N/A |
Pamela Wheelock
(Born 1959) | Trustee,
since January
2020; previously
Trustee from
January 2018 to
July 2019 | Board member of the Destination Medical Center Economic Development Agency, Rochester, Minnesota since 2019. Interim President of the McKnight Foundation from January to September 2020. Acting Commissioner, Minnesota Department of Human Services, July 2019 through September 2019. Human Services Manager (part-time), Minnesota Department of Human Services, October 2019 through December 2019. Chief Operating Officer, Twin Cities Habitat for Humanity from 2017 to 2019. Vice President of University Services, University of Minnesota from 2012 to 2016. Prior thereto, on the Board of Directors, Governance Committee and Finance Committee for the Minnesota Philanthropy Partners (Saint Paul Foundation) from 2012 to 2018, Interim Chief Executive Officer of Blue Cross Blue Shield of Minnesota from 2011 to 2012, Chairman of the Board from 2009 to 2012 and Board Director from 2003 to 2015. Vice President, Leadership and Community Engagement, Bush Foundation, Saint Paul, Minnesota (a private foundation) from 2009 to 2011. Executive Vice President and Chief Financial Officer, Minnesota Sports and Entertainment from 2004 to 2009 and Senior Vice President from 2002 to 2004. Executive Vice President of the Minnesota Wild Foundation from 2004 to 2008. Commissioner of Finance, State of Minnesota, from 1999 to 2002. Currently Board Chair of the Minnesota Wild Foundation since 2010. | N/A |
* Length of service dates reflect the Trustee’s commencement of service with the Trust’s predecessor entities, where applicable.
Wells Fargo Classic Value Fund | 27
Other information (unaudited)
Officers
Name and
year of birth | Position held and
length of service | Principal occupations during past five years or longer |
Andrew Owen
(Born 1960) | President,
since 2017 | Executive Vice President of Wells Fargo & Company and Head of Affiliated Managers, Wells Fargo Asset Management, since 2014. In addition, Mr. Owen is currently President, Chief Executive Officer and Director of Wells Fargo Funds Management, LLC since 2017. Prior thereto, Executive Vice President responsible for marketing, investments and product development for Wells Fargo Funds Management, LLC, from 2009 to 2014. |
Jeremy DePalma
(Born 1974) | Treasurer,
since 2012
(for certain funds in
the Fund Complex);
since 2021 (for
the remaining funds in the
Fund Complex) | Senior Vice President of Wells Fargo Funds Management, LLC since 2009. Senior Vice President of Evergreen Investment Management Company, LLC from 2008 to 2010 and head of the Fund Reporting and Control Team within Fund Administration from 2005 to 2010. |
Michelle Rhee
(Born 1966) | Chief Legal Officer,
since 2019 | Secretary of Wells Fargo Funds Management, LLC and Chief Legal Counsel of Wells Fargo Asset Management since 2018. Deputy General Counsel of Wells Fargo Bank, N.A. since 2020 and Assistant General Counsel of Wells Fargo Bank, N.A. from 2018 to 2020. Associate General Counsel and Managing Director of Bank of America Corporation from 2004 to 2018. |
Catherine Kennedy
(Born 1969) | Secretary,
since 2019 | Vice President of Wells Fargo Funds Management, LLC and Senior Counsel of the Wells Fargo Legal Department since 2010. Vice President and Senior Counsel of Evergreen Investment Management Company, LLC from 1998 to 2010. |
Michael H. Whitaker
(Born 1967) | Chief Compliance Officer,
since 2016 | Chief Compliance Officer of Wells Fargo Asset Management since 2016. Senior Vice President and Chief Compliance Officer for Fidelity Investments from 2007 to 2016. |
1 The Statement of Additional Information includes additional information about the Trustees and is available, without charge, upon request, by calling 1-800-222-8222 or by visiting the website at wfam.com.
28 | Wells Fargo Classic Value Fund
For more information
More information about Wells Fargo Funds is available free upon request. To obtain literature, please write, visit the Fund's website, or call:
Wells Fargo Funds
P.O. Box 219967
Kansas City, MO 64121-9967
Website: wfam.com
Individual investors: 1-800-222-8222
Retail investment professionals: 1-888-877-9275
Institutional investment professionals: 1-866-765-0778
This report and the financial statements contained herein are submitted for the general information of the shareholders of the Fund. If this report is used for promotional purposes, distribution of the report must be accompanied or preceded by a current prospectus. Before investing, please consider the investment objectives, risks, charges, and expenses of the investment. For a current prospectus and, if available, a summary prospectus, containing this information, call 1-800-222-8222 or visit the Fund’s website at wfam.com. Read the prospectus carefully before you invest or send money.
Wells Fargo Asset Management (WFAM) is the trade name for certain investment advisory/management firms owned by Wells Fargo & Company. These firms include but are not limited to Wells Capital Management Incorporated and Wells Fargo Funds Management, LLC. Certain products managed by WFAM entities are distributed by Wells Fargo Funds Distributor, LLC (a broker-dealer and Member FINRA).
This material is for general informational and educational purposes only and is NOT intended to provide investment advice or a recommendation of any kind— including a recommendation for any specific investment, strategy, or plan.
INVESTMENT PRODUCTS: NOT FDIC INSURED ■ NO BANK GUARANTEE ■ MAY LOSE VALUE
© 2021 Wells Fargo & Company. All rights reserved.
PAR-0221-00367 03-22
SA207/SAR207 01-21
Semi-Annual Report
January 31, 2021
Wells Fargo
Disciplined U.S. Core Fund
Reduce clutter.
Save trees.
Sign up for electronic delivery of prospectuses and shareholder reports at wellsfargo.com/ advantagedelivery
The views expressed and any forward-looking statements are as of January 31, 2021, unless otherwise noted, and are those of the Fund's portfolio managers and/or Wells Fargo Asset Management. Discussions of individual securities or the markets generally are not intended as individual recommendations. Future events or results may vary significantly from those expressed in any forward-looking statements. The views expressed are subject to change at any time in response to changing circumstances in the market. Wells Fargo Asset Management and the Fund disclaim any obligation to publicly update or revise any views expressed or forward-looking statements.
INVESTMENT PRODUCTS: NOT FDIC INSURED ■ NO BANK GUARANTEE ■ MAY LOSE VALUE
Wells Fargo Disciplined U.S. Core Fund | 1
Letter to shareholders (unaudited)
Dear Shareholder:
We are pleased to offer you this semi-annual report for the Wells Fargo Disciplined U.S. Core Fund for the six-month period that ended January 31, 2021. Despite a deeply challenging year, dominated by the spread of COVID-19 cases and a sharp drop in economic output throughout much of the world, global stocks performed extremely well, benefiting from ongoing central bank support and rising optimism over the development and distribution of effective COVID-19 vaccines. Bonds also had positive returns, led by global bonds and high-yield bonds.
For the six-month period, U.S. stocks, based on the S&P 500 Index1, gained 14.47%. International stocks, as measured by the MSCI ACWI ex USA Index (Net)2, returned 19.28%, while the MSCI EM Index (Net)3, had stronger performance, with a 24.07% gain. Among bond indexes, the Bloomberg Barclays U.S. Aggregate Bond Index4 returned -0.91%, the Bloomberg Barclays Global Aggregate ex-USD Index (unhedged)5 gained 3.71%, and the Bloomberg Barclays Municipal Bond Index6 returned 2.01% while the ICE BofA U.S. High Yield Index7 returned 6.82%.
The stock market rally continued in August.
The stock market continued a months-long rally in August despite concerns over rising numbers of U.S. and European COVID-19 cases. Relatively strong second-quarter earnings boosted investor sentiment along with the U.S. Federal Reserve’s announcement of a monetary policy shift expected to support longer-term low interest rates. U.S. manufacturing and services activity indexes beat expectations, while the U.S. housing market maintained strength. In Europe, retail sales expanded and consumer confidence was steady. China’s economy continued to expand.
Stocks grew more volatile in September on mixed economic data. U.S. economic activity continued to grow. However, U.S. unemployment remained elevated at 7.9% in September. With U.S. Congress delaying further fiscal relief and uncertainties surrounding a possible vaccine, doubts crept back into the financial markets. In the U.K., a lack of progress in Brexit talks weighed on markets. China’s economy picked up steam, fueled by increased global demand.
Andrew Owen
President
Wells Fargo Funds
“The stock market continued a months-long rally in August despite concerns over rising numbers of U.S. and European COVID-19 cases.”
| 1 | The S&P 500 Index consists of 500 stocks chosen for market size, liquidity, and industry group representation. It is a market-value-weighted index with each stock's weight in the index proportionate to its market value. You cannot invest directly in an index. |
| 2 | The Morgan Stanley Capital International (MSCI) All Country World Index (ACWI) ex USA Index (Net) is a free-float-adjusted market-capitalization-weighted index that is designed to measure the equity market performance of developed and emerging markets, excluding the United States. Source: MSCI. MSCI makes no express or implied warranties or representations and shall have no liability whatsoever with respect to any MSCI data contained herein. The MSCI data may not be further redistributed or used as a basis for other indices or any securities or financial products. This report is not approved, reviewed, or produced by MSCI. You cannot invest directly in an index. |
| 1 | The S&P 500 Index consists of 500 stocks chosen for market size, liquidity, and industry group representation. It is a market-value-weighted index with each stock's weight in the index proportionate to its market value. You cannot invest directly in an index. |
| 3 | The MSCI Emerging Markets (EM) Index (Net) is a free-float-adjusted market-capitalization-weighted index that is designed to measure equity market performance of emerging markets. You cannot invest directly in an index. |
| 1 | The S&P 500 Index consists of 500 stocks chosen for market size, liquidity, and industry group representation. It is a market-value-weighted index with each stock's weight in the index proportionate to its market value. You cannot invest directly in an index. |
| 4 | The Bloomberg Barclays U.S. Aggregate Bond Index is a broad-based benchmark that measures the investment-grade, U.S. dollar-denominated, fixed-rate taxable bond market, including Treasuries, government-related and corporate securities, mortgage-backed securities (agency fixed-rate and hybrid adjustable-rate mortgage pass-throughs), asset-backed securities, and commercial mortgage-backed securities. You cannot invest directly in an index. |
| 1 | The S&P 500 Index consists of 500 stocks chosen for market size, liquidity, and industry group representation. It is a market-value-weighted index with each stock's weight in the index proportionate to its market value. You cannot invest directly in an index. |
| 5 | The Bloomberg Barclays Global Aggregate ex-USD Index (unhedged) is an unmanaged index that provides a broad-based measure of the global investment-grade fixed-income markets excluding the U.S. dollar-denominated debt market. You cannot invest directly in an index. |
| 1 | The S&P 500 Index consists of 500 stocks chosen for market size, liquidity, and industry group representation. It is a market-value-weighted index with each stock's weight in the index proportionate to its market value. You cannot invest directly in an index. |
| 6 | The Bloomberg Barclays Municipal Bond Index is an unmanaged index composed of long-term tax-exempt bonds with a minimum credit rating of Baa. You cannot invest directly in an index. |
| 1 | The S&P 500 Index consists of 500 stocks chosen for market size, liquidity, and industry group representation. It is a market-value-weighted index with each stock's weight in the index proportionate to its market value. You cannot invest directly in an index. |
| 7 | The ICE BofA U.S. High Yield Index is a market-capitalization-weighted index of domestic and Yankee high-yield bonds. The index tracks the performance of high-yield securities traded in the U.S. bond market. You cannot invest directly in an index. Copyright 2021. ICE Data Indices, LLC. All rights reserved. |
2 | Wells Fargo Disciplined U.S. Core Fund
Letter to shareholders (unaudited)
In October, capital markets stepped back from their six-month rally. Market volatility rose in advance of the U.S. election and amid a global increase in COVID-19 infections. Europe introduced tighter restrictions affecting economic activity. U.S. markets looked favorably at the prospect of Democratic control of the federal purse strings, which could lead to additional fiscal stimulus and a boost to economic activity. Meanwhile, China reported 4.9% third-quarter GDP growth.
Global stocks rallied in November, propelled by optimism over three promising COVID-19 vaccines. Reversing recent trends, value stocks outperformed growth stocks and cyclical stocks outpaced technology stocks. However, U.S. unemployment remained elevated, with a net job loss of 10 million since February. The eurozone services purchasing managers’ index contracted sharply while the region’s manufacturing activity grew. The U.S. election results added to the upbeat mood as investors anticipated more consistent policies in the new administration.
Financial markets ended the year with strength on high expectations for a rapid rollout of the COVID-19 vaccines, the successful passage of a $900 billion stimulus package, and rising expectations of additional economic support from a Democratic-led Congress. U.S. economic data were mixed with still-elevated unemployment and weak retail sales but growth in manufacturing output. In contrast, China’s economic expansion continued in both manufacturing and nonmanufacturing. U.S. COVID-19 infection rates continued to rise even as new state and local lockdown measures were implemented.
The year 2021 began with emerging market stocks leading all major asset classes in January, driven by China’s strong economic growth and a broad recovery in corporate earnings, which propelled China’s stock market higher. In the United States, positive news on vaccine trials and January expansion in both the manufacturing and services sectors was offset by a weak December monthly jobs report. This was compounded by technical factors as some hedge funds were forced to sell stocks to protect themselves against a well-publicized short squeeze coordinated by a group of retail investors. Eurozone sentiment and economic growth were particularly weak, reflecting the impact of a new lockdown with stricter social distancing along with a slow vaccine rollout.
Don’t let short-term uncertainty derail long-term investment goals.
Periods of investment uncertainty can present challenges, but experience has taught us that maintaining long-term investment goals can be an effective way to plan for the future. To help you create a sound strategy based on your personal goals and risk tolerance, Wells Fargo Funds offers more than 100 mutual funds spanning a wide range of asset classes and investment styles. Although diversification cannot guarantee an investment profit or prevent losses, we believe it can be an effective way to manage investment risk and potentially smooth out overall portfolio performance. We encourage investors to know their investments and to understand that appropriate levels of risk-taking may unlock opportunities.
Thank you for choosing to invest with Wells Fargo Funds. We appreciate your confidence in us and remain committed to helping you meet your financial needs.
Sincerely,
Andrew Owen
President
Wells Fargo Funds
“Global stocks rallied in November, propelled by optimism over three promising COVID-19 vaccines.”
For further information about your Fund, contact your investment professional, visit our website at wfam.com, or call us directly at 1-800-222-8222.
Wells Fargo Disciplined U.S. Core Fund | 3
Performance highlights (unaudited)
Investment objective
The Fund seeks long-term capital appreciation.
Manager
Wells Fargo Funds Management, LLC
Subadviser
Wells Capital Management Incorporated
Portfolio managers
Justin P. Carr, CFA®‡
Robert M. Wicentowski, CFA®‡
Average annual total returns (%) as of January 31, 2021
| | | Including sales charge | | Excluding sales charge | | Expense ratios1 (%) |
| | Inception date | 1 year | 5 year | 10 year | | 1 year | 5 year | 10 year | | Gross | Net 2 |
| Class A (EVSAX) | 2-28-1990 | 10.04 | 12.65 | 12.06 | | 16.76 | 13.99 | 12.72 | | 0.86 | 0.86 |
| Class C (EVSTX) | 6-30-1999 | 14.95 | 13.15 | 11.89 | | 15.95 | 13.15 | 11.89 | | 1.61 | 1.61 |
| Class R (EVSHX)3 | 9-30-2015 | – | – | – | | 16.50 | 13.71 | 12.43 | | 1.11 | 1.11 |
| Class R6 (EVSRX)4 | 9-30-2015 | – | – | – | | 17.26 | 14.48 | 13.21 | | 0.43 | 0.43 |
| Administrator Class (EVSYX) | 2-21-1995 | – | – | – | | 16.92 | 14.11 | 12.88 | | 0.78 | 0.74 |
| Institutional Class (EVSIX) | 7-30-2010 | – | – | – | | 17.21 | 14.41 | 13.17 | | 0.53 | 0.48 |
| S&P 500 Index5 | – | – | – | – | | 17.25 | 16.16 | 13.50 | | – | – |
Figures quoted represent past performance, which is no guarantee of future results, and do not reflect taxes that a shareholder may pay on an investment in a fund. Investment return and principal value of an investment will fluctuate so that an investor’s shares, when redeemed, may be worth more or less than their original cost. Performance shown without sales charges would be lower if sales charges were reflected. Current performance may be lower or higher than the performance data quoted, which assumes the reinvestment of dividends and capital gains. Current month-end performance is available on the Fund’s website, wfam.com.
Index returns do not include transaction costs associated with buying and selling securities, any mutual fund fees or expenses, or any taxes. It is not possible to invest directly in an index.
For Class A shares, the maximum front-end sales charge is 5.75%. For Class C shares, the maximum contingent deferred sales charge is 1.00%. Performance including a contingent deferred sales charge assumes the sales charge for the corresponding time period. Class R, Class R6, Administrator Class, and Institutional Class shares are sold without a front-end sales charge or contingent deferred sales charge.
Stock values fluctuate in response to the activities of individual companies and general market and economic conditions. The use of derivatives may reduce returns and/or increase volatility. Consult the Fund’s prospectus for additional information on these and other risks.
Please see footnotes on page 5.
4 | Wells Fargo Disciplined U.S. Core Fund
Performance highlights (unaudited)
| Ten largest holdings (%) as of January 31, 20216 |
| Apple Incorporated | 6.78 |
| Microsoft Corporation | 6.04 |
| Amazon.com Incorporated | 4.30 |
| Alphabet Incorporated Class C | 2.07 |
| Facebook Incorporated Class A | 1.90 |
| Alphabet Incorporated Class A | 1.88 |
| Johnson & Johnson | 1.76 |
| Tesla Motors Incorporated | 1.69 |
| JPMorgan Chase & Company | 1.53 |
| The Procter & Gamble Company | 1.34 |
| Sector allocation as of January 31, 20217 |
| ‡ | CFA® and Chartered Financial Analyst® are trademarks owned by CFA Institute. |
| 1 | Reflects the expense ratios as stated in the most recent prospectuses. The expense ratios shown are subject to change and may differ from the annualized expense ratios shown in the financial highlights of this report. |
| 2 | The manager has contractually committed through November 30, 2021, to waive fees and/or reimburse expenses to the extent necessary to cap total annual fund operating expenses after fee waivers at 0.87% for Class A, 1.62% for Class C, 1.12% for Class R, 0.43% for Class R6, 0.74% for Administrator Class, and 0.48% for Institutional Class. Brokerage commissions, stamp duty fees, interest, taxes, acquired fund fees and expenses (if any), and extraordinary expenses are excluded from the expense caps. Prior to or after the commitment expiration date, the caps may be increased or the commitment to maintain the caps may be terminated only with the approval of the Board of Trustees. Without these caps, the Fund’s returns would have been lower. The expense ratio paid by an investor is the net expense ratio (the total annual fund operating expenses after fee waivers) as stated in the prospectuses. |
| 3 | Historical performance shown for the Class R shares prior to their inception reflects the performance of the Administrator Class shares, adjusted to reflect higher expenses applicable to the Class R shares. |
| 4 | Historical performance shown for the Class R6 shares prior to their inception reflects the performance of the Institutional Class shares, and includes the higher expenses applicable to the Institutional Class shares. If these expenses had not been included, returns for the Class R6 shares would be higher. |
| 5 | The S&P 500 Index consists of 500 stocks chosen for market size, liquidity, and industry group representation. It is a market-value-weighted index with each stock’s weight in the index proportionate to its market value. You cannot invest directly in an index. |
| 6 | Figures represent the percentage of the Fund's net assets. Holdings are subject to change and may have changed since the date specified. |
| 7 | Figures represent the percentage of the Fund's long-term investments. These amounts are subject to change and may have changed since the date specified. |
Wells Fargo Disciplined U.S. Core Fund | 5
Fund expenses (unaudited)
As a shareholder of the Fund, you incur two types of costs: (1) transaction costs, including sales charges (loads) on purchase payments and contingent deferred sales charges (if any) on redemptions and (2) ongoing costs, including management fees, distribution (12b-1) and/or shareholder servicing fees, and other Fund expenses. This example is intended to help you understand your ongoing costs (in dollars) of investing in the Fund and to compare these costs with the ongoing costs of investing in other mutual funds.
The example is based on an investment of $1,000 invested at the beginning of the six-month period and held for the entire period from August 1, 2020 to January 31, 2021.
Actual expenses
The “Actual” line of the table below provides information about actual account values and actual expenses. You may use the information in this line, together with the amount you invested, to estimate the expenses that you paid over the period. Simply divide your account value by $1,000 (for example, an $8,600 account value divided by $1,000 = 8.6), then multiply the result by the number in the “Actual” line under the heading entitled “Expenses paid during period” for your applicable class of shares to estimate the expenses you paid on your account during this period.
Hypothetical example for comparison purposes
The “Hypothetical” line of the table below provides information about hypothetical account values and hypothetical expenses based on the Fund’s actual expense ratio and an assumed rate of return of 5% per year before expenses, which is not the Fund’s actual return. The hypothetical account values and expenses may not be used to estimate the actual ending account balance or expenses you paid for the period. You may use this information to compare the ongoing costs of investing in the Fund and other funds. To do so, compare this 5% hypothetical example with the 5% hypothetical examples that appear in the shareholder reports of the other funds.
Please note that the expenses shown in the table are meant to highlight your ongoing costs only and do not reflect any transactional costs, such as sales charges (loads) and contingent deferred sales charges. Therefore, the “Hypothetical” line of the table is useful in comparing ongoing costs only and will not help you determine the relative total costs of owning different funds. In addition, if these transactional costs were included, your costs would have been higher
| | Beginning
account value
8-1-2020 | Ending
account value
1-31-2021 | Expenses
paid during
the period1 | Annualized net
expense ratio |
| Class A | | | | |
| Actual | $1,000.00 | $1,143.91 | $4.59 | 0.85% |
| Hypothetical (5% return before expenses) | $1,000.00 | $1,020.92 | $4.33 | 0.85% |
| Class C | | | | |
| Actual | $1,000.00 | $1,140.76 | $8.69 | 1.61% |
| Hypothetical (5% return before expenses) | $1,000.00 | $1,017.09 | $8.19 | 1.61% |
| Class R | | | | |
| Actual | $1,000.00 | $1,142.83 | $6.00 | 1.11% |
| Hypothetical (5% return before expenses) | $1,000.00 | $1,019.61 | $5.65 | 1.11% |
| Class R6 | | | | |
| Actual | $1,000.00 | $1,146.96 | $2.33 | 0.43% |
| Hypothetical (5% return before expenses) | $1,000.00 | $1,023.04 | $2.19 | 0.43% |
| Administrator Class | | | | |
| Actual | $1,000.00 | $1,144.87 | $4.00 | 0.74% |
| Hypothetical (5% return before expenses) | $1,000.00 | $1,021.48 | $3.77 | 0.74% |
| Institutional Class | | | | |
| Actual | $1,000.00 | $1,146.18 | $2.60 | 0.48% |
| Hypothetical (5% return before expenses) | $1,000.00 | $1,022.79 | $2.45 | 0.48% |
1 Expenses paid is equal to the annualized net expense ratio of each class multiplied by the average account value over the period, multiplied by the number of days in the most recent fiscal half-year divided by the number of days in the fiscal year (to reflect the one-half-year period).
6 | Wells Fargo Disciplined U.S. Core Fund
Portfolio of investments—January 31, 2021 (unaudited)
| | | | | Shares | Value |
| Common stocks: 97.36% | | | | | |
| Communication services: 10.12% | | | | | |
| Diversified telecommunication services: 1.30% | | | | | |
| AT&T Incorporated | | | | 209,195 | $ 5,989,253 |
| Verizon Communications Incorporated | | | | 118,565 | 6,491,434 |
| | | | | | 12,480,687 |
| Entertainment: 2.15% | | | | | |
| Activision Blizzard Incorporated | | | | 43,432 | 3,952,312 |
| Netflix Incorporated † | | | | 13,137 | 6,994,007 |
| The Walt Disney Company | | | | 57,355 | 9,645,390 |
| | | | | | 20,591,709 |
| Interactive media & services: 5.85% | | | | | |
| Alphabet Incorporated Class A † | | | | 9,871 | 18,037,871 |
| Alphabet Incorporated Class C † | | | | 10,805 | 19,835,171 |
| Facebook Incorporated Class A † | | | | 70,508 | 18,214,332 |
| | | | | | 56,087,374 |
| Media: 0.70% | | | | | |
| Comcast Corporation Class A | | | | 83,707 | 4,149,356 |
| Discovery Incorporated Class A † | | | | 60,940 | 2,524,135 |
| | | | | | 6,673,491 |
| Wireless telecommunication services: 0.12% | | | | | |
| T-Mobile US Incorporated † | | | | 9,006 | 1,135,476 |
| Consumer discretionary: 12.73% | | | | | |
| Auto components: 0.13% | | | | | |
| BorgWarner Incorporated | | | | 30,559 | 1,283,172 |
| Automobiles: 2.27% | | | | | |
| General Motors Company | | | | 109,542 | 5,551,589 |
| Tesla Motors Incorporated † | | | | 20,440 | 16,219,753 |
| | | | | | 21,771,342 |
| Hotels, restaurants & leisure: 1.30% | | | | | |
| Chipotle Mexican Grill Incorporated † | | | | 958 | 1,417,840 |
| Las Vegas Sands Corporation | | | | 27,375 | 1,316,464 |
| McDonald's Corporation | | | | 25,866 | 5,375,989 |
| Royal Caribbean Cruises Limited | | | | 12,507 | 812,955 |
| Starbucks Corporation | | | | 36,878 | 3,570,159 |
| | | | | | 12,493,407 |
| Household durables: 0.79% | | | | | |
| D.R. Horton Incorporated | | | | 73,846 | 5,671,373 |
| PulteGroup Incorporated | | | | 44,382 | 1,930,617 |
| | | | | | 7,601,990 |
| Internet & direct marketing retail: 4.30% | | | | | |
| Amazon.com Incorporated † | | | | 12,841 | 41,170,814 |
The accompanying notes are an integral part of these financial statements.
Wells Fargo Disciplined U.S. Core Fund | 7
Portfolio of investments—January 31, 2021 (unaudited)
| | | | | Shares | Value |
| Leisure products: 0.35% | | | | | |
| Polaris Industries Incorporated | | | | 28,601 | $ 3,336,879 |
| Multiline retail: 0.67% | | | | | |
| Target Corporation | | | | 35,115 | 6,361,785 |
| Specialty retail: 2.11% | | | | | |
| AutoZone Incorporated † | | | | 2,824 | 3,158,277 |
| Best Buy Company Incorporated | | | | 29,199 | 3,177,435 |
| Lowe's Companies Incorporated | | | | 6,423 | 1,071,678 |
| The Home Depot Incorporated | | | | 47,171 | 12,774,850 |
| | | | | | 20,182,240 |
| Textiles, apparel & luxury goods: 0.81% | | | | | |
| Nike Incorporated Class B | | | | 57,776 | 7,718,296 |
| Consumer staples: 5.54% | | | | | |
| Beverages: 0.40% | | | | | |
| PepsiCo Incorporated | | | | 11,721 | 1,600,737 |
| The Coca-Cola Company | | | | 45,692 | 2,200,070 |
| | | | | | 3,800,807 |
| Food & staples retailing: 1.47% | | | | | |
| Costco Wholesale Corporation | | | | 10,496 | 3,699,105 |
| Sysco Corporation | | | | 14,868 | 1,063,211 |
| Walmart Incorporated | | | | 66,376 | 9,325,164 |
| | | | | | 14,087,480 |
| Food products: 1.03% | | | | | |
| General Mills Incorporated | | | | 34,771 | 2,020,195 |
| Pilgrim's Pride Corporation † | | | | 68,770 | 1,332,763 |
| The Kraft Heinz Company | | | | 56,450 | 1,891,640 |
| Tyson Foods Incorporated Class A | | | | 71,840 | 4,620,030 |
| | | | | | 9,864,628 |
| Household products: 1.71% | | | | | |
| Kimberly-Clark Corporation | | | | 26,664 | 3,522,314 |
| The Procter & Gamble Company | | | | 100,162 | 12,841,770 |
| | | | | | 16,364,084 |
| Personal products: 0.31% | | | | | |
| The Estee Lauder Companies Incorporated Class A | | | | 12,727 | 3,011,845 |
| Tobacco: 0.62% | | | | | |
| Altria Group Incorporated | | | | 54,697 | 2,246,953 |
| Philip Morris International Incorporated | | | | 46,312 | 3,688,751 |
| | | | | | 5,935,704 |
| Energy: 2.14% | | | | | |
| Oil, gas & consumable fuels: 2.14% | | | | | |
| Chevron Corporation | | | | 72,171 | 6,148,969 |
| ConocoPhillips | | | | 49,777 | 1,992,573 |
| Diamondback Energy Incorporated | | | | 54,647 | 3,097,938 |
| EOG Resources Incorporated | | | | 45,629 | 2,325,254 |
The accompanying notes are an integral part of these financial statements.
8 | Wells Fargo Disciplined U.S. Core Fund
Portfolio of investments—January 31, 2021 (unaudited)
| | | | | Shares | Value |
| Oil, gas & consumable fuels (continued) | | | | | |
| Exxon Mobil Corporation | | | | 126,040 | $ 5,651,634 |
| Valero Energy Corporation | | | | 23,426 | 1,321,929 |
| | | | | | 20,538,297 |
| Financials: 10.50% | | | | | |
| Banks: 3.75% | | | | | |
| Bank of America Corporation | | | | 190,824 | 5,657,932 |
| Citigroup Incorporated | | | | 61,542 | 3,568,821 |
| Citizens Financial Group Incorporated | | | | 42,246 | 1,539,444 |
| Huntington Bancshares Incorporated | | | | 277,189 | 3,665,825 |
| JPMorgan Chase & Company | | | | 114,066 | 14,676,872 |
| Signature Bank | | | | 16,294 | 2,691,606 |
| US Bancorp | | | | 97,112 | 4,161,249 |
| | | | | | 35,961,749 |
| Capital markets: 2.55% | | | | | |
| Ameriprise Financial Incorporated | | | | 18,776 | 3,715,207 |
| Bank of New York Mellon Corporation | | | | 77,627 | 3,091,883 |
| BlackRock Incorporated | | | | 4,666 | 3,272,079 |
| Morgan Stanley | | | | 70,018 | 4,694,707 |
| Northern Trust Corporation | | | | 45,175 | 4,029,158 |
| S&P Global Incorporated | | | | 6,371 | 2,019,607 |
| The Goldman Sachs Group Incorporated | | | | 13,242 | 3,590,833 |
| | | | | | 24,413,474 |
| Consumer finance: 0.46% | | | | | |
| Capital One Financial Corporation | | | | 21,378 | 2,228,870 |
| Synchrony Financial | | | | 65,730 | 2,211,815 |
| | | | | | 4,440,685 |
| Diversified financial services: 1.67% | | | | | |
| Berkshire Hathaway Incorporated Class B † | | | | 55,524 | 12,652,254 |
| Equitable Holdings Incorporated | | | | 133,367 | 3,304,834 |
| | | | | | 15,957,088 |
| Insurance: 2.07% | | | | | |
| MetLife Incorporated | | | | 130,349 | 6,276,304 |
| Progressive Corporation | | | | 46,528 | 4,056,776 |
| Reinsurance Group of America Incorporated | | | | 14,907 | 1,565,980 |
| The Allstate Corporation | | | | 28,488 | 3,053,344 |
| The Hartford Financial Services Group Incorporated | | | | 102,466 | 4,920,417 |
| | | | | | 19,872,821 |
| Health care: 13.90% | | | | | |
| Biotechnology: 2.06% | | | | | |
| AbbVie Incorporated | | | | 85,876 | 8,800,572 |
| Amgen Incorporated | | | | 29,186 | 7,046,376 |
| Biogen Incorporated † | | | | 3,914 | 1,106,136 |
| Vertex Pharmaceuticals Incorporated † | | | | 12,100 | 2,771,868 |
| | | | | | 19,724,952 |
| Health care equipment & supplies: 3.19% | | | | | |
| Abbott Laboratories | | | | 48,503 | 5,994,486 |
The accompanying notes are an integral part of these financial statements.
Wells Fargo Disciplined U.S. Core Fund | 9
Portfolio of investments—January 31, 2021 (unaudited)
| | | | | Shares | Value |
| Health care equipment & supplies (continued) | | | | | |
| Baxter International Incorporated | | | | 34,326 | $ 2,637,267 |
| Danaher Corporation | | | | 20,778 | 4,941,840 |
| Edwards Lifesciences Corporation † | | | | 47,027 | 3,883,490 |
| Hologic Incorporated † | | | | 25,092 | 2,000,585 |
| Medtronic plc | | | | 72,769 | 8,101,373 |
| Zimmer Biomet Holdings Incorporated | | | | 19,297 | 2,965,370 |
| | | | | | 30,524,411 |
| Health care providers & services: 3.18% | | | | | |
| AmerisourceBergen Corporation | | | | 31,751 | 3,308,454 |
| Anthem Incorporated | | | | 10,250 | 3,044,045 |
| Cigna Corporation | | | | 14,774 | 3,206,697 |
| CVS Health Corporation | | | | 45,098 | 3,231,272 |
| Humana Incorporated | | | | 6,590 | 2,524,695 |
| McKesson Corporation | | | | 33,224 | 5,796,591 |
| UnitedHealth Group Incorporated | | | | 28,026 | 9,348,913 |
| | | | | | 30,460,667 |
| Health care technology: 0.50% | | | | | |
| Veeva Systems Incorporated Class A † | | | | 17,356 | 4,797,893 |
| Life sciences tools & services: 0.57% | | | | | |
| Thermo Fisher Scientific Incorporated | | | | 10,775 | 5,492,018 |
| Pharmaceuticals: 4.40% | | | | | |
| Bristol-Myers Squibb Company | | | | 120,986 | 7,432,170 |
| Eli Lilly & Company | | | | 18,278 | 3,801,276 |
| Johnson & Johnson | | | | 103,152 | 16,827,186 |
| Merck & Company Incorporated | | | | 100,585 | 7,752,086 |
| Pfizer Incorporated | | | | 166,867 | 5,990,525 |
| Viatris Incorporated † | | | | 20,704 | 351,761 |
| | | | | | 42,155,004 |
| Industrials: 7.56% | | | | | |
| Aerospace & defense: 1.23% | | | | | |
| Lockheed Martin Corporation | | | | 13,816 | 4,446,265 |
| Northrop Grumman Corporation | | | | 6,242 | 1,789,020 |
| Raytheon Technologies Corporation | | | | 71,721 | 4,785,942 |
| The Boeing Company | | | | 3,987 | 774,236 |
| | | | | | 11,795,463 |
| Air freight & logistics: 1.07% | | | | | |
| Expeditors International of Washington Incorporated | | | | 28,846 | 2,582,294 |
| FedEx Corporation | | | | 12,657 | 2,978,698 |
| United Parcel Service Incorporated Class B | | | | 30,355 | 4,705,025 |
| | | | | | 10,266,017 |
| Airlines: 0.35% | | | | | |
| Delta Air Lines Incorporated | | | | 77,827 | 2,954,313 |
| United Airlines Holdings Incorporated † | | | | 9,714 | 388,463 |
| | | | | | 3,342,776 |
| Building products: 0.64% | | | | | |
| Masco Corporation | | | | 112,095 | 6,087,879 |
The accompanying notes are an integral part of these financial statements.
10 | Wells Fargo Disciplined U.S. Core Fund
Portfolio of investments—January 31, 2021 (unaudited)
| | | | | Shares | Value |
| Commercial services & supplies: 0.45% | | | | | |
| Waste Management Incorporated | | | | 38,862 | $ 4,326,118 |
| Construction & engineering: 0.60% | | | | | |
| Quanta Services Incorporated | | | | 81,748 | 5,760,782 |
| Electrical equipment: 0.64% | | | | | |
| AMETEK Incorporated | | | | 23,120 | 2,618,571 |
| Eaton Corporation plc | | | | 29,809 | 3,508,519 |
| | | | | | 6,127,090 |
| Industrial conglomerates: 0.85% | | | | | |
| General Electric Company | | | | 243,804 | 2,603,827 |
| Honeywell International Incorporated | | | | 28,415 | 5,551,439 |
| | | | | | 8,155,266 |
| Machinery: 1.20% | | | | | |
| AGCO Corporation | | | | 39,159 | 4,342,728 |
| Cummins Incorporated | | | | 21,315 | 4,996,662 |
| Illinois Tool Works Incorporated | | | | 11,334 | 2,201,176 |
| | | | | | 11,540,566 |
| Road & rail: 0.30% | | | | | |
| Union Pacific Corporation | | | | 14,386 | 2,840,803 |
| Trading companies & distributors: 0.23% | | | | | |
| W.W. Grainger Incorporated | | | | 6,109 | 2,226,059 |
| Information technology: 27.86% | | | | | |
| Communications equipment: 0.83% | | | | | |
| Cisco Systems Incorporated | | | | 178,658 | 7,964,574 |
| Electronic equipment, instruments & components: 0.54% | | | | | |
| Keysight Technologies Incorporated † | | | | 19,603 | 2,775,589 |
| Zebra Technologies Corporation Class A † | | | | 6,234 | 2,417,732 |
| | | | | | 5,193,321 |
| IT services: 4.13% | | | | | |
| Accenture plc Class A | | | | 21,608 | 5,227,407 |
| CACI International Incorporated Class A † | | | | 15,201 | 3,666,785 |
| Cognizant Technology Solutions Corporation Class A | | | | 10,363 | 807,796 |
| International Business Machines Corporation | | | | 18,410 | 2,192,815 |
| MasterCard Incorporated Class A | | | | 19,941 | 6,307,139 |
| PayPal Holdings Incorporated † | | | | 36,668 | 8,591,679 |
| Visa Incorporated Class A | | | | 66,068 | 12,767,641 |
| | | | | | 39,561,262 |
| Semiconductors & semiconductor equipment: 5.88% | | | | | |
| Applied Materials Incorporated | | | | 68,026 | 6,576,754 |
| Broadcom Incorporated | | | | 21,403 | 9,642,052 |
| Enphase Energy Incorporated † | | | | 4,603 | 839,357 |
| Intel Corporation | | | | 119,222 | 6,618,013 |
| Lam Research Corporation | | | | 13,963 | 6,757,394 |
| Micron Technology Incorporated † | | | | 49,003 | 3,835,465 |
| NVIDIA Corporation | | | | 18,369 | 9,544,349 |
The accompanying notes are an integral part of these financial statements.
Wells Fargo Disciplined U.S. Core Fund | 11
Portfolio of investments—January 31, 2021 (unaudited)
| | | | | Shares | Value |
| Semiconductors & semiconductor equipment (continued) | | | | | |
| Qorvo Incorporated † | | | | 15,478 | $ 2,644,881 |
| QUALCOMM Incorporated | | | | 63,282 | 9,889,711 |
| | | | | | 56,347,976 |
| Software: 9.41% | | | | | |
| Adobe Incorporated † | | | | 13,977 | 6,412,228 |
| Cadence Design Systems Incorporated † | | | | 36,840 | 4,803,568 |
| Fortinet Incorporated † | | | | 16,391 | 2,372,597 |
| Intuit Incorporated | | | | 16,201 | 5,852,287 |
| Microsoft Corporation | | | | 249,361 | 57,841,778 |
| Oracle Corporation | | | | 104,050 | 6,287,742 |
| Salesforce.com Incorporated † | | | | 29,031 | 6,548,232 |
| | | | | | 90,118,432 |
| Technology hardware, storage & peripherals: 7.07% | | | | | |
| Apple Incorporated | | | | 492,309 | 64,965,096 |
| HP Incorporated | | | | 114,461 | 2,785,981 |
| | | | | | 67,751,077 |
| Materials: 2.43% | | | | | |
| Chemicals: 0.65% | | | | | |
| Eastman Chemical Company | | | | 22,379 | 2,200,975 |
| LyondellBasell Industries NV Class A | | | | 46,850 | 4,017,856 |
| | | | | | 6,218,831 |
| Containers & packaging: 0.51% | | | | | |
| Avery Dennison Corporation | | | | 8,912 | 1,344,553 |
| WestRock Company | | | | 85,404 | 3,538,288 |
| | | | | | 4,882,841 |
| Metals & mining: 1.27% | | | | | |
| Newmont Corporation | | | | 54,959 | 3,275,556 |
| Nucor Corporation | | | | 75,754 | 3,691,492 |
| Reliance Steel & Aluminum Company | | | | 44,512 | 5,166,953 |
| | | | | | 12,134,001 |
| Real estate: 2.52% | | | | | |
| Equity REITs: 2.52% | | | | | |
| Alexandria Real Estate Equities Incorporated | | | | 21,708 | 3,627,624 |
| American Tower Corporation | | | | 16,829 | 3,826,241 |
| Crown Castle International Corporation | | | | 7,370 | 1,173,746 |
| CyrusOne Incorporated | | | | 28,226 | 2,059,087 |
| Equinix Incorporated | | | | 3,148 | 2,329,394 |
| Essex Property Trust Incorporated | | | | 7,235 | 1,733,578 |
| Prologis Incorporated | | | | 66,313 | 6,843,502 |
| SBA Communications Corporation | | | | 6,231 | 1,674,083 |
| VICI Properties Incorporated | | | | 34,766 | 878,884 |
| | | | | | 24,146,139 |
| Utilities: 2.06% | | | | | |
| Electric utilities: 0.93% | | | | | |
| Eversource Energy | | | | 18,844 | 1,648,850 |
The accompanying notes are an integral part of these financial statements.
12 | Wells Fargo Disciplined U.S. Core Fund
Portfolio of investments—January 31, 2021 (unaudited)
| | | | | Shares | Value |
| Electric utilities (continued) | | | | | |
| NRG Energy Incorporated | | | | 114,422 | $ 4,738,215 |
| The Southern Company | | | | 42,940 | 2,530,025 |
| | | | | | 8,917,090 |
| Independent power & renewable electricity producers: 0.39% | | | | | |
| AES Corporation | | | | 154,522 | 3,768,792 |
| Multi-utilities: 0.74% | | | | | |
| Dominion Energy Incorporated | | | | 34,800 | 2,536,572 |
| Sempra Energy | | | | 36,732 | 4,545,952 |
| | | | | | 7,082,524 |
| Total Common stocks (Cost $520,558,402) | | | | | 932,847,948 |
| | | Yield | | | |
| Short-term investments: 0.94% | | | | | |
| Investment companies: 0.94% | | | | | |
| Wells Fargo Government Money Market Fund Select Class ♠∞ | | 0.03% | | 9,032,084 | 9,032,084 |
| Total Short-term investments (Cost $9,032,084) | | | | | 9,032,084 |
| Total investments in securities (Cost $529,590,486) | 98.30% | | | | 941,880,032 |
| Other assets and liabilities, net | 1.70 | | | | 16,307,664 |
| Total net assets | 100.00% | | | | $958,187,696 |
| † | Non-income-earning security |
| ♠ | The issuer of the security is an affiliated person of the Fund as defined in the Investment Company Act of 1940. |
| ∞ | The rate represents the 7-day annualized yield at period end. |
| Abbreviations: |
| REIT | Real estate investment trust |
Investments in affiliates
An affiliated investment is an investment in which the Fund owns at least 5% of the outstanding voting shares of the issuer or as a result of other relationships, such as the Fund and the issuer having the same investment manager. Transactions with issuers that were either affiliated persons of the Fund at the beginning of the period or the end of the period were as follows:
| | Value,
beginning of
period | Purchases | Sales
proceeds | Net
realized
gains
(losses) | | Net
change in
unrealized
gains
(losses) | | Value,
end of
period | | % of
net
assets | Shares,
end
of period | Income
from
affiliated
securities |
| Short-term investments | | | | | | | | | | | | |
| Investment companies | | | | | | | | | | | | |
| Securities Lending Cash Investments LLC* | $ 0 | $ 15,066,995 | $ (15,066,995) | $0 | | $0 | | $ 0 | | | 0 | $ 915# |
| Wells Fargo Government Money Market Fund Select Class | 15,915,451 | 118,066,643 | (124,950,010) | 0 | | 0 | | 9,032,084 | | | 9,032,084 | 3,649 |
| | | | | $0 | | $0 | | $9,032,084 | | 0.94% | | $4,564 |
| * | No longer held at the end of period. |
| # | Amount shown represents income before fees and rebates. |
The accompanying notes are an integral part of these financial statements.
Wells Fargo Disciplined U.S. Core Fund | 13
Portfolio of investments—January 31, 2021 (unaudited)
Futures contracts
| Description | Number of
contracts | Expiration
date | Notional
cost | Notional
value | Unrealized
gains | Unrealized
losses |
| Long | | | | | | |
| E-Mini S&P 500 Index | 117 | 3-19-2021 | $21,609,981 | $21,675,420 | $65,439 | $0 |
The accompanying notes are an integral part of these financial statements.
14 | Wells Fargo Disciplined U.S. Core Fund
Statement of assets and liabilities—January 31, 2021 (unaudited)
| | |
| Assets | |
Investments in unaffiliated securities, at value (cost $520,558,402)
| $ 932,847,948 |
Investments in affiliated securites, at value (cost $9,032,084)
| 9,032,084 |
Receivable for investments sold
| 14,856,339 |
Segregated cash for futures contracts
| 1,916,504 |
Receivable for dividends
| 956,250 |
Receivable for Fund shares sold
| 291,635 |
Receivable for securities lending income, net
| 98 |
Prepaid expenses and other assets
| 219,863 |
Total assets
| 960,120,721 |
| Liabilities | |
Payable for Fund shares redeemed
| 1,218,819 |
Management fee payable
| 286,739 |
Payable for daily variation margin on open futures contracts
| 141,109 |
Administration fees payable
| 118,520 |
Shareholder servicing fees payable
| 115,804 |
Distribution fees payable
| 16,061 |
Trustees’ fees and expenses payable
| 2,229 |
Accrued expenses and other liabilities
| 33,744 |
Total liabilities
| 1,933,025 |
Total net assets
| $958,187,696 |
| Net assets consist of | |
Paid-in capital
| $ 515,565,899 |
Total distributable earnings
| 442,621,797 |
Total net assets
| $958,187,696 |
| Computation of net asset value and offering price per share | |
Net assets – Class A
| $ 454,224,921 |
Shares outstanding – Class A1
| 23,838,299 |
Net asset value per share – Class A
| $19.05 |
Maximum offering price per share – Class A2
| $20.21 |
Net assets – Class C
| $ 25,691,194 |
Shares outstanding – Class C1
| 1,469,166 |
Net asset value per share – Class C
| $17.49 |
Net assets – Class R
| $ 3,810,889 |
Shares outstanding – Class R1
| 198,090 |
Net asset value per share – Class R
| $19.24 |
Net assets – Class R6
| $ 279,330,315 |
Shares outstanding – Class R61
| 14,259,146 |
Net asset value per share – Class R6
| $19.59 |
Net assets – Administrator Class
| $ 44,962,142 |
Shares outstanding – Administrator Class1
| 2,283,130 |
Net asset value per share – Administrator Class
| $19.69 |
Net assets – Institutional Class
| $ 150,168,235 |
Shares outstanding – Institutional Class1
| 7,744,773 |
Net asset value per share – Institutional Class
| $19.39 |
| 1 | The Fund has an unlimited number of authorized shares. |
| 2 | Maximum offering price is computed as 100/94.25 of net asset value. On investments of $50,000 or more, the offering price is reduced. |
The accompanying notes are an integral part of these financial statements.
Wells Fargo Disciplined U.S. Core Fund | 15
Statement of operations—six months ended January 31, 2021 (unaudited)
| | |
| Investment income | |
Dividends
| $ 8,322,029 |
Income from affiliated securities
| 6,702 |
Interest
| 127 |
Total investment income
| 8,328,858 |
| Expenses | |
Management fee
| 1,643,225 |
| Administration fees | |
Class A
| 465,447 |
Class C
| 29,284 |
Class R
| 3,900 |
Class R6
| 39,874 |
Administrator Class
| 32,289 |
Institutional Class
| 96,594 |
| Shareholder servicing fees | |
Class A
| 554,103 |
Class C
| 34,861 |
Class R
| 4,642 |
Administrator Class
| 62,020 |
| Distribution fees | |
Class C
| 104,416 |
Class R
| 4,627 |
Custody and accounting fees
| 32,041 |
Professional fees
| 28,245 |
Registration fees
| 60,807 |
Shareholder report expenses
| 39,818 |
Trustees’ fees and expenses
| 9,707 |
Other fees and expenses
| 61,215 |
Total expenses
| 3,307,115 |
| Less: Fee waivers and/or expense reimbursements | |
Fund-level
| (23,200) |
Class A
| (10,923) |
Class C
| (1) |
Class R6
| (1,347) |
Administrator Class
| (6,012) |
Institutional Class
| (18,371) |
Net expenses
| 3,247,261 |
Net investment income
| 5,081,597 |
| Realized and unrealized gains (losses) on investments | |
| Net realized gains on | |
Unaffiliated securities
| 29,665,874 |
Futures contracts
| 4,120,959 |
Net realized gains on investments
| 33,786,833 |
| Net change in unrealized gains (losses) on | |
Unaffiliated securities
| 88,689,199 |
Futures contracts
| (387,485) |
Net change in unrealized gains (losses) on investments
| 88,301,714 |
Net realized and unrealized gains (losses) on investments
| 122,088,547 |
Net increase in net assets resulting from operations
| 127,170,144 |
The accompanying notes are an integral part of these financial statements.
16 | Wells Fargo Disciplined U.S. Core Fund
Statement of changes in net assets
| | |
| | Six months ended
January 31, 2021
(unaudited) | Year ended
July 31, 2020 |
| Operations | | | | |
Net investment income
| | $ 5,081,597 | | $ 14,329,632 |
Net realized gains on investments
| | 33,786,833 | | 71,533,398 |
Net change in unrealized gains (losses) on investments
| | 88,301,714 | | (1,368,802) |
Net increase in net assets resulting from operations
| | 127,170,144 | | 84,494,228 |
| Distributions to shareholders from | | | | |
| Net investment income and net realized gains | | | | |
Class A
| | (40,144,770) | | (18,684,889) |
Class C
| | (2,202,870) | | (1,266,022) |
Class R
| | (330,477) | | (125,676) |
Class R6
| | (25,321,636) | | (13,828,583) |
Administrator Class
| | (4,226,866) | | (2,526,202) |
Institutional Class
| | (13,403,739) | | (9,162,742) |
Total distributions to shareholders
| | (85,630,358) | | (45,594,114) |
| Capital share transactions | Shares | | Shares | |
| Proceeds from shares sold | | | | |
Class A
| 756,009 | 14,674,357 | 1,168,491 | 19,900,273 |
Class C
| 25,341 | 442,408 | 95,422 | 1,502,772 |
Class R
| 9,380 | 183,707 | 46,128 | 784,721 |
Class R6
| 1,540,816 | 31,096,173 | 2,828,938 | 48,881,704 |
Administrator Class
| 66,620 | 1,315,627 | 204,842 | 3,475,476 |
Institutional Class
| 642,410 | 12,695,119 | 1,095,326 | 19,014,160 |
| | | 60,407,391 | | 93,559,106 |
| Reinvestment of distributions | | | | |
Class A
| 1,978,592 | 37,660,982 | 983,735 | 17,558,389 |
Class C
| 123,928 | 2,147,585 | 71,599 | 1,167,986 |
Class R
| 17,031 | 327,043 | 6,899 | 124,243 |
Class R6
| 1,222,488 | 23,967,764 | 704,180 | 12,911,375 |
Administrator Class
| 190,727 | 3,751,963 | 122,596 | 2,255,074 |
Institutional Class
| 620,802 | 12,045,656 | 466,052 | 8,456,868 |
| | | 79,900,993 | | 42,473,935 |
| Payment for shares redeemed | | | | |
Class A
| (2,003,635) | (38,621,292) | (4,165,810) | (70,522,271) |
Class C
| (424,689) | (7,535,073) | (864,975) | (13,589,760) |
Class R
| (19,151) | (373,796) | (41,436) | (711,640) |
Class R6
| (2,027,615) | (40,137,643) | (9,188,798) | (160,807,048) |
Administrator Class
| (671,075) | (13,361,938) | (934,084) | (15,485,846) |
Institutional Class
| (1,432,768) | (27,867,766) | (9,902,961) | (170,810,159) |
| | | (127,897,508) | | (431,926,724) |
Net increase (decrease) in net assets resulting from capital share transactions
| | 12,410,876 | | (295,893,683) |
Total increase (decrease) in net assets
| | 53,950,662 | | (256,993,569) |
| Net assets | | | | |
Beginning of period
| | 904,237,034 | | 1,161,230,603 |
End of period
| | $ 958,187,696 | | $ 904,237,034 |
The accompanying notes are an integral part of these financial statements.
Wells Fargo Disciplined U.S. Core Fund | 17
Financial highlights
(For a share outstanding throughout each period)
| | | Year ended July 31 |
| Class A | Six months ended
January 31, 2021
(unaudited) | 2020 | 2019 | 2018 | 2017 | 2016 |
Net asset value, beginning of period
| $18.22 | $17.29 | $17.70 | $16.30 | $14.50 | $15.45 |
Net investment income
| 0.08 | 0.23 | 0.25 | 0.24 | 0.22 | 0.21 |
Net realized and unrealized gains on investments
| 2.52 | 1.47 | 0.38 | 1.90 | 1.94 | 0.47 |
Total from investment operations
| 2.60 | 1.70 | 0.63 | 2.14 | 2.16 | 0.68 |
| Distributions to shareholders from | | | | | | |
Net investment income
| (0.33) | (0.33) | (0.19) | (0.15) | (0.15) | (0.19) |
Net realized gains
| (1.44) | (0.44) | (0.85) | (0.59) | (0.21) | (1.44) |
Total distributions to shareholders
| (1.77) | (0.77) | (1.04) | (0.74) | (0.36) | (1.63) |
Net asset value, end of period
| $19.05 | $18.22 | $17.29 | $17.70 | $16.30 | $14.50 |
Total return1
| 14.39% | 9.97% | 4.31% | 13.28% | 15.12% | 5.22% |
| Ratios to average net assets (annualized) | | | | | | |
Gross expenses
| 0.86% | 0.86% | 0.84% | 0.83% | 0.85% | 0.87% |
Net expenses
| 0.85% | 0.85% | 0.84% | 0.83% | 0.85% | 0.87% |
Net investment income
| 0.92% | 1.25% | 1.40% | 1.33% | 1.45% | 1.60% |
| Supplemental data | | | | | | |
Portfolio turnover rate
| 18% | 50% | 63% | 73% | 60% | 52% |
Net assets, end of period (000s omitted)
| $454,225 | $421,005 | $434,367 | $480,602 | $467,491 | $412,629 |
| 1 | Total return calculations do not include any sales charges. Returns for periods of less than one year are not annualized. |
The accompanying notes are an integral part of these financial statements.
18 | Wells Fargo Disciplined U.S. Core Fund
Financial highlights
(For a share outstanding throughout each period)
| | | Year ended July 31 |
| Class C | Six months ended
January 31, 2021
(unaudited) | 2020 | 2019 | 2018 | 2017 | 2016 |
Net asset value, beginning of period
| $16.70 | $15.85 | $16.28 | $15.04 | $13.45 | $14.50 |
Net investment income
| 0.03 | 0.11 | 0.12 | 0.09 | 0.10 | 0.14 |
Net realized and unrealized gains on investments
| 2.30 | 1.32 | 0.35 | 1.76 | 1.79 | 0.38 |
Total from investment operations
| 2.33 | 1.43 | 0.47 | 1.85 | 1.89 | 0.52 |
| Distributions to shareholders from | | | | | | |
Net investment income
| (0.10) | (0.14) | (0.05) | (0.02) | (0.09) | (0.13) |
Net realized gains
| (1.44) | (0.44) | (0.85) | (0.59) | (0.21) | (1.44) |
Total distributions to shareholders
| (1.54) | (0.58) | (0.90) | (0.61) | (0.30) | (1.57) |
Net asset value, end of period
| $17.49 | $16.70 | $15.85 | $16.28 | $15.04 | $13.45 |
Total return1
| 14.08% | 9.09% | 3.59% | 12.41% | 12.41% | 4.43% |
| Ratios to average net assets (annualized) | | | | | | |
Gross expenses
| 1.61% | 1.60% | 1.59% | 1.58% | 1.60% | 1.62% |
Net expenses
| 1.61% | 1.60% | 1.59% | 1.58% | 1.60% | 1.62% |
Net investment income
| 0.17% | 0.51% | 0.66% | 0.58% | 0.69% | 0.82% |
| Supplemental data | | | | | | |
Portfolio turnover rate
| 18% | 50% | 63% | 73% | 60% | 52% |
Net assets, end of period (000s omitted)
| $25,691 | $29,141 | $38,708 | $52,647 | $54,054 | $46,801 |
| 1 | Total return calculations do not include any sales charges. Returns for periods of less than one year are not annualized. |
The accompanying notes are an integral part of these financial statements.
Wells Fargo Disciplined U.S. Core Fund | 19
Financial highlights
(For a share outstanding throughout each period)
| | | Year ended July 31 |
| Class R | Six months ended
January 31, 2021
(unaudited) | 2020 | 2019 | 2018 | 2017 | 2016 1 |
Net asset value, beginning of period
| $18.38 | $17.44 | $17.88 | $16.51 | $14.77 | $14.62 |
Net investment income
| 0.06 | 0.18 | 0.19 2 | 0.18 2 | 0.17 2 | 0.13 2 |
Net realized and unrealized gains on investments
| 2.54 | 1.49 | 0.41 | 1.94 | 1.99 | 1.72 |
Total from investment operations
| 2.60 | 1.67 | 0.60 | 2.12 | 2.16 | 1.85 |
| Distributions to shareholders from | | | | | | |
Net investment income
| (0.30) | (0.29) | (0.19) | (0.16) | (0.21) | (0.26) |
Net realized gains
| (1.44) | (0.44) | (0.85) | (0.59) | (0.21) | (1.44) |
Total distributions to shareholders
| (1.74) | (0.73) | (1.04) | (0.75) | (0.42) | (1.70) |
Net asset value, end of period
| $19.24 | $18.38 | $17.44 | $17.88 | $16.51 | $14.77 |
Total return3
| 14.28% | 9.68% | 4.07% | 12.97% | 14.86% | 13.56% |
| Ratios to average net assets (annualized) | | | | | | |
Gross expenses
| 1.11% | 1.10% | 1.09% | 1.08% | 1.10% | 1.12% |
Net expenses
| 1.11% | 1.10% | 1.09% | 1.08% | 1.10% | 1.12% |
Net investment income
| 0.66% | 0.97% | 1.15% | 1.04% | 1.10% | 1.12% |
| Supplemental data | | | | | | |
Portfolio turnover rate
| 18% | 50% | 63% | 73% | 60% | 52% |
Net assets, end of period (000s omitted)
| $3,811 | $3,507 | $3,126 | $3,298 | $2,001 | $201 |
| 1 | For the period from September 30, 2015 (commencement of class operations) to July 31, 2016 |
| 2 | Calculated based upon average shares outstanding |
| 3 | Returns for periods of less than one year are not annualized. |
The accompanying notes are an integral part of these financial statements.
20 | Wells Fargo Disciplined U.S. Core Fund
Financial highlights
(For a share outstanding throughout each period)
| | | Year ended July 31 |
| Class R6 | Six months ended
January 31, 2021
(unaudited) | 2020 | 2019 | 2018 | 2017 | 2016 1 |
Net asset value, beginning of period
| $18.72 | $17.76 | $18.17 | $16.71 | $14.86 | $14.62 |
Net investment income
| 0.13 2 | 0.31 | 0.32 | 0.30 2 | 0.28 2 | 0.22 2 |
Net realized and unrealized gains on investments
| 2.60 | 1.51 | 0.40 | 1.97 | 1.99 | 1.72 |
Total from investment operations
| 2.73 | 1.82 | 0.72 | 2.27 | 2.27 | 1.94 |
| Distributions to shareholders from | | | | | | |
Net investment income
| (0.42) | (0.42) | (0.28) | (0.22) | (0.21) | (0.26) |
Net realized gains
| (1.44) | (0.44) | (0.85) | (0.59) | (0.21) | (1.44) |
Total distributions to shareholders
| (1.86) | (0.86) | (1.13) | (0.81) | (0.42) | (1.70) |
Net asset value, end of period
| $19.59 | $18.72 | $17.76 | $18.17 | $16.71 | $14.86 |
Total return3
| 14.70% | 10.39% | 4.77% | 13.78% | 15.56% | 14.24% |
| Ratios to average net assets (annualized) | | | | | | |
Gross expenses
| 0.43% | 0.43% | 0.41% | 0.40% | 0.42% | 0.44% |
Net expenses
| 0.43% | 0.42% | 0.41% | 0.40% | 0.42% | 0.43% |
Net investment income
| 1.35% | 1.70% | 1.84% | 1.71% | 1.77% | 1.88% |
| Supplemental data | | | | | | |
Portfolio turnover rate
| 18% | 50% | 63% | 73% | 60% | 52% |
Net assets, end of period (000s omitted)
| $279,330 | $253,223 | $340,606 | $445,678 | $41,770 | $4,024 |
| 1 | For the period from September 30, 2015 (commencement of class operations) to July 31, 2016 |
| 2 | Calculated based upon average shares outstanding |
| 3 | Returns for periods of less than one year are not annualized. |
The accompanying notes are an integral part of these financial statements.
Wells Fargo Disciplined U.S. Core Fund | 21
Financial highlights
(For a share outstanding throughout each period)
| | | Year ended July 31 |
| Administrator Class | Six months ended
January 31, 2021
(unaudited) | 2020 | 2019 | 2018 | 2017 | 2016 |
Net asset value, beginning of period
| $18.78 | $17.80 | $18.17 | $16.71 | $14.85 | $15.80 |
Net investment income
| 0.10 1 | 0.24 1 | 0.26 1 | 0.25 1 | 0.25 1 | 0.24 1 |
Net realized and unrealized gains on investments
| 2.60 | 1.53 | 0.41 | 1.97 | 1.98 | 0.48 |
Total from investment operations
| 2.70 | 1.77 | 0.67 | 2.22 | 2.23 | 0.72 |
| Distributions to shareholders from | | | | | | |
Net investment income
| (0.35) | (0.35) | (0.19) | (0.17) | (0.16) | (0.23) |
Net realized gains
| (1.44) | (0.44) | (0.85) | (0.59) | (0.21) | (1.44) |
Total distributions to shareholders
| (1.79) | (0.79) | (1.04) | (0.76) | (0.37) | (1.67) |
Net asset value, end of period
| $19.69 | $18.78 | $17.80 | $18.17 | $16.71 | $14.85 |
Total return2
| 14.49% | 10.08% | 4.43% | 13.40% | 15.24% | 5.36% |
| Ratios to average net assets (annualized) | | | | | | |
Gross expenses
| 0.78% | 0.77% | 0.76% | 0.75% | 0.77% | 0.78% |
Net expenses
| 0.74% | 0.74% | 0.74% | 0.74% | 0.74% | 0.74% |
Net investment income
| 1.05% | 1.37% | 1.50% | 1.42% | 1.60% | 1.71% |
| Supplemental data | | | | | | |
Portfolio turnover rate
| 18% | 50% | 63% | 73% | 60% | 52% |
Net assets, end of period (000s omitted)
| $44,962 | $50,655 | $58,808 | $94,058 | $94,294 | $116,807 |
| 1 | Calculated based upon average shares outstanding |
| 2 | Returns for periods of less than one year are not annualized. |
The accompanying notes are an integral part of these financial statements.
22 | Wells Fargo Disciplined U.S. Core Fund
Financial highlights
(For a share outstanding throughout each period)
| | | Year ended July 31 |
| Institutional Class | Six months ended
January 31, 2021
(unaudited) | 2020 | 2019 | 2018 | 2017 | 2016 |
Net asset value, beginning of period
| $18.54 | $17.57 | $17.98 | $16.55 | $14.72 | $15.66 |
Net investment income
| 0.13 1 | 0.29 1 | 0.30 1 | 0.28 | 0.27 1 | 0.28 1 |
Net realized and unrealized gains on investments
| 2.56 | 1.51 | 0.40 | 1.95 | 1.98 | 0.47 |
Total from investment operations
| 2.69 | 1.80 | 0.70 | 2.23 | 2.25 | 0.75 |
| Distributions to shareholders from | | | | | | |
Net investment income
| (0.40) | (0.39) | (0.26) | (0.21) | (0.21) | (0.25) |
Net realized gains
| (1.44) | (0.44) | (0.85) | (0.59) | (0.21) | (1.44) |
Total distributions to shareholders
| (1.84) | (0.83) | (1.11) | (0.80) | (0.42) | (1.69) |
Net asset value, end of period
| $19.39 | $18.54 | $17.57 | $17.98 | $16.55 | $14.72 |
Total return2
| 14.62% | 10.39% | 4.69% | 13.65% | 15.51% | 5.64% |
| Ratios to average net assets (annualized) | | | | | | |
Gross expenses
| 0.53% | 0.52% | 0.51% | 0.50% | 0.52% | 0.54% |
Net expenses
| 0.48% | 0.48% | 0.48% | 0.48% | 0.48% | 0.48% |
Net investment income
| 1.29% | 1.67% | 1.77% | 1.67% | 1.76% | 1.96% |
| Supplemental data | | | | | | |
Portfolio turnover rate
| 18% | 50% | 63% | 73% | 60% | 52% |
Net assets, end of period (000s omitted)
| $150,168 | $146,707 | $285,616 | $411,988 | $353,573 | $163,674 |
| 1 | Calculated based upon average shares outstanding |
| 2 | Returns for periods of less than one year are not annualized. |
The accompanying notes are an integral part of these financial statements.
Wells Fargo Disciplined U.S. Core Fund | 23
Notes to financial statements (unaudited)
1. ORGANIZATION
Wells Fargo Funds Trust (the “Trust”), a Delaware statutory trust organized on March 10, 1999, is an open-end management investment company registered under the Investment Company Act of 1940, as amended (the “1940 Act”). As an investment company, the Trust follows the accounting and reporting guidance in Financial Accounting Standards Board (“FASB”) Accounting Standards Codification Topic 946, Financial Services – Investment Companies. These financial statements report on the Wells Fargo Disciplined U.S. Core Fund (the “Fund”) which is a diversified series of the Trust.
2. SIGNIFICANT ACCOUNTING POLICIES
The following significant accounting policies, which are consistently followed in the preparation of the financial statements of the Fund, are in conformity with U.S. generally accepted accounting principles which require management to make estimates and assumptions that affect the reported amounts of assets and liabilities, disclosure of contingent assets and liabilities at the date of the financial statements, and the reported amounts of income and expenses during the reporting period. Actual results could differ from those estimates.
Securities valuation
All investments are valued each business day as of the close of regular trading on the New York Stock Exchange (generally 4 p.m. Eastern Time), although the Fund may deviate from this calculation time under unusual or unexpected circumstances.
Equity securities and futures contracts that are listed on a foreign or domestic exchange or market are valued at the official closing price or, if none, the last sales price. If no sale occurs on the principal exchange or market that day, a fair value price will be determined in accordance with the Fund’s Valuation Procedures.
Debt securities are valued at the evaluated bid price provided by an independent pricing service (e.g. taking into account various factors, including yields, maturities, or credit ratings) or, if a reliable price is not available, the quoted bid price from an independent broker-dealer.
Investments in registered open-end investment companies are valued at net asset value. Interests in non-registered investment companies that are redeemable at net asset value are fair valued normally at net asset value.
Investments which are not valued using any of the methods discussed above are valued at their fair value, as determined in good faith by the Board of Trustees. The Board of Trustees has established a Valuation Committee comprised of the Trustees and has delegated to it the authority to take any actions regarding the valuation of portfolio securities that the Valuation Committee deems necessary or appropriate, including determining the fair value of portfolio securities, unless the determination has been delegated to the Wells Fargo Asset Management Pricing Committee at Wells Fargo Funds Management, LLC (“Funds Management”). The Board of Trustees retains the authority to make or ratify any valuation decisions or approve any changes to the Valuation Procedures as it deems appropriate. On a quarterly basis, the Board of Trustees receives reports on any valuation actions taken by the Valuation Committee or the Wells Fargo Asset Management Pricing Committee which may include items for ratification.
Securities lending
The Fund may lend its securities from time to time in order to earn additional income in the form of fees or interest on securities received as collateral or the investment of any cash received as collateral. When securities are on loan, the Fund receives interest or dividends on those securities. Cash collateral received in connection with its securities lending transactions is invested in Securities Lending Cash Investments, LLC (the “Securities Lending Fund”). Investments in Securities Lending Fund are valued at the evaluated bid price provided by an independent pricing service. Income earned from investment in the Securities Lending Fund (net of fees and rebates), if any, is included in income from affiliated securities on the Statement of Operations.
In a securities lending transaction, the net asset value of the Fund is affected by an increase or decrease in the value of the securities loaned and by an increase or decrease in the value of the instrument in which collateral is invested. The amount of securities lending activity undertaken by the Fund fluctuates from time to time. The Fund has the right under the lending agreement to recover the securities from the borrower on demand. In the event of default or bankruptcy by the borrower, the Fund may be prevented from recovering the loaned securities or gaining access to the collateral or may experience delays or costs in doing so. In such an event, the terms of the agreement allow the unaffiliated securities lending agent to use the collateral to purchase replacement securities on behalf of the Fund or pay the Fund the market value of the loaned securities. The Fund bears the risk of loss with respect to depreciation of its investment of the cash collateral.
24 | Wells Fargo Disciplined U.S. Core Fund
Notes to financial statements (unaudited)
Futures contracts
Futures contracts are agreements between the Fund and a counterparty to buy or sell a specific amount of a commodity, financial instrument or currency at a specified price and on a specified date. The Fund may buy and sell futures contracts in order to gain exposure to, or protect against, changes in security values and is subject to equity price risk. The primary risks associated with the use of futures contracts are the imperfect correlation between changes in market values of securities held by the Fund and the prices of futures contracts, and the possibility of an illiquid market. Futures contracts are generally entered into on a regulated futures exchange and cleared through a clearinghouse associated with the exchange. With futures contracts, there is minimal counterparty risk to the Fund since futures contracts are exchange traded and the exchange’s clearinghouse, as the counterparty to all exchange traded futures, guarantees the futures contracts against default.
Upon entering into a futures contracts, the Fund is required to deposit either cash or securities (initial margin) with the broker in an amount equal to a certain percentage of the contract value. Subsequent payments (variation margin) are paid to or from the broker each day equal to the daily changes in the contract value. Such payments are recorded as unrealized gains or losses and, if any, shown as variation margin receivable (payable) in the Statement of Assets and Liabilities. Should the Fund fail to make requested variation margin payments, the broker can gain access to the initial margin to satisfy the Fund’s payment obligations. When the contracts are closed, a realized gain or loss is recorded in the Statement of Operations.
Security transactions and income recognition
Securities transactions are recorded on a trade date basis. Realized gains or losses are recorded on the basis of identified cost.
Dividend income is recognized on the ex-dividend date.
Interest income is accrued daily and bond discounts are accreted and premiums are amortized daily. To the extent debt obligations are placed on non-accrual status, any related interest income may be reduced by writing off interest receivables when the collection of all or a portion of interest has been determined to be doubtful based on consistently applied procedures and the fair value has decreased. If the issuer subsequently resumes interest payments or when the collectability of interest is reasonably assured, the debt obligation is removed from non-accrual status.
Distributions to shareholders
Distributions to shareholders from net investment income and any net realized gains are recorded on the ex-dividend date and paid at least annually. Such distributions are determined in accordance with income tax regulations and may differ from U.S. generally accepted accounting principles. Dividend sources are estimated at the time of declaration. The tax character of distributions is determined as of the Fund’s fiscal year end. Therefore, a portion of the Fund’s distributions made prior to the Fund’s fiscal year end may be categorized as a tax return of capital at year end.
Federal and other taxes
The Fund intends to continue to qualify as a regulated investment company by distributing substantially all of its investment company taxable income and any net realized capital gains (after reduction for capital loss carryforwards) sufficient to relieve it from all, or substantially all, federal income taxes. Accordingly, no provision for federal income taxes was required.
The Fund’s income and federal excise tax returns and all financial records supporting those returns for the prior three fiscal years are subject to examination by the federal and Delaware revenue authorities. Management has analyzed the Fund’s tax positions taken on federal, state, and foreign tax returns for all open tax years and does not believe that there are any uncertain tax positions that require recognition of a tax liability.
As of January 31, 2021, the aggregate cost of all investments for federal income tax purposes was $530,621,106 and the unrealized gains (losses) consisted of:
| Gross unrealized gains | $421,205,631 |
| Gross unrealized losses | (9,881,266) |
| Net unrealized gains | $411,324,365 |
Class allocations
The separate classes of shares offered by the Fund differ principally in applicable sales charges, distribution, shareholder servicing, and administration fees. Class specific expenses are charged directly to that share class. Investment income, common fund-level expenses, and realized and unrealized gains (losses) on investments are allocated daily to each class of shares based on the relative proportion of net assets of each class.
Wells Fargo Disciplined U.S. Core Fund | 25
Notes to financial statements (unaudited)
3. FAIR VALUATION MEASUREMENTS
Fair value measurements of investments are determined within a framework that has established a fair value hierarchy based upon the various data inputs utilized in determining the value of the Fund’s investments. The three-level hierarchy gives the highest priority to unadjusted quoted prices in active markets for identical assets or liabilities (Level 1) and the lowest priority to unobservable inputs (Level 3). The Fund’s investments are classified within the fair value hierarchy based on the lowest level of input that is significant to the fair value measurement. The inputs are summarized into three broad levels as follows:
| ■ | Level 1 – quoted prices in active markets for identical securities |
| ■ | Level 2 – other significant observable inputs (including quoted prices for similar securities, interest rates, prepayment speeds, credit risk, etc.) |
| ■ | Level 3 – significant unobservable inputs (including the Fund’s own assumptions in determining the fair value of investments) |
The inputs or methodologies used for valuing investments in securities are not necessarily an indication of the risk associated with investing in those securities.
The following is a summary of the inputs used in valuing the Fund’s assets and liabilities as of January 31, 2021:
| | Quoted prices
(Level 1) | Other significant
observable inputs
(Level 2) | Significant
unobservable inputs
(Level 3) | Total |
| Assets | | | | |
| Investments in: | | | | |
| Common stocks | | | | |
| Communication services | $ 96,968,737 | $0 | $0 | $ 96,968,737 |
| Consumer discretionary | 121,919,925 | 0 | 0 | 121,919,925 |
| Consumer staples | 53,064,548 | 0 | 0 | 53,064,548 |
| Energy | 20,538,297 | 0 | 0 | 20,538,297 |
| Financials | 100,645,817 | 0 | 0 | 100,645,817 |
| Health care | 133,154,945 | 0 | 0 | 133,154,945 |
| Industrials | 72,468,819 | 0 | 0 | 72,468,819 |
| Information technology | 266,936,642 | 0 | 0 | 266,936,642 |
| Materials | 23,235,673 | 0 | 0 | 23,235,673 |
| Real estate | 24,146,139 | 0 | 0 | 24,146,139 |
| Utilities | 19,768,406 | 0 | 0 | 19,768,406 |
| Short-term investments | | | | |
| Investment companies | 9,032,084 | 0 | 0 | 9,032,084 |
| | 941,880,032 | 0 | 0 | 941,880,032 |
| Futures contracts | 65,439 | 0 | 0 | 65,439 |
| Total assets | $941,945,471 | $0 | $0 | $941,945,471 |
Futures contracts are reported at their cumulative unrealized gains (losses) at measurement date as reported in the table following the Portfolio of Investments. For futures contracts, the current day’s variation margin is reported on the Statement of Assets and Liabilities. All other assets and liabilities are reported at their market value at measurement date.
Additional sector, industry or geographic detail, if any, is included in the Portfolio of Investments.
For the six months ended January 31, 2021, the Fund did not have any transfers into/out of Level 3.
4. TRANSACTIONS WITH AFFILIATES
Management fee
Funds Management, an indirect wholly owned subsidiary of Wells Fargo & Company (“Wells Fargo”), is the manager of the Fund and provides advisory and fund-level administrative services under an investment management agreement. Under the investment management agreement, Funds Management is responsible for, among other services, implementing the investment objectives and strategies of the Fund, supervising the subadviser and providing fund-level administrative services in
26 | Wells Fargo Disciplined U.S. Core Fund
Notes to financial statements (unaudited)
connection with the Fund’s operations. As compensation for its services under the investment management agreement, Funds Management is entitled to receive a management fee at the following annual rate based on the Fund’s average daily net assets:
| Average daily net assets | Management fee |
| First $1 billion | 0.350% |
| Next $4 billion | 0.325 |
| Next $5 billion | 0.290 |
| Over $10 billion | 0.280 |
For the six months ended January 31, 2021, the management fee was equivalent to an annual rate of 0.35% of the Fund’s average daily net assets.
Funds Management has retained the services of a subadviser to provide daily portfolio management to the Fund. The fee for subadvisory services is borne by Funds Management. Wells Capital Management Incorporated ("WellsCap"), an affiliate of Funds Management and an indirect wholly owned subsidiary of Wells Fargo, is the subadviser to the Fund and is entitled to receive a fee from Funds Management at an annual rate starting at 0.25% and declining to 0.15% as the average daily net assets of the Fund increase.
Administration fees
Under a class-level administration agreement, Funds Management provides class-level administrative services to the Fund, which includes paying fees and expenses for services provided by the transfer agent, sub-transfer agents, omnibus account servicers and record-keepers. As compensation for its services under the class-level administration agreement, Funds Management receives an annual fee which is calculated based on the average daily net assets of each class as follows:
| | Class-level
administration fee |
| Class A | 0.21% |
| Class C | 0.21 |
| Class R | 0.21 |
| Class R6 | 0.03 |
| Administrator Class | 0.13 |
| Institutional Class | 0.13 |
Waivers and/or expense reimbursements
Funds Management has contractually waived and/or reimbursed management and administration fees to the extent necessary to maintain certain net operating expense ratios for the Fund. When each class of the Fund has exceeded its expense cap, Funds Management has waived fees and/or reimbursed expenses from fund-level expenses on a proportionate basis and then from class specific expenses. When only certain classes exceed their expense caps, waivers and/or reimbursements are applied against class specific expenses before fund-level expenses. Funds Management has committed through November 30, 2021 to waive fees and/or reimburse expenses to the extent necessary to cap expenses. Prior to or after the commitment expiration date, the cap may be increased or the commitment to maintain the cap may be terminated only with the approval of the Board of Trustees. The expense caps are as follows:
| | Expense ratio caps |
| Class A | 0.87% |
| Class C | 1.62 |
| Class R | 1.12 |
| Class R6 | 0.43 |
| Administrator Class | 0.74 |
| Institutional Class | 0.48 |
Wells Fargo Disciplined U.S. Core Fund | 27
Notes to financial statements (unaudited)
Distribution fees
The Trust has adopted a distribution plan for Class C and Class R shares of the Fund pursuant to Rule 12b-1 under the 1940 Act. Distribution fees are charged to Class C and Class R shares and paid to Wells Fargo Funds Distributor, LLC (“Funds Distributor”), the principal underwriter, at an annual rate of 0.75% of the average daily net assets of Class C shares and 0.25% of the average daily net assets of Class R shares.
In addition, Funds Distributor is entitled to receive the front-end sales charge from the purchase of Class A shares and a contingent deferred sales charge on the redemption of certain Class A shares. Funds Distributor is also entitled to receive the contingent deferred sales charges from redemptions of Class C shares. For the six months ended January 31, 2021, Funds Distributor received $4,255 from the sale of Class A shares. No contingent deferred sales charges were incurred by Class A and Class C shares for the six months ended January 31, 2021.
Interfund transactions
The Fund may purchase or sell portfolio investment securities to certain other Wells Fargo affiliates pursuant to Rule 17a-7 under the 1940 Act and under procedures adopted by the Board of Trustees. The procedures have been designed to ensure that these interfund transactions, which do not incur broker commissions, are effected at current market prices.
5. INVESTMENT PORTFOLIO TRANSACTIONS
Purchases and sales of investments, excluding U.S. government obligations (if any) and short-term securities, for the six months ended January 31, 2021 were $163,449,622 and $235,545,356, respectively.
6. SECURITIES LENDING TRANSACTIONS
The Fund lends its securities through an unaffiliated securities lending agent and receives collateral in the form of cash or securities with a value at least equal to the value of the securities on loan. The value of the loaned securities is determined at the close of each business day and any increases or decreases in the required collateral are exchanged between the Fund and the counterparty on the next business day. Cash collateral received is invested in the Securities Lending Fund which seeks to provide a positive return compared to the daily Federal Funds Open Rate by investing in high-quality, U.S. dollar-denominated short-term money market instruments and is exempt from registration under Section 3(c)(7) of the 1940 Act. Securities Lending Fund is managed by Funds Management and is subadvised by WellsCap. Funds Management receives an advisory fee starting at 0.05% and declining to 0.01% as the average daily net assets of the Securities Lending Fund increase. All of the fees received by Funds Management are paid to WellsCap for its services as subadviser.
In the event of counterparty default or the failure of a borrower to return a loaned security, the Fund has the right to use the collateral to offset any losses incurred. As of January 31, 2021, the Fund did not have any securities on loan.
7. DERIVATIVE TRANSACTIONS
During the six months ended January 31, 2021, the Fund entered into futures contracts to gain market exposure. The Fund had an average notional amount of $17,067,397 in long futures contracts during the six months ended January 31, 2021.
The fair value, realized gains or losses and change in unrealized gains or losses, if any, on derivative instruments are reflected in the corresponding financial statement captions.
8. BANK BORROWINGS
The Trust (excluding the money market funds), Wells Fargo Master Trust and Wells Fargo Variable Trust are parties to a $350,000,000 revolving credit agreement whereby the Fund is permitted to use bank borrowings for temporary or emergency purposes, such as to fund shareholder redemption requests. Interest under the credit agreement is charged to the Fund based on a borrowing rate equal to the higher of the Federal Funds rate in effect on that day plus 1.25% or the overnight LIBOR rate in effect on that day plus 1.25%. In addition, an annual commitment fee equal to 0.25% of the unused balance is allocated to each participating fund.
For the six months ended January 31, 2021, there were no borrowings by the Fund under the agreement.
9. CONCENTRATION RISKS
Concentration risks result from exposure to a limited number of sectors. As of the end of the period, the Fund concentrated its portfolio in investments related to the information technology sector. A fund that invests a substantial portion of its assets in any sector may be more affected by changes in that sector than would be a fund whose investments are not heavily weighted in any sector.
28 | Wells Fargo Disciplined U.S. Core Fund
Notes to financial statements (unaudited)
10. INDEMNIFICATION
Under the Fund's organizational documents, the officers and Trustees have been granted certain indemnification rights against certain liabilities that may arise out of performance of their duties to the Fund. The Fund has entered into a separate agreement with each Trustee that converts indemnification rights currently existing under the Fund’s organizational documents into contractual rights that cannot be changed in the future without the consent of the Trustee. Additionally, in the normal course of business, the Fund may enter into contracts with service providers that contain a variety of indemnification clauses. The Fund’s maximum exposure under these arrangements is dependent on future claims that may be made against the Fund and, therefore, cannot be estimated.
11. NEW ACCOUNTING PRONOUNCEMENT
In August 2018, FASB issued Accounting Standards Update (“ASU”) No. 2018-13, Fair Value Measurement (Topic 820) Disclosure Framework - Changes to the Disclosure Requirements for Fair Value Measurement. ASU 2018-13 updates the disclosure requirements on fair value measurements in Topic 820, Fair Value Measurements. The amendments are effective for fiscal years, and interim periods within those fiscal years, beginning after December 15, 2019. Management has adopted this guidance which did not have a material impact on the financial statements.
12. CORONAVIRUS (COVID-19) PANDEMIC
On March 11, 2020, the World Health Organization announced that it had made the assessment that coronavirus disease 2019 (“COVID-19”) is a pandemic. The impacts of COVID-19 are affecting the entire global economy, individual companies and investment products, the funds, and the market in general. There is significant uncertainty around the extent and duration of business disruptions related to COVID-19 and the impacts may be short term or may last for an extended period of time. The risk of further spreading of COVID-19 has led to significant uncertainty and volatility in the financial markets.
13. SUBSEQUENT EVENT
On February 23, 2021, Wells Fargo announced that it has entered into a definitive agreement to sell Wells Fargo Asset Management (“WFAM”) to GTCR LLC and Reverence Capital Partners, L.P. WFAM is the trade name used by the asset management businesses of Wells Fargo and includes Wells Fargo Funds Management, LLC, the investment manager to the Fund, Wells Capital Management Incorporated and Wells Fargo Asset Management (International) Limited, both registered investment advisers providing sub-advisory services to certain funds, and Wells Fargo Funds Distributor, LLC, the Fund’s principal underwriter. As part of the transaction, Wells Fargo will own a 9.9% equity interest and will continue to serve as an important client and distribution partner.
Consummation of the transaction will result in the automatic termination of the Fund’s investment management agreement and sub-advisory agreement. The Fund’s Board of Trustees will be asked to approve new investment management arrangements with the new company. If approved by the Board, the new investment management arrangements with the new company will be presented to the shareholders of the Fund for approval, and, if approved by shareholders, would take effect upon the closing of the transaction. The transaction is expected to close in the second half of 2021, subject to customary closing conditions.
Wells Fargo Disciplined U.S. Core Fund | 29
Other information (unaudited)
PROXY VOTING INFORMATION
A description of the policies and procedures used to determine how to vote proxies relating to portfolio securities is available without charge, upon request, by calling 1-800-222-8222, visiting our website at wfam.com, or visiting the SEC website at sec.gov. Information regarding how the proxies related to portfolio securities were voted during the most recent 12-month period ended June 30 is available on the website at wfam.com or by visiting the SEC website at sec.gov.
QUARTERLY PORTFOLIO HOLDINGS INFORMATION
The Fund files its complete schedule of portfolio holdings with the SEC for the first and third quarters of each fiscal year as an exhibit to its reports on Form N-PORT. Shareholders may view the filed Form N-PORT by visiting the SEC website at sec.gov.
30 | Wells Fargo Disciplined U.S. Core Fund
Other information (unaudited)
BOARD OF TRUSTEES AND OFFICERS
Each of the Trustees and Officers listed in the table below acts in identical capacities for each fund in the Wells Fargo family of funds, which consists of 144 mutual funds comprising the Wells Fargo Funds Trust, Wells Fargo Variable Trust, Wells Fargo Master Trust and four closed-end funds (collectively the “Fund Complex”). This table should be read in conjunction with the Prospectus and the Statement of Additional Information1. The mailing address of each Trustee and Officer is 525 Market Street, 12th Floor, San Francisco, CA 94105. Each Trustee and Officer serves an indefinite term, however, each Trustee serves such term until reaching the mandatory retirement age established by the Trustees.
Independent Trustees
Name and
year of birth | Position held and
length of service* | Principal occupations during past five years or longer | Current other
public company or
investment
company
directorships |
William R. Ebsworth
(Born 1957) | Trustee,
since 2015 | Retired. From 1984 to 2013, equities analyst, portfolio manager, research director and chief investment officer at Fidelity Management and Research Company in Boston, Tokyo, and Hong Kong, and retired in 2013 as Chief Investment Officer of Fidelity Strategic Advisers, Inc. where he led a team of investment professionals managing client assets. Prior thereto, Board member of Hong Kong Securities Clearing Co., Hong Kong Options Clearing Corp., the Thailand International Fund, Ltd., Fidelity Investments Life Insurance Company, and Empire Fidelity Investments Life Insurance Company. Audit Committee Chair and Investment Committee Chair of the Vincent Memorial Hospital Endowment (non-profit organization). Mr. Ebsworth is a CFA® charterholder. | N/A |
Jane A. Freeman
(Born 1953) | Trustee,
since 2015;
Chair Liaison,
since 2018 | Retired. From 2012 to 2014 and 1999 to 2008, Chief Financial Officer of Scientific Learning Corporation. From 2008 to 2012, Ms. Freeman provided consulting services related to strategic business projects. Prior to 1999, Portfolio Manager at Rockefeller & Co. and Scudder, Stevens & Clark. Board member of the Harding Loevner Funds from 1996 to 2014, serving as both Lead Independent Director and chair of the Audit Committee. Board member of the Russell Exchange Traded Funds Trust from 2011 to 2012 and the chair of the Audit Committee. Ms. Freeman is also an inactive Chartered Financial Analyst. | N/A |
Isaiah Harris, Jr.
(Born 1952) | Trustee,
since 2009; Audit
Committee
Chair,
since 2019 | Retired. Chairman of the Board of CIGNA Corporation since 2009, and Director since 2005. From 2003 to 2011, Director of Deluxe Corporation. Prior thereto, President and CEO of BellSouth Advertising and Publishing Corp. from 2005 to 2007, President and CEO of BellSouth Enterprises from 2004 to 2005 and President of BellSouth Consumer Services from 2000 to 2003. Emeritus member of the Iowa State University Foundation Board of Governors. Emeritus Member of the Advisory Board of Iowa State University School of Business. Advisory Board Member, Palm Harbor Academy (private school). Mr. Harris is a certified public accountant (inactive status). | CIGNA Corporation |
Judith M. Johnson
(Born 1949) | Trustee,
since 2008 | Retired. Prior thereto, Chief Executive Officer and Chief Investment Officer of Minneapolis Employees Retirement Fund from 1996 to 2008. Ms. Johnson is an attorney, certified public accountant and a certified managerial accountant. | N/A |
David F. Larcker
(Born 1950) | Trustee,
since 2009 | James Irvin Miller Professor of Accounting at the Graduate School of Business (Emeritus), Stanford University, Director of the Corporate Governance Research Initiative and Senior Faculty of The Rock Center for Corporate Governance since 2006. From 2005 to 2008, Professor of Accounting at the Graduate School of Business, Stanford University. Prior thereto, Ernst & Young Professor of Accounting at The Wharton School, University of Pennsylvania from 1985 to 2005. | N/A |
Wells Fargo Disciplined U.S. Core Fund | 31
Other information (unaudited)
Name and
year of birth | Position held and
length of service* | Principal occupations during past five years or longer | Current other
public company or
investment
company
directorships |
Olivia S. Mitchell
(Born 1953) | Trustee,
since 2006;
Nominating and
Governance
Committee Chair,
since 2018 | International Foundation of Employee Benefit Plans Professor, Wharton School of the University of Pennsylvania since 1993. Director of Wharton’s Pension Research Council and Boettner Center on Pensions & Retirement Research, and Research Associate at the National Bureau of Economic Research. Previously, Cornell University Professor from 1978 to 1993. | N/A |
Timothy J. Penny
(Born 1951) | Trustee,
since 1996;
Chair,
since 2018 | President and Chief Executive Officer of Southern Minnesota Initiative Foundation, a non-profit organization, since 2007. Member of the Board of Trustees of NorthStar Education Finance, Inc., a non-profit organization, since 2007. | N/A |
James G. Polisson
(Born 1959) | Trustee,
since 2018 | Retired. Chief Marketing Officer, Source (ETF) UK Services, Ltd, from 2015 to 2017. From 2012 to 2015, Principal of The Polisson Group, LLC, a management consulting, corporate advisory and principal investing company. Chief Executive Officer and Managing Director at Russell Investments, Global Exchange Traded Funds from 2010 to 2012. Managing Director of Barclays Global Investors from 1998 to 2010 and Global Chief Marketing Officer for iShares and Barclays Global Investors from 2000 to 2010. Trustee of the San Francisco Mechanics’ Institute, a non-profit organization, from 2013 to 2015. Board member of the Russell Exchange Traded Fund Trust from 2011 to 2012. Director of Barclays Global Investors Holdings Deutschland GmbH from 2006 to 2009. Mr. Polisson is an attorney and has a retired status with the Massachusetts and District of Columbia Bar Associations. | N/A |
Pamela Wheelock
(Born 1959) | Trustee,
since January
2020; previously
Trustee from
January 2018 to
July 2019 | Board member of the Destination Medical Center Economic Development Agency, Rochester, Minnesota since 2019. Interim President of the McKnight Foundation from January to September 2020. Acting Commissioner, Minnesota Department of Human Services, July 2019 through September 2019. Human Services Manager (part-time), Minnesota Department of Human Services, October 2019 through December 2019. Chief Operating Officer, Twin Cities Habitat for Humanity from 2017 to 2019. Vice President of University Services, University of Minnesota from 2012 to 2016. Prior thereto, on the Board of Directors, Governance Committee and Finance Committee for the Minnesota Philanthropy Partners (Saint Paul Foundation) from 2012 to 2018, Interim Chief Executive Officer of Blue Cross Blue Shield of Minnesota from 2011 to 2012, Chairman of the Board from 2009 to 2012 and Board Director from 2003 to 2015. Vice President, Leadership and Community Engagement, Bush Foundation, Saint Paul, Minnesota (a private foundation) from 2009 to 2011. Executive Vice President and Chief Financial Officer, Minnesota Sports and Entertainment from 2004 to 2009 and Senior Vice President from 2002 to 2004. Executive Vice President of the Minnesota Wild Foundation from 2004 to 2008. Commissioner of Finance, State of Minnesota, from 1999 to 2002. Currently Board Chair of the Minnesota Wild Foundation since 2010. | N/A |
* Length of service dates reflect the Trustee’s commencement of service with the Trust’s predecessor entities, where applicable.
32 | Wells Fargo Disciplined U.S. Core Fund
Other information (unaudited)
Officers
Name and
year of birth | Position held and
length of service | Principal occupations during past five years or longer |
Andrew Owen
(Born 1960) | President,
since 2017 | Executive Vice President of Wells Fargo & Company and Head of Affiliated Managers, Wells Fargo Asset Management, since 2014. In addition, Mr. Owen is currently President, Chief Executive Officer and Director of Wells Fargo Funds Management, LLC since 2017. Prior thereto, Executive Vice President responsible for marketing, investments and product development for Wells Fargo Funds Management, LLC, from 2009 to 2014. |
Jeremy DePalma
(Born 1974) | Treasurer,
since 2012
(for certain funds in
the Fund Complex);
since 2021 (for
the remaining funds in the
Fund Complex) | Senior Vice President of Wells Fargo Funds Management, LLC since 2009. Senior Vice President of Evergreen Investment Management Company, LLC from 2008 to 2010 and head of the Fund Reporting and Control Team within Fund Administration from 2005 to 2010. |
Michelle Rhee
(Born 1966) | Chief Legal Officer,
since 2019 | Secretary of Wells Fargo Funds Management, LLC and Chief Legal Counsel of Wells Fargo Asset Management since 2018. Deputy General Counsel of Wells Fargo Bank, N.A. since 2020 and Assistant General Counsel of Wells Fargo Bank, N.A. from 2018 to 2020. Associate General Counsel and Managing Director of Bank of America Corporation from 2004 to 2018. |
Catherine Kennedy
(Born 1969) | Secretary,
since 2019 | Vice President of Wells Fargo Funds Management, LLC and Senior Counsel of the Wells Fargo Legal Department since 2010. Vice President and Senior Counsel of Evergreen Investment Management Company, LLC from 1998 to 2010. |
Michael H. Whitaker
(Born 1967) | Chief Compliance Officer,
since 2016 | Chief Compliance Officer of Wells Fargo Asset Management since 2016. Senior Vice President and Chief Compliance Officer for Fidelity Investments from 2007 to 2016. |
1 The Statement of Additional Information includes additional information about the Trustees and is available, without charge, upon request, by calling 1-800-222-8222 or by visiting the website at wfam.com.
Wells Fargo Disciplined U.S. Core Fund | 33
For more information
More information about Wells Fargo Funds is available free upon request. To obtain literature, please write, visit the Fund's website, or call:
Wells Fargo Funds
P.O. Box 219967
Kansas City, MO 64121-9967
Website: wfam.com
Individual investors: 1-800-222-8222
Retail investment professionals: 1-888-877-9275
Institutional investment professionals: 1-866-765-0778
This report and the financial statements contained herein are submitted for the general information of the shareholders of the Fund. If this report is used for promotional purposes, distribution of the report must be accompanied or preceded by a current prospectus. Before investing, please consider the investment objectives, risks, charges, and expenses of the investment. For a current prospectus and, if available, a summary prospectus, containing this information, call 1-800-222-8222 or visit the Fund’s website at wfam.com. Read the prospectus carefully before you invest or send money.
Wells Fargo Asset Management (WFAM) is the trade name for certain investment advisory/management firms owned by Wells Fargo & Company. These firms include but are not limited to Wells Capital Management Incorporated and Wells Fargo Funds Management, LLC. Certain products managed by WFAM entities are distributed by Wells Fargo Funds Distributor, LLC (a broker-dealer and Member FINRA).
This material is for general informational and educational purposes only and is NOT intended to provide investment advice or a recommendation of any kind— including a recommendation for any specific investment, strategy, or plan.
INVESTMENT PRODUCTS: NOT FDIC INSURED ■ NO BANK GUARANTEE ■ MAY LOSE VALUE
© 2021 Wells Fargo & Company. All rights reserved.
PAR-0221-00364 03-22
SA203/SAR203 01-21
Semi-Annual Report
January 31, 2021
Wells Fargo Endeavor Select Fund
Reduce clutter.
Save trees.
Sign up for electronic delivery of prospectuses and shareholder reports at wellsfargo.com/ advantagedelivery
The views expressed and any forward-looking statements are as of January 31, 2021, unless otherwise noted, and are those of the Fund's portfolio managers and/or Wells Fargo Asset Management. Discussions of individual securities or the markets generally are not intended as individual recommendations. Future events or results may vary significantly from those expressed in any forward-looking statements. The views expressed are subject to change at any time in response to changing circumstances in the market. Wells Fargo Asset Management and the Fund disclaim any obligation to publicly update or revise any views expressed or forward-looking statements.
INVESTMENT PRODUCTS: NOT FDIC INSURED ■ NO BANK GUARANTEE ■ MAY LOSE VALUE
Wells Fargo Endeavor Select Fund | 1
Letter to shareholders (unaudited)
Dear Shareholder:
We are pleased to offer you this semi-annual report for the Wells Fargo Endeavor Select Fund for the six-month period that ended January 31, 2021. Despite a deeply challenging year, dominated by the spread of COVID-19 cases and a sharp drop in economic output throughout much of the world, global stocks performed extremely well, benefiting from ongoing central bank support and rising optimism over the development and distribution of effective COVID-19 vaccines. Bonds also had positive returns, led by global bonds and high-yield bonds.
For the six-month period, U.S. stocks, based on the S&P 500 Index1, gained 14.47%. International stocks, as measured by the MSCI ACWI ex USA Index (Net)2, returned 19.28%, while the MSCI EM Index (Net)3, had stronger performance, with a 24.07% gain. Among bond indexes, the Bloomberg Barclays U.S. Aggregate Bond Index4 returned -0.91%, the Bloomberg Barclays Global Aggregate ex-USD Index (unhedged)5 gained 3.71%, and the Bloomberg Barclays Municipal Bond Index6 returned 2.01% while the ICE BofA U.S. High Yield Index7 returned 6.82%.
The stock market rally continued in August.
The stock market continued a months-long rally in August despite concerns over rising numbers of U.S. and European COVID-19 cases. Relatively strong second-quarter earnings boosted investor sentiment along with the U.S. Federal Reserve’s announcement of a monetary policy shift expected to support longer-term low interest rates. U.S. manufacturing and services activity indexes beat expectations, while the U.S. housing market maintained strength. In Europe, retail sales expanded and consumer confidence was steady. China’s economy continued to expand.
Stocks grew more volatile in September on mixed economic data. U.S. economic activity continued to grow. However, U.S. unemployment remained elevated at 7.9% in September. With U.S. Congress delaying further fiscal relief and uncertainties surrounding a possible vaccine, doubts crept back into the financial markets. In the U.K., a lack of progress in Brexit talks weighed on markets. China’s economy picked up steam, fueled by increased global demand.
Andrew Owen
President
Wells Fargo Funds
“The stock market continued a months-long rally in August despite concerns over rising numbers of U.S. and European COVID-19 cases.”
| 1 | The S&P 500 Index consists of 500 stocks chosen for market size, liquidity, and industry group representation. It is a market-value-weighted index with each stock's weight in the index proportionate to its market value. You cannot invest directly in an index. |
| 2 | The Morgan Stanley Capital International (MSCI) All Country World Index (ACWI) ex USA Index (Net) is a free-float-adjusted market-capitalization-weighted index that is designed to measure the equity market performance of developed and emerging markets, excluding the United States. Source: MSCI. MSCI makes no express or implied warranties or representations and shall have no liability whatsoever with respect to any MSCI data contained herein. The MSCI data may not be further redistributed or used as a basis for other indices or any securities or financial products. This report is not approved, reviewed, or produced by MSCI. You cannot invest directly in an index. |
| 1 | The S&P 500 Index consists of 500 stocks chosen for market size, liquidity, and industry group representation. It is a market-value-weighted index with each stock's weight in the index proportionate to its market value. You cannot invest directly in an index. |
| 3 | The MSCI Emerging Markets (EM) Index (Net) is a free-float-adjusted market-capitalization-weighted index that is designed to measure equity market performance of emerging markets. You cannot invest directly in an index. |
| 1 | The S&P 500 Index consists of 500 stocks chosen for market size, liquidity, and industry group representation. It is a market-value-weighted index with each stock's weight in the index proportionate to its market value. You cannot invest directly in an index. |
| 4 | The Bloomberg Barclays U.S. Aggregate Bond Index is a broad-based benchmark that measures the investment-grade, U.S. dollar-denominated, fixed-rate taxable bond market, including Treasuries, government-related and corporate securities, mortgage-backed securities (agency fixed-rate and hybrid adjustable-rate mortgage pass-throughs), asset-backed securities, and commercial mortgage-backed securities. You cannot invest directly in an index. |
| 1 | The S&P 500 Index consists of 500 stocks chosen for market size, liquidity, and industry group representation. It is a market-value-weighted index with each stock's weight in the index proportionate to its market value. You cannot invest directly in an index. |
| 5 | The Bloomberg Barclays Global Aggregate ex-USD Index (unhedged) is an unmanaged index that provides a broad-based measure of the global investment-grade fixed-income markets excluding the U.S. dollar-denominated debt market. You cannot invest directly in an index. |
| 1 | The S&P 500 Index consists of 500 stocks chosen for market size, liquidity, and industry group representation. It is a market-value-weighted index with each stock's weight in the index proportionate to its market value. You cannot invest directly in an index. |
| 6 | The Bloomberg Barclays Municipal Bond Index is an unmanaged index composed of long-term tax-exempt bonds with a minimum credit rating of Baa. You cannot invest directly in an index. |
| 1 | The S&P 500 Index consists of 500 stocks chosen for market size, liquidity, and industry group representation. It is a market-value-weighted index with each stock's weight in the index proportionate to its market value. You cannot invest directly in an index. |
| 7 | The ICE BofA U.S. High Yield Index is a market-capitalization-weighted index of domestic and Yankee high-yield bonds. The index tracks the performance of high-yield securities traded in the U.S. bond market. You cannot invest directly in an index. Copyright 2021. ICE Data Indices, LLC. All rights reserved. |
2 | Wells Fargo Endeavor Select Fund
Letter to shareholders (unaudited)
In October, capital markets stepped back from their six-month rally. Market volatility rose in advance of the U.S. election and amid a global increase in COVID-19 infections. Europe introduced tighter restrictions affecting economic activity. U.S. markets looked favorably at the prospect of Democratic control of the federal purse strings, which could lead to additional fiscal stimulus and a boost to economic activity. Meanwhile, China reported 4.9% third-quarter GDP growth.
Global stocks rallied in November, propelled by optimism over three promising COVID-19 vaccines. Reversing recent trends, value stocks outperformed growth stocks and cyclical stocks outpaced technology stocks. However, U.S. unemployment remained elevated, with a net job loss of 10 million since February. The eurozone services purchasing managers’ index contracted sharply while the region’s manufacturing activity grew. The U.S. election results added to the upbeat mood as investors anticipated more consistent policies in the new administration.
Financial markets ended the year with strength on high expectations for a rapid rollout of the COVID-19 vaccines, the successful passage of a $900 billion stimulus package, and rising expectations of additional economic support from a Democratic-led Congress. U.S. economic data were mixed with still-elevated unemployment and weak retail sales but growth in manufacturing output. In contrast, China’s economic expansion continued in both manufacturing and nonmanufacturing. U.S. COVID-19 infection rates continued to rise even as new state and local lockdown measures were implemented.
The year 2021 began with emerging market stocks leading all major asset classes in January, driven by China’s strong economic growth and a broad recovery in corporate earnings, which propelled China’s stock market higher. In the United States, positive news on vaccine trials and January expansion in both the manufacturing and services sectors was offset by a weak December monthly jobs report. This was compounded by technical factors as some hedge funds were forced to sell stocks to protect themselves against a well-publicized short squeeze coordinated by a group of retail investors. Eurozone sentiment and economic growth were particularly weak, reflecting the impact of a new lockdown with stricter social distancing along with a slow vaccine rollout.
Don’t let short-term uncertainty derail long-term investment goals.
Periods of investment uncertainty can present challenges, but experience has taught us that maintaining long-term investment goals can be an effective way to plan for the future. To help you create a sound strategy based on your personal goals and risk tolerance, Wells Fargo Funds offers more than 100 mutual funds spanning a wide range of asset classes and investment styles. Although diversification cannot guarantee an investment profit or prevent losses, we believe it can be an effective way to manage investment risk and potentially smooth out overall portfolio performance. We encourage investors to know their investments and to understand that appropriate levels of risk-taking may unlock opportunities.
Thank you for choosing to invest with Wells Fargo Funds. We appreciate your confidence in us and remain committed to helping you meet your financial needs.
Sincerely,
Andrew Owen
President
Wells Fargo Funds
“Global stocks rallied in November, propelled by optimism over three promising COVID-19 vaccines.”
For further information about your Fund, contact your investment professional, visit our website at wfam.com, or call us directly at 1-800-222-8222.
Wells Fargo Endeavor Select Fund | 3
Performance highlights (unaudited)
Investment objective
The Fund seeks long-term capital appreciation.
Manager
Wells Fargo Funds Management, LLC
Subadviser
Wells Capital Management Incorporated
Portfolio managers
Michael T. Smith, CFA®‡
Christopher J. Warner, CFA®‡
Average annual total returns (%) as of January 31, 2021
| | | Including sales charge | | Excluding sales charge | | Expense ratios1 (%) |
| | Inception date | 1 year | 5 year | 10 year | | 1 year | 5 year | 10 year | | Gross | Net 2 |
| Class A (STAEX) | 12-29-2000 | 22.37 | 21.15 | 14.87 | | 29.79 | 22.60 | 15.55 | | 1.26 | 1.03 |
| Class C (WECCX) | 12-29-2000 | 27.94 | 21.66 | 14.68 | | 28.94 | 21.66 | 14.68 | | 2.01 | 1.78 |
| Class R6 (WECRX)3 | 9-20-2019 | – | – | – | | 30.40 | 23.11 | 16.04 | | 0.83 | 0.60 |
| Administrator Class (WECDX) | 4-8-2005 | – | – | – | | 30.24 | 22.86 | 15.82 | | 1.18 | 0.94 |
| Institutional Class (WFCIX) | 4-8-2005 | – | – | – | | 30.23 | 23.05 | 16.01 | | 0.93 | 0.70 |
| Russell 1000® Growth Index4 | – | – | – | – | | 34.46 | 22.22 | 16.83 | | – | – |
Figures quoted represent past performance, which is no guarantee of future results, and do not reflect taxes that a shareholder may pay on an investment in a fund. Investment return and principal value of an investment will fluctuate so that an investor’s shares, when redeemed, may be worth more or less than their original cost. Performance shown without sales charges would be lower if sales charges were reflected. Current performance may be lower or higher than the performance data quoted, which assumes the reinvestment of dividends and capital gains. Current month-end performance is available on the Fund’s website, wfam.com.
Please keep in mind that high double-digit returns were primarily achieved during favorable market conditions. You should not expect that such favorable returns can be consistently achieved. A fund’s performance, especially for short time periods, should not be the sole factor in making your investment decision.
Index returns do not include transaction costs associated with buying and selling securities, any mutual fund fees or expenses, or any taxes. It is not possible to invest directly in an index.
For Class A shares, the maximum front-end sales charge is 5.75%. For Class C shares, the maximum contingent deferred sales charge is 1.00%. Performance including a contingent deferred sales charge assumes the sales charge for the corresponding time period. Class R, Adminitrator Class, and Institutional Class shares are sold without a front-end sales charge or contingent deferred sales charge.
Stock values fluctuate in response to the activities of individual companies and general market and economic conditions. Certain investment strategies tend to increase the total risk of an investment (relative to the broader market). The Fund is exposed to foreign investment risk and smaller-company securities risk. Consult the Fund’s prospectus for additional information on these and other risks.
Please see footnotes on page 5.
4 | Wells Fargo Endeavor Select Fund
Performance highlights (unaudited)
| Ten largest holdings (%) as of January 31, 20215 |
| Microsoft Corporation | 9.74 |
| Amazon.com Incorporated | 9.57 |
| Alphabet Incorporated Class A | 5.98 |
| PayPal Holdings Incorporated | 4.19 |
| Visa Incorporated Class A | 4.18 |
| UnitedHealth Group Incorporated | 3.72 |
| ServiceNow Incorporated | 3.68 |
| MercadoLibre Incorporated | 3.47 |
| The Home Depot Incorporated | 2.91 |
| The Sherwin-Williams Company | 2.78 |
| Sector allocation as of January 31, 20216 |
| ‡ | CFA® and Chartered Financial Analyst® are trademarks owned by CFA Institute. |
| 1 | Reflects the expense ratios as stated in the most recent prospectuses. The expense ratios shown are subject to change and may differ from the annualized expense ratios shown in the financial highlights of this report. |
| 2 | The manager has contractually committed through November 30, 2021, to waive fees and/or reimburse expenses to the extent necessary to cap total annual fund operating expenses after fee waivers at 1.03% for Class A, 1.78% for Class C, 0.60% for Class R6, 0.94% for Administrator Class, and 0.70% for Institutional Class. Brokerage commissions, stamp duty fees, interest, taxes, acquired fund fees and expenses (if any), and extraordinary expenses are excluded from the expense caps. Prior to or after the commitment expiration date, the caps may be increased or the commitment to maintain the caps may be terminated only with the approval of the Board of Trustees. Without these caps, the Fund’s returns would have been lower. The expense ratio paid by an investor is the net expense ratio (the total annual fund operating expenses after fee waivers) as stated in the prospectuses. |
| 3 | Historical performance shown for the Class R6 shares prior to their inception reflects the performance of the Institutional Class shares, and is not adjusted to reflect the Class R6 expenses. If these expenses had been included, returns for the Class R6 would be higher. |
| 4 | The Russell 1000® Growth Index measures the performance of those Russell 1000 companies with higher price/book ratios and higher forecasted growth values. You cannot invest directly in an index. |
| 5 | Figures represent the percentage of the Fund's net assets. Holdings are subject to change and may have changed since the date specified. |
| 6 | Figures represent the percentage of the Fund's long-term investments. These amounts are subject to change and may have changed since the date specified. |
Wells Fargo Endeavor Select Fund | 5
Fund expenses (unaudited)
As a shareholder of the Fund, you incur two types of costs: (1) transaction costs, including sales charges (loads) on purchase payments and contingent deferred sales charges (if any) on redemptions and (2) ongoing costs, including management fees, distribution (12b-1) and/or shareholder servicing fees, and other Fund expenses. This example is intended to help you understand your ongoing costs (in dollars) of investing in the Fund and to compare these costs with the ongoing costs of investing in other mutual funds.
The example is based on an investment of $1,000 invested at the beginning of the six-month period and held for the entire period from August 1, 2020 to January 31, 2021.
Actual expenses
The “Actual” line of the table below provides information about actual account values and actual expenses. You may use the information in this line, together with the amount you invested, to estimate the expenses that you paid over the period. Simply divide your account value by $1,000 (for example, an $8,600 account value divided by $1,000 = 8.6), then multiply the result by the number in the “Actual” line under the heading entitled “Expenses paid during period” for your applicable class of shares to estimate the expenses you paid on your account during this period.
Hypothetical example for comparison purposes
The “Hypothetical” line of the table below provides information about hypothetical account values and hypothetical expenses based on the Fund’s actual expense ratio and an assumed rate of return of 5% per year before expenses, which is not the Fund’s actual return. The hypothetical account values and expenses may not be used to estimate the actual ending account balance or expenses you paid for the period. You may use this information to compare the ongoing costs of investing in the Fund and other funds. To do so, compare this 5% hypothetical example with the 5% hypothetical examples that appear in the shareholder reports of the other funds.
Please note that the expenses shown in the table are meant to highlight your ongoing costs only and do not reflect any transactional costs, such as sales charges (loads) and contingent deferred sales charges. Therefore, the “Hypothetical” line of the table is useful in comparing ongoing costs only and will not help you determine the relative total costs of owning different funds. In addition, if these transactional costs were included, your costs would have been higher
| | Beginning
account value
8-1-2020 | Ending
account value
1-31-2021 | Expenses
paid during
the period1 | Annualized net
expense ratio |
| Class A | | | | |
| Actual | $1,000.00 | $1,134.67 | $5.43 | 1.01% |
| Hypothetical (5% return before expenses) | $1,000.00 | $1,020.11 | $5.14 | 1.01% |
| Class C | | | | |
| Actual | $1,000.00 | $1,130.10 | $9.56 | 1.78% |
| Hypothetical (5% return before expenses) | $1,000.00 | $1,016.23 | $9.05 | 1.78% |
| Class R6 | | | | |
| Actual | $1,000.00 | $1,137.74 | $3.23 | 0.60% |
| Hypothetical (5% return before expenses) | $1,000.00 | $1,022.18 | $3.06 | 0.60% |
| Administrator Class | | | | |
| Actual | $1,000.00 | $1,137.47 | $5.06 | 0.94% |
| Hypothetical (5% return before expenses) | $1,000.00 | $1,020.47 | $4.79 | 0.94% |
| Institutional Class | | | | |
| Actual | $1,000.00 | $1,136.04 | $3.77 | 0.70% |
| Hypothetical (5% return before expenses) | $1,000.00 | $1,021.68 | $3.57 | 0.70% |
1 Expenses paid is equal to the annualized net expense ratio of each class multiplied by the average account value over the period, multiplied by the number of days in the most recent fiscal half-year divided by the number of days in the fiscal year (to reflect the one-half-year period).
6 | Wells Fargo Endeavor Select Fund
Portfolio of investments—January 31, 2021 (unaudited)
| | | | | Shares | Value |
| Common stocks: 99.06% | | | | | |
| Communication services: 11.16% | | | | | |
| Entertainment: 2.55% | | | | | |
| Netflix Incorporated † | | | | 13,400 | $ 7,134,026 |
| Interactive media & services: 6.67% | | | | | |
| Alphabet Incorporated Class A † | | | | 9,157 | 16,733,136 |
| Alphabet Incorporated Class C † | | | | 1,050 | 1,927,527 |
| | | | | | 18,660,663 |
| Media: 1.94% | | | | | |
| Match Group Incorporated † | | | | 38,886 | 5,438,596 |
| Consumer discretionary: 21.73% | | | | | |
| Auto components: 1.82% | | | | | |
| Aptiv plc | | | | 38,150 | 5,096,840 |
| Automobiles: 1.47% | | | | | |
| Ferrari NV | | | | 19,800 | 4,121,964 |
| Hotels, restaurants & leisure: 2.49% | | | | | |
| Chipotle Mexican Grill Incorporated † | | | | 4,700 | 6,956,000 |
| Internet & direct marketing retail: 13.04% | | | | | |
| Amazon.com Incorporated † | | | | 8,358 | 26,797,420 |
| MercadoLibre Incorporated † | | | | 5,450 | 9,698,330 |
| | | | | | 36,495,750 |
| Specialty retail: 2.91% | | | | | |
| The Home Depot Incorporated | | | | 30,116 | 8,156,015 |
| Financials: 4.63% | | | | | |
| Capital markets: 4.63% | | | | | |
| Intercontinental Exchange Incorporated | | | | 67,590 | 7,458,557 |
| S&P Global Incorporated | | | | 17,341 | 5,497,097 |
| | | | | | 12,955,654 |
| Health care: 14.07% | | | | | |
| Biotechnology: 1.85% | | | | | |
| Exact Sciences Corporation † | | | | 37,800 | 5,184,648 |
| Health care equipment & supplies: 8.50% | | | | | |
| Alcon Incorporated † | | | | 86,750 | 6,220,843 |
| DexCom Incorporated † | | | | 17,550 | 6,578,618 |
| Edwards Lifesciences Corporation † | | | | 52,150 | 4,306,547 |
| Intuitive Surgical Incorporated † | | | | 8,950 | 6,691,378 |
| | | | | | 23,797,386 |
| Health care providers & services: 3.72% | | | | | |
| UnitedHealth Group Incorporated | | | | 31,247 | 10,423,374 |
The accompanying notes are an integral part of these financial statements.
Wells Fargo Endeavor Select Fund | 7
Portfolio of investments—January 31, 2021 (unaudited)
| | | | | Shares | Value |
| Industrials: 6.69% | | | | | |
| Air freight & logistics: 1.75% | | | | | |
| United Parcel Service Incorporated Class B | | | | 31,700 | $ 4,913,500 |
| Commercial services & supplies: 2.49% | | | | | |
| Waste Connections Incorporated | | | | 70,840 | 6,978,448 |
| Road & rail: 2.45% | | | | | |
| Union Pacific Corporation | | | | 34,700 | 6,852,209 |
| Information technology: 34.46% | | | | | |
| Communications equipment: 1.53% | | | | | |
| Motorola Solutions Incorporated | | | | 25,600 | 4,289,280 |
| IT services: 13.59% | | | | | |
| Fiserv Incorporated † | | | | 66,794 | 6,859,076 |
| MongoDB Incorporated † | | | | 21,000 | 7,761,810 |
| PayPal Holdings Incorporated † | | | | 50,100 | 11,738,931 |
| Visa Incorporated Class A | | | | 60,528 | 11,697,036 |
| | | | | | 38,056,853 |
| Software: 19.34% | | | | | |
| Atlassian Corporation plc Class A † | | | | 27,800 | 6,425,414 |
| Autodesk Incorporated † | | | | 22,000 | 6,103,460 |
| Microsoft Corporation | | | | 117,581 | 27,274,087 |
| ServiceNow Incorporated † | | | | 18,980 | 10,309,177 |
| Unity Software Incorporated †« | | | | 26,916 | 4,032,555 |
| | | | | | 54,144,693 |
| Materials: 4.68% | | | | | |
| Chemicals: 4.68% | | | | | |
| Air Products & Chemicals Incorporated | | | | 19,900 | 5,308,524 |
| The Sherwin-Williams Company | | | | 11,250 | 7,782,750 |
| | | | | | 13,091,274 |
| Real estate: 1.64% | | | | | |
| Equity REITs: 1.64% | | | | | |
| SBA Communications Corporation | | | | 17,100 | 4,594,257 |
| Total Common stocks (Cost $115,087,481) | | | | | 277,341,430 |
| | | Yield | | | |
| Short-term investments: 2.26% | | | | | |
| Investment companies: 2.26% | | | | | |
| Securities Lending Cash Investments LLC ♠∩∞ | | 0.10% | | 4,205,250 | 4,205,250 |
| Wells Fargo Government Money Market Fund Select Class ♠∞ | | 0.03 | | 2,115,431 | 2,115,431 |
| Total Short-term investments (Cost $6,320,681) | | | | | 6,320,681 |
| Total investments in securities (Cost $121,408,162) | 101.32% | | | | 283,662,111 |
| Other assets and liabilities, net | (1.32) | | | | (3,686,556) |
| Total net assets | 100.00% | | | | $279,975,555 |
The accompanying notes are an integral part of these financial statements.
8 | Wells Fargo Endeavor Select Fund
Portfolio of investments—January 31, 2021 (unaudited)
| † | Non-income-earning security |
| « | All or a portion of this security is on loan. |
| ♠ | The issuer of the security is an affiliated person of the Fund as defined in the Investment Company Act of 1940. |
| ∩ | The investment is a non-registered investment company purchased with cash collateral received from securities on loan. |
| ∞ | The rate represents the 7-day annualized yield at period end. |
| Abbreviations: |
| REIT | Real estate investment trust |
Investments in affiliates
An affiliated investment is an investment in which the Fund owns at least 5% of the outstanding voting shares of the issuer or as a result of other relationships, such as the Fund and the issuer having the same investment manager. Transactions with issuers that were either affiliated persons of the Fund at the beginning of the period or the end of the period were as follows:
| | Value,
beginning of
period | Purchases | Sales
proceeds | Net
realized
gains
(losses) | | Net
change in
unrealized
gains
(losses) | | Value,
end of
period | | % of
net
assets | Shares,
end
of period | Income
from
affiliated
securities |
| Short-term investments | | | | | | | | | | | | |
| Investment companies | | | | | | | | | | | | |
| Securities Lending Cash Investments LLC | $ 0 | $15,725,735 | $(11,520,485) | $0 | | $0 | | $ 4,205,250 | | | 4,205,250 | $ 1,382# |
| Wells Fargo Government Money Market Fund Select Class | 12,402,416 | 23,058,368 | (33,345,353) | 0 | | 0 | | 2,115,431 | | | 2,115,431 | 683 |
| | | | | $0 | | $0 | | $6,320,681 | | 2.26% | | $2,065 |
| # | Amount shown represents income before fees and rebates. |
The accompanying notes are an integral part of these financial statements.
Wells Fargo Endeavor Select Fund | 9
Statement of assets and liabilities—January 31, 2021 (unaudited)
| | |
| Assets | |
Investments in unaffiliated securities (including $4,116,606 of securities loaned), at value (cost $115,087,481)
| $ 277,341,430 |
Investments in affiliated securites, at value (cost $6,320,681)
| 6,320,681 |
Receivable for investments sold
| 950,894 |
Receivable for Fund shares sold
| 409,602 |
Receivable for dividends
| 35,195 |
Receivable for securities lending income, net
| 1,777 |
Prepaid expenses and other assets
| 133,488 |
Total assets
| 285,193,067 |
| Liabilities | |
Payable upon receipt of securities loaned
| 4,205,250 |
Payable for Fund shares redeemed
| 533,610 |
Payable for investments purchased
| 266,679 |
Management fee payable
| 119,452 |
Administration fees payable
| 37,620 |
Distribution fee payable
| 3,872 |
Trustees’ fees and expenses payable
| 2,640 |
Accrued expenses and other liabilities
| 48,389 |
Total liabilities
| 5,217,512 |
Total net assets
| $279,975,555 |
| Net assets consist of | |
Paid-in capital
| $ 107,839,822 |
Total distributable earnings
| 172,135,733 |
Total net assets
| $279,975,555 |
| Computation of net asset value and offering price per share | |
Net assets – Class A
| $ 129,876,790 |
Shares outstanding – Class A1
| 12,940,474 |
Net asset value per share – Class A
| $10.04 |
Maximum offering price per share – Class A2
| $10.65 |
Net assets – Class C
| $ 5,932,758 |
Shares outstanding – Class C1
| 1,190,961 |
Net asset value per share – Class C
| $4.98 |
Net assets – Class R6
| $ 41,129,810 |
Shares outstanding – Class R61
| 3,411,528 |
Net asset value per share – Class R6
| $12.06 |
Net assets – Administrator Class
| $ 10,677,665 |
Shares outstanding – Administrator Class1
| 949,080 |
Net asset value per share – Administrator Class
| $11.25 |
Net assets – Institutional Class
| $ 92,358,532 |
Shares outstanding – Institutional Class1
| 7,675,555 |
Net asset value per share – Institutional Class
| $12.03 |
| 1 | The Fund has an unlimited number of authorized shares. |
| 2 | Maximum offering price is computed as 100/94.25 of net asset value. On investments of $50,000 or more, the offering price is reduced. |
The accompanying notes are an integral part of these financial statements.
10 | Wells Fargo Endeavor Select Fund
Statement of operations—six months ended January 31, 2021 (unaudited)
| | |
| Investment income | |
Dividends (net of foreign withholdings taxes of $6,632)
| $ 740,220 |
Income from affiliated securities
| 6,107 |
Total investment income
| 746,327 |
| Expenses | |
Management fee
| 976,157 |
| Administration fees | |
Class A
| 134,462 |
Class C
| 6,744 |
Class R6
| 6,722 |
Administrator Class
| 6,507 |
Institutional Class
| 58,238 |
| Shareholder servicing fees | |
Class A
| 160,074 |
Class C
| 8,028 |
Administrator Class
| 12,513 |
| Distribution fee | |
Class C
| 24,085 |
Custody and accounting fees
| 9,936 |
Professional fees
| 23,337 |
Registration fees
| 48,635 |
Shareholder report expenses
| 25,899 |
Trustees’ fees and expenses
| 9,707 |
Other fees and expenses
| 12,753 |
Total expenses
| 1,523,797 |
| Less: Fee waivers and/or expense reimbursements | |
Fund-level
| (311,564) |
Class A
| (12,477) |
Administrator Class
| (500) |
Net expenses
| 1,199,256 |
Net investment loss
| (452,929) |
| Realized and unrealized gains (losses) on investments | |
Net realized gains on investments
| 16,812,563 |
Net change in unrealized gains (losses) on investments
| 18,632,662 |
Net realized and unrealized gains (losses) on investments
| 35,445,225 |
Net increase in net assets resulting from operations
| 34,992,296 |
The accompanying notes are an integral part of these financial statements.
Wells Fargo Endeavor Select Fund | 11
Statement of changes in net assets
| | |
| | Six months ended
January 31, 2021
(unaudited) | Year ended
July 31, 2020 |
| Operations | | | | |
Net investment loss
| | $ (452,929) | | $ (247,318) |
Net realized gains on investments
| | 16,812,563 | | 18,984,175 |
Net change in unrealized gains (losses) on investments
| | 18,632,662 | | 39,967,714 |
Net increase in net assets resulting from operations
| | 34,992,296 | | 58,704,571 |
| Distributions to shareholders from | | | | |
| Net investment income and net realized gains | | | | |
Class A
| | (10,518,393) | | (9,193,804) |
Class C
| | (883,514) | | (639,884) |
Class R6
| | (2,734,798) | | (3,817,296) 1 |
Administrator Class
| | (764,611) | | (594,711) |
Institutional Class
| | (6,195,904) | | (5,072,891) |
Total distributions to shareholders
| | (21,097,220) | | (19,318,586) |
| Capital share transactions | Shares | | Shares | |
| Proceeds from shares sold | | | | |
Class A
| 611,886 | 6,242,989 | 2,464,894 | 20,299,260 |
Class C
| 98,313 | 517,454 | 659,230 | 2,859,235 |
Class R6
| 403,210 | 4,740,428 | 6,365,048 1 | 60,326,316 1 |
Administrator Class
| 140,387 | 1,575,292 | 256,326 | 2,382,284 |
Institutional Class
| 697,768 | 8,303,242 | 4,348,587 | 41,589,495 |
| | | 21,379,405 | | 127,456,590 |
| Reinvestment of distributions | | | | |
Class A
| 1,050,716 | 10,276,001 | 1,136,944 | 8,970,487 |
Class C
| 181,793 | 883,514 | 145,449 | 621,069 |
Class R6
| 232,545 | 2,730,078 | 410,012 1 | 3,813,107 1 |
Administrator Class
| 69,407 | 760,704 | 67,574 | 590,592 |
Institutional Class
| 527,036 | 6,176,862 | 543,524 | 5,054,778 |
| | | 20,827,159 | | 19,050,033 |
| Payment for shares redeemed | | | | |
Class A
| (1,646,675) | (16,607,380) | (2,755,225) | (22,584,078) |
Class C
| (373,507) | (2,049,922) | (362,899) | (1,634,876) |
Class R6
| (1,483,713) | (17,256,242) | (2,770,957) 1 | (26,106,890) 1 |
Administrator Class
| (103,055) | (1,149,259) | (304,554) | (2,668,949) |
Institutional Class
| (1,157,818) | (13,806,121) | (9,604,487) | (91,582,332) |
| | | (50,868,924) | | (144,577,125) |
| Net asset value of shares issued in acquisition | | | | |
Class A
| 0 | 0 | 9,924,795 | 82,228,406 |
Class C
| 0 | 0 | 406,964 | 1,963,250 |
Class R6
| 0 | 0 | 255,383 1 | 2,459,686 1 |
Administrator Class
| 0 | 0 | 539,878 | 4,913,234 |
Institutional Class
| 0 | 0 | 1,198,969 | 11,547,626 |
| | | 0 | | 103,112,202 |
Net increase (decrease) in net assets resulting from capital share transactions
| | (8,662,360) | | 105,041,700 |
Total increase in net assets
| | 5,232,716 | | 144,427,685 |
| Net assets | | | | |
Beginning of period
| | 274,742,839 | | 130,315,154 |
End of period
| | $279,975,555 | | $ 274,742,839 |
| 1 | For the period from September 20, 2019 (commencement of class operations) to July 31, 2020 |
The accompanying notes are an integral part of these financial statements.
12 | Wells Fargo Endeavor Select Fund
Financial highlights
(For a share outstanding throughout each period)
| | | Year ended July 31 |
| Class A | Six months ended
January 31, 2021
(unaudited) | 2020 | 2019 | 2018 | 2017 | 2016 |
Net asset value, beginning of period
| $9.62 | $8.33 | $9.43 | $9.09 | $8.96 | $13.74 |
Net investment loss
| (0.02) | (0.03) 1 | (0.03) 1 | (0.04) 1 | (0.03) 1 | (0.04) 1 |
Net realized and unrealized gains (losses) on investments
| 1.29 | 2.08 | 0.97 | 2.23 | 1.49 | (0.14) |
Total from investment operations
| 1.27 | 2.05 | 0.94 | 2.19 | 1.46 | (0.18) |
| Distributions to shareholders from | | | | | | |
Net realized gains
| (0.85) | (0.76) | (2.04) | (1.85) | (1.33) | (4.60) |
Net asset value, end of period
| $10.04 | $9.62 | $8.33 | $9.43 | $9.09 | $8.96 |
Total return2
| 13.47% | 26.57% | 15.37% | 27.35% | 19.39% | (0.07)% |
| Ratios to average net assets (annualized) | | | | | | |
Gross expenses
| 1.25% | 1.26% | 1.30% | 1.25% | 1.22% | 1.28% |
Net expenses
| 1.01% | 1.02% | 1.20% | 1.20% | 1.20% | 1.20% |
Net investment loss
| (0.48)% | (0.30)% | (0.35)% | (0.49)% | (0.33)% | (0.36)% |
| Supplemental data | | | | | | |
Portfolio turnover rate
| 12% | 16% | 20% | 36% | 59% | 79% |
Net assets, end of period (000s omitted)
| $129,877 | $124,271 | $17,940 | $16,301 | $12,953 | $18,498 |
| 1 | Calculated based upon average shares outstanding |
| 2 | Total return calculations do not include any sales charges. Returns for periods of less than one year are not annualized. |
The accompanying notes are an integral part of these financial statements.
Wells Fargo Endeavor Select Fund | 13
Financial highlights
(For a share outstanding throughout each period)
| | | Year ended July 31 |
| Class C | Six months ended
January 31, 2021
(unaudited) | 2020 | 2019 | 2018 | 2017 | 2016 |
Net asset value, beginning of period
| $5.18 | $4.86 | $6.46 | $6.80 | $7.09 | $11.93 |
Net investment loss
| (0.03) 1 | (0.05) 1 | (0.06) 1 | (0.08) 1 | (0.07) 1 | (0.09) 1 |
Net realized and unrealized gains (losses) on investments
| 0.68 | 1.13 | 0.50 | 1.59 | 1.11 | (0.15) |
Total from investment operations
| 0.65 | 1.08 | 0.44 | 1.51 | 1.04 | (0.24) |
| Distributions to shareholders from | | | | | | |
Net realized gains
| (0.85) | (0.76) | (2.04) | (1.85) | (1.33) | (4.60) |
Net asset value, end of period
| $4.98 | $5.18 | $4.86 | $6.46 | $6.80 | $7.09 |
Total return2
| 13.01% | 25.48% | 14.51% | 26.43% | 18.46% | (0.76)% |
| Ratios to average net assets (annualized) | | | | | | |
Gross expenses
| 2.00% | 2.01% | 2.05% | 2.00% | 1.97% | 2.03% |
Net expenses
| 1.78% | 1.79% | 1.95% | 1.95% | 1.95% | 1.95% |
Net investment loss
| (1.24)% | (1.06)% | (1.12)% | (1.22)% | (1.08)% | (1.11)% |
| Supplemental data | | | | | | |
Portfolio turnover rate
| 12% | 16% | 20% | 36% | 59% | 79% |
Net assets, end of period (000s omitted)
| $5,933 | $6,651 | $2,116 | $3,792 | $3,676 | $4,845 |
| 1 | Calculated based upon average shares outstanding |
| 2 | Total return calculations do not include any sales charges. Returns for periods of less than one year are not annualized. |
The accompanying notes are an integral part of these financial statements.
14 | Wells Fargo Endeavor Select Fund
Financial highlights
(For a share outstanding throughout each period)
| | | Year ended July 31 |
| Class R6 | Six months ended
January 31, 2021
(unaudited) | 2020 1 |
Net asset value, beginning of period
| $11.37 | $9.63 |
Net investment income (loss)
| (0.00) 2,3 | 0.01 |
Net realized and unrealized gains on investments
| 1.54 | 2.49 |
Total from investment operations
| 1.54 | 2.50 |
| Distributions to shareholders from | | |
Net realized gains
| (0.85) | (0.76) |
Net asset value, end of period
| $12.06 | $11.37 |
Total return4
| 13.77% | 27.68% |
| Ratios to average net assets (annualized) | | |
Gross expenses
| 0.82% | 0.82% |
Net expenses
| 0.60% | 0.60% |
Net investment income (loss)
| (0.06)% | 0.11% |
| Supplemental data | | |
Portfolio turnover rate
| 12% | 16% |
Net assets, end of period (000s omitted)
| $41,130 | $48,435 |
| 1 | For the period from September 20, 2019 (commencement of class operations) to July 31, 2020 |
| 2 | Calculated based upon average shares outstanding |
| 3 | Amount is more than $(0.005) |
| 4 | Returns for periods of less than one year are not annualized. |
The accompanying notes are an integral part of these financial statements.
Wells Fargo Endeavor Select Fund | 15
Financial highlights
(For a share outstanding throughout each period)
| | | Year ended July 31 |
| Administrator Class | Six months ended
January 31, 2021
(unaudited) | 2020 | 2019 | 2018 | 2017 | 2016 |
Net asset value, beginning of period
| $10.66 | $9.15 | $10.12 | $9.62 | $9.38 | $14.13 |
Net investment income (loss)
| (0.02) 1 | (0.02) 1 | (0.01) 1 | (0.03) 1 | (0.01) 1 | 0.01 1 |
Net realized and unrealized gains (losses) on investments
| 1.46 | 2.29 | 1.08 | 2.38 | 1.58 | (0.16) |
Total from investment operations
| 1.44 | 2.27 | 1.07 | 2.35 | 1.57 | (0.15) |
| Distributions to shareholders from | | | | | | |
Net realized gains
| (0.85) | (0.76) | (2.04) | (1.85) | (1.33) | (4.60) |
Net asset value, end of period
| $11.25 | $10.66 | $9.15 | $10.12 | $9.62 | $9.38 |
Total return2
| 13.75% | 26.59% | 15.63% | 27.55% | 19.71% | 0.16% |
| Ratios to average net assets (annualized) | | | | | | |
Gross expenses
| 1.17% | 1.18% | 1.21% | 1.16% | 1.14% | 1.14% |
Net expenses
| 0.94% | 0.94% | 1.00% | 1.00% | 1.00% | 1.00% |
Net investment income (loss)
| (0.41)% | (0.21)% | (0.16)% | (0.28)% | (0.12)% | 0.06% |
| Supplemental data | | | | | | |
Portfolio turnover rate
| 12% | 16% | 20% | 36% | 59% | 79% |
Net assets, end of period (000s omitted)
| $10,678 | $8,979 | $2,590 | $3,068 | $3,695 | $5,254 |
| 1 | Calculated based upon average shares outstanding |
| 2 | Returns for periods of less than one year are not annualized. |
The accompanying notes are an integral part of these financial statements.
16 | Wells Fargo Endeavor Select Fund
Financial highlights
(For a share outstanding throughout each period)
| | | Year ended July 31 |
| Institutional Class | Six months ended
January 31, 2021
(unaudited) | 2020 | 2019 | 2018 | 2017 | 2016 |
Net asset value, beginning of period
| $11.36 | $9.68 | $10.57 | $9.95 | $9.65 | $14.39 |
Net investment income (loss)
| (0.01) 1 | 0.01 1 | 0.00 1,2 | (0.01) 1 | 0.00 1,2 | 0.00 1,2 |
Net realized and unrealized gains (losses) on investments
| 1.53 | 2.43 | 1.15 | 2.49 | 1.64 | (0.14) |
Total from investment operations
| 1.52 | 2.44 | 1.15 | 2.48 | 1.64 | (0.14) |
| Distributions to shareholders from | | | | | | |
Net investment income
| 0.00 | 0.00 | 0.00 | (0.01) | (0.01) | 0.00 |
Net realized gains
| (0.85) | (0.76) | (2.04) | (1.85) | (1.33) | (4.60) |
Total distributions to shareholders
| (0.85) | (0.76) | (2.04) | (1.86) | (1.34) | (4.60) |
Net asset value, end of period
| $12.03 | $11.36 | $9.68 | $10.57 | $9.95 | $9.65 |
Total return3
| 13.60% | 26.91% | 15.76% | 28.01% | 19.87% | 0.27% |
| Ratios to average net assets (annualized) | | | | | | |
Gross expenses
| 0.92% | 0.93% | 0.97% | 0.92% | 0.89% | 0.95% |
Net expenses
| 0.70% | 0.72% | 0.80% | 0.80% | 0.80% | 0.80% |
Net investment income (loss)
| (0.16)% | 0.07% | 0.05% | (0.08)% | 0.05% | 0.04% |
| Supplemental data | | | | | | |
Portfolio turnover rate
| 12% | 16% | 20% | 36% | 59% | 79% |
Net assets, end of period (000s omitted)
| $92,359 | $86,407 | $107,670 | $131,655 | $144,199 | $162,935 |
| 1 | Calculated based upon average shares outstanding |
| 2 | Amount is less than $0.005. |
| 3 | Returns for periods of less than one year are not annualized. |
The accompanying notes are an integral part of these financial statements.
Wells Fargo Endeavor Select Fund | 17
Notes to financial statements (unaudited)
1. ORGANIZATION
Wells Fargo Funds Trust (the “Trust”), a Delaware statutory trust organized on March 10, 1999, is an open-end management investment company registered under the Investment Company Act of 1940, as amended (the “1940 Act”). As an investment company, the Trust follows the accounting and reporting guidance in Financial Accounting Standards Board (“FASB”) Accounting Standards Codification Topic 946, Financial Services – Investment Companies. These financial statements report on the Wells Fargo Endeavor Select Fund (the “Fund”) which is a diversified series of the Trust.
2. SIGNIFICANT ACCOUNTING POLICIES
The following significant accounting policies, which are consistently followed in the preparation of the financial statements of the Fund, are in conformity with U.S. generally accepted accounting principles which require management to make estimates and assumptions that affect the reported amounts of assets and liabilities, disclosure of contingent assets and liabilities at the date of the financial statements, and the reported amounts of income and expenses during the reporting period. Actual results could differ from those estimates.
Securities valuation
All investments are valued each business day as of the close of regular trading on the New York Stock Exchange (generally 4 p.m. Eastern Time), although the Fund may deviate from this calculation time under unusual or unexpected circumstances.
Equity securities that are listed on a foreign or domestic exchange or market are valued at the official closing price or, if none, the last sales price. If no sale occurs on the principal exchange or market that day, a fair value price will be determined in accordance with the Fund’s Valuation Procedures.
Investments in registered open-end investment companies are valued at net asset value. Interests in non-registered investment companies that are redeemable at net asset value are fair valued normally at net asset value.
Investments which are not valued using any of the methods discussed above are valued at their fair value, as determined in good faith by the Board of Trustees. The Board of Trustees has established a Valuation Committee comprised of the Trustees and has delegated to it the authority to take any actions regarding the valuation of portfolio securities that the Valuation Committee deems necessary or appropriate, including determining the fair value of portfolio securities, unless the determination has been delegated to the Wells Fargo Asset Management Pricing Committee at Wells Fargo Funds Management, LLC (“Funds Management”). The Board of Trustees retains the authority to make or ratify any valuation decisions or approve any changes to the Valuation Procedures as it deems appropriate. On a quarterly basis, the Board of Trustees receives reports on any valuation actions taken by the Valuation Committee or the Wells Fargo Asset Management Pricing Committee which may include items for ratification.
Foreign currency translation
The accounting records of the Fund are maintained in U.S. dollars. The values of other assets and liabilities denominated in foreign currencies are translated into U.S. dollars at rates provided by an independent foreign currency pricing source at a time each business day specified by the Wells Fargo Asset Management Pricing Committee. Purchases and sales of securities, and income and expenses are converted at the rate of exchange on the respective dates of such transactions. Net realized foreign exchange gains or losses arise from sales of foreign currencies, currency gains or losses realized between the trade and settlement dates on securities transactions, and the difference between the amounts of dividends, interest and foreign withholding taxes recorded and the U.S. dollar equivalent of the amounts actually paid or received. Net unrealized foreign exchange gains and losses arise from changes in the fair value of assets and liabilities other than investments in securities resulting from changes in exchange rates. The changes in net assets arising from changes in exchange rates of securities and the changes in net assets resulting from changes in market prices of securities are not separately presented. Such changes are included in net realized and unrealized gains or losses from investments.
Securities lending
The Fund may lend its securities from time to time in order to earn additional income in the form of fees or interest on securities received as collateral or the investment of any cash received as collateral. When securities are on loan, the Fund receives interest or dividends on those securities. Cash collateral received in connection with its securities lending transactions is invested in Securities Lending Cash Investments, LLC (the “Securities Lending Fund”). Investments in Securities Lending Fund are valued at the evaluated bid price provided by an independent pricing service. Income earned from investment in the Securities Lending Fund (net of fees and rebates), if any, is included in income from affiliated securities on the Statement of Operations.
18 | Wells Fargo Endeavor Select Fund
Notes to financial statements (unaudited)
In a securities lending transaction, the net asset value of the Fund is affected by an increase or decrease in the value of the securities loaned and by an increase or decrease in the value of the instrument in which collateral is invested. The amount of securities lending activity undertaken by the Fund fluctuates from time to time. The Fund has the right under the lending agreement to recover the securities from the borrower on demand. In the event of default or bankruptcy by the borrower, the Fund may be prevented from recovering the loaned securities or gaining access to the collateral or may experience delays or costs in doing so. In such an event, the terms of the agreement allow the unaffiliated securities lending agent to use the collateral to purchase replacement securities on behalf of the Fund or pay the Fund the market value of the loaned securities. The Fund bears the risk of loss with respect to depreciation of its investment of the cash collateral.
Security transactions and income recognition
Securities transactions are recorded on a trade date basis. Realized gains or losses are recorded on the basis of identified cost.
Dividend income is recognized on the ex-dividend date. Dividend income is recorded net of foreign taxes withheld where recovery of such taxes is not assured.
Distributions to shareholders
Distributions to shareholders from net investment income and any net realized gains are recorded on the ex-dividend date and paid at least annually. Such distributions are determined in accordance with income tax regulations and may differ from U.S. generally accepted accounting principles. Dividend sources are estimated at the time of declaration. The tax character of distributions is determined as of the Fund’s fiscal year end. Therefore, a portion of the Fund’s distributions made prior to the Fund’s fiscal year end may be categorized as a tax return of capital at year end.
Federal and other taxes
The Fund intends to continue to qualify as a regulated investment company by distributing substantially all of its investment company taxable income and any net realized capital gains (after reduction for capital loss carryforwards) sufficient to relieve it from all, or substantially all, federal income taxes. Accordingly, no provision for federal income taxes was required.
The Fund’s income and federal excise tax returns and all financial records supporting those returns for the prior three fiscal years are subject to examination by the federal and Delaware revenue authorities. Management has analyzed the Fund’s tax positions taken on federal, state, and foreign tax returns for all open tax years and does not believe that there are any uncertain tax positions that require recognition of a tax liability.
As of January 31, 2021, the aggregate cost of all investments for federal income tax purposes was $122,393,598 and the unrealized gains (losses) consisted of:
| Gross unrealized gains | $162,398,079 |
| Gross unrealized losses | (1,129,566) |
| Net unrealized gains | $161,268,513 |
Class allocations
The separate classes of shares offered by the Fund differ principally in applicable sales charges, distribution, shareholder servicing, and administration fees. Class specific expenses are charged directly to that share class. Investment income, common fund-level expenses, and realized and unrealized gains (losses) on investments are allocated daily to each class of shares based on the relative proportion of net assets of each class.
Wells Fargo Endeavor Select Fund | 19
Notes to financial statements (unaudited)
3. FAIR VALUATION MEASUREMENTS
Fair value measurements of investments are determined within a framework that has established a fair value hierarchy based upon the various data inputs utilized in determining the value of the Fund’s investments. The three-level hierarchy gives the highest priority to unadjusted quoted prices in active markets for identical assets or liabilities (Level 1) and the lowest priority to unobservable inputs (Level 3). The Fund’s investments are classified within the fair value hierarchy based on the lowest level of input that is significant to the fair value measurement. The inputs are summarized into three broad levels as follows:
| ■ | Level 1 – quoted prices in active markets for identical securities |
| ■ | Level 2 – other significant observable inputs (including quoted prices for similar securities, interest rates, prepayment speeds, credit risk, etc.) |
| ■ | Level 3 – significant unobservable inputs (including the Fund’s own assumptions in determining the fair value of investments) |
The inputs or methodologies used for valuing investments in securities are not necessarily an indication of the risk associated with investing in those securities.
The following is a summary of the inputs used in valuing the Fund’s assets and liabilities as of January 31, 2021:
| | Quoted prices
(Level 1) | Other significant
observable inputs
(Level 2) | Significant
unobservable inputs
(Level 3) | Total |
| Assets | | | | |
| Investments in: | | | | |
| Common stocks | | | | |
| Communication services | $ 31,233,285 | $0 | $0 | $ 31,233,285 |
| Consumer discretionary | 60,826,569 | 0 | 0 | 60,826,569 |
| Financials | 12,955,654 | 0 | 0 | 12,955,654 |
| Health care | 39,405,408 | 0 | 0 | 39,405,408 |
| Industrials | 18,744,157 | 0 | 0 | 18,744,157 |
| Information technology | 96,490,826 | 0 | 0 | 96,490,826 |
| Materials | 13,091,274 | 0 | 0 | 13,091,274 |
| Real estate | 4,594,257 | 0 | 0 | 4,594,257 |
| Short-term investments | | | | |
| Investment companies | 6,320,681 | 0 | 0 | 6,320,681 |
| Total assets | $283,662,111 | $0 | $0 | $283,662,111 |
Additional sector, industry or geographic detail, if any, is included in the Portfolio of Investments.
For the six months ended January 31, 2021, the Fund did not have any transfers into/out of Level 3.
4. TRANSACTIONS WITH AFFILIATES
Management fee
Funds Management, an indirect wholly owned subsidiary of Wells Fargo & Company (“Wells Fargo”), is the manager of the Fund and provides advisory and fund-level administrative services under an investment management agreement. Under the investment management agreement, Funds Management is responsible for, among other services, implementing the investment objectives and strategies of the Fund, supervising the subadviser and providing fund-level administrative services in connection with the Fund’s operations. As compensation for its services under the investment management agreement, Funds Management is entitled to receive a management fee at the following annual rate based on the Fund’s average daily net assets:
20 | Wells Fargo Endeavor Select Fund
Notes to financial statements (unaudited)
| Average daily net assets | Management fee |
| First $500 million | 0.700% |
| Next $500 million | 0.675 |
| Next $1 billion | 0.650 |
| Next $2 billion | 0.625 |
| Next $1 billion | 0.600 |
| Next $3 billion | 0.590 |
| Next $2 billion | 0.565 |
| Next $2 billion | 0.555 |
| Next $4 billion | 0.530 |
| Over $16 billion | 0.505 |
For the six months ended January 31, 2021, the management fee was equivalent to an annual rate of 0.70% of the Fund’s average daily net assets.
Funds Management has retained the services of a subadviser to provide daily portfolio management to the Fund. The fee for subadvisory services is borne by Funds Management. Wells Capital Management Incorporated ("WellsCap"), an affiliate of Funds Management and an indirect wholly owned subsidiary of Wells Fargo, is the subadviser to the Fund and is entitled to receive a fee from Funds Management at an annual rate starting at 0.30% and declining to 0.20% as the average daily net assets of the Fund increase.
Administration fees
Under a class-level administration agreement, Funds Management provides class-level administrative services to the Fund, which includes paying fees and expenses for services provided by the transfer agent, sub-transfer agents, omnibus account servicers and record-keepers. As compensation for its services under the class-level administration agreement, Funds Management receives an annual fee which is calculated based on the average daily net assets of each class as follows:
| | Class-level
administration fee |
| Class A | 0.21% |
| Class C | 0.21 |
| Class R6 | 0.03 |
| Administrator Class | 0.13 |
| Institutional Class | 0.13 |
Waivers and/or expense reimbursements
Funds Management has contractually waived and/or reimbursed management and administration fees to the extent necessary to maintain certain net operating expense ratios for the Fund. When each class of the Fund has exceeded its expense cap, Funds Management has waived fees and/or reimbursed expenses from fund-level expenses on a proportionate basis and then from class specific expenses. When only certain classes exceed their expense caps, waivers and/or reimbursements are applied against class specific expenses before fund-level expenses. Funds Management has committed through November 30, 2021 to waive fees and/or reimburse expenses to the extent necessary to cap expenses. Prior to or after the commitment expiration date, the cap may be increased or the commitment to maintain the cap may be terminated only with the approval of the Board of Trustees. The expense caps are as follows:
| | Expense ratio caps |
| Class A | 1.03% |
| Class C | 1.78 |
| Class R6 | 0.60 |
| Administrator Class | 0.94 |
| Institutional Class | 0.70 |
Wells Fargo Endeavor Select Fund | 21
Notes to financial statements (unaudited)
Distribution fee
The Trust has adopted a distribution plan for Class C shares of the Fund pursuant to Rule 12b-1 under the 1940 Act. A distribution fee is charged charged to Class C shares and paid to Wells Fargo Funds Distributor, LLC (“Funds Distributor”), the principal underwriter, at an annual rate of 0.75% of the average daily net assets of Class C shares.
In addition, Funds Distributor is entitled to receive the front-end sales charge from the purchase of Class A shares and a contingent deferred sales charge on the redemption of certain Class A shares. Funds Distributor is also entitled to receive the contingent deferred sales charges from redemptions of Class C shares. For the six months ended January 31, 2021, Funds Distributor received $3,641 from the sale of Class A shares. No contingent deferred sales charges were incurred by Class A and Class C shares for the six months ended January 31, 2021.
Shareholder servicing fees
The Trust has entered into contracts with one or more shareholder servicing agents, whereby Class A, Class C, and Administrator Class of the Fund are charged a fee at an annual rate of 0.25% of the average daily net assets of each respective class. A portion of these total shareholder servicing fees were paid to affiliates of Wells Fargo.
Interfund transactions
The Fund may purchase or sell portfolio investment securities to certain other Wells Fargo affiliates pursuant to Rule 17a-7 under the 1940 Act and under procedures adopted by the Board of Trustees. The procedures have been designed to ensure that these interfund transactions, which do not incur broker commissions, are effected at current market prices.
5. INVESTMENT PORTFOLIO TRANSACTIONS
Purchases and sales of investments, excluding U.S. government obligations (if any) and short-term securities, for the six months ended January 31, 2021 were $31,822,864 and $52,011,222, respectively.
6. SECURITIES LENDING TRANSACTIONS
The Fund lends its securities through an unaffiliated securities lending agent and receives collateral in the form of cash or securities with a value at least equal to the value of the securities on loan. The value of the loaned securities is determined at the close of each business day and any increases or decreases in the required collateral are exchanged between the Fund and the counterparty on the next business day. Cash collateral received is invested in the Securities Lending Fund which seeks to provide a positive return compared to the daily Federal Funds Open Rate by investing in high-quality, U.S. dollar-denominated short-term money market instruments and is exempt from registration under Section 3(c)(7) of the 1940 Act. Securities Lending Fund is managed by Funds Management and is subadvised by WellsCap. Funds Management receives an advisory fee starting at 0.05% and declining to 0.01% as the average daily net assets of the Securities Lending Fund increase. All of the fees received by Funds Management are paid to WellsCap for its services as subadviser.
In the event of counterparty default or the failure of a borrower to return a loaned security, the Fund has the right to use the collateral to offset any losses incurred. As of January 31, 2021, the Fund had securities lending transactions with the following counterparties which are subject to offset:
| Counterparty | Value of
securities on
loan | Collateral
received1 | Net amount |
| Barclays Capital Incorporated | $4,116,606 | $(4,116,606) | $0 |
1 Collateral received within this table is limited to the collateral for the net transaction with the counterparty.
7. ACQUISITION
After the close of business on September 20, 2019, the Fund acquired the net assets of Wells Fargo Capital Growth Fund. The purpose of the transaction was to combine two funds with similar investment objectives and strategies. Shareholders holding Class A, Class C, Class R6, Administrator Class, and Institutional Class shares of Wells Fargo Capital Growth Fund received Class A, Class C, Class R6, Administrator Class, and Institutional Class shares, respectively, of the Fund in the reorganization. The acquisition was accomplished by a tax-free exchange of all of the shares of Wells Fargo Capital Growth Fund for 12,325,989 shares of the Fund valued at $103,112,202 at an exchange ratio of 0.97, 1.03, 1.14, 1.09, and 1.13 for Class A, Class C, Class R6, Administrator Class, and Institutional Class shares, respectively. The investment portfolio of Wells Fargo Capital Growth Fund with a fair value of $101,506,563, identified cost of $55,944,059 and unrealized gains of $45,562,504 at September 30, 2019 were the principal assets acquired by the Fund. The aggregate net assets of Wells Fargo Capital Growth Fund and the Fund
22 | Wells Fargo Endeavor Select Fund
Notes to financial statements (unaudited)
immediately prior to the acquisition were $103,112,202 and $124,063,059, respectively. The aggregate net assets of the Fund immediately after the acquisition were $227,175,261. For financial reporting purposes, assets received and shares issued by the Fund were recorded at fair value; however, the cost basis of the investments received from Wells Fargo Capital Growth Fund was carried forward to align with ongoing reporting of the Fund’s realized and unrealized gains and losses with amounts distributable to shareholders for tax purposes.
Assuming the acquisition had been completed August 1, 2019, the beginning of the annual reporting period for the Fund, the pro forma results of operations for the year ended July 31, 2020 would have been as follows (unaudited):
| Net investment loss | $ (273,003) |
| Net realized and unrealized gains on investments | 62,562,425 |
| Net increase in net assets resulting from operations | $62,289,422 |
8. BANK BORROWINGS
The Trust (excluding the money market funds), Wells Fargo Master Trust and Wells Fargo Variable Trust are parties to a $350,000,000 revolving credit agreement whereby the Fund is permitted to use bank borrowings for temporary or emergency purposes, such as to fund shareholder redemption requests. Interest under the credit agreement is charged to the Fund based on a borrowing rate equal to the higher of the Federal Funds rate in effect on that day plus 1.25% or the overnight LIBOR rate in effect on that day plus 1.25%. In addition, an annual commitment fee equal to 0.25% of the unused balance is allocated to each participating fund.
For the six months ended January 31, 2021, there were no borrowings by the Fund under the agreement.
9. CONCENTRATION RISKS
Concentration risks result from exposure to a limited number of sectors. As of the end of the period, the Fund concentrated its portfolio in investments related to the information technology sector. A fund that invests a substantial portion of its assets in any sector may be more affected by changes in that sector than would be a fund whose investments are not heavily weighted in any sector.
10. INDEMNIFICATION
Under the Fund's organizational documents, the officers and Trustees have been granted certain indemnification rights against certain liabilities that may arise out of performance of their duties to the Fund. The Fund has entered into a separate agreement with each Trustee that converts indemnification rights currently existing under the Fund’s organizational documents into contractual rights that cannot be changed in the future without the consent of the Trustee. Additionally, in the normal course of business, the Fund may enter into contracts with service providers that contain a variety of indemnification clauses. The Fund’s maximum exposure under these arrangements is dependent on future claims that may be made against the Fund and, therefore, cannot be estimated.
11. NEW ACCOUNTING PRONOUNCEMENT
In August 2018, FASB issued Accounting Standards Update (“ASU”) No. 2018-13, Fair Value Measurement (Topic 820) Disclosure Framework - Changes to the Disclosure Requirements for Fair Value Measurement. ASU 2018-13 updates the disclosure requirements on fair value measurements in Topic 820, Fair Value Measurements. The amendments are effective for fiscal years, and interim periods within those fiscal years, beginning after December 15, 2019. Management has adopted this guidance which did not have a material impact on the financial statements.
12. CORONAVIRUS (COVID-19) PANDEMIC
On March 11, 2020, the World Health Organization announced that it had made the assessment that coronavirus disease 2019 (“COVID-19”) is a pandemic. The impacts of COVID-19 are affecting the entire global economy, individual companies and investment products, the funds, and the market in general. There is significant uncertainty around the extent and duration of business disruptions related to COVID-19 and the impacts may be short term or may last for an extended period of time. The risk of further spreading of COVID-19 has led to significant uncertainty and volatility in the financial markets.
13. SUBSEQUENT EVENT
On February 23, 2021, Wells Fargo announced that it has entered into a definitive agreement to sell Wells Fargo Asset Management (“WFAM”) to GTCR LLC and Reverence Capital Partners, L.P. WFAM is the trade name used by the asset
Wells Fargo Endeavor Select Fund | 23
Notes to financial statements (unaudited)
management businesses of Wells Fargo and includes Wells Fargo Funds Management, LLC, the investment manager to the Fund, Wells Capital Management Incorporated and Wells Fargo Asset Management (International) Limited, both registered investment advisers providing sub-advisory services to certain funds, and Wells Fargo Funds Distributor, LLC, the Fund’s principal underwriter. As part of the transaction, Wells Fargo will own a 9.9% equity interest and will continue to serve as an important client and distribution partner.
Consummation of the transaction will result in the automatic termination of the Fund’s investment management agreement and sub-advisory agreement. The Fund’s Board of Trustees will be asked to approve new investment management arrangements with the new company. If approved by the Board, the new investment management arrangements with the new company will be presented to the shareholders of the Fund for approval, and, if approved by shareholders, would take effect upon the closing of the transaction. The transaction is expected to close in the second half of 2021, subject to customary closing conditions.
24 | Wells Fargo Endeavor Select Fund
Other information (unaudited)
PROXY VOTING INFORMATION
A description of the policies and procedures used to determine how to vote proxies relating to portfolio securities is available without charge, upon request, by calling 1-800-222-8222, visiting our website at wfam.com, or visiting the SEC website at sec.gov. Information regarding how the proxies related to portfolio securities were voted during the most recent 12-month period ended June 30 is available on the website at wfam.com or by visiting the SEC website at sec.gov.
QUARTERLY PORTFOLIO HOLDINGS INFORMATION
The Fund files its complete schedule of portfolio holdings with the SEC for the first and third quarters of each fiscal year as an exhibit to its reports on Form N-PORT. Shareholders may view the filed Form N-PORT by visiting the SEC website at sec.gov.
Wells Fargo Endeavor Select Fund | 25
Other information (unaudited)
BOARD OF TRUSTEES AND OFFICERS
Each of the Trustees and Officers listed in the table below acts in identical capacities for each fund in the Wells Fargo family of funds, which consists of 144 mutual funds comprising the Wells Fargo Funds Trust, Wells Fargo Variable Trust, Wells Fargo Master Trust and four closed-end funds (collectively the “Fund Complex”). This table should be read in conjunction with the Prospectus and the Statement of Additional Information1. The mailing address of each Trustee and Officer is 525 Market Street, 12th Floor, San Francisco, CA 94105. Each Trustee and Officer serves an indefinite term, however, each Trustee serves such term until reaching the mandatory retirement age established by the Trustees.
Independent Trustees
Name and
year of birth | Position held and
length of service* | Principal occupations during past five years or longer | Current other
public company or
investment
company
directorships |
William R. Ebsworth
(Born 1957) | Trustee,
since 2015 | Retired. From 1984 to 2013, equities analyst, portfolio manager, research director and chief investment officer at Fidelity Management and Research Company in Boston, Tokyo, and Hong Kong, and retired in 2013 as Chief Investment Officer of Fidelity Strategic Advisers, Inc. where he led a team of investment professionals managing client assets. Prior thereto, Board member of Hong Kong Securities Clearing Co., Hong Kong Options Clearing Corp., the Thailand International Fund, Ltd., Fidelity Investments Life Insurance Company, and Empire Fidelity Investments Life Insurance Company. Audit Committee Chair and Investment Committee Chair of the Vincent Memorial Hospital Endowment (non-profit organization). Mr. Ebsworth is a CFA® charterholder. | N/A |
Jane A. Freeman
(Born 1953) | Trustee,
since 2015;
Chair Liaison,
since 2018 | Retired. From 2012 to 2014 and 1999 to 2008, Chief Financial Officer of Scientific Learning Corporation. From 2008 to 2012, Ms. Freeman provided consulting services related to strategic business projects. Prior to 1999, Portfolio Manager at Rockefeller & Co. and Scudder, Stevens & Clark. Board member of the Harding Loevner Funds from 1996 to 2014, serving as both Lead Independent Director and chair of the Audit Committee. Board member of the Russell Exchange Traded Funds Trust from 2011 to 2012 and the chair of the Audit Committee. Ms. Freeman is also an inactive Chartered Financial Analyst. | N/A |
Isaiah Harris, Jr.
(Born 1952) | Trustee,
since 2009; Audit
Committee
Chair,
since 2019 | Retired. Chairman of the Board of CIGNA Corporation since 2009, and Director since 2005. From 2003 to 2011, Director of Deluxe Corporation. Prior thereto, President and CEO of BellSouth Advertising and Publishing Corp. from 2005 to 2007, President and CEO of BellSouth Enterprises from 2004 to 2005 and President of BellSouth Consumer Services from 2000 to 2003. Emeritus member of the Iowa State University Foundation Board of Governors. Emeritus Member of the Advisory Board of Iowa State University School of Business. Advisory Board Member, Palm Harbor Academy (private school). Mr. Harris is a certified public accountant (inactive status). | CIGNA Corporation |
Judith M. Johnson
(Born 1949) | Trustee,
since 2008 | Retired. Prior thereto, Chief Executive Officer and Chief Investment Officer of Minneapolis Employees Retirement Fund from 1996 to 2008. Ms. Johnson is an attorney, certified public accountant and a certified managerial accountant. | N/A |
David F. Larcker
(Born 1950) | Trustee,
since 2009 | James Irvin Miller Professor of Accounting at the Graduate School of Business (Emeritus), Stanford University, Director of the Corporate Governance Research Initiative and Senior Faculty of The Rock Center for Corporate Governance since 2006. From 2005 to 2008, Professor of Accounting at the Graduate School of Business, Stanford University. Prior thereto, Ernst & Young Professor of Accounting at The Wharton School, University of Pennsylvania from 1985 to 2005. | N/A |
26 | Wells Fargo Endeavor Select Fund
Other information (unaudited)
Name and
year of birth | Position held and
length of service* | Principal occupations during past five years or longer | Current other
public company or
investment
company
directorships |
Olivia S. Mitchell
(Born 1953) | Trustee,
since 2006;
Nominating and
Governance
Committee Chair,
since 2018 | International Foundation of Employee Benefit Plans Professor, Wharton School of the University of Pennsylvania since 1993. Director of Wharton’s Pension Research Council and Boettner Center on Pensions & Retirement Research, and Research Associate at the National Bureau of Economic Research. Previously, Cornell University Professor from 1978 to 1993. | N/A |
Timothy J. Penny
(Born 1951) | Trustee,
since 1996;
Chair,
since 2018 | President and Chief Executive Officer of Southern Minnesota Initiative Foundation, a non-profit organization, since 2007. Member of the Board of Trustees of NorthStar Education Finance, Inc., a non-profit organization, since 2007. | N/A |
James G. Polisson
(Born 1959) | Trustee,
since 2018 | Retired. Chief Marketing Officer, Source (ETF) UK Services, Ltd, from 2015 to 2017. From 2012 to 2015, Principal of The Polisson Group, LLC, a management consulting, corporate advisory and principal investing company. Chief Executive Officer and Managing Director at Russell Investments, Global Exchange Traded Funds from 2010 to 2012. Managing Director of Barclays Global Investors from 1998 to 2010 and Global Chief Marketing Officer for iShares and Barclays Global Investors from 2000 to 2010. Trustee of the San Francisco Mechanics’ Institute, a non-profit organization, from 2013 to 2015. Board member of the Russell Exchange Traded Fund Trust from 2011 to 2012. Director of Barclays Global Investors Holdings Deutschland GmbH from 2006 to 2009. Mr. Polisson is an attorney and has a retired status with the Massachusetts and District of Columbia Bar Associations. | N/A |
Pamela Wheelock
(Born 1959) | Trustee,
since January
2020; previously
Trustee from
January 2018 to
July 2019 | Board member of the Destination Medical Center Economic Development Agency, Rochester, Minnesota since 2019. Interim President of the McKnight Foundation from January to September 2020. Acting Commissioner, Minnesota Department of Human Services, July 2019 through September 2019. Human Services Manager (part-time), Minnesota Department of Human Services, October 2019 through December 2019. Chief Operating Officer, Twin Cities Habitat for Humanity from 2017 to 2019. Vice President of University Services, University of Minnesota from 2012 to 2016. Prior thereto, on the Board of Directors, Governance Committee and Finance Committee for the Minnesota Philanthropy Partners (Saint Paul Foundation) from 2012 to 2018, Interim Chief Executive Officer of Blue Cross Blue Shield of Minnesota from 2011 to 2012, Chairman of the Board from 2009 to 2012 and Board Director from 2003 to 2015. Vice President, Leadership and Community Engagement, Bush Foundation, Saint Paul, Minnesota (a private foundation) from 2009 to 2011. Executive Vice President and Chief Financial Officer, Minnesota Sports and Entertainment from 2004 to 2009 and Senior Vice President from 2002 to 2004. Executive Vice President of the Minnesota Wild Foundation from 2004 to 2008. Commissioner of Finance, State of Minnesota, from 1999 to 2002. Currently Board Chair of the Minnesota Wild Foundation since 2010. | N/A |
* Length of service dates reflect the Trustee’s commencement of service with the Trust’s predecessor entities, where applicable.
Wells Fargo Endeavor Select Fund | 27
Other information (unaudited)
Officers
Name and
year of birth | Position held and
length of service | Principal occupations during past five years or longer |
Andrew Owen
(Born 1960) | President,
since 2017 | Executive Vice President of Wells Fargo & Company and Head of Affiliated Managers, Wells Fargo Asset Management, since 2014. In addition, Mr. Owen is currently President, Chief Executive Officer and Director of Wells Fargo Funds Management, LLC since 2017. Prior thereto, Executive Vice President responsible for marketing, investments and product development for Wells Fargo Funds Management, LLC, from 2009 to 2014. |
Jeremy DePalma
(Born 1974) | Treasurer,
since 2012
(for certain funds in
the Fund Complex);
since 2021 (for
the remaining funds in the
Fund Complex) | Senior Vice President of Wells Fargo Funds Management, LLC since 2009. Senior Vice President of Evergreen Investment Management Company, LLC from 2008 to 2010 and head of the Fund Reporting and Control Team within Fund Administration from 2005 to 2010. |
Michelle Rhee
(Born 1966) | Chief Legal Officer,
since 2019 | Secretary of Wells Fargo Funds Management, LLC and Chief Legal Counsel of Wells Fargo Asset Management since 2018. Deputy General Counsel of Wells Fargo Bank, N.A. since 2020 and Assistant General Counsel of Wells Fargo Bank, N.A. from 2018 to 2020. Associate General Counsel and Managing Director of Bank of America Corporation from 2004 to 2018. |
Catherine Kennedy
(Born 1969) | Secretary,
since 2019 | Vice President of Wells Fargo Funds Management, LLC and Senior Counsel of the Wells Fargo Legal Department since 2010. Vice President and Senior Counsel of Evergreen Investment Management Company, LLC from 1998 to 2010. |
Michael H. Whitaker
(Born 1967) | Chief Compliance Officer,
since 2016 | Chief Compliance Officer of Wells Fargo Asset Management since 2016. Senior Vice President and Chief Compliance Officer for Fidelity Investments from 2007 to 2016. |
1 The Statement of Additional Information includes additional information about the Trustees and is available, without charge, upon request, by calling 1-800-222-8222 or by visiting the website at wfam.com.
28 | Wells Fargo Endeavor Select Fund
For more information
More information about Wells Fargo Funds is available free upon request. To obtain literature, please write, visit the Fund's website, or call:
Wells Fargo Funds
P.O. Box 219967
Kansas City, MO 64121-9967
Website: wfam.com
Individual investors: 1-800-222-8222
Retail investment professionals: 1-888-877-9275
Institutional investment professionals: 1-866-765-0778
This report and the financial statements contained herein are submitted for the general information of the shareholders of the Fund. If this report is used for promotional purposes, distribution of the report must be accompanied or preceded by a current prospectus. Before investing, please consider the investment objectives, risks, charges, and expenses of the investment. For a current prospectus and, if available, a summary prospectus, containing this information, call 1-800-222-8222 or visit the Fund’s website at wfam.com. Read the prospectus carefully before you invest or send money.
Wells Fargo Asset Management (WFAM) is the trade name for certain investment advisory/management firms owned by Wells Fargo & Company. These firms include but are not limited to Wells Capital Management Incorporated and Wells Fargo Funds Management, LLC. Certain products managed by WFAM entities are distributed by Wells Fargo Funds Distributor, LLC (a broker-dealer and Member FINRA).
This material is for general informational and educational purposes only and is NOT intended to provide investment advice or a recommendation of any kind— including a recommendation for any specific investment, strategy, or plan.
INVESTMENT PRODUCTS: NOT FDIC INSURED ■ NO BANK GUARANTEE ■ MAY LOSE VALUE
© 2021 Wells Fargo & Company. All rights reserved.
PAR-0221-00365 03-22
SA205/SAR205 01-21
Semi-Annual Report
January 31, 2021
Reduce clutter.
Save trees.
Sign up for electronic delivery of prospectuses and shareholder reports at wellsfargo.com/ advantagedelivery
The views expressed and any forward-looking statements are as of January 31, 2021, unless otherwise noted, and are those of the Fund's portfolio managers and/or Wells Fargo Asset Management. Discussions of individual securities or the markets generally are not intended as individual recommendations. Future events or results may vary significantly from those expressed in any forward-looking statements. The views expressed are subject to change at any time in response to changing circumstances in the market. Wells Fargo Asset Management and the Fund disclaim any obligation to publicly update or revise any views expressed or forward-looking statements.
INVESTMENT PRODUCTS: NOT FDIC INSURED ■ NO BANK GUARANTEE ■ MAY LOSE VALUE
Wells Fargo Growth Fund | 1
Letter to shareholders (unaudited)
Dear Shareholder:
We are pleased to offer you this semi-annual report for the Wells Fargo Growth Fund for the six-month period that ended January 31, 2021. Despite a deeply challenging year, dominated by the spread of COVID-19 cases and a sharp drop in economic output throughout much of the world, global stocks performed extremely well, benefiting from ongoing central bank support and rising optimism over the development and distribution of effective COVID-19 vaccines. Bonds also had positive returns, led by global bonds and high-yield bonds.
For the six-month period, U.S. stocks, based on the S&P 500 Index1, gained 14.47%. International stocks, as measured by the MSCI ACWI ex USA Index (Net)2, returned 19.28%, while the MSCI EM Index (Net)3, had stronger performance, with a 24.07% gain. Among bond indexes, the Bloomberg Barclays U.S. Aggregate Bond Index4 returned -0.91%, the Bloomberg Barclays Global Aggregate ex-USD Index (unhedged)5 gained 3.71%, and the Bloomberg Barclays Municipal Bond Index6 returned 2.01% while the ICE BofA U.S. High Yield Index7 returned 6.82%.
The stock market rally continued in August.
The stock market continued a months-long rally in August despite concerns over rising numbers of U.S. and European COVID-19 cases. Relatively strong second-quarter earnings boosted investor sentiment along with the U.S. Federal Reserve’s announcement of a monetary policy shift expected to support longer-term low interest rates. U.S. manufacturing and services activity indexes beat expectations, while the U.S. housing market maintained strength. In Europe, retail sales expanded and consumer confidence was steady. China’s economy continued to expand.
Stocks grew more volatile in September on mixed economic data. U.S. economic activity continued to grow. However, U.S. unemployment remained elevated at 7.9% in September. With U.S. Congress delaying further fiscal relief and uncertainties surrounding a possible vaccine, doubts crept back into the financial markets. In the U.K., a lack of progress in Brexit talks weighed on markets. China’s economy picked up steam, fueled by increased global demand.
Andrew Owen
President
Wells Fargo Funds
“The stock market continued a months-long rally in August despite concerns over rising numbers of U.S. and European COVID-19 cases.”
| 1 | The S&P 500 Index consists of 500 stocks chosen for market size, liquidity, and industry group representation. It is a market-value-weighted index with each stock's weight in the index proportionate to its market value. You cannot invest directly in an index. |
| 2 | The Morgan Stanley Capital International (MSCI) All Country World Index (ACWI) ex USA Index (Net) is a free-float-adjusted market-capitalization-weighted index that is designed to measure the equity market performance of developed and emerging markets, excluding the United States. Source: MSCI. MSCI makes no express or implied warranties or representations and shall have no liability whatsoever with respect to any MSCI data contained herein. The MSCI data may not be further redistributed or used as a basis for other indices or any securities or financial products. This report is not approved, reviewed, or produced by MSCI. You cannot invest directly in an index. |
| 1 | The S&P 500 Index consists of 500 stocks chosen for market size, liquidity, and industry group representation. It is a market-value-weighted index with each stock's weight in the index proportionate to its market value. You cannot invest directly in an index. |
| 3 | The MSCI Emerging Markets (EM) Index (Net) is a free-float-adjusted market-capitalization-weighted index that is designed to measure equity market performance of emerging markets. You cannot invest directly in an index. |
| 1 | The S&P 500 Index consists of 500 stocks chosen for market size, liquidity, and industry group representation. It is a market-value-weighted index with each stock's weight in the index proportionate to its market value. You cannot invest directly in an index. |
| 4 | The Bloomberg Barclays U.S. Aggregate Bond Index is a broad-based benchmark that measures the investment-grade, U.S. dollar-denominated, fixed-rate taxable bond market, including Treasuries, government-related and corporate securities, mortgage-backed securities (agency fixed-rate and hybrid adjustable-rate mortgage pass-throughs), asset-backed securities, and commercial mortgage-backed securities. You cannot invest directly in an index. |
| 1 | The S&P 500 Index consists of 500 stocks chosen for market size, liquidity, and industry group representation. It is a market-value-weighted index with each stock's weight in the index proportionate to its market value. You cannot invest directly in an index. |
| 5 | The Bloomberg Barclays Global Aggregate ex-USD Index (unhedged) is an unmanaged index that provides a broad-based measure of the global investment-grade fixed-income markets excluding the U.S. dollar-denominated debt market. You cannot invest directly in an index. |
| 1 | The S&P 500 Index consists of 500 stocks chosen for market size, liquidity, and industry group representation. It is a market-value-weighted index with each stock's weight in the index proportionate to its market value. You cannot invest directly in an index. |
| 6 | The Bloomberg Barclays Municipal Bond Index is an unmanaged index composed of long-term tax-exempt bonds with a minimum credit rating of Baa. You cannot invest directly in an index. |
| 1 | The S&P 500 Index consists of 500 stocks chosen for market size, liquidity, and industry group representation. It is a market-value-weighted index with each stock's weight in the index proportionate to its market value. You cannot invest directly in an index. |
| 7 | The ICE BofA U.S. High Yield Index is a market-capitalization-weighted index of domestic and Yankee high-yield bonds. The index tracks the performance of high-yield securities traded in the U.S. bond market. You cannot invest directly in an index. Copyright 2021. ICE Data Indices, LLC. All rights reserved. |
2 | Wells Fargo Growth Fund
Letter to shareholders (unaudited)
In October, capital markets stepped back from their six-month rally. Market volatility rose in advance of the U.S. election and amid a global increase in COVID-19 infections. Europe introduced tighter restrictions affecting economic activity. U.S. markets looked favorably at the prospect of Democratic control of the federal purse strings, which could lead to additional fiscal stimulus and a boost to economic activity. Meanwhile, China reported 4.9% third-quarter GDP growth.
Global stocks rallied in November, propelled by optimism over three promising COVID-19 vaccines. Reversing recent trends, value stocks outperformed growth stocks and cyclical stocks outpaced technology stocks. However, U.S. unemployment remained elevated, with a net job loss of 10 million since February. The eurozone services purchasing managers’ index contracted sharply while the region’s manufacturing activity grew. The U.S. election results added to the upbeat mood as investors anticipated more consistent policies in the new administration.
Financial markets ended the year with strength on high expectations for a rapid rollout of the COVID-19 vaccines, the successful passage of a $900 billion stimulus package, and rising expectations of additional economic support from a Democratic-led Congress. U.S. economic data were mixed with still-elevated unemployment and weak retail sales but growth in manufacturing output. In contrast, China’s economic expansion continued in both manufacturing and nonmanufacturing. U.S. COVID-19 infection rates continued to rise even as new state and local lockdown measures were implemented.
The year 2021 began with emerging market stocks leading all major asset classes in January, driven by China’s strong economic growth and a broad recovery in corporate earnings, which propelled China’s stock market higher. In the United States, positive news on vaccine trials and January expansion in both the manufacturing and services sectors was offset by a weak December monthly jobs report. This was compounded by technical factors as some hedge funds were forced to sell stocks to protect themselves against a well-publicized short squeeze coordinated by a group of retail investors. Eurozone sentiment and economic growth were particularly weak, reflecting the impact of a new lockdown with stricter social distancing along with a slow vaccine rollout.
Don’t let short-term uncertainty derail long-term investment goals.
Periods of investment uncertainty can present challenges, but experience has taught us that maintaining long-term investment goals can be an effective way to plan for the future. To help you create a sound strategy based on your personal goals and risk tolerance, Wells Fargo Funds offers more than 100 mutual funds spanning a wide range of asset classes and investment styles. Although diversification cannot guarantee an investment profit or prevent losses, we believe it can be an effective way to manage investment risk and potentially smooth out overall portfolio performance. We encourage investors to know their investments and to understand that appropriate levels of risk-taking may unlock opportunities.
Thank you for choosing to invest with Wells Fargo Funds. We appreciate your confidence in us and remain committed to helping you meet your financial needs.
Sincerely,
Andrew Owen
President
Wells Fargo Funds
“Global stocks rallied in November, propelled by optimism over three promising COVID-19 vaccines.”
For further information about your Fund, contact your investment professional, visit our website at wfam.com, or call us directly at 1-800-222-8222.
Wells Fargo Growth Fund | 3
Performance highlights (unaudited)
Investment objective
The Fund seeks long-term capital appreciation.
Manager
Wells Fargo Funds Management, LLC
Subadviser
Wells Capital Management Incorporated
Portfolio managers
Joseph M. Eberhardy, CFA®‡, CPA
Robert Gruendyke, CFA®‡
Thomas C. Ognar, CFA®‡
Average annual total returns (%) as of January 31, 2021
| | | Including sales charge | | Excluding sales charge | | Expense ratios1 (%) |
| | Inception date | 1 year | 5 year | 10 year | | 1 year | 5 year | 10 year | | Gross | Net 2 |
| Class A (SGRAX) | 2-24-2000 | 33.34 | 22.92 | 15.96 | | 41.45 | 24.39 | 16.65 | | 1.17 | 1.16 |
| Class C (WGFCX) | 12-26-2002 | 41.59 | 23.82 | 15.95 | | 42.59 | 23.82 | 15.95 | | 1.92 | 1.91 |
| Class R6 (SGRHX)3 | 9-30-2015 | – | – | – | | 42.08 | 24.95 | 17.17 | | 0.74 | 0.70 |
| Administrator Class (SGRKX) | 8-30-2002 | – | – | – | | 41.75 | 24.63 | 16.89 | | 1.09 | 0.96 |
| Institutional Class (SGRNX) | 2-24-2000 | – | – | – | | 42.03 | 24.88 | 17.13 | | 0.84 | 0.75 |
| Russell 3000® Growth Index4 | – | – | – | – | | 35.01 | 22.07 | 16.62 | | – | – |
Figures quoted represent past performance, which is no guarantee of future results, and do not reflect taxes that a shareholder may pay on an investment in a fund. Investment return and principal value of an investment will fluctuate so that an investor’s shares, when redeemed, may be worth more or less than their original cost. Performance shown without sales charges would be lower if sales charges were reflected. Current performance may be lower or higher than the performance data quoted, which assumes the reinvestment of dividends and capital gains. Current month-end performance is available on the Fund’s website, wfam.com.
Please keep in mind that high double-digit returns were primarily achieved during favorable market conditions. You should not expect that such favorable returns can be consistently achieved. A fund’s performance, especially for short time periods, should not be the sole factor in making your investment decision.
Index returns do not include transaction costs associated with buying and selling securities, any mutual fund fees or expenses, or any taxes. It is not possible to invest directly in an index.
For Class A shares, the maximum front-end sales charge is 5.75%. For Class C shares, the maximum contingent deferred sales charge is 1.00%. Performance including a contingent deferred sales charge assumes the sales charge for the corresponding time period. Class R6, Administrator Class, and Institutional Class and shares are sold without a front-end sales charge or contingent deferred sales charge.
Stock values fluctuate in response to the activities of individual companies and general market and economic conditions. Certain investment strategies tend to increase the total risk of an investment (relative to the broader market). The Fund is exposed to foreign investment risk and smaller-company securities risk. Consult the Fund’s prospectus for additional information on these and other risks.
Please see footnotes on page 5.
4 | Wells Fargo Growth Fund
Performance highlights (unaudited)
| Ten largest holdings (%) as of January 31, 20215 |
| Amazon.com Incorporated | 8.66 |
| Microsoft Corporation | 6.14 |
| Alphabet Incorporated Class A | 4.57 |
| Apple Incorporated | 3.42 |
| Facebook Incorporated Class A | 3.28 |
| MarketAxess Holdings Incorporated | 2.99 |
| PayPal Holdings Incorporated | 2.97 |
| Pinterest Incorporated Class A | 2.76 |
| MasterCard Incorporated Class A | 2.60 |
| Natera Incorporated | 2.50 |
| Sector allocation as of January 31, 20216 |
| ‡ | CFA® and Chartered Financial Analyst® are trademarks owned by CFA Institute. |
| 1 | Reflects the expense ratios as stated in the most recent prospectuses. The expense ratios shown are subject to change and may differ from the annualized expense ratios shown in the financial highlights of this report. |
| 2 | The manager has contractually committed through November 30, 2021, to waive fees and/or reimburse expenses to the extent necessary to cap total annual fund operating expenses after fee waivers at 1.16% for Class A, 1.91% for Class C, 0.70% for Class R6, 0.96% for Administrator Class, and 0.75% for Institutional Class. Brokerage commissions, stamp duty fees, interest, taxes, acquired fund fees and expenses (if any), and extraordinary expenses are excluded from the expense caps. Prior to or after the commitment expiration date, the caps may be increased or the commitment to maintain the caps may be terminated only with the approval of the Board of Trustees. Without these caps, the Fund’s returns would have been lower. The expense ratio paid by an investor is the net expense ratio (the total annual fund operating expenses after fee waivers) as stated in the prospectuses. |
| 3 | Historical performance shown for the Class R6 shares prior to their inception reflects the performance of the Institutional Class shares, and includes the higher expenses applicable to the Institutional Class shares. If these expenses had not been included, returns for the Class R6 shares would be higher. |
| 4 | The Russell 3000® Growth Index measures the performance of those Russell 3000® Index companies with higher price/book ratios and higher forecasted growth values. You cannot invest directly in an index. |
| 5 | Figures represent the percentage of the Fund's net assets. Holdings are subject to change and may have changed since the date specified. |
| 6 | Figures represent the percentage of the Fund's long-term investments. These amounts are subject to change and may have changed since the date specified. |
Wells Fargo Growth Fund | 5
Fund expenses (unaudited)
As a shareholder of the Fund, you incur two types of costs: (1) transaction costs, including sales charges (loads) on purchase payments and contingent deferred sales charges (if any) on redemptions and (2) ongoing costs, including management fees, distribution (12b-1) and/or shareholder servicing fees, and other Fund expenses. This example is intended to help you understand your ongoing costs (in dollars) of investing in the Fund and to compare these costs with the ongoing costs of investing in other mutual funds.
The example is based on an investment of $1,000 invested at the beginning of the six-month period and held for the entire period from August 1, 2020 to January 31, 2021.
Actual expenses
The “Actual” line of the table below provides information about actual account values and actual expenses. You may use the information in this line, together with the amount you invested, to estimate the expenses that you paid over the period. Simply divide your account value by $1,000 (for example, an $8,600 account value divided by $1,000 = 8.6), then multiply the result by the number in the “Actual” line under the heading entitled “Expenses paid during period” for your applicable class of shares to estimate the expenses you paid on your account during this period.
Hypothetical example for comparison purposes
The “Hypothetical” line of the table below provides information about hypothetical account values and hypothetical expenses based on the Fund’s actual expense ratio and an assumed rate of return of 5% per year before expenses, which is not the Fund’s actual return. The hypothetical account values and expenses may not be used to estimate the actual ending account balance or expenses you paid for the period. You may use this information to compare the ongoing costs of investing in the Fund and other funds. To do so, compare this 5% hypothetical example with the 5% hypothetical examples that appear in the shareholder reports of the other funds.
Please note that the expenses shown in the table are meant to highlight your ongoing costs only and do not reflect any transactional costs, such as sales charges (loads) and contingent deferred sales charges. Therefore, the “Hypothetical” line of the table is useful in comparing ongoing costs only and will not help you determine the relative total costs of owning different funds. In addition, if these transactional costs were included, your costs would have been higher
| | Beginning
account value
8-1-2020 | Ending
account value
1-31-2021 | Expenses
paid during
the period1 | Annualized net
expense ratio |
| Class A | | | | |
| Actual | $1,000.00 | $1,212.62 | $ 6.36 | 1.14% |
| Hypothetical (5% return before expenses) | $1,000.00 | $1,019.46 | $ 5.80 | 1.14% |
| Class C | | | | |
| Actual | $1,000.00 | $1,226.49 | $10.72 | 1.91% |
| Hypothetical (5% return before expenses) | $1,000.00 | $1,015.58 | $ 9.70 | 1.91% |
| Class R6 | | | | |
| Actual | $1,000.00 | $1,215.33 | $ 3.91 | 0.70% |
| Hypothetical (5% return before expenses) | $1,000.00 | $1,021.68 | $ 3.57 | 0.70% |
| Administrator Class | | | | |
| Actual | $1,000.00 | $1,213.81 | $ 5.36 | 0.96% |
| Hypothetical (5% return before expenses) | $1,000.00 | $1,020.37 | $ 4.89 | 0.96% |
| Institutional Class | | | | |
| Actual | $1,000.00 | $1,214.85 | $ 4.19 | 0.75% |
| Hypothetical (5% return before expenses) | $1,000.00 | $1,021.42 | $ 3.82 | 0.75% |
1 Expenses paid is equal to the annualized net expense ratio of each class multiplied by the average account value over the period, multiplied by the number of days in the most recent fiscal half-year divided by the number of days in the fiscal year (to reflect the one-half-year period).
6 | Wells Fargo Growth Fund
Portfolio of investments—January 31, 2021 (unaudited)
| | | | | Shares | Value |
| Common stocks: 99.96% | | | | | |
| Communication services: 14.34% | | | | | |
| Entertainment: 1.97% | | | | | |
| Roku Incorporated † | | | | 255,700 | $ 99,474,971 |
| Spotify Technology SA † | | | | 44,900 | 14,143,500 |
| | | | | | 113,618,471 |
| Interactive media & services: 11.60% | | | | | |
| Alphabet Incorporated Class A † | | | | 144,855 | 264,702,233 |
| Alphabet Incorporated Class C † | | | | 13,090 | 24,029,837 |
| Facebook Incorporated Class A † | | | | 734,800 | 189,820,884 |
| Pinterest Incorporated Class A † | | | | 2,336,376 | 160,065,120 |
| ZoomInfo Technologies Incorporated † | | | | 686,532 | 32,960,401 |
| | | | | | 671,578,475 |
| Media: 0.77% | | | | | |
| Cardlytics Incorporated † | | | | 364,670 | 44,588,201 |
| Consumer discretionary: 13.48% | | | | | |
| Diversified consumer services: 1.60% | | | | | |
| Bright Horizons Family Solutions Incorporated † | | | | 78,780 | 11,972,197 |
| Chegg Incorporated † | | | | 691,072 | 65,831,519 |
| Grand Canyon Education Incorporated † | | | | 172,950 | 14,690,373 |
| | | | | | 92,494,089 |
| Hotels, restaurants & leisure: 0.52% | | | | | |
| Chipotle Mexican Grill Incorporated † | | | | 20,250 | 29,970,000 |
| Internet & direct marketing retail: 9.90% | | | | | |
| Amazon.com Incorporated † | | | | 156,450 | 501,609,990 |
| Etsy Incorporated † | | | | 179,700 | 35,776,473 |
| Fiverr International Limited † | | | | 156,900 | 32,401,419 |
| Poshmark Incorporated Class A †« | | | | 47,190 | 3,292,918 |
| | | | | | 573,080,800 |
| Specialty retail: 1.46% | | | | | |
| Burlington Stores Incorporated † | | | | 65,960 | 16,417,444 |
| Five Below Incorporated † | | | | 292,259 | 51,358,674 |
| Petco Health and Wellness Company †« | | | | 352,303 | 9,170,447 |
| The Home Depot Incorporated | | | | 28,780 | 7,794,200 |
| | | | | | 84,740,765 |
| Consumer staples: 0.37% | | | | | |
| Personal products: 0.37% | | | | | |
| The Estee Lauder Companies Incorporated Class A | | | | 90,740 | 21,473,621 |
| Financials: 4.78% | | | | | |
| Capital markets: 4.47% | | | | | |
| Assetmark Financial Holdings † | | | | 900,534 | 20,730,293 |
| MarketAxess Holdings Incorporated | | | | 320,221 | 173,162,705 |
| Tradeweb Markets Incorporated Class A | | | | 1,062,587 | 64,594,664 |
| | | | | | 258,487,662 |
The accompanying notes are an integral part of these financial statements.
Wells Fargo Growth Fund | 7
Portfolio of investments—January 31, 2021 (unaudited)
| | | | | Shares | Value |
| Insurance: 0.31% | | | | | |
| ROOT Incorporated †« | | | | 904,458 | $ 18,229,351 |
| Health care: 14.25% | | | | | |
| Biotechnology: 3.61% | | | | | |
| Biohaven Pharmaceutical Holding Company † | | | | 616,040 | 52,498,929 |
| Natera Incorporated † | | | | 1,357,485 | 144,762,200 |
| Seagen Incorporated † | | | | 71,300 | 11,712,451 |
| | | | | | 208,973,580 |
| Health care equipment & supplies: 5.15% | | | | | |
| Boston Scientific Corporation † | | | | 1,155,036 | 40,934,476 |
| DexCom Incorporated † | | | | 66,570 | 24,953,765 |
| Edwards Lifesciences Corporation † | | | | 776,290 | 64,106,028 |
| Insulet Corporation † | | | | 183,900 | 49,134,402 |
| iRhythm Technologies Incorporated † | | | | 124,455 | 20,960,711 |
| Novocure Limited † | | | | 608,220 | 97,899,091 |
| | | | | | 297,988,473 |
| Health care technology: 1.31% | | | | | |
| Veeva Systems Incorporated Class A † | | | | 274,750 | 75,951,890 |
| Life sciences tools & services: 2.68% | | | | | |
| Adaptive Biotechnologies Corporation † | | | | 811,211 | 44,997,874 |
| Bio-Techne Corporation | | | | 46,690 | 15,170,048 |
| Repligen Corporation † | | | | 355,320 | 71,064,000 |
| Sotera Health Company † | | | | 916,609 | 23,914,329 |
| | | | | | 155,146,251 |
| Pharmaceuticals: 1.50% | | | | | |
| Horizon Therapeutics plc † | | | | 202,000 | 14,640,960 |
| Pacira Pharmaceuticals Incorporated † | | | | 618,680 | 40,882,374 |
| Zoetis Incorporated | | | | 203,310 | 31,360,568 |
| | | | | | 86,883,902 |
| Industrials: 8.46% | | | | | |
| Building products: 0.29% | | | | | |
| The AZEK Company Incorporated † | | | | 416,529 | 16,615,342 |
| Commercial services & supplies: 2.82% | | | | | |
| Casella Waste Systems Incorporated Class A † | | | | 623,014 | 35,661,321 |
| Copart Incorporated † | | | | 764,750 | 83,931,313 |
| Waste Connections Incorporated | | | | 444,695 | 43,806,904 |
| | | | | | 163,399,538 |
| Electrical equipment: 1.71% | | | | | |
| Bloom Energy Corporation Class A † | | | | 968,200 | 33,799,862 |
| Generac Holdings Incorporated † | | | | 163,468 | 40,281,785 |
| Plug Power Incorporated † | | | | 329,500 | 20,814,515 |
| Shoals Technologies Group Class A † | | | | 119,730 | 4,062,439 |
| | | | | | 98,958,601 |
| Professional services: 0.96% | | | | | |
| CoStar Group Incorporated † | | | | 62,010 | 55,791,017 |
The accompanying notes are an integral part of these financial statements.
8 | Wells Fargo Growth Fund
Portfolio of investments—January 31, 2021 (unaudited)
| | | | | Shares | Value |
| Road & rail: 2.68% | | | | | |
| CSX Corporation | | | | 545,756 | $ 46,801,306 |
| Norfolk Southern Corporation | | | | 297,660 | 70,432,309 |
| Union Pacific Corporation | | | | 190,500 | 37,618,035 |
| | | | | | 154,851,650 |
| Information technology: 42.63% | | | | | |
| IT services: 13.72% | | | | | |
| Affirm Holdings Incorporated † | | | | 27,194 | 2,708,250 |
| Global Payments Incorporated | | | | 459,940 | 81,188,609 |
| MasterCard Incorporated Class A | | | | 476,680 | 150,769,117 |
| MongoDB Incorporated † | | | | 258,420 | 95,514,616 |
| PayPal Holdings Incorporated † | | | | 732,790 | 171,700,025 |
| Shopify Incorporated Class A † | | | | 2,800 | 3,076,052 |
| Snowflake Incorporated Class A † | | | | 56,585 | 15,416,583 |
| Switch Incorporated Class A | | | | 2,895,325 | 49,857,497 |
| Twilio Incorporated Class A † | | | | 366,509 | 131,734,330 |
| Visa Incorporated Class A | | | | 477,750 | 92,325,188 |
| | | | | | 794,290,267 |
| Semiconductors & semiconductor equipment: 4.50% | | | | | |
| Allegro MicroSystems Incorporated † | | | | 378,752 | 10,574,756 |
| Microchip Technology Incorporated | | | | 831,830 | 113,220,381 |
| Monolithic Power Systems Incorporated | | | | 311,270 | 110,591,118 |
| Texas Instruments Incorporated | | | | 158,280 | 26,225,413 |
| | | | | | 260,611,668 |
| Software: 20.99% | | | | | |
| Atlassian Corporation plc Class A † | | | | 78,600 | 18,166,818 |
| C3.ai Incorporated Class A †« | | | | 8,285 | 1,156,586 |
| Cloudflare Incorporated Class A † | | | | 423,992 | 32,503,227 |
| Dynatrace Incorporated † | | | | 2,406,582 | 99,897,219 |
| Envestnet Incorporated † | | | | 1,393,570 | 106,928,626 |
| Everbridge Incorporated † | | | | 687,640 | 91,407,985 |
| HubSpot Incorporated † | | | | 130,540 | 48,586,988 |
| Jamf Holding Corporation † | | | | 1,028,909 | 37,997,609 |
| Microsoft Corporation | | | | 1,532,830 | 355,555,247 |
| Q2 Holdings Incorporated † | | | | 432,300 | 55,330,077 |
| Rapid7 Incorporated † | | | | 698,200 | 60,617,724 |
| RingCentral Incorporated Class A † | | | | 156,900 | 58,511,148 |
| ServiceNow Incorporated † | | | | 79,160 | 42,996,546 |
| Splunk Incorporated † | | | | 293,790 | 48,484,164 |
| The Trade Desk Incorporated † | | | | 68,020 | 52,102,640 |
| Unity Software Incorporated † | | | | 77,094 | 11,550,223 |
| Vertex Incorporated Class A † | | | | 1,046,735 | 34,385,245 |
| Zendesk Incorporated † | | | | 409,000 | 58,994,160 |
| | | | | | 1,215,172,232 |
| Technology hardware, storage & peripherals: 3.42% | | | | | |
| Apple Incorporated | | | | 1,499,810 | 197,914,928 |
The accompanying notes are an integral part of these financial statements.
Wells Fargo Growth Fund | 9
Portfolio of investments—January 31, 2021 (unaudited)
| | | | | Shares | Value |
| Materials: 1.65% | | | | | |
| Chemicals: 1.65% | | | | | |
| Air Products & Chemicals Incorporated | | | | 122,470 | $ 32,670,097 |
| Linde plc | | | | 255,680 | 62,743,872 |
| | | | | | 95,413,969 |
| Total Common stocks (Cost $2,161,567,932) | | | | | 5,786,224,743 |
| | | Yield | | | |
| Short-term investments: 0.76% | | | | | |
| Investment companies: 0.76% | | | | | |
| Securities Lending Cash Investments LLC ♠∩∞ | | 0.10% | | 43,000,170 | 43,000,170 |
| Wells Fargo Government Money Market Fund Select Class ♠∞ | | 0.03 | | 1,171,796 | 1,171,796 |
| Total Short-term investments (Cost $44,171,966) | | | | | 44,171,966 |
| Total investments in securities (Cost $2,205,739,898) | 100.72% | | | | 5,830,396,709 |
| Other assets and liabilities, net | (0.72) | | | | (41,579,202) |
| Total net assets | 100.00% | | | | $5,788,817,507 |
| † | Non-income-earning security |
| « | All or a portion of this security is on loan. |
| ♠ | The issuer of the security is an affiliated person of the Fund as defined in the Investment Company Act of 1940. |
| ∩ | The investment is a non-registered investment company purchased with cash collateral received from securities on loan. |
| ∞ | The rate represents the 7-day annualized yield at period end. |
Investments in affiliates
An affiliated investment is an investment in which the Fund owns at least 5% of the outstanding voting shares of the issuer or as a result of other relationships, such as the Fund and the issuer having the same investment manager. Transactions with issuers that were either affiliated persons of the Fund at the beginning of the period or the end of the period were as follows:
| | Value,
beginning of
period | Purchases | Sales
proceeds | Net
realized
gains
(losses) | | Net
change in
unrealized
gains
(losses) | | Value,
end of
period | | % of
net
assets | Shares,
end
of period | Income
from
affiliated
securities |
| Short-term investments | | | | | | | | | | | | |
| Investment companies | | | | | | | | | | | | |
| Securities Lending Cash Investments LLC | $ 500 | $349,153,610 | $(306,153,940) | $0 | | $0 | | $ 43,000,170 | | | 43,000,170 | $ 27,927# |
| Wells Fargo Government Money Market Fund Select Class | 4,136,432 | 354,352,455 | (357,317,091) | 0 | | 0 | | 1,171,796 | | | 1,171,796 | 2,858 |
| | | | | $0 | | $0 | | $44,171,966 | | 0.76% | | $30,785 |
| # | Amount shown represents income before fees and rebates. |
The accompanying notes are an integral part of these financial statements.
10 | Wells Fargo Growth Fund
Statement of assets and liabilities—January 31, 2021 (unaudited)
| | |
| Assets | |
Investments in unaffiliated securities (including $42,095,796 of securities loaned), at value (cost $2,161,567,932)
| $ 5,786,224,743 |
Investments in affiliated securites, at value (cost $44,171,966)
| 44,171,966 |
Receivable for investments sold
| 18,858,222 |
Receivable for Fund shares sold
| 4,074,490 |
Receivable for dividends
| 601,546 |
Receivable for securities lending income, net
| 87,278 |
Prepaid expenses and other assets
| 38,896 |
Total assets
| 5,854,057,141 |
| Liabilities | |
Payable upon receipt of securities loaned
| 42,999,670 |
Payable for Fund shares redeemed
| 10,867,079 |
Payable for investments purchased
| 5,631,274 |
Management fee payable
| 3,282,503 |
Administration fees payable
| 824,523 |
Distribution fee payable
| 27,894 |
Trustees’ fees and expenses payable
| 2,889 |
Accrued expenses and other liabilities
| 1,603,802 |
Total liabilities
| 65,239,634 |
Total net assets
| $5,788,817,507 |
| Net assets consist of | |
Paid-in capital
| $ 1,918,919,230 |
Total distributable earnings
| 3,869,898,277 |
Total net assets
| $5,788,817,507 |
| Computation of net asset value and offering price per share | |
Net assets – Class A
| $ 2,881,998,354 |
Shares outstanding – Class A1
| 68,338,495 |
Net asset value per share – Class A
| $42.17 |
Maximum offering price per share – Class A2
| $44.74 |
Net assets – Class C
| $ 41,926,458 |
Shares outstanding – Class C1
| 1,532,993 |
Net asset value per share – Class C
| $27.35 |
Net assets – Class R6
| $ 441,262,835 |
Shares outstanding – Class R61
| 7,549,353 |
Net asset value per share – Class R6
| $58.45 |
Net assets – Administrator Class
| $ 633,594,372 |
Shares outstanding – Administrator Class1
| 12,277,857 |
Net asset value per share – Administrator Class
| $51.60 |
Net assets – Institutional Class
| $ 1,790,035,488 |
Shares outstanding – Institutional Class1
| 30,770,736 |
Net asset value per share – Institutional Class
| $58.17 |
| 1 | The Fund has an unlimited number of authorized shares. |
| 2 | Maximum offering price is computed as 100/94.25 of net asset value. On investments of $50,000 or more, the offering price is reduced. |
The accompanying notes are an integral part of these financial statements.
Wells Fargo Growth Fund | 11
Statement of operations—six months ended January 31, 2021 (unaudited)
| | |
| Investment income | |
Dividends (net of foreign withholdings taxes of $34,669)
| $ 8,562,941 |
Securities lending income from affiliates, net
| 1,264,425 |
Income from affiliated securities
| 2,858 |
Total investment income
| 9,830,224 |
| Expenses | |
Management fee
| 18,976,486 |
| Administration fees | |
Class A
| 2,827,036 |
Class C
| 85,383 |
Class R6
| 63,047 |
Administrator Class
| 391,625 |
Institutional Class
| 1,108,313 |
| Shareholder servicing fees | |
Class A
| 3,365,520 |
Class C
| 101,647 |
Administrator Class
| 753,124 |
| Distribution fee | |
Class C
| 304,302 |
Custody and accounting fees
| 87,538 |
Professional fees
| 24,066 |
Registration fees
| 59,836 |
Shareholder report expenses
| 62,238 |
Trustees’ fees and expenses
| 9,707 |
Other fees and expenses
| 54,468 |
Total expenses
| 28,274,336 |
| Less: Fee waivers and/or expense reimbursements | |
Fund-level
| (584,394) |
Class A
| (291,440) |
Class C
| (3) |
Class R6
| (32,672) |
Administrator Class
| (181,398) |
Institutional Class
| (343,540) |
Net expenses
| 26,840,889 |
Net investment loss
| (17,010,665) |
Payment from affiliate
| 2,016,641 |
| Realized and unrealized gains (losses) on investments | |
Net realized gains on investments
| 518,894,575 |
Net change in unrealized gains (losses) on investments
| 559,051,513 |
Net realized and unrealized gains (losses) on investments
| 1,077,946,088 |
Net increase in net assets resulting from operations
| 1,062,952,064 |
The accompanying notes are an integral part of these financial statements.
12 | Wells Fargo Growth Fund
Statement of changes in net assets
| | |
| | Six months ended
January 31, 2021
(unaudited) | Year ended
July 31, 2020 |
| Operations | | | | |
Net investment loss
| | $ (17,010,665) | | $ (19,740,954) |
Payment from affiliate
| | 2,016,641 | | 0 |
Net realized gains on investments
| | 518,894,575 | | 491,576,159 |
Net change in unrealized gains (losses) on investments
| | 559,051,513 | | 638,779,053 |
Net increase in net assets resulting from operations
| | 1,062,952,064 | | 1,110,614,258 |
| Distributions to shareholders from | | | | |
| Net investment income and net realized gains | | | | |
Class A
| | (358,619,034) | | (247,668,290) |
Class C
| | (7,818,137) | | (20,979,782) |
Class R6
| | (42,602,746) | | (31,160,181) |
Administrator Class
| | (66,234,491) | | (55,248,543) |
Institutional Class
| | (166,987,346) | | (133,918,973) |
Total distributions to shareholders
| | (642,261,754) | | (488,975,769) |
| Capital share transactions | Shares | | Shares | |
| Proceeds from shares sold | | | | |
Class A
| 3,374,215 | 147,079,887 | 3,604,965 | 123,362,300 |
Class C
| 137,810 | 3,969,861 | 559,222 | 12,911,460 |
Class R6
| 1,180,827 | 67,994,436 | 1,488,420 | 65,868,480 |
Administrator Class
| 1,009,260 | 51,550,687 | 2,511,135 | 99,163,143 |
Institutional Class
| 2,215,338 | 127,764,346 | 6,059,936 | 267,887,037 |
| | | 398,359,217 | | 569,192,420 |
| Reinvestment of distributions | | | | |
Class A
| 8,547,067 | 345,130,553 | 7,496,110 | 239,800,544 |
Class C
| 276,129 | 7,240,102 | 799,568 | 17,614,481 |
Class R6
| 712,832 | 39,868,693 | 688,571 | 29,298,699 |
Administrator Class
| 1,326,828 | 65,545,322 | 1,435,464 | 54,762,934 |
Institutional Class
| 2,893,642 | 161,089,029 | 3,048,613 | 129,230,698 |
| | | 618,873,699 | | 470,707,356 |
| Payment for shares redeemed | | | | |
Class A
| (4,876,748) | (210,580,109) | (9,330,225) | (310,801,661) |
Class C
| (3,058,532) | (94,622,080) | (3,213,997) | (78,810,374) |
Class R6
| (1,710,711) | (98,242,712) | (2,167,510) | (94,595,348) |
Administrator Class
| (1,803,931) | (92,146,596) | (5,715,194) | (225,497,878) |
Institutional Class
| (4,697,401) | (269,385,898) | (11,657,374) | (511,473,406) |
| | | (764,977,395) | | (1,221,178,667) |
Net increase (decrease) in net assets resulting from capital share transactions
| | 252,255,521 | | (181,278,891) |
Total increase in net assets
| | 672,945,831 | | 440,359,598 |
| Net assets | | | | |
Beginning of period
| | 5,115,871,676 | | 4,675,512,078 |
End of period
| | $5,788,817,507 | | $ 5,115,871,676 |
The accompanying notes are an integral part of these financial statements.
Wells Fargo Growth Fund | 13
Financial highlights
(For a share outstanding throughout each period)
| | | Year ended July 31 |
| Class A | Six months ended
January 31, 2021
(unaudited) | 2020 | 2019 | 2018 | 2017 | 2016 |
Net asset value, beginning of period
| $39.86 | $35.56 | $38.67 | $40.38 | $42.28 | $49.50 |
Net investment loss
| (0.17) 1 | (0.19) | (0.13) | (0.12) | (0.19) 1 | (0.20) 1 |
Payment from affiliate
| 0.00 2 | 0.00 | 0.00 | 0.00 | 0.00 | 0.00 |
Net realized and unrealized gains (losses) on investments
| 8.38 | 8.77 | 3.73 | 9.49 | 5.61 | (0.99) |
Total from investment operations
| 8.21 | 8.58 | 3.60 | 9.37 | 5.42 | (1.19) |
| Distributions to shareholders from | | | | | | |
Net realized gains
| (5.90) | (4.28) | (6.71) | (11.08) | (7.32) | (6.03) |
Net asset value, end of period
| $42.17 | $39.86 | $35.56 | $38.67 | $40.38 | $42.28 |
Total return3
| 21.26% 4 | 27.08% | 13.55% | 27.66% | 15.95% | (1.69)% |
| Ratios to average net assets (annualized) | | | | | | |
Gross expenses
| 1.16% | 1.17% | 1.18% | 1.18% | 1.17% | 1.15% |
Net expenses
| 1.14% | 1.14% | 1.16% | 1.16% | 1.16% | 1.14% |
Net investment loss
| (0.78)% | (0.59)% | (0.45)% | (0.45)% | (0.49)% | (0.49)% |
| Supplemental data | | | | | | |
Portfolio turnover rate
| 17% | 37% | 39% | 37% | 42% | 38% |
Net assets, end of period (000s omitted)
| $2,881,998 | $2,443,132 | $2,116,542 | $2,142,855 | $1,950,551 | $2,582,955 |
| 1 | Calculated based upon average shares outstanding |
| 2 | Amount is less than $0.005. |
| 3 | Total return calculations do not include any sales charges. Returns for periods of less than one year are not annualized. |
| 4 | During the six months ended January 31, 2021, the Fund received a payment from an affiliate which had a 0.01% impact on the total return. See Note 4 in the Notes to Financial Statements for additional information. |
The accompanying notes are an integral part of these financial statements.
14 | Wells Fargo Growth Fund
Financial highlights
(For a share outstanding throughout each period)
| | | Year ended July 31 |
| Class C | Six months ended
January 31, 2021
(unaudited) | 2020 | 2019 | 2018 | 2017 | 2016 |
Net asset value, beginning of period
| $27.32 | $25.87 | $30.33 | $34.05 | $37.07 | $44.51 |
Net investment loss
| (0.22) 1 | (0.32) 1 | (0.31) 1 | (0.33) | (0.41) 1 | (0.46) 1 |
Payment from affiliate
| 1.16 | 0.00 | 0.00 | 0.00 | 0.00 | 0.00 |
Net realized and unrealized gains (losses) on investments
| 4.99 | 6.05 | 2.56 | 7.69 | 4.71 | (0.95) |
Total from investment operations
| 5.93 | 5.73 | 2.25 | 7.36 | 4.30 | (1.41) |
| Distributions to shareholders from | | | | | | |
Net realized gains
| (5.90) | (4.28) | (6.71) | (11.08) | (7.32) | (6.03) |
Net asset value, end of period
| $27.35 | $27.32 | $25.87 | $30.33 | $34.05 | $37.07 |
Total return2
| 22.65% 3 | 26.11% | 12.68% | 26.73% | 15.05% | (2.44)% |
| Ratios to average net assets (annualized) | | | | | | |
Gross expenses
| 1.91% | 1.92% | 1.93% | 1.93% | 1.92% | 1.90% |
Net expenses
| 1.91% | 1.91% | 1.91% | 1.91% | 1.91% | 1.89% |
Net investment loss
| (1.54)% | (1.35)% | (1.19)% | (1.19)% | (1.23)% | (1.24)% |
| Supplemental data | | | | | | |
Portfolio turnover rate
| 17% | 37% | 39% | 37% | 42% | 38% |
Net assets, end of period (000s omitted)
| $41,926 | $114,123 | $156,056 | $185,346 | $205,607 | $321,032 |
| 1 | Calculated based upon average shares outstanding |
| 2 | Total return calculations do not include any sales charges. Returns for periods of less than one year are not annualized. |
| 3 | During the six months ended January 31, 2021, the Fund received a payment from an affiliate which had a 5.21% impact on the total return. See Note 4 in the Notes to Financial Statements for additional information. |
The accompanying notes are an integral part of these financial statements.
Wells Fargo Growth Fund | 15
Financial highlights
(For a share outstanding throughout each period)
| | | Year ended July 31 |
| Class R6 | Six months ended
January 31, 2021
(unaudited) | 2020 | 2019 | 2018 | 2017 | 2016 1 |
Net asset value, beginning of period
| $53.17 | $45.84 | $47.53 | $47.13 | $47.90 | $48.97 |
Net investment income (loss)
| (0.10) | (0.07) | 0.00 2,3 | (0.01) 2 | (0.02) 2 | (0.02) |
Net realized and unrealized gains on investments
| 11.28 | 11.68 | 5.02 | 11.49 | 6.57 | 4.98 |
Total from investment operations
| 11.18 | 11.61 | 5.02 | 11.48 | 6.55 | 4.96 |
| Distributions to shareholders from | | | | | | |
Net realized gains
| (5.90) | (4.28) | (6.71) | (11.08) | (7.32) | (6.03) |
Net asset value, end of period
| $58.45 | $53.17 | $45.84 | $47.53 | $47.13 | $47.90 |
Total return4
| 21.53% | 27.65% | 14.06% | 28.26% | 16.49% | 10.89% |
| Ratios to average net assets (annualized) | | | | | | |
Gross expenses
| 0.73% | 0.74% | 0.75% | 0.75% | 0.74% | 0.74% |
Net expenses
| 0.70% | 0.70% | 0.70% | 0.70% | 0.70% | 0.70% |
Net investment income (loss)
| (0.34)% | (0.15)% | 0.00% | (0.02)% | (0.05)% | (0.23)% |
| Supplemental data | | | | | | |
Portfolio turnover rate
| 17% | 37% | 39% | 37% | 42% | 38% |
Net assets, end of period (000s omitted)
| $441,263 | $391,705 | $337,260 | $242,838 | $49,454 | $30,906 |
| 1 | For the period from September 30, 2015 (commencement of class operations) to July 31, 2016 |
| 2 | Calculated based upon average shares outstanding |
| 3 | Amount is less than $0.005. |
| 4 | Returns for periods of less than one year are not annualized. |
The accompanying notes are an integral part of these financial statements.
16 | Wells Fargo Growth Fund
Financial highlights
(For a share outstanding throughout each period)
| | | Year ended July 31 |
| Administrator Class | Six months ended
January 31, 2021
(unaudited) | 2020 | 2019 | 2018 | 2017 | 2016 |
Net asset value, beginning of period
| $47.60 | $41.58 | $43.89 | $44.40 | $45.66 | $52.86 |
Net investment loss
| (0.15) 1 | (0.16) 1 | (0.10) 1 | (0.11) 1 | (0.11) 1 | (0.14) 1 |
Net realized and unrealized gains (losses) on investments
| 10.05 | 10.46 | 4.50 | 10.68 | 6.17 | (1.03) |
Total from investment operations
| 9.90 | 10.30 | 4.40 | 10.57 | 6.06 | (1.17) |
| Distributions to shareholders from | | | | | | |
Net realized gains
| (5.90) | (4.28) | (6.71) | (11.08) | (7.32) | (6.03) |
Net asset value, end of period
| $51.60 | $47.60 | $41.58 | $43.89 | $44.40 | $45.66 |
Total return2
| 21.38% | 27.31% | 13.78% | 27.90% | 16.20% | (1.53)% |
| Ratios to average net assets (annualized) | | | | | | |
Gross expenses
| 1.08% | 1.09% | 1.10% | 1.10% | 1.09% | 1.07% |
Net expenses
| 0.96% | 0.96% | 0.96% | 0.96% | 0.96% | 0.96% |
Net investment loss
| (0.60)% | (0.40)% | (0.25)% | (0.24)% | (0.27)% | (0.31)% |
| Supplemental data | | | | | | |
Portfolio turnover rate
| 17% | 37% | 39% | 37% | 42% | 38% |
Net assets, end of period (000s omitted)
| $633,594 | $559,109 | $561,900 | $564,391 | $637,987 | $1,528,288 |
| 1 | Calculated based upon average shares outstanding |
| 2 | Returns for periods of less than one year are not annualized. |
The accompanying notes are an integral part of these financial statements.
Wells Fargo Growth Fund | 17
Financial highlights
(For a share outstanding throughout each period)
| | | Year ended July 31 |
| Institutional Class | Six months ended
January 31, 2021
(unaudited) | 2020 | 2019 | 2018 | 2017 | 2016 |
Net asset value, beginning of period
| $52.96 | $45.70 | $47.43 | $47.07 | $47.87 | $54.99 |
Net investment loss
| (0.11) 1 | (0.09) 1 | (0.01) 1 | (0.02) 1 | (0.04) 1 | (0.05) 1 |
Net realized and unrealized gains (losses) on investments
| 11.22 | 11.63 | 4.99 | 11.46 | 6.56 | (1.04) |
Total from investment operations
| 11.11 | 11.54 | 4.98 | 11.44 | 6.52 | (1.09) |
| Distributions to shareholders from | | | | | | |
Net realized gains
| (5.90) | (4.28) | (6.71) | (11.08) | (7.32) | (6.03) |
Net asset value, end of period
| $58.17 | $52.96 | $45.70 | $47.43 | $47.07 | $47.87 |
Total return2
| 21.48% | 27.58% | 14.00% | 28.21% | 16.44% | 1.31% |
| Ratios to average net assets (annualized) | | | | | | |
Gross expenses
| 0.83% | 0.84% | 0.85% | 0.85% | 0.84% | 0.82% |
Net expenses
| 0.75% | 0.75% | 0.75% | 0.75% | 0.75% | 0.75% |
Net investment loss
| (0.39)% | (0.20)% | (0.03)% | (0.03)% | (0.08)% | (0.10)% |
| Supplemental data | | | | | | |
Portfolio turnover rate
| 17% | 37% | 39% | 37% | 42% | 38% |
Net assets, end of period (000s omitted)
| $1,790,035 | $1,607,803 | $1,503,753 | $1,614,575 | $1,655,724 | $2,398,134 |
| 1 | Calculated based upon average shares outstanding |
| 2 | Returns for periods of less than one year are not annualized. |
The accompanying notes are an integral part of these financial statements.
18 | Wells Fargo Growth Fund
Notes to financial statements (unaudited)
1. ORGANIZATION
Wells Fargo Funds Trust (the “Trust”), a Delaware statutory trust organized on March 10, 1999, is an open-end management investment company registered under the Investment Company Act of 1940, as amended (the “1940 Act”). As an investment company, the Trust follows the accounting and reporting guidance in Financial Accounting Standards Board (“FASB”) Accounting Standards Codification Topic 946, Financial Services – Investment Companies. These financial statements report on the Wells Fargo Growth Fund (the “Fund”) which is a diversified series of the Trust.
2. SIGNIFICANT ACCOUNTING POLICIES
The following significant accounting policies, which are consistently followed in the preparation of the financial statements of the Fund, are in conformity with U.S. generally accepted accounting principles which require management to make estimates and assumptions that affect the reported amounts of assets and liabilities, disclosure of contingent assets and liabilities at the date of the financial statements, and the reported amounts of income and expenses during the reporting period. Actual results could differ from those estimates.
Securities valuation
All investments are valued each business day as of the close of regular trading on the New York Stock Exchange (generally 4 p.m. Eastern Time), although the Fund may deviate from this calculation time under unusual or unexpected circumstances.
Equity securities that are listed on a foreign or domestic exchange or market are valued at the official closing price or, if none, the last sales price. If no sale occurs on the principal exchange or market that day, a fair value price will be determined in accordance with the Fund’s Valuation Procedures.
Investments in registered open-end investment companies are valued at net asset value. Interests in non-registered investment companies that are redeemable at net asset value are fair valued normally at net asset value.
Investments which are not valued using any of the methods discussed above are valued at their fair value, as determined in good faith by the Board of Trustees. The Board of Trustees has established a Valuation Committee comprised of the Trustees and has delegated to it the authority to take any actions regarding the valuation of portfolio securities that the Valuation Committee deems necessary or appropriate, including determining the fair value of portfolio securities, unless the determination has been delegated to the Wells Fargo Asset Management Pricing Committee at Wells Fargo Funds Management, LLC (“Funds Management”). The Board of Trustees retains the authority to make or ratify any valuation decisions or approve any changes to the Valuation Procedures as it deems appropriate. On a quarterly basis, the Board of Trustees receives reports on any valuation actions taken by the Valuation Committee or the Wells Fargo Asset Management Pricing Committee which may include items for ratification.
Foreign currency translation
The accounting records of the Fund are maintained in U.S. dollars. The values of other assets and liabilities denominated in foreign currencies are translated into U.S. dollars at rates provided by an independent foreign currency pricing source at a time each business day specified by the Wells Fargo Asset Management Pricing Committee. Purchases and sales of securities, and income and expenses are converted at the rate of exchange on the respective dates of such transactions. Net realized foreign exchange gains or losses arise from sales of foreign currencies, currency gains or losses realized between the trade and settlement dates on securities transactions, and the difference between the amounts of dividends, interest and foreign withholding taxes recorded and the U.S. dollar equivalent of the amounts actually paid or received. Net unrealized foreign exchange gains and losses arise from changes in the fair value of assets and liabilities other than investments in securities resulting from changes in exchange rates. The changes in net assets arising from changes in exchange rates of securities and the changes in net assets resulting from changes in market prices of securities are not separately presented. Such changes are included in net realized and unrealized gains or losses from investments.
Securities lending
The Fund may lend its securities from time to time in order to earn additional income in the form of fees or interest on securities received as collateral or the investment of any cash received as collateral. When securities are on loan, the Fund receives interest or dividends on those securities. Cash collateral received in connection with its securities lending transactions is invested in Securities Lending Cash Investments, LLC (the “Securities Lending Fund”). Investments in Securities Lending Fund are valued at the evaluated bid price provided by an independent pricing service. Income earned from investment in the Securities Lending Fund, if any, is included in securities lending income from affiliates (net of fees and rebates) on the Statement of Operations.
Wells Fargo Growth Fund | 19
Notes to financial statements (unaudited)
In a securities lending transaction, the net asset value of the Fund is affected by an increase or decrease in the value of the securities loaned and by an increase or decrease in the value of the instrument in which collateral is invested. The amount of securities lending activity undertaken by the Fund fluctuates from time to time. The Fund has the right under the lending agreement to recover the securities from the borrower on demand. In the event of default or bankruptcy by the borrower, the Fund may be prevented from recovering the loaned securities or gaining access to the collateral or may experience delays or costs in doing so. In such an event, the terms of the agreement allow the unaffiliated securities lending agent to use the collateral to purchase replacement securities on behalf of the Fund or pay the Fund the market value of the loaned securities. The Fund bears the risk of loss with respect to depreciation of its investment of the cash collateral.
Security transactions and income recognition
Securities transactions are recorded on a trade date basis. Realized gains or losses are recorded on the basis of identified cost.
Dividend income is recognized on the ex-dividend date. Dividend income is recorded net of foreign taxes withheld where recovery of such taxes is not assured.
Distributions to shareholders
Distributions to shareholders from net investment income and any net realized gains are recorded on the ex-dividend date and paid at least annually. Such distributions are determined in accordance with income tax regulations and may differ from U.S. generally accepted accounting principles. Dividend sources are estimated at the time of declaration. The tax character of distributions is determined as of the Fund’s fiscal year end. Therefore, a portion of the Fund’s distributions made prior to the Fund’s fiscal year end may be categorized as a tax return of capital at year end.
Federal and other taxes
The Fund intends to continue to qualify as a regulated investment company by distributing substantially all of its investment company taxable income and any net realized capital gains (after reduction for capital loss carryforwards) sufficient to relieve it from all, or substantially all, federal income taxes. Accordingly, no provision for federal income taxes was required.
The Fund’s income and federal excise tax returns and all financial records supporting those returns for the prior three fiscal years are subject to examination by the federal and Delaware revenue authorities. Management has analyzed the Fund’s tax positions taken on federal, state, and foreign tax returns for all open tax years and does not believe that there are any uncertain tax positions that require recognition of a tax liability.
As of January 31, 2021, the aggregate cost of all investments for federal income tax purposes was $2,206,203,886 and the unrealized gains (losses) consisted of:
| Gross unrealized gains | $3,627,946,736 |
| Gross unrealized losses | (3,753,913) |
| Net unrealized gains | $3,624,192,823 |
As of July 31, 2020, the Fund had a qualified late-year ordinary loss of $22,780,204 which was recognized on the first day of the current fiscal year.
Class allocations
The separate classes of shares offered by the Fund differ principally in applicable sales charges, distribution, shareholder servicing, and administration fees. Class specific expenses are charged directly to that share class. Investment income, common fund-level expenses, and realized and unrealized gains (losses) on investments are allocated daily to each class of shares based on the relative proportion of net assets of each class.
20 | Wells Fargo Growth Fund
Notes to financial statements (unaudited)
3. FAIR VALUATION MEASUREMENTS
Fair value measurements of investments are determined within a framework that has established a fair value hierarchy based upon the various data inputs utilized in determining the value of the Fund’s investments. The three-level hierarchy gives the highest priority to unadjusted quoted prices in active markets for identical assets or liabilities (Level 1) and the lowest priority to unobservable inputs (Level 3). The Fund’s investments are classified within the fair value hierarchy based on the lowest level of input that is significant to the fair value measurement. The inputs are summarized into three broad levels as follows:
| ■ | Level 1 – quoted prices in active markets for identical securities |
| ■ | Level 2 – other significant observable inputs (including quoted prices for similar securities, interest rates, prepayment speeds, credit risk, etc.) |
| ■ | Level 3 – significant unobservable inputs (including the Fund’s own assumptions in determining the fair value of investments) |
The inputs or methodologies used for valuing investments in securities are not necessarily an indication of the risk associated with investing in those securities.
The following is a summary of the inputs used in valuing the Fund’s assets and liabilities as of January 31, 2021:
| | Quoted prices
(Level 1) | Other significant
observable inputs
(Level 2) | Significant
unobservable inputs
(Level 3) | Total |
| Assets | | | | |
| Investments in: | | | | |
| Common stocks | | | | |
| Communication services | $ 829,785,147 | $0 | $0 | $ 829,785,147 |
| Consumer discretionary | 780,285,654 | 0 | 0 | 780,285,654 |
| Consumer staples | 21,473,621 | 0 | 0 | 21,473,621 |
| Financials | 276,717,013 | 0 | 0 | 276,717,013 |
| Health care | 824,944,096 | 0 | 0 | 824,944,096 |
| Industrials | 489,616,148 | 0 | 0 | 489,616,148 |
| Information technology | 2,467,989,095 | 0 | 0 | 2,467,989,095 |
| Materials | 95,413,969 | 0 | 0 | 95,413,969 |
| Short-term investments | | | | |
| Investment companies | 44,171,966 | 0 | 0 | 44,171,966 |
| Total assets | $5,830,396,709 | $0 | $0 | $5,830,396,709 |
Additional sector, industry or geographic detail, if any, is included in the Portfolio of Investments.
For the six months ended January 31, 2021, the Fund did not have any transfers into/out of Level 3.
4. TRANSACTIONS WITH AFFILIATES
Management fee
Funds Management, an indirect wholly owned subsidiary of Wells Fargo & Company (“Wells Fargo”), is the manager of the Fund and provides advisory and fund-level administrative services under an investment management agreement. Under the investment management agreement, Funds Management is responsible for, among other services, implementing the investment objectives and strategies of the Fund, supervising the subadviser and providing fund-level administrative services in connection with the Fund’s operations. As compensation for its services under the investment management agreement, Funds Management is entitled to receive a management fee at the following annual rate based on the Fund’s average daily net assets:
Wells Fargo Growth Fund | 21
Notes to financial statements (unaudited)
| Average daily net assets | Management fee |
| First $500 million | 0.800% |
| Next $500 million | 0.750 |
| Next $1 billion | 0.700 |
| Next $2 billion | 0.675 |
| Next $1 billion | 0.650 |
| Next $3 billion | 0.640 |
| Next $2 billion | 0.615 |
| Next $2 billion | 0.605 |
| Next $4 billion | 0.580 |
| Over $16 billion | 0.555 |
For the six months ended January 31, 2021, the management fee was equivalent to an annual rate of 0.69% of the Fund’s average daily net assets.
Funds Management has retained the services of a subadviser to provide daily portfolio management to the Fund. The fee for subadvisory services is borne by Funds Management. Wells Capital Management Incorporated ("WellsCap"), an affiliate of Funds Management and an indirect wholly owned subsidiary of Wells Fargo, is the subadviser to the Fund and is entitled to receive a fee from Funds Management at an annual rate starting at 0.45% and declining to 0.30% as the average daily net assets of the Fund increase.
Administration fees
Under a class-level administration agreement, Funds Management provides class-level administrative services to the Fund, which includes paying fees and expenses for services provided by the transfer agent, sub-transfer agents, omnibus account servicers and record-keepers. As compensation for its services under the class-level administration agreement, Funds Management receives an annual fee which is calculated based on the average daily net assets of each class as follows:
| | Class-level
administration fee |
| Class A | 0.21% |
| Class C | 0.21 |
| Class R6 | 0.03 |
| Administrator Class | 0.13 |
| Institutional Class | 0.13 |
Waivers and/or expense reimbursements
Funds Management has contractually waived and/or reimbursed management and administration fees to the extent necessary to maintain certain net operating expense ratios for the Fund. When each class of the Fund has exceeded its expense cap, Funds Management has waived fees and/or reimbursed expenses from fund-level expenses on a proportionate basis and then from class specific expenses. When only certain classes exceed their expense caps, waivers and/or reimbursements are applied against class specific expenses before fund-level expenses. Funds Management has committed through November 30, 2021 to waive fees and/or reimburse expenses to the extent necessary to cap expenses. Prior to or after the commitment expiration date, the cap may be increased or the commitment to maintain the cap may be terminated only with the approval of the Board of Trustees. The expense caps are as follows:
| | Expense ratio caps |
| Class A | 1.16% |
| Class C | 1.91 |
| Class R6 | 0.70 |
| Administrator Class | 0.96 |
| Institutional Class | 0.75 |
22 | Wells Fargo Growth Fund
Notes to financial statements (unaudited)
Distribution fee
The Trust has adopted a distribution plan for Class C shares of the Fund pursuant to Rule 12b-1 under the 1940 Act. A distribution fee is charged charged to Class C shares and paid to Wells Fargo Funds Distributor, LLC (“Funds Distributor”), the principal underwriter, at an annual rate of 0.75% of the average daily net assets of Class C shares.
In addition, Funds Distributor is entitled to receive the front-end sales charge from the purchase of Class A shares and a contingent deferred sales charge on the redemption of certain Class A shares. Funds Distributor is also entitled to receive the contingent deferred sales charges from redemptions of Class C shares. For the six months ended January 31, 2021, Funds Distributor received $10,514 from the sale of Class A shares. No contingent deferred sales charges were incurred by Class A and Class C shares for the six months ended January 31, 2021.
Shareholder servicing fees
The Trust has entered into contracts with one or more shareholder servicing agents, whereby Class A, Class C, and Administrator Class of the Fund are charged a fee at an annual rate of 0.25% of the average daily net assets of each respective class. A portion of these total shareholder servicing fees were paid to affiliates of Wells Fargo.
Interfund transactions
The Fund may purchase or sell portfolio investment securities to certain other Wells Fargo affiliates pursuant to Rule 17a-7 under the 1940 Act and under procedures adopted by the Board of Trustees. The procedures have been designed to ensure that these interfund transactions, which do not incur broker commissions, are effected at current market prices.
Other transactions
On August 14, 2020, Class A and Class C of the Fund was reimbursed by Funds Management in the amount of $234,729 and $1,781,912, respectively.. The reimbursements were made in connection with resolving certain fee reimbursements.
5. INVESTMENT PORTFOLIO TRANSACTIONS
Purchases and sales of investments, excluding U.S. government obligations (if any) and short-term securities, for the six months ended January 31, 2021 were $816,350,156 and $1,217,491,439, respectively.
6. SECURITIES LENDING TRANSACTIONS
The Fund lends its securities through an unaffiliated securities lending agent and receives collateral in the form of cash or securities with a value at least equal to the value of the securities on loan. The value of the loaned securities is determined at the close of each business day and any increases or decreases in the required collateral are exchanged between the Fund and the counterparty on the next business day. Cash collateral received is invested in the Securities Lending Fund which seeks to provide a positive return compared to the daily Federal Funds Open Rate by investing in high-quality, U.S. dollar-denominated short-term money market instruments and is exempt from registration under Section 3(c)(7) of the 1940 Act. Securities Lending Fund is managed by Funds Management and is subadvised by WellsCap. Funds Management receives an advisory fee starting at 0.05% and declining to 0.01% as the average daily net assets of the Securities Lending Fund increase. All of the fees received by Funds Management are paid to WellsCap for its services as subadviser.
In the event of counterparty default or the failure of a borrower to return a loaned security, the Fund has the right to use the collateral to offset any losses incurred. As of January 31, 2021, the Fund had securities lending transactions with the following counterparties which are subject to offset:
| Counterparty | Value of
securities on
loan | Collateral
received1 | Net amount |
| Bank of America Securities Incorporated | $ 7,245,586 | $ (7,245,586) | $0 |
| Barclays Capital Incorporated | 10,559,347 | (10,559,347) | 0 |
| Citigroup Global Markets Incorporated | 12,280,522 | (12,280,522) | 0 |
| JPMorgan Securities LLC | 8,759,828 | (8,759,828) | 0 |
| Morgan Stanley & Company LLC | 334,823 | (334,823) | 0 |
| National Financial Services LLC | 2,915,690 | (2,915,690) | 0 |
1 Collateral received within this table is limited to the collateral for the net transaction with the counterparty.
Wells Fargo Growth Fund | 23
Notes to financial statements (unaudited)
7. BANK BORROWINGS
The Trust (excluding the money market funds), Wells Fargo Master Trust and Wells Fargo Variable Trust are parties to a $350,000,000 revolving credit agreement whereby the Fund is permitted to use bank borrowings for temporary or emergency purposes, such as to fund shareholder redemption requests. Interest under the credit agreement is charged to the Fund based on a borrowing rate equal to the higher of the Federal Funds rate in effect on that day plus 1.25% or the overnight LIBOR rate in effect on that day plus 1.25%. In addition, an annual commitment fee equal to 0.25% of the unused balance is allocated to each participating fund.
For the six months ended January 31, 2021, there were no borrowings by the Fund under the agreement.
8. CONCENTRATION RISKS
Concentration risks result from exposure to a limited number of sectors. As of the end of the period, the Fund concentrated its portfolio in investments related to the information technology sector. A fund that invests a substantial portion of its assets in any sector may be more affected by changes in that sector than would be a fund whose investments are not heavily weighted in any sector.
9. INDEMNIFICATION
Under the Fund's organizational documents, the officers and Trustees have been granted certain indemnification rights against certain liabilities that may arise out of performance of their duties to the Fund. The Fund has entered into a separate agreement with each Trustee that converts indemnification rights currently existing under the Fund’s organizational documents into contractual rights that cannot be changed in the future without the consent of the Trustee. Additionally, in the normal course of business, the Fund may enter into contracts with service providers that contain a variety of indemnification clauses. The Fund’s maximum exposure under these arrangements is dependent on future claims that may be made against the Fund and, therefore, cannot be estimated.
10. NEW ACCOUNTING PRONOUNCEMENT
In August 2018, FASB issued Accounting Standards Update (“ASU”) No. 2018-13, Fair Value Measurement (Topic 820) Disclosure Framework - Changes to the Disclosure Requirements for Fair Value Measurement. ASU 2018-13 updates the disclosure requirements on fair value measurements in Topic 820, Fair Value Measurements. The amendments are effective for fiscal years, and interim periods within those fiscal years, beginning after December 15, 2019. Management has adopted this guidance which did not have a material impact on the financial statements.
11. CORONAVIRUS (COVID-19) PANDEMIC
On March 11, 2020, the World Health Organization announced that it had made the assessment that coronavirus disease 2019 (“COVID-19”) is a pandemic. The impacts of COVID-19 are affecting the entire global economy, individual companies and investment products, the funds, and the market in general. There is significant uncertainty around the extent and duration of business disruptions related to COVID-19 and the impacts may be short term or may last for an extended period of time. The risk of further spreading of COVID-19 has led to significant uncertainty and volatility in the financial markets.
12. SUBSEQUENT EVENT
On February 23, 2021, Wells Fargo announced that it has entered into a definitive agreement to sell Wells Fargo Asset Management (“WFAM”) to GTCR LLC and Reverence Capital Partners, L.P. WFAM is the trade name used by the asset management businesses of Wells Fargo and includes Wells Fargo Funds Management, LLC, the investment manager to the Fund, Wells Capital Management Incorporated and Wells Fargo Asset Management (International) Limited, both registered investment advisers providing sub-advisory services to certain funds, and Wells Fargo Funds Distributor, LLC, the Fund’s principal underwriter. As part of the transaction, Wells Fargo will own a 9.9% equity interest and will continue to serve as an important client and distribution partner.
Consummation of the transaction will result in the automatic termination of the Fund’s investment management agreement and sub-advisory agreement. The Fund’s Board of Trustees will be asked to approve new investment management arrangements with the new company. If approved by the Board, the new investment management arrangements with the new company will be presented to the shareholders of the Fund for approval, and, if approved by shareholders, would take effect upon the closing of the transaction. The transaction is expected to close in the second half of 2021, subject to customary closing conditions.
24 | Wells Fargo Growth Fund
Other information (unaudited)
PROXY VOTING INFORMATION
A description of the policies and procedures used to determine how to vote proxies relating to portfolio securities is available without charge, upon request, by calling 1-800-222-8222, visiting our website at wfam.com, or visiting the SEC website at sec.gov. Information regarding how the proxies related to portfolio securities were voted during the most recent 12-month period ended June 30 is available on the website at wfam.com or by visiting the SEC website at sec.gov.
QUARTERLY PORTFOLIO HOLDINGS INFORMATION
The Fund files its complete schedule of portfolio holdings with the SEC for the first and third quarters of each fiscal year as an exhibit to its reports on Form N-PORT. Shareholders may view the filed Form N-PORT by visiting the SEC website at sec.gov.
Wells Fargo Growth Fund | 25
Other information (unaudited)
BOARD OF TRUSTEES AND OFFICERS
Each of the Trustees and Officers listed in the table below acts in identical capacities for each fund in the Wells Fargo family of funds, which consists of 144 mutual funds comprising the Wells Fargo Funds Trust, Wells Fargo Variable Trust, Wells Fargo Master Trust and four closed-end funds (collectively the “Fund Complex”). This table should be read in conjunction with the Prospectus and the Statement of Additional Information1. The mailing address of each Trustee and Officer is 525 Market Street, 12th Floor, San Francisco, CA 94105. Each Trustee and Officer serves an indefinite term, however, each Trustee serves such term until reaching the mandatory retirement age established by the Trustees.
Independent Trustees
Name and
year of birth | Position held and
length of service* | Principal occupations during past five years or longer | Current other
public company or
investment
company
directorships |
William R. Ebsworth
(Born 1957) | Trustee,
since 2015 | Retired. From 1984 to 2013, equities analyst, portfolio manager, research director and chief investment officer at Fidelity Management and Research Company in Boston, Tokyo, and Hong Kong, and retired in 2013 as Chief Investment Officer of Fidelity Strategic Advisers, Inc. where he led a team of investment professionals managing client assets. Prior thereto, Board member of Hong Kong Securities Clearing Co., Hong Kong Options Clearing Corp., the Thailand International Fund, Ltd., Fidelity Investments Life Insurance Company, and Empire Fidelity Investments Life Insurance Company. Audit Committee Chair and Investment Committee Chair of the Vincent Memorial Hospital Endowment (non-profit organization). Mr. Ebsworth is a CFA® charterholder. | N/A |
Jane A. Freeman
(Born 1953) | Trustee,
since 2015;
Chair Liaison,
since 2018 | Retired. From 2012 to 2014 and 1999 to 2008, Chief Financial Officer of Scientific Learning Corporation. From 2008 to 2012, Ms. Freeman provided consulting services related to strategic business projects. Prior to 1999, Portfolio Manager at Rockefeller & Co. and Scudder, Stevens & Clark. Board member of the Harding Loevner Funds from 1996 to 2014, serving as both Lead Independent Director and chair of the Audit Committee. Board member of the Russell Exchange Traded Funds Trust from 2011 to 2012 and the chair of the Audit Committee. Ms. Freeman is also an inactive Chartered Financial Analyst. | N/A |
Isaiah Harris, Jr.
(Born 1952) | Trustee,
since 2009; Audit
Committee
Chair,
since 2019 | Retired. Chairman of the Board of CIGNA Corporation since 2009, and Director since 2005. From 2003 to 2011, Director of Deluxe Corporation. Prior thereto, President and CEO of BellSouth Advertising and Publishing Corp. from 2005 to 2007, President and CEO of BellSouth Enterprises from 2004 to 2005 and President of BellSouth Consumer Services from 2000 to 2003. Emeritus member of the Iowa State University Foundation Board of Governors. Emeritus Member of the Advisory Board of Iowa State University School of Business. Advisory Board Member, Palm Harbor Academy (private school). Mr. Harris is a certified public accountant (inactive status). | CIGNA Corporation |
Judith M. Johnson
(Born 1949) | Trustee,
since 2008 | Retired. Prior thereto, Chief Executive Officer and Chief Investment Officer of Minneapolis Employees Retirement Fund from 1996 to 2008. Ms. Johnson is an attorney, certified public accountant and a certified managerial accountant. | N/A |
David F. Larcker
(Born 1950) | Trustee,
since 2009 | James Irvin Miller Professor of Accounting at the Graduate School of Business (Emeritus), Stanford University, Director of the Corporate Governance Research Initiative and Senior Faculty of The Rock Center for Corporate Governance since 2006. From 2005 to 2008, Professor of Accounting at the Graduate School of Business, Stanford University. Prior thereto, Ernst & Young Professor of Accounting at The Wharton School, University of Pennsylvania from 1985 to 2005. | N/A |
26 | Wells Fargo Growth Fund
Other information (unaudited)
Name and
year of birth | Position held and
length of service* | Principal occupations during past five years or longer | Current other
public company or
investment
company
directorships |
Olivia S. Mitchell
(Born 1953) | Trustee,
since 2006;
Nominating and
Governance
Committee Chair,
since 2018 | International Foundation of Employee Benefit Plans Professor, Wharton School of the University of Pennsylvania since 1993. Director of Wharton’s Pension Research Council and Boettner Center on Pensions & Retirement Research, and Research Associate at the National Bureau of Economic Research. Previously, Cornell University Professor from 1978 to 1993. | N/A |
Timothy J. Penny
(Born 1951) | Trustee,
since 1996;
Chair,
since 2018 | President and Chief Executive Officer of Southern Minnesota Initiative Foundation, a non-profit organization, since 2007. Member of the Board of Trustees of NorthStar Education Finance, Inc., a non-profit organization, since 2007. | N/A |
James G. Polisson
(Born 1959) | Trustee,
since 2018 | Retired. Chief Marketing Officer, Source (ETF) UK Services, Ltd, from 2015 to 2017. From 2012 to 2015, Principal of The Polisson Group, LLC, a management consulting, corporate advisory and principal investing company. Chief Executive Officer and Managing Director at Russell Investments, Global Exchange Traded Funds from 2010 to 2012. Managing Director of Barclays Global Investors from 1998 to 2010 and Global Chief Marketing Officer for iShares and Barclays Global Investors from 2000 to 2010. Trustee of the San Francisco Mechanics’ Institute, a non-profit organization, from 2013 to 2015. Board member of the Russell Exchange Traded Fund Trust from 2011 to 2012. Director of Barclays Global Investors Holdings Deutschland GmbH from 2006 to 2009. Mr. Polisson is an attorney and has a retired status with the Massachusetts and District of Columbia Bar Associations. | N/A |
Pamela Wheelock
(Born 1959) | Trustee,
since January
2020; previously
Trustee from
January 2018 to
July 2019 | Board member of the Destination Medical Center Economic Development Agency, Rochester, Minnesota since 2019. Interim President of the McKnight Foundation from January to September 2020. Acting Commissioner, Minnesota Department of Human Services, July 2019 through September 2019. Human Services Manager (part-time), Minnesota Department of Human Services, October 2019 through December 2019. Chief Operating Officer, Twin Cities Habitat for Humanity from 2017 to 2019. Vice President of University Services, University of Minnesota from 2012 to 2016. Prior thereto, on the Board of Directors, Governance Committee and Finance Committee for the Minnesota Philanthropy Partners (Saint Paul Foundation) from 2012 to 2018, Interim Chief Executive Officer of Blue Cross Blue Shield of Minnesota from 2011 to 2012, Chairman of the Board from 2009 to 2012 and Board Director from 2003 to 2015. Vice President, Leadership and Community Engagement, Bush Foundation, Saint Paul, Minnesota (a private foundation) from 2009 to 2011. Executive Vice President and Chief Financial Officer, Minnesota Sports and Entertainment from 2004 to 2009 and Senior Vice President from 2002 to 2004. Executive Vice President of the Minnesota Wild Foundation from 2004 to 2008. Commissioner of Finance, State of Minnesota, from 1999 to 2002. Currently Board Chair of the Minnesota Wild Foundation since 2010. | N/A |
* Length of service dates reflect the Trustee’s commencement of service with the Trust’s predecessor entities, where applicable.
Wells Fargo Growth Fund | 27
Other information (unaudited)
Officers
Name and
year of birth | Position held and
length of service | Principal occupations during past five years or longer |
Andrew Owen
(Born 1960) | President,
since 2017 | Executive Vice President of Wells Fargo & Company and Head of Affiliated Managers, Wells Fargo Asset Management, since 2014. In addition, Mr. Owen is currently President, Chief Executive Officer and Director of Wells Fargo Funds Management, LLC since 2017. Prior thereto, Executive Vice President responsible for marketing, investments and product development for Wells Fargo Funds Management, LLC, from 2009 to 2014. |
Jeremy DePalma
(Born 1974) | Treasurer,
since 2012
(for certain funds in
the Fund Complex);
since 2021 (for
the remaining funds in the
Fund Complex) | Senior Vice President of Wells Fargo Funds Management, LLC since 2009. Senior Vice President of Evergreen Investment Management Company, LLC from 2008 to 2010 and head of the Fund Reporting and Control Team within Fund Administration from 2005 to 2010. |
Michelle Rhee
(Born 1966) | Chief Legal Officer,
since 2019 | Secretary of Wells Fargo Funds Management, LLC and Chief Legal Counsel of Wells Fargo Asset Management since 2018. Deputy General Counsel of Wells Fargo Bank, N.A. since 2020 and Assistant General Counsel of Wells Fargo Bank, N.A. from 2018 to 2020. Associate General Counsel and Managing Director of Bank of America Corporation from 2004 to 2018. |
Catherine Kennedy
(Born 1969) | Secretary,
since 2019 | Vice President of Wells Fargo Funds Management, LLC and Senior Counsel of the Wells Fargo Legal Department since 2010. Vice President and Senior Counsel of Evergreen Investment Management Company, LLC from 1998 to 2010. |
Michael H. Whitaker
(Born 1967) | Chief Compliance Officer,
since 2016 | Chief Compliance Officer of Wells Fargo Asset Management since 2016. Senior Vice President and Chief Compliance Officer for Fidelity Investments from 2007 to 2016. |
1 The Statement of Additional Information includes additional information about the Trustees and is available, without charge, upon request, by calling 1-800-222-8222 or by visiting the website at wfam.com.
28 | Wells Fargo Growth Fund
For more information
More information about Wells Fargo Funds is available free upon request. To obtain literature, please write, visit the Fund's website, or call:
Wells Fargo Funds
P.O. Box 219967
Kansas City, MO 64121-9967
Website: wfam.com
Individual investors: 1-800-222-8222
Retail investment professionals: 1-888-877-9275
Institutional investment professionals: 1-866-765-0778
This report and the financial statements contained herein are submitted for the general information of the shareholders of the Fund. If this report is used for promotional purposes, distribution of the report must be accompanied or preceded by a current prospectus. Before investing, please consider the investment objectives, risks, charges, and expenses of the investment. For a current prospectus and, if available, a summary prospectus, containing this information, call 1-800-222-8222 or visit the Fund’s website at wfam.com. Read the prospectus carefully before you invest or send money.
Wells Fargo Asset Management (WFAM) is the trade name for certain investment advisory/management firms owned by Wells Fargo & Company. These firms include but are not limited to Wells Capital Management Incorporated and Wells Fargo Funds Management, LLC. Certain products managed by WFAM entities are distributed by Wells Fargo Funds Distributor, LLC (a broker-dealer and Member FINRA).
This material is for general informational and educational purposes only and is NOT intended to provide investment advice or a recommendation of any kind— including a recommendation for any specific investment, strategy, or plan.
INVESTMENT PRODUCTS: NOT FDIC INSURED ■ NO BANK GUARANTEE ■ MAY LOSE VALUE
© 2021 Wells Fargo & Company. All rights reserved.
PAR-0221-00366 03-22
SA206/SAR206 01-21
Semi-Annual Report
January 31, 2021
Wells Fargo Large Cap Core Fund
Reduce clutter.
Save trees.
Sign up for electronic delivery of prospectuses and shareholder reports at wellsfargo.com/ advantagedelivery
The views expressed and any forward-looking statements are as of January 31, 2021, unless otherwise noted, and are those of the Fund's portfolio managers and/or Wells Fargo Asset Management. Discussions of individual securities or the markets generally are not intended as individual recommendations. Future events or results may vary significantly from those expressed in any forward-looking statements. The views expressed are subject to change at any time in response to changing circumstances in the market. Wells Fargo Asset Management and the Fund disclaim any obligation to publicly update or revise any views expressed or forward-looking statements.
INVESTMENT PRODUCTS: NOT FDIC INSURED ■ NO BANK GUARANTEE ■ MAY LOSE VALUE
Wells Fargo Large Cap Core Fund | 1
Letter to shareholders (unaudited)
Dear Shareholder:
We are pleased to offer you this semi-annual report for the Wells Fargo Large Cap Core Fund for the six-month period that ended January 31, 2021. Despite a deeply challenging year, dominated by the spread of COVID-19 cases and a sharp drop in economic output throughout much of the world, global stocks performed extremely well, benefiting from ongoing central bank support and rising optimism over the development and distribution of effective COVID-19 vaccines. Bonds also had positive returns, led by global bonds and high-yield bonds.
For the six-month period, U.S. stocks, based on the S&P 500 Index1, gained 14.47%. International stocks, as measured by the MSCI ACWI ex USA Index (Net)2, returned 19.28%, while the MSCI EM Index (Net)3, had stronger performance, with a 24.07% gain. Among bond indexes, the Bloomberg Barclays U.S. Aggregate Bond Index4 returned -0.91%, the Bloomberg Barclays Global Aggregate ex-USD Index (unhedged)5 gained 3.71%, and the Bloomberg Barclays Municipal Bond Index6 returned 2.01% while the ICE BofA U.S. High Yield Index7 returned 6.82%.
The stock market rally continued in August.
The stock market continued a months-long rally in August despite concerns over rising numbers of U.S. and European COVID-19 cases. Relatively strong second-quarter earnings boosted investor sentiment along with the U.S. Federal Reserve’s announcement of a monetary policy shift expected to support longer-term low interest rates. U.S. manufacturing and services activity indexes beat expectations, while the U.S. housing market maintained strength. In Europe, retail sales expanded and consumer confidence was steady. China’s economy continued to expand.
Stocks grew more volatile in September on mixed economic data. U.S. economic activity continued to grow. However, U.S. unemployment remained elevated at 7.9% in September. With U.S. Congress delaying further fiscal relief and uncertainties surrounding a possible vaccine, doubts crept back into the financial markets. In the U.K., a lack of progress in Brexit talks weighed on markets. China’s economy picked up steam, fueled by increased global demand.
Andrew Owen
President
Wells Fargo Funds
“The stock market continued a months-long rally in August despite concerns over rising numbers of U.S. and European COVID-19 cases.”
| 1 | The S&P 500 Index consists of 500 stocks chosen for market size, liquidity, and industry group representation. It is a market-value-weighted index with each stock's weight in the index proportionate to its market value. You cannot invest directly in an index. |
| 2 | The Morgan Stanley Capital International (MSCI) All Country World Index (ACWI) ex USA Index (Net) is a free-float-adjusted market-capitalization-weighted index that is designed to measure the equity market performance of developed and emerging markets, excluding the United States. Source: MSCI. MSCI makes no express or implied warranties or representations and shall have no liability whatsoever with respect to any MSCI data contained herein. The MSCI data may not be further redistributed or used as a basis for other indices or any securities or financial products. This report is not approved, reviewed, or produced by MSCI. You cannot invest directly in an index. |
| 1 | The S&P 500 Index consists of 500 stocks chosen for market size, liquidity, and industry group representation. It is a market-value-weighted index with each stock's weight in the index proportionate to its market value. You cannot invest directly in an index. |
| 3 | The MSCI Emerging Markets (EM) Index (Net) is a free-float-adjusted market-capitalization-weighted index that is designed to measure equity market performance of emerging markets. You cannot invest directly in an index. |
| 1 | The S&P 500 Index consists of 500 stocks chosen for market size, liquidity, and industry group representation. It is a market-value-weighted index with each stock's weight in the index proportionate to its market value. You cannot invest directly in an index. |
| 4 | The Bloomberg Barclays U.S. Aggregate Bond Index is a broad-based benchmark that measures the investment-grade, U.S. dollar-denominated, fixed-rate taxable bond market, including Treasuries, government-related and corporate securities, mortgage-backed securities (agency fixed-rate and hybrid adjustable-rate mortgage pass-throughs), asset-backed securities, and commercial mortgage-backed securities. You cannot invest directly in an index. |
| 1 | The S&P 500 Index consists of 500 stocks chosen for market size, liquidity, and industry group representation. It is a market-value-weighted index with each stock's weight in the index proportionate to its market value. You cannot invest directly in an index. |
| 5 | The Bloomberg Barclays Global Aggregate ex-USD Index (unhedged) is an unmanaged index that provides a broad-based measure of the global investment-grade fixed-income markets excluding the U.S. dollar-denominated debt market. You cannot invest directly in an index. |
| 1 | The S&P 500 Index consists of 500 stocks chosen for market size, liquidity, and industry group representation. It is a market-value-weighted index with each stock's weight in the index proportionate to its market value. You cannot invest directly in an index. |
| 6 | The Bloomberg Barclays Municipal Bond Index is an unmanaged index composed of long-term tax-exempt bonds with a minimum credit rating of Baa. You cannot invest directly in an index. |
| 1 | The S&P 500 Index consists of 500 stocks chosen for market size, liquidity, and industry group representation. It is a market-value-weighted index with each stock's weight in the index proportionate to its market value. You cannot invest directly in an index. |
| 7 | The ICE BofA U.S. High Yield Index is a market-capitalization-weighted index of domestic and Yankee high-yield bonds. The index tracks the performance of high-yield securities traded in the U.S. bond market. You cannot invest directly in an index. Copyright 2021. ICE Data Indices, LLC. All rights reserved. |
2 | Wells Fargo Large Cap Core Fund
Letter to shareholders (unaudited)
In October, capital markets stepped back from their six-month rally. Market volatility rose in advance of the U.S. election and amid a global increase in COVID-19 infections. Europe introduced tighter restrictions affecting economic activity. U.S. markets looked favorably at the prospect of Democratic control of the federal purse strings, which could lead to additional fiscal stimulus and a boost to economic activity. Meanwhile, China reported 4.9% third-quarter GDP growth.
Global stocks rallied in November, propelled by optimism over three promising COVID-19 vaccines. Reversing recent trends, value stocks outperformed growth stocks and cyclical stocks outpaced technology stocks. However, U.S. unemployment remained elevated, with a net job loss of 10 million since February. The eurozone services purchasing managers’ index contracted sharply while the region’s manufacturing activity grew. The U.S. election results added to the upbeat mood as investors anticipated more consistent policies in the new administration.
Financial markets ended the year with strength on high expectations for a rapid rollout of the COVID-19 vaccines, the successful passage of a $900 billion stimulus package, and rising expectations of additional economic support from a Democratic-led Congress. U.S. economic data were mixed with still-elevated unemployment and weak retail sales but growth in manufacturing output. In contrast, China’s economic expansion continued in both manufacturing and nonmanufacturing. U.S. COVID-19 infection rates continued to rise even as new state and local lockdown measures were implemented.
The year 2021 began with emerging market stocks leading all major asset classes in January, driven by China’s strong economic growth and a broad recovery in corporate earnings, which propelled China’s stock market higher. In the United States, positive news on vaccine trials and January expansion in both the manufacturing and services sectors was offset by a weak December monthly jobs report. This was compounded by technical factors as some hedge funds were forced to sell stocks to protect themselves against a well-publicized short squeeze coordinated by a group of retail investors. Eurozone sentiment and economic growth were particularly weak, reflecting the impact of a new lockdown with stricter social distancing along with a slow vaccine rollout.
Don’t let short-term uncertainty derail long-term investment goals.
Periods of investment uncertainty can present challenges, but experience has taught us that maintaining long-term investment goals can be an effective way to plan for the future. To help you create a sound strategy based on your personal goals and risk tolerance, Wells Fargo Funds offers more than 100 mutual funds spanning a wide range of asset classes and investment styles. Although diversification cannot guarantee an investment profit or prevent losses, we believe it can be an effective way to manage investment risk and potentially smooth out overall portfolio performance. We encourage investors to know their investments and to understand that appropriate levels of risk-taking may unlock opportunities.
Thank you for choosing to invest with Wells Fargo Funds. We appreciate your confidence in us and remain committed to helping you meet your financial needs.
Sincerely,
Andrew Owen
President
Wells Fargo Funds
“Global stocks rallied in November, propelled by optimism over three promising COVID-19 vaccines.”
For further information about your Fund, contact your investment professional, visit our website at wfam.com, or call us directly at 1-800-222-8222.
Wells Fargo Large Cap Core Fund | 3
Performance highlights (unaudited)
Investment objective
The Fund seeks long-term capital appreciation.
Manager
Wells Fargo Funds Management, LLC
Subadviser
Wells Capital Management Incorporated
Portfolio managers
John R. Campbell, CFA®‡
Vince Fioramonti, CFA®‡*
Average annual total returns (%) as of January 31, 2021
| | | Including sales charge | | Excluding sales charge | | Expense ratios1 (%) |
| | Inception date | 1 year | 5 year | 10 year | | 1 year | 5 year | 10 year | | Gross | Net 2 |
| Class A (EGOAX) | 12-17-2007 | 4.64 | 11.51 | 11.11 | | 11.01 | 12.83 | 11.77 | | 1.22 | 1.08 |
| Class C (EGOCX) | 12-17-2007 | 9.10 | 11.97 | 10.92 | | 10.10 | 11.97 | 10.92 | | 1.97 | 1.83 |
| Class R (EGOHX)3 | 9-30-2015 | – | – | – | | 10.67 | 12.54 | 11.49 | | 1.47 | 1.33 |
| Class R6 (EGORX)4 | 9-30-2015 | – | – | – | | 11.45 | 13.97 | 12.59 | | 0.79 | 0.65 |
| Administrator Class (WFLLX) | 7-16-2010 | – | – | – | | 11.09 | 12.95 | 11.97 | | 1.14 | 0.97 |
| Institutional Class (EGOIX) | 12-17-2007 | – | – | – | | 11.43 | 13.30 | 12.26 | | 0.89 | 0.67 |
| S&P 500 Index5 | – | – | – | – | | 17.25 | 16.16 | 13.50 | | – | – |
Figures quoted represent past performance, which is no guarantee of future results, and do not reflect taxes that a shareholder may pay on an investment in a fund. Investment return and principal value of an investment will fluctuate so that an investor’s shares, when redeemed, may be worth more or less than their original cost. Performance shown without sales charges would be lower if sales charges were reflected. Current performance may be lower or higher than the performance data quoted, which assumes the reinvestment of dividends and capital gains. Current month-end performance is available on the Fund’s website, wfam.com.
Index returns do not include transaction costs associated with buying and selling securities, any mutual fund fees or expenses, or any taxes. It is not possible to invest directly in an index.
For Class A shares, the maximum front-end sales charge is 5.75%. For Class C shares, the maximum contingent deferred sales charge is 1.00%. Performance including a contingent deferred sales charge assumes the sales charge for the corresponding time period. Class R, Administrator Class, and Institutional Class shares are sold without a front-end sales charge or contingent deferred sales charge.
Stock values fluctuate in response to the activities of individual companies and general market and economic conditions. Certain investment strategies tend to increase the total risk of an investment (relative to the broader market). The Fund is exposed to foreign investment risk and smaller-company securities risk. Consult the Fund’s prospectus for additional information on these and other risks.
Please see footnotes on page 5.
4 | Wells Fargo Large Cap Core Fund
Performance highlights (unaudited)
| Ten largest holdings (%) as of January 31, 20216 |
| Apple Incorporated | 6.08 |
| Microsoft Corporation | 5.14 |
| Alphabet Incorporated Class C | 3.18 |
| Amazon.com Incorporated | 3.05 |
| Discovery Incorporated Class A | 2.44 |
| The Goldman Sachs Group Incorporated | 2.37 |
| Qorvo Incorporated | 2.28 |
| Hologic Incorporated | 2.26 |
| JPMorgan Chase & Company | 2.24 |
| Citizens Financial Group Incorporated | 2.19 |
| Sector allocation as of January 31, 20217 |
| ‡ | CFA® and Chartered Financial Analyst® are trademarks owned by CFA Institute. |
| 1 | Reflects the expense ratios as stated in the most recent prospectuses. The expense ratios shown are subject to change and may differ from the annualized expense ratios shown in the financial highlights of this report. |
| 2 | The manager has contractually committed through November 30, 2021, to waive fees and/or reimburse expenses to the extent necessary to cap total annual fund operating expenses after fee waivers at 1.08% for Class A, 1.83% for Class C, 1.33% for Class R, 0.65% for Class R6, 0.97% for Administrator Class, and 0.67% for Institutional Class. Brokerage commissions, stamp duty fees, interest, taxes, acquired fund fees and expenses (if any), and extraordinary expenses are excluded from the expense caps. Prior to or after the commitment expiration date, the caps may be increased or the commitment to maintain the caps may be terminated only with the approval of the Board of Trustees. Without these caps, the Fund’s returns would have been lower. The expense ratio paid by an investor is the net expense ratio (the total annual fund operating expenses after fee waivers) as stated in the prospectuses. |
| 3 | Historical performance shown for the Class R shares prior to their inception reflects the performance of the Administrator Class shares, adjusted to reflect higher expenses applicable to the Class R shares. |
| 4 | Historical performance shown for the Class R6 shares prior to their inception reflects the performance of the Institutional Class shares, adjusted to reflect higher expenses applicable to the Class R6 shares. |
| 5 | The S&P 500 Index consists of 500 stocks chosen for market size, liquidity, and industry group representation. It is a market-value weighted index with each stock’s weight in the index proportionate to its market value. You cannot invest directly in an index. |
| 6 | Figures represent the percentage of the Fund's net assets. Holdings are subject to change and may have changed since the date specified. |
| 7 | Figures represent the percentage of the Fund's long-term investments. These amounts are subject to change and may have changed since the date specified. |
Wells Fargo Large Cap Core Fund | 5
Fund expenses (unaudited)
As a shareholder of the Fund, you incur two types of costs: (1) transaction costs, including sales charges (loads) on purchase payments and contingent deferred sales charges (if any) on redemptions and (2) ongoing costs, including management fees, distribution (12b-1) and/or shareholder servicing fees, and other Fund expenses. This example is intended to help you understand your ongoing costs (in dollars) of investing in the Fund and to compare these costs with the ongoing costs of investing in other mutual funds.
The example is based on an investment of $1,000 invested at the beginning of the six-month period and held for the entire period from August 1, 2020 to January 31, 2021.
Actual expenses
The “Actual” line of the table below provides information about actual account values and actual expenses. You may use the information in this line, together with the amount you invested, to estimate the expenses that you paid over the period. Simply divide your account value by $1,000 (for example, an $8,600 account value divided by $1,000 = 8.6), then multiply the result by the number in the “Actual” line under the heading entitled “Expenses paid during period” for your applicable class of shares to estimate the expenses you paid on your account during this period.
Hypothetical example for comparison purposes
The “Hypothetical” line of the table below provides information about hypothetical account values and hypothetical expenses based on the Fund’s actual expense ratio and an assumed rate of return of 5% per year before expenses, which is not the Fund’s actual return. The hypothetical account values and expenses may not be used to estimate the actual ending account balance or expenses you paid for the period. You may use this information to compare the ongoing costs of investing in the Fund and other funds. To do so, compare this 5% hypothetical example with the 5% hypothetical examples that appear in the shareholder reports of the other funds.
Please note that the expenses shown in the table are meant to highlight your ongoing costs only and do not reflect any transactional costs, such as sales charges (loads) and contingent deferred sales charges. Therefore, the “Hypothetical” line of the table is useful in comparing ongoing costs only and will not help you determine the relative total costs of owning different funds. In addition, if these transactional costs were included, your costs would have been higher
| | Beginning
account value
8-1-2020 | Ending
account value
1-31-2021 | Expenses
paid during
the period1 | Annualized net
expense ratio |
| Class A | | | | |
| Actual | $1,000.00 | $1,148.30 | $5.69 | 1.05% |
| Hypothetical (5% return before expenses) | $1,000.00 | $1,019.91 | $5.35 | 1.05% |
| Class C | | | | |
| Actual | $1,000.00 | $1,143.90 | $9.89 | 1.83% |
| Hypothetical (5% return before expenses) | $1,000.00 | $1,015.98 | $9.30 | 1.83% |
| Class R | | | | |
| Actual | $1,000.00 | $1,146.92 | $7.20 | 1.33% |
| Hypothetical (5% return before expenses) | $1,000.00 | $1,018.50 | $6.77 | 1.33% |
| Class R6 | | | | |
| Actual | $1,000.00 | $1,150.41 | $3.52 | 0.65% |
| Hypothetical (5% return before expenses) | $1,000.00 | $1,021.93 | $3.31 | 0.65% |
| Administrator Class | | | | |
| Actual | $1,000.00 | $1,149.15 | $5.25 | 0.97% |
| Hypothetical (5% return before expenses) | $1,000.00 | $1,020.32 | $4.94 | 0.97% |
| Institutional Class | | | | |
| Actual | $1,000.00 | $1,150.23 | $3.63 | 0.67% |
| Hypothetical (5% return before expenses) | $1,000.00 | $1,021.83 | $3.41 | 0.67% |
1 Expenses paid is equal to the annualized net expense ratio of each class multiplied by the average account value over the period, multiplied by the number of days in the most recent fiscal half-year divided by the number of days in the fiscal year (to reflect the one-half-year period).
6 | Wells Fargo Large Cap Core Fund
Portfolio of investments—January 31, 2021 (unaudited)
| | | | | Shares | Value |
| Common stocks: 98.90% | | | | | |
| Communication services: 8.90% | | | | | |
| Diversified telecommunication services: 1.31% | | | | | |
| AT&T Incorporated | | | | 218,854 | $ 6,265,790 |
| Entertainment: 1.97% | | | | | |
| Activision Blizzard Incorporated | | | | 103,784 | 9,444,344 |
| Interactive media & services: 3.18% | | | | | |
| Alphabet Incorporated Class C † | | | | 8,300 | 15,236,642 |
| Media: 2.44% | | | | | |
| Discovery Incorporated Class A † | | | | 283,231 | 11,731,428 |
| Consumer discretionary: 15.47% | | | | | |
| Auto components: 1.50% | | | | | |
| Lear Corporation | | | | 47,628 | 7,180,397 |
| Household durables: 3.65% | | | | | |
| PulteGroup Incorporated | | | | 191,744 | 8,340,864 |
| Whirlpool Corporation | | | | 49,560 | 9,173,060 |
| | | | | | 17,513,924 |
| Internet & direct marketing retail: 3.05% | | | | | |
| Amazon.com Incorporated † | | | | 4,564 | 14,633,097 |
| Multiline retail: 3.69% | | | | | |
| Dollar General Corporation | | | | 40,473 | 7,876,451 |
| Target Corporation | | | | 54,081 | 9,797,855 |
| | | | | | 17,674,306 |
| Specialty retail: 3.58% | | | | | |
| O'Reilly Automotive Incorporated † | | | | 20,437 | 8,695,330 |
| The Home Depot Incorporated | | | | 31,344 | 8,488,582 |
| | | | | | 17,183,912 |
| Consumer staples: 3.56% | | | | | |
| Food & staples retailing: 3.56% | | | | | |
| Costco Wholesale Corporation | | | | 26,585 | 9,369,352 |
| Walmart Incorporated | | | | 54,959 | 7,721,190 |
| | | | | | 17,090,542 |
| Energy: 1.95% | | | | | |
| Oil, gas & consumable fuels: 1.95% | | | | | |
| Chevron Corporation | | | | 54,814 | 4,670,153 |
| ConocoPhillips | | | | 117,270 | 4,694,318 |
| | | | | | 9,364,471 |
The accompanying notes are an integral part of these financial statements.
Wells Fargo Large Cap Core Fund | 7
Portfolio of investments—January 31, 2021 (unaudited)
| | | | | Shares | Value |
| Financials: 12.14% | | | | | |
| Banks: 4.43% | | | | | |
| Citizens Financial Group Incorporated | | | | 287,913 | $ 10,491,550 |
| JPMorgan Chase & Company | | | | 83,662 | 10,764,790 |
| | | | | | 21,256,340 |
| Capital markets: 6.28% | | | | | |
| BlackRock Incorporated | | | | 13,504 | 9,469,815 |
| Evercore Partners Incorporated Class A | | | | 84,974 | 9,270,663 |
| The Goldman Sachs Group Incorporated | | | | 41,903 | 11,362,837 |
| | | | | | 30,103,315 |
| Insurance: 1.43% | | | | | |
| The Allstate Corporation | | | | 63,931 | 6,852,125 |
| Health care: 15.24% | | | | | |
| Biotechnology: 6.67% | | | | | |
| AbbVie Incorporated | | | | 64,676 | 6,627,996 |
| Amgen Incorporated | | | | 32,500 | 7,846,475 |
| Regeneron Pharmaceuticals Incorporated † | | | | 14,507 | 7,309,207 |
| United Therapeutics Corporation † | | | | 62,066 | 10,167,652 |
| | | | | | 31,951,330 |
| Health care equipment & supplies: 2.26% | | | | | |
| Hologic Incorporated † | | | | 135,866 | 10,832,596 |
| Health care providers & services: 3.08% | | | | | |
| Anthem Incorporated | | | | 21,563 | 6,403,780 |
| CVS Health Corporation | | | | 116,951 | 8,379,539 |
| | | | | | 14,783,319 |
| Pharmaceuticals: 3.23% | | | | | |
| Bristol-Myers Squibb Company | | | | 121,543 | 7,466,386 |
| Johnson & Johnson | | | | 49,230 | 8,030,890 |
| | | | | | 15,497,276 |
| Industrials: 8.94% | | | | | |
| Aerospace & defense: 1.56% | | | | | |
| Lockheed Martin Corporation | | | | 23,267 | 7,487,786 |
| Building products: 1.85% | | | | | |
| Masco Corporation | | | | 163,036 | 8,854,485 |
| Construction & engineering: 1.78% | | | | | |
| EMCOR Group Incorporated | | | | 96,807 | 8,548,058 |
| Machinery: 1.98% | | | | | |
| Cummins Incorporated | | | | 40,543 | 9,504,090 |
| Road & rail: 1.77% | | | | | |
| J.B. Hunt Transport Services Incorporated | | | | 62,773 | 8,453,012 |
The accompanying notes are an integral part of these financial statements.
8 | Wells Fargo Large Cap Core Fund
Portfolio of investments—January 31, 2021 (unaudited)
| | | | | Shares | Value |
| Information technology: 29.23% | | | | | |
| Electronic equipment, instruments & components: 3.62% | | | | | |
| CDW Corporation of Delaware | | | | 54,038 | $ 7,114,643 |
| Zebra Technologies Corporation Class A † | | | | 26,403 | 10,239,875 |
| | | | | | 17,354,518 |
| IT services: 5.31% | | | | | |
| Cognizant Technology Solutions Corporation Class A | | | | 114,938 | 8,959,417 |
| Leidos Holdings Incorporated | | | | 76,393 | 8,102,242 |
| MasterCard Incorporated Class A | | | | 26,557 | 8,399,714 |
| | | | | | 25,461,373 |
| Semiconductors & semiconductor equipment: 2.28% | | | | | |
| Qorvo Incorporated † | | | | 64,091 | 10,951,870 |
| Software: 11.94% | | | | | |
| Adobe Incorporated † | | | | 19,062 | 8,745,074 |
| Fortinet Incorporated † | | | | 56,034 | 8,110,922 |
| Intuit Incorporated | | | | 28,198 | 10,185,964 |
| Microsoft Corporation | | | | 106,130 | 24,617,913 |
| VMware Incorporated Class A † | | | | 40,468 | 5,578,514 |
| | | | | | 57,238,387 |
| Technology hardware, storage & peripherals: 6.08% | | | | | |
| Apple Incorporated | | | | 220,803 | 29,137,164 |
| Materials: 3.47% | | | | | |
| Metals & mining: 3.47% | | | | | |
| Newmont Corporation | | | | 132,936 | 7,922,986 |
| Reliance Steel & Aluminum Company | | | | 75,217 | 8,731,189 |
| | | | | | 16,654,175 |
| Total Common stocks (Cost $338,519,445) | | | | | 474,240,072 |
| | | Yield | | | |
| Short-term investments: 2.01% | | | | | |
| Investment companies: 2.01% | | | | | |
| Securities Lending Cash Investments LLC ♠∩∞ | | 0.10% | | 6,671,775 | 6,671,775 |
| Wells Fargo Government Money Market Fund Select Class ♠∞ | | 0.03 | | 2,974,499 | 2,974,499 |
| Total Short-term investments (Cost $9,646,274) | | | | | 9,646,274 |
| Total investments in securities (Cost $348,165,719) | 100.91% | | | | 483,886,346 |
| Other assets and liabilities, net | (0.91) | | | | (4,356,594) |
| Total net assets | 100.00% | | | | $479,529,752 |
| † | Non-income-earning security |
| ♠ | The issuer of the security is an affiliated person of the Fund as defined in the Investment Company Act of 1940. |
| ∩ | The investment is a non-registered investment company purchased with cash collateral received from securities on loan. |
| ∞ | The rate represents the 7-day annualized yield at period end. |
The accompanying notes are an integral part of these financial statements.
Wells Fargo Large Cap Core Fund | 9
Portfolio of investments—January 31, 2021 (unaudited)
Investments in affiliates
An affiliated investment is an investment in which the Fund owns at least 5% of the outstanding voting shares of the issuer or as a result of other relationships, such as the Fund and the issuer having the same investment manager. Transactions with issuers that were either affiliated persons of the Fund at the beginning of the period or the end of the period were as follows:
| | Value,
beginning of
period | Purchases | Sales
proceeds | Net
realized
gains
(losses) | | Net
change in
unrealized
gains
(losses) | | Value,
end of
period | | % of
net
assets | Shares,
end
of period | Income
from
affiliated
securities |
| Short-term investments | | | | | | | | | | | | |
| Investment companies | | | | | | | | | | | | |
| Securities Lending Cash Investments LLC | $ 0 | $79,417,610 | $(72,745,835) | $0 | | $0 | | $ 6,671,775 | | | 6,671,775 | $ 3,249# |
| Wells Fargo Government Money Market Fund Select Class | 4,601,813 | 56,491,731 | (58,119,045) | 0 | | 0 | | 2,974,499 | | | 2,974,499 | 722 |
| | | | | $0 | | $0 | | $9,646,274 | | 2.01% | | $3,971 |
| # | Amount shown represents income before fees and rebates. |
The accompanying notes are an integral part of these financial statements.
10 | Wells Fargo Large Cap Core Fund
Statement of assets and liabilities—January 31, 2021 (unaudited)
| | |
| Assets | |
Investments in unaffiliated securities (including $6,525,089 of securities loaned), at value (cost $338,519,445)
| $ 474,240,072 |
Investments in affiliated securites, at value (cost $9,646,274)
| 9,646,274 |
Receivable for investments sold
| 2,840,203 |
Receivable for dividends
| 436,719 |
Receivable for Fund shares sold
| 59,044 |
Prepaid expenses and other assets
| 30,204 |
Total assets
| 487,252,516 |
| Liabilities | |
Payable upon receipt of securities loaned
| 6,669,853 |
Payable for Fund shares redeemed
| 585,030 |
Management fee payable
| 223,874 |
Administration fees payable
| 78,879 |
Distribution fees payable
| 19,546 |
Trustees’ fees and expenses payable
| 2,751 |
Accrued expenses and other liabilities
| 142,831 |
Total liabilities
| 7,722,764 |
Total net assets
| $479,529,752 |
| Net assets consist of | |
Paid-in capital
| $ 316,371,212 |
Total distributable earnings
| 163,158,540 |
Total net assets
| $479,529,752 |
| Computation of net asset value and offering price per share | |
Net assets – Class A
| $ 319,081,601 |
Shares outstanding – Class A1
| 20,414,337 |
Net asset value per share – Class A
| $15.63 |
Maximum offering price per share – Class A2
| $16.58 |
Net assets – Class C
| $ 28,859,332 |
Shares outstanding – Class C1
| 1,877,056 |
Net asset value per share – Class C
| $15.37 |
Net assets – Class R
| $ 510,973 |
Shares outstanding – Class R1
| 32,433 |
Net asset value per share – Class R
| $15.75 |
Net assets – Class R6
| $ 5,909,380 |
Shares outstanding – Class R61
| 376,059 |
Net asset value per share – Class R6
| $15.71 |
Net assets – Administrator Class
| $ 2,079,487 |
Shares outstanding – Administrator Class1
| 130,370 |
Net asset value per share – Administrator Class
| $15.95 |
Net assets – Institutional Class
| $ 123,088,979 |
Shares outstanding – Institutional Class1
| 7,824,257 |
Net asset value per share – Institutional Class
| $15.73 |
| 1 | The Fund has an unlimited number of authorized shares. |
| 2 | Maximum offering price is computed as 100/94.25 of net asset value. On investments of $50,000 or more, the offering price is reduced. |
The accompanying notes are an integral part of these financial statements.
Wells Fargo Large Cap Core Fund | 11
Statement of operations—six months ended January 31, 2021 (unaudited)
| | |
| Investment income | |
Dividends
| $ 4,242,114 |
Income from affiliated securities
| 11,017 |
Total investment income
| 4,253,131 |
| Expenses | |
Management fee
| 1,706,690 |
| Administration fees | |
Class A
| 327,470 |
Class C
| 33,623 |
Class R
| 741 |
Class R6
| 986 |
Administrator Class
| 1,433 |
Institutional Class
| 87,269 |
| Shareholder servicing fees | |
Class A
| 389,845 |
Class C
| 40,028 |
Class R
| 872 |
Administrator Class
| 2,736 |
| Distribution fees | |
Class C
| 119,864 |
Class R
| 853 |
Custody and accounting fees
| 21,543 |
Professional fees
| 24,568 |
Registration fees
| 62,606 |
Shareholder report expenses
| 71,151 |
Trustees’ fees and expenses
| 9,707 |
Other fees and expenses
| 19,628 |
Total expenses
| 2,921,613 |
| Less: Fee waivers and/or expense reimbursements | |
Fund-level
| (385,126) |
Class A
| (60,378) |
Class R6
| (280) |
Administrator Class
| (406) |
Institutional Class
| (59,250) |
Net expenses
| 2,416,173 |
Net investment income
| 1,836,958 |
| Realized and unrealized gains (losses) on investments | |
Net realized gains on investments
| 35,974,502 |
Net change in unrealized gains (losses) on investments
| 30,413,735 |
Net realized and unrealized gains (losses) on investments
| 66,388,237 |
Net increase in net assets resulting from operations
| 68,225,195 |
The accompanying notes are an integral part of these financial statements.
12 | Wells Fargo Large Cap Core Fund
Statement of changes in net assets
| | |
| | Six months ended
January 31, 2021
(unaudited) | Year ended
July 31, 2020 |
| Operations | | | | |
Net investment income
| | $ 1,836,958 | | $ 7,206,846 |
Net realized gains on investments
| | 35,974,502 | | 104,757,110 |
Net change in unrealized gains (losses) on investments
| | 30,413,735 | | (92,410,548) |
Net increase in net assets resulting from operations
| | 68,225,195 | | 19,553,408 |
| Distributions to shareholders from | | | | |
| Net investment income and net realized gains | | | | |
Class A
| | (43,568,141) | | (61,566,588) |
Class C
| | (4,062,417) | | (7,938,179) |
Class R
| | (69,596) | | (385,920) |
Class R6
| | (942,745) | | (1,869,850) |
Administrator Class
| | (283,218) | | (2,568,605) |
Institutional Class
| | (18,363,526) | | (59,147,753) |
Total distributions to shareholders
| | (67,289,643) | | (133,476,895) |
| Capital share transactions | Shares | | Shares | |
| Proceeds from shares sold | | | | |
Class A
| 569,934 | 9,219,153 | 1,500,692 | 25,056,011 |
Class C
| 28,490 | 443,504 | 198,258 | 3,124,973 |
Class R
| 2,001 | 32,462 | 42,012 | 683,541 |
Class R6
| 13,339 | 210,917 | 46,727 | 745,853 |
Administrator Class
| 4,588 | 73,405 | 20,852 | 357,788 |
Institutional Class
| 634,442 | 10,377,917 | 2,471,565 | 41,971,331 |
| | | 20,357,358 | | 71,939,497 |
| Reinvestment of distributions | | | | |
Class A
| 2,687,262 | 41,377,941 | 3,568,341 | 58,962,830 |
Class C
| 259,190 | 3,893,123 | 419,517 | 6,752,912 |
Class R
| 4,276 | 65,764 | 23,014 | 379,887 |
Class R6
| 18,442 | 286,328 | 25,087 | 417,888 |
Administrator Class
| 17,840 | 279,907 | 151,848 | 2,548,476 |
Institutional Class
| 1,082,589 | 16,825,725 | 3,285,183 | 54,781,650 |
| | | 62,728,788 | | 123,843,643 |
| Payment for shares redeemed | | | | |
Class A
| (1,965,986) | (31,800,548) | (4,307,171) | 71,082,640 |
Class C
| (577,963) | (9,188,715) | (1,065,243) | (16,770,044) |
Class R
| (31,823) | (513,216) | (117,013) | (1,764,327) |
Class R6
| (71,325) | (1,155,699) | (364,215) | (6,430,922) |
Administrator Class
| (32,413) | (541,987) | (912,779) | (13,878,044) |
Institutional Class
| (3,081,921) | (50,216,206) | (28,685,504) | (504,129,832) |
| | | (93,416,371) | | (614,055,809) |
Net decrease in net assets resulting from capital share transactions
| | (10,330,225) | | (418,272,669) |
Total decrease in net assets
| | (9,394,673) | | (532,196,156) |
| Net assets | | | | |
Beginning of period
| | 488,924,425 | | 1,021,120,581 |
End of period
| | $479,529,752 | | $ 488,924,425 |
The accompanying notes are an integral part of these financial statements.
Wells Fargo Large Cap Core Fund | 13
Financial highlights
(For a share outstanding throughout each period)
| | | Year ended July 31 |
| Class A | Six months ended
January 31, 2021
(unaudited) | 2020 | 2019 | 2018 | 2017 | 2016 |
Net asset value, beginning of period
| $15.71 | $18.57 | $20.82 | $18.01 | $15.13 | $15.81 |
Net investment income
| 0.05 | 0.14 | 0.25 | 0.15 | 0.15 | 0.10 |
Net realized and unrealized gains (losses) on investments
| 2.22 | 0.51 | (0.29) | 3.01 | 2.85 | (0.60) |
Total from investment operations
| 2.27 | 0.65 | (0.04) | 3.16 | 3.00 | (0.50) |
| Distributions to shareholders from | | | | | | |
Net investment income
| (0.15) | (0.29) | (0.16) | (0.13) | (0.12) | (0.05) |
Net realized gains
| (2.20) | (3.22) | (2.05) | (0.22) | 0.00 | (0.13) |
Total distributions to shareholders
| (2.35) | (3.51) | (2.21) | (0.35) | (0.12) | (0.18) |
Net asset value, end of period
| $15.63 | $15.71 | $18.57 | $20.82 | $18.01 | $15.13 |
Total return1
| 14.83% | 2.86% | 1.10% | 17.66% | 19.94% | (3.18)% |
| Ratios to average net assets (annualized) | | | | | | |
Gross expenses
| 1.25% | 1.23% | 1.19% | 1.18% | 1.19% | 1.20% |
Net expenses
| 1.05% | 1.06% | 1.08% | 1.10% | 1.14% | 1.14% |
Net investment income
| 0.69% | 0.97% | 1.42% | 0.73% | 0.82% | 0.80% |
| Supplemental data | | | | | | |
Portfolio turnover rate
| 28% | 28% | 45% | 33% | 50% | 51% |
Net assets, end of period (000s omitted)
| $319,082 | $300,373 | $341,045 | $360,937 | $329,974 | $359,971 |
| 1 | Total return calculations do not include any sales charges. Returns for periods of less than one year are not annualized. |
The accompanying notes are an integral part of these financial statements.
14 | Wells Fargo Large Cap Core Fund
Financial highlights
(For a share outstanding throughout each period)
| | | Year ended July 31 |
| Class C | Six months ended
January 31, 2021
(unaudited) | 2020 | 2019 | 2018 | 2017 | 2016 |
Net asset value, beginning of period
| $15.41 | $18.22 | $20.44 | $17.70 | $14.87 | $15.61 |
Net investment income (loss)
| (0.01) | 0.03 | 0.13 | (0.00) 1 | 0.00 2 | 0.00 2,3 |
Net realized and unrealized gains (losses) on investments
| 2.18 | 0.47 | (0.30) | 2.96 | 2.83 | (0.61) |
Total from investment operations
| 2.17 | 0.50 | (0.17) | 2.96 | 2.83 | (0.61) |
| Distributions to shareholders from | | | | | | |
Net investment income
| (0.01) | (0.09) | 0.00 | 0.00 | 0.00 | 0.00 |
Net realized gains
| (2.20) | (3.22) | (2.05) | (0.22) | 0.00 | (0.13) |
Total distributions to shareholders
| (2.21) | (3.31) | (2.05) | (0.22) | 0.00 | (0.13) |
Net asset value, end of period
| $15.37 | $15.41 | $18.22 | $20.44 | $17.70 | $14.87 |
Total return4
| 14.39% | 2.01% | 0.34% | 16.78% | 19.03% | (3.90)% |
| Ratios to average net assets (annualized) | | | | | | |
Gross expenses
| 1.99% | 1.97% | 1.94% | 1.93% | 1.94% | 1.95% |
Net expenses
| 1.83% | 1.83% | 1.83% | 1.85% | 1.89% | 1.89% |
Net investment income (loss)
| (0.08)% | 0.21% | 0.67% | (0.02)% | 0.07% | 0.02% |
| Supplemental data | | | | | | |
Portfolio turnover rate
| 28% | 28% | 45% | 33% | 50% | 51% |
Net assets, end of period (000s omitted)
| $28,859 | $33,405 | $47,649 | $61,529 | $60,697 | $71,512 |
| 1 | Amount is more than $(0.005) |
| 2 | Amount is less than $0.005. |
| 3 | Calculated based upon average shares outstanding |
| 4 | Total return calculations do not include any sales charges. Returns for periods of less than one year are not annualized. |
The accompanying notes are an integral part of these financial statements.
Wells Fargo Large Cap Core Fund | 15
Financial highlights
(For a share outstanding throughout each period)
| | | Year ended July 31 |
| Class R | Six months ended
January 31, 2021
(unaudited) | 2020 | 2019 | 2018 | 2017 | 2016 1 |
Net asset value, beginning of period
| $15.70 | $18.57 | $20.81 | $18.04 | $15.17 | $14.66 |
Net investment income
| 0.04 2 | 0.11 2 | 0.21 | 0.12 | 0.13 | 0.06 |
Net realized and unrealized gains (losses) on investments
| 2.21 | 0.49 | (0.29) | 2.99 | 2.84 | 0.66 |
Total from investment operations
| 2.25 | 0.60 | (0.08) | 3.11 | 2.97 | 0.72 |
| Distributions to shareholders from | | | | | | |
Net investment income
| (0.00) 3 | (0.25) | (0.11) | (0.12) | (0.10) | (0.08) |
Net realized gains
| (2.20) | (3.22) | (2.05) | (0.22) | 0.00 | (0.13) |
Total distributions to shareholders
| (2.20) | (3.47) | (2.16) | (0.34) | (0.10) | (0.21) |
Net asset value, end of period
| $15.75 | $15.70 | $18.57 | $20.81 | $18.04 | $15.17 |
Total return4
| 14.69% | 2.56% | 0.87% | 17.37% | 19.64% | 4.90% |
| Ratios to average net assets (annualized) | | | | | | |
Gross expenses
| 1.49% | 1.47% | 1.44% | 1.43% | 1.44% | 1.46% |
Net expenses
| 1.33% | 1.33% | 1.33% | 1.34% | 1.39% | 1.39% |
Net investment income
| 0.45% | 0.69% | 1.18% | 0.48% | 0.51% | 0.52% |
| Supplemental data | | | | | | |
Portfolio turnover rate
| 28% | 28% | 45% | 33% | 50% | 51% |
Net assets, end of period (000s omitted)
| $511 | $910 | $2,043 | $2,042 | $1,369 | $26 |
| 1 | For the period from September 30, 2015 (commencement of class operations) to July 31, 2016 |
| 2 | Calculated based upon average shares outstanding |
| 3 | Amount is less than $0.005. |
| 4 | Returns for periods of less than one year are not annualized. |
The accompanying notes are an integral part of these financial statements.
16 | Wells Fargo Large Cap Core Fund
Financial highlights
(For a share outstanding throughout each period)
| | | Year ended July 31 |
| Class R6 | Six months ended
January 31, 2021
(unaudited) | 2020 | 2019 | 2018 | 2017 | 2016 1 |
Net asset value, beginning of period
| $15.81 | $18.68 | $20.92 | $18.09 | $15.24 | $14.66 |
Net investment income
| 0.09 | 0.24 2 | 0.34 | 0.22 2 | 0.25 2 | 0.20 |
Net realized and unrealized gains (losses) on investments
| 2.23 | 0.48 | (0.30) | 3.04 | 3.33 | 0.62 |
Total from investment operations
| 2.32 | 0.72 | 0.04 | 3.26 | 3.58 | 0.82 |
| Distributions to shareholders from | | | | | | |
Net investment income
| (0.22) | (0.37) | (0.23) | (0.21) | (0.73) | (0.11) |
Net realized gains
| (2.20) | (0.22) | (2.05) | (0.22) | 0.00 | (0.13) |
Total distributions to shareholders
| (2.42) | (3.59) | (2.28) | (0.43) | (0.73) | (0.24) |
Net asset value, end of period
| $15.71 | $15.81 | $18.68 | $20.92 | $18.09 | $15.24 |
Total return3
| 15.04% | 3.23% | 1.60% | 18.16% | 24.01% | 5.57% |
| Ratios to average net assets (annualized) | | | | | | |
Gross expenses
| 0.82% | 0.79% | 0.75% | 0.75% | 0.76% | 0.77% |
Net expenses
| 0.65% | 0.65% | 0.65% | 0.65% | 0.68% | 0.68% |
Net investment income
| 1.10% | 1.40% | 1.83% | 1.08% | 1.62% | 1.31% |
| Supplemental data | | | | | | |
Portfolio turnover rate
| 28% | 28% | 45% | 33% | 50% | 51% |
Net assets, end of period (000s omitted)
| $5,909 | $6,570 | $13,223 | $15,225 | $122 | $2,449 |
| 1 | For the period from September 30, 2015 (commencement of class operations) to July 31, 2016 |
| 2 | Calculated based upon average shares outstanding |
| 3 | Returns for periods of less than one year are not annualized. |
The accompanying notes are an integral part of these financial statements.
Wells Fargo Large Cap Core Fund | 17
Financial highlights
(For a share outstanding throughout each period)
| | | Year ended July 31 |
| Administrator Class | Six months ended
January 31, 2021
(unaudited) | 2020 | 2019 | 2018 | 2017 | 2016 |
Net asset value, beginning of period
| $15.96 | $18.82 | $21.05 | $18.21 | $15.18 | $15.87 |
Net investment income
| 0.06 1 | 0.18 1 | 0.29 1 | 0.17 1 | 0.16 1 | 0.15 |
Net realized and unrealized gains (losses) on investments
| 2.26 | 0.49 | (0.30) | 3.05 | 2.87 | (0.62) |
Total from investment operations
| 2.32 | 0.67 | 0.01 | 3.22 | 3.03 | (0.47) |
| Distributions to shareholders from | | | | | | |
Net investment income
| (0.13) | (0.31) | (0.17) | (0.16) | (0.00) 2 | (0.09) |
Net realized gains
| (2.20) | (3.22) | (2.05) | (0.220) | 0.00 | (0.13) |
Total distributions to shareholders
| (2.33) | (3.53) | (2.22) | (0.38) | (0.00) 2 | (0.22) |
Net asset value, end of period
| $15.95 | $15.96 | $18.82 | $21.05 | $18.21 | $15.18 |
Total return3
| 14.92% | 2.90% | 1.26% | 17.81% | 19.99% | (2.98)% |
| Ratios to average net assets (annualized) | | | | | | |
Gross expenses
| 1.16% | 1.13% | 1.10% | 1.10% | 1.10% | 1.12% |
Net expenses
| 0.97% | 0.97% | 0.97% | 0.98% | 1.00% | 0.96% |
Net investment income
| 0.77% | 1.04% | 1.52% | 0.86% | 1.00% | 0.95% |
| Supplemental data | | | | | | |
Portfolio turnover rate
| 28% | 28% | 45% | 33% | 50% | 51% |
Net assets, end of period (000s omitted)
| $2,079 | $2,241 | $16,566 | $25,444 | $32,091 | $57,879 |
| 1 | Calculated based upon average shares outstanding |
| 2 | Amount is less than $0.005. |
| 3 | Returns for periods of less than one year are not annualized. |
The accompanying notes are an integral part of these financial statements.
18 | Wells Fargo Large Cap Core Fund
Financial highlights
(For a share outstanding throughout each period)
| | | Year ended July 31 |
| Institutional Class | Six months ended
January 31, 2021
(unaudited) | 2020 | 2019 | 2018 | 2017 | 2016 |
Net asset value, beginning of period
| $15.83 | $18.70 | $20.95 | $18.12 | $15.23 | $15.91 |
Net investment income
| 0.09 1 | 0.24 1 | 0.34 | 0.23 | 0.18 | 0.18 1 |
Net realized and unrealized gains (losses) on investments
| 2.23 | 0.48 | (0.30) | 3.03 | 2.91 | (0.62) |
Total from investment operations
| 2.32 | 0.72 | 0.04 | 3.26 | 3.09 | (0.44) |
| Distributions to shareholders from | | | | | | |
Net investment income
| (0.22) | (0.37) | (0.24) | (0.21) | (0.20) | (0.11) |
Net realized gains
| (2.20) | (3.22) | (2.05) | (0.22) | 0.00 | (0.13) |
Total distributions to shareholders
| (2.42) | (3.59) | (2.29) | (0.43) | (0.20) | (0.24) |
Net asset value, end of period
| $15.73 | $15.83 | $18.70 | $20.95 | $18.12 | $15.23 |
Total return2
| 15.02% | 3.22% | 1.56% | 18.16% | 20.43% | (2.75)% |
| Ratios to average net assets (annualized) | | | | | | |
Gross expenses
| 0.92% | 0.89% | 0.86% | 0.85% | 0.86% | 0.87% |
Net expenses
| 0.67% | 0.67% | 0.67% | 0.68% | 0.70% | 0.70% |
Net investment income
| 1.09% | 1.40% | 1.82% | 1.15% | 1.23% | 1.22% |
| Supplemental data | | | | | | |
Portfolio turnover rate
| 28% | 28% | 45% | 33% | 50% | 51% |
Net assets, end of period (000s omitted)
| $123,089 | $145,425 | $600,595 | $690,855 | $621,864 | $412,678 |
| 1 | Calculated based upon average shares outstanding |
| 2 | Returns for periods of less than one year are not annualized. |
The accompanying notes are an integral part of these financial statements.
Wells Fargo Large Cap Core Fund | 19
Notes to financial statements (unaudited)
1. ORGANIZATION
Wells Fargo Funds Trust (the “Trust”), a Delaware statutory trust organized on March 10, 1999, is an open-end management investment company registered under the Investment Company Act of 1940, as amended (the “1940 Act”). As an investment company, the Trust follows the accounting and reporting guidance in Financial Accounting Standards Board (“FASB”) Accounting Standards Codification Topic 946, Financial Services – Investment Companies. These financial statements report on the Wells Fargo Large Cap Core Fund (the “Fund”) which is a diversified series of the Trust.
2. SIGNIFICANT ACCOUNTING POLICIES
The following significant accounting policies, which are consistently followed in the preparation of the financial statements of the Fund, are in conformity with U.S. generally accepted accounting principles which require management to make estimates and assumptions that affect the reported amounts of assets and liabilities, disclosure of contingent assets and liabilities at the date of the financial statements, and the reported amounts of income and expenses during the reporting period. Actual results could differ from those estimates.
Securities valuation
All investments are valued each business day as of the close of regular trading on the New York Stock Exchange (generally 4 p.m. Eastern Time), although the Fund may deviate from this calculation time under unusual or unexpected circumstances.
Equity securities that are listed on a foreign or domestic exchange or market are valued at the official closing price or, if none, the last sales price. If no sale occurs on the principal exchange or market that day, a fair value price will be determined in accordance with the Fund’s Valuation Procedures.
Investments in registered open-end investment companies are valued at net asset value. Interests in non-registered investment companies that are redeemable at net asset value are fair valued normally at net asset value.
Investments which are not valued using any of the methods discussed above are valued at their fair value, as determined in good faith by the Board of Trustees. The Board of Trustees has established a Valuation Committee comprised of the Trustees and has delegated to it the authority to take any actions regarding the valuation of portfolio securities that the Valuation Committee deems necessary or appropriate, including determining the fair value of portfolio securities, unless the determination has been delegated to the Wells Fargo Asset Management Pricing Committee at Wells Fargo Funds Management, LLC (“Funds Management”). The Board of Trustees retains the authority to make or ratify any valuation decisions or approve any changes to the Valuation Procedures as it deems appropriate. On a quarterly basis, the Board of Trustees receives reports on any valuation actions taken by the Valuation Committee or the Wells Fargo Asset Management Pricing Committee which may include items for ratification.
Securities lending
The Fund may lend its securities from time to time in order to earn additional income in the form of fees or interest on securities received as collateral or the investment of any cash received as collateral. When securities are on loan, the Fund receives interest or dividends on those securities. Cash collateral received in connection with its securities lending transactions is invested in Securities Lending Cash Investments, LLC (the “Securities Lending Fund”). Investments in Securities Lending Fund are valued at the evaluated bid price provided by an independent pricing service. Income earned from investment in the Securities Lending Fund (net of fees and rebates), if any, is included in income from affiliated securities on the Statement of Operations.
In a securities lending transaction, the net asset value of the Fund is affected by an increase or decrease in the value of the securities loaned and by an increase or decrease in the value of the instrument in which collateral is invested. The amount of securities lending activity undertaken by the Fund fluctuates from time to time. The Fund has the right under the lending agreement to recover the securities from the borrower on demand. In the event of default or bankruptcy by the borrower, the Fund may be prevented from recovering the loaned securities or gaining access to the collateral or may experience delays or costs in doing so. In such an event, the terms of the agreement allow the unaffiliated securities lending agent to use the collateral to purchase replacement securities on behalf of the Fund or pay the Fund the market value of the loaned securities. The Fund bears the risk of loss with respect to depreciation of its investment of the cash collateral.
Security transactions and income recognition
Securities transactions are recorded on a trade date basis. Realized gains or losses are recorded on the basis of identified cost.
Dividend income is recognized on the ex-dividend date.
20 | Wells Fargo Large Cap Core Fund
Notes to financial statements (unaudited)
Distributions to shareholders
Distributions to shareholders from net investment income and any net realized gains are recorded on the ex-dividend date and paid at least annually. Such distributions are determined in accordance with income tax regulations and may differ from U.S. generally accepted accounting principles. Dividend sources are estimated at the time of declaration. The tax character of distributions is determined as of the Fund’s fiscal year end. Therefore, a portion of the Fund’s distributions made prior to the Fund’s fiscal year end may be categorized as a tax return of capital at year end.
Federal and other taxes
The Fund intends to continue to qualify as a regulated investment company by distributing substantially all of its investment company taxable income and any net realized capital gains (after reduction for capital loss carryforwards) sufficient to relieve it from all, or substantially all, federal income taxes. Accordingly, no provision for federal income taxes was required.
The Fund’s income and federal excise tax returns and all financial records supporting those returns for the prior three fiscal years are subject to examination by the federal and Delaware revenue authorities. Management has analyzed the Fund’s tax positions taken on federal, state, and foreign tax returns for all open tax years and does not believe that there are any uncertain tax positions that require recognition of a tax liability.
As of January 31, 2021, the aggregate cost of all investments for federal income tax purposes was $348,471,770 and the unrealized gains (losses) consisted of:
| Gross unrealized gains | $142,475,497 |
| Gross unrealized losses | (7,060,921) |
| Net unrealized gains | $135,414,576 |
Class allocations
The separate classes of shares offered by the Fund differ principally in applicable sales charges, distribution, shareholder servicing, and administration fees. Class specific expenses are charged directly to that share class. Investment income, common fund-level expenses, and realized and unrealized gains (losses) on investments are allocated daily to each class of shares based on the relative proportion of net assets of each class.
3. FAIR VALUATION MEASUREMENTS
Fair value measurements of investments are determined within a framework that has established a fair value hierarchy based upon the various data inputs utilized in determining the value of the Fund’s investments. The three-level hierarchy gives the highest priority to unadjusted quoted prices in active markets for identical assets or liabilities (Level 1) and the lowest priority to unobservable inputs (Level 3). The Fund’s investments are classified within the fair value hierarchy based on the lowest level of input that is significant to the fair value measurement. The inputs are summarized into three broad levels as follows:
| ■ | Level 1 – quoted prices in active markets for identical securities |
| ■ | Level 2 – other significant observable inputs (including quoted prices for similar securities, interest rates, prepayment speeds, credit risk, etc.) |
| ■ | Level 3 – significant unobservable inputs (including the Fund’s own assumptions in determining the fair value of investments) |
The inputs or methodologies used for valuing investments in securities are not necessarily an indication of the risk associated with investing in those securities.
Wells Fargo Large Cap Core Fund | 21
Notes to financial statements (unaudited)
The following is a summary of the inputs used in valuing the Fund’s assets and liabilities as of January 31, 2021:
| | Quoted prices
(Level 1) | Other significant
observable inputs
(Level 2) | Significant
unobservable inputs
(Level 3) | Total |
| Assets | | | | |
| Investments in: | | | | |
| Common stocks | | | | |
| Communication services | $ 42,678,204 | $0 | $0 | $ 42,678,204 |
| Consumer discretionary | 74,185,636 | 0 | 0 | 74,185,636 |
| Consumer staples | 17,090,542 | 0 | 0 | 17,090,542 |
| Energy | 9,364,471 | 0 | 0 | 9,364,471 |
| Financials | 58,211,780 | 0 | 0 | 58,211,780 |
| Health care | 73,064,521 | 0 | 0 | 73,064,521 |
| Industrials | 42,847,431 | 0 | 0 | 42,847,431 |
| Information technology | 140,143,312 | 0 | 0 | 140,143,312 |
| Materials | 16,654,175 | 0 | 0 | 16,654,175 |
| Short-term investments | | | | |
| Investment companies | 9,646,274 | 0 | 0 | 9,646,274 |
| Total assets | $483,886,346 | $0 | $0 | $483,886,346 |
Additional sector, industry or geographic detail, if any, is included in the Portfolio of Investments.
For the six months ended January 31, 2021, the Fund did not have any transfers into/out of Level 3.
4. TRANSACTIONS WITH AFFILIATES
Management fee
Funds Management, an indirect wholly owned subsidiary of Wells Fargo & Company (“Wells Fargo”), is the manager of the Fund and provides advisory and fund-level administrative services under an investment management agreement. Under the investment management agreement, Funds Management is responsible for, among other services, implementing the investment objectives and strategies of the Fund, supervising the subadviser and providing fund-level administrative services in connection with the Fund’s operations. As compensation for its services under the investment management agreement, Funds Management is entitled to receive a management fee at the following annual rate based on the Fund’s average daily net assets:
| Average daily net assets | Management fee |
| First $500 million | 0.700% |
| Next $500 million | 0.675 |
| Next $1 billion | 0.650 |
| Next $2 billion | 0.625 |
| Next $1 billion | 0.600 |
| Next $3 billion | 0.590 |
| Next $2 billion | 0.565 |
| Next $2 billion | 0.555 |
| Next $4 billion | 0.530 |
| Over $16 billion | 0.505 |
For the six months ended January 31, 2021, the management fee was equivalent to an annual rate of 0.70% of the Fund’s average daily net assets.
Funds Management has retained the services of a subadviser to provide daily portfolio management to the Fund. The fee for subadvisory services is borne by Funds Management. Wells Capital Management Incorporated ("WellsCap"), an affiliate of
22 | Wells Fargo Large Cap Core Fund
Notes to financial statements (unaudited)
Funds Management and an indirect wholly owned subsidiary of Wells Fargo, is the subadviser to the Fund and is entitled to receive a fee from Funds Management at an annual rate starting at 0.35% and declining to 0.30% as the average daily net assets of the Fund increase.
Administration fees
Under a class-level administration agreement, Funds Management provides class-level administrative services to the Fund, which includes paying fees and expenses for services provided by the transfer agent, sub-transfer agents, omnibus account servicers and record-keepers. As compensation for its services under the class-level administration agreement, Funds Management receives an annual fee which is calculated based on the average daily net assets of each class as follows:
| | Class-level
administration fee |
| Class A | 0.21% |
| Class C | 0.21 |
| Class R | 0.21 |
| Class R6 | 0.03 |
| Administrator Class | 0.13 |
| Institutional Class | 0.13 |
Waivers and/or expense reimbursements
Funds Management has contractually waived and/or reimbursed management and administration fees to the extent necessary to maintain certain net operating expense ratios for the Fund. When each class of the Fund has exceeded its expense cap, Funds Management has waived fees and/or reimbursed expenses from fund-level expenses on a proportionate basis and then from class specific expenses. When only certain classes exceed their expense caps, waivers and/or reimbursements are applied against class specific expenses before fund-level expenses. Funds Management has committed through November 30, 2021 to waive fees and/or reimburse expenses to the extent necessary to cap expenses. Prior to or after the commitment expiration date, the cap may be increased or the commitment to maintain the cap may be terminated only with the approval of the Board of Trustees. The expense caps are as follows:
| | Expense ratio caps |
| Class A | 1.08% |
| Class C | 1.83 |
| Class R | 1.33 |
| Class R6 | 0.65 |
| Administrator Class | 0.97 |
Distribution fees
The Trust has adopted a distribution plan for Class C and Class R shares of the Fund pursuant to Rule 12b-1 under the 1940 Act. Distribution fees are charged to Class C and Class R shares and paid to Wells Fargo Funds Distributor, LLC (“Funds Distributor”), the principal underwriter, at an annual rate of 0.75% of the average daily net assets of Class C shares and 0.25% of the average daily net assets of Class R shares.
In addition, Funds Distributor is entitled to receive the front-end sales charge from the purchase of Class A shares and a contingent deferred sales charge on the redemption of certain Class A shares. Funds Distributor is also entitled to receive the contingent deferred sales charges from redemptions of Class C shares. For the six months ended January 31, 2021, Funds Distributor received $736 from the sale of Class A shares. No contingent deferred sales charges were incurred by Class A and Class C shares for the six months ended January 31, 2021.
Shareholder servicing fees
The Trust has entered into contracts with one or more shareholder servicing agents, whereby Class A, Class C, Class R, and Administrator Class of the Fund are charged a fee at an annual rate of 0.25% of the average daily net assets of each respective class. A portion of these total shareholder servicing fees were paid to affiliates of Wells Fargo.
Wells Fargo Large Cap Core Fund | 23
Notes to financial statements (unaudited)
Interfund transactions
The Fund may purchase or sell portfolio investment securities to certain other Wells Fargo affiliates pursuant to Rule 17a-7 under the 1940 Act and under procedures adopted by the Board of Trustees. The procedures have been designed to ensure that these interfund transactions, which do not incur broker commissions, are effected at current market prices.
5. INVESTMENT PORTFOLIO TRANSACTIONS
Purchases and sales of investments, excluding U.S. government obligations (if any) and short-term securities, for the six months ended January 31, 2021 were $135,048,357 and $212,656,348, respectively.
6. SECURITIES LENDING TRANSACTIONS
The Fund lends its securities through an unaffiliated securities lending agent and receives collateral in the form of cash or securities with a value at least equal to the value of the securities on loan. The value of the loaned securities is determined at the close of each business day and any increases or decreases in the required collateral are exchanged between the Fund and the counterparty on the next business day. Cash collateral received is invested in the Securities Lending Fund which seeks to provide a positive return compared to the daily Federal Funds Open Rate by investing in high-quality, U.S. dollar-denominated short-term money market instruments and is exempt from registration under Section 3(c)(7) of the 1940 Act. Securities Lending Fund is managed by Funds Management and is subadvised by WellsCap. Funds Management receives an advisory fee starting at 0.05% and declining to 0.01% as the average daily net assets of the Securities Lending Fund increase. All of the fees received by Funds Management are paid to WellsCap for its services as subadviser.
In the event of counterparty default or the failure of a borrower to return a loaned security, the Fund has the right to use the collateral to offset any losses incurred. As of January 31, 2021, the Fund had securities lending transactions with the following counterparties which are subject to offset:
| Counterparty | Value of
securities on
loan | Collateral
received1 | Net amount |
| BNP Paribas Securities Corporation | $6,525,089 | $(6,525,089) | $0 |
1 Collateral received within this table is limited to the collateral for the net transaction with the counterparty.
7. BANK BORROWINGS
The Trust (excluding the money market funds), Wells Fargo Master Trust and Wells Fargo Variable Trust are parties to a $350,000,000 revolving credit agreement whereby the Fund is permitted to use bank borrowings for temporary or emergency purposes, such as to fund shareholder redemption requests. Interest under the credit agreement is charged to the Fund based on a borrowing rate equal to the higher of the Federal Funds rate in effect on that day plus 1.25% or the overnight LIBOR rate in effect on that day plus 1.25%. In addition, an annual commitment fee equal to 0.25% of the unused balance is allocated to each participating fund.
For the six months ended January 31, 2021, there were no borrowings by the Fund under the agreement.
8. CONCENTRATION RISKS
Concentration risks result from exposure to a limited number of sectors. As of the end of the period, the Fund concentrated its portfolio in investments related to the information technology sector. A fund that invests a substantial portion of its assets in any sector may be more affected by changes in that sector than would be a fund whose investments are not heavily weighted in any sector.
9. INDEMNIFICATION
Under the Fund's organizational documents, the officers and Trustees have been granted certain indemnification rights against certain liabilities that may arise out of performance of their duties to the Fund. The Fund has entered into a separate agreement with each Trustee that converts indemnification rights currently existing under the Fund’s organizational documents into contractual rights that cannot be changed in the future without the consent of the Trustee. Additionally, in the normal course of business, the Fund may enter into contracts with service providers that contain a variety of indemnification clauses. The Fund’s maximum exposure under these arrangements is dependent on future claims that may be made against the Fund and, therefore, cannot be estimated.
24 | Wells Fargo Large Cap Core Fund
Notes to financial statements (unaudited)
10. NEW ACCOUNTING PRONOUNCEMENT
In August 2018, FASB issued Accounting Standards Update (“ASU”) No. 2018-13, Fair Value Measurement (Topic 820) Disclosure Framework - Changes to the Disclosure Requirements for Fair Value Measurement. ASU 2018-13 updates the disclosure requirements on fair value measurements in Topic 820, Fair Value Measurements. The amendments are effective for fiscal years, and interim periods within those fiscal years, beginning after December 15, 2019. Management has adopted this guidance which did not have a material impact on the financial statements.
11. CORONAVIRUS (COVID-19) PANDEMIC
On March 11, 2020, the World Health Organization announced that it had made the assessment that coronavirus disease 2019 (“COVID-19”) is a pandemic. The impacts of COVID-19 are affecting the entire global economy, individual companies and investment products, the funds, and the market in general. There is significant uncertainty around the extent and duration of business disruptions related to COVID-19 and the impacts may be short term or may last for an extended period of time. The risk of further spreading of COVID-19 has led to significant uncertainty and volatility in the financial markets.
12. SUBSEQUENT EVENT
On February 23, 2021, Wells Fargo announced that it has entered into a definitive agreement to sell Wells Fargo Asset Management (“WFAM”) to GTCR LLC and Reverence Capital Partners, L.P. WFAM is the trade name used by the asset management businesses of Wells Fargo and includes Wells Fargo Funds Management, LLC, the investment manager to the Fund, Wells Capital Management Incorporated and Wells Fargo Asset Management (International) Limited, both registered investment advisers providing sub-advisory services to certain funds, and Wells Fargo Funds Distributor, LLC, the Fund’s principal underwriter. As part of the transaction, Wells Fargo will own a 9.9% equity interest and will continue to serve as an important client and distribution partner.
Consummation of the transaction will result in the automatic termination of the Fund’s investment management agreement and sub-advisory agreement. The Fund’s Board of Trustees will be asked to approve new investment management arrangements with the new company. If approved by the Board, the new investment management arrangements with the new company will be presented to the shareholders of the Fund for approval, and, if approved by shareholders, would take effect upon the closing of the transaction. The transaction is expected to close in the second half of 2021, subject to customary closing conditions.
Wells Fargo Large Cap Core Fund | 25
Other information (unaudited)
PROXY VOTING INFORMATION
A description of the policies and procedures used to determine how to vote proxies relating to portfolio securities is available without charge, upon request, by calling 1-800-222-8222, visiting our website at wfam.com, or visiting the SEC website at sec.gov. Information regarding how the proxies related to portfolio securities were voted during the most recent 12-month period ended June 30 is available on the website at wfam.com or by visiting the SEC website at sec.gov.
QUARTERLY PORTFOLIO HOLDINGS INFORMATION
The Fund files its complete schedule of portfolio holdings with the SEC for the first and third quarters of each fiscal year as an exhibit to its reports on Form N-PORT. Shareholders may view the filed Form N-PORT by visiting the SEC website at sec.gov.
26 | Wells Fargo Large Cap Core Fund
Other information (unaudited)
BOARD OF TRUSTEES AND OFFICERS
Each of the Trustees and Officers listed in the table below acts in identical capacities for each fund in the Wells Fargo family of funds, which consists of 144 mutual funds comprising the Wells Fargo Funds Trust, Wells Fargo Variable Trust, Wells Fargo Master Trust and four closed-end funds (collectively the “Fund Complex”). This table should be read in conjunction with the Prospectus and the Statement of Additional Information1. The mailing address of each Trustee and Officer is 525 Market Street, 12th Floor, San Francisco, CA 94105. Each Trustee and Officer serves an indefinite term, however, each Trustee serves such term until reaching the mandatory retirement age established by the Trustees.
Independent Trustees
Name and
year of birth | Position held and
length of service* | Principal occupations during past five years or longer | Current other
public company or
investment
company
directorships |
William R. Ebsworth
(Born 1957) | Trustee,
since 2015 | Retired. From 1984 to 2013, equities analyst, portfolio manager, research director and chief investment officer at Fidelity Management and Research Company in Boston, Tokyo, and Hong Kong, and retired in 2013 as Chief Investment Officer of Fidelity Strategic Advisers, Inc. where he led a team of investment professionals managing client assets. Prior thereto, Board member of Hong Kong Securities Clearing Co., Hong Kong Options Clearing Corp., the Thailand International Fund, Ltd., Fidelity Investments Life Insurance Company, and Empire Fidelity Investments Life Insurance Company. Audit Committee Chair and Investment Committee Chair of the Vincent Memorial Hospital Endowment (non-profit organization). Mr. Ebsworth is a CFA® charterholder. | N/A |
Jane A. Freeman
(Born 1953) | Trustee,
since 2015;
Chair Liaison,
since 2018 | Retired. From 2012 to 2014 and 1999 to 2008, Chief Financial Officer of Scientific Learning Corporation. From 2008 to 2012, Ms. Freeman provided consulting services related to strategic business projects. Prior to 1999, Portfolio Manager at Rockefeller & Co. and Scudder, Stevens & Clark. Board member of the Harding Loevner Funds from 1996 to 2014, serving as both Lead Independent Director and chair of the Audit Committee. Board member of the Russell Exchange Traded Funds Trust from 2011 to 2012 and the chair of the Audit Committee. Ms. Freeman is also an inactive Chartered Financial Analyst. | N/A |
Isaiah Harris, Jr.
(Born 1952) | Trustee,
since 2009; Audit
Committee
Chair,
since 2019 | Retired. Chairman of the Board of CIGNA Corporation since 2009, and Director since 2005. From 2003 to 2011, Director of Deluxe Corporation. Prior thereto, President and CEO of BellSouth Advertising and Publishing Corp. from 2005 to 2007, President and CEO of BellSouth Enterprises from 2004 to 2005 and President of BellSouth Consumer Services from 2000 to 2003. Emeritus member of the Iowa State University Foundation Board of Governors. Emeritus Member of the Advisory Board of Iowa State University School of Business. Advisory Board Member, Palm Harbor Academy (private school). Mr. Harris is a certified public accountant (inactive status). | CIGNA Corporation |
Judith M. Johnson
(Born 1949) | Trustee,
since 2008 | Retired. Prior thereto, Chief Executive Officer and Chief Investment Officer of Minneapolis Employees Retirement Fund from 1996 to 2008. Ms. Johnson is an attorney, certified public accountant and a certified managerial accountant. | N/A |
David F. Larcker
(Born 1950) | Trustee,
since 2009 | James Irvin Miller Professor of Accounting at the Graduate School of Business (Emeritus), Stanford University, Director of the Corporate Governance Research Initiative and Senior Faculty of The Rock Center for Corporate Governance since 2006. From 2005 to 2008, Professor of Accounting at the Graduate School of Business, Stanford University. Prior thereto, Ernst & Young Professor of Accounting at The Wharton School, University of Pennsylvania from 1985 to 2005. | N/A |
Wells Fargo Large Cap Core Fund | 27
Other information (unaudited)
Name and
year of birth | Position held and
length of service* | Principal occupations during past five years or longer | Current other
public company or
investment
company
directorships |
Olivia S. Mitchell
(Born 1953) | Trustee,
since 2006;
Nominating and
Governance
Committee Chair,
since 2018 | International Foundation of Employee Benefit Plans Professor, Wharton School of the University of Pennsylvania since 1993. Director of Wharton’s Pension Research Council and Boettner Center on Pensions & Retirement Research, and Research Associate at the National Bureau of Economic Research. Previously, Cornell University Professor from 1978 to 1993. | N/A |
Timothy J. Penny
(Born 1951) | Trustee,
since 1996;
Chair,
since 2018 | President and Chief Executive Officer of Southern Minnesota Initiative Foundation, a non-profit organization, since 2007. Member of the Board of Trustees of NorthStar Education Finance, Inc., a non-profit organization, since 2007. | N/A |
James G. Polisson
(Born 1959) | Trustee,
since 2018 | Retired. Chief Marketing Officer, Source (ETF) UK Services, Ltd, from 2015 to 2017. From 2012 to 2015, Principal of The Polisson Group, LLC, a management consulting, corporate advisory and principal investing company. Chief Executive Officer and Managing Director at Russell Investments, Global Exchange Traded Funds from 2010 to 2012. Managing Director of Barclays Global Investors from 1998 to 2010 and Global Chief Marketing Officer for iShares and Barclays Global Investors from 2000 to 2010. Trustee of the San Francisco Mechanics’ Institute, a non-profit organization, from 2013 to 2015. Board member of the Russell Exchange Traded Fund Trust from 2011 to 2012. Director of Barclays Global Investors Holdings Deutschland GmbH from 2006 to 2009. Mr. Polisson is an attorney and has a retired status with the Massachusetts and District of Columbia Bar Associations. | N/A |
Pamela Wheelock
(Born 1959) | Trustee,
since January
2020; previously
Trustee from
January 2018 to
July 2019 | Board member of the Destination Medical Center Economic Development Agency, Rochester, Minnesota since 2019. Interim President of the McKnight Foundation from January to September 2020. Acting Commissioner, Minnesota Department of Human Services, July 2019 through September 2019. Human Services Manager (part-time), Minnesota Department of Human Services, October 2019 through December 2019. Chief Operating Officer, Twin Cities Habitat for Humanity from 2017 to 2019. Vice President of University Services, University of Minnesota from 2012 to 2016. Prior thereto, on the Board of Directors, Governance Committee and Finance Committee for the Minnesota Philanthropy Partners (Saint Paul Foundation) from 2012 to 2018, Interim Chief Executive Officer of Blue Cross Blue Shield of Minnesota from 2011 to 2012, Chairman of the Board from 2009 to 2012 and Board Director from 2003 to 2015. Vice President, Leadership and Community Engagement, Bush Foundation, Saint Paul, Minnesota (a private foundation) from 2009 to 2011. Executive Vice President and Chief Financial Officer, Minnesota Sports and Entertainment from 2004 to 2009 and Senior Vice President from 2002 to 2004. Executive Vice President of the Minnesota Wild Foundation from 2004 to 2008. Commissioner of Finance, State of Minnesota, from 1999 to 2002. Currently Board Chair of the Minnesota Wild Foundation since 2010. | N/A |
* Length of service dates reflect the Trustee’s commencement of service with the Trust’s predecessor entities, where applicable.
28 | Wells Fargo Large Cap Core Fund
Other information (unaudited)
Officers
Name and
year of birth | Position held and
length of service | Principal occupations during past five years or longer |
Andrew Owen
(Born 1960) | President,
since 2017 | Executive Vice President of Wells Fargo & Company and Head of Affiliated Managers, Wells Fargo Asset Management, since 2014. In addition, Mr. Owen is currently President, Chief Executive Officer and Director of Wells Fargo Funds Management, LLC since 2017. Prior thereto, Executive Vice President responsible for marketing, investments and product development for Wells Fargo Funds Management, LLC, from 2009 to 2014. |
Jeremy DePalma
(Born 1974) | Treasurer,
since 2012
(for certain funds in
the Fund Complex);
since 2021 (for
the remaining funds in the
Fund Complex) | Senior Vice President of Wells Fargo Funds Management, LLC since 2009. Senior Vice President of Evergreen Investment Management Company, LLC from 2008 to 2010 and head of the Fund Reporting and Control Team within Fund Administration from 2005 to 2010. |
Michelle Rhee
(Born 1966) | Chief Legal Officer,
since 2019 | Secretary of Wells Fargo Funds Management, LLC and Chief Legal Counsel of Wells Fargo Asset Management since 2018. Deputy General Counsel of Wells Fargo Bank, N.A. since 2020 and Assistant General Counsel of Wells Fargo Bank, N.A. from 2018 to 2020. Associate General Counsel and Managing Director of Bank of America Corporation from 2004 to 2018. |
Catherine Kennedy
(Born 1969) | Secretary,
since 2019 | Vice President of Wells Fargo Funds Management, LLC and Senior Counsel of the Wells Fargo Legal Department since 2010. Vice President and Senior Counsel of Evergreen Investment Management Company, LLC from 1998 to 2010. |
Michael H. Whitaker
(Born 1967) | Chief Compliance Officer,
since 2016 | Chief Compliance Officer of Wells Fargo Asset Management since 2016. Senior Vice President and Chief Compliance Officer for Fidelity Investments from 2007 to 2016. |
1 The Statement of Additional Information includes additional information about the Trustees and is available, without charge, upon request, by calling 1-800-222-8222 or by visiting the website at wfam.com.
Wells Fargo Large Cap Core Fund | 29
For more information
More information about Wells Fargo Funds is available free upon request. To obtain literature, please write, visit the Fund's website, or call:
Wells Fargo Funds
P.O. Box 219967
Kansas City, MO 64121-9967
Website: wfam.com
Individual investors: 1-800-222-8222
Retail investment professionals: 1-888-877-9275
Institutional investment professionals: 1-866-765-0778
This report and the financial statements contained herein are submitted for the general information of the shareholders of the Fund. If this report is used for promotional purposes, distribution of the report must be accompanied or preceded by a current prospectus. Before investing, please consider the investment objectives, risks, charges, and expenses of the investment. For a current prospectus and, if available, a summary prospectus, containing this information, call 1-800-222-8222 or visit the Fund’s website at wfam.com. Read the prospectus carefully before you invest or send money.
Wells Fargo Asset Management (WFAM) is the trade name for certain investment advisory/management firms owned by Wells Fargo & Company. These firms include but are not limited to Wells Capital Management Incorporated and Wells Fargo Funds Management, LLC. Certain products managed by WFAM entities are distributed by Wells Fargo Funds Distributor, LLC (a broker-dealer and Member FINRA).
This material is for general informational and educational purposes only and is NOT intended to provide investment advice or a recommendation of any kind— including a recommendation for any specific investment, strategy, or plan.
INVESTMENT PRODUCTS: NOT FDIC INSURED ■ NO BANK GUARANTEE ■ MAY LOSE VALUE
© 2021 Wells Fargo & Company. All rights reserved.
PAR-0221-00368 03-22
SA208/SAR208 01-21
Semi-Annual Report
January 31, 2021
Wells Fargo
Large Cap Growth Fund
Reduce clutter.
Save trees.
Sign up for electronic delivery of prospectuses and shareholder reports at wellsfargo.com/ advantagedelivery
The views expressed and any forward-looking statements are as of January 31, 2021, unless otherwise noted, and are those of the Fund's portfolio managers and/or Wells Fargo Asset Management. Discussions of individual securities or the markets generally are not intended as individual recommendations. Future events or results may vary significantly from those expressed in any forward-looking statements. The views expressed are subject to change at any time in response to changing circumstances in the market. Wells Fargo Asset Management and the Fund disclaim any obligation to publicly update or revise any views expressed or forward-looking statements.
INVESTMENT PRODUCTS: NOT FDIC INSURED ■ NO BANK GUARANTEE ■ MAY LOSE VALUE
Wells Fargo Large Cap Growth Fund | 1
Letter to shareholders (unaudited)
Dear Shareholder:
We are pleased to offer you this semi-annual report for the Wells Fargo Large Cap Growth Fund for the six-month period that ended January 31, 2021. Despite a deeply challenging year, dominated by the spread of COVID-19 cases and a sharp drop in economic output throughout much of the world, global stocks performed extremely well, benefiting from ongoing central bank support and rising optimism over the development and distribution of effective COVID-19 vaccines. Bonds also had positive returns, led by global bonds and high-yield bonds.
For the six-month period, U.S. stocks, based on the S&P 500 Index1, gained 14.47%. International stocks, as measured by the MSCI ACWI ex USA Index (Net)2, returned 19.28%, while the MSCI EM Index (Net)3, had stronger performance, with a 24.07% gain. Among bond indexes, the Bloomberg Barclays U.S. Aggregate Bond Index4 returned -0.91%, the Bloomberg Barclays Global Aggregate ex-USD Index (unhedged)5 gained 3.71%, and the Bloomberg Barclays Municipal Bond Index6 returned 2.01% while the ICE BofA U.S. High Yield Index7 returned 6.82%.
The stock market rally continued in August.
The stock market continued a months-long rally in August despite concerns over rising numbers of U.S. and European COVID-19 cases. Relatively strong second-quarter earnings boosted investor sentiment along with the U.S. Federal Reserve’s announcement of a monetary policy shift expected to support longer-term low interest rates. U.S. manufacturing and services activity indexes beat expectations, while the U.S. housing market maintained strength. In Europe, retail sales expanded and consumer confidence was steady. China’s economy continued to expand.
Stocks grew more volatile in September on mixed economic data. U.S. economic activity continued to grow. However, U.S. unemployment remained elevated at 7.9% in September. With U.S. Congress delaying further fiscal relief and uncertainties surrounding a possible vaccine, doubts crept back into the financial markets. In the U.K., a lack of progress in Brexit talks weighed on markets. China’s economy picked up steam, fueled by increased global demand.
Andrew Owen
President
Wells Fargo Funds
“The stock market continued a months-long rally in August despite concerns over rising numbers of U.S. and European COVID-19 cases.”
| 1 | The S&P 500 Index consists of 500 stocks chosen for market size, liquidity, and industry group representation. It is a market-value-weighted index with each stock's weight in the index proportionate to its market value. You cannot invest directly in an index. |
| 2 | The Morgan Stanley Capital International (MSCI) All Country World Index (ACWI) ex USA Index (Net) is a free-float-adjusted market-capitalization-weighted index that is designed to measure the equity market performance of developed and emerging markets, excluding the United States. Source: MSCI. MSCI makes no express or implied warranties or representations and shall have no liability whatsoever with respect to any MSCI data contained herein. The MSCI data may not be further redistributed or used as a basis for other indices or any securities or financial products. This report is not approved, reviewed, or produced by MSCI. You cannot invest directly in an index. |
| 1 | The S&P 500 Index consists of 500 stocks chosen for market size, liquidity, and industry group representation. It is a market-value-weighted index with each stock's weight in the index proportionate to its market value. You cannot invest directly in an index. |
| 3 | The MSCI Emerging Markets (EM) Index (Net) is a free-float-adjusted market-capitalization-weighted index that is designed to measure equity market performance of emerging markets. You cannot invest directly in an index. |
| 1 | The S&P 500 Index consists of 500 stocks chosen for market size, liquidity, and industry group representation. It is a market-value-weighted index with each stock's weight in the index proportionate to its market value. You cannot invest directly in an index. |
| 4 | The Bloomberg Barclays U.S. Aggregate Bond Index is a broad-based benchmark that measures the investment-grade, U.S. dollar-denominated, fixed-rate taxable bond market, including Treasuries, government-related and corporate securities, mortgage-backed securities (agency fixed-rate and hybrid adjustable-rate mortgage pass-throughs), asset-backed securities, and commercial mortgage-backed securities. You cannot invest directly in an index. |
| 1 | The S&P 500 Index consists of 500 stocks chosen for market size, liquidity, and industry group representation. It is a market-value-weighted index with each stock's weight in the index proportionate to its market value. You cannot invest directly in an index. |
| 5 | The Bloomberg Barclays Global Aggregate ex-USD Index (unhedged) is an unmanaged index that provides a broad-based measure of the global investment-grade fixed-income markets excluding the U.S. dollar-denominated debt market. You cannot invest directly in an index. |
| 1 | The S&P 500 Index consists of 500 stocks chosen for market size, liquidity, and industry group representation. It is a market-value-weighted index with each stock's weight in the index proportionate to its market value. You cannot invest directly in an index. |
| 6 | The Bloomberg Barclays Municipal Bond Index is an unmanaged index composed of long-term tax-exempt bonds with a minimum credit rating of Baa. You cannot invest directly in an index. |
| 1 | The S&P 500 Index consists of 500 stocks chosen for market size, liquidity, and industry group representation. It is a market-value-weighted index with each stock's weight in the index proportionate to its market value. You cannot invest directly in an index. |
| 7 | The ICE BofA U.S. High Yield Index is a market-capitalization-weighted index of domestic and Yankee high-yield bonds. The index tracks the performance of high-yield securities traded in the U.S. bond market. You cannot invest directly in an index. Copyright 2021. ICE Data Indices, LLC. All rights reserved. |
2 | Wells Fargo Large Cap Growth Fund
Letter to shareholders (unaudited)
In October, capital markets stepped back from their six-month rally. Market volatility rose in advance of the U.S. election and amid a global increase in COVID-19 infections. Europe introduced tighter restrictions affecting economic activity. U.S. markets looked favorably at the prospect of Democratic control of the federal purse strings, which could lead to additional fiscal stimulus and a boost to economic activity. Meanwhile, China reported 4.9% third-quarter GDP growth.
Global stocks rallied in November, propelled by optimism over three promising COVID-19 vaccines. Reversing recent trends, value stocks outperformed growth stocks and cyclical stocks outpaced technology stocks. However, U.S. unemployment remained elevated, with a net job loss of 10 million since February. The eurozone services purchasing managers’ index contracted sharply while the region’s manufacturing activity grew. The U.S. election results added to the upbeat mood as investors anticipated more consistent policies in the new administration.
Financial markets ended the year with strength on high expectations for a rapid rollout of the COVID-19 vaccines, the successful passage of a $900 billion stimulus package, and rising expectations of additional economic support from a Democratic-led Congress. U.S. economic data were mixed with still-elevated unemployment and weak retail sales but growth in manufacturing output. In contrast, China’s economic expansion continued in both manufacturing and nonmanufacturing. U.S. COVID-19 infection rates continued to rise even as new state and local lockdown measures were implemented.
The year 2021 began with emerging market stocks leading all major asset classes in January, driven by China’s strong economic growth and a broad recovery in corporate earnings, which propelled China’s stock market higher. In the United States, positive news on vaccine trials and January expansion in both the manufacturing and services sectors was offset by a weak December monthly jobs report. This was compounded by technical factors as some hedge funds were forced to sell stocks to protect themselves against a well-publicized short squeeze coordinated by a group of retail investors. Eurozone sentiment and economic growth were particularly weak, reflecting the impact of a new lockdown with stricter social distancing along with a slow vaccine rollout.
Don’t let short-term uncertainty derail long-term investment goals.
Periods of investment uncertainty can present challenges, but experience has taught us that maintaining long-term investment goals can be an effective way to plan for the future. To help you create a sound strategy based on your personal goals and risk tolerance, Wells Fargo Funds offers more than 100 mutual funds spanning a wide range of asset classes and investment styles. Although diversification cannot guarantee an investment profit or prevent losses, we believe it can be an effective way to manage investment risk and potentially smooth out overall portfolio performance. We encourage investors to know their investments and to understand that appropriate levels of risk-taking may unlock opportunities.
Thank you for choosing to invest with Wells Fargo Funds. We appreciate your confidence in us and remain committed to helping you meet your financial needs.
Sincerely,
Andrew Owen
President
Wells Fargo Funds
“Global stocks rallied in November, propelled by optimism over three promising COVID-19 vaccines.”
For further information about your Fund, contact your investment professional, visit our website at wfam.com, or call us directly at 1-800-222-8222.
Wells Fargo Large Cap Growth Fund | 3
Performance highlights (unaudited)
Investment objective
The Fund seeks long-term capital appreciation.
Manager
Wells Fargo Funds Management, LLC
Subadviser
Wells Capital Management Incorporated
Portfolio managers
Joseph M. Eberhardy, CFA®‡, CPA
Robert Gruendyke, CFA®‡
Thomas C. Ognar, CFA®‡
Average annual total returns (%) as of January 31, 2021
| | | Including sales charge | | Excluding sales charge | | Expense ratios1 (%) |
| | Inception date | 1 year | 5 year | 10 year | | 1 year | 5 year | 10 year | | Gross | Net 2 |
| Class A (STAFX) | 7-30-2010 | 17.16 | 17.88 | 13.90 | | 24.31 | 19.28 | 14.58 | | 1.18 | 1.07 |
| Class C (STOFX) | 7-30-2010 | 22.38 | 18.38 | 13.72 | | 23.38 | 18.38 | 13.72 | | 1.93 | 1.82 |
| Class R (STMFX)3 | 6-15-2012 | – | – | – | | 23.99 | 18.97 | 14.29 | | 1.43 | 1.32 |
| Class R4 (SLGRX)4 | 11-30-2012 | – | – | – | | 24.37 | 19.56 | 14.91 | | 0.90 | 0.80 |
| Class R6 (STFFX)5 | 11-30-2012 | – | – | – | | 24.81 | 19.78 | 15.06 | | 0.75 | 0.65 |
| Administrator Class (STDFX) | 7-30-2010 | – | – | – | | 24.44 | 19.42 | 14.72 | | 1.10 | 0.95 |
| Institutional Class (STNFX) | 7-30-2010 | – | – | – | | 24.66 | 19.65 | 14.98 | | 0.85 | 0.75 |
| Russell 1000® Growth Index6 | – | – | – | – | | 34.46 | 22.22 | 16.83 | | – | – |
Figures quoted represent past performance, which is no guarantee of future results, and do not reflect taxes that a shareholder may pay on an investment in a fund. Investment return and principal value of an investment will fluctuate so that an investor’s shares, when redeemed, may be worth more or less than their original cost. Performance shown without sales charges would be lower if sales charges were reflected. Current performance may be lower or higher than the performance data quoted, which assumes the reinvestment of dividends and capital gains. Current month-end performance is available on the Fund’s website, wfam.com.
Index returns do not include transaction costs associated with buying and selling securities, any mutual fund fees or expenses, or any taxes. It is not possible to invest directly in an index.
For Class A shares, the maximum front-end sales charge is 5.75%. For Class C shares, the maximum contingent deferred sales charge is 1.00%. Performance including a contingent deferred sales charge assumes the sales charge for the corresponding time period. Class R, Class R4, Class R6, Administrator Class, and Institutional Class and shares are sold without a front-end sales charge or contingent deferred sales charge.
Stock values fluctuate in response to the activities of individual companies and general market and economic conditions. Certain investment strategies tend to increase the total risk of an investment (relative to the broader market). The Fund is exposed to foreign investment risk and smaller-company securities risk. Consult the Fund’s prospectus for additional information on these and other risks.
Please see footnotes on page 5.
4 | Wells Fargo Large Cap Growth Fund
Performance highlights (unaudited)
| Ten largest holdings (%) as of January 31, 20217 |
| Amazon.com Incorporated | 9.86 |
| Microsoft Corporation | 9.63 |
| Apple Incorporated | 4.95 |
| PayPal Holdings Incorporated | 4.76 |
| Facebook Incorporated Class A | 4.05 |
| Alphabet Incorporated Class A | 4.01 |
| MasterCard Incorporated Class A | 3.93 |
| MarketAxess Holdings Incorporated | 3.48 |
| Visa Incorporated Class A | 2.61 |
| ServiceNow Incorporated | 2.10 |
| Sector allocation as of January 31, 20218 |
| ‡ | CFA® and Chartered Financial Analyst® are trademarks owned by CFA Institute. |
| 1 | Reflects the expense ratios as stated in the most recent prospectuses. The expense ratios shown are subject to change and may differ from the annualized expense ratios shown in the financial highlights of this report. |
| 2 | The manager has contractually committed through November 30, 2021, to waive fees and/or reimburse expenses to the extent necessary to cap total annual fund operating expenses after fee waivers at 1.07% for Class A, 1.82% for Class C, 1.32% for Class R, 0.80% for Class R4, 0.65% for Class R6, 0.95% for Administrator Class, and 0.75% for Institutional Class. Brokerage commissions, stamp duty fees, interest, taxes, acquired fund fees and expenses (if any), and extraordinary expenses are excluded from the expense caps. Prior to or after the commitment expiration date, the caps may be increased or the commitment to maintain the caps may be terminated only with the approval of the Board of Trustees. Without these caps, the Fund’s returns would have been lower. The expense ratio paid by an investor is the net expense ratio (the total annual fund operating expenses after fee waivers) as stated in the prospectuses. |
| 3 | Historical performance shown for the Class R shares prior to their inception reflects the performance of the former Investor Class shares, adjusted to reflect the higher expenses applicable to the Class R shares. |
| 4 | Historical performance shown for the Class R4 shares prior to their inception reflects the performance of the Institutional Class shares, adjusted to reflect the higher expenses applicable to the Class R4 shares. |
| 5 | Historical performance shown for the Class R6 shares prior to their inception reflects the performance of the Institutional Class shares, and includes the higher expenses applicable to the Institutional Class shares. If these expenses had not been included, returns for the Class R6 shares would be higher. |
| 6 | The Russell 1000® Growth Index measures the performance of those Russell 1000 companies with higher price/book ratios and higher forecasted growth values. You cannot invest directly in an index. |
| 7 | Figures represent the percentage of the Fund's net assets. Holdings are subject to change and may have changed since the date specified. |
| 8 | Figures represent the percentage of the Fund's long-term investments. These amounts are subject to change and may have changed since the date specified. |
Wells Fargo Large Cap Growth Fund | 5
Fund expenses (unaudited)
As a shareholder of the Fund, you incur two types of costs: (1) transaction costs, including sales charges (loads) on purchase payments and contingent deferred sales charges (if any) on redemptions and (2) ongoing costs, including management fees, distribution (12b-1) and/or shareholder servicing fees, and other Fund expenses. This example is intended to help you understand your ongoing costs (in dollars) of investing in the Fund and to compare these costs with the ongoing costs of investing in other mutual funds.
The example is based on an investment of $1,000 invested at the beginning of the six-month period and held for the entire period from August 1, 2020 to January 31, 2021.
Actual expenses
The “Actual” line of the table below provides information about actual account values and actual expenses. You may use the information in this line, together with the amount you invested, to estimate the expenses that you paid over the period. Simply divide your account value by $1,000 (for example, an $8,600 account value divided by $1,000 = 8.6), then multiply the result by the number in the “Actual” line under the heading entitled “Expenses paid during period” for your applicable class of shares to estimate the expenses you paid on your account during this period.
Hypothetical example for comparison purposes
The “Hypothetical” line of the table below provides information about hypothetical account values and hypothetical expenses based on the Fund’s actual expense ratio and an assumed rate of return of 5% per year before expenses, which is not the Fund’s actual return. The hypothetical account values and expenses may not be used to estimate the actual ending account balance or expenses you paid for the period. You may use this information to compare the ongoing costs of investing in the Fund and other funds. To do so, compare this 5% hypothetical example with the 5% hypothetical examples that appear in the shareholder reports of the other funds.
Please note that the expenses shown in the table are meant to highlight your ongoing costs only and do not reflect any transactional costs, such as sales charges (loads) and contingent deferred sales charges. Therefore, the “Hypothetical” line of the table is useful in comparing ongoing costs only and will not help you determine the relative total costs of owning different funds. In addition, if these transactional costs were included, your costs would have been higher
| | Beginning
account value
8-1-2020 | Ending
account value
1-31-2021 | Expenses
paid during
the period1 | Annualized net
expense ratio |
| Class A | | | | |
| Actual | $1,000.00 | $1,097.31 | $5.50 | 1.04% |
| Hypothetical (5% return before expenses) | $1,000.00 | $1,019.96 | $5.30 | 1.04% |
| Class C | | | | |
| Actual | $1,000.00 | $1,093.07 | $9.60 | 1.82% |
| Hypothetical (5% return before expenses) | $1,000.00 | $1,016.03 | $9.25 | 1.82% |
| Class R | | | | |
| Actual | $1,000.00 | $1,095.91 | $6.81 | 1.29% |
| Hypothetical (5% return before expenses) | $1,000.00 | $1,018.70 | $6.56 | 1.29% |
| Class R4 | | | | |
| Actual | $1,000.00 | $1,098.59 | $4.23 | 0.80% |
| Hypothetical (5% return before expenses) | $1,000.00 | $1,021.17 | $4.08 | 0.80% |
| Class R6 | | | | |
| Actual | $1,000.00 | $1,099.35 | $3.44 | 0.65% |
| Hypothetical (5% return before expenses) | $1,000.00 | $1,021.93 | $3.31 | 0.65% |
| Administrator Class | | | | |
| Actual | $1,000.00 | $1,097.88 | $5.02 | 0.95% |
| Hypothetical (5% return before expenses) | $1,000.00 | $1,020.42 | $4.84 | 0.95% |
| Institutional Class | | | | |
| Actual | $1,000.00 | $1,098.71 | $3.97 | 0.75% |
| Hypothetical (5% return before expenses) | $1,000.00 | $1,021.42 | $3.82 | 0.75% |
1 Expenses paid is equal to the annualized net expense ratio of each class multiplied by the average account value over the period, multiplied by the number of days in the most recent fiscal half-year divided by the number of days in the fiscal year (to reflect the one-half-year period).
6 | Wells Fargo Large Cap Growth Fund
Portfolio of investments—January 31, 2021 (unaudited)
| | | | | Shares | Value |
| Common stocks: 99.54% | | | | | |
| Communication services: 10.69% | | | | | |
| Entertainment: 1.47% | | | | | |
| Activision Blizzard Incorporated | | | | 119,630 | $ 10,886,330 |
| Roku Incorporated † | | | | 5,675 | 2,207,745 |
| Spotify Technology SA † | | | | 10,560 | 3,326,400 |
| | | | | | 16,420,475 |
| Interactive media & services: 9.22% | | | | | |
| Alphabet Incorporated Class A † | | | | 24,480 | 44,733,773 |
| Alphabet Incorporated Class C † | | | | 7,035 | 12,914,431 |
| Facebook Incorporated Class A † | | | | 174,825 | 45,162,542 |
| | | | | | 102,810,746 |
| Consumer discretionary: 15.37% | | | | | |
| Hotels, restaurants & leisure: 1.62% | | | | | |
| Chipotle Mexican Grill Incorporated † | | | | 12,180 | 18,026,400 |
| Internet & direct marketing retail: 9.86% | | | | | |
| Amazon.com Incorporated † | | | | 34,320 | 110,036,784 |
| Specialty retail: 2.57% | | | | | |
| The Home Depot Incorporated | | | | 55,110 | 14,924,890 |
| The TJX Companies Incorporated | | | | 214,335 | 13,726,013 |
| | | | | | 28,650,903 |
| Textiles, apparel & luxury goods: 1.32% | | | | | |
| Nike Incorporated Class B | | | | 110,480 | 14,759,023 |
| Consumer staples: 0.96% | | | | | |
| Beverages: 0.58% | | | | | |
| Boston Beer Company Incorporated Class A † | | | | 7,000 | 6,418,230 |
| Personal products: 0.38% | | | | | |
| The Estee Lauder Companies Incorporated Class A | | | | 18,145 | 4,294,014 |
| Financials: 4.59% | | | | | |
| Capital markets: 4.59% | | | | | |
| MarketAxess Holdings Incorporated | | | | 71,755 | 38,802,234 |
| MSCI Incorporated | | | | 21,445 | 8,477,209 |
| Tradeweb Markets Incorporated Class A | | | | 65,200 | 3,963,508 |
| | | | | | 51,242,951 |
| Health care: 9.66% | | | | | |
| Biotechnology: 0.59% | | | | | |
| Seagen Incorporated † | | | | 40,470 | 6,648,007 |
| Health care equipment & supplies: 5.44% | | | | | |
| Abbott Laboratories | | | | 150,225 | 18,566,308 |
| Boston Scientific Corporation † | | | | 299,359 | 10,609,283 |
The accompanying notes are an integral part of these financial statements.
Wells Fargo Large Cap Growth Fund | 7
Portfolio of investments—January 31, 2021 (unaudited)
| | | | | Shares | Value |
| Health care equipment & supplies (continued) | | | | | |
| Edwards Lifesciences Corporation † | | | | 259,030 | $ 21,390,697 |
| Stryker Corporation | | | | 45,740 | 10,108,997 |
| | | | | | 60,675,285 |
| Health care technology: 0.85% | | | | | |
| Veeva Systems Incorporated Class A † | | | | 34,150 | 9,440,426 |
| Life sciences tools & services: 0.70% | | | | | |
| Agilent Technologies Incorporated | | | | 65,070 | 7,819,462 |
| Pharmaceuticals: 2.08% | | | | | |
| Horizon Therapeutics plc † | | | | 74,160 | 5,375,117 |
| Zoetis Incorporated | | | | 115,750 | 17,854,438 |
| | | | | | 23,229,555 |
| Industrials: 9.15% | | | | | |
| Air freight & logistics: 1.71% | | | | | |
| FedEx Corporation | | | | 39,900 | 9,390,066 |
| United Parcel Service Incorporated Class B | | | | 62,800 | 9,734,000 |
| | | | | | 19,124,066 |
| Commercial services & supplies: 1.73% | | | | | |
| Copart Incorporated † | | | | 104,960 | 11,519,360 |
| Waste Connections Incorporated | | | | 78,720 | 7,754,707 |
| | | | | | 19,274,067 |
| Professional services: 0.84% | | | | | |
| CoStar Group Incorporated † | | | | 10,415 | 9,370,480 |
| Road & rail: 4.87% | | | | | |
| CSX Corporation | | | | 148,690 | 12,750,911 |
| Norfolk Southern Corporation | | | | 83,000 | 19,639,460 |
| Uber Technologies Incorporated † | | | | 164,005 | 8,352,775 |
| Union Pacific Corporation | | | | 68,745 | 13,575,075 |
| | | | | | 54,318,221 |
| Information technology: 44.57% | | | | | |
| IT services: 16.76% | | | | | |
| Affirm Holdings Incorporated † | | | | 13,689 | 1,363,288 |
| Fidelity National Information Services Incorporated | | | | 119,003 | 14,692,110 |
| Global Payments Incorporated | | | | 79,585 | 14,048,344 |
| MasterCard Incorporated Class A | | | | 138,660 | 43,856,771 |
| PayPal Holdings Incorporated † | | | | 226,635 | 53,102,847 |
| Shopify Incorporated Class A † | | | | 2,295 | 2,521,264 |
| Snowflake Incorporated Class A † | | | | 11,995 | 3,268,038 |
| Square Incorporated Class A † | | | | 48,250 | 10,420,070 |
| Twilio Incorporated Class A † | | | | 40,775 | 14,655,758 |
| Visa Incorporated Class A | | | | 150,640 | 29,111,180 |
| | | | | | 187,039,670 |
| Semiconductors & semiconductor equipment: 4.90% | | | | | |
| Microchip Technology Incorporated | | | | 171,770 | 23,379,615 |
The accompanying notes are an integral part of these financial statements.
8 | Wells Fargo Large Cap Growth Fund
Portfolio of investments—January 31, 2021 (unaudited)
| | | | | Shares | Value |
| Semiconductors & semiconductor equipment (continued) | | | | | |
| NVIDIA Corporation | | | | 39,330 | $ 20,435,475 |
| Texas Instruments Incorporated | | | | 65,425 | 10,840,268 |
| | | | | | 54,655,358 |
| Software: 17.96% | | | | | |
| Adobe Incorporated † | | | | 14,395 | 6,603,994 |
| Atlassian Corporation plc Class A † | | | | 41,825 | 9,667,012 |
| Crowdstrike Holdings Incorporated Class A † | | | | 26,690 | 5,759,702 |
| Dynatrace Incorporated † | | | | 255,900 | 10,622,409 |
| Microsoft Corporation | | | | 463,240 | 107,453,150 |
| RingCentral Incorporated Class A † | | | | 42,340 | 15,789,433 |
| ServiceNow Incorporated † | | | | 43,130 | 23,426,491 |
| Splunk Incorporated † | | | | 71,400 | 11,783,142 |
| Workday Incorporated Class A † | | | | 40,500 | 9,214,965 |
| | | | | | 200,320,298 |
| Technology hardware, storage & peripherals: 4.95% | | | | | |
| Apple Incorporated | | | | 418,690 | 55,250,332 |
| Materials: 4.55% | | | | | |
| Chemicals: 4.55% | | | | | |
| Air Products & Chemicals Incorporated | | | | 71,810 | 19,156,036 |
| Ecolab Incorporated | | | | 54,755 | 11,197,945 |
| Linde plc | | | | 83,085 | 20,389,059 |
| | | | | | 50,743,040 |
| Total Common stocks (Cost $475,403,684) | | | | | 1,110,567,793 |
| | | Yield | | | |
| Short-term investments: 0.04% | | | | | |
| Investment companies: 0.04% | | | | | |
| Wells Fargo Government Money Market Fund Select Class ♠∞ | | 0.03% | | 459,883 | 459,883 |
| Total Short-term investments (Cost $459,883) | | | | | 459,883 |
| Total investments in securities (Cost $475,863,567) | 99.58% | | | | 1,111,027,676 |
| Other assets and liabilities, net | 0.42 | | | | 4,693,962 |
| Total net assets | 100.00% | | | | $1,115,721,638 |
| † | Non-income-earning security |
| ♠ | The issuer of the security is an affiliated person of the Fund as defined in the Investment Company Act of 1940. |
| ∞ | The rate represents the 7-day annualized yield at period end. |
The accompanying notes are an integral part of these financial statements.
Wells Fargo Large Cap Growth Fund | 9
Portfolio of investments—January 31, 2021 (unaudited)
Investments in affiliates
An affiliated investment is an investment in which the Fund owns at least 5% of the outstanding voting shares of the issuer or as a result of other relationships, such as the Fund and the issuer having the same investment manager. Transactions with issuers that were either affiliated persons of the Fund at the beginning of the period or the end of the period were as follows:
| | Value,
beginning of
period | Purchases | Sales
proceeds | Net
realized
gains
(losses) | | Net
change in
unrealized
gains
(losses) | | Value,
end of
period | | % of
net
assets | Shares,
end
of period | Income
from
affiliated
securities |
| Short-term investments | | | | | | | | | | | | |
| Investment companies | | | | | | | | | | | | |
| Securities Lending Cash Investments LLC* | $ 0 | $17,753,375 | $(17,753,375) | $0 | | $0 | | $ 0 | | | 0 | $175 # |
| Wells Fargo Government Money Market Fund Select Class | 2,815,713 | 94,192,247 | (96,548,077) | 0 | | 0 | | 459,883 | | | 459,883 | 764 |
| | | | | $0 | | $0 | | $459,883 | | 0.04% | | $939 |
| * | No longer held at the end of period. |
| # | Amount shown represents income before fees and rebates. |
The accompanying notes are an integral part of these financial statements.
10 | Wells Fargo Large Cap Growth Fund
Statement of assets and liabilities—January 31, 2021 (unaudited)
| | |
| Assets | |
Investments in unaffiliated securities, at value (cost $475,403,684)
| $ 1,110,567,793 |
Investments in affiliated securites, at value (cost $459,883)
| 459,883 |
Cash
| 30,961 |
Receivable for investments sold
| 9,871,422 |
Receivable for Fund shares sold
| 333,265 |
Receivable for dividends
| 323,244 |
Prepaid expenses and other assets
| 13,716 |
Total assets
| 1,121,600,284 |
| Liabilities | |
Payable for investments purchased
| 3,395,476 |
Payable for Fund shares redeemed
| 1,506,401 |
Management fee payable
| 567,548 |
Administration fees payable
| 140,614 |
Distribution fees payable
| 5,445 |
Trustees’ fees and expenses payable
| 2,390 |
Accrued expenses and other liabilities
| 260,772 |
Total liabilities
| 5,878,646 |
Total net assets
| $1,115,721,638 |
| Net assets consist of | |
Paid-in capital
| $ 434,614,485 |
Total distributable earnings
| 681,107,153 |
Total net assets
| $1,115,721,638 |
| Computation of net asset value and offering price per share | |
Net assets – Class A
| $ 618,358,702 |
Shares outstanding – Class A1
| 13,026,428 |
Net asset value per share – Class A
| $47.47 |
Maximum offering price per share – Class A2
| $50.37 |
Net assets – Class C
| $ 7,196,855 |
Shares outstanding – Class C1
| 178,250 |
Net asset value per share – Class C
| $40.38 |
Net assets – Class R
| $ 2,644,736 |
Shares outstanding – Class R1
| 58,239 |
Net asset value per share – Class R
| $45.41 |
Net assets – Class R4
| $ 17,482 |
Shares outstanding – Class R41
| 353 |
Net asset value per share – Class R4
| $49.52 |
Net assets – Class R6
| $ 337,877,081 |
Shares outstanding – Class R61
| 6,739,988 |
Net asset value per share – Class R6
| $50.13 |
Net assets – Administrator Class
| $ 77,677,283 |
Shares outstanding – Administrator Class1
| 1,604,305 |
Net asset value per share – Administrator Class
| $48.42 |
Net assets – Institutional Class
| $ 71,949,499 |
Shares outstanding – Institutional Class1
| 1,444,983 |
Net asset value per share – Institutional Class
| $49.79 |
| 1 | The Fund has an unlimited number of authorized shares. |
| 2 | Maximum offering price is computed as 100/94.25 of net asset value. On investments of $50,000 or more, the offering price is reduced. |
The accompanying notes are an integral part of these financial statements.
Wells Fargo Large Cap Growth Fund | 11
Statement of operations—six months ended January 31, 2021 (unaudited)
| | |
| Investment income | |
Dividends (net of foreign withholdings taxes of $8,193)
| $ 3,004,710 |
Income from affiliated securities
| 1,921 |
Total investment income
| 3,006,631 |
| Expenses | |
Management fee
| 3,829,712 |
| Administration fees | |
Class A
| 645,619 |
Class C
| 9,219 |
Class R
| 3,476 |
Class R4
| 8 |
Class R6
| 50,895 |
Administrator Class
| 52,236 |
Institutional Class
| 48,226 |
| Shareholder servicing fees | |
Class A
| 768,595 |
Class C
| 10,975 |
Class R
| 3,596 |
Class R4
| 7 |
Administrator Class
| 100,454 |
| Distribution fees | |
Class C
| 32,892 |
Class R
| 3,513 |
Custody and accounting fees
| 24,281 |
Professional fees
| 24,016 |
Registration fees
| 58,935 |
Shareholder report expenses
| 35,037 |
Trustees’ fees and expenses
| 9,707 |
Other fees and expenses
| 19,329 |
Total expenses
| 5,730,728 |
| Less: Fee waivers and/or expense reimbursements | |
Fund-level
| (375,081) |
Class A
| (207,255) |
Class C
| (1,604) |
Class R6
| (46,379) |
Administrator Class
| (28,886) |
Institutional Class
| (10,037) |
Net expenses
| 5,061,486 |
Net investment loss
| (2,054,855) |
| Realized and unrealized gains (losses) on investments | |
Net realized gains on investments
| 104,071,071 |
Net change in unrealized gains (losses) on investments
| 1,972,450 |
Net realized and unrealized gains (losses) on investments
| 106,043,521 |
Net increase in net assets resulting from operations
| 103,988,666 |
The accompanying notes are an integral part of these financial statements.
12 | Wells Fargo Large Cap Growth Fund
Statement of changes in net assets
| | |
| | Six months ended
January 31, 2021
(unaudited) | Year ended
July 31, 2020 |
| Operations | | | | |
Net investment loss
| | $ (2,054,855) | | $ (921,213) |
Net realized gains on investments
| | 104,071,071 | | 102,201,550 |
Net change in unrealized gains (losses) on investments
| | 1,972,450 | | 109,642,689 |
Net increase in net assets resulting from operations
| | 103,988,666 | | 210,923,026 |
| Distributions to shareholders from | | | | |
| Net investment income and net realized gains | | | | |
Class A
| | (79,883,893) | | (48,085,264) |
Class C
| | (1,111,827) | | (1,095,349) |
Class R
| | (455,637) | | (417,971) |
Class R4
| | (2,447) | | (85,773) |
Class R6
| | (42,121,261) | | 29,201,378 |
Administrator Class
| | (10,082,395) | | (6,247,883) |
Institutional Class
| | (9,083,723) | | (6,697,849) |
Total distributions to shareholders
| | (142,741,183) | | (91,831,467) |
| Capital share transactions | Shares | | Shares | |
| Proceeds from shares sold | | | | |
Class A
| 224,064 | 11,421,162 | 380,850 | 16,129,700 |
Class C
| 8,779 | 385,789 | 51,726 | 1,741,347 |
Class R
| 7,874 | 366,163 | 32,914 | 1,386,119 |
Class R4
| 0 | 0 | 10,868 | 467,147 |
Class R6
| 539,917 | 28,597,175 | 1,409,952 | 60,242,135 |
Administrator Class
| 54,337 | 2,802,980 | 222,967 | 9,665,543 |
Institutional Class
| 79,261 | 4,217,464 | 196,605 | 8,571,145 |
| | | 47,790,733 | | 98,203,136 |
| Reinvestment of distributions | | | | |
Class A
| 1,646,859 | 77,616,455 | 1,127,986 | 46,360,245 |
Class C
| 27,637 | 1,109,089 | 25,717 | 927,347 |
Class R
| 7,808 | 352,223 | 4,263 | 169,064 |
Class R4
| 0 | 0 | 1,974 | 84,285 |
Class R6
| 795,939 | 39,597,989 | 647,777 | 27,895,354 |
Administrator Class
| 209,572 | 10,074,123 | 149,395 | 6,242,050 |
Institutional Class
| 175,339 | 8,665,260 | 140,193 | 6,001,246 |
| | | 137,415,139 | | 87,679,591 |
| Payment for shares redeemed | | | | |
Class A
| (688,311) | (34,957,128) | (1,628,537) | (68,860,332) |
Class C
| (87,100) | (3,977,750) | (140,447) | (5,259,663) |
Class R
| (26,931) | (1,248,673) | (72,655) | (2,962,212) |
Class R4
| 0 | 0 | (32,078) | (1,411,121) |
Class R6
| (901,267) | (47,730,441) | (2,851,205) | (123,114,591) |
Administrator Class
| (231,568) | (11,990,989) | (296,951) | (12,894,932) |
Institutional Class
| (216,223) | (11,454,268) | (679,804) | (30,194,632) |
| | | (111,359,249) | | (244,697,483) |
Net increase (decrease) in net assets resulting from capital share transactions
| | 73,846,623 | | (58,814,756) |
Total increase in net assets
| | 35,094,106 | | 60,276,803 |
| Net assets | | | | |
Beginning of period
| | 1,080,627,532 | | 1,020,350,729 |
End of period
| | $1,115,721,638 | | $1,080,627,532 |
The accompanying notes are an integral part of these financial statements.
Wells Fargo Large Cap Growth Fund | 13
Financial highlights
(For a share outstanding throughout each period)
| | | Year ended July 31 |
| Class A | Six months ended
January 31, 2021
(unaudited) | 2020 | 2019 | 2018 | 2017 | 2016 |
Net asset value, beginning of period
| $49.63 | $44.23 | $52.01 | $50.10 | $46.05 | $49.55 |
Net investment loss
| (0.13) 1 | (0.11) | (0.03) 1 | (0.08) | (0.03) 1 | (0.03) 1 |
Net realized and unrealized gains (losses) on investments
| 4.90 | 9.66 | 3.47 | 12.56 | 6.39 | (0.92) |
Total from investment operations
| 4.77 | 9.55 | 3.44 | 12.48 | 6.36 | (0.95) |
| Distributions to shareholders from | | | | | | |
Net investment income
| 0.00 | 0.00 | 0.00 | 0.00 | 0.00 | (0.00) 2 |
Net realized gains
| (6.93) | (4.15) | (11.22) | (10.57) | (2.31) | (2.55) |
Total distributions to shareholders
| (6.93) | (4.15) | (11.22) | (10.57) | (2.31) | (2.55) |
Net asset value, end of period
| $47.47 | $49.63 | $44.23 | $52.01 | $50.10 | $46.05 |
Total return3
| 9.73% | 23.51% | 11.00% | 27.98% | 14.60% | (1.83)% |
| Ratios to average net assets (annualized) | | | | | | |
Gross expenses
| 1.17% | 1.18% | 1.18% | 1.17% | 1.17% | 1.16% |
Net expenses
| 1.04% | 1.05% | 1.07% | 1.07% | 1.07% | 1.07% |
Net investment loss
| (0.50)% | (0.24)% | (0.07)% | (0.16)% | (0.06)% | (0.06)% |
| Supplemental data | | | | | | |
Portfolio turnover rate
| 19% | 34% | 43% | 34% | 40% | 31% |
Net assets, end of period (000s omitted)
| $618,359 | $587,771 | $529,110 | $534,694 | $516,410 | $576,502 |
| 1 | Calculated based upon average shares outstanding |
| 2 | Amount is less than $0.005. |
| 3 | Total return calculations do not include any sales charges. Returns for periods of less than one year are not annualized. |
The accompanying notes are an integral part of these financial statements.
14 | Wells Fargo Large Cap Growth Fund
Financial highlights
(For a share outstanding throughout each period)
| | | Year ended July 31 |
| Class C | Six months ended
January 31, 2021
(unaudited) | 2020 | 2019 | 2018 | 2017 | 2016 |
Net asset value, beginning of period
| $43.32 | $39.41 | $47.97 | $47.25 | $43.88 | $47.68 |
Net investment loss
| (0.28) 1 | (0.38) 1 | (0.32) 1 | (0.31) | (0.35) 1 | (0.32) 1 |
Net realized and unrealized gains (losses) on investments
| 4.27 | 8.44 | 2.98 | 11.60 | 6.03 | (0.93) |
Total from investment operations
| 3.99 | 8.06 | 2.66 | 11.29 | 5.68 | (1.25) |
| Distributions to shareholders from | | | | | | |
Net realized gains
| (6.93) | (4.15) | (11.22) | (10.57) | (2.31) | (2.55) |
Net asset value, end of period
| $40.38 | $43.32 | $39.41 | $47.97 | $47.25 | $43.88 |
Total return2
| 9.31% | 22.57% | 10.17% | 27.03% | 13.74% | (2.56)% |
| Ratios to average net assets (annualized) | | | | | | |
Gross expenses
| 1.92% | 1.93% | 1.93% | 1.92% | 1.91% | 1.91% |
Net expenses
| 1.82% | 1.82% | 1.82% | 1.82% | 1.82% | 1.82% |
Net investment loss
| (1.28)% | (1.00)% | (0.80)% | (0.90)% | (0.81)% | (0.75)% |
| Supplemental data | | | | | | |
Portfolio turnover rate
| 19% | 34% | 43% | 34% | 40% | 31% |
Net assets, end of period (000s omitted)
| $7,197 | $9,918 | $11,504 | $15,586 | $14,640 | $18,877 |
| 1 | Calculated based upon average shares outstanding |
| 2 | Total return calculations do not include any sales charges. Returns for periods of less than one year are not annualized. |
The accompanying notes are an integral part of these financial statements.
Wells Fargo Large Cap Growth Fund | 15
Financial highlights
(For a share outstanding throughout each period)
| | | Year ended July 31 |
| Class R | Six months ended
January 31, 2021
(unaudited) | 2020 | 2019 | 2018 | 2017 | 2016 |
Net asset value, beginning of period
| $47.81 | $42.86 | $50.89 | $49.34 | $45.50 | $49.11 |
Net investment loss
| (0.18) 1 | (0.20) 1 | (0.13) 1 | (0.20) 1 | (0.14) 1 | (0.10) 1 |
Net realized and unrealized gains (losses) on investments
| 4.71 | 9.30 | 3.32 | 12.32 | 6.29 | (0.96) |
Total from investment operations
| 4.53 | 9.10 | 3.19 | 12.12 | 6.15 | (1.06) |
| Distributions to shareholders from | | | | | | |
Net realized gains
| (6.93) | (4.15) | (11.22) | (10.57) | (2.31) | (2.55) |
Net asset value, end of period
| $45.41 | $47.81 | $42.86 | $50.89 | $49.34 | $45.50 |
Total return2
| 9.59% | 23.16% | 10.74% | 27.65% | 14.30% | (2.08)% |
| Ratios to average net assets (annualized) | | | | | | |
Gross expenses
| 1.35% | 1.41% | 1.42% | 1.42% | 1.41% | 1.41% |
Net expenses
| 1.29% | 1.32% | 1.32% | 1.32% | 1.32% | 1.32% |
Net investment loss
| (0.75)% | (0.49)% | (0.29)% | (0.40)% | (0.31)% | (0.23)% |
| Supplemental data | | | | | | |
Portfolio turnover rate
| 19% | 34% | 43% | 34% | 40% | 31% |
Net assets, end of period (000s omitted)
| $2,645 | $3,322 | $4,499 | $5,661 | $6,387 | $8,218 |
| 1 | Calculated based upon average shares outstanding |
| 2 | Returns for periods of less than one year are not annualized. |
The accompanying notes are an integral part of these financial statements.
16 | Wells Fargo Large Cap Growth Fund
Financial highlights
(For a share outstanding throughout each period)
| | | Year ended July 31 |
| Class R4 | Six months ended
January 31, 2021
(unaudited) | 2020 | 2019 | 2018 | 2017 | 2016 |
Net asset value, beginning of period
| $51.43 | $45.72 | $53.23 | $50.94 | $46.69 | $50.23 |
Net investment income (loss)
| (0.07) | 0.02 1 | 0.11 1 | 0.05 1 | 0.11 1 | 0.13 |
Net realized and unrealized gains (losses) on investments
| 5.09 | 9.91 | 3.60 | 12.81 | 6.50 | (0.95) |
Total from investment operations
| 5.02 | 9.93 | 3.71 | 12.86 | 6.61 | (0.82) |
| Distributions to shareholders from | | | | | | |
Net investment income
| 0.00 | (0.07) | 0.00 | 0.00 | (0.05) | (0.17) |
Net realized gains
| (6.93) | (4.15) | (11.22) | (10.57) | (2.31) | (2.55) |
Total distributions to shareholders
| (6.93) | (4.22) | (11.22) | (10.57) | (2.36) | (2.72) |
Net asset value, end of period
| $49.52 | $51.43 | $45.72 | $53.23 | $50.94 | $46.69 |
Total return2
| 9.86% | 23.59% | 11.32% | 28.31% | 14.96% | (1.54)% |
| Ratios to average net assets (annualized) | | | | | | |
Gross expenses
| 0.86% | 0.90% | 0.90% | 0.90% | 0.88% | 0.88% |
Net expenses
| 0.80% | 0.80% | 0.80% | 0.80% | 0.80% | 0.78% |
Net investment income (loss)
| (0.25)% | 0.05% | 0.24% | 0.10% | 0.25% | 0.27% |
| Supplemental data | | | | | | |
Portfolio turnover rate
| 19% | 34% | 43% | 34% | 40% | 31% |
Net assets, end of period (000s omitted)
| $17 | $18 | $896 | $2,089 | $337 | $8,400 |
| 1 | Calculated based upon average shares outstanding |
| 2 | Returns for periods of less than one year are not annualized. |
The accompanying notes are an integral part of these financial statements.
Wells Fargo Large Cap Growth Fund | 17
Financial highlights
(For a share outstanding throughout each period)
| | | Year ended July 31 |
| Class R6 | Six months ended
January 31, 2021
(unaudited) | 2020 | 2019 | 2018 | 2017 | 2016 |
Net asset value, beginning of period
| $51.95 | $46.06 | $53.49 | $51.12 | $46.82 | $50.34 |
Net investment income (loss)
| (0.03) 1 | 0.08 1 | 0.16 1 | 0.14 | 0.17 | 0.22 |
Net realized and unrealized gains (losses) on investments
| 5.14 | 10.09 | 3.65 | 12.85 | 6.52 | (0.97) |
Total from investment operations
| 5.11 | 10.17 | 3.81 | 12.99 | 6.69 | (0.75) |
| Distributions to shareholders from | | | | | | |
Net investment income
| 0.00 | (0.13) | (0.02) | (0.05) | (0.08) | (0.22) |
Net realized gains
| (6.93) | (4.15) | (11.22) | (10.57) | (2.31) | (2.55) |
Total distributions to shareholders
| (6.93) | (4.28) | (11.24) | (10.62) | (2.39) | (2.77) |
Net asset value, end of period
| $50.13 | $51.95 | $46.06 | $53.49 | $51.12 | $46.82 |
Total return2
| 9.94% | 24.03% | 11.46% | 28.51% | 15.09% | (1.39)% |
| Ratios to average net assets (annualized) | | | | | | |
Gross expenses
| 0.74% | 0.75% | 0.75% | 0.75% | 0.74% | 0.73% |
Net expenses
| 0.65% | 0.65% | 0.65% | 0.65% | 0.65% | 0.64% |
Net investment income (loss)
| (0.11)% | 0.17% | 0.35% | 0.27% | 0.36% | 0.39% |
| Supplemental data | | | | | | |
Portfolio turnover rate
| 19% | 34% | 43% | 34% | 40% | 31% |
Net assets, end of period (000s omitted)
| $337,877 | $327,584 | $326,990 | $327,943 | $307,048 | $225,805 |
| 1 | Calculated based upon average shares outstanding |
| 2 | Returns for periods of less than one year are not annualized. |
The accompanying notes are an integral part of these financial statements.
18 | Wells Fargo Large Cap Growth Fund
Financial highlights
(For a share outstanding throughout each period)
| | | Year ended July 31 |
| Administrator Class | Six months ended
January 31, 2021
(unaudited) | 2020 | 2019 | 2018 | 2017 | 2016 |
Net asset value, beginning of period
| $50.47 | $44.87 | $52.54 | $50.46 | $46.32 | $49.84 |
Net investment income (loss)
| (0.10) | (0.07) | 0.02 | (0.01) | 0.05 | 0.05 |
Net realized and unrealized gains (losses) on investments
| 4.98 | 9.83 | 3.53 | 12.66 | 6.41 | (0.94) |
Total from investment operations
| 4.88 | 9.76 | 3.55 | 12.65 | 6.46 | (0.89) |
| Distributions to shareholders from | | | | | | |
Net investment income
| 0.00 | (0.01) | 0.00 | 0.00 | (0.01) | (0.08) |
Net realized gains
| (6.93) | (4.15) | (11.22) | (10.57) | (2.31) | (2.55) |
Total distributions to shareholders
| (6.93) | (4.16) | (11.22) | (10.57) | (2.32) | (2.63) |
Net asset value, end of period
| $48.42 | $50.47 | $44.87 | $52.54 | $50.46 | $46.32 |
Total return1
| 9.79% | 23.63% | 11.14% | 28.14% | 14.75% | (1.71)% |
| Ratios to average net assets (annualized) | | | | | | |
Gross expenses
| 1.09% | 1.10% | 1.10% | 1.09% | 1.08% | 1.08% |
Net expenses
| 0.95% | 0.95% | 0.95% | 0.95% | 0.95% | 0.95% |
Net investment income (loss)
| (0.41)% | (0.14)% | 0.05% | (0.03)% | 0.06% | 0.12% |
| Supplemental data | | | | | | |
Portfolio turnover rate
| 19% | 34% | 43% | 34% | 40% | 31% |
Net assets, end of period (000s omitted)
| $77,677 | $79,334 | $67,158 | $79,154 | $80,937 | $237,577 |
| 1 | Returns for periods of less than one year are not annualized. |
The accompanying notes are an integral part of these financial statements.
Wells Fargo Large Cap Growth Fund | 19
Financial highlights
(For a share outstanding throughout each period)
| | | Year ended July 31 |
| Institutional Class | Six months ended
January 31, 2021
(unaudited) | 2020 | 2019 | 2018 | 2017 | 2016 |
Net asset value, beginning of period
| $51.67 | $45.84 | $53.31 | $51.00 | $46.74 | $50.30 |
Net investment income (loss)
| (0.06) 1 | 0.03 1 | 0.12 1 | 0.10 1 | 0.12 1 | 0.17 1 |
Net realized and unrealized gains (losses) on investments
| 5.11 | 10.04 | 3.63 | 12.80 | 6.51 | (0.96) |
Total from investment operations
| 5.05 | 10.07 | 3.75 | 12.90 | 6.63 | (0.79) |
| Distributions to shareholders from | | | | | | |
Net investment income
| 0.00 | (0.09) | 0.00 | (0.02) | (0.06) | (0.22) |
Net realized gains
| (6.93) | (4.15) | (11.22) | (10.57) | (2.31) | (2.55) |
Total distributions to shareholders
| (6.93) | (4.24) | (11.22) | (10.59) | (2.37) | (2.77) |
Net asset value, end of period
| $49.79 | $51.67 | $45.84 | $53.31 | $51.00 | $46.74 |
Total return2
| 9.87% | 23.89% | 11.37% | 28.37% | 14.98% | (1.49)% |
| Ratios to average net assets (annualized) | | | | | | |
Gross expenses
| 0.84% | 0.85% | 0.85% | 0.84% | 0.83% | 0.83% |
Net expenses
| 0.75% | 0.75% | 0.75% | 0.75% | 0.75% | 0.71% |
Net investment income (loss)
| (0.21)% | 0.07% | 0.26% | 0.18% | 0.27% | 0.37% |
| Supplemental data | | | | | | |
Portfolio turnover rate
| 19% | 34% | 43% | 34% | 40% | 31% |
Net assets, end of period (000s omitted)
| $71,949 | $72,681 | $80,194 | $95,809 | $169,836 | $316,310 |
| 1 | Calculated based upon average shares outstanding |
| 2 | Returns for periods of less than one year are not annualized. |
The accompanying notes are an integral part of these financial statements.
20 | Wells Fargo Large Cap Growth Fund
Notes to financial statements (unaudited)
1. ORGANIZATION
Wells Fargo Funds Trust (the “Trust”), a Delaware statutory trust organized on March 10, 1999, is an open-end management investment company registered under the Investment Company Act of 1940, as amended (the “1940 Act”). As an investment company, the Trust follows the accounting and reporting guidance in Financial Accounting Standards Board (“FASB”) Accounting Standards Codification Topic 946, Financial Services – Investment Companies. These financial statements report on the Wells Fargo Large Cap Growth Fund (the “Fund”) which is a diversified series of the Trust.
2. SIGNIFICANT ACCOUNTING POLICIES
The following significant accounting policies, which are consistently followed in the preparation of the financial statements of the Fund, are in conformity with U.S. generally accepted accounting principles which require management to make estimates and assumptions that affect the reported amounts of assets and liabilities, disclosure of contingent assets and liabilities at the date of the financial statements, and the reported amounts of income and expenses during the reporting period. Actual results could differ from those estimates.
Securities valuation
All investments are valued each business day as of the close of regular trading on the New York Stock Exchange (generally 4 p.m. Eastern Time), although the Fund may deviate from this calculation time under unusual or unexpected circumstances.
Equity securities that are listed on a foreign or domestic exchange or market are valued at the official closing price or, if none, the last sales price. If no sale occurs on the principal exchange or market that day, a fair value price will be determined in accordance with the Fund’s Valuation Procedures.
Investments in registered open-end investment companies are valued at net asset value. Interests in non-registered investment companies that are redeemable at net asset value are fair valued normally at net asset value.
Investments which are not valued using any of the methods discussed above are valued at their fair value, as determined in good faith by the Board of Trustees. The Board of Trustees has established a Valuation Committee comprised of the Trustees and has delegated to it the authority to take any actions regarding the valuation of portfolio securities that the Valuation Committee deems necessary or appropriate, including determining the fair value of portfolio securities, unless the determination has been delegated to the Wells Fargo Asset Management Pricing Committee at Wells Fargo Funds Management, LLC (“Funds Management”). The Board of Trustees retains the authority to make or ratify any valuation decisions or approve any changes to the Valuation Procedures as it deems appropriate. On a quarterly basis, the Board of Trustees receives reports on any valuation actions taken by the Valuation Committee or the Wells Fargo Asset Management Pricing Committee which may include items for ratification.
Foreign currency translation
The accounting records of the Fund are maintained in U.S. dollars. The values of other assets and liabilities denominated in foreign currencies are translated into U.S. dollars at rates provided by an independent foreign currency pricing source at a time each business day specified by the Wells Fargo Asset Management Pricing Committee. Purchases and sales of securities, and income and expenses are converted at the rate of exchange on the respective dates of such transactions. Net realized foreign exchange gains or losses arise from sales of foreign currencies, currency gains or losses realized between the trade and settlement dates on securities transactions, and the difference between the amounts of dividends, interest and foreign withholding taxes recorded and the U.S. dollar equivalent of the amounts actually paid or received. Net unrealized foreign exchange gains and losses arise from changes in the fair value of assets and liabilities other than investments in securities resulting from changes in exchange rates. The changes in net assets arising from changes in exchange rates of securities and the changes in net assets resulting from changes in market prices of securities are not separately presented. Such changes are included in net realized and unrealized gains or losses from investments.
Securities lending
The Fund may lend its securities from time to time in order to earn additional income in the form of fees or interest on securities received as collateral or the investment of any cash received as collateral. When securities are on loan, the Fund receives interest or dividends on those securities. Cash collateral received in connection with its securities lending transactions is invested in Securities Lending Cash Investments, LLC (the “Securities Lending Fund”). Investments in Securities Lending Fund are valued at the evaluated bid price provided by an independent pricing service. Income earned from investment in the Securities Lending Fund (net of fees and rebates), if any, is included in income from affiliated securities on the Statement of Operations.
Wells Fargo Large Cap Growth Fund | 21
Notes to financial statements (unaudited)
In a securities lending transaction, the net asset value of the Fund is affected by an increase or decrease in the value of the securities loaned and by an increase or decrease in the value of the instrument in which collateral is invested. The amount of securities lending activity undertaken by the Fund fluctuates from time to time. The Fund has the right under the lending agreement to recover the securities from the borrower on demand. In the event of default or bankruptcy by the borrower, the Fund may be prevented from recovering the loaned securities or gaining access to the collateral or may experience delays or costs in doing so. In such an event, the terms of the agreement allow the unaffiliated securities lending agent to use the collateral to purchase replacement securities on behalf of the Fund or pay the Fund the market value of the loaned securities. The Fund bears the risk of loss with respect to depreciation of its investment of the cash collateral.
Security transactions and income recognition
Securities transactions are recorded on a trade date basis. Realized gains or losses are recorded on the basis of identified cost.
Dividend income is recognized on the ex-dividend date. Dividend income is recorded net of foreign taxes withheld where recovery of such taxes is not assured.
Distributions to shareholders
Distributions to shareholders from net investment income and any net realized gains are recorded on the ex-dividend date and paid at least annually. Such distributions are determined in accordance with income tax regulations and may differ from U.S. generally accepted accounting principles. Dividend sources are estimated at the time of declaration. The tax character of distributions is determined as of the Fund’s fiscal year end. Therefore, a portion of the Fund’s distributions made prior to the Fund’s fiscal year end may be categorized as a tax return of capital at year end.
Federal and other taxes
The Fund intends to continue to qualify as a regulated investment company by distributing substantially all of its investment company taxable income and any net realized capital gains (after reduction for capital loss carryforwards) sufficient to relieve it from all, or substantially all, federal income taxes. Accordingly, no provision for federal income taxes was required.
The Fund’s income and federal excise tax returns and all financial records supporting those returns for the prior three fiscal years are subject to examination by the federal and Delaware revenue authorities. Management has analyzed the Fund’s tax positions taken on federal, state, and foreign tax returns for all open tax years and does not believe that there are any uncertain tax positions that require recognition of a tax liability.
As of January 31, 2021, the aggregate cost of all investments for federal income tax purposes was $476,480,591 and the unrealized gains (losses) consisted of:
| Gross unrealized gains | $636,920,559 |
| Gross unrealized losses | (2,373,474) |
| Net unrealized gains | $634,547,085 |
Class allocations
The separate classes of shares offered by the Fund differ principally in applicable sales charges, distribution, shareholder servicing, and administration fees. Class specific expenses are charged directly to that share class. Investment income, common fund-level expenses, and realized and unrealized gains (losses) on investments are allocated daily to each class of shares based on the relative proportion of net assets of each class.
22 | Wells Fargo Large Cap Growth Fund
Notes to financial statements (unaudited)
3. FAIR VALUATION MEASUREMENTS
Fair value measurements of investments are determined within a framework that has established a fair value hierarchy based upon the various data inputs utilized in determining the value of the Fund’s investments. The three-level hierarchy gives the highest priority to unadjusted quoted prices in active markets for identical assets or liabilities (Level 1) and the lowest priority to unobservable inputs (Level 3). The Fund’s investments are classified within the fair value hierarchy based on the lowest level of input that is significant to the fair value measurement. The inputs are summarized into three broad levels as follows:
| ■ | Level 1 – quoted prices in active markets for identical securities |
| ■ | Level 2 – other significant observable inputs (including quoted prices for similar securities, interest rates, prepayment speeds, credit risk, etc.) |
| ■ | Level 3 – significant unobservable inputs (including the Fund’s own assumptions in determining the fair value of investments) |
The inputs or methodologies used for valuing investments in securities are not necessarily an indication of the risk associated with investing in those securities.
The following is a summary of the inputs used in valuing the Fund’s assets and liabilities as of January 31, 2021:
| | Quoted prices
(Level 1) | Other significant
observable inputs
(Level 2) | Significant
unobservable inputs
(Level 3) | Total |
| Assets | | | | |
| Investments in: | | | | |
| Common stocks | | | | |
| Communication services | $ 119,231,221 | $0 | $0 | $ 119,231,221 |
| Consumer discretionary | 171,473,110 | 0 | 0 | 171,473,110 |
| Consumer staples | 10,712,244 | 0 | 0 | 10,712,244 |
| Financials | 51,242,951 | 0 | 0 | 51,242,951 |
| Health care | 107,812,735 | 0 | 0 | 107,812,735 |
| Industrials | 102,086,834 | 0 | 0 | 102,086,834 |
| Information technology | 497,265,658 | 0 | 0 | 497,265,658 |
| Materials | 50,743,040 | 0 | 0 | 50,743,040 |
| Short-term investments | | | | |
| Investment companies | 459,883 | 0 | 0 | 459,883 |
| Total assets | $1,111,027,676 | $0 | $0 | $1,111,027,676 |
Additional sector, industry or geographic detail, if any, is included in the Portfolio of Investments.
For the six months ended January 31, 2021, the Fund did not have any transfers into/out of Level 3.
4. TRANSACTIONS WITH AFFILIATES
Management fee
Funds Management, an indirect wholly owned subsidiary of Wells Fargo & Company (“Wells Fargo”), is the manager of the Fund and provides advisory and fund-level administrative services under an investment management agreement. Under the investment management agreement, Funds Management is responsible for, among other services, implementing the investment objectives and strategies of the Fund, supervising the subadviser and providing fund-level administrative services in connection with the Fund’s operations. As compensation for its services under the investment management agreement, Funds Management is entitled to receive a management fee at the following annual rate based on the Fund’s average daily net assets:
Wells Fargo Large Cap Growth Fund | 23
Notes to financial statements (unaudited)
| Average daily net assets | Management fee |
| First $500 million | 0.700% |
| Next $500 million | 0.675 |
| Next $1 billion | 0.650 |
| Next $2 billion | 0.625 |
| Next $1 billion | 0.600 |
| Next $3 billion | 0.590 |
| Next $2 billion | 0.565 |
| Next $2 billion | 0.555 |
| Next $4 billion | 0.530 |
| Over $16 billion | 0.505 |
For the six months ended January 31, 2021, the management fee was equivalent to an annual rate of 0.68% of the Fund’s average daily net assets.
Funds Management has retained the services of a subadviser to provide daily portfolio management to the Fund. The fee for subadvisory services is borne by Funds Management. Wells Capital Management Incorporated ("WellsCap"), an affiliate of Funds Management and an indirect wholly owned subsidiary of Wells Fargo, is the subadviser to the Fund and is entitled to receive a fee from Funds Management at an annual rate starting at 0.30% and declining to 0.20% as the average daily net assets of the Fund increase.
Administration fees
Under a class-level administration agreement, Funds Management provides class-level administrative services to the Fund, which includes paying fees and expenses for services provided by the transfer agent, sub-transfer agents, omnibus account servicers and record-keepers. As compensation for its services under the class-level administration agreement, Funds Management receives an annual fee which is calculated based on the average daily net assets of each class as follows:
| | Class-level
administration fee |
| Class A | 0.21% |
| Class C | 0.21 |
| Class R | 0.21 |
| Class R4 | 0.08 |
| Class R6 | 0.03 |
| Administrator Class | 0.13 |
| Institutional Class | 0.13 |
Waivers and/or expense reimbursements
Funds Management has contractually waived and/or reimbursed management and administration fees to the extent necessary to maintain certain net operating expense ratios for the Fund. When each class of the Fund has exceeded its expense cap, Funds Management has waived fees and/or reimbursed expenses from fund-level expenses on a proportionate basis and then from class specific expenses. When only certain classes exceed their expense caps, waivers and/or reimbursements are applied against class specific expenses before fund-level expenses. Funds Management has committed through November 30, 2021 to waive fees and/or reimburse expenses to the extent necessary to cap expenses. Prior to or after the commitment expiration date, the cap may be increased or the commitment to maintain the cap may be terminated only with the approval of the Board of Trustees. The expense caps are as follows:
24 | Wells Fargo Large Cap Growth Fund
Notes to financial statements (unaudited)
| | Expense ratio caps |
| Class A | 1.07% |
| Class C | 1.82 |
| Class R | 1.32 |
| Class R4 | 0.80 |
| Class R6 | 0.65 |
| Administrator Class | 0.95 |
| Institutional Class | 0.75 |
Distribution fees
The Trust has adopted a distribution plan for Class C and Class R shares of the Fund pursuant to Rule 12b-1 under the 1940 Act. Distribution fees are charged to Class C and Class R shares and paid to Wells Fargo Funds Distributor, LLC (“Funds Distributor”), the principal underwriter, at an annual rate of 0.75% of the average daily net assets of Class C shares and 0.21% of the average daily net assets of Class R shares.
In addition, Funds Distributor is entitled to receive the front-end sales charge from the purchase of Class A shares and a contingent deferred sales charge on the redemption of certain Class A shares. Funds Distributor is also entitled to receive the contingent deferred sales charges from redemptions of Class C shares. For the six months ended January 31, 2021, Funds Distributor received $1,353 from the sale of Class A shares. No contingent deferred sales charges were incurred by Class A and Class C shares for the six months ended January 31, 2021.
Shareholder servicing fees
The Trust has entered into contracts with one or more shareholder servicing agents, whereby Class A, Class C, Class R, and Administrator Class of the Fund are charged a fee at an annual rate of 0.25% of the average daily net assets of each respective class. Class R4 is charged a fee at an annual rate of 0.10% of its average daily net assets. A portion of these total shareholder servicing fees were paid to affiliates of Wells Fargo.
Interfund transactions
The Fund may purchase or sell portfolio investment securities to certain other Wells Fargo affiliates pursuant to Rule 17a-7 under the 1940 Act and under procedures adopted by the Board of Trustees. The procedures have been designed to ensure that these interfund transactions, which do not incur broker commissions, are effected at current market prices.
5. INVESTMENT PORTFOLIO TRANSACTIONS
Purchases and sales of investments, excluding U.S. government obligations (if any) and short-term securities, for the six months ended January 31, 2021 were $213,734,105 and $291,230,840, respectively.
6. SECURITIES LENDING TRANSACTIONS
The Fund lends its securities through an unaffiliated securities lending agent and receives collateral in the form of cash or securities with a value at least equal to the value of the securities on loan. The value of the loaned securities is determined at the close of each business day and any increases or decreases in the required collateral are exchanged between the Fund and the counterparty on the next business day. Cash collateral received is invested in the Securities Lending Fund which seeks to provide a positive return compared to the daily Federal Funds Open Rate by investing in high-quality, U.S. dollar-denominated short-term money market instruments and is exempt from registration under Section 3(c)(7) of the 1940 Act. Securities Lending Fund is managed by Funds Management and is subadvised by WellsCap. Funds Management receives an advisory fee starting at 0.05% and declining to 0.01% as the average daily net assets of the Securities Lending Fund increase. All of the fees received by Funds Management are paid to WellsCap for its services as subadviser.
In the event of counterparty default or the failure of a borrower to return a loaned security, the Fund has the right to use the collateral to offset any losses incurred. As of January 31, 2021, the Fund did not have any securities on loan.
7. BANK BORROWINGS
The Trust (excluding the money market funds), Wells Fargo Master Trust and Wells Fargo Variable Trust are parties to a $350,000,000 revolving credit agreement whereby the Fund is permitted to use bank borrowings for temporary or emergency purposes, such as to fund shareholder redemption requests. Interest under the credit agreement is charged to the Fund based
Wells Fargo Large Cap Growth Fund | 25
Notes to financial statements (unaudited)
on a borrowing rate equal to the higher of the Federal Funds rate in effect on that day plus 1.25% or the overnight LIBOR rate in effect on that day plus 1.25%. In addition, an annual commitment fee equal to 0.25% of the unused balance is allocated to each participating fund.
For the six months ended January 31, 2021, there were no borrowings by the Fund under the agreement.
8. CONCENTRATION RISKS
Concentration risks result from exposure to a limited number of sectors. As of the end of the period, the Fund concentrated its portfolio in investments related to the information technology sector. A fund that invests a substantial portion of its assets in any sector may be more affected by changes in that sector than would be a fund whose investments are not heavily weighted in any sector.
9. INDEMNIFICATION
Under the Fund's organizational documents, the officers and Trustees have been granted certain indemnification rights against certain liabilities that may arise out of performance of their duties to the Fund. The Fund has entered into a separate agreement with each Trustee that converts indemnification rights currently existing under the Fund’s organizational documents into contractual rights that cannot be changed in the future without the consent of the Trustee. Additionally, in the normal course of business, the Fund may enter into contracts with service providers that contain a variety of indemnification clauses. The Fund’s maximum exposure under these arrangements is dependent on future claims that may be made against the Fund and, therefore, cannot be estimated.
10. NEW ACCOUNTING PRONOUNCEMENT
In August 2018, FASB issued Accounting Standards Update (“ASU”) No. 2018-13, Fair Value Measurement (Topic 820) Disclosure Framework - Changes to the Disclosure Requirements for Fair Value Measurement. ASU 2018-13 updates the disclosure requirements on fair value measurements in Topic 820, Fair Value Measurements. The amendments are effective for fiscal years, and interim periods within those fiscal years, beginning after December 15, 2019. Management has adopted this guidance which did not have a material impact on the financial statements.
11. CORONAVIRUS (COVID-19) PANDEMIC
On March 11, 2020, the World Health Organization announced that it had made the assessment that coronavirus disease 2019 (“COVID-19”) is a pandemic. The impacts of COVID-19 are affecting the entire global economy, individual companies and investment products, the funds, and the market in general. There is significant uncertainty around the extent and duration of business disruptions related to COVID-19 and the impacts may be short term or may last for an extended period of time. The risk of further spreading of COVID-19 has led to significant uncertainty and volatility in the financial markets.
12. SUBSEQUENT EVENT
On February 23, 2021, Wells Fargo announced that it has entered into a definitive agreement to sell Wells Fargo Asset Management (“WFAM”) to GTCR LLC and Reverence Capital Partners, L.P. WFAM is the trade name used by the asset management businesses of Wells Fargo and includes Wells Fargo Funds Management, LLC, the investment manager to the Fund, Wells Capital Management Incorporated and Wells Fargo Asset Management (International) Limited, both registered investment advisers providing sub-advisory services to certain funds, and Wells Fargo Funds Distributor, LLC, the Fund’s principal underwriter. As part of the transaction, Wells Fargo will own a 9.9% equity interest and will continue to serve as an important client and distribution partner.
Consummation of the transaction will result in the automatic termination of the Fund’s investment management agreement and sub-advisory agreement. The Fund’s Board of Trustees will be asked to approve new investment management arrangements with the new company. If approved by the Board, the new investment management arrangements with the new company will be presented to the shareholders of the Fund for approval, and, if approved by shareholders, would take effect upon the closing of the transaction. The transaction is expected to close in the second half of 2021, subject to customary closing conditions.
26 | Wells Fargo Large Cap Growth Fund
Other information (unaudited)
PROXY VOTING INFORMATION
A description of the policies and procedures used to determine how to vote proxies relating to portfolio securities is available without charge, upon request, by calling 1-800-222-8222, visiting our website at wfam.com, or visiting the SEC website at sec.gov. Information regarding how the proxies related to portfolio securities were voted during the most recent 12-month period ended June 30 is available on the website at wfam.com or by visiting the SEC website at sec.gov.
QUARTERLY PORTFOLIO HOLDINGS INFORMATION
The Fund files its complete schedule of portfolio holdings with the SEC for the first and third quarters of each fiscal year as an exhibit to its reports on Form N-PORT. Shareholders may view the filed Form N-PORT by visiting the SEC website at sec.gov.
Wells Fargo Large Cap Growth Fund | 27
Other information (unaudited)
BOARD OF TRUSTEES AND OFFICERS
Each of the Trustees and Officers listed in the table below acts in identical capacities for each fund in the Wells Fargo family of funds, which consists of 144 mutual funds comprising the Wells Fargo Funds Trust, Wells Fargo Variable Trust, Wells Fargo Master Trust and four closed-end funds (collectively the “Fund Complex”). This table should be read in conjunction with the Prospectus and the Statement of Additional Information1. The mailing address of each Trustee and Officer is 525 Market Street, 12th Floor, San Francisco, CA 94105. Each Trustee and Officer serves an indefinite term, however, each Trustee serves such term until reaching the mandatory retirement age established by the Trustees.
Independent Trustees
Name and
year of birth | Position held and
length of service* | Principal occupations during past five years or longer | Current other
public company or
investment
company
directorships |
William R. Ebsworth
(Born 1957) | Trustee,
since 2015 | Retired. From 1984 to 2013, equities analyst, portfolio manager, research director and chief investment officer at Fidelity Management and Research Company in Boston, Tokyo, and Hong Kong, and retired in 2013 as Chief Investment Officer of Fidelity Strategic Advisers, Inc. where he led a team of investment professionals managing client assets. Prior thereto, Board member of Hong Kong Securities Clearing Co., Hong Kong Options Clearing Corp., the Thailand International Fund, Ltd., Fidelity Investments Life Insurance Company, and Empire Fidelity Investments Life Insurance Company. Audit Committee Chair and Investment Committee Chair of the Vincent Memorial Hospital Endowment (non-profit organization). Mr. Ebsworth is a CFA® charterholder. | N/A |
Jane A. Freeman
(Born 1953) | Trustee,
since 2015;
Chair Liaison,
since 2018 | Retired. From 2012 to 2014 and 1999 to 2008, Chief Financial Officer of Scientific Learning Corporation. From 2008 to 2012, Ms. Freeman provided consulting services related to strategic business projects. Prior to 1999, Portfolio Manager at Rockefeller & Co. and Scudder, Stevens & Clark. Board member of the Harding Loevner Funds from 1996 to 2014, serving as both Lead Independent Director and chair of the Audit Committee. Board member of the Russell Exchange Traded Funds Trust from 2011 to 2012 and the chair of the Audit Committee. Ms. Freeman is also an inactive Chartered Financial Analyst. | N/A |
Isaiah Harris, Jr.
(Born 1952) | Trustee,
since 2009; Audit
Committee
Chair,
since 2019 | Retired. Chairman of the Board of CIGNA Corporation since 2009, and Director since 2005. From 2003 to 2011, Director of Deluxe Corporation. Prior thereto, President and CEO of BellSouth Advertising and Publishing Corp. from 2005 to 2007, President and CEO of BellSouth Enterprises from 2004 to 2005 and President of BellSouth Consumer Services from 2000 to 2003. Emeritus member of the Iowa State University Foundation Board of Governors. Emeritus Member of the Advisory Board of Iowa State University School of Business. Advisory Board Member, Palm Harbor Academy (private school). Mr. Harris is a certified public accountant (inactive status). | CIGNA Corporation |
Judith M. Johnson
(Born 1949) | Trustee,
since 2008 | Retired. Prior thereto, Chief Executive Officer and Chief Investment Officer of Minneapolis Employees Retirement Fund from 1996 to 2008. Ms. Johnson is an attorney, certified public accountant and a certified managerial accountant. | N/A |
David F. Larcker
(Born 1950) | Trustee,
since 2009 | James Irvin Miller Professor of Accounting at the Graduate School of Business (Emeritus), Stanford University, Director of the Corporate Governance Research Initiative and Senior Faculty of The Rock Center for Corporate Governance since 2006. From 2005 to 2008, Professor of Accounting at the Graduate School of Business, Stanford University. Prior thereto, Ernst & Young Professor of Accounting at The Wharton School, University of Pennsylvania from 1985 to 2005. | N/A |
28 | Wells Fargo Large Cap Growth Fund
Other information (unaudited)
Name and
year of birth | Position held and
length of service* | Principal occupations during past five years or longer | Current other
public company or
investment
company
directorships |
Olivia S. Mitchell
(Born 1953) | Trustee,
since 2006;
Nominating and
Governance
Committee Chair,
since 2018 | International Foundation of Employee Benefit Plans Professor, Wharton School of the University of Pennsylvania since 1993. Director of Wharton’s Pension Research Council and Boettner Center on Pensions & Retirement Research, and Research Associate at the National Bureau of Economic Research. Previously, Cornell University Professor from 1978 to 1993. | N/A |
Timothy J. Penny
(Born 1951) | Trustee,
since 1996;
Chair,
since 2018 | President and Chief Executive Officer of Southern Minnesota Initiative Foundation, a non-profit organization, since 2007. Member of the Board of Trustees of NorthStar Education Finance, Inc., a non-profit organization, since 2007. | N/A |
James G. Polisson
(Born 1959) | Trustee,
since 2018 | Retired. Chief Marketing Officer, Source (ETF) UK Services, Ltd, from 2015 to 2017. From 2012 to 2015, Principal of The Polisson Group, LLC, a management consulting, corporate advisory and principal investing company. Chief Executive Officer and Managing Director at Russell Investments, Global Exchange Traded Funds from 2010 to 2012. Managing Director of Barclays Global Investors from 1998 to 2010 and Global Chief Marketing Officer for iShares and Barclays Global Investors from 2000 to 2010. Trustee of the San Francisco Mechanics’ Institute, a non-profit organization, from 2013 to 2015. Board member of the Russell Exchange Traded Fund Trust from 2011 to 2012. Director of Barclays Global Investors Holdings Deutschland GmbH from 2006 to 2009. Mr. Polisson is an attorney and has a retired status with the Massachusetts and District of Columbia Bar Associations. | N/A |
Pamela Wheelock
(Born 1959) | Trustee,
since January
2020; previously
Trustee from
January 2018 to
July 2019 | Board member of the Destination Medical Center Economic Development Agency, Rochester, Minnesota since 2019. Interim President of the McKnight Foundation from January to September 2020. Acting Commissioner, Minnesota Department of Human Services, July 2019 through September 2019. Human Services Manager (part-time), Minnesota Department of Human Services, October 2019 through December 2019. Chief Operating Officer, Twin Cities Habitat for Humanity from 2017 to 2019. Vice President of University Services, University of Minnesota from 2012 to 2016. Prior thereto, on the Board of Directors, Governance Committee and Finance Committee for the Minnesota Philanthropy Partners (Saint Paul Foundation) from 2012 to 2018, Interim Chief Executive Officer of Blue Cross Blue Shield of Minnesota from 2011 to 2012, Chairman of the Board from 2009 to 2012 and Board Director from 2003 to 2015. Vice President, Leadership and Community Engagement, Bush Foundation, Saint Paul, Minnesota (a private foundation) from 2009 to 2011. Executive Vice President and Chief Financial Officer, Minnesota Sports and Entertainment from 2004 to 2009 and Senior Vice President from 2002 to 2004. Executive Vice President of the Minnesota Wild Foundation from 2004 to 2008. Commissioner of Finance, State of Minnesota, from 1999 to 2002. Currently Board Chair of the Minnesota Wild Foundation since 2010. | N/A |
* Length of service dates reflect the Trustee’s commencement of service with the Trust’s predecessor entities, where applicable.
Wells Fargo Large Cap Growth Fund | 29
Other information (unaudited)
Officers
Name and
year of birth | Position held and
length of service | Principal occupations during past five years or longer |
Andrew Owen
(Born 1960) | President,
since 2017 | Executive Vice President of Wells Fargo & Company and Head of Affiliated Managers, Wells Fargo Asset Management, since 2014. In addition, Mr. Owen is currently President, Chief Executive Officer and Director of Wells Fargo Funds Management, LLC since 2017. Prior thereto, Executive Vice President responsible for marketing, investments and product development for Wells Fargo Funds Management, LLC, from 2009 to 2014. |
Jeremy DePalma
(Born 1974) | Treasurer,
since 2012
(for certain funds in
the Fund Complex);
since 2021 (for
the remaining funds in the
Fund Complex) | Senior Vice President of Wells Fargo Funds Management, LLC since 2009. Senior Vice President of Evergreen Investment Management Company, LLC from 2008 to 2010 and head of the Fund Reporting and Control Team within Fund Administration from 2005 to 2010. |
Michelle Rhee
(Born 1966) | Chief Legal Officer,
since 2019 | Secretary of Wells Fargo Funds Management, LLC and Chief Legal Counsel of Wells Fargo Asset Management since 2018. Deputy General Counsel of Wells Fargo Bank, N.A. since 2020 and Assistant General Counsel of Wells Fargo Bank, N.A. from 2018 to 2020. Associate General Counsel and Managing Director of Bank of America Corporation from 2004 to 2018. |
Catherine Kennedy
(Born 1969) | Secretary,
since 2019 | Vice President of Wells Fargo Funds Management, LLC and Senior Counsel of the Wells Fargo Legal Department since 2010. Vice President and Senior Counsel of Evergreen Investment Management Company, LLC from 1998 to 2010. |
Michael H. Whitaker
(Born 1967) | Chief Compliance Officer,
since 2016 | Chief Compliance Officer of Wells Fargo Asset Management since 2016. Senior Vice President and Chief Compliance Officer for Fidelity Investments from 2007 to 2016. |
1 The Statement of Additional Information includes additional information about the Trustees and is available, without charge, upon request, by calling 1-800-222-8222 or by visiting the website at wfam.com.
30 | Wells Fargo Large Cap Growth Fund
For more information
More information about Wells Fargo Funds is available free upon request. To obtain literature, please write, visit the Fund's website, or call:
Wells Fargo Funds
P.O. Box 219967
Kansas City, MO 64121-9967
Website: wfam.com
Individual investors: 1-800-222-8222
Retail investment professionals: 1-888-877-9275
Institutional investment professionals: 1-866-765-0778
This report and the financial statements contained herein are submitted for the general information of the shareholders of the Fund. If this report is used for promotional purposes, distribution of the report must be accompanied or preceded by a current prospectus. Before investing, please consider the investment objectives, risks, charges, and expenses of the investment. For a current prospectus and, if available, a summary prospectus, containing this information, call 1-800-222-8222 or visit the Fund’s website at wfam.com. Read the prospectus carefully before you invest or send money.
Wells Fargo Asset Management (WFAM) is the trade name for certain investment advisory/management firms owned by Wells Fargo & Company. These firms include but are not limited to Wells Capital Management Incorporated and Wells Fargo Funds Management, LLC. Certain products managed by WFAM entities are distributed by Wells Fargo Funds Distributor, LLC (a broker-dealer and Member FINRA).
This material is for general informational and educational purposes only and is NOT intended to provide investment advice or a recommendation of any kind— including a recommendation for any specific investment, strategy, or plan.
INVESTMENT PRODUCTS: NOT FDIC INSURED ■ NO BANK GUARANTEE ■ MAY LOSE VALUE
© 2021 Wells Fargo & Company. All rights reserved.
PAR-0221-00370 03-22
SA209/SAR209 01-21
Semi-Annual Report
January 31, 2021
Wells Fargo
Large Company Value Fund
Reduce clutter.
Save trees.
Sign up for electronic delivery of prospectuses and shareholder reports at wellsfargo.com/ advantagedelivery
The views expressed and any forward-looking statements are as of January 31, 2021, unless otherwise noted, and are those of the Fund's portfolio managers and/or Wells Fargo Asset Management. Discussions of individual securities or the markets generally are not intended as individual recommendations. Future events or results may vary significantly from those expressed in any forward-looking statements. The views expressed are subject to change at any time in response to changing circumstances in the market. Wells Fargo Asset Management and the Fund disclaim any obligation to publicly update or revise any views expressed or forward-looking statements.
INVESTMENT PRODUCTS: NOT FDIC INSURED ■ NO BANK GUARANTEE ■ MAY LOSE VALUE
Wells Fargo Large Company Value Fund | 1
Letter to shareholders (unaudited)
Dear Shareholder:
We are pleased to offer you this semi-annual report for the Wells Fargo Large Company Value Fund for the six-month period that ended January 31, 2021. Despite a deeply challenging year, dominated by the spread of COVID-19 cases and a sharp drop in economic output throughout much of the world, global stocks performed extremely well, benefiting from ongoing central bank support and rising optimism over the development and distribution of effective COVID-19 vaccines. Bonds also had positive returns, led by global bonds and high-yield bonds.
For the six-month period, U.S. stocks, based on the S&P 500 Index1, gained 14.47%. International stocks, as measured by the MSCI ACWI ex USA Index (Net)2, returned 19.28%, while the MSCI EM Index (Net)3, had stronger performance, with a 24.07% gain. Among bond indexes, the Bloomberg Barclays U.S. Aggregate Bond Index4 returned -0.91%, the Bloomberg Barclays Global Aggregate ex-USD Index (unhedged)5 gained 3.71%, and the Bloomberg Barclays Municipal Bond Index6 returned 2.01% while the ICE BofA U.S. High Yield Index7 returned 6.82%.
The stock market rally continued in August.
The stock market continued a months-long rally in August despite concerns over rising numbers of U.S. and European COVID-19 cases. Relatively strong second-quarter earnings boosted investor sentiment along with the U.S. Federal Reserve’s announcement of a monetary policy shift expected to support longer-term low interest rates. U.S. manufacturing and services activity indexes beat expectations, while the U.S. housing market maintained strength. In Europe, retail sales expanded and consumer confidence was steady. China’s economy continued to expand.
Stocks grew more volatile in September on mixed economic data. U.S. economic activity continued to grow. However, U.S. unemployment remained elevated at 7.9% in September. With U.S. Congress delaying further fiscal relief and uncertainties surrounding a possible vaccine, doubts crept back into the financial markets. In the U.K., a lack of progress in Brexit talks weighed on markets. China’s economy picked up steam, fueled by increased global demand.
Andrew Owen
President
Wells Fargo Funds
“The stock market continued a months-long rally in August despite concerns over rising numbers of U.S. and European COVID-19 cases.”
| 1 | The S&P 500 Index consists of 500 stocks chosen for market size, liquidity, and industry group representation. It is a market-value-weighted index with each stock's weight in the index proportionate to its market value. You cannot invest directly in an index. |
| 2 | The Morgan Stanley Capital International (MSCI) All Country World Index (ACWI) ex USA Index (Net) is a free-float-adjusted market-capitalization-weighted index that is designed to measure the equity market performance of developed and emerging markets, excluding the United States. Source: MSCI. MSCI makes no express or implied warranties or representations and shall have no liability whatsoever with respect to any MSCI data contained herein. The MSCI data may not be further redistributed or used as a basis for other indices or any securities or financial products. This report is not approved, reviewed, or produced by MSCI. You cannot invest directly in an index. |
| 1 | The S&P 500 Index consists of 500 stocks chosen for market size, liquidity, and industry group representation. It is a market-value-weighted index with each stock's weight in the index proportionate to its market value. You cannot invest directly in an index. |
| 3 | The MSCI Emerging Markets (EM) Index (Net) is a free-float-adjusted market-capitalization-weighted index that is designed to measure equity market performance of emerging markets. You cannot invest directly in an index. |
| 1 | The S&P 500 Index consists of 500 stocks chosen for market size, liquidity, and industry group representation. It is a market-value-weighted index with each stock's weight in the index proportionate to its market value. You cannot invest directly in an index. |
| 4 | The Bloomberg Barclays U.S. Aggregate Bond Index is a broad-based benchmark that measures the investment-grade, U.S. dollar-denominated, fixed-rate taxable bond market, including Treasuries, government-related and corporate securities, mortgage-backed securities (agency fixed-rate and hybrid adjustable-rate mortgage pass-throughs), asset-backed securities, and commercial mortgage-backed securities. You cannot invest directly in an index. |
| 1 | The S&P 500 Index consists of 500 stocks chosen for market size, liquidity, and industry group representation. It is a market-value-weighted index with each stock's weight in the index proportionate to its market value. You cannot invest directly in an index. |
| 5 | The Bloomberg Barclays Global Aggregate ex-USD Index (unhedged) is an unmanaged index that provides a broad-based measure of the global investment-grade fixed-income markets excluding the U.S. dollar-denominated debt market. You cannot invest directly in an index. |
| 1 | The S&P 500 Index consists of 500 stocks chosen for market size, liquidity, and industry group representation. It is a market-value-weighted index with each stock's weight in the index proportionate to its market value. You cannot invest directly in an index. |
| 6 | The Bloomberg Barclays Municipal Bond Index is an unmanaged index composed of long-term tax-exempt bonds with a minimum credit rating of Baa. You cannot invest directly in an index. |
| 1 | The S&P 500 Index consists of 500 stocks chosen for market size, liquidity, and industry group representation. It is a market-value-weighted index with each stock's weight in the index proportionate to its market value. You cannot invest directly in an index. |
| 7 | The ICE BofA U.S. High Yield Index is a market-capitalization-weighted index of domestic and Yankee high-yield bonds. The index tracks the performance of high-yield securities traded in the U.S. bond market. You cannot invest directly in an index. Copyright 2021. ICE Data Indices, LLC. All rights reserved. |
2 | Wells Fargo Large Company Value Fund
Letter to shareholders (unaudited)
In October, capital markets stepped back from their six-month rally. Market volatility rose in advance of the U.S. election and amid a global increase in COVID-19 infections. Europe introduced tighter restrictions affecting economic activity. U.S. markets looked favorably at the prospect of Democratic control of the federal purse strings, which could lead to additional fiscal stimulus and a boost to economic activity. Meanwhile, China reported 4.9% third-quarter GDP growth.
Global stocks rallied in November, propelled by optimism over three promising COVID-19 vaccines. Reversing recent trends, value stocks outperformed growth stocks and cyclical stocks outpaced technology stocks. However, U.S. unemployment remained elevated, with a net job loss of 10 million since February. The eurozone services purchasing managers’ index contracted sharply while the region’s manufacturing activity grew. The U.S. election results added to the upbeat mood as investors anticipated more consistent policies in the new administration.
Financial markets ended the year with strength on high expectations for a rapid rollout of the COVID-19 vaccines, the successful passage of a $900 billion stimulus package, and rising expectations of additional economic support from a Democratic-led Congress. U.S. economic data were mixed with still-elevated unemployment and weak retail sales but growth in manufacturing output. In contrast, China’s economic expansion continued in both manufacturing and nonmanufacturing. U.S. COVID-19 infection rates continued to rise even as new state and local lockdown measures were implemented.
The year 2021 began with emerging market stocks leading all major asset classes in January, driven by China’s strong economic growth and a broad recovery in corporate earnings, which propelled China’s stock market higher. In the United States, positive news on vaccine trials and January expansion in both the manufacturing and services sectors was offset by a weak December monthly jobs report. This was compounded by technical factors as some hedge funds were forced to sell stocks to protect themselves against a well-publicized short squeeze coordinated by a group of retail investors. Eurozone sentiment and economic growth were particularly weak, reflecting the impact of a new lockdown with stricter social distancing along with a slow vaccine rollout.
Don’t let short-term uncertainty derail long-term investment goals.
Periods of investment uncertainty can present challenges, but experience has taught us that maintaining long-term investment goals can be an effective way to plan for the future. To help you create a sound strategy based on your personal goals and risk tolerance, Wells Fargo Funds offers more than 100 mutual funds spanning a wide range of asset classes and investment styles. Although diversification cannot guarantee an investment profit or prevent losses, we believe it can be an effective way to manage investment risk and potentially smooth out overall portfolio performance. We encourage investors to know their investments and to understand that appropriate levels of risk-taking may unlock opportunities.
Thank you for choosing to invest with Wells Fargo Funds. We appreciate your confidence in us and remain committed to helping you meet your financial needs.
Sincerely,
Andrew Owen
President
Wells Fargo Funds
“Global stocks rallied in November, propelled by optimism over three promising COVID-19 vaccines.”
For further information about your Fund, contact your investment professional, visit our website at wfam.com, or call us directly at 1-800-222-8222.
Wells Fargo Large Company Value Fund | 3
Performance highlights (unaudited)
Investment objective
The Fund seeks long-term capital appreciation.
Manager
Wells Fargo Funds Management, LLC
Subadviser
Wells Capital Management Incorporated
Portfolio managers
Dennis Bein, CFA®‡
Ryan Brown, CFA®‡
Harindra de Silva, Ph.D., CFA®‡
Average annual total returns (%) as of January 31, 2021
| | | Including sales charge | | Excluding sales charge | | Expense ratios1 (%) |
| | Inception date | 1 year | 5 year | 10 year | | 1 year | 5 year | 10 year | | Gross | Net 2 |
| Class A (WLCAX) | 3-31-2008 | 3.72 | 9.39 | 8.18 | | 10.04 | 10.69 | 8.82 | | 0.99 | 0.83 |
| Class C (WFLVX) | 3-31-2008 | 8.18 | 9.85 | 8.01 | | 9.18 | 9.85 | 8.01 | | 1.74 | 1.58 |
| Class R6(WTLVX) 3 | 4-7-2017 | – | – | – | | 10.39 | 11.13 | 9.30 | | 0.56 | 0.40 |
| Administrator Class (WWIDX) | 12-31-2001 | – | – | – | | 10.10 | 10.78 | 9.01 | | 0.91 | 0.75 |
| Institutional Class (WLCIX) | 3-31-2008 | – | – | – | | 10.36 | 11.06 | 9.26 | | 0.66 | 0.50 |
| Russell 1000® Value Index 4 | – | – | – | – | | 4.09 | 10.71 | 10.15 | | – | – |
Figures quoted represent past performance, which is no guarantee of future results, and do not reflect taxes that a shareholder may pay on an investment in a fund. Investment return and principal value of an investment will fluctuate so that an investor’s shares, when redeemed, may be worth more or less than their original cost. Performance shown without sales charges would be lower if sales charges were reflected. Current performance may be lower or higher than the performance data quoted, which assumes the reinvestment of dividends and capital gains. Current month-end performance is available on the Fund’s website, wfam.com.
Index returns do not include transaction costs associated with buying and selling securities, any mutual fund fees or expenses, or any taxes. It is not possible to invest directly in an index.
For Class A shares, the maximum front-end sales charge is 5.75%. For Class C shares, the maximum contingent deferred sales charge is 1.00%. Performance including a contingent deferred sales charge assumes the sales charge for the corresponding time period. Class R6, Administrator Class, and Institutional Class shares are sold without a front-end sales charge or contingent deferred sales charge.
Stock values fluctuate in response to the activities of individual companies and general market and economic conditions. Certain investment strategies tend to increase the total risk of an investment (relative to the broader market). The Fund is exposed to foreign investment risk. Consult the Fund’s prospectus for additional information on these and other risks.
4 | Wells Fargo Large Company Value Fund
Performance highlights (unaudited)
| Ten largest holdings (%) as of January 31, 20215 |
| Exxon Mobil Corporation | 3.19 |
| JPMorgan Chase & Company | 2.83 |
| Pfizer Incorporated | 2.74 |
| Linde plc | 2.66 |
| Raytheon Technologies Corporation | 2.56 |
| Berkshire Hathaway Incorporated Class B | 2.50 |
| CSX Corporation | 2.26 |
| UnitedHealth Group Incorporated | 2.23 |
| AT&T Incorporated | 2.20 |
| US Bancorp | 2.17 |
| Sector distribution as of January 31, 20216 |
| ‡ | CFA® and Chartered Financial Analyst® are trademarks owned by CFA Institute. |
| 1 | Reflects the expense ratios as stated in the most recent prospectuses. The expense ratios shown are subject to change and may differ from the annualized expense ratios shown in the financial highlights of this report. |
| 2 | The manager has contractually committed through November 30, 2021, to waive fees and/or reimburse expenses to the extent necessary to cap total annual fund operating expenses after fee waivers at 0.83% for Class A, 1.58% for Class C, 0.40% for Class R6, 0.75% for Administrator Class, and 0.50% for Institutional Class. Brokerage commissions, stamp duty fees, interest, taxes, acquired fund fees and expenses (if any), and extraordinary expenses are excluded from the expense caps. Prior to or after the commitment expiration date, the caps may be increased or the commitment to maintain the caps may be terminated only with the approval of the Board of Trustees. Without these caps, the Fund’s returns would have been lower. The expense ratio paid by an investor is the net expense ratio (the total annual fund operating expenses after fee waivers) as stated in the prospectuses. |
| 3 | Historical performance shown for the Class R6 shares prior to their inception reflects the performance of the Institutional Class shares, and is not adjusted to reflect the Class R6 expenses. If these expenses had been included, returns for the Class R6 shares would be higher. |
| 4 | The Russell 1000® Value Index measures the performance of those Russell 1000 companies with lower price/book ratios and lower forecasted growth values. You cannot invest directly in an index. |
| 5 | Figures represent the percentage of the Fund's net assets. Holdings are subject to change and may have changed since the date specified. |
| 6 | Figures represent the percentage of the Fund's long-term investments. These amounts are subject to change and may have changed since the date specified. |
Wells Fargo Large Company Value Fund | 5
Fund expenses (unaudited)
As a shareholder of the Fund, you incur two types of costs: (1) transaction costs, including sales charges (loads) on purchase payments and contingent deferred sales charges (if any) on redemptions and (2) ongoing costs, including management fees, distribution (12b-1) and/or shareholder servicing fees, and other Fund expenses. This example is intended to help you understand your ongoing costs (in dollars) of investing in the Fund and to compare these costs with the ongoing costs of investing in other mutual funds.
The example is based on an investment of $1,000 invested at the beginning of the six-month period and held for the entire period from August 1, 2020 to January 31, 2021.
Actual expenses
The “Actual” line of the table below provides information about actual account values and actual expenses. You may use the information in this line, together with the amount you invested, to estimate the expenses that you paid over the period. Simply divide your account value by $1,000 (for example, an $8,600 account value divided by $1,000 = 8.6), then multiply the result by the number in the “Actual” line under the heading entitled “Expenses paid during period” for your applicable class of shares to estimate the expenses you paid on your account during this period.
Hypothetical example for comparison purposes
The “Hypothetical” line of the table below provides information about hypothetical account values and hypothetical expenses based on the Fund’s actual expense ratio and an assumed rate of return of 5% per year before expenses, which is not the Fund’s actual return. The hypothetical account values and expenses may not be used to estimate the actual ending account balance or expenses you paid for the period. You may use this information to compare the ongoing costs of investing in the Fund and other funds. To do so, compare this 5% hypothetical example with the 5% hypothetical examples that appear in the shareholder reports of the other funds.
Please note that the expenses shown in the table are meant to highlight your ongoing costs only and do not reflect any transactional costs, such as sales charges (loads) and contingent deferred sales charges. Therefore, the “Hypothetical” line of the table is useful in comparing ongoing costs only and will not help you determine the relative total costs of owning different funds. In addition, if these transactional costs were included, your costs would have been higher
| | Beginning
account value
8-1-2020 | Ending
account value
1-31-2021 | Expenses
paid during
the period1 | Annualized net
expense ratio |
| Class A | | | | |
| Actual | $1,000.00 | $1,193.47 | $4.48 | 0.81% |
| Hypothetical (5% return before expenses) | $1,000.00 | $1,021.12 | $4.13 | 0.81% |
| Class C | | | | |
| Actual | $1,000.00 | $1,189.33 | $8.72 | 1.58% |
| Hypothetical (5% return before expenses) | $1,000.00 | $1,017.24 | $8.03 | 1.58% |
| Class R6 | | | | |
| Actual | $1,000.00 | $1,195.20 | $2.21 | 0.40% |
| Hypothetical (5% return before expenses) | $1,000.00 | $1,023.19 | $2.04 | 0.40% |
| Administrator Class | | | | |
| Actual | $1,000.00 | $1,193.51 | $4.15 | 0.75% |
| Hypothetical (5% return before expenses) | $1,000.00 | $1,021.42 | $3.82 | 0.75% |
| Institutional Class | | | | |
| Actual | $1,000.00 | $1,195.19 | $2.77 | 0.50% |
| Hypothetical (5% return before expenses) | $1,000.00 | $1,022.68 | $2.55 | 0.50% |
1 Expenses paid is equal to the annualized net expense ratio of each class multiplied by the average account value over the period, multiplied by the number of days in the most recent fiscal half-year divided by the number of days in the fiscal year (to reflect the one-half-year period).
6 | Wells Fargo Large Company Value Fund
Portfolio of investments—January 31, 2021 (unaudited)
| | | | | Shares | Value |
| Common stocks: 98.64% | | | | | |
| Communication services: 7.32% | | | | | |
| Diversified telecommunication services: 4.34% | | | | | |
| AT&T Incorporated | | | | 164,011 | $ 4,695,635 |
| Verizon Communications Incorporated | | | | 83,405 | 4,566,424 |
| | | | | | 9,262,059 |
| Entertainment: 1.32% | | | | | |
| The Walt Disney Company | | | | 16,693 | 2,807,262 |
| Media: 1.66% | | | | | |
| Comcast Corporation Class A | | | | 71,506 | 3,544,552 |
| Consumer discretionary: 9.24% | | | | | |
| Auto components: 1.94% | | | | | |
| Gentex Corporation | | | | 125,443 | 4,145,891 |
| Automobiles: 1.05% | | | | | |
| Tesla Motors Incorporated † | | | | 2,824 | 2,240,929 |
| Hotels, restaurants & leisure: 1.14% | | | | | |
| Chipotle Mexican Grill Incorporated † | | | | 698 | 1,033,040 |
| Shake Shack Incorporated Class A † | | | | 12,356 | 1,401,418 |
| | | | | | 2,434,458 |
| Household durables: 2.14% | | | | | |
| Garmin Limited | | | | 16,621 | 1,909,088 |
| Sonos Incorporated † | | | | 101,548 | 2,655,480 |
| | | | | | 4,564,568 |
| Specialty retail: 1.70% | | | | | |
| GrowGeneration Corporation † | | | | 1,915 | 82,709 |
| Ross Stores Incorporated | | | | 25,330 | 2,818,976 |
| The TJX Companies Incorporated | | | | 11,135 | 713,085 |
| | | | | | 3,614,770 |
| Textiles, apparel & luxury goods: 1.27% | | | | | |
| lululemon athletica Incorporated † | | | | 5,039 | 1,656,219 |
| Nike Incorporated Class B | | | | 7,926 | 1,058,834 |
| | | | | | 2,715,053 |
| Consumer staples: 8.27% | | | | | |
| Beverages: 0.01% | | | | | |
| PepsiCo Incorporated | | | | 226 | 30,865 |
| Food & staples retailing: 3.33% | | | | | |
| Costco Wholesale Corporation | | | | 8,198 | 2,889,221 |
| Performance Food Group Company † | | | | 22,750 | 1,066,520 |
| The Kroger Company | | | | 74,887 | 2,583,602 |
| Walmart Incorporated | | | | 4,011 | 563,505 |
| | | | | | 7,102,848 |
The accompanying notes are an integral part of these financial statements.
Wells Fargo Large Company Value Fund | 7
Portfolio of investments—January 31, 2021 (unaudited)
| | | | | Shares | Value |
| Food products: 1.51% | | | | | |
| Hormel Foods Corporation | | | | 2,642 | $ 123,804 |
| Tyson Foods Incorporated Class A | | | | 48,054 | 3,090,353 |
| | | | | | 3,214,157 |
| Household products: 1.47% | | | | | |
| The Procter & Gamble Company | | | | 24,384 | 3,126,273 |
| Personal products: 1.95% | | | | | |
| The Estee Lauder Companies Incorporated Class A | | | | 17,565 | 4,156,757 |
| Energy: 4.24% | | | | | |
| Oil, gas & consumable fuels: 4.24% | | | | | |
| Antero Midstream Corporation | | | | 270,356 | 2,189,884 |
| Exxon Mobil Corporation | | | | 151,842 | 6,808,595 |
| Hess Corporation | | | | 754 | 40,701 |
| | | | | | 9,039,180 |
| Financials: 19.01% | | | | | |
| Banks: 9.30% | | | | | |
| Citigroup Incorporated | | | | 79,466 | 4,608,233 |
| First Financial Bankshares Incorporated | | | | 30,173 | 1,142,953 |
| JPMorgan Chase & Company | | | | 46,916 | 6,036,682 |
| Truist Financial Corporation | | | | 71,155 | 3,414,017 |
| US Bancorp | | | | 107,974 | 4,626,686 |
| | | | | | 19,828,571 |
| Capital markets: 2.80% | | | | | |
| Bank of New York Mellon Corporation | | | | 5,754 | 229,182 |
| KKR & Company Incorporated Class A | | | | 6,700 | 260,965 |
| Morgan Stanley | | | | 36,067 | 2,418,292 |
| SEI Investments Company | | | | 11,154 | 589,489 |
| The Carlyle Group Incorporated | | | | 1,309 | 42,241 |
| The Charles Schwab Corporation | | | | 4,497 | 231,775 |
| The Goldman Sachs Group Incorporated | | | | 8,093 | 2,194,579 |
| | | | | | 5,966,523 |
| Consumer finance: 0.71% | | | | | |
| OneMain Holdings Incorporated | | | | 32,651 | 1,520,231 |
| Diversified financial services: 2.50% | | | | | |
| Berkshire Hathaway Incorporated Class B † | | | | 23,410 | 5,334,438 |
| Insurance: 1.40% | | | | | |
| Assured Guaranty Limited | | | | 5,102 | 182,397 |
| Kinsale Capital Group Incorporated | | | | 3,446 | 646,332 |
| Prudential Financial Incorporated | | | | 27,512 | 2,153,639 |
| | | | | | 2,982,368 |
| Mortgage REITs: 0.59% | | | | | |
| Arbor Realty Trust Incorporated | | | | 87,489 | 1,247,593 |
The accompanying notes are an integral part of these financial statements.
8 | Wells Fargo Large Company Value Fund
Portfolio of investments—January 31, 2021 (unaudited)
| | | | | Shares | Value |
| Thrifts & mortgage finance: 1.71% | | | | | |
| Essent Group Limited | | | | 39,018 | $ 1,632,123 |
| NMI Holdings Incorporated Class A † | | | | 95,278 | 2,020,846 |
| | | | | | 3,652,969 |
| Health care: 13.88% | | | | | |
| Biotechnology: 2.98% | | | | | |
| Exact Sciences Corporation † | | | | 17,038 | 2,336,932 |
| Incyte Corporation † | | | | 18,833 | 1,690,262 |
| Vertex Pharmaceuticals Incorporated † | | | | 10,127 | 2,319,893 |
| | | | | | 6,347,087 |
| Health care equipment & supplies: 2.29% | | | | | |
| Baxter International Incorporated | | | | 3,692 | 283,656 |
| Boston Scientific Corporation † | | | | 17,702 | 627,359 |
| Cardiovascular Systems Incorporated † | | | | 1,830 | 82,332 |
| Glaukos Corporation † | | | | 10,380 | 920,602 |
| Medtronic plc | | | | 7,965 | 886,743 |
| Novocure Limited † | | | | 12,522 | 2,015,541 |
| Tandem Diabetes Care Incorporated † | | | | 753 | 69,765 |
| | | | | | 4,885,998 |
| Health care providers & services: 2.23% | | | | | |
| UnitedHealth Group Incorporated | | | | 14,246 | 4,752,181 |
| Pharmaceuticals: 6.38% | | | | | |
| Bristol-Myers Squibb Company | | | | 18,395 | 1,130,005 |
| Johnson & Johnson | | | | 13,151 | 2,145,323 |
| Merck & Company Incorporated | | | | 58,206 | 4,485,936 |
| Pfizer Incorporated | | | | 163,063 | 5,853,962 |
| | | | | | 13,615,226 |
| Industrials: 11.34% | | | | | |
| Aerospace & defense: 2.56% | | | | | |
| Raytheon Technologies Corporation | | | | 82,018 | 5,473,061 |
| Air freight & logistics: 1.16% | | | | | |
| C.H. Robinson Worldwide Incorporated | | | | 28,916 | 2,474,053 |
| Commercial services & supplies: 0.23% | | | | | |
| McGrath RentCorp | | | | 6,942 | 484,482 |
| Construction & engineering: 0.50% | | | | | |
| WillScot Mobile Mini Holdings Corporation † | | | | 44,845 | 1,063,275 |
| Machinery: 1.33% | | | | | |
| Donaldson Company Incorporated | | | | 17,976 | 1,068,493 |
| Mueller Industries Incorporated | | | | 7,448 | 254,349 |
| PACCAR Incorporated | | | | 13,268 | 1,210,307 |
| Proto Labs Incorporated † | | | | 619 | 131,104 |
| Wabtec Corporation | | | | 2,253 | 167,195 |
| | | | | | 2,831,448 |
| Professional services: 2.92% | | | | | |
| CoStar Group Incorporated † | | | | 4,909 | 4,416,676 |
The accompanying notes are an integral part of these financial statements.
Wells Fargo Large Company Value Fund | 9
Portfolio of investments—January 31, 2021 (unaudited)
| | | | | Shares | Value |
| Professional services (continued) | | | | | |
| IHS Markit Limited | | | | 386 | $ 33,613 |
| TransUnion | | | | 20,330 | 1,769,523 |
| | | | | | 6,219,812 |
| Road & rail: 2.64% | | | | | |
| CSX Corporation | | | | 56,273 | 4,825,691 |
| Lyft Incorporated Class A † | | | | 3,076 | 136,759 |
| Uber Technologies Incorporated † | | | | 4,161 | 211,920 |
| Union Pacific Corporation | | | | 2,325 | 459,118 |
| | | | | | 5,633,488 |
| Information technology: 11.90% | | | | | |
| Communications equipment: 1.29% | | | | | |
| Arista Networks Incorporated † | | | | 4,479 | 1,377,561 |
| Cisco Systems Incorporated | | | | 30,698 | 1,368,517 |
| | | | | | 2,746,078 |
| Electronic equipment, instruments & components: 2.75% | | | | | |
| Amphenol Corporation Class A | | | | 26,109 | 3,260,492 |
| CDW Corporation of Delaware | | | | 19,734 | 2,598,178 |
| | | | | | 5,858,670 |
| IT services: 3.47% | | | | | |
| International Business Machines Corporation | | | | 7,240 | 862,356 |
| LiveRamp Holdings Incorporated † | | | | 18,555 | 1,404,799 |
| MasterCard Incorporated Class A | | | | 7,427 | 2,349,086 |
| Square Incorporated Class A † | | | | 12,850 | 2,775,086 |
| | | | | | 7,391,327 |
| Semiconductors & semiconductor equipment: 3.46% | | | | | |
| Advanced Micro Devices Incorporated † | | | | 1,056 | 90,436 |
| Ambarella Incorporated † | | | | 1,708 | 161,167 |
| Brooks Automation Incorporated | | | | 56,371 | 4,270,667 |
| Intel Corporation | | | | 51,548 | 2,861,429 |
| | | | | | 7,383,699 |
| Technology hardware, storage & peripherals: 0.93% | | | | | |
| 3D Systems Corporation †« | | | | 55,129 | 1,959,285 |
| Pure Storage Incorporated Class A † | | | | 1,272 | 29,421 |
| | | | | | 1,988,706 |
| Materials: 5.64% | | | | | |
| Chemicals: 2.66% | | | | | |
| Linde plc | | | | 23,104 | 5,669,722 |
| Metals & mining: 1.77% | | | | | |
| Freeport-McMoRan Incorporated | | | | 140,546 | 3,782,093 |
| Paper & forest products: 1.21% | | | | | |
| Louisiana-Pacific Corporation | | | | 67,813 | 2,577,572 |
The accompanying notes are an integral part of these financial statements.
10 | Wells Fargo Large Company Value Fund
Portfolio of investments—January 31, 2021 (unaudited)
| | | | | Shares | Value |
| Real estate: 4.14% | | | | | |
| Equity REITs: 1.99% | | | | | |
| AvalonBay Communities Incorporated | | | | 1,306 | $ 213,753 |
| Essential Properties Realty | | | | 25,883 | 538,884 |
| Innovative Industrial Properties Incorporated | | | | 1,946 | 364,136 |
| Invitation Homes Incorporated | | | | 1,715 | 50,558 |
| Outfront Media Incorporated | | | | 1,803 | 32,869 |
| SBA Communications Corporation | | | | 1,736 | 466,411 |
| VEREIT Incorporated | | | | 73,107 | 2,575,560 |
| | | | | | 4,242,171 |
| Real estate management & development: 2.15% | | | | | |
| CBRE Group Incorporated Class A † | | | | 75,414 | 4,598,746 |
| Utilities: 3.66% | | | | | |
| Electric utilities: 3.39% | | | | | |
| Exelon Corporation | | | | 93,658 | 3,892,426 |
| NextEra Energy Incorporated | | | | 41,390 | 3,347,209 |
| | | | | | 7,239,635 |
| Independent power & renewable electricity producers: 0.06% | | | | | |
| Vistra Energy Corporation | | | | 5,901 | 117,843 |
| Multi-utilities: 0.21% | | | | | |
| Dominion Energy Incorporated | | | | 6,195 | 451,554 |
| Total Common stocks (Cost $197,892,901) | | | | | 210,360,242 |
| | | Yield | | | |
| Short-term investments: 2.29% | | | | | |
| Investment companies: 2.29% | | | | | |
| Securities Lending Cash Investments LLC ♠∩∞ | | 0.10% | | 2,026,625 | 2,026,625 |
| Wells Fargo Government Money Market Fund Select Class ♠∞ | | 0.03 | | 2,859,588 | 2,859,588 |
| Total Short-term investments (Cost $4,886,213) | | | | | 4,886,213 |
| Total investments in securities (Cost $202,779,114) | 100.93% | | | | 215,246,455 |
| Other assets and liabilities, net | (0.93) | | | | (1,988,189) |
| Total net assets | 100.00% | | | | $213,258,266 |
| † | Non-income-earning security |
| « | All or a portion of this security is on loan. |
| ♠ | The issuer of the security is an affiliated person of the Fund as defined in the Investment Company Act of 1940. |
| ∩ | The investment is a non-registered investment company purchased with cash collateral received from securities on loan. |
| ∞ | The rate represents the 7-day annualized yield at period end. |
| Abbreviations: |
| REIT | Real estate investment trust |
The accompanying notes are an integral part of these financial statements.
Wells Fargo Large Company Value Fund | 11
Portfolio of investments—January 31, 2021 (unaudited)
Investments in affiliates
An affiliated investment is an investment in which the Fund owns at least 5% of the outstanding voting shares of the issuer or as a result of other relationships, such as the Fund and the issuer having the same investment manager. Transactions with issuers that were either affiliated persons of the Fund at the beginning of the period or the end of the period were as follows:
| | Value,
beginning of
period | Purchases | Sales
proceeds | Net
realized
gains
(losses) | | Net
change in
unrealized
gains
(losses) | | Value,
end of
period | | % of
net
assets | Shares,
end
of period | Income
from
affiliated
securities |
| Short-term investments | | | | | | | | | | | | |
| Investment companies | | | | | | | | | | | | |
| Securities Lending Cash Investments LLC | $ 0 | $11,902,700 | $ (9,876,075) | $0 | | $0 | | $ 2,026,625 | | | 2,026,625 | $ 431# |
| Wells Fargo Government Money Market Fund Select Class | 2,774,458 | 22,833,901 | (22,748,771) | 0 | | 0 | | 2,859,588 | | | 2,859,588 | 638 |
| | | | | $0 | | $0 | | $4,886,213 | | 2.29% | | $1,069 |
| # | Amount shown represents income before fees and rebates. |
Futures contracts
| Description | Number of
contracts | Expiration
date | Notional
cost | Notional
value | Unrealized
gains | Unrealized
losses |
| Long | | | | | | |
| E-Mini S&P 500 Index | 17 | 3-19-2021 | $3,127,128 | $3,149,420 | $22,292 | $0 |
The accompanying notes are an integral part of these financial statements.
12 | Wells Fargo Large Company Value Fund
Statement of assets and liabilities—January 31, 2021 (unaudited)
| | |
| Assets | |
Investments in unaffiliated securities (including $1,986,877 of securities loaned), at value (cost $197,892,901)
| $ 210,360,242 |
Investments in affiliated securites, at value (cost $4,886,213)
| 4,886,213 |
Segregated cash for futures contracts
| 425,000 |
Receivable for dividends
| 291,007 |
Receivable for Fund shares sold
| 32,139 |
Receivable for securities lending income, net
| 621 |
Prepaid expenses and other assets
| 58,681 |
Total assets
| 216,053,903 |
| Liabilities | |
Payable upon receipt of securities loaned
| 2,026,625 |
Payable for Fund shares redeemed
| 522,390 |
Payable for daily variation margin on open futures contracts
| 62,985 |
Management fee payable
| 51,097 |
Administration fees payable
| 38,445 |
Trustees’ fees and expenses payable
| 2,378 |
Distribution fee payable
| 371 |
Accrued expenses and other liabilities
| 91,346 |
Total liabilities
| 2,795,637 |
Total net assets
| $213,258,266 |
| Net assets consist of | |
Paid-in capital
| $ 176,151,346 |
Total distributable earnings
| 37,106,920 |
Total net assets
| $213,258,266 |
| Computation of net asset value and offering price per share | |
Net assets – Class A
| $ 196,067,981 |
Shares outstanding – Class A1
| 13,632,478 |
Net asset value per share – Class A
| $14.38 |
Maximum offering price per share – Class A2
| $15.26 |
Net assets – Class C
| $ 464,243 |
Shares outstanding – Class C1
| 31,171 |
Net asset value per share – Class C
| $14.89 |
Net assets – Class R6
| $ 182,773 |
Shares outstanding – Class R61
| 12,654 |
Net asset value per share – Class R6
| $14.44 |
Net assets – Administrator Class
| $ 13,482,944 |
Shares outstanding – Administrator Class1
| 928,197 |
Net asset value per share – Administrator Class
| $14.53 |
Net assets – Institutional Class
| $ 3,060,325 |
Shares outstanding – Institutional Class1
| 211,595 |
Net asset value per share – Institutional Class
| $14.46 |
| 1 | The Fund has an unlimited number of authorized shares. |
| 2 | Maximum offering price is computed as 100/94.25 of net asset value. On investments of $50,000 or more, the offering price is reduced. |
The accompanying notes are an integral part of these financial statements.
Wells Fargo Large Company Value Fund | 13
Statement of operations—six months ended January 31, 2021 (unaudited)
| | |
| Investment income | |
Dividends
| $ 1,886,882 |
Income from affiliated securities
| 1,536 |
Total investment income
| 1,888,418 |
| Expenses | |
Management fee
| 407,163 |
| Administration fees | |
Class A
| 196,878 |
Class C
| 530 |
Class R6
| 25 |
Administrator Class
| 8,341 |
Institutional Class
| 1,672 |
| Shareholder servicing fees | |
Class A
| 234,409 |
Class C
| 602 |
Administrator Class
| 16,038 |
| Distribution fee | |
Class C
| 1,778 |
Custody and accounting fees
| 8,445 |
Professional fees
| 21,674 |
Registration fees
| 47,704 |
Shareholder report expenses
| 35,038 |
Trustees’ fees and expenses
| 9,707 |
Other fees and expenses
| 18,749 |
Total expenses
| 1,008,753 |
| Less: Fee waivers and/or expense reimbursements | |
Fund-level
| (169,854) |
Class A
| (22,210) |
Class C
| (3) |
Administrator Class
| (250) |
Net expenses
| 816,436 |
Net investment income
| 1,071,982 |
| Realized and unrealized gains (losses) on investments | |
| Net realized gains on | |
Unaffiliated securities
| 38,362,808 |
Futures contracts
| 496,162 |
Net realized gains on investments
| 38,858,970 |
| Net change in unrealized gains (losses) on | |
Unaffiliated securities
| (4,238,164) |
Futures contracts
| (49,905) |
Net change in unrealized gains (losses) on investments
| (4,288,069) |
Net realized and unrealized gains (losses) on investments
| 34,570,901 |
Net increase in net assets resulting from operations
| 35,642,883 |
The accompanying notes are an integral part of these financial statements.
14 | Wells Fargo Large Company Value Fund
Statement of changes in net assets
| | |
| | Six months ended
January 31, 2021
(unaudited) | Year ended
July 31, 2020 |
| Operations | | | | |
Net investment income
| | $ 1,071,982 | | $ 3,248,406 |
Net realized gains (losses) on investments
| | 38,858,970 | | (6,615,449) |
Net change in unrealized losses on investments
| | (4,288,069) | | (1,641,747) |
Net increase (decrease) in net assets resulting from operations
| | 35,642,883 | | (5,008,790) |
| Distributions to shareholders from | | | | |
| Net investment income and net realized gains | | | | |
Class A
| | (4,142,134) | | (4,138,739) |
Class C
| | (8,330) | | (8,415) |
Class R6
| | (4,127) | | (1,720) |
Administrator Class
| | (284,934) | | (307,818) |
Institutional Class
| | (66,123) | | (76,019) |
Total distributions to shareholders
| | (4,505,648) | | (4,532,711) |
| Capital share transactions | Shares | | Shares | |
| Proceeds from shares sold | | | | |
Class A
| 117,509 | 1,611,325 | 393,071 | 4,710,162 |
Class C
| 2,428 | 34,938 | 1,205 | 16,645 |
Class R6
| 250 | 3,383 | 10,550 | 145,462 |
Administrator Class
| 9,566 | 137,304 | 14,119 | 176,541 |
Institutional Class
| 56,819 | 798,249 | 71,355 | 926,976 |
| | | 2,585,199 | | 5,975,786 |
| Reinvestment of distributions | | | | |
Class A
| 288,161 | 4,039,471 | 331,283 | 4,035,013 |
Class C
| 565 | 8,330 | 579 | 7,318 |
Class R6
| 257 | 3,611 | 106 | 1,111 |
Administrator Class
| 19,746 | 279,451 | 24,225 | 299,549 |
Institutional Class
| 4,625 | 65,284 | 6,020 | 74,841 |
| | | 4,396,147 | | 4,417,832 |
| Payment for shares redeemed | | | | |
Class A
| (905,049) | (12,332,958) | (1,762,779) | (22,001,832) |
Class C
| (9,586) | (135,129) | (36,432) | (470,955) |
Class R6
| (29) | (408) | (29) | (332) |
Administrator Class
| (51,026) | (696,506) | (149,524) | (1,951,878) |
Institutional Class
| (22,767) | (310,183) | (130,502) | (1,675,849) |
| | | (13,475,184) | | (26,100,846) |
Net decrease in net assets resulting from capital share transactions
| | (6,493,838) | | (15,707,228) |
Total increase (decrease) in net assets
| | 24,643,397 | | (25,248,729) |
| Net assets | | | | |
Beginning of period
| | 188,614,869 | | 213,863,598 |
End of period
| | $213,258,266 | | $188,614,869 |
The accompanying notes are an integral part of these financial statements.
Wells Fargo Large Company Value Fund | 15
Financial highlights
(For a share outstanding throughout each period)
| | | Year ended July 31 |
| Class A | Six months ended
January 31, 2021
(unaudited) | 2020 | 2019 | 2018 | 2017 | 2016 |
Net asset value, beginning of period
| $12.31 | $12.92 | $14.46 | $16.54 | $14.58 | $16.10 |
Net investment income
| 0.07 | 0.20 | 0.24 | 0.19 | 0.14 | 0.17 |
Net realized and unrealized gains (losses) on investments
| 2.31 | (0.53) | (0.15) | 1.29 | 1.93 | (0.41) |
Total from investment operations
| 2.38 | (0.33) | 0.09 | 1.48 | 2.07 | (0.24) |
| Distributions to shareholders from | | | | | | |
Net investment income
| (0.05) | (0.21) | (0.25) | (0.18) | (0.11) | (0.16) |
Net realized gains
| (0.26) | (0.07) | (1.38) | (3.38) | 0.00 | (1.12) |
Total distributions to shareholders
| (0.31) | (0.28) | (1.63) | (3.56) | (0.11) | (1.28) |
Net asset value, end of period
| $14.38 | $12.31 | $12.92 | $14.46 | $16.54 | $14.58 |
Total return1
| 19.35% | (2.49)% | 1.44% | 9.39% | 14.24% | (0.98)% |
| Ratios to average net assets (annualized) | | | | | | |
Gross expenses
| 1.00% | 0.99% | 0.97% | 0.94% | 1.09% | 1.24% |
Net expenses
| 0.81% | 0.82% | 0.83% | 0.83% | 0.96% | 1.10% |
Net investment income
| 1.05% | 1.63% | 1.84% | 1.28% | 0.91% | 1.19% |
| Supplemental data | | | | | | |
Portfolio turnover rate
| 222% | 366% | 221% | 258% | 221% | 50% |
Net assets, end of period (000s omitted)
| $196,068 | $174,028 | $196,075 | $214,247 | $221,207 | $218,922 |
| 1 | Total return calculations do not include any sales charges. Returns for periods of less than one year are not annualized. |
The accompanying notes are an integral part of these financial statements.
16 | Wells Fargo Large Company Value Fund
Financial highlights
(For a share outstanding throughout each period)
| | | Year ended July 31 |
| Class C | Six months ended
January 31, 2021
(unaudited) | 2020 | 2019 | 2018 | 2017 | 2016 |
Net asset value, beginning of period
| $12.75 | $13.34 | $14.81 | $16.86 | $14.90 | $16.41 |
Net investment income
| 0.02 1 | 0.12 1 | 0.16 1 | 0.08 | 0.03 1 | 0.06 |
Net realized and unrealized gains (losses) on investments
| 2.40 | (0.56) | (0.15) | 1.30 | 1.96 | (0.40) |
Total from investment operations
| 2.42 | (0.44) | 0.01 | 1.38 | 1.99 | (0.34) |
| Distributions to shareholders from | | | | | | |
Net investment income
| (0.02) | (0.08) | (0.10) | (0.05) | (0.03) | (0.05) |
Net realized gains
| (0.26) | (0.07) | (1.38) | (3.38) | 0 | (1.12) |
Total distributions to shareholders
| (0.28) | (0.15) | (1.48) | (3.43) | (0.03) | (1.17) |
Net asset value, end of period
| $14.89 | $12.75 | $13.34 | $14.81 | $16.86 | $14.90 |
Total return2
| 18.93% | (3.27)% | 0.76% | 8.49% | 13.40% | (1.68)% |
| Ratios to average net assets (annualized) | | | | | | |
Gross expenses
| 1.75% | 1.74% | 1.71% | 1.69% | 1.84% | 1.99% |
Net expenses
| 1.58% | 1.58% | 1.58% | 1.58% | 1.72% | 1.85% |
Net investment income
| 0.27% | 0.92% | 1.15% | 0.55% | 0.16% | 0.44% |
| Supplemental data | | | | | | |
Portfolio turnover rate
| 222% | 366% | 221% | 258% | 221% | 50% |
Net assets, end of period (000s omitted)
| $464 | $482 | $966 | $2,926 | $3,356 | $3,674 |
| 1 | Calculated based upon average shares outstanding |
| 2 | Total return calculations do not include any sales charges. Returns for periods of less than one year are not annualized. |
The accompanying notes are an integral part of these financial statements.
Wells Fargo Large Company Value Fund | 17
Financial highlights
(For a share outstanding throughout each period)
| | | Year ended July 31 |
| Class R6 | Six months ended
January 31, 2021
(unaudited) | 2020 | 2019 | 2018 | 2017 1 |
Net asset value, beginning of period
| $12.37 | $13.04 | $14.59 | $16.66 | $16.14 |
Net investment income
| 0.10 | 0.30 | 0.30 | 0.26 | 0.03 2 |
Net realized and unrealized gains (losses) on investments
| 2.31 | (0.57) | (0.14) | 1.30 | 0.49 |
Total from investment operations
| 2.41 | (0.27) | 0.16 | 1.56 | 0.52 |
| Distributions to shareholders from | | | | | |
Net investment income
| (0.08) | (0.33) | (0.33) | (0.25) | 0.00 |
Net realized gains
| (0.26) | (0.07) | (1.38) | (3.38) | 0.00 |
Total distributions to shareholders
| (0.34) | (0.40) | (1.71) | (3.63) | 0.00 |
Net asset value, end of period
| $14.44 | $12.37 | $13.04 | $14.59 | $16.66 |
Total return3
| 19.52% | (2.09)% | 1.92% | 9.88% | 3.22% |
| Ratios to average net assets (annualized) | | | | | |
Gross expenses
| 0.57% | 0.58% | 0.55% | 0.51% | 0.49% |
Net expenses
| 0.40% | (0.40)% | 0.40% | 0.40% | 0.40% |
Net investment income
| 1.46% | 1.69% | 2.26% | 1.73% | 0.52% |
| Supplemental data | | | | | |
Portfolio turnover rate
| 222% | 366% | 221% | 258% | 221% |
Net assets, end of period (000s omitted)
| $183 | $151 | $20 | $23 | $26 |
| 1 | For the period from April 7, 2017 (commencement of class operations) to July 31, 2017 |
| 2 | Calculated based upon average shares outstanding |
| 3 | Returns for periods of less than one year are not annualized. |
The accompanying notes are an integral part of these financial statements.
18 | Wells Fargo Large Company Value Fund
Financial highlights
(For a share outstanding throughout each period)
| | | Year ended July 31 |
| Administrator Class | Six months ended
January 31, 2021
(unaudited) | 2020 | 2019 | 2018 | 2017 | 2016 |
Net asset value, beginning of period
| $12.44 | $13.06 | $14.59 | $16.66 | $14.68 | $16.20 |
Net investment income
| 0.08 | 0.22 | 0.26 | 0.20 | 0.16 1 | 0.20 |
Net realized and unrealized gains (losses) on investments
| 2.32 | (0.54) | (0.14) | 1.30 | 1.94 | (0.41) |
Total from investment operations
| 2.40 | (0.32) | 0.12 | 1.50 | 2.10 | (0.21) |
| Distributions to shareholders from | | | | | | |
Net investment income
| (0.05) | (0.230) | (0.27) | (0.19) | (0.12) | (0.19) |
Net realized gains
| (0.26) | (0.07) | (1.38) | (3.38) | 0.00 | (1.12) |
Total distributions to shareholders
| (0.31) | (0.30) | (1.65) | (3.57) | (0.12) | (1.31) |
Net asset value, end of period
| $14.53 | $12.44 | $13.06 | $14.59 | $16.66 | $14.68 |
Total return2
| 19.35% | (2.41)% | 1.61% | 9.44% | 14.35% | (0.79)% |
| Ratios to average net assets (annualized) | | | | | | |
Gross expenses
| 0.92% | 0.91% | 0.89% | 0.86% | 1.01% | 1.16% |
Net expenses
| 0.75% | 0.75% | 0.75% | 0.75% | 0.87% | 0.93% |
Net investment income
| 1.11% | 1.71% | 1.93% | 1.37% | 1.01% | 1.35% |
| Supplemental data | | | | | | |
Portfolio turnover rate
| 222% | 366% | 221% | 258% | 221% | 50% |
Net assets, end of period (000s omitted)
| $13,483 | $11,813 | $13,854 | $16,744 | $18,296 | $24,164 |
| 1 | Calculated based upon average shares outstanding |
| 2 | Returns for periods of less than one year are not annualized. |
The accompanying notes are an integral part of these financial statements.
Wells Fargo Large Company Value Fund | 19
Financial highlights
(For a share outstanding throughout each period)
| | | Year ended July 31 |
| Institutional Class | Six months ended
January 31, 2021
(unaudited) | 2020 | 2019 | 2018 | 2017 | 2016 |
Net asset value, beginning of period
| $12.38 | $13.04 | $14.58 | $16.65 | $14.66 | $16.17 |
Net investment income
| 0.09 | 0.26 | 0.29 1 | 0.24 | 0.19 1 | 0.21 1 |
Net realized and unrealized gains (losses) on investments
| 2.32 | (0.55) | (0.14) | 1.30 | 1.94 | (0.38) |
Total from investment operations
| 2.41 | (0.29) | 0.15 | 1.54 | 2.13 | (0.17) |
| Distributions to shareholders from | | | | | | |
Net investment income
| (0.07) | (0.30) | (0.31) | (0.23) | (0.14) | (0.22) |
Net realized gains
| (0.26) | (0.07) | (1.38) | (3.38) | 0.00 | (1.12) |
Total distributions to shareholders
| (0.33) | (0.37) | (1.69) | (3.61) | (0.14) | (1.34) |
Net asset value, end of period
| $14.46 | $12.38 | $13.04 | $14.58 | $16.65 | $14.66 |
Total return2
| 19.52% | (2.20)% | 1.86% | 9.77% | 14.61% | (0.54)% |
| Ratios to average net assets (annualized) | | | | | | |
Gross expenses
| 0.67% | 0.66% | 0.63% | 0.62% | 0.74% | 0.91% |
Net expenses
| 0.50% | 0.50% | 0.50% | 0.50% | 0.61% | 0.74% |
Net investment income
| 1.34% | 1.96% | 2.14% | 1.60% | 1.21% | 1.52% |
| Supplemental data | | | | | | |
Portfolio turnover rate
| 222% | 366% | 221% | 258% | 221% | 50% |
Net assets, end of period (000s omitted)
| $3,060 | $2,142 | $2,948 | $17,606 | $16,321 | $9,343 |
| 1 | Calculated based upon average shares outstanding |
| 2 | Returns for periods of less than one year are not annualized. |
The accompanying notes are an integral part of these financial statements.
20 | Wells Fargo Large Company Value Fund
Notes to financial statements (unaudited)
1. ORGANIZATION
Wells Fargo Funds Trust (the “Trust”), a Delaware statutory trust organized on March 10, 1999, is an open-end management investment company registered under the Investment Company Act of 1940, as amended (the “1940 Act”). As an investment company, the Trust follows the accounting and reporting guidance in Financial Accounting Standards Board (“FASB”) Accounting Standards Codification Topic 946, Financial Services – Investment Companies. These financial statements report on the Wells Fargo Large Company Value Fund (the “Fund”) which is a diversified series of the Trust.
2. SIGNIFICANT ACCOUNTING POLICIES
The following significant accounting policies, which are consistently followed in the preparation of the financial statements of the Fund, are in conformity with U.S. generally accepted accounting principles which require management to make estimates and assumptions that affect the reported amounts of assets and liabilities, disclosure of contingent assets and liabilities at the date of the financial statements, and the reported amounts of income and expenses during the reporting period. Actual results could differ from those estimates.
Securities valuation
All investments are valued each business day as of the close of regular trading on the New York Stock Exchange (generally 4 p.m. Eastern Time), although the Fund may deviate from this calculation time under unusual or unexpected circumstances.
Equity securities and futures contracts that are listed on a foreign or domestic exchange or market are valued at the official closing price or, if none, the last sales price. If no sale occurs on the principal exchange or market that day, a fair value price will be determined in accordance with the Fund’s Valuation Procedures.
Investments in registered open-end investment companies are valued at net asset value. Interests in non-registered investment companies that are redeemable at net asset value are fair valued normally at net asset value.
Investments which are not valued using any of the methods discussed above are valued at their fair value, as determined in good faith by the Board of Trustees. The Board of Trustees has established a Valuation Committee comprised of the Trustees and has delegated to it the authority to take any actions regarding the valuation of portfolio securities that the Valuation Committee deems necessary or appropriate, including determining the fair value of portfolio securities, unless the determination has been delegated to the Wells Fargo Asset Management Pricing Committee at Wells Fargo Funds Management, LLC (“Funds Management”). The Board of Trustees retains the authority to make or ratify any valuation decisions or approve any changes to the Valuation Procedures as it deems appropriate. On a quarterly basis, the Board of Trustees receives reports on any valuation actions taken by the Valuation Committee or the Wells Fargo Asset Management Pricing Committee which may include items for ratification.
Securities lending
The Fund may lend its securities from time to time in order to earn additional income in the form of fees or interest on securities received as collateral or the investment of any cash received as collateral. When securities are on loan, the Fund receives interest or dividends on those securities. Cash collateral received in connection with its securities lending transactions is invested in Securities Lending Cash Investments, LLC (the “Securities Lending Fund”). Investments in Securities Lending Fund are valued at the evaluated bid price provided by an independent pricing service. Income earned from investment in the Securities Lending Fund (net of fees and rebates), if any, is included in income from affiliated securities on the Statement of Operations.
In a securities lending transaction, the net asset value of the Fund is affected by an increase or decrease in the value of the securities loaned and by an increase or decrease in the value of the instrument in which collateral is invested. The amount of securities lending activity undertaken by the Fund fluctuates from time to time. The Fund has the right under the lending agreement to recover the securities from the borrower on demand. In the event of default or bankruptcy by the borrower, the Fund may be prevented from recovering the loaned securities or gaining access to the collateral or may experience delays or costs in doing so. In such an event, the terms of the agreement allow the unaffiliated securities lending agent to use the collateral to purchase replacement securities on behalf of the Fund or pay the Fund the market value of the loaned securities. The Fund bears the risk of loss with respect to depreciation of its investment of the cash collateral.
Futures contracts
Futures contracts are agreements between the Fund and a counterparty to buy or sell a specific amount of a commodity, financial instrument or currency at a specified price and on a specified date. The Fund may buy and sell futures contracts in order to gain exposure to, or protect against, changes in security values and is subject to equity price risk. The primary risks associated with the use of futures contracts are the imperfect correlation between changes in market values of securities held
Wells Fargo Large Company Value Fund | 21
Notes to financial statements (unaudited)
by the Fund and the prices of futures contracts, and the possibility of an illiquid market. Futures contracts are generally entered into on a regulated futures exchange and cleared through a clearinghouse associated with the exchange. With futures contracts, there is minimal counterparty risk to the Fund since futures contracts are exchange traded and the exchange’s clearinghouse, as the counterparty to all exchange traded futures, guarantees the futures contracts against default.
Upon entering into a futures contracts, the Fund is required to deposit either cash or securities (initial margin) with the broker in an amount equal to a certain percentage of the contract value. Subsequent payments (variation margin) are paid to or from the broker each day equal to the daily changes in the contract value. Such payments are recorded as unrealized gains or losses and, if any, shown as variation margin receivable (payable) in the Statement of Assets and Liabilities. Should the Fund fail to make requested variation margin payments, the broker can gain access to the initial margin to satisfy the Fund’s payment obligations. When the contracts are closed, a realized gain or loss is recorded in the Statement of Operations.
Security transactions and income recognition
Securities transactions are recorded on a trade date basis. Realized gains or losses are recorded on the basis of identified cost.
Dividend income is recognized on the ex-dividend date.
Distributions to shareholders
Distributions to shareholders are recorded on the ex-dividend date and paid from net investment income quarterly and any net realized gains are paid at least annually. Such distributions are determined in accordance with income tax regulations and may differ from U.S. generally accepted accounting principles. Dividend sources are estimated at the time of declaration. The tax character of distributions is determined as of the Fund’s fiscal year end. Therefore, a portion of the Fund’s distributions made prior to the Fund’s fiscal year end may be categorized as a tax return of capital at year end.
Federal and other taxes
The Fund intends to continue to qualify as a regulated investment company by distributing substantially all of its investment company taxable income and any net realized capital gains (after reduction for capital loss carryforwards) sufficient to relieve it from all, or substantially all, federal income taxes. Accordingly, no provision for federal income taxes was required.
The Fund’s income and federal excise tax returns and all financial records supporting those returns for the prior three fiscal years are subject to examination by the federal and Delaware revenue authorities. Management has analyzed the Fund’s tax positions taken on federal, state, and foreign tax returns for all open tax years and does not believe that there are any uncertain tax positions that require recognition of a tax liability.
As of January 31, 2021, the aggregate cost of all investments for federal income tax purposes was $204,920,492 and the unrealized gains (losses) consisted of:
| Gross unrealized gains | $16,870,538 |
| Gross unrealized losses | (6,522,283) |
| Net unrealized gains | $10,348,255 |
As of July 31, 2020, the Fund had current year net deferred post-October capital losses consisting of $8,701,143 in short-term losses which was recognized on the first day of the current fiscal year.
Class allocations
The separate classes of shares offered by the Fund differ principally in applicable sales charges, distribution, shareholder servicing, and administration fees. Class specific expenses are charged directly to that share class. Investment income, common fund-level expenses, and realized and unrealized gains (losses) on investments are allocated daily to each class of shares based on the relative proportion of net assets of each class.
22 | Wells Fargo Large Company Value Fund
Notes to financial statements (unaudited)
3. FAIR VALUATION MEASUREMENTS
Fair value measurements of investments are determined within a framework that has established a fair value hierarchy based upon the various data inputs utilized in determining the value of the Fund’s investments. The three-level hierarchy gives the highest priority to unadjusted quoted prices in active markets for identical assets or liabilities (Level 1) and the lowest priority to unobservable inputs (Level 3). The Fund’s investments are classified within the fair value hierarchy based on the lowest level of input that is significant to the fair value measurement. The inputs are summarized into three broad levels as follows:
| ■ | Level 1 – quoted prices in active markets for identical securities |
| ■ | Level 2 – other significant observable inputs (including quoted prices for similar securities, interest rates, prepayment speeds, credit risk, etc.) |
| ■ | Level 3 – significant unobservable inputs (including the Fund’s own assumptions in determining the fair value of investments) |
The inputs or methodologies used for valuing investments in securities are not necessarily an indication of the risk associated with investing in those securities.
The following is a summary of the inputs used in valuing the Fund’s assets and liabilities as of January 31, 2021:
| | Quoted prices
(Level 1) | Other significant
observable inputs
(Level 2) | Significant
unobservable inputs
(Level 3) | Total |
| Assets | | | | |
| Investments in: | | | | |
| Common stocks | | | | |
| Communication services | $ 15,613,873 | $0 | $0 | $ 15,613,873 |
| Consumer discretionary | 19,715,669 | 0 | 0 | 19,715,669 |
| Consumer staples | 17,630,900 | 0 | 0 | 17,630,900 |
| Energy | 9,039,180 | 0 | 0 | 9,039,180 |
| Financials | 40,532,693 | 0 | 0 | 40,532,693 |
| Health care | 29,600,492 | 0 | 0 | 29,600,492 |
| Industrials | 24,179,619 | 0 | 0 | 24,179,619 |
| Information technology | 25,368,480 | 0 | 0 | 25,368,480 |
| Materials | 12,029,387 | 0 | 0 | 12,029,387 |
| Real estate | 8,840,917 | 0 | 0 | 8,840,917 |
| Utilities | 7,809,032 | 0 | 0 | 7,809,032 |
| Short-term investments | | | | |
| Investment companies | 4,886,213 | 0 | 0 | 4,886,213 |
| | 215,246,455 | 0 | 0 | 215,246,455 |
| Futures contracts | 22,292 | 0 | 0 | 22,292 |
| Total assets | $215,268,747 | $0 | $0 | $215,268,747 |
Futures contracts are reported at their cumulative unrealized gains (losses) at measurement date as reported in the table following the Portfolio of Investments. For futures contracts, the current day’s variation margin is reported on the Statement of Assets and Liabilities. All other assets and liabilities are reported at their market value at measurement date.
Additional sector, industry or geographic detail, if any, is included in the Portfolio of Investments.
For the six months ended January 31, 2021, the Fund did not have any transfers into/out of Level 3.
4. TRANSACTIONS WITH AFFILIATES
Management fee
Funds Management, an indirect wholly owned subsidiary of Wells Fargo & Company (“Wells Fargo”), is the manager of the Fund and provides advisory and fund-level administrative services under an investment management agreement. Under the investment management agreement, Funds Management is responsible for, among other services, implementing the investment objectives and strategies of the Fund, supervising the subadviser and providing fund-level administrative services in
Wells Fargo Large Company Value Fund | 23
Notes to financial statements (unaudited)
connection with the Fund’s operations. As compensation for its services under the investment management agreement, Funds Management is entitled to receive a management fee at the following annual rate based on the Fund’s average daily net assets:
| Average daily net assets | Management fee |
| First $1 billion | 0.400% |
| Next $4 billion | 0.375 |
| Next $5 billion | 0.340 |
| Over $10 billion | 0.330 |
For the six months ended January 31, 2021, the management fee was equivalent to an annual rate of 0.40% of the Fund’s average daily net assets.
Funds Management has retained the services of a subadviser to provide daily portfolio management to the Fund. The fee for subadvisory services is borne by Funds Management. Wells Capital Management Incorporated ("WellsCap"), an affiliate of Funds Management and an indirect wholly owned subsidiary of Wells Fargo, is the subadviser to the Fund and is entitled to receive a fee from Funds Management at an annual rate starting at 0.25% and declining to 0.15% as the average daily net assets of the Fund increase.
Administration fees
Under a class-level administration agreement, Funds Management provides class-level administrative services to the Fund, which includes paying fees and expenses for services provided by the transfer agent, sub-transfer agents, omnibus account servicers and record-keepers. As compensation for its services under the class-level administration agreement, Funds Management receives an annual fee which is calculated based on the average daily net assets of each class as follows:
| | Class-level
administration fee |
| Class A | 0.21% |
| Class C | 0.21 |
| Class R6 | 0.03 |
| Administrator Class | 0.13 |
| Institutional Class | 0.13 |
Waivers and/or expense reimbursements
Funds Management has contractually waived and/or reimbursed management and administration fees to the extent necessary to maintain certain net operating expense ratios for the Fund. When each class of the Fund has exceeded its expense cap, Funds Management has waived fees and/or reimbursed expenses from fund-level expenses on a proportionate basis and then from class specific expenses. When only certain classes exceed their expense caps, waivers and/or reimbursements are applied against class specific expenses before fund-level expenses. Funds Management has committed through November 30, 2021 to waive fees and/or reimburse expenses to the extent necessary to cap expenses. Prior to or after the commitment expiration date, the cap may be increased or the commitment to maintain the cap may be terminated only with the approval of the Board of Trustees. The expense caps are as follows:
| | Expense ratio caps |
| Class A | 0.83% |
| Class C | 1.58 |
| Class R6 | 0.40 |
| Administrator Class | 0.75 |
| Institutional Class | 0.50 |
Distribution fee
The Trust has adopted a distribution plan for Class C shares of the Fund pursuant to Rule 12b-1 under the 1940 Act. A distribution fee is charged charged to Class C shares and paid to Wells Fargo Funds Distributor, LLC (“Funds Distributor”), the principal underwriter, at an annual rate of 0.75% of the average daily net assets of Class C shares.
24 | Wells Fargo Large Company Value Fund
Notes to financial statements (unaudited)
In addition, Funds Distributor is entitled to receive the front-end sales charge from the purchase of Class A shares and a contingent deferred sales charge on the redemption of certain Class A shares. Funds Distributor is also entitled to receive the contingent deferred sales charges from redemptions of Class C shares. For the six months ended January 31, 2021, Funds Distributor received $690 from the sale of Class A shares. No contingent deferred sales charges were incurred by Class A and Class C shares for the six months ended January 31, 2021.
Shareholder servicing fees
The Trust has entered into contracts with one or more shareholder servicing agents, whereby Class A, Class C, and Administrator Class of the Fund are charged a fee at an annual rate of 0.25% of the average daily net assets of each respective class. A portion of these total shareholder servicing fees were paid to affiliates of Wells Fargo.
Interfund transactions
The Fund may purchase or sell portfolio investment securities to certain other Wells Fargo affiliates pursuant to Rule 17a-7 under the 1940 Act and under procedures adopted by the Board of Trustees. The procedures have been designed to ensure that these interfund transactions, which do not incur broker commissions, are effected at current market prices.
5. INVESTMENT PORTFOLIO TRANSACTIONS
Purchases and sales of investments, excluding U.S. government obligations (if any) and short-term securities, for the six months ended January 31, 2021 were $439,891,110 and $448,839,715, respectively.
6. SECURITIES LENDING TRANSACTIONS
The Fund lends its securities through an unaffiliated securities lending agent and receives collateral in the form of cash or securities with a value at least equal to the value of the securities on loan. The value of the loaned securities is determined at the close of each business day and any increases or decreases in the required collateral are exchanged between the Fund and the counterparty on the next business day. Cash collateral received is invested in the Securities Lending Fund which seeks to provide a positive return compared to the daily Federal Funds Open Rate by investing in high-quality, U.S. dollar-denominated short-term money market instruments and is exempt from registration under Section 3(c)(7) of the 1940 Act. Securities Lending Fund is managed by Funds Management and is subadvised by WellsCap. Funds Management receives an advisory fee starting at 0.05% and declining to 0.01% as the average daily net assets of the Securities Lending Fund increase. All of the fees received by Funds Management are paid to WellsCap for its services as subadviser.
In the event of counterparty default or the failure of a borrower to return a loaned security, the Fund has the right to use the collateral to offset any losses incurred. As of January 31, 2021, the Fund had securities lending transactions with the following counterparties which are subject to offset:
| Counterparty | Value of
securities on
loan | Collateral
received1 | Net amount |
| Bank of America Securities Inc. | $1,986,877 | $(1,986,877) | $0 |
1 Collateral received within this table is limited to the collateral for the net transaction with the counterparty.
7. DERIVATIVE TRANSACTIONS
During the six months ended January 31, 2021, the Fund entered into futures contracts to gain market exposure. The Fund had an average notional amount of $3,587,465 in long futures contracts during the six months ended January 31, 2021.
The fair value, realized gains or losses and change in unrealized gains or losses, if any, on derivative instruments are reflected in the corresponding financial statement captions.
8. BANK BORROWINGS
The Trust (excluding the money market funds), Wells Fargo Master Trust and Wells Fargo Variable Trust are parties to a $350,000,000 revolving credit agreement whereby the Fund is permitted to use bank borrowings for temporary or emergency purposes, such as to fund shareholder redemption requests. Interest under the credit agreement is charged to the Fund based on a borrowing rate equal to the higher of the Federal Funds rate in effect on that day plus 1.25% or the overnight LIBOR rate in effect on that day plus 1.25%. In addition, an annual commitment fee equal to 0.25% of the unused balance is allocated to each participating fund.
For the six months ended January 31, 2021, there were no borrowings by the Fund under the agreement.
Wells Fargo Large Company Value Fund | 25
Notes to financial statements (unaudited)
9. INDEMNIFICATION
Under the Fund's organizational documents, the officers and Trustees have been granted certain indemnification rights against certain liabilities that may arise out of performance of their duties to the Fund. The Fund has entered into a separate agreement with each Trustee that converts indemnification rights currently existing under the Fund’s organizational documents into contractual rights that cannot be changed in the future without the consent of the Trustee. Additionally, in the normal course of business, the Fund may enter into contracts with service providers that contain a variety of indemnification clauses. The Fund’s maximum exposure under these arrangements is dependent on future claims that may be made against the Fund and, therefore, cannot be estimated.
10. NEW ACCOUNTING PRONOUNCEMENT
In August 2018, FASB issued Accounting Standards Update (“ASU”) No. 2018-13, Fair Value Measurement (Topic 820) Disclosure Framework - Changes to the Disclosure Requirements for Fair Value Measurement. ASU 2018-13 updates the disclosure requirements on fair value measurements in Topic 820, Fair Value Measurements. The amendments are effective for fiscal years, and interim periods within those fiscal years, beginning after December 15, 2019. Management has adopted this guidance which did not have a material impact on the financial statements.
11. CORONAVIRUS (COVID-19) PANDEMIC
On March 11, 2020, the World Health Organization announced that it had made the assessment that coronavirus disease 2019 (“COVID-19”) is a pandemic. The impacts of COVID-19 are affecting the entire global economy, individual companies and investment products, the funds, and the market in general. There is significant uncertainty around the extent and duration of business disruptions related to COVID-19 and the impacts may be short term or may last for an extended period of time. The risk of further spreading of COVID-19 has led to significant uncertainty and volatility in the financial markets.
12. SUBSEQUENT EVENT
On February 23, 2021, Wells Fargo announced that it has entered into a definitive agreement to sell Wells Fargo Asset Management (“WFAM”) to GTCR LLC and Reverence Capital Partners, L.P. WFAM is the trade name used by the asset management businesses of Wells Fargo and includes Wells Fargo Funds Management, LLC, the investment manager to the Fund, Wells Capital Management Incorporated and Wells Fargo Asset Management (International) Limited, both registered investment advisers providing sub-advisory services to certain funds, and Wells Fargo Funds Distributor, LLC, the Fund’s principal underwriter. As part of the transaction, Wells Fargo will own a 9.9% equity interest and will continue to serve as an important client and distribution partner.
Consummation of the transaction will result in the automatic termination of the Fund’s investment management agreement and sub-advisory agreement. The Fund’s Board of Trustees will be asked to approve new investment management arrangements with the new company. If approved by the Board, the new investment management arrangements with the new company will be presented to the shareholders of the Fund for approval, and, if approved by shareholders, would take effect upon the closing of the transaction. The transaction is expected to close in the second half of 2021, subject to customary closing conditions.
26 | Wells Fargo Large Company Value Fund
Other information (unaudited)
PROXY VOTING INFORMATION
A description of the policies and procedures used to determine how to vote proxies relating to portfolio securities is available without charge, upon request, by calling 1-800-222-8222, visiting our website at wfam.com, or visiting the SEC website at sec.gov. Information regarding how the proxies related to portfolio securities were voted during the most recent 12-month period ended June 30 is available on the website at wfam.com or by visiting the SEC website at sec.gov.
QUARTERLY PORTFOLIO HOLDINGS INFORMATION
The Fund files its complete schedule of portfolio holdings with the SEC for the first and third quarters of each fiscal year as an exhibit to its reports on Form N-PORT. Shareholders may view the filed Form N-PORT by visiting the SEC website at sec.gov.
Wells Fargo Large Company Value Fund | 27
Other information (unaudited)
BOARD OF TRUSTEES AND OFFICERS
Each of the Trustees and Officers listed in the table below acts in identical capacities for each fund in the Wells Fargo family of funds, which consists of 144 mutual funds comprising the Wells Fargo Funds Trust, Wells Fargo Variable Trust, Wells Fargo Master Trust and four closed-end funds (collectively the “Fund Complex”). This table should be read in conjunction with the Prospectus and the Statement of Additional Information1. The mailing address of each Trustee and Officer is 525 Market Street, 12th Floor, San Francisco, CA 94105. Each Trustee and Officer serves an indefinite term, however, each Trustee serves such term until reaching the mandatory retirement age established by the Trustees.
Independent Trustees
Name and
year of birth | Position held and
length of service* | Principal occupations during past five years or longer | Current other
public company or
investment
company
directorships |
William R. Ebsworth
(Born 1957) | Trustee,
since 2015 | Retired. From 1984 to 2013, equities analyst, portfolio manager, research director and chief investment officer at Fidelity Management and Research Company in Boston, Tokyo, and Hong Kong, and retired in 2013 as Chief Investment Officer of Fidelity Strategic Advisers, Inc. where he led a team of investment professionals managing client assets. Prior thereto, Board member of Hong Kong Securities Clearing Co., Hong Kong Options Clearing Corp., the Thailand International Fund, Ltd., Fidelity Investments Life Insurance Company, and Empire Fidelity Investments Life Insurance Company. Audit Committee Chair and Investment Committee Chair of the Vincent Memorial Hospital Endowment (non-profit organization). Mr. Ebsworth is a CFA® charterholder. | N/A |
Jane A. Freeman
(Born 1953) | Trustee,
since 2015;
Chair Liaison,
since 2018 | Retired. From 2012 to 2014 and 1999 to 2008, Chief Financial Officer of Scientific Learning Corporation. From 2008 to 2012, Ms. Freeman provided consulting services related to strategic business projects. Prior to 1999, Portfolio Manager at Rockefeller & Co. and Scudder, Stevens & Clark. Board member of the Harding Loevner Funds from 1996 to 2014, serving as both Lead Independent Director and chair of the Audit Committee. Board member of the Russell Exchange Traded Funds Trust from 2011 to 2012 and the chair of the Audit Committee. Ms. Freeman is also an inactive Chartered Financial Analyst. | N/A |
Isaiah Harris, Jr.
(Born 1952) | Trustee,
since 2009; Audit
Committee
Chair,
since 2019 | Retired. Chairman of the Board of CIGNA Corporation since 2009, and Director since 2005. From 2003 to 2011, Director of Deluxe Corporation. Prior thereto, President and CEO of BellSouth Advertising and Publishing Corp. from 2005 to 2007, President and CEO of BellSouth Enterprises from 2004 to 2005 and President of BellSouth Consumer Services from 2000 to 2003. Emeritus member of the Iowa State University Foundation Board of Governors. Emeritus Member of the Advisory Board of Iowa State University School of Business. Advisory Board Member, Palm Harbor Academy (private school). Mr. Harris is a certified public accountant (inactive status). | CIGNA Corporation |
Judith M. Johnson
(Born 1949) | Trustee,
since 2008 | Retired. Prior thereto, Chief Executive Officer and Chief Investment Officer of Minneapolis Employees Retirement Fund from 1996 to 2008. Ms. Johnson is an attorney, certified public accountant and a certified managerial accountant. | N/A |
David F. Larcker
(Born 1950) | Trustee,
since 2009 | James Irvin Miller Professor of Accounting at the Graduate School of Business (Emeritus), Stanford University, Director of the Corporate Governance Research Initiative and Senior Faculty of The Rock Center for Corporate Governance since 2006. From 2005 to 2008, Professor of Accounting at the Graduate School of Business, Stanford University. Prior thereto, Ernst & Young Professor of Accounting at The Wharton School, University of Pennsylvania from 1985 to 2005. | N/A |
28 | Wells Fargo Large Company Value Fund
Other information (unaudited)
Name and
year of birth | Position held and
length of service* | Principal occupations during past five years or longer | Current other
public company or
investment
company
directorships |
Olivia S. Mitchell
(Born 1953) | Trustee,
since 2006;
Nominating and
Governance
Committee Chair,
since 2018 | International Foundation of Employee Benefit Plans Professor, Wharton School of the University of Pennsylvania since 1993. Director of Wharton’s Pension Research Council and Boettner Center on Pensions & Retirement Research, and Research Associate at the National Bureau of Economic Research. Previously, Cornell University Professor from 1978 to 1993. | N/A |
Timothy J. Penny
(Born 1951) | Trustee,
since 1996;
Chair,
since 2018 | President and Chief Executive Officer of Southern Minnesota Initiative Foundation, a non-profit organization, since 2007. Member of the Board of Trustees of NorthStar Education Finance, Inc., a non-profit organization, since 2007. | N/A |
James G. Polisson
(Born 1959) | Trustee,
since 2018 | Retired. Chief Marketing Officer, Source (ETF) UK Services, Ltd, from 2015 to 2017. From 2012 to 2015, Principal of The Polisson Group, LLC, a management consulting, corporate advisory and principal investing company. Chief Executive Officer and Managing Director at Russell Investments, Global Exchange Traded Funds from 2010 to 2012. Managing Director of Barclays Global Investors from 1998 to 2010 and Global Chief Marketing Officer for iShares and Barclays Global Investors from 2000 to 2010. Trustee of the San Francisco Mechanics’ Institute, a non-profit organization, from 2013 to 2015. Board member of the Russell Exchange Traded Fund Trust from 2011 to 2012. Director of Barclays Global Investors Holdings Deutschland GmbH from 2006 to 2009. Mr. Polisson is an attorney and has a retired status with the Massachusetts and District of Columbia Bar Associations. | N/A |
Pamela Wheelock
(Born 1959) | Trustee,
since January
2020; previously
Trustee from
January 2018 to
July 2019 | Board member of the Destination Medical Center Economic Development Agency, Rochester, Minnesota since 2019. Interim President of the McKnight Foundation from January to September 2020. Acting Commissioner, Minnesota Department of Human Services, July 2019 through September 2019. Human Services Manager (part-time), Minnesota Department of Human Services, October 2019 through December 2019. Chief Operating Officer, Twin Cities Habitat for Humanity from 2017 to 2019. Vice President of University Services, University of Minnesota from 2012 to 2016. Prior thereto, on the Board of Directors, Governance Committee and Finance Committee for the Minnesota Philanthropy Partners (Saint Paul Foundation) from 2012 to 2018, Interim Chief Executive Officer of Blue Cross Blue Shield of Minnesota from 2011 to 2012, Chairman of the Board from 2009 to 2012 and Board Director from 2003 to 2015. Vice President, Leadership and Community Engagement, Bush Foundation, Saint Paul, Minnesota (a private foundation) from 2009 to 2011. Executive Vice President and Chief Financial Officer, Minnesota Sports and Entertainment from 2004 to 2009 and Senior Vice President from 2002 to 2004. Executive Vice President of the Minnesota Wild Foundation from 2004 to 2008. Commissioner of Finance, State of Minnesota, from 1999 to 2002. Currently Board Chair of the Minnesota Wild Foundation since 2010. | N/A |
* Length of service dates reflect the Trustee’s commencement of service with the Trust’s predecessor entities, where applicable.
Wells Fargo Large Company Value Fund | 29
Other information (unaudited)
Officers
Name and
year of birth | Position held and
length of service | Principal occupations during past five years or longer |
Andrew Owen
(Born 1960) | President,
since 2017 | Executive Vice President of Wells Fargo & Company and Head of Affiliated Managers, Wells Fargo Asset Management, since 2014. In addition, Mr. Owen is currently President, Chief Executive Officer and Director of Wells Fargo Funds Management, LLC since 2017. Prior thereto, Executive Vice President responsible for marketing, investments and product development for Wells Fargo Funds Management, LLC, from 2009 to 2014. |
Jeremy DePalma
(Born 1974) | Treasurer,
since 2012
(for certain funds in
the Fund Complex);
since 2021 (for
the remaining funds in the
Fund Complex) | Senior Vice President of Wells Fargo Funds Management, LLC since 2009. Senior Vice President of Evergreen Investment Management Company, LLC from 2008 to 2010 and head of the Fund Reporting and Control Team within Fund Administration from 2005 to 2010. |
Michelle Rhee
(Born 1966) | Chief Legal Officer,
since 2019 | Secretary of Wells Fargo Funds Management, LLC and Chief Legal Counsel of Wells Fargo Asset Management since 2018. Deputy General Counsel of Wells Fargo Bank, N.A. since 2020 and Assistant General Counsel of Wells Fargo Bank, N.A. from 2018 to 2020. Associate General Counsel and Managing Director of Bank of America Corporation from 2004 to 2018. |
Catherine Kennedy
(Born 1969) | Secretary,
since 2019 | Vice President of Wells Fargo Funds Management, LLC and Senior Counsel of the Wells Fargo Legal Department since 2010. Vice President and Senior Counsel of Evergreen Investment Management Company, LLC from 1998 to 2010. |
Michael H. Whitaker
(Born 1967) | Chief Compliance Officer,
since 2016 | Chief Compliance Officer of Wells Fargo Asset Management since 2016. Senior Vice President and Chief Compliance Officer for Fidelity Investments from 2007 to 2016. |
1 The Statement of Additional Information includes additional information about the Trustees and is available, without charge, upon request, by calling 1-800-222-8222 or by visiting the website at wfam.com.
30 | Wells Fargo Large Company Value Fund
For more information
More information about Wells Fargo Funds is available free upon request. To obtain literature, please write, visit the Fund's website, or call:
Wells Fargo Funds
P.O. Box 219967
Kansas City, MO 64121-9967
Website: wfam.com
Individual investors: 1-800-222-8222
Retail investment professionals: 1-888-877-9275
Institutional investment professionals: 1-866-765-0778
This report and the financial statements contained herein are submitted for the general information of the shareholders of the Fund. If this report is used for promotional purposes, distribution of the report must be accompanied or preceded by a current prospectus. Before investing, please consider the investment objectives, risks, charges, and expenses of the investment. For a current prospectus and, if available, a summary prospectus, containing this information, call 1-800-222-8222 or visit the Fund’s website at wfam.com. Read the prospectus carefully before you invest or send money.
Wells Fargo Asset Management (WFAM) is the trade name for certain investment advisory/management firms owned by Wells Fargo & Company. These firms include but are not limited to Wells Capital Management Incorporated and Wells Fargo Funds Management, LLC. Certain products managed by WFAM entities are distributed by Wells Fargo Funds Distributor, LLC (a broker-dealer and Member FINRA).
This material is for general informational and educational purposes only and is NOT intended to provide investment advice or a recommendation of any kind— including a recommendation for any specific investment, strategy, or plan.
INVESTMENT PRODUCTS: NOT FDIC INSURED ■ NO BANK GUARANTEE ■ MAY LOSE VALUE
© 2021 Wells Fargo & Company. All rights reserved.
PAR-0221-00371 03-22
SA210/SAR210 01-21
Semi-Annual Report
January 31, 2021
Wells Fargo
Low Volatility U.S. Equity Fund
Reduce clutter.
Save trees.
Sign up for electronic delivery of prospectuses and shareholder reports at wellsfargo.com/ advantagedelivery
The views expressed and any forward-looking statements are as of January 31, 2021, unless otherwise noted, and are those of the Fund's portfolio managers and/or Wells Fargo Asset Management. Discussions of individual securities or the markets generally are not intended as individual recommendations. Future events or results may vary significantly from those expressed in any forward-looking statements. The views expressed are subject to change at any time in response to changing circumstances in the market. Wells Fargo Asset Management and the Fund disclaim any obligation to publicly update or revise any views expressed or forward-looking statements.
INVESTMENT PRODUCTS: NOT FDIC INSURED ■ NO BANK GUARANTEE ■ MAY LOSE VALUE
Letter to shareholders (unaudited)
Dear Shareholder:
We are pleased to offer you this semi-annual report for the Wells Fargo Low Volatility U.S. Equity Fund for the six-month period that ended January 31, 2021. Despite a deeply challenging year, dominated by the spread of COVID-19 cases and a sharp drop in economic output throughout much of the world, global stocks performed extremely well, benefiting from ongoing central bank support and rising optimism over the development and distribution of effective COVID-19 vaccines. Bonds also had positive returns, led by global bonds and high-yield bonds.
For the six-month period, U.S. stocks, based on the S&P 500 Index1, gained 14.47%. International stocks, as measured by the MSCI ACWI ex USA Index (Net)2, returned 19.28%, while the MSCI EM Index (Net)3, had stronger performance, with a 24.07% gain. Among bond indexes, the Bloomberg Barclays U.S. Aggregate Bond Index4 returned -0.91%, the Bloomberg Barclays Global Aggregate ex-USD Index (unhedged)5 gained 3.71%, and the Bloomberg Barclays Municipal Bond Index6 returned 2.01% while the ICE BofA U.S. High Yield Index7 returned 6.82%.
The stock market rally continued in August.
The stock market continued a months-long rally in August despite concerns over rising numbers of U.S. and European COVID-19 cases. Relatively strong second-quarter earnings boosted investor sentiment along with the U.S. Federal Reserve’s announcement of a monetary policy shift expected to support longer-term low interest rates. U.S. manufacturing and services activity indexes beat expectations, while the U.S. housing market maintained strength. In Europe, retail sales expanded and consumer confidence was steady. China’s economy continued to expand.
Stocks grew more volatile in September on mixed economic data. U.S. economic activity continued to grow. However, U.S. unemployment remained elevated at 7.9% in September. With U.S. Congress delaying further fiscal relief and uncertainties surrounding a possible vaccine, doubts crept back into the financial markets. In the U.K., a lack of progress in Brexit talks weighed on markets. China’s economy picked up steam, fueled by increased global demand.
Andrew Owen
President
Wells Fargo Funds
“The stock market continued a months-long rally in August despite concerns over rising numbers of U.S. and European COVID-19 cases.”
| 1 | The S&P 500 Index consists of 500 stocks chosen for market size, liquidity, and industry group representation. It is a market-value-weighted index with each stock's weight in the index proportionate to its market value. You cannot invest directly in an index. |
| 2 | The Morgan Stanley Capital International (MSCI) All Country World Index (ACWI) ex USA Index (Net) is a free-float-adjusted market-capitalization-weighted index that is designed to measure the equity market performance of developed and emerging markets, excluding the United States. Source: MSCI. MSCI makes no express or implied warranties or representations and shall have no liability whatsoever with respect to any MSCI data contained herein. The MSCI data may not be further redistributed or used as a basis for other indices or any securities or financial products. This report is not approved, reviewed, or produced by MSCI. You cannot invest directly in an index. |
| 1 | The S&P 500 Index consists of 500 stocks chosen for market size, liquidity, and industry group representation. It is a market-value-weighted index with each stock's weight in the index proportionate to its market value. You cannot invest directly in an index. |
| 3 | The MSCI Emerging Markets (EM) Index (Net) is a free-float-adjusted market-capitalization-weighted index that is designed to measure equity market performance of emerging markets. You cannot invest directly in an index. |
| 1 | The S&P 500 Index consists of 500 stocks chosen for market size, liquidity, and industry group representation. It is a market-value-weighted index with each stock's weight in the index proportionate to its market value. You cannot invest directly in an index. |
| 4 | The Bloomberg Barclays U.S. Aggregate Bond Index is a broad-based benchmark that measures the investment-grade, U.S. dollar-denominated, fixed-rate taxable bond market, including Treasuries, government-related and corporate securities, mortgage-backed securities (agency fixed-rate and hybrid adjustable-rate mortgage pass-throughs), asset-backed securities, and commercial mortgage-backed securities. You cannot invest directly in an index. |
| 1 | The S&P 500 Index consists of 500 stocks chosen for market size, liquidity, and industry group representation. It is a market-value-weighted index with each stock's weight in the index proportionate to its market value. You cannot invest directly in an index. |
| 5 | The Bloomberg Barclays Global Aggregate ex-USD Index (unhedged) is an unmanaged index that provides a broad-based measure of the global investment-grade fixed-income markets excluding the U.S. dollar-denominated debt market. You cannot invest directly in an index. |
| 1 | The S&P 500 Index consists of 500 stocks chosen for market size, liquidity, and industry group representation. It is a market-value-weighted index with each stock's weight in the index proportionate to its market value. You cannot invest directly in an index. |
| 6 | The Bloomberg Barclays Municipal Bond Index is an unmanaged index composed of long-term tax-exempt bonds with a minimum credit rating of Baa. You cannot invest directly in an index. |
| 1 | The S&P 500 Index consists of 500 stocks chosen for market size, liquidity, and industry group representation. It is a market-value-weighted index with each stock's weight in the index proportionate to its market value. You cannot invest directly in an index. |
| 7 | The ICE BofA U.S. High Yield Index is a market-capitalization-weighted index of domestic and Yankee high-yield bonds. The index tracks the performance of high-yield securities traded in the U.S. bond market. You cannot invest directly in an index. Copyright 2021. ICE Data Indices, LLC. All rights reserved. |
2 | Wells Fargo Low Volatility U.S. Equity Fund
Letter to shareholders (unaudited)
In October, capital markets stepped back from their six-month rally. Market volatility rose in advance of the U.S. election and amid a global increase in COVID-19 infections. Europe introduced tighter restrictions affecting economic activity. U.S. markets looked favorably at the prospect of Democratic control of the federal purse strings, which could lead to additional fiscal stimulus and a boost to economic activity. Meanwhile, China reported 4.9% third-quarter GDP growth.
Global stocks rallied in November, propelled by optimism over three promising COVID-19 vaccines. Reversing recent trends, value stocks outperformed growth stocks and cyclical stocks outpaced technology stocks. However, U.S. unemployment remained elevated, with a net job loss of 10 million since February. The eurozone services purchasing managers’ index contracted sharply while the region’s manufacturing activity grew. The U.S. election results added to the upbeat mood as investors anticipated more consistent policies in the new administration.
Financial markets ended the year with strength on high expectations for a rapid rollout of the COVID-19 vaccines, the successful passage of a $900 billion stimulus package, and rising expectations of additional economic support from a Democratic-led Congress. U.S. economic data were mixed with still-elevated unemployment and weak retail sales but growth in manufacturing output. In contrast, China’s economic expansion continued in both manufacturing and nonmanufacturing. U.S. COVID-19 infection rates continued to rise even as new state and local lockdown measures were implemented.
The year 2021 began with emerging market stocks leading all major asset classes in January, driven by China’s strong economic growth and a broad recovery in corporate earnings, which propelled China’s stock market higher. In the United States, positive news on vaccine trials and January expansion in both the manufacturing and services sectors was offset by a weak December monthly jobs report. This was compounded by technical factors as some hedge funds were forced to sell stocks to protect themselves against a well-publicized short squeeze coordinated by a group of retail investors. Eurozone sentiment and economic growth were particularly weak, reflecting the impact of a new lockdown with stricter social distancing along with a slow vaccine rollout.
Don’t let short-term uncertainty derail long-term investment goals.
Periods of investment uncertainty can present challenges, but experience has taught us that maintaining long-term investment goals can be an effective way to plan for the future. To help you create a sound strategy based on your personal goals and risk tolerance, Wells Fargo Funds offers more than 100 mutual funds spanning a wide range of asset classes and investment styles. Although diversification cannot guarantee an investment profit or prevent losses, we believe it can be an effective way to manage investment risk and potentially smooth out overall portfolio performance. We encourage investors to know their investments and to understand that appropriate levels of risk-taking may unlock opportunities.
Thank you for choosing to invest with Wells Fargo Funds. We appreciate your confidence in us and remain committed to helping you meet your financial needs.
Sincerely,
Andrew Owen
President
Wells Fargo Funds
“Global stocks rallied in November, propelled by optimism over three promising COVID-19 vaccines.”
For further information about your Fund, contact your investment professional, visit our website at wfam.com, or call us directly at 1-800-222-8222.
Wells Fargo Low Volatility U.S. Equity Fund | 3
Performance highlights (unaudited)
Investment objective
The Fund seeks long-term capital appreciation.
Manager
Wells Fargo Funds Management, LLC
Subadviser
Wells Capital Management Incorporated
Portfolio managers
Dennis Bein, CFA®‡
Ryan Brown, CFA®‡
Harindra de Silva, Ph.D., CFA®‡
Average annual total returns (%) as of January 31, 2021
| | | Including sales charge | | Excluding sales charge | | Expense ratios(%) |
| | Inception date | 1 year | Since
inception | | 1 year | Since
inception | | Gross | Net |
| Class A (WLVLX) | 10-31-2016 | -5.51 | 7.81 | | 0.24 | 9.32 | | 1.33 | 0.73 |
| Class C (WLVKX) | 10-31-2016 | -1.46 | 8.52 | | -0.46 | 8.52 | | 2.08 | 1.48 |
| Class R6 (WLVJX) | 10-31-2016 | - | - | | 0.65 | 9.77 | | 0.90 | 0.30 |
| Administrator Class (WLVDX) | 10-31-2016 | - | - | | 0.35 | 9.40 | | 1.25 | 0.65 |
| Institutional Class (WLVOX) | 10-31-2016 | - | - | | 0.49 | 9.66 | | 1.00 | 0.40 |
| Russell 1000® Index | - | - | - | | 19.84 | 16.79* | | - | - |
* Based on inception date of the oldest Fund class.
Figures quoted represent past performance, which is no guarantee of future results, and do not reflect taxes that a shareholder may pay on an investment in a fund. Investment return and principal value of an investment will fluctuate so that an investor’s shares, when redeemed, may be worth more or less than their original cost. Performance shown without sales charges would be lower if sales charges were reflected. Current performance may be lower or higher than the performance data quoted, which assumes the reinvestment of dividends and capital gains. Current month-end performance is available on the Fund’s website, wfam.com.
Index returns do not include transaction costs associated with buying and selling securities, any mutual fund fees or expenses, or any taxes. It is not possible to invest directly in an index.
For Class A shares, the maximum front-end sales charge is 5.75%. For Class C shares, the maximum contingent deferred sales charge is 1.00%. Performance including a contingent deferred sales charge assumes the sales charge for the corresponding time period. Class R6, Administrator Class, and Institutional Class shares are sold without a front-end sales charge or contingent deferred sales charge.
Stock values fluctuate in response to the activities of individual companies and general market and economic conditions. Certain investment strategies tend to increase the total risk of an investment (relative to the broader market). The Fund is exposed to smaller-company securities risk. Consult the Fund’s prospectus for additional information on these and other risks.
Please see footnotes on page 5.
4 | Wells Fargo Low Volatility U.S. Equity Fund
Performance highlights (unaudited)
| Ten largest holdings (%) as of January 31, 20214 |
| Berkshire Hathaway Incorporated Class B | 2.30 |
| The Coca-Cola Company | 2.10 |
| The Kroger Company | 1.91 |
| The Sherwin-Williams Company | 1.87 |
| Johnson & Johnson | 1.84 |
| Verizon Communications Incorporated | 1.81 |
| AT&T Incorporated | 1.77 |
| Linde plc | 1.76 |
| Garmin Limited | 1.75 |
| McDonald's Corporation | 1.74 |
| Sector allocation as of January 31, 20215 |
| ‡ | CFA® and Chartered Financial Analyst® are trademarks owned by CFA Institute. |
| 1 | Reflects the expense ratios as stated in the most recent prospectuses. The expense ratios shown are subject to change and may differ from the annualized expense ratios shown in the financial highlights of this report. |
| 2 | The manager has contractually committed through November 30, 2021, to waive fees and/or reimburse expenses to the extent necessary to cap total annual fund operating expenses after fee waivers at 0.73% for Class A, 1.48% for Class C, 0.30% for Class R6, 0.65% for Administrator Class, and 0.40% for Institutional Class. Brokerage commissions, stamp duty fees, interest, taxes, acquired fund fees and expenses (if any), and extraordinary expenses are excluded from the expense caps. Prior to or after the commitment expiration date, the caps may be increased or the commitment to maintain the caps may be terminated only with the approval of the Board of Trustees. Without these caps, the Fund’s returns would have been lower. The expense ratio paid by an investor is the net expense ratio (the total annual fund operating expenses after fee waivers) as stated in the prospectuses. |
| 3 | The Russell 1000® Index measures the performance of the largest 1,000 companies in the Russell 3000® Index, which represents approximately 92% of the total market capitalization of the Russell 3000® Index. You cannot invest directly in an index. |
| 4 | Figures represent the percentage of the Fund's net assets. Holdings are subject to change and may have changed since the date specified. |
| 5 | Figures represent the percentage of the Fund's long-term investments. These amounts are subject to change and may have changed since the date specified. |
Wells Fargo Low Volatility U.S. Equity Fund | 5
Fund expenses (unaudited)
As a shareholder of the Fund, you incur two types of costs: (1) transaction costs, including sales charges (loads) on purchase payments and contingent deferred sales charges (if any) on redemptions and (2) ongoing costs, including management fees, distribution (12b-1) and/or shareholder servicing fees, and other Fund expenses. This example is intended to help you understand your ongoing costs (in dollars) of investing in the Fund and to compare these costs with the ongoing costs of investing in other mutual funds.
The example is based on an investment of $1,000 invested at the beginning of the six-month period and held for the entire period from August 1, 2020 to January 31, 2021.
Actual expenses
The “Actual” line of the table below provides information about actual account values and actual expenses. You may use the information in this line, together with the amount you invested, to estimate the expenses that you paid over the period. Simply divide your account value by $1,000 (for example, an $8,600 account value divided by $1,000 = 8.6), then multiply the result by the number in the “Actual” line under the heading entitled “Expenses paid during period” for your applicable class of shares to estimate the expenses you paid on your account during this period.
Hypothetical example for comparison purposes
The “Hypothetical” line of the table below provides information about hypothetical account values and hypothetical expenses based on the Fund’s actual expense ratio and an assumed rate of return of 5% per year before expenses, which is not the Fund’s actual return. The hypothetical account values and expenses may not be used to estimate the actual ending account balance or expenses you paid for the period. You may use this information to compare the ongoing costs of investing in the Fund and other funds. To do so, compare this 5% hypothetical example with the 5% hypothetical examples that appear in the shareholder reports of the other funds.
Please note that the expenses shown in the table are meant to highlight your ongoing costs only. Therefore, the “Hypothetical” line of the table is useful in comparing ongoing costs only and will not help you determine the relative total costs of owning different funds. In addition, if these transactional costs were included, your costs would have been higher.
| | Beginning
account value
8-1-2020 | Ending
account value
1-31-2021 | Expenses
paid during
the period1 | Annualized net
expense ratio |
| Class A | | | | |
| Actual | $1,000.00 | $1,042.50 | $3.60 | 0.70% |
| Hypothetical (5% return before expenses) | $1,000.00 | $1,021.68 | $3.57 | 0.70% |
| Class C | | | | |
| Actual | $1,000.00 | $1,039.80 | $7.56 | 1.47% |
| Hypothetical (5% return before expenses) | $1,000.00 | $1,017.80 | $7.48 | 1.47% |
| Class R6 | | | | |
| Actual | $1,000.00 | $1,045.07 | $1.55 | 0.30% |
| Hypothetical (5% return before expenses) | $1,000.00 | $1,023.69 | $1.53 | 0.30% |
| Administrator Class | | | | |
| Actual | $1,000.00 | $1,043.73 | $3.35 | 0.65% |
| Hypothetical (5% return before expenses) | $1,000.00 | $1,021.93 | $3.31 | 0.65% |
| Institutional Class | | | | |
| Actual | $1,000.00 | $1,044.15 | $2.06 | 0.40% |
| Hypothetical (5% return before expenses) | $1,000.00 | $1,023.19 | $2.04 | 0.40% |
1 Expenses paid is equal to the annualized net expense ratio of each class multiplied by the average account value over the period, multiplied by the number of days in the most recent fiscal half-year divided by the number of days in the fiscal year (to reflect the one-half-year period).
6 | Wells Fargo Low Volatility U.S. Equity Fund
Portfolio of investments—January 31, 2021 (unaudited)
| | | | | Shares | Value |
| Common stocks: 98.29% | | | | | |
| Communication services: 6.88% | | | | | |
| Diversified telecommunication services: 3.58% | | | | | |
| AT&T Incorporated | | | | 35,701 | $ 1,022,120 |
| Verizon Communications Incorporated | | | | 19,114 | 1,046,492 |
| | | | | | 2,068,612 |
| Entertainment: 1.36% | | | | | |
| Spotify Technology SA † | | | | 1,752 | 551,880 |
| The Madison Square Garden Company Class A | | | | 1,443 | 233,607 |
| | | | | | 785,487 |
| Media: 1.82% | | | | | |
| John Wiley & Sons Incorporated Class A | | | | 4,672 | 213,090 |
| The New York Times Company Class A | | | | 16,912 | 838,666 |
| | | | | | 1,051,756 |
| Wireless telecommunication services: 0.12% | | | | | |
| United States Cellular Corporation † | | | | 2,119 | 66,070 |
| Consumer discretionary: 10.82% | | | | | |
| Auto components: 0.43% | | | | | |
| Gentex Corporation | | | | 7,532 | 248,933 |
| Diversified consumer services: 0.99% | | | | | |
| Grand Canyon Education Incorporated † | | | | 6,491 | 551,346 |
| Terminix Global Holdings Incorporated † | | | | 415 | 19,787 |
| | | | | | 571,133 |
| Hotels, restaurants & leisure: 5.06% | | | | | |
| Chipotle Mexican Grill Incorporated † | | | | 607 | 898,360 |
| Domino's Pizza Incorporated | | | | 1,204 | 446,395 |
| McDonald's Corporation | | | | 4,841 | 1,006,153 |
| Starbucks Corporation | | | | 1,409 | 136,405 |
| Yum China Holdings Incorporated | | | | 7,726 | 438,141 |
| | | | | | 2,925,454 |
| Household durables: 1.75% | | | | | |
| Garmin Limited | | | | 8,776 | 1,008,011 |
| Multiline retail: 1.15% | | | | | |
| Ollie's Bargain Outlet Holdings Incorporated † | | | | 7,023 | 665,289 |
| Textiles, apparel & luxury goods: 1.44% | | | | | |
| Nike Incorporated Class B | | | | 6,217 | 830,529 |
| Consumer staples: 30.47% | | | | | |
| Beverages: 5.43% | | | | | |
| Boston Beer Company Incorporated Class A † | | | | 456 | 418,102 |
| Brown-Forman Corporation Class B | | | | 2,050 | 146,924 |
| Monster Beverage Corporation † | | | | 5,388 | 467,840 |
The accompanying notes are an integral part of these financial statements.
Wells Fargo Low Volatility U.S. Equity Fund | 7
Portfolio of investments—January 31, 2021 (unaudited)
| | | | | Shares | Value |
| Beverages (continued) | | | | | |
| PepsiCo Incorporated | | | | 6,518 | $ 890,163 |
| The Coca-Cola Company | | | | 25,152 | 1,211,069 |
| | | | | | 3,134,098 |
| Food & staples retailing: 4.51% | | | | | |
| Casey's General Stores Incorporated | | | | 2,259 | 423,517 |
| Costco Wholesale Corporation | | | | 1,657 | 583,977 |
| The Kroger Company | | | | 32,001 | 1,104,035 |
| Walmart Incorporated | | | | 3,523 | 494,946 |
| | | | | | 2,606,475 |
| Food products: 12.88% | | | | | |
| Bunge Limited | | | | 6,666 | 436,223 |
| Campbell Soup Company | | | | 10,212 | 491,299 |
| ConAgra Foods Incorporated | | | | 3,720 | 128,712 |
| Flowers Foods Incorporated | | | | 27,212 | 624,788 |
| General Mills Incorporated | | | | 11,399 | 662,282 |
| Hormel Foods Corporation | | | | 15,111 | 708,101 |
| Kellogg Company | | | | 13,143 | 774,648 |
| McCormick & Company Incorporated | | | | 8,492 | 760,374 |
| Mondelez International Incorporated Class A | | | | 11,290 | 625,918 |
| The Hershey Company | | | | 6,099 | 887,039 |
| The J.M. Smucker Company | | | | 6,108 | 711,032 |
| Tyson Foods Incorporated Class A | | | | 9,752 | 627,151 |
| | | | | | 7,437,567 |
| Household products: 4.71% | | | | | |
| Church & Dwight Company Incorporated | | | | 6,790 | 573,280 |
| Colgate-Palmolive Company | | | | 10,727 | 836,706 |
| The Clorox Company | | | | 2,314 | 484,690 |
| The Procter & Gamble Company | | | | 6,443 | 826,057 |
| | | | | | 2,720,733 |
| Personal products: 1.82% | | | | | |
| Herbalife Nutrition Limited † | | | | 1,564 | 79,701 |
| NU Skin Enterprises Incorporated Class A | | | | 799 | 46,238 |
| The Estee Lauder Companies Incorporated Class A | | | | 3,903 | 923,645 |
| | | | | | 1,049,584 |
| Tobacco: 1.12% | | | | | |
| Altria Group Incorporated | | | | 15,773 | 647,955 |
| Energy: 1.91% | | | | | |
| Oil, gas & consumable fuels: 1.91% | | | | | |
| Antero Midstream Corporation | | | | 32,359 | 262,108 |
| Cabot Oil & Gas Corporation | | | | 46,051 | 844,115 |
| | | | | | 1,106,223 |
| Financials: 7.53% | | | | | |
| Banks: 0.24% | | | | | |
| Commerce Bancshares Incorporated | | | | 2,058 | 137,577 |
| Capital markets: 2.21% | | | | | |
| Cboe Global Markets Incorporated | | | | 3,686 | 338,117 |
The accompanying notes are an integral part of these financial statements.
8 | Wells Fargo Low Volatility U.S. Equity Fund
Portfolio of investments—January 31, 2021 (unaudited)
| | | | | Shares | Value |
| Capital markets (continued) | | | | | |
| MarketAxess Holdings Incorporated | | | | 719 | $ 388,806 |
| Morningstar Incorporated | | | | 729 | 167,590 |
| Tradeweb Markets Incorporated Class A | | | | 6,257 | 380,363 |
| | | | | | 1,274,876 |
| Diversified financial services: 2.30% | | | | | |
| Berkshire Hathaway Incorporated Class B † | | | | 5,841 | 1,330,985 |
| Insurance: 2.78% | | | | | |
| American National Group Incorporated | | | | 379 | 33,496 |
| Erie Indemnity Company Class A | | | | 280 | 68,068 |
| Marsh & McLennan Companies Incorporated | | | | 3,136 | 344,678 |
| Mercury General Corporation | | | | 6,652 | 352,623 |
| Progressive Corporation | | | | 7,411 | 646,165 |
| White Mountains Insurance Group Limited | | | | 156 | 159,120 |
| | | | | | 1,604,150 |
| Health care: 12.53% | | | | | |
| Biotechnology: 0.20% | | | | | |
| Ionis Pharmaceuticals Incorporated † | | | | 1,966 | 118,098 |
| Health care equipment & supplies: 1.12% | | | | | |
| Haemonetics Corporation † | | | | 580 | 66,288 |
| Masimo Corporation † | | | | 355 | 90,852 |
| West Pharmaceutical Services Incorporated | | | | 1,626 | 486,971 |
| | | | | | 644,111 |
| Health care providers & services: 3.20% | | | | | |
| Chemed Corporation | | | | 1,197 | 619,926 |
| CVS Health Corporation | | | | 13,368 | 957,817 |
| Henry Schein Incorporated † | | | | 4,120 | 271,302 |
| | | | | | 1,849,045 |
| Life sciences tools & services: 0.50% | | | | | |
| Agilent Technologies Incorporated | | | | 1,497 | 179,894 |
| Mettler-Toledo International Incorporated † | | | | 91 | 106,297 |
| | | | | | 286,191 |
| Pharmaceuticals: 7.51% | | | | | |
| Bristol-Myers Squibb Company | | | | 15,299 | 939,818 |
| Elanco Animal Health Incorporated † | | | | 16,329 | 474,031 |
| Eli Lilly & Company | | | | 4,781 | 994,305 |
| Johnson & Johnson | | | | 6,510 | 1,061,976 |
| Merck & Company Incorporated | | | | 10,731 | 827,038 |
| Perrigo Company plc | | | | 958 | 40,907 |
| | | | | | 4,338,075 |
| Industrials: 12.68% | | | | | |
| Aerospace & defense: 0.56% | | | | | |
| BWX Technologies Incorporated | | | | 5,977 | 322,280 |
The accompanying notes are an integral part of these financial statements.
Wells Fargo Low Volatility U.S. Equity Fund | 9
Portfolio of investments—January 31, 2021 (unaudited)
| | | | | Shares | Value |
| Air freight & logistics: 2.69% | | | | | |
| C.H. Robinson Worldwide Incorporated | | | | 9,410 | $ 805,120 |
| Expeditors International of Washington Incorporated | | | | 8,364 | 748,745 |
| | | | | | 1,553,865 |
| Commercial services & supplies: 1.12% | | | | | |
| Copart Incorporated † | | | | 614 | 67,387 |
| Rollins Incorporated | | | | 16,149 | 581,687 |
| | | | | | 649,074 |
| Electrical equipment: 0.70% | | | | | |
| Vertiv Holdings Company | | | | 19,964 | 401,676 |
| Industrial conglomerates: 1.41% | | | | | |
| Roper Technologies Incorporated | | | | 2,074 | 814,895 |
| Machinery: 0.60% | | | | | |
| The Toro Company | | | | 3,666 | 345,521 |
| Professional services: 1.56% | | | | | |
| CoStar Group Incorporated † | | | | 1,002 | 901,509 |
| Road & rail: 1.87% | | | | | |
| J.B. Hunt Transport Services Incorporated | | | | 1,116 | 150,281 |
| Old Dominion Freight Line Incorporated | | | | 4,787 | 928,678 |
| | | | | | 1,078,959 |
| Trading companies & distributors: 2.17% | | | | | |
| Fastenal Company | | | | 18,952 | 864,022 |
| Watsco Incorporated | | | | 1,642 | 391,601 |
| | | | | | 1,255,623 |
| Information technology: 6.90% | | | | | |
| Communications equipment: 3.57% | | | | | |
| Arista Networks Incorporated † | | | | 1,362 | 418,897 |
| Cisco Systems Incorporated | | | | 22,145 | 987,224 |
| F5 Networks Incorporated † | | | | 2,856 | 559,633 |
| Juniper Networks Incorporated | | | | 3,904 | 95,336 |
| | | | | | 2,061,090 |
| Electronic equipment, instruments & components: 0.72% | | | | | |
| Amphenol Corporation Class A | | | | 3,318 | 414,352 |
| IT services: 1.58% | | | | | |
| Booz Allen Hamilton Holding Corporation | | | | 4,011 | 341,617 |
| Jack Henry & Associates Incorporated | | | | 3,965 | 574,092 |
| | | | | | 915,709 |
| Software: 1.03% | | | | | |
| DocuSign Incorporated † | | | | 1,031 | 240,110 |
| Zoom Video Communications Incorporated † | | | | 340 | 126,504 |
| Zscaler Incorporated † | | | | 1,130 | 225,661 |
| | | | | | 592,275 |
The accompanying notes are an integral part of these financial statements.
10 | Wells Fargo Low Volatility U.S. Equity Fund
Portfolio of investments—January 31, 2021 (unaudited)
| | | | | Shares | Value |
| Materials: 5.91% | | | | | |
| Chemicals: 4.10% | | | | | |
| Air Products & Chemicals Incorporated | | | | 915 | $ 244,085 |
| Linde plc | | | | 4,141 | 1,016,201 |
| NewMarket Corporation | | | | 72 | 28,238 |
| The Sherwin-Williams Company | | | | 1,557 | 1,077,133 |
| | | | | | 2,365,657 |
| Containers & packaging: 1.42% | | | | | |
| AptarGroup Incorporated | | | | 6,154 | 818,297 |
| Metals & mining: 0.39% | | | | | |
| Royal Gold Incorporated | | | | 2,133 | 227,975 |
| Real estate: 0.17% | | | | | |
| Equity REITs: 0.17% | | | | | |
| Extra Space Storage Incorporated | | | | 886 | 100,818 |
| Utilities: 2.49% | | | | | |
| Electric utilities: 0.50% | | | | | |
| Hawaiian Electric Industries Incorporated | | | | 8,736 | 288,812 |
| Gas utilities: 0.92% | | | | | |
| Atmos Energy Corporation | | | | 5,275 | 469,475 |
| UGI Corporation | | | | 1,732 | 62,335 |
| | | | | | 531,810 |
| Multi-utilities: 1.07% | | | | | |
| MDU Resources Group Incorporated | | | | 1,474 | 38,751 |
| Public Service Enterprise Group Incorporated | | | | 10,323 | 582,527 |
| | | | | | 621,278 |
| Total Common stocks (Cost $51,887,540) | | | | | 56,768,492 |
| | | Yield | | | |
| Short-term investments: 1.76% | | | | | |
| Investment companies: 1.76% | | | | | |
| Wells Fargo Government Money Market Fund Select Class ♠∞ | | 0.03% | | 1,017,098 | 1,017,098 |
| Total Short-term investments (Cost $1,017,098) | | | | | 1,017,098 |
| Total investments in securities (Cost $52,904,638) | 100.05% | | | | 57,785,590 |
| Other assets and liabilities, net | (0.05) | | | | (29,314) |
| Total net assets | 100.00% | | | | $57,756,276 |
| † | Non-income-earning security |
| ♠ | The issuer of the security is an affiliated person of the Fund as defined in the Investment Company Act of 1940. |
| ∞ | The rate represents the 7-day annualized yield at period end. |
| Abbreviations: |
| REIT | Real estate investment trust |
The accompanying notes are an integral part of these financial statements.
Wells Fargo Low Volatility U.S. Equity Fund | 11
Portfolio of investments—January 31, 2021 (unaudited)
Investments in affiliates
An affiliated investment is an investment in which the Fund owns at least 5% of the outstanding voting shares of the issuer or as a result of other relationships, such as the Fund and the issuer having the same investment manager. Transactions with issuers that were either affiliated persons of the Fund at the beginning of the period or the end of the period were as follows:
| | Value,
beginning of
period | Purchases | Sales
proceeds | Net
realized
gains
(losses) | Net
change in
unrealized
gains
(losses) | Value,
end of
period | % of
net
assets | Shares,
end
of period | Income
from
affiliated
securities |
| Short-term investments | | | | | | | | | |
| Investment companies | | | | | | | | | |
| Wells Fargo Government Money Market Fund Select Class | $1,214,586 | $5,232,924 | $(5,430,412) | $0 | $0 | $1,017,098 | 1.76% | 1,017,098 | $240 |
The accompanying notes are an integral part of these financial statements.
12 | Wells Fargo Low Volatility U.S. Equity Fund
Statement of assets and liabilities—January 31, 2021 (unaudited)
| | |
| Assets | |
Investments in unaffiliated securities, at value (cost $51,887,540)
| $ 56,768,492 |
Investments in affiliated securites, at value (cost $1,017,098)
| 1,017,098 |
Receivable for dividends
| 82,014 |
Receivable for Fund shares sold
| 34,993 |
Receivable from manager
| 1,629 |
Total assets
| 57,904,226 |
| Liabilities | |
Payable for Fund shares redeemed
| 57,249 |
Shareholder report expenses payable
| 43,690 |
Professional fees payable
| 19,781 |
Administration fees payable
| 6,630 |
Trustees’ fees and expenses payable
| 2,892 |
Distribution fee payable
| 267 |
Accrued expenses and other liabilities
| 17,441 |
Total liabilities
| 147,950 |
Total net assets
| $57,756,276 |
| Net assets consist of | |
Paid-in capital
| $ 50,362,491 |
Total distributable earnings
| 7,393,785 |
Total net assets
| $57,756,276 |
| Computation of net asset value and offering price per share | |
Net assets – Class A
| $ 2,565,214 |
Shares outstanding – Class A1
| 206,202 |
Net asset value per share – Class A
| $12.44 |
Maximum offering price per share – Class A2
| $13.20 |
Net assets – Class C
| $ 409,284 |
Shares outstanding – Class C1
| 33,102 |
Net asset value per share – Class C
| $12.36 |
Net assets – Class R6
| $ 1,249,185 |
Shares outstanding – Class R61
| 100,480 |
Net asset value per share – Class R6
| $12.43 |
Net assets – Administrator Class
| $ 218,912 |
Shares outstanding – Administrator Class1
| 17,618 |
Net asset value per share – Administrator Class
| $12.43 |
Net assets – Institutional Class
| $ 53,313,681 |
Shares outstanding – Institutional Class1
| 4,280,509 |
Net asset value per share – Institutional Class
| $12.45 |
| 1 | The Fund has an unlimited number of authorized shares. |
| 2 | Maximum offering price is computed as 100/94.25 of net asset value. On investments of $50,000 or more, the offering price is reduced. |
The accompanying notes are an integral part of these financial statements.
Wells Fargo Low Volatility U.S. Equity Fund | 13
Statement of operations—six months ended January 31, 2021 (unaudited)
| | |
| Investment income | |
Dividends
| $ 498,305 |
Income from affiliated securities
| 240 |
Total investment income
| 498,545 |
| Expenses | |
Management fee
| 114,790 |
| Administration fees | |
Class A
| 2,202 |
Class C
| 405 |
Class R6
| 186 |
Administrator Class
| 122 |
Institutional Class
| 34,765 |
| Shareholder servicing fees | |
Class A
| 2,621 |
Class C
| 466 |
Administrator Class
| 234 |
| Distribution fee | |
Class C
| 1,136 |
Custody and accounting fees
| 5,089 |
Professional fees
| 23,031 |
Registration fees
| 52,282 |
Shareholder report expenses
| 14,528 |
Trustees’ fees and expenses
| 9,706 |
Other fees and expenses
| 4,142 |
Total expenses
| 265,705 |
| Less: Fee waivers and/or expense reimbursements | |
Fund-level
| (109,043) |
Class A
| (1,905) |
Class C
| (2) |
Class R6
| (186) |
Administrator Class
| (144) |
Institutional Class
| (34,765) |
Net expenses
| 119,660 |
Net investment income
| 378,885 |
| Realized and unrealized gains (losses) on investments | |
Net realized gains on investments
| 4,773,208 |
Net change in unrealized gains (losses) on investments
| (2,647,431) |
Net realized and unrealized gains (losses) on investments
| 2,125,777 |
Net increase in net assets resulting from operations
| 2,504,662 |
The accompanying notes are an integral part of these financial statements.
14 | Wells Fargo Low Volatility U.S. Equity Fund
Statement of changes in net assets
| | |
| | Six months ended
January 31, 2021
(unaudited) | Year ended
July 31, 2020 |
| Operations | | | | |
Net investment income
| | $ 378,885 | | $ 791,944 |
Net realized gains (losses) on investments
| | 4,773,208 | | (993,101) |
Net change in unrealized gains (losses) on investments
| | (2,647,431) | | 2,023,097 |
Net increase in net assets resulting from operations
| | 2,504,662 | | 1,821,940 |
| Distributions to shareholders from | | | | |
| Net investment income and net realized gains | | | | |
Class A
| | (13,576) | | (74,979) |
Class C
| | (114) | | (14,949) |
Class R6
| | (12,328) | | (59,692) |
Administrator Class
| | (1,313) | | (5,557) |
Institutional Class
| | (481,314) | | (2,494,914) |
Total distributions to shareholders
| | (508,645) | | (2,650,091) |
| Capital share transactions | Shares | | Shares | |
| Proceeds from shares sold | | | | |
Class A
| 92,904 | 1,152,926 | 42,642 | 495,950 |
Class C
| 6,518 | 80,569 | 11,609 | 138,302 |
Administrator Class
| 7,531 | 90,826 | 0 | 0 |
Institutional Class
| 119,694 | 1,479,261 | 1,647,036 | 20,200,973 |
| | | 2,803,582 | | 20,835,225 |
| Reinvestment of distributions | | | | |
Class A
| 1,023 | 12,867 | 5,757 | 69,533 |
Class C
| 6 | 81 | 857 | 10,265 |
Administrator Class
| 45 | 563 | 0 | 0 |
Institutional Class
| 6,296 | 79,285 | 39,816 | 481,655 |
| | | 92,796 | | 561,453 |
| Payment for shares redeemed | | | | |
Class A
| (28,363) | (350,055) | (35,036) | (396,795) |
Class C
| (5,173) | (62,556) | (6,078) | (66,025) |
Institutional Class
| (246,054) | (3,059,257) | (303,612) | (3,484,213) |
| | | (3,471,868) | | (3,947,033) |
Net increase (decrease) in net assets resulting from capital share transactions
| | (575,490) | | 17,449,645 |
Total increase in net assets
| | 1,420,527 | | 16,621,494 |
| Net assets | | | | |
Beginning of period
| | 56,335,749 | | 39,714,255 |
End of period
| | $57,756,276 | | $56,335,749 |
The accompanying notes are an integral part of these financial statements.
Wells Fargo Low Volatility U.S. Equity Fund | 15
Financial highlights
(For a share outstanding throughout each period)
| | | Year ended July 31 |
| Class A | Six months ended
January 31, 2021
(unaudited) | 2020 | 2019 | 2018 | 2017 1 |
Net asset value, beginning of period
| $12.00 | $12.09 | $11.56 | $11.21 | $10.00 |
Net investment income
| 0.05 | 0.14 | 0.19 | 0.16 | 0.13 |
Net realized and unrealized gains on investments
| 0.46 | 0.31 | 1.17 | 0.54 | 1.12 |
Total from investment operations
| 0.51 | 0.45 | 1.36 | 0.70 | 1.25 |
| Distributions to shareholders from | | | | | |
Net investment income
| (0.07) | (0.19) | (0.18) | (0.17) | (0.04) |
Net realized gains
| (0.00) 2 | (0.35) | (0.65) | (0.18) | 0.00 |
Total distributions to shareholders
| (0.07) | (0.54) | (0.83) | (0.35) | (0.04) |
Net asset value, end of period
| $12.44 | $12.00 | $12.09 | $11.56 | $11.21 |
Total return3
| 4.25% | 3.76% | 12.87% | 6.32% | 12.53% |
| Ratios to average net assets (annualized) | | | | | |
Gross expenses
| 1.24% | 1.34% | 1.50% | 1.55% | 1.61% |
Net expenses
| 0.70% | 0.71% | 0.76% | 0.83% | 0.82% |
Net investment income
| 1.08% | 1.29% | 1.83% | 1.53% | 1.78% |
| Supplemental data | | | | | |
Portfolio turnover rate
| 60% | 165% | 74% | 75% | 39% |
Net assets, end of period (000s omitted)
| $2,565 | $1,687 | $1,539 | $1,312 | $1,096 |
| 1 | For the period from October 31, 2016 (commencement of class operations) to July 31, 2017 |
| 2 | Amount is less than $0.005. |
| 3 | Total return calculations do not include any sales charges. Returns for periods of less than one year are not annualized. |
The accompanying notes are an integral part of these financial statements.
16 | Wells Fargo Low Volatility U.S. Equity Fund
Financial highlights
(For a share outstanding throughout each period)
| | | Year ended July 31 |
| Class C | Six months ended
January 31, 2021
(unaudited) | 2020 | 2019 | 2018 | 2017 1 |
Net asset value, beginning of period
| $11.89 | $12.01 | $11.49 | $11.16 | $10.00 |
Net investment income
| 0.02 | 0.05 | 0.11 | 0.08 | 0.08 |
Net realized and unrealized gains on investments
| 0.45 | 0.30 | 1.17 | 0.52 | 1.11 |
Total from investment operations
| 0.47 | 0.35 | 1.28 | 0.60 | 1.19 |
| Distributions to shareholders from | | | | | |
Net investment income
| 0.00 | (0.12) | (0.11) | (0.09) | (0.03) |
Net realized gains
| (0.00) 2 | (0.35) | (0.65) | (0.18) | 0.00 |
Total distributions to shareholders
| (0.00) 2 | (0.47) | (0.76) | (0.27) | (0.03) |
Net asset value, end of period
| $12.36 | $11.89 | $12.01 | $11.49 | $11.16 |
Total return3
| 3.98% | 2.89% | 12.15% | 5.45% | 11.91% |
| Ratios to average net assets (annualized) | | | | | |
Gross expenses
| 1.82% | 1.93% | 2.18% | 2.31% | 2.40% |
Net expenses
| 1.47% | 1.48% | 1.51% | 1.58% | 1.58% |
Net investment income
| 0.27% | 0.52% | 1.10% | 0.76% | 1.01% |
| Supplemental data | | | | | |
Portfolio turnover rate
| 60% | 165% | 74% | 75% | 39% |
Net assets, end of period (000s omitted)
| $409 | $377 | $305 | $187 | $112 |
| 1 | For the period from October 31, 2016 (commencement of class operations) to July 31, 2017 |
| 2 | Amount is less than $0.005. |
| 3 | Total return calculations do not include any sales charges. Returns for periods of less than one year are not annualized. |
The accompanying notes are an integral part of these financial statements.
Wells Fargo Low Volatility U.S. Equity Fund | 17
Financial highlights
(For a share outstanding throughout each period)
| | | Year ended July 31 |
| Class R6 | Six months ended
January 31, 2021
(unaudited) | 2020 | 2019 | 2018 | 2017 1 |
Net asset value, beginning of period
| $12.01 | $12.11 | $11.58 | $11.24 | $10.00 |
Net investment income
| 0.09 | 0.20 | 0.26 | 0.22 | 0.18 |
Net realized and unrealized gains on investments
| 0.45 | 0.30 | 1.15 | 0.52 | 1.11 |
Total from investment operations
| 0.54 | 0.50 | 1.41 | 0.74 | 1.29 |
| Distributions to shareholders from | | | | | |
Net investment income
| (0.12) | (0.25) | (0.23) | (0.22) | (0.05) |
Net realized gains
| (0.00) 2 | (0.35) | (0.65) | (0.18) | 0.00 |
Total distributions to shareholders
| (0.12) | (0.60) | (0.88) | (0.40) | (0.05) |
Net asset value, end of period
| $12.43 | $12.01 | $12.11 | $11.58 | $11.24 |
Total return3
| 4.51% | 4.10% | 13.39% | 6.70% | 12.94% |
| Ratios to average net assets (annualized) | | | | | |
Gross expenses
| 0.81% | 0.91% | 1.07% | 1.12% | 1.22% |
Net expenses
| 0.30% | 0.30% | 0.33% | 0.40% | 0.40% |
Net investment income
| 1.44% | 1.71% | 2.27% | 1.96% | 2.19% |
| Supplemental data | | | | | |
Portfolio turnover rate
| 60% | 165% | 74% | 75% | 39% |
Net assets, end of period (000s omitted)
| $1,249 | $1,207 | $1,217 | $1,164 | $1,129 |
| 1 | For the period from October 31, 2016 (commencement of class operations) to July 31, 2017 |
| 2 | Amount is less than $0.005. |
| 3 | Returns for periods of less than one year are not annualized. |
The accompanying notes are an integral part of these financial statements.
18 | Wells Fargo Low Volatility U.S. Equity Fund
Financial highlights
(For a share outstanding throughout each period)
| | | Year ended July 31 |
| Administrator Class | Six months ended
January 31, 2021
(unaudited) | 2020 | 2019 | 2018 | 2017 1 |
Net asset value, beginning of period
| $11.98 | $12.08 | $11.55 | $11.21 | $10.00 |
Net investment income
| 0.07 2 | 0.16 | 0.22 | 0.18 | 0.15 |
Net realized and unrealized gains on investments
| 0.45 | 0.30 | 1.15 | 0.53 | 1.10 |
Total from investment operations
| 0.52 | 0.46 | 1.37 | 0.71 | 1.25 |
| Distributions to shareholders from | | | | | |
Net investment income
| (0.07) | (0.21) | (0.19) | (0.19) | (0.04) |
Net realized gains
| (0.00) 3 | (0.35) | (0.65) | (0.18) | 0.00 |
Total distributions to shareholders
| (0.07) | (0.56) | (0.84) | (0.37) | (0.04) |
Net asset value, end of period
| $12.43 | $11.98 | $12.08 | $11.55 | $11.21 |
Total return4
| 4.37% | 3.77% | 13.00% | 6.36% | 12.57% |
| Ratios to average net assets (annualized) | | | | | |
Gross expenses
| 1.15% | 1.26% | 1.42% | 1.47% | 1.57% |
Net expenses
| 0.65% | 0.65% | 0.68% | 0.75% | 0.75% |
Net investment income
| 1.17% | 1.36% | 1.92% | 1.61% | 1.87% |
| Supplemental data | | | | | |
Portfolio turnover rate
| 60% | 165% | 74% | 75% | 39% |
Net assets, end of period (000s omitted)
| $219 | $120 | $121 | $116 | $113 |
| 1 | For the period from October 31, 2016 (commencement of class operations) to July 31, 2017 |
| 2 | Calculated based upon average shares outstanding |
| 3 | Amount is less than $0.005. |
| 4 | Returns for periods of less than one year are not annualized. |
The accompanying notes are an integral part of these financial statements.
Wells Fargo Low Volatility U.S. Equity Fund | 19
Financial highlights
(For a share outstanding throughout each period)
| | | Year ended July 31 |
| Institutional Class | Six months ended
January 31, 2021
(unaudited) | 2020 | 2019 | 2018 | 2017 1 |
Net asset value, beginning of period
| $12.03 | $12.11 | $11.58 | $11.23 | $10.00 |
Net investment income
| 0.08 | 0.19 2 | 0.25 | 0.20 | 0.16 |
Net realized and unrealized gains on investments
| 0.45 | 0.29 | 1.15 | 0.54 | 1.12 |
Total from investment operations
| 0.53 | 0.48 | 1.40 | 0.74 | 1.28 |
| Distributions to shareholders from | | | | | |
Net investment income
| (0.11) | (0.21) | (0.22) | (0.21) | (0.05) |
Net realized gains
| (0.00) 3 | (0.35) | (0.65) | (0.18) | 0.00 |
Total distributions to shareholders
| (0.11) | (0.56) | (0.87) | (0.39) | (0.05) |
Net asset value, end of period
| $12.45 | $12.03 | $12.11 | $11.58 | $11.23 |
Total return4
| 4.41% | 4.01% | 13.28% | 6.64% | 12.82% |
| Ratios to average net assets (annualized) | | | | | |
Gross expenses
| 0.91% | 1.00% | 1.17% | 1.22% | 1.31% |
Net expenses
| 0.40% | 0.40% | 0.43% | 0.50% | 0.50% |
Net investment income
| 1.33% | 1.59% | 2.17% | 1.87% | 2.09% |
| Supplemental data | | | | | |
Portfolio turnover rate
| 60% | 165% | 74% | 75% | 39% |
Net assets, end of period (000s omitted)
| $53,314 | $52,944 | $36,533 | $35,593 | $33,169 |
| 1 | For the period from October 31, 2016 (commencement of class operations) to July 31, 2017 |
| 2 | Calculated based upon average shares outstanding |
| 3 | Amount is less than $0.005. |
| 4 | Returns for periods of less than one year are not annualized. |
The accompanying notes are an integral part of these financial statements.
20 | Wells Fargo Low Volatility U.S. Equity Fund
Notes to financial statements (unaudited)
1. ORGANIZATION
Wells Fargo Funds Trust (the “Trust”), a Delaware statutory trust organized on March 10, 1999, is an open-end management investment company registered under the Investment Company Act of 1940, as amended (the “1940 Act”). As an investment company, the Trust follows the accounting and reporting guidance in Financial Accounting Standards Board (“FASB”) Accounting Standards Codification Topic 946, Financial Services – Investment Companies. These financial statements report on the Wells Fargo Low Volatility U.S. Equity Fund (the “Fund”) which is a diversified series of the Trust.
2. SIGNIFICANT ACCOUNTING POLICIES
The following significant accounting policies, which are consistently followed in the preparation of the financial statements of the Fund, are in conformity with U.S. generally accepted accounting principles which require management to make estimates and assumptions that affect the reported amounts of assets and liabilities, disclosure of contingent assets and liabilities at the date of the financial statements, and the reported amounts of income and expenses during the reporting period. Actual results could differ from those estimates.
Securities valuation
All investments are valued each business day as of the close of regular trading on the New York Stock Exchange (generally 4 p.m. Eastern Time), although the Fund may deviate from this calculation time under unusual or unexpected circumstances.
Equity securities that are listed on a foreign or domestic exchange or market are valued at the official closing price or, if none, the last sales price. If no sale occurs on the principal exchange or market that day, a fair value price will be determined in accordance with the Fund’s Valuation Procedures.
Investments in registered open-end investment companies are valued at net asset value.
Investments which are not valued using any of the methods discussed above are valued at their fair value, as determined in good faith by the Board of Trustees. The Board of Trustees has established a Valuation Committee comprised of the Trustees and has delegated to it the authority to take any actions regarding the valuation of portfolio securities that the Valuation Committee deems necessary or appropriate, including determining the fair value of portfolio securities, unless the determination has been delegated to the Wells Fargo Asset Management Pricing Committee at Wells Fargo Funds Management, LLC (“Funds Management”). The Board of Trustees retains the authority to make or ratify any valuation decisions or approve any changes to the Valuation Procedures as it deems appropriate. On a quarterly basis, the Board of Trustees receives reports on any valuation actions taken by the Valuation Committee or the Wells Fargo Asset Management Pricing Committee which may include items for ratification.
Security transactions and income recognition
Securities transactions are recorded on a trade date basis. Realized gains or losses are recorded on the basis of identified cost.
Dividend income is recognized on the ex-dividend date.
Distributions to shareholders
Distributions to shareholders from net investment income and any net realized gains are recorded on the ex-dividend date and paid at least annually. Such distributions are determined in accordance with income tax regulations and may differ from U.S. generally accepted accounting principles. Dividend sources are estimated at the time of declaration. The tax character of distributions is determined as of the Fund’s fiscal year end. Therefore, a portion of the Fund’s distributions made prior to the Fund’s fiscal year end may be categorized as a tax return of capital at year end.
Federal and other taxes
The Fund intends to continue to qualify as a regulated investment company by distributing substantially all of its investment company taxable income and any net realized capital gains (after reduction for capital loss carryforwards) sufficient to relieve it from all, or substantially all, federal income taxes. Accordingly, no provision for federal income taxes was required.
The Fund’s income and federal excise tax returns and all financial records supporting those returns for the prior three fiscal years are subject to examination by the federal and Delaware revenue authorities. Management has analyzed the Fund’s tax positions taken on federal, state, and foreign tax returns for all open tax years and does not believe that there are any uncertain tax positions that require recognition of a tax liability.
Wells Fargo Low Volatility U.S. Equity Fund | 21
Notes to financial statements (unaudited)
As of January 31, 2021, the aggregate cost of all investments for federal income tax purposes was $52,996,940 and the unrealized gains (losses) consisted of:
| Gross unrealized gains | $5,481,361 |
| Gross unrealized losses | (692,711) |
| Net unrealized gains | $4,788,650 |
As of July 31, 2020, the Fund had current year net deferred post-October capital losses consisting of $2,104,568 in short-term losses which was recognized on the first day of the current fiscal year.
Class allocations
The separate classes of shares offered by the Fund differ principally in applicable sales charges, distribution, shareholder servicing, and administration fees. Class specific expenses are charged directly to that share class. Investment income, common fund-level expenses, and realized and unrealized gains (losses) on investments are allocated daily to each class of shares based on the relative proportion of net assets of each class.
3. FAIR VALUATION MEASUREMENTS
Fair value measurements of investments are determined within a framework that has established a fair value hierarchy based upon the various data inputs utilized in determining the value of the Fund’s investments. The three-level hierarchy gives the highest priority to unadjusted quoted prices in active markets for identical assets or liabilities (Level 1) and the lowest priority to unobservable inputs (Level 3). The Fund’s investments are classified within the fair value hierarchy based on the lowest level of input that is significant to the fair value measurement. The inputs are summarized into three broad levels as follows:
| ■ | Level 1 – quoted prices in active markets for identical securities |
| ■ | Level 2 – other significant observable inputs (including quoted prices for similar securities, interest rates, prepayment speeds, credit risk, etc.) |
| ■ | Level 3 – significant unobservable inputs (including the Fund’s own assumptions in determining the fair value of investments) |
The inputs or methodologies used for valuing investments in securities are not necessarily an indication of the risk associated with investing in those securities.
The following is a summary of the inputs used in valuing the Fund’s assets and liabilities as of January 31, 2021:
| | Quoted prices
(Level 1) | Other significant
observable inputs
(Level 2) | Significant
unobservable inputs
(Level 3) | Total |
| Assets | | | | |
| Investments in: | | | | |
| Common stocks | | | | |
| Communication services | $ 3,971,925 | $0 | $0 | $ 3,971,925 |
| Consumer discretionary | 6,249,349 | 0 | 0 | 6,249,349 |
| Consumer staples | 17,596,412 | 0 | 0 | 17,596,412 |
| Energy | 1,106,223 | 0 | 0 | 1,106,223 |
| Financials | 4,347,588 | 0 | 0 | 4,347,588 |
| Health care | 7,235,520 | 0 | 0 | 7,235,520 |
| Industrials | 7,323,402 | 0 | 0 | 7,323,402 |
| Information technology | 3,983,426 | 0 | 0 | 3,983,426 |
| Materials | 3,411,929 | 0 | 0 | 3,411,929 |
| Real estate | 100,818 | 0 | 0 | 100,818 |
| Utilities | 1,441,900 | 0 | 0 | 1,441,900 |
| Short-term investments | | | | |
| Investment companies | 1,017,098 | 0 | 0 | 1,017,098 |
| Total assets | $57,785,590 | $0 | $0 | $57,785,590 |
Additional sector, industry or geographic detail, if any, is included in the Portfolio of Investments.
22 | Wells Fargo Low Volatility U.S. Equity Fund
Notes to financial statements (unaudited)
For the six months ended January 31, 2021, the Fund did not have any transfers into/out of Level 3.
4. TRANSACTIONS WITH AFFILIATES
Management fee
Funds Management, an indirect wholly owned subsidiary of Wells Fargo & Company (“Wells Fargo”), is the manager of the Fund and provides advisory and fund-level administrative services under an investment management agreement. Under the investment management agreement, Funds Management is responsible for, among other services, implementing the investment objectives and strategies of the Fund, supervising the subadviser and providing fund-level administrative services in connection with the Fund’s operations. As compensation for its services under the investment management agreement, Funds Management is entitled to receive a management fee at the following annual rate based on the Fund’s average daily net assets:
| Average daily net assets | Management fee |
| First $1 billion | 0.400% |
| Next $4 billion | 0.375 |
| Next $5 billion | 0.340 |
| Over $10 billion | 0.330 |
For the six months ended January 31, 2021, the management fee was equivalent to an annual rate of 0.40% of the Fund’s average daily net assets.
Funds Management has retained the services of a subadviser to provide daily portfolio management to the Fund. The fee for subadvisory services is borne by Funds Management. Wells Capital Management, Incorporated, an affiliate of Funds Management and an indirect wholly owned subsidiary of Wells Fargo, is the subadviser to the Fund and is entitled to receive a fee from Funds Management at an annual rate starting at 0.20% and declining to 0.12% as the average daily net assets of the Fund increase.
Administration fees
Under a class-level administration agreement, Funds Management provides class-level administrative services to the Fund, which includes paying fees and expenses for services provided by the transfer agent, sub-transfer agents, omnibus account servicers and record-keepers. As compensation for its services under the class-level administration agreement, Funds Management receives an annual fee which is calculated based on the average daily net assets of each class as follows:
| | Class-level
administration fee |
| Class A | 0.21% |
| Class C | 0.21 |
| Class R6 | 0.03 |
| Administrator Class | 0.13 |
| Institutional Class | 0.13 |
Waivers and/or expense reimbursements
Funds Management has contractually waived and/or reimbursed management and administration fees to the extent necessary to maintain certain net operating expense ratios for the Fund. When each class of the Fund has exceeded its expense cap, Funds Management has waived fees and/or reimbursed expenses from fund-level expenses on a proportionate basis and then from class specific expenses. When only certain classes exceed their expense caps, waivers and/or reimbursements are applied against class specific expenses before fund-level expenses. Funds Management has committed through November 30, 2021 to waive fees and/or reimburse expenses to the extent necessary to cap expenses. Prior to or after the commitment expiration date, the cap may be increased or the commitment to maintain the cap may be terminated only with the approval of the Board of Trustees. The expense caps are as follows:
Wells Fargo Low Volatility U.S. Equity Fund | 23
Notes to financial statements (unaudited)
| | Expense ratio caps |
| Class A | 0.73% |
| Class C | 1.48 |
| Class R6 | 0.30 |
| Administrator Class | 0.65 |
| Institutional Class | 0.40 |
Distribution fee
The Trust has adopted a distribution plan for Class C shares of the Fund pursuant to Rule 12b-1 under the 1940 Act. A distribution fee is charged charged to Class C shares and paid to Wells Fargo Funds Distributor, LLC (“Funds Distributor”), the principal underwriter, at an annual rate of 0.75% of the average daily net assets of Class C shares.
In addition, Funds Distributor is entitled to receive the front-end sales charge from the purchase of Class A shares and a contingent deferred sales charge on the redemption of certain Class A shares. Funds Distributor is also entitled to receive the contingent deferred sales charges from redemptions of Class C shares. For the six months ended January 31, 2021, Funds Distributor did not receive any front-end or contingent deferred sales charges from Class A or Class C shares.
Shareholder servicing fees
The Trust has entered into contracts with one or more shareholder servicing agents, whereby Class A, Class C, and Administrator Class of the Fund are charged a fee at an annual rate of 0.25% of the average daily net assets of each respective class. A portion of these total shareholder servicing fees were paid to affiliates of Wells Fargo.
Interfund transactions
The Fund may purchase or sell portfolio investment securities to certain other Wells Fargo affiliates pursuant to Rule 17a-7 under the 1940 Act and under procedures adopted by the Board of Trustees. The procedures have been designed to ensure that these interfund transactions, which do not incur broker commissions, are effected at current market prices.
5. INVESTMENT PORTFOLIO TRANSACTIONS
Purchases and sales of investments, excluding U.S. government obligations (if any) and short-term securities, for the six months ended January 31, 2021 were $33,639,044 and $34,170,789, respectively.
6. BANK BORROWINGS
The Trust (excluding the money market funds), Wells Fargo Master Trust and Wells Fargo Variable Trust are parties to a $350,000,000 revolving credit agreement whereby the Fund is permitted to use bank borrowings for temporary or emergency purposes, such as to fund shareholder redemption requests. Interest under the credit agreement is charged to the Fund based on a borrowing rate equal to the higher of the Federal Funds rate in effect on that day plus 1.25% or the overnight LIBOR rate in effect on that day plus 1.25%. In addition, an annual commitment fee equal to 0.25% of the unused balance is allocated to each participating fund.
For the six months ended January 31, 2021, there were no borrowings by the Fund under the agreement.
7. CONCENTRATION RISKS
Concentration risks result from exposure to a limited number of sectors. As of the end of the period, the Fund concentrated its portfolio in investments related to consumer staples. A fund that invests a substantial portion of its assets in any sector may be more affected by changes in that sector than would be a fund whose investments are not heavily weighted in any sector.
8. INDEMNIFICATION
Under the Fund's organizational documents, the officers and Trustees have been granted certain indemnification rights against certain liabilities that may arise out of performance of their duties to the Fund. The Fund has entered into a separate agreement with each Trustee that converts indemnification rights currently existing under the Fund’s organizational documents into contractual rights that cannot be changed in the future without the consent of the Trustee. Additionally, in the normal course of business, the Fund may enter into contracts with service providers that contain a variety of indemnification clauses. The Fund’s maximum exposure under these arrangements is dependent on future claims that may be made against the Fund and, therefore, cannot be estimated.
24 | Wells Fargo Low Volatility U.S. Equity Fund
Notes to financial statements (unaudited)
9. NEW ACCOUNTING PRONOUNCEMENT
In August 2018, FASB issued Accounting Standards Update (“ASU”) No. 2018-13, Fair Value Measurement (Topic 820) Disclosure Framework - Changes to the Disclosure Requirements for Fair Value Measurement. ASU 2018-13 updates the disclosure requirements on fair value measurements in Topic 820, Fair Value Measurements. The amendments are effective for fiscal years, and interim periods within those fiscal years, beginning after December 15, 2019. Management has adopted this guidance which did not have a material impact on the financial statements.
10. CORONAVIRUS (COVID-19) PANDEMIC
On March 11, 2020, the World Health Organization announced that it had made the assessment that coronavirus disease 2019 (“COVID-19”) is a pandemic. The impacts of COVID-19 are affecting the entire global economy, individual companies and investment products, the funds, and the market in general. There is significant uncertainty around the extent and duration of business disruptions related to COVID-19 and the impacts may be short term or may last for an extended period of time. The risk of further spreading of COVID-19 has led to significant uncertainty and volatility in the financial markets.
11. SUBSEQUENT EVENT
On February 23, 2021, Wells Fargo announced that it has entered into a definitive agreement to sell Wells Fargo Asset Management (“WFAM”) to GTCR LLC and Reverence Capital Partners, L.P. WFAM is the trade name used by the asset management businesses of Wells Fargo and includes Wells Fargo Funds Management, LLC, the investment manager to the Fund, Wells Capital Management Incorporated and Wells Fargo Asset Management (International) Limited, both registered investment advisers providing sub-advisory services to certain funds, and Wells Fargo Funds Distributor, LLC, the Fund’s principal underwriter. As part of the transaction, Wells Fargo will own a 9.9% equity interest and will continue to serve as an important client and distribution partner.
Consummation of the transaction will result in the automatic termination of the Fund’s investment management agreement and sub-advisory agreement. The Fund’s Board of Trustees will be asked to approve new investment management arrangements with the new company. If approved by the Board, the new investment management arrangements with the new company will be presented to the shareholders of the Fund for approval, and, if approved by shareholders, would take effect upon the closing of the transaction. The transaction is expected to close in the second half of 2021, subject to customary closing conditions.
Wells Fargo Low Volatility U.S. Equity Fund | 25
Other information (unaudited)
PROXY VOTING INFORMATION
A description of the policies and procedures used to determine how to vote proxies relating to portfolio securities is available without charge, upon request, by calling 1-800-222-8222, visiting our website at wfam.com, or visiting the SEC website at sec.gov. Information regarding how the proxies related to portfolio securities were voted during the most recent 12-month period ended June 30 is available on the website at wfam.com or by visiting the SEC website at sec.gov.
QUARTERLY PORTFOLIO HOLDINGS INFORMATION
The Fund files its complete schedule of portfolio holdings with the SEC for the first and third quarters of each fiscal year as an exhibit to its reports on Form N-PORT. Shareholders may view the filed Form N-PORT by visiting the SEC website at sec.gov.
26 | Wells Fargo Low Volatility U.S. Equity Fund
Other information (unaudited)
BOARD OF TRUSTEES AND OFFICERS
Each of the Trustees and Officers listed in the table below acts in identical capacities for each fund in the Wells Fargo family of funds, which consists of 144 mutual funds comprising the Wells Fargo Funds Trust, Wells Fargo Variable Trust, Wells Fargo Master Trust and four closed-end funds (collectively the “Fund Complex”). This table should be read in conjunction with the Prospectus and the Statement of Additional Information1. The mailing address of each Trustee and Officer is 525 Market Street, 12th Floor, San Francisco, CA 94105. Each Trustee and Officer serves an indefinite term, however, each Trustee serves such term until reaching the mandatory retirement age established by the Trustees.
Independent Trustees
Name and
year of birth | Position held and
length of service* | Principal occupations during past five years or longer | Current other
public company or
investment
company
directorships |
William R. Ebsworth
(Born 1957) | Trustee,
since 2015 | Retired. From 1984 to 2013, equities analyst, portfolio manager, research director and chief investment officer at Fidelity Management and Research Company in Boston, Tokyo, and Hong Kong, and retired in 2013 as Chief Investment Officer of Fidelity Strategic Advisers, Inc. where he led a team of investment professionals managing client assets. Prior thereto, Board member of Hong Kong Securities Clearing Co., Hong Kong Options Clearing Corp., the Thailand International Fund, Ltd., Fidelity Investments Life Insurance Company, and Empire Fidelity Investments Life Insurance Company. Audit Committee Chair and Investment Committee Chair of the Vincent Memorial Hospital Endowment (non-profit organization). Mr. Ebsworth is a CFA® charterholder. | N/A |
Jane A. Freeman
(Born 1953) | Trustee,
since 2015;
Chair Liaison,
since 2018 | Retired. From 2012 to 2014 and 1999 to 2008, Chief Financial Officer of Scientific Learning Corporation. From 2008 to 2012, Ms. Freeman provided consulting services related to strategic business projects. Prior to 1999, Portfolio Manager at Rockefeller & Co. and Scudder, Stevens & Clark. Board member of the Harding Loevner Funds from 1996 to 2014, serving as both Lead Independent Director and chair of the Audit Committee. Board member of the Russell Exchange Traded Funds Trust from 2011 to 2012 and the chair of the Audit Committee. Ms. Freeman is also an inactive Chartered Financial Analyst. | N/A |
Isaiah Harris, Jr.
(Born 1952) | Trustee,
since 2009; Audit
Committee
Chair,
since 2019 | Retired. Chairman of the Board of CIGNA Corporation since 2009, and Director since 2005. From 2003 to 2011, Director of Deluxe Corporation. Prior thereto, President and CEO of BellSouth Advertising and Publishing Corp. from 2005 to 2007, President and CEO of BellSouth Enterprises from 2004 to 2005 and President of BellSouth Consumer Services from 2000 to 2003. Emeritus member of the Iowa State University Foundation Board of Governors. Emeritus Member of the Advisory Board of Iowa State University School of Business. Advisory Board Member, Palm Harbor Academy (private school). Mr. Harris is a certified public accountant (inactive status). | CIGNA Corporation |
Judith M. Johnson
(Born 1949) | Trustee,
since 2008 | Retired. Prior thereto, Chief Executive Officer and Chief Investment Officer of Minneapolis Employees Retirement Fund from 1996 to 2008. Ms. Johnson is an attorney, certified public accountant and a certified managerial accountant. | N/A |
David F. Larcker
(Born 1950) | Trustee,
since 2009 | James Irvin Miller Professor of Accounting at the Graduate School of Business (Emeritus), Stanford University, Director of the Corporate Governance Research Initiative and Senior Faculty of The Rock Center for Corporate Governance since 2006. From 2005 to 2008, Professor of Accounting at the Graduate School of Business, Stanford University. Prior thereto, Ernst & Young Professor of Accounting at The Wharton School, University of Pennsylvania from 1985 to 2005. | N/A |
Wells Fargo Low Volatility U.S. Equity Fund | 27
Other information (unaudited)
Name and
year of birth | Position held and
length of service* | Principal occupations during past five years or longer | Current other
public company or
investment
company
directorships |
Olivia S. Mitchell
(Born 1953) | Trustee,
since 2006;
Nominating and
Governance
Committee Chair,
since 2018 | International Foundation of Employee Benefit Plans Professor, Wharton School of the University of Pennsylvania since 1993. Director of Wharton’s Pension Research Council and Boettner Center on Pensions & Retirement Research, and Research Associate at the National Bureau of Economic Research. Previously, Cornell University Professor from 1978 to 1993. | N/A |
Timothy J. Penny
(Born 1951) | Trustee,
since 1996;
Chair,
since 2018 | President and Chief Executive Officer of Southern Minnesota Initiative Foundation, a non-profit organization, since 2007. Member of the Board of Trustees of NorthStar Education Finance, Inc., a non-profit organization, since 2007. | N/A |
James G. Polisson
(Born 1959) | Trustee,
since 2018 | Retired. Chief Marketing Officer, Source (ETF) UK Services, Ltd, from 2015 to 2017. From 2012 to 2015, Principal of The Polisson Group, LLC, a management consulting, corporate advisory and principal investing company. Chief Executive Officer and Managing Director at Russell Investments, Global Exchange Traded Funds from 2010 to 2012. Managing Director of Barclays Global Investors from 1998 to 2010 and Global Chief Marketing Officer for iShares and Barclays Global Investors from 2000 to 2010. Trustee of the San Francisco Mechanics’ Institute, a non-profit organization, from 2013 to 2015. Board member of the Russell Exchange Traded Fund Trust from 2011 to 2012. Director of Barclays Global Investors Holdings Deutschland GmbH from 2006 to 2009. Mr. Polisson is an attorney and has a retired status with the Massachusetts and District of Columbia Bar Associations. | N/A |
Pamela Wheelock
(Born 1959) | Trustee,
since January
2020; previously
Trustee from
January 2018 to
July 2019 | Board member of the Destination Medical Center Economic Development Agency, Rochester, Minnesota since 2019. Interim President of the McKnight Foundation from January to September 2020. Acting Commissioner, Minnesota Department of Human Services, July 2019 through September 2019. Human Services Manager (part-time), Minnesota Department of Human Services, October 2019 through December 2019. Chief Operating Officer, Twin Cities Habitat for Humanity from 2017 to 2019. Vice President of University Services, University of Minnesota from 2012 to 2016. Prior thereto, on the Board of Directors, Governance Committee and Finance Committee for the Minnesota Philanthropy Partners (Saint Paul Foundation) from 2012 to 2018, Interim Chief Executive Officer of Blue Cross Blue Shield of Minnesota from 2011 to 2012, Chairman of the Board from 2009 to 2012 and Board Director from 2003 to 2015. Vice President, Leadership and Community Engagement, Bush Foundation, Saint Paul, Minnesota (a private foundation) from 2009 to 2011. Executive Vice President and Chief Financial Officer, Minnesota Sports and Entertainment from 2004 to 2009 and Senior Vice President from 2002 to 2004. Executive Vice President of the Minnesota Wild Foundation from 2004 to 2008. Commissioner of Finance, State of Minnesota, from 1999 to 2002. Currently Board Chair of the Minnesota Wild Foundation since 2010. | N/A |
* Length of service dates reflect the Trustee’s commencement of service with the Trust’s predecessor entities, where applicable.
28 | Wells Fargo Low Volatility U.S. Equity Fund
Other information (unaudited)
Officers
Name and
year of birth | Position held and
length of service | Principal occupations during past five years or longer |
Andrew Owen
(Born 1960) | President,
since 2017 | Executive Vice President of Wells Fargo & Company and Head of Affiliated Managers, Wells Fargo Asset Management, since 2014. In addition, Mr. Owen is currently President, Chief Executive Officer and Director of Wells Fargo Funds Management, LLC since 2017. Prior thereto, Executive Vice President responsible for marketing, investments and product development for Wells Fargo Funds Management, LLC, from 2009 to 2014. |
Jeremy DePalma
(Born 1974) | Treasurer,
since 2012
(for certain funds in
the Fund Complex);
since 2021 (for
the remaining funds in the
Fund Complex) | Senior Vice President of Wells Fargo Funds Management, LLC since 2009. Senior Vice President of Evergreen Investment Management Company, LLC from 2008 to 2010 and head of the Fund Reporting and Control Team within Fund Administration from 2005 to 2010. |
Michelle Rhee
(Born 1966) | Chief Legal Officer,
since 2019 | Secretary of Wells Fargo Funds Management, LLC and Chief Legal Counsel of Wells Fargo Asset Management since 2018. Deputy General Counsel of Wells Fargo Bank, N.A. since 2020 and Assistant General Counsel of Wells Fargo Bank, N.A. from 2018 to 2020. Associate General Counsel and Managing Director of Bank of America Corporation from 2004 to 2018. |
Catherine Kennedy
(Born 1969) | Secretary,
since 2019 | Vice President of Wells Fargo Funds Management, LLC and Senior Counsel of the Wells Fargo Legal Department since 2010. Vice President and Senior Counsel of Evergreen Investment Management Company, LLC from 1998 to 2010. |
Michael H. Whitaker
(Born 1967) | Chief Compliance Officer,
since 2016 | Chief Compliance Officer of Wells Fargo Asset Management since 2016. Senior Vice President and Chief Compliance Officer for Fidelity Investments from 2007 to 2016. |
1 The Statement of Additional Information includes additional information about the Trustees and is available, without charge, upon request, by calling 1-800-222-8222 or by visiting the website at wfam.com.
Wells Fargo Low Volatility U.S. Equity Fund | 29
For more information
More information about Wells Fargo Funds is available free upon request. To obtain literature, please write, visit the Fund's website, or call:
Wells Fargo Funds
P.O. Box 219967
Kansas City, MO 64121-9967
Website: wfam.com
Individual investors: 1-800-222-8222
Retail investment professionals: 1-888-877-9275
Institutional investment professionals: 1-866-765-0778
This report and the financial statements contained herein are submitted for the general information of the shareholders of the Fund. If this report is used for promotional purposes, distribution of the report must be accompanied or preceded by a current prospectus. Before investing, please consider the investment objectives, risks, charges, and expenses of the investment. For a current prospectus and, if available, a summary prospectus, containing this information, call 1-800-222-8222 or visit the Fund’s website at wfam.com. Read the prospectus carefully before you invest or send money.
Wells Fargo Asset Management (WFAM) is the trade name for certain investment advisory/management firms owned by Wells Fargo & Company. These firms include but are not limited to Wells Capital Management Incorporated and Wells Fargo Funds Management, LLC. Certain products managed by WFAM entities are distributed by Wells Fargo Funds Distributor, LLC (a broker-dealer and Member FINRA).
This material is for general informational and educational purposes only and is NOT intended to provide investment advice or a recommendation of any kind— including a recommendation for any specific investment, strategy, or plan.
INVESTMENT PRODUCTS: NOT FDIC INSURED ■ NO BANK GUARANTEE ■ MAY LOSE VALUE
© 2021 Wells Fargo & Company. All rights reserved.
PAR-0221-00372 03-22
SA270/SAR270 01-21
Semi-Annual Report
January 31, 2021
Wells Fargo
Premier Large Company Growth Fund
Reduce clutter.
Save trees.
Sign up for electronic delivery of prospectuses and shareholder reports at wellsfargo.com/ advantagedelivery
The views expressed and any forward-looking statements are as of January 31, 2021, unless otherwise noted, and are those of the Fund's portfolio managers and/or Wells Fargo Asset Management. Discussions of individual securities or the markets generally are not intended as individual recommendations. Future events or results may vary significantly from those expressed in any forward-looking statements. The views expressed are subject to change at any time in response to changing circumstances in the market. Wells Fargo Asset Management and the Fund disclaim any obligation to publicly update or revise any views expressed or forward-looking statements.
INVESTMENT PRODUCTS: NOT FDIC INSURED ■ NO BANK GUARANTEE ■ MAY LOSE VALUE
Wells Fargo Premier Large Company Growth Fund | 1
Letter to shareholders (unaudited)
Dear Shareholder:
We are pleased to offer you this semi-annual report for the Wells Fargo Premier Large Company Growth Fund for the six-month period that ended January 31, 2021. Despite a deeply challenging year, dominated by the spread of COVID-19 cases and a sharp drop in economic output throughout much of the world, global stocks performed extremely well, benefiting from ongoing central bank support and rising optimism over the development and distribution of effective COVID-19 vaccines. Bonds also had positive returns, led by global bonds and high-yield bonds.
For the six-month period, U.S. stocks, based on the S&P 500 Index1, gained 14.47%. International stocks, as measured by the MSCI ACWI ex USA Index (Net)2, returned 19.28%, while the MSCI EM Index (Net)3, had stronger performance, with a 24.07% gain. Among bond indexes, the Bloomberg Barclays U.S. Aggregate Bond Index4 returned -0.91%, the Bloomberg Barclays Global Aggregate ex-USD Index (unhedged)5 gained 3.71%, and the Bloomberg Barclays Municipal Bond Index6 returned 2.01% while the ICE BofA U.S. High Yield Index7 returned 6.82%.
The stock market rally continued in August.
The stock market continued a months-long rally in August despite concerns over rising numbers of U.S. and European COVID-19 cases. Relatively strong second-quarter earnings boosted investor sentiment along with the U.S. Federal Reserve’s announcement of a monetary policy shift expected to support longer-term low interest rates. U.S. manufacturing and services activity indexes beat expectations, while the U.S. housing market maintained strength. In Europe, retail sales expanded and consumer confidence was steady. China’s economy continued to expand.
Stocks grew more volatile in September on mixed economic data. U.S. economic activity continued to grow. However, U.S. unemployment remained elevated at 7.9% in September. With U.S. Congress delaying further fiscal relief and uncertainties surrounding a possible vaccine, doubts crept back into the financial markets. In the U.K., a lack of progress in Brexit talks weighed on markets. China’s economy picked up steam, fueled by increased global demand.
Andrew Owen
President
Wells Fargo Funds
“The stock market continued a months-long rally in August despite concerns over rising numbers of U.S. and European COVID-19 cases.”
| 1 | The S&P 500 Index consists of 500 stocks chosen for market size, liquidity, and industry group representation. It is a market-value-weighted index with each stock's weight in the index proportionate to its market value. You cannot invest directly in an index. |
| 2 | The Morgan Stanley Capital International (MSCI) All Country World Index (ACWI) ex USA Index (Net) is a free-float-adjusted market-capitalization-weighted index that is designed to measure the equity market performance of developed and emerging markets, excluding the United States. Source: MSCI. MSCI makes no express or implied warranties or representations and shall have no liability whatsoever with respect to any MSCI data contained herein. The MSCI data may not be further redistributed or used as a basis for other indices or any securities or financial products. This report is not approved, reviewed, or produced by MSCI. You cannot invest directly in an index. |
| 1 | The S&P 500 Index consists of 500 stocks chosen for market size, liquidity, and industry group representation. It is a market-value-weighted index with each stock's weight in the index proportionate to its market value. You cannot invest directly in an index. |
| 3 | The MSCI Emerging Markets (EM) Index (Net) is a free-float-adjusted market-capitalization-weighted index that is designed to measure equity market performance of emerging markets. You cannot invest directly in an index. |
| 1 | The S&P 500 Index consists of 500 stocks chosen for market size, liquidity, and industry group representation. It is a market-value-weighted index with each stock's weight in the index proportionate to its market value. You cannot invest directly in an index. |
| 4 | The Bloomberg Barclays U.S. Aggregate Bond Index is a broad-based benchmark that measures the investment-grade, U.S. dollar-denominated, fixed-rate taxable bond market, including Treasuries, government-related and corporate securities, mortgage-backed securities (agency fixed-rate and hybrid adjustable-rate mortgage pass-throughs), asset-backed securities, and commercial mortgage-backed securities. You cannot invest directly in an index. |
| 1 | The S&P 500 Index consists of 500 stocks chosen for market size, liquidity, and industry group representation. It is a market-value-weighted index with each stock's weight in the index proportionate to its market value. You cannot invest directly in an index. |
| 5 | The Bloomberg Barclays Global Aggregate ex-USD Index (unhedged) is an unmanaged index that provides a broad-based measure of the global investment-grade fixed-income markets excluding the U.S. dollar-denominated debt market. You cannot invest directly in an index. |
| 1 | The S&P 500 Index consists of 500 stocks chosen for market size, liquidity, and industry group representation. It is a market-value-weighted index with each stock's weight in the index proportionate to its market value. You cannot invest directly in an index. |
| 6 | The Bloomberg Barclays Municipal Bond Index is an unmanaged index composed of long-term tax-exempt bonds with a minimum credit rating of Baa. You cannot invest directly in an index. |
| 1 | The S&P 500 Index consists of 500 stocks chosen for market size, liquidity, and industry group representation. It is a market-value-weighted index with each stock's weight in the index proportionate to its market value. You cannot invest directly in an index. |
| 7 | The ICE BofA U.S. High Yield Index is a market-capitalization-weighted index of domestic and Yankee high-yield bonds. The index tracks the performance of high-yield securities traded in the U.S. bond market. You cannot invest directly in an index. Copyright 2021. ICE Data Indices, LLC. All rights reserved. |
2 | Wells Fargo Premier Large Company Growth Fund
Letter to shareholders (unaudited)
In October, capital markets stepped back from their six-month rally. Market volatility rose in advance of the U.S. election and amid a global increase in COVID-19 infections. Europe introduced tighter restrictions affecting economic activity. U.S. markets looked favorably at the prospect of Democratic control of the federal purse strings, which could lead to additional fiscal stimulus and a boost to economic activity. Meanwhile, China reported 4.9% third-quarter GDP growth.
Global stocks rallied in November, propelled by optimism over three promising COVID-19 vaccines. Reversing recent trends, value stocks outperformed growth stocks and cyclical stocks outpaced technology stocks. However, U.S. unemployment remained elevated, with a net job loss of 10 million since February. The eurozone services purchasing managers’ index contracted sharply while the region’s manufacturing activity grew. The U.S. election results added to the upbeat mood as investors anticipated more consistent policies in the new administration.
Financial markets ended the year with strength on high expectations for a rapid rollout of the COVID-19 vaccines, the successful passage of a $900 billion stimulus package, and rising expectations of additional economic support from a Democratic-led Congress. U.S. economic data were mixed with still-elevated unemployment and weak retail sales but growth in manufacturing output. In contrast, China’s economic expansion continued in both manufacturing and nonmanufacturing. U.S. COVID-19 infection rates continued to rise even as new state and local lockdown measures were implemented.
The year 2021 began with emerging market stocks leading all major asset classes in January, driven by China’s strong economic growth and a broad recovery in corporate earnings, which propelled China’s stock market higher. In the United States, positive news on vaccine trials and January expansion in both the manufacturing and services sectors was offset by a weak December monthly jobs report. This was compounded by technical factors as some hedge funds were forced to sell stocks to protect themselves against a well-publicized short squeeze coordinated by a group of retail investors. Eurozone sentiment and economic growth were particularly weak, reflecting the impact of a new lockdown with stricter social distancing along with a slow vaccine rollout.
Don’t let short-term uncertainty derail long-term investment goals.
Periods of investment uncertainty can present challenges, but experience has taught us that maintaining long-term investment goals can be an effective way to plan for the future. To help you create a sound strategy based on your personal goals and risk tolerance, Wells Fargo Funds offers more than 100 mutual funds spanning a wide range of asset classes and investment styles. Although diversification cannot guarantee an investment profit or prevent losses, we believe it can be an effective way to manage investment risk and potentially smooth out overall portfolio performance. We encourage investors to know their investments and to understand that appropriate levels of risk-taking may unlock opportunities.
Thank you for choosing to invest with Wells Fargo Funds. We appreciate your confidence in us and remain committed to helping you meet your financial needs.
Sincerely,
Andrew Owen
President
Wells Fargo Funds
“Global stocks rallied in November, propelled by optimism over three promising COVID-19 vaccines.”
For further information about your Fund, contact your investment professional, visit our website at wfam.com, or call us directly at 1-800-222-8222.
Wells Fargo Premier Large Company Growth Fund | 3
Performance highlights (unaudited)
Investment objective
The Fund seeks long-term capital appreciation.
Manager
Wells Fargo Funds Management, LLC
Subadviser
Wells Capital Management Incorporated
Portfolio managers
Joseph M. Eberhardy, CFA®‡, CPA
Robert Gruendyke, CFA®‡
Thomas C. Ognar, CFA®‡
Average annual total returns (%) as of January 31, 2021
| | | Including sales charge | | Excluding sales charge | | Expense ratios1 (%) |
| | Inception date | 1 year | 5 year | 10 year | | 1 year | 5 year | 10 year | | Gross | Net 2 |
| Class A (EKJAX) | 1-20-1998 | 24.90 | 19.77 | 14.63 | | 32.49 | 21.19 | 15.31 | | 1.14 | 1.11 |
| Class C (EKJCX) | 1-22-1998 | 30.56 | 20.27 | 14.45 | | 31.56 | 20.27 | 14.45 | | 1.89 | 1.86 |
| Class R4 (EKJRX)3 | 11-30-2012 | – | – | – | | 32.94 | 21.56 | 15.67 | | 0.86 | 0.80 |
| Class R6 (EKJFX)4 | 11-30-2012 | – | – | – | | 33.18 | 21.76 | 15.83 | | 0.71 | 0.65 |
| Administrator Class (WFPDX) | 7-16-2010 | – | – | – | | 32.66 | 21.33 | 15.47 | | 1.06 | 1.00 |
| Institutional Class (EKJYX) | 6-30-1999 | – | – | – | | 33.06 | 21.68 | 15.78 | | 0.81 | 0.70 |
| Russell 1000® Growth Index5 | – | – | – | – | | 34.46 | 22.22 | 16.83 | | – | – |
Figures quoted represent past performance, which is no guarantee of future results, and do not reflect taxes that a shareholder may pay on an investment in a fund. Investment return and principal value of an investment will fluctuate so that an investor’s shares, when redeemed, may be worth more or less than their original cost. Performance shown without sales charges would be lower if sales charges were reflected. Current performance may be lower or higher than the performance data quoted, which assumes the reinvestment of dividends and capital gains. Current month-end performance is available on the Fund’s website, wfam.com.
Please keep in mind that high double-digit returns were primarily achieved during favorable market conditions. You should not expect that such favorable returns can be consistently achieved. A fund’s performance, especially for short time periods, should not be the sole factor in making your investment decision.
Index returns do not include transaction costs associated with buying and selling securities, any mutual fund fees or expenses, or any taxes. It is not possible to invest directly in an index.
For Class A shares, the maximum front-end sales charge is 5.75%. For Class C shares, the maximum contingent deferred sales charge is 1.00%. Performance including a contingent deferred sales charge assumes the sales charge for the corresponding time period. Class R4, Class R6, Administrator Class, and Institutional Class and shares are sold without a front-end sales charge or contingent deferred sales charge.
Stock values fluctuate in response to the activities of individual companies and general market and economic conditions. Certain investment strategies tend to increase the total risk of an investment (relative to the broader market). The Fund is exposed to foreign investment risk. Consult the Fund’s prospectus for additional information on these and other risks.
Please see footnotes on page 5.
4 | Wells Fargo Premier Large Company Growth Fund
Performance highlights (unaudited)
| Ten largest holdings (%) as of January 31, 20216 |
| Amazon.com Incorporated | 9.10 |
| Microsoft Corporation | 8.58 |
| Alphabet Incorporated Class A | 4.14 |
| MasterCard Incorporated Class A | 3.58 |
| PayPal Holdings Incorporated | 3.20 |
| Facebook Incorporated Class A | 3.15 |
| MarketAxess Holdings Incorporated | 2.69 |
| CoStar Group Incorporated | 1.97 |
| Microchip Technology Incorporated | 1.96 |
| Pinterest Incorporated Class A | 1.95 |
| Sector allocation as of January 31, 20217 |
| ‡ | CFA® and Chartered Financial Analyst® are trademarks owned by CFA Institute. |
| 1 | Reflects the expense ratios as stated in the most recent prospectuses. The expense ratios shown are subject to change and may differ from the annualized expense ratios shown in the financial highlights of this report. |
| 2 | The manager has contractually committed through November 30, 2021, to waive fees and/or reimburse expenses to the extent necessary to cap total annual fund operating expenses after fee waivers at 1.11% for Class A, 1.86% for Class C, 0.80% for Class R4, 0.65% for Class R6, 1.00% for Administrator Class, and 0.70% for Institutional Class. Brokerage commissions, stamp duty fees, interest, taxes, acquired fund fees and expenses (if any), and extraordinary expenses are excluded from the expense caps. Prior to or after the commitment expiration date, the caps may be increased or the commitment to maintain the caps may be terminated only with the approval of the Board of Trustees. Without these caps, the Fund’s returns would have been lower. The expense ratio paid by an investor is the net expense ratio (the total annual fund operating expenses after fee waivers) as stated in the prospectuses. |
| 3 | Historical performance shown for the Class R4 shares prior to their inception reflects the performance of the Institutional Class shares, adjusted to reflect the higher expenses applicable to the Class R4 shares. |
| 4 | Historical performance shown for the Class R6 shares prior to their inception reflects the performance of the Institutional Class shares, and includes the higher expenses applicable to the Institutional Class shares. If these expenses had not been included, returns for the Class R6 shares would be higher. |
| 5 | The Russell 1000® Growth Index measures the performance of those Russell 1000 companies with higher price/book ratios and higher forecasted growth values. You cannot invest directly in an index. |
| 6 | Figures represent the percentage of the Fund's net assets. Holdings are subject to change and may have changed since the date specified. |
| 7 | Figures represent the percentage of the Fund's long-term investments. These amounts are subject to change and may have changed since the date specified. |
Wells Fargo Premier Large Company Growth Fund | 5
Fund expenses (unaudited)
As a shareholder of the Fund, you incur two types of costs: (1) transaction costs, including sales charges (loads) on purchase payments and contingent deferred sales charges (if any) on redemptions and (2) ongoing costs, including management fees, distribution (12b-1) and/or shareholder servicing fees, and other Fund expenses. This example is intended to help you understand your ongoing costs (in dollars) of investing in the Fund and to compare these costs with the ongoing costs of investing in other mutual funds.
The example is based on an investment of $1,000 invested at the beginning of the six-month period and held for the entire period from August 1, 2020 to January 31, 2021.
Actual expenses
The “Actual” line of the table below provides information about actual account values and actual expenses. You may use the information in this line, together with the amount you invested, to estimate the expenses that you paid over the period. Simply divide your account value by $1,000 (for example, an $8,600 account value divided by $1,000 = 8.6), then multiply the result by the number in the “Actual” line under the heading entitled “Expenses paid during period” for your applicable class of shares to estimate the expenses you paid on your account during this period.
Hypothetical example for comparison purposes
The “Hypothetical” line of the table below provides information about hypothetical account values and hypothetical expenses based on the Fund’s actual expense ratio and an assumed rate of return of 5% per year before expenses, which is not the Fund’s actual return. The hypothetical account values and expenses may not be used to estimate the actual ending account balance or expenses you paid for the period. You may use this information to compare the ongoing costs of investing in the Fund and other funds. To do so, compare this 5% hypothetical example with the 5% hypothetical examples that appear in the shareholder reports of the other funds.
Please note that the expenses shown in the table are meant to highlight your ongoing costs only and do not reflect any transactional costs, such as sales charges (loads) and contingent deferred sales charges. Therefore, the “Hypothetical” line of the table is useful in comparing ongoing costs only and will not help you determine the relative total costs of owning different funds. In addition, if these transactional costs were included, your costs would have been higher
| | Beginning
account value
8-1-2020 | Ending
account value
1-31-2021 | Expenses
paid during
the period1 | Annualized net
expense ratio |
| Class A | | | | |
| Actual | $1,000.00 | $1,165.90 | $ 6.01 | 1.10% |
| Hypothetical (5% return before expenses) | $1,000.00 | $1,019.66 | $ 5.60 | 1.10% |
| Class C | | | | |
| Actual | $1,000.00 | $1,160.96 | $10.13 | 1.86% |
| Hypothetical (5% return before expenses) | $1,000.00 | $1,015.83 | $ 9.45 | 1.86% |
| Class R4 | | | | |
| Actual | $1,000.00 | $1,167.56 | $ 4.37 | 0.80% |
| Hypothetical (5% return before expenses) | $1,000.00 | $1,021.17 | $ 4.08 | 0.80% |
| Class R6 | | | | |
| Actual | $1,000.00 | $1,168.66 | $ 3.55 | 0.65% |
| Hypothetical (5% return before expenses) | $1,000.00 | $1,021.93 | $ 3.31 | 0.65% |
| Administrator Class | | | | |
| Actual | $1,000.00 | $1,166.27 | $ 5.46 | 1.00% |
| Hypothetical (5% return before expenses) | $1,000.00 | $1,020.16 | $ 5.09 | 1.00% |
| Institutional Class | | | | |
| Actual | $1,000.00 | $1,168.34 | $ 3.83 | 0.70% |
| Hypothetical (5% return before expenses) | $1,000.00 | $1,021.68 | $ 3.57 | 0.70% |
1 Expenses paid is equal to the annualized net expense ratio of each class multiplied by the average account value over the period, multiplied by the number of days in the most recent fiscal half-year divided by the number of days in the fiscal year (to reflect the one-half-year period).
6 | Wells Fargo Premier Large Company Growth Fund
Portfolio of investments—January 31, 2021 (unaudited)
| | | | | Shares | Value |
| Common stocks: 99.86% | | | | | |
| Communication services: 14.36% | | | | | |
| Entertainment: 3.21% | | | | | |
| Activision Blizzard Incorporated | | | | 326,025 | $ 29,668,275 |
| Roku Incorporated † | | | | 130,000 | 50,573,900 |
| Spotify Technology SA † | | | | 67,935 | 21,399,525 |
| | | | | | 101,641,700 |
| Interactive media & services: 10.85% | | | | | |
| Alphabet Incorporated Class A † | | | | 71,910 | 131,405,458 |
| Alphabet Incorporated Class C † | | | | 17,653 | 32,406,318 |
| Facebook Incorporated Class A † | | | | 386,570 | 99,862,628 |
| Pinterest Incorporated Class A † | | | | 902,820 | 61,852,198 |
| ZoomInfo Technologies Incorporated † | | | | 391,253 | 18,784,057 |
| | | | | | 344,310,659 |
| Media: 0.30% | | | | | |
| Match Group Incorporated † | | | | 68,500 | 9,580,410 |
| Consumer discretionary: 17.98% | | | | | |
| Diversified consumer services: 0.86% | | | | | |
| Chegg Incorporated † | | | | 286,250 | 27,268,175 |
| Hotels, restaurants & leisure: 1.32% | | | | | |
| Airbnb Incorporated Class A † | | | | 91,560 | 16,813,163 |
| Chipotle Mexican Grill Incorporated † | | | | 16,960 | 25,100,800 |
| | | | | | 41,913,963 |
| Internet & direct marketing retail: 9.10% | | | | | |
| Amazon.com Incorporated † | | | | 90,030 | 288,654,186 |
| Multiline retail: 0.93% | | | | | |
| Dollar General Corporation | | | | 151,195 | 29,424,059 |
| Specialty retail: 2.92% | | | | | |
| Burlington Stores Incorporated † | | | | 103,135 | 25,670,302 |
| Five Below Incorporated † | | | | 123,270 | 21,662,237 |
| Floor & Decor Holdings Incorporated Class A † | | | | 211,610 | 19,482,933 |
| Petco Health and Wellness Company † | | | | 192,408 | 5,008,380 |
| RH † | | | | 44,220 | 21,020,419 |
| | | | | | 92,844,271 |
| Textiles, apparel & luxury goods: 2.85% | | | | | |
| Deckers Outdoor Corporation † | | | | 111,375 | 32,519,273 |
| lululemon athletica Incorporated † | | | | 175,815 | 57,786,874 |
| | | | | | 90,306,147 |
| Consumer staples: 0.79% | | | | | |
| Beverages: 0.79% | | | | | |
| Boston Beer Company Incorporated Class A † | | | | 27,380 | 25,104,448 |
The accompanying notes are an integral part of these financial statements.
Wells Fargo Premier Large Company Growth Fund | 7
Portfolio of investments—January 31, 2021 (unaudited)
| | | | | Shares | Value |
| Financials: 4.94% | | | | | |
| Capital markets: 4.94% | | | | | |
| LPL Financial Holdings Incorporated | | | | 165,400 | $ 17,919,436 |
| MarketAxess Holdings Incorporated | | | | 158,020 | 85,450,895 |
| MSCI Incorporated | | | | 74,235 | 29,345,096 |
| Tradeweb Markets Incorporated Class A | | | | 395,960 | 24,070,408 |
| | | | | | 156,785,835 |
| Health care: 14.42% | | | | | |
| Biotechnology: 1.35% | | | | | |
| Alnylam Pharmaceuticals Incorporated † | | | | 47,380 | 7,129,742 |
| Mirati Therapeutics Incorporated † | | | | 49,420 | 10,147,409 |
| Natera Incorporated † | | | | 131,400 | 14,012,496 |
| Seagen Incorporated † | | | | 69,220 | 11,370,769 |
| | | | | | 42,660,416 |
| Health care equipment & supplies: 5.05% | | | | | |
| Abbott Laboratories | | | | 378,020 | 46,719,492 |
| Boston Scientific Corporation † | | | | 157,790 | 5,592,078 |
| Edwards Lifesciences Corporation † | | | | 642,025 | 53,018,425 |
| Insulet Corporation † | | | | 155,350 | 41,506,413 |
| Novocure Limited † | | | | 83,980 | 13,517,421 |
| | | | | | 160,353,829 |
| Health care providers & services: 1.29% | | | | | |
| Amedisys Incorporated † | | | | 142,430 | 40,921,560 |
| Health care technology: 1.51% | | | | | |
| Veeva Systems Incorporated Class A † | | | | 172,710 | 47,743,952 |
| Life sciences tools & services: 2.79% | | | | | |
| Bio-Techne Corporation | | | | 87,430 | 28,406,881 |
| Repligen Corporation † | | | | 223,860 | 44,772,000 |
| Sotera Health Company † | | | | 590,395 | 15,403,406 |
| | | | | | 88,582,287 |
| Pharmaceuticals: 2.43% | | | | | |
| Horizon Therapeutics plc † | | | | 268,104 | 19,432,178 |
| Zoetis Incorporated | | | | 374,483 | 57,764,003 |
| | | | | | 77,196,181 |
| Industrials: 8.45% | | | | | |
| Air freight & logistics: 0.81% | | | | | |
| FedEx Corporation | | | | 108,725 | 25,587,342 |
| Building products: 0.80% | | | | | |
| The AZEK Company Incorporated † | | | | 634,210 | 25,298,637 |
| Commercial services & supplies: 1.14% | | | | | |
| Copart Incorporated † | | | | 292,095 | 32,057,426 |
| Waste Connections Incorporated | | | | 43,025 | 4,238,393 |
| | | | | | 36,295,819 |
The accompanying notes are an integral part of these financial statements.
8 | Wells Fargo Premier Large Company Growth Fund
Portfolio of investments—January 31, 2021 (unaudited)
| | | | | Shares | Value |
| Electrical equipment: 2.18% | | | | | |
| Generac Holdings Incorporated † | | | | 202,955 | $ 50,012,171 |
| Plug Power Incorporated † | | | | 266,055 | 16,806,694 |
| Shoals Technologies Group Class A † | | | | 65,174 | 2,211,354 |
| | | | | | 69,030,219 |
| Professional services: 1.97% | | | | | |
| CoStar Group Incorporated † | | | | 69,525 | 62,552,338 |
| Road & rail: 1.55% | | | | | |
| CSX Corporation | | | | 59,555 | 5,107,139 |
| Norfolk Southern Corporation | | | | 12,815 | 3,032,285 |
| Uber Technologies Incorporated † | | | | 249,700 | 12,717,221 |
| Union Pacific Corporation | | | | 143,725 | 28,381,376 |
| | | | | | 49,238,021 |
| Information technology: 37.40% | | | | | |
| IT services: 11.19% | | | | | |
| Fidelity National Information Services Incorporated | | | | 39,145 | 4,832,842 |
| Global Payments Incorporated | | | | 241,525 | 42,633,993 |
| MasterCard Incorporated Class A | | | | 358,730 | 113,462,712 |
| PayPal Holdings Incorporated † | | | | 433,220 | 101,507,778 |
| Snowflake Incorporated Class A † | | | | 9,882 | 2,692,351 |
| Square Incorporated Class A † | | | | 137,968 | 29,795,569 |
| Visa Incorporated Class A | | | | 158,235 | 30,578,914 |
| WEX Incorporated † | | | | 155,840 | 29,391,424 |
| | | | | | 354,895,583 |
| Semiconductors & semiconductor equipment: 5.63% | | | | | |
| Microchip Technology Incorporated | | | | 457,600 | 62,283,936 |
| Monolithic Power Systems Incorporated | | | | 132,510 | 47,079,478 |
| NXP Semiconductors NV | | | | 289,700 | 46,488,159 |
| Texas Instruments Incorporated | | | | 138,025 | 22,869,362 |
| | | | | | 178,720,935 |
| Software: 20.37% | | | | | |
| Anaplan Incorporated † | | | | 197,695 | 13,186,257 |
| Atlassian Corporation plc Class A † | | | | 126,475 | 29,232,167 |
| C3.ai Incorporated Class A † | | | | 121,972 | 17,027,291 |
| Cloudflare Incorporated Class A † | | | | 528,175 | 40,489,896 |
| Dynatrace Incorporated † | | | | 1,145,068 | 47,531,773 |
| Everbridge Incorporated † | | | | 210,635 | 27,999,711 |
| HubSpot Incorporated † | | | | 102,667 | 38,212,657 |
| Microsoft Corporation | | | | 1,173,545 | 272,215,498 |
| RingCentral Incorporated Class A † | | | | 116,240 | 43,348,221 |
| ServiceNow Incorporated † | | | | 89,145 | 48,419,998 |
| Unity Software Incorporated † | | | | 132,514 | 19,853,247 |
| Zendesk Incorporated † | | | | 338,775 | 48,864,906 |
| | | | | | 646,381,622 |
| Technology hardware, storage & peripherals: 0.21% | | | | | |
| Apple Incorporated | | | | 50,920 | 6,719,403 |
The accompanying notes are an integral part of these financial statements.
Wells Fargo Premier Large Company Growth Fund | 9
Portfolio of investments—January 31, 2021 (unaudited)
| | | | | Shares | Value |
| Materials: 1.52% | | | | | |
| Chemicals: 1.52% | | | | | |
| Linde plc | | | | 196,595 | $ 48,244,413 |
| Total Common stocks (Cost $1,464,291,878) | | | | | 3,168,256,410 |
| | | Yield | | | |
| Short-term investments: 1.46% | | | | | |
| Investment companies: 1.46% | | | | | |
| Securities Lending Cash Investments LLC ♠∩∞ | | 0.10% | | 42,278,978 | 42,278,978 |
| Wells Fargo Government Money Market Fund Select Class ♠∞ | | 0.03 | | 3,996,168 | 3,996,168 |
| Total Short-term investments (Cost $46,275,146) | | | | | 46,275,146 |
| Total investments in securities (Cost $1,510,567,024) | 101.32% | | | | 3,214,531,556 |
| Other assets and liabilities, net | (1.32) | | | | (41,837,330) |
| Total net assets | 100.00% | | | | $3,172,694,226 |
| † | Non-income-earning security |
| ♠ | The issuer of the security is an affiliated person of the Fund as defined in the Investment Company Act of 1940. |
| ∩ | The investment is a non-registered investment company purchased with cash collateral received from securities on loan. |
| ∞ | The rate represents the 7-day annualized yield at period end. |
Investments in affiliates
An affiliated investment is an investment in which the Fund owns at least 5% of the outstanding voting shares of the issuer or as a result of other relationships, such as the Fund and the issuer having the same investment manager. Transactions with issuers that were either affiliated persons of the Fund at the beginning of the period or the end of the period were as follows:
| | Value,
beginning of
period | Purchases | Sales
proceeds | Net
realized
gains
(losses) | | Net
change in
unrealized
gains
(losses) | | Value,
end of
period | | % of
net
assets | Shares,
end
of period | Income
from
affiliated
securities |
| Short-term investments | | | | | | | | | | | | |
| Investment companies | | | | | | | | | | | | |
| Securities Lending Cash Investments LLC | $ 0 | $258,323,050 | $(216,044,072) | $0 | | $0 | | $ 42,278,978 | | | 42,278,978 | $ 13,678# |
| Wells Fargo Government Money Market Fund Select Class | 2,465,488 | 205,650,581 | (204,119,901) | 0 | | 0 | | 3,996,168 | | | 3,996,168 | 1,052 |
| | | | | $0 | | $0 | | $46,275,146 | | 1.46% | | $14,730 |
| # | Amount shown represents income before fees and rebates. |
The accompanying notes are an integral part of these financial statements.
10 | Wells Fargo Premier Large Company Growth Fund
Statement of assets and liabilities—January 31, 2021 (unaudited)
| | |
| Assets | |
Investments in unaffiliated securities (including $41,407,834 of securities loaned), at value (cost $1,464,291,878)
| $ 3,168,256,410 |
Investments in affiliated securites, at value (cost $46,275,146)
| 46,275,146 |
Receivable for investments sold
| 16,886,230 |
Receivable for Fund shares sold
| 1,649,262 |
Receivable for dividends
| 538,889 |
Receivable for securities lending income, net
| 36,461 |
Prepaid expenses and other assets
| 95,490 |
Total assets
| 3,233,737,888 |
| Liabilities | |
Payable upon receipt of securities loaned
| 42,278,978 |
Payable for investments purchased
| 13,380,373 |
Payable for Fund shares redeemed
| 2,506,749 |
Management fee payable
| 1,682,196 |
Administration fees payable
| 366,025 |
Distribution fee payable
| 47,474 |
Trustees’ fees and expenses payable
| 2,873 |
Accrued expenses and other liabilities
| 778,994 |
Total liabilities
| 61,043,662 |
Total net assets
| $3,172,694,226 |
| Net assets consist of | |
Paid-in capital
| $ 1,305,814,618 |
Total distributable earnings
| 1,866,879,608 |
Total net assets
| $3,172,694,226 |
| Computation of net asset value and offering price per share | |
Net assets – Class A
| $ 1,347,797,382 |
Shares outstanding – Class A1
| 80,876,545 |
Net asset value per share – Class A
| $16.66 |
Maximum offering price per share – Class A2
| $17.68 |
Net assets – Class C
| $ 68,232,464 |
Shares outstanding – Class C1
| 6,117,415 |
Net asset value per share – Class C
| $11.15 |
Net assets – Class R4
| $ 1,345,743 |
Shares outstanding – Class R41
| 75,753 |
Net asset value per share – Class R4
| $17.76 |
Net assets – Class R6
| $ 1,056,158,606 |
Shares outstanding – Class R61
| 58,220,721 |
Net asset value per share – Class R6
| $18.14 |
Net assets – Administrator Class
| $ 57,212,331 |
Shares outstanding – Administrator Class1
| 3,341,676 |
Net asset value per share – Administrator Class
| $17.12 |
Net assets – Institutional Class
| $ 641,947,700 |
Shares outstanding – Institutional Class1
| 35,596,931 |
Net asset value per share – Institutional Class
| $18.03 |
| 1 | The Fund has an unlimited number of authorized shares. |
| 2 | Maximum offering price is computed as 100/94.25 of net asset value. On investments of $50,000 or more, the offering price is reduced. |
The accompanying notes are an integral part of these financial statements.
Wells Fargo Premier Large Company Growth Fund | 11
Statement of operations—six months ended January 31, 2021 (unaudited)
| | |
| Investment income | |
Dividends (net of foreign withholdings taxes of $56,961)
| $ 5,271,057 |
Income from affiliated securities
| 134,546 |
Total investment income
| 5,405,603 |
| Expenses | |
Management fee
| 10,102,443 |
| Administration fees | |
Class A
| 1,337,022 |
Class C
| 98,913 |
Class R4
| 495 |
Class R6
| 151,967 |
Administrator Class
| 36,674 |
Institutional Class
| 425,641 |
| Shareholder servicing fees | |
Class A
| 1,591,693 |
Class C
| 117,753 |
Class R4
| 619 |
Administrator Class
| 70,527 |
| Distribution fee | |
Class C
| 352,516 |
Custody and accounting fees
| 54,032 |
Professional fees
| 25,605 |
Registration fees
| 53,066 |
Shareholder report expenses
| 84,579 |
Trustees’ fees and expenses
| 9,707 |
Other fees and expenses
| 28,741 |
Total expenses
| 14,541,993 |
| Less: Fee waivers and/or expense reimbursements | |
Fund-level
| (418,631) |
Class A
| (84,906) |
Class C
| (44) |
Class R4
| (155) |
Class R6
| (125,663) |
Administrator Class
| (7,097) |
Institutional Class
| (163,112) |
Net expenses
| 13,742,385 |
Net investment loss
| (8,336,782) |
| Realized and unrealized gains (losses) on investments | |
Net realized gains on investments
| 370,650,056 |
Net change in unrealized gains (losses) on investments
| 111,806,313 |
Net realized and unrealized gains (losses) on investments
| 482,456,369 |
Net increase in net assets resulting from operations
| 474,119,587 |
The accompanying notes are an integral part of these financial statements.
12 | Wells Fargo Premier Large Company Growth Fund
Statement of changes in net assets
| | |
| | Six months ended
January 31, 2021
(unaudited) | Year ended
July 31, 2020 |
| Operations | | | | |
Net investment loss
| | $ (8,336,782) | | $ (8,544,770) |
Net realized gains on investments
| | 370,650,056 | | 152,795,477 |
Net change in unrealized gains (losses) on investments
| | 111,806,313 | | 410,793,163 |
Net increase in net assets resulting from operations
| | 474,119,587 | | 555,043,870 |
| Distributions to shareholders from | | | | |
| Net investment income and net realized gains | | | | |
Class A
| | (148,403,252) | | (79,445,426) |
Class C
| | (11,942,210) | | (13,534,953) |
Class R4
| | (135,124) | | (288,415) |
Class R6
| | (107,248,773) | | (58,912,621) |
Administrator Class
| | (6,166,075) | | (3,631,494) |
Institutional Class
| | (67,714,365) | | (44,767,006) |
Total distributions to shareholders
| | (341,609,799) | | (200,579,915) |
| Capital share transactions | Shares | | Shares | |
| Proceeds from shares sold | | | | |
Class A
| 3,942,591 | 68,872,399 | 5,450,625 | 77,021,734 |
Class C
| 219,972 | 2,558,023 | 768,733 | 7,336,013 |
Class R4
| 3,011 | 54,342 | 15,508 | 231,846 |
Class R6
| 2,250,919 | 41,278,532 | 5,901,603 | 86,487,057 |
Administrator Class
| 153,683 | 2,639,029 | 1,510,542 | 21,788,823 |
Institutional Class
| 1,731,056 | 31,502,542 | 5,199,312 | 74,602,092 |
| | | 146,904,867 | | 267,467,565 |
| Reinvestment of distributions | | | | |
Class A
| 8,581,749 | 138,681,054 | 5,635,528 | 74,670,743 |
Class C
| 1,066,052 | 11,545,329 | 1,226,541 | 11,578,543 |
Class R4
| 7,716 | 132,869 | 20,543 | 287,184 |
Class R6
| 6,007,269 | 105,607,780 | 4,072,770 | 57,914,790 |
Administrator Class
| 359,007 | 5,959,521 | 258,688 | 3,507,809 |
Institutional Class
| 3,347,542 | 58,515,035 | 2,794,274 | 39,538,976 |
| | | 320,441,588 | | 187,498,045 |
| Payment for shares redeemed | | | | |
Class A
| (4,920,080) | (83,135,410) | (11,885,781) | (161,114,742) |
Class C
| (4,910,159) | (60,555,511) | (6,937,436) | (70,405,278) |
Class R4
| (1,371) | (25,097) | (234,231) | (3,635,661) |
Class R6
| (5,194,968) | (95,382,637) | (9,076,035) | (132,489,008) |
Administrator Class
| (471,089) | (8,227,484) | (1,855,137) | (26,245,495) |
Institutional Class
| (7,124,410) | (128,013,405) | (13,095,393) | (188,459,918) |
| | | (375,339,544) | | (582,350,102) |
Net increase (decrease) in net assets resulting from capital share transactions
| | 92,006,911 | | (127,384,492) |
Total increase in net assets
| | 224,516,699 | | 227,079,463 |
| Net assets | | | | |
Beginning of period
| | 2,948,177,527 | | 2,721,098,064 |
End of period
| | $3,172,694,226 | | $2,948,177,527 |
The accompanying notes are an integral part of these financial statements.
Wells Fargo Premier Large Company Growth Fund | 13
Financial highlights
(For a share outstanding throughout each period)
| | | Year ended July 31 |
| Class A | Six months ended
January 31, 2021
(unaudited) | 2020 | 2019 | 2018 | 2017 | 2016 |
Net asset value, beginning of period
| $16.08 | $14.19 | $15.10 | $15.34 | $14.68 | $16.28 |
Net investment loss
| (0.06) 1 | (0.07) | (0.05) | (0.05) | (0.03) 1 | (0.03) |
Net realized and unrealized gains (losses) on investments
| 2.67 | 3.07 | 1.50 | 3.56 | 2.12 | (0.52) |
Total from investment operations
| 2.61 | 3.00 | 1.45 | 3.51 | 2.09 | (0.55) |
| Distributions to shareholders from | | | | | | |
Net realized gains
| (2.03) | (1.11) | (2.36) | (3.75) | (1.43) | (1.05) |
Net asset value, end of period
| $16.66 | $16.08 | $14.19 | $15.10 | $15.34 | $14.68 |
Total return2
| 16.59% | 22.78% | 12.97% | 26.54% | 16.01% | (3.22)% |
| Ratios to average net assets (annualized) | | | | | | |
Gross expenses
| 1.13% | 1.14% | 1.15% | 1.15% | 1.14% | 1.13% |
Net expenses
| 1.10% | 1.10% | 1.11% | 1.11% | 1.11% | 1.11% |
Net investment loss
| (0.75)% | (0.52)% | (0.40)% | (0.34)% | (0.20)% | (0.17)% |
| Supplemental data | | | | | | |
Portfolio turnover rate
| 24% | 45% | 60% | 45% | 65% | 47% |
Net assets, end of period (000s omitted)
| $1,347,797 | $1,178,453 | $1,050,751 | $1,048,632 | $986,791 | $1,697,746 |
| 1 | Calculated based upon average shares outstanding |
| 2 | Total return calculations do not include any sales charges. Returns for periods of less than one year are not annualized. |
The accompanying notes are an integral part of these financial statements.
14 | Wells Fargo Premier Large Company Growth Fund
Financial highlights
(For a share outstanding throughout each period)
| | | Year ended July 31 |
| Class C | Six months ended
January 31, 2021
(unaudited) | 2020 | 2019 | 2018 | 2017 | 2016 |
Net asset value, beginning of period
| $11.40 | $10.45 | $11.87 | $12.86 | $12.64 | $14.27 |
Net investment loss
| (0.09) 1 | (0.13) 1 | (0.12) 1 | (0.13) 1 | (0.12) 1 | (0.12) 1 |
Net realized and unrealized gains (losses) on investments
| 1.87 | 2.19 | 1.06 | 2.89 | 1.77 | (0.46) |
Total from investment operations
| 1.78 | 2.06 | 0.94 | 2.76 | 1.65 | (0.58) |
| Distributions to shareholders from | | | | | | |
Net realized gains
| (2.03) | (1.11) | (2.36) | (3.75) | (1.43) | (1.05) |
Net asset value, end of period
| $11.15 | $11.40 | $10.45 | $11.87 | $12.86 | $12.64 |
Total return2
| 16.10% | 21.87% | 12.09% | 25.68% | 15.05% | (3.92)% |
| Ratios to average net assets (annualized) | | | | | | |
Gross expenses
| 1.88% | 1.89% | 1.90% | 1.90% | 1.89% | 1.88% |
Net expenses
| 1.86% | 1.86% | 1.86% | 1.86% | 1.86% | 1.86% |
Net investment loss
| (1.50)% | (1.27)% | (1.14)% | (1.09)% | (0.95)% | (0.92)% |
| Supplemental data | | | | | | |
Portfolio turnover rate
| 24% | 45% | 60% | 45% | 65% | 47% |
Net assets, end of period (000s omitted)
| $68,232 | $111,046 | $153,404 | $201,138 | $206,026 | $296,896 |
| 1 | Calculated based upon average shares outstanding |
| 2 | Total return calculations do not include any sales charges. Returns for periods of less than one year are not annualized. |
The accompanying notes are an integral part of these financial statements.
Wells Fargo Premier Large Company Growth Fund | 15
Financial highlights
(For a share outstanding throughout each period)
| | | Year ended July 31 |
| Class R4 | Six months ended
January 31, 2021
(unaudited) | 2020 | 2019 | 2018 | 2017 | 2016 |
Net asset value, beginning of period
| $17.00 | $14.89 | $15.69 | $15.75 | $15.00 | $16.56 |
Net investment income (loss)
| (0.04) 1 | (0.03) 1 | (0.03) | (0.00) 1,2 | 0.01 1 | 0.02 1 |
Net realized and unrealized gains (losses) on investments
| 2.83 | 3.25 | 1.59 | 3.69 | 2.17 | (0.53) |
Total from investment operations
| 2.79 | 3.22 | 1.56 | 3.69 | 2.18 | (0.51) |
| Distributions to shareholders from | | | | | | |
Net realized gains
| (2.03) | (1.11) | (2.36) | (3.75) | (1.43) | (1.05) |
Net asset value, end of period
| $17.76 | $17.00 | $14.89 | $15.69 | $15.75 | $15.00 |
Total return3
| 16.76% | 23.20% | 13.21% | 27.06% | 16.30% | (2.91)% |
| Ratios to average net assets (annualized) | | | | | | |
Gross expenses
| 0.85% | 0.86% | 0.87% | 0.87% | 0.86% | 0.85% |
Net expenses
| 0.80% | 0.80% | 0.80% | 0.80% | 0.80% | 0.80% |
Net investment income (loss)
| (0.45)% | (0.20)% | (0.10)% | (0.02)% | 0.09% | 0.13% |
| Supplemental data | | | | | | |
Portfolio turnover rate
| 24% | 45% | 60% | 45% | 65% | 47% |
Net assets, end of period (000s omitted)
| $1,346 | $1,129 | $3,940 | $3,727 | $3,559 | $3,988 |
| 1 | Calculated based upon average shares outstanding |
| 2 | Amount is more than $(0.005) |
| 3 | Returns for periods of less than one year are not annualized. |
The accompanying notes are an integral part of these financial statements.
16 | Wells Fargo Premier Large Company Growth Fund
Financial highlights
(For a share outstanding throughout each period)
| | | Year ended July 31 |
| Class R6 | Six months ended
January 31, 2021
(unaudited) | 2020 | 2019 | 2018 | 2017 | 2016 |
Net asset value, beginning of period
| $17.31 | $15.12 | $15.87 | $15.87 | $15.08 | $16.62 |
Net investment income (loss)
| (0.03) | (0.01) | (0.00) 1,2 | 0.02 1 | 0.03 1 | 0.04 1 |
Net realized and unrealized gains (losses) on investments
| 2.89 | 3.31 | 1.61 | 3.73 | 2.19 | (0.53) |
Total from investment operations
| 2.86 | 3.30 | 1.61 | 3.75 | 2.22 | (0.49) |
| Distributions to shareholders from | | | | | | |
Net realized gains
| (2.03) | (1.11) | (2.36) | (3.75) | (1.43) | (1.05) |
Net asset value, end of period
| $18.14 | $17.31 | $15.12 | $15.87 | $15.87 | $15.08 |
Total return3
| 16.87% | 23.39% | 13.40% | 27.27% | 16.48% | (2.78)% |
| Ratios to average net assets (annualized) | | | | | | |
Gross expenses
| 0.70% | 0.71% | 0.71% | 0.72% | 0.71% | 0.70% |
Net expenses
| 0.65% | 0.65% | 0.65% | 0.65% | 0.65% | 0.65% |
Net investment income (loss)
| (0.30)% | (0.07)% | (0.02)% | 0.12% | 0.25% | 0.28% |
| Supplemental data | | | | | | |
Portfolio turnover rate
| 24% | 45% | 60% | 45% | 65% | 47% |
Net assets, end of period (000s omitted)
| $1,056,159 | $954,852 | $820,383 | $196,934 | $170,657 | $179,198 |
| 1 | Calculated based upon average shares outstanding |
| 2 | Amount is more than $(0.005) |
| 3 | Returns for periods of less than one year are not annualized. |
The accompanying notes are an integral part of these financial statements.
Wells Fargo Premier Large Company Growth Fund | 17
Financial highlights
(For a share outstanding throughout each period)
| | | Year ended July 31 |
| Administrator Class | Six months ended
January 31, 2021
(unaudited) | 2020 | 2019 | 2018 | 2017 | 2016 |
Net asset value, beginning of period
| $16.47 | $14.48 | $15.35 | $15.52 | $14.82 | $16.41 |
Net investment loss
| (0.06) 1 | (0.06) 1 | (0.04) 1 | (0.03) 1 | (0.01) 1 | (0.00) 1,2 |
Net realized and unrealized gains (losses) on investments
| 2.74 | 3.16 | 1.53 | 3.61 | 2.14 | (0.54) |
Total from investment operations
| 2.68 | 3.10 | 1.49 | 3.58 | 2.13 | (0.54) |
| Distributions to shareholders from | | | | | | |
Net realized gains
| (2.03) | (1.11) | (2.36) | (3.75) | (1.43) | (1.05) |
Net asset value, end of period
| $17.12 | $16.47 | $14.48 | $15.35 | $15.52 | $14.82 |
Total return3
| 16.63% | 23.02% | 13.02% | 26.70% | 16.14% | (3.13)% |
| Ratios to average net assets (annualized) | | | | | | |
Gross expenses
| 1.05% | 1.06% | 1.07% | 1.07% | 1.06% | 1.04% |
Net expenses
| 1.00% | 1.00% | 1.00% | 1.00% | 1.00% | 0.98% |
Net investment loss
| (0.65)% | (0.42)% | (0.29)% | (0.22)% | (0.06)% | (0.02)% |
| Supplemental data | | | | | | |
Portfolio turnover rate
| 24% | 45% | 60% | 45% | 65% | 47% |
Net assets, end of period (000s omitted)
| $57,212 | $54,341 | $49,042 | $57,582 | $82,998 | $292,900 |
| 1 | Calculated based upon average shares outstanding |
| 2 | Amount is more than $(0.005) |
| 3 | Returns for periods of less than one year are not annualized. |
The accompanying notes are an integral part of these financial statements.
18 | Wells Fargo Premier Large Company Growth Fund
Financial highlights
(For a share outstanding throughout each period)
| | | Year ended July 31 |
| Institutional Class | Six months ended
January 31, 2021
(unaudited) | 2020 | 2019 | 2018 | 2017 | 2016 |
Net asset value, beginning of period
| $17.22 | $15.06 | $15.82 | $15.84 | $15.06 | $16.61 |
Net investment income (loss)
| (0.03) 1 | (0.02) 1 | 0.00 1,2 | 0.01 1 | 0.02 1 | 0.03 1 |
Net realized and unrealized gains (losses) on investments
| 2.87 | 3.29 | 1.60 | 3.72 | 2.19 | (0.53) |
Total from investment operations
| 2.84 | 3.27 | 1.60 | 3.73 | 2.21 | (0.50) |
| Distributions to shareholders from | | | | | | |
Net realized gains
| (2.03) | (1.11) | (2.36) | (3.75) | (1.43) | (1.05) |
Net asset value, end of period
| $18.03 | $17.22 | $15.06 | $15.82 | $15.84 | $15.06 |
Total return3
| 16.83% | 23.28% | 13.38% | 27.17% | 16.44% | (2.85)% |
| Ratios to average net assets (annualized) | | | | | | |
Gross expenses
| 0.80% | 0.81% | 0.82% | 0.82% | 0.81% | 0.80% |
Net expenses
| 0.70% | 0.70% | 0.70% | 0.70% | 0.70% | 0.70% |
Net investment income (loss)
| (0.35)% | (0.12)% | 0.02% | 0.07% | 0.19% | 0.23% |
| Supplemental data | | | | | | |
Portfolio turnover rate
| 24% | 45% | 60% | 45% | 65% | 47% |
Net assets, end of period (000s omitted)
| $641,948 | $648,357 | $643,578 | $1,043,161 | $949,344 | $1,097,976 |
| 1 | Calculated based upon average shares outstanding |
| 2 | Amount is less than $0.005. |
| 3 | Returns for periods of less than one year are not annualized. |
The accompanying notes are an integral part of these financial statements.
Wells Fargo Premier Large Company Growth Fund | 19
Notes to financial statements (unaudited)
1. ORGANIZATION
Wells Fargo Funds Trust (the “Trust”), a Delaware statutory trust organized on March 10, 1999, is an open-end management investment company registered under the Investment Company Act of 1940, as amended (the “1940 Act”). As an investment company, the Trust follows the accounting and reporting guidance in Financial Accounting Standards Board (“FASB”) Accounting Standards Codification Topic 946, Financial Services – Investment Companies. These financial statements report on the Wells Fargo Premier Large Company Growth Fund (the “Fund”) which is a diversified series of the Trust.
2. SIGNIFICANT ACCOUNTING POLICIES
The following significant accounting policies, which are consistently followed in the preparation of the financial statements of the Fund, are in conformity with U.S. generally accepted accounting principles which require management to make estimates and assumptions that affect the reported amounts of assets and liabilities, disclosure of contingent assets and liabilities at the date of the financial statements, and the reported amounts of income and expenses during the reporting period. Actual results could differ from those estimates.
Securities valuation
All investments are valued each business day as of the close of regular trading on the New York Stock Exchange (generally 4 p.m. Eastern Time), although the Fund may deviate from this calculation time under unusual or unexpected circumstances.
Equity securities that are listed on a foreign or domestic exchange or market are valued at the official closing price or, if none, the last sales price. If no sale occurs on the principal exchange or market that day, a fair value price will be determined in accordance with the Fund’s Valuation Procedures.
Investments in registered open-end investment companies are valued at net asset value. Interests in non-registered investment companies that are redeemable at net asset value are fair valued normally at net asset value.
Investments which are not valued using any of the methods discussed above are valued at their fair value, as determined in good faith by the Board of Trustees. The Board of Trustees has established a Valuation Committee comprised of the Trustees and has delegated to it the authority to take any actions regarding the valuation of portfolio securities that the Valuation Committee deems necessary or appropriate, including determining the fair value of portfolio securities, unless the determination has been delegated to the Wells Fargo Asset Management Pricing Committee at Wells Fargo Funds Management, LLC (“Funds Management”). The Board of Trustees retains the authority to make or ratify any valuation decisions or approve any changes to the Valuation Procedures as it deems appropriate. On a quarterly basis, the Board of Trustees receives reports on any valuation actions taken by the Valuation Committee or the Wells Fargo Asset Management Pricing Committee which may include items for ratification.
Foreign currency translation
The accounting records of the Fund are maintained in U.S. dollars. The values of other assets and liabilities denominated in foreign currencies are translated into U.S. dollars at rates provided by an independent foreign currency pricing source at a time each business day specified by the Wells Fargo Asset Management Pricing Committee. Purchases and sales of securities, and income and expenses are converted at the rate of exchange on the respective dates of such transactions. Net realized foreign exchange gains or losses arise from sales of foreign currencies, currency gains or losses realized between the trade and settlement dates on securities transactions, and the difference between the amounts of dividends, interest and foreign withholding taxes recorded and the U.S. dollar equivalent of the amounts actually paid or received. Net unrealized foreign exchange gains and losses arise from changes in the fair value of assets and liabilities other than investments in securities resulting from changes in exchange rates. The changes in net assets arising from changes in exchange rates of securities and the changes in net assets resulting from changes in market prices of securities are not separately presented. Such changes are included in net realized and unrealized gains or losses from investments.
Securities lending
The Fund may lend its securities from time to time in order to earn additional income in the form of fees or interest on securities received as collateral or the investment of any cash received as collateral. When securities are on loan, the Fund receives interest or dividends on those securities. Cash collateral received in connection with its securities lending transactions is invested in Securities Lending Cash Investments, LLC (the “Securities Lending Fund”). Investments in Securities Lending Fund are valued at the evaluated bid price provided by an independent pricing service. Income earned from investment in the Securities Lending Fund (net of fees and rebates), if any, is included in income from affiliated securities on the Statement of Operations.
20 | Wells Fargo Premier Large Company Growth Fund
Notes to financial statements (unaudited)
In a securities lending transaction, the net asset value of the Fund is affected by an increase or decrease in the value of the securities loaned and by an increase or decrease in the value of the instrument in which collateral is invested. The amount of securities lending activity undertaken by the Fund fluctuates from time to time. The Fund has the right under the lending agreement to recover the securities from the borrower on demand. In the event of default or bankruptcy by the borrower, the Fund may be prevented from recovering the loaned securities or gaining access to the collateral or may experience delays or costs in doing so. In such an event, the terms of the agreement allow the unaffiliated securities lending agent to use the collateral to purchase replacement securities on behalf of the Fund or pay the Fund the market value of the loaned securities. The Fund bears the risk of loss with respect to depreciation of its investment of the cash collateral.
Security transactions and income recognition
Securities transactions are recorded on a trade date basis. Realized gains or losses are recorded on the basis of identified cost.
Dividend income is recognized on the ex-dividend date. Dividend income is recorded net of foreign taxes withheld where recovery of such taxes is not assured.
Distributions to shareholders
Distributions to shareholders from net investment income and any net realized gains are recorded on the ex-dividend date and paid at least annually. Such distributions are determined in accordance with income tax regulations and may differ from U.S. generally accepted accounting principles. Dividend sources are estimated at the time of declaration. The tax character of distributions is determined as of the Fund’s fiscal year end. Therefore, a portion of the Fund’s distributions made prior to the Fund’s fiscal year end may be categorized as a tax return of capital at year end.
Federal and other taxes
The Fund intends to continue to qualify as a regulated investment company by distributing substantially all of its investment company taxable income and any net realized capital gains (after reduction for capital loss carryforwards) sufficient to relieve it from all, or substantially all, federal income taxes. Accordingly, no provision for federal income taxes was required.
The Fund’s income and federal excise tax returns and all financial records supporting those returns for the prior three fiscal years are subject to examination by the federal and Delaware revenue authorities. Management has analyzed the Fund’s tax positions taken on federal, state, and foreign tax returns for all open tax years and does not believe that there are any uncertain tax positions that require recognition of a tax liability.
As of January 31, 2021, the aggregate cost of all investments for federal income tax purposes was $1,510,565,778 and the unrealized gains (losses) consisted of:
| Gross unrealized gains | $1,706,726,387 |
| Gross unrealized losses | (2,760,609) |
| Net unrealized gains | $1,703,965,778 |
As of July 31, 2020, the Fund had a qualified late-year ordinary loss of $6,045,614 which was recognized on the first day of the current fiscal year.
Class allocations
The separate classes of shares offered by the Fund differ principally in applicable sales charges, distribution, shareholder servicing, and administration fees. Class specific expenses are charged directly to that share class. Investment income, common fund-level expenses, and realized and unrealized gains (losses) on investments are allocated daily to each class of shares based on the relative proportion of net assets of each class.
Wells Fargo Premier Large Company Growth Fund | 21
Notes to financial statements (unaudited)
3. FAIR VALUATION MEASUREMENTS
Fair value measurements of investments are determined within a framework that has established a fair value hierarchy based upon the various data inputs utilized in determining the value of the Fund’s investments. The three-level hierarchy gives the highest priority to unadjusted quoted prices in active markets for identical assets or liabilities (Level 1) and the lowest priority to unobservable inputs (Level 3). The Fund’s investments are classified within the fair value hierarchy based on the lowest level of input that is significant to the fair value measurement. The inputs are summarized into three broad levels as follows:
| ■ | Level 1 – quoted prices in active markets for identical securities |
| ■ | Level 2 – other significant observable inputs (including quoted prices for similar securities, interest rates, prepayment speeds, credit risk, etc.) |
| ■ | Level 3 – significant unobservable inputs (including the Fund’s own assumptions in determining the fair value of investments) |
The inputs or methodologies used for valuing investments in securities are not necessarily an indication of the risk associated with investing in those securities.
The following is a summary of the inputs used in valuing the Fund’s assets and liabilities as of January 31, 2021:
| | Quoted prices
(Level 1) | Other significant
observable inputs
(Level 2) | Significant
unobservable inputs
(Level 3) | Total |
| Assets | | | | |
| Investments in: | | | | |
| Common stocks | | | | |
| Communication services | $ 455,532,769 | $0 | $0 | $ 455,532,769 |
| Consumer discretionary | 570,410,801 | 0 | 0 | 570,410,801 |
| Consumer staples | 25,104,448 | 0 | 0 | 25,104,448 |
| Financials | 156,785,835 | 0 | 0 | 156,785,835 |
| Health care | 457,458,225 | 0 | 0 | 457,458,225 |
| Industrials | 268,002,376 | 0 | 0 | 268,002,376 |
| Information technology | 1,186,717,543 | 0 | 0 | 1,186,717,543 |
| Materials | 48,244,413 | 0 | 0 | 48,244,413 |
| Short-term investments | | | | |
| Investment companies | 46,275,146 | 0 | 0 | 46,275,146 |
| Total assets | $3,214,531,556 | $0 | $0 | $3,214,531,556 |
Additional sector, industry or geographic detail, if any, is included in the Portfolio of Investments.
For the six months ended January 31, 2021, the Fund did not have any transfers into/out of Level 3.
4. TRANSACTIONS WITH AFFILIATES
Management fee
Funds Management, an indirect wholly owned subsidiary of Wells Fargo & Company (“Wells Fargo”), is the manager of the Fund and provides advisory and fund-level administrative services under an investment management agreement. Under the investment management agreement, Funds Management is responsible for, among other services, implementing the investment objectives and strategies of the Fund, supervising the subadviser and providing fund-level administrative services in connection with the Fund’s operations. As compensation for its services under the investment management agreement, Funds Management is entitled to receive a management fee at the following annual rate based on the Fund’s average daily net assets:
22 | Wells Fargo Premier Large Company Growth Fund
Notes to financial statements (unaudited)
| Average daily net assets | Management fee |
| First $500 million | 0.700% |
| Next $500 million | 0.675 |
| Next $1 billion | 0.650 |
| Next $2 billion | 0.625 |
| Next $1 billion | 0.600 |
| Next $3 billion | 0.590 |
| Next $2 billion | 0.565 |
| Next $2 billion | 0.555 |
| Next $4 billion | 0.530 |
| Over $16 billion | 0.505 |
For the six months ended January 31, 2021, the management fee was equivalent to an annual rate of 0.65% of the Fund’s average daily net assets.
Funds Management has retained the services of a subadviser to provide daily portfolio management to the Fund. The fee for subadvisory services is borne by Funds Management. Wells Capital Management Incorporated ("WellsCap"), an affiliate of Funds Management and an indirect wholly owned subsidiary of Wells Fargo, is the subadviser to the Fund and is entitled to receive a fee from Funds Management at an annual rate starting at 0.35% and declining to 0.275% as the average daily net assets of the Fund increase.
Administration fees
Under a class-level administration agreement, Funds Management provides class-level administrative services to the Fund, which includes paying fees and expenses for services provided by the transfer agent, sub-transfer agents, omnibus account servicers and record-keepers. As compensation for its services under the class-level administration agreement, Funds Management receives an annual fee which is calculated based on the average daily net assets of each class as follows:
| | Class-level
administration fee |
| Class A | 0.21% |
| Class C | 0.21 |
| Class R4 | 0.08 |
| Class R6 | 0.03 |
| Administrator Class | 0.13 |
| Institutional Class | 0.13 |
Waivers and/or expense reimbursements
Funds Management has contractually waived and/or reimbursed management and administration fees to the extent necessary to maintain certain net operating expense ratios for the Fund. When each class of the Fund has exceeded its expense cap, Funds Management has waived fees and/or reimbursed expenses from fund-level expenses on a proportionate basis and then from class specific expenses. When only certain classes exceed their expense caps, waivers and/or reimbursements are applied against class specific expenses before fund-level expenses. Funds Management has committed through November 30, 2021 to waive fees and/or reimburse expenses to the extent necessary to cap expenses. Prior to or after the commitment expiration date, the cap may be increased or the commitment to maintain the cap may be terminated only with the approval of the Board of Trustees. The expense caps are as follows:
Wells Fargo Premier Large Company Growth Fund | 23
Notes to financial statements (unaudited)
| | Expense ratio caps |
| Class A | 1.11% |
| Class C | 1.86 |
| Class R4 | 0.80 |
| Class R6 | 0.65 |
| Administrator Class | 1.00 |
| Institutional Class | 0.70 |
Distribution fee
The Trust has adopted a distribution plan for Class C shares of the Fund pursuant to Rule 12b-1 under the 1940 Act. A distribution fee is charged charged to Class C shares and paid to Wells Fargo Funds Distributor, LLC (“Funds Distributor”), the principal underwriter, at an annual rate of 0.75% of the average daily net assets of Class C shares.
In addition, Funds Distributor is entitled to receive the front-end sales charge from the purchase of Class A shares and a contingent deferred sales charge on the redemption of certain Class A shares. Funds Distributor is also entitled to receive the contingent deferred sales charges from redemptions of Class C shares. For the six months ended January 31, 2021, Funds Distributor received $9,185 from the sale of Class A shares. No contingent deferred sales charges were incurred by Class A and Class C shares for the six months ended January 31, 2021.
Shareholder servicing fees
The Trust has entered into contracts with one or more shareholder servicing agents, whereby Class A, Class C, and Administrator Class of the Fund are charged a fee at an annual rate of 0.25% of the average daily net assets of each respective class. Class R4 is charged a fee at an annual rate of 0.10% of its average daily net assets. A portion of these total shareholder servicing fees were paid to affiliates of Wells Fargo.
Interfund transactions
The Fund may purchase or sell portfolio investment securities to certain other Wells Fargo affiliates pursuant to Rule 17a-7 under the 1940 Act and under procedures adopted by the Board of Trustees. The procedures have been designed to ensure that these interfund transactions, which do not incur broker commissions, are effected at current market prices.
5. INVESTMENT PORTFOLIO TRANSACTIONS
Purchases and sales of investments, excluding U.S. government obligations (if any) and short-term securities, for the six months ended January 31, 2021 were $747,368,177 and $1,012,293,156, respectively.
6. SECURITIES LENDING TRANSACTIONS
The Fund lends its securities through an unaffiliated securities lending agent and receives collateral in the form of cash or securities with a value at least equal to the value of the securities on loan. The value of the loaned securities is determined at the close of each business day and any increases or decreases in the required collateral are exchanged between the Fund and the counterparty on the next business day. Cash collateral received is invested in the Securities Lending Fund which seeks to provide a positive return compared to the daily Federal Funds Open Rate by investing in high-quality, U.S. dollar-denominated short-term money market instruments and is exempt from registration under Section 3(c)(7) of the 1940 Act. Securities Lending Fund is managed by Funds Management and is subadvised by WellsCap. Funds Management receives an advisory fee starting at 0.05% and declining to 0.01% as the average daily net assets of the Securities Lending Fund increase. All of the fees received by Funds Management are paid to WellsCap for its services as subadviser.
In the event of counterparty default or the failure of a borrower to return a loaned security, the Fund has the right to use the collateral to offset any losses incurred. As of January 31, 2021, the Fund had securities lending transactions with the following counterparties which are subject to offset:
24 | Wells Fargo Premier Large Company Growth Fund
Notes to financial statements (unaudited)
| Counterparty | Value of
securities on
loan | Collateral
received1 | Net amount |
| Bank of America Securities Incorporated | $ 4,561,724 | $ (4,561,724) | $0 |
| Barclays Capital Incorporated | 4,687,072 | (4,687,072) | 0 |
| JPMorgan Securities LLC | 15,020,638 | (15,020,638) | 0 |
| Morgan Stanley & Co. LLC | 1,332,000 | (1,332,000) | 0 |
| Nomura Securities International Incorporated | 15,806,400 | (15,806,400) | 0 |
1 Collateral received within this table is limited to the collateral for the net transaction with the counterparty.
7. BANK BORROWINGS
The Trust (excluding the money market funds), Wells Fargo Master Trust and Wells Fargo Variable Trust are parties to a $350,000,000 revolving credit agreement whereby the Fund is permitted to use bank borrowings for temporary or emergency purposes, such as to fund shareholder redemption requests. Interest under the credit agreement is charged to the Fund based on a borrowing rate equal to the higher of the Federal Funds rate in effect on that day plus 1.25% or the overnight LIBOR rate in effect on that day plus 1.25%. In addition, an annual commitment fee equal to 0.25% of the unused balance is allocated to each participating fund.
For the six months ended January 31, 2021, there were no borrowings by the Fund under the agreement.
8. CONCENTRATION RISKS
Concentration risks result from exposure to a limited number of sectors. As of the end of the period, the Fund concentrated its portfolio in investments related to the information technology sector. A fund that invests a substantial portion of its assets in any sector may be more affected by changes in that sector than would be a fund whose investments are not heavily weighted in any sector.
9. INDEMNIFICATION
Under the Fund's organizational documents, the officers and Trustees have been granted certain indemnification rights against certain liabilities that may arise out of performance of their duties to the Fund. The Fund has entered into a separate agreement with each Trustee that converts indemnification rights currently existing under the Fund’s organizational documents into contractual rights that cannot be changed in the future without the consent of the Trustee. Additionally, in the normal course of business, the Fund may enter into contracts with service providers that contain a variety of indemnification clauses. The Fund’s maximum exposure under these arrangements is dependent on future claims that may be made against the Fund and, therefore, cannot be estimated.
10. NEW ACCOUNTING PRONOUNCEMENT
In August 2018, FASB issued Accounting Standards Update (“ASU”) No. 2018-13, Fair Value Measurement (Topic 820) Disclosure Framework - Changes to the Disclosure Requirements for Fair Value Measurement. ASU 2018-13 updates the disclosure requirements on fair value measurements in Topic 820, Fair Value Measurements. The amendments are effective for fiscal years, and interim periods within those fiscal years, beginning after December 15, 2019. Management has adopted this guidance which did not have a material impact on the financial statements.
11. CORONAVIRUS (COVID-19) PANDEMIC
On March 11, 2020, the World Health Organization announced that it had made the assessment that coronavirus disease 2019 (“COVID-19”) is a pandemic. The impacts of COVID-19 are affecting the entire global economy, individual companies and investment products, the funds, and the market in general. There is significant uncertainty around the extent and duration of business disruptions related to COVID-19 and the impacts may be short term or may last for an extended period of time. The risk of further spreading of COVID-19 has led to significant uncertainty and volatility in the financial markets.
12. SUBSEQUENT EVENT
On February 23, 2021, Wells Fargo announced that it has entered into a definitive agreement to sell Wells Fargo Asset Management (“WFAM”) to GTCR LLC and Reverence Capital Partners, L.P. WFAM is the trade name used by the asset management businesses of Wells Fargo and includes Wells Fargo Funds Management, LLC, the investment manager to the Fund, Wells Capital Management Incorporated and Wells Fargo Asset Management (International) Limited, both registered
Wells Fargo Premier Large Company Growth Fund | 25
Notes to financial statements (unaudited)
investment advisers providing sub-advisory services to certain funds, and Wells Fargo Funds Distributor, LLC, the Fund’s principal underwriter. As part of the transaction, Wells Fargo will own a 9.9% equity interest and will continue to serve as an important client and distribution partner.
Consummation of the transaction will result in the automatic termination of the Fund’s investment management agreement and sub-advisory agreement. The Fund’s Board of Trustees will be asked to approve new investment management arrangements with the new company. If approved by the Board, the new investment management arrangements with the new company will be presented to the shareholders of the Fund for approval, and, if approved by shareholders, would take effect upon the closing of the transaction. The transaction is expected to close in the second half of 2021, subject to customary closing conditions.
26 | Wells Fargo Premier Large Company Growth Fund
Other information (unaudited)
PROXY VOTING INFORMATION
A description of the policies and procedures used to determine how to vote proxies relating to portfolio securities is available without charge, upon request, by calling 1-800-222-8222, visiting our website at wfam.com, or visiting the SEC website at sec.gov. Information regarding how the proxies related to portfolio securities were voted during the most recent 12-month period ended June 30 is available on the website at wfam.com or by visiting the SEC website at sec.gov.
QUARTERLY PORTFOLIO HOLDINGS INFORMATION
The Fund files its complete schedule of portfolio holdings with the SEC for the first and third quarters of each fiscal year as an exhibit to its reports on Form N-PORT. Shareholders may view the filed Form N-PORT by visiting the SEC website at sec.gov.
Wells Fargo Premier Large Company Growth Fund | 27
Other information (unaudited)
BOARD OF TRUSTEES AND OFFICERS
Each of the Trustees and Officers listed in the table below acts in identical capacities for each fund in the Wells Fargo family of funds, which consists of 144 mutual funds comprising the Wells Fargo Funds Trust, Wells Fargo Variable Trust, Wells Fargo Master Trust and four closed-end funds (collectively the “Fund Complex”). This table should be read in conjunction with the Prospectus and the Statement of Additional Information1. The mailing address of each Trustee and Officer is 525 Market Street, 12th Floor, San Francisco, CA 94105. Each Trustee and Officer serves an indefinite term, however, each Trustee serves such term until reaching the mandatory retirement age established by the Trustees.
Independent Trustees
Name and
year of birth | Position held and
length of service* | Principal occupations during past five years or longer | Current other
public company or
investment
company
directorships |
William R. Ebsworth
(Born 1957) | Trustee,
since 2015 | Retired. From 1984 to 2013, equities analyst, portfolio manager, research director and chief investment officer at Fidelity Management and Research Company in Boston, Tokyo, and Hong Kong, and retired in 2013 as Chief Investment Officer of Fidelity Strategic Advisers, Inc. where he led a team of investment professionals managing client assets. Prior thereto, Board member of Hong Kong Securities Clearing Co., Hong Kong Options Clearing Corp., the Thailand International Fund, Ltd., Fidelity Investments Life Insurance Company, and Empire Fidelity Investments Life Insurance Company. Audit Committee Chair and Investment Committee Chair of the Vincent Memorial Hospital Endowment (non-profit organization). Mr. Ebsworth is a CFA® charterholder. | N/A |
Jane A. Freeman
(Born 1953) | Trustee,
since 2015;
Chair Liaison,
since 2018 | Retired. From 2012 to 2014 and 1999 to 2008, Chief Financial Officer of Scientific Learning Corporation. From 2008 to 2012, Ms. Freeman provided consulting services related to strategic business projects. Prior to 1999, Portfolio Manager at Rockefeller & Co. and Scudder, Stevens & Clark. Board member of the Harding Loevner Funds from 1996 to 2014, serving as both Lead Independent Director and chair of the Audit Committee. Board member of the Russell Exchange Traded Funds Trust from 2011 to 2012 and the chair of the Audit Committee. Ms. Freeman is also an inactive Chartered Financial Analyst. | N/A |
Isaiah Harris, Jr.
(Born 1952) | Trustee,
since 2009; Audit
Committee
Chair,
since 2019 | Retired. Chairman of the Board of CIGNA Corporation since 2009, and Director since 2005. From 2003 to 2011, Director of Deluxe Corporation. Prior thereto, President and CEO of BellSouth Advertising and Publishing Corp. from 2005 to 2007, President and CEO of BellSouth Enterprises from 2004 to 2005 and President of BellSouth Consumer Services from 2000 to 2003. Emeritus member of the Iowa State University Foundation Board of Governors. Emeritus Member of the Advisory Board of Iowa State University School of Business. Advisory Board Member, Palm Harbor Academy (private school). Mr. Harris is a certified public accountant (inactive status). | CIGNA Corporation |
Judith M. Johnson
(Born 1949) | Trustee,
since 2008 | Retired. Prior thereto, Chief Executive Officer and Chief Investment Officer of Minneapolis Employees Retirement Fund from 1996 to 2008. Ms. Johnson is an attorney, certified public accountant and a certified managerial accountant. | N/A |
David F. Larcker
(Born 1950) | Trustee,
since 2009 | James Irvin Miller Professor of Accounting at the Graduate School of Business (Emeritus), Stanford University, Director of the Corporate Governance Research Initiative and Senior Faculty of The Rock Center for Corporate Governance since 2006. From 2005 to 2008, Professor of Accounting at the Graduate School of Business, Stanford University. Prior thereto, Ernst & Young Professor of Accounting at The Wharton School, University of Pennsylvania from 1985 to 2005. | N/A |
28 | Wells Fargo Premier Large Company Growth Fund
Other information (unaudited)
Name and
year of birth | Position held and
length of service* | Principal occupations during past five years or longer | Current other
public company or
investment
company
directorships |
Olivia S. Mitchell
(Born 1953) | Trustee,
since 2006;
Nominating and
Governance
Committee Chair,
since 2018 | International Foundation of Employee Benefit Plans Professor, Wharton School of the University of Pennsylvania since 1993. Director of Wharton’s Pension Research Council and Boettner Center on Pensions & Retirement Research, and Research Associate at the National Bureau of Economic Research. Previously, Cornell University Professor from 1978 to 1993. | N/A |
Timothy J. Penny
(Born 1951) | Trustee,
since 1996;
Chair,
since 2018 | President and Chief Executive Officer of Southern Minnesota Initiative Foundation, a non-profit organization, since 2007. Member of the Board of Trustees of NorthStar Education Finance, Inc., a non-profit organization, since 2007. | N/A |
James G. Polisson
(Born 1959) | Trustee,
since 2018 | Retired. Chief Marketing Officer, Source (ETF) UK Services, Ltd, from 2015 to 2017. From 2012 to 2015, Principal of The Polisson Group, LLC, a management consulting, corporate advisory and principal investing company. Chief Executive Officer and Managing Director at Russell Investments, Global Exchange Traded Funds from 2010 to 2012. Managing Director of Barclays Global Investors from 1998 to 2010 and Global Chief Marketing Officer for iShares and Barclays Global Investors from 2000 to 2010. Trustee of the San Francisco Mechanics’ Institute, a non-profit organization, from 2013 to 2015. Board member of the Russell Exchange Traded Fund Trust from 2011 to 2012. Director of Barclays Global Investors Holdings Deutschland GmbH from 2006 to 2009. Mr. Polisson is an attorney and has a retired status with the Massachusetts and District of Columbia Bar Associations. | N/A |
Pamela Wheelock
(Born 1959) | Trustee,
since January
2020; previously
Trustee from
January 2018 to
July 2019 | Board member of the Destination Medical Center Economic Development Agency, Rochester, Minnesota since 2019. Interim President of the McKnight Foundation from January to September 2020. Acting Commissioner, Minnesota Department of Human Services, July 2019 through September 2019. Human Services Manager (part-time), Minnesota Department of Human Services, October 2019 through December 2019. Chief Operating Officer, Twin Cities Habitat for Humanity from 2017 to 2019. Vice President of University Services, University of Minnesota from 2012 to 2016. Prior thereto, on the Board of Directors, Governance Committee and Finance Committee for the Minnesota Philanthropy Partners (Saint Paul Foundation) from 2012 to 2018, Interim Chief Executive Officer of Blue Cross Blue Shield of Minnesota from 2011 to 2012, Chairman of the Board from 2009 to 2012 and Board Director from 2003 to 2015. Vice President, Leadership and Community Engagement, Bush Foundation, Saint Paul, Minnesota (a private foundation) from 2009 to 2011. Executive Vice President and Chief Financial Officer, Minnesota Sports and Entertainment from 2004 to 2009 and Senior Vice President from 2002 to 2004. Executive Vice President of the Minnesota Wild Foundation from 2004 to 2008. Commissioner of Finance, State of Minnesota, from 1999 to 2002. Currently Board Chair of the Minnesota Wild Foundation since 2010. | N/A |
* Length of service dates reflect the Trustee’s commencement of service with the Trust’s predecessor entities, where applicable.
Wells Fargo Premier Large Company Growth Fund | 29
Other information (unaudited)
Officers
Name and
year of birth | Position held and
length of service | Principal occupations during past five years or longer |
Andrew Owen
(Born 1960) | President,
since 2017 | Executive Vice President of Wells Fargo & Company and Head of Affiliated Managers, Wells Fargo Asset Management, since 2014. In addition, Mr. Owen is currently President, Chief Executive Officer and Director of Wells Fargo Funds Management, LLC since 2017. Prior thereto, Executive Vice President responsible for marketing, investments and product development for Wells Fargo Funds Management, LLC, from 2009 to 2014. |
Jeremy DePalma
(Born 1974) | Treasurer,
since 2012
(for certain funds in
the Fund Complex);
since 2021 (for
the remaining funds in the
Fund Complex) | Senior Vice President of Wells Fargo Funds Management, LLC since 2009. Senior Vice President of Evergreen Investment Management Company, LLC from 2008 to 2010 and head of the Fund Reporting and Control Team within Fund Administration from 2005 to 2010. |
Michelle Rhee
(Born 1966) | Chief Legal Officer,
since 2019 | Secretary of Wells Fargo Funds Management, LLC and Chief Legal Counsel of Wells Fargo Asset Management since 2018. Deputy General Counsel of Wells Fargo Bank, N.A. since 2020 and Assistant General Counsel of Wells Fargo Bank, N.A. from 2018 to 2020. Associate General Counsel and Managing Director of Bank of America Corporation from 2004 to 2018. |
Catherine Kennedy
(Born 1969) | Secretary,
since 2019 | Vice President of Wells Fargo Funds Management, LLC and Senior Counsel of the Wells Fargo Legal Department since 2010. Vice President and Senior Counsel of Evergreen Investment Management Company, LLC from 1998 to 2010. |
Michael H. Whitaker
(Born 1967) | Chief Compliance Officer,
since 2016 | Chief Compliance Officer of Wells Fargo Asset Management since 2016. Senior Vice President and Chief Compliance Officer for Fidelity Investments from 2007 to 2016. |
1 The Statement of Additional Information includes additional information about the Trustees and is available, without charge, upon request, by calling 1-800-222-8222 or by visiting the website at wfam.com.
30 | Wells Fargo Premier Large Company Growth Fund
For more information
More information about Wells Fargo Funds is available free upon request. To obtain literature, please write, visit the Fund's website, or call:
Wells Fargo Funds
P.O. Box 219967
Kansas City, MO 64121-9967
Website: wfam.com
Individual investors: 1-800-222-8222
Retail investment professionals: 1-888-877-9275
Institutional investment professionals: 1-866-765-0778
This report and the financial statements contained herein are submitted for the general information of the shareholders of the Fund. If this report is used for promotional purposes, distribution of the report must be accompanied or preceded by a current prospectus. Before investing, please consider the investment objectives, risks, charges, and expenses of the investment. For a current prospectus and, if available, a summary prospectus, containing this information, call 1-800-222-8222 or visit the Fund’s website at wfam.com. Read the prospectus carefully before you invest or send money.
Wells Fargo Asset Management (WFAM) is the trade name for certain investment advisory/management firms owned by Wells Fargo & Company. These firms include but are not limited to Wells Capital Management Incorporated and Wells Fargo Funds Management, LLC. Certain products managed by WFAM entities are distributed by Wells Fargo Funds Distributor, LLC (a broker-dealer and Member FINRA).
This material is for general informational and educational purposes only and is NOT intended to provide investment advice or a recommendation of any kind— including a recommendation for any specific investment, strategy, or plan.
INVESTMENT PRODUCTS: NOT FDIC INSURED ■ NO BANK GUARANTEE ■ MAY LOSE VALUE
© 2021 Wells Fargo & Company. All rights reserved.
PAR-0221-00376 03-22
SA212/SAR212 01-21
Semi-Annual Report
January 31, 2021
Wells Fargo
Omega Growth Fund
Reduce clutter.
Save trees.
Sign up for electronic delivery of prospectuses and shareholder reports at wellsfargo.com/ advantagedelivery
The views expressed and any forward-looking statements are as of January 31, 2021, unless otherwise noted, and are those of the Fund's portfolio managers and/or Wells Fargo Asset Management. Discussions of individual securities or the markets generally are not intended as individual recommendations. Future events or results may vary significantly from those expressed in any forward-looking statements. The views expressed are subject to change at any time in response to changing circumstances in the market. Wells Fargo Asset Management and the Fund disclaim any obligation to publicly update or revise any views expressed or forward-looking statements.
INVESTMENT PRODUCTS: NOT FDIC INSURED ■ NO BANK GUARANTEE ■ MAY LOSE VALUE
Wells Fargo Omega Growth Fund | 1
Letter to shareholders (unaudited)
Dear Shareholder:
We are pleased to offer you this semi-annual report for the Wells Fargo Omega Growth Fund for the six-month period that ended January 31, 2021. Despite a deeply challenging year, dominated by the spread of COVID-19 cases and a sharp drop in economic output throughout much of the world, global stocks performed extremely well, benefiting from ongoing central bank support and rising optimism over the development and distribution of effective COVID-19 vaccines. Bonds also had positive returns, led by global bonds and high-yield bonds.
For the six-month period, U.S. stocks, based on the S&P 500 Index1, gained 14.47%. International stocks, as measured by the MSCI ACWI ex USA Index (Net)2, returned 19.28%, while the MSCI EM Index (Net)3, had stronger performance, with a 24.07% gain. Among bond indexes, the Bloomberg Barclays U.S. Aggregate Bond Index4 returned -0.91%, the Bloomberg Barclays Global Aggregate ex-USD Index (unhedged)5 gained 3.71%, and the Bloomberg Barclays Municipal Bond Index6 returned 2.01% while the ICE BofA U.S. High Yield Index7 returned 6.82%.
The stock market rally continued in August.
The stock market continued a months-long rally in August despite concerns over rising numbers of U.S. and European COVID-19 cases. Relatively strong second-quarter earnings boosted investor sentiment along with the U.S. Federal Reserve’s announcement of a monetary policy shift expected to support longer-term low interest rates. U.S. manufacturing and services activity indexes beat expectations, while the U.S. housing market maintained strength. In Europe, retail sales expanded and consumer confidence was steady. China’s economy continued to expand.
Stocks grew more volatile in September on mixed economic data. U.S. economic activity continued to grow. However, U.S. unemployment remained elevated at 7.9% in September. With U.S. Congress delaying further fiscal relief and uncertainties surrounding a possible vaccine, doubts crept back into the financial markets. In the U.K., a lack of progress in Brexit talks weighed on markets. China’s economy picked up steam, fueled by increased global demand.
Andrew Owen
President
Wells Fargo Funds
“The stock market continued a months-long rally in August despite concerns over rising numbers of U.S. and European COVID-19 cases.”
| 1 | The S&P 500 Index consists of 500 stocks chosen for market size, liquidity, and industry group representation. It is a market-value-weighted index with each stock's weight in the index proportionate to its market value. You cannot invest directly in an index. |
| 2 | The Morgan Stanley Capital International (MSCI) All Country World Index (ACWI) ex USA Index (Net) is a free-float-adjusted market-capitalization-weighted index that is designed to measure the equity market performance of developed and emerging markets, excluding the United States. Source: MSCI. MSCI makes no express or implied warranties or representations and shall have no liability whatsoever with respect to any MSCI data contained herein. The MSCI data may not be further redistributed or used as a basis for other indices or any securities or financial products. This report is not approved, reviewed, or produced by MSCI. You cannot invest directly in an index. |
| 1 | The S&P 500 Index consists of 500 stocks chosen for market size, liquidity, and industry group representation. It is a market-value-weighted index with each stock's weight in the index proportionate to its market value. You cannot invest directly in an index. |
| 3 | The MSCI Emerging Markets (EM) Index (Net) is a free-float-adjusted market-capitalization-weighted index that is designed to measure equity market performance of emerging markets. You cannot invest directly in an index. |
| 1 | The S&P 500 Index consists of 500 stocks chosen for market size, liquidity, and industry group representation. It is a market-value-weighted index with each stock's weight in the index proportionate to its market value. You cannot invest directly in an index. |
| 4 | The Bloomberg Barclays U.S. Aggregate Bond Index is a broad-based benchmark that measures the investment-grade, U.S. dollar-denominated, fixed-rate taxable bond market, including Treasuries, government-related and corporate securities, mortgage-backed securities (agency fixed-rate and hybrid adjustable-rate mortgage pass-throughs), asset-backed securities, and commercial mortgage-backed securities. You cannot invest directly in an index. |
| 1 | The S&P 500 Index consists of 500 stocks chosen for market size, liquidity, and industry group representation. It is a market-value-weighted index with each stock's weight in the index proportionate to its market value. You cannot invest directly in an index. |
| 5 | The Bloomberg Barclays Global Aggregate ex-USD Index (unhedged) is an unmanaged index that provides a broad-based measure of the global investment-grade fixed-income markets excluding the U.S. dollar-denominated debt market. You cannot invest directly in an index. |
| 1 | The S&P 500 Index consists of 500 stocks chosen for market size, liquidity, and industry group representation. It is a market-value-weighted index with each stock's weight in the index proportionate to its market value. You cannot invest directly in an index. |
| 6 | The Bloomberg Barclays Municipal Bond Index is an unmanaged index composed of long-term tax-exempt bonds with a minimum credit rating of Baa. You cannot invest directly in an index. |
| 1 | The S&P 500 Index consists of 500 stocks chosen for market size, liquidity, and industry group representation. It is a market-value-weighted index with each stock's weight in the index proportionate to its market value. You cannot invest directly in an index. |
| 7 | The ICE BofA U.S. High Yield Index is a market-capitalization-weighted index of domestic and Yankee high-yield bonds. The index tracks the performance of high-yield securities traded in the U.S. bond market. You cannot invest directly in an index. Copyright 2021. ICE Data Indices, LLC. All rights reserved. |
2 | Wells Fargo Omega Growth Fund
Letter to shareholders (unaudited)
In October, capital markets stepped back from their six-month rally. Market volatility rose in advance of the U.S. election and amid a global increase in COVID-19 infections. Europe introduced tighter restrictions affecting economic activity. U.S. markets looked favorably at the prospect of Democratic control of the federal purse strings, which could lead to additional fiscal stimulus and a boost to economic activity. Meanwhile, China reported 4.9% third-quarter GDP growth.
Global stocks rallied in November, propelled by optimism over three promising COVID-19 vaccines. Reversing recent trends, value stocks outperformed growth stocks and cyclical stocks outpaced technology stocks. However, U.S. unemployment remained elevated, with a net job loss of 10 million since February. The eurozone services purchasing managers’ index contracted sharply while the region’s manufacturing activity grew. The U.S. election results added to the upbeat mood as investors anticipated more consistent policies in the new administration.
Financial markets ended the year with strength on high expectations for a rapid rollout of the COVID-19 vaccines, the successful passage of a $900 billion stimulus package, and rising expectations of additional economic support from a Democratic-led Congress. U.S. economic data were mixed with still-elevated unemployment and weak retail sales but growth in manufacturing output. In contrast, China’s economic expansion continued in both manufacturing and nonmanufacturing. U.S. COVID-19 infection rates continued to rise even as new state and local lockdown measures were implemented.
The year 2021 began with emerging market stocks leading all major asset classes in January, driven by China’s strong economic growth and a broad recovery in corporate earnings, which propelled China’s stock market higher. In the United States, positive news on vaccine trials and January expansion in both the manufacturing and services sectors was offset by a weak December monthly jobs report. This was compounded by technical factors as some hedge funds were forced to sell stocks to protect themselves against a well-publicized short squeeze coordinated by a group of retail investors. Eurozone sentiment and economic growth were particularly weak, reflecting the impact of a new lockdown with stricter social distancing along with a slow vaccine rollout.
Don’t let short-term uncertainty derail long-term investment goals.
Periods of investment uncertainty can present challenges, but experience has taught us that maintaining long-term investment goals can be an effective way to plan for the future. To help you create a sound strategy based on your personal goals and risk tolerance, Wells Fargo Funds offers more than 100 mutual funds spanning a wide range of asset classes and investment styles. Although diversification cannot guarantee an investment profit or prevent losses, we believe it can be an effective way to manage investment risk and potentially smooth out overall portfolio performance. We encourage investors to know their investments and to understand that appropriate levels of risk-taking may unlock opportunities.
Thank you for choosing to invest with Wells Fargo Funds. We appreciate your confidence in us and remain committed to helping you meet your financial needs.
Sincerely,
Andrew Owen
President
Wells Fargo Funds
“Global stocks rallied in November, propelled by optimism over three promising COVID-19 vaccines.”
For further information about your Fund, contact your investment professional, visit our website at wfam.com, or call us directly at 1-800-222-8222.
Wells Fargo Omega Growth Fund | 3
Performance highlights (unaudited)
Investment objective
The Fund seeks long-term capital appreciation.
Manager
Wells Fargo Funds Management, LLC
Subadviser
Wells Capital Management Incorporated
Portfolio managers
Michael T. Smith, CFA®‡
Christopher J. Warner, CFA®‡
Average annual total returns (%) as of January 31, 2021
| | | Including sales charge | | Excluding sales charge | | Expense ratios1 (%) |
| | Inception date | 1 year | 5 year | 10 year | | 1 year | 5 year | 10 year | | Gross | Net 2 |
| Class A (EKOAX) | 4-29-1968 | 28.49 | 21.51 | 14.61 | | 36.33 | 22.96 | 15.29 | | 1.28 | 1.28 |
| Class C (EKOCX) | 8-2-1993 | 34.74 | 22.11 | 14.46 | | 35.74 | 22.11 | 14.46 | | 2.03 | 2.03 |
| Class R (EKORX) | 10-10-2003 | – | – | – | | 35.99 | 22.65 | 15.00 | | 1.53 | 1.53 |
| Administrator Class (EOMYX) | 1-13-1997 | – | – | – | | 36.56 | 23.18 | 15.54 | | 1.20 | 1.10 |
| Institutional Class (EKONX) | 7-30-2010 | – | – | – | | 36.91 | 23.49 | 15.83 | | 0.95 | 0.85 |
| Russell 3000® Growth Index3 | – | – | – | – | | 35.01 | 22.07 | 16.62 | | – | – |
Figures quoted represent past performance, which is no guarantee of future results, and do not reflect taxes that a shareholder may pay on an investment in a fund. Investment return and principal value of an investment will fluctuate so that an investor’s shares, when redeemed, may be worth more or less than their original cost. Performance shown without sales charges would be lower if sales charges were reflected. Current performance may be lower or higher than the performance data quoted, which assumes the reinvestment of dividends and capital gains. Current month-end performance is available on the Fund’s website, wfam.com.
Please keep in mind that high double-digit returns were primarily achieved during favorable market conditions. You should not expect that such favorable returns can be consistently achieved. A fund’s performance, especially for short time periods, should not be the sole factor in making your investment decision.
Index returns do not include transaction costs associated with buying and selling securities, any mutual fund fees or expenses, or any taxes. It is not possible to invest directly in an index.
For Class A shares, the maximum front-end sales charge is 5.75%. For Class C shares, the maximum contingent deferred sales charge is 1.00%. Performance including a contingent deferred sales charge assumes the sales charge for the corresponding time period. Class R, Administrator Class, and Institutional Class shares are sold without a front-end sales charge or contingent deferred sales charge.
Stock values fluctuate in response to the activities of individual companies and general market and economic conditions. Certain investment strategies tend to increase the total risk of an investment (relative to the broader market). The Fund is exposed to foreign investment risk and smaller-company securities risk. Consult the Fund’s prospectus for additional information on these and other risks.
Please see footnotes on page 5.
4 | Wells Fargo Omega Growth Fund
Performance highlights (unaudited)
| Ten largest holdings (%) as of January 31, 20214 |
| Microsoft Corporation | 9.51 |
| Amazon.com Incorporated | 8.52 |
| Alphabet Incorporated Class A | 4.28 |
| PayPal Holdings Incorporated | 3.01 |
| Visa Incorporated Class A | 2.90 |
| MercadoLibre Incorporated | 2.72 |
| UnitedHealth Group Incorporated | 2.67 |
| Chipotle Mexican Grill Incorporated | 2.55 |
| ServiceNow Incorporated | 2.45 |
| EPAM Systems Incorporated | 2.18 |
| Sector distribution as of January 31, 20215 |
| ‡ | CFA® and Chartered Financial Analyst® are trademarks owned by CFA Institute. |
| 1 | Reflects the expense ratios as stated in the most recent prospectuses. The expense ratios shown are subject to change and may differ from the annualized expense ratios shown in the financial highlights of this report. |
| 2 | The manager has contractually committed through November 30, 2021, to waive fees and/or reimburse expenses to the extent necessary to cap total annual fund operating expenses after fee waivers at 1.30% for Class A, 2.05% for Class C, 1.55% for Class R, 1.10% for Administrator Class, and 0.85% for Institutional Class. Brokerage commissions, stamp duty fees, interest, taxes, acquired fund fees and expenses (if any), and extraordinary expenses are excluded from the expense caps. Prior to or after the commitment expiration date, the caps may be increased or the commitment to maintain the caps may be terminated only with the approval of the Board of Trustees. Without these caps, the Fund’s returns would have been lower. The expense ratio paid by an investor is the net expense ratio (the total annual fund operating expenses after fee waivers) as stated in the prospectuses. |
| 3 | The Russell 3000® Growth Index measures the performance of those Russell 3000® Index companies with higher price/book ratios and higher forecasted growth values. You cannot invest directly in an index. |
| 4 | Figures represent the percentage of the Fund's net assets. Holdings are subject to change and may have changed since the date specified. |
| 5 | Figures represent the percentage of the Fund's long-term investments. These amounts are subject to change and may have changed since the date specified. |
Wells Fargo Omega Growth Fund | 5
Fund expenses (unaudited)
As a shareholder of the Fund, you incur two types of costs: (1) transaction costs, including sales charges (loads) on purchase payments and contingent deferred sales charges (if any) on redemptions and (2) ongoing costs, including management fees, distribution (12b-1) and/or shareholder servicing fees, and other Fund expenses. This example is intended to help you understand your ongoing costs (in dollars) of investing in the Fund and to compare these costs with the ongoing costs of investing in other mutual funds.
The example is based on an investment of $1,000 invested at the beginning of the six-month period and held for the entire period from August 1, 2020 to January 31, 2021.
Actual expenses
The “Actual” line of the table below provides information about actual account values and actual expenses. You may use the information in this line, together with the amount you invested, to estimate the expenses that you paid over the period. Simply divide your account value by $1,000 (for example, an $8,600 account value divided by $1,000 = 8.6), then multiply the result by the number in the “Actual” line under the heading entitled “Expenses paid during period” for your applicable class of shares to estimate the expenses you paid on your account during this period.
Hypothetical example for comparison purposes
The “Hypothetical” line of the table below provides information about hypothetical account values and hypothetical expenses based on the Fund’s actual expense ratio and an assumed rate of return of 5% per year before expenses, which is not the Fund’s actual return. The hypothetical account values and expenses may not be used to estimate the actual ending account balance or expenses you paid for the period. You may use this information to compare the ongoing costs of investing in the Fund and other funds. To do so, compare this 5% hypothetical example with the 5% hypothetical examples that appear in the shareholder reports of the other funds.
Please note that the expenses shown in the table are meant to highlight your ongoing costs only and do not reflect any transactional costs, such as sales charges (loads) and contingent deferred sales charges. Therefore, the “Hypothetical” line of the table is useful in comparing ongoing costs only and will not help you determine the relative total costs of owning different funds. In addition, if these transactional costs were included, your costs would have been higher
| | Beginning
account value
8-1-2020 | Ending
account value
1-31-2021 | Expenses
paid during
the period1 | Annualized net
expense ratio |
| Class A | | | | |
| Actual | $1,000.00 | $1,180.28 | $ 6.92 | 1.26% |
| Hypothetical (5% return before expenses) | $1,000.00 | $1,018.85 | $ 6.41 | 1.26% |
| Class C | | | | |
| Actual | $1,000.00 | $1,179.49 | $11.10 | 2.02% |
| Hypothetical (5% return before expenses) | $1,000.00 | $1,015.02 | $10.26 | 2.02% |
| Class R | | | | |
| Actual | $1,000.00 | $1,178.83 | $ 8.24 | 1.50% |
| Hypothetical (5% return before expenses) | $1,000.00 | $1,017.64 | $ 7.63 | 1.50% |
| Administrator Class | | | | |
| Actual | $1,000.00 | $1,181.34 | $ 5.94 | 1.08% |
| Hypothetical (5% return before expenses) | $1,000.00 | $1,019.76 | $ 5.50 | 1.08% |
| Institutional Class | | | | |
| Actual | $1,000.00 | $1,182.68 | $ 4.68 | 0.85% |
| Hypothetical (5% return before expenses) | $1,000.00 | $1,020.92 | $ 4.33 | 0.85% |
1 Expenses paid is equal to the annualized net expense ratio of each class multiplied by the average account value over the period, multiplied by the number of days in the most recent fiscal half-year divided by the number of days in the fiscal year (to reflect the one-half-year period).
6 | Wells Fargo Omega Growth Fund
Portfolio of investments—January 31, 2021 (unaudited)
| | | | | Shares | Value |
| Common stocks: 98.95% | | | | | |
| Communication services: 10.71% | | | | | |
| Entertainment: 3.40% | | | | | |
| Netflix Incorporated † | | | | 38,700 | $ 20,603,493 |
| Spotify Technology SA † | | | | 50,300 | 15,844,500 |
| | | | | | 36,447,993 |
| Interactive media & services: 4.67% | | | | | |
| Alphabet Incorporated Class A † | | | | 25,100 | 45,866,736 |
| Alphabet Incorporated Class C † | | | | 2,285 | 4,194,666 |
| | | | | | 50,061,402 |
| Media: 2.64% | | | | | |
| IAC/InterActiveCorp † | | | | 61,800 | 12,974,910 |
| Match Group Incorporated † | | | | 110,232 | 15,417,048 |
| | | | | | 28,391,958 |
| Consumer discretionary: 17.73% | | | | | |
| Auto components: 1.42% | | | | | |
| Aptiv plc | | | | 113,700 | 15,190,320 |
| Automobiles: 0.79% | | | | | |
| Ferrari NV | | | | 40,600 | 8,452,108 |
| Hotels, restaurants & leisure: 2.55% | | | | | |
| Chipotle Mexican Grill Incorporated † | | | | 18,500 | 27,380,000 |
| Internet & direct marketing retail: 11.24% | | | | | |
| Amazon.com Incorporated † | | | | 28,500 | 91,376,700 |
| MercadoLibre Incorporated † | | | | 16,400 | 29,183,964 |
| | | | | | 120,560,664 |
| Specialty retail: 1.73% | | | | | |
| The Home Depot Incorporated | | | | 68,600 | 18,578,252 |
| Financials: 2.97% | | | | | |
| Capital markets: 2.97% | | | | | |
| Intercontinental Exchange Incorporated | | | | 143,800 | 15,868,330 |
| MarketAxess Holdings Incorporated | | | | 29,500 | 15,952,420 |
| | | | | | 31,820,750 |
| Health care: 17.57% | | | | | |
| Biotechnology: 1.56% | | | | | |
| Exact Sciences Corporation † | | | | 122,300 | 16,774,668 |
| Health care equipment & supplies: 9.03% | | | | | |
| ABIOMED Incorporated † | | | | 34,600 | 12,049,450 |
| Alcon Incorporated † | | | | 207,200 | 14,858,312 |
| Align Technology Incorporated † | | | | 43,100 | 22,643,878 |
| DexCom Incorporated † | | | | 46,100 | 17,280,585 |
The accompanying notes are an integral part of these financial statements.
Wells Fargo Omega Growth Fund | 7
Portfolio of investments—January 31, 2021 (unaudited)
| | | | | Shares | Value |
| Health care equipment & supplies (continued) | | | | | |
| Edwards Lifesciences Corporation † | | | | 125,200 | $ 10,339,016 |
| Intuitive Surgical Incorporated † | | | | 26,300 | 19,662,932 |
| | | | | | 96,834,173 |
| Health care providers & services: 5.42% | | | | | |
| Chemed Corporation | | | | 32,900 | 17,038,910 |
| HealthEquity Incorporated † | | | | 149,448 | 12,486,380 |
| UnitedHealth Group Incorporated | | | | 85,700 | 28,587,806 |
| | | | | | 58,113,096 |
| Health care technology: 1.56% | | | | | |
| Veeva Systems Incorporated Class A † | | | | 60,300 | 16,669,332 |
| Industrials: 6.76% | | | | | |
| Aerospace & defense: 1.63% | | | | | |
| HEICO Corporation | | | | 61,400 | 7,229,236 |
| Teledyne Technologies Incorporated † | | | | 28,600 | 10,210,486 |
| | | | | | 17,439,722 |
| Air freight & logistics: 1.00% | | | | | |
| United Parcel Service Incorporated Class B | | | | 69,200 | 10,726,000 |
| Commercial services & supplies: 1.49% | | | | | |
| Waste Connections Incorporated | | | | 162,322 | 15,990,340 |
| Professional services: 1.08% | | | | | |
| Equifax Incorporated | | | | 65,600 | 11,618,416 |
| Road & rail: 1.56% | | | | | |
| Union Pacific Corporation | | | | 84,900 | 16,765,203 |
| Information technology: 40.49% | | | | | |
| Communications equipment: 1.19% | | | | | |
| Motorola Solutions Incorporated | | | | 75,800 | 12,700,290 |
| Electronic equipment, instruments & components: 1.25% | | | | | |
| Zebra Technologies Corporation Class A † | | | | 34,600 | 13,418,918 |
| IT services: 19.46% | | | | | |
| Black Knight Incorporated † | | | | 214,300 | 17,506,167 |
| EPAM Systems Incorporated † | | | | 67,741 | 23,332,033 |
| Euronet Worldwide Incorporated † | | | | 60,200 | 7,522,592 |
| Fiserv Incorporated † | | | | 157,040 | 16,126,438 |
| MongoDB Incorporated † | | | | 50,100 | 18,517,461 |
| PayPal Holdings Incorporated † | | | | 137,600 | 32,241,056 |
| Shopify Incorporated Class A † | | | | 13,500 | 14,830,965 |
| Square Incorporated Class A † | | | | 92,400 | 19,954,704 |
| StoneCo Limited Class A † | | | | 182,000 | 13,085,800 |
| Visa Incorporated Class A | | | | 160,804 | 31,075,373 |
| WEX Incorporated † | | | | 76,602 | 14,447,137 |
| | | | | | 208,639,726 |
| Software: 18.59% | | | | | |
| Atlassian Corporation plc Class A † | | | | 60,100 | 13,890,913 |
| Autodesk Incorporated † | | | | 59,300 | 16,451,599 |
The accompanying notes are an integral part of these financial statements.
8 | Wells Fargo Omega Growth Fund
Portfolio of investments—January 31, 2021 (unaudited)
| | | | | Shares | Value |
| Software (continued) | | | | | |
| Cadence Design Systems Incorporated † | | | | 134,300 | $ 17,511,377 |
| Microsoft Corporation | | | | 439,700 | 101,992,812 |
| ServiceNow Incorporated † | | | | 48,300 | 26,234,628 |
| Unity Software Incorporated †« | | | | 88,520 | 13,262,066 |
| Zoom Video Communications Incorporated † | | | | 27,000 | 10,045,890 |
| | | | | | 199,389,285 |
| Materials: 1.54% | | | | | |
| Chemicals: 1.54% | | | | | |
| The Sherwin-Williams Company | | | | 23,900 | 16,534,020 |
| Real estate: 1.18% | | | | | |
| Equity REITs: 1.18% | | | | | |
| SBA Communications Corporation | | | | 46,900 | 12,600,623 |
| Total Common stocks (Cost $470,916,279) | | | | | 1,061,097,259 |
| | | Yield | | | |
| Short-term investments: 2.37% | | | | | |
| Investment companies: 2.37% | | | | | |
| Securities Lending Cash Investments LLC ♠∩∞ | | 0.10% | | 12,237,750 | 12,237,750 |
| Wells Fargo Government Money Market Fund Select Class ♠∞ | | 0.03 | | 13,144,761 | 13,144,761 |
| Total Short-term investments (Cost $25,382,511) | | | | | 25,382,511 |
| Total investments in securities (Cost $496,298,790) | 101.32% | | | | 1,086,479,770 |
| Other assets and liabilities, net | (1.32) | | | | (14,107,422) |
| Total net assets | 100.00% | | | | $1,072,372,348 |
| † | Non-income-earning security |
| « | All or a portion of this security is on loan. |
| ♠ | The issuer of the security is an affiliated person of the Fund as defined in the Investment Company Act of 1940. |
| ∩ | The investment is a non-registered investment company purchased with cash collateral received from securities on loan. |
| ∞ | The rate represents the 7-day annualized yield at period end. |
| Abbreviations: |
| REIT | Real estate investment trust |
The accompanying notes are an integral part of these financial statements.
Wells Fargo Omega Growth Fund | 9
Portfolio of investments—January 31, 2021 (unaudited)
Investments in affiliates
An affiliated investment is an investment in which the Fund owns at least 5% of the outstanding voting shares of the issuer or as a result of other relationships, such as the Fund and the issuer having the same investment manager. Transactions with issuers that were either affiliated persons of the Fund at the beginning of the period or the end of the period were as follows:
| | Value,
beginning of
period | Purchases | Sales
proceeds | Net
realized
gains
(losses) | | Net
change in
unrealized
gains
(losses) | | Value,
end of
period | | % of
net
assets | Shares,
end
of period | Income
from
affiliated
securities |
| Short-term investments | | | | | | | | | | | | |
| Investment companies | | | | | | | | | | | | |
| Securities Lending Cash Investments LLC | $ 0 | $54,016,081 | $(41,778,331) | $0 | | $0 | | $ 12,237,750 | | | 12,237,750 | $ 4,367# |
| Wells Fargo Government Money Market Fund Select Class | 6,153,039 | 77,242,732 | (70,251,010) | 0 | | 0 | | 13,144,761 | | | 13,144,761 | 1,271 |
| | | | | $0 | | $0 | | $25,382,511 | | 2.37% | | $5,638 |
| # | Amount shown represents income before fees and rebates. |
The accompanying notes are an integral part of these financial statements.
10 | Wells Fargo Omega Growth Fund
Statement of assets and liabilities—January 31, 2021 (unaudited)
| | |
| Assets | |
Investments in unaffiliated securities (including $11,979,786 of securities loaned), at value (cost $470,916,279)
| $ 1,061,097,259 |
Investments in affiliated securites, at value (cost $25,382,511)
| 25,382,511 |
Receivable for Fund shares sold
| 145,083 |
Receivable for dividends
| 18,557 |
Receivable for securities lending income, net
| 5,028 |
Prepaid expenses and other assets
| 28,620 |
Total assets
| 1,086,677,058 |
| Liabilities | |
Payable upon receipt of securities loaned
| 12,237,750 |
Management fee payable
| 705,459 |
Payable for Fund shares redeemed
| 463,628 |
Payable for investments purchased
| 431,058 |
Administration fees payable
| 185,512 |
Distribution fees payable
| 12,121 |
Trustees’ fees and expenses payable
| 2,552 |
Accrued expenses and other liabilities
| 266,630 |
Total liabilities
| 14,304,710 |
Total net assets
| $1,072,372,348 |
| Net assets consist of | |
Paid-in capital
| $ 441,070,179 |
Total distributable earnings
| 631,302,169 |
Total net assets
| $1,072,372,348 |
| Computation of net asset value and offering price per share | |
Net assets – Class A
| $ 908,685,093 |
Shares outstanding – Class A1
| 12,594,758 |
Net asset value per share – Class A
| $72.15 |
Maximum offering price per share – Class A2
| $76.55 |
Net assets – Class C
| $ 16,678,148 |
Shares outstanding – Class C1
| 385,224 |
Net asset value per share – Class C
| $43.29 |
Net assets – Class R
| $ 4,715,562 |
Shares outstanding – Class R1
| 70,455 |
Net asset value per share – Class R
| $66.93 |
Net assets – Administrator Class
| $ 35,558,180 |
Shares outstanding – Administrator Class1
| 442,766 |
Net asset value per share – Administrator Class
| $80.31 |
Net assets – Institutional Class
| $ 106,735,365 |
Shares outstanding – Institutional Class1
| 1,274,635 |
Net asset value per share – Institutional Class
| $83.74 |
| 1 | The Fund has an unlimited number of authorized shares. |
| 2 | Maximum offering price is computed as 100/94.25 of net asset value. On investments of $50,000 or more, the offering price is reduced. |
The accompanying notes are an integral part of these financial statements.
Wells Fargo Omega Growth Fund | 11
Statement of operations—six months ended January 31, 2021 (unaudited)
| | |
| Investment income | |
Dividends (net of foreign withholdings taxes of $9,070)
| $ 1,922,353 |
Income from affiliated securities
| 19,437 |
Total investment income
| 1,941,790 |
| Expenses | |
Management fee
| 3,937,736 |
| Administration fees | |
Class A
| 906,429 |
Class C
| 20,879 |
Class R
| 5,145 |
Administrator Class
| 20,928 |
Institutional Class
| 64,308 |
| Shareholder servicing fees | |
Class A
| 1,079,082 |
Class C
| 24,856 |
Class R
| 5,996 |
Administrator Class
| 40,042 |
| Distribution fees | |
Class C
| 74,417 |
Class R
| 5,900 |
Custody and accounting fees
| 18,689 |
Professional fees
| 26,651 |
Registration fees
| 50,194 |
Shareholder report expenses
| 56,426 |
Trustees’ fees and expenses
| 9,707 |
Other fees and expenses
| 14,770 |
Total expenses
| 6,362,155 |
| Less: Fee waivers and/or expense reimbursements | |
Fund-level
| (28,606) |
Class A
| (20,263) |
Class C
| (19) |
Administrator Class
| (9,454) |
Institutional Class
| (21,600) |
Net expenses
| 6,282,213 |
Net investment loss
| (4,340,423) |
Payment from affiliate
| 77,039 |
| Realized and unrealized gains (losses) on investments | |
Net realized gains on investments
| 68,040,332 |
Net change in unrealized gains (losses) on investments
| 104,102,170 |
Net realized and unrealized gains (losses) on investments
| 172,142,502 |
Net increase in net assets resulting from operations
| 167,879,118 |
The accompanying notes are an integral part of these financial statements.
12 | Wells Fargo Omega Growth Fund
Statement of changes in net assets
| | |
| | Six months ended
January 31, 2021
(unaudited) | Year ended
July 31, 2020 |
| Operations | | | | |
Net investment loss
| | $ (4,340,423) | | $ (5,432,640) |
Payment from affiliate
| | 77,039 | | 0 |
Net realized gains on investments
| | 68,040,332 | | 59,456,747 |
Net change in unrealized gains (losses) on investments
| | 104,102,170 | | 134,698,602 |
Net increase in net assets resulting from operations
| | 167,879,118 | | 188,722,709 |
| Distributions to shareholders from | | | | |
| Net investment income and net realized gains | | | | |
Class A
| | (52,646,623) | | (38,639,530) |
Class C
| | (1,658,736) | | (1,862,430) |
Class R
| | (283,298) | | (304,034) |
Administrator Class
| | (1,791,540) | | (1,255,690) |
Institutional Class
| | (5,339,881) | | (3,766,464) |
Total distributions to shareholders
| | (61,720,078) | | (45,828,148) |
| Capital share transactions | Shares | | Shares | |
| Proceeds from shares sold | | | | |
Class A
| 228,740 | 16,260,171 | 272,882 | 14,921,263 |
Class C
| 8,099 | 353,609 | 51,013 | 1,731,016 |
Class R
| 5,940 | 383,462 | 25,891 | 1,308,361 |
Administrator Class
| 44,267 | 3,516,978 | 9,639 | 598,496 |
Institutional Class
| 121,038 | 9,716,927 | 231,605 | 13,472,238 |
| | | 30,231,147 | | 32,031,374 |
| Reinvestment of distributions | | | | |
Class A
| 720,507 | 50,392,262 | 697,108 | 37,030,375 |
Class C
| 39,414 | 1,656,177 | 53,921 | 1,795,565 |
Class R
| 4,084 | 265,103 | 4,691 | 232,868 |
Administrator Class
| 20,456 | 1,592,066 | 19,576 | 1,148,300 |
Institutional Class
| 65,296 | 5,297,486 | 61,188 | 3,723,927 |
| | | 59,203,094 | | 43,931,035 |
| Payment for shares redeemed | | | | |
Class A
| (674,770) | (47,364,234) | (1,593,178) | (85,882,986) |
Class C
| (207,127) | (9,177,941) | (289,079) | (10,068,981) |
Class R
| (16,248) | (1,116,869) | (71,554) | (3,669,955) |
Administrator Class
| (21,840) | (1,745,281) | (60,813) | (3,572,488) |
Institutional Class
| (129,897) | (10,350,408) | (278,139) | (17,354,985) |
| | | (69,754,733) | | (120,549,395) |
Net increase (decrease) in net assets resulting from capital share transactions
| | 19,679,508 | | (44,586,986) |
Total increase in net assets
| | 125,838,548 | | 98,307,575 |
| Net assets | | | | |
Beginning of period
| | 946,533,800 | | 848,226,225 |
End of period
| | $1,072,372,348 | | $ 946,533,800 |
The accompanying notes are an integral part of these financial statements.
Wells Fargo Omega Growth Fund | 13
Financial highlights
(For a share outstanding throughout each period)
| | | Year ended July 31 |
| Class A | Six months ended
January 31, 2021
(unaudited) | 2020 | 2019 | 2018 | 2017 | 2016 |
Net asset value, beginning of period
| $64.95 | $55.19 | $54.77 | $49.43 | $42.73 | $48.29 |
Net investment loss
| (0.31) 1 | (0.38) 1 | (0.33) 1 | (0.32) 1 | (0.22) 1 | (0.19) 1 |
Payment from affiliate
| 0.00 2 | 0.00 | 0.00 | 0.00 | 0.00 | 0.00 |
Net realized and unrealized gains (losses) on investments
| 11.88 | 13.24 | 6.56 | 12.57 | 8.07 | (1.44) |
Total from investment operations
| 11.57 | 12.86 | 6.23 | 12.25 | 7.85 | (1.63) |
| Distributions to shareholders from | | | | | | |
Net realized gains
| (4.37) | (3.10) | (5.81) | (6.91) | (1.15) | (3.93) |
Net asset value, end of period
| $72.15 | $64.95 | $55.19 | $54.77 | $49.43 | $42.73 |
Total return3
| 18.03% 4 | 24.55% | 13.89% | 26.86% | 18.88% | (3.07)% |
| Ratios to average net assets (annualized) | | | | | | |
Gross expenses
| 1.27% | 1.28% | 1.28% | 1.28% | 1.28% | 1.28% |
Net expenses
| 1.26% | 1.28% | 1.28% | 1.28% | 1.28% | 1.28% |
Net investment loss
| (0.88)% | (0.68)% | (0.64)% | (0.63)% | (0.50)% | (0.47)% |
| Supplemental data | | | | | | |
Portfolio turnover rate
| 15% | 23% | 39% | 48% | 76% | 84% |
Net assets, end of period (000s omitted)
| $908,685 | $800,199 | $714,411 | $662,751 | $581,967 | $573,304 |
| 1 | Calculated based upon average shares outstanding |
| 2 | Amount is less than $0.005. |
| 3 | Total return calculations do not include any sales charges. Returns for periods of less than one year are not annualized. |
| 4 | During the six months ended January 31, 2021, the Fund received a payment from an affiliate that had an impact of less than 0.005% on total return. See Note 4 in the Notes to Financial Statements for additional information. |
The accompanying notes are an integral part of these financial statements.
14 | Wells Fargo Omega Growth Fund
Financial highlights
(For a share outstanding throughout each period)
| | | Year ended July 31 |
| Class C | Six months ended
January 31, 2021
(unaudited) | 2020 | 2019 | 2018 | 2017 | 2016 |
Net asset value, beginning of period
| $40.52 | $35.83 | $38.02 | $36.47 | $32.07 | $37.55 |
Net investment loss
| (0.35) 1 | (0.50) 1 | (0.48) 1 | (0.50) 1 | (0.41) 1 | (0.39) 1 |
Payment from affiliate
| 0.19 | 0.00 | 0.00 | 0.00 | 0.00 | 0.00 |
Net realized and unrealized gains (losses) on investments
| 7.30 | 8.29 | 4.10 | 8.96 | 5.96 | (1.16) |
Total from investment operations
| 7.14 | 7.79 | 3.62 | 8.46 | 5.55 | (1.55) |
| Distributions to shareholders from | | | | | | |
Net realized gains
| (4.37) | (3.10) | (5.81) | (6.91) | (1.15) | (3.93) |
Net asset value, end of period
| $43.29 | $40.52 | $35.83 | $38.02 | $36.47 | $32.07 |
Total return2
| 17.95% 3 | 23.61% | 13.04% | 25.88% | 18.00% | (3.75)% |
| Ratios to average net assets (annualized) | | | | | | |
Gross expenses
| 2.02% | 2.03% | 2.03% | 2.03% | 2.03% | 2.03% |
Net expenses
| 2.02% | 2.03% | 2.03% | 2.03% | 2.03% | 2.03% |
Net investment loss
| (1.62)% | (1.42)% | (1.40)% | (1.38)% | (1.24)% | (1.22)% |
| Supplemental data | | | | | | |
Portfolio turnover rate
| 15% | 23% | 39% | 48% | 76% | 84% |
Net assets, end of period (000s omitted)
| $16,678 | $22,077 | $26,122 | $62,074 | $62,543 | $74,337 |
| 1 | Calculated based upon average shares outstanding |
| 2 | Total return calculations do not include any sales charges. Returns for periods of less than one year are not annualized. |
| 3 | During the six months ended January 31, 2021, the Fund received a payment from an affiliate which had a 0.51% impact on total return. See Note 4 in the Notes to Financial Statements for additional information. |
The accompanying notes are an integral part of these financial statements.
Wells Fargo Omega Growth Fund | 15
Financial highlights
(For a share outstanding throughout each period)
| | | Year ended July 31 |
| Class R | Six months ended
January 31, 2021
(unaudited) | 2020 | 2019 | 2018 | 2017 | 2016 |
Net asset value, beginning of period
| $60.60 | $51.82 | $51.92 | $47.30 | $41.04 | $46.66 |
Net investment loss
| (0.36) 1 | (0.47) 1 | (0.43) 1 | (0.43) 1 | (0.30) 1 | (0.29) 1 |
Net realized and unrealized gains (losses) on investments
| 11.06 | 12.35 | 6.14 | 11.96 | 7.71 | (1.40) |
Total from investment operations
| 10.70 | 11.88 | 5.71 | 11.53 | 7.41 | (1.69) |
| Distributions to shareholders from | | | | | | |
Net realized gains
| (4.37) | (3.10) | (5.81) | (6.91) | (1.15) | (3.93) |
Net asset value, end of period
| $66.93 | $60.60 | $51.82 | $51.92 | $47.30 | $41.04 |
Total return2
| 17.88% | 24.24% | 13.63% | 26.53% | 18.58% | (3.30)% |
| Ratios to average net assets (annualized) | | | | | | |
Gross expenses
| 1.50% | 1.52% | 1.53% | 1.53% | 1.53% | 1.53% |
Net expenses
| 1.50% | 1.52% | 1.53% | 1.53% | 1.53% | 1.53% |
Net investment loss
| (1.11)% | (0.91)% | (0.88)% | (0.88)% | (0.72)% | (0.71)% |
| Supplemental data | | | | | | |
Portfolio turnover rate
| 15% | 23% | 39% | 48% | 76% | 84% |
Net assets, end of period (000s omitted)
| $4,716 | $4,647 | $6,097 | $7,494 | $6,298 | $10,122 |
| 1 | Calculated based upon average shares outstanding |
| 2 | Returns for periods of less than one year are not annualized. |
The accompanying notes are an integral part of these financial statements.
16 | Wells Fargo Omega Growth Fund
Financial highlights
(For a share outstanding throughout each period)
| | | Year ended July 31 |
| Administrator Class | Six months ended
January 31, 2021
(unaudited) | 2020 | 2019 | 2018 | 2017 | 2016 |
Net asset value, beginning of period
| $71.80 | $60.58 | $59.39 | $52.99 | $45.65 | $51.20 |
Net investment loss
| (0.28) 1 | (0.30) 1 | (0.25) 1 | (0.25) 1 | (0.12) 1 | (0.12) 1 |
Net realized and unrealized gains (losses) on investments
| 13.16 | 14.62 | 7.25 | 13.56 | 8.61 | (1.50) |
Total from investment operations
| 12.88 | 14.32 | 7.00 | 13.31 | 8.49 | (1.62) |
| Distributions to shareholders from | | | | | | |
Net realized gains
| (4.37) | (3.10) | (5.81) | (6.91) | (1.15) | (3.93) |
Net asset value, end of period
| $80.31 | $71.80 | $60.58 | $59.39 | $52.99 | $45.65 |
Total return2
| 18.13% | 24.78% | 14.12% | 27.07% | 19.08% | (2.84)% |
| Ratios to average net assets (annualized) | | | | | | |
Gross expenses
| 1.19% | 1.20% | 1.20% | 1.20% | 1.20% | 1.19% |
Net expenses
| 1.08% | 1.09% | 1.10% | 1.10% | 1.10% | 1.08% |
Net investment loss
| (0.71)% | (0.49)% | (0.45)% | (0.45)% | (0.25)% | (0.27)% |
| Supplemental data | | | | | | |
Portfolio turnover rate
| 15% | 23% | 39% | 48% | 76% | 84% |
Net assets, end of period (000s omitted)
| $35,558 | $28,712 | $26,141 | $24,140 | $19,754 | $38,039 |
| 1 | Calculated based upon average shares outstanding |
| 2 | Returns for periods of less than one year are not annualized. |
The accompanying notes are an integral part of these financial statements.
Wells Fargo Omega Growth Fund | 17
Financial highlights
(For a share outstanding throughout each period)
| | | Year ended July 31 |
| Institutional Class | Six months ended
January 31, 2021
(unaudited) | 2020 | 2019 | 2018 | 2017 | 2016 |
Net asset value, beginning of period
| $74.62 | $62.69 | $61.10 | $54.21 | $46.55 | $52.01 |
Net investment loss
| (0.19) 1 | (0.16) 1 | (0.12) 1 | (0.11) 1 | (0.03) 1 | (0.00) 2 |
Net realized and unrealized gains (losses) on investments
| 13.68 | 15.19 | 7.52 | 13.91 | 8.84 | (1.53) |
Total from investment operations
| 13.49 | 15.03 | 7.40 | 13.80 | 8.81 | (1.53) |
| Distributions to shareholders from | | | | | | |
Net realized gains
| (4.37) | (3.10) | (5.81) | (6.91) | (1.15) | (3.93) |
Net asset value, end of period
| $83.74 | $74.62 | $62.69 | $61.10 | $54.21 | $46.55 |
Total return3
| 18.27% | 25.09% | 14.39% | 27.39% | 19.40% | (2.61)% |
| Ratios to average net assets (annualized) | | | | | | |
Gross expenses
| 0.94% | 0.95% | 0.95% | 0.95% | 0.95% | 0.95% |
Net expenses
| 0.85% | 0.85% | 0.85% | 0.85% | 0.85% | 0.83% |
Net investment loss
| (0.47)% | (0.25)% | (0.20)% | (0.20)% | (0.06)% | (0.01)% |
| Supplemental data | | | | | | |
Portfolio turnover rate
| 15% | 23% | 39% | 48% | 76% | 84% |
Net assets, end of period (000s omitted)
| $106,735 | $90,900 | $75,456 | $64,792 | $62,987 | $76,980 |
| 1 | Calculated based upon average shares outstanding |
| 2 | Amount is more than $(0.005) |
| 3 | Returns for periods of less than one year are not annualized. |
The accompanying notes are an integral part of these financial statements.
18 | Wells Fargo Omega Growth Fund
Notes to financial statements (unaudited)
1. ORGANIZATION
Wells Fargo Funds Trust (the “Trust”), a Delaware statutory trust organized on March 10, 1999, is an open-end management investment company registered under the Investment Company Act of 1940, as amended (the “1940 Act”). As an investment company, the Trust follows the accounting and reporting guidance in Financial Accounting Standards Board (“FASB”) Accounting Standards Codification Topic 946, Financial Services – Investment Companies. These financial statements report on the Wells Fargo Omega Growth Fund (the “Fund”) which is a diversified series of the Trust.
2. SIGNIFICANT ACCOUNTING POLICIES
The following significant accounting policies, which are consistently followed in the preparation of the financial statements of the Fund, are in conformity with U.S. generally accepted accounting principles which require management to make estimates and assumptions that affect the reported amounts of assets and liabilities, disclosure of contingent assets and liabilities at the date of the financial statements, and the reported amounts of income and expenses during the reporting period. Actual results could differ from those estimates.
Securities valuation
All investments are valued each business day as of the close of regular trading on the New York Stock Exchange (generally 4 p.m. Eastern Time), although the Fund may deviate from this calculation time under unusual or unexpected circumstances.
Equity securities that are listed on a foreign or domestic exchange or market are valued at the official closing price or, if none, the last sales price. If no sale occurs on the principal exchange or market that day, a fair value price will be determined in accordance with the Fund’s Valuation Procedures.
Investments in registered open-end investment companies are valued at net asset value. Interests in non-registered investment companies that are redeemable at net asset value are fair valued normally at net asset value.
Investments which are not valued using any of the methods discussed above are valued at their fair value, as determined in good faith by the Board of Trustees. The Board of Trustees has established a Valuation Committee comprised of the Trustees and has delegated to it the authority to take any actions regarding the valuation of portfolio securities that the Valuation Committee deems necessary or appropriate, including determining the fair value of portfolio securities, unless the determination has been delegated to the Wells Fargo Asset Management Pricing Committee at Wells Fargo Funds Management, LLC (“Funds Management”). The Board of Trustees retains the authority to make or ratify any valuation decisions or approve any changes to the Valuation Procedures as it deems appropriate. On a quarterly basis, the Board of Trustees receives reports on any valuation actions taken by the Valuation Committee or the Wells Fargo Asset Management Pricing Committee which may include items for ratification.
Foreign currency translation
The accounting records of the Fund are maintained in U.S. dollars. The values of other assets and liabilities denominated in foreign currencies are translated into U.S. dollars at rates provided by an independent foreign currency pricing source at a time each business day specified by the Wells Fargo Asset Management Pricing Committee. Purchases and sales of securities, and income and expenses are converted at the rate of exchange on the respective dates of such transactions. Net realized foreign exchange gains or losses arise from sales of foreign currencies, currency gains or losses realized between the trade and settlement dates on securities transactions, and the difference between the amounts of dividends, interest and foreign withholding taxes recorded and the U.S. dollar equivalent of the amounts actually paid or received. Net unrealized foreign exchange gains and losses arise from changes in the fair value of assets and liabilities other than investments in securities resulting from changes in exchange rates. The changes in net assets arising from changes in exchange rates of securities and the changes in net assets resulting from changes in market prices of securities are not separately presented. Such changes are included in net realized and unrealized gains or losses from investments.
Securities lending
The Fund may lend its securities from time to time in order to earn additional income in the form of fees or interest on securities received as collateral or the investment of any cash received as collateral. When securities are on loan, the Fund receives interest or dividends on those securities. Cash collateral received in connection with its securities lending transactions is invested in Securities Lending Cash Investments, LLC (the “Securities Lending Fund”). Investments in Securities Lending Fund are valued at the evaluated bid price provided by an independent pricing service. Income earned from investment in the Securities Lending Fund (net of fees and rebates), if any, is included in income from affiliated securities on the Statement of Operations.
Wells Fargo Omega Growth Fund | 19
Notes to financial statements (unaudited)
In a securities lending transaction, the net asset value of the Fund is affected by an increase or decrease in the value of the securities loaned and by an increase or decrease in the value of the instrument in which collateral is invested. The amount of securities lending activity undertaken by the Fund fluctuates from time to time. The Fund has the right under the lending agreement to recover the securities from the borrower on demand. In the event of default or bankruptcy by the borrower, the Fund may be prevented from recovering the loaned securities or gaining access to the collateral or may experience delays or costs in doing so. In such an event, the terms of the agreement allow the unaffiliated securities lending agent to use the collateral to purchase replacement securities on behalf of the Fund or pay the Fund the market value of the loaned securities. The Fund bears the risk of loss with respect to depreciation of its investment of the cash collateral.
Security transactions and income recognition
Securities transactions are recorded on a trade date basis. Realized gains or losses are recorded on the basis of identified cost.
Dividend income is recognized on the ex-dividend date. Dividend income is recorded net of foreign taxes withheld where recovery of such taxes is not assured.
Distributions to shareholders
Distributions to shareholders from net investment income and any net realized gains are recorded on the ex-dividend date and paid at least annually. Such distributions are determined in accordance with income tax regulations and may differ from U.S. generally accepted accounting principles. Dividend sources are estimated at the time of declaration. The tax character of distributions is determined as of the Fund’s fiscal year end. Therefore, a portion of the Fund’s distributions made prior to the Fund’s fiscal year end may be categorized as a tax return of capital at year end.
Federal and other taxes
The Fund intends to continue to qualify as a regulated investment company by distributing substantially all of its investment company taxable income and any net realized capital gains (after reduction for capital loss carryforwards) sufficient to relieve it from all, or substantially all, federal income taxes. Accordingly, no provision for federal income taxes was required.
The Fund’s income and federal excise tax returns and all financial records supporting those returns for the prior three fiscal years are subject to examination by the federal and Delaware revenue authorities. Management has analyzed the Fund’s tax positions taken on federal, state, and foreign tax returns for all open tax years and does not believe that there are any uncertain tax positions that require recognition of a tax liability.
As of January 31, 2021, the aggregate cost of all investments for federal income tax purposes was $495,056,842 and the unrealized gains (losses) consisted of:
| Gross unrealized gains | $591,780,736 |
| Gross unrealized losses | (357,808) |
| Net unrealized gains | $591,422,928 |
As of July 31, 2020, the Fund had a qualified late-year ordinary loss of $1,808,659 which was recognized on the first day of the current fiscal year.
Class allocations
The separate classes of shares offered by the Fund differ principally in applicable sales charges, distribution, shareholder servicing, and administration fees. Class specific expenses are charged directly to that share class. Investment income, common fund-level expenses, and realized and unrealized gains (losses) on investments are allocated daily to each class of shares based on the relative proportion of net assets of each class.
20 | Wells Fargo Omega Growth Fund
Notes to financial statements (unaudited)
3. FAIR VALUATION MEASUREMENTS
Fair value measurements of investments are determined within a framework that has established a fair value hierarchy based upon the various data inputs utilized in determining the value of the Fund’s investments. The three-level hierarchy gives the highest priority to unadjusted quoted prices in active markets for identical assets or liabilities (Level 1) and the lowest priority to unobservable inputs (Level 3). The Fund’s investments are classified within the fair value hierarchy based on the lowest level of input that is significant to the fair value measurement. The inputs are summarized into three broad levels as follows:
| ■ | Level 1 – quoted prices in active markets for identical securities |
| ■ | Level 2 – other significant observable inputs (including quoted prices for similar securities, interest rates, prepayment speeds, credit risk, etc.) |
| ■ | Level 3 – significant unobservable inputs (including the Fund’s own assumptions in determining the fair value of investments) |
The inputs or methodologies used for valuing investments in securities are not necessarily an indication of the risk associated with investing in those securities.
The following is a summary of the inputs used in valuing the Fund’s assets and liabilities as of January 31, 2021:
| | Quoted prices
(Level 1) | Other significant
observable inputs
(Level 2) | Significant
unobservable inputs
(Level 3) | Total |
| Assets | | | | |
| Investments in: | | | | |
| Common stocks | | | | |
| Communication services | $ 114,901,353 | $0 | $0 | $ 114,901,353 |
| Consumer discretionary | 190,161,344 | 0 | 0 | 190,161,344 |
| Financials | 31,820,750 | 0 | 0 | 31,820,750 |
| Health care | 188,391,269 | 0 | 0 | 188,391,269 |
| Industrials | 72,539,681 | 0 | 0 | 72,539,681 |
| Information technology | 434,148,219 | 0 | 0 | 434,148,219 |
| Materials | 16,534,020 | 0 | 0 | 16,534,020 |
| Real estate | 12,600,623 | 0 | 0 | 12,600,623 |
| Short-term investments | | | | |
| Investment companies | 25,382,511 | 0 | 0 | 25,382,511 |
| Total assets | $1,086,479,770 | $0 | $0 | $1,086,479,770 |
Additional sector, industry or geographic detail, if any, is included in the Portfolio of Investments.
For the six months ended January 31, 2021, the Fund did not have any transfers into/out of Level 3.
4. TRANSACTIONS WITH AFFILIATES
Management fee
Funds Management, an indirect wholly owned subsidiary of Wells Fargo & Company (“Wells Fargo”), is the manager of the Fund and provides advisory and fund-level administrative services under an investment management agreement. Under the investment management agreement, Funds Management is responsible for, among other services, implementing the investment objectives and strategies of the Fund, supervising the subadviser and providing fund-level administrative services in connection with the Fund’s operations. As compensation for its services under the investment management agreement, Funds Management is entitled to receive a management fee at the following annual rate based on the Fund’s average daily net assets:
Wells Fargo Omega Growth Fund | 21
Notes to financial statements (unaudited)
| Average daily net assets | Management fee |
| First $500 million | 0.800% |
| Next $500 million | 0.750 |
| Next $1 billion | 0.700 |
| Next $2 billion | 0.675 |
| Next $1 billion | 0.650 |
| Next $3 billion | 0.640 |
| Next $2 billion | 0.615 |
| Next $2 billion | 0.605 |
| Next $4 billion | 0.580 |
| Over $16 billion | 0.555 |
For the six months ended January 31, 2021, the management fee was equivalent to an annual rate of 0.77% of the Fund’s average daily net assets.
Funds Management has retained the services of a subadviser to provide daily portfolio management to the Fund. The fee for subadvisory services is borne by Funds Management. Wells Capital Management Incorporated ("WellsCap"), an affiliate of Funds Management and an indirect wholly owned subsidiary of Wells Fargo, is the subadviser to the Fund and is entitled to receive a fee from Funds Management at an annual rate starting at 0.45% and declining to 0.30% as the average daily net assets of the Fund increase.
Administration fees
Under a class-level administration agreement, Funds Management provides class-level administrative services to the Fund, which includes paying fees and expenses for services provided by the transfer agent, sub-transfer agents, omnibus account servicers and record-keepers. As compensation for its services under the class-level administration agreement, Funds Management receives an annual fee which is calculated based on the average daily net assets of each class as follows:
| | Class-level
administration fee |
| Class A | 0.21% |
| Class C | 0.21 |
| Class R | 0.21 |
| Administrator Class | 0.13 |
| Institutional Class | 0.13 |
Waivers and/or expense reimbursements
Funds Management has contractually waived and/or reimbursed management and administration fees to the extent necessary to maintain certain net operating expense ratios for the Fund. When each class of the Fund has exceeded its expense cap, Funds Management has waived fees and/or reimbursed expenses from fund-level expenses on a proportionate basis and then from class specific expenses. When only certain classes exceed their expense caps, waivers and/or reimbursements are applied against class specific expenses before fund-level expenses. Funds Management has committed through November 30, 2021 to waive fees and/or reimburse expenses to the extent necessary to cap expenses. Prior to or after the commitment expiration date, the cap may be increased or the commitment to maintain the cap may be terminated only with the approval of the Board of Trustees. The expense caps are as follows:
| | Expense ratio caps |
| Class A | 1.30% |
| Class C | 2.05 |
| Class R | 1.55 |
| Administrator Class | 1.10 |
| Institutional Class | 0.85 |
22 | Wells Fargo Omega Growth Fund
Notes to financial statements (unaudited)
Distribution fees
The Trust has adopted a distribution plan for Class C and Class R shares of the Fund pursuant to Rule 12b-1 under the 1940 Act. Distribution fees are charged to Class C and Class R shares and paid to Wells Fargo Funds Distributor, LLC (“Funds Distributor”), the principal underwriter, at an annual rate of 0.75% of the average daily net assets of Class C shares and 0.25% of the average daily net assets of Class R shares.
In addition, Funds Distributor is entitled to receive the front-end sales charge from the purchase of Class A shares and a contingent deferred sales charge on the redemption of certain Class A shares. Funds Distributor is also entitled to receive the contingent deferred sales charges from redemptions of Class C shares. For the six months ended January 31, 2021, Funds Distributor received $8,445 from the sale of Class A shares. No contingent deferred sales charges were incurred by Class A and Class C shares for the six months ended January 31, 2021.
Shareholder servicing fees
The Trust has entered into contracts with one or more shareholder servicing agents, whereby Class A, Class C, Class R, and Administrator Class of the Fund are charged a fee at an annual rate of 0.25% of the average daily net assets of each respective class. A portion of these total shareholder servicing fees were paid to affiliates of Wells Fargo.
Interfund transactions
The Fund may purchase or sell portfolio investment securities to certain other Wells Fargo affiliates pursuant to Rule 17a-7 under the 1940 Act and under procedures adopted by the Board of Trustees. The procedures have been designed to ensure that these interfund transactions, which do not incur broker commissions, are effected at current market prices.
Other transactions
On August 14, 2020, Class A and Class C of the Fund was reimbursed by Funds Management in the amount of $4,497 and $72,542, respectively. The reimbursement was. made in connection with resolving certain fee reimbursements.
5. INVESTMENT PORTFOLIO TRANSACTIONS
Purchases and sales of investments, excluding U.S. government obligations (if any) and short-term securities, for the six months ended January 31, 2021 were $147,443,061 and $200,148,212, respectively.
6. SECURITIES LENDING TRANSACTIONS
The Fund lends its securities through an unaffiliated securities lending agent and receives collateral in the form of cash or securities with a value at least equal to the value of the securities on loan. The value of the loaned securities is determined at the close of each business day and any increases or decreases in the required collateral are exchanged between the Fund and the counterparty on the next business day. Cash collateral received is invested in the Securities Lending Fund which seeks to provide a positive return compared to the daily Federal Funds Open Rate by investing in high-quality, U.S. dollar-denominated short-term money market instruments and is exempt from registration under Section 3(c)(7) of the 1940 Act. Securities Lending Fund is managed by Funds Management and is subadvised by WellsCap. Funds Management receives an advisory fee starting at 0.05% and declining to 0.01% as the average daily net assets of the Securities Lending Fund increase. All of the fees received by Funds Management are paid to WellsCap for its services as subadviser.
In the event of counterparty default or the failure of a borrower to return a loaned security, the Fund has the right to use the collateral to offset any losses incurred. As of January 31, 2021, the Fund had securities lending transactions with the following counterparties which are subject to offset:
| Counterparty | Value of
securities on
loan | Collateral
received1 | Net amount |
| Barclays Capital Inc. | $11,733,098 | $(11,733,098) | $0 |
| Bank of America Securities Inc. | 246,688 | (246,688) | 0 |
1 Collateral received within this table is limited to the collateral for the net transaction with the counterparty.
7. BANK BORROWINGS
The Trust (excluding the money market funds), Wells Fargo Master Trust and Wells Fargo Variable Trust are parties to a $350,000,000 revolving credit agreement whereby the Fund is permitted to use bank borrowings for temporary or emergency purposes, such as to fund shareholder redemption requests. Interest under the credit agreement is charged to the Fund based
Wells Fargo Omega Growth Fund | 23
Notes to financial statements (unaudited)
on a borrowing rate equal to the higher of the Federal Funds rate in effect on that day plus 1.25% or the overnight LIBOR rate in effect on that day plus 1.25%. In addition, an annual commitment fee equal to 0.25% of the unused balance is allocated to each participating fund.
For the six months ended January 31, 2021, there were no borrowings by the Fund under the agreement.
8. CONCENTRATION RISKS
Concentration risks result from exposure to a limited number of sectors. As of the end of the period, the Fund concentrated its portfolio in investments related to the information technology sector. A fund that invests a substantial portion of its assets in any sector may be more affected by changes in that sector than would be a fund whose investments are not heavily weighted in any sector.
9. INDEMNIFICATION
Under the Fund's organizational documents, the officers and Trustees have been granted certain indemnification rights against certain liabilities that may arise out of performance of their duties to the Fund. The Fund has entered into a separate agreement with each Trustee that converts indemnification rights currently existing under the Fund’s organizational documents into contractual rights that cannot be changed in the future without the consent of the Trustee. Additionally, in the normal course of business, the Fund may enter into contracts with service providers that contain a variety of indemnification clauses. The Fund’s maximum exposure under these arrangements is dependent on future claims that may be made against the Fund and, therefore, cannot be estimated.
10. NEW ACCOUNTING PRONOUNCEMENT
In August 2018, FASB issued Accounting Standards Update (“ASU”) No. 2018-13, Fair Value Measurement (Topic 820) Disclosure Framework—Changes to the Disclosure Requirements for Fair Value Measurement. ASU 2018-13 updates the disclosure requirements for fair value measurements by modifying or removing certain disclosures and adding certain new disclosures. The amendments are effective for fiscal years, and interim periods within those fiscal years, beginning after December 15, 2019. Early adoption is permitted. Management has adopted the removal and modification of disclosures early, as permitted, and will adopt the additional new disclosures at the effective date.
11. CORONAVIRUS (COVID-19) PANDEMIC
On March 11, 2020, the World Health Organization announced that it had made the assessment that coronavirus disease 2019 (“COVID-19”) is a pandemic. The impacts of COVID-19 are affecting the entire global economy, individual companies and investment products, the funds, and the market in general. There is significant uncertainty around the extent and duration of business disruptions related to COVID-19 and the impacts may be short term or may last for an extended period of time. The risk of further spreading of COVID-19 has led to significant uncertainty and volatility in the financial markets.
12. SUBSEQUENT EVENT
On February 23, 2021, Wells Fargo announced that it has entered into a definitive agreement to sell Wells Fargo Asset Management (“WFAM”) to GTCR LLC and Reverence Capital Partners, L.P. WFAM is the trade name used by the asset management businesses of Wells Fargo and includes Wells Fargo Funds Management, LLC, the investment manager to the Fund, Wells Capital Management Incorporated and Wells Fargo Asset Management (International) Limited, both registered investment advisers providing sub-advisory services to certain funds, and Wells Fargo Funds Distributor, LLC, the Fund’s principal underwriter. As part of the transaction, Wells Fargo will own a 9.9% equity interest and will continue to serve as an important client and distribution partner.
Consummation of the transaction will result in the automatic termination of the Fund’s investment management agreement and sub-advisory agreement. The Fund’s Board of Trustees will be asked to approve new investment management arrangements with the new company. If approved by the Board, the new investment management arrangements with the new company will be presented to the shareholders of the Fund for approval, and, if approved by shareholders, would take effect upon the closing of the transaction. The transaction is expected to close in the second half of 2021, subject to customary closing conditions.
24 | Wells Fargo Omega Growth Fund
Other information (unaudited)
PROXY VOTING INFORMATION
A description of the policies and procedures used to determine how to vote proxies relating to portfolio securities is available without charge, upon request, by calling 1-800-222-8222, visiting our website at wfam.com, or visiting the SEC website at sec.gov. Information regarding how the proxies related to portfolio securities were voted during the most recent 12-month period ended June 30 is available on the website at wfam.com or by visiting the SEC website at sec.gov.
QUARTERLY PORTFOLIO HOLDINGS INFORMATION
The Fund files its complete schedule of portfolio holdings with the SEC for the first and third quarters of each fiscal year as an exhibit to its reports on Form N-PORT. Shareholders may view the filed Form N-PORT by visiting the SEC website at sec.gov.
Wells Fargo Omega Growth Fund | 25
Other information (unaudited)
BOARD OF TRUSTEES AND OFFICERS
Each of the Trustees and Officers listed in the table below acts in identical capacities for each fund in the Wells Fargo family of funds, which consists of 144 mutual funds comprising the Wells Fargo Funds Trust, Wells Fargo Variable Trust, Wells Fargo Master Trust and four closed-end funds (collectively the “Fund Complex”). This table should be read in conjunction with the Prospectus and the Statement of Additional Information1. The mailing address of each Trustee and Officer is 525 Market Street, 12th Floor, San Francisco, CA 94105. Each Trustee and Officer serves an indefinite term, however, each Trustee serves such term until reaching the mandatory retirement age established by the Trustees.
Independent Trustees
Name and
year of birth | Position held and
length of service* | Principal occupations during past five years or longer | Current other
public company or
investment
company
directorships |
William R. Ebsworth
(Born 1957) | Trustee,
since 2015 | Retired. From 1984 to 2013, equities analyst, portfolio manager, research director and chief investment officer at Fidelity Management and Research Company in Boston, Tokyo, and Hong Kong, and retired in 2013 as Chief Investment Officer of Fidelity Strategic Advisers, Inc. where he led a team of investment professionals managing client assets. Prior thereto, Board member of Hong Kong Securities Clearing Co., Hong Kong Options Clearing Corp., the Thailand International Fund, Ltd., Fidelity Investments Life Insurance Company, and Empire Fidelity Investments Life Insurance Company. Audit Committee Chair and Investment Committee Chair of the Vincent Memorial Hospital Endowment (non-profit organization). Mr. Ebsworth is a CFA® charterholder. | N/A |
Jane A. Freeman
(Born 1953) | Trustee,
since 2015;
Chair Liaison,
since 2018 | Retired. From 2012 to 2014 and 1999 to 2008, Chief Financial Officer of Scientific Learning Corporation. From 2008 to 2012, Ms. Freeman provided consulting services related to strategic business projects. Prior to 1999, Portfolio Manager at Rockefeller & Co. and Scudder, Stevens & Clark. Board member of the Harding Loevner Funds from 1996 to 2014, serving as both Lead Independent Director and chair of the Audit Committee. Board member of the Russell Exchange Traded Funds Trust from 2011 to 2012 and the chair of the Audit Committee. Ms. Freeman is also an inactive Chartered Financial Analyst. | N/A |
Isaiah Harris, Jr.
(Born 1952) | Trustee,
since 2009; Audit
Committee
Chair,
since 2019 | Retired. Chairman of the Board of CIGNA Corporation since 2009, and Director since 2005. From 2003 to 2011, Director of Deluxe Corporation. Prior thereto, President and CEO of BellSouth Advertising and Publishing Corp. from 2005 to 2007, President and CEO of BellSouth Enterprises from 2004 to 2005 and President of BellSouth Consumer Services from 2000 to 2003. Emeritus member of the Iowa State University Foundation Board of Governors. Emeritus Member of the Advisory Board of Iowa State University School of Business. Advisory Board Member, Palm Harbor Academy (private school). Mr. Harris is a certified public accountant (inactive status). | CIGNA Corporation |
Judith M. Johnson
(Born 1949) | Trustee,
since 2008 | Retired. Prior thereto, Chief Executive Officer and Chief Investment Officer of Minneapolis Employees Retirement Fund from 1996 to 2008. Ms. Johnson is an attorney, certified public accountant and a certified managerial accountant. | N/A |
David F. Larcker
(Born 1950) | Trustee,
since 2009 | James Irvin Miller Professor of Accounting at the Graduate School of Business (Emeritus), Stanford University, Director of the Corporate Governance Research Initiative and Senior Faculty of The Rock Center for Corporate Governance since 2006. From 2005 to 2008, Professor of Accounting at the Graduate School of Business, Stanford University. Prior thereto, Ernst & Young Professor of Accounting at The Wharton School, University of Pennsylvania from 1985 to 2005. | N/A |
26 | Wells Fargo Omega Growth Fund
Other information (unaudited)
Name and
year of birth | Position held and
length of service* | Principal occupations during past five years or longer | Current other
public company or
investment
company
directorships |
Olivia S. Mitchell
(Born 1953) | Trustee,
since 2006;
Nominating and
Governance
Committee Chair,
since 2018 | International Foundation of Employee Benefit Plans Professor, Wharton School of the University of Pennsylvania since 1993. Director of Wharton’s Pension Research Council and Boettner Center on Pensions & Retirement Research, and Research Associate at the National Bureau of Economic Research. Previously, Cornell University Professor from 1978 to 1993. | N/A |
Timothy J. Penny
(Born 1951) | Trustee,
since 1996;
Chair,
since 2018 | President and Chief Executive Officer of Southern Minnesota Initiative Foundation, a non-profit organization, since 2007. Member of the Board of Trustees of NorthStar Education Finance, Inc., a non-profit organization, since 2007. | N/A |
James G. Polisson
(Born 1959) | Trustee,
since 2018 | Retired. Chief Marketing Officer, Source (ETF) UK Services, Ltd, from 2015 to 2017. From 2012 to 2015, Principal of The Polisson Group, LLC, a management consulting, corporate advisory and principal investing company. Chief Executive Officer and Managing Director at Russell Investments, Global Exchange Traded Funds from 2010 to 2012. Managing Director of Barclays Global Investors from 1998 to 2010 and Global Chief Marketing Officer for iShares and Barclays Global Investors from 2000 to 2010. Trustee of the San Francisco Mechanics’ Institute, a non-profit organization, from 2013 to 2015. Board member of the Russell Exchange Traded Fund Trust from 2011 to 2012. Director of Barclays Global Investors Holdings Deutschland GmbH from 2006 to 2009. Mr. Polisson is an attorney and has a retired status with the Massachusetts and District of Columbia Bar Associations. | N/A |
Pamela Wheelock
(Born 1959) | Trustee,
since January
2020; previously
Trustee from
January 2018 to
July 2019 | Board member of the Destination Medical Center Economic Development Agency, Rochester, Minnesota since 2019. Interim President of the McKnight Foundation from January to September 2020. Acting Commissioner, Minnesota Department of Human Services, July 2019 through September 2019. Human Services Manager (part-time), Minnesota Department of Human Services, October 2019 through December 2019. Chief Operating Officer, Twin Cities Habitat for Humanity from 2017 to 2019. Vice President of University Services, University of Minnesota from 2012 to 2016. Prior thereto, on the Board of Directors, Governance Committee and Finance Committee for the Minnesota Philanthropy Partners (Saint Paul Foundation) from 2012 to 2018, Interim Chief Executive Officer of Blue Cross Blue Shield of Minnesota from 2011 to 2012, Chairman of the Board from 2009 to 2012 and Board Director from 2003 to 2015. Vice President, Leadership and Community Engagement, Bush Foundation, Saint Paul, Minnesota (a private foundation) from 2009 to 2011. Executive Vice President and Chief Financial Officer, Minnesota Sports and Entertainment from 2004 to 2009 and Senior Vice President from 2002 to 2004. Executive Vice President of the Minnesota Wild Foundation from 2004 to 2008. Commissioner of Finance, State of Minnesota, from 1999 to 2002. Currently Board Chair of the Minnesota Wild Foundation since 2010. | N/A |
* Length of service dates reflect the Trustee’s commencement of service with the Trust’s predecessor entities, where applicable.
Wells Fargo Omega Growth Fund | 27
Other information (unaudited)
Officers
Name and
year of birth | Position held and
length of service | Principal occupations during past five years or longer |
Andrew Owen
(Born 1960) | President,
since 2017 | Executive Vice President of Wells Fargo & Company and Head of Affiliated Managers, Wells Fargo Asset Management, since 2014. In addition, Mr. Owen is currently President, Chief Executive Officer and Director of Wells Fargo Funds Management, LLC since 2017. Prior thereto, Executive Vice President responsible for marketing, investments and product development for Wells Fargo Funds Management, LLC, from 2009 to 2014. |
Jeremy DePalma
(Born 1974) | Treasurer,
since 2012
(for certain funds in
the Fund Complex);
since 2021 (for
the remaining funds in the
Fund Complex) | Senior Vice President of Wells Fargo Funds Management, LLC since 2009. Senior Vice President of Evergreen Investment Management Company, LLC from 2008 to 2010 and head of the Fund Reporting and Control Team within Fund Administration from 2005 to 2010. |
Michelle Rhee
(Born 1966) | Chief Legal Officer,
since 2019 | Secretary of Wells Fargo Funds Management, LLC and Chief Legal Counsel of Wells Fargo Asset Management since 2018. Deputy General Counsel of Wells Fargo Bank, N.A. since 2020 and Assistant General Counsel of Wells Fargo Bank, N.A. from 2018 to 2020. Associate General Counsel and Managing Director of Bank of America Corporation from 2004 to 2018. |
Catherine Kennedy
(Born 1969) | Secretary,
since 2019 | Vice President of Wells Fargo Funds Management, LLC and Senior Counsel of the Wells Fargo Legal Department since 2010. Vice President and Senior Counsel of Evergreen Investment Management Company, LLC from 1998 to 2010. |
Michael H. Whitaker
(Born 1967) | Chief Compliance Officer,
since 2016 | Chief Compliance Officer of Wells Fargo Asset Management since 2016. Senior Vice President and Chief Compliance Officer for Fidelity Investments from 2007 to 2016. |
1 The Statement of Additional Information includes additional information about the Trustees and is available, without charge, upon request, by calling 1-800-222-8222 or by visiting the website at wfam.com.
28 | Wells Fargo Omega Growth Fund
For more information
More information about Wells Fargo Funds is available free upon request. To obtain literature, please write, visit the Fund's website, or call:
Wells Fargo Funds
P.O. Box 219967
Kansas City, MO 64121-9967
Website: wfam.com
Individual investors: 1-800-222-8222
Retail investment professionals: 1-888-877-9275
Institutional investment professionals: 1-866-765-0778
This report and the financial statements contained herein are submitted for the general information of the shareholders of the Fund. If this report is used for promotional purposes, distribution of the report must be accompanied or preceded by a current prospectus. Before investing, please consider the investment objectives, risks, charges, and expenses of the investment. For a current prospectus and, if available, a summary prospectus, containing this information, call 1-800-222-8222 or visit the Fund’s website at wfam.com. Read the prospectus carefully before you invest or send money.
Wells Fargo Asset Management (WFAM) is the trade name for certain investment advisory/management firms owned by Wells Fargo & Company. These firms include but are not limited to Wells Capital Management Incorporated and Wells Fargo Funds Management, LLC. Certain products managed by WFAM entities are distributed by Wells Fargo Funds Distributor, LLC (a broker-dealer and Member FINRA).
This material is for general informational and educational purposes only and is NOT intended to provide investment advice or a recommendation of any kind— including a recommendation for any specific investment, strategy, or plan.
INVESTMENT PRODUCTS: NOT FDIC INSURED ■ NO BANK GUARANTEE ■ MAY LOSE VALUE
© 2021 Wells Fargo & Company. All rights reserved.
PAR-0221-00374 03-22
SA211/SAR211 01-21
Not applicable.
| ITEM 3. | AUDIT COMMITTEE FINANCIAL EXPERT |
Not applicable.
| ITEM 4. | PRINCIPAL ACCOUNTANT FEES AND SERVICES |
Not applicable.
| ITEM 5. | AUDIT COMMITTEE OF LISTED REGISTRANTS |
Not applicable.
A Portfolio of Investments for each series of Wells Fargo Funds Trust is included as part of the report to shareholders filed under Item 1 of this Form.
| ITEM 7. | DISCLOSURE OF PROXY VOTING POLICIES AND PROCEDURES FOR CLOSED-END MANAGEMENT INVESTMENT COMPANIES |
Not applicable.
| ITEM 8. | PORTFOLIO MANAGERS OF CLOSED-END MANAGEMENT INVESTMENT COMPANIES |
Not applicable.
| ITEM 9. | PURCHASES OF EQUITY SECURITIES BY CLOSED-END MANAGEMEENT INVESTMENT COMPANY AND AFFILIATED PURCHASERS |
Not applicable.
| ITEM 10. | SUBMISSION OF MATTERS TO A VOTE OF SECURITY HOLDERS |
There have been no material changes to the procedures by which shareholders may recommend nominees to the registrant’s Board of Trustees that have been implemented since the registrant’s last provided disclosure in response to the requirements of this Item.
| ITEM 11. | CONTROLS AND PROCEDURES |
(a) The President and Treasurer have concluded that the Wells Fargo Funds Trust disclosure controls and procedures (as defined in Rule 30a-3(c) under the Investment Company Act of 1940) provide reasonable assurances that material information relating to the registrant is made known to them by the appropriate persons, based on their evaluation of these controls and procedures as of a date within 90 days of the filing of this report.
(b) There were no significant changes in the registrant’s internal controls over financial reporting (as defined in Rule 30a-3(d) under the Investment Company Act of 1940) that occurred during the most recent fiscal half-year of the period covered by this report that materially affected, or is reasonably likely to materially affect, the registrant’s internal control over financial reporting.
| ITEM 12. | DISCLOSURES OF SECURITIES LENDING ACTIVITES FOR CLOSED-END MANAGEMENT INVESTMENT COMPANIES |
Not applicable.
(a)(1) Not applicable.
(a)(2) Certifications pursuant to Section 302 of the Sarbanes-Oxley Act of 2002.
(b) Certifications pursuant to Section 906 of the Sarbanes-Oxley Act of 2002.
SIGNATURES
Pursuant to the requirements of the Securities Exchange Act of 1934 and the Investment Company Act of 1940, the registrant has duly caused this report to be signed on its behalf by the undersigned, thereunto duly authorized.
| | |
| Wells Fargo Funds Trust |
| |
| By: | | /s/Andrew Owen |
| |
| | Andrew Owen |
| | President |
| |
| Date: | | March 29, 2021 |
Pursuant to the requirements of the Securities Exchange Act of 1934 and the Investment Company Act of 1940, this report has been signed below by the following persons on behalf of the registrant and in the capacities and on the date indicated.
| | |
| Wells Fargo Funds Trust |
| |
| By: | | /s/Andrew Owen |
| |
| | Andrew Owen |
| | President |
| |
| Date: | | March 29, 2021 |
| |
| By: | | /s/Jeremy DePalma |
| |
| | Jeremy DePalma |
| | Treasurer |
| |
| Date: | | March 29, 2021 |