UNITED STATES
SECURITIES AND EXCHANGE COMMISSION
Washington, D.C. 20549
FORM N-CSRS
CERTIFIED SHAREHOLDER REPORT OF REGISTERED
MANAGEMENT INVESTMENT COMPANIES
Investment Company Act file number: 811-09253
Wells Fargo Funds Trust
(Exact name of registrant as specified in charter)
525 Market St., San Francisco, CA 94105
(Address of principal executive offices) (Zip code)
Catherine Kennedy
Wells Fargo Funds Management, LLC
525 Market St., San Francisco, CA 94105
(Name and address of agent for service)
Registrant’s telephone number, including area code: 800-222-8222
Date of fiscal year end: April 30
Registrant is making a filing for 1 of its series: Wells Fargo Absolute Return Fund.
Date of reporting period: October 31, 2020
| ITEM 1. | REPORT TO STOCKHOLDERS |
Semi-Annual Report
October 31, 2020
Wells Fargo Absolute Return Fund
Beginning on January 1, 2021, as permitted by new regulations adopted by the Securities and Exchange Commission, paper copies of the Wells Fargo Funds’ annual and semi-annual shareholder reports issued after this date will no longer be sent by mail, unless you specifically request paper copies of the reports. Instead, the reports will be made available on the Funds’ website, and you will be notified by mail each time a report is posted and provided with a website address to access the report.
If you already elected to receive shareholder reports electronically, you will not be affected by this change and you need not take any action. You may elect to receive shareholder reports and other communications from the Fund electronically at any time by contacting your financial intermediary (such as a broker-dealer or bank) or, if you are a direct investor, by calling 1-800-222-8222 or by enrolling at wellsfargo.com/advantagedelivery.
You may elect to receive all future reports in paper free of charge. If you invest through a financial intermediary, you can contact your financial intermediary to request that you continue to receive paper copies of your shareholder reports; if you invest directly with the Fund, you can call 1-800-222-8222. Your election to receive reports in paper will apply to all Wells Fargo Funds held in your account with your financial intermediary or, if you are a direct investor, to all Wells Fargo Funds that you hold.
|
|
|
Reduce clutter. Save trees. |
Sign up for electronic delivery of prospectuses and shareholder reports at wellsfargo.com/
advantagedelivery |
The views expressed and any forward-looking statements are as of October 31, 2020, unless otherwise noted, and are those of the Fund’s portfolio managers and/or Wells Fargo Asset Management. Discussions of individual securities, or the markets generally, or any Wells Fargo Fund are not intended as individual recommendations. Future events or results may vary significantly from those expressed in any forward-looking statements. The views expressed are subject to change at any time in response to changing circumstances in the market. Wells Fargo Asset Management and the Fund disclaim any obligation to publicly update or revise any views expressed or forward-looking statements.
INVESTMENT PRODUCTS: NOT FDIC INSURED ◾ NO BANK GUARANTEE ◾ MAY LOSE VALUE
Wells Fargo Absolute Return Fund | 1
Letter to shareholders (unaudited)

Andrew Owen
President
Wells Fargo Funds
“The global equity market continued to rebound from earlier volatility in May, with widespread advances.”
Dear Shareholder:
We are pleased to offer you this semi-annual report for the Wells Fargo Absolute Return Fund for the six-month period that ended October 31, 2020. Global stock markets rallied strongly, driven by aggressive stimulus measures introduced by central banks and governments in response to challenges presented by the COVID-19 pandemic. Emerging market equities had particularly robust results during the six-month period. Among bonds, high-yield issues led the way while U.S. bonds generally had more modest returns than their international counterparts.
For the period, U.S. stocks, based on the S&P 500 Index,1 returned 13.29% and international stocks, as measured by the MSCI ACWI ex USA Index (Net),2 gained 12.22%. The MSCI EM Index (Net)3 rallied 20.96%. Among bond investments, the Bloomberg Barclays U.S. Aggregate Bond Index4 returned a modest 1.27%, the Bloomberg Barclays Global Aggregate ex-USD Index5 gained 5.99%, the Bloomberg Barclays Municipal Bond Index6 had a 4.99% return, and the ICE BofA U.S. High Yield Index7 gained a healthy 11.08%.
Equities enjoyed a strong tailwind from monetary and fiscal stimulus.
The global equity market continued to rebound from earlier volatility in May, with widespread advances. Investors regained confidence on reports of early signs of success in human trials of a COVID-19 vaccine. Growth stocks continued to lead value stocks while returns on global government bonds were generally flat. In the U.S., a gap grew between the stock market rebound and economic data. Manufacturing and services Purchasing Managers’ Indices reflected widespread weakening activity in May. U.S. corporate earnings reports understandably indicated a 14% year-over-year contraction in earnings from the first quarter of 2019. However, high demand for technology, driven by remote activity, supported robust information technology sector earnings, which helped drive major technology stocks higher.
Financial markets posted widely positive returns in June despite ongoing economic weakness and high levels of uncertainty on the containment of COVID-19 and the timing of an effective vaccine. As economies reopened, optimism rose. Vitally important to market sentiment was the ongoing global central bank commitment to do everything possible to provide economic support through liquidity and low borrowing costs. U.S. economic activity was boosted by one-time $1,200 stimulus checks and $600 weekly bonus unemployment benefits that carried tens of millions of
| 1 | The S&P 500 Index consists of 500 stocks chosen for market size, liquidity, and industry group representation. It is a market-value-weighted index with each stock’s weight in the index proportionate to its market value. You cannot invest directly in an index. |
| 2 | The Morgan Stanley Capital International (MSCI) All Country World Index (ACWI) ex USA Index (Net) is a free-float-adjusted market-capitalization-weighted index that is designed to measure the equity market performance of developed and emerging markets, excluding the United States. Source: MSCI. MSCI makes no express or implied warranties or representations and shall have no liability whatsoever with respect to any MSCI data contained herein. The MSCI data may not be further redistributed or used as a basis for other indices or any securities or financial products. This report is not approved, reviewed, or produced by MSCI. You cannot invest directly in an index. |
| 3 | The MSCI Emerging Markets (EM) Index (Net) is a free-float-adjusted market-capitalization-weighted index that is designed to measure equity market performance of emerging markets. You cannot invest directly in an index. |
| 4 | The Bloomberg Barclays U.S. Aggregate Bond Index is a broad-based benchmark that measures the investment-grade, U.S. dollar-denominated, fixed-rate taxable bond market, including Treasuries, government-related and corporate securities, mortgage-backed securities (agency fixed-rate and hybrid adjustable-rate mortgage pass-throughs), asset-backed securities, and commercial mortgage-backed securities. You cannot invest directly in an index. |
| 5 | The Bloomberg Barclays Global Aggregate ex-USD Index is an unmanaged index that provides a broad-based measure of the global investment-grade fixed-income markets excluding the U.S. dollar-denominated debt market. You cannot invest directly in an index. |
| 6 | The Bloomberg Barclays Municipal Bond Index is an unmanaged index composed of long-term tax-exempt bonds with a minimum credit rating of Baa. You cannot invest directly in an index. |
| 7 | The ICE BofA U.S. High Yield Index is a market-capitalization-weighted index of domestic and Yankee high-yield bonds. The index tracks the performance of high-yield securities traded in the U.S. bond market. You cannot invest directly in an index. Copyright 2020. ICE Data Indices, LLC. All rights reserved. |
2 | Wells Fargo Absolute Return Fund
Letter to shareholders (unaudited)
Americans through the end of July. However, unemployment remained historically high, easing somewhat from 14.7% in April to 11.1% in June. However, by late June, numerous states reported increases of COVID-19 cases. China’s economic recovery picked up momentum in June, though it remained far from a full recovery.
July was broadly positive for both global equities and fixed income. However, economic data and a resurgence of COVID-19 cases pointed to the vulnerability of the global economy and the ongoing imperative to regain control of the pandemic. Second-quarter gross domestic product (GDP) shrank from the previous quarter by 9.5% and 12.1% in the U.S. and the eurozone, respectively. In contrast, China reported a 3.2% year-over-year expansion in its second-quarter GDP. U.S. unemployment remained high despite adding 1.8 million jobs in July, with a double-digit jobless rate persisting. However, manufacturing activity grew in both the U.S. and the eurozone. In Asia, while China’s manufacturing sector continued to expand, activity in Japan and South Korea contracted. A rising concern was the rapid and broad reemergence of COVID-19 infections.
The stock market continued to rally in August despite concerns over widespread increases in the number of COVID-19 cases in the United States and Europe, as well as the July expiration of the U.S. $600 weekly bonus unemployment benefit. U.S. stocks had strong monthly gains, surpassing broadly positive overall global equity performance, while fixed-income market monthly returns were broadly flat. Generally stronger-than-expected second-quarter earnings boosted investor sentiment along with the Federal Reserve’s announcement of a policy shift that will likely lead to longer-term low interest rates and supportive monetary policy. U.S. indices measuring manufacturing and services activities beat expectations while the U.S. housing market maintained strength. In Europe, retail sales expanded and consumer confidence was steady. China’s economy continued to expand.
Stocks grew more volatile in September on mixed economic data. U.S. economic activity continued to grow. However, six months after the bottom fell out of the labor market in early spring, only half of the 22 million jobs lost had returned. The U.S. unemployment rate fell to 7.9% in September, reflecting steady improvement but far higher than the 3.5% pre-COVID-19 rate. Only 661,000 jobs were added for the month, down from 1.5 million in August. Meanwhile, a reported 2.3 million people have given up looking for work. With U.S. Congress failing to pass further fiscal relief and uncertainties surrounding a possible vaccine, doubts crept back into the financial markets. In the U.K., a lack of progress in Brexit talks with the European Union weighed on markets. China’s economy picked up steam, however, with growth fueled by increased global demand, and China’s services sector rallied.
In October, capital markets took a step back from their six-month rally. Market volatility rose in advance of the U.S. election and amid a global increase in COVID-19 infections. Europe responded with a new round of restrictions affecting economic activity. Meanwhile, Brexit remained unresolved as the European Union and the U.K. failed to strike a deal by a mid-October deadline. U.S. markets looked favorably at a possible Democratic sweep and control of the federal purse strings as that could lead to the passage of long-awaited additional fiscal stimulus, which could boost economic activity. Meanwhile, China continued to stand apart, reporting 4.9% third-quarter GDP growth year over year.
“In October, capital markets took a step back from their six-month rally. Market volatility rose in advance of the U.S. election and amid a global increase in COVID-19 infections.”
Wells Fargo Absolute Return Fund | 3
Letter to shareholders (unaudited)
|
|
|
For further information about your Fund, contact your investment professional, visit our website at wfam.com, or call us directly at 1-800-222-8222. |
Don’t let short-term uncertainty derail long-term investment goals.
Periods of investment uncertainty can present challenges, but experience has taught us that maintaining long-term investment goals can be an effective way to plan for the future. To help you create a sound strategy based on your personal goals and risk tolerance, Wells Fargo Funds offers more than 100 mutual funds spanning a wide range of asset classes and investment styles. Although diversification cannot guarantee an investment profit or prevent losses, we believe it can be an effective way to manage investment risk and potentially smooth out overall portfolio performance. We encourage investors to know their investments and to understand that appropriate levels of risk-taking may unlock opportunities.
Thank you for choosing to invest with Wells Fargo Funds. We appreciate your confidence in us and remain committed to helping you meet your financial needs.
Sincerely,

Andrew Owen
President
Wells Fargo Funds
Notice to Shareholders
At a meeting held on August 10-12, 2020, the Board of Trustees of the Fund approved a change to the Fund’s automatic conversion feature for Class C shares in order to shorten the required holding period from 10 to 8 years. As a result, on a monthly basis beginning November 5, 2020, Class C shares will convert automatically into Class A shares 8 years after the initial date of purchase or, if you acquired your Class C shares through an exchange or conversion from another share class, 8 years after the date you acquired your Class C shares. When Class C shares that you acquired through a purchase or exchange convert, any other Class C shares that you purchased with reinvested dividends and distributions also will convert into Class A shares on a pro rata basis.
Please note that a shorter holding period may apply depending on your intermediary. Please see “Appendix A—Sales Charge Reductions and Waivers for Certain Intermediaries” in the Fund’s prospectus for further information.
4 | Wells Fargo Absolute Return Fund
This page is intentionally left blank.
Performance highlights (unaudited)
Investment objective
The Fund seeks a positive total return.
Manager
Wells Fargo Funds Management, LLC
Portfolio managers
Ben Inker, CFA®‡1
John Thorndike1
Average annual total returns (%) as of October 31, 2020
| | | | | | | | | | | | | | | | | | | | | | | | | | | | | | | | | | |
| | | | |
| | | | | Including sales charge | | | Excluding sales charge | | | Expense ratios2 (%) | |
| | | | | | | | | |
| | | Inception date | | 1 year | | | 5 year | | | 10 year | | | 1 year | | | 5 year | | | 10 year | | | Gross | | | Net3 | |
| | | | | | | | | | |
| Class A (WARAX)4 | | 3-1-2012 | | | -10.06 | | | | 0.46 | | | | 2.09 | | | | -4.58 | | | | 1.65 | | | | 2.70 | | | | 1.50 | | | | 1.50 | |
| | | | | | | | | | |
| Class C (WARCX)5 | | 3-1-2012 | | | -6.05 | | | | 0.97 | | | | 1.95 | | | | -5.05 | | | | 0.97 | | | | 1.95 | | | | 2.25 | | | | 2.25 | |
| | | | | | | | | | |
| Class R (WARHX)6 | | 9-30-2015 | | | – | | | | – | | | | – | | | | -3.59 | | | | 1.70 | | | | 2.72 | | | | 1.75 | | | | 1.75 | |
| | | | | | | | | | |
| Class R6 (WARRX)7 | | 10-31-2014 | | | – | | | | – | | | | – | | | | -4.14 | | | | 2.13 | | | | 3.10 | | | | 1.07 | | | | 1.07 | |
| | | | | | | | | | |
| Administrator Class (WARDX)8 | | 3-1-2012 | | | – | | | | – | | | | – | | | | -3.99 | | | | 1.88 | | | | 2.88 | | | | 1.42 | | | | 1.38 | |
| | | | | | | | | | |
| Institutional Class (WABIX)9 | | 11-30-2012 | | | – | | | | – | | | | – | | | | -4.22 | | | | 2.02 | | | | 3.04 | | | | 1.17 | | | | 1.14 | |
| | | | | | | | | | |
| MSCI ACWI Index (Net)10 | | – | | | – | | | | – | | | | – | | | | 4.89 | | | | 8.11 | | | | 7.90 | | | | – | | | | – | |
| | | | | | | | | | |
| Bloomberg Barclays U.S. TIPS 1-10 Year Index11 | | – | | | – | | | | – | | | | – | | | | 7.00 | | | | 3.56 | | | | 2.51 | | | | – | | | | – | |
| | | | | | | | | | |
| CPI12 | | – | | | – | | | | – | | | | – | | | | 1.18 | | | | 1.83 | | | | 1.76 | | | | – | | | | – | |
Figures quoted represent past performance, which is no guarantee of future results, and do not reflect taxes that a shareholder may pay on an investment in a fund. Investment return and principal value of an investment will fluctuate so that an investor’s shares, when redeemed, may be worth more or less than their original cost. Performance shown without sales charges would be lower if sales charges were reflected. Current performance may be lower or higher than the performance data quoted, which assumes the reinvestment of dividends and capital gains. Current month-end performance is available on the Fund’s website, wfam.com.
Index returns do not include transaction costs associated with buying and selling securities, any mutual fund fees or expenses, or any taxes. It is not possible to invest directly in an index.
For Class A shares, the maximum front-end sales charge is 5.75%. For Class C shares, the maximum contingent deferred sales charge is 1.00%. Performance including a contingent deferred sales charge assumes the sales charge for the corresponding time period. Class R, Class R6, Administrator Class, and Institutional Class shares are sold without a front-end sales charge or contingent deferred sales charge.
Absolute return funds are not intended to outperform stocks and bonds in strong markets, and there is no guarantee of positive returns or that the Fund’s objectives will be achieved. Stock values fluctuate in response to the activities of individual companies and general market and economic conditions. Bond values fluctuate in response to the financial condition of individual issuers, general market and economic conditions, and changes in interest rates. Changes in market conditions and government policies may lead to periods of heightened volatility in the bond market and reduced liquidity for certain bonds held by the Fund. In general, when interest rates rise, bond values fall and investors may lose principal value. Interest rate changes and their impact on the Fund and its share price can be sudden and unpredictable. Borrowing money to purchase securities or to cover short positions magnifies losses and incurs expenses. Short selling is generally considered speculative, has the potential for unlimited loss, and may involve leverage. Alternative investments, such as commodities and merger arbitrage strategies, are speculative and entail a high degree of risk. Foreign investments are especially volatile and can rise or fall dramatically due to differences in the political and economic conditions of the host country. The Fund will indirectly be exposed to all of the risks of an investment in the underlying funds and will indirectly bear expenses of the underlying funds. The use of derivatives may reduce returns and/or increase volatility. Certain investment strategies tend to increase the total risk of an investment (relative to the broader market). The Fund is exposed to asset-backed securities risk, non-diversification risk, geographic risk, and smaller company securities risk. Consult the Fund’s prospectus for additional information on these and other risks.
Please see footnotes on page 7.
6 | Wells Fargo Absolute Return Fund
Performance highlights (unaudited)
| | | | |
|
| Holdings (%) as of October 31, 202013 | |
| | |
GMO Implementation Fund | | | 82.39 | |
| | |
GMO Opportunistic Income Fund, Class VI | | | 4.91 | |
| | |
GMO Emerging Country Debt Fund, Class IV | | | 2.89 | |
| | |
GMO SGM Major Markets Fund, Class VI | | | 2.64 | |
| | |
GMO Special Opportunities Fund, Class VI | | | 2.16 | |
| | |
GMO High Yield Fund, Class VI | | | 1.10 | |
|
|
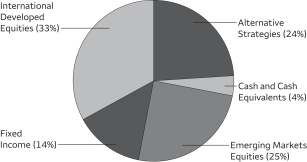
| Portfolio composition as of October 31, 202014 |
|
 |
| ‡ | CFA® and Chartered Financial Analyst® are trademarks owned by CFA Institute. |
| 1 | The Fund invests substantially all of its investable assets directly in GMO Benchmark-Free Allocation Fund, an investment company advised by Grantham, Mayo, Van Otterloo & Co. LLC (GMO). Mr. Inker and Mr. Thorndike have been responsible for coordinating the portfolio management of GMO Benchmark-Free Allocation Fund since 2003 and 2019, respectively. |
| 2 | Reflects the expense ratios as stated in the most recent prospectuses, which include the impact of 0.81% in acquired fund fees and expenses and underlying GMO fees. The expense ratios shown are subject to change and may differ from the annualized expense ratios shown in the financial highlights of this report, which do not include the expenses of GMO Benchmark-Free Allocation Fund and other acquired fund fees and expenses. |
| 3 | The manager has contractually committed through August 31, 2021, to waive fees and/or reimburse expenses to the extent necessary to cap total annual fund operating expenses after fee waivers at 0.71% for Class A, 1.46% for Class C, 0.96% for Class R, 0.28% for Class R6, 0.57% for Administrator Class, and 0.33% for Institutional Class. Brokerage commissions, stamp duty fees, interest, taxes, acquired fund fees and expenses (if any, including the expenses of GMO Benchmark-Free Allocation Fund), and extraordinary expenses are excluded from the expense caps. Prior to or after the commitment expiration date, the caps may be increased or the commitment to maintain the caps may be terminated only with the approval of the Board of Trustees. Without these caps, the Fund’s returns would have been lower. The expense ratio paid by an investor is the net expense ratio (the total annual fund operating expenses after fee waivers) as stated in the prospectuses. |
| 4 | Historical performance shown for the Class A shares prior to their inception is based on the performance of the Class III shares of the GMO Benchmark-Free Allocation Fund. The inception date of the GMO Benchmark-Free Allocation Fund Class III shares is July 23, 2003. Returns for the Class III shares do not reflect the GMO Benchmark-Free Allocation Fund’s current fee arrangement and have been adjusted downward to reflect the higher expense ratios applicable to the Class A shares at its inception. The ratio for the Class A shares was 1.66%. |
| 5 | Historical performance shown for the Class C shares prior to their inception is based on the performance of the Class III shares of the GMO Benchmark-Free Allocation Fund. The inception date of the GMO Benchmark-Free Allocation Fund Class III shares is July 23, 2003. Returns for the Class III shares do not reflect the GMO Benchmark-Free Allocation Fund’s current fee arrangement and have been adjusted downward to reflect the higher expense ratios applicable to the Class C shares at its inception. The ratio for the Class C shares was 2.41%. |
| 6 | Historical performance shown for the Class R shares prior to their inception reflects the performance of the Administrator Class shares, and is not adjusted to reflect the Class R share expenses. If these expenses had been included, returns for the Class R shares would be lower. |
| 7 | Historical performance shown for the Class R6 shares prior to their inception reflects the performance of the Institutional Class shares, and is not adjusted to reflect the Class R6 share expenses. If these expenses had been included, returns for the Class R6 shares would be higher. |
| 8 | Historical performance shown for the Administrator Class shares prior to their inception is based on the performance of the Class III shares of the GMO Benchmark-Free Allocation Fund. The inception date of the GMO Benchmark-Free Allocation Fund Class III shares is July 23, 2003. Returns for the Class III shares do not reflect the GMO Benchmark-Free Allocation Fund’s current fee arrangement and have been adjusted downward to reflect the higher expense ratios applicable to the Administrator Class shares at its inception. The ratio for the Institutional Class shares was 1.50%. |
| 9 | Historical performance shown for the Institutional Class shares prior to their inception reflects the performance of the Administrator Class shares, and is not adjusted to reflect the Institutional Class share expenses. If these expenses had been included, returns for the Institutional Class shares would be higher. |
| 10 | The Morgan Stanley Capital International (MSCI) All Country World Index (ACWI) Index (Net) is a free-float-adjusted market-capitalization-weighted index that is designed to measure the equity market performance of developed and emerging markets. Source: MSCI. MSCI makes no express or implied warranties or representations and shall have no liability whatsoever with respect to any MSCI data contained herein. The MSCI data may not be further redistributed or used as a basis for other indexes or any securities or financial products. This report is not approved, reviewed, or produced by MSCI. You cannot invest directly in an index. |
| 11 | The Bloomberg Barclays U.S. Treasury Inflation-Protected Securities (TIPS) 1-10 Year Index is an unmanaged index of U.S. Treasury securities with maturities of less than 10 years and more than 1 year. You cannot invest directly in an index. |
| 12 | The Consumer Price Index (CPI) is a measure of the average change over time in the prices paid by urban consumers for a market basket of consumer goods and services. You cannot invest directly in an index. |
| 13 | The holdings, excluding cash, cash equivalents and any money market funds, are calculated based on the value of the investments of GMO Benchmark-Free Allocation Fund divided by total net assets of the Fund. Holdings are subject to change and may have changed since the date specified. |
| 14 | Portfolio composition represents the portfolio allocation of the GMO Benchmark-Free Allocation Fund, which is calculated based on the investment exposures of the underlying GMO funds. Portfolio composition is subject to change and may have changed since the date specified. |
Wells Fargo Absolute Return Fund | 7
Fund expenses (unaudited)
As a shareholder of the Fund, you incur two types of costs: (1) transaction costs, including sales charges (loads) on purchase payments and contingent deferred sales charges (if any) on redemptions and (2) ongoing costs, including management fees, distribution (12b-1) and/or shareholder servicing fees, and other Fund expenses. This example is intended to help you understand your ongoing costs (in dollars) of investing in the Fund and to compare these costs with the ongoing costs of investing in other mutual funds.
The example is based on an investment of $1,000 invested at the beginning of the six-month period and held for the entire period from May 1, 2020 to October 31, 2020.
Actual expenses
The “Actual” line of the table below provides information about actual account values and actual expenses. You may use the information in this line, together with the amount you invested, to estimate the expenses that you paid over the period. Simply divide your account value by $1,000 (for example, an $8,600 account value divided by $1,000 = 8.6), then multiply the result by the number in the “Actual” line under the heading entitled “Expenses paid during period” for your applicable class of shares to estimate the expenses you paid on your account during this period.
Hypothetical example for comparison purposes
The “Hypothetical” line of the table below provides information about hypothetical account values and hypothetical expenses based on the Fund’s actual expense ratio and an assumed rate of return of 5% per year before expenses, which is not the Fund’s actual return. The hypothetical account values and expenses may not be used to estimate the actual ending account balance or expenses you paid for the period. You may use this information to compare the ongoing costs of investing in the Fund and other funds. To do so, compare this 5% hypothetical example with the 5% hypothetical examples that appear in the shareholder reports of the other funds.
Please note that the expenses shown in the table are meant to highlight your ongoing costs only and do not reflect any transactional costs, such as sales charges (loads) and contingent deferred sales charges. Therefore, the “Hypothetical” line of the table is useful in comparing ongoing costs only and will not help you determine the relative total costs of owning different funds. In addition, if these transactional costs were included, your costs would have been higher.
| | | | | | | | | | | | | | | | |
Wells Fargo Absolute Return Fund (excluding GMO
Benchmark-Free Allocation Fund and its underlying fund
expenses) | | Beginning account value 5-1-2020 | | | Ending account value 10-31-2020 | | | Expenses paid during the period1 | | | Annualized net expense ratio | |
| | | | | |
Class A | | | | | | | | | | | | | | | | |
| | | | |
Actual | | $ | 1,000.00 | | | $ | 1,027.70 | | | $ | 3.53 | | | | 0.69 | % |
| | | | |
Hypothetical (5% return before expenses) | | $ | 1,000.00 | | | $ | 1,021.73 | | | $ | 3.52 | | | | 0.69 | % |
| | | | | |
Class C | | | | | | | | | | | | | | | | |
| | | | |
Actual | | $ | 1,000.00 | | | $ | 1,027.14 | | | $ | 7.31 | | | | 1.43 | % |
| | | | |
Hypothetical (5% return before expenses) | | $ | 1,000.00 | | | $ | 1,018.00 | | | $ | 7.27 | | | | 1.43 | % |
| | | | | |
Class R | | | | | | | | | | | | | | | | |
| | | | |
Actual | | $ | 1,000.00 | | | $ | 1,038.72 | | | $ | 3.49 | | | | 0.68 | % |
| | | | |
Hypothetical (5% return before expenses) | | $ | 1,000.00 | | | $ | 1,021.78 | | | $ | 3.47 | | | | 0.68 | % |
| | | | | |
Class R6 | | | | | | | | | | | | | | | | |
| | | | |
Actual | | $ | 1,000.00 | | | $ | 1,030.66 | | | $ | 1.33 | | | | 0.26 | % |
| | | | |
Hypothetical (5% return before expenses) | | $ | 1,000.00 | | | $ | 1,023.89 | | | $ | 1.33 | | | | 0.26 | % |
| | | | | |
Administrator Class | | | | | | | | | | | | | | | | |
| | | | |
Actual | | $ | 1,000.00 | | | $ | 1,033.50 | | | $ | 2.92 | | | | 0.57 | % |
| | | | |
Hypothetical (5% return before expenses) | | $ | 1,000.00 | | | $ | 1,022.33 | | | $ | 2.91 | | | | 0.57 | % |
| | | | | |
Institutional Class | | | | | | | | | | | | | | | | |
| | | | |
Actual | | $ | 1,000.00 | | | $ | 1,029.67 | | | $ | 1.69 | | | | 0.33 | % |
| | | | |
Hypothetical (5% return before expenses) | | $ | 1,000.00 | | | $ | 1,023.54 | | | $ | 1.68 | | | | 0.33 | % |
| 1 | Expenses paid is equal to the annualized net expense ratio of each class multiplied by the average account value over the period, multiplied by the number of days in the most recent fiscal half-year divided by the number of days in the fiscal year (to reflect the one-half-year period). |
8 | Wells Fargo Absolute Return Fund
Fund expenses (unaudited)
| | | | | | | | | | | | | | | | |
Wells Fargo Absolute Return Fund (including GMO
Benchmark-Free Allocation Fund and its underlying fund
expenses) | | Beginning account value 5-1-2020 | | | Ending account value 10-31-2020 | | | Expenses paid during the period1 | | | Annualized net expense ratio | |
| | | | | |
Class A | | | | | | | | | | | | | | | | |
| | | | |
Actual | | $ | 1,000.00 | | | $ | 1,027.70 | | | $ | 7.87 | | | | 1.54 | % |
| | | | |
Hypothetical (5% return before expenses) | | $ | 1,000.00 | | | $ | 1,017.44 | | | $ | 7.83 | | | | 1.54 | % |
| | | | | |
Class C | | | | | | | | | | | | | | | | |
| | | | |
Actual | | $ | 1,000.00 | | | $ | 1,027.14 | | | $ | 11.65 | | | | 2.28 | % |
| | | | |
Hypothetical (5% return before expenses) | | $ | 1,000.00 | | | $ | 1,013.71 | | | $ | 11.57 | | | | 2.28 | % |
| | | | | |
Class R | | | | | | | | | | | | | | | | |
| | | | |
Actual | | $ | 1,000.00 | | | $ | 1,038.72 | | | $ | 7.86 | | | | 1.53 | % |
| | | | |
Hypothetical (5% return before expenses) | | $ | 1,000.00 | | | $ | 1,017.49 | | | $ | 7.78 | | | | 1.53 | % |
| | | | | |
Class R6 | | | | | | | | | | | | | | | | |
| | | | |
Actual | | $ | 1,000.00 | | | $ | 1,030.66 | | | $ | 5.68 | | | | 1.11 | % |
| | | | |
Hypothetical (5% return before expenses) | | $ | 1,000.00 | | | $ | 1,019.61 | | | $ | 5.65 | | | | 1.11 | % |
| | | | | |
Administrator Class | | | | | | | | | | | | | | | | |
| | | | |
Actual | | $ | 1,000.00 | | | $ | 1,033.50 | | | $ | 7.28 | | | | 1.42 | % |
| | | | |
Hypothetical (5% return before expenses) | | $ | 1,000.00 | | | $ | 1,018.05 | | | $ | 7.22 | | | | 1.42 | % |
| | | | | |
Institutional Class | | | | | | | | | | | | | | | | |
| | | | |
Actual | | $ | 1,000.00 | | | $ | 1,029.67 | | | $ | 6.04 | | | | 1.18 | % |
| | | | |
Hypothetical (5% return before expenses) | | $ | 1,000.00 | | | $ | 1,019.26 | | | $ | 6.01 | | | | 1.18 | % |
| 1 | Expenses paid is equal to the annualized net expense ratio of each class multiplied by the average account value over the period, multiplied by the number of days in the most recent fiscal half-year divided by the number of days in the fiscal year (to reflect the one-half-year period). |
Wells Fargo Absolute Return Fund | 9
Portfolio of investments—October 31, 2020 (unaudited)
| | | | | | | | | | | | | | | | |
| | | | | | | | | Shares | | | Value | |
| Investment Companies: 97.73% | | | | | | | | | | | | | | | | |
GMO Benchmark-Free Allocation Fund Class MF (l) | | | | | | | | | | | 73,211,939 | | | $ | 1,822,245,158 | |
| | | | | | | | | | | | | | | | |
| | | | |
Total Investment Companies (Cost $1,750,904,325) | | | | | | | | | | | | | | | 1,822,245,158 | |
| | | | | | | | | | | | | | | | |
| | | | | | | | |
| Total investments in securities (Cost $1,750,904,325) | | | 97.73 | % | | | 1,822,245,158 | |
| | |
Other assets and liabilities, net | | | 2.27 | | | | 42,310,516 | |
| | | | | | | | |
| Total net assets | | | 100.00 | % | | $ | 1,864,555,674 | |
| | | | | | | | |
| (l) | The issuer of the security is an affiliated person of the Fund as defined in the Investment Company Act of 1940. |
Investments in Affiliates
An affiliated investment is an investment in which the Fund owns at least 5% of the outstanding voting shares of the issuer or as a result of other relationships, such as the Fund and the issuer having the same investment manager. Transactions with issuers that were either affiliated persons of the Fund at the beginning of the period or the end of the period were as follows:
| | | | | | | | | | | | | | | | | | | | | | | | | | | | | | | | | | | | | | | | |
| | | Value,
beginning of
period | | | Purchases | | | Sales
proceeds | | | Net realized gains (losses) | | | Net change in unrealized gains (losses) | | | Value, end of period | | | % of
net
assets | | | Shares,
end of
period | | | Dividends
from
affiliated
investment
companies | | | Capital gain
distributions
from
affiliated
investment
companies | |
| | | | | | | | | | |
| Investment Companies | | | | | | | | | | | | | | | | | | | | | | | | | | | | | | |
GMO Benchmark-Free Allocation Fund Class MF | | $ | 2,259,258,586 | | | $ | 24,820,909 | | | $ | (516,115,780 | ) | | $ | 3,531,313 | | | $ | 50,750,130 | | | $ | 1,822,245,158 | | | | 97.73 | % | | | 73,211,939 | | | $ | 1,564,378 | | | $ | 13,993,903 | |
The accompanying notes are an integral part of these financial statements.
10 | Wells Fargo Absolute Return Fund
Statement of assets and liabilities—October 31, 2020 (unaudited)
| | | | |
| | | | |
| |
Assets | | | | |
Investments in affiliated investment companies, at value (cost $1,750,904,325) | | $ | 1,822,245,158 | |
Cash | | | 44,986,652 | |
Receivable for investments sold | | | 5,013,348 | |
Receivable for Fund shares sold | | | 1,180,734 | |
Prepaid expenses and other assets | | | 2,872 | |
| | | | |
Total assets | | | 1,873,428,764 | |
| | | | |
| |
Liabilities | | | | |
Payable for Fund shares redeemed | | | 7,359,125 | |
Management fee payable | | | 327,143 | |
Administration fees payable | | | 255,973 | |
Distribution fees payable | | | 128,556 | |
Shareholder report expenses payable | | | 591,078 | |
Trustees’ fees and expenses payable | | | 1,189 | |
Accrued expenses and other liabilities | | | 210,026 | |
| | | | |
Total liabilities | | | 8,873,090 | |
| | | | |
Total net assets | | $ | 1,864,555,674 | |
| | | | |
| |
Net assets consist of | | | | |
Paid-in capital | | $ | 2,267,249,774 | |
Total distributable loss | | | (402,694,100 | ) |
| | | | |
Total net assets | | $ | 1,864,555,674 | |
| | | | |
| |
Computation of net asset value and offering price per share | | | | |
Net assets – Class A | | $ | 295,772,533 | |
Shares outstanding – Class A1 | | | 28,455,962 | |
Net asset value per share – Class A | | | $10.39 | |
Maximum offering price per share – Class A2 | | | $11.02 | |
Net assets – Class C | | $ | 190,522,824 | |
Shares outstanding – Class C1 | | | 18,635,283 | |
Net asset value per share – Class C | | | $10.22 | |
Net assets – Class R | | $ | 27,059 | |
Shares outstanding – Class R1 | | | 2,522 | |
Net asset value per share – Class R | | | $10.73 | |
Net assets – Class R6 | | $ | 19,549,793 | |
Shares outstanding – Class R61 | | | 1,876,563 | |
Net asset value per share – Class R6 | | | $10.42 | |
Net assets – Administrator Class | | $ | 45,015,698 | |
Shares outstanding – Administrator Class1 | | | 4,292,551 | |
Net asset value per share – Administrator Class | | | $10.49 | |
Net assets – Institutional Class | | $ | 1,313,667,767 | |
Shares outstanding – Institutional Class1 | | | 126,162,124 | |
Net asset value per share – Institutional Class | | | $10.41 | |
| 1 | The Fund has an unlimited number of authorized shares. |
| 2 | Maximum offering price is computed as 100/94.25 of net asset value. On investments of $50,000 or more, the offering price is reduced. |
The accompanying notes are an integral part of these financial statements.
Wells Fargo Absolute Return Fund | 11
Statement of operations—six months ended October 31, 2020 (unaudited)
| | | | |
| | | | |
| |
Investment income | | | | |
Dividends from affiliated investment companies | | $ | 1,564,378 | |
| | | | |
| |
Expenses | | | | |
Management fee | | | 2,282,342 | |
Administration fees | |
Class A | | | 321,131 | |
Class C | | | 238,548 | |
Class R | | | 29 | |
Class R6 | | | 3,282 | |
Administrator Class | | | 34,646 | |
Institutional Class | | | 1,005,807 | |
Shareholder servicing fees | |
Class A | | | 381,086 | |
Class C | | | 282,794 | |
Class R | | | 34 | |
Administrator Class | | | 64,783 | |
Distribution fees | |
Class C | | | 847,519 | |
Class R | | | 1 | |
Custody and accounting fees | | | 11,797 | |
Professional fees | | | 18,015 | |
Registration fees | | | 45,229 | |
Shareholder report expenses | | | 38,426 | |
Trustees’ fees and expenses | | | 9,883 | |
Other fees and expenses | | | 40,895 | |
| | | | |
Total expenses | | | 5,626,247 | |
Less: Fee waivers and/or expense reimbursements | |
Administrator Class | | | (7,973 | ) |
Institutional Class | | | (208,678 | ) |
| | | | |
Net expenses | | | 5,409,596 | |
| | | | |
Net investment loss | | | (3,845,218 | ) |
| | | | |
Payment from affiliate | | | 840,939 | |
| | | | |
| |
Realized and unrealized gains (losses) on investments | | | | |
Net realized gains on | |
Unaffiliated securities | | | 3,531,313 | |
Capital gain distributions from affiliated investment companies | | | 13,993,903 | |
| | | | |
Net realized gains on investments | | | 17,525,216 | |
Net change in unrealized gains (losses) on investments | | | 50,750,130 | |
| | | | |
Net realized and unrealized gains (losses) on investments | | | 68,275,346 | |
| | | | |
Net increase in net assets resulting from operations | | $ | 65,271,067 | |
| | | | |
The accompanying notes are an integral part of these financial statements.
12 | Wells Fargo Absolute Return Fund
Statement of changes in net assets
| | | | | | | | | | | | | | | | |
| | | Six months ended
October 31, 2020 (unaudited) | | | Year ended
April 30, 2020 | |
| | | | |
Operations | | | | | | | | | | | | | | | | |
Net investment income (loss) | | | | | | $ | (3,845,218 | ) | | | | | | $ | 91,487,675 | |
Payment from affiliate | | | | | | | 840,939 | | | | | | | | 0 | |
Net realized gains on investments | | | | | | | 17,525,216 | | | | | | | | 14,359,603 | |
Net change in unrealized gains (losses) on investments | | | | | | | 50,750,130 | | | | | | | | (314,690,632 | ) |
| | | | |
Net increase (decrease) in net assets resulting from operations | | | | | | | 65,271,067 | | | | | | | | (208,843,354 | ) |
| | | | |
| | | | |
Distributions to shareholders from net investment income and realized gains | | | | | | | | | | | | | | | | |
Class A | | | | | | | 0 | | | | | | | | (9,515,886 | ) |
Class C | | | | | | | 0 | | | | | | | | (5,326,006 | ) |
Class R6 | | | | | | | 0 | | | | | | | | (902,716 | ) |
Administrator Class | | | | | | | 0 | | | | | | | | (2,075,107 | ) |
Institutional Class | | | | | | | 0 | | | | | | | | (71,689,413 | ) |
| | | | |
Total distributions to shareholders | | | | | | | 0 | | | | | | | | (89,509,128 | ) |
| | | | |
| | | | |
Capital share transactions | | | Shares | | | | | | | | Shares | | | | | |
Proceeds from shares sold | | | | | | | | | | | | | | | | |
Class A | | | 4,200,401 | | | | 43,779,088 | | | | 4,671,061 | | | | 50,858,864 | |
Class C | | | 126,428 | | | | 1,285,628 | | | | 591,736 | | | | 6,399,495 | |
Class R | | | 3 | | | | 33 | | | | 1,073 | | | | 11,764 | |
Class R6 | | | 59,632 | | | | 613,503 | | | | 1,034,300 | | | | 11,116,006 | |
Administrator Class | | | 91,744 | | | | 943,746 | | | | 947,480 | | | | 10,476,640 | |
Institutional Class | | | 10,108,834 | | | | 104,308,921 | | | | 25,838,753 | | | | 281,518,141 | |
| | | | |
| | | | | | | 150,930,919 | | | | | | | | 360,380,910 | |
| | | | |
Reinvestment of distributions | | | | | | | | | | | | | | | | |
Class A | | | 0 | | | | 0 | | | | 765,410 | | | | 8,641,478 | |
Class C | | | 0 | | | | 0 | | | | 407,464 | | | | 4,539,140 | |
Class R6 | | | 0 | | | | 0 | | | | 60,641 | | | | 683,427 | |
Administrator Class | | | 0 | | | | 0 | | | | 174,757 | | | | 1,980,001 | |
Institutional Class | | | 0 | | | | 0 | | | | 5,261,407 | | | | 59,348,673 | |
| | | | |
| | | | | | | 0 | | | | | | | | 75,192,719 | |
| | | | |
Payment for shares redeemed | | | | | | | | | | | | | | | | |
Class A | | | (5,175,309 | ) | | | (53,579,102 | ) | | | (13,226,374 | ) | | | (140,904,801 | ) |
Class C | | | (7,055,780 | ) | | | (72,115,206 | ) | | | (13,728,996 | ) | | | (145,764,194 | ) |
Class R | | | (78 | ) | | | (811 | ) | | | (22,063 | ) | | | (241,798 | ) |
Class R6 | | | (691,105 | ) | | | (7,027,142 | ) | | | (1,441,527 | ) | | | (15,854,425 | ) |
Administrator Class | | | (1,793,081 | ) | | | (18,563,599 | ) | | | (5,579,018 | ) | | | (60,101,012 | ) |
Institutional Class | | | (48,517,377 | ) | | | (502,691,557 | ) | | | (125,711,938 | ) | | | (1,345,767,943 | ) |
| | | | |
| | | | | | | (653,977,417 | ) | | | | | | | (1,708,634,173 | ) |
| | | | |
Net decrease in net assets resulting from capital share transactions | | | | | | | (503,046,498 | ) | | | | | | | (1,273,060,544 | ) |
| | | | |
Total decrease in net assets | | | | | | | (437,775,431 | ) | | | | | | | (1,571,413,026 | ) |
| | | | |
| | | | |
Net assets | | | | | | | | | | | | | | | | |
Beginning of period | | | | | | | 2,302,331,105 | | | | | | | | 3,873,744,131 | |
| | | | |
End of period | | | | | | $ | 1,864,555,674 | | | | | | | $ | 2,302,331,105 | |
| | | | |
The accompanying notes are an integral part of these financial statements.
Wells Fargo Absolute Return Fund | 13
Financial highlights
(For a share outstanding throughout each period)
| | | | | | | | | | | | | | | | | | | | | | | | |
| | | Six months ended
October 31, 2020
(unaudited) | | | Year ended April 30 | |
| CLASS A | | 2020 | | | 2019 | | | 2018 | | | 2017 | | | 2016 | |
Net asset value, beginning of period | | | $10.11 | | | | $11.15 | | | | $11.40 | | | | $10.90 | | | | $10.25 | | | | $11.15 | |
Net investment income (loss) | | | (0.03 | )1 | | | 0.29 | 1 | | | 0.27 | 1 | | | 0.19 | 1 | | | 0.08 | 1 | | | 0.11 | |
Net realized and unrealized gains (losses) on investments | | | 0.31 | | | | (1.04 | ) | | | (0.24 | ) | | | 0.51 | | | | 0.65 | | | | (0.88 | ) |
| | | | | | | | | | | | | | | | | | | | | | | | |
Total from investment operations | | | 0.28 | | | | (0.75 | ) | | | 0.03 | | | | 0.70 | | | | 0.73 | | | | (0.77 | ) |
Distributions to shareholders from | | | | | | | | | | | | | | | | | | | | | | | | |
Net investment income | | | 0.00 | | | | (0.29 | ) | | | (0.28 | ) | | | (0.20 | ) | | | (0.08 | ) | | | (0.01 | ) |
Net realized gains | | | 0.00 | | | | 0.00 | | | | 0.00 | | | | 0.00 | | | | 0.00 | | | | (0.12 | ) |
| | | | | | | | | | | | | | | | | | | | | | | | |
Total distributions to shareholders | | | 0.00 | | | | (0.29 | ) | | | (0.28 | ) | | | (0.20 | ) | | | (0.08 | ) | | | (0.13 | ) |
Net asset value, end of period | | | $10.39 | | | | $10.11 | | | | $11.15 | | | | $11.40 | | | | $10.90 | | | | $10.25 | |
Total return2 | | | 2.77 | % | | | (6.99 | )% | | | 0.42 | % | | | 6.45 | % | | | 7.15 | % | | | (6.82 | )% |
Ratios to average net assets (annualized) | | | | | | | | | | | | | | | | | | | | | | | | |
Gross expenses3 | | | 0.69 | % | | | 0.69 | % | | | 0.69 | % | | | 0.68 | % | | | 0.67 | % | | | 0.68 | % |
Net expenses3 | | | 0.69 | % | | | 0.69 | % | | | 0.69 | % | | | 0.68 | % | | | 0.67 | % | | | 0.68 | % |
Net investment income (loss) | | | (0.55 | )% | | | 2.68 | % | | | 2.43 | % | | | 1.67 | % | | | 0.78 | % | | | 0.87 | % |
Supplemental data | | | | | | | | | | | | | | | | | | | | | | | | |
Portfolio turnover rate | | | 1 | % | | | 4 | % | | | 5 | % | | | 5 | % | | | 2 | % | | | 8 | % |
Net assets, end of period (000s omitted) | | | $295,773 | | | | $297,590 | | | | $415,011 | | | | $516,085 | | | | $586,785 | | | | $1,185,631 | |
| 1 | Calculated based upon average shares outstanding |
| 2 | Total return calculations do not include any sales charges. Returns for periods of less than one year are not annualized. |
| 3 | Ratios do not reflect net expenses of GMO Benchmark-Free Allocation Fund, Class MF. Including net expenses allocated from GMO Benchmark-Free Allocation Fund, Class MF, the ratios would be increased by the following amounts: |
| | | | |
Six months ended October 31, 2020 (unaudited) | | | 0.66 | % |
Year ended April 30, 2020 | | | 0.61 | % |
Year ended April 30, 2019 | | | 0.60 | % |
Year ended April 30, 2018 | | | 0.60 | % |
Year ended April 30, 2017 | | | 0.59 | % |
Year ended April 30, 2016 | | | 0.59 | % |
The accompanying notes are an integral part of these financial statements.
14 | Wells Fargo Absolute Return Fund
Financial highlights
(For a share outstanding throughout each period)
| | | | | | | | | | | | | | | | | | | | | | | | |
| | | Six months ended
October 31, 2020
(unaudited) | | | Year ended April 30 | |
| CLASS C | | 2020 | | | 2019 | | | 2018 | | | 2017 | | | 2016 | |
Net asset value, beginning of period | | | $9.95 | | | | $10.96 | | | | $11.19 | | | | $10.70 | | | | $10.05 | | | | $11.01 | |
Net investment income (loss) | | | (0.07 | )1 | | | 0.12 | | | | 0.19 | 1 | | | 0.10 | 1 | | | 0.00 | 1 | | | 0.01 | 1 |
Payment from affiliate | | | 0.03 | | | | 0.00 | | | | 0.00 | | | | 0.00 | | | | 0.00 | | | | 0.00 | |
Net realized and unrealized gains (losses) on investments | | | 0.31 | | | | (0.95 | ) | | | (0.24 | ) | | | 0.50 | | | | 0.65 | | | | (0.85 | ) |
| | | | | | | | | | | | | | | | | | | | | | | | |
Total from investment operations | | | 0.27 | | | | (0.83 | ) | | | (0.05 | ) | | | 0.60 | | | | 0.65 | | | | (0.84 | ) |
Distributions to shareholders from | | | | | | | | | | | | | | | | | | | | | | | | |
Net investment income | | | 0.00 | | | | (0.18 | ) | | | (0.18 | ) | | | (0.11 | ) | | | 0.00 | | | | 0.00 | |
Net realized gains | | | 0.00 | | | | 0.00 | | | | 0.00 | | | | 0.00 | | | | 0.00 | | | | (0.12 | ) |
| | | | | | | | | | | | | | | | | | | | | | | | |
Total distributions to shareholders | | | 0.00 | | | | (0.18 | ) | | | (0.18 | ) | | | (0.11 | ) | | | 0.00 | | | | (0.12 | ) |
Net asset value, end of period | | | $10.22 | | | | $9.95 | | | | $10.96 | | | | $11.19 | | | | $10.70 | | | | $10.05 | |
Total return2 | | | 2.71 | %3 | | | (7.73 | )% | | | (0.31 | )% | | | 5.60 | % | | | 6.47 | % | | | (7.59 | )% |
Ratios to average net assets (annualized) | | | | | | | | | | | | | | | | | | | | | | | | |
Gross expenses4 | | | 1.43 | % | | | 1.44 | % | | | 1.44 | % | | | 1.43 | % | | | 1.42 | % | | | 1.43 | % |
Net expenses4 | | | 1.43 | % | | | 1.44 | % | | | 1.44 | % | | | 1.43 | % | | | 1.42 | % | | | 1.43 | % |
Net investment income (loss) | | | (1.28 | )% | | | 1.71 | % | | | 1.78 | % | | | 0.88 | % | | | 0.04 | % | | | 0.08 | % |
Supplemental data | | | | | | | | | | | | | | | | | | | | | | | | |
Portfolio turnover rate | | | 1 | % | | | 4 | % | | | 5 | % | | | 5 | % | | | 2 | % | | | 8 | % |
Net assets, end of period (000s omitted) | | | $190,523 | | | | $254,485 | | | | $419,656 | | | | $629,813 | | | | $765,561 | | | | $1,207,967 | |
| 1 | Calculated based upon average shares outstanding |
| 2 | Total return calculations do not include any sales charges. Returns for periods of less than one year are not annualized. |
| 3 | During the six months ended October 31, 2020, the Fund received a payment from an affiliate which had a 0.33% impact on the total return. See Note 4 in the Notes to Financial Statements for additional information. |
| 4 | Ratios do not reflect net expenses of GMO Benchmark-Free Allocation Fund, Class MF. Including net expenses allocated from GMO Benchmark-Free Allocation Fund, Class MF, the ratios would be increased by the following amounts: |
| | | | |
Six months ended October 31, 2020 (unaudited) | | | 0.66 | % |
Year ended April 30, 2020 | | | 0.61 | % |
Year ended April 30, 2019 | | | 0.60 | % |
Year ended April 30, 2018 | | | 0.60 | % |
Year ended April 30, 2017 | | | 0.59 | % |
Year ended April 30, 2016 | | | 0.59 | % |
The accompanying notes are an integral part of these financial statements.
Wells Fargo Absolute Return Fund | 15
Financial highlights
(For a share outstanding throughout each period)
| | | | | | | | | | | | | | | | | | | | | | | | |
| | | Six months ended
October 31, 2020
(unaudited) | | | Year ended April 30 | |
| CLASS R | | 2020 | | | 2019 | | | 2018 | | | 2017 | | | 20161 | |
Net asset value, beginning of period | | | $10.33 | | | | $11.12 | | | | $11.37 | | | | $10.82 | | | | $10.22 | | | | $10.19 | |
Net investment income (loss) | | | (0.03 | ) | | | 0.12 | | | | 0.27 | | | | 0.12 | | | | 0.13 | | | | (0.05 | )2 |
Payment from affiliate | | | 0.11 | | | | 0.00 | | | | 0.00 | | | | 0.00 | | | | 0.00 | | | | 0.00 | |
Net realized and unrealized gains (losses) on investments | | | 0.32 | | | | (0.91 | ) | | | (0.26 | ) | | | 0.55 | | | | 0.57 | | | | 0.26 | |
| | | | | | | | | | | | | | | | | | | | | | | | |
Total from investment operations | | | 0.40 | | | | (0.79 | ) | | | 0.01 | | | | 0.67 | | | | 0.70 | | | | 0.21 | |
Distributions to shareholders from | | | | | | | | | | | | | | | | | | | | | | | | |
Net investment income | | | 0.00 | | | | 0.00 | | | | (0.26 | ) | | | (0.12 | ) | | | (0.10 | ) | | | (0.06 | ) |
Net realized gains | | | 0.00 | | | | 0.00 | | | | 0.00 | | | | 0.00 | | | | 0.00 | | | | (0.12 | ) |
| | | | | | | | | | | | | | | | | | | | | | | | |
Total distributions to shareholders | | | 0.00 | | | | 0.00 | | | | (0.26 | ) | | | (0.12 | ) | | | (0.10 | ) | | | (0.18 | ) |
Net asset value, end of period | | | $10.73 | | | | $10.33 | | | | $11.12 | | | | $11.37 | | | | $10.82 | | | | $10.22 | |
Total return3 | | | 3.87 | %4 | | | (7.10 | )% | | | 0.21 | % | | | 6.21 | % | | | 6.91 | % | | | 2.10 | % |
Ratios to average net assets (annualized) | | | | | | | | | | | | | | | | | | | | | | | | |
Gross expenses5 | | | 0.68 | % | | | 0.91 | % | | | 0.85 | % | | | 0.93 | % | | | 0.93 | % | | | 0.93 | % |
Net expenses5 | | | 0.68 | % | | | 0.91 | % | | | 0.85 | % | | | 0.93 | % | | | 0.93 | % | | | 0.93 | % |
Net investment income (loss) | | | (0.54 | )% | | | 0.21 | % | | | 2.42 | % | | | 0.85 | % | | | 1.40 | % | | | (0.92 | )% |
Supplemental data | | | | | | | | | | | | | | | | | | | | | | | | |
Portfolio turnover rate | | | 1 | % | | | 4 | % | | | 5 | % | | | 5 | % | | | 2 | % | | | 8 | % |
Net assets, end of period (000s omitted) | | | $27 | | | | $27 | | | | $262 | | | | $368 | | | | $756 | | | | $56 | |
| 1 | For the period from September 30, 2015 (commencement of class operations) to April 30, 2016 |
| 2 | Calculated based upon average shares outstanding |
| 3 | Returns for periods of less than one year are not annualized. |
| 4 | During the six months ended October 31, 2020, the Fund received a payment from an affiliate which had a 1.10% impact on the total return. See Note 4 in the Notes to Financial Statements for additional information. |
| 5 | Ratios do not reflect net expenses of GMO Benchmark-Free Allocation Fund, Class MF. Including net expenses allocated from GMO Benchmark-Free Allocation Fund, Class MF, the ratios would be increased by the following amounts: |
| | | | |
Six months ended October 31, 2020 (unaudited) | | | 0.66 | % |
Year ended April 30, 2020 | | | 0.61 | % |
Year ended April 30, 2019 | | | 0.60 | % |
Year ended April 30, 2018 | | | 0.60 | % |
Year ended April 30, 2017 | | | 0.59 | % |
Year ended April 30, 20161 | | | 0.59 | % |
The accompanying notes are an integral part of these financial statements.
16 | Wells Fargo Absolute Return Fund
Financial highlights
(For a share outstanding throughout each period)
| | | | | | | | | | | | | | | | | | | | | | | | |
| | | Six months ended
October 31, 2020
(unaudited) | | | Year ended April 30 | |
| CLASS R6 | | 2020 | | | 2019 | | | 2018 | | | 2017 | | | 2016 | |
Net asset value, beginning of period | | | $10.11 | | | | $11.15 | | | | $11.41 | | | | $10.91 | | | | $10.26 | | | | $11.18 | |
Net investment income (loss) | | | (0.01 | ) | | | 0.35 | | | | 0.34 | | | | 0.31 | 1 | | | 0.14 | 1 | | | 0.10 | 1 |
Net realized and unrealized gains (losses) on investments | | | 0.32 | | | | (1.05 | ) | | | (0.27 | ) | | | 0.45 | | | | 0.64 | | | | (0.82 | ) |
| | | | | | | | | | | | | | | | | | | | | | | | |
Total from investment operations | | | 0.31 | | | | (0.70 | ) | | | 0.07 | | | | 0.76 | | | | 0.78 | | | | (0.72 | ) |
Distributions to shareholders from | | | | | | | | | | | | | | | | | | | | | | | | |
Net investment income | | | 0.00 | | | | (0.34 | ) | | | (0.33 | ) | | | (0.26 | ) | | | (0.13 | ) | | | (0.08 | ) |
Net realized gains | | | 0.00 | | | | 0.00 | | | | 0.00 | | | | 0.00 | | | | 0.00 | | | | (0.12 | ) |
| | | | | | | | | | | | | | | | | | | | | | | | |
Total distributions to shareholders | | | 0.00 | | | | (0.34 | ) | | | (0.33 | ) | | | (0.26 | ) | | | (0.13 | ) | | | (0.20 | ) |
Net asset value, end of period | | | $10.42 | | | | $10.11 | | | | $11.15 | | | | $11.41 | | | | $10.91 | | | | $10.26 | |
Total return2 | | | 3.07 | % | | | (6.57 | )% | | | 0.86 | % | | | 6.97 | % | | | 7.67 | % | | | (6.42 | )% |
Ratios to average net assets (annualized) | | | | | | | | | | | | | | | | | | | | | | | | |
Gross expenses3 | | | 0.26 | % | | | 0.26 | % | | | 0.26 | % | | | 0.25 | % | | | 0.25 | % | | | 0.24 | % |
Net expenses3 | | | 0.26 | % | | | 0.26 | % | | | 0.26 | % | | | 0.25 | % | | | 0.25 | % | | | 0.24 | % |
Net investment income (loss) | | | (0.12 | )% | | | 3.05 | %�� | | | 2.64 | % | | | 2.69 | % | | | 1.37 | % | | | 0.99 | % |
Supplemental data | | | | | | | | | | | | | | | | | | | | | | | | |
Portfolio turnover rate | | | 1 | % | | | 4 | % | | | 5 | % | | | 5 | % | | | 2 | % | | | 8 | % |
Net assets, end of period (000s omitted) | | | $19,550 | | | | $25,363 | | | | $31,838 | | | | $46,753 | | | | $14,636 | | | | $8,274 | |
| 1 | Calculated based upon average shares outstanding |
| 2 | Returns for periods of less than one year are not annualized. |
| 3 | Ratios do not reflect net expenses of GMO Benchmark-Free Allocation Fund, Class MF. Including net expenses allocated from GMO Benchmark-Free Allocation Fund, Class MF, the ratios would be increased by the following amounts: |
| | | | |
Six months ended October 31, 2020 (unaudited) | | | 0.66 | % |
Year ended April 30, 2020 | | | 0.61 | % |
Year ended April 30, 2019 | | | 0.60 | % |
Year ended April 30, 2018 | | | 0.60 | % |
Year ended April 30, 2017 | | | 0.59 | % |
Year ended April 30, 2016 | | | 0.59 | % |
The accompanying notes are an integral part of these financial statements.
Wells Fargo Absolute Return Fund | 17
Financial highlights
(For a share outstanding throughout each period)
| | | | | | | | | | | | | | | | | | | | | | | | |
| | | Six months ended
October 31, 2020
(unaudited) | | | Year ended April 30 | |
| ADMINISTRATOR CLASS | | 2020 | | | 2019 | | | 2018 | | | 2017 | | | 2016 | |
Net asset value, beginning of period | | | $10.15 | | | | $11.18 | | | | $11.43 | | | | $10.92 | | | | $10.27 | | | | $11.18 | |
Net investment income (loss) | | | (0.02 | )1 | | | 0.27 | 1 | | | 0.27 | 1 | | | 0.19 | 1 | | | 0.07 | 1 | | | 0.14 | 1 |
Payment from affiliate | | | 0.05 | | | | 0.00 | | | | 0.00 | | | | 0.00 | | | | 0.00 | | | | 0.00 | |
Net realized and unrealized gains (losses) on investments | | | 0.31 | | | | (1.01 | ) | | | (0.24 | ) | | | 0.53 | | | | 0.68 | | | | (0.91 | ) |
| | | | | | | | | | | | | | | | | | | | | | | | |
Total from investment operations | | | 0.34 | | | | (0.74 | ) | | | 0.03 | | | | 0.72 | | | | 0.75 | | | | (0.77 | ) |
Distributions to shareholders from | | | | | | | | | | | | | | | | | | | | | | | | |
Net investment income | | | 0.00 | | | | (0.29 | ) | | | (0.28 | ) | | | (0.21 | ) | | | (0.10 | ) | | | (0.02 | ) |
Net realized gains | | | 0.00 | | | | 0.00 | | | | 0.00 | | | | 0.00 | | | | 0.00 | | | | (0.12 | ) |
| | | | | | | | | | | | | | | | | | | | | | | | |
Total distributions to shareholders | | | 0.00 | | | | (0.29 | ) | | | (0.28 | ) | | | (0.21 | ) | | | (0.10 | ) | | | (0.14 | ) |
Net asset value, end of period | | | $10.49 | | | | $10.15 | | | | $11.18 | | | | $11.43 | | | | $10.92 | | | | $10.27 | |
Total return2 | | | 3.35 | %3 | | | (6.85 | )% | | | 0.48 | % | | | 6.62 | % | | | 7.31 | % | | | (6.85 | )% |
Ratios to average net assets (annualized) | | | | | | | | | | | | | | | | | | | | | | | | |
Gross expenses4 | | | 0.60 | % | | | 0.61 | % | | | 0.60 | % | | | 0.60 | % | | | 0.59 | % | | | 0.58 | % |
Net expenses4 | | | 0.57 | % | | | 0.57 | % | | | 0.57 | % | | | 0.57 | % | | | 0.57 | % | | | 0.57 | % |
Net investment income (loss) | | | (0.43 | )% | | | 2.42 | % | | | 2.44 | % | | | 1.70 | % | | | 0.72 | % | | | 1.31 | % |
Supplemental data | | | | | | | | | | | | | | | | | | | | | | | | |
Portfolio turnover rate | | | 1 | % | | | 4 | % | | | 5 | % | | | 5 | % | | | 2 | % | | | 8 | % |
Net assets, end of period (000s omitted) | | | $45,016 | | | | $60,846 | | | | $116,871 | | | | $212,965 | | | | $287,532 | | | | $1,409,516 | |
| 1 | Calculated based upon average shares outstanding |
| 2 | Returns for periods of less than one year are not annualized. |
| 3 | During the six months ended October 31, 2020, the Fund received a payment from an affiliate which had a 0.51% impact on the total return. See Note 4 in the Notes to Financial Statements for additional information. |
| 4 | Ratios do not reflect net expenses of GMO Benchmark-Free Allocation Fund, Class MF. Including net expenses allocated from GMO Benchmark-Free Allocation Fund, Class MF, the ratios would be increased by the following amounts: |
| | | | |
Six months ended October 31, 2020 (unaudited) | | | 0.66 | % |
Year ended April 30, 2020 | | | 0.61 | % |
Year ended April 30, 2019 | | | 0.60 | % |
Year ended April 30, 2018 | | | 0.60 | % |
Year ended April 30, 2017 | | | 0.59 | % |
Year ended April 30, 2016 | | | 0.59 | % |
The accompanying notes are an integral part of these financial statements.
18 | Wells Fargo Absolute Return Fund
Financial highlights
(For a share outstanding throughout each period)
| | | | | | | | | | | | | | | | | | | | | | | | |
| | | Six months ended
October 31, 2020
(unaudited) | | | Year ended April 30 | |
| INSTITUTIONAL CLASS | | 2020 | | | 2019 | | | 2018 | | | 2017 | | | 2016 | |
Net asset value, beginning of period | | | $10.11 | | | | $11.15 | | | | $11.41 | | | | $10.92 | | | | $10.27 | | | | $11.19 | |
Net investment income (loss) | | | (0.01 | )1 | | | 0.33 | 1 | | | 0.31 | 1 | | | 0.24 | | | | 0.14 | | | | 0.11 | 1 |
Net realized and unrealized gains (losses) on investments | | | 0.31 | | | | (1.04 | ) | | | (0.25 | ) | | | 0.50 | | | | 0.63 | | | | (0.84 | ) |
| | | | | | | | | | | | | | | | | | | | | | | | |
Total from investment operations | | | 0.30 | | | | (0.71 | ) | | | 0.06 | | | | 0.74 | | | | 0.77 | | | | (0.73 | ) |
Distributions to shareholders from | | | | | | | | | | | | | | | | | | | | | | | | |
Net investment income | | | 0.00 | | | | (0.33 | ) | | | (0.32 | ) | | | (0.25 | ) | | | (0.12 | ) | | | (0.07 | ) |
Net realized gains | | | 0.00 | | | | 0.00 | | | | 0.00 | | | | 0.00 | | | | 0.00 | | | | (0.12 | ) |
| | | | | | | | | | | | | | | | | | | | | | | | |
Total distributions to shareholders | | | 0.00 | | | | (0.33 | ) | | | (0.32 | ) | | | (0.25 | ) | | | (0.12 | ) | | | (0.19 | ) |
Net asset value, end of period | | | $10.41 | | | | $10.11 | | | | $11.15 | | | | $11.41 | | | | $10.92 | | | | $10.27 | |
Total return2 | | | 2.97 | % | | | (6.65 | )% | | | 0.76 | % | | | 6.78 | % | | | 7.58 | % | | | (6.51 | )% |
Ratios to average net assets (annualized) | | | | | | | | | | | | | | | | | | | | | | | | |
Gross expenses3 | | | 0.36 | % | | | 0.36 | % | | | 0.36 | % | | | 0.35 | % | | | 0.35 | % | | | 0.33 | % |
Net expenses3 | | | 0.33 | % | | | 0.33 | % | | | 0.33 | % | | | 0.33 | % | | | 0.33 | % | | | 0.32 | % |
Net investment income (loss) | | | (0.18 | )% | | | 3.00 | % | | | 2.82 | % | | | 2.07 | % | | | 1.19 | % | | | 1.05 | % |
Supplemental data | | | | | | | | | | | | | | | | | | | | | | | | |
Portfolio turnover rate | | | 1 | % | | | 4 | % | | | 5 | % | | | 5 | % | | | 2 | % | | | 8 | % |
Net assets, end of period (000s omitted) | | | $1,313,668 | | | | $1,664,020 | | | | $2,890,106 | | | | $4,189,647 | | | | $4,091,536 | | | | $4,346,360 | |
| 1 | Calculated based upon average shares outstanding |
| 2 | Returns for periods of less than one year are not annualized. |
| 3 | Ratios do not reflect net expenses of GMO Benchmark-Free Allocation Fund, Class MF. Including net expenses allocated from GMO Benchmark-Free Allocation Fund, Class MF, the ratios would be increased by the following amounts: |
| | | | |
Six months ended October 31, 2020 (unaudited) | | | 0.66 | % |
Year ended April 30, 2020 | | | 0.61 | % |
Year ended April 30, 2019 | | | 0.60 | % |
Year ended April 30, 2018 | | | 0.60 | % |
Year ended April 30, 2017 | | | 0.59 | % |
Year ended April 30, 2016 | | | 0.59 | % |
The accompanying notes are an integral part of these financial statements.
Wells Fargo Absolute Return Fund | 19
Notes to financial statements (unaudited)
1. ORGANIZATION
Wells Fargo Funds Trust (the “Trust”), a Delaware statutory trust organized on March 10, 1999, is an open-end management investment company registered under the Investment Company Act of 1940, as amended (the “1940 Act”). As an investment company, the Trust follows the accounting and reporting guidance in Financial Accounting Standards Board (“FASB”) Accounting Standards Codification Topic 946, Financial Services – Investment Companies. These financial statements report on the Wells Fargo Absolute Return Fund (the “Fund”) which is a diversified series of the Trust.
The Fund invests all of its investable assets in the GMO Benchmark-Free Allocation Fund (the “Benchmark-Free Allocation Fund”), an investment company managed by Grantham, Mayo, Van Otterloo & Co. LLC (“GMO”). Benchmark-Free Allocation Fund is a fund-of-funds and gains its investment exposures primarily by investing in GMO Implementation Fund. In addition, Benchmark-Free Allocation Fund may invest in other GMO Funds (together with GMO Implementation Fund, the “underlying GMO funds”), whether currently existing or created in the future. These underlying GMO funds may include, among others, GMO High Yield Fund, GMO Emerging Country Debt Fund, GMO Opportunistic Income Fund, GMO Special Opportunities Fund, and GMO SGM Major Markets Fund. GMO Implementation Fund is permitted to invest in any asset class and may engage in merger arbitrage. Benchmark-Free Allocation Fund also may invest directly in securities (including other underlying funds) and derivatives. As of October 31, 2020, the Fund owned 27% of Benchmark-Free Allocation Fund. Because the Fund invests all of its assets in Benchmark-Free Allocation Fund, the shareholders of the Fund bear the fees and expense of Benchmark-Free Allocation Fund, which are not included in the Statement of Operations, but are incurred indirectly because they are considered in the calculation of the net asset value of Benchmark-Free Allocation Fund. As a result, the Fund’s actual expenses may be higher than those of other mutual funds that invest directly in securities.
2. SIGNIFICANT ACCOUNTING POLICIES
The following significant accounting policies, which are consistently followed in the preparation of the financial statements of the Fund, are in conformity with U.S. generally accepted accounting principles which require management to make estimates and assumptions that affect the reported amounts of assets and liabilities, disclosure of contingent assets and liabilities at the date of the financial statements, and the reported amounts of revenues and expenses during the reporting period. Actual results could differ from those estimates.
Securities valuation
All investments are valued each business day as of the close of regular trading on the New York Stock Exchange (generally 4 p.m. Eastern Time), although the Fund may deviate from this calculation time under unusual or unexpected circumstances.
The Fund values its investment in Benchmark-Free Allocation Fund at net asset value. The valuation of investments in securities and the underlying funds held by Benchmark-Free Allocation Fund is discussed in the annual report of Benchmark-Free Allocation Fund, which is included in the mailing of this shareholder report. An unaudited Statement of Assets and Liabilities and an unaudited Schedule of Investments for Benchmark-Free Allocation Fund as of October 31, 2020 have also been included as Appendix I in this report for your reference.
Investment transactions and income recognition
Investment transactions in Benchmark-Free Allocation Fund are recorded on a trade date basis. Realized gains and losses resulting from investment transactions in Benchmark-Free Allocation Fund are determined on the identified cost basis.
Income dividends and capital gain distributions from Benchmark-Free Allocation Fund are recorded on the ex-dividend date. Capital gain distributions from Benchmark-Free Allocation Fund are treated as realized gains.
Distributions to shareholders
Distributions to shareholders from net investment income and any net realized gains are recorded on the ex-dividend date and paid at least annually. Such distributions are determined in accordance with income tax regulations and may differ from U.S. generally accepted accounting principles. Dividend sources are estimated at the time of declaration. The tax character of distributions is determined as of the Fund’s fiscal year end. Therefore, a portion of the Fund’s distributions made prior to the Fund’s fiscal year end may be categorized as a tax return of capital at year end.
Federal and other taxes
The Fund intends to continue to qualify as a regulated investment company by distributing substantially all of its investment company taxable income and any net realized capital gains (after reduction for capital loss carryforwards) sufficient to relieve it from all, or substantially all, federal income taxes. Accordingly, no provision for federal income taxes was required.
20 | Wells Fargo Absolute Return Fund
Notes to financial statements (unaudited)
The Fund’s income and federal excise tax returns and all financial records supporting those returns for the prior three fiscal years are subject to examination by the federal and Delaware revenue authorities. Management has analyzed the Fund’s tax positions taken on federal, state, and foreign tax returns for all open tax years and does not believe that there are any uncertain tax positions that require recognition of a tax liability.
As of October 31, 2020, the aggregate cost of all investments for federal income tax purposes was $1,751,787,573 and the unrealized gains (losses) consisted of:
| | | | |
| |
Gross unrealized gains | | $ | 70,457,585 | |
| |
Gross unrealized losses | | | 0 | |
| |
Net unrealized gains | | $ | 70,457,585 | |
As of April 30, 2020, the Fund had capital loss carryforwards which consisted of $3,231,220 in short-term capital losses and $483,523,717 in the long-term capital losses.
Class allocations
The separate classes of shares offered by the Fund differ principally in applicable sales charges, distribution, shareholder servicing, and administration fees. Class specific expenses are charged directly to that share class. Investment income, common fund-level expenses, and realized and unrealized gains (losses) on investments are allocated daily to each class of shares based on the relative proportion of net assets of each class.
3. FAIR VALUATION MEASUREMENTS
Fair value measurements of investments are determined within a framework that has established a fair value hierarchy based upon the various data inputs utilized in determining the value of the Fund’s investments. The three-level hierarchy gives the highest priority to unadjusted quoted prices in active markets for identical assets or liabilities (Level 1) and the lowest priority to unobservable inputs (Level 3). The Fund’s investments are classified within the fair value hierarchy based on the lowest level of input that is significant to the fair value measurement. The inputs are summarized into three broad levels as follows:
| ∎ | | Level 1 – quoted prices in active markets for identical securities |
| ∎ | | Level 2 – other significant observable inputs (including quoted prices for similar securities, interest rates, prepayment speeds, credit risk, etc.) |
| ∎ | | Level 3 – significant unobservable inputs (including the Fund’s own assumptions in determining the fair value of investments) |
The inputs or methodologies used for valuing investments in securities are not necessarily an indication of the risk associated with investing in those securities.
At October 31, 2020, the Fund’s investment in Benchmark-Free Allocation Fund was measured at fair value using Level 1 inputs. For the six months ended October 31, 2020, the Fund did not have any transfers into/out of Level 3.
4. TRANSACTIONS WITH AFFILIATES
Management fee
Wells Fargo Funds Management, LLC (“Funds Management”), an indirect wholly owned subsidiary of Wells Fargo & Company (“Wells Fargo”), is the manager of the Fund and provides advisory and fund-level administrative services under an investment management agreement. Under the investment management agreement, Funds Management is responsible for, among other services, implementing the investment objectives and strategies of the Fund, and providing fund-level administrative services in connection with the Fund’s operations. As compensation for its services under the investment management agreement, Funds Management is entitled to receive a management fee at the following annual rate based on the Fund’s average daily net assets:
| | | | |
| |
| Average daily net assets | | Management fee | |
| |
First $1 billion | | | 0.225 | % |
| |
Next $4 billion | | | 0.200 | |
| |
Next $5 billion | | | 0.175 | |
| |
Next $10 billion | | | 0.165 | |
| |
Over $20 billion | | | 0.160 | |
Wells Fargo Absolute Return Fund | 21
Notes to financial statements (unaudited)
For the six months ended October 31, 2020, the management fee was equivalent to an annual rate of 0.21% of the Fund’s average daily net assets.
Administration fees
Under a class-level administration agreement, Funds Management provides class-level administrative services to the Fund, which includes paying fees and expenses for services provided by the transfer agent, sub-transfer agents, omnibus account servicers and record-keepers. As compensation for its services under the class-level administration agreement, Funds Management receives an annual fee which is calculated based on the average daily net assets of each class as follows:
| | | | |
| |
| | | Class-level administration fee | |
| |
Class A, Class C, Class R | | | 0.21 | % |
| |
Class R6 | | | 0.03 | |
| |
Administrator Class, Institutional Class | | | 0.13 | |
Waivers and/or expense reimbursements
Funds Management has contractually waived and/or reimbursed management and administration fees to the extent necessary to maintain certain net operating expense ratios for the Fund. When each class of the Fund has exceeded its expense cap, Funds Management has waived fees and/or reimbursed expenses from fund-level expenses on a proportionate basis and then from class specific expenses. When only certain classes exceed their expense caps, waivers and/or reimbursements are applied against class specific expenses before fund-level expenses. Funds Management has committed through August 31, 2021 to waive fees and/or reimburse expenses to the extent necessary to cap the Fund’s expenses (excluding expenses of Benchmark-Free Allocation Fund and acquired fund fees and expenses) at 0.71% for Class A shares, 1.46% for Class C shares, 0.96% for Class R shares, 0.28% for Class R6 shares, 0.57% for Administrator Class shares, and 0.33% for Institutional Class shares. Prior to or after the commitment expiration date, the cap may be increased or the commitment to maintain the cap may be terminated only with the approval of the Board of Trustees.
Distribution fees
The Trust has adopted a distribution plan for Class C and Class R shares of the Fund pursuant to Rule 12b-1 under the 1940 Act. Distribution fees are charged to Class C and Class R shares and paid to Wells Fargo Funds Distributor, LLC (“Funds Distributor”), the principal underwriter, at an annual rate of 0.75% of the average daily net assets of Class C shares and 0.25% of the average daily net assets of Class R shares.
In addition, Funds Distributor is entitled to receive the front-end sales charge from the purchase of Class A shares and a contingent deferred sales charge on the redemption of certain Class A shares. Funds Distributor is also entitled to receive the contingent deferred sales charges from redemptions of Class C shares. For the six months ended October 31, 2020, Funds Distributor received $3,871 from the sale of Class A shares and $172 in contingent deferred sales charges from redemptions of Class C shares. No contingent deferred sales charges were incurred by Class A shares for the six months ended October 31, 2020.
Shareholder servicing fees
The Trust has entered into contracts with one or more shareholder servicing agents, whereby Class A, Class C, Class R, and Administrator Class of the Fund are charged a fee at an annual rate of 0.25% of the average daily net assets of each respective class. A portion of these total shareholder servicing fees were paid to affiliates of Wells Fargo.
Other transactions
On August 14, 2020, Class C, Class R, and Administrator Class of the Fund were reimbursed by Funds Management in the amount of $619,025, $288 and $221,626, respectively. The reimbursement was made in connection with resolving certain fee reimbursements.
5. INVESTMENT TRANSACTIONS
For the six months ended October 31, 2020, the Fund made aggregate purchases and sales of $24,820,909 and $516,115,231, respectively, in its investment in Benchmark-Free Allocation Fund.
6. BANK BORROWINGS
The Trust (excluding the money market funds), Wells Fargo Master Trust and Wells Fargo Variable Trust are parties to a $350,000,000 revolving credit agreement whereby the Fund is permitted to use bank borrowings for temporary or emergency
22 | Wells Fargo Absolute Return Fund
Notes to financial statements (unaudited)
purposes, such as to fund shareholder redemption requests. Interest under the credit agreement is charged to the Fund based on a borrowing rate equal to the higher of the Federal Funds rate in effect on that day plus 1.25% or the overnight LIBOR rate in effect on that day plus 1.25%. In addition, an annual commitment fee equal to 0.25% of the unused balance is allocated to each participating fund.
For the six months ended October 31, 2020, there were no borrowings by the Fund under the agreement.
7. INDEMNIFICATION
Under the Fund’s organizational documents, the officers and Trustees have been granted certain indemnification rights against certain liabilities that may arise out of performance of their duties to the Fund. The Fund has entered into a separate agreement with each Trustee that converts indemnification rights currently existing under the Fund’s organizational documents into contractual rights that cannot be changed in the future without the consent of the Trustee. Additionally, in the normal course of business, the Fund may enter into contracts with service providers that contain a variety of indemnification clauses. The Fund’s maximum exposure under these arrangements is dependent on future claims that may be made against the Fund and, therefore, cannot be estimated.
8. NEW ACCOUNTING PRONOUNCEMENT
In August 2018, FASB issued Accounting Standards Update (“ASU”) No. 2018-13, Fair Value Measurement (Topic 820) Disclosure Framework—Changes to the Disclosure Requirements for Fair Value Measurement. ASU 2018-13 updates the disclosure requirements on fair value measurements in Topic 820, Fair Value Measurements. The amendments are effective for fiscal years, and interim periods within those fiscal years, beginning after December 15, 2019. Management has adopted this guidance which did not have a material impact on the financial statements.
9. CORONAVIRUS (COVID-19) PANDEMIC
On March 11, 2020, the World Health Organization announced that it had made the assessment that coronavirus disease 2019 (“COVID-19”) is a pandemic. The impacts of COVID-19 are adversely affecting the entire global economy, individual companies and investment products, and the market in general. There is significant uncertainty around the extent and duration of business disruptions related to COVID-19 and the impacts may be short term or may last for an extended period of time. The risk of further spreading of COVID-19 has led to significant uncertainty and volatility in the financial markets.
Wells Fargo Absolute Return Fund | 23
Other information (unaudited)
PROXY VOTING INFORMATION
A description of the policies and procedures used to determine how to vote proxies relating to portfolio securities is available, upon request, by calling 1-800-222-8222, visiting our website at wfam.com, or visiting the SEC website at sec.gov. Information regarding how the proxies related to portfolio securities were voted during the most recent 12-month period ended June 30 is available on the website at wfam.com or by visiting the SEC website at sec.gov.
QUARTERLY PORTFOLIO HOLDINGS INFORMATION
The Fund files its complete schedule of portfolio holdings with the SEC for the first and third quarters of each fiscal year as an exhibit to its reports on Form N-PORT. Shareholders may view the filed Form N-PORT by visiting the SEC website at sec.gov.
24 | Wells Fargo Absolute Return Fund
Other information (unaudited)
BOARD OF TRUSTEES AND OFFICERS
Each of the Trustees and Officers1 listed in the table below acts in identical capacities for each fund in the Wells Fargo family of funds, which consists of 144 mutual funds comprising the Wells Fargo Funds Trust, Wells Fargo Variable Trust, Wells Fargo Master Trust and four closed-end funds (collectively the “Fund Complex”). This table should be read in conjunction with the Prospectus and the Statement of Additional Information2. The mailing address of each Trustee and Officer is 525 Market Street, 12th Floor, San Francisco, CA 94105. Each Trustee and Officer serves an indefinite term, however, each Trustee serves such term until reaching the mandatory retirement age established by the Trustees.
Independent Trustees
| | | | | | |
Name and year of birth | | Position held and length of service* | | Principal occupations during past five years or longer | | Current other public company or investment company directorships |
| | | |
William R. Ebsworth (Born 1957) | | Trustee, since 2015 | | Retired. From 1984 to 2013, equities analyst, portfolio manager, research director and chief investment officer at Fidelity Management and Research Company in Boston, Tokyo, and Hong Kong, and retired in 2013 as Chief Investment Officer of Fidelity Strategic Advisers, Inc. where he led a team of investment professionals managing client assets. Prior thereto, Board member of Hong Kong Securities Clearing Co., Hong Kong Options Clearing Corp., the Thailand International Fund, Ltd., Fidelity Investments Life Insurance Company, and Empire Fidelity Investments Life Insurance Company. Audit Committee Chair and Investment Committee Chair of the Vincent Memorial Hospital Endowment (non-profit organization). Mr. Ebsworth is a CFA® charterholder. | | N/A |
| | | |
Jane A. Freeman (Born 1953) | | Trustee, since 2015; Chair Liaison, since 2018 | | Retired. From 2012 to 2014 and 1999 to 2008, Chief Financial Officer of Scientific Learning Corporation. From 2008 to 2012, Ms. Freeman provided consulting services related to strategic business projects. Prior to 1999, Portfolio Manager at Rockefeller & Co. and Scudder, Stevens & Clark. Board member of the Harding Loevner Funds from 1996 to 2014, serving as both Lead Independent Director and chair of the Audit Committee. Board member of the Russell Exchange Traded Funds Trust from 2011 to 2012 and the chair of the Audit Committee. Ms. Freeman is also an inactive Chartered Financial Analyst. | | N/A |
| | | |
Isaiah Harris, Jr. (Born 1952) | | Trustee, since 2009; Audit Committee Chair,
since 2019 | | Retired. Chairman of the Board of CIGNA Corporation since 2009, and Director since 2005. From 2003 to 2011, Director of Deluxe Corporation. Prior thereto, President and CEO of BellSouth Advertising and Publishing Corp. from 2005 to 2007, President and CEO of BellSouth Enterprises from 2004 to 2005 and President of BellSouth Consumer Services from 2000 to 2003. Emeritus member of the Iowa State University Foundation Board of Governors. Emeritus Member of the Advisory Board of Iowa State University School of Business. Advisory Board Member, Palm Harbor Academy (private school). Mr. Harris is a certified public accountant (inactive status). | | CIGNA Corporation |
| | | |
Judith M. Johnson (Born 1949) | | Trustee, since 2008 | | Retired. Prior thereto, Chief Executive Officer and Chief Investment Officer of Minneapolis Employees Retirement Fund from 1996 to 2008. Ms. Johnson is an attorney, certified public accountant and a certified managerial accountant. | | N/A |
| | | |
David F. Larcker (Born 1950) | | Trustee, since 2009 | | James Irvin Miller Professor of Accounting at the Graduate School of Business (Emeritus), Stanford University, Director of the Corporate Governance Research Initiative and Senior Faculty of The Rock Center for Corporate Governance since 2006. From 2005 to 2008, Professor of Accounting at the Graduate School of Business, Stanford University. Prior thereto, Ernst & Young Professor of Accounting at The Wharton School, University of Pennsylvania from 1985 to 2005. | | N/A |
Wells Fargo Absolute Return Fund | 25
Other information (unaudited)
| | | | | | |
Name and year of birth | | Position held and length of service* | | Principal occupations during past five years or longer | | Current other public company or investment company directorships |
| | | |
Olivia S. Mitchell (Born 1953) | | Trustee, since 2006; Nominating and Governance Committee Chair, since 2018 | | International Foundation of Employee Benefit Plans Professor, Wharton School of the University of Pennsylvania since 1993. Director of Wharton’s Pension Research Council and Boettner Center on Pensions & Retirement Research, and Research Associate at the National Bureau of Economic Research. Previously, Cornell University Professor from 1978 to 1993. | | N/A |
| | | |
Timothy J. Penny (Born 1951) | | Trustee, since 1996;
Chair,
since 2018 | | President and Chief Executive Officer of Southern Minnesota Initiative Foundation, a non-profit organization, since 2007. Member of the Board of Trustees of NorthStar Education Finance, Inc., a non-profit organization, since 2007. | | N/A |
| | | |
James G. Polisson (Born 1959) | | Trustee, since 2018 | | Retired. Chief Marketing Officer, Source (ETF) UK Services, Ltd, from 2015 to 2017. From 2012 to 2015, Principal of The Polisson Group, LLC, a management consulting, corporate advisory and principal investing company. Chief Executive Officer and Managing Director at Russell Investments, Global Exchange Traded Funds from 2010 to 2012. Managing Director of Barclays Global Investors from 1998 to 2010 and Global Chief Marketing Officer for iShares and Barclays Global Investors from 2000 to 2010. Trustee of the San Francisco Mechanics’ Institute, a non-profit organization, from 2013 to 2015. Board member of the Russell Exchange Traded Fund Trust from 2011 to 2012. Director of Barclays Global Investors Holdings Deutschland GmbH from 2006 to 2009. Mr. Polisson is an attorney and has a retired status with the Massachusetts and District of Columbia Bar Associations. | | N/A |
| | | |
Pamela Wheelock (Born 1959) | | Trustee, since January 2020; previously Trustee from January 2018 to July 2019 | | Board member of the Destination Medical Center Economic Development Agency, Rochester, Minnesota since 2019. Interim President of the McKnight Foundation from January to September 2020. Acting Commissioner, Minnesota Department of Human Services, July 2019 through September 2019. Human Services Manager (part-time), Minnesota Department of Human Services, October 2019 through December 2019. Chief Operating Officer, Twin Cities Habitat for Humanity from 2017 to 2019. Vice President of University Services, University of Minnesota from 2012 to 2016. Prior thereto, on the Board of Directors, Governance Committee and Finance Committee for the Minnesota Philanthropy Partners (Saint Paul Foundation) from 2012 to 2018, Interim Chief Executive Officer of Blue Cross Blue Shield of Minnesota from 2011 to 2012, Chairman of the Board from 2009 to 2012 and Board Director from 2003 to 2015. Vice President, Leadership and Community Engagement, Bush Foundation, Saint Paul, Minnesota (a private foundation) from 2009 to 2011. Executive Vice President and Chief Financial Officer, Minnesota Sports and Entertainment from 2004 to 2009 and Senior Vice President from 2002 to 2004. Executive Vice President of the Minnesota Wild Foundation from 2004 to 2008. Commissioner of Finance, State of Minnesota, from 1999 to 2002. Currently Board Chair of the Minnesota Wild Foundation since 2010. | | N/A |
| * | Length of service dates reflect the Trustee’s commencement of service with the Trust’s predecessor entities, where applicable. |
26 | Wells Fargo Absolute Return Fund
Other information (unaudited)
Officers
| | | | |
Name and year of birth | | Position held and length of service | | Principal occupations during past five years or longer |
| | |
Andrew Owen (Born 1960) | | President, since 2017 | | Executive Vice President of Wells Fargo & Company and Head of Affiliated Managers, Wells Fargo Asset Management, since 2014. In addition, Mr. Owen is currently President, Chief Executive Officer and Director of Wells Fargo Funds Management, LLC since 2017. Prior thereto, Executive Vice President responsible for marketing, investments and product development for Wells Fargo Funds Management, LLC, from 2009 to 2014. |
| | |
Jeremy DePalma1 (Born 1974) | | Treasurer, since 2012 | | Senior Vice President of Wells Fargo Funds Management, LLC since 2009. Senior Vice President of Evergreen Investment Management Company, LLC from 2008 to 2010 and head of the Fund Reporting and Control Team within Fund Administration from 2005 to 2010. |
| | |
Michelle Rhee (Born 1966) | | Chief Legal Officer, since 2019 | | Secretary of Wells Fargo Funds Management, LLC and Chief Legal Counsel of Wells Fargo Asset Management since 2018. Deputy General Counsel of Wells Fargo Bank, N.A. since 2020 and Assistant General Counsel of Wells Fargo Bank, N.A. from 2018 to 2020. Associate General Counsel and Managing Director of Bank of America Corporation from 2004 to 2018. |
| | |
Catherine Kennedy (Born 1969) | | Secretary, since 2019 | | Vice President of Wells Fargo Funds Management, LLC and Senior Counsel of the Wells Fargo Legal Department since 2010. Vice President and Senior Counsel of Evergreen Investment Management Company, LLC from 1998 to 2010. |
| | |
Michael H. Whitaker (Born 1967) | | Chief Compliance Officer, since 2016 | | Chief Compliance Officer of Wells Fargo Asset Management since 2016. Senior Vice President and Chief Compliance Officer for Fidelity Investments from 2007 to 2016. |
| 1 | Jeremy DePalma acts as Treasurer of 77 funds in the Fund Complex. |
| 2 | The Statement of Additional Information includes additional information about the Trustees and is available, without charge, upon request, by calling 1-800-222-8222 or by visiting the website at wfam.com. |
Wells Fargo Absolute Return Fund | 27
Other information (unaudited)
BOARD CONSIDERATION OF INVESTMENT MANAGEMENT AGREEMENT:
Wells Fargo Absolute Return Fund
Under the Investment Company Act of 1940 (the “1940 Act”), the Board of Trustees (the “Board”) of Wells Fargo Funds Trust (the “Trust”) must determine annually whether to approve the continuation of the Trust’s investment management agreements. In this regard, at a Board meeting held on May 26, 2020 and May 28, 2020 (together, the “Meeting”), the Board, all the members of which have no direct or indirect interest in the investment management and sub-advisory agreements and are not “interested persons” of the Trust, as defined in the 1940 Act (the “Independent Trustees”), reviewed and approved an investment management agreement (the “Management Agreement”) with Wells Fargo Funds Management, LLC (“Funds Management”) for Wells Fargo Absolute Return Fund (the “Fund”).
The Fund is a gateway feeder fund that invests substantially all of its assets in the GMO Benchmark-Free Allocation Fund (the “GMO Fund”), a series of the GMO Trust, which is overseen by a different board of trustees. The GMO Fund is managed by Grantham Mayo Van Otterloo & Co. LLC (“GMO”). The Fund’s investment objective and principal investment strategies are substantially similar to those of the GMO Fund. References to the Fund and its performance and characteristics are also applicable to the GMO Fund, as relevant.
At the Meeting, the Board considered the factors and reached the conclusions described below relating to the selection of Funds Management and the continuation of the Management Agreement. Prior to the Meeting, including at a Board meeting held in April 2020, the Trustees conferred extensively among themselves and with representatives of Funds Management about these matters. Also, the Board has adopted a team-based approach, with each team consisting of a sub-set of Trustees, to assist the full Board in the discharge of its duties in reviewing investment performance and other matters throughout the year. The Independent Trustees were assisted in their evaluation of the Management Agreement by independent legal counsel, from whom they received separate legal advice and with whom they met separately.
In providing information to the Board, Funds Management was guided by a detailed set of requests for information submitted to them by independent legal counsel on behalf of the Independent Trustees at the start of the Board’s annual contract renewal process earlier in 2020. In considering and approving the Management Agreement, the Trustees considered the information they believed relevant, including but not limited to the information discussed below. The Board considered not only the specific information presented in connection with the Meeting, but also the knowledge gained over time through interaction with Funds Management about various topics. In this regard, the Board reviewed reports at each of its quarterly meetings, which included, among other things, portfolio reviews and investment performance reports. In addition, the Board and the teams mentioned above confer with portfolio managers at various times throughout the year. The Board did not identify any particular information or consideration that was all-important or controlling, and each individual Trustee may have attributed different weights to various factors.
After its deliberations, the Board unanimously approved the continuation of the Management Agreement for a one-year term, and determined that the compensation payable to Funds Management was reasonable. The Board considered the continuation of the Management Agreement for the Fund as part of its consideration of agreements for funds across the complex, but its approvals were made on a fund-by-fund basis. The following summarizes a number of important, but not necessarily all, factors considered by the Board in support of its approvals.
Nature, extent and quality of services
The Board received and considered various information regarding the nature, extent and quality of services provided to the Fund by Funds Management under the Management Agreement. This information included, among other things, a summary of the background and experience of senior management of Wells Fargo Asset Management (“WFAM”), of which Funds Management is a part, and a summary of investments made in the business of WFAM. The Board also received a description of Funds Management’s business continuity plans and its approach to data privacy and cybersecurity, including related testing. The Board received and reviewed information about Funds Management’s role as administrator of the Fund’s liquidity risk management program. The Board considered the qualifications, background, tenure and responsibilities of the portfolio manager of GMO primarily responsible for the day-to-day portfolio management of the GMO Fund.
In light of the gateway feeder nature of the Fund, the Board was advised that the scope of services under the Management Agreement includes various responsibilities related to the oversight of the Fund’s investment in the GMO Fund and the GMO Fund’s performance and investment management activities, as well as Fund-level administrative services.
The Board evaluated the ability of Funds Management to attract and retain qualified investment professionals, including research, advisory and supervisory personnel. The Board further considered the compliance program and compliance record of Funds Management. In addition, the Board took into account the full range of services provided to the Fund by Funds Management and its affiliates.
28 | Wells Fargo Absolute Return Fund
Other information (unaudited)
Fund investment performance and expenses
The Board considered the performance results for the Fund over various time periods ended December 31, 2019. The Board also considered more current results for various time periods ended March 31, 2020. The Board considered these results in comparison to the performance of funds in a universe that was determined by Broadridge Inc. (“Broadridge”) to be similar to the Fund (the “Universe”), and in comparison to the Fund’s benchmark index and to other comparative data. Broadridge is an independent provider of investment company data. The Board received a description of the methodology used by Broadridge to select the mutual funds in the performance Universe. The Board noted that the investment performance of the Fund (Administrator Class) was in range of the average investment performance of the Universe for the three-year period ended December 31, 2019, and lower than the average investment performance of the Universe for the one-, five- and ten-year periods ended December 31, 2019. The Board also noted that the investment performance of the Fund (Administrator Class) was in range of the average investment performance of the Universe for the ten-year period ended March 31, 2020, and lower than the average investment performance of the Universe for the one-, three- and five-year periods ended March 31, 2020. The Board also noted that the investment performance of the Fund was higher than its benchmark index, the Consumer Price Index, for all periods ended December 31, 2019. The Board also noted that the investment performance of the Fund was lower than its benchmark index, the Consumer Price Index, for the one-, three- and five-year periods ended March 31, 2020, and higher than the benchmark index for the ten-year period ended March 31, 2020.
The Board received information concerning, and discussed factors contributing to, the underperformance of the Fund relative to the Universe and benchmark for the periods identified above. The Board took note of the explanations for the relative underperformance during these periods, including with respect to investment decisions and market factors that affected the Fund’s investment performance. The Board also received and considered information concerning investment strategy changes and organizational changes at GMO.
The Board also received and considered information regarding the Fund’s net operating expense ratios and their various components, including actual management fees, custodian and other non-management fees, acquired fund fees and expenses, and Rule 12b-1 and non-Rule 12b-1 shareholder service fees, but excluding purchase premiums, redemption fees and indirect interest expenses, at both the Fund-level and the GMO Fund-level. The Board considered these ratios in comparison to the median ratios of funds in class-specific expense groups that were determined by Broadridge to be similar to the Fund (the “Groups”). The Board received a description of the methodology used by Broadridge to select the mutual funds in the expense Groups and an explanation of how the funds comprising expense groups and their expense ratios may vary from year-to-year. Based on the Broadridge reports, the Board noted that the net operating expense ratios of the Fund, including indirect fees and expenses incurred at the GMO Fund-level, were lower than the median net operating expense ratios of the expense Groups for all share classes.
The Board took into account the Fund’s investment performance and expense information provided to it among the factors considered in deciding to re-approve the Management Agreement.
Investment management fee rates
The Board reviewed and considered the contractual fee rates payable by the Fund to Funds Management under the Management Agreement, as well as the contractual fee rates payable by the Fund to Funds Management for class-level administrative services under a Class-Level Administration Agreement, which include, among other things, class-level transfer agency and sub-transfer agency costs (collectively, the “Management Rates”).
Among other information reviewed by the Board was a comparison of the Fund’s Management Rates with the average contractual investment management fee rates of funds in the expense Groups at a common asset level as well as transfer agency costs of the funds in the expense Groups. The Board noted that the Management Rates of the Fund were lower than or equal to the sum of these average rates for the Fund’s expense Groups for all share classes.
Based on its consideration of the factors and information it deemed relevant, including those described here, the Board determined that the compensation payable to Funds Management under the Management Agreement was reasonable.
Profitability
The Board received and considered information concerning the profitability of Funds Management, as well as the profitability of both WFAM and Wells Fargo & Co. (“Wells Fargo”) from providing services to the fund family as a whole. Funds Management reported on the methodologies and estimates used in calculating profitability, including a description of the methodology used to allocate certain expenses. Among other things, the Board noted that the levels of profitability reported on a fund-by-fund basis varied widely, depending on factors such as the size, type and age of fund. Based on its review, the Board did not deem the profits reported by Funds Management, WFAM or Wells Fargo to be at a level that would prevent it from approving the continuation of the Management Agreement.
Wells Fargo Absolute Return Fund | 29
Other information (unaudited)
Economies of scale
The Board received and considered information about the potential for Funds Management to experience economies of scale in the provision of management services to the Fund, the difficulties of calculating economies of scale at an individual fund level, and the extent to which potential scale benefits are shared with shareholders. The Board noted the existence of breakpoints in the Fund’s management fee structure, which operate generally to reduce the Fund’s expense ratios as the Fund grows in size, and the size of the Fund in relation to such breakpoints. The Board considered that in addition to management fee breakpoints, Funds Management shares potential economies of scale from its management business in a variety of ways, including through fee waiver and expense reimbursement arrangements, services that benefit shareholders, competitive management fee rates set at the outset without regard to breakpoints, and investments in the business intended to enhance services available to shareholders.
The Board concluded that Funds Management’s arrangements with respect to the Fund, including contractual breakpoints, constituted a reasonable approach to sharing potential economies of scale with the Fund and its shareholders.
Other benefits to Funds Management
The Board received and considered information regarding potential “fall-out” or ancillary benefits received by Funds Management and its affiliates as a result of their relationships with the Fund. Ancillary benefits could include, among others, benefits directly attributable to other relationships with the Fund and benefits potentially derived from an increase in Funds Management’s business as a result of its relationship with the Fund. The Board also noted that various affiliates of Funds Management may receive distribution-related fees, shareholder servicing payments and sub-transfer agency fees in respect of shares sold or held through them and services provided.
Based on its consideration of the factors and information it deemed relevant, including those described here, the Board did not find that any ancillary benefits received by Funds Management and its affiliates were unreasonable.
Conclusion
At the Meeting, after considering the above-described factors and based on its deliberations and its evaluation of the information described above, the Board unanimously approved the continuation of the Management Agreement for a one-year term, and determined that the compensation payable to Funds Management was reasonable.
30 | Wells Fargo Absolute Return Fund
Other information (unaudited)
LIQUIDITY RISK MANAGEMENT PROGRAM
In accordance with Rule 22e-4 under the Investment Company Act of 1940, as amended (the “Liquidity Rule”), Wells Fargo Funds Trust (the “Trust”) has adopted and implemented a liquidity risk management program (the “Program”) on behalf of each of its series, including the Fund, which is reasonably designed to assess and manage the Fund’s liquidity risk. “Liquidity risk” is defined as the risk that the Fund is unable to meet redemption requests without significantly diluting remaining investors’ interests in the Fund. The Trust’s Board of Trustees (the “Board”) previously approved the designation of Wells Fargo Funds Management, LLC (“Funds Management”), the Fund’s investment manager, as the administrator of the Program, and Funds Management has established a Liquidity Risk Management Council composed of personnel from multiple departments within Funds Management and its affiliates to assist Funds Management in the implementation and on-going administration of the Program.
The Program is comprised of various components designed to support the assessment and/or management of liquidity risk, including: (1) the periodic assessment (no less frequently than annually) of certain factors that influence the Fund’s liquidity risk; (2) the periodic classification (no less frequently than monthly) of the Fund’s investments into one of four liquidity categories that reflect an estimate of their liquidity under current market conditions; (3) a 15% limit on the acquisition of “illiquid investments” (as defined under the Liquidity Rule); (4) to the extent the Fund does not invest primarily in “highly liquid investments” (as defined under the Liquidity Rule), the determination of a minimum percentage of the Fund’s assets that generally will be invested in highly liquid investments (an “HLIM”); (5) if the Fund has established an HLIM, the periodic review (no less frequently than annually) of the HLIM and the adoption of policies and procedures for responding to a shortfall of the Fund’s “highly liquid investments” below its HLIM; and (6) periodic reporting to the Board.
At a meeting of the Board held on May 26 and 28, 2020, the Board received a written report (the “Report”) from Funds Management that addressed the operation of the Program and assessed its adequacy and effectiveness of implementation. The Report covered the initial period from December 1, 2018 through December 31, 2019 (the “Reporting Period”). No significant liquidity events impacting the Fund were noted in the Report. There were no material changes to the Program during the Reporting Period. The Report concluded that the Program is operating effectively to assess and manage the Fund’s liquidity risk, and that the Program has been and continues to be adequately and effectively implemented to monitor and, as applicable, respond to the Fund’s liquidity developments.
There can be no assurance that the Program will achieve its objectives under all circumstances in the future. Please refer to the Fund’s prospectus for more information regarding the Fund’s exposure to liquidity risk and other risks to which an investment in the Fund may be subject.
Wells Fargo Absolute Return Fund | 31
Appendix I (unaudited)
GMO Benchmark-Free Allocation Fund
(A Series of GMO Trust)
Schedule of Investments
(showing percentage of total net assets)
October 31, 2020 (Unaudited)
| | | | | | | | | | |
| Shares | | | Description | | Value ($) | |
| | |
| | | | | | MUTUAL FUNDS — 100.0% | |
| | |
| | | | | | Affiliated Issuers — 100.0% | |
| | | |
| | | 7,650,737 | | | GMO Emerging Country Debt Fund, Class IV | | | 199,301,693 | |
| | | |
| | | 3,803,989 | | | GMO High Yield Fund, Class VI | | | 75,737,419 | |
| | | |
| | | 472,955,253 | | | GMO Implementation Fund | | | 5,689,651,696 | |
| | | |
| | | 12,964,167 | | | GMO Opportunistic Income Fund, Class VI | | | 338,883,333 | |
| | | |
| | | 5,620,528 | | | GMO SGM Major Markets Fund, Class VI | | | 181,992,693 | |
| | | |
| | | 5,713,838 | | | GMO Special Opportunities Fund, Class VI | | | 149,302,595 | |
| | | | | | | | | | |
| | | |
| | | | | | TOTAL MUTUAL FUNDS (COST $7,163,000,171) | | | 6,634,869,429 | |
| | | | | | | | | | |
| | |
| | | | | | SHORT-TERM INVESTMENTS — 0.1% | |
| | |
| | | | | | Money Market Funds — 0.1% | |
| | | |
| | | 3,939,087 | | | State Street Institutional Treasury Money Market Fund – Premier Class, 0.01%(a) | | | 3,939,087 | |
| | | | | | | | | | |
| | | |
| | | | | | TOTAL SHORT-TERM INVESTMENTS (COST $3,939,087) | | | 3,939,087 | |
| | | | | | | | | | |
| | | |
| | | | | | TOTAL INVESTMENTS — 100.1% (Cost $7,166,939,258) | | | 6,638,808,516 | |
| | | |
| | | | | | Other Assets and Liabilities (net) — (0.1%) | | | (4,028,526 | ) |
| | | | | | | | | | |
| | | |
| | | | | | TOTAL NET ASSETS — 100.0% | | $ | 6,634,779,990 | |
| | | | | | | | | | |
Notes to Schedule of Investments:
| (a) | The rate disclosed is the 7 day net yield as of October 31, 2020. |
32 | Wells Fargo Absolute Return Fund
Appendix I (unaudited)
GMO Benchmark-Free Allocation Fund
Statement of Assets and Liabilities — October 31, 2020 (Unaudited)
| | | | |
Assets: | |
| |
Investments in affiliated issuers, at value(a) | | $ | 6,634,869,429 | |
| |
Investments in unaffiliated issuers, at value(b) | | | 3,939,087 | |
| |
Receivable for investments sold | | | 38,000,000 | |
| |
Receivable for Fund shares sold | | | 2,062,609 | |
| |
Dividends and interest receivable | | | 53 | |
| |
Receivable for expenses reimbursed and/or waived by GMO | | | 587,750 | |
| | | | |
| |
Total assets | | | 6,679,458,928 | |
| | | | |
Liabilities: | |
| |
Payable for investments purchased | | | 34,518,665 | |
| |
Payable for Fund shares repurchased | | | 5,456,839 | |
| |
Payable to affiliate for: | | | | |
Management fee | | | 3,806,339 | |
Supplemental support fee – Class MF | | | 162,287 | |
Shareholder service fee | | | 552,850 | |
| |
Payable to agents unaffiliated with GMO | | | 2,264 | |
| |
Payable to Trustees and related expenses | | | 24,699 | |
| |
Accrued expenses | | | 154,995 | |
| | | | |
| |
Total liabilities | | | 44,678,938 | |
| | | | |
Net assets | | $ | 6,634,779,990 | |
| | | | |
| |
Net assets consist of: | | | | |
| |
Paid-in capital | | $ | 7,329,702,640 | |
| |
Distributable earnings (accumulated loss) | | | (694,922,650 | ) |
| | | | |
| | $ | 6,634,779,990 | |
| | | | |
Net assets attributable to: | | | | |
| |
Class III | | $ | 2,818,436,021 | |
| | | | |
| |
Class IV | | $ | 1,818,208,632 | |
| | | | |
| |
Class MF | | $ | 1,821,970,646 | |
| | | | |
| |
Class R6 | | $ | 45,053,759 | |
| | | | |
| |
Class I | | $ | 131,110,932 | |
| | | | |
Shares outstanding: | | | | |
| |
Class III | | | 113,361,249 | |
| | | | |
| |
Class IV | | | 73,130,399 | |
| | | | |
| |
Class MF | | | 73,211,939 | |
| | | | |
| |
Class R6 | | | 1,812,737 | |
| | | | |
| |
Class I | | | 5,279,523 | |
| | | | |
Net asset value per share: | | | | |
| |
Class III | | $ | 24.86 | |
| | | | |
| |
Class IV | | $ | 24.86 | |
| | | | |
| |
Class MF | | $ | 24.89 | |
| | | | |
| |
Class R6 | | $ | 24.85 | |
| | | | |
| |
Class I | | $ | 24.83 | |
| | | | |
| |
(a) Cost of investments – affiliated issuers: | | $ | 7,163,000,171 | |
| |
(b) Cost of investments – unaffiliated issuers: | | $ | 3,939,087 | |
Wells Fargo Absolute Return Fund | 33
This page is intentionally left blank.
This page is intentionally left blank.
This page is intentionally left blank.

For more information
More information about Wells Fargo Funds is available free upon request. To obtain literature, please write, visit the Fund’s website, or call:
Wells Fargo Funds
P.O. Box 219967
Kansas City, MO 64121-9967
Website: wfam.com
Individual investors: 1-800-222-8222
Retail investment professionals: 1-888-877-9275
Institutional investment professionals: 1-866-765-0778

This report and the financial statements contained herein are submitted for the general information of the shareholders of the Fund. If this report is used for promotional purposes, distribution of the report must be accompanied or preceded by a current prospectus. Before investing, please consider the investment objectives, risks, charges, and expenses of the investment. For a current prospectus and, if available, a summary prospectus, containing this information, call 1-800-222-8222 or visit the Fund’s website at wfam.com. Read the prospectus carefully before you invest or send money.
Wells Fargo Asset Management (WFAM) is the trade name for certain investment advisory/management firms owned by Wells Fargo & Company. These firms include but are not limited to Wells Capital Management Incorporated and Wells Fargo Funds Management, LLC. Certain products managed by WFAM entities are distributed by Wells Fargo Funds Distributor, LLC (a broker-dealer and Member FINRA).
This material is for general informational and educational purposes only and is NOT intended to provide investment advice or a recommendation of any kind—including a recommendation for any specific investment, strategy, or plan.
INVESTMENT PRODUCTS: NOT FDIC INSURED ◾ NO BANK GUARANTEE ◾ MAY LOSE VALUE
© 2020 Wells Fargo & Company. All rights reserved.
PAR-1120-00562 12-20
SA260/SAR260 10-20
Not applicable.
| ITEM 3. | AUDIT COMMITTEE FINANCIAL EXPERT |
Not applicable.
| ITEM 4. | PRINCIPAL ACCOUNTANT FEES AND SERVICES |
Not applicable.
| ITEM 5. | AUDIT COMMITTEE OF LISTED REGISTRANTS |
Not applicable.
A Portfolio of Investments for Wells Fargo Absolute Return Fund is included as part of the report to shareholders filed under Item 1 of this Form.
| ITEM 7. | DISCLOSURE OF PROXY VOTING POLICIES AND PROCEDURES FOR CLOSED-END MANAGEMENT INVESTMENT COMPANIES |
Not applicable.
| ITEM 8. | PORTFOLIO MANAGERS OF CLOSED-END MANAGEMENT INVESTMENT COMPANIES |
Not applicable.
| ITEM 9. | PURCHASES OF EQUITY SECURITIES BY CLOSED-END MANAGEMEENT INVESTMENT COMPANY AND AFFILIATED PURCHASERS |
Not applicable.
| ITEM 10. | SUBMISSION OF MATTERS TO A VOTE OF SECURITY HOLDERS |
There have been no material changes to the procedures by which shareholders may recommend nominees to the registrant’s Board of Trustees that have been implemented since the registrant’s last provided disclosure in response to the requirements of this Item.
| ITEM 11. | CONTROLS AND PROCEDURES |
(a) The President and Treasurer have concluded that the Wells Fargo Funds Trust disclosure controls and procedures (as defined in Rule 30a-3(c) under the Investment Company Act of 1940) provide reasonable assurances that material information relating to the registrant is made known to them by the appropriate persons, based on their evaluation of these controls and procedures as of a date within 90 days of the filing of this report.
(b) There were no significant changes in the registrant’s internal controls over financial reporting (as defined in Rule 30a-3(d) under the Investment Company Act of 1940) that occurred during the most recent fiscal half-year of the period covered by this report that materially affected, or is reasonably likely to materially affect, the registrant’s internal control over financial reporting.
| ITEM 12. | DISCLOSURES OF SECURITIES LENDING ACTIVITES FOR CLOSED-END MANAGEMENT INVESTMENT COMPANIES |
Not applicable.
(a)(1) Not applicable.
(a)(2) Certifications pursuant to Section 302 of the Sarbanes-Oxley Act of 2002.
(b) Certifications pursuant to Section 906 of the Sarbanes-Oxley Act of 2002.
SIGNATURES
Pursuant to the requirements of the Securities Exchange Act of 1934 and the Investment Company Act of 1940, the registrant has duly caused this report to be signed on its behalf by the undersigned, thereunto duly authorized.
| | |
| Wells Fargo Funds Trust |
| |
| By: | | |
| |
| | /s/ Andrew Owen |
| |
| | Andrew Owen |
| | President |
| |
| Date: | | December 22, 2020 |
Pursuant to the requirements of the Securities Exchange Act of 1934 and the Investment Company Act of 1940, this report has been signed below by the following persons on behalf of the registrant and in the capacities and on the date indicated.
| | |
| Wells Fargo Funds Trust |
| |
| By: | | |
| |
| | /s/ Andrew Owen |
| |
| | Andrew Owen |
| | President |
| |
| Date: | | December 22, 2020 |
| |
| By: | | |
| |
| | /s/ Jeremy DePalma |
| |
| | Jeremy DePalma |
| | Treasurer |
| |
| Date: | | December 22, 2020 |