
UNITED STATES
SECURITIES AND EXCHANGE COMMISSION
Washington, D.C. 20549
FORM N-CSRS
CERTIFIED SHAREHOLDER REPORT OF REGISTERED
MANAGEMENT INVESTMENT COMPANIES
Investment Company Act file number: 811-09253
Wells Fargo Funds Trust
(Exact name of registrant as specified in charter)
525 Market St., San Francisco, CA 94105
(Address of principal executive offices) (Zip code)
Catherine Kennedy
Wells Fargo Funds Management, LLC
525 Market St., San Francisco, CA 94105
(Name and address of agent for service)
Registrant’s telephone number, including area code: 800-222-8222
Date of fiscal year end: May 31
Registrant is making a filing for 17 of its series:
Wells Fargo Asset Allocation Fund, Wells Fargo Growth Balanced Fund, Wells Fargo Moderate Balanced Fund, Wells Fargo C&B Large Cap Value Fund, Wells Fargo Diversified Equity Fund, Wells Fargo Emerging Growth Fund, Wells Fargo Index Fund, Wells Fargo International Value Fund, Wells Fargo Small Company Growth Fund, Wells Fargo Small Company Value Fund, Wells Fargo Core Bond Fund, Wells Fargo Real Return Fund, Wells Fargo Spectrum Income Allocation Fund, Wells Fargo Spectrum Growth Fund, Wells Fargo Spectrum Moderate Growth Fund, Wells Fargo Spectrum Conservative Growth Fund, and Wells Fargo Spectrum Aggressive Growth Fund.
Date of reporting period: November 30, 2020
| ITEM 1. | REPORT TO STOCKHOLDERS |
Semi-Annual Report
November 30, 2020
Wells Fargo Asset Allocation Fund
|
|
|
Reduce clutter. Save trees. |
Sign up for
electronic delivery
of prospectuses
and shareholder
reports at
wellsfargo.com/
advantagedelivery |
The views expressed and any forward-looking statements are as of November 30, 2020, unless otherwise noted, and are those of the Fund’s portfolio managers and/or Wells Fargo Asset Management. Discussions of individual securities, or the markets generally, or any Wells Fargo Fund are not intended as individual recommendations. Future events or results may vary significantly from those expressed in any forward-looking statements. The views expressed are subject to change at any time in response to changing circumstances in the market. Wells Fargo Asset Management and the Fund disclaim any obligation to publicly update or revise any views expressed or forward-looking statements.
INVESTMENT PRODUCTS: NOT FDIC INSURED ◾ NO BANK GUARANTEE ◾ MAY LOSE VALUE
Wells Fargo Asset Allocation Fund | 1
Letter to shareholders (unaudited)

Andrew Owen
President
Wells Fargo Funds
“Global stock markets rallied strongly, driven by aggressive stimulus measures introduced by central banks and governments in response to challenges presented by the COVID-19 pandemic.”
Dear Shareholder:
We are pleased to offer you this semi-annual report for the Wells Fargo Asset Allocation Fund for the six-month period that ended November 30, 2020. Global stock markets rallied strongly, driven by aggressive stimulus measures introduced by central banks and governments in response to challenges presented by the COVID-19 pandemic. Emerging market equities had particularly robust results during the six-month period. Among bonds, high-yield issues led the way while U.S. bonds generally had more modest returns than their international counterparts.
For the period, U.S. stocks, based on the S&P 500 Index,1 returned 19.98% and international stocks, as measured by the MSCI ACWI ex USA Index (Net),2 gained 23.28%. The MSCI EM Index (Net)3 rallied 31.14%. Among bond investments, the Bloomberg Barclays U.S. Aggregate Bond Index4 returned a modest 1.79%, the Bloomberg Barclays Global Aggregate ex-USD Index5 gained a robust 8.19%, the Bloomberg Barclays Municipal Bond Index6 had a 3.29% return, and the ICE BofA U.S. High Yield Index7 gained a healthy 10.47%.
Equities enjoyed a strong tailwind from monetary and fiscal stimulus.
Financial markets posted widely positive returns in June despite ongoing economic weakness and uncertainty regarding COVID-19 and the timing of an effective vaccine. As economies reopened, optimism rose. Vitally important to market sentiment was the ongoing global central bank commitment to provide economic support through liquidity and low borrowing costs. U.S. economic activity was boosted by one-time $1,200 stimulus checks and $600 weekly bonus unemployment benefits for tens of millions of Americans through July. However, jobless rates remained historically high, easing somewhat from 14.7% in April to 11.1% in June. By late June, numerous states reported increases of COVID-19 cases, an ominous sign. China’s economic recovery picked up momentum in June.
July was broadly positive for both global equities and fixed income. However, economic data and a resurgence of COVID-19 cases pointed to the vulnerability of the global economy and the need to regain control of the pandemic. Second-quarter gross domestic product (GDP) shrank from the previous quarter by 9.5% and 12.1% in the U.S. and the eurozone, respectively. In contrast, China reported 3.2% year-over-year second-quarter GDP growth. U.S. unemployment remained high despite adding 1.8��million jobs in July, as a double-digit jobless rate persisted. However, manufacturing activity grew in both the U.S. and the eurozone. In Asia, while China’s manufacturing sector continued to expand, activity in Japan and South Korea contracted. A rising concern was the rapid and broad reemergence of COVID-19 infections.
| 1 | The S&P 500 Index consists of 500 stocks chosen for market size, liquidity, and industry group representation. It is a market-value-weighted index with each stock’s weight in the index proportionate to its market value. You cannot invest directly in an index. |
| 2 | The Morgan Stanley Capital International (MSCI) All Country World Index (ACWI) ex USA Index (Net) is a free-float-adjusted market-capitalization-weighted index that is designed to measure the equity market performance of developed and emerging markets, excluding the United States. Source: MSCI. MSCI makes no express or implied warranties or representations and shall have no liability whatsoever with respect to any MSCI data contained herein. The MSCI data may not be further redistributed or used as a basis for other indices or any securities or financial products. This report is not approved, reviewed, or produced by MSCI. You cannot invest directly in an index. |
| 3 | The MSCI Emerging Markets (EM) Index (Net) is a free-float-adjusted market-capitalization-weighted index that is designed to measure equity market performance of emerging markets. You cannot invest directly in an index. |
| 4 | The Bloomberg Barclays U.S. Aggregate Bond Index is a broad-based benchmark that measures the investment-grade, U.S. dollar-denominated, fixed-rate taxable bond market, including Treasuries, government-related and corporate securities, mortgage-backed securities (agency fixed-rate and hybrid adjustable-rate mortgage pass-throughs), asset-backed securities, and commercial mortgage-backed securities. You cannot invest directly in an index. |
| 5 | The Bloomberg Barclays Global Aggregate ex-USD Index is an unmanaged index that provides a broad-based measure of the global investment-grade fixed-income markets excluding the U.S. dollar-denominated debt market. You cannot invest directly in an index. |
| 6 | The Bloomberg Barclays Municipal Bond Index is an unmanaged index composed of long-term tax-exempt bonds with a minimum credit rating of Baa. You cannot invest directly in an index. |
| 7 | The ICE BofA U.S. High Yield Index is a market-capitalization-weighted index of domestic and Yankee high-yield bonds. The index tracks the performance of high-yield securities traded in the U.S. bond market. You cannot invest directly in an index. Copyright 2021. ICE Data Indices, LLC. All rights reserved. |
2 | Wells Fargo Asset Allocation Fund
Letter to shareholders (unaudited)
The stock market continued to rally in August despite concerns over rising COVID-19 cases in the U.S. and Europe, as well as the expiration of the $600 weekly bonus unemployment benefit in July. Generally stronger-than-expected second-quarter earnings boosted investor sentiment along with the Federal Reserve’s announcement of a more accommodative policy shift that could lead to longer-term low interest rates. U.S. indices measuring manufacturing and services activities beat expectations while the U.S. housing market maintained strength. In Europe, retail sales expanded and consumer confidence was steady. China’s economy continued to expand.
Stocks grew more volatile in September on mixed economic data. U.S. economic activity continued to grow. However, only half of the 22 million jobs lost since the early spring had returned. The U.S. unemployment rate fell to 7.9% in September, a measurable improvement but far higher than the 3.5% pre-COVID-19 rate. Only 661,000 jobs were added for the month, down from 1.5 million in August. With the U.S. Congress failing to pass further fiscal relief and uncertainties surrounding a possible vaccine, doubts crept back into the markets. In the U.K., a lack of progress in Brexit talks with the European Union weighed on markets. China’s economy picked up steam, however, with growth fueled by increased global demand.
In October, capital markets took a step back from their six-month rally. Market volatility rose in advance of the U.S. election and amid a global increase in COVID-19 infections. Europe responded with more economic restrictions. Meanwhile, Brexit remained unresolved. U.S. markets looked favorably at a possible Democratic sweep and control of the federal purse strings in anticipation of additional fiscal stimulus, which could boost economic activity. Meanwhile, China continued to stand apart, reporting 4.9% third-quarter GDP growth year over year.
Global stocks rallied broadly in November, propelled by optimism over three promising COVID-19 vaccines, which reported high effectiveness in trials. Global stock indices notched double-digit monthly gains. In a reversal of recent trends, value stocks outperformed growth and cyclical stocks outpaced technology stocks. However, U.S. unemployment remained elevated, with a net job loss of 10 million since February. The Eurozone Services Purchasing Managers’ Index, a monthly survey of purchasing managers, contracted sharply while the region’s manufacturing activity gauge indicated growth. The U.S. election results added to the market’s upbeat mood as investors gave thumbs-up to the certainty of the outcome after an unusual delay and anticipated more consistent policies in the new administration.
Don’t let short-term uncertainty derail long-term investment goals.
Periods of investment uncertainty can present challenges, but experience has taught us that maintaining long-term investment goals can be an effective way to plan for the future. To help you create a sound strategy based on your personal goals and risk tolerance, Wells Fargo Funds offers more than 100 mutual funds spanning a wide range of asset classes and investment styles. Although diversification cannot guarantee an investment profit or prevent losses, we believe it can be an effective way to manage investment risk and potentially smooth out overall portfolio performance. We encourage investors to know their investments and to understand that appropriate levels of risk-taking may unlock opportunities.
Thank you for choosing to invest with Wells Fargo Funds. We appreciate your confidence in us and remain committed to helping you meet your financial needs.
Sincerely,

Andrew Owen
President
Wells Fargo Funds
“Global stocks rallied broadly in November, propelled by optimism over three promising COVID-19 vaccines, which reported high effectiveness in trials.”
|
|
|
For further information about your Fund, contact your investment professional, visit our website at wfam.com, or call us directly at 1-800-222-8222. |
Wells Fargo Asset Allocation Fund | 3
Letter to shareholders (unaudited)
Notice to Shareholders
At a meeting held on August 10-12, 2020, the Board of Trustees of the Fund approved a change to the Fund’s automatic conversion feature for Class C shares in order to shorten the required holding period from 10 to 8 years. As a result, on a monthly basis beginning November 5, 2020, Class C shares will convert automatically into Class A shares 8 years after the initial date of purchase or, if you acquired your Class C shares through an exchange or conversion from another share class, 8 years after the date you acquired your Class C shares. When Class C shares that you acquired through a purchase or exchange convert, any other Class C shares that you purchased with reinvested dividends and distributions also will convert into Class A shares on a pro rata basis.
Please note that a shorter holding period may apply depending on your intermediary. Please see “Appendix A—Sales Charge Reductions and Waivers for Certain Intermediaries” in the Fund’s prospectus for further information.
Preparing for LIBOR Transition
The global financial industry is preparing to transition away from the London Interbank Offered Rate (LIBOR), a key benchmark interest rate, to new alternative rates. LIBOR underpins more than $350 trillion of financial contracts. It is the benchmark rate for a wide spectrum of products ranging from residential mortgages to corporate bonds to derivatives. Regulators have called for a market-wide transition away from LIBOR to successor reference rates by the end of 2021, which requires proactive steps be taken by issuers, counterparties, and asset managers to identify impacted products and adopt new reference rates.
The Fund holds at least one security that uses LIBOR as a floating reference rate and has a maturity date after 12-31-2021.
Although the transition process away from LIBOR has become increasingly well-defined in advance of the anticipated discontinuation date, there remains uncertainty regarding the nature of successor reference rates, and any potential effects of the transition away from LIBOR on investment instruments that use it as a benchmark rate. The transition process may result in, among other things, increased volatility or illiquidity in markets for instruments that currently rely on LIBOR and could negatively impact the value of certain instruments held by the Fund.
Wells Fargo Asset Management is monitoring LIBOR exposure closely and has put resources and controls in place to manage this transition effectively. The Fund’s portfolio management team is evaluating LIBOR holdings to understand what happens to those securities when LIBOR ceases to exist, including examining security documentation to identify the presence or absence of fallback language identifying a replacement rate to LIBOR.
While the pace of transition away from LIBOR will differ by asset class and investment strategy, the portfolio management team will monitor market conditions for those holdings to identify and mitigate deterioration or volatility in pricing and liquidity and ensure appropriate actions are taken in a timely manner.
Further information regarding the potential risks associated with the discontinuation of LIBOR can be found in the Fund’s Statement of Additional Information.
4 | Wells Fargo Asset Allocation Fund
This page is intentionally left blank.
Performance highlights (unaudited)
Investment objective
The Fund seeks long-term total return, consisting of capital appreciation and current income.
Manager
Wells Fargo Funds Management, LLC
Subadviser
Wells Capitals Management Incorporated
Portfolio managers
Kandarp R. Acharya, CFA®‡, FRM
Petros N. Bocray, CFA®‡, FRM
Christian L. Chan, CFA®‡
Average annual total returns (%) as of November 30, 2020
| | | | | | | | | | | | | | | | | | | | | | | | | | | | | | | | | | |
| | | | |
| | | | | Including sales charge | | | Excluding sales charge | | | Expense ratios1 (%) | |
| | | | | | | | | |
| | | Inception date | | 1 year | | | 5 year | | | 10 year | | | 1 year | | | 5 year | | | 10 year | | | Gross | | | Net2 | |
| | | | | | | | | | |
| Class A (EAAFX) | | 7-29-1996 | | | 5.23 | | | | 5.73 | | | | 5.17 | | | | 11.67 | | | | 6.99 | | | | 5.80 | | | | 1.30 | | | | 1.13 | |
| | | | | | | | | | |
| Class C (EACFX) | | 10-3-2002 | | | 11.32 | | | | 6.47 | | | | 5.14 | | | | 12.32 | | | | 6.47 | | | | 5.14 | | | | 2.05 | | | | 1.88 | |
| | | | | | | | | | |
| Class R (EAXFX) | | 10-10-2003 | | | – | | | | – | | | | – | | | | 12.00 | | | | 6.84 | | | | 5.59 | | | | 1.55 | | | | 1.38 | |
| | | | | | | | | | |
| Administrator Class (EAIFX) | | 10-3-2002 | | | – | | | | – | | | | – | | | | 12.83 | | | | 7.35 | | | | 6.08 | | | | 1.22 | | | | 0.95 | |
| | | | | | | | | | |
| Institutional Class (EAAIX)3 | | 11-30-2012 | | | – | | | | – | | | | – | | | | 12.13 | | | | 7.39 | | | | 6.17 | | | | 0.97 | | | | 0.80 | |
| | | | | | | | | | |
| Asset Allocation Blended Index4 | | – | | | – | | | | – | | | | – | | | | 13.74 | | | | 9.16 | | | | 7.82 | | | | – | | | | – | |
| | | | | | | | | | |
| Bloomberg Barclays U.S. Aggregate Bond Index5 | | – | | | – | | | | – | | | | – | | | | 7.28 | | | | 4.34 | | | | 3.71 | | | | – | | | | – | |
| | | | | | | | | | |
| MSCI ACWI ex USA Index (Net)6 | | – | | | – | | | | – | | | | – | | | | 9.52 | | | | 7.38 | | | | 5.16 | | | | – | | | | – | |
| | | | | | | | | | |
| Russell 3000® Index7 | | – | | | – | | | | – | | | | – | | | | 19.02 | | | | 13.95 | | | | 14.04 | | | | – | | | | – | |
Figures quoted represent past performance, which is no guarantee of future results, and do not reflect taxes that a shareholder may pay on an investment in a fund. Investment return and principal value of an investment will fluctuate so that an investor’s shares, when redeemed, may be worth more or less than their original cost. Performance shown without sales charges would be lower if sales charges were reflected. Current performance may be lower or higher than the performance data quoted, which assumes the reinvestment of dividends and capital gains. Current month-end performance is available on the Fund’s website, wfam.com.
Index returns do not include transaction costs associated with buying and selling securities, any mutual fund fees or expenses, or any taxes. It is not possible to invest directly in an index.
For Class A shares, the maximum front-end sales charge is 5.75%. For Class C shares, the maximum contingent deferred sales charge is 1.00%. Performance including a contingent deferred sales charge assumes the sales charge for the corresponding time period. Class R, Administrator Class, and Institutional Class shares are sold without a front-end sales charge or contingent deferred sales charge.
Balanced funds may invest in stocks and bonds. Stock values fluctuate in response to the activities of individual companies and general market and economic conditions. Bond values fluctuate in response to the financial condition of individual issuers, general market and economic conditions, and changes in interest rates. Changes in market conditions and government policies may lead to periods of heightened volatility in the bond market and reduced liquidity for certain bonds held by the Fund. In general, when interest rates rise, bond values fall and investors may lose principal value. Interest rate changes and their impact on the fund and its share price can be sudden and unpredictable. The use of derivatives may reduce returns and/or increase volatility. Foreign investments are especially volatile and can rise or fall dramatically due to differences in the political and economic conditions of the host country. Certain investment strategies tend to increase the total risk of an investment (relative to the broader market). The Fund is exposed to high-yield securities risk, mortgage- and asset-backed securities risk, geographic risk, and smaller-company securities risk. Consult the Fund’s prospectus for additional information on these and other risks.
Please see footnotes on page 7.
6 | Wells Fargo Asset Allocation Fund
Performance highlights (unaudited)
| | | | |
| |
| Ten largest holdings (%) as of November 30, 20208 | | | |
| | |
Wells Fargo Managed Fixed Income Portfolio | | | 21.35 | |
| | |
Wells Fargo Disciplined U.S. Core Fund Class R6 | | | 11.81 | |
| | |
Wells Fargo Large Company Value Portfolio | | | 10.16 | |
| | |
Wells Fargo Diversified Large Cap Growth Portfolio | | | 9.43 | |
| | |
Wells Fargo Disciplined International Developed Markets Portfolio | | | 8.82 | |
| | |
Wells Fargo International Value Portfolio | | | 6.54 | |
| | |
Wells Fargo Core Bond Portfolio | | | 5.98 | |
| | |
Wells Fargo Real Return Portfolio | | | 3.34 | |
| | |
Wells Fargo Factor Enhanced International Equity Portfolio | | | 3.28 | |
| | |
Wells Fargo C&B Large Cap Value Portfolio | | | 3.05 | |
| | | | | | | | |
|
| Allocations (%) as of November 30, 2020 | |
| | |
| | | Neutral
allocation | | | Effective
allocation9 | |
| | | |
Bonds | | | 35 | | | | 34 | |
| | | |
Stocks | | | 65 | | | | 66 | |
| ‡ | CFA® and Chartered Financial Analyst® are trademarks owned by CFA Institute. |
| 1 | Reflects the expense ratios as stated in the most recent prospectuses, which include the impact of 0.53% in acquired fund fees and expenses. The expense ratios shown are subject to change and may differ from the annualized expense ratios shown in the financial highlights of this report, which do not include acquired fund fees and expenses. |
| 2 | The manager has contractually committed through August 31, 2021, to waive fees and/or reimburse expenses to the extent necessary to cap total annual fund operating expenses after fee waivers at 1.13% for Class A, 1.88% for Class C, 1.38% for Class R, 0.95% for Administrator Class and 0.80% for Institutional Class. Brokerage commissions, stamp duty fees, interest, taxes, acquired fund fees and expenses (if any) from funds in which the affiliated master portfolios and funds invest and from money market funds, and extraordinary expenses are excluded from the expense caps. All other acquired fund fees and expenses from the affiliated master portfolios are included in the expense caps. Prior to or after the commitment expiration date, the caps may be increased or the commitment to maintain the caps may be terminated only with the approval of the Board of Trustees. Without these caps, the Fund’s returns would have been lower. The expense ratio paid by an investor is the net expense ratio (the total annual fund operating expenses after fee waivers) as stated in the prospectuses. |
| 3 | Historical performance shown for the Institutional Class shares prior to their inception reflects the performance of the Administrator Class shares, and includes the higher expenses applicable to the Administrator Class shares. If these expenses had been included, returns for the Institutional Class shares would be higher. |
| 4 | Source: Wells Fargo Funds Management, LLC. The Asset Allocation Blended Index is composed of 45% of the Russell 3000®Index, 35% of the Bloomberg Barclays U.S. Aggregate Bond Index and 20% of the MSCI ACWI ex USA Index (Net). Prior to June 16, 2018, it was comprised of 65% of the MSCI ACWI Index (Net) and 35% of the Bloomberg Barclays U.S. Aggregate Bond Index. You cannot invest directly in an index. |
| 5 | The Bloomberg Barclays U.S. Aggregate Bond Index is a broad-based benchmark that measures the investment-grade, U.S. dollar–denominated, fixed-rate taxable bond market, including Treasuries, government-related and corporate securities, mortgage-backed securities (agency fixed-rate and hybrid adjustable-rate mortgage pass-throughs), asset-backed securities, and commercial mortgage-backed. You cannot invest directly in an index. |
| 6 | The Morgan Stanley Capital International (MSCI) All Country World Index (ACWI) ex USA Index (Net) is a free-float-adjusted market-capitalization-weighted index that is designed to measure the equity market performance of developed and emerging markets, excluding the U.S. You cannot invest directly in an index. |
| 7 | The Russell 3000® Index measures the performance of the 3,000 largest U.S. companies based on total market capitalization, which represents approximately 98% of the investable U.S. equity market. You cannot invest directly in an index. |
| 8 | Figures represent the percentage of the Fund’s net assets. Holdings are subject to change and may have changed since the date specified. |
| 9 | Effective allocation includes the effect of any tactical futures overlay that may be in place. Effective cash, if any, represents the net offset to such futures positions. These amounts are subject to change and may have changed since the date specified. |
Wells Fargo Asset Allocation Fund | 7
Fund expenses (unaudited)
As a shareholder of the Fund, you incur two types of costs: (1) transaction costs, including sales charges (loads) on purchase payments and contingent deferred sales charges (if any) on redemptions and (2) ongoing costs, including management fees, distribution (12b-1) and/or shareholder servicing fees, and other Fund expenses. This example is intended to help you understand your ongoing costs (in dollars) of investing in the Fund and to compare these costs with the ongoing costs of investing in other mutual funds.
The example is based on an investment of $1,000 invested at the beginning of the six-month period and held for the entire period from June 1, 2020 to November 30, 2020.
Actual expenses
The “Actual” line of the table below provides information about actual account values and actual expenses. You may use the information in this line, together with the amount you invested, to estimate the expenses that you paid over the period. Simply divide your account value by $1,000 (for example, an $8,600 account value divided by $1,000 = 8.6), then multiply the result by the number in the “Actual” line under the heading entitled “Expenses paid during period” for your applicable class of shares to estimate the expenses you paid on your account during this period.
Hypothetical example for comparison purposes
The “Hypothetical” line of the table below provides information about hypothetical account values and hypothetical expenses based on the Fund’s actual expense ratio and an assumed rate of return of 5% per year before expenses, which is not the Fund’s actual return. The hypothetical account values and expenses may not be used to estimate the actual ending account balance or expenses you paid for the period. You may use this information to compare the ongoing costs of investing in the Fund and other funds. To do so, compare this 5% hypothetical example with the 5% hypothetical examples that appear in the shareholder reports of the other funds.
Please note that the expenses shown in the table are meant to highlight your ongoing costs only and do not reflect any transactional costs, such as sales charges (loads) and contingent deferred sales charges. Therefore, the “Hypothetical” line of the table is useful in comparing ongoing costs only and will not help you determine the relative total costs of owning different funds. In addition, if these transactional costs were included, your costs would have been higher.
| | | | | | | | | | | | | | | | |
| | | Beginning
account value
6-1-2020 | | | Ending
account value
11-30-2020 | | | Expenses
paid during
the period1,2 | | | Annualized net
expense ratio1 | |
| | | | | |
Class A | | | | | | | | | | | | | | | | |
| | | | |
Actual | | $ | 1,000.00 | | | $ | 1,151.81 | | | $ | 5.66 | | | | 1.05 | % |
| | | | |
Hypothetical (5% return before expenses) | | $ | 1,000.00 | | | $ | 1,019.80 | | | $ | 5.32 | | | | 1.05 | % |
| | | | | |
Class C | | | | | | | | | | | | | | | | |
| | | | |
Actual | | $ | 1,000.00 | | | $ | 1,162.18 | | | $ | 9.76 | | | | 1.80 | % |
| | | | |
Hypothetical (5% return before expenses) | | $ | 1,000.00 | | | $ | 1,016.04 | | | $ | 9.10 | | | | 1.80 | % |
| | | | | |
Class R | | | | | | | | | | | | | | | | |
| | | | |
Actual | | $ | 1,000.00 | | | $ | 1,155.90 | | | $ | 6.97 | | | | 1.29 | % |
| | | | |
Hypothetical (5% return before expenses) | | $ | 1,000.00 | | | $ | 1,018.60 | | | $ | 6.53 | | | | 1.29 | % |
| | | | | |
Administrator Class | | | | | | | | | | | | | | | | |
| | | | |
Actual | | $ | 1,000.00 | | | $ | 1,162.18 | | | $ | 4.72 | | | | 0.87 | % |
| | | | |
Hypothetical (5% return before expenses) | | $ | 1,000.00 | | | $ | 1,020.71 | | | $ | 4.41 | | | | 0.87 | % |
| | | | | |
Institutional Class | | | | | | | | | | | | | | | | |
| | | | |
Actual | | $ | 1,000.00 | | | $ | 1,153.56 | | | $ | 3.89 | | | | 0.72 | % |
| | | | |
Hypothetical (5% return before expenses) | | $ | 1,000.00 | | | $ | 1,021.46 | | | $ | 3.65 | | | | 0.72 | % |
| 1 | Amounts reflect net expenses allocated from the affiliated Master Portfolios in which the Fund invests. |
| 2 | Expenses paid is equal to the annualized net expense ratio of each class multiplied by the average account value over the period, multiplied by the number of days in the most recent fiscal half-year divided by the number of days in the fiscal year (to reflect the one-half-year period). |
8 | Wells Fargo Asset Allocation Fund
Portfolio of investments—November 30, 2020 (unaudited)
| | | | | | | | | | | | | | | | |
| | | | | | | | | Shares | | | Value | |
| Exchange-Traded Funds: 5.74% | | | | | | | | | | | | |
iShares Core S&P 500 ETF | | | | | | | | | | | 148,900 | | | $ | 54,098,348 | |
iShares Core U.S. Aggregate Bond ETF | | | | | | | | | | | 170,772 | | | | 20,222,820 | |
The Industrial Select Sector SPDR Fund | | | | | | | | | | | 325,466 | | | | 28,650,772 | |
| | | | |
Total Exchange-Traded Funds (Cost $97,605,461) | | | | | | | | | | | | | | | 102,971,940 | |
| | | | | | | | | | | | | | | | |
| | | | |
Investment Companies: 92.88% | | | | | | | | | | | | | | | | |
| | | | |
| Affiliated Master Portfolios: 78.40% | | | | | | | | | | | | |
Wells Fargo C&B Large Cap Value Portfolio | | | | | | | | | | | | | | | 54,641,270 | |
Wells Fargo Core Bond Portfolio | | | | | | | | | | | | | | | 107,361,305 | |
Wells Fargo Disciplined International Developed Markets Portfolio | | | | | | | | | | | | | | | 158,160,560 | |
Wells Fargo Diversified Large Cap Growth Portfolio | | | | | | | | | | | | | | | 169,266,542 | |
Wells Fargo Emerging Growth Portfolio | | | | | | | | | | | | | | | 20,620,718 | |
Wells Fargo Factor Enhanced Emerging Markets Equity Portfolio | | | | | | | | | | | | | | | 23,916,906 | |
Wells Fargo Factor Enhanced International Equity Portfolio | | | | | | | | | | | | | | | 58,857,994 | |
Wells Fargo International Value Portfolio | | | | | | | | | | | | | | | 117,291,222 | |
Wells Fargo Large Company Value Portfolio | | | | | | | | | | | | | | | 182,266,646 | |
Wells Fargo Managed Fixed Income Portfolio | | | | | | | | | | | | | | | 383,123,784 | |
Wells Fargo Real Return Portfolio | | | | | | | | | | | | | | | 59,867,970 | |
Wells Fargo Small Company Growth Portfolio | | | | | | | | | | | | | | | 20,781,130 | |
Wells Fargo Small Company Value Portfolio | | | | | | | | | | | | | | | 50,421,280 | |
| | | | |
| | | | | | | | | | | | | | | 1,406,577,327 | |
| | | | | | | | | | | | | | | | |
| | | | |
| Affiliated Funds: 14.48% | | | | | | | | | | | | |
Wells Fargo Disciplined U.S. Core Fund Class R6 | | | | | | | | | | | 10,173,577 | | | | 211,813,879 | |
Wells Fargo Emerging Markets Equity Fund Class R6 | | | | | | | | | | | 760,808 | | | | 23,957,835 | |
Wells Fargo Emerging Markets Equity Income Fund Class R6 | | | | | | | | | | | 2,068,777 | | | | 24,018,497 | |
| | | | |
| | | | | | | | | | | | | | | 259,790,211 | |
| | | | | | | | | | | | | | | | |
| | | | |
Total Investment Companies (Cost $1,401,140,010) | | | | | | | | | | | | | | | 1,666,367,538 | |
| | | | | | | | | | | | | | | | |
| | | | | | | | |
| Total investments in securities (Cost $1,498,745,471) | | | 98.62 | % | | | 1,769,339,478 | |
| | |
Other assets and liabilities, net | | | 1.38 | | | | 24,744,703 | |
| | | | | | | | |
| Total net assets | | | 100.00 | % | | $ | 1,794,084,181 | |
| | | | | | | | |
Futures Contracts
| | | | | | | | | | | | | | | | | | | | | | | | |
| Description | | Number of
contracts | | | Expiration
date | | | Notional cost | | | Notional
value | | | Unrealized
gains | | | Unrealized
losses | |
| | | | | | |
Long | | | | | | | | | | | | | | | | | | | | | | | | |
| | | | | | |
Japanese Yen Futures | | | 748 | | | | 12-14-2020 | | | $ | 89,349,501 | | | $ | 89,633,775 | | | $ | 284,274 | | | $ | 0 | |
| | | | | | |
E-Mini Nasdaq 100 Index | | | 143 | | | | 12-18-2020 | | | | 34,354,197 | | | | 35,112,220 | | | | 758,023 | | | | 0 | |
| | | | | | |
E-Mini Russell 2000 Index | | | 609 | | | | 12-18-2020 | | | | 53,024,388 | | | | 55,422,045 | | | | 2,397,657 | | | | 0 | |
| | | | | | |
IBEX 35 Index | | | 780 | | | | 12-18-2020 | | | | 73,598,091 | | | | 75,019,109 | | | | 1,421,018 | | | | 0 | |
| | | | | | |
MSCI Emerging Markets Index | | | 298 | | | | 12-18-2020 | | | | 17,550,762 | | | | 17,914,270 | | | | 363,508 | | | | 0 | |
| | | | | | |
Long Gilt Bonds | | | 759 | | | | 3-29-2021 | | | | 135,555,600 | | | | 135,781,633 | | | | 226,033 | | | | 0 | |
| | | | | | |
Short | | | | | | | | | | | | | | | | | | | | | | | | |
| | | | | | |
E-Mini S&P 500 Index | | | (295) | | | | 12-18-2020 | | | | (52,744,740 | ) | | | (53,442,200 | ) | | | 0 | | | | (697,460 | ) |
| | | | | | |
Mini-DAX Futures Index | | | (903) | | | | 12-18-2020 | | | | (71,016,557 | ) | | | (71,802,421 | ) | | | 0 | | | | (785,864 | ) |
| | | | | | |
Euro-Bund Futures | | | (529) | | | | 3-8-2021 | | | | (112,149,694 | ) | | | (112,068,785 | ) | | | 80,909 | | | | 0 | |
| | | | | | | | | | | | | | | | | | | | | | | | |
| | | | | | |
| | | | | | | | | | | | | | | | | | $ | 5,531,422 | | | $ | (1,483,324 | ) |
| | | | | | | | | | | | | | | | | | | | | | | | |
The accompanying notes are an integral part of these financial statements.
Wells Fargo Asset Allocation Fund | 9
Portfolio of investments—November 30, 2020 (unaudited)
Investments in Affiliates
An affiliated investment is an investment in which the Fund owns at least 5% of the outstanding voting shares of the issuer or as a result of other relationships, such as the Fund and the issuer having the same investment manager or adviser. Transactions with issuers that were either affiliated persons of the Fund at the beginning of the period or the end of the period were as follows:
| | | | | | | | | | | | | | | | | | | | | | | | | | | | | | | | | | | | |
| | | Values,
beginning of
period | | | Purchases | | | Sales
proceeds | | | Net
realized
gains
(losses) on
affiliated
Underlying
Funds | | | Net
change in
unrealized
gains
(losses) on
affiliated
Underlying
Funds | | | Value,
end of
period | | | % of
net
assets | | | Shares,
end of
period | | | Dividends
from
affiliated
Underlying
Funds | |
| | | | | | | | | |
| Investment Companies | | | | | | | | | | | | | | | | | | | | | | | | | | | |
Affiliated Funds | | | | | | | | | | | | | | | | | | | | | | | | | | | | | | | | | | | | |
Wells Fargo Disciplined U.S. Core Fund Class R6 | | $ | 178,014,521 | | | $ | 26,121,814 | | | $ | (25,024,593 | ) | | $ | 2,608,665 | | | $ | 30,093,472 | | | $ | 211,813,879 | | | | | | | | 10,173,577 | | | $ | 0 | |
Wells Fargo Emerging Markets Equity Fund Class R6 | | | 22,128,708 | | | | 31,471 | | | | (4,481,799 | ) | | | 1,003,712 | | | | 5,275,743 | | | | 23,957,835 | | | | | | | | 760,808 | | | | 0 | |
Wells Fargo Emerging Markets Equity Income Fund
Class R6 | | | 21,561,691 | | | | 472,043 | | | | (3,255,335 | ) | | | 144,749 | | | | 5,095,349 | | | | 24,018,497 | | | | | | | | 2,068,777 | | | | 440,572 | |
| | | | | | | | | | | | | | | | | | | | | | | | | | | | | | | | | | | | |
| | | | | | | | | | | | | | $ | 3,757,126 | | | $ | 40,464,564 | | | $ | 259,790,211 | | | | 14.48 | % | | | | | | $ | 440,572 | |
| | | | | | | | | | | | | | | | | | | | | | | | | | | | | | | | | | | | |
The accompanying notes are an integral part of these financial statements.
10 | Wells Fargo Asset Allocation Fund
Portfolio of investments—November 30, 2020 (unaudited)
Transactions with the affiliated Master Portfolios were as follows:
| | | | | | | | | | | | | | | | | | | | | | | | | | | | | | | | | | | | |
| | | % of
ownership,
beginning
of period | | | % of
ownership,
end of
period | | | Net realized
gains
(losses) on
securities
transactions
allocated
from
affiliated
Master
Portfolios | | | Net
change in
unrealized
gains
(losses) on
securities
transactions
allocated
from
affiliated
Master
Portfolios | | | Interest
allocated
from
affiliated
Master
Portfolios | | | Dividends
allocated
from
affiliated
Master
Portfolios | | | Affiliated
income
allocated
from
affiliated
Master
Portfolios | | | Value,
end
of period | | | % of
net
assets | |
Wells Fargo C&B Large Cap Value Portfolio | | | 17.52 | % | | | 16.37 | % | | $ | 1,693,561 | | | $ | 9,849,926 | | | $ | 0 | | | $ | 485,616 | | | $ | 683 | | | $ | 54,641,270 | | | | | |
Wells Fargo Core Bond Portfolio | | | 1.57 | | | | 1.76 | | |
| 1,784,376
|
| | | 211,038 | | | | 820,524 | | | | 0 | | | | 1,924 | | | | 107,361,305 | | | | | |
Wells Fargo Disciplined International Developed Markets Portfolio | | | 81.81 | | | | 81.89 | | |
| 28,298,722
|
| | | (542,565 | ) | | | 1,563 | | | | 1,570,745 | | | | 222 | | | | 158,160,560 | | | | | |
Wells Fargo Diversified Large Cap Growth Portfolio | | | 70.75 | | | | 71.03 | | |
| 11,846,875
|
| | | 20,666,710 | | | | 0 | | | | 665,229 | | | | 2,148 | | | | 169,266,542 | | | | | |
Wells Fargo Emerging Growth Portfolio | | | 2.63 | | | | 2.40 | | |
| 2,825,015
|
| | | 3,783,449 | | | | 0 | | | | 25,907 | | | | 3,148 | | | | 20,620,718 | | | | | |
Wells Fargo Factor Enhanced Emerging Markets Equity Portfolio | | | 11.03 | | | | 11.87 | | |
| 86,271
|
| |
| 4,145,112
|
| | | 0 | | |
| 341,445
|
| | | 453 | | | | 23,916,906 | | | | | |
Wells Fargo Factor Enhanced International Equity Portfolio | | | 0.00 | | | | 8.54 | | |
| 1,512,813
|
| | | 5,114,927 | | | | 0 | | | | 487,405 | | | | 352 | | | | 58,857,994 | | | | | |
Wells Fargo High Yield Corporate Bond Portfolio* | | | 59.90 | | | | 0.00 | | |
| 353,257
|
| |
| 4,881,968
|
| |
| 2,792,198
|
| | | 0 | | | | 71 | | | | 0 | | | | | |
Wells Fargo International Value Portfolio | | | 20.82 | | | | 39.75 | | |
| (23,842,103
| )
| | | 44,994,453 | | | | 0 | | | | 1,742,289 | | | | 15,788 | | | | 117,291,222 | | | | | |
Wells Fargo Large Company Value Portfolio | | | 76.13 | | | | 76.06 | | |
| 30,601,299
|
| | | 2,197,247 | | | | 127 | | | | 1,760,403 | | | | 904 | | | | 182,266,646 | | | | | |
Wells Fargo Managed Fixed Income Portfolio | | | 82.04 | | | | 82.49 | | |
| 1,845,545
|
| | | 7,028,161 | | | | 5,777,812 | | | | 0 | | | | 5,664 | | | | 383,123,784 | | | | | |
Wells Fargo Real Return Portfolio | | | 35.61 | | | | 27.49 | | |
| (57,085
| )
| | | 2,610,199 | | | | 641,663 | | | | 94,915 | | | | 348 | | | | 59,867,970 | | | | | |
Wells Fargo Small Company Growth Portfolio | | | 1.38 | | | | 1.43 | | |
| 2,481,290
|
| | | 2,654,554 | | | | 0 | | | | 58,343 | | | | 616 | | | | 20,781,130 | | | | | |
Wells Fargo Small Company Value Portfolio | | | 11.31 | | | | 10.95 | | |
| 47,453
|
| | | 11,563,003 | | | | 0 | | | | 490,656 | | | | 3,149 | | | | 50,421,280 | | | | | |
| | | | | | | | | | | | | | | | | | | | | | | | | | | | | | | | | | | | |
| | | | | | | | | | $ | 59,477,289 | | | $ | 119,158,182 | | | $ | 10,033,887 | | | $ | 7,722,953 | | | $ | 35,470 | | | $ | 1,406,577,327 | | | | 78.40 | % |
| | | | | | | | | | | | | | | | | | | | | | | | | | | | | | | | | | | | |
| * | No longer held at the end of the period |
The accompanying notes are an integral part of these financial statements.
Wells Fargo Asset Allocation Fund | 11
Statement of assets and liabilities—November 30, 2020 (unaudited)
| | | | |
| | | | |
| |
Assets | | | | |
Investments in affiliated Master Portfolios, at value (cost $1,186,830,643) | | $ | 1,406,577,327 | |
Investments in affiliated Underlying Funds, at value (cost $214,309,367) | | | 259,790,211 | |
Investments in unaffiliated securities, at value (cost $97,605,461) | | | 102,971,940 | |
Segregated cash for futures contracts | | | 28,634,102 | |
Cash | | | 600,000 | |
Receivable for investments sold | | | 126,473 | |
Receivable for Fund shares sold | | | 525,269 | |
Prepaid expenses and other assets | | | 23,442 | |
| | | | |
Total assets | | | 1,799,248,764 | |
| | | | |
| |
Liabilities | | | | |
Payable for Fund shares redeemed | | | 1,689,946 | |
Payable for daily variation margin on open futures contracts | | | 2,117,238 | |
Overdraft due to custodian bank | | | 126,367 | |
Management fee payable | | | 321,531 | |
Administration fees payable | | | 285,968 | |
Distribution fees payable | | | 40,837 | |
Shareholder servicing fees payable | | | 310,988 | |
Accrued expenses and other liabilities | | | 271,708 | |
| | | | |
Total liabilities | | | 5,164,583 | |
| | | | |
Total net assets | | $ | 1,794,084,181 | |
| | | | |
| |
Net assets consist of | | | | |
Paid-in capital | | $ | 1,472,151,707 | |
Total distributable earnings | | | 321,932,474 | |
| | | | |
Total net assets | | $ | 1,794,084,181 | |
| | | | |
| |
Computation of net asset value and offering price per share | | | | |
Net assets – Class A | | $ | 1,457,289,149 | |
Shares outstanding – Class A1 | | | 93,182,781 | |
Net asset value per share – Class A | | | $15.64 | |
Maximum offering price per share – Class A2 | | | $16.59 | |
Net assets – Class C | | $ | 60,280,776 | |
Shares outstanding – Class C1 | | | 4,025,341 | |
Net asset value per share – Class C | | | $14.98 | |
Net assets – Class R | | $ | 3,291,378 | |
Shares outstanding – Class R1 | | | 211,705 | |
Net asset value per share – Class R | | | $15.55 | |
Net assets – Administrator Class | | $ | 23,037,454 | |
Shares outstanding – Administrator Class1 | | | 1,441,580 | |
Net asset value per share – Administrator Class | | | $15.98 | |
Net assets – Institutional Class | | $ | 250,185,424 | |
Shares outstanding – Institutional Class1 | | | 15,934,840 | |
Net asset value per share – Institutional Class | | | $15.70 | |
| 1 | The Fund has an unlimited number of authorized shares. |
| 2 | Maximum offering price is computed as 100/94.25 of net asset value. On investments of $50,000 or more, the offering price is reduced. |
The accompanying notes are an integral part of these financial statements.
12 | Wells Fargo Asset Allocation Fund
Statement of operations—six months ended November 30, 2020 (unaudited)
| | | | |
| | | | |
| |
Investment income | | | | |
Interest allocated from affiliated Master Portfolios | | $ | 10,033,887 | |
Dividends allocated from affiliated Master Portfolios (net of foreign withholding taxes of $468,527) | | | 7,722,953 | |
Dividend from affiliated Underlying Funds | | | 440,572 | |
Dividends | | | 101,587 | |
Affiliated income allocated from affiliated Master Portfolios | | | 35,470 | |
Expenses allocated from affiliated Master Portfolios | | | (3,819,858 | ) |
Waivers allocated from affiliated Master Portfolios | | | 357,997 | |
| | | | |
Total investment income | | | 14,872,608 | |
| | | | |
| |
Expenses | | | | |
Management fee | | | 2,401,811 | |
Administration fees | | | | |
Class A | | | 1,435,488 | |
Class C | | | 101,870 | |
Class R | | | 4,339 | |
Administrator Class | | | 14,607 | |
Institutional Class | | | 156,709 | |
Shareholder servicing fees | | | | |
Class A | | | 1,706,050 | |
Class C | | | 120,665 | |
Class R | | | 5,009 | |
Administrator Class | | | 27,756 | |
Distribution fees | | | | |
Class C | | | 361,284 | |
Class R | | | 4,961 | |
Custody and accounting fees | | | 39,845 | |
Professional fees | | | 30,861 | |
Registration fees | | | 64,131 | |
Shareholder report expenses | | | 42,692 | |
Trustees’ fees and expenses | | | 9,776 | |
Other fees and expenses | | | 47,214 | |
| | | | |
Total expenses | | | 6,575,068 | |
Less: Fee waivers and/or expense reimbursements | | | | |
Fund-level | | | (968,348 | ) |
Class A | | | (1,351 | ) |
Class C | | | (53 | ) |
Administrator Class | | | (11,603 | ) |
| | | | |
Net expenses | | | 5,593,713 | |
| | | | |
Net investment income | | | 9,278,895 | |
| | | | |
Payment from affiliate | | | 712,806 | |
| | | | |
| |
Realized and unrealized gains (losses) on investments | | | | |
Net realized gains on | | | | |
Securities transactions allocated from affiliated Master Portfolios | | | 59,477,289 | |
Affiliated Underlying Funds | | | 3,757,126 | |
Unaffiliated securities | | | 89,464 | |
Futures contracts | | | 13,810,651 | |
| | | | |
Net realized gains on investments | | | 77,134,530 | |
| | | | |
| |
Net change in unrealized gains (losses) on | | | | |
Securities transactions allocated from affiliated Master Portfolios | | | 119,158,182 | |
Affiliated Underlying Funds | | | 40,464,564 | |
Unaffiliated securities | | | 5,366,479 | |
Futures contracts | | | (6,725,220 | ) |
| | | | |
Net change in unrealized gains (losses) on investments | | | 158,264,005 | |
| | | | |
Net realized and unrealized gains (losses) on investments | | | 235,398,535 | |
| | | | |
Net increase in net assets resulting from operations | | $ | 245,390,236 | |
| | | | |
The accompanying notes are an integral part of these financial statements.
Wells Fargo Asset Allocation Fund | 13
Statement of changes in net assets
| | | | | | | | | | | | | | | | | | | | | | | | |
| | | Six months ended
November 30, 2020
(unaudited) | | | Year ended
May 31, 20201 | | | Year ended
April 30, 2020 | |
| | | | | | |
Operations | | | | | | | | | | | | | | | | | | | | | | | | |
Net investment income | | | | | | $ | 9,278,895 | | | | | | | $ | 1,669,038 | | | | | | | $ | 28,719,641 | |
Payment from affiliate | | | | | | | 712,806 | | | | | | | | 0 | | | | | | | | 0 | |
Net realized gains on investments | | | | | | | 77,134,530 | | | | | | | | 1,279,058 | | | | | | | | 2,140,519 | |
Net change in unrealized gains (losses) on investments | | | | | | | 158,264,005 | | | | | | | | 53,264,308 | | | | | | | | (50,067,897 | ) |
| | | | |
Net increase (decrease) in net assets resulting from operations | | | | | | | 245,390,236 | | | | | | | | 56,212,404 | | | | | | | | (19,207,737 | ) |
| | | | |
| | | | | | |
Distributions to shareholders from net investment income and net realized gains | | | | | | | | | | | | | | | | | | | | | | | | |
Class A | | | | | | | 0 | | | | | | | | 0 | | | | | | | | (21,696,851 | ) |
Class C | | | | | | | 0 | | | | | | | | 0 | | | | | | | | (1,880,323 | ) |
Class R | | | | | | | 0 | | | | | | | | 0 | | | | | | | | (65,870 | ) |
Administrator Class | | | | | | | 0 | | | | | | | | 0 | | | | | | | | (445,651 | ) |
Institutional Class | | | | | | | 0 | | | | | | | | 0 | | | | | | | | (5,062,752 | ) |
| | | | |
Total distributions to shareholders | | | | | | | 0 | | | | | | | | 0 | | | | | | | | (29,151,447 | ) |
| | | | |
| | | | | | |
Capital share transactions | | | Shares | | | | | | | | Shares | | | | | | | | Shares | | | | | |
Proceeds from shares sold | | | | | | | | | | | | | | | | | | | | | | | | |
Class A | | | 4,760,516 | | | | 70,092,760 | | | | 370,617 | | | | 4,834,007 | | | | 6,471,393 | | | | 88,539,900 | |
Class C | | | 123,128 | | | | 1,736,281 | | | | 21,252 | | | | 268,156 | | | | 352,682 | | | | 4,601,983 | |
Class R | | | 13,414 | | | | 192,913 | | | | 5,366 | | | | 70,207 | | | | 76,686 | �� | | | 1,045,391 | |
Administrator Class | | | 35,813 | | | | 529,908 | | | | 2,868 | | | | 37,874 | | | | 82,695 | | | | 1,128,405 | |
Institutional Class | | | 711,062 | | | | 10,399,769 | | | | 117,750 | | | | 1,544,789 | | | | 2,340,394 | | | | 31,989,185 | |
| | | | |
| | | | | | | 82,951,631 | | | | | | | | 6,755,033 | | | | | | | | 127,304,864 | |
| | | | |
Reinvestment of distributions | | | | | | | | | | | | | | | | | | | | | | | | |
Class A | | | 0 | | | | 0 | | | | 0 | | | | 0 | | | | 1,392,639 | | | | 19,726,126 | |
Class C | | | 0 | | | | 0 | | | | 0 | | | | 0 | | | | 109,235 | | | | 1,477,961 | |
Class R | | | 0 | | | | 0 | | | | 0 | | | | 0 | | | | 3,939 | | | | 55,022 | |
Administrator Class | | | 0 | | | | 0 | | | | 0 | | | | 0 | | | | 27,855 | | | | 400,275 | |
Institutional Class | | | 0 | | | | 0 | | | | 0 | | | | 0 | | | | 271,898 | | | | 3,868,327 | |
| | | | |
| | | | | | | 0 | | | | | | | | 0 | | | | | | | | 25,527,711 | |
| | | | |
Payment for shares redeemed | | | | | | | | | | | | | | | | | | | | | | | | |
Class A | | | (6,450,532 | ) | | | (94,032,355 | ) | | | (1,082,884 | ) | | | (14,222,900 | ) | | | (21,422,317 | ) | | | (290,340,362 | ) |
Class C | | | (5,173,574 | ) | | | (73,203,427 | ) | | | (487,279 | ) | | | (6,097,311 | ) | | | (9,169,334 | ) | | | (119,930,791 | ) |
Class R | | | (122,309 | ) | | | (1,764,566 | ) | | | (152 | ) | | | (1,986 | ) | | | (335,021 | ) | | | (4,480,311 | ) |
Administrator Class | | | (166,725 | ) | | | (2,476,751 | ) | | | (34,639 | ) | | | (464,546 | ) | | | (820,004 | ) | | | (11,202,765 | ) |
Institutional Class | | | (1,803,170 | ) | | | (26,316,483 | ) | | | (404,103 | ) | | | (5,323,366 | ) | | | (8,379,750 | ) | | | (112,607,902 | ) |
| | | | |
| | | | | | | (197,793,582 | ) | | | | | | | (26,110,109 | ) | | | | | | | (538,562,131 | ) |
| | | | |
Net decrease in net assets resulting from capital share transactions | | | | | | | (114,841,951 | ) | | | | | | | (19,355,076 | ) | | | | | | | (385,729,556 | ) |
| | | | |
Total increase (decrease) in net assets | | | | | | | 130,548,285 | | | | | | | | 36,857,328 | | | | | | | | (434,088,740 | ) |
| | | | |
| | | | |
Net assets | | | | | | | | | | | | | | | | |
Beginning of period | | | | | | | 1,663,535,896 | | | | | | | | 1,626,678,568 | | | | | | | | 2,060,767,308 | |
| | | | |
End of period | | | | | | $ | 1,794,084,181 | | | | | | | $ | 1,663,535,896 | | | | | | | $ | 1,626,678,568 | |
| | | | |
| 1�� | For the one month ended May 31, 2020. The Fund changed its fiscal year end from April 30 to May 31, effective May 31, 2020. |
The accompanying notes are an integral part of these financial statements.
14 | Wells Fargo Asset Allocation Fund
Financial highlights
(For a share outstanding throughout each period)
| | | | | | | | | | | | | | | | | | | | | | | | | | | | |
| | | Six months ended
November 30, 2020
(unaudited) | | | Year ended
May 31, 20201 | | | Year ended April 30 | |
| CLASS A | | 2020 | | | 2019 | | | 2018 | | | 2017 | | | 2016 | |
Net asset value, beginning of period | | | $13.57 | | | | $13.12 | | | | $13.49 | | | | $14.33 | | | | $13.62 | | | | $12.71 | | | | $14.10 | |
Net investment income (loss) | | | 0.08 | 2 | | | 0.02 | | | | 0.21 | 2 | | | 0.15 | 2 | | | (0.12 | ) | | | (0.09 | ) | | | (0.11 | ) |
Payment from affiliate | | | 0.00 | 3 | | | 0.00 | | | | 0.00 | | | | 0.00 | | | | 0.00 | | | | 0.00 | | | | 0.00 | |
Net realized and unrealized gains (losses) on investments | | | 1.99 | | | | 0.43 | | | | (0.36 | ) | | | 0.04 | | | | 1.08 | | | | 1.20 | | | | (0.72 | ) |
| | | | | | | | | | | | | | | | | | | | | | | | | | | | |
Total from investment operations | | | 2.07 | | | | 0.45 | | | | (0.15 | ) | | | 0.19 | | | | 0.96 | | | | 1.11 | | | | (0.83 | ) |
Distributions to shareholders from | | | | | | | | | | | | | | | | | | | | | | | | | | | | |
Net investment income | | | 0.00 | | | | 0.00 | | | | (0.06 | ) | | | (0.06 | ) | | | (0.25 | ) | | | (0.20 | ) | | | (0.37 | ) |
Net realized gains | | | 0.00 | | | | 0.00 | | | | (0.16 | ) | | | (0.97 | ) | | | 0.00 | | | | 0.00 | | | | (0.19 | ) |
| | | | | | | | | | | | | | | | | | | | | | | | | | | | |
Total distributions to shareholders | | | 0.00 | | | | 0.00 | | | | (0.22 | ) | | | (1.03 | ) | | | (0.25 | ) | | | (0.20 | ) | | | (0.56 | ) |
Net asset value, end of period | | | $15.64 | | | | $13.57 | | | | $13.12 | | | | $13.49 | | | | $14.33 | | | | $13.62 | | | | $12.71 | |
Total return4 | | | 15.18 | %5 | | | 3.43 | % | | | (1.26 | )% | | | 1.96 | % | | | 7.01 | % | | | 8.86 | % | | | (5.78 | )% |
Ratios to average net assets (annualized) | | | | | | | | | | | | | | | | | | | | | | | | | | | | |
Gross expenses | | | 1.16 | %6 | | | 1.21 | %6 | | | 1.22 | %6 | | | 1.18 | %6,7 | | | 0.82 | %7 | | | 0.80 | %7 | | | 0.82 | %7 |
Net expenses | | | 1.05 | %6 | | | 1.05 | %6 | | | 1.05 | %6 | | | 1.04 | %6,7 | | | 0.82 | %7 | | | 0.80 | %7 | | | 0.82 | %7 |
Net investment income (loss) | | | 1.06 | %6 | | | 1.22 | %6 | | | 1.54 | %6 | | | 1.08 | %6,7 | | | (0.82 | )%7 | | | (0.80 | )%7 | | | (0.82 | )%7 |
Supplemental data | | | | | | | | | | | | | | | | | | | | | | | | | | | | |
Portfolio turnover rate | | | 68 | %8 | | | 13 | %8 | | | 109 | %8 | | | 189 | %8 | | | 0 | %9 | | | 0 | %9 | | | 1 | %9 |
Net assets, end of period (000s omitted) | | | $1,457,289 | | | | $1,287,856 | | | | $1,253,699 | | | | $1,472,484 | | | | $1,348,107 | | | | $1,413,776 | | | | $1,578,517 | |
| 1 | For the one month ended May 31, 2020. The Fund changed its fiscal year end from April 30 to May 31, effective May 31, 2020. |
| 2 | Calculated based upon average shares outstanding |
| 3 | Amount is less than $0.005. |
| 4 | Total return calculations do not include any sales charges. Returns for periods of less than one year are not annualized. |
| 5 | During the six months ended November 30, 2020, the Fund received a payment from an affiliate that had an impact of less than 0.005% on total return. See Note 4 in the Notes to Financial Statements for additional information. |
| 6 | Ratios include only the net expenses allocated from the affiliated Master Portfolios and do not include expenses from any other affiliated Underlying Funds. Net expenses allocated from the affiliated Master Portfolios included in the ratios were as follows: |
| | | | |
Six months ended November 30, 2020 (unaudited) | | | 0.40 | % |
Year ended May 31, 20201 | | | 0.45 | % |
Year ended April 30, 2020 | | | 0.45 | % |
Year ended April 30, 2019 | | | 0.40 | % |
| 7 | Ratios did not include any expenses from Asset Allocation Trust or its investments in underlying funds. Asset Allocation Trust did not have any net expenses. |
| 8 | Portfolio turnover rate is calculated by multiplying the Fund’s ownership percentage in the respective affiliated Master Portfolio by the corresponding affiliated Master Portfolio’s purchases and sales. These purchases and sales amounts are aggregated with the direct purchases and sales in the affiliated Underlying Funds and unaffiliated securities and included in the portfolio turnover calculation. |
| 9 | Portfolio turnover rate represents the purchase and sales of the Fund’s investment in Asset Allocation Trust and not the underlying investment transactions of Asset Allocation Trust. |
The accompanying notes are an integral part of these financial statements.
Wells Fargo Asset Allocation Fund | 15
Financial highlights
(For a share outstanding throughout each period)
| | | | | | | | | | | | | | | | | | | | | | | | | | | | |
| | | Six months ended
November 30, 2020
(unaudited) | | | Year ended
May 31, 20201 | | | Year ended April 30 | |
| CLASS C | | 2020 | | | 2019 | | | 2018 | | | 2017 | | | 2016 | |
Net asset value, beginning of period | | | $13.01 | | | | $12.58 | | | | $12.99 | | | | $13.87 | | | | $13.17 | | | | $12.28 | | | | $13.61 | |
Net investment income (loss) | | | 0.02 | 2 | | | 0.01 | 2 | | | 0.11 | 2 | | | 0.03 | 2 | | | (0.22 | )2 | | | (0.19 | )2 | | | (0.20 | )2 |
Payment from affiliate | | | 0.13 | | | | 0.00 | | | | 0.00 | | | | 0.00 | | | | 0.00 | | | | 0.00 | | | | 0.00 | |
Net realized and unrealized gains (losses) on investments | | | 1.82 | | | | 0.42 | | | | (0.36 | ) | | | 0.06 | | | | 1.03 | | | | 1.18 | | | | (0.69 | ) |
| | | | | | | | | | | | | | | | | | | | | | | | | | | | |
Total from investment operations | | | 1.97 | | | | 0.43 | | | | (0.25 | ) | | | 0.09 | | | | 0.81 | | | | 0.99 | | | | (0.89 | ) |
Distributions to shareholders from | | | | | | | | | | | | | | | | | | | | | | | | | | | | |
Net investment income | | | 0.00 | | | | 0.00 | | | | 0.00 | | | | 0.00 | | | | (0.11 | ) | | | (0.10 | ) | | | (0.25 | ) |
Net realized gains | | | 0.00 | | | | 0.00 | | | | (0.16 | ) | | | (0.97 | ) | | | 0.00 | | | | 0.00 | | | | (0.19 | ) |
| | | | | | | | | | | | | | | | | | | | | | | | | | | | |
Total distributions to shareholders | | | 0.00 | | | | 0.00 | | | | (0.16 | ) | | | (0.97 | ) | | | (0.11 | ) | | | (0.10 | ) | | | (0.44 | ) |
Net asset value, end of period | | | $14.98 | | | | $13.01 | | | | $12.58 | | | | $12.99 | | | | $13.87 | | | | $13.17 | | | | $12.28 | |
Total return3 | | | 15.14 | %4 | | | 3.42 | % | | | (2.02 | )% | | | 1.21 | % | | | 6.16 | % | | | 8.08 | % | | | (6.48 | )% |
Ratios to average net assets (annualized) | | | | | | | | | | | | | | | | | | | | | | | | | |
Gross expenses | | | 1.91 | %5 | | | 1.96 | %5 | | | 1.97 | %5 | | | 1.92 | %5,6 | | | 1.57 | %6 | | | 1.55 | %6 | | | 1.57 | %6 |
Net expenses | | | 1.80 | %5 | | | 1.79 | %5 | | | 1.80 | %5 | | | 1.78 | %5,6 | | | 1.57 | %6 | | | 1.55 | %6 | | | 1.57 | %6 |
Net investment income (loss) | | | 0.34 | %5 | | | 0.47 | %5 | | | 0.82 | %5 | | | 0.23 | %5,6 | | | (1.57 | )%6 | | | (1.55 | )%6 | | | (1.57 | )%6 |
Supplemental data | | | | | | | | | | | | | | | | | | | | | | | | | | | | |
Portfolio turnover rate | | | 68 | %7 | | | 13 | %7 | | | 109 | %7 | | | 189 | %7 | | | 0 | %8 | | | 0 | %8 | | | 1 | %8 |
Net assets, end of period (000s omitted) | | | $60,281 | | | | $118,081 | | | | $120,029 | | | | $237,096 | | | | $905,336 | | | | $1,232,098 | | | | $1,561,695 | |
| 1 | For the one month ended May 31, 2020. The Fund changed its fiscal year end from April 30 to May 31, effective May 31, 2020. |
| 2 | Calculated based upon average shares outstanding |
| 3 | Total return calculations do not include any sales charges. Returns for periods of less than one year are not annualized. |
| 4 | During the six months ended November 30, 2020, the Fund received a payment from an affiliate which had a 1.01% impact on the total return. See Note 4 in the Notes to Financial Statements for additional information. |
| 5 | Ratios include only the net expenses allocated from the affiliated Master Portfolios and do not include expenses from any other affiliated Underlying Funds. Net expenses allocated from the affiliated Master Portfolios included in the ratios were as follows: |
| | | | |
Six months ended November 30, 2020 (unaudited) | | | 0.40 | % |
Year ended May 31, 20201 | | | 0.44 | % |
Year ended April 30, 2020 | | | 0.45 | % |
Year ended April 30, 2019 | | | 0.38 | % |
| 6 | Ratios do not include any expenses from Asset Allocation Trust. Asset Allocation Trust does not have any net expenses. |
| 7 | Portfolio turnover rate is calculated by multiplying the Fund’s ownership percentage in the respective affiliated Master Portfolio by the corresponding affiliated Master Portfolio’s purchases and sales. These purchases and sales amounts are aggregated with the direct purchases and sales in the affiliated Underlying Funds and unaffiliated securities and included in the portfolio turnover calculation. |
| 8 | Portfolio turnover rate represents the purchase and sales of the Fund’s investment in Asset Allocation Trust and not the underlying investment transactions of Asset Allocation Trust. |
The accompanying notes are an integral part of these financial statements.
16 | Wells Fargo Asset Allocation Fund
Financial highlights
(For a share outstanding throughout each period)
| | | | | | | | | | | | | | | | | | | | | | | | | | | | |
| | | Six months ended
November 30, 2020
(unaudited) | | | Year ended
May 31, 20201 | | | Year ended April 30 | |
| CLASS R | | 2020 | | | 2019 | | | 2018 | | | 2017 | | | 2016 | |
Net asset value, beginning of period | | | $13.47 | | | | $13.02 | | | | $13.37 | | | | $14.20 | | | | $13.49 | | | | $12.58 | | | | $13.95 | |
Net investment income (loss) | | | 0.06 | 2 | | | 0.01 | 2 | | | 0.18 | 2 | | | 0.11 | 2 | | | (0.15 | )2 | | | (0.13 | )2 | | | (0.14 | )2 |
Payment from affiliate | | | 0.06 | | | | 0.00 | | | | 0.00 | | | | 0.00 | | | | 0.00 | | | | 0.00 | | | | 0.00 | |
Net realized and unrealized gains (losses) on investments | | | 1.96 | | | | 0.44 | | | | (0.37 | ) | | | 0.05 | | | | 1.05 | | | | 1.21 | | | | (0.71 | ) |
| | | | | | | | | | | | | | | | | | | | | | | | | | | | |
Total from investment operations | | | 2.08 | | | | 0.45 | | | | 0.19 | | | | 0.16 | | | | 0.90 | | | | 1.08 | | | | (0.85 | ) |
Distributions to shareholders from | | | | | | | | | | | | | | | | | | | | | | | | | | | | |
Net investment income | | | 0.00 | | | | 0.00 | | | | 0.00 | | | | (0.02 | ) | | | (0.19 | ) | | | (0.17 | ) | | | (0.33 | ) |
Net realized gains | | | 0.00 | | | | 0.00 | | | | (0.16 | ) | | | (0.97 | ) | | | 0.00 | | | | 0.00 | | | | (0.19 | ) |
| | | | | | | | | | | | | | | | | | | | | | | | | | | | |
Total distributions to shareholders | | | 0.00 | | | | 0.00 | | | | (0.16 | ) | | | (0.99 | ) | | | (0.19 | ) | | | (0.17 | ) | | | (0.52 | ) |
Net asset value, end of period | | | $15.55 | | | | $13.47 | | | | $13.02 | | | | $13.37 | | | | $14.20 | | | | $13.49 | | | | $12.58 | |
Total return3 | | | 15.59 | %4 | | | 3.46 | % | | | (1.51 | )% | | | 1.73 | % | | | 6.70 | % | | | 8.64 | % | | | (6.02 | )% |
Ratios to average net assets (annualized) | | | | | | | | | | | | | | | | | | | | | | | | | | | | |
Gross expenses | | | 1.40 | %5 | | | 1.44 | %5 | | | 1.47 | %5 | | | 1.42 | %5,6 | | | 1.06 | %6 | | | 1.05 | %6 | | | 1.06 | %6 |
Net expenses | | | 1.29 | %5 | | | 1.27 | %5 | | | 1.30 | %5 | | | 1.29 | %5,6 | | | 1.06 | %6 | | | 1.05 | %6 | | | 1.06 | %6 |
Net investment income (loss) | | | 0.84 | %5 | | | 0.99 | %5 | | | 1.32 | %5 | | | 0.77 | %5,6 | | | (1.06 | )%6 | | | (1.05 | )%6 | | | (1.06 | )%6 |
Supplemental data | | | | | | | | | | | | | | | | | | | | | | | | | | | | |
Portfolio turnover rate | | | 68 | %7 | | | 13 | %7 | | | 109 | %7 | | | 189 | %7 | | | 0 | %8 | | | 0 | %8 | | | 1 | %8 |
Net assets, end of period (000s omitted) | | | $3,291 | | | | $4,318 | | | | $4,106 | | | | $7,619 | | | | $15,658 | | | | $20,244 | | | | $24,122 | |
| 1 | For the one month ended May 31, 2020. The Fund changed its fiscal year end from April 30 to May 31, effective May 31, 2020. |
| 2 | Calculated based upon average shares outstanding |
| 3 | Returns for periods of less than one year are not annualized. |
| 4 | During the six months ended November 30, 2020, the Fund received a payment from an affiliate which had a 0.47% impact on the total return. See Note 4 in the Notes to Financial Statements for additional information. |
| 5 | Ratios include only the net expenses allocated from the affiliated Master Portfolios and do not include expenses from any other affiliated Underlying Funds. Net expenses allocated from the affiliated Master Portfolios included in the ratios were as follows: |
| | | | |
Six months ended November 30, 2020 (unaudited) | | | 0.40 | % |
Year ended May 31, 20201 | | | 0.45 | % |
Year ended April 30, 2020 | | | 0.45 | % |
Year ended April 30, 2019 | | | 0.39 | % |
| 6 | Ratios do not include any expenses from Asset Allocation Trust. Asset Allocation Trust does not have any net expenses. |
| 7 | Portfolio turnover rate is calculated by multiplying the Fund’s ownership percentage in the respective affiliated Master Portfolio by the corresponding affiliated Master Portfolio’s purchases and sales. These purchases and sales amounts are aggregated with the direct purchases and sales in the affiliated Underlying Funds and unaffiliated securities and included in the portfolio turnover calculation. |
| 8 | Portfolio turnover rate represents the purchase and sales of the Fund’s investment in Asset Allocation Trust and not the underlying investment transactions of Asset Allocation Trust. |
The accompanying notes are an integral part of these financial statements.
Wells Fargo Asset Allocation Fund | 17
Financial highlights
(For a share outstanding throughout each period)
| | | | | | | | | | | | | | | | | | | | | | | | | | | | |
| | | Six months ended
November 30, 2020
(unaudited) | | | Year ended
May 31, 20201 | | | Year ended April 30 | |
| ADMINISTRATOR CLASS | | 2020 | | | 2019 | | | 2018 | | | 2017 | | | 2016 | |
Net asset value, beginning of period | | | $13.75 | | | | $13.29 | | | | $13.66 | | | | $14.49 | | | | $13.78 | | | | $12.84 | | | | $14.23 | |
Net investment income (loss) | | | 0.09 | 2 | | | 0.02 | 2 | | | 0.24 | 2 | | | 0.16 | 2 | | | (0.09 | )2 | | | (0.08 | )2 | | | (0.09 | )2 |
Payment from affiliate | | | 0.12 | | | | 0.00 | | | | 0.00 | | | | 0.00 | | | | 0.00 | | | | 0.00 | | | | 0.00 | |
Net realized and unrealized gains (losses) on investments | | | 2.02 | | | | 0.44 | | | | (0.37 | ) | | | 0.06 | | | | 1.07 | | | | 1.24 | | | | (0.73 | ) |
| | | | | | | | | | | | | | | | | | | | | | | | | | | | |
Total from investment operations | | | 2.23 | | | | 0.46 | | | | (0.13 | ) | | | 0.22 | | | | 0.98 | | | | 1.16 | | | | (0.82 | ) |
Distributions to shareholders from | | | | | | | | | | | | | | | | | | | | | | | | | | | | |
Net investment income | | | 0.00 | | | | 0.00 | | | | (0.08 | ) | | | (0.08 | ) | | | (0.27 | ) | | | (0.22 | ) | | | (0.38 | ) |
Net realized gains | | | 0.00 | | | | 0.00 | | | | (0.16 | ) | | | (0.97 | ) | | | 0.00 | | | | 0.00 | | | | (0.19 | ) |
| | | | | | | | | | | | | | | | | | | | | | | | | | | | |
Total distributions to shareholders | | | 0.00 | | | | 0.00 | | | | (0.24 | ) | | | (1.05 | ) | | | (0.27 | ) | | | (0.22 | ) | | | (0.57 | ) |
Net asset value, end of period | | | $15.98 | | | | $13.75 | | | | $13.29 | | | | $13.66 | | | | $14.49 | | | | $13.78 | | | | $12.84 | |
Total return3 | | | 16.22 | %4 | | | 3.46 | % | | | (1.08 | )% | | | 2.18 | % | | | 7.10 | % | | | 9.14 | % | | | (5.69 | )% |
Ratios to average net assets (annualized) | | | | | | | | | | | | | | | | | | | | | | | | | | | | |
Gross expenses | | | 1.08 | %5 | | | 1.13 | %5 | | | 1.14 | %5 | | | 1.08 | %5,6 | | | 0.73 | %6 | | | 0.72 | %6 | | | 0.71 | %6 |
Net expenses | | | 0.87 | %5 | | | 0.86 | %5 | | | 0.86 | %5 | | | 0.86 | %5,6 | | | 0.64 | %6 | | | 0.64 | %6 | | | 0.64 | %6 |
Net investment income (loss) | | | 1.25 | %5 | | | 1.40 | %5 | | | 1.74 | %5 | | | 1.17 | %5,6 | | | (0.64 | )%6 | | | (0.64 | )%6 | | | (0.64 | )%6 |
Supplemental data | | | | | | | | | | | | | | | | | | | | | | | | | | | | |
Portfolio turnover rate | | | 68 | %7 | | | 13 | %7 | | | 109 | %7 | | | 189 | %7 | | | 0 | %8 | | | 0 | %8 | | | 1 | %8 |
Net assets, end of period (000s omitted) | | | $23,037 | | | | $21,628 | | | | $21,316 | | | | $31,610 | | | | $69,607 | | | | $92,600 | | | | $157,303 | |
| 1 | For the one month ended May 31, 2020. The Fund changed its fiscal year end from April 30 to May 31, effective May 31, 2020. |
| 2 | Calculated based upon average shares outstanding |
| 3 | Returns for periods of less than one year are not annualized. |
| 4 | During the six months ended November 30, 2020, the Fund received a payment from an affiliate which had a 0.87% impact on the total return. See Note 4 in the Notes to Financial Statements for additional information. |
| 5 | Ratios include only the net expenses allocated from the affiliated Master Portfolios and do not include expenses from any other affiliated Underlying Funds. Net expenses allocated from the affiliated Master Portfolios included in the ratios were as follows: |
| | | | |
Six months ended November 30, 2020 (unaudited) | | | 0.40 | % |
Year ended May 31, 20201 | | | 0.45 | % |
Year ended April 30, 2020 | | | 0.44 | % |
Year ended April 30, 2019 | | | 0.38 | % |
| 6 | Ratios did not include any expenses from Asset Allocation Trust or its investments in underlying funds. Asset Allocation Trust did not have any net expenses. |
| 7 | Portfolio turnover rate is calculated by multiplying the Fund’s ownership percentage in the respective affiliated Master Portfolio by the corresponding affiliated Master Portfolio’s purchases and sales. These purchases and sales amounts are aggregated with the direct purchases and sales in the affiliated Underlying Funds and unaffiliated securities and included in the portfolio turnover calculation. |
| 8 | Portfolio turnover rate represents the purchase and sales of the Fund’s investment in Asset Allocation Trust and not the underlying investment transactions of Asset Allocation Trust. |
The accompanying notes are an integral part of these financial statements.
18 | Wells Fargo Asset Allocation Fund
Financial highlights
(For a share outstanding throughout each period)
| | | | | | | | | | | | | | | | | | | | | | | | | | | | |
| | | Six months ended
November 30, 2020
(unaudited) | | | Year ended
May 31, 20201 | | | Year ended April 30 | |
| INSTITUTIONAL CLASS | | 2020 | | | 2019 | | | 2018 | | | 2017 | | | 2016 | |
Net asset value, beginning of period | | | $13.61 | | | | $13.14 | | | | $13.52 | | | | $14.36 | | | | $13.66 | | | | $12.74 | | | | $14.15 | |
Net investment income (loss) | | | 0.11 | | | | 0.02 | | | | 0.26 | 2 | | | 0.19 | 2 | | | (0.06 | )2 | | | (0.06 | )2 | | | (0.06 | )2 |
Net realized and unrealized gains (losses) on investments | | | 1.98 | | | | 0.45 | | | | (0.38 | ) | | | 0.05 | | | | 1.06 | | | | 1.23 | | | | (0.72 | ) |
| | | | | | | | | | | | | | | | | | | | | | | | | | | | |
Total from investment operations | | | 2.09 | | | | 0.47 | | | | (0.12 | ) | | | 0.24 | | | | 1.00 | | | | 1.17 | | | | (0.78 | ) |
Distributions to shareholders from | | | | | | | | | | | | | | | | | | | | | | | | | | | | |
Net investment income | | | 0.00 | | | | 0.00 | | | | (0.10 | ) | | | (0.11 | ) | | | (0.30 | ) | | | (0.25 | ) | | | (0.44 | ) |
Net realized gains | | | 0.00 | | | | 0.00 | | | | (0.16 | ) | | | (0.97 | ) | | | 0.00 | | | | 0.00 | | | | (0.19 | ) |
| | | | | | | | | | | | | | | | | | | | | | | | | | | | |
Total distributions to shareholders | | | 0.00 | | | | 0.00 | | | | (0.26 | ) | | | (1.08 | ) | | | (0.30 | ) | | | (0.25 | ) | | | (0.63 | ) |
Net asset value, end of period | | | $15.70 | | | | $13.61 | | | | $13.14 | | | | $13.52 | | | | $14.36 | | | | $13.66 | | | | $12.74 | |
Total return3 | | | 15.36 | % | | | 3.58 | % | | | (1.01 | )% | | | 2.39 | % | | | 7.33 | % | | | 9.34 | % | | | (5.44 | )% |
Ratios to average net assets (annualized) | | | | | | | | | | | | | | | | | | | | | | | | | |
Gross expenses | | | 0.83 | %4 | | | 0.88 | %4 | | | 0.89 | %4 | | | 0.84 | %4,5 | | | 0.49 | %5 | | | 0.47 | %5 | | | 0.47 | %5 |
Net expenses | | | 0.72 | %4 | | | 0.72 | %4 | | | 0.72 | %4 | | | 0.69 | %4,5 | | | 0.44 | %5 | | | 0.44 | %5 | | | 0.44 | %5 |
Net investment income (loss) | | | 1.39 | %4 | | | 1.55 | %4 | | | 1.88 | %4 | | | 1.34 | %4,5 | | | (0.44 | )%5 | | | (0.44 | )%5 | | | (0.44 | )%5 |
Supplemental data | | | | | | | | | | | | | | | | | | | | | | | | | | | | |
Portfolio turnover rate | | | 68 | %6 | | | 13 | %6 | | | 109 | %6 | | | 189 | %6 | | | 0 | %7 | | | 0 | %7 | | | 1 | %7 |
Net assets, end of period (000s omitted) | | | $250,185 | | | | $231,652 | | | | $227,529 | | | | $311,958 | | | | $572,803 | | | | $672,544 | | | | $787,484 | |
| 1 | For the one month ended May 31, 2020. The Fund changed its fiscal year end from April 30 to May 31, effective May 30, 2020. |
| 2 | Calculated based upon average shares outstanding |
| 3 | Returns for periods of less than one year are not annualized. |
| 4 | Ratios include only the net expenses allocated from the affiliated Master Portfolios and do not include expenses from any other affiliated Underlying Funds. Net expenses allocated from the affiliated Master Portfolios included in the ratios were as follows: |
| | | | |
Six months ended November 30, 2020 (unaudited) | | | 0.40 | % |
Year ended May 31, 20201 | | | 0.45 | % |
Year ended April 30, 2020 | | | 0.45 | % |
Year ended April 30, 2019 | | | 0.38 | % |
| 5 | Ratios did not include any expenses from Asset Allocation Trust or its investments in underlying funds. Asset Allocation Trust did not have any net expenses. |
| 6 | Portfolio turnover rate is calculated by multiplying the Fund’s ownership percentage in the respective affiliated Master Portfolio by the corresponding affiliated Master Portfolio’s purchases and sales. These purchases and sales amounts are aggregated with the direct purchases and sales in the affiliated Underlying Funds and unaffiliated securities and included in the portfolio turnover calculation. |
| 7 | Portfolio turnover rate represents the purchase and sales of the Fund’s investment in Asset Allocation Trust and not the underlying investment transactions of Asset Allocation Trust. |
The accompanying notes are an integral part of these financial statements.
Wells Fargo Asset Allocation Fund | 19
Notes to financial statements (unaudited)
1. ORGANIZATION
Wells Fargo Fund Trust (the “Trust”), a Delaware statutory trust organized on March 10, 1999, is an open-end management investment company registered under the Investment Company Act of 1940, as amended (the “1940 Act”). As an investment company, the Trust follows the accounting and reporting guidance in Financial Accounting Standards Board (“FASB”) Accounting Standards Codification Topic 946, Financial Services – Investment Companies. These financial statements report on the Wells Fargo Asset Allocation Fund (the “Fund”) which is a diversified series of the Trust.
The Fund is a fund-of-funds that invests in various affiliated mutual funds (“Underlying Funds”) employing a multi-asset, multi-style investment approach designed to reduce the price and return volatility of the Fund and to provide more consistent returns. The Fund may also invest directly in securities. The Underlying Funds incur separate expenses in seeking to achieve their investment objectives. Investments in affiliated Underlying Funds may also include investments in one or more separate diversified portfolios (collectively, the “affiliated Master Portfolios”) of Wells Fargo Master Trust, a registered open-end management investment company. Each affiliated Master Portfolio directly acquires portfolio securities and the Fund acquires an indirect interest in those securities. The Fund accounts for its investments in the affiliated Master Portfolios as partnership investments and records on a daily basis its share of the affiliated Master Portfolio’s income, expense and realized and unrealized gains and losses. The financial statements of the affiliated Master Portfolios are presented in separate financial statements and may be obtained free of charge by contacting Investor Services or by visiting the SEC website at sec.gov. The financial statements of the affiliated Master Portfolios are filed with the SEC under Wells Fargo Master Trust. The financial statements for all other affiliated Underlying Funds are also publicly available on the SEC website at sec.gov.
2. SIGNIFICANT ACCOUNTING POLICIES
The following significant accounting policies, which are consistently followed in the preparation of the financial statements of the Fund, are in conformity with U.S. generally accepted accounting principles which require management to make estimates and assumptions that affect the reported amounts of assets and liabilities, disclosure of contingent assets and liabilities at the date of the financial statements, and the reported amounts of revenues and expenses during the reporting period. Actual results could differ from those estimates.
Securities valuation
All investments are valued each business day as of the close of regular trading on the New York Stock Exchange (generally 4 p.m. Eastern Time), although the Fund may deviate from this calculation time under unusual or unexpected circumstances.
Investments in the affiliated Master Portfolios are valued daily based on the Fund’s proportionate share of each affiliated Master Portfolio’s net assets, which are also valued daily.
Investments in underlying mutual funds are valued at net asset per share as reported by the Underlying Funds as of the close of the regular trading on the New York Stock Exchange on each day the exchange is open for trading.
Equity securities and futures contracts that are listed on a foreign or domestic exchange or market are valued at the official closing price or, if none, the last sales price. If no sale occurs on the principal exchange or market that day, a fair value price will be determined in accordance with the Fund’s Valuation Procedures.
Debt securities are valued at the evaluated bid price provided by an independent pricing service (e.g. taking into account various factors, including yields, maturities, or credit ratings) or, if a reliable price is not available, the quoted bid price from an independent broker-dealer.
Investments which are not valued using any of the methods discussed above are valued at their fair value, as determined in good faith by the Board of Trustees of the Fund. The Board of Trustees has established a Valuation Committee comprised of the Trustees and has delegated to it the authority to take any actions regarding the valuation of portfolio securities that the Valuation Committee deems necessary or appropriate, including determining the fair value of portfolio securities, unless the determination has been delegated to the Wells Fargo Asset Management Pricing Committee at Wells Fargo Funds Management, LLC (“Funds Management”). The Board of Trustees retains the authority to make or ratify any valuation decisions or approve any changes to the Valuation Procedures as it deems appropriate. On a quarterly basis, the Board of Trustees receives reports on any valuation actions taken by the Valuation Committee or the Wells Fargo Asset Management Pricing Committee which may include items for ratification.
Futures contracts
Futures contracts are agreements between the Fund and a counterparty to buy or sell a specific amount of a commodity, financial instrument or currency at a specified price and on a specified date. The Fund may buy and sell futures contracts in order to gain exposure to, or protect against, changes in interest rates, security values and foreign exchange rates and is subject
20 | Wells Fargo Asset Allocation Fund
Notes to financial statements (unaudited)
to interest rate risk, equity price risk, and foreign currency risk. The primary risks associated with the use of futures contracts are the imperfect correlation between changes in market values of securities held by the Fund and the prices of futures contracts, and the possibility of an illiquid market. Futures contracts are generally entered into on a regulated futures exchange and cleared through a clearinghouse associated with the exchange. With futures contracts, there is minimal counterparty risk to the Fund since futures contracts are exchange traded and the exchange’s clearinghouse, as the counterparty to all exchange traded futures, guarantees the futures contracts against default.
Upon entering into a futures contracts, the Fund is required to deposit either cash or securities (initial margin) with the broker in an amount equal to a certain percentage of the contract value. Subsequent payments (variation margin) are paid to or from the broker each day equal to the daily changes in the contract value. Such payments are recorded as unrealized gains or losses and, if any, shown as variation margin receivable (payable) in the Statement of Assets and Liabilities. Should the Fund fail to make requested variation margin payments, the broker can gain access to the initial margin to satisfy the Fund’s payment obligations. When the contracts are closed, a realized gain or loss is recorded in the Statement of Operations.
Investment transactions, income and expenses
Investments in the affiliated Master Portfolios are recorded on a trade basis. The Fund records daily its proportionate share of each affiliated Master Portfolio’s income, expenses, and realized and unrealized gains or losses. The Fund also accrues its own expenses.
Securities transactions are recorded on a trade date basis. Realized gains or losses are recorded on the basis of identified cost.
Income dividends and capital gain distributions from investment companies are recorded on the ex-dividend date. Capital gain distributions from investment companies are treated as realized gains.
Distributions to shareholders
Distributions to shareholders from net investment income and any net realized gains are recorded on the ex-dividend date and paid at least annually. Such distributions are determined in accordance with income tax regulations and may differ from U.S. generally accepted accounting principles. Dividend sources are estimated at the time of declaration. The tax character of distributions is determined as of the Fund’s fiscal year end. Therefore, a portion of the Fund’s distributions made prior to the Fund’s fiscal year end may be categorized as a tax return of capital at year end.
Federal and other taxes
The Fund intends to continue to qualify as a regulated investment company by distributing substantially all of its investment company taxable income and any net realized capital gains (after reduction for capital loss carryforwards) sufficient to relieve it from all, or substantially all, federal income taxes. Accordingly, no provision for federal income taxes was required.
The Fund’s income and federal excise tax returns and all financial records supporting those returns for the prior three fiscal years are subject to examination by the federal and Delaware revenue authorities. Management has analyzed the Fund’s tax positions taken on federal, state, and foreign tax returns for all open tax years and does not believe that there are any uncertain tax positions that require recognition of a tax liability.
As of November 30, 2020, the aggregate cost of all investments for federal income tax purposes was $1,498,746,627 and the unrealized gains (losses) consisted of:
| | | | |
| |
Gross unrealized gains | | $ | 276,124,273 | |
| |
Gross unrealized losses | | | (1,483,324 | ) |
| |
Net unrealized gains | | $ | 274,640,949 | |
Capital loss carryforwards available to offset future net realized capital gains were as follows:
| | | | | | | | |
| | |
| | | Short-term | | | Long-term | |
| | |
For the period from May 1, 2020 to May 31, 2020 | | $ | (24,218,326 | ) | | $ | (8,518,149 | ) |
| | |
Year ended April 30, 2020 | | | (29,338,312 | ) | | | 0 | |
Class allocations
The separate classes of shares offered by the Fund differ principally in applicable sales charges, distribution, shareholder servicing, and administration fees. Class specific expenses are charged directly to that share class. Investment income, common fund-level expenses, and realized and unrealized gains (losses) on investments are allocated daily to each class of shares based on the relative proportion of net assets of each class.
Wells Fargo Asset Allocation Fund | 21
Notes to financial statements (unaudited)
3. FAIR VALUATION MEASUREMENTS
Fair value measurements of investments are determined within a framework that has established a fair value hierarchy based upon the various data inputs utilized in determining the value of the Fund’s investments. The three-level hierarchy gives the highest priority to unadjusted quoted prices in active markets for identical assets or liabilities (Level 1) and the lowest priority to unobservable inputs (Level 3). The Fund’s investments are classified within the fair value hierarchy based on the lowest level of input that is significant to the fair value measurement. The inputs are summarized into three broad levels as follows:
| ∎ | | Level 1 – quoted prices in active markets for identical securities |
| ∎ | | Level 2 – other significant observable inputs (including quoted prices for similar securities, interest rates, prepayment speeds, credit risk, etc.) |
| ∎ | | Level 3 – significant unobservable inputs (including the Fund’s own assumptions in determining the fair value of investments) |
The inputs or methodologies used for valuing investments in securities are not necessarily an indication of the risk associated with investing in those securities.
The following is a summary of the inputs used in valuing the Fund’s assets and liabilities as of November 30, 2020:
| | | | | | | | | | | | | | | | |
| | | | |
| | | Quoted prices
(Level 1) | | | Other significant
observable inputs
(Level 2) | | | Significant
unobservable inputs (Level 3) | | | Total | |
| | | | |
Assets | | | | | | | | | | | | | | | | |
Investments in: | | | | | | | | | | | | | | | | |
| | | | |
Exchange-traded funds | | $ | 102,971,940 | | | $ | 0 | | | $ | 0 | | | $ | 102,971,940 | |
| | | | |
Investment companies | | | 259,790,211 | | | | 0 | | | | 0 | | | | 259,790,211 | |
| | | | |
Investments measured at net asset value* | | | | | | | | | | | | | | | 1,406,577,327 | |
| | | | |
| | | 362,762,151 | | | | 0 | | | | 0 | | | | 1,769,339,478 | |
| | | | |
Futures contracts | | | 5,531,422 | | | | 0 | | | | 0 | | | | 5,531,422 | |
| | | | |
Total assets | | $ | 368,293,573 | | | $ | 0 | | | $ | 0 | | | $ | 1,774,870,900 | |
| | | | |
Liabilities | | | | | | | | | | | | | | | | |
| | | | |
Futures contracts | | $ | 1,483,324 | | | $ | 0 | | | $ | 0 | | | $ | 1,483,324 | |
| | | | |
Total liabilities | | $ | 1,483,324 | | | $ | 0 | | | $ | 0 | | | $ | 1,483,324 | |
| * | Investments that are measured at fair value using the net asset value per share (or its equivalent) as a practical expedient have not been categorized in the fair value hierarchy. The fair value amount presented in the table is intended to permit reconciliation of the fair value hierarchy to the amounts presented in the Statement of Assets and Liabilities. The Fund’s investment in affiliated Master Portfolios are valued at $1,406,577,327. Each affiliated Master Portfolio does not have a redemption period notice, can be redeemed daily and does not have any unfunded commitments. |
Futures contracts are reported at their cumulative unrealized gains (losses) at measurement date as reported in the table following the Portfolio of Investments. For futures contracts, the current day’s variation margin is reported on the Statement of Assets and Liabilities. All other assets and liabilities are reported at their market value at measurement date.
For the six months ended November 30, 2020, the Fund did not have any transfers into/out of Level 3.
22 | Wells Fargo Asset Allocation Fund
Notes to financial statements (unaudited)
The investment objective of each affiliated Master Portfolio is as follows:
| | |
| |
| Affiliated Master Portfolio | | Investment objective |
| |
Wells Fargo C&B Large Cap Value Portfolio | | Seeks maximum long-term total return (current income and capital appreciation), consistent with minimizing risk to principal |
| |
Wells Fargo Core Bond Portfolio | | Seeks total return, consisting of income and capital appreciation |
| |
Wells Fargo Disciplined International Developed Markets Portfolio | | Seeks long-term capital appreciation |
| |
Wells Fargo Diversified Large Cap Growth Portfolio | | Seeks long-term capital appreciation |
| |
Wells Fargo Emerging Growth Portfolio | | Seeks long-term capital appreciation |
| |
Wells Fargo Factor Enhanced Emerging Markets Equity Portfolio | | Seeks long-term capital appreciation |
| |
Wells Fargo Factor Enhanced International Equity Portfolio | | Seeks long-term capital appreciation |
| |
Wells Fargo International Value Portfolio | | Seeks long-term capital appreciation |
| |
Wells Fargo Large Company Value Portfolio | | Seeks long-term capital appreciation |
| |
Wells Fargo Managed Fixed Income Portfolio | | Seeks consistent fixed-income returns |
| |
Wells Fargo Real Return Portfolio | | Seeks returns that exceed the rate of inflation over the long-term |
| |
Wells Fargo Small Company Growth Portfolio | | Seeks long-term capital appreciation |
| |
Wells Fargo Small Company Value Portfolio | | Seeks long-term capital appreciation |
4. TRANSACTIONS WITH AFFILIATES
Funds Management, an indirect wholly owned subsidiary of Wells Fargo & Company (“Wells Fargo”), is the manager of the Fund and provides advisory and fund-level administrative services under an investment management agreement. Under the investment management agreement, Funds Management is responsible for, among other services, implementing the investment objectives and strategies of the Fund, supervising the subadviser and providing fund-level administrative services in connection with the Fund’s operations. As compensation for its services under the investment management agreement, Funds Management is entitled to receive a management fee at the following annual rate based on the Fund’s average daily net assets:
| | | | |
| |
| Average daily net assets | | Management fee | |
| |
First $500 million | | | 0.30 | % |
| |
Next $500 million | | | 0.28 | |
| |
Next $2 billion | | | 0.26 | |
| |
Next $2 billion | | | 0.24 | |
| |
Next $5 billion | | | 0.23 | |
| |
Over $10 billion | | | 0.22 | |
For the six months ended November 30, 2020, the management fee was equivalent to an annual rate of 0.28% of the Fund’s average daily net assets.
Funds Management also serves as the adviser to the affiliated Master Portfolio and is entitled to receive a fee from the affiliated Master Portfolio for those services.
Funds Management has retained the services of a subadviser to provide daily portfolio management to the Fund. The fee for subadvisory services is borne by Funds Management. Wells Capital Management Incorporated, an affiliate of Funds Management and an indirect wholly owned subsidiary of Wells Fargo, is the subadviser to the Fund and is entitled to receive a fee from Funds Management at an annual rate starting at 0.10% and declining to 0.05% as the average daily net assets of the Fund increase.
Wells Fargo Asset Allocation Fund | 23
Notes to financial statements (unaudited)
Administration fees
Under a class-level administration agreement, Funds Management provides class-level administrative services to the Fund, which includes paying fees and expenses for services provided by the transfer agent, sub-transfer agents, omnibus account servicers and record-keepers. As compensation for its services under the class-level administration agreement, Funds Management receives an annual fee which is calculated based on the average daily net assets of each class as follows:
| | | | |
| |
| | | Class-level
administration fee | |
| |
Class A, Class C, Class R | | | 0.21 | % |
| |
Administrator Class , Institutional Class | | | 0.13 | |
Waivers and/or expense reimbursements
Funds Management has contractually waived and/or reimbursed management and administration fees to the extent necessary to maintain certain net operating expense ratios for the Fund. When each class of the Fund has exceeded its expense cap, Funds Management has waived fees and/or reimbursed expenses from fund-level expenses on a proportionate basis and then from class specific expenses. When only certain classes exceed their expense caps, waivers and/or reimbursements are applied against class specific expenses before fund-level expenses. Funds Management has committed through August 31, 2021 to waive fees and/or reimburse expenses to the extent necessary to cap the Fund’s expenses at 1.13% for Class A shares, 1.88% for Class C shares, 1.38% for Class R shares, 0.95% for Administrator Class shares, and 0.80% for Institutional Class shares. Prior to or after the commitment expiration date, the cap may be increased or the commitment to maintain the cap may be terminated only with the approval of the Board of Trustees.
Distribution fees
The Trust has adopted a distribution plan for Class C and Class R shares of the Fund pursuant to Rule 12b-1 under the 1940 Act. Distribution fees are charged to Class C and Class R shares and paid to Wells Fargo Funds Distributor, LLC (“Funds Distributor”), the principal underwriter, at an annual rate of 0.75% of the average daily net assets of Class C shares and 0.25% of the average daily net assets of Class R shares.
In addition, Funds Distributor is entitled to receive the front-end sales charge from the purchase of Class A shares and a contingent deferred sales charge on the redemption of certain Class A shares. Funds Distributor is also entitled to receive the contingent deferred sales charges from redemptions of Class C shares. For the six months ended November 30, 2020, Funds Distributor received $8,883 from the sale of Class A shares. No contingent deferred sales charges were incurred by Class A and Class C shares for the six months ended November 30, 2020.
Shareholder servicing fees
The Trust has entered into contracts with one or more shareholder servicing agents, whereby Class A, Class C, Class R, and Administrator Class of the Fund are charged a fee at an annual rate of 0.25% of the average daily net assets of each respective class. A portion of these total shareholder servicing fees were paid to affiliates of Wells Fargo.
Other transactions
On August 14, 2020, Class A, Class C, Class R, and Administration Class of the Fund were reimbursed by Funds Management in the amount of $2,100, $525,311, $13,410 and $171,985, respectively. The reimbursements were made in connection with resolving certain fee reimbursements.
5. INVESTMENT PORTFOLIO TRANSACTIONS
The Fund seeks to achieve its investment objective by investing in multiple affiliated Master Portfolios. Purchases and sales related to these investments have been calculated by aggregating the results of multiplying the Fund’s ownership percentage in the respective affiliated Master Portfolio by the corresponding affiliated Master Portfolio’s purchases and sales. Purchases and sales of Underlying Funds and unaffiliated securities in which the Fund invests are actual purchases and sale of those investments. Purchases and sales of investments, excluding short-term securities, for the six months ended November 30, 2020 were as follows:
| | | | | | |
Purchases at cost | | Sales proceeds |
U.S. government | | Non-U.S. government | | U.S. government | | Non-U.S. government |
| $276,464,135 | | $866,840,700 | | $235,775,829 | | $1,065,494,942 |
24 | Wells Fargo Asset Allocation Fund
Notes to financial statements (unaudited)
6. DERIVATIVE TRANSACTIONS
During the six months ended November 30, 2020 the Fund entered into futures contracts to gain market exposure to certain asset classes consistent with its asset allocation strategy. The Fund had an average notional amount of $124,821,545 in long futures contracts and $116,703,062 in short futures contracts during the six months ended November 30, 2020.
A summary of the location of derivative instruments on the financial statements by primary risk exposure is outlined in the following tables.
The fair value of derivative instruments as of November 30, 2020 by risk type was as follows for the Fund:
| | | | | | | | | | | | |
| | | Asset derivatives | | | Liability derivatives | |
| | | | |
| | | Statement of Assets and
Liabilities location | | Fair value | | | Statement of Assets and
Liabilities location | | Fair value | |
| | | | |
Equity contracts | | Unrealized gains on futures contracts | | $ | 4,940,206 | * | | Unrealized losses on futures contracts | | $ | 1,483,324 | * |
| | | | |
Foreign currency risk | | Unrealized gains on futures contracts | | | 284,274 | * | | Unrealized losses on futures contracts | | | 0 | * |
| | | | |
Interest risk | | Unrealized gains on futures contracts | | | 306,942 | * | | Unrealized losses on futures contracts | | | 0 | * |
| | | |
| | | $ | 5,531,422 | | | | | $ | 1,483,324 | |
| * | Amount represents cumulative unrealized gains (losses) as reported in the table following the Portfolio of Investments. Only the current day’s variation margin as of November 30, 2020 is reported separately on the Statement of Assets and Liabilities. |
The effect of derivative instruments on the Statement of Operations for the six months ended November 30, 2020 was as follows for the Fund:
| | | | | | | | |
| | |
| | | Amount of realized
gains (losses) on
derivatives | | | Change in unrealized
gains (losses) on
derivatives | |
| | |
Equity risk | | $ | 17,229,060 | | | $ | (8,055,139 | ) |
| | |
Foreign currency risk | | | (4,256,183 | ) | | | 1,022,977 | |
| | |
Interest risk | | | 837,774 | | | | 306,942 | |
| | |
| | | | 13,810,651 | | | | (6,725,220 | ) |
7. BANK BORROWINGS
The Trust (excluding the money market funds), Wells Fargo Master Trust and Wells Fargo Variable Trust are parties to a $350,000,000 revolving credit agreement whereby the Fund is permitted to use bank borrowings for temporary or emergency purposes, such as to fund shareholder redemption requests. Interest under the credit agreement is charged to the Fund based on a borrowing rate equal to the higher of the Federal Funds rate in effect on that day plus 1.25% or the overnight LIBOR rate in effect on that day plus 1.25%. In addition, an annual commitment fee equal to 0.25% of the unused balance is allocated to each participating fund.
For the six months ended November 30, 2020, there were no borrowings by the Fund under the agreement.
8. INDEMNIFICATION
Under the Fund’s organizational documents, the officers and Trustees have been granted certain indemnification rights against certain liabilities that may arise out of performance of their duties to the Fund. The Fund has entered into a separate agreement with each Trustee that converts indemnification rights currently existing under the Fund’s organizational documents into contractual rights that cannot be changed in the future without the consent of the Trustee. Additionally, in the normal course of business, the Fund may enter into contracts with service providers that contain a variety of indemnification clauses. The Fund’s maximum exposure under these arrangements is dependent on future claims that may be made against the Fund and, therefore, cannot be estimated.
Wells Fargo Asset Allocation Fund | 25
Notes to financial statements (unaudited)
9. NEW ACCOUNTING PRONOUNCEMENT
In August 2018, FASB issued Accounting Standards Update (“ASU”) No. 2018-13, Fair Value Measurement (Topic 820) Disclosure Framework—Changes to the Disclosure Requirements for Fair Value Measurement. ASU 2018-13 updates the disclosure requirements on fair value measurements in Topic 820, Fair Value Measurements. The amendments are effective for fiscal years, and interim periods within those fiscal years, beginning after December 15, 2019. Management has adopted this guidance which did not have a material impact on the financial statements.
10. CORONAVIRUS (COVID-19) PANDEMIC
On March 11, 2020, the World Health Organization announced that it had made the assessment that coronavirus disease 2019 (“COVID-19”) is a pandemic. The impacts of COVID-19 are adversely affecting the entire global economy, individual companies and investment products, and the market in general. There is significant uncertainty around the extent and duration of business disruptions related to COVID-19 and the impacts may be short term or may last for an extended period of time. The risk of further spreading of COVID-19 has led to significant uncertainty and volatility in the financial markets.
26 | Wells Fargo Asset Allocation Fund
Other information (unaudited)
PROXY VOTING INFORMATION
A description of the policies and procedures used to determine how to vote proxies relating to portfolio securities is available, upon request, by calling 1-800-222-8222, visiting our website at wfam.com, or visiting the SEC website at sec.gov. Information regarding how the proxies related to portfolio securities were voted during the most recent 12-month period ended June 30 is available on the website at wfam.com or by visiting the SEC website at sec.gov.
QUARTERLY PORTFOLIO HOLDINGS INFORMATION
The Fund files its complete schedule of portfolio holdings with the SEC for the first and third quarters of each fiscal year as an exhibit to its reports on Form N-PORT. Shareholders may view the filed Form N-PORT by visiting the SEC website at sec.gov.
Wells Fargo Asset Allocation Fund | 27
Other information (unaudited)
BOARD OF TRUSTEES AND OFFICERS
Each of the Trustees and Officers1 listed in the table below acts in identical capacities for each fund in the Wells Fargo family of funds, which consists of 144 mutual funds comprising the Wells Fargo Funds Trust, Wells Fargo Variable Trust, Wells Fargo Master Trust and four closed-end funds (collectively the “Fund Complex”). This table should be read in conjunction with the Prospectus and the Statement of Additional Information2. The mailing address of each Trustee and Officer is 525 Market Street, 12th Floor, San Francisco, CA 94105. Each Trustee and Officer serves an indefinite term, however, each Trustee serves such term until reaching the mandatory retirement age established by the Trustees.
Independent Trustees
| | | | | | |
Name and year of birth | | Position held and
length of service* | | Principal occupations during past five years or longer | | Current other
public company or
investment
company
directorships |
| | | |
William R. Ebsworth
(Born 1957) | | Trustee, since 2015 | | Retired. From 1984 to 2013, equities analyst, portfolio manager, research director and chief investment officer at Fidelity Management and Research Company in Boston, Tokyo, and Hong Kong, and retired in 2013 as Chief Investment Officer of Fidelity Strategic Advisers, Inc. where he led a team of investment professionals managing client assets. Prior thereto, Board member of Hong Kong Securities Clearing Co., Hong Kong Options Clearing Corp., the Thailand International Fund, Ltd., Fidelity Investments Life Insurance Company, and Empire Fidelity Investments Life Insurance Company. Audit Committee Chair and Investment Committee Chair of the Vincent Memorial Hospital Endowment (non-profit organization). Mr. Ebsworth is a CFA® charterholder. | | N/A |
| | | |
Jane A. Freeman
(Born 1953) | | Trustee, since 2015; Chair Liaison, since 2018 | | Retired. From 2012 to 2014 and 1999 to 2008, Chief Financial Officer of Scientific Learning Corporation. From 2008 to 2012, Ms. Freeman provided consulting services related to strategic business projects. Prior to 1999, Portfolio Manager at Rockefeller & Co. and Scudder, Stevens & Clark. Board member of the Harding Loevner Funds from 1996 to 2014, serving as both Lead Independent Director and chair of the Audit Committee. Board member of the Russell Exchange Traded Funds Trust from 2011 to 2012 and the chair of the Audit Committee. Ms. Freeman is also an inactive Chartered Financial Analyst. | | N/A |
| | | |
Isaiah Harris, Jr.
(Born 1952) | | Trustee, since 2009; Audit Committee Chair, since 2019 | | Retired. Chairman of the Board of CIGNA Corporation since 2009, and Director since 2005. From 2003 to 2011, Director of Deluxe Corporation. Prior thereto, President and CEO of BellSouth Advertising and Publishing Corp. from 2005 to 2007, President and CEO of BellSouth Enterprises from 2004 to 2005 and President of BellSouth Consumer Services from 2000 to 2003. Emeritus member of the Iowa State University Foundation Board of Governors. Emeritus Member of the Advisory Board of Iowa State University School of Business. Advisory Board Member, Palm Harbor Academy (private school). Mr. Harris is a certified public accountant (inactive status). | | CIGNA Corporation |
| | | |
Judith M. Johnson
(Born 1949) | | Trustee, since 2008 | | Retired. Prior thereto, Chief Executive Officer and Chief Investment Officer of Minneapolis Employees Retirement Fund from 1996 to 2008. Ms. Johnson is an attorney, certified public accountant and a certified managerial accountant. | | N/A |
| | | |
David F. Larcker
(Born 1950) | | Trustee, since 2009 | | James Irvin Miller Professor of Accounting at the Graduate School of Business (Emeritus), Stanford University, Director of the Corporate Governance Research Initiative and Senior Faculty of The Rock Center for Corporate Governance since 2006. From 2005 to 2008, Professor of Accounting at the Graduate School of Business, Stanford University. Prior thereto, Ernst & Young Professor of Accounting at The Wharton School, University of Pennsylvania from 1985 to 2005. | | N/A |
28 | Wells Fargo Asset Allocation Fund
Other information (unaudited)
| | | | | | |
Name and year of birth | | Position held and
length of service* | | Principal occupations during past five years or longer | | Current other
public company or
investment
company
directorships |
| | | |
Olivia S. Mitchell
(Born 1953) | | Trustee, since 2006; Nominating and Governance Committee Chair, since 2018 | | International Foundation of Employee Benefit Plans Professor, Wharton School of the University of Pennsylvania since 1993. Director of Wharton’s Pension Research Council and Boettner Center on Pensions & Retirement Research, and Research Associate at the National Bureau of Economic Research. Previously, Cornell University Professor from 1978 to 1993. | | N/A |
| | | |
Timothy J. Penny
(Born 1951) | | Trustee, since 1996; Chair, since 2018 | | President and Chief Executive Officer of Southern Minnesota Initiative Foundation, a non-profit organization, since 2007. Member of the Board of Trustees of NorthStar Education Finance, Inc., a non-profit organization, since 2007. | | N/A |
| | | |
James G. Polisson
(Born 1959) | | Trustee,
since 2018 | | Retired. Chief Marketing Officer, Source (ETF) UK Services, Ltd, from 2015 to 2017. From 2012 to 2015, Principal of The Polisson Group, LLC, a management consulting, corporate advisory and principal investing company. Chief Executive Officer and Managing Director at Russell Investments, Global Exchange Traded Funds from 2010 to 2012. Managing Director of Barclays Global Investors from 1998 to 2010 and Global Chief Marketing Officer for iShares and Barclays Global Investors from 2000 to 2010. Trustee of the San Francisco Mechanics’ Institute, a non-profit organization, from 2013 to 2015. Board member of the Russell Exchange Traded Fund Trust from 2011 to 2012. Director of Barclays Global Investors Holdings Deutschland GmbH from 2006 to 2009. Mr. Polisson is an attorney and has a retired status with the Massachusetts and District of Columbia Bar Associations. | | N/A |
| | | |
Pamela Wheelock
(Born 1959) | | Trustee, since January 2020; previously Trustee from January 2018 to July 2019 | | Board member of the Destination Medical Center Economic Development Agency, Rochester, Minnesota since 2019. Interim President of the McKnight Foundation from January to September 2020. Acting Commissioner, Minnesota Department of Human Services, July 2019 through September 2019. Human Services Manager (part-time), Minnesota Department of Human Services, October 2019 through December 2019. Chief Operating Officer, Twin Cities Habitat for Humanity from 2017 to 2019. Vice President of University Services, University of Minnesota from 2012 to 2016. Prior thereto, on the Board of Directors, Governance Committee and Finance Committee for the Minnesota Philanthropy Partners (Saint Paul Foundation) from 2012 to 2018, Interim Chief Executive Officer of Blue Cross Blue Shield of Minnesota from 2011 to 2012, Chairman of the Board from 2009 to 2012 and Board Director from 2003 to 2015. Vice President, Leadership and Community Engagement, Bush Foundation, Saint Paul, Minnesota (a private foundation) from 2009 to 2011. Executive Vice President and Chief Financial Officer, Minnesota Sports and Entertainment from 2004 to 2009 and Senior Vice President from 2002 to 2004. Executive Vice President of the Minnesota Wild Foundation from 2004 to 2008. Commissioner of Finance, State of Minnesota, from 1999 to 2002. Currently Board Chair of the Minnesota Wild Foundation since 2010. | | N/A |
| * | Length of service dates reflect the Trustee’s commencement of service with the Trust’s predecessor entities, where applicable. |
Wells Fargo Asset Allocation Fund | 29
Other information (unaudited)
Officers
| | | | |
Name and year of birth | | Position held and
length of service | | Principal occupations during past five years or longer |
| | |
Andrew Owen
(Born 1960) | | President, since 2017 | | Executive Vice President of Wells Fargo & Company and Head of Affiliated Managers, Wells Fargo Asset Management, since 2014. In addition, Mr. Owen is currently President, Chief Executive Officer and Director of Wells Fargo Funds Management, LLC since 2017. Prior thereto, Executive Vice President responsible for marketing, investments and product development for Wells Fargo Funds Management, LLC, from 2009 to 2014. |
| | |
Jeremy DePalma1
(Born 1974) | | Treasurer, since 2012 | | Senior Vice President of Wells Fargo Funds Management, LLC since 2009. Senior Vice President of Evergreen Investment Management Company, LLC from 2008 to 2010 and head of the Fund Reporting and Control Team within Fund Administration from 2005 to 2010. |
| | |
Michelle Rhee
(Born 1966) | | Chief Legal Officer, since 2019 | | Secretary of Wells Fargo Funds Management, LLC and Chief Legal Counsel of Wells Fargo Asset Management since 2018. Deputy General Counsel of Wells Fargo Bank, N.A. since 2020 and Assistant General Counsel of Wells Fargo Bank, N.A. from 2018 to 2020. Associate General Counsel and Managing Director of Bank of America Corporation from 2004 to 2018. |
| | |
Catherine Kennedy
(Born 1969) | | Secretary, since 2019 | | Vice President of Wells Fargo Funds Management, LLC and Senior Counsel of the Wells Fargo Legal Department since 2010. Vice President and Senior Counsel of Evergreen Investment Management Company, LLC from 1998 to 2010. |
| | |
Michael H. Whitaker
(Born 1967) | | Chief Compliance Officer,
since 2016 | | Chief Compliance Officer of Wells Fargo Asset Management since 2016. Senior Vice President and Chief Compliance Officer for Fidelity Investments from 2007 to 2016. |
| 1 | Jeremy DePalma acts as Treasurer of 77 funds in the Fund Complex. |
| 2 | The Statement of Additional Information includes additional information about the Trustees and is available, without charge, upon request, by calling 1-800-222-8222 or by visiting the website at wfam.com. |
30 | Wells Fargo Asset Allocation Fund
Other information (unaudited)
BOARD CONSIDERATION OF INVESTMENT MANAGEMENT AND SUB-ADVISORY AGREEMENTS:
Wells Fargo Asset Allocation Fund
Under the Investment Company Act of 1940 (the “1940 Act”), the Board of Trustees (the “Board”) of Wells Fargo Funds Trust (the “Trust”) must determine annually whether to approve the continuation of the Trust’s investment management and sub-advisory agreements. In this regard, at a Board meeting held on May 26, 2020 and May 28, 2020 (together, the “Meeting”), the Board, all the members of which have no direct or indirect interest in the investment management and sub-advisory agreements and are not “interested persons” of the Trust, as defined in the 1940 Act (the “Independent Trustees”), reviewed and approved for Wells Fargo Asset Allocation Fund (the “Fund”): (i) an investment management agreement (the “Management Agreement”) with Wells Fargo Funds Management, LLC (“Funds Management”); and (ii) an investment sub-advisory agreement (the “Sub-Advisory Agreement”) with Wells Capital Management Incorporated (the “Sub-Adviser”), an affiliate of Funds Management. The Management Agreement and the Sub-Advisory Agreement are collectively referred to as the “Advisory Agreements.”
At the Meeting, the Board considered the factors and reached the conclusions described below relating to the selection of Funds Management and the Sub-Adviser and the approval of the Advisory Agreements. Prior to the Meeting, including at a Board meeting held in April 2020, the Trustees conferred extensively among themselves and with representatives of Funds Management about these matters. Also, the Board has adopted a team-based approach, with each team consisting of a sub-set of Trustees, to assist the full Board in the discharge of its duties in reviewing investment performance and other matters throughout the year. The Independent Trustees were assisted in their evaluation of the Advisory Agreements by independent legal counsel, from whom they received separate legal advice and with whom they met separately.
In providing information to the Board, Funds Management and the Sub-Adviser were guided by a detailed set of requests for information submitted to them by independent legal counsel on behalf of the Independent Trustees at the start of the Board’s annual contract renewal process earlier in 2020. In considering and approving the Advisory Agreements, the Trustees considered the information they believed relevant, including but not limited to the information discussed below. The Board considered not only the specific information presented in connection with the Meeting, but also the knowledge gained over time through interaction with Funds Management and the Sub-Adviser about various topics. In this regard, the Board reviewed reports of Funds Management at each of its quarterly meetings, which included, among other things, portfolio reviews and investment performance reports. In addition, the Board and the teams mentioned above confer with portfolio managers at various times throughout the year. The Board did not identify any particular information or consideration that was all-important or controlling, and each individual Trustee may have attributed different weights to various factors.
After its deliberations, the Board unanimously approved the continuation of the Advisory Agreements for a one-year term and determined that the compensation payable to Funds Management and the Sub-Adviser under each of the Advisory Agreements was reasonable. The Board considered the approval of the Advisory Agreements for the Fund as part of its consideration of agreements for funds across the complex, but its approvals were made on a fund-by-fund basis. The following summarizes a number of important, but not necessarily all, factors considered by the Board in support of its approvals.
Nature, Extent and Quality of Services
The Board received and considered various information regarding the nature, extent and quality of services provided to the Fund by Funds Management and the Sub-Adviser under the Advisory Agreements. This information included a description of the investment advisory services and Fund-level administrative services covered by the Management Agreement, as well as, among other things, a summary of the background and experience of senior management of Wells Fargo Asset Management (“WFAM”), of which Funds Management and the Sub-Adviser are a part, and a summary of investments made in the business of WFAM. The Board also received a description of Funds Management’s and the Sub-Adviser’s business continuity plans and of their approaches to data privacy and cybersecurity, and related testing. The Board also received and reviewed information about Funds Management’s role as administrator of the Fund’s liquidity risk management program, Funds Management’s approach to risk management, and Funds Management’s intermediary and vendor oversight program.
The Board also considered the qualifications, background, tenure and responsibilities of each of the portfolio managers primarily responsible for the day-to-day portfolio management of the Fund. The Board evaluated the ability of Funds Management and the Sub-Adviser to attract and retain qualified investment professionals, including research, advisory and supervisory personnel. The Board further considered the compliance programs and compliance records of Funds Management and the Sub-Adviser. In addition, the Board took into account the full range of services provided to the Fund by Funds Management and its affiliates.
Wells Fargo Asset Allocation Fund | 31
Other information (unaudited)
Fund Investment Performance and Expenses
The Board considered the investment performance results for the Fund over various time periods ended December 31, 2019. The Board also considered more current results for various time periods ended March 31, 2020. The Board considered these results in comparison to the investment performance of funds in a universe that was determined by Broadridge Inc. (“Broadridge”) to be similar to the Fund (the “Universe”), and in comparison to the Fund’s benchmark index and to other comparative data. Broadridge is an independent provider of investment company data. The Board received a description of the methodology used by Broadridge to select the mutual funds in the performance Universe. The Board noted that the investment performance of the Fund (Administrator Class) was lower than the average investment performance of the Universe for the one-, three-, five- and ten-year periods ended December 31, 2019. The Board also noted that the investment performance of the Fund (Administrator Class) was lower than the average investment performance of the Universe for the three-, five- and ten-year periods ended March 31, 2020, but higher than the average investment performance of the Universe for the one-year period ended March 31, 2020. The Board also noted that the investment performance of the Fund was lower than its benchmark index, the Asset Allocation Blended Index, for all periods ended December 31, 2019. The Board also noted that the investment performance of the Fund was lower than its benchmark index, the Asset Allocation Blended Index, for all periods ended March 31, 2020.
The Board received information concerning, and discussed factors contributing to, the underperformance of the Fund relative to the Universe and benchmark for the periods identified above. The Board took note of the explanations for the relative underperformance during these periods, including with respect to investment decisions and market factors that affected the Fund’s investment performance.
The Board also received and considered information regarding the Fund’s net operating expense ratios and their various components, including actual management fees, custodian and other non-management fees, and Rule 12b-1 and non-Rule 12b-1 shareholder service fees. The Board considered these ratios in comparison to the median ratios of funds in class-specific expense groups that were determined by Broadridge to be similar to the Fund (the “Groups”). The Board received a description of the methodology used by Broadridge to select the mutual funds in the expense Groups and an explanation of how funds comprising expense groups and their expense ratios may vary from year-to-year. Based on the Broadridge reports, the Board noted that the net operating expense ratios of the Fund were lower than, equal to or in range of the median net operating expense ratios of the expense Groups for each share class.
The Board took into account the Fund’s investment performance and expense information provided to it among the factors considered in deciding to re-approve the Advisory Agreements.
Investment Management and Sub-Advisory Fee Rates
The Board reviewed and considered the contractual fee rates payable by the Fund to Funds Management under the Management Agreement, as well as the contractual fee rates payable by the Fund to Funds Management for class-level administrative services under a Class-Level Administration Agreement, which include, among other things, class-level transfer agency and sub-transfer agency costs (collectively, the “Management Rates”). The Board also reviewed and considered the contractual investment sub-advisory fee rates that are payable by Funds Management to the Sub-Adviser for investment sub-advisory services.
Among other information reviewed by the Board was a comparison of the Fund’s Management Rates with the average contractual investment management fee rates of funds in the expense Groups at a common asset level as well as transfer agency costs of the funds in the expense Groups. The Board noted that the Management Rates of the Fund were higher than the sum of these average rates for the Fund’s expense Groups for all share classes. However, the Board noted that the net operating expense ratios of the Fund were lower than, equal to or in range of the median net operating expense ratios of the expense Groups for all share classes. The Board also noted that the Fund’s expense caps for all share classes were lowered in 2018.
The Board also received and considered information about the portion of the total management fee that was retained by Funds Management after payment of the fee to the Sub-Adviser for sub-advisory services. In assessing the reasonableness of this amount, the Board received and evaluated information about the nature and extent of responsibilities retained and risks assumed by Funds Management and not delegated to or assumed by the Sub-Adviser, and about Funds Management’s on-going oversight services. Given the affiliation between Funds Management and the Sub-Adviser, the Board ascribed limited relevance to the allocation of fees between them.
The Board also received and considered information about the nature and extent of services offered and fee rates charged by Funds Management and the Sub-Adviser to other types of clients with investment strategies similar to those of the Fund. In this regard, the Board received information about the significantly greater scope of services, and compliance, reporting and
32 | Wells Fargo Asset Allocation Fund
Other information (unaudited)
other legal burdens and risks of managing proprietary mutual funds compared with those associated with managing assets of other types of clients, including third-party sub-advised fund clients and non-mutual fund clients such as institutional separate accounts.
Based on its consideration of the factors and information it deemed relevant, including those described here, the Board determined that the compensation payable to Funds Management under the Management Agreement and to the Sub-Adviser under the Sub-Advisory Agreement was reasonable.
Profitability
The Board received and considered information concerning the profitability of Funds Management, as well as the profitability of both WFAM and Wells Fargo & Co. (“Wells Fargo”) from providing services to the fund family as a whole. The Board noted that the Sub-Adviser’s profitability information with respect to providing services to the Fund and other funds in the family was subsumed in the WFAM and Wells Fargo profitability analysis.
Funds Management reported on the methodologies and estimates used in calculating profitability, including a description of the methodology used to allocate certain expenses. Among other things, the Board noted that the levels of profitability reported on a fund-by-fund basis varied widely, depending on factors such as the size, type and age of fund.
Based on its review, the Board did not deem the profits reported by Funds Management, WFAM or Wells Fargo from services provided to the Fund to be at a level that would prevent it from approving the continuation of the Advisory Agreements.
Economies of Scale
The Board received and considered information about the potential for Funds Management to experience economies of scale in the provision of management services to the Fund, the difficulties of calculating economies of scale at an individual fund level, and the extent to which potential scale benefits are shared with shareholders. The Board noted the existence of breakpoints in the Fund’s management fee structure, which operate generally to reduce the Fund’s expense ratios as the Fund grows in size, and the size of the Fund in relation to such breakpoints. The Board considered that in addition to management fee breakpoints, Funds Management shares potential economies of scale from its management business in a variety of ways, including through fee waiver and expense reimbursement arrangements, services that benefit shareholders, competitive management fee rates set at the outset without regard to breakpoints, and investments in the business intended to enhance services available to shareholders.
The Board concluded that Funds Management’s arrangements with respect to the Fund, including contractual breakpoints, constituted a reasonable approach to sharing potential economies of scale with the Fund and its shareholders.
Other Benefits to Funds Management and the Sub-Adviser
The Board received and considered information regarding potential “fall-out” or ancillary benefits received by Funds Management and its affiliates, including the Sub-Adviser, as a result of their relationships with the Fund. Ancillary benefits could include, among others, benefits directly attributable to other relationships with the Fund and benefits potentially derived from an increase in Funds Management’s and the Sub-Adviser’s business as a result of their relationships with the Fund. The Board noted that various affiliates of Funds Management may receive distribution-related fees, shareholder servicing payments and sub-transfer agency fees in respect of shares sold or held through them and services provided.
The Board also reviewed information about soft dollar credits earned and utilized by the Sub-Adviser, fees earned by Funds Management and the Sub-Adviser from managing a private investment vehicle for the fund family’s securities lending collateral, and commissions earned by an affiliated broker from portfolio transactions.
Based on its consideration of the factors and information it deemed relevant, including those described here, the Board did not find that any ancillary benefits received by Funds Management and its affiliates, including the Sub-Adviser, were unreasonable.
Conclusion
At the Meeting, after considering the above-described factors and based on its deliberations and its evaluation of the information described above, the Board unanimously approved the continuation of the Advisory Agreements for a one-year term and determined that the compensation payable to Funds Management and the Sub-Adviser under each of the Advisory Agreements was reasonable.
Wells Fargo Asset Allocation Fund | 33
This page is intentionally left blank.
This page is intentionally left blank.
This page is intentionally left blank.

For more information
More information about Wells Fargo Funds is available free upon request. To obtain literature, please write, visit the Fund’s website, or call:
Wells Fargo Funds
P.O. Box 219967
Kansas City, MO 64121-9967
Website: wfam.com
Individual investors: 1-800-222-8222
Retail investment professionals: 1-888-877-9275
Institutional investment professionals: 1-866-765-0778

This report and the financial statements contained herein are submitted for the general information of the shareholders of the Fund. If this report is used for promotional purposes, distribution of the report must be accompanied or preceded by a current prospectus. Before investing, please consider the investment objectives, risks, charges, and expenses of the investment. For a current prospectus and, if available, a summary prospectus, containing this information, call 1-800-222-8222 or visit the Fund’s website at wfam.com. Read the prospectus carefully before you invest or send money.
Wells Fargo Asset Management (WFAM) is the trade name for certain investment advisory/management firms owned by Wells Fargo & Company. These firms include but are not limited to Wells Capital Management Incorporated and Wells Fargo Funds Management, LLC. Certain products managed by WFAM entities are distributed by Wells Fargo Funds Distributor, LLC (a broker-dealer and Member FINRA).
This material is for general informational and educational purposes only and is NOT intended to provide investment advice or a recommendation of any kind—including a recommendation for any specific investment, strategy, or plan.
INVESTMENT PRODUCTS: NOT FDIC INSURED ◾ NO BANK GUARANTEE ◾ MAY LOSE VALUE
© 2021 Wells Fargo & Company. All rights reserved.
PAR-1220-00725 01-20
SA224/SAR224 11-20
Semi-Annual Report
November 30, 2020
Wells Fargo Growth Balanced Fund
|
|
|
Reduce clutter. Save trees. |
Sign up for electronic delivery of prospectuses and shareholder reports at wellsfargo.com/
advantagedelivery |
The views expressed and any forward-looking statements are as of November 30, 2020, unless otherwise noted, and are those of the Fund’s portfolio managers and/or Wells Fargo Asset Management. Discussions of individual securities, or the markets generally, or any Wells Fargo Fund are not intended as individual recommendations. Future events or results may vary significantly from those expressed in any forward-looking statements. The views expressed are subject to change at any time in response to changing circumstances in the market. Wells Fargo Asset Management and the Fund disclaim any obligation to publicly update or revise any views expressed or forward-looking statements.
INVESTMENT PRODUCTS: NOT FDIC INSURED ◾ NO BANK GUARANTEE ◾ MAY LOSE VALUE
Wells Fargo Growth Balanced Fund | 1
Letter to shareholders (unaudited)

Andrew Owen
President
Wells Fargo Funds
“Global stock markets rallied strongly, driven by aggressive stimulus measures introduced by central banks and governments in response to challenges presented by the COVID-19 pandemic.”
Dear Shareholder:
We are pleased to offer you this semi-annual report for the Wells Fargo Growth Balanced Fund for the six-month period that ended November 30, 2020. Global stock markets rallied strongly, driven by aggressive stimulus measures introduced by central banks and governments in response to challenges presented by the COVID-19 pandemic. Emerging market equities had particularly robust results during the six-month period. Among bonds, high-yield issues led the way while U.S. bonds generally had more modest returns than their international counterparts.
For the period, U.S. stocks, based on the S&P 500 Index,1 returned 19.98% and international stocks, as measured by the MSCI ACWI ex USA Index (Net),2 gained 23.28%. The MSCI EM Index (Net)3 rallied 31.14%. Among bond investments, the Bloomberg Barclays U.S. Aggregate Bond Index4 returned a modest 1.79%, the Bloomberg Barclays Global Aggregate ex-USD Index5 gained a robust 8.19%, the Bloomberg Barclays Municipal Bond Index6 had a 3.29% return, and the ICE BofA U.S. High Yield Index7 gained a healthy 10.47%.
Equities enjoyed a strong tailwind from monetary and fiscal stimulus.
Financial markets posted widely positive returns in June despite ongoing economic weakness and uncertainty regarding COVID-19 and the timing of an effective vaccine. As economies reopened, optimism rose. Vitally important to market sentiment was the ongoing global central bank commitment to provide economic support through liquidity and low borrowing costs. U.S. economic activity was boosted by one-time $1,200 stimulus checks and $600 weekly bonus unemployment benefits for tens of millions of Americans through July. However, jobless rates remained historically high, easing somewhat from 14.7% in April to 11.1% in June. By late June, numerous states reported increases of COVID-19 cases, an ominous sign. China’s economic recovery picked up momentum in June.
July was broadly positive for both global equities and fixed income. However, economic data and a resurgence of COVID-19 cases pointed to the vulnerability of the global economy and the need to regain control of the pandemic. Second-quarter gross domestic product (GDP) shrank from the previous quarter by 9.5% and 12.1% in the U.S. and the eurozone, respectively. In contrast, China reported 3.2% year-over-year second-quarter GDP growth. U.S. unemployment remained high despite adding 1.8 million jobs in July, as a double-digit jobless rate persisted. However, manufacturing activity grew in both the U.S. and the eurozone. In Asia, while China’s manufacturing sector continued to expand, activity in Japan and South Korea contracted. A rising concern was the rapid and broad reemergence of COVID-19 infections.
| 1 | The S&P 500 Index consists of 500 stocks chosen for market size, liquidity, and industry group representation. It is a market-value-weighted index with each stock’s weight in the index proportionate to its market value. You cannot invest directly in an index. |
| 2 | The Morgan Stanley Capital International (MSCI) All Country World Index (ACWI) ex USA Index (Net) is a free-float-adjusted market-capitalization-weighted index that is designed to measure the equity market performance of developed and emerging markets, excluding the United States. Source: MSCI. MSCI makes no express or implied warranties or representations and shall have no liability whatsoever with respect to any MSCI data contained herein. The MSCI data may not be further redistributed or used as a basis for other indices or any securities or financial products. This report is not approved, reviewed, or produced by MSCI. You cannot invest directly in an index. |
| 3 | The MSCI Emerging Markets (EM) Index (Net) is a free-float-adjusted market-capitalization-weighted index that is designed to measure equity market performance of emerging markets. You cannot invest directly in an index. |
| 4 | The Bloomberg Barclays U.S. Aggregate Bond Index is a broad-based benchmark that measures the investment-grade, U.S. dollar-denominated, fixed-rate taxable bond market, including Treasuries, government-related and corporate securities, mortgage-backed securities (agency fixed-rate and hybrid adjustable-rate mortgage pass-throughs), asset-backed securities, and commercial mortgage-backed securities. You cannot invest directly in an index. |
| 5 | The Bloomberg Barclays Global Aggregate ex-USD Index is an unmanaged index that provides a broad-based measure of the global investment-grade fixed-income markets excluding the U.S. dollar-denominated debt market. You cannot invest directly in an index. |
| 6 | The Bloomberg Barclays Municipal Bond Index is an unmanaged index composed of long-term tax-exempt bonds with a minimum credit rating of Baa. You cannot invest directly in an index. |
| 7 | The ICE BofA U.S. High Yield Index is a market-capitalization-weighted index of domestic and Yankee high-yield bonds. The index tracks the performance of high-yield securities traded in the U.S. bond market. You cannot invest directly in an index. Copyright 2021. ICE Data Indices, LLC. All rights reserved. |
2 | Wells Fargo Growth Balanced Fund
Letter to shareholders (unaudited)
The stock market continued to rally in August despite concerns over rising COVID-19 cases in the U.S. and Europe, as well as the expiration of the $600 weekly bonus unemployment benefit in July. Generally stronger-than-expected second-quarter earnings boosted investor sentiment along with the Federal Reserve’s announcement of a more accommodative policy shift that could lead to longer-term low interest rates. U.S. indices measuring manufacturing and services activities beat expectations while the U.S. housing market maintained strength. In Europe, retail sales expanded and consumer confidence was steady. China’s economy continued to expand.
Stocks grew more volatile in September on mixed economic data. U.S. economic activity continued to grow. However, only half of the 22 million jobs lost since the early spring had returned. The U.S. unemployment rate fell to 7.9% in September, a measurable improvement but far higher than the 3.5% pre-COVID-19 rate. Only 661,000 jobs were added for the month, down from 1.5 million in August. With the U.S. Congress failing to pass further fiscal relief and uncertainties surrounding a possible vaccine, doubts crept back into the markets. In the U.K., a lack of progress in Brexit talks with the European Union weighed on markets. China’s economy picked up steam, however, with growth fueled by increased global demand.
In October, capital markets took a step back from their six-month rally. Market volatility rose in advance of the U.S. election and amid a global increase in COVID-19 infections. Europe responded with more economic restrictions. Meanwhile, Brexit remained unresolved. U.S. markets looked favorably at a possible Democratic sweep and control of the federal purse strings in anticipation of additional fiscal stimulus, which could boost economic activity. Meanwhile, China continued to stand apart, reporting 4.9% third-quarter GDP growth year over year.
Global stocks rallied broadly in November, propelled by optimism over three promising COVID-19 vaccines, which reported high effectiveness in trials. Global stock indices notched double-digit monthly gains. In a reversal of recent trends, value stocks outperformed growth and cyclical stocks outpaced technology stocks. However, U.S. unemployment remained elevated, with a net job loss of 10 million since February. The Eurozone Services Purchasing Managers’ Index, a monthly survey of purchasing managers, contracted sharply while the region’s manufacturing activity gauge indicated growth. The U.S. election results added to the market’s upbeat mood as investors gave thumbs-up to the certainty of the outcome after an unusual delay and anticipated more consistent policies in the new administration.
Don’t let short-term uncertainty derail long-term investment goals.
Periods of investment uncertainty can present challenges, but experience has taught us that maintaining long-term investment goals can be an effective way to plan for the future. To help you create a sound strategy based on your personal goals and risk tolerance, Wells Fargo Funds offers more than 100 mutual funds spanning a wide range of asset classes and investment styles. Although diversification cannot guarantee an investment profit or prevent losses, we believe it can be an effective way to manage investment risk and potentially smooth out overall portfolio performance. We encourage investors to know their investments and to understand that appropriate levels of risk-taking may unlock opportunities.
Thank you for choosing to invest with Wells Fargo Funds. We appreciate your confidence in us and remain committed to helping you meet your financial needs.
Sincerely,

Andrew Owen
President
Wells Fargo Funds
“Global stocks rallied broadly in November, propelled by optimism over three promising COVID-19 vaccines, which reported high effectiveness in trials.”
|
|
|
For further information about your Fund, contact your investment professional, visit our website at wfam.com, or call us directly at 1-800-222-8222. |
Wells Fargo Growth Balanced Fund | 3
Letter to shareholders (unaudited)
Notice to Shareholders
At a meeting held on August 10-12, 2020, the Board of Trustees of the Fund approved a change to the Fund’s automatic conversion feature for Class C shares in order to shorten the required holding period from 10 to 8 years. As a result, on a monthly basis beginning November 5, 2020, Class C shares will convert automatically into Class A shares 8 years after the initial date of purchase or, if you acquired your Class C shares through an exchange or conversion from another share class, 8 years after the date you acquired your Class C shares. When Class C shares that you acquired through a purchase or exchange convert, any other Class C shares that you purchased with reinvested dividends and distributions also will convert into Class A shares on a pro rata basis.
Please note that a shorter holding period may apply depending on your intermediary. Please see “Appendix A—Sales Charge Reductions and Waivers for Certain Intermediaries” in the Fund’s prospectus for further information.
Preparing for LIBOR Transition
The global financial industry is preparing to transition away from the London Interbank Offered Rate (LIBOR), a key benchmark interest rate, to new alternative rates. LIBOR underpins more than $350 trillion of financial contracts. It is the benchmark rate for a wide spectrum of products ranging from residential mortgages to corporate bonds to derivatives. Regulators have called for a market-wide transition away from LIBOR to successor reference rates by the end of 2021, which requires proactive steps be taken by issuers, counterparties, and asset managers to identify impacted products and adopt new reference rates.
The Fund holds at least one security that uses LIBOR as a floating reference rate and has a maturity date after 12-31-2021.
Although the transition process away from LIBOR has become increasingly well-defined in advance of the anticipated discontinuation date, there remains uncertainty regarding the nature of successor reference rates, and any potential effects of the transition away from LIBOR on investment instruments that use it as a benchmark rate. The transition process may result in, among other things, increased volatility or illiquidity in markets for instruments that currently rely on LIBOR and could negatively impact the value of certain instruments held by the Fund.
Wells Fargo Asset Management is monitoring LIBOR exposure closely and has put resources and controls in place to manage this transition effectively. The Fund’s portfolio management team is evaluating LIBOR holdings to understand what happens to those securities when LIBOR ceases to exist, including examining security documentation to identify the presence or absence of fallback language identifying a replacement rate to LIBOR.
While the pace of transition away from LIBOR will differ by asset class and investment strategy, the portfolio management team will monitor market conditions for those holdings to identify and mitigate deterioration or volatility in pricing and liquidity and ensure appropriate actions are taken in a timely manner.
Further information regarding the potential risks associated with the discontinuation of LIBOR can be found in the Fund’s Statement of Additional Information.
4 | Wells Fargo Growth Balanced Fund
This page is intentionally left blank.
Performance highlights (unaudited)
Investment objective
The Fund seeks total return, consisting of capital appreciation and current income.
Manager
Wells Fargo Funds Management, LLC
Subadviser
Wells Capital Management Incorporated
Portfolio managers
Kandarp R. Acharya, CFA®‡, FRM
Petros N. Bocray, CFA®‡, FRM
Christian L. Chan, CFA®‡
Average annual total returns (%) as of November 30, 2020
| | | | | | | | | | | | | | | | | | | | | | | | | | | | | | | | | | |
| | | | |
| | | | | Including sales charge | | | Excluding sales charge | | | Expense ratios1 (%) | |
| | | | | | | | | |
| | | Inception date | | 1 year | | | 5 year | | | 10 year | | | 1 year | | | 5 year | | | 10 year | | | Gross | | | Net2 | |
| | | | | | | | | | |
| Class A (WFGBX) | | 10-14-1998 | | | 5.21 | | | | 6.75 | | | | 8.31 | | | | 11.63 | | | | 8.02 | | | | 8.96 | | | | 1.41 | | | | 1.13 | |
| | | | | | | | | | |
| Class C (WFGWX) | | 10-1-1998 | | | 9.95 | | | | 7.24 | | | | 8.16 | | | | 10.95 | | | | 7.24 | | | | 8.16 | | | | 2.16 | | | | 1.88 | |
| | | | | | | | | | |
| Administrator Class (NVGBX) | | 11-11-1994 | | | – | | | | – | | | | – | | | | 11.91 | | | | 8.27 | | | | 9.22 | | | | 1.33 | | | | 0.95 | |
| | | | | | | | | | |
| Growth Balanced Blended Index3 | | – | | | – | | | | – | | | | – | | | | 13.74 | | | | 9.53 | | | | 9.53 | | | | – | | | | – | |
| | | | | | | | | | |
| Bloomberg Barclays U.S. Aggregate Bond Index4 | | – | | | – | | | | – | | | | – | | | | 7.28 | | | | 4.34 | | | | 3.71 | | | | – | | | | – | |
| | | | | | | | | | |
| MSCI ACWI ex USA Index (Net)5 | | – | | | – | | | | – | | | | – | | | | 9.52 | | | | 7.38 | | | | 5.16 | | | | – | | | | – | |
| | | | | | | | | | |
| Russell 3000® Index6 | | – | | | – | | | | – | | | | – | | | | 19.02 | | | | 13.95 | | | | 14.04 | | | | – | | | | – | |
Figures quoted represent past performance, which is no guarantee of future results, and do not reflect taxes that a shareholder may pay on an investment in a fund. Investment return and principal value of an investment will fluctuate so that an investor’s shares, when redeemed, may be worth more or less than their original cost. Performance shown without sales charges would be lower if sales charges were reflected. Current performance may be lower or higher than the performance data quoted, which assumes the reinvestment of dividends and capital gains. Current month-end performance is available on the Fund’s website, wfam.com.
Index returns do not include transaction costs associated with buying and selling securities, any mutual fund fees or expenses, or any taxes. It is not possible to invest directly in an index.
For Class A shares, the maximum front-end sales charge is 5.75%. For Class C shares, the maximum contingent deferred sales charge is 1.00%. Performance including a contingent deferred sales charge assumes the sales charge for the corresponding time period. Administrator Class shares are sold without a front-end sales charge or contingent deferred sales charge.
Balanced funds may invest in stocks and bonds. Stock values fluctuate in response to the activities of individual companies and general market and economic conditions. The use of derivatives may reduce returns and/or increase volatility. Certain investment strategies tend to increase the total risk of an investment (relative to the broader market). Bond values fluctuate in response to the financial condition of individual issuers, general market and economic conditions, and changes in interest rates. Changes in market conditions and government policies may lead to periods of heightened volatility in the bond market and reduced liquidity for certain bonds held by the Fund. In general, when interest rates rise, bond values fall and investors may lose principal value. Interest rate changes and their impact on the Fund and its share price can be sudden and unpredictable. The Fund is exposed to foreign investment risk, mortgage and asset-backed securities risk, and smaller-company securities risk. Consult the Fund’s prospectus for additional information on these and other risks.
Please see footnotes on page 7.
6 | Wells Fargo Growth Balanced Fund
Performance highlights (unaudited)
| | | | |
| |
| Ten largest holdings (%) as of November 30, 20207 | | | |
| | |
Wells Fargo Managed Fixed Income Portfolio | | | 20.84 | |
| | |
Wells Fargo Large Company Value Portfolio | | | 10.16 | |
| | |
Wells Fargo Diversified Large Cap Growth Portfolio | | | 9.40 | |
| | |
Wells Fargo Disciplined International Developed Markets Portfolio | | | 8.81 | |
| | |
Wells Fargo International Value Portfolio | | | 6.54 | |
| | |
Wells Fargo Core Bond Portfolio | | | 6.47 | |
| | |
Wells Fargo Real Return Portfolio | | | 3.33 | |
| | |
Wells Fargo Factor Enhanced International Equity Portfolio | | | 3.28 | |
| | |
Wells Fargo C&B Large Cap Value Portfolio | | | 3.05 | |
| | |
Wells Fargo Small Company Value Portfolio | | | 2.82 | |
| | | | | | | | |
|
| Allocations (%) as of November 30, 2020 | |
| | |
| | | Neutral
allocation | | | Effective
allocation8 | |
| | | |
Stocks | | | 65 | | | | 67 | |
| | | |
Bonds | | | 35 | | | | 33 | |
| ‡ | CFA® and Chartered Financial Analyst® are trademarks owned by CFA Institute. |
| 1 | Reflects the expense ratios as stated in the most recent prospectuses, which include the impact of 0.54% in acquired fund fees and expenses. The expense ratios shown are subject to change and may differ from the annualized expense ratios shown in the financial highlights of this report, which do not include acquired fund fees and expenses. |
| 2 | The manager has contractually committed through September 30, 2021, to waive fees and/or reimburse expenses to the extent necessary to cap total annual fund operating expenses after fee waivers at 1.13% for Class A, 1.88% for Class C, and 0.95% for Administrator Class. Brokerage commissions, stamp duty fees, interest, taxes, acquired fund fees and expenses (if any) from funds in which the affiliated master portfolios and funds invest and from money market funds, and extraordinary expenses are excluded from the expense caps. All other acquired fund fees and expenses from the affiliated master portfolios are included in the expense caps. Prior to or after the commitment expiration date, the caps may be increased or the commitment to maintain the caps may be terminated only with the approval of the Board of Trustees. Without these caps, the Fund’s returns would have been lower. The expense ratio paid by an investor is the net expense ratio (the total annual fund operating expenses after fee waivers) as stated in the prospectuses. |
| 3 | Source: Wells Fargo Funds Management, LLC. The Growth Balanced Blended Index is composed of 45% of the Russell 3000® Index, 35% of the Bloomberg Barclays U.S. Aggregate Bond Index, and 20% of the MSCI ACWI ex USA Index (Net). Prior to November 30, 2017, the Growth Balanced Blended Index was composed 35% of the Bloomberg Barclays U.S. Aggregate Bond Index, 16.25% in the Russell 1000® Growth Index, 16.25% of the Russell 1000® Value Index, 16.25% of the S&P 500 Index, 9.75% of the MSCI EAFE Index (Net), and 6.50% of the Russell 2000® Index. You cannot invest directly in an index. |
| 4 | The Bloomberg Barclays U.S. Aggregate Bond Index is a broad-based benchmark that measures the investment-grade, U.S. dollar–denominated, fixed-rate taxable bond market, including Treasuries, government-related and corporate securities, mortgage-backed securities (agency fixed-rate and hybrid adjustable-rate mortgage pass-throughs), asset-backed securities, and commercial mortgage-backed securities. You cannot invest directly in an index. |
| 5 | The Morgan Stanley Capital International (MSCI) All Country World Index (ACWI) ex USA Index (Net) is a free-float-adjusted market capitalization-weighted index that is designed to measure the equity market performance of developed and emerging markets, excluding the United States. Source: MSCI. MSCI makes no express or implied warranties or representations and shall have no liability whatsoever with respect to any MSCI data contained herein. The MSCI data may not be further redistributed or used as a basis for other indices or any securities or financial products. This report is not approved, reviewed, or produced by MSCI. You cannot invest directly in an index. |
| 6 | The Russell 3000® Index measures the performance of the 3,000 largest U.S. companies based on total market capitalization, which represents approximately 98% of the investable U.S. equity market. You cannot invest directly in an index. |
| 7 | Figures represent the percentage of the Fund’s net assets. Holdings are subject to change and may have changed since the date specified. |
| 8 | Effective allocation includes the effect of any tactical futures overlay that may be in place. Effective cash, if any, represents the net offset to such futures positions. These amounts are subject to change and may have changed since the date specified. |
Wells Fargo Growth Balanced Fund | 7
Fund expenses (unaudited)
As a shareholder of the Fund, you incur two types of costs: (1) transaction costs, including sales charges (loads) on purchase payments and contingent deferred sales charges (if any) on redemptions and (2) ongoing costs, including management fees, distribution (12b-1) and/or shareholder servicing fees, and other Fund expenses. This example is intended to help you understand your ongoing costs (in dollars) of investing in the Fund and to compare these costs with the ongoing costs of investing in other mutual funds.
The example is based on an investment of $1,000 invested at the beginning of the six-month period and held for the entire period from June 1, 2020 to November 30, 2020.
Actual expenses
The “Actual” line of the table below provides information about actual account values and actual expenses. You may use the information in this line, together with the amount you invested, to estimate the expenses that you paid over the period. Simply divide your account value by $1,000 (for example, an $8,600 account value divided by $1,000 = 8.6), then multiply the result by the number in the “Actual” line under the heading entitled “Expenses paid during period” for your applicable class of shares to estimate the expenses you paid on your account during this period.
Hypothetical example for comparison purposes
The “Hypothetical” line of the table below provides information about hypothetical account values and hypothetical expenses based on the Fund’s actual expense ratio and an assumed rate of return of 5% per year before expenses, which is not the Fund’s actual return. The hypothetical account values and expenses may not be used to estimate the actual ending account balance or expenses you paid for the period. You may use this information to compare the ongoing costs of investing in the Fund and other funds. To do so, compare this 5% hypothetical example with the 5% hypothetical examples that appear in the shareholder reports of the other funds.
Please note that the expenses shown in the table are meant to highlight your ongoing costs only and do not reflect any transactional costs, such as sales charges (loads) and contingent deferred sales charges. Therefore, the “Hypothetical” line of the table is useful in comparing ongoing costs only and will not help you determine the relative total costs of owning different funds. In addition, if these transactional costs were included, your costs would have been higher.
| | | | | | | | | | | | | | | | |
| | | Beginning
account value
6-1-2020 | | | Ending
account value
11-30-2020 | | | Expenses
paid during
the period1,2 | | | Annualized net
expense ratio1 | |
| | | | | |
Class A | | | | | | | | | | | | | | | | |
| | | | |
Actual | | $ | 1,000.00 | | | $ | 1,151.09 | | | $ | 5.66 | | | | 1.05 | % |
| | | | |
Hypothetical (5% return before expenses) | | $ | 1,000.00 | | | $ | 1,019.80 | | | $ | 5.32 | | | | 1.05 | % |
| | | | | |
Class C | | | | | | | | | | | | | | | | |
| | | | |
Actual | | $ | 1,000.00 | | | $ | 1,148.46 | | | $ | 9.69 | | | | 1.80 | % |
| | | | |
Hypothetical (5% return before expenses) | | $ | 1,000.00 | | | $ | 1,016.04 | | | $ | 9.10 | | | | 1.80 | % |
| | | | | |
Administrator Class | | | | | | | | | | | | | | | | |
| | | | |
Actual | | $ | 1,000.00 | | | $ | 1,152.83 | | | $ | 4.64 | | | | 0.86 | % |
| | | | |
Hypothetical (5% return before expenses) | | $ | 1,000.00 | | | $ | 1,020.76 | | | $ | 4.36 | | | | 0.86 | % |
| 1 | Amounts reflect net expenses allocated from the affiliated Master Portfolios in which the Fund invests. |
| 2 | Expenses paid is equal to the annualized net expense ratio of each class multiplied by the average account value over the period, multiplied by the number of days in the most recent fiscal half-year divided by the number of days in the fiscal year (to reflect the one-half-year period). |
8 | Wells Fargo Growth Balanced Fund
Portfolio of investments—November 30, 2020 (unaudited)
| | | | | | | | | | | | | | | | |
| | | | | | | | | Shares | | | Value | |
| Exchange-Traded Funds: 5.74% | |
iShares Core S&P 500 ETF | | | | | | | | | | | 18,140 | | | $ | 6,590,625 | |
iShares Core U.S. Aggregate Bond ETF | | | | | | | | | | | 20,757 | | | | 2,458,044 | |
The Industrial Select Sector SPDR Fund | | | | | | | | | | | 39,815 | | | | 3,504,918 | |
| | | | |
Total Exchange-Traded Funds (Cost $11,870,348) | | | | | | | | | | | | | | | 12,553,587 | |
| | | | | | | | | | | | | | | | |
| | | | |
Investment Companies: 92.81% | | | | | | | | | | | | | | | | |
| | | | |
| Affiliated Master Portfolios: 78.35% | | | | | | | | | | | | |
Wells Fargo C&B Large Cap Value Portfolio | | | | | | | | | | | | | | | 6,676,323 | |
Wells Fargo Core Bond Portfolio | | | | | | | | | | | | | | | 14,161,772 | |
Wells Fargo Disciplined International Developed Markets Portfolio | | | | | | | | | | | | | | | 19,271,535 | |
Wells Fargo Diversified Large Cap Growth Portfolio | | | | | | | | | | | | | | | 20,558,198 | |
Wells Fargo Emerging Growth Portfolio | | | | | | | | | | | | | | | 2,509,346 | |
Wells Fargo Factor Enhanced Emerging Markets Equity Portfolio | | | | | | | | | | | | | | | 2,911,307 | |
Wells Fargo Factor Enhanced International Equity Portfolio | | | | | | | | | | | | | | | 7,172,811 | |
Wells Fargo International Value Portfolio | | | | | | | | | | | | | | | 14,313,156 | |
Wells Fargo Large Company Value Portfolio | | | | | | | | | | | | | | | 22,226,733 | |
Wells Fargo Managed Fixed Income Portfolio | | | | | | | | | | | | | | | 45,589,025 | |
Wells Fargo Real Return Portfolio | | | | | | | | | | | | | | | 7,292,961 | |
Wells Fargo Small Company Growth Portfolio | | | | | | | | | | | | | | | 2,531,973 | |
Wells Fargo Small Company Value Portfolio | | | | | | | | | | | | | | | 6,172,378 | |
| | | | |
| | | | | | | | | | | | | | | 171,387,518 | |
| | | | | | | | | | | | | | | | |
|
| Affiliated Funds: 14.46% | |
Wells Fargo Disciplined U.S. Core Fund Class R6 | | | | | | | | | | | 1,238,731 | | | | 25,790,387 | |
Wells Fargo Emerging Markets Equity Fund Class R6 | | | | | | | | | | | 92,769 | | | | 2,921,311 | |
Wells Fargo Emerging Markets Equity Income Fund Class R6 | | | | | | | | | | | 252,424 | | | | 2,930,643 | |
| | | | |
| | | | | | | | | | | | | | | 31,642,341 | |
| | | | | | | | | | | | | | | | |
| | | | |
Total Investment Companies (Cost $158,179,319) | | | | | | | | | | | | | | | 203,029,859 | |
| | | | | | | | | | | | | | | | |
| | | | | | | | |
| Total investments in securities (Cost $170,049,667) | | | 98.55 | % | | | 215,583,446 | |
| | |
Other assets and liabilities, net | | | 1.45 | | | | 3,173,411 | |
| | | | | | | | |
| Total net assets | | | 100.00 | % | | $ | 218,756,857 | |
| | | | | | | | |
The accompanying notes are an integral part of these financial statements.
Wells Fargo Growth Balanced Fund | 9
Portfolio of investments—November 30, 2020 (unaudited)
Futures Contracts
| | | | | | | | | | | | | | | | | | | | | | | | |
| Description | | Number of
contracts | | | Expiration
date | | | Notional
cost | | | Notional
value | | | Unrealized
gains | | | Unrealized
losses | |
| | | | | | |
Long | | | | | | | | | | | | | | | | | | | | | | | | |
| | | | | | |
Japanese Yen Futures | | | 91 | | | | 12-14-2020 | | | $ | 10,870,061 | | | $ | 10,904,644 | | | $ | 34,583 | | | $ | 0 | |
| | | | | | |
E-Mini Nasdaq 100 Index | | | 17 | | | | 12-18-2020 | | | | 4,084,065 | | | | 4,174,180 | | | | 90,115 | | | | 0 | |
| | | | | | |
E-Mini Russell 2000 Index | | | 74 | | | | 12-18-2020 | | | | 6,443,029 | | | | 6,734,370 | | | | 291,341 | | | | 0 | |
| | | | | | |
IBEX 35 Index | | | 95 | | | | 12-18-2020 | | | | 8,963,692 | | | | 9,136,943 | | | | 173,251 | | | | 0 | |
| | | | | | |
MSCI Emerging Markets Index | | | 36 | | | | 12-18-2020 | | | | 2,120,226 | | | | 2,164,140 | | | | 43,914 | | | | 0 | |
| | | | | | |
Long Gilt Bonds | | | 92 | | | | 3-29-2021 | | | | 16,430,982 | | | | 16,458,380 | | | | 27,398 | | | | 0 | |
| | | | | | |
Short | | | | | | | | | | | | | | | | | | | | | | | | |
| | | | | | |
Euro-Bund Futures | | | (64) | | | | 12-8-2020 | | | | (13,568,205 | ) | | | (13,558,416 | ) | | | 9,789 | | | | 0 | |
| | | | | | |
E-Mini S&P 500 Index | | | (36) | | | | 12-18-2020 | | | | (6,436,646 | ) | | | (6,521,760 | ) | | | 0 | | | | (85,114 | ) |
| | | | | | |
Mini-DAX Futures Index | | | (110) | | | | 12-18-2020 | | | | (8,650,901 | ) | | | (8,746,696 | ) | | | 0 | | | | (95,795 | ) |
| | | | | | | | | | | | | | | | | | | | | | | | |
| | | | | | |
| | | | | | | | | | | | | | | | | | $ | 670,391 | | | $ | (180,909 | ) |
| | | | | | | | | | | | | | | | | | | | | | | | |
Investments in Affiliates
An affiliated investment is an investment in which the Fund owns at least 5% of the outstanding voting shares of the issuer or as a result of other relationships, such as the Fund and the issuer having the same adviser or investment manager. Transactions with issuers that were either affiliated persons of the Fund at the beginning of the period or the end of the period were as follows:
| | | | | | | | | | | | | | | | | | | | | | | | | | | | | | | | | | | | |
| | | Value,
beginning of
period | | | Purchases | | | Sales
proceeds | | | Net
realized
gains
(losses) on affiliated
Underlying
Funds | | | Net
change in
unrealized
gains
(losses) on affiliated
Underlying
Funds | | | Value,
end of
period | | | % of
net
assets | | | Shares,
end of
the period | | | Dividend
from
affiliated
Underlying
Funds | |
| | | | | | | | | |
| Investment Companies | | | | | | | | | | | | | | | | | | | | | | | | | | | |
Affiliated Funds | | | | | | | | | | | | | | | | | | | | | | | | | | | | | | | | | | | | |
Wells Fargo Disciplined U.S. Core Fund Class R6 | | $ | 22,208,533 | | | $ | 3,439,215 | | | $ | (3,892,265 | ) | | $ | 203,049 | | | $ | 3,831,855 | | | $ | 25,790,387 | | | | | | | | 1,238,731 | | | $ | 0 | |
Wells Fargo Emerging Markets Equity Fund Class R6 | | | 2,760,102 | | | | 15,755 | | | | (634,235 | ) | | | 137,195 | | | | 642,494 | | | | 2,921,311 | | | | | | | | 92,769 | | | | 0 | |
Wells Fargo Emerging Markets Equity Income Fund Class R6 | | | 2,689,475 | | | | 69,998 | | | | (476,761 | ) | | | 18,292 | | | | 629,639 | | | | 2,930,643 | | | | | | | | 252,424 | | | | 73,364 | |
| | | | | | | | | | | | | | | | | | | | | | | | | | | | | | | | | | | | |
| | | | | | | | | | | | | | $ | 358,536 | | | $ | 5,103,988 | | | $ | 31,642,341 | | | | 14.46 | % | | | | | | $ | 73,364 | |
| | | | | | | | | | | | | | | | | | | | | | | | | | | | | | | | | | | | |
The accompanying notes are an integral part of these financial statements.
10 | Wells Fargo Growth Balanced Fund
Portfolio of investments—November 30, 2020 (unaudited)
Transactions with the affiliated Master Portfolios were as follows:
| | | | | | | | | | | | | | | | | | | | | | | | | | | | | | | | | | | | |
| | | % of
ownership,
beginning
of period | | | % of
ownership,
end of
period | | | Net realized
gains
(losses) on
securities
transactions
allocated
from
affiliated
Master
Portfolios | | | Net
change in
unrealized
gains
(losses) on
securities
transactions
allocated
from
affiliated
Master
Portfolios | | | Interest
allocated
from
affiliated
Master
Portfolios | | | Dividends
allocated
from
affiliated
Master
Portfolios | | | Affiliated
income
allocated
from
affiliates
Master
Portfolios | | | Value,
end
of period | | | % of
net
assets | |
Wells Fargo C&B Large Cap Value Portfolio | | | 2.20 | % | | | 2.00 | % | | $ | 204,448 | | | $ | 1,214,708 | | | $ | 0 | | | $ | 59,063 | | | $ | 75 | | | $ | 6,676,323 | | | | | |
Wells Fargo Core Bond Portfolio | | | 0.23 | | | | 0.23 | | | | 245,947 | | | | 50,245 | | | | 113,370 | | | | 0 | | | | 252 | | | | 14,161,772 | | | | | |
Wells Fargo Disciplined International Developed Markets Portfolio | | | 10.20 | | | | 9.98 | | | | 3,539,101 | | | | (109,340 | ) | | | 0 | | | | 190,002 | | | | 2 | | | | 19,271,535 | | | | | |
Wells Fargo Diversified Large Cap Growth Portfolio | | | 8.84 | | | | 8.63 | | | | 1,431,238 | | | | 2,562,757 | | | | 0 | | | | 78,643 | | | | 227 | | | | 20,558,198 | | | | | |
Wells Fargo Emerging Growth Portfolio | | | 0.33 | | | | 0.29 | | | | 343,843 | | | | 464,829 | | | | 0 | | | | 2,868 | | | | 372 | | | | 2,509,346 | | | | | |
Wells Fargo Factor Enhanced Emerging Markets Equity Portfolio | | | 1.38 | | | | 1.44 | | | | (26,871 | ) | | | 581,661 | | | | 0 | | | | 42,185 | | | | 17 | | | | 2,911,307 | | | | | |
Wells Fargo Factor Enhanced International Equity Portfolio | | | 0.00 | | | | 1.04 | | | | 130,410 | | | | 635,361 | | | | 0 | | | | 58,942 | | | | 33 | | | | 7,172,811 | | | | | |
Wells Fargo High Yield Corporate Bond Portfolio * | | | 7.51 | | | | 0.00 | | | | 43,029 | | | | 554,637 | | | | 350,669 | | | | 0 | | | | 57 | | | | 0 | | | | | |
Wells Fargo International Value Portfolio | | | 2.59 | | | | 4.85 | | | | (2,998,603 | ) | | | 5,621,623 | | | | 6,421 | | | | 212,656 | | | | 1,896 | | | | 14,313,156 | | | | | |
Wells Fargo Large Company Value Portfolio | | | 9.50 | | | | 9.28 | | | | 3,613,379 | | | | 263,376 | | | | 16 | | | | 206,703 | | | | 145 | | | | 22,226,733 | | | | | |
Wells Fargo Managed Fixed Income Portfolio | | | 9.86 | | | | 9.82 | | | | 214,687 | | | | 851,435 | | | | 686,685 | | | | 0 | | | | 618 | | | | 45,589,025 | | | | | |
Wells Fargo Real Return Portfolio | | | 4.38 | | | | 3.35 | | | | (8,299 | ) | | | 322,425 | | | | 78,069 | | | | 10,817 | | | | 32 | | | | 7,292,961 | | | | | |
Wells Fargo Small Company Growth Portfolio | | | 0.17 | | | | 0.17 | | | | 301,679 | | | | 326,298 | | | | 0 | | | | 6,785 | | | | 71 | | | | 2,531,973 | | | | | |
Wells Fargo Small Company Value Portfolio | | | 1.43 | | | | 1.34 | | | | 7,275 | | | | 1,421,832 | | | | 0 | | | | 59,874 | | | | 372 | | | | 6,172,378 | | | | | |
| | | | | | | | | | | | | | | | | | | | | | | | | | | | | | | | | | | | |
| | | | | | | | | | $ | 7,041,263 | | | $ | 14,761,847 | | | $ | 1,235,230 | | | $ | 928,538 | | | $ | 4,169 | | | $ | 171,387,518 | | | | 78.35 | % |
| | | | | | | | | | | | | | | | | | | | | | | | | | | | | | | | | | | | |
| * | No longer held at the end of the period |
The accompanying notes are an integral part of these financial statements.
Wells Fargo Growth Balanced Fund | 11
Statement of assets and liabilities—November 30, 2020 (unaudited)
| | | | |
| | | | |
| |
Assets | | | | |
Investments in affiliated Master Portfolios, at value (cost $132,268,352) | | $ | 171,387,518 | |
Investments in affiliated Underlying Funds, at value (cost $25,910,967) | | | 31,642,341 | |
Investments in unaffiliated securities, at value (cost $11,870,348) | | | 12,553,587 | |
Segregated cash for futures contracts | | | 3,472,894 | |
Cash | | | 112,000 | |
Receivable for Fund shares sold | | | 77,180 | |
Prepaid expenses and other assets | | | 8,553 | |
| | | | |
Total assets | | | 219,254,073 | |
| | | | |
| |
Liabilities | | | | |
Payable for daily variation margin on open futures contracts | | | 257,221 | |
Payable for Fund shares redeemed | | | 50,042 | |
Management fee payable | | | 8,103 | |
Administration fees payable | | | 28,408 | |
Distribution fee payable | | | 5,780 | |
Shareholder report expenses payable | | | 66,352 | |
Shareholder servicing fees payable | | | 44,023 | |
Professional fees payable | | | 18,845 | |
Trustees’ fees and expenses payable | | | 1,052 | |
Accrued expenses and other liabilities | | | 17,390 | |
| | | | |
Total liabilities | | | 497,216 | |
| | | | |
Total net assets | | $ | 218,756,857 | |
| | | | |
| |
Net assets consist of | | | | |
Paid-in capital | | $ | 164,478,585 | |
Total distributable earnings | | | 54,278,272 | |
| | | | |
Total net assets | | $ | 218,756,857 | |
| | | | |
| |
Computation of net asset value and offering price per share | | | | |
Net assets – Class A | | $ | 76,106,893 | |
Shares outstanding – Class A1 | | | 1,426,567 | |
Net asset value per share – Class A | | | $53.35 | |
Maximum offering price per share – Class A2 | | | $56.60 | |
Net assets – Class C | | $ | 9,381,249 | |
Shares outstanding – Class C1 | | | 205,421 | |
Net asset value per share – Class C | | | $45.67 | |
Net assets – Administrator Class | | $ | 133,268,715 | |
Shares outstanding – Administrator Class1 | | | 2,831,879 | |
Net asset value per share – Administrator Class | | | $47.06 | |
| 1 | The Fund has an unlimited number of authorized shares. |
| 2 | Maximum offering price is computed as 100/94.25 of net asset value. On investments of $50,000 or more, the offering price is reduced. |
The accompanying notes are an integral part of these financial statements.
12 | Wells Fargo Growth Balanced Fund
Statement of operations—six months ended November 30, 2020 (unaudited)
| | | | |
| | | | |
| |
Investment income | | | | |
Interest allocated from affiliated Master Portfolios (net of foreign withholding taxes of $133) | | $ | 1,235,230 | |
Dividends allocated from affiliated Master Portfolios (net of foreign withholding taxes of $57,708) | | | 928,538 | |
Dividends from affiliated Underlying Funds | | | 73,364 | |
Affiliated income allocated from affiliated Master Portfolios | | | 4,169 | |
Dividends | | | 19,121 | |
Expenses allocated from affiliated Master Portfolios | | | (469,529 | ) |
Waivers allocated from affiliated Master Portfolios | | | 43,704 | |
| | | | |
Total investment income | | | 1,834,597 | |
| | | | |
| |
Expenses | | | | |
Management fee | | | 320,193 | |
Administration fees | | | | |
Class A | | | 75,954 | |
Class C | | | 10,326 | |
Administrator Class | | | 85,339 | |
Shareholder servicing fees | | | | |
Class A | | | 90,328 | |
Class C | | | 12,271 | |
Administrator Class | | | 163,511 | |
Distribution fee | | | | |
Class C | | | 36,813 | |
Custody and accounting fees | | | 5,280 | |
Professional fees | | | 17,001 | |
Registration fees | | | 38,606 | |
Shareholder report expenses | | | 34,377 | |
Trustees’ fees and expenses | | | 11,029 | |
Other fees and expenses | | | 12,344 | |
| | | | |
Total expenses | | | 913,372 | |
Less: Fee waivers and/or expense reimbursements | | | | |
Fund-level | | | (227,912 | ) |
Class A | | | (1,045 | ) |
Administrator Class | | | (72,737 | ) |
| | | | |
Net expenses | | | 611,678 | |
| | | | |
Net investment income | | | 1,222,919 | |
| | | | |
| |
Realized and unrealized gains (losses) on investments | | | | |
Net realized gains on | | | | |
Securities transactions allocated from affiliated Master Portfolios | | | 7,041,263 | |
Affiliated Underlying Funds | | | 358,536 | |
Unaffiliated securities | | | 39,409 | |
Futures contracts | | | 1,894,017 | |
| | | | |
Net realized gains on investments | | | 9,333,225 | |
| | | | |
| |
Net change in unrealized gains (losses) on | | | | |
Securities transactions allocated from affiliated Master Portfolios | | | 14,761,847 | |
Affiliated Underlying Funds | | | 5,103,988 | |
Unaffiliated securities | | | 683,239 | |
Futures contracts | | | (817,389 | ) |
| | | | |
Net change in unrealized gains (losses) on investments | | | 19,731,685 | |
| | | | |
Net realized and unrealized gains (losses) on investments | | | 29,064,910 | |
| | | | |
Net increase in net assets resulting from operations | | $ | 30,287,829 | |
| | | | |
The accompanying notes are an integral part of these financial statements.
Wells Fargo Growth Balanced Fund | 13
Statement of changes in net assets
| | | | | | | | | | | | | | | | |
| | | Six months ended
November 30, 2020
(unaudited) | | | Year ended
May 31, 2020 | |
| | | | |
Operations | | | | | | | | | | | | | | | | |
Net investment income | | | | | | $ | 1,222,919 | | | | | | | $ | 3,165,071 | |
Net realized gains on investments | | | | | | | 9,333,225 | | | | | | | | 2,965,059 | |
Net change in unrealized gains (losses) on investments | | | | | | | 19,731,685 | | | | | | | | 5,591,889 | |
| | | | |
Net increase in net assets resulting from operations | | | | | | | 30,287,829 | | | | | | | | 11,722,019 | |
| | | | |
| | | |
Distributions to shareholders from net investment income and net realized gains | | | | | | | | | | | | | |
Class A | | | | | | | 0 | | | | | | | | (1,899,671 | ) |
Class C | | | | | | | 0 | | | | | | | | (252,329 | ) |
Administrator Class | | | | | | | 0 | | | | | | | | (4,326,341 | ) |
| | | | |
Total distributions to shareholders | | | | | | | 0 | | | | | | | | (6,478,341 | ) |
| | | | |
| | | | |
Capital share transactions | | | Shares | | | | | | | | Shares | | | | | |
Proceeds from shares sold | | | | | | | | | | | | | | | | |
Class A | | | 52,441 | | | | 2,609,960 | | | | 130,896 | | | | 6,205,787 | |
Class C | | | 4,798 | | | | 201,659 | | | | 38,064 | | | | 1,521,837 | |
Administrator Class | | | 64,805 | | | | 2,820,369 | | | | 252,894 | | | | 10,053,081 | |
| | | | |
| | | | | | | 5,631,988 | | | | | | | | 17,780,705 | |
| | | | |
Reinvestment of distributions | | | | | | | | | | | | | | | | |
Class A | | | 0 | | | | 0 | | | | 38,579 | | | | 1,874,625 | |
Class C | | | 0 | | | | 0 | | | | 5,569 | | | | 231,803 | |
Administrator Class | | | 0 | | | | 0 | | | | 100,724 | | | | 4,319,406 | |
| | | | |
| | | | | | | 0 | | | | | | | | 6,425,834 | |
| | | | |
Payment for shares redeemed | | | | | | | | | | | | | | | | |
Class A | | | (106,092 | ) | | | (5,264,671 | ) | | | (213,827 | ) | | | (9,907,481 | ) |
Class C | | | (53,272 | ) | | | (2,271,840 | ) | | | (83,327 | ) | | | (3,328,464 | ) |
Administrator Class | | | (405,385 | ) | | | (17,846,280 | ) | | | (656,994 | ) | | | (27,048,981 | ) |
| | | | |
| | | | | | | (25,382,791 | ) | | | | | | | (40,284,926 | ) |
| | | | |
Net decrease in net assets resulting from capital share transactions | | | | | | | (19,750,803 | ) | | | | | | | (16,078,387 | ) |
| | | | |
Total increase (decrease) in net assets | | | | | | | 10,537,026 | | | | | | | | (10,834,709 | ) |
| | | | |
| | | | |
Net assets | | | | | | | | | | | | | | | | |
Beginning of period | | | | | | | 208,219,831 | | | | | | | | 219,054,540 | |
| | | | |
End of period | | | | | | $ | 218,756,857 | | | | | | | $ | 208,219,831 | |
| | | | |
The accompanying notes are an integral part of these financial statements.
14 | Wells Fargo Growth Balanced Fund
Financial highlights
(For a share outstanding throughout each period)
| | | | | | | | | | | | | | | | | | | | | | | | |
| | | Six months ended
November 30, 2020
(unaudited) | | | Year ended May 31 | |
| CLASS A | | 2020 | | | 2019 | | | 2018 | | | 2017 | | | 2016 | |
Net asset value, beginning of period | | | $46.33 | | | | $45.15 | | | | $47.12 | | | | $43.91 | | | | $39.99 | | | | $40.80 | |
Net investment income | | | 0.25 | | | | 0.65 | 1 | | | 0.72 | 1 | | | 0.53 | | | | 0.41 | | | | 0.46 | |
Net realized and unrealized gains (losses) on investments | | | 6.77 | | | | 1.80 | | | | (0.60 | ) | | | 3.13 | | | | 3.93 | | | | (0.94 | ) |
| | | | | | | | | | | | | | | | | | | | | | | | |
Total from investment operations | | | 7.02 | | | | 2.45 | | | | 0.12 | | | | 3.66 | | | | 4.34 | | | | (0.48 | ) |
Distributions to shareholders from | | | | | | | | | | | | | | | | | | | | | | | | |
Net investment income | | | 0.00 | | | | (0.47 | ) | | | (1.26 | ) | | | (0.45 | ) | | | (0.42 | ) | | | (0.33 | ) |
Net realized gains | | | 0.00 | | | | (0.80 | ) | | | (0.83 | ) | | | 0.00 | | | | 0.00 | | | | 0.00 | |
| | | | | | | | | | | | | | | | | | | | | | | | |
Total distributions to shareholders | | | 0.00 | | | | (1.27 | ) | | | (2.09 | ) | | | (0.45 | ) | | | (0.42 | ) | | | (0.33 | ) |
Net asset value, end of period | | | $53.35 | | | | $46.33 | | | | $45.15 | | | | $47.12 | | | | $43.91 | | | | $39.99 | |
Total return2 | | | 15.11 | % | | | 5.31 | % | | | 0.53 | % | | | 8.34 | % | | | 10.93 | % | | | (1.14 | )% |
Ratios to average net assets (annualized) | | | | | | | | | | | | | | | | | | | | | | | | |
Gross expenses3 | | | 1.27 | % | | | 1.32 | % | | | 1.33 | % | | | 1.35 | % | | | 1.34 | % | | | 1.35 | % |
Net expenses3 | | | 1.05 | % | | | 1.04 | % | | | 1.07 | % | | | 1.17 | % | | | 1.20 | % | | | 1.20 | % |
Net investment income3 | | | 1.06 | % | | | 1.40 | % | | | 1.55 | % | | | 1.27 | % | | | 1.10 | % | | | 1.10 | % |
Supplemental data | | | | | | | | | | | | | | | | | | | | | | | | |
Portfolio turnover rate4 | | | 69 | % | | | 116 | % | | | 149 | % | | | 114 | % | | | 114 | % | | | 79 | % |
Net assets, end of period (000s omitted) | | | $76,107 | | | | $68,581 | | | | $68,832 | | | | $62,473 | | | | $65,514 | | | | $65,866 | |
| 1 | Calculated based upon average shares outstanding |
| 2 | Total return calculations do not include any sales charges. Returns for periods of less than one year are not annualized. |
| 3 | Ratios include only the net expenses allocated from the affiliated Master Portfolios and do not include expenses from any other affiliated Underlying Funds. Net expenses allocated from the affiliated Master Portfolios included in the ratios were as follows: |
| | | | |
Six months ended November 30, 2020 (unaudited) | | | 0.40 | % |
Year ended May 31, 2020 | | | 0.45 | % |
Year ended May 31, 2019 | | | 0.47 | % |
Year ended May 31, 2018 | | | 0.51 | % |
Year ended May 31, 2017 | | | 0.50 | % |
Year ended May 31, 2016 | | | 0.51 | % |
| 4 | Portfolio turnover rate is calculated by multiplying the Fund’s ownership percentage in the respective affiliated Master Portfolio by the corresponding affiliated Master Portfolio’s purchases and sales. These purchases and sales amounts are aggregated with the direct purchases and sales in the affiliated Underlying Funds and unaffiliated securities and included in the portfolio turnover calculation. |
The accompanying notes are an integral part of these financial statements.
Wells Fargo Growth Balanced Fund | 15
Financial highlights
(For a share outstanding throughout each period)
| | | | | | | | | | | | | | | | | | | | | | | | |
| | | Six months ended
November 30, 2020
(unaudited) | | | Year ended May 31 | |
| CLASS C | | 2020 | | | 2019 | | | 2018 | | | 2017 | | | 2016 | |
Net asset value, beginning of period | | | $39.81 | | | | $38.95 | | | | $40.86 | | | | $38.14 | | | | $34.82 | | | | $35.63 | |
Net investment income | | | 0.07 | 1 | | | 0.26 | 1 | | | 0.37 | 1 | | | 0.14 | | | | 0.13 | 1 | | | 0.12 | |
Net realized and unrealized gains (losses) on investments | | | 5.79 | | | | 1.54 | | | | (0.56 | ) | | | 2.74 | | | | 3.38 | | | | (0.79 | ) |
| | | | | | | | | | | | | | | | | | | | | | | | |
Total from investment operations | | | 5.86 | | | | 1.80 | | | | (0.19 | ) | | | 2.88 | | | | 3.51 | | | | (0.67 | ) |
Distributions to shareholders from | | | | | | | | | | | | | | | | | | | | | | | | |
Net investment income | | | 0.00 | | | | (0.14 | ) | | | (0.89 | ) | | | (0.16 | ) | | | (0.19 | ) | | | (0.14 | ) |
Net realized gains | | | 0.00 | | | | (0.80 | ) | | | (0.83 | ) | | | 0.00 | | | | 0.00 | | | | 0.00 | |
| | | | | | | | | | | | | | | | | | | | | | | | |
Total distributions to shareholders | | | 0.00 | | | | (0.94 | ) | | | (1.72 | ) | | | (0.16 | ) | | | (0.19 | ) | | | (0.14 | ) |
Net asset value, end of period | | | $45.67 | | | | $39.81 | | | | $38.95 | | | | $40.86 | | | | $38.14 | | | | $34.82 | |
Total return2 | | | 14.85 | % | | | 4.52 | % | | | (0.23 | )% | | | 7.55 | % | | | 10.10 | % | | | (1.88 | )% |
Ratios to average net assets (annualized) | | | | | | | | | | | | | | | | | | | | | | | | |
Gross expenses3 | | | 2.02 | % | | | 2.07 | % | | | 2.08 | % | | | 2.10 | % | | | 2.09 | % | | | 2.10 | % |
Net expenses3 | | | 1.80 | % | | | 1.79 | % | | | 1.82 | % | | | 1.92 | % | | | 1.95 | % | | | 1.95 | % |
Net investment income3 | | | 0.31 | % | | | 0.64 | % | | | 0.93 | % | | | 0.52 | % | | | 0.35 | % | | | 0.36 | % |
Supplemental data | | | | | | | | | | | | | | | | | | | | | | | | |
Portfolio turnover rate4 | | | 69 | % | | | 116 | % | | | 149 | % | | | 114 | % | | | 114 | % | | | 79 | % |
Net assets, end of period (000s omitted) | | | $9,381 | | | | $10,108 | | | | $11,434 | | | | $16,649 | | | | $16,463 | | | | $16,225 | |
| 1 | Calculated based upon average shares outstanding |
| 2 | Total return calculations do not include any sales charges. Returns for periods of less than one year are not annualized. |
| 3 | Ratios include only the net expenses allocated from the affiliated Master Portfolios and do not include expenses from any other affiliated Underlying Funds. Net expenses allocated from the affiliated Master Portfolios included in the ratios were as follows: |
| | | | |
Six months ended November 30, 2020 (unaudited) | | | 0.40 | % |
Year ended May 31, 2020 | | | 0.45 | % |
Year ended May 31, 2019 | | | 0.48 | % |
Year ended May 31, 2018 | | | 0.51 | % |
Year ended May 31, 2017 | | | 0.50 | % |
Year ended May 31, 2016 | | | 0.50 | % |
| 4 | Portfolio turnover rate is calculated by multiplying the Fund’s ownership percentage in the respective affiliated Master Portfolio by the corresponding affiliated Master Portfolio’s purchases and sales. These purchases and sales amounts are aggregated with the direct purchases and sales in the affiliated Underlying Funds and unaffiliated securities and included in the portfolio turnover calculation. |
The accompanying notes are an integral part of these financial statements.
16 | Wells Fargo Growth Balanced Fund
Financial highlights
(For a share outstanding throughout each period)
| | | | | | | | | | | | | | | | | | | | | | | | |
| | | Six months ended
November 30, 2020
(unaudited) | | | Year ended May 31 | |
| ADMINISTRATOR CLASS | | 2020 | | | 2019 | | | 2018 | | | 2017 | | | 2016 | |
Net asset value, beginning of period | | | $40.83 | | | | $39.93 | | | | $42.04 | | | | $39.22 | | | | $35.78 | | | | $36.54 | |
Net investment income | | | 0.41 | | | | 0.84 | | | | 1.05 | | | | 0.75 | | | | 0.50 | 1 | | | 0.49 | |
Net realized and unrealized gains (losses) on investments | | | 5.82 | | | | 1.41 | | | | (0.90 | ) | | | 2.63 | | | | 3.47 | | | | (0.82 | ) |
| | | | | | | | | | | | | | | | | | | | | | | | |
Total from investment operations | | | 6.23 | | | | 2.25 | | | | 0.15 | | | | 3.38 | | | | 3.97 | | | | (0.33 | ) |
Distributions to shareholders from | | | | | | | | | | | | | | | | | | | | | | | | |
Net investment income | | | 0.00 | | | | (0.55 | ) | | | (1.43 | ) | | | (0.56 | ) | | | (0.53 | ) | | | (0.43 | ) |
Net realized gains | | | 0.00 | | | | (0.80 | ) | | | (0.83 | ) | | | 0.00 | | | | 0.00 | | | | 0.00 | |
| | | | | | | | | | | | | | | | | | | | | | | | |
Total distributions to shareholders | | | 0.00 | | | | (1.35 | ) | | | (2.26 | ) | | | (0.56 | ) | | | (0.53 | ) | | | (0.43 | ) |
Net asset value, end of period | | | $47.06 | | | | $40.83 | | | | $39.93 | | | | $42.04 | | | | $39.22 | | | | $35.78 | |
Total return2 | | | 15.28 | % | | | 5.51 | % | | | 0.70 | % | | | 8.63 | % | | | 11.19 | % | | | (0.86 | )% |
Ratios to average net assets (annualized) | | | | | | | | | | | | | | | | | | | | | | | | |
Gross expenses3 | | | 1.19 | % | | | 1.24 | % | | | 1.25 | % | | | 1.27 | % | | | 1.26 | % | | | 1.27 | % |
Net expenses3 | | | 0.86 | % | | | 0.86 | % | | | 0.89 | % | | | 0.92 | % | | | 0.95 | % | | | 0.95 | % |
Net investment income3 | | | 1.25 | % | | | 1.57 | % | | | 1.72 | % | | | 1.51 | % | | | 1.34 | % | | | 1.35 | % |
Supplemental data | | | | | | | | | | | | | | | | | | | | | | | | |
Portfolio turnover rate4 | | | 69 | % | | | 116 | % | | | 149 | % | | | 114 | % | | | 114 | % | | | 79 | % |
Net assets, end of period (000s omitted) | | | $133,269 | | | | $129,531 | | | | $138,788 | | | | $157,889 | | | | $162,693 | | | | $175,715 | |
| 1 | Calculated based upon average shares outstanding |
| 2 | Returns for periods of less than one year are not annualized. |
| 3 | Ratios include only the net expenses allocated from the affiliated Master Portfolios and do not include expenses from any other affiliated Underlying Funds. Net expenses allocated from the affiliated Master Portfolios included in the ratios were as follows: |
| | | | |
Six months ended November 30, 2020 (unaudited) | | | 0.40 | % |
Year ended May 31, 2020 | | | 0.45 | % |
Year ended May 31, 2019 | | | 0.47 | % |
Year ended May 31, 2018 | | | 0.51 | % |
Year ended May 31, 2017 | | | 0.50 | % |
Year ended May 31, 2016 | | | 0.50 | % |
| 4 | Portfolio turnover rate is calculated by multiplying the Fund’s ownership percentage in the respective affiliated Master Portfolio by the corresponding affiliated Master Portfolio’s purchases and sales. These purchases and sales amounts are aggregated with the direct purchases and sales in the affiliated Underlying Funds and unaffiliated securities and included in the portfolio turnover calculation. |
The accompanying notes are an integral part of these financial statements.
Wells Fargo Growth Balanced Fund | 17
Notes to financial statements (unaudited)
1. ORGANIZATION
Wells Fargo Funds Trust (the “Trust”), a Delaware statutory trust organized on March 10, 1999, is an open-end management investment company registered under the Investment Company Act of 1940, as amended (the “1940 Act”). As an investment company, the Trust follows the accounting and reporting guidance in Financial Accounting Standards Board (“FASB”) Accounting Standards Codification Topic 946, Financial Services – Investment Companies. These financial statements report on the Wells Fargo Growth Balanced Fund (the “Fund”) which is a diversified series of the Trust.
The Fund is a fund-of-funds that invests in various affiliated mutual funds (“Underlying Funds”) employing a multi-asset, multi-style investment approach designed to reduce the price and return volatility of the Fund and to provide more consistent returns. The Fund may also invest directly in securities. The Underlying Funds incur separate expenses in seeking to achieve their investment objectives. Investments in affiliated Underlying Funds may also include investments in one or more separate diversified portfolios (collectively, the “affiliated Master Portfolios”) of Wells Fargo Master Trust, a registered open-end management investment company. Each affiliated Master Portfolio directly acquires portfolio securities and the Fund acquires an indirect interest in those securities. The Fund accounts for its investments in the affiliated Master Portfolios as partnership investments and records on a daily basis its share of the affiliated Master Portfolio’s income, expense and realized and unrealized gains and losses. The financial statements of the affiliated Master Portfolios are presented in separate financial statements and may be obtained free of charge by contacting Investor Services or by visiting the SEC website at sec.gov. The financial statements of the affiliated Master Portfolios are filed with the SEC under Wells Fargo Master Trust. The financial statements for all other affiliated Underlying Funds are also publicly available on the SEC website at sec.gov.
2. SIGNIFICANT ACCOUNTING POLICIES
The following significant accounting policies, which are consistently followed in the preparation of the financial statements of the Fund, are in conformity with U.S. generally accepted accounting principles which require management to make estimates and assumptions that affect the reported amounts of assets and liabilities, disclosure of contingent assets and liabilities at the date of the financial statements, and the reported amounts of income and expenses during the reporting period. Actual results could differ from those estimates.
Securities valuation
All investments are valued each business day as of the close of regular trading on the New York Stock Exchange (generally 4 p.m. Eastern Time), although the Fund may deviate from this calculation time under unusual or unexpected circumstances.
Investments in the affiliated Master Portfolios are valued daily based on the Fund’s proportionate share of each affiliated Master Portfolio’s net assets, which are also valued daily.
Investments in underlying mutual funds are valued at net asset per share as reported by the Underlying Funds as of the close of the regular trading on the New York Stock Exchange on each day the exchange is open for trading.
Debt securities are valued at the evaluated bid price provided by an independent pricing service (e.g. taking into account various factors, including yields, maturities, or credit ratings) or, if a reliable price is not available, the quoted bid price from an independent broker-dealer.
Equity securities and futures contracts that are listed on a foreign or domestic exchange or market are valued at the official closing price or, if none, the last sales price. If no sale occurs on the principal exchange or market that day, a fair value price will be determined in accordance with the Fund’s Valuation Procedures.
Investments which are not valued using any of the methods discussed above are valued at their fair value, as determined in good faith by the Board of Trustees of the Fund. The Board of Trustees has established a Valuation Committee comprised of the Trustees and has delegated to it the authority to take any actions regarding the valuation of portfolio securities that the Valuation Committee deems necessary or appropriate, including determining the fair value of portfolio securities, unless the determination has been delegated to the Wells Fargo Asset Management Pricing Committee at Wells Fargo Funds Management, LLC (“Funds Management”). The Board of Trustees retains the authority to make or ratify any valuation decisions or approve any changes to the Valuation Procedures as it deems appropriate. On a quarterly basis, the Board of Trustees receives reports on any valuation actions taken by the Valuation Committee or the Wells Fargo Asset Management Pricing Committee which may include items for ratification.
Futures contracts
Futures contracts are agreements between the Fund and a counterparty to buy or sell a specific amount of a commodity, financial instrument or currency at a specified price and on a specified date. The Fund may buy and sell futures contracts in order to gain exposure to, or protect against, changes in interest rates, security values, and foreign exchange rates and is
18 | Wells Fargo Growth Balanced Fund
Notes to financial statements (unaudited)
subject to interest rate risk, equity price risk, and foreign currency risk. The primary risks associated with the use of futures contracts are the imperfect correlation between changes in market values of securities held by the Fund and the prices of futures contracts, and the possibility of an illiquid market. Futures contracts are generally entered into on a regulated futures exchange and cleared through a clearinghouse associated with the exchange. With futures contracts, there is minimal counterparty risk to the Fund since futures contracts are exchange traded and the exchange’s clearinghouse, as the counterparty to all exchange traded futures, guarantees the futures contracts against default.
Upon entering into a futures contracts, the Fund is required to deposit either cash or securities (initial margin) with the broker in an amount equal to a certain percentage of the contract value. Subsequent payments (variation margin) are paid to or from the broker each day equal to the daily changes in the contract value. Such payments are recorded as unrealized gains or losses and, if any, shown as variation margin receivable (payable) in the Statement of Assets and Liabilities. Should the Fund fail to make requested variation margin payments, the broker can gain access to the initial margin to satisfy the Fund’s payment obligations. When the contracts are closed, a realized gain or loss is recorded in the Statement of Operations.
Investment transactions, income and expenses
Investments in the affiliated Master Portfolios are recorded on a trade basis. The Fund records daily its proportionate share of each affiliated Master Portfolio’s income, expenses and realized and unrealized gains or losses. The Fund also accrues its own expenses.
Securities transactions are recorded on a trade date basis. Realized gains or losses are recorded on the basis of identified cost.
Income dividends and capital gain distributions from investment companies are recorded on the ex-dividend date. Capital gain distributions from investment companies are treated as realized gains.
Distributions to shareholders
Distributions to shareholders from net investment income and any net realized gains are recorded on the ex-dividend date and paid at least annually. Such distributions are determined in accordance with income tax regulations and may differ from U.S. generally accepted accounting principles. Dividend sources are estimated at the time of declaration. The tax character of distributions is determined as of the Fund’s fiscal year end. Therefore, a portion of the Fund’s distributions made prior to the Fund’s fiscal year end may be categorized as a tax return of capital at year end.
Federal and other taxes
The Fund intends to continue to qualify as a regulated investment company by distributing substantially all of its investment company taxable income and any net realized capital gains (after reduction for capital loss carryforwards) sufficient to relieve it from all, or substantially all, federal income taxes. Accordingly, no provision for federal income taxes was required.
The Fund’s income and federal excise tax returns and all financial records supporting those returns for the prior three fiscal years are subject to examination by the federal and Delaware revenue authorities. Management has analyzed the Fund’s tax positions taken on federal, state, and foreign tax returns for all open tax years and does not believe that there are any uncertain tax positions that require recognition of a tax liability.
As of November 30, 2020, the aggregate cost of all investments for federal income tax purposes was $173,434,563 and the unrealized gains (losses) consisted of:
| | | | |
| |
Gross unrealized gains | | $ | 42,638,365 | |
| |
Gross unrealized losses | | | 0 | |
| |
Net unrealized gains | | $ | 42,638,365 | |
Class allocations
The separate classes of shares offered by the Fund differ principally in applicable sales charges, distribution, shareholder servicing, and administration fees. Class specific expenses are charged directly to that share class. Investment income, common fund-level expenses, and realized and unrealized gains (losses) on investments are allocated daily to each class of shares based on the relative proportion of net assets of each class.
3. FAIR VALUATION MEASUREMENTS
Fair value measurements of investments are determined within a framework that has established a fair value hierarchy based upon the various data inputs utilized in determining the value of the Fund’s investments. The three-level hierarchy gives the highest priority to unadjusted quoted prices in active markets for identical assets or liabilities (Level 1) and the lowest priority to
Wells Fargo Growth Balanced Fund | 19
Notes to financial statements (unaudited)
unobservable inputs (Level 3). The Fund’s investments are classified within the fair value hierarchy based on the lowest level of input that is significant to the fair value measurement. The inputs are summarized into three broad levels as follows:
| ∎ | | Level 1 – quoted prices in active markets for identical securities |
| ∎ | | Level 2 – other significant observable inputs (including quoted prices for similar securities, interest rates, prepayment speeds, credit risk, etc.) |
| ∎ | | Level 3 – significant unobservable inputs (including the Fund’s own assumptions in determining the fair value of investments) |
The inputs or methodologies used for valuing investments in securities are not necessarily an indication of the risk associated with investing in those securities.
The following is a summary of the inputs used in valuing the Fund’s assets and liabilities as of November 30, 2020:
| | | | | | | | | | | | | | | | |
| | | | |
| | | Quoted prices
(Level 1) | | | Other significant
observable inputs
(Level 2) | | | Significant
unobservable inputs (Level 3) | | | Total | |
| | | | |
Assets | | | | | | | | | | | | | | | | |
Investments in: | | | | | | | | | | | | | | | | |
| | | | |
Exchange-traded funds | | $ | 12,553,587 | | | $ | 0 | | | $ | 0 | | | $ | 12,553,587 | |
| | | | |
Investment companies | | | 31,642,341 | | | | 0 | | | | 0 | | | | 31,642,341 | |
| | | | |
Investments measured at net asset value* | | | | | | | | | | | | | | | 171,387,518 | |
| | | | |
| | | 44,195,928 | | | | 0 | | | | 0 | | | | 215,583,446 | |
| | | | |
Futures contracts | | | 670,391 | | | | 0 | | | | 0 | | | | 670,391 | |
| | | | |
Total assets | | $ | 44,866,319 | | | $ | 0 | | | $ | 0 | | | $ | 216,253,837 | |
| | | | |
Liabilities | | | | | | | | | | | | | | | | |
| | | | |
Futures contracts | | $ | 180,909 | | | $ | 0 | | | $ | 0 | | | $ | 180,909 | |
| | | | |
Total liabilities | | $ | 180,909 | | | $ | 0 | | | $ | 0 | | | $ | 180,909 | |
| * | Investments that are measured at fair value using the net asset value per share (or its equivalent) as a practical expedient have not been categorized in the fair value hierarchy. The fair value amount presented in the table is intended to permit reconciliation of the fair value hierarchy to the amounts presented in the Statement of Assets and Liabilities. The Fund’s investment in affiliated Master Portfolios are valued at $171,387,518. Each affiliated Master Portfolio does not have a redemption period notice, can be redeemed daily and does not have any unfunded commitments. |
Futures contracts are reported at their cumulative unrealized gains (losses) at measurement date as reported in the table following the Portfolio of Investments. For futures contracts, the current day’s variation margin is reported on the Statement of Assets and Liabilities. All other assets and liabilities are reported at their market value at measurement date.
For the six months ended November 30, 2020, the Fund did not have any transfers into/out of Level 3.
20 | Wells Fargo Growth Balanced Fund
Notes to financial statements (unaudited)
The investment objective of each affiliated Master Portfolio is as follows:
| | |
| |
| Affiliated Master Portfolio | | Investment objective |
| |
Wells Fargo C&B Large Cap Value Portfolio | | Seeks maximum long-term total return (current income and capital appreciation), consistent with minimizing risk to principal |
| |
Wells Fargo Core Bond Portfolio | | Seeks total return, consisting of income and capital appreciation |
| |
Wells Fargo Disciplined International Developed Markets Portfolio | | Seeks long-term capital appreciation |
| |
Wells Fargo Diversified Large Cap Growth Portfolio | | Seeks long-term capital appreciation |
| |
Wells Fargo Emerging Growth Portfolio | | Seeks long-term capital appreciation |
| |
Wells Fargo Factor Enhanced Emerging Markets Portfolio | | Seeks long-term capital appreciation |
| |
Wells Fargo Factor Enhanced International Equity Portfolio | | Seeks long-term capital appreciation |
| |
Wells Fargo International Value Portfolio | | Seeks long-term capital appreciation |
| |
Wells Fargo Large Company Value Portfolio | | Seeks long-term capital appreciation |
| |
Wells Fargo Managed Fixed Income Portfolio | | Seeks consistent fixed-income returns |
| |
Wells Fargo Real Return Portfolio | | Seeks returns that exceed the rate of inflation over the long-term |
| |
Wells Fargo Small Company Growth Portfolio | | Seeks long-term capital appreciation |
| |
Wells Fargo Small Company Value Portfolio | | Seeks long-term capital appreciation |
4. TRANSACTIONS WITH AFFILIATES
Management fee
Funds Management, an indirect wholly owned subsidiary of Wells Fargo & Company (“Wells Fargo”), is the manager of the Fund and provides advisory and fund-level administrative services under an investment management agreement. Under the investment management agreement, Funds Management is responsible for, among other services, implementing the investment objectives and strategies of the Fund and providing fund-level administrative services in connection with the Fund’s operations. As long as the Fund continues to invest substantially all of its assets in a single affiliated Master Portfolio, the Fund pays Funds Management an investment management fee only for fund-level administrative services at the following annual rate based on the Fund’s average daily net assets:
| | | | |
| |
| Average daily net assets | | Management fee | |
| |
First $500 million | | | 0.30 | % |
| |
Next $500 million | | | 0.28 | |
| |
Next $2 billion | | | 0.26 | |
| |
Next $2 billion | | | 0.24 | |
| |
Next $5 billion | | | 0.23 | |
| |
Over $10 billion | | | 0.22 | |
For the six months ended November 30, 2020, the management fee was equivalent to an annual rate of 0.30% of the Fund’s average daily net assets.
Funds Management also serves as the adviser to each affiliated Master Portfolio and is entitled to receive a fee from each affiliated Master Portfolio for those services.
Funds Management has retained the services of a subadviser to provide daily portfolio management to the Fund. The fee for subadvisory services is borne by Funds Management. Wells Capital Management Incorporated, an affiliate of Funds Management and an indirect wholly owned subsidiary of Wells Fargo, is the subadviser to the Fund and is entitled to receive a fee from Funds Management at an annual rate starting at 0.10% and declining to 0.05% as the average daily net assets of the Fund increase.
Wells Fargo Growth Balanced Fund | 21
Notes to financial statements (unaudited)
Administration fees
Under a class-level administration agreement, Funds Management provides class-level administrative services to the Fund, which includes paying fees and expenses for services provided by the transfer agent, sub-transfer agents, omnibus account servicers and record-keepers. As compensation for its services under the class-level administration agreement, Funds Management receives an annual fee which is calculated based on the average daily net assets of each class as follows:
| | | | |
| |
| | | Class-level
administration fee | |
| |
Class A, Class C | | | 0.21 | % |
| |
Administrator Class | | | 0.13 | |
Waivers and/or expense reimbursements
Funds Management has contractually waived and/or reimbursed management and administration fees to the extent necessary to maintain certain net operating expense ratios for the Fund. When each class of the Fund has exceeded its expense cap, Funds Management has waived fees and/or reimbursed expenses from fund-level expenses on a proportionate basis and then from class specific expenses. When only certain classes exceed their expense caps, waivers and/or reimbursements are applied against class specific expenses before fund-level expenses. Funds Management has committed through September 30, 2021 to waive fees and/or reimburse expenses to the extent necessary to cap the Fund’s expenses at 1.13% for Class A shares, 1.88% for Class C shares, and 0.95% for Administrator Class shares. Prior to or after the commitment expiration date, the cap may be increased or the commitment to maintain the cap may be terminated only with the approval of the Board of Trustees.
Distribution fee
The Trust has adopted a distribution plan for Class C shares of the Fund pursuant to Rule 12b-1 under the 1940 Act. A distribution fee is charged to Class C shares and paid to Wells Fargo Funds Distributor, LLC (“Funds Distributor”), the principal underwriter, at an annual rate of 0.75% of the average daily net assets of Class C shares.
In addition, Funds Distributor is entitled to receive the front-end sales charge from the purchase of Class A shares and a contingent deferred sales charge on the redemption of certain Class A shares. Funds Distributor is also entitled to receive the contingent deferred sales charges from redemptions of Class C shares. For the six months ended November 30, 2020, Funds Distributor received $2,809 from the sale of Class A shares. No contingent deferred sales charges were incurred by Class A and Class C shares for the six months ended November 30, 2020.
Shareholder servicing fees
The Trust has entered into contracts with one or more shareholder servicing agents, whereby Class A, Class C, and Administrator Class of the Fund are charged a fee at an annual rate of 0.25% of the average daily net assets of each respective class. A portion of these total shareholder servicing fees were paid to affiliates of Wells Fargo.
5. INVESTMENT PORTFOLIO TRANSACTIONS
The Fund seeks to achieve its investment objective by investing in multiple affiliated Master Portfolios. Purchases and sales related to these investments have been calculated by aggregating the results of multiplying the Fund’s ownership percentage in the respective affiliated Master Portfolio by the corresponding affiliated Master Portfolio’s purchases and sales. Purchases and sales of Underlying Funds and unaffiliated securities in which the Fund invests are actual purchases and sale of those securities. Purchases and sales of investments, excluding short-term securities, for the six months ended November 30, 2020 were as follows:
| | | | | | |
Purchases at cost | | Sales proceeds |
U.S. government | | Non-U.S. government | | U.S. government | | Non-U.S. government |
| $35,711,148 | | $92,717,246 | | $30,738,910 | | $133,642,990 |
6. DERIVATIVE TRANSACTIONS
During the six months ended November 30, 2020, the Fund entered into futures contracts to gain market exposure to certain asset classes consistent with its asset allocation strategy. The Fund had an average notional amount of $15,300,247 in long futures contracts and $14,358,161 in short futures contracts during the six months ended November 30, 2020.
22 | Wells Fargo Growth Balanced Fund
Notes to financial statements (unaudited)
A summary of the location of derivative instruments on the financial statements by primary risk exposure is outlined in the following tables.
The fair value of derivative instruments as of November 30, 2020 by risk type was as follows for the Fund:
| | | | | | | | | | | | |
| | | Asset derivatives | | | Liability derivatives | |
| | | | |
| | | Statement of Assets and
Liabilities location | | Fair value | | | Statement of Assets and
Liabilities location | | Fair value | |
| | | | |
Equity risk | | Unrealized gains on futures contracts | | $ | 598,621 | * | | Unrealized losses on futures contracts | | $ | (180,909 | )* |
| | | | |
Interest rate risk | | Unrealized gains on futures contracts | | | 37,187 | * | | Unrealized losses on futures contracts | | | 0 | * |
| | | | |
Foreign currency risk | | Unrealized gains on futures contracts | | | 34,583 | * | | Unrealized losses on futures contracts | | | 0 | * |
| | | |
| | | $ | 670,391 | | | | | $ | (180,909 | ) |
| * | Amount represents cumulative unrealized gains (losses) as reported in the table following the Portfolio of Investments. Only the current day’s variation margin as of November 30, 2019 is reported separately on the Statement of Assets and Liabilities. |
The effect of derivative instruments on the Statement of Operations for the six months ended November 30, 2020 was as follows for the Fund:
| | | | | | | | |
| | |
| | | Amount of realized
gains (losses) on
derivatives | | | Change in unrealized
gains (losses) on
derivatives | |
| | |
Equity risk | | $ | 2,318,902 | | | $ | (981,101 | ) |
| | |
Interest rate risk | | | 102,850 | | | | 37,187 | |
| | |
Foreign currency risk | | | (527,735 | ) | | | 126,525 | |
| | |
| | | $ | 1,894,017 | | | $ | (817,389 | ) |
7. BANK BORROWINGS
The Trust (excluding the money market funds), Wells Fargo Master Trust and Wells Fargo Variable Trust are parties to a $350,000,000 revolving credit agreement whereby the Fund is permitted to use bank borrowings for temporary or emergency purposes, such as to fund shareholder redemption requests. Interest under the credit agreement is charged to the Fund based on a borrowing rate equal to the higher of the Federal Funds rate in effect on that day plus 1.25% or the overnight LIBOR rate in effect on that day plus 1.25%. In addition, an annual commitment fee equal to 0.25% of the unused balance is allocated to each participating fund.
For the six months ended November 30, 2020, there were no borrowings by the Fund under the agreement.
8. INDEMNIFICATION
Under the Fund’s organizational documents, the officers and Trustees have been granted certain indemnification rights against certain liabilities that may arise out of performance of their duties to the Fund. The Fund has entered into a separate agreement with each Trustee that converts indemnification rights currently existing under the Fund’s organizational documents into contractual rights that cannot be changed in the future without the consent of the Trustee. Additionally, in the normal course of business, the Fund may enter into contracts with service providers that contain a variety of indemnification clauses. The Fund’s maximum exposure under these arrangements is dependent on future claims that may be made against the Fund and, therefore, cannot be estimated.
9. NEW ACCOUNTING PRONOUNCEMENT
In August 2018, FASB issued Accounting Standards Update (“ASU”) No. 2018-13, Fair Value Measurement (Topic 820) Disclosure Framework—Changes to the Disclosure Requirements for Fair Value Measurement. ASU 2018-13 updates the disclosure requirements on fair value measurements in Topic 820, Fair Value Measurements. The amendments are effective for fiscal years, and interim periods within those fiscal years, beginning after December 15, 2019. Management has adopted this guidance which did not have a material impact on the financial statements.
Wells Fargo Growth Balanced Fund | 23
Notes to financial statements (unaudited)
10. CORONAVIRUS (COVID-19) PANDEMIC
On March 11, 2020, the World Health Organization announced that it had made the assessment that coronavirus disease 2019 (“COVID-19”) is a pandemic. The impacts of COVID-19 are adversely affecting the entire global economy, individual companies and investment products, and the market in general. There is significant uncertainty around the extent and duration of business disruptions related to COVID-19 and the impacts may be short term or may last for an extended period of time. The risk of further spreading of COVID-19 has led to significant uncertainty and volatility in the financial markets.
24 | Wells Fargo Growth Balanced Fund
Other information (unaudited)
PROXY VOTING INFORMATION
A description of the policies and procedures used to determine how to vote proxies relating to portfolio securities is available, upon request, by calling 1-800-222-8222, visiting our website at wfam.com, or visiting the SEC website at sec.gov. Information regarding how the proxies related to portfolio securities were voted during the most recent 12-month period ended June 30 is available on the website at wfam.com or by visiting the SEC website at sec.gov.
QUARTERLY PORTFOLIO HOLDINGS INFORMATION
The Fund files its complete schedule of portfolio holdings with the SEC for the first and third quarters of each fiscal year as an exhibit to its reports on Form N-PORT. Shareholders may view the filed Form N-PORT by visiting the SEC website at sec.gov.
Wells Fargo Growth Balanced Fund | 25
Other information (unaudited)
BOARD OF TRUSTEES AND OFFICERS
Each of the Trustees and Officers1 listed in the table below acts in identical capacities for each fund in the Wells Fargo family of funds, which consists of 144 mutual funds comprising the Wells Fargo Funds Trust, Wells Fargo Variable Trust, Wells Fargo Master Trust and four closed-end funds (collectively the “Fund Complex”). This table should be read in conjunction with the Prospectus and the Statement of Additional Information2. The mailing address of each Trustee and Officer is 525 Market Street, 12th Floor, San Francisco, CA 94105. Each Trustee and Officer serves an indefinite term, however, each Trustee serves such term until reaching the mandatory retirement age established by the Trustees.
Independent Trustees
| | | | | | |
Name and year of birth | | Position held and
length of service* | | Principal occupations during past five years or longer | | Current other
public company or
investment
company
directorships |
| | | |
William R. Ebsworth (Born 1957) | | Trustee,
since 2015 | | Retired. From 1984 to 2013, equities analyst, portfolio manager, research director and chief investment officer at Fidelity Management and Research Company in Boston, Tokyo, and Hong Kong, and retired in 2013 as Chief Investment Officer of Fidelity Strategic Advisers, Inc. where he led a team of investment professionals managing client assets. Prior thereto, Board member of Hong Kong Securities Clearing Co., Hong Kong Options Clearing Corp., the Thailand International Fund, Ltd., Fidelity Investments Life Insurance Company, and Empire Fidelity Investments Life Insurance Company. Audit Committee Chair and Investment Committee Chair of the Vincent Memorial Hospital Endowment (non-profit organization). Mr. Ebsworth is a CFA® charterholder. | | N/A |
| | | |
Jane A. Freeman (Born 1953) | | Trustee,
since 2015;
Chair Liaison,
since 2018 | | Retired. From 2012 to 2014 and 1999 to 2008, Chief Financial Officer of Scientific Learning Corporation. From 2008 to 2012, Ms. Freeman provided consulting services related to strategic business projects. Prior to 1999, Portfolio Manager at Rockefeller & Co. and Scudder, Stevens & Clark. Board member of the Harding Loevner Funds from 1996 to 2014, serving as both Lead Independent Director and chair of the Audit Committee. Board member of the Russell Exchange Traded Funds Trust from 2011 to 2012 and the chair of the Audit Committee. Ms. Freeman is also an inactive Chartered Financial Analyst. | | N/A |
| | | |
Isaiah Harris, Jr. (Born 1952) | | Trustee,
since 2009;
Audit Committee Chair, since 2019 | | Retired. Chairman of the Board of CIGNA Corporation since 2009, and Director since 2005. From 2003 to 2011, Director of Deluxe Corporation. Prior thereto, President and CEO of BellSouth Advertising and Publishing Corp. from 2005 to 2007, President and CEO of BellSouth Enterprises from 2004 to 2005 and President of BellSouth Consumer Services from 2000 to 2003. Emeritus member of the Iowa State University Foundation Board of Governors. Emeritus Member of the Advisory Board of Iowa State University School of Business. Advisory Board Member, Palm Harbor Academy (private school). Mr. Harris is a certified public accountant (inactive status). | | CIGNA Corporation |
| | | |
Judith M. Johnson (Born 1949) | | Trustee,
since 2008 | | Retired. Prior thereto, Chief Executive Officer and Chief Investment Officer of Minneapolis Employees Retirement Fund from 1996 to 2008. Ms. Johnson is an attorney, certified public accountant and a certified managerial accountant. | | N/A |
| | | |
David F. Larcker (Born 1950) | | Trustee,
since 2009 | | James Irvin Miller Professor of Accounting at the Graduate School of Business (Emeritus), Stanford University, Director of the Corporate Governance Research Initiative and Senior Faculty of The Rock Center for Corporate Governance since 2006. From 2005 to 2008, Professor of Accounting at the Graduate School of Business, Stanford University. Prior thereto, Ernst & Young Professor of Accounting at The Wharton School, University of Pennsylvania from 1985 to 2005. | | N/A |
26 | Wells Fargo Growth Balanced Fund
Other information (unaudited)
| | | | | | |
Name and year of birth | | Position held and
length of service* | | Principal occupations during past five years or longer | | Current other
public company or
investment
company
directorships |
| | | |
Olivia S. Mitchell (Born 1953) | | Trustee,
since 2006; Nominating and Governance Committee Chair, since 2018 | | International Foundation of Employee Benefit Plans Professor, Wharton School of the University of Pennsylvania since 1993. Director of Wharton’s Pension Research Council and Boettner Center on Pensions & Retirement Research, and Research Associate at the National Bureau of Economic Research. Previously, Cornell University Professor from 1978 to 1993. | | N/A |
| | | |
Timothy J. Penny (Born 1951) | | Trustee,
since 1996; Chair,
since 2018 | | President and Chief Executive Officer of Southern Minnesota Initiative Foundation, a non-profit organization, since 2007. Member of the Board of Trustees of NorthStar Education Finance, Inc., a non-profit organization, since 2007. | | N/A |
| | | |
James G. Polisson (Born 1959) | | Trustee,
since 2018 | | Retired. Chief Marketing Officer, Source (ETF) UK Services, Ltd, from 2015 to 2017. From 2012 to 2015, Principal of The Polisson Group, LLC, a management consulting, corporate advisory and principal investing company. Chief Executive Officer and Managing Director at Russell Investments, Global Exchange Traded Funds from 2010 to 2012. Managing Director of Barclays Global Investors from 1998 to 2010 and Global Chief Marketing Officer for iShares and Barclays Global Investors from 2000 to 2010. Trustee of the San Francisco Mechanics’ Institute, a non-profit organization, from 2013 to 2015. Board member of the Russell Exchange Traded Fund Trust from 2011 to 2012. Director of Barclays Global Investors Holdings Deutschland GmbH from 2006 to 2009. Mr. Polisson is an attorney and has a retired status with the Massachusetts and District of Columbia Bar Associations. | | N/A |
| | | |
Pamela Wheelock (Born 1959) | | Trustee, since January 2020; previously Trustee from January 2018 to July 2019 | | Board member of the Destination Medical Center Economic Development Agency, Rochester, Minnesota since 2019. Interim President of the McKnight Foundation from January to September 2020. Acting Commissioner, Minnesota Department of Human Services, July 2019 through September 2019. Human Services Manager (part-time), Minnesota Department of Human Services, October 2019 through December 2019. Chief Operating Officer, Twin Cities Habitat for Humanity from 2017 to 2019. Vice President of University Services, University of Minnesota from 2012 to 2016. Prior thereto, on the Board of Directors, Governance Committee and Finance Committee for the Minnesota Philanthropy Partners (Saint Paul Foundation) from 2012 to 2018, Interim Chief Executive Officer of Blue Cross Blue Shield of Minnesota from 2011 to 2012, Chairman of the Board from 2009 to 2012 and Board Director from 2003 to 2015. Vice President, Leadership and Community Engagement, Bush Foundation, Saint Paul, Minnesota (a private foundation) from 2009 to 2011. Executive Vice President and Chief Financial Officer, Minnesota Sports and Entertainment from 2004 to 2009 and Senior Vice President from 2002 to 2004. Executive Vice President of the Minnesota Wild Foundation from 2004 to 2008. Commissioner of Finance, State of Minnesota, from 1999 to 2002. Currently Board Chair of the Minnesota Wild Foundation since 2010. | | N/A |
| * | Length of service dates reflect the Trustee’s commencement of service with the Trust’s predecessor entities, where applicable. |
Wells Fargo Growth Balanced Fund | 27
Other information (unaudited)
Officers
| | | | |
Name and year of birth | | Position held and
length of service | | Principal occupations during past five years or longer |
| | |
Andrew Owen (Born 1960) | | President,
since 2017 | | Executive Vice President of Wells Fargo & Company and Head of Affiliated Managers, Wells Fargo Asset Management, since 2014. In addition, Mr. Owen is currently President, Chief Executive Officer and Director of Wells Fargo Funds Management, LLC since 2017. Prior thereto, Executive Vice President responsible for marketing, investments and product development for Wells Fargo Funds Management, LLC, from 2009 to 2014. |
| | |
| Jeremy DePalma1 (Born 1974) | | Treasurer,
since 2012 | | Senior Vice President of Wells Fargo Funds Management, LLC since 2009. Senior Vice President of Evergreen Investment Management Company, LLC from 2008 to 2010 and head of the Fund Reporting and Control Team within Fund Administration from 2005 to 2010. |
| | |
Michelle Rhee (Born 1966) | | Chief Legal Officer, since 2019 | | Secretary of Wells Fargo Funds Management, LLC and Chief Legal Counsel of Wells Fargo Asset Management since 2018. Deputy General Counsel of Wells Fargo Bank, N.A. since 2020 and Assistant General Counsel of Wells Fargo Bank, N.A. from 2018 to 2020. Associate General Counsel and Managing Director of Bank of America Corporation from 2004 to 2018. |
| | |
| Catherine Kennedy (Born 1969) | | Secretary,
since 2019 | | Vice President of Wells Fargo Funds Management, LLC and Senior Counsel of the Wells Fargo Legal Department since 2010. Vice President and Senior Counsel of Evergreen Investment Management Company, LLC from 1998 to 2010. |
| | |
| Michael H. Whitaker (Born 1967) | | Chief Compliance Officer,
since 2016 | | Chief Compliance Officer of Wells Fargo Asset Management since 2016. Senior Vice President and Chief Compliance Officer for Fidelity Investments from 2007 to 2016. |
| 1 | Jeremy DePalma acts as Treasurer of 77 funds in the Fund Complex. |
| 2 | The Statement of Additional Information includes additional information about the Trustees and is available, without charge, upon request, by calling 1-800-222-8222 or by visiting the website at wfam.com. |
28 | Wells Fargo Growth Balanced Fund

For more information
More information about Wells Fargo Funds is available free upon request. To obtain literature, please write, visit the Fund’s website, or call:
Wells Fargo Funds
P.O. Box 219967
Kansas City, MO 64121-9967
Website: wfam.com
Individual investors: 1-800-222-8222
Retail investment professionals: 1-888-877-9275
Institutional investment professionals: 1-866-765-0778

This report and the financial statements contained herein are submitted for the general information of the shareholders of the Fund. If this report is used for promotional purposes, distribution of the report must be accompanied or preceded by a current prospectus. Before investing, please consider the investment objectives, risks, charges, and expenses of the investment. For a current prospectus and, if available, a summary prospectus, containing this information, call 1-800-222-8222 or visit the Fund’s website at wfam.com. Read the prospectus carefully before you invest or send money.
Wells Fargo Asset Management (WFAM) is the trade name for certain investment advisory/management firms owned by Wells Fargo & Company. These firms include but are not limited to Wells Capital Management Incorporated and Wells Fargo Funds Management, LLC. Certain products managed by WFAM entities are distributed by Wells Fargo Funds Distributor, LLC (a broker-dealer and Member FINRA).
This material is for general informational and educational purposes only and is NOT intended to provide investment advice or a recommendation of any kind—including a recommendation for any specific investment, strategy, or plan.
INVESTMENT PRODUCTS: NOT FDIC INSURED ◾ NO BANK GUARANTEE ◾ MAY LOSE VALUE
© 2021 Wells Fargo & Company. All rights reserved.
PAR-1220-00726 01-20
SA278/SAR278 11-20
Semi-Annual Report
November 30, 2020
Wells Fargo Moderate Balanced Fund
|
|
|
Reduce clutter. Save trees. |
Sign up for electronic delivery of prospectuses and shareholder reports at wellsfargo.com/advantagedelivery |
The views expressed and any forward-looking statements are as of November 30, 2020, unless otherwise noted, and are those of the Fund’s portfolio managers and/or Wells Fargo Asset Management. Discussions of individual securities, or the markets generally, or any Wells Fargo Fund are not intended as individual recommendations. Future events or results may vary significantly from those expressed in any forward-looking statements. The views expressed are subject to change at any time in response to changing circumstances in the market. Wells Fargo Asset Management and the Fund disclaim any obligation to publicly update or revise any views expressed or forward-looking statements.
INVESTMENT PRODUCTS: NOT FDIC INSURED ◾ NO BANK GUARANTEE ◾ MAY LOSE VALUE
Wells Fargo Moderate Balanced Fund | 1
Letter to shareholders (unaudited)

Andrew Owen
President
Wells Fargo Funds
“Global stock markets rallied strongly, driven by aggressive stimulus measures introduced by central banks and governments in response to challenges presented by the COVID-19 pandemic.”
Dear Shareholder:
We are pleased to offer you this semi-annual report for the Wells Fargo Moderate Balanced Fund for the six-month period that ended November 30, 2020. Global stock markets rallied strongly, driven by aggressive stimulus measures introduced by central banks and governments in response to challenges presented by the COVID-19 pandemic. Emerging market equities had particularly robust results during the six-month period. Among bonds, high-yield issues led the way while U.S. bonds generally had more modest returns than their international counterparts.
For the period, U.S. stocks, based on the S&P 500 Index,1 returned 19.98% and international stocks, as measured by the MSCI ACWI ex USA Index (Net),2 gained 23.28%. The MSCI EM Index (Net)3 rallied 31.14%. Among bond investments, the Bloomberg Barclays U.S. Aggregate Bond Index4 returned a modest 1.79%, the Bloomberg Barclays Global Aggregate ex-USD Index5 gained a robust 8.19%, the Bloomberg Barclays Municipal Bond Index6 had a 3.29% return, and the ICE BofA U.S. High Yield Index7 gained a healthy 10.47%.
Equities enjoyed a strong tailwind from monetary and fiscal stimulus.
Financial markets posted widely positive returns in June despite ongoing economic weakness and uncertainty regarding COVID-19 and the timing of an effective vaccine. As economies reopened, optimism rose. Vitally important to market sentiment was the ongoing global central bank commitment to provide economic support through liquidity and low borrowing costs. U.S. economic activity was boosted by one-time $1,200 stimulus checks and $600 weekly bonus unemployment benefits for tens of millions of Americans through July. However, jobless rates remained historically high, easing somewhat from 14.7% in April to 11.1% in June. By late June, numerous states reported increases of COVID-19 cases, an ominous sign. China’s economic recovery picked up momentum in June.
July was broadly positive for both global equities and fixed income. However, economic data and a resurgence of COVID-19 cases pointed to the vulnerability of the global economy and the need to regain control of the pandemic. Second-quarter gross domestic product (GDP) shrank from the previous quarter by 9.5% and 12.1% in the U.S. and the eurozone, respectively. In contrast, China reported 3.2% year-over-year second-quarter GDP growth. U.S. unemployment remained high despite adding 1.8 million jobs in July, as a double-digit jobless rate persisted. However, manufacturing activity grew in both the U.S. and the eurozone. In Asia, while China’s manufacturing sector continued to expand, activity in Japan and South Korea contracted. A rising concern was the rapid and broad reemergence of COVID-19 infections.
| 1 | The S&P 500 Index consists of 500 stocks chosen for market size, liquidity, and industry group representation. It is a market-value-weighted index with each stock’s weight in the index proportionate to its market value. You cannot invest directly in an index. |
| 2 | The Morgan Stanley Capital International (MSCI) All Country World Index (ACWI) ex USA Index (Net) is a free-float-adjusted market-capitalization-weighted index that is designed to measure the equity market performance of developed and emerging markets, excluding the United States. Source: MSCI. MSCI makes no express or implied warranties or representations and shall have no liability whatsoever with respect to any MSCI data contained herein. The MSCI data may not be further redistributed or used as a basis for other indices or any securities or financial products. This report is not approved, reviewed, or produced by MSCI. You cannot invest directly in an index. |
| 3 | The MSCI Emerging Markets (EM) Index (Net) is a free-float-adjusted market-capitalization-weighted index that is designed to measure equity market performance of emerging markets. You cannot invest directly in an index. |
| 4 | The Bloomberg Barclays U.S. Aggregate Bond Index is a broad-based benchmark that measures the investment-grade, U.S. dollar-denominated, fixed-rate taxable bond market, including Treasuries, government-related and corporate securities, mortgage-backed securities (agency fixed-rate and hybrid adjustable-rate mortgage pass-throughs), asset-backed securities, and commercial mortgage-backed securities. You cannot invest directly in an index. |
| 5 | The Bloomberg Barclays Global Aggregate ex-USD Index is an unmanaged index that provides a broad-based measure of the global investment-grade fixed-income markets excluding the U.S. dollar-denominated debt market. You cannot invest directly in an index. |
| 6 | The Bloomberg Barclays Municipal Bond Index is an unmanaged index composed of long-term tax-exempt bonds with a minimum credit rating of Baa. You cannot invest directly in an index. |
| 7 | The ICE BofA U.S. High Yield Index is a market-capitalization-weighted index of domestic and Yankee high-yield bonds. The index tracks the performance of high-yield securities traded in the U.S. bond market. You cannot invest directly in an index. Copyright 2021. ICE Data Indices, LLC. All rights reserved. |
2 | Wells Fargo Moderate Balanced Fund
Letter to shareholders (unaudited)
The stock market continued to rally in August despite concerns over rising COVID-19 cases in the U.S. and Europe, as well as the expiration of the $600 weekly bonus unemployment benefit in July. Generally stronger-than-expected second-quarter earnings boosted investor sentiment along with the Federal Reserve’s announcement of a more accommodative policy shift that could lead to longer-term low interest rates. U.S. indices measuring manufacturing and services activities beat expectations while the U.S. housing market maintained strength. In Europe, retail sales expanded and consumer confidence was steady. China’s economy continued to expand.
Stocks grew more volatile in September on mixed economic data. U.S. economic activity continued to grow. However, only half of the 22 million jobs lost since the early spring had returned. The U.S. unemployment rate fell to 7.9% in September, a measurable improvement but far higher than the 3.5% pre-COVID-19 rate. Only 661,000 jobs were added for the month, down from 1.5 million in August. With the U.S. Congress failing to pass further fiscal relief and uncertainties surrounding a possible vaccine, doubts crept back into the markets. In the U.K., a lack of progress in Brexit talks with the European Union weighed on markets. China’s economy picked up steam, however, with growth fueled by increased global demand.
In October, capital markets took a step back from their six-month rally. Market volatility rose in advance of the U.S. election and amid a global increase in COVID-19 infections. Europe responded with more economic restrictions. Meanwhile, Brexit remained unresolved. U.S. markets looked favorably at a possible Democratic sweep and control of the federal purse strings in anticipation of additional fiscal stimulus, which could boost economic activity. Meanwhile, China continued to stand apart, reporting 4.9% third-quarter GDP growth year over year.
Global stocks rallied broadly in November, propelled by optimism over three promising COVID-19 vaccines, which reported high effectiveness in trials. Global stock indices notched double-digit monthly gains. In a reversal of recent trends, value stocks outperformed growth and cyclical stocks outpaced technology stocks. However, U.S. unemployment remained elevated, with a net job loss of 10 million since February. The Eurozone Services Purchasing Managers’ Index, a monthly survey of purchasing managers, contracted sharply while the region’s manufacturing activity gauge indicated growth. The U.S. election results added to the market’s upbeat mood as investors gave thumbs-up to the certainty of the outcome after an unusual delay and anticipated more consistent policies in the new administration.
Don’t let short-term uncertainty derail long-term investment goals.
Periods of investment uncertainty can present challenges, but experience has taught us that maintaining long-term investment goals can be an effective way to plan for the future. To help you create a sound strategy based on your personal goals and risk tolerance, Wells Fargo Funds offers more than 100 mutual funds spanning a wide range of asset classes and investment styles. Although diversification cannot guarantee an investment profit or prevent losses, we believe it can be an effective way to manage investment risk and potentially smooth out overall portfolio performance. We encourage investors to know their investments and to understand that appropriate levels of risk-taking may unlock opportunities.
Thank you for choosing to invest with Wells Fargo Funds. We appreciate your confidence in us and remain committed to helping you meet your financial needs.
Sincerely,

Andrew Owen
President
Wells Fargo Funds
“Global stocks rallied broadly in November, propelled by optimism over three promising COVID-19 vaccines, which reported high effectiveness in trials.”
|
|
|
For further information about your Fund, contact your investment professional, visit our website at wfam.com, or call us directly at 1-800-222-8222. |
Wells Fargo Moderate Balanced Fund | 3
Letter to shareholders (unaudited)
Notice to Shareholders
At a meeting held on August 10-12, 2020, the Board of Trustees of the Fund approved a change to the Fund’s automatic conversion feature for Class C shares in order to shorten the required holding period from 10 to 8 years. As a result, on a monthly basis beginning November 5, 2020, Class C shares will convert automatically into Class A shares 8 years after the initial date of purchase or, if you acquired your Class C shares through an exchange or conversion from another share class, 8 years after the date you acquired your Class C shares. When Class C shares that you acquired through a purchase or exchange convert, any other Class C shares that you purchased with reinvested dividends and distributions also will convert into Class A shares on a pro rata basis.
Please note that a shorter holding period may apply depending on your intermediary. Please see “Appendix A—Sales Charge Reductions and Waivers for Certain Intermediaries” in the Fund’s prospectus for further information.
Preparing for LIBOR Transition
The global financial industry is preparing to transition away from the London Interbank Offered Rate (LIBOR), a key benchmark interest rate, to new alternative rates. LIBOR underpins more than $350 trillion of financial contracts. It is the benchmark rate for a wide spectrum of products ranging from residential mortgages to corporate bonds to derivatives. Regulators have called for a market-wide transition away from LIBOR to successor reference rates by the end of 2021, which requires proactive steps be taken by issuers, counterparties, and asset managers to identify impacted products and adopt new reference rates.
The Fund holds at least one security that uses LIBOR as a floating reference rate and has a maturity date after 12-31-2021.
Although the transition process away from LIBOR has become increasingly well-defined in advance of the anticipated discontinuation date, there remains uncertainty regarding the nature of successor reference rates, and any potential effects of the transition away from LIBOR on investment instruments that use it as a benchmark rate. The transition process may result in, among other things, increased volatility or illiquidity in markets for instruments that currently rely on LIBOR and could negatively impact the value of certain instruments held by the Fund.
Wells Fargo Asset Management is monitoring LIBOR exposure closely and has put resources and controls in place to manage this transition effectively. The Fund’s portfolio management team is evaluating LIBOR holdings to understand what happens to those securities when LIBOR ceases to exist, including examining security documentation to identify the presence or absence of fallback language identifying a replacement rate to LIBOR.
While the pace of transition away from LIBOR will differ by asset class and investment strategy, the portfolio management team will monitor market conditions for those holdings to identify and mitigate deterioration or volatility in pricing and liquidity and ensure appropriate actions are taken in a timely manner.
Further information regarding the potential risks associated with the discontinuation of LIBOR can be found in the Fund’s Statement of Additional Information.
4 | Wells Fargo Moderate Balanced Fund
This page is intentionally left blank.
Performance highlights (unaudited)
Investment objective
The Fund seeks total return, consisting of current income and capital appreciation.
Manager
Wells Fargo Funds Management, LLC
Subadviser
Wells Capital Management Incorporated
Portfolio managers
Kandarp R. Acharya, CFA®‡, FRM
Petros N. Bocray, CFA®‡, FRM
Christian L. Chan, CFA®‡
Average annual total returns (%) as of November 30, 2020
| | | | | | | | | | | | | | | | | | | | | | | | | | | | | | | | | | |
| | | | |
| | | | | Including sales charge | | | Excluding sales charge | | | Expense ratios1 (%) | |
| | | | | | | | | |
| | | Inception date | | 1 year | | | 5 year | | | 10 year | | | 1 year | | | 5 year | | | 10 year | | | Gross | | | Net2 | |
| | | | | | | | | | |
| Class A (WFMAX) | | 1-30-2004 | | | 3.48 | | | | 5.26 | | | | 6.31 | | | | 9.79 | | | | 6.51 | | | | 6.95 | | | | 1.36 | | | | 1.15 | |
| | | | | | | | | | |
| Class C (WFBCX) | | 1-30-2004 | | | 8.14 | | | | 5.74 | | | | 6.16 | | | | 9.14 | | | | 5.74 | | | | 6.16 | | | | 2.11 | | | | 1.90 | |
| | | | | | | | | | |
| Administrator Class (NVMBX) | | 11-11-1994 | | | – | | | | – | | | | – | | | | 10.26 | | | | 6.81 | | | | 7.22 | | | | 1.28 | | | | 0.90 | |
| | | | | | | | | | |
| Institutional Class (WFMYX)3 | | 7-31-2018 | | | – | | | | – | | | | – | | | | 10.20 | | | | 6.83 | | | | 7.23 | | | | 1.03 | | | | 0.80 | |
| | | | | | | | | | |
| Moderate Balanced Blended Index4 | | – | | | – | | | | – | | | | – | | | | 10.65 | | | | 7.44 | | | | 7.05 | | | | – | | | | – | |
| | | | | | | | | | |
| Bloomberg Barclays U.S. Aggregate Bond Index5 | | – | | | – | | | | – | | | | – | | | | 7.28 | | | | 4.34 | | | | 3.71 | | | | – | | | | – | |
| | | | | | | | | | |
| Bloomberg Barclays U.S. Short Treasury 9-12 Months Index6 | | – | | | – | | | | – | | | | – | | | | 1.86 | | | | 1.59 | | | | 0.93 | | | | – | | | | – | |
| | | | | | | | | | |
| MSCI EAFE Index (Net)7 | | – | | | – | | | | – | | | | – | | | | 6.37 | | | | 6.19 | | | | 5.85 | | | | – | | | | – | |
| | | | | | | | | | |
| Russell 1000® Growth Index8 | | – | | | – | | | | – | | | | – | | | | 36.40 | | | | 19.56 | | | | 17.31 | | | | – | | | | – | |
| | | | | | | | | | |
| Russell 1000® Value Index9 | | – | | | – | | | | – | | | | – | | | | 1.72 | | | | 8.44 | | | | 10.93 | | | | – | | | | – | |
| | | | | | | | | | |
| Russell 2000® Index10 | | – | | | – | | | | – | | | | – | | | | 13.59 | | | | 10.25 | | | | 11.13 | | | | – | | | | – | |
| | | | | | | | | | |
| S&P 500 Index11 | | – | | | – | | | | – | | | | – | | | | 17.46 | | | | 13.99 | | | | 14.19 | | | | – | | | | – | |
Figures quoted represent past performance, which is no guarantee of future results, and do not reflect taxes that a shareholder may pay on an investment in a fund. Investment return and principal value of an investment will fluctuate so that an investor’s shares, when redeemed, may be worth more or less than their original cost. Performance shown without sales charges would be lower if sales charges were reflected. Current performance may be lower or higher than the performance data quoted, which assumes the reinvestment of dividends and capital gains. Current month-end performance is available on the Fund’s website, wfam.com.
Index returns do not include transaction costs associated with buying and selling securities, any mutual fund fees or expenses, or any taxes. It is not possible to invest directly in an index.
For Class A shares, the maximum front-end sales charge is 5.75%. For Class C shares, the maximum contingent deferred sales charge is 1.00%. Performance including a contingent deferred sales charge assumes the sales charge for the corresponding time period. Administrator Class and Institutional Class shares are sold without a front-end sales charge or contingent deferred sales charge.
Balanced funds may invest in stocks and bonds. Stock values fluctuate in response to the activities of individual companies and general market and economic conditions. Bond values fluctuate in response to the financial condition of individual issuers, general market and economic conditions, and changes in interest rates. Changes in market conditions and government policies may lead to periods of heightened volatility in the bond market and reduced liquidity for certain bonds held by the Fund. In general, when interest rates rise, bond values fall and investors may lose principal value. Interest rate changes and their impact on the Fund and its share price can be sudden and unpredictable. The use of derivatives may reduce returns and/or increase volatility. Certain investment strategies tend to increase the total risk of an investment (relative to the broader market). The Fund is exposed to mortgage- and asset-backed securities risk. Consult the Fund’s prospectus for additional information on these and other risks.
Please see footnotes on page 7.
6 | Wells Fargo Moderate Balanced Fund
Performance highlights (unaudited)
| | | | |
|
| Ten largest holdings (%) as of November 30, 202012 | |
| | |
Wells Fargo Managed Fixed Income Portfolio | | | 28.56 | |
| | |
Wells Fargo Conservative Income Fund Institutional Class | | | 14.75 | |
| | |
Wells Fargo Core Bond Portfolio | | | 8.33 | |
| | |
Wells Fargo Disciplined Large Cap Portfolio | | | 7.39 | |
| | |
Wells Fargo Diversified Large Cap Growth Portfolio | | | 6.92 | |
| | |
Wells Fargo Large Company Value Portfolio | | | 6.78 | |
| | |
Wells Fargo Real Return Portfolio | | | 4.40 | |
| | |
Wells Fargo C&B Large Cap Value Portfolio | | | 3.42 | |
| | |
Wells Fargo Disciplined International Developed Markets Portfolio | | | 3.03 | |
| | |
iShares Core S&P 500 ETF | | | 2.57 | |
| | | | | | | | |
|
| Allocations (%) as of November 30, 2020 | |
| | |
| | | Neutral allocation | | | Effective
allocation13 | |
| | | |
Bonds | | | 60 | | | | 59 | |
| | | |
Stocks | | | 40 | | | | 41 | |
| ‡ | CFA® and Chartered Financial Analyst® are trademarks owned by CFA Institute. |
| 1 | Reflects the expense ratios as stated in the most recent prospectuses, which include the impact of 0.43% in acquired fund fees and expenses. The expense ratios shown are subject to change and may differ from the annualized expense ratios shown in the financial highlights of this report, which do not include acquired fund fees and expenses. |
| 2 | The manager has contractually committed through September 30, 2021, to waive fees and/or reimburse expenses to the extent necessary to cap total annual fund operating expenses after fee waivers at 1.15% for Class A, 1.90% for Class C, 0.90% for Administrator Class and 0.80% for Institutional Class. Brokerage commissions, stamp duty fees, interest, taxes, acquired fund fees and expenses (if any) from funds in which the affiliated master portfolios and funds invest and from money market funds, and extraordinary expenses are excluded from the expense caps. All other acquired fund fees and expenses from the affiliated master portfolios are included in the expense caps. Prior to or after the commitment expiration date, the caps may be increased or the commitment to maintain the caps may be terminated only with the approval of the Board of Trustees. Without these caps, the Fund’s returns would have been lower. The expense ratio paid by an investor is the net expense ratio (the total annual fund operating expenses after fee waivers) as stated in the prospectuses. |
| 3 | Historical performance shown for the Institutional Class shares prior to their inception reflects the performance of the Administrator Class shares, and is not adjusted to reflect the Institutional Class share expenses. If these expenses had been included, returns for the Institutional Class shares would be higher. |
| 4 | Source: Wells Fargo Funds Management, LLC. The Moderate Balanced Blended Index is composed 45% of the Bloomberg Barclays U.S. Aggregate Bond Index, 15% of the Bloomberg Barclays U.S. Short Treasury 9-12 Months Index, 10% of the Russell 1000® Growth Index, 10% of the Russell 1000® Value Index, 10% of the S&P 500 Index, 6% of the MSCI EAFE Index (Net), and 4% of the Russell 2000® Index. You cannot invest directly in an index. |
| 5 | The Bloomberg Barclays U.S. Aggregate Bond Index is a broad-based benchmark that measures the investment-grade, U.S. dollar–denominated, fixed-rate taxable bond market, including Treasuries, government-related and corporate securities, mortgage-backed securities (agency fixed-rate and hybrid adjustable-rate mortgage pass-throughs), asset-backed securities, and commercial mortgage-backed securities. You cannot invest directly in an index. |
| 6 | The Bloomberg Barclays U.S. Short Treasury 9–12 Months Index is an unmanaged index that includes aged U.S. Treasury bills, notes, and bonds with a remaining maturity from 9 up to (but not including) 12 months. It excludes zero-coupon STRIPS. You cannot invest directly in an index. |
| 7 | The Morgan Stanley Capital International (MSCI) Europe, Australasia, Far East (EAFE) Index (Net) is a free-float-adjusted market-capitalization-weighted index that is designed to measure the equity market performance of developed markets, excluding the United States and Canada. Source: MSCI. MSCI makes no express or implied warranties or representations and shall have no liability whatsoever with respect to any MSCI data contained herein. The MSCI data may not be further redistributed or used as a basis for other indexes or any securities or financial products. This report is not approved, reviewed, or produced by MSCI. You cannot invest directly in an index. |
| 8 | The Russell 1000® Growth Index measures the performance of those Russell 1000 companies with higher price/book ratios and higher forecasted growth values. You cannot invest directly in an index. |
| 9 | The Russell 1000® Value Index measures the performance of those Russell 1000 companies with lower price/book ratios and lower forecasted growth values. You cannot invest directly in an index. |
| 10 | The Russell 2000® Index measures the performance of the 2,000 smallest companies in the Russell 3000® Index, which represents approximately 8% of the total market capitalization of the Russell 3000® Index. You cannot invest directly in an index. |
| 11 | The S&P 500 Index consists of 500 stocks chosen for market size, liquidity, and industry group representation. It is a market-value-weighted index with each stock’s weight in the index proportionate to its market value. You cannot invest directly in an index. |
| 12 | Figures represent the percentage of the Fund’s net assets. Holdings are subject to change and may have changed since the date specified. |
| 13 | Effective allocation includes the effect of any tactical futures overlay that may be in place. Effective cash, if any, represents the net offset to such futures positions. These amounts are subject to change and may have changed since the date specified. |
Wells Fargo Moderate Balanced Fund | 7
Fund expenses (unaudited)
As a shareholder of the Fund, you incur two types of costs: (1) transaction costs, including sales charges (loads) on purchase payments and contingent deferred sales charges (if any) on redemptions and (2) ongoing costs, including management fees, distribution (12b-1) and/or shareholder servicing fees, and other Fund expenses. This example is intended to help you understand your ongoing costs (in dollars) of investing in the Fund and to compare these costs with the ongoing costs of investing in other mutual funds.
The example is based on an investment of $1,000 invested at the beginning of the six-month period and held for the entire period from June 1, 2020 to November 30, 2020.
Actual expenses
The “Actual” line of the table below provides information about actual account values and actual expenses. You may use the information in this line, together with the amount you invested, to estimate the expenses that you paid over the period. Simply divide your account value by $1,000 (for example, an $8,600 account value divided by $1,000 = 8.6), then multiply the result by the number in the “Actual” line under the heading entitled “Expenses paid during period” for your applicable class of shares to estimate the expenses you paid on your account during this period.
Hypothetical example for comparison purposes
The “Hypothetical” line of the table below provides information about hypothetical account values and hypothetical expenses based on the Fund’s actual expense ratio and an assumed rate of return of 5% per year before expenses, which is not the Fund’s actual return. The hypothetical account values and expenses may not be used to estimate the actual ending account balance or expenses you paid for the period. You may use this information to compare the ongoing costs of investing in the Fund and other funds. To do so, compare this 5% hypothetical example with the 5% hypothetical examples that appear in the shareholder reports of the other funds.
Please note that the expenses shown in the table are meant to highlight your ongoing costs only and do not reflect any transactional costs, such as sales charges (loads) and contingent deferred sales charges. Therefore, the “Hypothetical” line of the table is useful in comparing ongoing costs only and will not help you determine the relative total costs of owning different funds. In addition, if these transactional costs were included, your costs would have been higher.
| | | | | | | | | | | | | | | | |
| | | Beginning account value 6-1-2020 | | | Ending account value
11-30-2020 | | | Expenses
paid during
the period1,2 | | | Annualized net
expense ratio1 | |
| | | | | |
Class A | | | | | | | | | | | | | | | | |
| | | | |
Actual | | $ | 1,000.00 | | | $ | 1,103.50 | | | $ | 5.75 | | | | 1.09 | % |
| | | | |
Hypothetical (5% return before expenses) | | $ | 1,000.00 | | | $ | 1,019.60 | | | $ | 5.52 | | | | 1.09 | % |
| | | | | |
Class C | | | | | | | | | | | | | | | | |
| | | | |
Actual | | $ | 1,000.00 | | | $ | 1,100.99 | | | $ | 9.69 | | | | 1.84 | % |
| | | | |
Hypothetical (5% return before expenses) | | $ | 1,000.00 | | | $ | 1,015.84 | | | $ | 9.30 | | | | 1.84 | % |
| | | | | |
Administrator Class | | | | | | | | | | | | | | | | |
| | | | |
Actual | | $ | 1,000.00 | | | $ | 1,106.64 | | | $ | 4.44 | | | | 0.84 | % |
| | | | |
Hypothetical (5% return before expenses) | | $ | 1,000.00 | | | $ | 1,020.86 | | | $ | 4.26 | | | | 0.84 | % |
| | | | | |
Institutional Class | | | | | | | | | | | | | | | | |
| | | | |
Actual | | $ | 1,000.00 | | | $ | 1,105.49 | | | $ | 3.91 | | | | 0.74 | % |
| | | | |
Hypothetical (5% return before expenses) | | $ | 1,000.00 | | | $ | 1,021.36 | | | $ | 3.75 | | | | 0.74% | |
| 1 | Amounts reflect net expenses allocated from the affiliated Master Portfolios in which the Fund invests. |
| 2 | Expenses paid is equal to the annualized net expense ratio of each class multiplied by the average account value over the period, multiplied by the number of days in the most recent fiscal half-year divided by the number of days in the fiscal year (to reflect the one-half-year period). |
8 | Wells Fargo Moderate Balanced Fund
Portfolio of investments—November 30, 2020 (unaudited)
| | | | | | | | | | | | | | | | |
| | | | | | | | | Shares | | | Value | |
| Exchange-Traded Funds: 5.22% | | | | | | | | | | | | |
iShares Core S&P 500 ETF | | | | | | | | | | | 8,847 | | | $ | 3,214,292 | |
iShares Core U.S. Aggregate Bond ETF | | | | | | | | | | | 9,453 | | | | 1,119,424 | |
The Industrial Select Sector SPDR Fund | | | | | | | | | | | 25,090 | | | | 2,208,673 | |
| | | | |
Total Exchange-Traded Funds (Cost $6,153,061) | | | | | | | | | | | | | | | 6,542,389 | |
| | | | | | | | | | | | | | | | |
| | | | |
Investment Companies: 93.29% | | | | | | | | | | | | | | | | |
| | | | |
| Affiliated Master Portfolios: 76.86% | | | | | | | | | | | | |
Wells Fargo C&B Large Cap Value Portfolio | | | | | | | | | | | | | | | 4,287,626 | |
Wells Fargo Core Bond Portfolio | | | | | | | | | | | | | | | 10,433,512 | |
Wells Fargo Disciplined International Developed Markets Portfolio | | | | | | | | | | | | | | | 3,796,923 | |
Wells Fargo Disciplined Large Cap Portfolio | | | | | | | | | | | | | | | 9,253,517 | |
Wells Fargo Diversified Large Cap Growth Portfolio | | | | | | | | | | | | | | | 8,665,884 | |
Wells Fargo Emerging Growth Portfolio | | | | | | | | | | | | | | | 1,286,673 | |
Wells Fargo Factor Enhanced Emerging Markets Equity Portfolio | | | | | | | | | | | | | | | 1,049,641 | |
Wells Fargo Factor Enhanced International Equity Portfolio | | | | | | | | | | | | | | | 1,267,598 | |
Wells Fargo International Value Portfolio | | | | | | | | | | | | | | | 2,544,358 | |
Wells Fargo Large Company Value Portfolio | | | | | | | | | | | | | | | 8,489,037 | |
Wells Fargo Managed Fixed Income Portfolio | | | | | | | | | | | | | | | 35,763,284 | |
Wells Fargo Real Return Portfolio | | | | | | | | | | | | | | | 5,521,880 | |
Wells Fargo Small Company Growth Portfolio | | | | | | | | | | | | | | | 1,289,734 | |
Wells Fargo Small Company Value Portfolio | | | | | | | | | | | | | | | 2,605,564 | |
| | | | |
| | | | | | | | | | | | | | | 96,255,231 | |
| | | | | | | | | | | | | | | | |
| | | | |
| Affiliated Funds: 16.43% | | | | | | | | | | | | |
Wells Fargo Conservative Income Fund Institutional Class | | | | | | | | | | | 1,839,349 | | | | 18,467,064 | |
Wells Fargo Emerging Markets Equity Fund Class R6 | | | | | | | | | | | 33,386 | | | | 1,051,321 | |
Wells Fargo Emerging Markets Equity Income Fund Class R6 | | | | | | | | | | | 90,454 | | | | 1,050,169 | |
| | | | |
| | | | | | | | | | | | | | | 20,568,554 | |
| | | | | | | | | | | | | | | | |
| | | | |
Total Investment Companies (Cost $97,164,818) | | | | | | | | | | | | | | | 116,823,785 | |
| | | | | | | | | | | | | | | | |
| | | | | | | | |
| Total investments in securities (Cost $103,317,879) | | | 98.51 | % | | | 123,366,174 | |
| | |
Other assets and liabilities, net | | | 1.49 | | | | 1,865,611 | |
| | | | | | | | |
| Total net assets | | | 100.00 | % | | $ | 125,231,785 | |
| | | | | | | | |
The accompanying notes are an integral part of these financial statements.
Wells Fargo Moderate Balanced Fund | 9
Portfolio of investments—November 30, 2020 (unaudited)
Futures Contracts
| | | | | | | | | | | | | | | | | | | | | | | | |
| Description | | Number of contracts | | | Expiration date | | | Notional
cost | | | Notional
value | | | Unrealized
gains | | | Unrealized
losses | |
| | | | | | |
Long | | | | | | | | | | | | | | | | | | | | | | | | |
| | | | | | |
Japanese Yen Futures | | | 52 | | | | 12-14-2020 | | | $ | 6,211,381 | | | $ | 6,231,225 | | | $ | 19,844 | | | $ | 0 | |
| | | | | | |
E-Mini Nasdaq 100 Index | | | 10 | | | | 12-18-2020 | | | | 2,402,391 | | | | 2,455,400 | | | | 53,009 | | | | 0 | |
| | | | | | |
E-Mini Russell 2000 Index | | | 42 | | | | 12-18-2020 | | | | 3,656,854 | | | | 3,822,210 | | | | 165,356 | | | | 0 | |
| | | | | | |
IBEX 35 Index | | | 54 | | | | 12-18-2020 | | | | 5,095,396 | | | | 5,193,631 | | | | 98,235 | | | | 0 | |
| | | | | | |
MSCI Emerging Markets Index | | | 21 | | | | 12-18-2020 | | | | 1,236,799 | | | | 1,262,415 | | | | 25,616 | | | | 0 | |
| | | | | | |
Long Gilt Bonds | | | 56 | | | | 3-29-2021 | | | | 10,001,467 | | | | 10,018,144 | | | | 16,677 | | | | 0 | |
| | | | | | |
Short | | | | | | | | | | | | | | | | | | | | | | | | |
| | | | | | |
Euro Bund Futures | | | (39) | | | | 12-8-2020 | | | | (8,268,125 | ) | | | (8,262,160 | ) | | | 5,965 | | | | 0 | |
| | | | | | |
E-Mini S&P 500 Index | | | (21) | | | | 12-18-2020 | | | | (3,754,710 | ) | | | (3,804,360 | ) | | | 0 | | | | (49,650 | ) |
| | | | | | |
Mini-DAX Futures | | | (63) | | | | 12-18-2020 | | | | (4,954,660 | ) | | | (5,009,471 | ) | | | 0 | | | | (54,811 | ) |
| | | | | | | | | | | | | | | | | | | | | | | | |
| | | | | | |
| | | | | | | | | | | | | | | | | | $ | 384,702 | | | $ | (104,461 | ) |
| | | | | | | | | | | | | | | | | | | | | | | | |
Investments in Affiliates
An affiliated investment is an investment in which the Fund owns at least 5% of the outstanding voting shares of the issuer or as a result of other relationships, such as the Fund and the issuer having the same adviser or investment manager. Transactions with issuers that were either affiliated persons of the Fund at the beginning of the period or the end of the period were as follows:
| | | | | | | | | | | | | | | | | | | | | | | | | | | | | | | | | | | | |
| | | Value, beginning of period | | | Purchases | | | Sales
proceeds | | | Net
realized
gains
(losses) on
affiliated
Underlying
Funds | | | Net
change in
unrealized
gains
(losses) on
affiliated
Underlying
Funds | | | Value,
end of
period | | | % of
net
assets | | | Shares,
end of
period | | | Dividends
from
affiliated
Underlying
Funds | |
| | | | | | | | | |
| Investment Companies | | | | | | | | | | | | | | | | | | | | | | | | | | | |
Affiliated Funds | | | | | | | | | | | | | | | | | | | | | | | | | | | | | | | | | | | | |
Wells Fargo Conservative Income Fund Institutional Class | | $ | 18,653,995 | | | $ | 965,045 | | | $ | (1,188,309 | ) | | $ | 172 | | | $ | 36,161 | | | $ | 18,467,064 | | | | | | | | 1,839,349 | | | $ | 92,462 | |
Wells Fargo Emerging Markets Equity Fund Class R6 | | | 1,069,244 | | | | 0 | | | | (319,395 | ) | | | 76,159 | | | | 225,313 | | | | 1,051,321 | | | | | | | | 33,386 | | | | 0 | |
Wells Fargo Emerging Markets Equity Income Fund Class R6 | | | 1,035,794 | | | | 21,237 | | | | (253,437 | ) | | | 11,769 | | | | 234,806 | | | | 1,050,169 | | | | | | | | 90,454 | | | | 21,237 | |
| | | | | | | | | | | | | | | | | | | | | | | | | | | | | | | | | | | | |
| | | | | | | | | | | | | | $ | 88,100 | | | $ | 496,280 | | | $ | 20,568,554 | | | | 16.43 | % | | | | | | $ | 113,699 | |
| | | | | | | | | | | | | | | | | | | | | | | | | | | | | | | | | | | | |
The accompanying notes are an integral part of these financial statements.
10 | Wells Fargo Moderate Balanced Fund
Portfolio of investments—November 30, 2020 (unaudited)
Transactions with the affiliated Master Portfolios were as follows:
| | | | | | | | | | | | | | | | | | | | | | | | | | | | | | | | | | | | |
| | | % of ownership, beginning of period | | | % of ownership, end of period | | | Net realized gains (losses) on securities transactions allocated from affiliated Master Portfolios | | | Net change in unrealized gains (losses) on securities transactions allocated from affiliated Master Portfolios | | | Interest allocated from affiliated Master Portfolios | | | Dividends allocated from affiliated Master Portfolios | | | Affiliated income allocated from affiliates Master Portfolios | | | Value, end of period | | | % of
net
assets | |
Wells Fargo C&B Large Cap Value Portfolio | | | 1.53 | % | | | 1.28 | % | | $ | 142,745 | | | $ | 813,763 | | | $ | 0 | | | $ | 41,674 | | | $ | 57 | | | $ | 4,287,626 | | | | | |
Wells Fargo Core Bond Portfolio | | | 0.18 | | | | 0.17 | | | | 196,011 | | | | 11,103 | | | | 89,571 | | | | 0 | | | | 211 | | | | 10,433,512 | | | | | |
Wells Fargo Disciplined International Developed Markets Portfolio | | | 2.18 | | | | 1.97 | | | | 758,616 | | | | (44,076 | ) | | | 0 | | | | 41,462 | | | | 2 | | | | 3,796,923 | | | | | |
Wells Fargo Disciplined Large Cap Portfolio | | | 3.21 | | | | 2.95 | | | | 75,934 | | | | 1,454,002 | | | | 8 | | | | 76,236 | | | | 395 | | | | 9,253,517 | | | | | |
Wells Fargo Diversified Large Cap Growth Portfolio | | | 4.03 | | | | 3.64 | | | | 652,315 | | | | 1,165,071 | | | | 0 | | | | 36,897 | | | | 116 | | | | 8,665,884 | | | | | |
Wells Fargo Emerging Growth Portfolio | | | 0.19 | | | | 0.15 | | | | 196,557 | | | | 261,133 | | | | 0 | | | | 1,699 | | | | 207 | | | | 1,286,673 | | | | | |
Wells Fargo Factor Enhanced Emerging Markets Equity Portfolio | | | 0.53 | | | | 0.52 | | | | 3,892 | | | | 225,992 | | | | 3 | | | | 16,623 | | | | 7 | | | | 1,049,641 | | | | | |
Wells Fargo Factor Enhanced International Equity Portfolio | | | 0.00 | | | | 0.18 | | | | 34,818 | | | | 113,989 | | | | 0 | | | | 11,421 | | | | 7 | | | | 1,267,598 | | | | | |
Wells Fargo High Yield Corporate Bond Portfolio * | | | 4.64 | | | | 0.00 | | | | 26,294 | | | | 339,793 | | | | 219,496 | | | | 0 | | | | 36 | | | | 0 | | | | | |
Wells Fargo International Value Portfolio | | | 0.50 | | | | 0.86 | | | | (575,479 | ) | | | 1,057,581 | | | | 0 | | | | 41,463 | | | | 373 | | | | 2,544,358 | | | | | |
Wells Fargo Large Company Value Portfolio | | | 3.93 | | | | 3.54 | | | | 1,550,997 | | | | 69,674 | | | | 6 | | | | 89,005 | | | | 71 | | | | 8,489,037 | | | | | |
Wells Fargo Managed Fixed Income Portfolio | | | 8.11 | | | | 7.70 | | | | 180,894 | | | | 625,265 | | | | 571,567 | | | | 0 | | | | 546 | | | | 35,763,284 | | | | | |
Wells Fargo Real Return Portfolio | | | 3.48 | | | | 2.54 | | | | (6,445 | ) | | | 248,277 | | | | 62,905 | | | | 9,435 | | | | 31 | | | | 5,521,880 | | | | | |
Wells Fargo Small Company Growth Portfolio | | | 0.10 | | | | 0.09 | | | | 168,142 | | | | 176,235 | | | | 0 | | | | 3,861 | | | | 40 | | | | 1,289,734 | | | | | |
Wells Fargo Small Company Value Portfolio | | | 0.65 | | | | 0.57 | | | | 795 | | | | 732,517 | | | | 0 | | | | 27,645 | | | | 176 | | | | 2,605,564 | | | | | |
| | | | | | | | | | | | | | | | | | | | | | | | | | | | | | | | | | | | |
| | | | | | | | | | $ | 3,406,086 | | | $ | 7,250,319 | | | $ | 943,556 | | | $ | 397,421 | | | $ | 2,275 | | | $ | 96,255,231 | | | | 76.86 | % |
| | | | | | | | | | | | | | | | | | | | | | | | | | | | | | | | | | | | |
| * | No longer held at the end of the period |
The accompanying notes are an integral part of these financial statements.
Wells Fargo Moderate Balanced Fund | 11
Statement of assets and liabilities—November 30, 2020 (unaudited)
| | | | |
| | | | |
| |
Assets | | | | |
Investments in affiliated Master Portfolios, at value (cost $77,166,932) | | $ | 96,255,231 | |
Investments in affiliated Underlying Funds, at value (cost $19,997,886) | | | 20,568,554 | |
Investments in unaffiliated securities, at value (cost $6,153,061) | | | 6,542,389 | |
Cash | | | 49,000 | |
Segregated cash for futures contracts | | | 2,004,937 | |
Receivable for Fund shares sold | | | 108,027 | |
Receivable for dividends | | | 11,625 | |
Prepaid expenses and other assets | | | 230 | |
| | | | |
Total assets | | | 125,539,993 | |
| | | | |
| |
Liabilities | | | | |
Payable for investments purchased | | | 12,450 | |
Payable for Fund shares redeemed | | | 43,872 | |
Payable for daily variation margin on open futures contracts | | | 146,198 | |
Management fee payable | | | 1,908 | |
Administration fees payable | | | 16,123 | |
Distribution fee payable | | | 4,716 | |
Shareholder report expenses payable | | | 44,535 | |
Shareholder servicing fees payable | | | 23,205 | |
Trustees’ fees and expenses payable | | | 1,156 | |
Accrued expenses and other liabilities | | | 14,045 | |
| | | | |
Total liabilities | | | 308,208 | |
| | | | |
Total net assets | | $ | 125,231,785 | |
| | | | |
| |
Net assets consist of | | | | |
Paid-in capital | | $ | 98,321,171 | |
Total distributable earnings | | | 26,910,614 | |
| | | | |
Total net assets | | $ | 125,231,785 | |
| | | | |
| |
Computation of net asset value and offering price per share | | | | |
Net assets – Class A | | $ | 36,015,526 | |
Shares outstanding – Class A1 | | | 1,562,585 | |
Net asset value per share – Class A | | | $23.05 | |
Maximum offering price per share – Class A2 | | | $24.46 | |
Net assets – Class C | | $ | 7,570,345 | |
Shares outstanding – Class C1 | | | 338,946 | |
Net asset value per share – Class C | | | $22.33 | |
Net assets – Administrator Class | | $ | 69,648,883 | |
Shares outstanding – Administrator Class1 | | | 2,984,911 | |
Net asset value per share – Administrator Class | | | $23.33 | |
Net assets – Institutional Class | | $ | 11,997,031 | |
Shares outstanding – Institutional Class1 | | | 512,902 | |
Net asset value per share – Institutional Class | | | $23.39 | |
| 1 | The Fund has an unlimited number of authorized shares. |
| 2 | Maximum offering price is computed as 100/94.25 of net asset value. On investments of $50,000 or more, the offering price is reduced. |
The accompanying notes are an integral part of these financial statements.
12 | Wells Fargo Moderate Balanced Fund
Statement of operations—six months ended November 30, 2020 (unaudited)
| | | | |
| | | | |
| |
Investment income | | | | |
Interest allocated from affiliated Master Portfolios (net of foreign withholding taxes of $85) | | $ | 943,556 | |
Dividends allocated from affiliated Master Portfolios (net of foreign withholding taxes of $14,272) | | | 397,421 | |
Dividends from affiliated Underlying Funds | | | 113,699 | |
Dividends | | | 10,908 | |
Affiliated income allocated from affiliated Master Portfolios | | | 2,275 | |
Expenses allocated from affiliated Master Portfolios | | | (253,045 | ) |
Waivers allocated from affiliated Master Portfolios | | | 22,717 | |
| | | | |
Total investment income | | | 1,237,531 | |
| | | | |
| |
Expenses | | | | |
Management fee | | | 196,838 | |
Administration fees | |
Class A | | | 35,163 | |
Class C | | | 8,285 | |
Administrator Class | | | 51,039 | |
Institutional Class | | | 7,361 | |
Shareholder servicing fees | |
Class A | | | 41,836 | |
Class C | | | 9,849 | |
Administrator Class | | | 98,107 | |
Distribution fee | |
Class C | | | 29,546 | |
Custody and accounting fees | | | 4,317 | |
Professional fees | | | 15,681 | |
Registration fees | | | 38,606 | |
Shareholder report expenses | | | 30,442 | |
Trustees’ fees and expenses | | | 11,029 | |
Other fees and expenses | | | 10,668 | |
| | | | |
Total expenses | | | 588,767 | |
Less: Fee waivers and/or expense reimbursements | |
Fund-level | | | (121,413 | ) |
Class A | | | (296 | ) |
Administrator Class | | | (69,391 | ) |
Institutional Class | | | (1,315 | ) |
| | | | |
Net expenses | | | 396,352 | |
| | | | |
Net investment income | | | 841,179 | |
| | | | |
| |
Realized and unrealized gains (losses) on investments | | | | |
Net realized gains on | |
Securities transactions allocated from affiliated Master Portfolios | | | 3,406,086 | |
Unaffiliated securities | | | 4,169 | |
Affiliated Underlying Funds | | | 88,100 | |
Futures contracts | | | 1,105,154 | |
| | | | |
Net realized gains on investments | | | 4,603,509 | |
| | | | |
|
Net change in unrealized gains (losses) on | |
Securities transactions allocated from affiliated Master Portfolios | | | 7,250,319 | |
Unaffiliated securities | | | 389,328 | |
Affiliated Underlying Funds | | | 496,280 | |
Futures contracts | | | (577,190 | ) |
| | | | |
Net change in unrealized gains (losses) on investments | | | 7,558,737 | |
| | | | |
Net realized and unrealized gains (losses) on investments | | | 12,162,246 | |
| | | | |
Net increase in net assets resulting from operations | | $ | 13,003,425 | |
| | | | |
The accompanying notes are an integral part of these financial statements.
Wells Fargo Moderate Balanced Fund | 13
Statement of changes in net assets
| | | | | | | | | | | | | | | | |
| | | Six months ended
November 30, 2020
(unaudited) | | | Year ended
May 31, 2020 | |
| | | | |
Operations | | | | | | | | | | | | | | | | |
Net investment income | | | | | | $ | 841,179 | | | | | | | $ | 2,007,092 | |
Net realized gains on investments | | | | | | | 4,603,509 | | | | | | | | 1,483,956 | |
Net change in unrealized gains (losses) on investments | | | | | | | 7,558,737 | | | | | | | | 3,601,837 | |
| | | | |
Net increase in net assets resulting from operations | | | | | | | 13,003,425 | | | | | | | | 7,092,885 | |
| | | | |
| | | | |
Distributions to shareholders from net investment income and net realized gains | | | | | | | | | | | | | | | | |
Class A | | | | | | | 0 | | | | | | | | (949,542 | ) |
Class C | | | | | | | 0 | | | | | | | | (193,050 | ) |
Administrator Class | | | | | | | 0 | | | | | | | | (2,564,416 | ) |
Institutional Class | | | | | | | 0 | | | | | | | | (332,334 | ) |
| | | | |
Total distributions to shareholders | | | | | | | 0 | | | | | | | | (4,039,342 | ) |
| | | | |
| | | | |
Capital share transactions | | | Shares | | | | | | | | Shares | | | | | |
Proceeds from shares sold | | | | | | | | | | | | | | | | |
Class A | | | 161,106 | | | | 3,569,320 | | | | 314,459 | | | | 6,582,803 | |
Class C | | | 15,314 | | | | 327,869 | | | | 80,214 | | | | 1,612,864 | |
Administrator Class | | | 90,192 | | | | 2,002,620 | | | | 270,029 | | | | 5,728,452 | |
Institutional Class | | | 48,343 | | | | 1,077,589 | | | | 112,688 | | | | 2,401,546 | |
| | | | |
| | | | | | | 6,977,398 | | | | | | | | 16,325,665 | |
| | | | |
Reinvestment of distributions | | | | | | | | | | | | | | | | |
Class A | | | 0 | | | | 0 | | | | 42,968 | | | | 914,528 | |
Class C | | | 0 | | | | 0 | | | | 9,165 | | | | 189,731 | |
Administrator Class | | | 0 | | | | 0 | | | | 118,939 | | | | 2,558,445 | |
Institutional Class | | | 0 | | | | 0 | | | | 15,389 | | | | 331,571 | |
| | | | |
| | | | | | | 0 | | | | | | | | 3,994,275 | |
| | | | |
Payment for shares redeemed | | | | | | | | | | | | | | | | |
Class A | | | (99,855 | ) | | | (2,194,041 | ) | | | (336,995 | ) | | | (6,989,591 | ) |
Class C | | | (67,257 | ) | | | (1,443,923 | ) | | | (128,163 | ) | | | (2,596,917 | ) |
Administrator Class | | | (827,171 | ) | | | (18,702,263 | ) | | | (470,413 | ) | | | (9,914,992 | ) |
Institutional Class | | | (32,276 | ) | | | (719,610 | ) | | | (61,855 | ) | | | (1,282,623 | ) |
| | | | |
| | | | | | | (23,059,837 | ) | | | | | | | (20,784,123 | ) |
| | | | |
Net decrease in net assets resulting from capital share transactions | | | | | | | (16,082,439 | ) | | | | | | | (464,183 | ) |
| | | | |
Total increase (decrease) in net assets | | | | | | | (3,079,014 | ) | | | | | | | 2,589,360 | |
| | | | |
| | | | |
Net assets | | | | | | | | | | | | | | | | |
Beginning of period | | | | | | | 128,310,799 | | | | | | | | 125,721,439 | |
| | | | |
End of period | | | | | | $ | 125,231,785 | | | | | | | $ | 128,310,799 | |
| | | | |
The accompanying notes are an integral part of these financial statements.
14 | Wells Fargo Moderate Balanced Fund
Financial highlights
(For a share outstanding throughout each period)
| | | | | | | | | | | | | | | | | | | | | | | | |
| | | Six months ended
November 30, 2020
(unaudited) | | | Year ended May 31 | |
| CLASS A | | 2020 | | | 2019 | | | 2018 | | | 2017 | | | 2016 | |
Net asset value, beginning of period | | | $20.87 | | | | $20.35 | | | | $22.73 | | | | $23.47 | | | | $22.51 | | | | $23.57 | |
Net investment income | | | 0.14 | | | | 0.30 | | | | 0.36 | 1 | | | 0.29 | | | | 0.28 | | | | 0.28 | 1 |
Net realized and unrealized gains (losses) on investments | | | 2.04 | | | | 0.86 | | | | 0.11 | | | | 0.97 | | | | 1.34 | | | | (0.23 | ) |
| | | | | | | | | | | | | | | | | | | | | | | | |
Total from investment operations | | | 2.18 | | | | 1.16 | | | | 0.47 | | | | 1.26 | | | | 1.62 | | | | 0.05 | |
Distributions to shareholders from | | | | | | | | | | | | | | | | | | | | | | | | |
Net investment income | | | 0.00 | | | | (0.35 | ) | | | (0.42 | ) | | | (0.32 | ) | | | (0.29 | ) | | | (0.26 | ) |
Net realized gains | | | 0.00 | | | | (0.29 | ) | | | (2.43 | ) | | | (1.68 | ) | | | (0.37 | ) | | | (0.85 | ) |
| | | | | | | | | | | | | | | | | | | | | | | | |
Total distributions to shareholders | | | 0.00 | | | | (0.64 | ) | | | (2.85 | ) | | | (2.00 | ) | | | (0.66 | ) | | | (1.11 | ) |
Net asset value, end of period | | | $23.05 | | | | $20.87 | | | | $20.35 | | | | $22.73 | | | | $23.47 | | | | $22.51 | |
Total return2 | | | 10.35 | % | | | 5.65 | % | | | 2.68 | % | | | 5.38 | % | | | 7.33 | % | | | 0.34 | % |
Ratios to average net assets (annualized) | | | | | | | | | | | | | | | | | | | | | | | | |
Gross expenses3 | | | 1.28 | % | | | 1.30 | % | | | 1.31 | % | | | 1.33 | % | | | 1.32 | % | | | 1.32 | % |
Net expenses3 | | | 1.09 | % | | | 1.08 | % | | | 1.12 | % | | | 1.13 | % | | | 1.15 | % | | | 1.15 | % |
Net investment income3 | | | 1.14 | % | | | 1.43 | % | | | 1.65 | % | | | 1.42 | % | | | 1.25 | % | | | 1.26 | % |
Supplemental data | | | | | | | | | | | | | | | | | | | | | | | | |
Portfolio turnover rate4 | | | 59 | % | | | 119 | % | | | 191 | % | | | 113 | % | | | 114 | % | | | 87 | % |
Net assets, end of period (000s omitted) | | | $36,016 | | | | $31,334 | | | | $30,132 | | | | $31,980 | | | | $36,679 | | | | $35,993 | |
| 1 | Calculated based upon average shares outstanding |
| 2 | Total return calculations do not include any sales charges. Returns for periods of less than one year are not annualized. |
| 3 | Ratios include only the net expenses allocated from the affiliated Master Portfolios and do not include expenses from any other affiliated Underlying Funds. Net expenses allocated from the affiliated Master Portfolios included in the ratios were as follows: |
| | | | |
Six months ended November 30, 2020 (unaudited) | | | 0.35 | % |
Year ended May 31, 2020 | | | 0.37 | % |
Year ended May 31, 2019 | | | 0.40 | % |
Year ended May 31, 2018 | | | 0.44 | % |
Year ended May 31, 2017 | | | 0.46 | % |
Year ended May 31, 2016 | | | 0.47 | % |
| 4 | Portfolio turnover rate is calculated by multiplying the Fund’s ownership percentage in the respective affiliated Master Portfolio by the corresponding affiliated Master Portfolio’s purchases and sales. These purchases and sales amounts are aggregated with the direct purchases and sales in the affiliated Underlying Funds and unaffiliated securities and included in the portfolio turnover calculation. |
The accompanying notes are an integral part of these financial statements.
Wells Fargo Moderate Balanced Fund | 15
Financial highlights
(For a share outstanding throughout each period)
| | | | | | | | | | | | | | | | | | | | | | | | |
| | | Six months ended
November 30, 2020
(unaudited) | | | Year ended May 31 | |
| CLASS C | | 2020 | | | 2019 | | | 2018 | | | 2017 | | | 2016 | |
Net asset value, beginning of period | | | $20.30 | | | | $19.80 | | | | $22.20 | | | | $22.97 | | | | $22.05 | | | | $23.18 | |
Net investment income | | | 0.04 | 1 | | | 0.09 | | | | 0.12 | | | | 0.10 | | | | 0.11 | 1 | | | 0.11 | 1 |
Net realized and unrealized gains (losses) on investments | | | 1.99 | | | | 0.88 | | | | 0.18 | | | | 0.95 | | | | 1.32 | | | | (0.23 | ) |
| | | | | | | | | | | | | | | | | | | | | | | | |
Total from investment operations | | | 2.03 | | | | 0.97 | | | | 0.30 | | | | 1.05 | | | | 1.43 | | | | (0.12 | ) |
Distributions to shareholders from | | | | | | | | | | | | | | | | | | | | | | | | |
Net investment income | | | 0.00 | | | | (0.18 | ) | | | (0.27 | ) | | | (0.14 | ) | | | (0.14 | ) | | | (0.16 | ) |
Net realized gains | | | 0.00 | | | | (0.29 | ) | | | (2.43 | ) | | | (1.68 | ) | | | (0.37 | ) | | | (0.85 | ) |
| | | | | | | | | | | | | | | | | | | | | | | | |
Total distributions to shareholders | | | 0.00 | | | | (0.47 | ) | | | (2.70 | ) | | | (1.82 | ) | | | (0.51 | ) | | | (1.01 | ) |
Net asset value, end of period | | | $22.33 | | | | $20.30 | | | | $19.80 | | | | $22.20 | | | | $22.97 | | | | $22.05 | |
Total return2 | | | 10.10 | % | | | 4.89 | % | | | 1.90 | % | | | 4.56 | % | | | 6.56 | % | | | (0.44 | )% |
Ratios to average net assets (annualized) | | | | | | | | | | | | | | | | | | | | | | | | |
Gross expenses3 | | | 2.03 | % | | | 2.05 | % | | | 2.06 | % | | | 2.08 | % | | | 2.07 | % | | | 2.07 | % |
Net expenses3 | | | 1.84 | % | | | 1.84 | % | | | 1.87 | % | | | 1.88 | % | | | 1.90 | % | | | 1.90 | % |
Net investment income3 | | | 0.39 | % | | | 0.69 | % | | | 0.89 | % | | | 0.66 | % | | | 0.50 | % | | | 0.51 | % |
Supplemental data | | | | | | | | | | | | | | | | | | | | | | | | |
Portfolio turnover rate4 | | | 59 | % | | | 119 | % | | | 191 | % | | | 113 | % | | | 114 | % | | | 87 | % |
Net assets, end of period (000s omitted) | | | $7,570 | | | | $7,935 | | | | $8,509 | | | | $10,260 | | | | $12,180 | | | | $12,501 | |
| 1 | Calculated based upon average shares outstanding |
| 2 | Total return calculations do not include any sales charges. Returns for periods of less than one year are not annualized. |
| 3 | Ratios include only the net expenses allocated from the affiliated Master Portfolios and do not include expenses from any other affiliated Underlying Funds. Net expenses allocated from the affiliated Master Portfolios included in the ratios were as follows: |
| | | | |
Six months ended November 30, 2020 (unaudited) | | | 0.35 | % |
Year ended May 31, 2020 | | | 0.37 | % |
Year ended May 31, 2019 | | | 0.40 | % |
Year ended May 31, 2018 | | | 0.44 | % |
Year ended May 31, 2017 | | | 0.46 | % |
Year ended May 31, 2016 | | | 0.47 | % |
| 4 | Portfolio turnover rate is calculated by multiplying the Fund’s ownership percentage in the respective affiliated Master Portfolio by the corresponding affiliated Master Portfolio’s purchases and sales. These purchases and sales amounts are aggregated with the direct purchases and sales in the affiliated Underlying Funds and unaffiliated securities and included in the portfolio turnover calculation. |
The accompanying notes are an integral part of these financial statements.
16 | Wells Fargo Moderate Balanced Fund
Financial highlights
(For a share outstanding throughout each period)
| | | | | | | | | | | | | | | | | | | | | | | | |
| | | Six months ended
November 30, 2020
(unaudited) | | | Year ended May 31 | |
| ADMINISTRATOR CLASS | | 2020 | | | 2019 | | | 2018 | | | 2017 | | | 2016 | |
Net asset value, beginning of period | | | $21.10 | | | | $20.56 | | | | $22.94 | | | | $23.68 | | | | $22.70 | | | | $23.75 | |
Net investment income | | | 0.16 | | | | 0.35 | 1 | | | 0.41 | 1 | | | 0.38 | | | | 0.35 | 1 | | | 0.32 | |
Net realized and unrealized gains (losses) on investments | | | 2.07 | | | | 0.88 | | | | 0.12 | | | | 0.94 | | | | 1.35 | | | | (0.21 | ) |
| | | | | | | | | | | | | | | | | | | | | | | | |
Total from investment operations | | | 2.23 | | | | 1.23 | | | | 0.53 | | | | 1.32 | | | | 1.70 | | | | 0.11 | |
Distributions to shareholders from | | | | | | | | | | | | | | | | | | | | | | | | |
Net investment income | | | 0.00 | | | | (0.40 | ) | | | (0.48 | ) | | | (0.38 | ) | | | (0.35 | ) | | | (0.31 | ) |
Net realized gains | | | 0.00 | | | | (0.29 | ) | | | (2.43 | ) | | | (1.68 | ) | | | (0.37 | ) | | | (0.85 | ) |
| | | | | | | | | | | | | | | | | | | | | | | | |
Total distributions to shareholders | | | 0.00 | | | | (0.69 | ) | | | (2.91 | ) | | | (2.06 | ) | | | (0.72 | ) | | | (1.16 | ) |
Net asset value, end of period | | | $23.33 | | | | $21.10 | | | | $20.56 | | | | $22.94 | | | | $23.68 | | | | $22.70 | |
Total return2 | | | 10.66 | % | | | 5.94 | % | | | 2.95 | % | | | 5.59 | % | | | 7.62 | % | | | 0.59 | % |
Ratios to average net assets (annualized) | | | | | | | | | | | | | | | | | | | | | | | | |
Gross expenses3 | | | 1.20 | % | | | 1.22 | % | | | 1.23 | % | | | 1.25 | % | | | 1.24 | % | | | 1.23 | % |
Net expenses3 | | | 0.84 | % | | | 0.83 | % | | | 0.87 | % | | | 0.88 | % | | | 0.90 | % | | | 0.90 | % |
Net investment income3 | | | 1.40 | % | | | 1.69 | % | | | 1.88 | % | | | 1.67 | % | | | 1.49 | % | | | 1.48 | % |
Supplemental data | | | | | | | | | | | | | | | | | | | | | | | | |
Portfolio turnover rate4 | | | 59 | % | | | 119 | % | | | 191 | % | | | 113 | % | | | 114 | % | | | 87 | % |
Net assets, end of period (000s omitted) | | | $69,649 | | | | $78,538 | | | | $78,209 | | | | $112,302 | | | | $112,835 | | | | $156,915 | |
| 1 | Calculated based upon average shares outstanding |
| 2 | Returns for periods of less than one year are not annualized. |
| 3 | Ratios include only the net expenses allocated from the affiliated Master Portfolios and do not include expenses from any other affiliated Underlying Funds. Net expenses allocated from the affiliated Master Portfolios included in the ratios were as follows: |
| | | | |
Six months ended November 30, 2020 (unaudited) | | | 0.35 | % |
Year ended May 31, 2020 | | | 0.37 | % |
Year ended May 31, 2019 | | | 0.41 | % |
Year ended May 31, 2018 | | | 0.44 | % |
Year ended May 31, 2017 | | | 0.46 | % |
Year ended May 31, 2016 | | | 0.47 | % |
| 4 | Portfolio turnover rate is calculated by multiplying the Fund’s ownership percentage in the respective affiliated Master Portfolio by the corresponding affiliated Master Portfolio’s purchases and sales. These purchases and sales amounts are aggregated with the direct purchases and sales in the affiliated Underlying Funds and unaffiliated securities and included in the portfolio turnover calculation. |
The accompanying notes are an integral part of these financial statements.
Wells Fargo Moderate Balanced Fund | 17
Financial highlights
(For a share outstanding throughout each period)
| | | | | | | | | | | | |
| | | Six months ended
November 30, 2020
(unaudited) | | | Year ended May 31 | |
| INSTITUTIONAL CLASS | | 2020 | | | 20191 | |
Net asset value, beginning of period | | | $21.14 | | | | $20.60 | | | | $23.24 | |
Net investment income | | | 0.18 | | | | 0.37 | 2 | | | 0.37 | 2 |
Net realized and unrealized gains (losses) on investments | | | 2.07 | | | | 0.88 | | | | (0.12 | ) |
| | | | | | | | | | | | |
Total from investment operations | | | 2.25 | | | | 1.25 | | | | 0.25 | |
Distributions to shareholders from | | | | | | | | | | | | |
Net investment income | | | 0.00 | | | | (0.42 | ) | | | (0.46 | ) |
Net realized gains | | | 0.00 | | | | (0.29 | ) | | | (2.43 | ) |
| | | | | | | | | | | | |
Total distributions to shareholders | | | 0.00 | | | | (0.71 | ) | | | (2.89 | ) |
Net asset value, end of period | | | $23.39 | | | | $21.14 | | | | $20.60 | |
Total return3 | | | 10.55 | % | | | 6.02 | % | | | 1.72 | % |
Ratios to average net assets (annualized) | | | | | | | | | | | | |
Gross expenses4 | | | 0.95 | % | | | 0.97 | % | | | 0.98 | % |
Net expenses4 | | | 0.74 | % | | | 0.74 | % | | | 0.75 | % |
Net investment income4 | | | 1.49 | % | | | 1.78 | % | | | 2.15 | % |
Supplemental data | | | | | | | | | | | | |
Portfolio turnover rate5 | | | 59 | % | | | 119 | % | | | 191 | % |
Net assets, end of period (000s omitted) | | | $11,997 | | | | $10,504 | | | | $8,871 | |
| 1 | For the period from July 31, 2018 (commencement of class operations) to May 31, 2019 |
| 2 | Calculated based upon average shares outstanding |
| 3 | Returns for periods of less than one year are not annualized. |
| 4 | Ratios include only the net expenses allocated from the affiliated Master Portfolios and do not include expenses from any other affiliated Underlying Funds. Net expenses allocated from the affiliated Master Portfolios included in the ratios were as follows: |
| | | | |
Six months ended November 30, 2020 (unaudited) | | | 0.35 | % |
Year ended May 31, 2020 | | | 0.37 | % |
Year ended May 31, 20191 | | | 0.38 | % |
| 5 | Portfolio turnover rate is calculated by multiplying the Fund’s ownership percentage in the respective affiliated Master Portfolio by the corresponding affiliated Master Portfolio’s purchases and sales. These purchases and sales amounts are aggregated with the direct purchases and sales in the affiliated Underlying Funds and unaffiliated securities and included in the portfolio turnover calculation. |
The accompanying notes are an integral part of these financial statements.
18 | Wells Fargo Moderate Balanced Fund
Notes to financial statements (unaudited)
1. ORGANIZATION
Wells Fargo Funds Trust (the “Trust”), a Delaware statutory trust organized on March 10, 1999, is an open-end management investment company registered under the Investment Company Act of 1940, as amended (the “1940 Act”). As an investment company, the Trust follows the accounting and reporting guidance in Financial Accounting Standards Board (“FASB”) Accounting Standards Codification Topic 946, Financial Services – Investment Companies. These financial statements report on the Wells Fargo Moderate Balanced Fund (the “Fund”) which is a diversified series of the Trust.
The Fund is a fund-of-funds that invests in various affiliated mutual funds (“Underlying Funds”) employing a multi-asset, multi-style investment approach designed to reduce the price and return volatility of the Fund and to provide more consistent returns. The Fund may also invest directly in securities. The Underlying Funds incur separate expenses in seeking to achieve their investment objectives. Investments in affiliated Underlying Funds may also include investments in one or more separate diversified portfolios (collectively, the “affiliated Master Portfolios”) of Wells Fargo Master Trust, a registered open-end management investment company. Each affiliated Master Portfolio directly acquires portfolio securities and the Fund acquires an indirect interest in those securities. The Fund accounts for its investments in the affiliated Master Portfolios as partnership investments and records on a daily basis its share of the affiliated Master Portfolio’s income, expense and realized and unrealized gains and losses. The financial statements of the affiliated Master Portfolios are presented in separate financial statements and may be obtained free of charge by contacting Investor Services or by visiting the SEC website at sec.gov. The financial statements of the affiliated Master Portfolios are filed with the SEC under Wells Fargo Master Trust. The financial statements for all other affiliated Underlying Funds are also publicly available on the SEC website at sec.gov.
2. SIGNIFICANT ACCOUNTING POLICIES
The following significant accounting policies, which are consistently followed in the preparation of the financial statements of the Fund, are in conformity with U.S. generally accepted accounting principles which require management to make estimates and assumptions that affect the reported amounts of assets and liabilities, disclosure of contingent assets and liabilities at the date of the financial statements, and the reported amounts of revenues and expenses during the reporting period. Actual results could differ from those estimates.
Securities valuation
All investments are valued each business day as of the close of regular trading on the New York Stock Exchange (generally 4 p.m. Eastern Time), although the Fund may deviate from this calculation time under unusual or unexpected circumstances.
Investments in the affiliated Master Portfolios are valued daily based on the Fund’s proportionate share of each affiliated Master Portfolio’s net assets, which are also valued daily.
Investments in underlying mutual funds are valued at net asset per share as reported by the Underlying Funds as of the close of the regular trading on the New York Stock Exchange on each day the exchange is open for trading.
Debt securities are valued at the evaluated bid price provided by an independent pricing service (e.g. taking into account various factors, including yields, maturities, or credit ratings) or, if a reliable price is not available, the quoted bid price from an independent broker-dealer.
Equity securities and futures contracts that are listed on a foreign or domestic exchange or market are valued at the official closing price or, if none, the last sales price. If no sale occurs on the principal exchange or market that day, a fair value price will be determined in accordance with the Fund’s Valuation Procedures.
Investments which are not valued using any of the methods discussed above are valued at their fair value, as determined in good faith by the Board of Trustees of the Fund. The Board of Trustees has established a Valuation Committee comprised of the Trustees and has delegated to it the authority to take any actions regarding the valuation of portfolio securities that the Valuation Committee deems necessary or appropriate, including determining the fair value of portfolio securities, unless the determination has been delegated to the Wells Fargo Asset Management Pricing Committee at Wells Fargo Funds Management, LLC (“Funds Management”). The Board of Trustees retains the authority to make or ratify any valuation decisions or approve any changes to the Valuation Procedures as it deems appropriate. On a quarterly basis, the Board of Trustees receives reports on any valuation actions taken by the Valuation Committee or the Wells Fargo Asset Management Pricing Committee which may include items for ratification.
Futures contracts
Futures contracts are agreements between the Fund and a counterparty to buy or sell a specific amount of a commodity, financial instrument or currency at a specified price and on a specified date. The Fund may buy and sell futures contracts in order to gain exposure to, or protect against, changes in interest rates, security values, and foreign exchange rates and is
Wells Fargo Moderate Balanced Fund | 19
Notes to financial statements (unaudited)
subject to interest rate risk, equity price risk, and foreign currency risk. The primary risks associated with the use of futures contracts are the imperfect correlation between changes in market values of securities held by the Fund and the prices of futures contracts, and the possibility of an illiquid market. Futures contracts are generally entered into on a regulated futures exchange and cleared through a clearinghouse associated with the exchange. With futures contracts, there is minimal counterparty risk to the Fund since futures contracts are exchange traded and the exchange’s clearinghouse, as the counterparty to all exchange traded futures, guarantees the futures contracts against default.
Upon entering into a futures contracts, the Fund is required to deposit either cash or securities (initial margin) with the broker in an amount equal to a certain percentage of the contract value. Subsequent payments (variation margin) are paid to or from the broker each day equal to the daily changes in the contract value. Such payments are recorded as unrealized gains or losses and, if any, shown as variation margin receivable (payable) in the Statement of Assets and Liabilities. Should the Fund fail to make requested variation margin payments, the broker can gain access to the initial margin to satisfy the Fund’s payment obligations. When the contracts are closed, a realized gain or loss is recorded in the Statement of Operations.
Investment transactions, income and expenses
Investments in the affiliated Master Portfolios are recorded on a trade basis. The Fund records daily its proportionate share of each affiliated Master Portfolio’s income, expenses and realized and unrealized gains or losses. The Fund also accrues its own expenses.
Securities transactions are recorded on a trade date basis. Realized gains or losses are recorded on the basis of identified cost.
Income dividends and capital gain distributions from investment companies are recorded on the ex-dividend date. Capital gain distributions from investment companies are treated as realized gains.
Distributions to shareholders
Distributions to shareholders from net investment income and any net realized gains are recorded on the ex-dividend date and paid at least annually. Such distributions are determined in accordance with income tax regulations and may differ from U.S. generally accepted accounting principles. Dividend sources are estimated at the time of declaration. The tax character of distributions is determined as of the Fund’s fiscal year end. Therefore, a portion of the Fund’s distributions made prior to the Fund’s fiscal year end may be categorized as a tax return of capital at year end.
Federal and other taxes
The Fund intends to continue to qualify as a regulated investment company by distributing substantially all of its investment company taxable income and any net realized capital gains (after reduction for capital loss carryforwards) sufficient to relieve it from all, or substantially all, federal income taxes. Accordingly, no provision for federal income taxes was required.
The Fund’s income and federal excise tax returns and all financial records supporting those returns for the prior three fiscal years are subject to examination by the federal and Delaware revenue authorities. Management has analyzed the Fund’s tax positions taken on federal, state, and foreign tax returns for all open tax years and does not believe that there are any uncertain tax positions that require recognition of a tax liability.
As of November 30, 2020, the aggregate cost of all investments for federal income tax purposes was $104,060,794 and the unrealized gains (losses) consisted of:
| | | | |
| |
Gross unrealized gains | | $ | 19,585,621 | |
| |
Gross unrealized losses | | | 0 | |
| |
Net unrealized gains | | $ | 19,585,621 | |
Class allocations
The separate classes of shares offered by the Fund differ principally in applicable sales charges, distribution, shareholder servicing, and administration fees. Class specific expenses are charged directly to that share class. Investment income, common fund-level expenses, and realized and unrealized gains (losses) on investments are allocated daily to each class of shares based on the relative proportion of net assets of each class.
3. FAIR VALUATION MEASUREMENTS
Fair value measurements of investments are determined within a framework that has established a fair value hierarchy based upon the various data inputs utilized in determining the value of the Fund’s investments. The three-level hierarchy gives the highest priority to unadjusted quoted prices in active markets for identical assets or liabilities (Level 1) and the lowest priority to
20 | Wells Fargo Moderate Balanced Fund
Notes to financial statements (unaudited)
unobservable inputs (Level 3). The Fund’s investments are classified within the fair value hierarchy based on the lowest level of input that is significant to the fair value measurement. The inputs are summarized into three broad levels as follows:
| ∎ | | Level 1 – quoted prices in active markets for identical securities |
| ∎ | | Level 2 – other significant observable inputs (including quoted prices for similar securities, interest rates, prepayment speeds, credit risk, etc.) |
| ∎ | | Level 3 – significant unobservable inputs (including the Fund’s own assumptions in determining the fair value of investments) |
The inputs or methodologies used for valuing investments in securities are not necessarily an indication of the risk associated with investing in those securities.
The following is a summary of the inputs used in valuing the Fund’s assets and liabilities as of November 30, 2020:
| | | | | | | | | | | | | | | | |
| | | | |
| | | Quoted prices (Level 1) | | | Other significant observable inputs (Level 2) | | | Significant unobservable inputs (Level 3) | | | Total | |
| | | | |
Assets | | | | | | | | | | | | | | | | |
Investments in: | | | | | | | | | | | | | | | | |
| | | | |
Exchange-traded funds | | $ | 6,542,389 | | | $ | 0 | | | $ | 0 | | | $ | 6,542,389 | |
| | | | |
Investments in investment companies | | | 20,568,554 | | | $ | 0 | | | $ | 0 | | | | 20,568,554 | |
| | | | |
Investments measured at net asset value* | | | | | | | | | | | | | | | 96,255,231 | |
| | | | |
| | | 27,110,943 | | | | 0 | | | | 0 | | | | 123,336,174 | |
| | | | |
Futures contracts | | | 384,702 | | | | 0 | | | | 0 | | | | 384,702 | |
| | | | |
Total assets | | $ | 27,495,645 | | | $ | 0 | | | $ | 0 | | | $ | 123,750,876 | |
| | | | |
Liabilities | | | | | | | | | | | | | | | | |
| | | | |
Futures contracts | | $ | 104,461 | | | $ | 0 | | | $ | 0 | | | $ | 104,461 | |
| | | | |
Total liabilities | | $ | 104,461 | | | $ | 0 | | | $ | 0 | | | $ | 104,461 | |
| * | Investments that are measured at fair value using the net asset value per share (or its equivalent) as a practical expedient have not been categorized in the fair value hierarchy. The fair value amount presented in the table is intended to permit reconciliation of the fair value hierarchy to the amounts presented in the Statement of Assets and Liabilities. The Fund’s investment in affiliated Master Portfolios are valued at $96,255,231. Each affiliated Master Portfolio does not have a redemption period notice, can be redeemed daily and does not have any unfunded commitments. |
Futures contracts are reported at their cumulative unrealized gains (losses) at measurement date as reported in the table following the Portfolio of Investments. For futures contracts, the current day’s variation margin is reported on the Statement of Assets and Liabilities. All other assets and liabilities are reported at their market value at measurement date.
For the six months ended November 30, 2020, the Fund did not have any transfers into/out of Level 3.
Wells Fargo Moderate Balanced Fund | 21
Notes to financial statements (unaudited)
The investment objective of each affiliated Master Portfolio is as follows:
| | |
| |
| Affiliated Master Portfolio | | Investment objective |
| |
Wells Fargo C&B Large Cap Value Portfolio | | Seeks maximum long-term total return (current income and capital appreciation), consistent with minimizing risk to principal |
| |
Wells Fargo Core Bond Portfolio | | Seeks total return, consisting of income and capital appreciation |
| |
Wells Fargo Disciplined International Developed Markets Portfolio | | Seeks long-term capital appreciation |
| |
Wells Fargo Disciplined Large Cap Portfolio | | Seeks long-term capital appreciation |
| |
Wells Fargo Diversified Large Cap Growth Portfolio | | Seeks long-term capital appreciation |
| |
Wells Fargo Emerging Growth Portfolio | | Seeks long-term capital appreciation |
| |
Wells Fargo Factor Enhanced Emerging Markets Equity Portfolio | | Seeks long-term capital appreciation |
| |
Wells Fargo Factor Enhanced International Equity Portfolio | | Seeks long-term capital appreciation |
| |
Wells Fargo International Value Portfolio | | Seeks long-term capital appreciation |
| |
Wells Fargo Large Company Value Portfolio | | Seeks long-term capital appreciation |
| |
Wells Fargo Managed Fixed Income Portfolio | | Seeks consistent fixed-income returns |
| |
Wells Fargo Real Return Portfolio | | Seeks returns that exceed the rate of inflation over the long-term |
| |
Wells Fargo Small Company Growth Portfolio | | Seeks long-term capital appreciation |
| |
Wells Fargo Small Company Value Portfolio | | Seeks long-term capital appreciation |
4. TRANSACTIONS WITH AFFILIATES
Management fee
Funds Management, an indirect wholly owned subsidiary of Wells Fargo & Company (“Wells Fargo”), is the manager of the Fund and provides advisory and fund-level administrative services under an investment management agreement. Under the investment management agreement, Funds Management is responsible for, among other services, implementing the investment objectives and strategies of the Fund, supervising the subadviser and providing fund-level administrative services in connection with the Fund’s operations. As compensation for its services under the investment management agreement, Funds Management is entitled to receive a management fee at the following annual rate based on the Fund’s average daily net assets:
| | | | |
| |
| Average daily net assets | | Management fee | |
| |
First $500 million | | | 0.30 | % |
| |
Next $500 million | | | 0.28 | |
| |
Next $2 billion | | | 0.26 | |
| |
Next $2 billion | | | 0.24 | |
| |
Next $5 billion | | | 0.23 | |
| |
Over $10 billion | | | 0.22 | |
For the six months ended November 30, 2020, the management fee was equivalent to an annual rate of 0.30% of the Fund’s average daily net assets.
Funds Management also serves as the adviser to each affiliated Master Portfolio and is entitled to receive a fee from the affiliated Master Portfolio for those services.
Funds Management has retained the services of a subadviser to provide daily portfolio management to the Fund. The fee for subadvisory services is borne by Funds Management. Wells Capital Management Incorporated , an affiliate of Funds Management and an indirect wholly owned subsidiary of Wells Fargo, is the subadviser to the Fund and is entitled to receive a fee from Funds Management at an annual rate starting at 0.10% and declining to 0.05% as the average daily net assets of the Fund increase.
22 | Wells Fargo Moderate Balanced Fund
Notes to financial statements (unaudited)
Administration fees
Under a class-level administration agreement, Funds Management provides class-level administrative services to the Fund, which includes paying fees and expenses for services provided by the transfer agent, sub-transfer agents, omnibus account servicers and record-keepers. As compensation for its services under the class-level administration agreement, Funds Management receives an annual fee which is calculated based on the average daily net assets of each class as follows:
| | | | |
| |
| | | Class-level
administration fee | |
| |
Class A, Class C | | | 0.21 | % |
| |
Administrator Class, Institutional Class | | | 0.13 | |
Waivers and/or expense reimbursements
Funds Management has contractually waived and/or reimbursed management and administration fees to the extent necessary to maintain certain net operating expense ratios for the Fund. When each class of the Fund has exceeded its expense cap, Funds Management has waived fees and/or reimbursed expenses from fund-level expenses on a proportionate basis and then from class specific expenses. When only certain classes exceed their expense caps, waivers and/or reimbursements are applied against class specific expenses before fund-level expenses. Net expenses from the affiliated Master Portfolios are included in the expense caps. Funds Management has committed through September 30, 2021 to waive fees and/or reimburse expenses to the extent necessary to cap the Fund’s expenses at 1.15% for Class A shares, 1.90% for Class C shares, 0.90% for Administrator Class shares, and 0.80% for Institutional Class shares. Prior to or after the commitment expiration date, the cap may be increased or the commitment to maintain the cap may be terminated only with the approval of the Board of Trustees.
Distribution fee
The Trust has adopted a distribution plan for Class C shares of the Fund pursuant to Rule 12b-1 under the 1940 Act. A distribution fee is charged to Class C shares and paid to Wells Fargo Funds Distributor, LLC (“Funds Distributor”), the principal underwriter, at an annual rate of 0.75% of the average daily net assets of Class C shares.
In addition, Funds Distributor is entitled to receive the front-end sales charge from the purchase of Class A shares and a contingent deferred sales charge on the redemption of certain Class A shares. Funds Distributor is also entitled to receive the contingent deferred sales charges from redemptions of Class C shares. For the six months ended November 30, 2020, Funds Distributor received $3,533 from the sale of Class A shares. No contingent deferred sales charges were incurred by Class A and Class C shares for the six months ended November 30, 2020.
Shareholder servicing fees
The Trust has entered into contracts with one or more shareholder servicing agents, whereby Class A, Class C, and Administrator Class of the Fund are charged a fee at an annual rate of 0.25% of the average daily net assets of each respective class. A portion of these total shareholder servicing fees were paid to affiliates of Wells Fargo.
5. INVESTMENT PORTFOLIO TRANSACTIONS
The Fund seeks to achieve its investment objective by investing in multiple affiliated Master Portfolios. Purchases and sales related to these investments have been calculated by aggregating the results of multiplying the Fund’s ownership percentage in the respective affiliated Master Portfolio by the corresponding affiliated Master Portfolio’s purchases and sales. Purchases and sales of Underlying Funds and unaffiliated securities in which the Fund invests are actual purchases and sale of those securities. Purchases and sales of investments, excluding short-term securities, for the six months ended November 30, 2020 were as follows:
| | | | | | |
Purchases at cost | | Sales proceeds |
U.S.
government | | Non-U.S.
government | | U.S.
government | | Non-U.S.
government |
| $26,624,705 | | $43,773,434 | | $22,803,957 | | $46,830,967 |
6. DERIVATIVE TRANSACTIONS
During the six months ended November 30, 2020, the Fund entered into futures contracts to gain market exposure to certain asset classes consistent with its asset allocation strategy. The Fund had an average notional amount of $9,390,854 in long futures contracts and $8,893,171 in short futures contracts during the six months ended November 30, 2020.
Wells Fargo Moderate Balanced Fund | 23
Notes to financial statements (unaudited)
A summary of the location of derivative instruments on the financial statements by primary risk exposure is outlined in the following tables.
The fair value of derivative instruments as of November 30, 2020 by risk type was as follows for the Fund:
| | | | | | | | | | | | |
| | | Asset derivatives | | | Liability derivatives | |
| | | | |
| | | Statement of Assets and
Liabilities location | | Fair value | | | Statement of Assets and
Liabilities location | | Fair value | |
| | | | |
Equity risk | | Unrealized gains on futures contracts | | $ | 342,216 | * | | Unrealized losses on futures contracts | | $ | 104,461 | * |
| | | | |
Foreign currency risk | | Unrealized gains on futures contracts | | | 19,844 | * | | Unrealized losses on futures contracts | | | 0 | * |
| | | | |
Interest rate risk | | Unrealized gains on futures contracts | | | 22,642 | * | | Unrealized losses on futures contracts | | | 0 | * |
| | | | |
| | | | | $ | 384,702 | | | | | $ | 104,461 | |
| * | Amount represents cumulative unrealized gains (losses) as reported in the table following the Portfolio of Investments. Only the current day’s variation margin as of November 30, 2020 is reported separately on the Statement of Assets and Liabilities. |
The effect of derivative instruments on the Statement of Operations for the six months ended November 30, 2020 was as follows for the Fund:
| | | | | | | | |
| | |
| | | Amount of realized gains (losses) on
derivatives | | | Change in unrealized gains (losses) on
derivatives | |
| | |
Equity risk | | $ | 1,365,315 | | | $ | (677,195 | ) |
| | |
Foreign currency risk | | | (331,319 | ) | | | 77,363 | |
| | |
Interest rate risk | | | 71,158 | | | | 22,642 | |
| | |
| | | $ | 1,105,154 | | | $ | (577,190 | ) |
7. BANK BORROWINGS
The Trust (excluding the money market funds), Wells Fargo Master Trust and Wells Fargo Variable Trust are parties to a $350,000,000 revolving credit agreement whereby the Fund is permitted to use bank borrowings for temporary or emergency purposes, such as to fund shareholder redemption requests. Interest under the credit agreement is charged to the Fund based on a borrowing rate equal to the higher of the Federal Funds rate in effect on that day plus 1.25% or the overnight LIBOR rate in effect on that day plus 1.25%. In addition, an annual commitment fee equal to 0.25% of the unused balance is allocated to each participating fund.
For the six months ended November 30, 2020, there were no borrowings by the Fund under the agreement.
8. INDEMNIFICATION
Under the Fund’s organizational documents, the officers and Trustees have been granted certain indemnification rights against certain liabilities that may arise out of performance of their duties to the Fund. The Fund has entered into a separate agreement with each Trustee that converts indemnification rights currently existing under the Fund’s organizational documents into contractual rights that cannot be changed in the future without the consent of the Trustee. Additionally, in the normal course of business, the Fund may enter into contracts with service providers that contain a variety of indemnification clauses. The Fund’s maximum exposure under these arrangements is dependent on future claims that may be made against the Fund and, therefore, cannot be estimated.
9. NEW ACCOUNTING PRONOUNCEMENT
In August 2018, FASB issued Accounting Standards Update (“ASU”) No. 2018-13, Fair Value Measurement (Topic 820) Disclosure Framework—Changes to the Disclosure Requirements for Fair Value Measurement. ASU 2018-13 updates the disclosure requirements on fair value measurements in Topic 820, Fair Value Measurements. The amendments are effective for fiscal years, and interim periods within those fiscal years, beginning after December 15, 2019. Management has adopted this guidance which did not have a material impact on the financial statements.
24 | Wells Fargo Moderate Balanced Fund
Notes to financial statements (unaudited)
10. CORONAVIRUS (COVID-19) PANDEMIC
On March 11, 2020, the World Health Organization announced that it had made the assessment that coronavirus disease 2019 (“COVID-19”) is a pandemic. The impacts of COVID-19 are adversely affecting the entire global economy, individual companies and investment products, and the market in general. There is significant uncertainty around the extent and duration of business disruptions related to COVID-19 and the impacts may be short term or may last for an extended period of time. The risk of further spreading of COVID-19 has led to significant uncertainty and volatility in the financial markets.
Wells Fargo Moderate Balanced Fund | 25
Other information (unaudited)
PROXY VOTING INFORMATION
A description of the policies and procedures used to determine how to vote proxies relating to portfolio securities is available, upon request, by calling 1-800-222-8222, visiting our website at wfam.com, or visiting the SEC website at sec.gov. Information regarding how the proxies related to portfolio securities were voted during the most recent 12-month period ended June 30 is available on the website at wfam.com or by visiting the SEC website at sec.gov.
QUARTERLY PORTFOLIO HOLDINGS INFORMATION
The Fund files its complete schedule of portfolio holdings with the SEC for the first and third quarters of each fiscal year as an exhibit to its reports on Form N-PORT. Shareholders may view the filed Form N-PORT by visiting the SEC website at sec.gov.
26 | Wells Fargo Moderate Balanced Fund
Other information (unaudited)
BOARD OF TRUSTEES AND OFFICERS
Each of the Trustees and Officers1 listed in the table below acts in identical capacities for each fund in the Wells Fargo family of funds, which consists of 144 mutual funds comprising the Wells Fargo Funds Trust, Wells Fargo Variable Trust, Wells Fargo Master Trust and four closed-end funds (collectively the “Fund Complex”). This table should be read in conjunction with the Prospectus and the Statement of Additional Information2. The mailing address of each Trustee and Officer is 525 Market Street, 12th Floor, San Francisco, CA 94105. Each Trustee and Officer serves an indefinite term, however, each Trustee serves such term until reaching the mandatory retirement age established by the Trustees.
Independent Trustees
| | | | | | |
Name and year of birth | | Position held and
length of service* | | Principal occupations during past five years or longer | | Current other
public company or
investment
company
directorships |
| | | |
William R. Ebsworth (Born 1957) | | Trustee, since 2015 | | Retired. From 1984 to 2013, equities analyst, portfolio manager, research director and chief investment officer at Fidelity Management and Research Company in Boston, Tokyo, and Hong Kong, and retired in 2013 as Chief Investment Officer of Fidelity Strategic Advisers, Inc. where he led a team of investment professionals managing client assets. Prior thereto, Board member of Hong Kong Securities Clearing Co., Hong Kong Options Clearing Corp., the Thailand International Fund, Ltd., Fidelity Investments Life Insurance Company, and Empire Fidelity Investments Life Insurance Company. Audit Committee Chair and Investment Committee Chair of the Vincent Memorial Hospital Endowment (non-profit organization). Mr. Ebsworth is a CFA® charterholder. | | N/A |
| | | |
Jane A. Freeman (Born 1953) | | Trustee, since 2015; Chair Liaison, since 2018 | | Retired. From 2012 to 2014 and 1999 to 2008, Chief Financial Officer of Scientific Learning Corporation. From 2008 to 2012, Ms. Freeman provided consulting services related to strategic business projects. Prior to 1999, Portfolio Manager at Rockefeller & Co. and Scudder, Stevens & Clark. Board member of the Harding Loevner Funds from 1996 to 2014, serving as both Lead Independent Director and chair of the Audit Committee. Board member of the Russell Exchange Traded Funds Trust from 2011 to 2012 and the chair of the Audit Committee. Ms. Freeman is also an inactive Chartered Financial Analyst. | | N/A |
| | | |
Isaiah Harris, Jr. (Born 1952) | | Trustee, since 2009; Audit Committee Chair, since 2019 | | Retired. Chairman of the Board of CIGNA Corporation since 2009, and Director since 2005. From 2003 to 2011, Director of Deluxe Corporation. Prior thereto, President and CEO of BellSouth Advertising and Publishing Corp. from 2005 to 2007, President and CEO of BellSouth Enterprises from 2004 to 2005 and President of BellSouth Consumer Services from 2000 to 2003. Emeritus member of the Iowa State University Foundation Board of Governors. Emeritus Member of the Advisory Board of Iowa State University School of Business. Advisory Board Member, Palm Harbor Academy (private school). Mr. Harris is a certified public accountant (inactive status). | | CIGNA Corporation |
| | | |
Judith M. Johnson (Born 1949) | | Trustee, since 2008 | | Retired. Prior thereto, Chief Executive Officer and Chief Investment Officer of Minneapolis Employees Retirement Fund from 1996 to 2008. Ms. Johnson is an attorney, certified public accountant and a certified managerial accountant. | | N/A |
| | | |
David F. Larcker (Born 1950) | | Trustee, since 2009 | | James Irvin Miller Professor of Accounting at the Graduate School of Business (Emeritus), Stanford University, Director of the Corporate Governance Research Initiative and Senior Faculty of The Rock Center for Corporate Governance since 2006. From 2005 to 2008, Professor of Accounting at the Graduate School of Business, Stanford University. Prior thereto, Ernst & Young Professor of Accounting at The Wharton School, University of Pennsylvania from 1985 to 2005. | | N/A |
Wells Fargo Moderate Balanced Fund | 27
Other information (unaudited)
| | | | | | |
Name and year of birth | | Position held and
length of service* | | Principal occupations during past five years or longer | | Current other
public company or
investment
company
directorships |
| | | |
Olivia S. Mitchell (Born 1953) | | Trustee, since 2006; Nominating and Governance Committee Chair, since 2018 | | International Foundation of Employee Benefit Plans Professor, Wharton School of the University of Pennsylvania since 1993. Director of Wharton’s Pension Research Council and Boettner Center on Pensions & Retirement Research, and Research Associate at the National Bureau of Economic Research. Previously, Cornell University Professor from 1978 to 1993. | | N/A |
| | | |
Timothy J. Penny (Born 1951) | | Trustee, since 1996; Chair, since 2018 | | President and Chief Executive Officer of Southern Minnesota Initiative Foundation, a non-profit organization, since 2007. Member of the Board of Trustees of NorthStar Education Finance, Inc., a non-profit organization, since 2007. | | N/A |
| | | |
James G. Polisson (Born 1959) | | Trustee, since 2018 | | Retired. Chief Marketing Officer, Source (ETF) UK Services, Ltd, from 2015 to 2017. From 2012 to 2015, Principal of The Polisson Group, LLC, a management consulting, corporate advisory and principal investing company. Chief Executive Officer and Managing Director at Russell Investments, Global Exchange Traded Funds from 2010 to 2012. Managing Director of Barclays Global Investors from 1998 to 2010 and Global Chief Marketing Officer for iShares and Barclays Global Investors from 2000 to 2010. Trustee of the San Francisco Mechanics’ Institute, a non-profit organization, from 2013 to 2015. Board member of the Russell Exchange Traded Fund Trust from 2011 to 2012. Director of Barclays Global Investors Holdings Deutschland GmbH from 2006 to 2009. Mr. Polisson is an attorney and has a retired status with the Massachusetts and District of Columbia Bar Associations. | | N/A |
| | | |
Pamela Wheelock (Born 1959) | | Trustee, since January 2020; previously Trustee from January 2018 to July 2019 | | Board member of the Destination Medical Center Economic Development Agency, Rochester, Minnesota since 2019. Interim President of the McKnight Foundation from January to September 2020. Acting Commissioner, Minnesota Department of Human Services, July 2019 through September 2019. Human Services Manager (part-time), Minnesota Department of Human Services, October 2019 through December 2019. Chief Operating Officer, Twin Cities Habitat for Humanity from 2017 to 2019. Vice President of University Services, University of Minnesota from 2012 to 2016. Prior thereto, on the Board of Directors, Governance Committee and Finance Committee for the Minnesota Philanthropy Partners (Saint Paul Foundation) from 2012 to 2018, Interim Chief Executive Officer of Blue Cross Blue Shield of Minnesota from 2011 to 2012, Chairman of the Board from 2009 to 2012 and Board Director from 2003 to 2015. Vice President, Leadership and Community Engagement, Bush Foundation, Saint Paul, Minnesota (a private foundation) from 2009 to 2011. Executive Vice President and Chief Financial Officer, Minnesota Sports and Entertainment from 2004 to 2009 and Senior Vice President from 2002 to 2004. Executive Vice President of the Minnesota Wild Foundation from 2004 to 2008. Commissioner of Finance, State of Minnesota, from 1999 to 2002. Currently Board Chair of the Minnesota Wild Foundation since 2010. | | N/A |
| * | Length of service dates reflect the Trustee’s commencement of service with the Trust’s predecessor entities, where applicable. |
28 | Wells Fargo Moderate Balanced Fund
Other information (unaudited)
Officers
| | | | |
Name and year of birth | | Position held and
length of service | | Principal occupations during past five years or longer |
| | |
Andrew Owen (Born 1960) | | President, since 2017 | | Executive Vice President of Wells Fargo & Company and Head of Affiliated Managers, Wells Fargo Asset Management, since 2014. In addition, Mr. Owen is currently President, Chief Executive Officer and Director of Wells Fargo Funds Management, LLC since 2017. Prior thereto, Executive Vice President responsible for marketing, investments and product development for Wells Fargo Funds Management, LLC, from 2009 to 2014. |
| | |
Jeremy DePalma1 (Born 1974) | | Treasurer, since 2012 | | Senior Vice President of Wells Fargo Funds Management, LLC since 2009. Senior Vice President of Evergreen Investment Management Company, LLC from 2008 to 2010 and head of the Fund Reporting and Control Team within Fund Administration from 2005 to 2010. |
| | |
Michelle Rhee (Born 1966) | | Chief Legal Officer, since 2019 | | Secretary of Wells Fargo Funds Management, LLC and Chief Legal Counsel of Wells Fargo Asset Management since 2018. Deputy General Counsel of Wells Fargo Bank, N.A. since 2020 and Assistant General Counsel of Wells Fargo Bank, N.A. from 2018 to 2020. Associate General Counsel and Managing Director of Bank of America Corporation from 2004 to 2018. |
| | |
Catherine Kennedy (Born 1969) | | Secretary, since 2019 | | Vice President of Wells Fargo Funds Management, LLC and Senior Counsel of the Wells Fargo Legal Department since 2010. Vice President and Senior Counsel of Evergreen Investment Management Company, LLC from 1998 to 2010. |
| | |
Michael H. Whitaker (Born 1967) | | Chief Compliance Officer, since 2016 | | Chief Compliance Officer of Wells Fargo Asset Management since 2016. Senior Vice President and Chief Compliance Officer for Fidelity Investments from 2007 to 2016. |
| 1 | Jeremy DePalma acts as Treasurer of 77 funds in the Fund Complex. |
| 2 | The Statement of Additional Information includes additional information about the Trustees and is available, without charge, upon request, by calling 1-800-222-8222 or by visiting the website at wfam.com. |
Wells Fargo Moderate Balanced Fund | 29
This page is intentionally left blank.
This page is intentionally left blank.
This page is intentionally left blank.

For more information
More information about Wells Fargo Funds is available free upon request. To obtain literature, please write, visit the Fund’s website, or call:
Wells Fargo Funds
P.O. Box 219967
Kansas City, MO 64121-9967
Website: wfam.com
Individual investors: 1-800-222-8222
Retail investment professionals: 1-888-877-9275
Institutional investment professionals: 1-866-765-0778

This report and the financial statements contained herein are submitted for the general information of the shareholders of the Fund. If this report is used for promotional purposes, distribution of the report must be accompanied or preceded by a current prospectus. Before investing, please consider the investment objectives, risks, charges, and expenses of the investment. For a current prospectus and, if available, a summary prospectus, containing this information, call 1-800-222-8222 or visit the Fund’s website at wfam.com. Read the prospectus carefully before you invest or send money.
Wells Fargo Asset Management (WFAM) is the trade name for certain investment advisory/management firms owned by Wells Fargo & Company. These firms include but are not limited to Wells Capital Management Incorporated and Wells Fargo Funds Management, LLC. Certain products managed by WFAM entities are distributed by Wells Fargo Funds Distributor, LLC (a broker-dealer and Member FINRA).
This material is for general informational and educational purposes only and is NOT intended to provide investment advice or a recommendation of any kind—including a recommendation for any specific investment, strategy, or plan.
INVESTMENT PRODUCTS: NOT FDIC INSURED ◾ NO BANK GUARANTEE ◾ MAY LOSE VALUE
© 2021 Wells Fargo & Company. All rights reserved.
PAR-1220-00730 01-20
SA279/SAR279 11-20
Semi-Annual Report
November 30, 2020
Wells Fargo C&B Large Cap Value Fund
|
|
|
Reduce clutter. Save trees. |
Sign up for
electronic delivery
of prospectuses
and shareholder
reports at
wellsfargo.com/
advantagedelivery |
The views expressed and any forward-looking statements are as of November 30, 2020, unless otherwise noted, and are those of the Fund’s portfolio managers and/or Wells Fargo Asset Management. Discussions of individual securities, or the markets generally, or any Wells Fargo Fund are not intended as individual recommendations. Future events or results may vary significantly from those expressed in any forward-looking statements. The views expressed are subject to change at any time in response to changing circumstances in the market. Wells Fargo Asset Management and the Fund disclaim any obligation to publicly update or revise any views expressed or forward-looking statements.
INVESTMENT PRODUCTS: NOT FDIC INSURED ◾ NO BANK GUARANTEE ◾ MAY LOSE VALUE
Wells Fargo C&B Large Cap Value Fund | 1
Letter to shareholders (unaudited)

Andrew Owen
President
Wells Fargo Funds
“Global stock markets rallied strongly, driven by aggressive stimulus measures introduced by central banks and governments in response to challenges presented by the COVID-19 pandemic.”
Dear Shareholder:
We are pleased to offer you this semi-annual report for the Wells Fargo C&B Large Cap Value Fund for the six-month period that ended November 30, 2020. Global stock markets rallied strongly, driven by aggressive stimulus measures introduced by central banks and governments in response to challenges presented by the COVID-19 pandemic. Emerging market equities had particularly robust results during the six-month period. Among bonds, high-yield issues led the way while U.S. bonds generally had more modest returns than their international counterparts.
For the period, U.S. stocks, based on the S&P 500 Index,1 returned 19.98% and international stocks, as measured by the MSCI ACWI ex USA Index (Net),2 gained 23.28%. The MSCI EM Index (Net)3 rallied 31.14%. Among bond investments, the Bloomberg Barclays U.S. Aggregate Bond Index4 returned a modest 1.79%, the Bloomberg Barclays Global Aggregate ex-USD Index5 gained a robust 8.19%, the Bloomberg Barclays Municipal Bond Index6 had a 3.29% return, and the ICE BofA U.S. High Yield Index7 gained a healthy 10.47%.
Equities enjoyed a strong tailwind from monetary and fiscal stimulus.
Financial markets posted widely positive returns in June despite ongoing economic weakness and uncertainty regarding COVID-19 and the timing of an effective vaccine. As economies reopened, optimism rose. Vitally important to market sentiment was the ongoing global central bank commitment to provide economic support through liquidity and low borrowing costs. U.S. economic activity was boosted by one-time $1,200 stimulus checks and $600 weekly bonus unemployment benefits for tens of millions of Americans through July. However, jobless rates remained historically high, easing somewhat from 14.7% in April to 11.1% in June. By late June, numerous states reported increases of COVID-19 cases, an ominous sign. China’s economic recovery picked up momentum in June.
July was broadly positive for both global equities and fixed income. However, economic data and a resurgence of COVID-19 cases pointed to the vulnerability of the global economy and the need to regain control of the pandemic. Second-quarter gross domestic product (GDP) shrank from the previous quarter by 9.5% and 12.1% in the U.S. and the eurozone, respectively. In contrast, China reported 3.2% year-over-year second-quarter GDP growth. U.S. unemployment remained high despite adding 1.8 million jobs in July, as a double-digit jobless rate persisted. However, manufacturing activity grew in both the U.S. and the eurozone. In Asia, while China’s manufacturing sector continued to expand, activity in Japan and South Korea contracted. A rising concern was the rapid and broad reemergence of COVID-19 infections.
| 1 | The S&P 500 Index consists of 500 stocks chosen for market size, liquidity, and industry group representation. It is a market-value-weighted index with each stock’s weight in the index proportionate to its market value. You cannot invest directly in an index. |
| 2 | The Morgan Stanley Capital International (MSCI) All Country World Index (ACWI) ex USA Index (Net) is a free-float-adjusted market-capitalization-weighted index that is designed to measure the equity market performance of developed and emerging markets, excluding the United States. Source: MSCI. MSCI makes no express or implied warranties or representations and shall have no liability whatsoever with respect to any MSCI data contained herein. The MSCI data may not be further redistributed or used as a basis for other indices or any securities or financial products. This report is not approved, reviewed, or produced by MSCI. You cannot invest directly in an index. |
| 3 | The MSCI Emerging Markets (EM) Index (Net) is a free-float-adjusted market-capitalization-weighted index that is designed to measure equity market performance of emerging markets. You cannot invest directly in an index. |
| 4 | The Bloomberg Barclays U.S. Aggregate Bond Index is a broad-based benchmark that measures the investment-grade, U.S. dollar-denominated, fixed-rate taxable bond market, including Treasuries, government-related and corporate securities, mortgage-backed securities (agency fixed-rate and hybrid adjustable-rate mortgage pass-throughs), asset-backed securities, and commercial mortgage-backed securities. You cannot invest directly in an index. |
| 5 | The Bloomberg Barclays Global Aggregate ex-USD Index is an unmanaged index that provides a broad-based measure of the global investment-grade fixed-income markets excluding the U.S. dollar-denominated debt market. You cannot invest directly in an index. |
| 6 | The Bloomberg Barclays Municipal Bond Index is an unmanaged index composed of long-term tax-exempt bonds with a minimum credit rating of Baa. You cannot invest directly in an index. |
| 7 | The ICE BofA U.S. High Yield Index is a market-capitalization-weighted index of domestic and Yankee high-yield bonds. The index tracks the performance of high-yield securities traded in the U.S. bond market. You cannot invest directly in an index. Copyright 2021. ICE Data Indices, LLC. All rights reserved. |
2 | Wells Fargo C&B Large Cap Value Fund
Letter to shareholders (unaudited)
The stock market continued to rally in August despite concerns over rising COVID-19 cases in the U.S. and Europe, as well as the expiration of the $600 weekly bonus unemployment benefit in July. Generally stronger-than-expected second-quarter earnings boosted investor sentiment along with the Federal Reserve’s announcement of a more accommodative policy shift that could lead to longer-term low interest rates. U.S. indices measuring manufacturing and services activities beat expectations while the U.S. housing market maintained strength. In Europe, retail sales expanded and consumer confidence was steady. China’s economy continued to expand.
Stocks grew more volatile in September on mixed economic data. U.S. economic activity continued to grow. However, only half of the 22 million jobs lost since the early spring had returned. The U.S. unemployment rate fell to 7.9% in September, a measurable improvement but far higher than the 3.5% pre-COVID-19 rate. Only 661,000 jobs were added for the month, down from 1.5 million in August. With the U.S. Congress failing to pass further fiscal relief and uncertainties surrounding a possible vaccine, doubts crept back into the markets. In the U.K., a lack of progress in Brexit talks with the European Union weighed on markets. China’s economy picked up steam, however, with growth fueled by increased global demand.
In October, capital markets took a step back from their six-month rally. Market volatility rose in advance of the U.S. election and amid a global increase in COVID-19 infections. Europe responded with more economic restrictions. Meanwhile, Brexit remained unresolved. U.S. markets looked favorably at a possible Democratic sweep and control of the federal purse strings in anticipation of additional fiscal stimulus, which could boost economic activity. Meanwhile, China continued to stand apart, reporting 4.9% third-quarter GDP growth year over year.
Global stocks rallied broadly in November, propelled by optimism over three promising COVID-19 vaccines, which reported high effectiveness in trials. Global stock indices notched double-digit monthly gains. In a reversal of recent trends, value stocks outperformed growth and cyclical stocks outpaced technology stocks. However, U.S. unemployment remained elevated, with a net job loss of 10 million since February. The Eurozone Services Purchasing Managers’ Index, a monthly survey of purchasing managers, contracted sharply while the region’s manufacturing activity gauge indicated growth. The U.S. election results added to the market’s upbeat mood as investors gave thumbs-up to the certainty of the outcome after an unusual delay and anticipated more consistent policies in the new administration.
Don’t let short-term uncertainty derail long-term investment goals.
Periods of investment uncertainty can present challenges, but experience has taught us that maintaining long-term investment goals can be an effective way to plan for the future. To help you create a sound strategy based on your personal goals and risk tolerance, Wells Fargo Funds offers more than 100 mutual funds spanning a wide range of asset classes and investment styles. Although diversification cannot guarantee an investment profit or prevent losses, we believe it can be an effective way to manage investment risk and potentially smooth out overall portfolio performance. We encourage investors to know their investments and to understand that appropriate levels of risk-taking may unlock opportunities.
Thank you for choosing to invest with Wells Fargo Funds. We appreciate your confidence in us and remain committed to helping you meet your financial needs.
Sincerely,

Andrew Owen
President
Wells Fargo Funds
“Global stocks rallied broadly in November, propelled by optimism over three promising COVID-19 vaccines, which reported high effectiveness in trials.”
|
|
|
For further information about your Fund, contact your investment professional, visit our website at wfam.com, or call us directly at 1-800-222-8222. |
Wells Fargo C&B Large Cap Value Fund | 3
Letter to shareholders (unaudited)
Notice to Shareholders
At a meeting held on August 10-12, 2020, the Board of Trustees of the Fund approved a change to the Fund’s automatic conversion feature for Class C shares in order to shorten the required holding period from 10 to 8 years. As a result, on a monthly basis beginning November 5, 2020, Class C shares will convert automatically into Class A shares 8 years after the initial date of purchase or, if you acquired your Class C shares through an exchange or conversion from another share class, 8 years after the date you acquired your Class C shares. When Class C shares that you acquired through a purchase or exchange convert, any other Class C shares that you purchased with reinvested dividends and distributions also will convert into Class A shares on a pro rata basis.
Please note that a shorter holding period may apply depending on your intermediary. Please see “Appendix A—Sales Charge Reductions and Waivers for Certain Intermediaries” in the Fund’s prospectus for further information.
4 | Wells Fargo C&B Large Cap Value Fund
This page is intentionally left blank.
Performance highlights (unaudited)
Investment objective
The Fund seeks maximum long-term total return (current income and capital appreciation), consistent with minimizing risk to principal.
Manager
Wells Fargo Funds Management, LLC
Subadviser for the affiliated master portfolio1
Cooke & Bieler, L.P.
Portfolio managers
Andrew B. Armstrong, CFA®‡
Wesley Lim, CFA®‡
Steve Lyons, CFA®‡
Michael M. Meyer, CFA®‡
Edward W. O’Connor, CFA®‡
R. James O’Neil, CFA®‡
Mehul Trivedi, CFA®‡
William Weber, CFA®‡
Average annual total returns (%) as of November 30, 2020
| | | | | | | | | | | | | | | | | | | | | | | | | | | | | | | | | | |
| | | | |
| | | | | Including sales charge | | | Excluding sales charge | | | Expense ratios2 (%) | |
| | | | | | | | | |
| | | Inception date | | 1 year | | | 5 year | | | 10 year | | | 1 year | | | 5 year | | | 10 year | | | Gross | | | Net3 | |
| | | | | | | | | | |
| Class A (CBEAX) | | 7-26-2004 | | | -4.07 | | | | 8.12 | | | | 9.96 | | | | 1.81 | | | | 9.40 | | | | 10.61 | | | | 1.28 | | | | 1.08 | |
| | | | | | | | | | |
| Class C (CBECX) | | 7-26-2004 | | | -0.01 | | | | 8.58 | | | | 9.77 | | | | 0.99 | | | | 8.58 | | | | 9.77 | | | | 2.03 | | | | 1.83 | |
| | | | | | | | | | |
| Class R6 (CBEJX)4 | | 10-31-2016 | | | – | | | | – | | | | – | | | | 2.27 | | | | 9.85 | | | | 11.01 | | | | 0.85 | | | | 0.65 | |
| | | | | | | | | | |
| Administrator Class (CBLLX) | | 7-26-2004 | | | – | | | | – | | | | – | | | | 1.85 | | | | 9.52 | | | | 10.77 | | | | 1.20 | | | | 1.00 | |
| | | | | | | | | | |
| Institutional Class (CBLSX) | | 7-26-2004 | | | – | | | | – | | | | – | | | | 2.17 | | | | 9.78 | | | | 11.04 | | | | 0.95 | | | | 0.75 | |
| | | | | | | | | | |
| Russell 1000® Value Index5 | | – | | | – | | | | – | | | | – | | | | 1.72 | | | | 8.44 | | | | 10.93 | | | | – | | | | – | |
Figures quoted represent past performance, which is no guarantee of future results, and do not reflect taxes that a shareholder may pay on an investment in a fund. Investment return and principal value of an investment will fluctuate so that an investor’s shares, when redeemed, may be worth more or less than their original cost. Performance shown without sales charges would be lower if sales charges were reflected. Current performance may be lower or higher than the performance data quoted, which assumes the reinvestment of dividends and capital gains. Current month-end performance is available on the Fund’s website, wfam.com.
Index returns do not include transaction costs associated with buying and selling securities, any mutual fund fees or expenses, or any taxes. It is not possible to invest directly in an index.
For Class A shares, the maximum front-end sales charge is 5.75%. For Class C shares, the maximum contingent deferred sales charge is 1.00%. Performance including a contingent deferred sales charge assumes the sales charge for the corresponding time period. Class R6, Administrator Class, and Institutional Class shares are sold without a front-end sales charge or contingent deferred sales charge.
Stock values fluctuate in response to the activities of individual companies and general market and economic conditions. Consult the Fund’s prospectus for additional information on these and other risks.
Please see footnotes on page 7.
6 | Wells Fargo C&B Large Cap Value Fund
Performance highlights (unaudited)
| | | | |
|
| Ten largest holdings (%) as of November 30, 20206 | |
| | |
Arrow Electronics Incorporated | | | 3.52 | |
| | |
Brookfield Asset Management Incorporated Class A | | | 3.15 | |
| | |
The Charles Schwab Corporation | | | 3.14 | |
| | |
Chubb Limited | | | 3.08 | |
| | |
State Street Corporation | | | 3.06 | |
| | |
Synchrony Financial | | | 3.01 | |
| | |
Gildan Activewear Incorporated | | | 2.87 | |
| | |
Johnson & Johnson | | | 2.78 | |
| | |
Leidos Holdings Incorporated | | | 2.58 | |
| | |
AerCap Holdings NV | | | 2.53 | |
|
|
| Sector allocation as of November 30, 20207 |
|
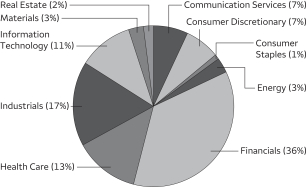 |
| ‡ | CFA® and Chartered Financial Analyst® are trademarks owned by CFA Institute. |
| 1 | The Fund is a feeder fund in a master-feeder structure that invests substantially all of its assets in a single affiliated master portfolio of the Wells Fargo Master Trust with a substantially identical investment objective and substantially similar investment strategies. References to the investment activities of the Fund are intended to refer to the investment activities of the affiliated master portfolio in which it invests. |
| 2 | Reflects the expense ratios as stated in the most recent prospectuses, which include the impact of 0.01% in acquired fund fees and expenses. The expense ratios shown are subject to change and may differ from the annualized expense ratios shown in the financial highlights of this report, which do not include acquired fund fees and expenses. |
| 3 | The manager has contractually committed through September 30, 2021, to waive fees and/or reimburse expenses to the extent necessary to cap total annual fund operating expenses after fee waivers at 1.08% for Class A, 1.83% for Class C, 0.65% for Class R6, 1.00% for Administrator Class, and 0.75% for Institutional Class. Brokerage commissions, stamp duty fees, interest, taxes, acquired fund fees and expenses (if any) from funds in which the affiliated master portfolios invest and from money market funds, and extraordinary expenses are excluded from the expense caps. Net expenses from the affiliated master portfolio are included in the expense caps. Prior to or after the commitment expiration date, the caps may be increased or the commitment to maintain the caps may be terminated only with the approval of the Board of Trustees. Without these caps, the Fund’s returns would have been lower. The expense ratio paid by an investor is the net expense ratio (the total annual fund operating expenses after fee waivers) as stated in the prospectuses. |
| 4 | Historical performance shown for the Class R6 shares prior to their inception reflects the performance of the Institutional Class shares adjusted to reflect the higher expenses applicable to the Class R6 shares. If these expenses had been included, returns for the Class R6 shares would be higher. |
| 5 | The Russell 1000® Value Index measures the performance of those Russell 1000 companies with lower price/book ratios and lower forecasted growth values. You cannot invest directly in an index. |
| 6 | Each holding represents the Fund’s allocable portion of the affiliated master portfolio security. Figures represent each holding as a percentage of the Fund’s net assets. |
| 7 | Figures represent the sector allocation of the affiliated master portfolio as a percentage of the long-term investments of the affiliated master portfolio. These amounts are subject to change and may have changed since the date specified. |
Wells Fargo C&B Large Cap Value Fund | 7
Fund expenses (unaudited)
As a shareholder of the Fund, you incur two types of costs: (1) transaction costs, including sales charges (loads) on purchase payments and contingent deferred sales charges (if any) on redemptions and (2) ongoing costs, including management fees, distribution (12b-1) and/or shareholder servicing fees, and other Fund expenses. This example is intended to help you understand your ongoing costs (in dollars) of investing in the Fund and to compare these costs with the ongoing costs of investing in other mutual funds.
The example is based on an investment of $1,000 invested at the beginning of the six-month period and held for the entire period from June 1, 2020 to November 30, 2020.
Actual expenses
The “Actual” line of the table below provides information about actual account values and actual expenses. You may use the information in this line, together with the amount you invested, to estimate the expenses that you paid over the period. Simply divide your account value by $1,000 (for example, an $8,600 account value divided by $1,000 = 8.6), then multiply the result by the number in the “Actual” line under the heading entitled “Expenses paid during period” for your applicable class of shares to estimate the expenses you paid on your account during this period.
Hypothetical example for comparison purposes
The “Hypothetical” line of the table below provides information about hypothetical account values and hypothetical expenses based on the Fund’s actual expense ratio and an assumed rate of return of 5% per year before expenses, which is not the Fund’s actual return. The hypothetical account values and expenses may not be used to estimate the actual ending account balance or expenses you paid for the period. You may use this information to compare the ongoing costs of investing in the Fund and other funds. To do so, compare this 5% hypothetical example with the 5% hypothetical examples that appear in the shareholder reports of the other funds.
Please note that the expenses shown in the table are meant to highlight your ongoing costs only and do not reflect any transactional costs, such as sales charges (loads) and contingent deferred sales charges. Therefore, the “Hypothetical” line of the table is useful in comparing ongoing costs only and will not help you determine the relative total costs of owning different funds. In addition, if these transactional costs were included, your costs would have been higher.
| | | | | | | | | | | | | | | | |
| | | Beginning
account value
6-1-2020 | | | Ending
account value
11-30-2020 | | | Expenses
paid during
the period1,2 | | | Annualized net
expense ratio1 | |
| | | | | |
Class A | | | | | | | | | | | | | | | | |
| | | | |
Actual | | $ | 1,000.00 | | | $ | 1,244.56 | | | $ | 6.02 | | | | 1.07 | % |
| | | | |
Hypothetical (5% return before expenses) | | $ | 1,000.00 | | | $ | 1,019.70 | | | $ | 5.42 | | | | 1.07 | % |
| | | | | |
Class C | | | | | | | | | | | | | | | | |
| | | | |
Actual | | $ | 1,000.00 | | | $ | 1,240.32 | | | $ | 10.28 | | | | 1.83 | % |
| | | | |
Hypothetical (5% return before expenses) | | $ | 1,000.00 | | | $ | 1,015.89 | | | $ | 9.25 | | | | 1.83 | % |
| | | | | |
Class R6 | | | | | | | | | | | | | | | | |
| | | | |
Actual | | $ | 1,000.00 | | | $ | 1,248.05 | | | $ | 3.66 | | | | 0.65 | % |
| | | | |
Hypothetical (5% return before expenses) | | $ | 1,000.00 | | | $ | 1,021.81 | | | $ | 3.29 | | | | 0.65 | % |
| | | | | |
Administrator Class | | | | | | | | | | | | | | | | |
| | | | |
Actual | | $ | 1,000.00 | | | $ | 1,245.00 | | | $ | 5.57 | | | | 0.99 | % |
| | | | |
Hypothetical (5% return before expenses) | | $ | 1,000.00 | | | $ | 1,020.10 | | | $ | 5.01 | | | | 0.99 | % |
| | | | | |
Institutional Class | | | | | | | | | | | | | | | | |
| | | | |
Actual | | $ | 1,000.00 | | | $ | 1,247.18 | | | $ | 4.23 | | | | 0.75 | % |
| | | | |
Hypothetical (5% return before expenses) | | $ | 1,000.00 | | | $ | 1,021.31 | | | $ | 3.80 | | | | 0.75 | % |
| 1 | Amounts reflect net expenses allocated from the affiliated Master Portfolio in which the Fund invests. |
| 2 | Expenses paid is equal to the annualized net expense ratio of each class multiplied by the average account value over the period, multiplied by the number of days in the most recent fiscal half-year divided by the number of days in the fiscal year (to reflect the one-half-year period). |
8 | Wells Fargo C&B Large Cap Value Fund
Portfolio of investments—November 30, 2020 (unaudited)
| | | | | | | | | | | | | | | | |
| | | | | | | | | | | | Value | |
| Investment Companies: 100.19% | | | | | | | | | | | | | | | | |
| | | | |
| Affiliated Master Portfolio: 100.19% | | | | | | | | | | | | |
Wells Fargo C&B Large Cap Value Portfolio | | | | | | | | | | | | | | $ | 254,949,135 | |
| | | | | | | | | | | | | | | | |
| | | | |
Total Investment Companies (Cost $188,819,000) | | | | | | | | | | | | | | | 254,949,135 | |
| | | | | | | | | | | | | | | | |
| | | | | | | | |
| Total investments in securities (Cost $188,819,000) | | | 100.19 | % | | | 254,949,135 | |
| | |
Other assets and liabilities, net | | | (0.19 | ) | | | (492,956 | ) |
| | | | | | | | |
| Total net assets | | | 100.00 | % | | $ | 254,456,179 | |
| | | | | | | | |
Transactions with the affiliated Master Portfolio were as follows:
| | | | | | | | | | | | | | | | | | | | | | | | | | | | | | | | |
| | | % of
ownership,
beginning
of period | | | % of
ownership,
end of
period | | | Net realized
gains
(losses) on
securities
transactions
allocated
from
affiliated
Master
Portfolio | | | Net
change in
unrealized
gains
(losses) on
securities
transactions
allocated
from
affiliated
Master
Portfolio | | | Dividends
allocated
from
affiliated
Master
Portfolio | | | Affiliated
income
allocated
from
affiliated
Master
Portfolio | | | Value,
end of
period | | | % of
net
assets | |
Wells Fargo C&B Large Cap Value Portfolio | | | 75 | % | | | 76 | % | | $ | 7,553,557 | | | $ | 43,394,844 | | | $ | 2,179,203 | | | $ | 3,058 | | | $ | 254,949,135 | | | | 100.19 | % |
The accompanying notes are an integral part of these financial statements.
Wells Fargo C&B Large Cap Value Fund | 9
Statement of assets and liabilities—November 30, 2020 (unaudited)
| | | | |
| | | | |
| |
Assets | | | | |
Investments in affiliated Master Portfolio, at value (cost $188,819,000) | | $ | 254,949,135 | |
Receivable for Fund shares sold | | | 95,295 | |
Receivable from manager | | | 1,224 | |
Prepaid expenses and other assets | | | 506 | |
| | | | |
Total assets | | | 255,046,160 | |
| | | | |
| |
Liabilities | | | | |
Payable for Fund shares redeemed | | | 479,795 | |
Administration fees payable | | | 28,521 | |
Distribution fee payable | | | 2,225 | |
Shareholder report expenses payable | | | 31,320 | |
Shareholder servicing fees payable | | | 18,545 | |
Trustees’ fees and expenses payable | | | 1,055 | |
Accrued expenses and other liabilities | | | 28,520 | |
| | | | |
Total liabilities | | | 589,981 | |
| | | | |
Total net assets | | $ | 254,456,179 | |
| | | | |
| |
Net assets consist of | | | | |
Paid-in capital | | $ | 176,282,140 | |
Total distributable earnings | | | 78,174,039 | |
| | | | |
Total net assets | | $ | 254,456,179 | |
| | | | |
| |
Computation of net asset value and offering price per share | | | | |
Net assets – Class A | | $ | 82,658,348 | |
Shares outstanding – Class A1 | | | 5,780,349 | |
Net asset value per share – Class A | | | $14.30 | |
Maximum offering price per share – Class A2 | | | $15.17 | |
Net assets – Class C | | $ | 3,631,763 | |
Shares outstanding – Class C1 | | | 257,721 | |
Net asset value per share – Class C | | | $14.09 | |
Net assets – Class R6 | | $ | 41,040,603 | |
Shares outstanding – Class R61 | | | 2,852,355 | |
Net asset value per share – Class R6 | | | $14.39 | |
Net assets – Administrator Class | | $ | 6,701,945 | |
Shares outstanding – Administrator Class1 | | | 467,627 | |
Net asset value per share – Administrator Class | | | $14.33 | |
Net assets – Institutional Class | | $ | 120,423,520 | |
Shares outstanding – Institutional Class1 | | | 8,375,029 | |
Net asset value per share – Institutional Class | | | $14.38 | |
| 1 | The Fund has an unlimited number of authorized shares. |
| 2 | Maximum offering price is computed as 100/94.25 of net asset value. On investments of $50,000 or more, the offering price is reduced. |
The accompanying notes are an integral part of these financial statements.
10 | Wells Fargo C&B Large Cap Value Fund
Statement of operations—six months ended November 30, 2020 (unaudited)
| | | | |
| | | | |
| |
Investment income | | | | |
Dividends allocated from affiliated Master Portfolio (net of foreign withholding taxes of $56,458) | | $ | 2,179,203 | |
Affiliated income allocated from affiliated Master Portfolio | | | 3,058 | |
Expenses allocated from affiliated Master Portfolio | | | (798,606 | ) |
Waivers allocated from affiliated Master Portfolio | | | 51,115 | |
| | | | |
Total investment income | | | 1,434,770 | |
| | | | |
| |
Expenses | | | | |
Management fee | | | 58,448 | |
Administration fees | | | | |
Class A | | | 78,866 | |
Class C | | | 3,827 | |
Class R6 | | | 5,745 | |
Administrator Class | | | 4,023 | |
Institutional Class | | | 71,856 | |
Shareholder servicing fees | | | | |
Class A | | | 93,754 | |
Class C | | | 4,545 | |
Administrator Class | | | 7,720 | |
Distribution fee | | | | |
Class C | | | 13,635 | |
Custody and accounting fees | | | 6,850 | |
Professional fees | | | 17,546 | |
Registration fees | | | 83,477 | |
Shareholder report expenses | | | 37,350 | |
Trustees’ fees and expenses | | | 11,029 | |
Other fees and expenses | | | 9,330 | |
| | | | |
Total expenses | | | 508,001 | |
Less: Fee waivers and/or expense reimbursements | | | | |
Fund-level | | | (246,563 | ) |
Class A | | | (4,094 | ) |
Administrator Class | | | (341 | ) |
| | | | |
Net expenses | | | 257,003 | |
| | | | |
Net investment income | | | 1,177,767 | |
| | | | |
| |
Realized and unrealized gains (losses) on investments | | | | |
Net realized gains on securities transactions allocated from affiliated Master Portfolio | | | 7,553,557 | |
Net change in unrealized gains (losses) on securities transactions allocated from affiliated Master Portfolio | | | 43,394,844 | |
| | | | |
Net realized and unrealized gains (losses) on investments | | | 50,948,401 | |
| | | | |
Net increase in net assets resulting from operations | | $ | 52,126,168 | |
| | | | |
The accompanying notes are an integral part of these financial statements.
Wells Fargo C&B Large Cap Value Fund | 11
Statement of changes in net assets
| | | | | | | | | | | | | | | | |
| | | Six months ended
November 30, 2020
(unaudited) | | | Year ended
May 31, 2020 | |
| | | | |
Operations | | | | | | | | | | | | | | | | |
Net investment income | | | | | | $ | 1,177,767 | | | | | | | $ | 3,041,679 | |
Net realized gains on investments | | | | | | | 7,553,557 | | | | | | | | 14,162,746 | |
Net change in unrealized gains (losses) on investments | | | | | | | 43,394,844 | | | | | | | | (23,968,868 | ) |
| | | | |
Net increase (decrease) in net assets resulting from operations | | | | | | | 52,126,168 | | | | | | | | (6,764,443 | ) |
| | | | |
| | | | |
Distributions to shareholders from net investment income and net realized gains | | | | | | | | | | | | | | | | |
Class A | | | | | | | 0 | | | | | | | | (7,751,447 | ) |
Class C | | | | | | | 0 | | | | | | | | (388,806 | ) |
Class R6 | | | | | | | 0 | | | | | | | | (5,218,989 | ) |
Administrator Class | | | | | | | 0 | | | | | | | | (711,108 | ) |
Institutional Class | | | | | | | 0 | | | | | | | | (11,583,308 | ) |
| | | | |
Total distributions to shareholders | | | | | | | 0 | | | | | | | | (25,653,658 | ) |
| | | | |
| | | | |
Capital share transactions | | | Shares | | | | | | | | Shares | | | | | |
Proceeds from shares sold | | | | | | | | | | | | | | | | |
Class A | | | 279,739 | | | | 3,592,305 | | | | 738,336 | | | | 9,862,221 | |
Class C | | | 23,039 | | | | 282,833 | | | | 84,359 | | | | 1,159,805 | |
Class R6 | | | 103,146 | | | | 1,292,676 | | | | 862,015 | | | | 10,181,197 | |
Administrator Class | | | 9,616 | | | | 120,970 | | | | 86,612 | | | | 1,194,613 | |
Institutional Class | | | 2,031,232 | | | | 24,616,651 | | | | 3,591,723 | | | | 48,556,144 | |
| | | | |
| | | | | | | 29,905,435 | | | | | | | | 70,953,980 | |
| | | | |
Reinvestment of distributions | | | | | | | | | | | | | | | | |
Class A | | | 0 | | | | 0 | | | | 529,924 | | | | 7,655,000 | |
Class C | | | 0 | | | | 0 | | | | 26,971 | | | | 383,791 | |
Class R6 | | | 0 | | | | 0 | | | | 47,617 | | | | 691,796 | |
Administrator Class | | | 0 | | | | 0 | | | | 34,562 | | | | 500,228 | |
Institutional Class | | | 0 | | | | 0 | | | | 792,083 | | | | 11,497,247 | |
| | | | |
| | | | | | | 0 | | | | | | | | 20,728,062 | |
| | | | |
Payment for shares redeemed | | | | | | | | | | | | | | | | |
Class A | | | (652,676 | ) | | | (8,206,957 | ) | | | (1,199,143 | ) | | | (15,487,514 | ) |
Class C | | | (80,021 | ) | | | (999,223 | ) | | | (192,765 | ) | | | (2,559,135 | ) |
Class R6 | | | (533,506 | ) | | | (6,698,867 | ) | | | (2,860,401 | ) | | | (39,194,686 | ) |
Administrator Class | | | (77,880 | ) | | | (975,211 | ) | | | (297,032 | ) | | | (3,913,331 | ) |
Institutional Class | | | (2,054,060 | ) | | | (25,814,527 | ) | | | (4,306,577 | ) | | | (53,511,682 | ) |
| | | | |
| | | | | | | (42,694,785 | ) | | | | | | | (114,666,348 | ) |
| | | | |
Net decrease in net assets resulting from capital share transactions | | | | | | | (12,789,350 | ) | | | | | | | (22,984,306 | ) |
| | | | |
Total increase (decrease) in net assets | | | | | | | 39,336,818 | | | | | | | | (55,402,407 | ) |
| | | | |
| | | | |
Net assets | | | | | | | | | | | | | | | | |
Beginning of period | | | | | | | 215,119,361 | | | | | | | | 270,521,768 | |
| | | | |
End of period | | | | | | $ | 254,456,179 | | | | | | | $ | 215,119,361 | |
| | | | |
The accompanying notes are an integral part of these financial statements.
12 | Wells Fargo C&B Large Cap Value Fund
Financial highlights
(For a share outstanding throughout each period)
| | | | | | | | | | | | | | | | | | | | | | | | |
| | | Six months ended
November 30, 2020
(unaudited) | | | Year ended May 31 | |
| CLASS A | | 2020 | | | 2019 | | | 2018 | | | 2017 | | | 2016 | |
Net asset value, beginning of period | | | $11.49 | | | | $13.01 | | | | $13.91 | | | | $14.54 | | | | $12.55 | | | | $13.07 | |
Net investment income | | | 0.05 | | | | 0.12 | | | | 0.11 | | | | 0.09 | 1 | | | 0.08 | | | | 0.11 | 1 |
Net realized and unrealized gains (losses) on investments | | | 2.76 | | | | (0.33 | ) | | | 0.02 | | | | 0.87 | | | | 2.23 | | | | (0.14 | ) |
| | | | | | | | | | | | | | | | | | | | | | | | |
Total from investment operations | | | 2.81 | | | | (0.21 | ) | | | 0.13 | | | | 0.96 | | | | 2.31 | | | | (0.03 | ) |
Distributions to shareholders from | | | | | | | | | | | | | | | | | | | | | | | | |
Net investment income | | | 0.00 | | | | (0.13 | ) | | | (0.12 | ) | | | (0.06 | ) | | | (0.08 | ) | | | (0.10 | ) |
Net realized gains | | | 0.00 | | | | (1.18 | ) | | | (0.91 | ) | | | (1.53 | ) | | | (0.24 | ) | | | (0.39 | ) |
| | | | | | | | | | | | | | | | | | | | | | | | |
Total distributions to shareholders | | | 0.00 | | | | (1.31 | ) | | | (1.03 | ) | | | (1.59 | ) | | | (0.32 | ) | | | (0.49 | ) |
Net asset value, end of period | | | $14.30 | | | | $11.49 | | | | $13.01 | | | | $13.91 | | | | $14.54 | | | | $12.55 | |
Total return2 | | | 24.46 | % | | | (3.61 | )% | | | 1.33 | % | | | 6.29 | % | | | 18.62 | % | | | (0.08 | )% |
Ratios to average net assets (annualized) | | | | | | | | | | | | | | | | | | | | | | | | |
Gross expenses3 | | | 1.29 | % | | | 1.27 | % | | | 1.23 | % | | | 1.21 | % | | | 1.24 | % | | | 1.25 | % |
Net expenses3 | | | 1.07 | % | | | 1.07 | % | | | 1.08 | % | | | 1.10 | % | | | 1.15 | % | | | 1.15 | % |
Net investment income3 | | | 0.80 | % | | | 0.92 | % | | | 0.83 | % | | | 0.58 | % | | | 0.62 | % | | | 0.89 | % |
Supplemental data | | | | | | | | | | | | | | | | | | | | | | | | |
Portfolio turnover rate4 | | | 13 | % | | | 33 | % | | | 47 | % | | | 42 | % | | | 89 | % | | | 29 | % |
Net assets, end of period (000s omitted) | | | $82,658 | | | | $70,680 | | | | $79,172 | | | | $85,707 | | | | $83,016 | | | | $88,387 | |
| 1 | Calculated based upon average shares outstanding |
| 2 | Total return calculations do not include any sales charges. Returns for periods of less than one year are not annualized. |
| 3 | Ratios include net expenses allocated from the affiliated Master Portfolio which were as follows: |
| | | | |
Six months ended November 30, 2020 (unaudited) | | | 0.64 | % |
Year ended May 31, 2020 | | | 0.64 | % |
Year ended May 31, 2019 | | | 0.65 | % |
Year ended May 31, 2018 | | | 0.66 | % |
Year ended May 31, 2017 | | | 0.68 | % |
Year ended May 31, 2016 | | | 0.68 | % |
| 4 | Portfolio turnover rate is calculated by multiplying the affiliated Master Portfolio’s percentage of the Fund’s total investments in securities at the end of the period by the affiliated Master Portfolio’s portfolio turnover rate. |
The accompanying notes are an integral part of these financial statements.
Wells Fargo C&B Large Cap Value Fund | 13
Financial highlights
(For a share outstanding throughout each period)
| | | | | | | | | | | | | | | | | | | | | | | | |
| | | Six months ended
November 30, 2020
(unaudited) | | | Year ended May 31 | |
| CLASS C | | 2020 | | | 2019 | | | 2018 | | | 2017 | | | 2016 | |
Net asset value, beginning of period | | | $11.36 | | | | $12.87 | | | | $13.75 | | | | $14.44 | | | | $12.48 | | | | $13.01 | |
Net investment income (loss) | | | 0.00 | 1,2 | | | 0.02 | 2 | | | 0.01 | 2 | | | (0.02 | )2 | | | (0.02 | ) | | | 0.01 | |
Net realized and unrealized gains (losses) on investments | | | 2.73 | | | | (0.35 | ) | | | 0.03 | | | | 0.86 | | | | 2.22 | | | | (0.14 | ) |
| | | | | | | | | | | | | | | | | | | | | | | | |
Total from investment operations | | | 2.73 | | | | (0.33 | ) | | | 0.04 | | | | 0.84 | | | | 2.20 | | | | (0.13 | ) |
Distributions to shareholders from | | | | | | | | | | | | | | | | | | | | | | | | |
Net investment income | | | 0.00 | | | | 0.00 | | | | (0.01 | ) | | | 0.00 | | | | 0.00 | | | | (0.01 | ) |
Net realized gains | | | 0.00 | | | | (1.18 | ) | | | (0.91 | ) | | | (1.53 | ) | | | (0.24 | ) | | | (0.39 | ) |
| | | | | | | | | | | | | | | | | | | | | | | | |
Total distributions to shareholders | | | 0.00 | | | | (1.18 | ) | | | (0.92 | ) | | | (1.53 | ) | | | (0.24 | ) | | | (0.40 | ) |
Net asset value, end of period | | | $14.09 | | | | $11.36 | | | | $12.87 | | | | $13.75 | | | | $14.44 | | | | $12.48 | |
Total return3 | | | 24.03 | % | | | (4.41 | )% | | | 0.61 | % | | | 5.46 | % | | | 17.73 | % | | | (0.82 | )% |
Ratios to average net assets (annualized) | | | | | | | | | | | | | | | | | | | | | | | | |
Gross expenses4 | | | 2.04 | % | | | 2.02 | % | | | 1.97 | % | | | 1.96 | % | | | 1.99 | % | | | 2.00 | % |
Net expenses4 | | | 1.83 | % | | | 1.83 | % | | | 1.83 | % | | | 1.85 | % | | | 1.90 | % | | | 1.90 | % |
Net investment income (loss)4 | | | 0.03 | % | | | 0.16 | % | | | 0.07 | % | | | (0.16 | )% | | | (0.13 | )% | | | 0.11 | % |
Supplemental data | | | | | | | | | | | | | | | | | | | | | | | | |
Portfolio turnover rate5 | | | 13 | % | | | 33 | % | | | 47 | % | | | 42 | % | | | 89 | % | | | 29 | % |
Net assets, end of period (000s omitted) | | | $3,632 | | | | $3,576 | | | | $5,098 | | | | $11,031 | | | | $8,043 | | | | $7,282 | |
| 1 | Amount is less than $0.005 |
| 2 | Calculated based upon average shares outstanding |
| 3 | Total return calculations do not include any sales charges. Returns for periods of less than one year are not annualized. |
| 4 | Ratios include net expenses allocated from the affiliated Master Portfolio which were as follows: |
| | | | |
Six months ended November 30, 2020 (unaudited) | | | 0.64 | % |
Year ended May 31, 2020 | | | 0.64 | % |
Year ended May 31, 2019 | | | 0.65 | % |
Year ended May 31, 2018 | | | 0.66 | % |
Year ended May 31, 2017 | | | 0.68 | % |
Year ended May 31, 2016 | | | 0.68 | % |
| 5 | Portfolio turnover rate is calculated by multiplying the affiliated Master Portfolio’s percentage of the Fund’s total investments in securities at the end of the period by the affiliated Master Portfolio’s portfolio turnover rate. |
The accompanying notes are an integral part of these financial statements.
14 | Wells Fargo C&B Large Cap Value Fund
Financial highlights
(For a share outstanding throughout each period)
| | | | | | | | | | | | | | | | | | | | |
| | | Six months ended
November 30, 2020
(unaudited) | | | Year ended May 31 | |
| CLASS R6 | | 2020 | | | 2019 | | | 2018 | | | 20171 | |
Net asset value, beginning of period | | | $11.53 | | | | $13.06 | | | | $13.97 | | | | $14.59 | | | | $12.73 | |
Net investment income | | | 0.08 | 2 | | | 0.18 | 2 | | | 0.18 | 2 | | | 0.18 | 2 | | | 0.16 | |
Net realized and unrealized gains (losses) on investments | | | 2.78 | | | | (0.33 | ) | | | 0.00 | 3 | | | 0.85 | | | | 2.06 | |
| | | | | | | | | | | | | | | | | | | | |
Total from investment operations | | | 2.86 | | | | (0.15 | ) | | | 0.18 | | | | 1.03 | | | | 2.22 | |
Distributions to shareholders from | | | | | | | | | | | | | | | | | | | | |
Net investment income | | | 0.00 | | | | (0.20 | ) | | | (0.18 | ) | | | (0.12 | ) | | | (0.12 | ) |
Net realized gains | | | 0.00 | | | | (1.18 | ) | | | (0.91 | ) | | | (1.53 | ) | | | (0.24 | ) |
| | | | | | | | | | | | | | | | | | | | |
Total distributions to shareholders | | | 0.00 | | | | (1.38 | ) | | | (1.09 | ) | | | (1.65 | ) | | | (0.36 | ) |
Net asset value, end of period | | | $14.39 | | | | $11.53 | | | | $13.06 | | | | $13.97 | | | | $14.59 | |
Total return4 | | | 24.80 | % | | | (3.25 | )% | | | 1.74 | % | | | 6.76 | % | | | 17.65 | % |
Ratios to average net assets (annualized) | | | | | | | | | | | | | | | | | | | | |
Gross expenses5 | | | 0.86 | % | | | 0.84 | % | | | 0.79 | % | | | 0.77 | % | | | 0.81 | % |
Net expenses5 | | | 0.65 | % | | | 0.65 | % | | | 0.65 | % | | | 0.65 | % | | | 0.70 | % |
Net investment income5 | | | 1.21 | % | | | 1.33 | % | | | 1.27 | % | | | 1.28 | % | | | 1.04 | % |
Supplemental data | | | | | | | | | | | | | | | | | | | | |
Portfolio turnover rate6 | | | 13 | % | | | 33 | % | | | 47 | % | | | 42 | % | | | 89 | % |
Net assets, end of period (000s omitted) | | | $41,041 | | | | $37,859 | | | | $68,366 | | | | $110,665 | | | | $3,532 | |
| 1 | For the period from October 31, 2016 (commencement of class operations) to March 31, 2017 |
| 2 | Calculated based upon average shares outstanding |
| 3 | Amount is less than $0.005. |
| 4 | Returns for periods of less than one year are not annualized. |
| 5 | Ratios include net expenses allocated from the affiliated Master Portfolio which were as follows: |
| | | | |
Six months ended November 30, 2020 (unaudited) | | | 0.64 | % |
Year ended May 31, 2020 | | | 0.64 | % |
Year ended May 31, 2019 | | | 0.65 | % |
Year ended May 31, 2018 | | | 0.65 | % |
Year ended May 31, 20171 | | | 0.68 | % |
| 6 | Portfolio turnover rate is calculated by multiplying the affiliated Master Portfolio’s percentage of the Fund’s total investment in securities at the end of the period by the affiliated Master Portfolio’s portfolio turnover rate. |
The accompanying notes are an integral part of these financial statements.
Wells Fargo C&B Large Cap Value Fund | 15
Financial highlights
(For a share outstanding throughout each period)
| | | | | | | | | | | | | | | | | | | | | | | | |
| | | Six months ended
November 30, 2020
(unaudited) | | | Year ended May 31 | |
| ADMINISTRATOR CLASS | | 2020 | | | 2019 | | | 2018 | | | 2017 | | | 2016 | |
Net asset value, beginning of period | | | $11.51 | | | | $13.03 | | | | $13.92 | | | | $14.56 | | | | $12.54 | | | | $13.07 | |
Net investment income | | | 0.05 | 1 | | | 0.13 | 1 | | | 0.12 | 1 | | | 0.10 | 1 | | | 0.10 | 1 | | | 0.13 | 1 |
Net realized and unrealized gains (losses) on investments | | | 2.77 | | | | (0.33 | ) | | | 0.02 | | | | 0.87 | | | | 2.24 | | | | (0.15 | ) |
| | | | | | | | | | | | | | | | | | | | | | | | |
Total from investment operations | | | 2.82 | | | | (0.20 | ) | | | 0.14 | | | | 0.97 | | | | 2.34 | | | | (0.02 | ) |
Distributions to shareholders from | | | | | | | | | | | | | | | | | | | | | | | | |
Net investment income | | | 0.00 | | | | (0.14 | ) | | | (0.12 | ) | | | (0.08 | ) | | | (0.08 | ) | | | (0.12 | ) |
Net realized gains | | | 0.00 | | | | (1.18 | ) | | | (0.91 | ) | | | (1.53 | ) | | | (0.24 | ) | | | (0.39 | ) |
| | | | | | | | | | | | | | | | | | | | | | | | |
Total distributions to shareholders | | | 0.00 | | | | (1.32 | ) | | | (1.03 | ) | | | (1.61 | ) | | | (0.32 | ) | | | (0.51 | ) |
Net asset value, end of period | | | $14.33 | | | | $11.51 | | | | $13.03 | | | | $13.92 | | | | $14.56 | | | | $12.54 | |
Total return2 | | | 24.50 | % | | | (3.56 | )% | | | 1.44 | % | | | 6.36 | % | | | 18.82 | % | | | 0.11 | % |
Ratios to average net assets (annualized) | | | | | | | | | | | | | | | | | | | | | | | | |
Gross expenses3 | | | 1.21 | % | | | 1.19 | % | | | 1.15 | % | | | 1.13 | % | | | 1.16 | % | | | 1.16 | % |
Net expenses3 | | | 0.99 | % | | | 0.99 | % | | | 1.00 | % | | | 1.00 | % | | | 1.00 | % | | | 0.98 | % |
Net investment income3 | | | 0.87 | % | | | 1.00 | % | | | 0.90 | % | | | 0.69 | % | | | 0.77 | % | | | 1.03 | % |
Supplemental data | | | | | | | | | | | | | | | | | | | | | | | | |
Portfolio turnover rate4 | | | 13 | % | | | 33 | % | | | 47 | % | | | 42 | % | | | 89 | % | | | 29 | % |
Net assets, end of period (000s omitted) | | | $6,702 | | | | $6,167 | | | | $9,274 | | | | $12,742 | | | | $11,467 | | | | $23,210 | |
| 1 | Calculated based upon average shares outstanding |
| 2 | Returns for periods of less than one year are not annualized. |
| 3 | Ratios include net expenses allocated from the affiliated Master Portfolio which were as follows: |
| | | | |
Six months ended November 30, 2020 (unaudited) | | | 0.64 | % |
Year ended May 31, 2020 | | | 0.64 | % |
Year ended May 31, 2019 | | | 0.65 | % |
Year ended May 31, 2018 | | | 0.66 | % |
Year ended May 31, 2017 | | | 0.68 | % |
Year ended May 31, 2016 | | | 0.68 | % |
| 4 | Portfolio turnover rate is calculated by multiplying the affiliated Master Portfolio’s percentage of the Fund’s total investments in securities at the end of the period by the affiliated Master Portfolio’s portfolio turnover rate. |
The accompanying notes are an integral part of these financial statements.
16 | Wells Fargo C&B Large Cap Value Fund
Financial highlights
(For a share outstanding throughout each period)
| | | | | | | | | | | | | | | | | | | | | | | | |
| | | Six months ended
November 30, 2020
(unaudited) | | | Year ended May 31 | |
| INSTITUTIONAL CLASS | | 2020 | | | 2019 | | | 2018 | | | 2017 | | | 2016 | |
Net asset value, beginning of period | | | $11.53 | | | | $13.05 | | | | $13.96 | | | | $14.58 | | | | $12.58 | | | | $13.11 | |
Net investment income | | | 0.07 | | | | 0.16 | | | | 0.14 | | | | 0.13 | 1 | | | 0.14 | | | | 0.16 | |
Net realized and unrealized gains (losses) on investments | | | 2.78 | | | | (0.33 | ) | | | 0.02 | | | | 0.89 | | | | 2.22 | | | | (0.14 | ) |
| | | | | | | | | | | | | | | | | | | | | | | | |
Total from investment operations | | | 2.85 | | | | (0.17 | ) | | | 0.16 | | | | 1.02 | | | | 2.36 | | | | 0.02 | |
Distributions to shareholders from | | | | | | | | | | | | | | | | | | | | | | | | |
Net investment income | | | 0.00 | | | | (0.17 | ) | | | (0.16 | ) | | | (0.11 | ) | | | (0.12 | ) | | | (0.16 | ) |
Net realized gains | | | 0.00 | | | | (1.18 | ) | | | (0.91 | ) | | | (1.53 | ) | | | (0.24 | ) | | | (0.39 | ) |
| | | | | | | | | | | | | | | | | | | | | | | | |
Total distributions to shareholders | | | 0.00 | | | | (1.35 | ) | | | (1.07 | ) | | | (1.64 | ) | | | (0.36 | ) | | | (0.55 | ) |
Net asset value, end of period | | | $14.38 | | | | $11.53 | | | | $13.05 | | | | $13.96 | | | | $14.58 | | | | $12.58 | |
Total return2 | | | 24.72 | % | | | (3.33 | )% | | | 1.64 | % | | | 6.68 | % | | | 19.05 | % | | | 0.33 | % |
Ratios to average net assets (annualized) | | | | | | | | | | | | | | | | | | | | | | | | |
Gross expenses3 | | | 0.96 | % | | | 0.94 | % | | | 0.90 | % | | | 0.88 | % | | | 0.91 | % | | | 0.92 | % |
Net expenses3 | | | 0.75 | % | | | 0.75 | % | | | 0.75 | % | | | 0.77 | % | | | 0.80 | % | | | 0.77 | % |
Net investment income3 | | | 1.20 | % | | | 1.25 | % | | | 1.17 | % | | | 0.87 | % | | | 0.96 | % | | | 1.25 | % |
Supplemental data | | | | | | | | | | | | | | | | | | | | | | | | |
Portfolio turnover rate4 | | | 13 | % | | | 33 | % | | | 47 | % | | | 42 | % | | | 89 | % | | | 29 | % |
Net assets, end of period (000s omitted) | | | $120,424 | | | | $96,838 | | | | $108,613 | | | | $135,082 | | | | $220,257 | | | | $133,632 | |
| 1 | Calculated based upon average shares outstanding |
| 2 | Returns for periods of less than one year are not annualized. |
| 3 | Ratios include net expenses allocated from the affiliated Master Portfolio which were as follows: |
| | | | |
Six months ended November 30, 2020 (unaudited) | | | 0.64 | % |
Year ended May 31, 2020 | | | 0.64 | % |
Year ended May 31, 2019 | | | 0.65 | % |
Year ended May 31, 2018 | | | 0.66 | % |
Year ended May 31, 2017 | | | 0.68 | % |
Year ended May 31, 2016 | | | 0.68 | % |
| 4 | Portfolio turnover rate is calculated by multiplying the affiliated Master Portfolio’s percentage of the Fund’s total investment in securities at the end of the period by the affiliated Master Portfolio’s portfolio turnover rate. |
The accompanying notes are an integral part of these financial statements.
Wells Fargo C&B Large Cap Value Fund | 17
Notes to financial statements (unaudited)
1. ORGANIZATION
Wells Fargo Funds Trust (the “Trust”), a Delaware statutory trust organized on March 10, 1999, is an open-end management investment company registered under the Investment Company Act of 1940, as amended (the “1940 Act”). As an investment company, the Trust follows the accounting and reporting guidance in Financial Accounting Standards Board (“FASB”) Accounting Standards Codification Topic 946, Financial Services – Investment Companies. These financial statements report on the Wells Fargo C&B Large Cap Value Fund (the “Fund”) which is a diversified series of the Trust.
The Fund is a feeder fund in a master-feeder structure that invests substantially all of its assets in a single master portfolio with a substantially identical investment objective and substantially similar investment strategies. The Fund invests in Wells Fargo C&B Large Cap Value Portfolio, a separate diversified portfolio (the “affiliated Master Portfolio”) of Wells Fargo Master Trust, a registered open-end management investment company. As of November 30, 2020, the Fund owned 76% of Wells Fargo C&B Large Cap Value Portfolio. The affiliated Master Portfolio directly acquires portfolio securities and the Fund acquires an indirect interest in those securities. The Fund accounts for its investment in the affiliated Master Portfolio as a partnership investment and records on a daily basis its share of the affiliated Master Portfolio’s income, expense and realized and unrealized gains and losses. The financial statements of the affiliated Master Portfolio for the six months ended November 30, 2020 are included in this report and should be read in conjunction with the Fund’s financial statements.
2. SIGNIFICANT ACCOUNTING POLICIES
The following significant accounting policies, which are consistently followed in the preparation of the financial statements of the Fund, are in conformity with U.S. generally accepted accounting principles which require management to make estimates and assumptions that affect the reported amounts of assets and liabilities, disclosure of contingent assets and liabilities at the date of the financial statements, and the reported amounts of revenues and expenses during the reporting period. Actual results could differ from those estimates.
Securities valuation
All investments are valued each business day as of the close of regular trading on the New York Stock Exchange (generally 4 p.m. Eastern Time), although the Fund may deviate from this calculation time under unusual or unexpected circumstances.
Investments in the affiliated Master Portfolio are valued daily based on the Fund’s proportionate share of the affiliated Master Portfolio’s net assets, which are also valued daily. Securities held in the affiliated Master Portfolio are valued as discussed in the Notes to Financial Statements of the affiliated Master Portfolio, which are included elsewhere in this report.
Investments which are not valued using the method discussed above are valued at their fair value, as determined in good faith by the Board of Trustees of the Fund. The Board of Trustees has established a Valuation Committee comprised of the Trustees and has delegated to it the authority to take any actions regarding the valuation of portfolio securities that the Valuation Committee deems necessary or appropriate, including determining the fair value of portfolio securities, unless the determination has been delegated to the Wells Fargo Asset Management Pricing Committee at Wells Fargo Funds Management, LLC (“Funds Management”). The Board of Trustees retains the authority to make or ratify any valuation decisions or approve any changes to the Valuation Procedures as it deems appropriate. On a quarterly basis, the Board of Trustees receives reports on any valuation actions taken by the Valuation Committee or the Wells Fargo Asset Management Pricing Committee which may include items for ratification.
Investment transactions, income and expenses
Investments in the affiliated Master Portfolio are recorded on a trade basis. The Fund records daily its proportionate share of the affiliated Master Portfolio’s income, expenses and realized and unrealized gains or losses. The Fund also accrues its own expenses.
Distributions to shareholders
Distributions to shareholders from net investment income and any net realized gains are recorded on the ex-dividend date and paid at least annually. Such distributions are determined in accordance with income tax regulations and may differ from U.S. generally accepted accounting principles. Dividend sources are estimated at the time of declaration. The tax character of distributions is determined as of the Fund’s fiscal year end. Therefore, a portion of the Fund’s distributions made prior to the Fund’s fiscal year end may be categorized as a tax return of capital at year end.
Federal and other taxes
The Fund intends to continue to qualify as a regulated investment company by distributing substantially all of its investment company taxable income and any net realized capital gains (after reduction for capital loss carryforwards) sufficient to relieve it from all, or substantially all, federal income taxes. Accordingly, no provision for federal income taxes was required.
18 | Wells Fargo C&B Large Cap Value Fund
Notes to financial statements (unaudited)
The Fund’s income and federal excise tax returns and all financial records supporting those returns for the prior three fiscal years are subject to examination by the federal and Delaware revenue authorities. Management has analyzed the Fund’s tax positions taken on federal, state, and foreign tax returns for all open tax years and does not believe that there are any uncertain tax positions that require recognition of a tax liability.
As of November 30, 2020, the aggregate cost of all investments for federal income tax purposes was $190,892,050 and the unrealized gains (losses) consisted of:
| | | | |
| |
Gross unrealized gains | | $ | 64,057,085 | |
| |
Gross unrealized losses | | | 0 | |
| |
Net unrealized gains | | $ | 64,057,085 | |
Class allocations
The separate classes of shares offered by the Fund differ principally in applicable sales charges, distribution, shareholder servicing, and administration fees. Class specific expenses are charged directly to that share class. Investment income, common fund-level expenses, and realized and unrealized gains (losses) on investments are allocated daily to each class of shares based on the relative proportion of net assets of each class.
3. FAIR VALUATION MEASUREMENTS
At November 30, 2020, the affiliated Master Portfolio was measured at fair value using the net asset value per share (or its equivalent) as a practical expedient. The investment objective and the value of the affiliate Master Portfolio was as follows:
| | | | | | |
| | |
| Affiliated Master Portfolio | | Investment objective | | Value of affiliated
Master Portfolio | |
| | |
Wells Fargo C&B Large Cap Value Portfolio | | Seeks maximum long-term total return (current income and capital appreciation), consistent with minimizing risk to principal | | | $254,949,135 | |
The affiliated Master Portfolio does not have a redemption period notice, can be redeemed daily and does not have any unfunded commitments.
4. TRANSACTIONS WITH AFFILIATES
Management fee
Funds Management an indirect wholly owned subsidiary of Wells Fargo & Company (“Wells Fargo”), is the manager of the Fund and provides advisory and fund-level administrative services under an investment management agreement. Under the investment management agreement, Funds Management is responsible for, among other services, implementing the investment objectives and strategies of the Fund and providing fund-level administrative services in connection with the Fund’s operations. As long as the Fund continues to invest substantially all of its assets in a single affiliated Master Portfolio, the Fund pays Funds Management an investment management fee only for fund-level administrative services at the following annual rate based on the Fund’s average daily net assets:
| | | | |
| |
| Average daily net assets | | Management fee | |
| |
First $5 billion | | | 0.05 | % |
| |
Next $5 billion | | | 0.04 | |
| |
Over $10 billion | | | 0.03 | |
For the six months ended November 30, 2020, the management fee was equivalent to an annual rate of 0.05% of the Fund’s average daily net assets.
Funds Management also serves as the adviser to the affiliated Master Portfolio and is entitled to receive a fee from the affiliated Master Portfolio for those services.
Wells Fargo C&B Large Cap Value Fund | 19
Notes to financial statements (unaudited)
Administration fees
Under a class-level administration agreement, Funds Management provides class-level administrative services to the Fund, which includes paying fees and expenses for services provided by the transfer agent, sub-transfer agents, omnibus account servicers and record-keepers. As compensation for its services under the class-level administration agreement, Funds Management receives an annual fee which is calculated based on the average daily net assets of each class as follows:
| | | | |
| |
| | | Class-level
administration fee | |
| |
Class A, Class C | | | 0.21 | % |
| |
Class R6 | | | 0.03 | |
| |
Administrator Class, Institutional Class | | | 0.13 | |
Waivers and/or expense reimbursements
Funds Management has contractually waived and/or reimbursed management and administration fees to the extent necessary to maintain certain net operating expense ratios for the Fund. When each class of the Fund has exceeded its expense cap, Funds Management has waived fees and/or reimbursed expenses from fund-level expenses on a proportionate basis and then from class specific expenses. When only certain classes exceed their expense caps, waivers and/or reimbursements are applied against class specific expenses before fund-level expenses. Net expenses from the affiliated Master Portfolio are included in the expense caps. Funds Management has committed through September 30, 2021 to waive fees and/or reimburse expenses to the extent necessary to cap the Fund’s expenses at 1.08% for Class A shares, 1.83% for Class C shares, 0.65% for Class R6 shares, 1.00% for Administrator Class shares, and 0.75% for Institutional Class shares. Prior to or after the commitment expiration date, the cap may be increased or the commitment to maintain the cap may be terminated only with the approval of the Board of Trustees.
Distribution fee
The Trust has adopted a distribution plan for Class C shares of the Fund pursuant to Rule 12b-1 under the 1940 Act. A distribution fee is charged to Class C shares and paid to Wells Fargo Funds Distributor, LLC (“Funds Distributor”), the principal underwriter, at an annual rate of 0.75% of the average daily net assets of Class C shares.
In addition, Funds Distributor is entitled to receive the front-end sales charge from the purchase of Class A shares and a contingent deferred sales charge on the redemption of certain Class A shares. Funds Distributor is also entitled to receive the contingent deferred sales charges from redemptions of Class C shares. For the six months ended November 30, 2020, Funds Distributor received $1,110 from the sale of Class C shares. No contingent deferred sales charges were incurred by Class A and Class C shares for the six months ended November 30, 2020.
Shareholder servicing fees
The Trust has entered into contracts with one or more shareholder servicing agents, whereby Class A, Class C, and Administrator Class of the Fund are charged a fee at an annual rate of 0.25% of the average daily net assets of each respective class. A portion of these total shareholder servicing fees were paid to affiliates of Wells Fargo.
5. INVESTMENT PORTFOLIO TRANSACTIONS
The Fund seeks to achieve its investment objective by investing substantially all of its assets in a single affiliated Master Portfolio. Purchases and sales have been calculated by multiplying the Fund’s ownership percentage of the affiliated Master Portfolio by the affiliated Master Portfolio’s purchases and sales. Purchases and sales of investments, excluding U.S. government obligations (if any) and short-term securities, for the six months ended November 30, 2020 were $29,536,821 and $51,408,062, respectively.
6. BANK BORROWINGS
The Trust (excluding the money market funds), Wells Fargo Master Trust and Wells Fargo Variable Trust are parties to a $350,000,000 revolving credit agreement whereby the Fund is permitted to use bank borrowings for temporary or emergency purposes, such as to fund shareholder redemption requests. Interest under the credit agreement is charged to the Fund based on a borrowing rate equal to the higher of the Federal Funds rate in effect on that day plus 1.25% or the overnight LIBOR rate in effect on that day plus 1.25%. In addition, an annual commitment fee equal to 0.25% of the unused balance is allocated to each participating fund.
For the six months ended November 30, 2020, there were no borrowings by the Fund under the agreement.
20 | Wells Fargo C&B Large Cap Value Fund
Notes to financial statements (unaudited)
7. CONCENTRATION RISK
Concentration risk results from exposure to a limited number of sectors. Through its investment in the affiliated Master Portfolio which may invest a substantial portion of its assets in any sector, the Fund may in turn be more affected by changes in that sector than a fund whose investments are not heavily weighted in any sector. As of the end of the period, the Fund invested a concentration of its portfolio in the financials sector.
8. INDEMNIFICATION
Under the Fund’s organizational documents, the officers and Trustees have been granted certain indemnification rights against certain liabilities that may arise out of performance of their duties to the Fund. The Fund has entered into a separate agreement with each Trustee that converts indemnification rights currently existing under the Fund’s organizational documents into contractual rights that cannot be changed in the future without the consent of the Trustee. Additionally, in the normal course of business, the Fund may enter into contracts with service providers that contain a variety of indemnification clauses. The Fund’s maximum exposure under these arrangements is dependent on future claims that may be made against the Fund and, therefore, cannot be estimated.
9. NEW ACCOUNTING PRONOUNCEMENT
In August 2018, FASB issued Accounting Standards Update (“ASU”) No. 2018-13, Fair Value Measurement (Topic 820) Disclosure Framework—Changes to the Disclosure Requirements for Fair Value Measurement. ASU 2018-13 updates the disclosure requirements on fair value measurements in Topic 820, Fair Value Measurements. The amendments are effective for fiscal years, and interim periods within those fiscal years, beginning after December 15, 2019. Management has adopted this guidance which did not have a material impact on the financial statements.
10. CORONAVIRUS (COVID-19) PANDEMIC
On March 11, 2020, the World Health Organization announced that it had made the assessment that coronavirus disease 2019 (“COVID-19”) is a pandemic. The impacts of COVID-19 are adversely affecting the entire global economy, individual companies and investment products, and the market in general. There is significant uncertainty around the extent and duration of business disruptions related to COVID-19 and the impacts may be short term or may last for an extended period of time. The risk of further spreading of COVID-19 has led to significant uncertainty and volatility in the financial markets.
Wells Fargo C&B Large Cap Value Fund | 21
Portfolio of investments—November 30, 2020 (unaudited)
| | | | | | | | | | | | | | | | |
| | | | | | | | | Shares | | | Value | |
| Common Stocks: 95.01% | |
|
Communication Services: 6.39% | |
|
| Diversified Telecommunication Services: 2.40% | |
Verizon Communications Incorporated | | | | | | | | | | | 132,400 | | | $ | 7,998,284 | |
| | | | | | | | | | | | | | | | |
|
| Entertainment: 2.09% | |
Activision Blizzard Incorporated | | | | | | | | | | | 87,900 | | | | 6,986,292 | |
| | | | | | | | | | | | | | | | |
|
| Media: 1.90% | |
Omnicom Group Incorporated | | | | | | | | | | | 100,900 | | | | 6,356,700 | |
| | | | | | | | | | | | | | | | |
|
Consumer Discretionary: 6.57% | |
|
| Household Durables: 2.13% | |
Whirlpool Corporation | | | | | | | | | | | 36,600 | | | | 7,122,726 | |
| | | | | | | | | | | | | | | | |
|
| Textiles, Apparel & Luxury Goods: 4.44% | |
Gildan Activewear Incorporated | | | | | | | | | | | 366,400 | | | | 9,574,032 | |
HanesBrands Incorporated | | | | | | | | | | | 369,600 | | | | 5,248,320 | |
| | | | |
| | | | | | | | | | | | | | | 14,822,352 | |
| | | | | | | | | | | | | | | | |
|
Consumer Staples: 1.46% | |
|
| Tobacco: 1.46% | |
Philip Morris International Incorporated | | | | | | | | | | | 64,400 | | | | 4,878,300 | |
| | | | | | | | | | | | | | | | |
|
Energy: 2.46% | |
|
| Energy Equipment & Services: 1.41% | |
Schlumberger Limited | | | | | | | | | | | 225,900 | | | | 4,696,461 | |
| | | | | | | | | | | | | | | | |
|
| Oil, Gas & Consumable Fuels: 1.05% | |
Exxon Mobil Corporation | | | | | | | | | | | 91,800 | | | | 3,500,334 | |
| | | | | | | | | | | | | | | | |
|
Financials: 34.28% | |
|
| Banks: 7.56% | |
JPMorgan Chase & Company | | | | | | | | | | | 71,300 | | | | 8,404,844 | |
PNC Financial Services Group Incorporated | | | | | | | | | | | 61,100 | | | | 8,436,077 | |
US Bancorp | | | | | | | | | | | 194,300 | | | | 8,395,703 | |
| | | | |
| | | | | | | | | | | | | | | 25,236,624 | |
| | | | | | | | | | | | | | | | |
|
| Capital Markets: 10.95% | |
Brookfield Asset Management Incorporated Class A | | | | | | | | | | | 259,300 | | | | 10,499,057 | |
Intercontinental Exchange Incorporated | | | | | | | | | | | 51,100 | | | | 5,391,561 | |
State Street Corporation | | | | | | | | | | | 144,700 | | | | 10,198,456 | |
The Charles Schwab Corporation | | | | | | | | | | | 214,500 | | | | 10,463,310 | |
| | | | |
| | | | | | | | | | | | | | | 36,552,384 | |
| | | | | | | | | | | | | | | | |
|
| Consumer Finance: 3.01% | |
Synchrony Financial | | | | | | | | | | | 329,300 | | | | 10,033,771 | |
| | | | | | | | | | | | | | | | |
|
| Diversified Financial Services: 2.25% | |
Berkshire Hathaway Incorporated Class B † | | | | | | | | | | | 32,800 | | | | 7,508,248 | |
| | | | | | | | | | | | | | | | |
|
| Insurance: 10.51% | |
Alleghany Corporation | | | | | | | | | | | 12,000 | | | | 6,902,400 | |
Arch Capital Group Limited † | | | | | | | | | | | 246,900 | | | | 7,948,946 | |
Chubb Limited | | | | | | | | | | | 69,600 | | | | 10,288,968 | |
The accompanying notes are an integral part of these financial statements.
22 | Wells Fargo C&B Large Cap Value Portfolio
Portfolio of investments—November 30, 2020 (unaudited)
| | | | | | | | | | | | | | | | |
| | | | | | | | | Shares | | | Value | |
|
| Insurance (continued) | |
Fidelity National Financial Incorporated | | | | | | | | | | | 71,400 | | | $ | 2,569,686 | |
The Allstate Corporation | | | | | | | | | | | 33,200 | | | | 3,398,020 | |
The Progressive Corporation | | | | | | | | | | | 45,500 | | | | 3,963,505 | |
| | | | |
| | | | | | | | | | | | | | | 35,071,525 | |
| | | | | | | | | | | | | | | | |
|
Health Care: 12.71% | |
|
| Health Care Equipment & Supplies: 3.89% | |
Becton Dickinson & Company | | | | | | | | | | | 23,700 | | | | 5,565,708 | |
Medtronic plc | | | | | | | | | | | 65,300 | | | | 7,424,610 | |
| | | | |
| | | | | | | | | | | | | | | 12,990,318 | |
| | | | | | | | | | | | | | | | |
|
| Health Care Providers & Services: 6.04% | |
HCA Healthcare Incorporated | | | | | | | | | | | 50,400 | | | | 7,565,544 | |
Laboratory Corporation of America Holdings † | | | | | | | | | | | 34,400 | | | | 6,874,496 | |
UnitedHealth Group Incorporated | | | | | | | | | | | 17,000 | | | | 5,717,780 | |
| | | | |
| | | | | | | | | | | | | | | 20,157,820 | |
| | | | | | | | | | | | | | | | |
|
| Pharmaceuticals: 2.78% | |
Johnson & Johnson | | | | | | | | | | | 64,100 | | | | 9,273,988 | |
| | | | | | | | | | | | | | | | |
|
Industrials: 16.42% | |
|
| Aerospace & Defense: 0.75% | |
Hexcel Corporation | | | | | | | | | | | 50,700 | | | | 2,510,664 | |
| | | | | | | | | | | | | | | | |
|
| Air Freight & Logistics: 1.51% | |
United Parcel Service Incorporated Class B | | | | | | | | | | | 29,400 | | | | 5,029,458 | |
| | | | | | | | | | | | | | | | |
|
| Building Products: 1.41% | |
Johnson Controls International plc | | | | | | | | | | | 102,300 | | | | 4,709,892 | |
| | | | | | | | | | | | | | | | |
|
| Electrical Equipment: 3.31% | |
AMETEK Incorporated | | | | | | | | | | | 44,600 | | | | 5,286,438 | |
Eaton Corporation plc | | | | | | | | | | | 47,400 | | | | 5,740,614 | |
| | | | |
| | | | | | | | | | | | | | | 11,027,052 | |
| | | | | | | | | | | | | | | | |
| | | | |
| Industrial Conglomerates: 1.94% | | | | | | | | | | | | |
3M Company | | | | | | | | | | | 37,500 | | | | 6,477,375 | |
| | | | | | | | | | | | | | | | |
|
| Machinery: 4.97% | |
Colfax Corporation † | | | | | | | | | | | 204,930 | | | | 7,393,874 | |
Snap-on Incorporated | | | | | | | | | | | 31,300 | | | | 5,504,105 | |
Woodward Governor Company | | | | | | | | | | | 33,100 | | | | 3,701,573 | |
| | | | |
| | | | | | | | | | | | | | | 16,599,552 | |
| | | | | | | | | | | | | | | | |
|
| Trading Companies & Distributors: 2.53% | |
AerCap Holdings NV † | | | | | | | | | | | 229,700 | | | | 8,443,772 | |
| | | | | | | | | | | | | | | | |
|
Information Technology: 10.14% | |
|
| Electronic Equipment, Instruments & Components: 5.21% | |
Arrow Electronics Incorporated † | | | | | | | | | | | 128,300 | | | | 11,758,695 | |
TE Connectivity Limited | | | | | | | | | | | 49,500 | | | | 5,641,515 | |
| | | | |
| | | | | | | | | | | | | | | 17,400,210 | |
| | | | | | | | | | | | | | | | |
The accompanying notes are an integral part of these financial statements.
Wells Fargo C&B Large Cap Value Portfolio | 23
Portfolio of investments—November 30, 2020 (unaudited)
| | | | | | | | | | | | | | | | |
| | | | | | | | | Shares | | | Value | |
| IT Services: 4.93% | |
Amdocs Limited | | | | | | | | | | | 118,900 | | | $ | 7,824,809 | |
Leidos Holdings Incorporated | | | | | | | | 85,500 | | | | 8,609,850 | |
| | | | |
| | | | | | | | | | | | | | | 16,434,659 | |
| | | | | | | | | | | | | | | | |
|
Materials: 2.93% | |
|
| Chemicals: 1.48% | |
Axalta Coating Systems Limited † | | | | | | | | 172,100 | | | | 4,923,781 | |
| | | | | | | | | | | | | | | | |
|
| Metals & Mining: 1.45% | |
Reliance Steel & Aluminum Company | | | | | | | | 41,100 | | | | 4,841,580 | |
| | | | | | | | | | | | | | | | |
|
Real Estate: 1.65% | |
|
| Real Estate Management & Development: 1.65% | |
CBRE Group Incorporated Class A † | | | | | | | | 90,000 | | | | 5,502,600 | |
| | | | | | | | | | | | | | | | |
| |
Total Common Stocks (Cost $228,416,580) | | | | 317,086,722 | |
| | | | | | | | | | | | | | | | |
| | | | |
| | | | | | | | | | | | | | | | |
| | | Yield | | | | | | | | | | |
| Short-Term Investments: 5.04% | |
|
| Investment Companies: 5.04% | |
Wells Fargo Government Money Market Fund Select Class (l)(u) | | | 0.02 | % | | | | | | | 16,813,758 | | | | 16,813,758 | |
| | | | | | | | | | | | | | | | |
| |
Total Short-Term Investments (Cost $16,813,758) | | | | 16,813,758 | |
| | | | | | | | | | | | | | | | |
| | | | | | | | |
| Total investments in securities (Cost $245,230,338) | | | 100.05 | % | | | 333,900,480 | |
| | |
Other assets and liabilities, net | | | (0.05 | ) | | | (169,325 | ) |
| | | | | | | | |
| Total net assets | | | 100.00 | % | | $ | 333,731,155 | |
| | | | | | | | |
| † | Non-income-earning security |
| (l) | The issuer of the security is an affiliated person of the Portfolio as defined in the Investment Company Act of 1940. |
| (u) | The rate represents the 7-day annualized yield at period end. |
Investments in Affiliates
An affiliated investment is an investment in which the Portfolio owns at least 5% of the outstanding voting shares of the issuer or as a result of other relationships, such as the Portfolio and the issuer having the same adviser or investment manager. Transactions with issuers that were either affiliated persons of the Portfolio at the beginning of the period or the end of the period were as follows:
| | | | | | | | | | | | | | | | | | | | | | | | | | | | | | | | | | | | |
| | | Value,
beginning of
period | | | Purchases | | | Sales
proceeds | | | Net
realized
gains
(losses) | | | Net
change in
unrealized
gains
(losses) | | | Value,
end of
period | | | % of
net
assets | | | Shares,
end of
period | | | Income
from
affiliated
securities | |
| | | | | | | | | |
| Short-Term Investments | | | | | | | | | | | | | | | | | | | | | | | | | | | |
Investment Companies | | | | | | | | | | | | | | | | | | | | | | | | | | | | | | | | | | | | |
Wells Fargo Government Money Market Fund Select Class | | $ | 6,370,055 | | | $ | 53,586,849 | | | $ | (43,143,146 | ) | | $ | 0 | | | $ | 0 | | | $ | 16,813,758 | | | | 5.04 | % | | | 16,813,758 | | | $ | 4,039 | |
The accompanying notes are an integral part of these financial statements.
24 | Wells Fargo C&B Large Cap Value Portfolio
Statement of assets and liabilities—November 30, 2020 (unaudited)
| | | | |
| | | | |
| |
Assets | | | | |
Investments in unaffiliated securities, at value (cost $228,416,580) | | $ | 317,086,722 | |
Investments in affiliated securities, at value (cost $16,813,758) | | | 16,813,758 | |
Receivable for dividends | | | 465,320 | |
Prepaid expenses and other assets | | | 35,663 | |
| | | | |
Total assets | | | 334,402,463 | |
| | | | |
| |
Liabilities | | | | |
Payable for investments purchased | | | 508,557 | |
Advisory fee payable | | | 161,751 | |
| | | | |
Total liabilities | | | 670,308 | |
| | | | |
Total net assets | | $ | 333,731,155 | |
| | | | |
The accompanying notes are an integral part of these financial statements.
Wells Fargo C&B Large Cap Value Portfolio | 25
Statement of operations—six months ended November 30, 2020 (unaudited)
| | | | |
| | | | |
| |
Investment income | | | | |
Dividends (net of foreign withholding taxes of $74,501) | | $ | 2,877,573 | |
Income from affiliated securities | | | 4,039 | |
| | | | |
Total investment income | | | 2,881,612 | |
| | | | |
| |
Expenses | | | | |
Advisory fee | | | 1,003,142 | |
Custody and accounting fees | | | 10,285 | |
Professional fees | | | 21,887 | |
Shareholder report expenses | | | 3,411 | |
Trustees’ fees and expenses | | | 9,589 | |
Other fees and expenses | | | 6,939 | |
| | | | |
Total expenses | | | 1,055,253 | |
Less: Fee waivers and/or expense reimbursements | | | (67,544 | ) |
| | | | |
Net expenses | | | 987,709 | |
| �� | | | |
Net investment income | | | 1,893,903 | |
| | | | |
| |
Realized and unrealized gains (losses) on investments | | | | |
Net realized gains on investments | | | 9,977,236 | |
Net change in unrealized gains (losses) on investments | | | 57,523,789 | |
| | | | |
Net realized and unrealized gains (losses) on investments | | | 67,501,025 | |
| | | | |
Net increase in net assets resulting from operations | | $ | 69,394,928 | |
| | | | |
The accompanying notes are an integral part of these financial statements.
26 | Wells Fargo C&B Large Cap Value Portfolio
Statement of changes in net assets
| | | | | | | | |
| | | Six months ended
November 30, 2020
(unaudited) | | | Year ended
May 31, 2020 | |
| | |
Operations | | | | | | | | |
Net investment income | | $ | 1,893,903 | | | $ | 4,668,688 | |
Net realized gains on investments | | | 9,977,236 | | | | 14,608,307 | |
Net change in unrealized gains (losses) on investments | | | 57,523,789 | | | | (25,082,549 | ) |
| | | | |
Net increase (decrease) in net assets resulting from operations | | | 69,394,928 | | | | (5,805,554 | ) |
| | | | |
| | |
Capital transactions | | | | | | | | |
Transactions in investors’ beneficial interests | | | | | | | | |
Contributions | | | 20,316,432 | | | | 41,745,884 | |
Withdrawals | | | (42,892,559 | ) | | | (99,923,052 | ) |
| | | | |
Net decrease in net assets resulting from capital transactions | | | (22,576,127 | ) | | | (58,177,168 | ) |
| | | | |
Total increase (decrease) in net assets | | | 46,818,801 | | | | (63,982,722 | ) |
| | | | |
| | |
Net assets | | | | | | | | |
Beginning of period | | | 286,912,354 | | | | 350,895,076 | |
| | | | |
End of period | | $ | 333,731,155 | | | $ | 286,912,354 | |
| | | | |
The accompanying notes are an integral part of these financial statements.
Wells Fargo C&B Large Cap Value Portfolio | 27
Financial highlights
| | | | | | | | | | | | | | | | | | | | | | | | |
| | | Six months ended
November 30, 2020
(unaudited) | | | Year ended May 31 | |
| | | 2020 | | | 2019 | | | 2018 | | | 2017 | | | 2016 | |
Total return1 | | | 24.92 | % | | | (3.40 | )% | | | 1.80 | % | | | 6.65 | % | | | 19.17 | % | | | 0.35 | % |
Ratios to average net assets (annualized) | | | | | | | | | | | | | | | | | | | | | | | | |
Gross expenses | | | 0.68 | % | | | 0.68 | % | | | 0.67 | % | | | 0.67 | % | | | 0.68 | % | | | 0.68 | % |
Net expenses | | | 0.34 | % | | | 0.64 | % | | | 0.65 | % | | | 0.66 | % | | | 0.68 | % | | | 0.68 | % |
Net investment income | | | 1.23 | % | | | 1.36 | % | | | 1.27 | % | | | 1.02 | % | | | 1.09 | % | | | 1.33 | % |
Supplemental data | | | | | | | | | | | | | | | | | | | | | | | | |
Portfolio turnover rate | | | 13 | % | | | 33 | % | | | 47 | % | | | 42 | % | | | 89 | % | | | 29 | % |
| 1 | Returns for periods of less than one year are not annualized |
The accompanying notes are an integral part of these financial statements.
28 | Wells Fargo C&B Large Cap Value Portfolio
Notes to financial statements (unaudited)
1. ORGANIZATION
Wells Fargo Master Trust (the “Trust”), a Delaware statutory trust organized on March 10, 1999, is an open-end management investment company registered under the Investment Company Act of 1940, as amended (the “1940 Act”). As an investment company, the Trust follows the accounting and reporting guidance in Financial Accounting Standards Board (“FASB”) Accounting Standards Codification Topic 946, Financial Services – Investment Companies. These financial statements report on the Wells Fargo C&B Large Cap Value Portfolio (the “Portfolio”) which is a diversified series of the Trust.
2. SIGNIFICANT ACCOUNTING POLICIES
The following significant accounting policies, which are consistently followed in the preparation of the financial statements of the Portfolio, are in conformity with U.S. generally accepted accounting principles which require management to make estimates and assumptions that affect the reported amounts of assets and liabilities, disclosure of contingent assets and liabilities at the date of the financial statements, and the reported amounts of revenues and expenses during the reporting period. Actual results could differ from those estimates.
Securities valuation
All investments are valued each business day as of the close of regular trading on the New York Stock Exchange (generally 4 p.m. Eastern Time), although the Portfolio may deviate from this calculation time under unusual or unexpected circumstances.
Equity securities that are listed on a foreign or domestic exchange or market are valued at the official closing price or, if none, the last sales price. If no sale occurs on the principal exchange or market that day, a fair value price will be determined in accordance with the Portfolio’s Valuation Procedures.
Investments in registered open-end investment companies are valued at net asset value. Interests in non-registered investment companies that are redeemable at net asset value are fair valued normally at net asset value.
Investments which are not valued using any of the methods discussed above are valued at their fair value, as determined in good faith by the Board of Trustees of the Portfolio. The Board of Trustees has established a Valuation Committee comprised of the Trustees and has delegated to it the authority to take any actions regarding the valuation of portfolio securities that the Valuation Committee deems necessary or appropriate, including determining the fair value of portfolio securities, unless the determination has been delegated to the Wells Fargo Asset Management Pricing Committee at Wells Fargo Funds Management, LLC (“Funds Management”). The Board of Trustees retains the authority to make or ratify any valuation decisions or approve any changes to the Valuation Procedures as it deems appropriate. On a quarterly basis, the Board of Trustees receives reports on any valuation actions taken by the Valuation Committee or the Wells Fargo Asset Management Pricing Committee which may include items for ratification.
Securities lending
The Portfolio may lend its securities from time to time in order to earn additional income in the form of fees or interest on securities received as collateral or the investment of any cash received as collateral. When securities are on loan, the Portfolio receives interest or dividends on those securities. Cash collateral received in connection with its securities lending transactions is invested in Securities Lending Cash Investments, LLC (the “Securities Lending Fund”). Investments in Securities Lending Fund are valued at the evaluated bid price provided by an independent pricing service. Income earned from investment in the Securities Lending Fund (net of fees and rebates), if any, is included in income from affiliated securities on the Statement of Operations.
In a securities lending transaction, the net asset value of the Portfolio is affected by an increase or decrease in the value of the securities loaned and by an increase or decrease in the value of the instrument in which collateral is invested. The amount of securities lending activity undertaken by the Portfolio fluctuates from time to time. The Portfolio has the right under the lending agreement to recover the securities from the borrower on demand. In the event of default or bankruptcy by the borrower, the Portfolio may be prevented from recovering the loaned securities or gaining access to the collateral or may experience delays or costs in doing so. In such an event, the terms of the agreement allow the unaffiliated securities lending agent to use the collateral to purchase replacement securities on behalf of the Portfolio or pay the Portfolio the market value of the loaned securities. The Portfolio bears the risk of loss with respect to depreciation of its investment of the cash collateral.
Security transactions and income recognition
Securities transactions are recorded on a trade date basis. Realized gains or losses are recorded on the basis of identified cost.
Dividend income is recognized on the ex-dividend date. Dividend income is recorded net of foreign taxes withheld where recovery of such taxes is not assured.
Wells Fargo C&B Large Cap Value Portfolio | 29
Notes to financial statements (unaudited)
Federal and other taxes
The Portfolio is treated as a separate entity for federal income tax purposes. The Portfolio is not required to pay federal income taxes on its net investment income and net capital gains as it is treated as a partnership for federal income tax purposes. All dividends, gains and losses of the Portfolio are deemed to have been “passed through” to the interest holders in proportion to their holdings of the Portfolio regardless of whether dividends and gains have been distributed by the Portfolio.
The Portfolio’s income tax returns and all financial records supporting those returns for the prior three fiscal years are subject to examination by the federal revenue authority. Management has analyzed the Portfolio’s tax positions taken on federal, state, and foreign tax returns for all open tax years and does not believe that there are any uncertain tax positions that require recognition of a tax liability.
As of November 30, 2020, the aggregate cost of all investments for federal income tax purposes was $249,814,430 and the unrealized gains (losses) consisted of:
| | | | |
| |
Gross unrealized gains | | $ | 97,507,798 | |
| |
Gross unrealized losses | | | (13,421,748 | ) |
| |
Net unrealized gains | | $ | 84,086,050 | |
3. FAIR VALUATION MEASUREMENTS
Fair value measurements of investments are determined within a framework that has established a fair value hierarchy based upon the various data inputs utilized in determining the value of the Portfolio’s investments. The three-level hierarchy gives the highest priority to unadjusted quoted prices in active markets for identical assets or liabilities (Level 1) and the lowest priority to unobservable inputs (Level 3). The Portfolio’s investments are classified within the fair value hierarchy based on the lowest level of input that is significant to the fair value measurement. The inputs are summarized into three broad levels as follows:
| ∎ | | Level 1 – quoted prices in active markets for identical securities |
| ∎ | | Level 2 – other significant observable inputs (including quoted prices for similar securities, interest rates, prepayment speeds, credit risk, etc.) |
| ∎ | | Level 3 – significant unobservable inputs (including the Portfolio’s own assumptions in determining the fair value of investments) |
The inputs or methodologies used for valuing investments in securities are not necessarily an indication of the risk associated with investing in those securities.
The following is a summary of the inputs used in valuing the Portfolio’s assets and liabilities as of November 30, 2020:
| | | | | | | | | | | | | | | | |
| | | | |
| | | Quoted prices
(Level 1) | | | Other significant
observable inputs
(Level 2) | | | Significant
unobservable inputs (Level 3) | | | Total | |
Assets | | | | | | | | | | | | | | | | |
Investments in: | | | | | | | | | | | | | | | | |
| | | | |
Common stocks | | | | | | | | | | | | | | | | |
| | | | |
Communication services | | $ | 21,341,276 | | | $ | 0 | | | $ | 0 | | | $ | 21,341,276 | |
| | | | |
Consumer discretionary | | | 21,945,078 | | | | 0 | | | | 0 | | | | 21,945,078 | |
| | | | |
Consumer staples | | | 4,878,300 | | | | 0 | | | | 0 | | | | 4,878,300 | |
| | | | |
Energy | | | 8,196,795 | | | | 0 | | | | 0 | | | | 8,196,795 | |
| | | | |
Financials | | | 114,402,552 | | | | 0 | | | | 0 | | | | 114,402,552 | |
| | | | |
Health care | | | 42,422,126 | | | | 0 | | | | 0 | | | | 42,422,126 | |
| | | | |
Industrials | | | 54,797,765 | | | | 0 | | | | 0 | | | | 54,797,765 | |
| | | | |
Information technology | | | 33,834,869 | | | | 0 | | | | 0 | | | | 33,834,869 | |
| | | | |
Materials | | | 9,765,361 | | | | 0 | | | | 0 | | | | 9,765,361 | |
| | | | |
Real estate | | | 5,502,600 | | | | 0 | | | | 0 | | | | 5,502,600 | |
| | | | |
Short-term investments | | | | | | | | | | | | | | | | |
| | | | |
Investment companies | | | 16,813,758 | | | | 0 | | | | 0 | | | | 16,813,758 | |
| | | | |
Total assets | | $ | 333,900,480 | | | $ | 0 | | | $ | 0 | | | $ | 333,900,480 | |
30 | Wells Fargo C&B Large Cap Value Portfolio
Notes to financial statements (unaudited)
Additional sector, industry or geographic detail is included in the Portfolio of Investments.
For the six months ended November 30, 2020, the Portfolio did not have any transfers into/out of Level 3.
4. TRANSACTIONS WITH AFFILIATES AND OTHER EXPENSES
Advisory fee
The Trust has entered into an advisory contract with Funds Management, an indirect wholly owned subsidiary of Wells Fargo & Company (“Wells Fargo”). The adviser is responsible for implementing investment policies and guidelines and for supervising the subadviser, who is responsible for day-to-day portfolio management of the Portfolio. Pursuant to the contract, Funds Management is entitled to receive an annual advisory fee at the following annual rate based on the Portfolio’s average daily net assets:
| | | | |
| |
| Average daily net assets | | Advisory fee | |
| |
First $500 million | | | 0.650 | % |
| |
Next $500 million | | | 0.625 | |
| |
Next $1 billion | | | 0.600 | |
| |
Next $2 billion | | | 0.575 | |
| |
Next $4 billion | | | 0.550 | |
| |
Next $4 billion | | | 0.525 | |
| |
Next $4 billion | | | 0.500 | |
| |
Over $16 billion | | | 0.475 | |
For the six months ended November 30, 2020, the advisory fee was equivalent to an annual rate of 0.65% of the Portfolio’s average daily net assets.
Funds Management has retained the services of a subadviser to provide daily portfolio management to the Portfolio. The fee for subadvisory services is borne by Funds Management. Cooke & Bieler, L.P., which is not an affiliate of Funds Management, is also a subadviser to the Portfolio and is entitled to receive a fee from Funds Management at an annual rate starting at 0.38% and declining to 0.30% as the average daily net assets of the Portfolio increase.
Funds Management has voluntarily waived and/or reimbursed advisory fees to reduce the net operating expense ratio of the Portfolio.
5. INVESTMENT PORTFOLIO TRANSACTIONS
Purchases and sales of investments, excluding U.S. government obligations (if any) and short-term securities, for the six months ended November 30, 2020 were $38,664,016 and $67,293,705, respectively.
6. SECURITIES LENDING TRANSACTIONS
The Portfolio lends its securities through an unaffiliated securities lending agent and receives collateral in the form of cash or securities with a value at least equal to the value of the securities on loan. The value of the loaned securities is determined at the close of each business day and any increases or decreases in the required collateral are exchanged between the Portfolio and the counterparty on the next business day. Cash collateral received is invested in the Securities Lending Fund which seeks to provide a positive return compared to the daily Fed Funds Open Rate by investing in high-quality, U.S. dollar-denominated short-term money market instruments and is exempt from registration under Section 3(c)(7) of the 1940 Act. Securities Lending Fund is managed by Funds Management and is subadvised by Wells Capital Management Incorporated (“WellsCap”), an affiliate of Funds Management and an indirect wholly owned subsidiary of Wells Fargo. Funds Management receives an advisory fee starting at 0.05% and declining to 0.01% as the average daily net assets of the Securities Lending Fund increase. All of the fees received by Funds Management are paid to WellsCap for its services as subadviser.
In the event of counterparty default or the failure of a borrower to return a loaned security, the Portfolio has the right to use the collateral to offset any losses incurred. As of November 30, 2020, the Portfolio did not have any securities on loan.
7. BANK BORROWINGS
The Trust, along with Wells Fargo Variable Trust and Wells Fargo Funds Trust (excluding the money market funds), are parties to a $350,000,000 revolving credit agreement whereby the Portfolio is permitted to use bank borrowings for temporary or
Wells Fargo C&B Large Cap Value Portfolio | 31
Notes to financial statements (unaudited)
emergency purposes, such as to fund shareholder redemption requests. Interest under the credit agreement is charged to the Portfolio based on a borrowing rate equal to the higher of the Federal Funds rate in effect on that day plus 1.25% or the overnight LIBOR rate in effect on that day plus 1.25%. In addition, an annual commitment fee equal to 0.25% of the unused balance is allocated to each participating fund.
For the six months ended November 30, 2020, there were no borrowings by the Portfolio under the agreement.
8. CONCENTRATION RISK
Concentration risk results from exposure to a limited number of sectors. As of the end of the period, the Portfolio concentrated its portfolio in investments related to the financials sector. A fund that invests a substantial portion of its assets in any sector may be more affected by changes in that sector than would be a fund whose investments are not heavily weighted in any sector.
9. INDEMNIFICATION
Under the Fund’s organizational documents, the officers and Trustees have been granted certain indemnification rights against certain liabilities that may arise out of performance of their duties to the Portfolio. The Portfolio has entered into a separate agreement with each Trustee that converts indemnification rights currently existing under the Portfolio’s organizational documents into contractual rights that cannot be changed in the future without the consent of the Trustee. Additionally, in the normal course of business, the Portfolio may enter into contracts with service providers that contain a variety of indemnification clauses. The Portfolio’s maximum exposure under these arrangements is dependent on future claims that may be made against the Portfolio and, therefore, cannot be estimated.
10. NEW ACCOUNTING PRONOUNCEMENT
In August 2018, FASB issued Accounting Standards Update (“ASU”) No. 2018-13, Fair Value Measurement (Topic 820) Disclosure Framework—Changes to the Disclosure Requirements for Fair Value Measurement. ASU 2018-13 updates the disclosure requirements on fair value measurements in Topic 820, Fair Value Measurements. The amendments are effective for fiscal years, and interim periods within those fiscal years, beginning after December 15, 2019. Management has adopted this guidance which did not have a material impact on the financial statements.
11. CORONAVIRUS (COVID-19) PANDEMIC
On March 11, 2020, the World Health Organization announced that it had made the assessment that coronavirus disease 2019 (“COVID-19”) is a pandemic. The impacts of COVID-19 are adversely affecting the entire global economy, individual companies and investment products, and the market in general. There is significant uncertainty around the extent and duration of business disruptions related to COVID-19 and the impacts may be short term or may last for an extended period of time. The risk of further spreading of COVID-19 has led to significant uncertainty and volatility in the financial markets.
32 | Wells Fargo C&B Large Cap Value Portfolio
Other information (unaudited)
PROXY VOTING INFORMATION
A description of the policies and procedures used to determine how to vote proxies relating to portfolio securities is available, upon request, by calling 1-800-222-8222, visiting our website at wfam.com, or visiting the SEC website at sec.gov. Information regarding how the proxies related to portfolio securities were voted during the most recent 12-month period ended June 30 is available on the website at wfam.com or by visiting the SEC website at sec.gov.
QUARTERLY PORTFOLIO HOLDINGS INFORMATION
The Fund and Portfolio file their complete schedule of portfolio holdings with the SEC for the first and third quarters of each fiscal year as an exhibit to its reports on Form N-PORT. Shareholders may view the filed Form N-PORT by visiting the SEC website at sec.gov.
Wells Fargo C&B Large Cap Value Fund | 33
Other information (unaudited)
BOARD OF TRUSTEES AND OFFICERS
Each of the Trustees and Officers1 listed in the table below acts in identical capacities for each fund in the Wells Fargo family of funds, which consists of 144 mutual funds comprising the Wells Fargo Funds Trust, Wells Fargo Variable Trust, Wells Fargo Master Trust and four closed-end funds (collectively the “Fund Complex”). This table should be read in conjunction with the Prospectus and the Statement of Additional Information2. The mailing address of each Trustee and Officer is 525 Market Street, 12th Floor, San Francisco, CA 94105. Each Trustee and Officer serves an indefinite term, however, each Trustee serves such term until reaching the mandatory retirement age established by the Trustees.
Independent Trustees
| | | | | | |
Name and
year of birth | | Position held and
length of service* | | Principal occupations during past five years or longer | | Current other
public company or
investment
company
directorships |
| | | |
William R. Ebsworth
(Born 1957) | | Trustee, since 2015 | | Retired. From 1984 to 2013, equities analyst, portfolio manager, research director and chief investment officer at Fidelity Management and Research Company in Boston, Tokyo, and Hong Kong, and retired in 2013 as Chief Investment Officer of Fidelity Strategic Advisers, Inc. where he led a team of investment professionals managing client assets. Prior thereto, Board member of Hong Kong Securities Clearing Co., Hong Kong Options Clearing Corp., the Thailand International Fund, Ltd., Fidelity Investments Life Insurance Company, and Empire Fidelity Investments Life Insurance Company. Audit Committee Chair and Investment Committee Chair of the Vincent Memorial Hospital Endowment (non-profit organization). Mr. Ebsworth is a CFA® charterholder. | | N/A |
| | | |
Jane A. Freeman
(Born 1953) | | Trustee, since 2015; Chair Liaison, since 2018 | | Retired. From 2012 to 2014 and 1999 to 2008, Chief Financial Officer of Scientific Learning Corporation. From 2008 to 2012, Ms. Freeman provided consulting services related to strategic business projects. Prior to 1999, Portfolio Manager at Rockefeller & Co. and Scudder, Stevens & Clark. Board member of the Harding Loevner Funds from 1996 to 2014, serving as both Lead Independent Director and chair of the Audit Committee. Board member of the Russell Exchange Traded Funds Trust from 2011 to 2012 and the chair of the Audit Committee. Ms. Freeman is also an inactive Chartered Financial Analyst. | | N/A |
| | | |
Isaiah Harris, Jr.
(Born 1952) | | Trustee, since 2009; Audit Committee Chair, since 2019 | | Retired. Chairman of the Board of CIGNA Corporation since 2009, and Director since 2005. From 2003 to 2011, Director of Deluxe Corporation. Prior thereto, President and CEO of BellSouth Advertising and Publishing Corp. from 2005 to 2007, President and CEO of BellSouth Enterprises from 2004 to 2005 and President of BellSouth Consumer Services from 2000 to 2003. Emeritus member of the Iowa State University Foundation Board of Governors. Emeritus Member of the Advisory Board of Iowa State University School of Business. Advisory Board Member, Palm Harbor Academy (private school). Mr. Harris is a certified public accountant (inactive status). | | CIGNA Corporation |
| | | |
Judith M. Johnson
(Born 1949) | | Trustee, since 2008 | | Retired. Prior thereto, Chief Executive Officer and Chief Investment Officer of Minneapolis Employees Retirement Fund from 1996 to 2008. Ms. Johnson is an attorney, certified public accountant and a certified managerial accountant. | | N/A |
| | | |
David F. Larcker
(Born 1950) | | Trustee, since 2009 | | James Irvin Miller Professor of Accounting at the Graduate School of Business (Emeritus), Stanford University, Director of the Corporate Governance Research Initiative and Senior Faculty of The Rock Center for Corporate Governance since 2006. From 2005 to 2008, Professor of Accounting at the Graduate School of Business, Stanford University. Prior thereto, Ernst & Young Professor of Accounting at The Wharton School, University of Pennsylvania from 1985 to 2005. | | N/A |
34 | Wells Fargo C&B Large Cap Value Fund
Other information (unaudited)
| | | | | | |
Name and
year of birth | | Position held and
length of service* | | Principal occupations during past five years or longer | | Current other
public company or
investment
company
directorships |
| | | |
Olivia S. Mitchell
(Born 1953) | | Trustee, since 2006; Nominating and Governance Committee Chair, since 2018 | | International Foundation of Employee Benefit Plans Professor, Wharton School of the University of Pennsylvania since 1993. Director of Wharton’s Pension Research Council and Boettner Center on Pensions & Retirement Research, and Research Associate at the National Bureau of Economic Research. Previously, Cornell University Professor from 1978 to 1993. | | N/A |
| | | |
Timothy J. Penny
(Born 1951) | | Trustee, since 1996; Chair, since 2018 | | President and Chief Executive Officer of Southern Minnesota Initiative Foundation, a non-profit organization, since 2007. Member of the Board of Trustees of NorthStar Education Finance, Inc., a non-profit organization, since 2007. | | N/A |
| | | |
James G. Polisson
(Born 1959) | | Trustee, since 2018 | | Retired. Chief Marketing Officer, Source (ETF) UK Services, Ltd, from 2015 to 2017. From 2012 to 2015, Principal of The Polisson Group, LLC, a management consulting, corporate advisory and principal investing company. Chief Executive Officer and Managing Director at Russell Investments, Global Exchange Traded Funds from 2010 to 2012. Managing Director of Barclays Global Investors from 1998 to 2010 and Global Chief Marketing Officer for iShares and Barclays Global Investors from 2000 to 2010. Trustee of the San Francisco Mechanics’ Institute, a non-profit organization, from 2013 to 2015. Board member of the Russell Exchange Traded Fund Trust from 2011 to 2012. Director of Barclays Global Investors Holdings Deutschland GmbH from 2006 to 2009. Mr. Polisson is an attorney and has a retired status with the Massachusetts and District of Columbia Bar Associations. | | N/A |
| | | |
Pamela Wheelock
(Born 1959) | | Trustee, since January 2020; previously Trustee from January 2018 to July 2019 | | Board member of the Destination Medical Center Economic Development Agency, Rochester, Minnesota since 2019. Interim President of the McKnight Foundation from January to September 2020. Acting Commissioner, Minnesota Department of Human Services, July 2019 through September 2019. Human Services Manager (part-time), Minnesota Department of Human Services, October 2019 through December 2019. Chief Operating Officer, Twin Cities Habitat for Humanity from 2017 to 2019. Vice President of University Services, University of Minnesota from 2012 to 2016. Prior thereto, on the Board of Directors, Governance Committee and Finance Committee for the Minnesota Philanthropy Partners (Saint Paul Foundation) from 2012 to 2018, Interim Chief Executive Officer of Blue Cross Blue Shield of Minnesota from 2011 to 2012, Chairman of the Board from 2009 to 2012 and Board Director from 2003 to 2015. Vice President, Leadership and Community Engagement, Bush Foundation, Saint Paul, Minnesota (a private foundation) from 2009 to 2011. Executive Vice President and Chief Financial Officer, Minnesota Sports and Entertainment from 2004 to 2009 and Senior Vice President from 2002 to 2004. Executive Vice President of the Minnesota Wild Foundation from 2004 to 2008. Commissioner of Finance, State of Minnesota, from 1999 to 2002. Currently Board Chair of the Minnesota Wild Foundation since 2010. | | N/A |
| * | Length of service dates reflect the Trustee’s commencement of service with the Trust’s predecessor entities, where applicable. |
Wells Fargo C&B Large Cap Value Fund | 35
Other information (unaudited)
Officers
| | | | |
Name and
year of birth | | Position held and
length of service | | Principal occupations during past five years or longer |
| | |
Andrew Owen
(Born 1960) | | President, since 2017 | | Executive Vice President of Wells Fargo & Company and Head of Affiliated Managers, Wells Fargo Asset Management, since 2014. In addition, Mr. Owen is currently President, Chief Executive Officer and Director of Wells Fargo Funds Management, LLC since 2017. Prior thereto, Executive Vice President responsible for marketing, investments and product development for Wells Fargo Funds Management, LLC, from 2009 to 2014. |
| | |
Nancy Wiser1
(Born 1967) | | Treasurer, since 2012 | | Executive Vice President of Wells Fargo Funds Management, LLC since 2011. Chief Operating Officer and Chief Compliance Officer at LightBox Capital Management LLC, from 2008 to 2011. |
| | |
Michelle Rhee
(Born 1966) | | Chief Legal Officer, since 2019 | | Secretary of Wells Fargo Funds Management, LLC and Chief Legal Counsel of Wells Fargo Asset Management since 2018. Deputy General Counsel of Wells Fargo Bank, N.A. since 2020 and Assistant General Counsel of Wells Fargo Bank, N.A. from 2018 to 2020. Associate General Counsel and Managing Director of Bank of America Corporation from 2004 to 2018. |
| | |
Catherine Kennedy
(Born 1969) | | Secretary, since 2019 | | Vice President of Wells Fargo Funds Management, LLC and Senior Counsel of the Wells Fargo Legal Department since 2010. Vice President and Senior Counsel of Evergreen Investment Management Company, LLC from 1998 to 2010. |
| | |
Michael H. Whitaker
(Born 1967) | | Chief Compliance Officer, since 2016 | | Chief Compliance Officer of Wells Fargo Asset Management since 2016. Senior Vice President and Chief Compliance Officer for Fidelity Investments from 2007 to 2016. |
| | |
Jeremy DePalma1
(Born 1974) | | Assistant Treasurer, since 2009 | | Senior Vice President of Wells Fargo Funds Management, LLC since 2009. Senior Vice President of Evergreen Investment Management Company, LLC from 2008 to 2010 and head of the Fund Reporting and Control Team within Fund Administration from 2005 to 2010. |
| 1 | Nancy Wiser acts as Treasurer of 67 funds in the Fund Complex. Jeremy DePalma acts as the Treasurer of 77 funds and Assistant Treasurer of 67 funds in the Fund Complex. |
| 2 | The Statement of Additional Information includes additional information about the Trustees and is available, without charge, upon request, by calling 1-800-222-8222 or by visiting the website at wfam.com. |
36 | Wells Fargo C&B Large Cap Value Fund

For more information
More information about Wells Fargo Funds is available free upon request. To obtain literature, please write, visit the Fund’s website, or call:
Wells Fargo Funds
P.O. Box 219967
Kansas City, MO 64121-9967
Website: wfam.com
Individual investors: 1-800-222-8222
Retail investment professionals: 1-888-877-9275
Institutional investment professionals: 1-866-765-0778

This report and the financial statements contained herein are submitted for the general information of the shareholders of the Fund. If this report is used for promotional purposes, distribution of the report must be accompanied or preceded by a current prospectus. Before investing, please consider the investment objectives, risks, charges, and expenses of the investment. For a current prospectus and, if available, a summary prospectus, containing this information, call 1-800-222-8222 or visit the Fund’s website at wfam.com. Read the prospectus carefully before you invest or send money.
Wells Fargo Asset Management (WFAM) is the trade name for certain investment advisory/management firms owned by Wells Fargo & Company. These firms include but are not limited to Wells Capital Management Incorporated and Wells Fargo Funds Management, LLC. Certain products managed by WFAM entities are distributed by Wells Fargo Funds Distributor, LLC (a broker-dealer and Member FINRA).
This material is for general informational and educational purposes only and is NOT intended to provide investment advice or a recommendation of any kind—including a recommendation for any specific investment, strategy, or plan.
INVESTMENT PRODUCTS: NOT FDIC INSURED ◾ NO BANK GUARANTEE ◾ MAY LOSE VALUE
© 2021 Wells Fargo & Company. All rights reserved.
PAR-1220-00739 01-20
SA280/SAR280 11-20
Semi-Annual Report
November 30, 2020
Wells Fargo Diversified Equity Fund
|
|
|
Reduce clutter. Save trees. |
Sign up for electronic delivery of prospectuses and shareholder reports at wellsfargo.com/ advantagedelivery |
The views expressed and any forward-looking statements are as of November 30, 2020, unless otherwise noted, and are those of the Fund’s portfolio managers and/or Wells Fargo Asset Management. Discussions of individual securities, or the markets generally, or any Wells Fargo Fund are not intended as individual recommendations. Future events or results may vary significantly from those expressed in any forward-looking statements. The views expressed are subject to change at any time in response to changing circumstances in the market. Wells Fargo Asset Management and the Fund disclaim any obligation to publicly update or revise any views expressed or forward-looking statements.
INVESTMENT PRODUCTS: NOT FDIC INSURED ◾ NO BANK GUARANTEE ◾ MAY LOSE VALUE
Wells Fargo Diversified Equity Fund | 1
Letter to shareholders (unaudited)

Andrew Owen
President
Wells Fargo Funds
“Global stock markets rallied strongly, driven by aggressive stimulus measures introduced by central banks and governments in response to challenges presented by the COVID-19 pandemic.”
Dear Shareholder:
We are pleased to offer you this semi-annual report for the Wells Fargo Diversified Equity Fund for the six-month period that ended November 30, 2020. Global stock markets rallied strongly, driven by aggressive stimulus measures introduced by central banks and governments in response to challenges presented by the COVID-19 pandemic. Emerging market equities had particularly robust results during the six-month period. Among bonds, high-yield issues led the way while U.S. bonds generally had more modest returns than their international counterparts.
For the period, U.S. stocks, based on the S&P 500 Index,1 returned 19.98% and international stocks, as measured by the MSCI ACWI ex USA Index (Net),2 gained 23.28%. The MSCI EM Index (Net)3 rallied 31.14%. Among bond investments, the Bloomberg Barclays U.S. Aggregate Bond Index4 returned a modest 1.79%, the Bloomberg Barclays Global Aggregate ex-USD Index5 gained a robust 8.19%, the Bloomberg Barclays Municipal Bond Index6 had a 3.29% return, and the ICE BofA U.S. High Yield Index7 gained a healthy 10.47%.
Equities enjoyed a strong tailwind from monetary and fiscal stimulus.
Financial markets posted widely positive returns in June despite ongoing economic weakness and uncertainty regarding COVID-19 and the timing of an effective vaccine. As economies reopened, optimism rose. Vitally important to market sentiment was the ongoing global central bank commitment to provide economic support through liquidity and low borrowing costs. U.S. economic activity was boosted by one-time $1,200 stimulus checks and $600 weekly bonus unemployment benefits for tens of millions of Americans through July. However, jobless rates remained historically high, easing somewhat from 14.7% in April to 11.1% in June. By late June, numerous states reported increases of COVID-19 cases, an ominous sign. China’s economic recovery picked up momentum in June.
July was broadly positive for both global equities and fixed income. However, economic data and a resurgence of COVID-19 cases pointed to the vulnerability of the global economy and the need to regain control of the pandemic. Second-quarter gross domestic product (GDP) shrank from the previous quarter by 9.5% and 12.1% in the U.S. and the eurozone, respectively. In contrast, China reported 3.2% year-over-year second-quarter GDP growth. U.S. unemployment remained high despite adding 1.8 million jobs in July, as a double-digit jobless rate persisted. However, manufacturing activity grew in both the U.S. and the eurozone. In Asia, while China’s manufacturing sector continued to expand, activity in Japan and South Korea contracted. A rising concern was the rapid and broad reemergence of COVID-19 infections.
| 1 | The S&P 500 Index consists of 500 stocks chosen for market size, liquidity, and industry group representation. It is a market-value-weighted index with each stock’s weight in the index proportionate to its market value. You cannot invest directly in an index. |
| 2 | The Morgan Stanley Capital International (MSCI) All Country World Index (ACWI) ex USA Index (Net) is a free-float-adjusted market-capitalization-weighted index that is designed to measure the equity market performance of developed and emerging markets, excluding the United States. Source: MSCI. MSCI makes no express or implied warranties or representations and shall have no liability whatsoever with respect to any MSCI data contained herein. The MSCI data may not be further redistributed or used as a basis for other indices or any securities or financial products. This report is not approved, reviewed, or produced by MSCI. You cannot invest directly in an index. |
| 3 | The MSCI Emerging Markets (EM) Index (Net) is a free-float-adjusted market-capitalization-weighted index that is designed to measure equity market performance of emerging markets. You cannot invest directly in an index. |
| 4 | The Bloomberg Barclays U.S. Aggregate Bond Index is a broad-based benchmark that measures the investment-grade, U.S. dollar-denominated, fixed-rate taxable bond market, including Treasuries, government-related and corporate securities, mortgage-backed securities (agency fixed-rate and hybrid adjustable-rate mortgage pass-throughs), asset-backed securities, and commercial mortgage-backed securities. You cannot invest directly in an index. |
| 5 | The Bloomberg Barclays Global Aggregate ex-USD Index is an unmanaged index that provides a broad-based measure of the global investment-grade fixed-income markets excluding the U.S. dollar-denominated debt market. You cannot invest directly in an index. |
| 6 | The Bloomberg Barclays Municipal Bond Index is an unmanaged index composed of long-term tax-exempt bonds with a minimum credit rating of Baa. You cannot invest directly in an index. |
| 7 | The ICE BofA U.S. High Yield Index is a market-capitalization-weighted index of domestic and Yankee high-yield bonds. The index tracks the performance of high-yield securities traded in the U.S. bond market. You cannot invest directly in an index. Copyright 2021. ICE Data Indices, LLC. All rights reserved. |
2 | Wells Fargo Diversified Equity Fund
Letter to shareholders (unaudited)
The stock market continued to rally in August despite concerns over rising COVID-19 cases in the U.S. and Europe, as well as the expiration of the $600 weekly bonus unemployment benefit in July. Generally stronger-than-expected second-quarter earnings boosted investor sentiment along with the Federal Reserve’s announcement of a more accommodative policy shift that could lead to longer-term low interest rates. U.S. indices measuring manufacturing and services activities beat expectations while the U.S. housing market maintained strength. In Europe, retail sales expanded and consumer confidence was steady. China’s economy continued to expand.
Stocks grew more volatile in September on mixed economic data. U.S. economic activity continued to grow. However, only half of the 22 million jobs lost since the early spring had returned. The U.S. unemployment rate fell to 7.9% in September, a measurable improvement but far higher than the 3.5% pre-COVID-19 rate. Only 661,000 jobs were added for the month, down from 1.5 million in August. With the U.S. Congress failing to pass further fiscal relief and uncertainties surrounding a possible vaccine, doubts crept back into the markets. In the U.K., a lack of progress in Brexit talks with the European Union weighed on markets. China’s economy picked up steam, however, with growth fueled by increased global demand.
In October, capital markets took a step back from their six-month rally. Market volatility rose in advance of the U.S. election and amid a global increase in COVID-19 infections. Europe responded with more economic restrictions. Meanwhile, Brexit remained unresolved. U.S. markets looked favorably at a possible Democratic sweep and control of the federal purse strings in anticipation of additional fiscal stimulus, which could boost economic activity. Meanwhile, China continued to stand apart, reporting 4.9% third-quarter GDP growth year over year.
Global stocks rallied broadly in November, propelled by optimism over three promising COVID-19 vaccines, which reported high effectiveness in trials. Global stock indices notched double-digit monthly gains. In a reversal of recent trends, value stocks outperformed growth and cyclical stocks outpaced technology stocks. However, U.S. unemployment remained elevated, with a net job loss of 10 million since February. The Eurozone Services Purchasing Managers’ Index, a monthly survey of purchasing managers, contracted sharply while the region’s manufacturing activity gauge indicated growth. The U.S. election results added to the market’s upbeat mood as investors gave thumbs-up to the certainty of the outcome after an unusual delay and anticipated more consistent policies in the new administration.
Don’t let short-term uncertainty derail long-term investment goals.
Periods of investment uncertainty can present challenges, but experience has taught us that maintaining long-term investment goals can be an effective way to plan for the future. To help you create a sound strategy based on your personal goals and risk tolerance, Wells Fargo Funds offers more than 100 mutual funds spanning a wide range of asset classes and investment styles. Although diversification cannot guarantee an investment profit or prevent losses, we believe it can be an effective way to manage investment risk and potentially smooth out overall portfolio performance. We encourage investors to know their investments and to understand that appropriate levels of risk-taking may unlock opportunities.
Thank you for choosing to invest with Wells Fargo Funds. We appreciate your confidence in us and remain committed to helping you meet your financial needs.
Sincerely,

Andrew Owen
President
Wells Fargo Funds
“Global stocks rallied broadly in November, propelled by optimism over three promising COVID-19 vaccines, which reported high effectiveness in trials.”
|
|
|
For further information about your Fund, contact your investment professional, visit our website at wfam.com, or call us directly at 1-800-222-8222. |
Wells Fargo Diversified Equity Fund | 3
Letter to shareholders (unaudited)
Notice to Shareholders
At a meeting held on August 10-12, 2020, the Board of Trustees of the Fund approved a change to the Fund’s automatic conversion feature for Class C shares in order to shorten the required holding period from 10 to 8 years. As a result, on a monthly basis beginning November 5, 2020, Class C shares will convert automatically into Class A shares 8 years after the initial date of purchase or, if you acquired your Class C shares through an exchange or conversion from another share class, 8 years after the date you acquired your Class C shares. When Class C shares that you acquired through a purchase or exchange convert, any other Class C shares that you purchased with reinvested dividends and distributions also will convert into Class A shares on a pro rata basis.
Please note that a shorter holding period may apply depending on your intermediary. Please see “Appendix A—Sales Charge Reductions and Waivers for Certain Intermediaries” in the Fund’s prospectus for further information.
4 | Wells Fargo Diversified Equity Fund
This page is intentionally left blank.
Performance highlights (unaudited)
Investment objective
The Fund seeks long-term total capital appreciation.
Manager
Wells Fargo Funds Management, LLC
Portfolio manager
Aldo Ceccarelli, CFA®‡
Average annual total returns (%) as of November 30, 2020
| | | | | | | | | | | | | | | | | | | | | | | | | | | | | | | | | | |
| | | | |
| | | | | Including sales charge | | | Excluding sales charge | | | Expense ratios1 (%) | |
| | | | | | | | | |
| | | Inception date | | 1 year | | | 5 year | | | 10 year | | | 1 year | | | 5 year | | | 10 year | | | Gross | | | Net2 | |
| | | | | | | | | | |
| Class A (NVDAX) | | 5-2-1996 | | | 7.13 | | | | 9.36 | | | | 10.44 | | | | 13.67 | | | | 10.67 | | | | 11.10 | | | | 1.40 | | | | 1.25 | |
| | | | | | | | | | |
| Class C (WFDEX) | | 10-1-1998 | | | 11.82 | | | | 9.85 | | | | 10.27 | | | | 12.82 | | | | 9.85 | | | | 10.27 | | | | 2.15 | | | | 2.00 | |
| | | | | | | | | | |
| Administrator Class (NVDEX) | | 11-11-1994 | | | – | | | | – | | | | – | | | | 13.94 | | | | 10.94 | | | | 11.37 | | | | 1.32 | | | | 1.00 | |
| | | | | | | | | | |
| Diversified Equity Blended Index3 | | – | | | – | | | | – | | | | – | | | | 15.80 | | | | 12.49 | | | | 12.65 | | | | – | | | | – | |
| | | | | | | | | | |
| MSCI EAFE Index (Net)4 | | – | | | – | | | | – | | | | – | | | | 6.37 | | | | 6.19 | | | | 5.85 | | | | – | | | | – | |
| | | | | | | | | | |
| Russell 1000® Growth Index5 | | – | | | – | | | | – | | | | – | | | | 36.40 | | | | 19.56 | | | | 17.31 | | | | – | | | | – | |
| | | | | | | | | | |
| Russell 1000® Value Index6 | | – | | | – | | | | – | | | | – | | | | 1.72 | | | | 8.44 | | | | 10.93 | | | | – | | | | – | |
| | | | | | | | | | |
| Russell 2000® Index7 | | – | | | – | | | | – | | | | – | | | | 13.59 | | | | 10.25 | | | | 11.13 | | | | – | | | | – | |
| | | | | | | | | | |
| S&P 500 Index8 | | – | | | – | | | | – | | | | – | | | | 17.46 | | | | 13.99 | | | | 14.19 | | | | – | | | | – | |
Figures quoted represent past performance, which is no guarantee of future results, and do not reflect taxes that a shareholder may pay on an investment in a fund. Investment return and principal value of an investment will fluctuate so that an investor’s shares, when redeemed, may be worth more or less than their original cost. Performance shown without sales charges would be lower if sales charges were reflected. Current performance may be lower or higher than the performance data quoted, which assumes the reinvestment of dividends and capital gains. Current month-end performance is available on the Fund’s website, wfam.com.
Index returns do not include transaction costs associated with buying and selling securities, any mutual fund fees or expenses, or any taxes. It is not possible to invest directly in an index.
For Class A shares, the maximum front-end sales charge is 5.75%. For Class C shares, the maximum contingent deferred sales charge is 1.00%. Performance including a contingent deferred sales charge assumes the sales charge for the corresponding time period. Administrator Class shares are sold without a front-end sales charge or contingent deferred sales charge.
Stock values fluctuate in response to the activities of individual companies and general market and economic conditions. The use of derivatives may reduce returns and/or increase volatility. Certain investment strategies tend to increase the total risk of an investment (relative to the broader market). The Fund is exposed to foreign investment risk and smaller-company securities risk. Consult the Fund’s prospectus for additional information on these and other risks.
Please see footnotes on page 7.
6 | Wells Fargo Diversified Equity Fund
Performance highlights (unaudited)
| | | | |
| |
| Fund holdings (%) as of November 30, 20209 | | | |
| | |
Wells Fargo Diversified Large Cap Growth Portfolio | | | 25.11 | |
| | |
Wells Fargo Index Portfolio | | | 25.06 | |
| | |
Wells Fargo Large Company Value Portfolio | | | 16.79 | |
| | |
Wells Fargo C&B Large Cap Value Portfolio | | | 8.30 | |
| | |
Wells Fargo Disciplined International Developed Markets Portfolio | | | 7.50 | |
| | |
Wells Fargo Small Company Value Portfolio | | | 4.98 | |
| | |
Wells Fargo International Value Portfolio | | | 4.83 | |
| | |
Wells Fargo Emerging Growth Portfolio | | | 2.55 | |
| | |
Wells Fargo Small Company Growth Portfolio | | | 2.52 | |
| | |
Wells Fargo Factor Enhanced International Equity Portfolio | | | 2.50 | |
| | | | | | | | |
|
| Allocations (%) as of November 30, 2020 | |
| | |
| | | Neutral
allocation | | | Effective
allocation10 | |
| | | |
U.S. Large Cap Stock Funds | | | 75 | | | | 75 | |
| | | |
International Stock Funds | | | 15 | | | | 15 | |
| | | |
U.S. Small Cap Stock Funds | | | 10 | | | | 10 | |
| ‡ | CFA® and Chartered Financial Analyst® are trademarks owned by CFA Institute. |
| 1 | Reflects the expense ratios as stated in the most recent prospectuses, which include the impact of 0.51% in acquired fund fees and expenses. The expense ratios shown are subject to change and may differ from the annualized expense ratios shown in the financial highlights of this report, which do not include acquired fund fees and expenses. |
| 2 | The manager has contractually committed through September 30, 2021, to waive fees and/or reimburse expenses to the extent necessary to cap total annual fund operating expenses after fee waivers at 1.25% for Class A, 2.00% for Class C, and 1.00% for Administrator Class. Brokerage commissions, stamp duty fees, interest, taxes, acquired fund fees and expenses (if any) from funds in which the affiliated master portfolios and funds invest and from any money market funds, and extraordinary expenses are excluded from the expense caps. All other acquired fund fees and expenses from the affiliated master portfolios are included in the expense caps. Prior to or after the commitment expiration date, the caps may be increased or the commitment to maintain the caps may be terminated only with the approval of the Board of Trustees. Without these caps, the Fund’s returns would have been lower. The expense ratio paid by an investor is the net expense ratio (the total annual fund operating expenses after fee waivers) as stated in the prospectuses. |
| 3 | Source: Wells Fargo Funds Management, LLC. The Diversified Equity Blended Index is composed of 25% of the S&P 500 Index, 25% of the Russell 1000® Growth Index, 25% of the Russell 1000® Value Index, 15% of the MSCI EAFE Index (Net), and 10% of the Russell 2000® Index. You cannot invest directly in an index. |
| 4 | The Morgan Stanley Capital International (MSCI) Europe, Australasia, Far East (EAFE) Index (Net) is a free-float-adjusted market-capitalization-weighted index that is designed to measure the equity market performance of developed markets, excluding the United States and Canada. Source: MSCI. MSCI makes no express or implied warranties or representations and shall have no liability whatsoever with respect to any MSCI data contained herein. The MSCI data may not be further redistributed or used as a basis for other indexes or any securities or financial products. This report is not approved, reviewed, or produced by MSCI. You cannot invest directly in an index. |
| 5 | The Russell 1000® Growth Index measures the performance of those Russell 1000 companies with higher price/book ratios and higher forecasted growth values. You cannot invest directly in an index. |
| 6 | The Russell 1000® Value Index measures the performance of those Russell 1000 companies with lower price/book ratios and lower forecasted growth values. You cannot invest directly in an index. |
| 7 | The Russell 2000® Index measures the performance of the 2,000 smallest companies in the Russell 3000® Index, which represents approximately 8% of the total market capitalization of the Russell 3000® Index. You cannot invest directly in an index. |
| 8 | The S&P 500 Index consists of 500 stocks chosen for market size, liquidity, and industry group representation. It is a market-value-weighted index with each stock’s weight in the index proportionate to its market value. You cannot invest directly in an index. |
| 9 | Figures represent the percentage of the Fund’s net assets. Holdings are subject to change and may have changed since the date specified. |
| 10 | Figures represent the sector allocation of the affiliated master portfolio as a percentage of the long-term investments of the affiliated master portfolio. These amounts are subject to change and may have changed since the date specified. |
Wells Fargo Diversified Equity Fund | 7
Fund expenses (unaudited)
As a shareholder of the Fund, you incur two types of costs: (1) transaction costs, including sales charges (loads) on purchase payments and contingent deferred sales charges (if any) on redemptions and (2) ongoing costs, including management fees, distribution (12b-1) and/or shareholder servicing fees, and other Fund expenses. This example is intended to help you understand your ongoing costs (in dollars) of investing in the Fund and to compare these costs with the ongoing costs of investing in other mutual funds.
The example is based on an investment of $1,000 invested at the beginning of the six-month period and held for the entire period from June 1, 2020 to November 30, 2020.
Actual expenses
The “Actual” line of the table below provides information about actual account values and actual expenses. You may use the information in this line, together with the amount you invested, to estimate the expenses that you paid over the period. Simply divide your account value by $1,000 (for example, an $8,600 account value divided by $1,000 = 8.6), then multiply the result by the number in the “Actual” line under the heading entitled “Expenses paid during period” for your applicable class of shares to estimate the expenses you paid on your account during this period.
Hypothetical example for comparison purposes
The “Hypothetical” line of the table below provides information about hypothetical account values and hypothetical expenses based on the Fund’s actual expense ratio and an assumed rate of return of 5% per year before expenses, which is not the Fund’s actual return. The hypothetical account values and expenses may not be used to estimate the actual ending account balance or expenses you paid for the period. You may use this information to compare the ongoing costs of investing in the Fund and other funds. To do so, compare this 5% hypothetical example with the 5% hypothetical examples that appear in the shareholder reports of the other funds.
Please note that the expenses shown in the table are meant to highlight your ongoing costs only and do not reflect any transactional costs, such as sales charges (loads) and contingent deferred sales charges. Therefore, the “Hypothetical” line of the table is useful in comparing ongoing costs only and will not help you determine the relative total costs of owning different funds. In addition, if these transactional costs were included, your costs would have been higher.
| | | | | | | | | | | | | | | | |
| | | Beginning
account value
6-1-2020 | | | Ending
account value
11-30-2020 | | | Expenses
paid during
the period1,2 | | | Annualized net
expense ratio1 | |
| | | | | |
Class A | | | | | | | | | | | | | | | | |
| | | | |
Actual | | $ | 1,000.00 | | | $ | 1,215.69 | | | $ | 6.94 | | | | 1.25 | % |
| | | | |
Hypothetical (5% return before expenses) | | $ | 1,000.00 | | | $ | 1,018.80 | | | $ | 6.33 | | | | 1.25 | % |
| | | | | |
Class C | | | | | | | | | | | | | | | | |
| | | | |
Actual | | $ | 1,000.00 | | | $ | 1,210.95 | | | $ | 11.09 | | | | 2.00 | % |
| | | | |
Hypothetical (5% return before expenses) | | $ | 1,000.00 | | | $ | 1,015.04 | | | $ | 10.10 | | | | 2.00 | % |
| | | | | |
Administrator Class | | | | | | | | | | | | | | | | |
| | | | |
Actual | | $ | 1,000.00 | | | $ | 1,216.76 | | | $ | 5.56 | | | | 1.00 | % |
| | | | |
Hypothetical (5% return before expenses) | | $ | 1,000.00 | | | $ | 1,020.05 | | | $ | 5.06 | | | | 1.00 | % |
| 1 | Amounts reflect net expenses allocated from the affiliated Master Portfolios in which the Fund invests. |
| 2 | Expenses paid is equal to the annualized net expense ratio of each class multiplied by the average account value over the period, multiplied by the number of days in the most recent fiscal half-year divided by the number of days in the fiscal year (to reflect the one-half-year period). |
8 | Wells Fargo Diversified Equity Fund
Portfolio of investments—November 30, 2020 (unaudited)
| | | | | | | | | | | | | | | | |
| | | | | | | | | | | | Value | |
| Investment Companies: 100.14% | |
|
| Affiliated Master Portfolios: 100.14% | |
Wells Fargo C&B Large Cap Value Portfolio | | | | | | | | | | | | | | $ | 13,175,576 | |
Wells Fargo Disciplined International Developed Markets Portfolio | | | | | | | | | | | | | | | 11,898,542 | |
Wells Fargo Diversified Large Cap Growth Portfolio | | | | | | | | | | | | | | | 39,816,369 | |
Wells Fargo Emerging Growth Portfolio | | | | | | | | | | | | | | | 4,045,587 | |
Wells Fargo Factor Enhanced International Equity Portfolio | | | | | | | | | | | | | | | 3,968,742 | |
Wells Fargo Index Portfolio | | | | | | | | | | | | | | | 39,762,811 | |
Wells Fargo International Value Portfolio | | | | | | | | | | | | | | | 7,665,473 | |
Wells Fargo Large Company Value Portfolio | | | | | | | | | | | | | | | 26,644,425 | |
Wells Fargo Small Company Growth Portfolio | | | | | | | | | | | | | | | 3,996,524 | |
Wells Fargo Small Company Value Portfolio | | | | | | | | | | | | | | | 7,903,201 | |
| |
Total Investment Companies (Cost $128,639,736) | | | | 158,877,250 | |
| | | | | | | | | | | | | | | | |
| | | | | | | | |
| Total investments in securities (Cost $128,639,736) | | | 100.14 | % | | | 158,877,250 | |
| | |
Other assets and liabilities, net | | | (0.14 | ) | | | (219,123 | ) |
| | | | | | | | |
| Total net assets | | | 100.00 | % | | $ | 158,658,127 | |
| | | | | | | | |
Transactions with the affiliated Master Portfolios were as follows:
| | | | | | | | | | | | | | | | | | | | | | | | | | | | | | | | |
| | | % of
ownership,
beginning
of period | | | % of
ownership,
end of
period | | | Net realized
gains
(losses) on
securities
transactions
allocated
from
affiliated
Master
Portfolios | | | Net
change in
unrealized
gains
(losses) on
securities
transactions
allocated
from
affiliated
Master
Portfolios | | | Dividends
allocated
from
affiliated
Master
Portfolios | | | Affiliated
income
allocated
from
affiliated
Master
Portfolios
| | | Value,
end
of period | | | % of
net
assets | |
Wells Fargo C&B Large Cap Value Portfolio | | | 3.77 | % | | | 3.95 | % | | $ | 391,893 | | | $ | 2,244,029 | | | $ | 111,264 | | | $ | 143 | | | $ | 13,175,576 | | | | | |
Wells Fargo Disciplined International Developed Markets Portfolio | | | 5.81 | | | | 6.16 | | | | 2,052,797 | | | | (15,281 | ) | | | 114,541 | | | | 6 | | | | 11,898,542 | | | | | |
Wells Fargo Diversified Large Cap Growth Portfolio | | | 16.37 | | | | 16.71 | | | | 2,705,970 | | | | 4,672,764 | | | | 152,292 | | | | 457 | | | | 39,816,369 | | | | | |
Wells Fargo Emerging Growth Portfolio | | | 0.54 | | | | 0.47 | | | | 556,287 | | | | 743,542 | | | | 5,146 | | | | 611 | | | | 4,045,587 | | | | | |
Wells Fargo Factor Enhanced International Equity Portfolio | | | 0.00 | | | | 0.58 | | | | 99,525 | | | | 337,952 | | | | 32,036 | | | | 20 | | | | 3,968,742 | | | | | |
Wells Fargo Index Portfolio | | | 3.39 | | | | 3.34 | | | | 1,355,798 | | | | 5,220,506 | | | | 313,677 | | | | 312 | | | | 39,762,811 | | | | | |
Wells Fargo International Value Portfolio | | | 1.23 | | | | 2.60 | | | | (1,451,892 | ) | | | 2,741,398 | | | | 107,257 | | | | 971 | | | | 7,665,473 | | | | | |
Wells Fargo Large Company Value Portfolio | | | 10.44 | | | | 11.12 | | | | 4,305,469 | | | | 347,033 | | | | 248,466 | | | | 181 | | | | 26,644,425 | | | | | |
Wells Fargo Small Company Growth Portfolio | | | 0.26 | | | | 0.28 | | | | 470,409 | | | | 505,613 | | | | 11,211 | | | | 115 | | | | 3,996,524 | | | | | |
Wells Fargo Small Company Value Portfolio | | | 1.51 | | | | 1.72 | | | | 9,544 | | | | 1,668,561 | | | | 69,982 | | | | 446 | | | | 7,903,201 | | | | | |
| | | | | | | | | | | | | | | | | | | | | | | | | | | | | | | | |
| | | | | | | | | | $ | 10,495,800 | | | $ | 18,466,117 | | | $ | 1,165,872 | | | $ | 3,262 | | | $ | 158,877,250 | | | | 100.14 | % |
| | | | | | | | | | | | | | | | | | | | | | | | | | | | | | | | |
The accompanying notes are an integral part of these financial statements.
Wells Fargo Diversified Equity Fund | 9
Statement of assets and liabilities—November 30, 2020 (unaudited)
| | | | |
| | | | |
| |
Assets | | | | |
Investments in affiliated Master Portfolios, at value (cost $128,639,736) | | $ | 158,877,250 | |
Receivable for Fund shares sold | | | 31,020 | |
Prepaid expenses and other assets | | | 253 | |
| | | | |
Total assets | | | 158,908,523 | |
| | | | |
| |
Liabilities | | | | |
Payable for Fund shares redeemed | | | 145,912 | |
Management fee payable | | | 15,471 | |
Administration fees payable | | | 20,805 | |
Distribution fee payable | | | 955 | |
Shareholder servicing fees payable | | | 31,887 | |
Professional fees payable | | | 13,472 | |
Trustees’ fees and expenses payable | | | 1,125 | |
Accrued expenses and other liabilities | | | 20,769 | |
| | | | |
Total liabilities | | | 250,396 | |
| | | | |
Total net assets | | $ | 158,658,127 | |
| | | | |
| |
Net assets consist of | | | | |
Paid-in capital | | $ | 121,771,166 | |
Total distributable earnings | | | 36,886,961 | |
| | | | |
Total net assets | | $ | 158,658,127 | |
| | | | |
| |
Computation of net asset value and offering price per share | | | | |
Net assets – Class A | | $ | 64,266,039 | |
Shares outstanding – Class A1 | | | 2,591,126 | |
Net asset value per share – Class A | | | $24.80 | |
Maximum offering price per share – Class A2 | | | $26.31 | |
Net assets – Class C | | $ | 1,596,063 | |
Shares outstanding – Class C1 | | | 75,963 | |
Net asset value per share – Class C | | | $21.01 | |
Net assets – Administrator Class | | $ | 92,796,025 | |
Shares outstanding – Administrator Class1 | | | 3,714,645 | |
Net asset value per share – Administrator Class | | | $24.98 | |
| 1 | The Fund has an unlimited number of authorized shares. |
| 2 | Maximum offering price is computed as 100/94.25 of net asset value. On investments of $50,000 or more, the offering price is reduced. |
The accompanying notes are an integral part of these financial statements.
10 | Wells Fargo Diversified Equity Fund
Statement of operations—six months ended November 30, 2020 (unaudited)
| | | | |
| | | | |
| |
Investment income | | | | |
Dividends allocated from affiliated Master Portfolios (net of foreign withholding taxes of $31,640) | | $ | 1,165,872 | |
Affiliated income allocated from affiliated Master Portfolios | | | 3,262 | |
Expenses allocated from affiliated Master Portfolios | | | (371,908 | ) |
Waivers allocated from affiliated Master Portfolios | | | 29,979 | |
| | | | |
Total investment income | | | 827,205 | |
| | | | |
| |
Expenses | | | | |
Management fee | | | 223,852 | |
Administration fees | |
Class A | | | 63,040 | |
Class C | | | 1,512 | |
Administrator Class | | | 57,041 | |
Shareholder servicing fees | |
Class A | | | 74,975 | |
Class C | | | 1,798 | |
Administrator Class | | | 109,616 | |
Distribution fee | |
Class C | | | 5,376 | |
Custody and accounting fees | | | 4,425 | |
Professional fees | | | 16,726 | |
Registration fees | | | 37,601 | |
Shareholder report expenses | | | 15,507 | |
Trustees’ fees and expenses | | | 11,029 | |
Other fees and expenses | | | 9,271 | |
| | | | |
Total expenses | | | 631,769 | |
Less: Fee waivers and/or expense reimbursements | |
Fund-level | | | (87,100 | ) |
Class A | | | (207 | ) |
Class C | | | (1 | ) |
Administrator Class | | | (58,035 | ) |
| | | | |
Net expenses | | | 486,426 | |
| | | | |
Net investment income | | | 340,779 | |
| | | | |
| |
Realized and unrealized gains (losses) on investments | | | | |
Net realized gains on securities transactions allocated from affiliated Master Portfolios | | | 10,495,800 | |
Net change in unrealized gains (losses) on securities transactions allocated from affiliated Master Portfolios | | | 18,466,117 | |
| | | | |
Net realized and unrealized gains (losses) on investments | | | 28,961,917 | |
| | | | |
Net increase in net assets resulting from operations | | $ | 29,302,696 | |
| | | | |
The accompanying notes are an integral part of these financial statements.
Wells Fargo Diversified Equity Fund | 11
Statement of changes in net assets
| | | | | | | | | | | | | | | | |
| | | Six months ended
November 30, 2020
(unaudited) | | | Year ended
May 31, 2020 | |
| |
Operations | | | | | |
Net investment income | | | | | | $ | 340,779 | | | | | | | $ | 985,336 | |
Net realized gains on investments | | | | | | | 10,495,800 | | | | | | | | 7,327,284 | |
Net change in unrealized gains (losses) on investments | | | | | | | 18,466,117 | | | | | | | | (2,050 | ) |
| | | | |
Net increase in net assets resulting from operations | | | | | | | 29,302,696 | | | | | | | | 8,310,570 | |
| | | | |
| | | | |
Distributions to shareholders from net investment income and net realized gains | | | | | | | | | | | | | | | | |
Class A | | | | | | | 0 | | | | | | | | (6,060,114 | ) |
Class C | | | | | | | 0 | | | | | | | | (154,837 | ) |
Administrator Class | | | | | | | 0 | | | | | | | | (8,943,655 | ) |
| | | | |
Total distributions to shareholders | | | | | | | 0 | | | | | | | | (15,158,606 | ) |
| | | | |
| | | | |
Capital share transactions | | | Shares | | | | | | | | Shares | | | | | |
Proceeds from shares sold | |
Class A | | | 26,121 | | | | 596,537 | | | | 34,574 | | | | 724,712 | |
Class C | | | 5,297 | | | | 104,200 | | | | 1,492 | | | | 27,271 | |
Administrator Class | | | 99,746 | | | | 2,237,146 | | | | 793,124 | | | | 13,930,309 | |
| | | | |
| | | | | | | 2,937,883 | | | | | | | | 14,682,292 | |
| | | | |
Reinvestment of distributions | | | | | | | | | | | | | | | | |
Class A | | | 0 | | | | 0 | | | | 271,522 | | | | 6,024,365 | |
Class C | | | 0 | | | | 0 | | | | 8,155 | | | | 153,322 | |
Administrator Class | | | 0 | | | | 0 | | | | 396,996 | | | | 8,870,564 | |
| | | | |
| | | | | | | 0 | | | | | | | | 15,048,251 | |
| | | | |
Payment for shares redeemed | |
Class A | | | (198,579 | ) | | | (4,467,509 | ) | | | (430,823 | ) | | | (9,283,399 | ) |
Class C | | | (5,240 | ) | | | (102,205 | ) | | | (10,993 | ) | | | (204,548 | ) |
Administrator Class | | | (416,669 | ) | | | (9,468,689 | ) | | | (1,241,352 | ) | | | (23,720,814 | ) |
| | | | |
| | | | | | | (14,038,403 | ) | | | | | | | (33,208,761 | ) |
| | | | |
Net decrease in net assets resulting from capital share transactions | | | | | | | (11,100,520 | ) | | | | | | | (3,478,218 | ) |
| | | | |
Total increase (decrease) in net assets | | | | | | | 18,202,176 | | | | | | | | (10,326,254 | ) |
| | | | |
| | | | |
Net assets | | | | | | | | | | | | | | | | |
Beginning of period | | | | | | | 140,455,951 | | | | | | | | 150,782,205 | |
| | | | |
End of period | | | | | | $ | 158,658,127 | | | | | | | $ | 140,455,951 | |
| | | | |
The accompanying notes are an integral part of these financial statements.
12 | Wells Fargo Diversified Equity Fund
Financial highlights
(For a share outstanding throughout each period)
| | | | | | | | | | | | | | | | | | | | | | | | |
| | | Six months ended
November 30, 2020
(unaudited) | | | Year ended May 31 | |
| CLASS A | | 2020 | | | 2019 | | | 2018 | | | 2017 | | | 2016 | |
Net asset value, beginning of period | | | $20.40 | | | | $21.36 | | | | $26.48 | | | | $29.37 | | | | $27.30 | | | | $32.37 | |
Net investment income | | | 0.04 | 1 | | | 0.11 | 1 | | | 0.18 | 1 | | | 0.16 | 1 | | | 0.13 | | | | 0.16 | |
Net realized and unrealized gains (losses) on investments | | | 4.36 | | | | 1.18 | | | | (0.55 | ) | | | 3.93 | | | | 3.94 | | | | (1.55 | ) |
| | | | | | | | | | | | | | | | | | | | | | | | |
Total from investment operations | | | 4.40 | | | | 1.29 | | | | (0.37 | ) | | | 4.09 | | | | 4.07 | | | | (1.39 | ) |
Distributions to shareholders from | | | | | | | | | | | | | | | | | | | | | | | | |
Net investment income | | | 0.00 | | | | (0.17 | ) | | | (0.13 | ) | | | (0.17 | ) | | | (0.22 | ) | | | (0.08 | ) |
Net realized gains | | | 0.00 | | | | (2.08 | ) | | | (4.62 | ) | | | (6.81 | ) | | | (1.78 | ) | | | (3.60 | ) |
| | | | | | | | | | | | | | | | | | | | | | | | |
Total distributions to shareholders | | | 0.00 | | | | (2.25 | ) | | | (4.75 | ) | | | (6.98 | ) | | | (2.00 | ) | | | (3.68 | ) |
Net asset value, end of period | | | $24.80 | | | | $20.40 | | | | $21.36 | | | | $26.48 | | | | $29.37 | | | | $27.30 | |
Total return2 | | | 21.57 | % | | | 5.27 | % | | | (0.57 | )% | | | 14.68 | % | | | 15.59 | % | | | (4.24 | )% |
Ratios to average net assets (annualized) | | | | | | | | | | | | | | | | | | | | | | | | |
Gross expenses3 | | | 1.34 | % | | | 1.39 | % | | | 1.37 | % | | | 1.38 | % | | | 1.40 | % | | | 1.41 | % |
Net expenses3 | | | 1.25 | % | | | 1.25 | % | | | 1.25 | % | | | 1.25 | % | | | 1.25 | % | | | 1.25 | % |
Net investment income3 | | | 0.32 | % | | | 0.52 | % | | | 0.75 | % | | | 0.55 | % | | | 0.63 | % | | | 0.60 | % |
Supplemental data | | | | | | | | | | | | | | | | | | | | | | | | |
Portfolio turnover rate4 | | | 58 | % | | | 81 | % | | | 91 | % | | | 70 | % | | | 90 | % | | | 39 | % |
Net assets, end of period (000s omitted) | | | $64,266 | | | | $56,387 | | | | $61,692 | | | | $69,766 | | | | $68,678 | | | | $67,597 | |
| 1 | Calculated based upon average shares outstanding |
| 2 | Total return calculations do not include any sales charges. Returns for periods of less than one year are not annualized. |
| 3 | Ratios include net expenses allocated from the affiliated Master Portfolios which were as follows: |
| | | | |
Six months ended November 30, 2020 (unaudited) | | | 0.46 | % |
Year ended May 31, 2020 | | | 0.51 | % |
Year ended May 31, 2019 | | | 0.50 | % |
Year ended May 31, 2018 | | | 0.53 | % |
Year ended May 31, 2017 | | | 0.57 | % |
Year ended May 31, 2016 | | | 0.59 | % |
| 4 | Portfolio turnover rate is calculated by multiplying the affiliated Master Portfolio’s percentage of the Fund’s total investment in securities at the end of the period by the affiliated Master Portfolio’s portfolio turnover rate. |
The accompanying notes are an integral part of these financial statements.
Wells Fargo Diversified Equity Fund | 13
Financial highlights
(For a share outstanding throughout each period)
| | | | | | | | | | | | | | | | | | | | | | | | |
| | | Six months ended
November 30, 2020
(unaudited) | | | Year ended May 31 | |
| CLASS C | | 2020 | | | 2019 | | | 2018 | | | 2017 | | | 2016 | |
Net asset value, beginning of period | | | $17.35 | | | | $18.45 | | | | $23.58 | | | | $26.86 | | | | $25.12 | | | | $30.22 | |
Net investment loss | | | (0.04 | ) | | | (0.04 | )1 | | | (0.01 | )1 | | | (0.05 | )1 | | | (0.03 | )1 | | | (0.05 | )1 |
Net realized and unrealized gains (losses) on investments | | | 3.70 | | | | 1.03 | | | | (0.50 | ) | | | 3.58 | | | | 3.57 | | | | (1.45 | ) |
| | | | | | | | | | | | | | | | | | | | | | | | |
Total from investment operations | | | 3.66 | | | | 0.99 | | | | (0.51 | ) | | | 3.53 | | | | 3.54 | | | | (1.50 | ) |
Distributions to shareholders from | | | | | | | | | | | | | | | | | | | | | | | | |
Net investment income | | | 0.00 | | | | (0.01 | ) | | | 0.00 | | | | (0.00 | )2 | | | (0.02 | ) | | | 0.00 | |
Net realized gains | | | 0.00 | | | | (2.08 | ) | | | (4.62 | ) | | | (6.81 | ) | | | (1.78 | ) | | | (3.60 | ) |
| | | | | | | | | | | | | | | | | | | | | | | | |
Total distributions to shareholders | | | 0.00 | | | | (2.09 | ) | | | (4.62 | ) | | | (6.81 | ) | | | (1.80 | ) | | | (3.60 | ) |
Net asset value, end of period | | | $21.01 | | | | $17.35 | | | | $18.45 | | | | $23.58 | | | | $26.86 | | | | $25.12 | |
Total return3 | | | 21.10 | % | | | 4.53 | % | | | (1.34 | )% | | | 13.89 | % | | | 14.71 | % | | | (4.96 | )% |
Ratios to average net assets (annualized) | | | | | | | | | | | | | | | | | | | | | | | | |
Gross expenses4 | | | 2.09 | % | | | 2.14 | % | | | 2.11 | % | | | 2.13 | % | | | 2.15 | % | | | 2.16 | % |
Net expenses4 | | | 2.00 | % | | | 2.00 | % | | | 2.00 | % | | | 2.00 | % | | | 2.00 | % | | | 2.00 | % |
Net investment loss4 | | | (0.43 | )% | | | (0.23 | )% | | | (0.04 | )% | | | (0.21 | )% | | | (0.13 | )% | | | (0.17 | )% |
Supplemental data | | | | | | | | | | | | | | | | | | | | | | | | |
Portfolio turnover rate5 | | | 58 | % | | | 81 | % | | | 91 | % | | | 70 | % | | | 90 | % | | | 39 | % |
Net assets, end of period (000s omitted) | | | $1,596 | | | | $1,317 | | | | $1,425 | | | | $2,245 | | | | $2,355 | | | | $2,846 | |
| 1 | Calculated based upon average shares outstanding |
| 2 | Amount is less than $0.005. |
| 3 | Total return calculations do not include any sales charges. Returns for periods of less than one year are not annualized. |
| 4 | Ratios include net expenses allocated from the affiliated Master Portfolios which were as follows: |
| | | | |
Six months ended November 30, 2020 (unaudited) | | | 0.46 | % |
Year ended May 31, 2020 | | | 0.51 | % |
Year ended May 31, 2019 | | | 0.50 | % |
Year ended May 31, 2018 | | | 0.53 | % |
Year ended May 31, 2017 | | | 0.57 | % |
Year ended May 31, 2016 | | | 0.59 | % |
| 5 | Portfolio turnover rate is calculated by multiplying the affiliated Master Portfolio’s percentage of the Fund’s total investment in securities at the end of the period by the affiliated Master Portfolio’s portfolio turnover rate. |
The accompanying notes are an integral part of these financial statements.
14 | Wells Fargo Diversified Equity Fund
Financial highlights
(For a share outstanding throughout each period)
| | | | | | | | | | | | | | | | | | | | | | | | |
| | | Six months ended
November 30, 2020
(unaudited) | | | Year ended May 31 | |
| ADMINISTRATOR CLASS | | 2020 | | | 2019 | | | 2018 | | | 2017 | | | 2016 | |
Net asset value, beginning of period | | | $20.53 | | | | $21.47 | | | | $26.60 | | | | $29.46 | | | | $27.38 | | | | $32.45 | |
Net investment income | | | 0.06 | 1 | | | 0.17 | | | | 0.24 | 1 | | | 0.23 | 1 | | | 0.24 | 1 | | | 0.24 | |
Net realized and unrealized gains (losses) on investments | | | 4.39 | | | | 1.20 | | | | (0.57 | ) | | | 3.95 | | | | 3.91 | | | | (1.55 | ) |
| | | | | | | | | | | | | | | | | | | | | | | | |
Total from investment operations | | | 4.45 | | | | 1.37 | | | | (0.33 | ) | | | 4.18 | | | | 4.15 | | | | (1.31 | ) |
Distributions to shareholders from | | | | | | | | | | | | | | | | | | | | | | | | |
Net investment income | | | 0.00 | | | | (0.23 | ) | | | (0.18 | ) | | | (0.23 | ) | | | (0.29 | ) | | | (0.16 | ) |
Net realized gains | | | 0.00 | | | | (2.08 | ) | | | (4.62 | ) | | | (6.81 | ) | | | (1.78 | ) | | | (3.60 | ) |
| | | | | | | | | | | | | | | | | | | | | | | | |
Total distributions to shareholders | | | 0.00 | | | | (2.31 | ) | | | (4.80 | ) | | | (7.04 | ) | | | (2.07 | ) | | | (3.76 | ) |
Net asset value, end of period | | | $24.98 | | | | $20.53 | | | | $21.47 | | | | $26.60 | | | | $29.46 | | | | $27.38 | |
Total return2 | | | 21.68 | % | | | 5.59 | % | | | (0.35 | )% | | | 14.99 | % | | | 15.86 | % | | | (3.98 | )% |
Ratios to average net assets (annualized) | | | | | | | | | | | | | | | | | | | | | | | | |
Gross expenses3 | | | 1.26 | % | | | 1.31 | % | | | 1.29 | % | | | 1.30 | % | | | 1.32 | % | | | 1.33 | % |
Net expenses3 | | | 1.00 | % | | | 1.00 | % | | | 1.00 | % | | | 1.00 | % | | | 1.00 | % | | | 1.00 | % |
Net investment income3 | | | 0.57 | % | | | 0.77 | % | | | 1.00 | % | | | 0.79 | % | | | 0.87 | % | | | 0.85 | % |
Supplemental data | | | | | | | | | | | | | | | | | | | | | | | | |
Portfolio turnover rate4 | | | 58 | % | | | 81 | % | | | 91 | % | | | 70 | % | | | 90 | % | | | 39 | % |
Net assets, end of period (000s omitted) | | | $92,796 | | | | $82,752 | | | | $87,665 | | | | $98,668 | | | | $119,893 | | | | $140,963 | |
| 1 | Calculated based upon average shares outstanding |
| 2 | Returns for periods of less than one year are not annualized. |
| 3 | Ratios include net expenses allocated from the affiliated Master Portfolios which were as follows: |
| | | | |
Six months ended November 30, 2020 (unaudited) | | | 0.46 | % |
Year ended May 31, 2020 | | | 0.51 | % |
Year ended May 31, 2019 | | | 0.50 | % |
Year ended May 31, 2018 | | | 0.53 | % |
Year ended May 31, 2017 | | | 0.57 | % |
Year ended May 31, 2016 | | | 0.59 | % |
| 4 | Portfolio turnover rate is calculated by multiplying the affiliated Master Portfolio’s percentage of the Fund’s total investment in securities at the end of the period by the affiliated Master Portfolio’s portfolio turnover rate. |
The accompanying notes are an integral part of these financial statements.
Wells Fargo Diversified Equity Fund | 15
Notes to financial statements (unaudited)
1. ORGANIZATION
Wells Fargo Funds Trust (the “Trust”), a Delaware statutory trust organized on March 10, 1999, is an open-end management investment company registered under the Investment Company Act of 1940, as amended (the “1940 Act”). As an investment company, the Trust follows the accounting and reporting guidance in Financial Accounting Standards Board (“FASB”) Accounting Standards Codification Topic 946, Financial Services – Investment Companies. These financial statements report on the Wells Fargo Diversified Equity Fund (the “Fund”) which is a diversified series of the Trust.
The Fund is a fund-of-funds which seeks to achieve its investment objective by investing in various affiliated mutual funds employing a multi-style equity investment approach designed to reduce the price and return volatility of the Fund and to provide more consistent returns. The Fund may also invest directly in securities. The Fund invests in multiple diversified portfolios (collectively, the “affiliated Master Portfolios”) of Wells Fargo Master Trust, a registered open-end management investment company. Each affiliated Master Portfolio directly acquires portfolio securities and the Fund acquires an indirect interest in those securities. The Fund accounts for its investment in the affiliated Master Portfolios as partnership investments and records on a daily basis its share of each affiliated Master Portfolio’s income, expense and realized and unrealized gains and losses. The financial statements of the affiliated Master Portfolios are presented in separate financial statements and may be obtained free of charge by contacting Investor Services or by visiting the SEC website at sec.gov. The financial statements of the affiliated Master Portfolios are filed with the SEC under Wells Fargo Master Trust.
2. SIGNIFICANT ACCOUNTING POLICIES
The following significant accounting policies, which are consistently followed in the preparation of the financial statements of the Fund, are in conformity with U.S. generally accepted accounting principles which require management to make estimates and assumptions that affect the reported amounts of assets and liabilities, disclosure of contingent assets and liabilities at the date of the financial statements, and the reported amounts of revenues and expenses during the reporting period. Actual results could differ from those estimates.
Securities valuation
All investments are valued each business day as of the close of regular trading on the New York Stock Exchange (generally 4 p.m. Eastern Time), although the Fund may deviate from this calculation time under unusual or unexpected circumstances.
Investments in the affiliated Master Portfolios are valued daily based on the Fund’s proportionate share of each affiliated Master Portfolio’s net assets, which are also valued daily.
Investments which are not valued using the method discussed above are valued at their fair value, as determined in good faith by the Board of Trustees of the Fund. The Board of Trustees has established a Valuation Committee comprised of the Trustees and has delegated to it the authority to take any actions regarding the valuation of portfolio securities that the Valuation Committee deems necessary or appropriate, including determining the fair value of portfolio securities, unless the determination has been delegated to the Wells Fargo Asset Management Pricing Committee at Wells Fargo Funds Management, LLC (“Funds Management”). The Board of Trustees retains the authority to make or ratify any valuation decisions or approve any changes to the Valuation Procedures as it deems appropriate. On a quarterly basis, the Board of Trustees receives reports on any valuation actions taken by the Valuation Committee or the Wells Fargo Asset Management Pricing Committee which may include items for ratification.
Investment transactions, income and expenses
Investments in the affiliated Master Portfolios are recorded on a trade basis. The Fund records daily its proportionate share of each affiliated Master Portfolio’s income, expenses, and realized and unrealized gains or losses. The Fund also accrues its own expenses.
Distributions to shareholders
Distributions to shareholders from net investment income and any net realized gains are recorded on the ex-dividend date and paid at least annually. Such distributions are determined in accordance with income tax regulations and may differ from U.S. generally accepted accounting principles. Dividend sources are estimated at the time of declaration. The tax character of distributions is determined as of the Fund’s fiscal year end. Therefore, a portion of the Fund’s distributions made prior to the Fund’s fiscal year end may be categorized as a tax return of capital at year end.
Federal and other taxes
The Fund intends to continue to qualify as a regulated investment company by distributing substantially all of its investment company taxable income and any net realized capital gains (after reduction for capital loss carryforwards) sufficient to relieve it from all, or substantially all, federal income taxes. Accordingly, no provision for federal income taxes was required.
16 | Wells Fargo Diversified Equity Fund
Notes to financial statements (unaudited)
The Fund’s income and federal excise tax returns and all financial records supporting those returns for the prior three fiscal years are subject to examination by the federal and Delaware revenue authorities. Management has analyzed the Fund’s tax positions taken on federal, state, and foreign tax returns for all open tax years and does not believe that there are any uncertain tax positions that require recognition of a tax liability.
As of November 30, 2020, the aggregate cost of all investments for federal income tax purposes was $137,526,871 and the unrealized gains (losses) consisted of:
| | | | |
| |
Gross unrealized gains | | $ | 21,350,379 | |
| |
Gross unrealized losses | | | 0 | |
| |
Net unrealized gains | | $ | 21,350,379 | |
Class allocations
The separate classes of shares offered by the Fund differ principally in applicable sales charges, distribution, shareholder servicing, and administration fees. Class specific expenses are charged directly to that share class. Investment income, common fund-level expenses, and realized and unrealized gains (losses) on investments are allocated daily to each class of shares based on the relative proportion of net assets of each class.
3. FAIR VALUATION MEASUREMENTS
At November 30, 2020, the affiliated Master Portfolios were measured at fair value using the net asset value per share (or its equivalent) as a practical expedient. The aggregate value of the affiliated Master Portfolios was $158,877,250. The investment objective of each affiliated Master Portfolio is as follows:
| | |
| |
| Affiliated Master Portfolio | | Investment objective |
| |
Wells Fargo C&B Large Cap Value Portfolio | | Seeks maximum long-term total return (current income and capital appreciation), consistent with minimizing risk to principal |
| |
Wells Fargo Disciplined International Developed Markets Portfolio | | Seeks long-term capital appreciation |
| |
Wells Fargo Diversified Large Cap Growth Portfolio | | Seeks long-term capital appreciation |
| |
Wells Fargo Emerging Growth Portfolio | | Seeks long-term capital appreciation |
| |
Wells Fargo Factor Enhanced International Equity Portfolio | | Seeks long-term capital appreciation |
| |
Wells Fargo Index Portfolio | | Seeks to replicate the total return of the S&P 500 Index, before fees and expenses |
| |
Wells Fargo International Value Portfolio | | Seeks long-term capital appreciation |
| |
Wells Fargo Large Company Value Portfolio | | Seeks long-term capital appreciation |
| |
Wells Fargo Small Company Growth Portfolio | | Seeks long-term capital appreciation |
| |
Wells Fargo Small Company Value Portfolio | | Seeks long-term capital appreciation |
The affiliated Master Portfolios do not have a redemption period notice, can be redeemed daily and do not have any unfunded commitments.
4. TRANSACTIONS WITH AFFILIATES
Management fee
Funds Management, an indirect wholly owned subsidiary of Wells Fargo & Company (“Wells Fargo”), is the manager of the Fund and provides advisory and fund-level administrative services under an investment management agreement. Under the investment management agreement, Funds Management is responsible for, among other services, implementing the investment objectives and strategies of the Fund and providing fund-level administrative services in connection with the Fund’s
Wells Fargo Diversified Equity Fund | 17
Notes to financial statements (unaudited)
operations. As compensation for its services under the investment management agreement, Funds Management is entitled to receive a management fee at the following annual rate based on the Fund’s average daily net assets:
| | | | |
| |
| Average daily net assets | | Management fee | |
| |
First $500 million | | | 0.30 | % |
| |
Next $500 million | | | 0.28 | |
| |
Next $2 billion | | | 0.26 | |
| |
Next $2 billion | | | 0.24 | |
| |
Next $5 billion | | | 0.23 | |
| |
Over $10 billion | | | 0.22 | |
For the six months ended November 30, 2020, the management fee was equivalent to an annual rate of 0.30% of the Fund’s average daily net assets.
Funds Management also serves as the adviser to each affiliated Master Portfolio and is entitled to receive a fee from each affiliated Master Portfolio for those services.
Administration fees
Under a class-level administration agreement, Funds Management provides class-level administrative services to the Fund, which includes paying fees and expenses for services provided by the transfer agent, sub-transfer agents, omnibus account servicers and record-keepers. As compensation for its services under the class-level administration agreement, Funds Management receives an annual fee which is calculated based on the average daily net assets of each class as follows:
| | | | |
| |
| | | Class-level
administration fee | |
| |
Class A, Class C | | | 0.21 | % |
| |
Administrator Class | | | 0.13 | |
Waivers and/or expense reimbursements
Funds Management has contractually waived and/or reimbursed management and administration fees to the extent necessary to maintain certain net operating expense ratios for the Fund. When each class of the Fund has exceeded its expense cap, Funds Management has waived fees and/or reimbursed expenses from fund-level expenses on a proportionate basis and then from class specific expenses. When only certain classes exceed their expense caps, waivers and/or reimbursements are applied against class specific expenses before fund-level expenses. Funds Management has committed through September 30, 2021 to waive fees and/or reimburse expenses to the extent necessary to cap the Fund’s expenses at 1.25% for Class A shares, 2.00% for Class C shares, and 1.00% for Administrator Class shares. Prior to or after the commitment expiration date, the cap may be increased or the commitment to maintain the cap may be terminated only with the approval of the Board of Trustees.
Distribution fee
The Trust has adopted a distribution plan for Class C shares of the Fund pursuant to Rule 12b-1 under the 1940 Act. A distribution fee is charged to Class C shares and paid to Wells Fargo Funds Distributor, LLC (“Funds Distributor”), the principal underwriter, at an annual rate of 0.75% of the average daily net assets of Class C shares.
In addition, Funds Distributor is entitled to receive the front-end sales charge from the purchase of Class A shares and a contingent deferred sales charge on the redemption of certain Class A shares. Funds Distributor is also entitled to receive the contingent deferred sales charges from redemptions of Class C shares. For the six months ended November 30, 2020, Funds Distributor received $1,074 from the sale of Class A shares. No contingent deferred sales charges were incurred by Class A and Class C shares for the six months ended November 30, 2020.
Shareholder servicing fees
The Trust has entered into contracts with one or more shareholder servicing agents, whereby Class A, Class C, and Administrator Class of the Fund are charged a fee at an annual rate of 0.25% of the average daily net assets of each respective class. A portion of these total shareholder servicing fees were paid to affiliates of Wells Fargo.
18 | Wells Fargo Diversified Equity Fund
Notes to financial statements (unaudited)
5. INVESTMENT PORTFOLIO TRANSACTIONS
The Fund seeks to achieve its investment objective by investing in multiple affiliated Master Portfolios. Purchases and sales related to these investments have been calculated by aggregating the results of multiplying the Fund’s ownership percentage in the respective affiliated Master Portfolio by the corresponding affiliated Master Portfolio’s purchases and sales. Purchases and sales of investments, excluding U.S. government obligations (if any) and short-term securities, for the six months ended November 30, 2020 were $86,146,481 and $114,031,823, respectively.
6. BANK BORROWINGS
The Trust (excluding the money market funds), Wells Fargo Master Trust and Wells Fargo Variable Trust are parties to a $350,000,000 revolving credit agreement whereby the Fund is permitted to use bank borrowings for temporary or emergency purposes, such as to fund shareholder redemption requests. Interest under the credit agreement is charged to the Fund based on a borrowing rate equal to the higher of the Federal Funds rate in effect on that day plus 1.25% or the overnight LIBOR rate in effect on that day plus 1.25%. In addition, an annual commitment fee equal to 0.25% of the unused balance is allocated to each participating fund.
For the six months ended November 30, 2020, there were no borrowings by the Fund under the agreement.
7. INDEMNIFICATION
Under the Fund’s organizational documents, the officers and Trustees have been granted certain indemnification rights against certain liabilities that may arise out of performance of their duties to the Fund. The Fund has entered into a separate agreement with each Trustee that converts indemnification rights currently existing under the Fund’s organizational documents into contractual rights that cannot be changed in the future without the consent of the Trustee. Additionally, in the normal course of business, the Fund may enter into contracts with service providers that contain a variety of indemnification clauses. The Fund’s maximum exposure under these arrangements is dependent on future claims that may be made against the Fund and, therefore, cannot be estimated.
8. NEW ACCOUNTING PRONOUNCEMENT
In August 2018, FASB issued Accounting Standards Update (“ASU”) No. 2018-13, Fair Value Measurement (Topic 820) Disclosure Framework—Changes to the Disclosure Requirements for Fair Value Measurement. ASU 2018-13 updates the disclosure requirements on fair value measurements in Topic 820, Fair Value Measurements. The amendments are effective for fiscal years, and interim periods within those fiscal years, beginning after December 15, 2019. Management has adopted this guidance which did not have a material impact on the financial statements.
9. CORONAVIRUS (COVID-19) PANDEMIC
On March 11, 2020, the World Health Organization announced that it had made the assessment that coronavirus disease 2019 (“COVID-19”) is a pandemic. The impacts of COVID-19 are adversely affecting the entire global economy, individual companies and investment products, and the market in general. There is significant uncertainty around the extent and duration of business disruptions related to COVID-19 and the impacts may be short term or may last for an extended period of time. The risk of further spreading of COVID-19 has led to significant uncertainty and volatility in the financial markets.
Wells Fargo Diversified Equity Fund | 19
Other information (unaudited)
PROXY VOTING INFORMATION
A description of the policies and procedures used to determine how to vote proxies relating to portfolio securities is available, upon request, by calling 1-800-222-8222, visiting our website at wfam.com, or visiting the SEC website at sec.gov. Information regarding how the proxies related to portfolio securities were voted during the most recent 12-month period ended June 30 is available on the website at wfam.com or by visiting the SEC website at sec.gov.
QUARTERLY PORTFOLIO HOLDINGS INFORMATION
The Fund files its complete schedule of portfolio holdings with the SEC for the first and third quarters of each fiscal year as an exhibit to its reports on Form N-PORT. Shareholders may view the filed Form N-PORT by visiting the SEC website at sec.gov.
20 | Wells Fargo Diversified Equity Fund
Other information (unaudited)
BOARD OF TRUSTEES AND OFFICERS
Each of the Trustees and Officers1 listed in the table below acts in identical capacities for each fund in the Wells Fargo family of funds, which consists of 144 mutual funds comprising the Wells Fargo Funds Trust, Wells Fargo Variable Trust, Wells Fargo Master Trust and four closed-end funds (collectively the “Fund Complex”). This table should be read in conjunction with the Prospectus and the Statement of Additional Information2. The mailing address of each Trustee and Officer is 525 Market Street, 12th Floor, San Francisco, CA 94105. Each Trustee and Officer serves an indefinite term, however, each Trustee serves such term until reaching the mandatory retirement age established by the Trustees.
Independent Trustees
| | | | | | |
Name and year of birth | | Position held and
length of service* | | Principal occupations during past five years or longer | | Current other
public company or
investment
company
directorships |
| | | |
William R. Ebsworth (Born 1957) | | Trustee, since 2015 | | Retired. From 1984 to 2013, equities analyst, portfolio manager, research director and chief investment officer at Fidelity Management and Research Company in Boston, Tokyo, and Hong Kong, and retired in 2013 as Chief Investment Officer of Fidelity Strategic Advisers, Inc. where he led a team of investment professionals managing client assets. Prior thereto, Board member of Hong Kong Securities Clearing Co., Hong Kong Options Clearing Corp., the Thailand International Fund, Ltd., Fidelity Investments Life Insurance Company, and Empire Fidelity Investments Life Insurance Company. Audit Committee Chair and Investment Committee Chair of the Vincent Memorial Hospital Endowment (non-profit organization). Mr. Ebsworth is a CFA® charterholder. | | N/A |
| | | |
Jane A. Freeman (Born 1953) | | Trustee, since 2015; Chair Liaison, since 2018 | | Retired. From 2012 to 2014 and 1999 to 2008, Chief Financial Officer of Scientific Learning Corporation. From 2008 to 2012, Ms. Freeman provided consulting services related to strategic business projects. Prior to 1999, Portfolio Manager at Rockefeller & Co. and Scudder, Stevens & Clark. Board member of the Harding Loevner Funds from 1996 to 2014, serving as both Lead Independent Director and chair of the Audit Committee. Board member of the Russell Exchange Traded Funds Trust from 2011 to 2012 and the chair of the Audit Committee. Ms. Freeman is also an inactive Chartered Financial Analyst. | | N/A |
| | | |
Isaiah Harris, Jr. (Born 1952) | | Trustee, since 2009; Audit Committee Chair, since 2019 | | Retired. Chairman of the Board of CIGNA Corporation since 2009, and Director since 2005. From 2003 to 2011, Director of Deluxe Corporation. Prior thereto, President and CEO of BellSouth Advertising and Publishing Corp. from 2005 to 2007, President and CEO of BellSouth Enterprises from 2004 to 2005 and President of BellSouth Consumer Services from 2000 to 2003. Emeritus member of the Iowa State University Foundation Board of Governors. Emeritus Member of the Advisory Board of Iowa State University School of Business. Advisory Board Member, Palm Harbor Academy (private school). Mr. Harris is a certified public accountant (inactive status). | | CIGNA Corporation |
| | | |
Judith M. Johnson (Born 1949) | | Trustee, since 2008 | | Retired. Prior thereto, Chief Executive Officer and Chief Investment Officer of Minneapolis Employees Retirement Fund from 1996 to 2008. Ms. Johnson is an attorney, certified public accountant and a certified managerial accountant. | | N/A |
| | | |
David F. Larcker (Born 1950) | | Trustee, since 2009 | | James Irvin Miller Professor of Accounting at the Graduate School of Business (Emeritus), Stanford University, Director of the Corporate Governance Research Initiative and Senior Faculty of The Rock Center for Corporate Governance since 2006. From 2005 to 2008, Professor of Accounting at the Graduate School of Business, Stanford University. Prior thereto, Ernst & Young Professor of Accounting at The Wharton School, University of Pennsylvania from 1985 to 2005. | | N/A |
Wells Fargo Diversified Equity Fund | 21
Other information (unaudited)
| | | | | | |
Name and year of birth | | Position held and
length of service* | | Principal occupations during past five years or longer | | Current other
public company or
investment
company
directorships |
| | | |
Olivia S. Mitchell (Born 1953) | | Trustee, since 2006; Nominating and Governance Committee Chair, since 2018 | | International Foundation of Employee Benefit Plans Professor, Wharton School of the University of Pennsylvania since 1993. Director of Wharton’s Pension Research Council and Boettner Center on Pensions & Retirement Research, and Research Associate at the National Bureau of Economic Research. Previously, Cornell University Professor from 1978 to 1993. | | N/A |
| | | |
Timothy J. Penny (Born 1951) | | Trustee, since 1996; Chair, since 2018 | | President and Chief Executive Officer of Southern Minnesota Initiative Foundation, a non-profit organization, since 2007. Member of the Board of Trustees of NorthStar Education Finance, Inc., a non-profit organization, since 2007. | | N/A |
| | | |
James G. Polisson (Born 1959) | | Trustee, since 2018 | | Retired. Chief Marketing Officer, Source (ETF) UK Services, Ltd, from 2015 to 2017. From 2012 to 2015, Principal of The Polisson Group, LLC, a management consulting, corporate advisory and principal investing company. Chief Executive Officer and Managing Director at Russell Investments, Global Exchange Traded Funds from 2010 to 2012. Managing Director of Barclays Global Investors from 1998 to 2010 and Global Chief Marketing Officer for iShares and Barclays Global Investors from 2000 to 2010. Trustee of the San Francisco Mechanics’ Institute, a non-profit organization, from 2013 to 2015. Board member of the Russell Exchange Traded Fund Trust from 2011 to 2012. Director of Barclays Global Investors Holdings Deutschland GmbH from 2006 to 2009. Mr. Polisson is an attorney and has a retired status with the Massachusetts and District of Columbia Bar Associations. | | N/A |
| | | |
Pamela Wheelock (Born 1959) | | Trustee, since January 2020; previously Trustee from January 2018 to July 2019 | | Board member of the Destination Medical Center Economic Development Agency, Rochester, Minnesota since 2019. Interim President of the McKnight Foundation from January to September 2020. Acting Commissioner, Minnesota Department of Human Services, July 2019 through September 2019. Human Services Manager (part-time), Minnesota Department of Human Services, October 2019 through December 2019. Chief Operating Officer, Twin Cities Habitat for Humanity from 2017 to 2019. Vice President of University Services, University of Minnesota from 2012 to 2016. Prior thereto, on the Board of Directors, Governance Committee and Finance Committee for the Minnesota Philanthropy Partners (Saint Paul Foundation) from 2012 to 2018, Interim Chief Executive Officer of Blue Cross Blue Shield of Minnesota from 2011 to 2012, Chairman of the Board from 2009 to 2012 and Board Director from 2003 to 2015. Vice President, Leadership and Community Engagement, Bush Foundation, Saint Paul, Minnesota (a private foundation) from 2009 to 2011. Executive Vice President and Chief Financial Officer, Minnesota Sports and Entertainment from 2004 to 2009 and Senior Vice President from 2002 to 2004. Executive Vice President of the Minnesota Wild Foundation from 2004 to 2008. Commissioner of Finance, State of Minnesota, from 1999 to 2002. Currently Board Chair of the Minnesota Wild Foundation since 2010. | | N/A |
| * | Length of service dates reflect the Trustee’s commencement of service with the Trust’s predecessor entities, where applicable. |
22 | Wells Fargo Diversified Equity Fund
Other information (unaudited)
Officers
| | | | |
Name and
year of birth | | Position held and
length of service | | Principal occupations during past five years or longer |
| | |
Andrew Owen (Born 1960) | | President, since 2017 | | Executive Vice President of Wells Fargo & Company and Head of Affiliated Managers, Wells Fargo Asset Management, since 2014. In addition, Mr. Owen is currently President, Chief Executive Officer and Director of Wells Fargo Funds Management, LLC since 2017. Prior thereto, Executive Vice President responsible for marketing, investments and product development for Wells Fargo Funds Management, LLC, from 2009 to 2014. |
| | |
Nancy Wiser1 (Born 1967) | | Treasurer, since 2012 | | Executive Vice President of Wells Fargo Funds Management, LLC since 2011. Chief Operating Officer and Chief Compliance Officer at LightBox Capital Management LLC, from 2008 to 2011. |
| | |
Michelle Rhee (Born 1966) | | Chief Legal Officer, since 2019 | | Secretary of Wells Fargo Funds Management, LLC and Chief Legal Counsel of Wells Fargo Asset Management since 2018. Deputy General Counsel of Wells Fargo Bank, N.A. since 2020 and Assistant General Counsel of Wells Fargo Bank, N.A. from 2018 to 2020. Associate General Counsel and Managing Director of Bank of America Corporation from 2004 to 2018. |
| | |
Catherine Kennedy (Born 1969) | | Secretary, since 2019 | | Vice President of Wells Fargo Funds Management, LLC and Senior Counsel of the Wells Fargo Legal Department since 2010. Vice President and Senior Counsel of Evergreen Investment Management Company, LLC from 1998 to 2010. |
| | |
Michael H. Whitaker (Born 1967) | | Chief Compliance Officer, since 2016 | | Chief Compliance Officer of Wells Fargo Asset Management since 2016. Senior Vice President and Chief Compliance Officer for Fidelity Investments from 2007 to 2016. |
| | |
Jeremy DePalma1 (Born 1974) | | Assistant Treasurer, since 2009 | | Senior Vice President of Wells Fargo Funds Management, LLC since 2009. Senior Vice President of Evergreen Investment Management Company, LLC from 2008 to 2010 and head of the Fund Reporting and Control Team within Fund Administration from 2005 to 2010. |
| 1 | Nancy Wiser acts as Treasurer of 67 funds in the Fund Complex. Jeremy DePalma acts as the Treasurer of 77 funds and Assistant Treasurer of 67 funds in the Fund Complex. |
| 2 | The Statement of Additional Information includes additional information about the Trustees and is available, without charge, upon request, by calling 1-800-222-8222 or by visiting the website at wfam.com. |
Wells Fargo Diversified Equity Fund | 23
This page is intentionally left blank.

For more information
More information about Wells Fargo Funds is available free upon request. To obtain literature, please write, visit the Fund’s website, or call:
Wells Fargo Funds
P.O. Box 219967
Kansas City, MO 64121-9967
Website: wfam.com
Individual investors: 1-800-222-8222
Retail investment professionals: 1-888-877-9275
Institutional investment professionals: 1-866-765-0778

This report and the financial statements contained herein are submitted for the general information of the shareholders of the Fund. If this report is used for promotional purposes, distribution of the report must be accompanied or preceded by a current prospectus. Before investing, please consider the investment objectives, risks, charges, and expenses of the investment. For a current prospectus and, if available, a summary prospectus, containing this information, call 1-800-222-8222 or visit the Fund’s website at wfam.com. Read the prospectus carefully before you invest or send money.
Wells Fargo Asset Management (WFAM) is the trade name for certain investment advisory/management firms owned by Wells Fargo & Company. These firms include but are not limited to Wells Capital Management Incorporated and Wells Fargo Funds Management, LLC. Certain products managed by WFAM entities are distributed by Wells Fargo Funds Distributor, LLC (a broker-dealer and Member FINRA).
This material is for general informational and educational purposes only and is NOT intended to provide investment advice or a recommendation of any kind—including a recommendation for any specific investment, strategy, or plan.
INVESTMENT PRODUCTS: NOT FDIC INSURED ◾ NO BANK GUARANTEE ◾ MAY LOSE VALUE
© 2021 Wells Fargo & Company. All rights reserved.
PAR-1220-00740 01-20
SA281/SAR281 11-20
Semi-Annual Report
November 30, 2020
Wells Fargo Emerging Growth Fund
|
|
|
Reduce clutter. Save trees. |
Sign up for electronic delivery of prospectuses and shareholder reports at wellsfargo.com/
advantagedelivery |
The views expressed and any forward-looking statements are as of November 30, 2020, unless otherwise noted, and are those of the Fund’s portfolio managers and/or Wells Fargo Asset Management. Discussions of individual securities, or the markets generally, or any Wells Fargo Fund are not intended as individual recommendations. Future events or results may vary significantly from those expressed in any forward-looking statements. The views expressed are subject to change at any time in response to changing circumstances in the market. Wells Fargo Asset Management and the Fund disclaim any obligation to publicly update or revise any views expressed or forward-looking statements.
INVESTMENT PRODUCTS: NOT FDIC INSURED ◾ NO BANK GUARANTEE ◾ MAY LOSE VALUE
Wells Fargo Emerging Growth Fund | 1
Letter to shareholders (unaudited)

Andrew Owen
President
Wells Fargo Funds
“Global stock markets rallied strongly, driven by aggressive stimulus measures introduced by central banks and governments in response to challenges presented by the COVID-19 pandemic.”
Dear Shareholder:
We are pleased to offer you this semi-annual report for the Wells Fargo Emerging Growth Fund for the six-month period that ended November 30, 2020. Global stock markets rallied strongly, driven by aggressive stimulus measures introduced by central banks and governments in response to challenges presented by the COVID-19 pandemic. Emerging market equities had particularly robust results during the six-month period. Among bonds, high-yield issues led the way while U.S. bonds generally had more modest returns than their international counterparts.
For the period, U.S. stocks, based on the S&P 500 Index,1 returned 19.98% and international stocks, as measured by the MSCI ACWI ex USA Index (Net),2 gained 23.28%. The MSCI EM Index (Net)3 rallied 31.14%. Among bond investments, the Bloomberg Barclays U.S. Aggregate Bond Index4 returned a modest 1.79%, the Bloomberg Barclays Global Aggregate ex-USD Index5 gained a robust 8.19%, the Bloomberg Barclays Municipal Bond Index6 had a 3.29% return, and the ICE BofA U.S. High Yield Index7 gained a healthy 10.47%.
Equities enjoyed a strong tailwind from monetary and fiscal stimulus.
Financial markets posted widely positive returns in June despite ongoing economic weakness and uncertainty regarding COVID-19 and the timing of an effective vaccine. As economies reopened, optimism rose. Vitally important to market sentiment was the ongoing global central bank commitment to provide economic support through liquidity and low borrowing costs. U.S. economic activity was boosted by one-time $1,200 stimulus checks and $600 weekly bonus unemployment benefits for tens of millions of Americans through July. However, jobless rates remained historically high, easing somewhat from 14.7% in April to 11.1% in June. By late June, numerous states reported increases of COVID-19 cases, an ominous sign. China’s economic recovery picked up momentum in June.
July was broadly positive for both global equities and fixed income. However, economic data and a resurgence of COVID-19 cases pointed to the vulnerability of the global economy and the need to regain control of the pandemic. Second-quarter gross domestic product (GDP) shrank from the previous quarter by 9.5% and 12.1% in the U.S. and the eurozone, respectively. In contrast, China reported 3.2% year-over-year second-quarter GDP growth. U.S. unemployment remained high despite adding 1.8 million jobs in July, as a double-digit jobless rate persisted. However, manufacturing activity grew in both the U.S. and the eurozone. In Asia, while China’s manufacturing sector continued to expand, activity in Japan and South Korea contracted. A rising concern was the rapid and broad reemergence of COVID-19 infections.
| 1 | The S&P 500 Index consists of 500 stocks chosen for market size, liquidity, and industry group representation. It is a market-value-weighted index with each stock’s weight in the index proportionate to its market value. You cannot invest directly in an index. |
| 2 | The Morgan Stanley Capital International (MSCI) All Country World Index (ACWI) ex USA Index (Net) is a free-float-adjusted market-capitalization-weighted index that is designed to measure the equity market performance of developed and emerging markets, excluding the United States. Source: MSCI. MSCI makes no express or implied warranties or representations and shall have no liability whatsoever with respect to any MSCI data contained herein. The MSCI data may not be further redistributed or used as a basis for other indices or any securities or financial products. This report is not approved, reviewed, or produced by MSCI. You cannot invest directly in an index. |
| 3 | The MSCI Emerging Markets (EM) Index (Net) is a free-float-adjusted market-capitalization-weighted index that is designed to measure equity market performance of emerging markets. You cannot invest directly in an index. |
| 4 | The Bloomberg Barclays U.S. Aggregate Bond Index is a broad-based benchmark that measures the investment-grade, U.S. dollar-denominated, fixed-rate taxable bond market, including Treasuries, government-related and corporate securities, mortgage-backed securities (agency fixed-rate and hybrid adjustable-rate mortgage pass-throughs), asset-backed securities, and commercial mortgage-backed securities. You cannot invest directly in an index. |
| 5 | The Bloomberg Barclays Global Aggregate ex-USD Index is an unmanaged index that provides a broad-based measure of the global investment-grade fixed-income markets excluding the U.S. dollar-denominated debt market. You cannot invest directly in an index. |
| 6 | The Bloomberg Barclays Municipal Bond Index is an unmanaged index composed of long-term tax-exempt bonds with a minimum credit rating of Baa. You cannot invest directly in an index. |
| 7 | The ICE BofA U.S. High Yield Index is a market-capitalization-weighted index of domestic and Yankee high-yield bonds. The index tracks the performance of high-yield securities traded in the U.S. bond market. You cannot invest directly in an index. Copyright 2021. ICE Data Indices, LLC. All rights reserved. |
2 | Wells Fargo Emerging Growth Fund
Letter to shareholders (unaudited)
The stock market continued to rally in August despite concerns over rising COVID-19 cases in the U.S. and Europe, as well as the expiration of the $600 weekly bonus unemployment benefit in July. Generally stronger-than-expected second-quarter earnings boosted investor sentiment along with the Federal Reserve’s announcement of a more accommodative policy shift that could lead to longer-term low interest rates. U.S. indices measuring manufacturing and services activities beat expectations while the U.S. housing market maintained strength. In Europe, retail sales expanded and consumer confidence was steady. China’s economy continued to expand.
Stocks grew more volatile in September on mixed economic data. U.S. economic activity continued to grow. However, only half of the 22 million jobs lost since the early spring had returned. The U.S. unemployment rate fell to 7.9% in September, a measurable improvement but far higher than the 3.5% pre-COVID-19 rate. Only 661,000 jobs were added for the month, down from 1.5 million in August. With the U.S. Congress failing to pass further fiscal relief and uncertainties surrounding a possible vaccine, doubts crept back into the markets. In the U.K., a lack of progress in Brexit talks with the European Union weighed on markets. China’s economy picked up steam, however, with growth fueled by increased global demand.
In October, capital markets took a step back from their six-month rally. Market volatility rose in advance of the U.S. election and amid a global increase in COVID-19 infections. Europe responded with more economic restrictions. Meanwhile, Brexit remained unresolved. U.S. markets looked favorably at a possible Democratic sweep and control of the federal purse strings in anticipation of additional fiscal stimulus, which could boost economic activity. Meanwhile, China continued to stand apart, reporting 4.9% third-quarter GDP growth year over year.
Global stocks rallied broadly in November, propelled by optimism over three promising COVID-19 vaccines, which reported high effectiveness in trials. Global stock indices notched double-digit monthly gains. In a reversal of recent trends, value stocks outperformed growth and cyclical stocks outpaced technology stocks. However, U.S. unemployment remained elevated, with a net job loss of 10 million since February. The Eurozone Services Purchasing Managers’ Index, a monthly survey of purchasing managers, contracted sharply while the region’s manufacturing activity gauge indicated growth. The U.S. election results added to the market’s upbeat mood as investors gave thumbs-up to the certainty of the outcome after an unusual delay and anticipated more consistent policies in the new administration.
Don’t let short-term uncertainty derail long-term investment goals.
Periods of investment uncertainty can present challenges, but experience has taught us that maintaining long-term investment goals can be an effective way to plan for the future. To help you create a sound strategy based on your personal goals and risk tolerance, Wells Fargo Funds offers more than 100 mutual funds spanning a wide range of asset classes and investment styles. Although diversification cannot guarantee an investment profit or prevent losses, we believe it can be an effective way to manage investment risk and potentially smooth out overall portfolio performance. We encourage investors to know their investments and to understand that appropriate levels of risk-taking may unlock opportunities.
Thank you for choosing to invest with Wells Fargo Funds. We appreciate your confidence in us and remain committed to helping you meet your financial needs.
Sincerely,

Andrew Owen
President
Wells Fargo Funds
“Global stocks rallied broadly in November, propelled by optimism over three promising COVID-19 vaccines, which reported high effectiveness in trials.”
|
|
|
For further information about your Fund, contact your investment professional, visit our website at wfam.com, or call us directly at 1-800-222-8222. |
Wells Fargo Emerging Growth Fund | 3
Letter to shareholders (unaudited)
Notice to Shareholders
At a meeting held on August 10-12, 2020, the Board of Trustees of the Fund approved a change to the Fund’s automatic conversion feature for Class C shares in order to shorten the required holding period from 10 to 8 years. As a result, on a monthly basis beginning November 5, 2020, Class C shares will convert automatically into Class A shares 8 years after the initial date of purchase or, if you acquired your Class C shares through an exchange or conversion from another share class, 8 years after the date you acquired your Class C shares. When Class C shares that you acquired through a purchase or exchange convert, any other Class C shares that you purchased with reinvested dividends and distributions also will convert into Class A shares on a pro rata basis.
Please note that a shorter holding period may apply depending on your intermediary. Please see “Appendix A—Sales Charge Reductions and Waivers for Certain Intermediaries” in the Fund’s prospectus for further information.
4 | Wells Fargo Emerging Growth Fund
This page is intentionally left blank.
Performance highlights (unaudited)
Investment objective
The Fund seeks long-term capital appreciation.
Manager
Wells Fargo Funds Management, LLC
Subadviser for the affiliated master portfolio1
Wells Capital Management Incorporated
Portfolio managers
Joseph M. Eberhardy, CFA®‡, CPA
Robert Gruendyke, CFA®‡*
David Nazaret, CFA®‡*
Thomas C. Ognar, CFA®‡
Average annual total returns (%) as of November 30, 2020
| | | | | | | | | | | | | | | | | | | | | | | | | | | | | | | | | | |
| | | | |
| | | | | Including sales charge | | | Excluding sales charge | | | Expense ratios2 (%) | |
| | | | | | | | | |
| | | Inception date | | 1 year | | | 5 year | | | 10 year | | | 1 year | | | 5 year | | | 10 year | | | Gross | | | Net3 | |
| | | | | | | | | | |
| Class A (WEMAX) | | 3-31-2008 | | | 38.55 | | | | 17.63 | | | | 14.93 | | | | 47.00 | | | | 19.03 | | | | 15.61 | | | | 1.35 | | | | 1.28 | |
| | | | | | | | | | |
| Class C (WEMCX) | | 3-31-2008 | | | 44.99 | | | | 18.14 | | | | 14.76 | | | | 45.99 | | | | 18.14 | | | | 14.76 | | | | 2.10 | | | | 2.03 | |
| | | | | | | | | | |
| Class R6 (WEGRX)4 | | 7-31-2018 | | | – | | | | – | | | | – | | | | 47.56 | | | | 19.59 | | | | 16.16 | | | | 0.92 | | | | 0.85 | |
| | | | | | | | | | |
| Administrator Class (WFGDX) | | 1-31-2007 | | | – | | | | – | | | | – | | | | 47.05 | | | | 19.14 | | | | 15.77 | | | | 1.27 | | | | 1.20 | |
| | | | | | | | | | |
| Institutional Class (WEMIX) | | 3-31-2008 | | | – | | | | – | | | | – | | | | 47.51 | | | | 19.51 | | | | 16.12 | | | | 1.02 | | | | 0.90 | |
| | | | | | | | | | |
| Russell 2000® Growth Index5 | | – | | | – | | | | – | | | | – | | | | 25.95 | | | | 13.19 | | | | 13.30 | | | | – | | | | – | |
Figures quoted represent past performance, which is no guarantee of future results, and do not reflect taxes that a shareholder may pay on an investment in a fund. Investment return and principal value of an investment will fluctuate so that an investor’s shares, when redeemed, may be worth more or less than their original cost. Performance shown without sales charges would be lower if sales charges were reflected. Current performance may be lower or higher than the performance data quoted, which assumes the reinvestment of dividends and capital gains. Current month-end performance is available on the Fund’s website, wfam.com.
Please keep in mind that high double-digit returns were primarily achieved during favorable market conditions. You should not expect that such favorable returns can be consistently achieved. A fund’s performance, especially for short time periods, should not be the sole factor in making your investment decision.
Index returns do not include transaction costs associated with buying and selling securities, any mutual fund fees or expenses, or any taxes. It is not possible to invest directly in an index.
For Class A shares, the maximum front-end sales charge is 5.75%. For Class C shares, the maximum contingent deferred sales charge is 1.00%. Performance including a contingent deferred sales charge assumes the sales charge for the corresponding time period. Class R6, Administrator Class, and Institutional Class shares are sold without a front-end sales charge or contingent deferred sales charge.
Stock values fluctuate in response to the activities of individual companies and general market and economic conditions. Smaller-company stocks tend to be more volatile and less liquid than those of larger companies. Certain investment strategies tend to increase the total risk of an investment (relative to the broader market). The Fund is exposed to foreign investment risk. Consult the Fund’s prospectus for additional information on these and other risks.
Please see footnotes on page 7.
6 | Wells Fargo Emerging Growth Fund
Performance highlights (unaudited)
| | | | |
|
| Ten largest holdings (%) as of November 30, 20206 | |
| | |
Q2 Holdings Incorporated | | | 3.10 | |
| | |
Kinsale Capital Group Incorporated | | | 2.94 | |
| | |
Casella Waste Systems Incorporated Class A | | | 2.78 | |
| | |
Rapid7 Incorporated | | | 2.70 | |
| | |
ASGN Incorporated | | | 2.64 | |
| | |
iRhythm Technologies Incorporated | | | 2.51 | |
| | |
SPS Commerce Incorporated | | | 2.47 | |
| | |
Rexnord Corporation | | | 2.42 | |
| | |
Shockwave Medical Incorporated | | | 2.11 | |
| | |
Novanta Incorporated | | | 2.07 | |
|
|
| Sector allocation as of November 30, 20207 |
|
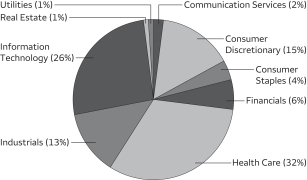 |
| ‡ | CFA® and Chartered Financial Analyst® are trademarks owned by CFA Institute. |
| * | Mr. Gruendyke and Mr. Nazaret became portfolio managers of the Fund on July 28, 2020. |
| 1 | The Fund is a feeder fund in a master-feeder structure that invests substantially all of its assets in a single affiliated master portfolio of the Wells Fargo Master Trust with a substantially identical investment objective and substantially similar investment strategies. References to the investment activities of the Fund are intended to refer to the investment activities of the affiliated master portfolio in which it invests. |
| 2 | Reflects the expense ratios as stated in the most recent prospectuses. The expense ratios shown are subject to change and may differ from the annualized expense ratios shown in the financial highlights of this report. |
| 3 | The manager has contractually committed through September 30, 2021, to waive fees and/or reimburse expenses to the extent necessary to cap total annual fund operating expenses after fee waivers at 1.28% for Class A, 2.03% for Class C, 0.85% for Class R6, 1.20% for Administrator Class, and 0.90% for Institutional Class. Brokerage commissions, stamp duty fees, interest, taxes, acquired fund fees and expenses (if any) from funds in which the affiliated master portfolios invest and from money market funds, and extraordinary expenses are excluded from the expense caps. Net expenses from the affiliated master portfolio are included in the expense caps. Prior to or after the commitment expiration date, the caps may be increased or the commitment to maintain the caps may be terminated only with the approval of the Board of Trustees. Without these caps, the Fund’s returns would have been lower. The expense ratio paid by an investor is the net expense ratio (the total annual fund operating expenses after fee waivers) as stated in the prospectuses. |
| 4 | Historical performance shown for the Class R6 shares prior to their inception reflects the performance of the Institutional Class shares, and includes the higher expenses applicable to the Institutional Class shares. If these expenses had not been included, returns for the Class R6 shares would be higher. |
| 5 | The Russell 2000® Growth Index measures the performance of those Russell 2000 companies with higher price/book ratios and higher forecasted growth values. You cannot invest directly in an index. |
| 6 | Each holding represents the Fund’s allocable portion of the affiliated master portfolio security. Figures represent each holding as a percentage of the Fund’s net assets. Holdings are subject to change and may have changed since the date specified. |
| 7 | Figures represent the sector allocation of the affiliated master portfolio as a percentage of the long-term investments of the affiliated master portfolio. These amounts are subject to change and may have changed since the date specified. |
Wells Fargo Emerging Growth Fund | 7
Fund expenses (unaudited)
As a shareholder of the Fund, you incur two types of costs: (1) transaction costs, including sales charges (loads) on
purchase payments and contingent deferred sales charges (if any) on redemptions and (2) ongoing costs, including
management fees, distribution (12b-1) and/or shareholder servicing fees, and other Fund expenses. This example is
intended to help you understand your ongoing costs (in dollars) of investing in the Fund and to compare these costs with
the ongoing costs of investing in other mutual funds.
The example is based on an investment of $1,000 invested at the beginning of the six-month period and held for the
entire period from June 1, 2020 to November 30, 2020.
Actual expenses
The “Actual” line of the table below provides information about actual account values and actual expenses. You may use
the information in this line, together with the amount you invested, to estimate the expenses that you paid over the
period. Simply divide your account value by $1,000 (for example, an $8,600 account value divided by $1,000 = 8.6), then
multiply the result by the number in the “Actual” line under the heading entitled “Expenses paid during period” for your
applicable class of shares to estimate the expenses you paid on your account during this period.
Hypothetical example for comparison purposes
The “Hypothetical” line of the table below provides information about hypothetical account values and hypothetical
expenses based on the Fund’s actual expense ratio and an assumed rate of return of 5% per year before expenses, which
is not the Fund’s actual return. The hypothetical account values and expenses may not be used to estimate the actual
ending account balance or expenses you paid for the period. You may use this information to compare the ongoing costs
of investing in the Fund and other funds. To do so, compare this 5% hypothetical example with the 5% hypothetical
examples that appear in the shareholder reports of the other funds.
Please note that the expenses shown in the table are meant to highlight your ongoing costs only and do not reflect any
transactional costs, such as sales charges (loads) and contingent deferred sales charges. Therefore, the “Hypothetical” line
of the table is useful in comparing ongoing costs only and will not help you determine the relative total costs of owning
different funds. In addition, if these transactional costs were included, your costs would have been higher.
| | | | | | | | | | | | | | | | |
| | | Beginning
account value
6-1-2020 | | | Ending
account value
11-30-2020 | | | Expenses paid during the period1,2 | | | Annualized net
expense ratio1 | |
| | | | | |
Class A | | | | | | | | | | | | | | | | |
| | | | |
Actual | | $ | 1,000.00 | | | $ | 1,382.73 | | | $ | 7.59 | | | | 1.27 | % |
| | | | |
Hypothetical (5% return before expenses) | | $ | 1,000.00 | | | $ | 1,018.70 | | | $ | 6.43 | | | | 1.27 | % |
| | | | | |
Class C | | | | | | | | | | | | | | | | |
| | | | |
Actual | | $ | 1,000.00 | | | $ | 1,378.23 | | | $ | 12.10 | | | | 2.03 | % |
| | | | |
Hypothetical (5% return before expenses) | | $ | 1,000.00 | | | $ | 1,014.89 | | | $ | 10.25 | | | | 2.03 | % |
| | | | | |
Class R6 | | | | | | | | | | | | | | | | |
| | | | |
Actual | | $ | 1,000.00 | | | $ | 1,384.94 | | | $ | 5.08 | | | | 0.85 | % |
| | | | |
Hypothetical (5% return before expenses) | | $ | 1,000.00 | | | $ | 1,020.81 | | | $ | 4.31 | | | | 0.85 | % |
| | | | | |
Administrator Class | | | | | | | | | | | | | | | | |
| | | | |
Actual | | $ | 1,000.00 | | | $ | 1,382.76 | | | $ | 7.17 | | | | 1.20 | % |
| | | | |
Hypothetical (5% return before expenses) | | $ | 1,000.00 | | | $ | 1,019.05 | | | $ | 6.07 | | | | 1.20 | % |
| | | | | |
Institutional Class | | | | | | | | | | | | | | | | |
| | | | |
Actual | | $ | 1,000.00 | | | $ | 1,384.28 | | | $ | 5.38 | | | | 0.90 | % |
| | | | |
Hypothetical (5% return before expenses) | | $ | 1,000.00 | | | $ | 1,020.56 | | | $ | 4.56 | | | | 0.90 | % |
| 1 | Amounts reflect net expenses allocated from the affiliated Master Portfolio in which the Fund invests. |
| 2 | Expenses paid is equal to the annualized net expense ratio of each class multiplied by the average account value over the period, multiplied by the number of days in the most recent fiscal half-year divided by the number of days in the fiscal year (to reflect the one-half-year period). |
8 | Wells Fargo Emerging Growth Fund
Portfolio of investments—November 30, 2020 (unaudited)
| | | | | | | | | | | | | | | | |
| | | | | | | | | | | | Value | |
| Investment Companies: 100.36% | |
|
| Affiliated Master Portfolio: 100.36% | |
Wells Fargo Emerging Growth Portfolio | | | | | | | | | | | | | | $ | 819,507,074 | |
| | | | | | | | | | | | | | | | |
| |
Total Investment Companies (Cost $458,351,848) | | | | 819,507,074 | |
| | | | | | | | | | | | | | | | |
| | | | | | | | |
| Total investments in securities (Cost $458,351,848) | | | 100.36 | % | | | 819,507,074 | |
| | |
Other assets and liabilities, net | | | (0.36 | ) | | | (2,946,306 | ) |
| | | | | | | | |
| Total net assets | | | 100.00 | % | | $ | 816,560,768 | |
| | | | | | | | |
Transactions with the affiliated Master Portfolio were as follows:
| | | | | | | | | | | | | | | | | | | | | | | | | | | | | | | | | | | | |
| | | % of ownership,
beginning of period | | | % of
ownership,
end of
period | | | Net realized
gains
(losses) on
securities
transactions
allocated
from
affiliated
Master
Portfolio | | | Net change in
unrealized
gains
(losses) on
securities
transactions
allocated
from
affiliated
Master
Portfolio | | | Dividends
allocated
from
affiliated
Master
Portfolio | | | Securities
lending
income
allocated
from
affiliated
Master
Portfolio | | | Affiliated
income
allocated
from
affiliated
Master
Portfolio | | | Value,
end of period | | | % of
net
assets | |
Wells Fargo Emerging Growth Portfolio | | | 92 | % | | | 96 | % | | $ | 103,174,672 | | | $ | 138,740,188 | | | $ | 997,824 | | | $ | 115,885 | | | $ | 2,004 | | | $ | 819,507,074 | | | | 100.36 | % |
The accompanying notes are an integral part of these financial statements.
Wells Fargo Emerging Growth Fund | 9
Statement of assets and liabilities—November 30, 2020 (unaudited)
| | | | |
| | | | |
| |
Assets | | | | |
Investments in affiliated Master Portfolio, at value (cost $458,351,848) | | $ | 819,507,074 | |
Receivable for Fund shares sold | | | 1,441,729 | |
Receivable from manager | | | 36,934 | |
Prepaid expenses and other assets | | | 23,504 | |
| | | | |
Total assets | | | 821,009,241 | |
| | | | |
| |
Liabilities | | | | |
Payable for Fund shares redeemed | | | 4,195,692 | |
Administration fees payable | | | 94,100 | |
Distribution fee payable | | | 1,166 | |
Trustees’ fees and expenses payable | | | 1,031 | |
Accrued expenses and other liabilities | | | 156,484 | |
| | | | |
Total liabilities | | | 4,448,473 | |
| | | | |
Total net assets | | $ | 816,560,768 | |
| | | | |
| |
Net assets consist of | | | | |
Paid-in capital | | $ | 293,125,475 | |
Total distributable earnings | | | 523,435,293 | |
| | | | |
Total net assets | | $ | 816,560,768 | |
| | | | |
| |
Computation of net asset value and offering price per share | | | | |
Net assets – Class A | | $ | 199,318,877 | |
Shares outstanding – Class A1 | | | 9,802,127 | |
Net asset value per share – Class A | | | $20.33 | |
Maximum offering price per share – Class A2 | | | $21.57 | |
Net assets – Class C | | $ | 1,976,306 | |
Shares outstanding – Class C1 | | | 115,615 | |
Net asset value per share – Class C | | | $17.09 | |
Net assets – Class R6 | | $ | 23,046,817 | |
Shares outstanding – Class R61 | | | 1,018,623 | |
Net asset value per share – Class R6 | | | $22.63 | |
Net assets – Administrator Class | | $ | 26,225,575 | |
Shares outstanding – Administrator Class1 | | | 1,239,080 | |
Net asset value per share – Administrator Class | | | $21.17 | |
Net assets – Institutional Class | | $ | 565,993,193 | |
Shares outstanding – Institutional Class1 | | | 25,096,258 | |
Net asset value per share – Institutional Class | | | $22.55 | |
| 1 | The Fund has an unlimited number of authorized shares. |
| 2 | Maximum offering price is computed as 100/94.25 of net asset value. On investments of $50,000 or more, the offering price is reduced. |
The accompanying notes are an integral part of these financial statements.
10 | Wells Fargo Emerging Growth Fund
Statement of operations—six months ended November 30, 2020 (unaudited)
| | | | |
| | | | |
| |
Investment income | | | | |
Dividends allocated from affiliated Master Portfolio | | $ | 997,824 | |
Securities lending income allocated from affiliated Master Portfolio | | | 115,885 | |
Affiliated income allocated from affiliated Master Portfolio | | | 2,004 | |
Expenses allocated from affiliated Master Portfolio | | | (2,978,107 | ) |
| | | | |
Total investment income | | | (1,862,394 | ) |
| | | | |
| |
Expenses | | | | |
Management fee | | | 183,640 | |
Administration fees | |
Class A | | | 180,205 | |
Class C | | | 1,904 | |
Class R6 | | | 3,311 | |
Administrator Class | | | 15,235 | |
Institutional Class | | | 335,148 | |
Shareholder servicing fees | |
Class A | | | 214,134 | |
Class C | | | 2,263 | |
Administrator Class | | | 29,200 | |
Distribution fee | |
Class C | | | 6,788 | |
Custody and accounting fees | | | 14,053 | |
Professional fees | | | 15,831 | |
Registration fees | | | 37,070 | |
Shareholder report expenses | | | 43,549 | |
Trustees’ fees and expenses | | | 11,029 | |
Other fees and expenses | | | 7,957 | |
| | | | |
Total expenses | | | 1,101,317 | |
Less: Fee waivers and/or expense reimbursements | |
Fund-level | | | (279,449 | ) |
Class A | | | (10,701 | ) |
Administrator Class | | | (4 | ) |
Institutional Class | | | (128,551 | ) |
| | | | |
Net expenses | | | 682,612 | |
| | | | |
Net investment loss | | | (2,545,006 | ) |
| | | | |
| |
Realized and unrealized gains (losses) on investments | | | | |
Net realized gains on securities transactions allocated from affiliated Master Portfolio | | | 103,174,672 | |
Net change in unrealized gains (losses) on securities transactions allocated from affiliated Master Portfolio | | | 138,740,188 | |
| | | | |
Net realized and unrealized gains (losses) on investments | | | 241,914,860 | |
| | | | |
Net increase in net assets resulting from operations | | $ | 239,369,854 | |
| | | | |
The accompanying notes are an integral part of these financial statements.
Wells Fargo Emerging Growth Fund | 11
Statement of changes in net assets
| | | | | | | | | | | | | | | | |
| | | Six months ended
November 30, 2020
(unaudited) | | | Year ended
May 31, 2020 | |
| | | | |
Operations | | | | | | | | | | | | | | | | |
Net investment loss | | | | | | $ | (2,545,006 | ) | | | | | | $ | (5,696,248 | ) |
Net realized gains on investments | | | | | | | 103,174,672 | | | | | | | | 87,082,930 | |
Net change in unrealized gains (losses) on investments | | | | | | | 138,740,188 | | | | | | | | 4,916,772 | |
| | | | |
Net increase in net assets resulting from operations | | | | | | | 239,369,854 | | | | | | | | 86,303,454 | |
| | | | |
| | | | |
Distributions to shareholders from net investment income and net realized gains | | | | | | | | | | | | | | | | |
Class A | | | | | | | 0 | | | | | | | | (7,796,239 | ) |
Class C | | | | | | | 0 | | | | | | | | (97,557 | ) |
Class R6 | | | | | | | 0 | | | | | | | | (245,756 | ) |
Administrator Class | | | | | | | 0 | | | | | | | | (1,143,908 | ) |
Institutional Class | | | | | | | 0 | | | | | | | | (28,466,003 | ) |
| | | | |
Total distributions to shareholders | | | | | | | 0 | | | | | | | | (37,749,463 | ) |
| | | | |
| | | | |
Capital share transactions | | | Shares | | | | | | | | Shares | | | | | |
Proceeds from shares sold | | | | | | | | | | | | | | | | |
Class A | | | 164,800 | | | | 2,821,041 | | | | 270,025 | | | | 3,503,910 | |
Class C | | | 8,691 | | | | 133,350 | | | | 14,056 | | | | 158,468 | |
Class R6 | | | 91,894 | | | | 1,866,543 | | | | 1,351,041 | | | | 21,252,448 | |
Administrator Class | | | 102,737 | | | | 1,876,789 | | | | 185,559 | | | | 2,546,018 | |
Institutional Class | | | 3,991,970 | | | | 74,436,514 | | | | 7,701,460 | | | | 113,827,845 | |
| | | | |
| | | | | | | 81,134,237 | | | | | | | | 141,288,689 | |
| | | | |
Reinvestment of distributions | | | | | | | | | | | | | | | | |
Class A | | | 0 | | | | 0 | | | | 556,631 | | | | 7,609,147 | |
Class C | | | 0 | | | | 0 | | | | 8,439 | | | | 97,557 | |
Class R6 | | | 0 | | | | 0 | | | | 16,154 | | | | 244,735 | |
Administrator Class | | | 0 | | | | 0 | | | | 80,016 | | | | 1,137,821 | |
Institutional Class | | | 0 | | | | 0 | | | | 1,832,144 | | | | 27,683,692 | |
| | | | |
| | | | | | | 0 | | | | | | | | 36,772,952 | |
| | | | |
Payment for shares redeemed | | | | | | | | | | | | | | | | |
Class A | | | (481,467 | ) | | | (8,260,572 | ) | | | (1,506,830 | ) | | | (19,951,780 | ) |
Class C | | | (22,037 | ) | | | (344,401 | ) | | | (45,564 | ) | | | (513,234 | ) |
Class R6 | | | (264,384 | ) | | | (5,497,178 | ) | | | (177,590 | ) | | | (2,654,701 | ) |
Administrator Class | | | (251,828 | ) | | | (4,519,328 | ) | | | (557,050 | ) | | | (7,634,612 | ) |
Institutional Class | | | (7,845,230 | ) | | | (148,006,505 | ) | | | (19,569,429 | ) | | | (282,480,504 | ) |
| | | | |
| | | | | | | (166,627,984 | ) | | | | | | | (313,234,831 | ) |
| | | | |
Net decrease in net assets resulting from capital share transactions | | | | | | | (85,493,747 | ) | | | | | | | (135,173,190 | ) |
| | | | |
Total increase (decrease) in net assets | | | | | | | 153,876,107 | | | | | | | | (86,619,199 | ) |
| | | | |
| | | | |
Net assets | | | | | | | | | | | | | | | | |
Beginning of period | | | | | | | 662,684,661 | | | | | | | | 749,303,860 | |
| | | | |
End of period | | | | | | $ | 816,560,768 | | | | | | | $ | 662,684,661 | |
| | | | |
The accompanying notes are an integral part of these financial statements.
12 | Wells Fargo Emerging Growth Fund
Financial highlights
(For a share outstanding throughout each period)
| | | | | | | | | | | | | | | | | | | | | | | | |
| | | Six months ended
November 30, 2020
(unaudited) | | | Year ended May 31 | |
| CLASS A | | 2020 | | | 2019 | | | 2018 | | | 2017 | | | 2016 | |
Net asset value, beginning of period | | | $14.71 | | | | $13.51 | | | | $17.04 | | | | $14.57 | | | | $12.55 | | | | $16.70 | |
Net investment loss | | | (0.10 | ) | | | (0.17 | ) | | | (0.16 | )1 | | | (0.15 | ) | | | (0.10 | )1 | | | (0.13 | )1 |
Net realized and unrealized gains (losses) on investments | | | 5.72 | | | | 2.13 | | | | (0.19 | ) | | | 4.57 | | | | 2.96 | | | | (2.28 | ) |
| | | | | | | | | | | | | | | | | | | | | | | | |
Total from investment operations | | | 5.62 | | | | 1.96 | | | | (0.35 | ) | | | 4.42 | | | | 2.86 | | | | (2.41 | ) |
Distributions to shareholders from | | | | | | | | | | | | | | | | | | | | | | | | |
Net realized gains | | | 0.00 | | | | (0.76 | ) | | | (3.18 | ) | | | (1.95 | ) | | | (0.84 | ) | | | (1.74 | ) |
Net asset value, end of period | | | $20.33 | | | | $14.71 | | | | $13.51 | | | | $17.04 | | | | $14.57 | | | | $12.55 | |
Total return2 | | | 38.27 | % | | | 14.97 | % | | | (0.84 | )% | | | 32.91 | % | | | 23.39 | % | | | (14.94 | )% |
Ratios to average net assets (annualized) | | | | | | | | | | | | | | | | | | | | | | | | |
Gross expenses3 | | | 1.36 | % | | | 1.36 | % | | | 1.35 | % | | | 1.36 | % | | | 1.36 | % | | | 1.35 | % |
Net expenses3 | | | 1.27 | % | | | 1.27 | % | | | 1.29 | % | | | 1.35 | % | | | 1.35 | % | | | 1.35 | % |
Net investment loss3 | | | (0.96 | )% | | | (1.08 | )% | | | (1.06 | )% | | | (1.01 | )% | | | (0.72 | )% | | | (0.92 | )% |
Supplemental data | | | | | | | | | | | | | | | | | | | | | | | | |
Portfolio turnover rate4 | | | 25 | % | | | 55 | % | | | 71 | % | | | 47 | % | | | 115 | % | | | 68 | % |
Net assets, end of period (000s omitted) | | | $199,319 | | | | $148,866 | | | | $145,898 | | | | $153,526 | | | | $129,724 | | | | $127,154 | |
| 1 | Calculated based upon average shares outstanding |
| 2 | Total return calculations do not include any sales charges. Returns for periods of less than one year are not annualized. |
| 3 | Ratios include net expenses allocated from the affiliated Master Portfolio which were as follows: |
| | | | |
Six months ended November 30, 2020 (unaudited) | | | 0.81 | % |
Year ended May 31, 2020 | | | 0.81 | % |
Year ended May 31, 2019 | | | 0.81 | % |
Year ended May 31, 2018 | | | 0.81 | % |
Year ended May 31, 2017 | | | 0.81 | % |
Year ended May 31, 2016 | | | 0.80 | % |
| 4 | Portfolio turnover rate is calculated by multiplying the affiliated Master Portfolio’s percentage of the Fund’s total investments in securities at the end of the period by the affiliated Master Portfolio’s portfolio turnover rate. |
The accompanying notes are an integral part of these financial statements.
Wells Fargo Emerging Growth Fund | 13
Financial highlights
(For a share outstanding throughout each period)
| | | | | | | | | | | | | | | | | | | | | | | | |
| | | Six months ended
November 30, 2020
(unaudited) | | | Year ended May 31 | |
| CLASS C | | 2020 | | | 2019 | | | 2018 | | | 2017 | | | 2016 | |
Net asset value, beginning of period | | | $12.40 | | | | $11.58 | | | | $15.19 | | | | $13.28 | | | | $11.58 | | | | $15.67 | |
Net investment loss | | | (0.13 | )1 | | | (0.21 | )1 | | | (0.25 | )1 | | | (0.25 | )1 | | | (0.19 | )1 | | | (0.21 | ) |
Net realized and unrealized gains (losses) on investments | | | 4.82 | | | | 1.79 | | | | (0.18 | ) | | | 4.11 | | | | 2.73 | | | | (2.14 | ) |
| | | | | | | | | | | | | | | | | | | | | | | | |
Total from investment operations | | | 4.69 | | | | 1.58 | | | | (0.43 | ) | | | 3.86 | | | | 2.54 | | | | (2.35 | ) |
Distributions to shareholders from | | | | | | | | | | | | | | | | | | | | | | | | |
Net realized gains | | | 0.00 | | | | (0.76 | ) | | | (3.18 | ) | | | (1.95 | ) | | | (0.84 | ) | | | (1.74 | ) |
Net asset value, end of period | | | $17.09 | | | | $12.40 | | | | $11.58 | | | | $15.19 | | | | $13.28 | | | | $11.58 | |
Total return2 | | | 37.82 | % | | | 14.16 | % | | | (1.55 | )% | | | 31.82 | % | | | 22.56 | % | | | (15.59 | )% |
Ratios to average net assets (annualized) | | | | | | | | | | | | | | | | | | | | | | | | |
Gross expenses3 | | | 2.11 | % | | | 2.11 | % | | | 2.10 | % | | | 2.11 | % | | | 2.11 | % | | | 2.10 | % |
Net expenses3 | | | 2.03 | % | | | 2.03 | % | | | 2.04 | % | | | 2.10 | % | | | 2.10 | % | | | 2.10 | % |
Net investment loss3 | | | (1.73 | )% | | | (1.84 | )% | | | (1.78 | )% | | | (1.76 | )% | | | (1.46 | )% | | | (1.70 | )% |
Supplemental data | | | | | | | | | | | | | | | | | | | | | | | | |
Portfolio turnover rate4 | | | 25 | % | | | 55 | % | | | 71 | % | | | 47 | % | | | 115 | % | | | 68 | % |
Net assets, end of period (000s omitted) | | | $1,976 | | | | $1,599 | | | | $1,761 | | | | $4,190 | | | | $3,328 | | | | $3,815 | |
| 1 | Calculated based upon average shares outstanding |
| 2 | Total return calculations do not include any sales charges. Returns for periods of less than one year are not annualized. |
| 3 | Ratios include net expenses allocated from the affiliated Master Portfolio which were as follows: |
| | | | |
Six months ended November 30, 2020 (unaudited) | | | 0.81 | % |
Year ended May 31, 2020 | | | 0.81 | % |
Year ended May 31, 2019 | | | 0.81 | % |
Year ended May 31, 2018 | | | 0.81 | % |
Year ended May 31, 2017 | | | 0.81 | % |
Year ended May 31, 2016 | | | 0.80 | % |
| 4 | Portfolio turnover rate is calculated by multiplying the affiliated Master Portfolio’s percentage of the Fund’s total investments in securities at the end of the period by the affiliated Master Portfolio’s portfolio turnover rate. |
The accompanying notes are an integral part of these financial statements.
14 | Wells Fargo Emerging Growth Fund
Financial highlights
(For a share outstanding throughout each period)
| | | | | | | | | | | | |
| | | Six months ended
November 30, 2020
(unaudited) | | | Year ended May 31 | |
| CLASS R6 | | 2020 | | | 20191 | |
Net asset value, beginning of period | | | $16.34 | | | | $14.86 | | | | $18.70 | |
Net investment loss | | | (0.05 | )2 | | | (0.10 | )2 | | | (0.07 | )2 |
Net realized and unrealized gains (losses) on investments | | | 6.34 | | | | 2.34 | | | | (0.59 | ) |
| | | | | | | | | | | | |
Total from investment operations | | | 6.29 | | | | 2.24 | | | | (0.66 | ) |
Distributions to shareholders from | | | | | | | | | | | | |
Net realized gains | | | 0.00 | | | | (0.76 | ) | | | (3.18 | ) |
Net asset value, end of period | | | $22.63 | | | | $16.34 | | | | $14.86 | |
Total return3 | | | 38.49 | % | | | 15.51 | % | | | (2.35 | )% |
Ratios to average net assets (annualized) | | | | | | | | | | | | |
Gross expenses4 | | | 0.93 | % | | | 0.93 | % | | | 0.92 | % |
Net expenses4 | | | 0.85 | % | | | 0.85 | % | | | 0.85 | % |
Net investment loss4 | | | (0.27 | )% | | | (0.67 | )% | | | (0.51 | )% |
Supplemental data | | | | | | | | | | | | |
Portfolio turnover rate5 | | | 25 | % | | | 55 | % | | | 71 | % |
Net assets, end of period (000s omitted) | | | $23,047 | | | | $19,458 | | | | $22 | |
| 1 | For the period from July, 31, 2018 (commencement of class operations) to May 31, 2019 |
| 2 | Calculated based upon average shares outstanding |
| 3 | Returns for periods of less than one year are not annualized. |
| 4 | Ratios include net expenses allocated from the affiliated Master Portfolio which were as follows: |
| | | | |
Six months ended November 30, 2020 (unaudited) | | | 0.81 | % |
Year ended May 31, 2020 | | | 0.81 | % |
Year ended May 31, 20191 | | | 0.81 | % |
| 5 | Portfolio turnover rate is calculated by multiplying the affiliated Master Portfolio’s percentage of the Fund’s total investments in securities at the end of the period by the affiliated Master Portfolio’s portfolio turnover rate. |
The accompanying notes are an integral part of these financial statements.
Wells Fargo Emerging Growth Fund | 15
Financial highlights
(For a share outstanding throughout each period)
| | | | | | | | | | | | | | | | | | | | | | | | |
| | | Six months ended
November 30, 2020
(unaudited) | | | Year ended May 31 | |
| ADMINISTRATOR CLASS | | 2020 | | | 2019 | | | 2018 | | | 2017 | | | 2016 | |
Net asset value, beginning of period | | | $15.31 | | | | $14.02 | | | | $17.54 | | | | $14.93 | | | | $12.82 | | | | $17.00 | |
Net investment loss | | | (0.08 | )1 | | | (0.14 | )1 | | | (0.15 | )1 | | | (0.14 | )1 | | | (0.07 | )1 | | | (0.12 | )1 |
Net realized and unrealized gains (losses) on investments | | | 5.94 | | | | 2.19 | | | | (0.19 | ) | | | 4.70 | | | | 3.02 | | | | (2.32 | ) |
| | | | | | | | | | | | | | | | | | | | | | | | |
Total from investment operations | | | 5.86 | | | | 2.05 | | | | (0.34 | ) | | | 4.56 | | | | 2.95 | | | | (2.44 | ) |
Distributions to shareholders from | | | | | | | | | | | | | | | | | | | | | | | | |
Net realized gains | | | 0.00 | | | | (0.76 | ) | | | (3.18 | ) | | | (1.95 | ) | | | (0.84 | ) | | | (1.74 | ) |
Net asset value, end of period | | | $21.17 | | | | $15.31 | | | | $14.02 | | | | $17.54 | | | | $14.93 | | | | $12.82 | |
Total return2 | | | 38.28 | % | | | 15.07 | % | | | (0.75 | )% | | | 33.06 | % | | | 23.60 | % | | | (14.80 | )% |
Ratios to average net assets (annualized) | | | | | | | | | | | | | | | | | | | | | | | | |
Gross expenses3 | | | 1.28 | % | | | 1.28 | % | | | 1.27 | % | | | 1.28 | % | | | 1.26 | % | | | 1.23 | % |
Net expenses3 | | | 1.20 | % | | | 1.20 | % | | | 1.20 | % | | | 1.20 | % | | | 1.20 | % | | | 1.20 | % |
Net investment loss3 | | | (0.45 | )% | | | (1.01 | )% | | | (0.94 | )% | | | (0.86 | )% | | | (0.48 | )% | | | (0.80 | )% |
Supplemental data | | | | | | | | | | | | | | | | | | | | | | | | |
Portfolio turnover rate4 | | | 25 | % | | | 55 | % | | | 71 | % | | | 47 | % | | | 115 | % | | | 68 | % |
Net assets, end of period (000s omitted) | | | $26,226 | | | | $21,250 | | | | $23,549 | | | | $52,335 | | | | $50,865 | | | | $99,792 | |
| 1 | Calculated based upon average shares outstanding |
| 2 | Returns for periods of less than one year are not annualized. |
| 3 | Ratios include net expenses allocated from the affiliated Master Portfolio which were as follows: |
| | | | |
Six months ended November 30, 2020 (unaudited) | | | 0.81 | % |
Year ended May 31, 2020 | | | 0.81 | % |
Year ended May 31, 2019 | | | 0.81 | % |
Year ended May 31, 2018 | | | 0.81 | % |
Year ended May 31, 2017 | | | 0.81 | % |
Year ended May 31, 2016 | | | 0.80 | % |
| 3 | Portfolio turnover rate is calculated by multiplying the affiliated Master Portfolio’s percentage of the Fund’s total investments in securities at the end of the period by the affiliated Master Portfolio’s portfolio turnover rate. |
The accompanying notes are an integral part of these financial statements.
16 | Wells Fargo Emerging Growth Fund
Financial highlights
(For a share outstanding throughout each period)
| | | | | | | | | | | | | | | | | | | | | | | | |
| | | Six months ended
November 30, 2020
(unaudited) | | | Year ended May 31 | |
| INSTITUTIONAL CLASS | | 2020 | | | 2019 | | | 2018 | | | 2017 | | | 2016 | |
Net asset value, beginning of period | | | $16.29 | | | | $14.83 | | | | $18.30 | | | | $15.46 | | | | $13.20 | | | | $17.40 | |
Net investment loss | | | (0.06 | )1 | | | (0.11 | )1 | | | (0.13 | ) | | | (0.09 | ) | | | (0.04 | )1 | | | (0.07 | ) |
Net realized and unrealized gains (losses) on investments | | | 6.32 | | | | 2.33 | | | | (0.16 | ) | | | 4.88 | | | | 3.14 | | | | (2.39 | ) |
| | | | | | | | | | | | | | | | | | | | | | | | |
Total from investment operations | | | 6.26 | | | | 2.22 | | | | (0.29 | ) | | | 4.79 | | | | 3.10 | | | | (2.46 | ) |
Distributions to shareholders from | | | | | | | | | | | | | | | | | | | | | | | | |
Net realized gains | | | 0.00 | | | | (0.76 | ) | | | (3.18 | ) | | | (1.95 | ) | | | (0.84 | ) | | | (1.74 | ) |
Net asset value, end of period | | | $22.55 | | | | $16.29 | | | | $14.83 | | | | $18.30 | | | | $15.46 | | | | $13.20 | |
Total return2 | | | 38.43 | % | | | 15.40 | % | | | (0.42 | )% | | | 33.44 | % | | | 24.08 | % | | | (14.62 | )% |
Ratios to average net assets (annualized) | | | | | | | | | | | | | | | | | | | | | | | | |
Gross expenses3 | | | 1.03 | % | | | 1.03 | % | | | 1.02 | % | | | 1.03 | % | | | 1.03 | % | | | 1.01 | % |
Net expenses3 | | | 0.90 | % | | | 0.90 | % | | | 0.90 | % | | | 0.90 | % | | | 0.90 | % | | | 0.90 | % |
Net investment loss3 | | | (0.30 | )% | | | (0.71 | )% | | | (0.67 | )% | | | (0.56 | )% | | | (0.24 | )% | | | (0.50 | )% |
Supplemental data | | | | | | | | | | | | | | | | | | | | | | | | |
Portfolio turnover rate4 | | | 25 | % | | | 55 | % | | | 71 | % | | | 47 | % | | | 115 | % | | | 68 | % |
Net assets, end of period (000s omitted) | | | $565,993 | | | | $471,512 | | | | $578,073 | | | | $606,729 | | | | $534,846 | | | | $583,843 | |
| 1 | Calculated based upon average shares outstanding |
| 2 | Returns for periods of less than one year are not annualized. |
| 3 | Ratios include net expenses allocated from the affiliated Master Portfolio which were as follows: |
| | | | |
Six months ended November 30, 2020 (unaudited) | | | 0.81 | % |
Year ended May 31, 2020 | | | 0.81 | % |
Year ended May 31, 2019 | | | 0.81 | % |
Year ended May 31, 2018 | | | 0.81 | % |
Year ended May 31, 2017 | | | 0.81 | % |
Year ended May 31, 2016 | | | 0.80 | % |
| 4 | Portfolio turnover rate is calculated by multiplying the affiliated Master Portfolio’s percentage of the Fund’s total investments in securities at the end of the period by the affiliated Master Portfolio’s portfolio turnover rate. |
The accompanying notes are an integral part of these financial statements.
Wells Fargo Emerging Growth Fund | 17
Notes to financial statements (unaudited)
1. ORGANIZATION
Wells Fargo Funds Trust (the “Trust”), a Delaware statutory trust organized on March 10, 1999, is an open-end management investment company registered under the Investment Company Act of 1940, as amended (the “1940 Act”). As an investment company, the Trust follows the accounting and reporting guidance in Financial Accounting Standards Board (“FASB”) Accounting Standards Codification Topic 946, Financial Services – Investment Companies. These financial statements report on the Wells Fargo Emerging Growth Fund (the “Fund”) which is a diversified series of the Trust.
The Fund is a feeder fund in a master-feeder structure that invests substantially all of its assets in a single master portfolio with a substantially identical investment objective and substantially similar investment strategies. The Fund invests in Wells Fargo Emerging Growth Portfolio, a separate diversified portfolio (the “affiliated Master Portfolio”) of Wells Fargo Master Trust, a registered open-end management investment company. As of November 30, 2020, the Fund owned 96% of Wells Fargo Emerging Growth Portfolio. The affiliated Master Portfolio directly acquires portfolio securities and the Fund acquires an indirect interest in those securities. The Fund accounts for its investment in the affiliated Master Portfolio as a partnership investment and records on a daily basis its share of the affiliated Master Portfolio’s income, expense and realized and unrealized gains and losses. The financial statements of the affiliated Master Portfolio for the six months ended November 30, 2020 are included in this report and should be read in conjunction with the Fund’s financial statements.
2. SIGNIFICANT ACCOUNTING POLICIES
The following significant accounting policies, which are consistently followed in the preparation of the financial statements of the Fund, are in conformity with U.S. generally accepted accounting principles which require management to make estimates and assumptions that affect the reported amounts of assets and liabilities, disclosure of contingent assets and liabilities at the date of the financial statements, and the reported amounts of income and expenses during the reporting period. Actual results could differ from those estimates.
Securities valuation
All investments are valued each business day as of the close of regular trading on the New York Stock Exchange (generally 4 p.m. Eastern Time), although the Fund may deviate from this calculation time under unusual or unexpected circumstances.
Investments in the affiliated Master Portfolio are valued daily based on the Fund’s proportionate share of the affiliated Master Portfolio’s net assets, which are also valued daily. Securities held in the affiliated Master Portfolio are valued as discussed in the Notes to Financial Statements of the affiliated Master Portfolio, which are included elsewhere in this report.
Investments which are not valued using the method discussed above are valued at their fair value, as determined in good faith by the Board of Trustees of the Fund. The Board of Trustees has established a Valuation Committee comprised of the Trustees and has delegated to it the authority to take any actions regarding the valuation of portfolio securities that the Valuation Committee deems necessary or appropriate, including determining the fair value of portfolio securities, unless the determination has been delegated to the Wells Fargo Asset Management Pricing Committee at Wells Fargo Funds Management, LLC (“Funds Management”). The Board of Trustees retains the authority to make or ratify any valuation decisions or approve any changes to the Valuation Procedures as it deems appropriate. On a quarterly basis, the Board of Trustees receives reports on any valuation actions taken by the Valuation Committee or the Wells Fargo Asset Management Pricing Committee which may include items for ratification.
Investment transactions, income and expenses
Investments in the affiliated Master Portfolio are recorded on a trade basis. The Fund records daily its proportionate share of the affiliated Master Portfolio’s income, expenses and realized and unrealized gains or losses. The Fund also accrues its own expenses.
Distributions to shareholders
Distributions to shareholders from net investment income and any net realized gains are recorded on the ex-dividend date and paid at least annually. Such distributions are determined in accordance with income tax regulations and may differ from U.S. generally accepted accounting principles. Dividend sources are estimated at the time of declaration. The tax character of distributions is determined as of the Fund’s fiscal year end. Therefore, a portion of the Fund’s distributions made prior to the Fund’s fiscal year end may be categorized as a tax return of capital at year end.
Federal and other taxes
The Fund intends to continue to qualify as a regulated investment company by distributing substantially all of its investment company taxable income and any net realized capital gains (after reduction for capital loss carryforwards) sufficient to relieve it from all, or substantially all, federal income taxes. Accordingly, no provision for federal income taxes was required.
18 | Wells Fargo Emerging Growth Fund
Notes to financial statements (unaudited)
The Fund’s income and federal excise tax returns and all financial records supporting those returns for the prior three fiscal years are subject to examination by the federal and Delaware revenue authorities. Management has analyzed the Fund’s tax positions taken on federal, state, and foreign tax returns for all open tax years and does not believe that there are any uncertain tax positions that require recognition of a tax liability.
As of November 30, 2020, the aggregate cost of all investments for federal income tax purposes was $461,061,497 and the unrealized gains (losses) consisted of:
| | | | |
| |
Gross unrealized gains | | $ | 358,445,577 | |
| |
Gross unrealized losses | | | 0 | |
| |
Net unrealized gains | | $ | 358,445,577 | |
As of May 31, 2020, the Fund had a qualified late-year ordinary loss of $2,330,946 which was recognized on the first day of the current fiscal year.
Class allocations
The separate classes of shares offered by the Fund differ principally in applicable sales charges, distribution, shareholder servicing, and administration fees. Class specific expenses are charged directly to that share class. Investment income, common fund-level expenses, and realized and unrealized gains (losses) on investments are allocated daily to each class of shares based on the relative proportion of net assets of each class.
3. FAIR VALUATION MEASUREMENTS
At November 30, 2020, the affiliated Master Portfolio was measured at fair value using the net asset value per share (or its equivalent) as a practical expedient. The investment objective and the value of the affiliate Master Portfolio was as follows:
| | | | | | |
| | |
| Affiliated Master Portfolio | | Investment objective | | Value of affiliated
Master Portfolio | |
| | |
Wells Fargo Emerging Growth Portfolio | | Seeks long-term capital appreciation | | $ | 819,507,074 | |
The affiliated Master Portfolio does not have a redemption period notice, can be redeemed daily and does not have any unfunded commitments.
4. TRANSACTIONS WITH AFFILIATES
Management fee
Funds Management, an indirect wholly owned subsidiary of Wells Fargo & Company (“Wells Fargo”), is the manager of the Fund and provides advisory and fund-level administrative services under an investment management agreement. Under the investment management agreement, Funds Management is responsible for, among other services, implementing the investment objectives and strategies of the Fund and providing fund-level administrative services in connection with the Fund’s operations. As long as the Fund continues to invest substantially all of its assets in a single affiliated Master Portfolio, the Fund pays Funds Management an investment management fee only for fund-level administrative services at the following annual rate based on the Fund’s average daily net assets:
| | | | |
| |
| Average daily net assets | | Management fee | |
| |
First $5 billion | | | 0.05 | % |
| |
Next $5 billion | | | 0.04 | |
| |
Over $10 billion | | | 0.03 | |
For the six months ended November 30, 2020, the management fee was equivalent to an annual rate of 0.05% of the Fund’s average daily net assets.
Funds Management also serves as the adviser to the affiliated Master Portfolio and is entitled to receive a fee from the affiliated Master Portfolio for those services.
Wells Fargo Emerging Growth Fund | 19
Notes to financial statements (unaudited)
Administration fees
Under a class-level administration agreement, Funds Management provides class-level administrative services to the Fund, which includes paying fees and expenses for services provided by the transfer agent, sub-transfer agents, omnibus account servicers and record-keepers. As compensation for its services under the class-level administration agreement, Funds Management receives an annual fee which is calculated based on the average daily net assets of each class as follows:
| | | | |
| |
| | | Class-level
administration fee | |
| |
Class A, Class C | | | 0.21 | % |
| |
Class R6 | | | 0.03 | |
| |
Administrator Class, Institutional Class | | | 0.13 | |
Waivers and/or expense reimbursements
Funds Management has contractually waived and/or reimbursed management and administration fees to the extent necessary to maintain certain net operating expense ratios for the Fund. When each class of the Fund has exceeded its expense cap, Funds Management has waived fees and/or reimbursed expenses from fund-level expenses on a proportionate basis and then from class specific expenses. When only certain classes exceed their expense caps, waivers and/or reimbursements are applied against class specific expenses before fund-level expenses. Net expenses from the affiliated Master Portfolio are included in the expense cap. Funds Management has committed through September 30, 2021 to waive fees and/or reimburse expenses to the extent necessary to cap each Fund’s expenses at 1.28% for Class A shares, 2.03% for Class C shares, 0.85% for Class R6 shares, 1.20% for Administrator Class shares, and 0.90% for Institutional Class shares. Prior to or after the commitment expiration date, the cap may be increased or the commitment to maintain the cap may be terminated only with the approval of the Board of Trustees.
Distribution fee
The Trust has adopted a distribution plan for Class C shares of the Fund pursuant to Rule 12b-1 under the 1940 Act. A distribution fee is charged to Class C shares and paid to Wells Fargo Funds Distributor, LLC (“Funds Distributor”), the principal underwriter, at an annual rate of 0.75% of the average daily net assets of Class C shares.
In addition, Funds Distributor is entitled to receive the front-end sales charge from the purchase of Class A shares and a contingent deferred sales charge on the redemption of certain Class A shares. Funds Distributor is also entitled to receive the contingent deferred sales charges from redemptions of Class C shares. For the six months ended November 30, 2020, Funds Distributor received $674 from the sale of Class A shares. No contingent deferred sales charges were incurred by Class A and Class C shares for the six months ended November 30, 2020.
Shareholder servicing fees
The Trust has entered into contracts with one or more shareholder servicing agents, whereby Class A, Class C, and Administrator Class of the Fund are charged a fee at an annual rate of 0.25% of the average daily net assets of each respective class. A portion of these total shareholder servicing fees were paid to affiliates of Wells Fargo.
5. INVESTMENT PORTFOLIO TRANSACTIONS
The Fund seeks to achieve its investment objective by investing substantially all of its assets in a single affiliated Master Portfolio. Purchases and sales have been calculated by multiplying the Fund’s ownership percentage of the affiliated Master Portfolio by the affiliated Master Portfolio’s purchases and sales. Purchases and sales of investments, excluding U.S. government obligations (if any) and short-term securities, for the six months ended November 30, 2020 were $183,831,940 and $297,634,813, respectively.
6. BANK BORROWINGS
The Trust (excluding the money market funds), Wells Fargo Master Trust and Wells Fargo Variable Trust are parties to a $350,000,000 revolving credit agreement whereby the Fund is permitted to use bank borrowings for temporary or emergency purposes, such as to fund shareholder redemption requests. Interest under the credit agreement is charged to the Fund based on a borrowing rate equal to the higher of the Federal Funds rate in effect on that day plus 1.25% or the overnight LIBOR rate in effect on that day plus 1.25%. In addition, an annual commitment fee equal to 0.25% of the unused balance is allocated to each participating fund.
For the six months ended November 30, 2020, there were no borrowings by the Fund under the agreement.
20 | Wells Fargo Emerging Growth Fund
Notes to financial statements (unaudited)
7. CONCENTRATION RISKS
Concentration risks result from exposure to a limited number of sectors. Through its investment in the affiliated Master Portfolio which may invest a substantial portion of its assets in any sector, the Fund may in turn be more affected by changes in that sector than a fund whose investments are not heavily weighted in any sector. As of the end of the period, the Master Portfolio concentrated its portfolio in investments related to the health care and information technology sectors.
8. INDEMNIFICATION
Under the Fund’s organizational documents, the officers and Trustees have been granted certain indemnification rights against certain liabilities that may arise out of performance of their duties to the Fund. The Fund has entered into a separate agreement with each Trustee that converts indemnification rights currently existing under the Fund’s organizational documents into contractual rights that cannot be changed in the future without the consent of the Trustee. Additionally, in the normal course of business, the Fund may enter into contracts with service providers that contain a variety of indemnification clauses. The Fund’s maximum exposure under these arrangements is dependent on future claims that may be made against the Fund and, therefore, cannot be estimated.
9. REDEMPTION IN-KIND
After the close of business on March 31, 2020, the Fund redeemed assets through an in-kind redemption. In the redemption transaction, the Fund transferred securities with a value of $32,967,178 and cash in the amount o $95,186. The Fund recognized losses in the amount of $7,498,217. The redemption in-kind by a shareholder of the Institutional Class represented 5.89% of the Fund and is reflected on the Statement of Changes in Net Assets.
10. NEW ACCOUNTING PRONOUNCEMENT
In August 2018, FASB issued Accounting Standards Update (“ASU”) No. 2018-13, Fair Value Measurement (Topic 820) Disclosure Framework—Changes to the Disclosure Requirements for Fair Value Measurement. ASU 2018-13 updates the disclosure requirements on fair value measurements in Topic 820, Fair Value Measurements. The amendments are effective for fiscal years, and interim periods within those fiscal years, beginning after December 15, 2019. Management has adopted this guidance which did not have a material impact on the financial statements.
11. CORONAVIRUS (COVID-19) PANDEMIC
On March 11, 2020, the World Health Organization announced that it had made the assessment that coronavirus disease 2019 (“COVID-19”) is a pandemic. The impacts of COVID-19 are adversely affecting the entire global economy, individual companies and investment products, and the market in general. There is significant uncertainty around the extent and duration of business disruptions related to COVID-19 and the impacts may be short term or may last for an extended period of time. The risk of further spreading of COVID-19 has led to significant uncertainty and volatility in the financial markets.
Wells Fargo Emerging Growth Fund | 21
Portfolio of investments—November 30, 2020 (unaudited)
| | | | | | | | | | | | | | | | |
| | | | | | | | | Shares | | | Value | |
| Common Stocks: 98.56% | | | | | | | | | | | | | | | | |
| | | | |
Communication Services: 1.58% | | | | | | | | | | | | | | | | |
| | | | |
| Interactive Media & Services: 0.28% | | | | | | | | | | | | |
EverQuote Incorporated Class A † | | | | | | | | | | | 64,826 | | | $ | 2,441,347 | |
| | | | | | | | | | | | | | | | |
| | | | |
| Media: 1.30% | | | | | | | | | | | | |
Cardlytics Incorporated † | | | | | | | | | | | 93,585 | | | | 11,106,668 | |
| | | | | | | | | | | | | | | | |
| | | | |
Consumer Discretionary: 14.33% | | | | | | | | | | | | | | | | |
| | | | |
| Auto Components: 1.04% | | | | | | | | | | | | |
Fox Factory Holding Corporation † | | | | | | | | | | | 102,788 | | | | 8,970,309 | |
| | | | | | | | | | | | | | | | |
| | | | |
| Hotels, Restaurants & Leisure: 2.64% | | | | | | | | | | | | |
GAN Limited Ǡ | | | | | | | | | | | 62,341 | | | | 1,013,041 | |
Papa John’s International Incorporated | | | | | | | | | | | 114,600 | | | | 9,209,256 | |
Wingstop Incorporated | | | | | | | | | | | 97,808 | | | | 12,451,936 | |
| | | | |
| | | | | | | | | | | | | | | 22,674,233 | |
| | | | | | | | | | | | | | | | |
| | | | |
| Household Durables: 1.46% | | | | | | | | | | | | |
Purple Innovation Incorporated † | | | | | | | | | | | 419,947 | | | | 12,522,820 | |
| | | | | | | | | | | | | | | | |
| | | | |
| Internet & Direct Marketing Retail: 2.44% | | | | | | | | | | | | |
Carparts.com Incorporated Ǡ | | | | | | | | | | | 361,350 | | | | 5,445,545 | |
Fiverr International Limited † | | | | | | | | | | | 77,241 | | | | 15,473,690 | |
| | | | |
| | | | | | | | | | | | | | | 20,919,235 | |
| | | | | | | | | | | | | | | | |
| | | | |
| Leisure Products: 1.48% | | | | | | | | | | | | |
YETI Holdings Incorporated † | | | | | | | | | | | 200,880 | | | | 12,689,590 | |
| | | | | | | | | | | | | | | | |
| | | | |
| Specialty Retail: 3.00% | | | | | | | | | | | | |
Boot Barn Holdings Incorporated † | | | | | | | | | | | 335,275 | | | | 13,833,447 | |
Leslie’s Incorporated † | | | | | | | | | | | 92,219 | | | | 1,908,011 | |
Lithia Motors Incorporated Class A | | | | | | | | | | | 34,472 | | | | 9,972,750 | |
| | | | |
| | | | | | | | | | | | | | | 25,714,208 | |
| | | | | | | | | | | | | | | | |
| | | | |
| Textiles, Apparel & Luxury Goods: 2.27% | | | | | | | | | | | | |
Crocs Incorporated † | | | | | | | | | | | 220,400 | | | | 12,979,356 | |
Deckers Outdoor Corporation † | | | | | | | | | | | 25,523 | | | | 6,497,901 | |
| | | | |
| | | | | | | | | | | | | | | 19,477,257 | |
| | | | | | | | | | | | | | | | |
| | | | |
Consumer Staples: 4.23% | | | | | | | | | | | | | | | | |
| | | | |
| Beverages: 0.66% | | | | | | | | | | | | |
Celsius Holdings Incorporated † | | | | | | | | | | | 174,800 | | | | 5,637,300 | |
| | | | | | | | | | | | | | | | |
| | | | |
| Food & Staples Retailing: 0.79% | | | | | | | | | | | | |
Grocery Outlet Holding Corporation † | | | | | | | | | | | 76,215 | | | | 2,943,423 | |
The Chef’s Warehouse Incorporated † | | | | | | | | | | | 164,945 | | | | 3,801,158 | |
| | | | |
| | | | | | | | | | | | | | | 6,744,581 | |
| | | | | | | | | | | | | | | | |
| | | | |
| Food Products: 2.78% | | | | | | | | | | | | |
Freshpet Incorporated † | | | | | | | | | | | 118,448 | | | | 16,213,162 | |
Vital Farms Incorporated Ǡ | | | | | | | | | | | 258,661 | | | | 7,666,712 | |
| | | | |
| | | | | | | | | | | | | | | 23,879,874 | |
| | | | | | | | | | | | | | | | |
The accompanying notes are an integral part of these financial statements.
22 | Wells Fargo Emerging Growth Portfolio
Portfolio of investments—November 30, 2020 (unaudited)
| | | | | | | | | | | | | | | | |
| | | | | | | | | Shares | | | Value | |
Financials: 6.32% | | | | | | | | | | | | | | | | |
| | | | |
| Capital Markets: 1.59% | | | | | | | | | | | | |
Assetmark Financial Holdings † | | | | | | | | | | | 193,934 | | | $ | 4,611,751 | |
Stifel Financial Corporation | | | | | | | | | | | 131,154 | | | | 9,088,972 | |
| | | | |
| | | | | | | | | | | | | | | 13,700,723 | |
| | | | | | | | | | | | | | | | |
| | | | |
| Consumer Finance: 0.95% | | | | | | | | | | | | |
LendingTree Incorporated † | | | | | | | | | | | 31,797 | | | | 8,126,677 | |
| | | | | | | | | | | | | | | | |
| | | | |
| Insurance: 3.78% | | | | | | | | | | | | |
Goosehead Insurance Incorporated Class A | | | | | | | | | | | 47,921 | | | | 5,899,554 | |
Kinsale Capital Group Incorporated | | | | | | | | | | | 104,677 | | | | 25,139,228 | |
Lemonade Incorporated Ǡ | | | | | | | | | | | 20,211 | | | | 1,400,016 | |
| | | | |
| | | | | | | | | | | | | | | 32,438,798 | |
| | | | | | | | | | | | | | | | |
| | | | |
Health Care: 31.37% | | | | | | | | | | | | | | | | |
| | | | |
| Biotechnology: 11.18% | | | | | | | | | | | | |
Arcutis Biotherapeutics Incorporated † | | | | | | | | | | | 297,451 | | | | 8,066,871 | |
Arena Pharmaceuticals Incorporated † | | | | | | | | | | | 83,102 | | | | 5,473,929 | |
Biohaven Pharmaceutical Holding Company Limited † | | | | | | | | | | | 41,266 | | | | 3,670,611 | |
CareDx Incorporated † | | | | | | | | | | | 105,553 | | | | 6,034,465 | |
Castle Biosciences Incorporated † | | | | | | | | | | | 257,871 | | | | 12,264,345 | |
Chemocentryx Incorporated † | | | | | | | | | | | 42,650 | | | | 2,352,148 | |
Deciphera Pharmaceuticals Incorporated † | | | | | | | | | | | 13,500 | | | | 834,300 | |
Emergent BioSolutions Incorporated † | | | | | | | | | | | 41,598 | | | | 3,408,124 | |
Fate Therapeutics Incorporated † | | | | | | | | | | | 55,312 | | | | 3,233,816 | |
Halozyme Therapeutics Incorporated † | | | | | | | | | | | 315,730 | | | | 12,345,043 | |
Invitae Corporation † | | | | | | | | | | | 177,394 | | | | 8,807,612 | |
Natera Incorporated † | | | | | | | | | | | 180,858 | | | | 15,964,336 | |
Vericel Corporation † | | | | | | | | | | | 526,793 | | | | 13,454,293 | |
| | | | |
| | | | | | | | | | | | | | | 95,909,893 | |
| | | | | | | | | | | | | | | | |
| | | | |
| Health Care Equipment & Supplies: 10.74% | | | | | | | | | | | | |
Acutus Medical Incorporated Ǡ | | | | | | | | | | | 174,325 | | | | 4,954,317 | |
iRhythm Technologies Incorporated † | | | | | | | | | | | 87,833 | | | | 21,476,047 | |
Mesa Laboratories Incorporated | | | | | | | | | | | 14,459 | | | | 3,929,378 | |
Orthopediatrics Corporation † | | | | | | | | | | | 185,996 | | | | 8,511,177 | |
Outset Medical Incorporated † | | | | | | | | | | | 75,026 | | | | 4,801,664 | |
Pulmonx Corporation † | | | | | | | | | | | 103,099 | | | | 5,587,966 | |
Shockwave Medical Incorporated † | | | | | | | | | | | 184,620 | | | | 18,061,375 | |
SI-BONE Incorporated † | | | | | | | | | | | 354,753 | | | | 8,216,079 | |
Silk Road Medical Incorporated † | | | | | | | | | | | 70,144 | | | | 4,019,251 | |
Tactile Systems Technology Class I † | | | | | | | | | | | 7,954 | | | | 342,897 | |
Tandem Diabetes Care Incorporated † | | | | | | | | | | | 59,145 | | | | 5,552,533 | |
Vapotherm Incorporated † | | | | | | | | | | | 265,307 | | | | 6,675,124 | |
| | | | |
| | | | | | | | | | | | | | | 92,127,808 | |
| | | | | | | | | | | | | | | | |
| | | | |
| Health Care Providers & Services: 1.54% | | | | | | | | | | | | |
Addus Homecare Corporation † | | | | | | | | | | | 133,281 | | | | 13,228,139 | |
| | | | | | | | | | | | | | | | |
| | | | |
| Health Care Technology: 2.59% | | | | | | | | | | | | |
Inspire Medical Systems Incorporated † | | | | | | | | | | | 63,769 | | | | 11,844,454 | |
Phreesia Incorporated † | | | | | | | | | | | 234,893 | | | | 10,372,875 | |
| | | | |
| | | | | | | | | | | | | | | 22,217,329 | |
| | | | | | | | | | | | | | | | |
The accompanying notes are an integral part of these financial statements.
Wells Fargo Emerging Growth Portfolio | 23
Portfolio of investments—November 30, 2020 (unaudited)
| | | | | | | | | | | | | | | | |
| | | | | | | | | Shares | | | Value | |
| Life Sciences Tools & Services: 3.84% | | | | | | | | | | | | |
Adaptive Biotechnologies Corporation † | | | | | | | | | | | 68,417 | | | $ | 3,299,068 | |
Codexis Incorporated † | | | | | | | | | | | 816,932 | | | | 15,129,581 | |
Neogenomics Incorporated † | | | | | | | | | | | 305,204 | | | | 14,521,606 | |
| | | | |
| | | | | | | | | | | | | | | 32,950,255 | |
| | | | | | | | | | | | | | | | |
| | | | |
| Pharmaceuticals: 1.48% | | | | | | | | | | | | |
Pacira Pharmaceuticals Incorporated † | | | | | | | | | | | 162,280 | | | | 9,832,545 | |
Revance Therapeutics Incorporated † | | | | | | | | | | | 116,980 | | | | 2,823,897 | |
| | | | |
| | | | | | | | | | | | | | | 12,656,442 | |
| | | | | | | | | | | | | | | | |
| | | | |
Industrials: 13.27% | | | | | | | | | | | | | | | | |
| | | | |
| Aerospace & Defense: 2.48% | | | | | | | | | | | | |
Kratos Defense & Security Solutions Incorporated † | | | | | | | | | | | 419,110 | | | | 8,872,559 | |
Mercury Systems Incorporated † | | | | | | | | | | | 174,108 | | | | 12,399,972 | |
| | | | |
| | | | | | | | | | | | | | | 21,272,531 | |
| | | | | | | | | | | | | | | | |
| | | | |
| Building Products: 0.12% | | | | | | | | | | | | |
The AZEK Company Incorporated † | | | | | | | | | | | 28,277 | | | | 1,010,054 | |
| | | | | | | | | | | | | | | | |
| | | | |
| Commercial Services & Supplies: 2.77% | | | | | | | | | | | | |
Casella Waste Systems Incorporated Class A † | | | | | | | | | | | 395,031 | | | | 23,772,966 | |
| | | | | | | | | | | | | | | | |
| | | | |
| Construction & Engineering: 0.05% | | | | | | | | | | | | |
Construction Partners Incorporated Class A † | | | | | | | | | | | 17,461 | | | | 459,224 | |
| | | | | | | | | | | | | | | | |
| | | | |
| Electrical Equipment: 0.47% | | | | | | | | | | | | |
Bloom Energy Corporation Class A † | | | | | | | | | | | 164,005 | | | | 4,021,403 | |
| | | | | | | | | | | | | | | | |
| | | | |
| Machinery: 2.41% | | | | | | | | | | | | |
Rexnord Corporation | | | | | | | | | | | 551,914 | | | | 20,702,294 | |
| | | | | | | | | | | | | | | | |
| | | | |
| Professional Services: 2.63% | | | | | | | | | | | | |
ASGN Incorporated † | | | | | | | | | | | 288,961 | | | | 22,590,971 | |
| | | | | | | | | | | | | | | | |
| | | | |
| Road & Rail: 1.26% | | | | | | | | | | | | |
Marten Transport Limited | | | | | | | | | | | 118,097 | | | | 2,082,050 | |
Saia Incorporated † | | | | | | | | | | | 49,761 | | | | 8,685,285 | |
| | | | |
| | | | | | | | | | | | | | | 10,767,335 | |
| | | | | | | | | | | | | | | | |
| | | | |
| Trading Companies & Distributors: 1.08% | | | | | | | | | | | | |
SiteOne Landscape Supply Incorporated † | | | | | | | | | | | 67,147 | | | | 9,273,001 | |
| | | | | | | | | | | | | | | | |
| | | | |
Information Technology: 25.51% | | | | | | | | | | | | | | | | |
| | | | |
| Electronic Equipment, Instruments & Components: 2.06% | | | | | | | | | | | | |
Novanta Incorporated † | | | | | | | | | | | 147,587 | | | | 17,707,488 | |
| | | | | | | | | | | | | | | | |
| | | | |
| IT Services: 2.54% | | | | | | | | | | | | |
Endava plc Sponsored ADR † | | | | | | | | | | | 138,684 | | | | 8,707,968 | |
EVO Payments Incorporated Class A † | | | | | | | | | | | 447,912 | | | | 11,260,508 | |
LiveRamp Holdings Incorporated † | | | | | | | | | | | 31,687 | | | | 1,854,006 | |
| | | | |
| | | | | | | | | | | | | | | 21,822,482 | |
| | | | | | | | | | | | | | | | |
| | | | |
| Semiconductors & Semiconductor Equipment: 3.82% | | | | | | | | | | | | |
Allegro Microsystems Incorporated † | | | | | | | | | | | 224,047 | | | | 5,365,926 | |
Diodes Incorporated † | | | | | | | | | | | 156,311 | | | | 10,622,896 | |
The accompanying notes are an integral part of these financial statements.
24 | Wells Fargo Emerging Growth Portfolio
Portfolio of investments—November 30, 2020 (unaudited)
| | | | | | | | | | | | | | | | |
| | | | | | | | | Shares | | | Value | |
| | | | |
| Semiconductors & Semiconductor Equipment (continued) | | | | | | | | | | | | |
Semtech Corporation † | | | | | | | | | | | 198,331 | | | $ | 13,381,393 | |
Silicon Laboratories Incorporated † | | | | | | | | | | | 28,599 | | | | 3,352,089 | |
| | | | |
| | | | | | | | | | | | | | | 32,722,304 | |
| | | | | | | | | | | | | | | | |
| | | | |
| Software: 17.09% | | | | | | | | | | | | |
Envestnet Incorporated † | | | | | | | | | | | 193,597 | | | | 15,538,095 | |
Everbridge Incorporated † | | | | | | | | | | | 57,211 | | | | 7,262,364 | |
Jamf Holding Corporation † | | | | | | | | | | | 131,168 | | | | 4,158,026 | |
Mimecast Limited † | | | | | | | | | | | 158,711 | | | | 7,138,821 | |
Q2 Holdings Incorporated † | | | | | | | | | | | 233,685 | | | | 26,492,868 | |
Rapid7 Incorporated † | | | | | | | | | | | 308,255 | | | | 23,100,630 | |
Sprout Social Incorporated Class A † | | | | | | | | | | | 297,551 | | | | 15,288,170 | |
SPS Commerce Incorporated † | | | | | | | | | | | 204,531 | | | | 21,081,010 | |
Sumo Logic Incorporated Ǡ | | | | | | | | | | | 173,978 | | | | 4,558,224 | |
Talend SA ADR † | | | | | | | | | | | 382,443 | | | | 14,353,086 | |
Vertex Incorporated Class A † | | | | | | | | | | | 129,531 | | | | 3,269,362 | |
Workiva Incorporated † | | | | | | | | | | | 57,600 | | | | 4,319,424 | |
| | | | |
| | | | | | | | | | | | | | | 146,560,080 | |
| | | | | | | | | | | | | | | | |
| | | | |
Real Estate: 1.45% | | | | | | | | | | | | | | | | |
| | | | |
| Equity REITs: 1.45% | | | | | | | | | | | | |
Community Healthcare Trust Incorporated | | | | | | | | | | | 136,080 | | | | 6,145,373 | |
QTS Realty Trust Incorporated Class A | | | | | | | | | | | 106,100 | | | | 6,303,401 | |
| | | | |
| | | | | | | | | | | | | | | 12,448,774 | |
| | | | | | | | | | | | | | | | |
| | | | |
Utilities: 0.50% | | | | | | | | | | | | | | | | |
| | | | |
| Independent Power & Renewable Electricity Producers: 0.50% | | | | | | | | | | | | |
Sunnova Energy International † | | | | | | | | | | | 105,305 | | | | 4,265,901 | |
| | | | | | | | | | | | | | | | |
| | | | |
Total Common Stocks (Cost $439,330,421) | | | | | | | | | | | | | | | 845,530,294 | |
| | | | | | | | | | | | | | | | |
| | | | |
| | | | | | | | | | | | | | | | |
| | | Yield | | | | | | | | | | |
| Short-Term Investments: 3.20% | | | | | | | | | | | | | | | | |
| | | | |
| Investment Companies: 3.20% | | | | | | | | | | | | |
Securities Lending Cash Investments LLC (l)(r)(u) | | | 0.12 | % | | | | | | | 13,007,270 | | | | 13,007,270 | |
Wells Fargo Government Money Market Fund Select Class (l)(u) | | | 0.02 | | | | | | | | 14,413,892 | | | | 14,413,892 | |
| | | | |
Total Short-Term Investments (Cost $27,421,162) | | | | | | | | | | | | | | | 27,421,162 | |
| | | | | | | | | | | | | | | | |
| | | | | | | | |
| Total investments in securities (Cost $466,751,583) | | | 101.76 | % | | | 872,951,456 | |
| | |
Other assets and liabilities, net | | | (1.76 | ) | | | (15,080,145 | ) |
| | | | | | | | |
| Total net assets | | | 100.00 | % | | $ | 857,871,311 | |
| | | | | | | | |
| † | Non-income-earning security |
| « | All or a portion of this security is on loan. |
| (l) | The issuer of the security is an affiliated person of the Portfolio as defined in the Investment Company Act of 1940. |
| (r) | The investment is a non-registered investment company purchased with cash collateral received from securities on loan. |
| (u) | The rate represents the 7-day annualized yield at period end. |
Abbreviations:
| ADR | American depositary receipt |
| REIT | Real estate investment trust |
The accompanying notes are an integral part of these financial statements.
Wells Fargo Emerging Growth Portfolio | 25
Portfolio of investments—November 30, 2020 (unaudited)
Investments in Affiliates
An affiliated investment is an investment in which the Portfolio owns at least 5% of the outstanding voting shares of the issuer or as a result of other relationships, such as the Portfolio and the issuer having the same adviser or investment manager. Transactions with issuers that were either affiliated persons of the Portfolio at the beginning of the period or the end of the period were as follows:
| | | | | | | | | | | | | | | | | | | | | | | | | | | | | | | | | | | | |
| | | Value, beginning of period | | | Purchases | | | Shares proceeds | | | Net realized gains (losses) | | | Net change in unrealized gains (losses) | | | Value, end of
period | | | % of net assets | | | Shares, end of
period | | | Income
from
affiliated
securities | |
| | | | | | | | | |
| Short-Term Investments | | | | | | | | | | | | | | | | | | | | | | | | | | | |
Investment Companies | | | | | | | | | | | | | | | | | | | | | | | | | | | | | | | | | | | | |
Securities Lending Cash Investments LLC | | $ | 0 | | | $ | 99,850,892 | | | $ | (86,843,622 | ) | | $ | 0 | | | $ | 0 | | | $ | 13,007,270 | | | | | | | | 13,007,270 | | | $ | 8,048 | # |
Wells Fargo Government Money Market Fund Select Class | | | 10,065,569 | | | | 140,673,038 | | | | (136,324,715 | ) | | | 0 | | | | 0 | | | | 14,413,892 | | | | | | | | 14,413,892 | | | | 2,174 | |
| | | | | | | | | | | | | | | | | | | | | | | | | | | | | | | | | | | | |
| | | | | | | | | | | | | | $ | 0 | | | $ | 0 | | | $ | 27,421,162 | | | | 3.20 | % | | | | | | $ | 10,222 | |
| | | | | | | | | | | | | | | | | | | | | | | | | | | | | | | | | | | | |
| # | Amount shown represents income before fees and rebates. |
The accompanying notes are an integral part of these financial statements.
26 | Wells Fargo Emerging Growth Portfolio
Statement of assets and liabilities—November 30, 2020 (unaudited)
| | | | |
| | | | |
| |
Assets | | | | |
Investments in unaffiliated securities, (including $12,699,325 of securities loaned), at value (cost $439,330,421) | | $ | 845,530,294 | |
Investments in affiliated securities, at value (cost $27,421,162) | | | 27,421,162 | |
Receivable for investments sold | | | 517,748 | |
Receivable for dividends | | | 581,168 | |
Receivable for securities lending income, net | | | 44,102 | |
Prepaid expenses and other assets | | | 15,948 | |
| | | | |
Total assets | | | 874,110,422 | |
| | | | |
| |
Liabilities | | | | |
Payable upon receipt of securities loaned | | | 13,007,270 | |
Payable for investments purchased | | | 2,657,628 | |
Advisory fee payable | | | 532,781 | |
Accrued expenses and other liabilities | | | 41,432 | |
| | | | |
Total liabilities | | | 16,239,111 | |
| | | | |
Total net assets | | $ | 857,871,311 | |
| | | | |
The accompanying notes are an integral part of these financial statements.
Wells Fargo Emerging Growth Portfolio | 27
Statement of operations—six months ended November 30, 2020 (unaudited)
| | | | |
| | | | |
| |
Investment income | | | | |
Dividends | | $ | 1,059,268 | |
Securities lending income from affiliates, net | | | 124,400 | |
Income from affiliated securities | | | 2,174 | |
| | | | |
Total investment income | | | 1,185,842 | |
| | | | |
| |
Expenses | | | | |
Advisory fee | | | 3,141,475 | |
Custody and accounting fees | | | 26,681 | |
Professional fees | | | 23,943 | |
Shareholder report expenses | | | 3,427 | |
Trustees’ fees and expenses | | | 9,585 | |
Other fees and expenses | | | 16,521 | |
| | | | |
Net expenses | | | 3,221,632 | |
| | | | |
Net investment loss | | | (2,035,790 | ) |
| | | | |
| |
Realized and unrealized gains (losses) on investments | | | | |
Net realized gains on investments | | | 111,813,045 | |
Net change in unrealized gains (losses) on investments | | | 147,601,505 | |
| | | | |
Net realized and unrealized gains (losses) on investments | | | 259,414,550 | |
| | | | |
Net increase in net assets resulting from operations | | $ | 257,378,760 | |
| | | | |
The accompanying notes are an integral part of these financial statements.
28 | Wells Fargo Emerging Growth Portfolio
Statement of changes in net assets
| | | | | | | | |
| | | Six months ended
November 30, 2020
(unaudited) | | | Year ended
May 31, 2020 | |
|
Operations | |
Net investment loss | | $ | (2,035,790 | ) | | $ | (4,861,375 | ) |
Net realized gains on investments | | | 111,813,045 | | | | 95,687,152 | |
Net change in unrealized gains (losses) on investments | | | 147,601,505 | | | | 7,683,217 | |
| | | | |
Net increase in net assets resulting from operations | | | 257,378,760 | | | | 98,508,994 | |
| | | | |
| | |
Capital transactions | | | | | | | | |
Transactions in investors’ beneficial interests | |
Contributions | | | 40,187,039 | | | | 65,548,053 | |
Withdrawals | | | (163,115,183 | ) | | | (260,126,766 | ) |
| | | | |
Net decrease in net assets resulting from capital transactions | | | (122,928,144 | ) | | | (194,578,713 | ) |
| | | | |
Total increase (decrease) in net assets | | | 134,450,616 | | | | (96,069,719 | ) |
| | | | |
| | |
Net assets | | | | | | | | |
Beginning of period | | | 723,420,695 | | | | 819,490,414 | |
| | | | |
End of period | | $ | 857,871,311 | | | $ | 723,420,695 | |
| | | | |
The accompanying notes are an integral part of these financial statements.
Wells Fargo Emerging Growth Portfolio | 29
Financial highlights
| | | | | | | | | | | | | | | | | | | | | | | | |
| | | Six months ended
November 30, 2020
(unaudited) | | | Year ended May 31 | |
| | | 2020 | | | 2019 | | | 2018 | | | 2017 | | | 2016 | |
Total return1 | | | 38.55 | % | | | 15.49 | % | | | (0.28 | )% | | | 33.60 | % | | | 23.97 | % | | | (14.47 | )% |
Ratios to average net assets (annualized) | | | | | | | | | | | | | | | | | | | | | | | | |
Gross expenses | | | 0.81 | % | | | 0.81 | % | | | 0.81 | % | | | 0.81 | % | | | 0.81 | % | | | 0.80 | % |
Net expenses | | | 0.81 | % | | | 0.81 | % | | | 0.81 | % | | | 0.81 | % | | | 0.81 | % | | | 0.80 | % |
Net investment loss | | | (0.51 | )% | | | (0.62 | )% | | | (0.57 | )% | | | (0.47 | )% | | | (0.15 | )% | | | (0.40 | )% |
Supplemental data | | | | | | | | | | | | | | | | | | | | | | | | |
Portfolio turnover rate | | | 25 | % | | | 55 | % | | | 71 | % | | | 47 | % | | | 115 | % | | | 66 | % |
| 1 | Returns for periods of less than one year are not annualized |
The accompanying notes are an integral part of these financial statements.
30 | Wells Fargo Emerging Growth Portfolio
Notes to financial statements (unaudited)
1. ORGANIZATION
Wells Fargo Master Trust (the “Trust”), a Delaware statutory trust organized on March 10, 1999, is an open-end management investment company registered under the Investment Company Act of 1940, as amended (the “1940 Act”). As an investment company, the Trust follows the accounting and reporting guidance in Financial Accounting Standards Board (“FASB”) Accounting Standards Codification Topic 946, Financial Services – Investment Companies. These financial statements report on the Wells Fargo Emerging Growth Portfolio (the “Portfolio”) which is a diversified series of the Trust.
2. SIGNIFICANT ACCOUNTING POLICIES
The following significant accounting policies, which are consistently followed in the preparation of the financial statements of the Portfolio, are in conformity with U.S. generally accepted accounting principles which require management to make estimates and assumptions that affect the reported amounts of assets and liabilities, disclosure of contingent assets and liabilities at the date of the financial statements, and the reported amounts of revenues and expenses during the reporting period. Actual results could differ from those estimates.
Securities valuation
All investments are valued each business day as of the close of regular trading on the New York Stock Exchange (generally 4 p.m. Eastern Time), although the Portfolio may deviate from this calculation time under unusual or unexpected circumstances.
Equity securities that are listed on a foreign or domestic exchange or market are valued at the official closing price or, if none, the last sales price. If no sale occurs on the principal exchange or market that day, a fair value price will be determined in accordance with the Portfolio’s Valuation Procedures.
Investments in registered open-end investment companies are valued at net asset value. Interests in non-registered investment companies that are redeemable at net asset value are fair valued normally at net asset value.
Investments which are not valued using any of the methods discussed above are valued at their fair value, as determined in good faith by the Board of Trustees of the Portfolio. The Board of Trustees has established a Valuation Committee comprised of the Trustees and has delegated to it the authority to take any actions regarding the valuation of portfolio securities that the Valuation Committee deems necessary or appropriate, including determining the fair value of portfolio securities, unless the determination has been delegated to the Wells Fargo Asset Management Pricing Committee at Wells Fargo Funds Management, LLC (“Funds Management”). The Board of Trustees retains the authority to make or ratify any valuation decisions or approve any changes to the Valuation Procedures as it deems appropriate. On a quarterly basis, the Board of Trustees receives reports on any valuation actions taken by the Valuation Committee or the Wells Fargo Asset Management Pricing Committee which may include items for ratification.
Securities lending
The Portfolio may lend its securities from time to time in order to earn additional income in the form of fees or interest on securities received as collateral or the investment of any cash received as collateral. When securities are on loan, the Portfolio receives interest or dividends on those securities. Cash collateral received in connection with its securities lending transactions is invested in Securities Lending Cash Investments, LLC (the “Securities Lending Fund”). Investments in Securities Lending Fund are valued at the evaluated bid price provided by an independent pricing service. Income earned from investment in the Securities Lending Fund, if any, is included in securities lending income from affiliates (net of fees and rebates) on the Statement of Operations.
In a securities lending transaction, the net asset value of the Portfolio is affected by an increase or decrease in the value of the securities loaned and by an increase or decrease in the value of the instrument in which collateral is invested. The amount of securities lending activity undertaken by the Portfolio fluctuates from time to time. The Portfolio has the right under the lending agreement to recover the securities from the borrower on demand. In the event of default or bankruptcy by the borrower, the Portfolio may be prevented from recovering the loaned securities or gaining access to the collateral or may experience delays or costs in doing so. In such an event, the terms of the agreement allow the unaffiliated securities lending agent to use the collateral to purchase replacement securities on behalf of the Portfolio or pay the Portfolio the market value of the loaned securities. The Portfolio bears the risk of loss with respect to depreciation of its investment of the cash collateral.
Security transactions and income recognition
Securities transactions are recorded on a trade date basis. Realized gains or losses are recorded on the basis of identified cost.
Dividend income is recognized on the ex-dividend date.
Wells Fargo Emerging Growth Portfolio | 31
Notes to financial statements (unaudited)
Federal and other taxes
The Portfolio is treated as a separate entity for federal income tax purposes. The Portfolio is not required to pay federal income taxes on its net investment income and net capital gains as it is treated as a partnership for federal income tax purposes. All dividends, gains and losses of the Portfolio are deemed to have been “passed through” to the interest holders in proportion to their holdings of the Portfolio regardless of whether dividends and gains have been distributed by the Portfolio.
The Portfolio’s income tax returns and all financial records supporting those returns for the prior three fiscal years are subject to examination by the federal revenue authority. Management has analyzed the Portfolio’s tax positions taken on federal, state, and foreign tax returns for all open tax years and does not believe that there are any uncertain tax positions that require recognition of a tax liability.
As of November 30, 2020, the aggregate cost of all investments for federal income tax purposes was $460,907,255 and the unrealized gains (losses) consisted of:
| | | | |
| |
Gross unrealized gains | | $ | 413,194,476 | |
| |
Gross unrealized losses | | | (1,150,275 | ) |
| |
Net unrealized gains | | $ | 412,044,201 | |
3. FAIR VALUATION MEASUREMENTS
Fair value measurements of investments are determined within a framework that has established a fair value hierarchy based upon the various data inputs utilized in determining the value of the Portfolio’s investments. The three-level hierarchy gives the highest priority to unadjusted quoted prices in active markets for identical assets or liabilities (Level 1) and the lowest priority to unobservable inputs (Level 3). The Portfolio’s investments are classified within the fair value hierarchy based on the lowest level of input that is significant to the fair value measurement. The inputs are summarized into three broad levels as follows:
| ∎ | | Level 1 – quoted prices in active markets for identical securities |
| ∎ | | Level 2 – other significant observable inputs (including quoted prices for similar securities, interest rates, prepayment speeds, credit risk, etc.) |
| ∎ | | Level 3 – significant unobservable inputs (including the Portfolio’s own assumptions in determining the fair value of investments) |
The inputs or methodologies used for valuing investments in securities are not necessarily an indication of the risk associated with investing in those securities.
The following is a summary of the inputs used in valuing the Portfolio’s assets and liabilities as of November 30, 2020:
| | | | | | | | | | | | | | | | |
| | | | |
| | | Quoted prices
(Level 1) | | | Other significant
observable inputs
(Level 2) | | | Significant
unobservable inputs (Level 3) | | | Total | |
| | | | |
Assets | | | | | | | | | | | | | | | | |
Investments in: | | | | | | | | | | | | | | | | |
| | | | |
Common stocks | | | | | | | | | | | | | | | | |
| | | | |
Communication services | | $ | 13,548,015 | | | $ | 0 | | | $ | 0 | | | $ | 13,548,015 | |
| | | | |
Consumer discretionary | | | 122,967,652 | | | | 0 | | | | 0 | | | | 122,967,652 | |
| | | | |
Consumer staples | | | 36,261,755 | | | | 0 | | | | 0 | | | | 36,261,755 | |
| | | | |
Financials | | | 54,266,198 | | | | 0 | | | | 0 | | | | 54,266,198 | |
| | | | |
Health care | | | 269,089,866 | | | | 0 | | | | 0 | | | | 269,089,866 | |
| | | | |
Industrials | | | 113,869,779 | | | | 0 | | | | 0 | | | | 113,869,779 | |
| | | | |
Information technology | | | 218,812,354 | | | | 0 | | | | 0 | | | | 218,812,354 | |
| | | | |
Real estate | | | 12,448,774 | | | | 0 | | | | 0 | | | | 12,448,774 | |
| | | | |
Utilities | | | 4,265,901 | | | | 0 | | | | 0 | | | | 4,265,901 | |
| | | | |
Short-term investments | | | | | | | | | | | | | | | | |
| | | | |
Investment companies | | | 27,421,162 | | | | 0 | | | | 0 | | | | 27,421,162 | |
| | | | |
Total assets | | $ | 872,951,456 | | | $ | 0 | | | $ | 0 | | | $ | 872,951,456 | |
32 | Wells Fargo Emerging Growth Portfolio
Notes to financial statements (unaudited)
Additional sector, industry or geographic detail is included in the Portfolio of Investments.
For the six months ended November 30, 2020, the Portfolio did not have any transfers into/out of Level 3.
4. TRANSACTIONS WITH AFFILIATES
Advisory fee
The Trust has entered into an advisory contract with Funds Management, an indirect wholly owned subsidiary of Wells Fargo & Company (“Wells Fargo”). The adviser is responsible for implementing investment policies and guidelines and for supervising the subadviser, who is responsible for day-to-day portfolio management of the Portfolio. Pursuant to the contract, Funds Management is entitled to receive an annual advisory fee at the following annual rate based on the Portfolio’s average daily net assets:
| | | | |
| |
| Average daily net assets | | Advisory fee | |
| |
First $500 million | | | 0.800 | % |
| |
Next $500 million | | | 0.775 | |
| |
Next $1 billion | | | 0.750 | |
| |
Next $1 billion | | | 0.725 | |
| |
Next $1 billion | | | 0.700 | |
| |
Over $4 billion | | | 0.680 | |
For the six months ended November 30, 2020, the advisory fee was equivalent to an annual rate of 0.79% of the Portfolio’s average daily net assets.
Funds Management has retained the services of a subadviser to provide daily portfolio management to the Portfolio. The fee for subadvisory services is borne by Funds Management. Wells Capital Management Incorporated (“WellsCap”), an affiliate of Funds Management and an indirect wholly owned subsidiary of Wells Fargo is the subadviser to the Portfolio and is entitled to receive a fee from Funds Management at an annual rate starting at 0.55% and declining to 0.40% as the average daily net assets of the Portfolio increase.
Interfund transactions
The Portfolio may purchase or sell portfolio investment securities to certain other Wells Fargo affiliates pursuant to Rule 17a-7 under the 1940 Act and under procedures adopted by the Board of Trustees. The procedures have been designed to ensure that these interfund transactions, which do not incur broker commissions, are effected at current market prices.
5. INVESTMENT PORTFOLIO TRANSACTIONS
Purchases and sales of investments, excluding U.S. government obligations (if any) and short-term securities, for the six months ended November 30, 2020 were $192,437,811 and $311,568,229, respectively.
6. SECURITIES LENDING TRANSACTIONS
The Portfolio lends its securities through an unaffiliated securities lending agent and receives collateral in the form of cash or securities with a value at least equal to the value of the securities on loan. The value of the loaned securities is determined at the close of each business day and any increases or decreases in the required collateral are exchanged between the Portfolio and the counterparty on the next business day. Cash collateral received is invested in the Securities Lending Fund which seeks to provide a positive return compared to the daily Fed Funds Open Rate by investing in high-quality, U.S. dollar-denominated short-term money market instruments and is exempt from registration under Section 3(c)(7) of the 1940 Act. Securities Lending Fund is managed by Funds Management and is subadvised by WellsCap. Funds Management receives an advisory fee starting at 0.05% and declining to 0.01% as the average daily net assets of the Securities Lending Fund increase. All of the fees received by Funds Management are paid to WellsCap for its services as subadviser.
Wells Fargo Emerging Growth Portfolio | 33
Notes to financial statements (unaudited)
In the event of counterparty default or the failure of a borrower to return a loaned security, the Portfolio has the right to use the collateral to offset any losses incurred. As of November 30, 2020, the Portfolio had securities lending transactions with the following counterparties which are subject to offset:
| | | | | | | | | | | | |
| | | |
| Counterparty | | Value of securities on loan | | | Collateral
received1 | | | Net amount | |
| | | |
Bank of America Securities Inc. | | $ | 1,172,371 | | | $ | (1,172,371 | ) | | $ | 0 | |
| | | |
Barclays Capital Inc. | | | 2,887,796 | | | | (2,887,796 | ) | | | 0 | |
| | | |
BMO Capital Markets Corp. | | | 229,554 | | | | (229,554 | ) | | | 0 | |
| | | |
Morgan Stanley & Co. LLC | | | 5,090,417 | | | | (5,090,417 | ) | | | 0 | |
| | | |
National Financial Services LLC | | | 2,678,487 | | | | (2,678,487 | ) | | | 0 | |
| | | |
UBS Securities LLC | | | 640,700 | | | | (640,700 | ) | | | 0 | |
| 1 | Collateral received within this table is limited to the collateral for the net transaction with the counterparty. |
7. BANK BORROWINGS
The Trust, along with Wells Fargo Variable Trust and Wells Fargo Funds Trust (excluding the money market funds), are parties to a $350,000,000 revolving credit agreement whereby the Portfolio is permitted to use bank borrowings for temporary or emergency purposes, such as to fund shareholder redemption requests. Interest under the credit agreement is charged to the Portfolio based on a borrowing rate equal to the higher of the Federal Funds rate in effect on that day plus 1.25% or the overnight LIBOR rate in effect on that day plus 1.25%. In addition, an annual commitment fee equal to 0.25% of the unused balance is allocated to each participating fund.
For the six months ended November 30, 2020, there were no borrowings by the Portfolio under the agreement.
8. CONCENTRATION RISKS
Concentration risks result from exposure to a limited number of sectors. As of the end of the period, the portfolio concentrated its portfolio in investments related to the health care and information technology sectors. A fund that invests a substantial portion of its assets in any sector may be more affected by changes in that sector than would be a fund whose investments are not heavily weighted in any sector.
9. INDEMNIFICATION
Under the Portfolio’s organizational documents, the officers and Trustees have been granted certain indemnification rights against certain liabilities that may arise out of performance of their duties to the Portfolio. The Portfolio has entered into a separate agreement with each Trustee that converts indemnification rights currently existing under the Portfolio’s organizational documents into contractual rights that cannot be changed in the future without the consent of the Trustee. Additionally, in the normal course of business, the Portfolio may enter into contracts with service providers that contain a variety of indemnification clauses. The Portfolio’s maximum exposure under these arrangements is dependent on future claims that may be made against the Portfolio and, therefore, cannot be estimated.
10. NEW ACCOUNTING PRONOUNCEMENT
In August 2018, FASB issued Accounting Standards Update (“ASU”) No. 2018-13, Fair Value Measurement (Topic 820) Disclosure Framework—Changes to the Disclosure Requirements for Fair Value Measurement. ASU 2018-13 updates the disclosure requirements on fair value measurements in Topic 820, Fair Value Measurements. The amendments are effective for fiscal years, and interim periods within those fiscal years, beginning after December 15, 2019. Management has adopted this guidance which did not have a material impact on the financial statements.
11. CORONAVIRUS (COVID-19) PANDEMIC
On March 11, 2020, the World Health Organization announced that it had made the assessment that coronavirus disease 2019 (“COVID-19”) is a pandemic. The impacts of COVID-19 are adversely affecting the entire global economy, individual companies and investment products, and the market in general. There is significant uncertainty around the extent and duration of business disruptions related to COVID-19 and the impacts may be short term or may last for an extended period of time. The risk of further spreading of COVID-19 has led to significant uncertainty and volatility in the financial markets. The value of the Portfolio and the securities in which the Portfolio invests have generally been adversely affected by impacts caused by COVID-19.
34 | Wells Fargo Emerging Growth Portfolio
Other information (unaudited)
PROXY VOTING INFORMATION
A description of the policies and procedures used to determine how to vote proxies relating to portfolio securities is available, upon request, by calling 1-800-222-8222, visiting our website at wfam.com, or visiting the SEC website at sec.gov. Information regarding how the proxies related to portfolio securities were voted during the most recent 12-month period ended June 30 is available on the website at wfam.com or by visiting the SEC website at sec.gov.
QUARTERLY PORTFOLIO HOLDINGS INFORMATION
The Fund and Portfolio file their complete schedule of portfolio holdings with the SEC for the first and third quarters of each fiscal year as an exhibit to its reports on Form N-PORT. Shareholders may view the filed Form N-PORT by visiting the SEC website at sec.gov.
Wells Fargo Emerging Growth Fund | 35
Other information (unaudited)
BOARD OF TRUSTEES AND OFFICERS
Each of the Trustees and Officers1 listed in the table below acts in identical capacities for each fund in the Wells Fargo family of funds, which consists of 144 mutual funds comprising the Wells Fargo Funds Trust, Wells Fargo Variable Trust, Wells Fargo Master Trust and four closed-end funds (collectively the “Fund Complex”). This table should be read in conjunction with the Prospectus and the Statement of Additional Information2. The mailing address of each Trustee and Officer is 525 Market Street, 12th Floor, San Francisco, CA 94105. Each Trustee and Officer serves an indefinite term, however, each Trustee serves such term until reaching the mandatory retirement age established by the Trustees.
Independent Trustees
| | | | | | |
Name and
year of birth | | Position held and
length of service* | | Principal occupations during past five years or longer | | Current other
public company or
investment
company
directorships |
| | | |
| William R. Ebsworth (Born 1957) | | Trustee, since 2015 | | Retired. From 1984 to 2013, equities analyst, portfolio manager, research director and chief investment officer at Fidelity Management and Research Company in Boston, Tokyo, and Hong Kong, and retired in 2013 as Chief Investment Officer of Fidelity Strategic Advisers, Inc. where he led a team of investment professionals managing client assets. Prior thereto, Board member of Hong Kong Securities Clearing Co., Hong Kong Options Clearing Corp., the Thailand International Fund, Ltd., Fidelity Investments Life Insurance Company, and Empire Fidelity Investments Life Insurance Company. Audit Committee Chair and Investment Committee Chair of the Vincent Memorial Hospital Endowment (non-profit organization). Mr. Ebsworth is a CFA® charterholder. | | N/A |
| | | |
| Jane A. Freeman (Born 1953) | | Trustee, since 2015; Chair Liaison, since 2018 | | Retired. From 2012 to 2014 and 1999 to 2008, Chief Financial Officer of Scientific Learning Corporation. From 2008 to 2012, Ms. Freeman provided consulting services related to strategic business projects. Prior to 1999, Portfolio Manager at Rockefeller & Co. and Scudder, Stevens & Clark. Board member of the Harding Loevner Funds from 1996 to 2014, serving as both Lead Independent Director and chair of the Audit Committee. Board member of the Russell Exchange Traded Funds Trust from 2011 to 2012 and the chair of the Audit Committee. Ms. Freeman is also an inactive Chartered Financial Analyst. | | N/A |
| | | |
| Isaiah Harris, Jr. (Born 1952) | | Trustee, since 2009; Audit Committee Chair, since 2019 | | Retired. Chairman of the Board of CIGNA Corporation since 2009, and Director since 2005. From 2003 to 2011, Director of Deluxe Corporation. Prior thereto, President and CEO of BellSouth Advertising and Publishing Corp. from 2005 to 2007, President and CEO of BellSouth Enterprises from 2004 to 2005 and President of BellSouth Consumer Services from 2000 to 2003. Emeritus member of the Iowa State University Foundation Board of Governors. Emeritus Member of the Advisory Board of Iowa State University School of Business. Advisory Board Member, Palm Harbor Academy (private school). Mr. Harris is a certified public accountant (inactive status). | | CIGNA Corporation |
| | | |
| Judith M. Johnson (Born 1949) | | Trustee, since 2008 | | Retired. Prior thereto, Chief Executive Officer and Chief Investment Officer of Minneapolis Employees Retirement Fund from 1996 to 2008. Ms. Johnson is an attorney, certified public accountant and a certified managerial accountant. | | N/A |
| | | |
| David F. Larcker (Born 1950) | | Trustee, since 2009 | | James Irvin Miller Professor of Accounting at the Graduate School of Business (Emeritus), Stanford University, Director of the Corporate Governance Research Initiative and Senior Faculty of The Rock Center for Corporate Governance since 2006. From 2005 to 2008, Professor of Accounting at the Graduate School of Business, Stanford University. Prior thereto, Ernst & Young Professor of Accounting at The Wharton School, University of Pennsylvania from 1985 to 2005. | | N/A |
36 | Wells Fargo Emerging Growth Fund
Other information (unaudited)
| | | | | | |
Name and
year of birth | | Position held and
length of service* | | Principal occupations during past five years or longer | | Current other
public company or
investment
company
directorships |
| | | |
| Olivia S. Mitchell (Born 1953) | | Trustee, since 2006; Nominating and Governance Committee Chair, since 2018 | | International Foundation of Employee Benefit Plans Professor, Wharton School of the University of Pennsylvania since 1993. Director of Wharton’s Pension Research Council and Boettner Center on Pensions & Retirement Research, and Research Associate at the National Bureau of Economic Research. Previously, Cornell University Professor from 1978 to 1993. | | N/A |
| | | |
| Timothy J. Penny (Born 1951) | | Trustee, since 1996; Chair, since 2018 | | President and Chief Executive Officer of Southern Minnesota Initiative Foundation, a non-profit organization, since 2007. Member of the Board of Trustees of NorthStar Education Finance, Inc., a non-profit organization, since 2007. | | N/A |
| | | |
| James G. Polisson (Born 1959) | | Trustee, since 2018 | | Retired. Chief Marketing Officer, Source (ETF) UK Services, Ltd, from 2015 to 2017. From 2012 to 2015, Principal of The Polisson Group, LLC, a management consulting, corporate advisory and principal investing company. Chief Executive Officer and Managing Director at Russell Investments, Global Exchange Traded Funds from 2010 to 2012. Managing Director of Barclays Global Investors from 1998 to 2010 and Global Chief Marketing Officer for iShares and Barclays Global Investors from 2000 to 2010. Trustee of the San Francisco Mechanics’ Institute, a non-profit organization, from 2013 to 2015. Board member of the Russell Exchange Traded Fund Trust from 2011 to 2012. Director of Barclays Global Investors Holdings Deutschland GmbH from 2006 to 2009. Mr. Polisson is an attorney and has a retired status with the Massachusetts and District of Columbia Bar Associations. | | N/A |
| | | |
| Pamela Wheelock (Born 1959) | | Trustee, since January 2020; previously Trustee from January 2018 to July 2019 | | Board member of the Destination Medical Center Economic Development Agency, Rochester, Minnesota since 2019. Interim President of the McKnight Foundation from January to September 2020. Acting Commissioner, Minnesota Department of Human Services, July 2019 through September 2019. Human Services Manager (part-time), Minnesota Department of Human Services, October 2019 through December 2019. Chief Operating Officer, Twin Cities Habitat for Humanity from 2017 to 2019. Vice President of University Services, University of Minnesota from 2012 to 2016. Prior thereto, on the Board of Directors, Governance Committee and Finance Committee for the Minnesota Philanthropy Partners (Saint Paul Foundation) from 2012 to 2018, Interim Chief Executive Officer of Blue Cross Blue Shield of Minnesota from 2011 to 2012, Chairman of the Board from 2009 to 2012 and Board Director from 2003 to 2015. Vice President, Leadership and Community Engagement, Bush Foundation, Saint Paul, Minnesota (a private foundation) from 2009 to 2011. Executive Vice President and Chief Financial Officer, Minnesota Sports and Entertainment from 2004 to 2009 and Senior Vice President from 2002 to 2004. Executive Vice President of the Minnesota Wild Foundation from 2004 to 2008. Commissioner of Finance, State of Minnesota, from 1999 to 2002. Currently Board Chair of the Minnesota Wild Foundation since 2010. | | N/A |
| * | Length of service dates reflect the Trustee’s commencement of service with the Trust’s predecessor entities, where applicable. |
Wells Fargo Emerging Growth Fund | 37
Other information (unaudited)
Officers
| | | | |
Name and
year of birth | | Position held and
length of service | | Principal occupations during past five years or longer |
| | |
| Andrew Owen (Born 1960) | | President, since 2017 | | Executive Vice President of Wells Fargo & Company and Head of Affiliated Managers, Wells Fargo Asset Management, since 2014. In addition, Mr. Owen is currently President, Chief Executive Officer and Director of Wells Fargo Funds Management, LLC since 2017. Prior thereto, Executive Vice President responsible for marketing, investments and product development for Wells Fargo Funds Management, LLC, from 2009 to 2014. |
| | |
| Nancy Wiser1 (Born 1967) | | Treasurer, since 2012 | | Executive Vice President of Wells Fargo Funds Management, LLC since 2011. Chief Operating Officer and Chief Compliance Officer at LightBox Capital Management LLC, from 2008 to 2011. |
| | |
| Michelle Rhee (Born 1966) | | Chief Legal Officer, since 2019 | | Secretary of Wells Fargo Funds Management, LLC and Chief Legal Counsel of Wells Fargo Asset Management since 2018. Deputy General Counsel of Wells Fargo Bank, N.A. since 2020 and Assistant General Counsel of Wells Fargo Bank, N.A. from 2018 to 2020. Associate General Counsel and Managing Director of Bank of America Corporation from 2004 to 2018. |
| | |
| Catherine Kennedy (Born 1969) | | Secretary, since 2019 | | Vice President of Wells Fargo Funds Management, LLC and Senior Counsel of the Wells Fargo Legal Department since 2010. Vice President and Senior Counsel of Evergreen Investment Management Company, LLC from 1998 to 2010. |
| | |
| Michael H. Whitaker (Born 1967) | | Chief Compliance Officer, since 2016 | | Chief Compliance Officer of Wells Fargo Asset Management since 2016. Senior Vice President and Chief Compliance Officer for Fidelity Investments from 2007 to 2016. |
| | |
| Jeremy DePalma1 (Born 1974) | | Assistant Treasurer, since 2009 | | Senior Vice President of Wells Fargo Funds Management, LLC since 2009. Senior Vice President of Evergreen Investment Management Company, LLC from 2008 to 2010 and head of the Fund Reporting and Control Team within Fund Administration from 2005 to 2010. |
| 1 | Nancy Wiser acts as Treasurer of 67 funds in the Fund Complex. Jeremy DePalma acts as the Treasurer of 77 funds and Assistant Treasurer of 67 funds in the Fund Complex. |
| 2 | The Statement of Additional Information includes additional information about the Trustees and is available, without charge, upon request, by calling 1-800-222-8222 or by visiting the website at wfam.com. |
38 | Wells Fargo Emerging Growth Fund
This page is intentionally left blank.
This page is intentionally left blank.

For more information
More information about Wells Fargo Funds is available free upon request. To obtain literature, please write, visit the Fund’s website, or call:
Wells Fargo Funds
P.O. Box 219967
Kansas City, MO 64121-9967
Website: wfam.com
Individual investors: 1-800-222-8222
Retail investment professionals: 1-888-877-9275
Institutional investment professionals: 1-866-765-0778

This report and the financial statements contained herein are submitted for the general information of the shareholders of the Fund. If this report is used for promotional purposes, distribution of the report must be accompanied or preceded by a current prospectus. Before investing, please consider the investment objectives, risks, charges, and expenses of the investment. For a current prospectus and, if available, a summary prospectus, containing this information, call 1-800-222-8222 or visit the Fund’s website at wfam.com. Read the prospectus carefully before you invest or send money.
Wells Fargo Asset Management (WFAM) is the trade name for certain investment advisory/management firms owned by Wells Fargo & Company. These firms include but are not limited to Wells Capital Management Incorporated and Wells Fargo Funds Management, LLC. Certain products managed by WFAM entities are distributed by Wells Fargo Funds Distributor, LLC (a broker-dealer and Member FINRA).
This material is for general informational and educational purposes only and is NOT intended to provide investment advice or a recommendation of any kind—including a recommendation for any specific investment, strategy, or plan.
INVESTMENT PRODUCTS: NOT FDIC INSURED ◾ NO BANK GUARANTEE ◾ MAY LOSE VALUE
© 2021 Wells Fargo & Company. All rights reserved.
PAR-1220-00728 01-20
SA282/SAR282 11-20
Semi-Annual Report
November 30, 2020
Wells Fargo Index Fund
|
|
|
Reduce clutter. Save trees. |
Sign up for electronic delivery of prospectuses and
shareholder reports at wellsfargo.com/
advantagedelivery |
The views expressed and any forward-looking statements are as of November 30, 2020, unless otherwise noted, and are those of the Fund’s portfolio managers and/or Wells Fargo Asset Management. Discussions of individual securities, or the markets generally, or any Wells Fargo Fund are not intended as individual recommendations. Future events or results may vary significantly from those expressed in any forward-looking statements. The views expressed are subject to change at any time in response to changing circumstances in the market. Wells Fargo Asset Management and the Fund disclaim any obligation to publicly update or revise any views expressed or forward-looking statements.
INVESTMENT PRODUCTS: NOT FDIC INSURED ◾ NO BANK GUARANTEE ◾ MAY LOSE VALUE
Wells Fargo Index Fund | 1
Letter to shareholders (unaudited)

Andrew Owen
President
Wells Fargo Funds
“Global stock markets rallied strongly, driven by aggressive stimulus measures introduced by central banks and governments in response to challenges presented by the COVID-19 pandemic.”
Dear Shareholder:
We are pleased to offer you this semi-annual report for the Wells Fargo Index Fund for the six-month period that ended November 30, 2020. Global stock markets rallied strongly, driven by aggressive stimulus measures introduced by central banks and governments in response to challenges presented by the COVID-19 pandemic. Emerging market equities had particularly robust results during the six-month period. Among bonds, high-yield issues led the way while U.S. bonds generally had more modest returns than their international counterparts.
For the period, U.S. stocks, based on the S&P 500 Index,1 returned 19.98% and international stocks, as measured by the MSCI ACWI ex USA Index (Net),2 gained 23.28%. The MSCI EM Index (Net)3 rallied 31.14%. Among bond investments, the Bloomberg Barclays U.S. Aggregate Bond Index4 returned a modest 1.79%, the Bloomberg Barclays Global Aggregate ex-USD Index5 gained a robust 8.19%, the Bloomberg Barclays Municipal Bond Index6 had a 3.29% return, and the ICE BofA U.S. High Yield Index7 gained a healthy 10.47%.
Equities enjoyed a strong tailwind from monetary and fiscal stimulus.
Financial markets posted widely positive returns in June despite ongoing economic weakness and uncertainty regarding COVID-19 and the timing of an effective vaccine. As economies reopened, optimism rose. Vitally important to market sentiment was the ongoing global central bank commitment to provide economic support through liquidity and low borrowing costs. U.S. economic activity was boosted by one-time $1,200 stimulus checks and $600 weekly bonus unemployment benefits for tens of millions of Americans through July. However, jobless rates remained historically high, easing somewhat from 14.7% in April to 11.1% in June. By late June, numerous states reported increases of COVID-19 cases, an ominous sign. China’s economic recovery picked up momentum in June.
July was broadly positive for both global equities and fixed income. However, economic data and a resurgence of COVID-19 cases pointed to the vulnerability of the global economy and the need to regain control of the pandemic. Second-quarter gross domestic product (GDP) shrank from the previous quarter by 9.5% and 12.1% in the U.S. and the eurozone, respectively. In contrast, China reported 3.2% year-over-year second-quarter GDP growth. U.S. unemployment remained high despite adding 1.8 million jobs in July, as a double-digit jobless rate persisted. However, manufacturing activity grew in both the U.S. and the eurozone. In Asia, while China’s manufacturing sector continued to expand, activity in Japan and South Korea contracted. A rising concern was the rapid and broad reemergence of COVID-19 infections.
| 1 | The S&P 500 Index consists of 500 stocks chosen for market size, liquidity, and industry group representation. It is a market-value-weighted index with each stock’s weight in the index proportionate to its market value. You cannot invest directly in an index. |
| 2 | The Morgan Stanley Capital International (MSCI) All Country World Index (ACWI) ex USA Index (Net) is a free-float-adjusted market-capitalization-weighted index that is designed to measure the equity market performance of developed and emerging markets, excluding the United States. Source: MSCI. MSCI makes no express or implied warranties or representations and shall have no liability whatsoever with respect to any MSCI data contained herein. The MSCI data may not be further redistributed or used as a basis for other indices or any securities or financial products. This report is not approved, reviewed, or produced by MSCI. You cannot invest directly in an index. |
| 3 | The MSCI Emerging Markets (EM) Index (Net) is a free-float-adjusted market-capitalization-weighted index that is designed to measure equity market performance of emerging markets. You cannot invest directly in an index. |
| 4 | The Bloomberg Barclays U.S. Aggregate Bond Index is a broad-based benchmark that measures the investment-grade, U.S. dollar-denominated, fixed-rate taxable bond market, including Treasuries, government-related and corporate securities, mortgage-backed securities (agency fixed-rate and hybrid adjustable-rate mortgage pass-throughs), asset-backed securities, and commercial mortgage-backed securities. You cannot invest directly in an index. |
| 5 | The Bloomberg Barclays Global Aggregate ex-USD Index is an unmanaged index that provides a broad-based measure of the global investment-grade fixed-income markets excluding the U.S. dollar-denominated debt market. You cannot invest directly in an index. |
| 6 | The Bloomberg Barclays Municipal Bond Index is an unmanaged index composed of long-term tax-exempt bonds with a minimum credit rating of Baa. You cannot invest directly in an index. |
| 7 | The ICE BofA U.S. High Yield Index is a market-capitalization-weighted index of domestic and Yankee high-yield bonds. The index tracks the performance of high-yield securities traded in the U.S. bond market. You cannot invest directly in an index. Copyright 2021. ICE Data Indices, LLC. All rights reserved. |
2 | Wells Fargo Index Fund
Letter to shareholders (unaudited)
The stock market continued to rally in August despite concerns over rising COVID-19 cases in the U.S. and Europe, as well as the expiration of the $600 weekly bonus unemployment benefit in July. Generally stronger-than-expected second-quarter earnings boosted investor sentiment along with the Federal Reserve’s announcement of a more accommodative policy shift that could lead to longer-term low interest rates. U.S. indices measuring manufacturing and services activities beat expectations while the U.S. housing market maintained strength. In Europe, retail sales expanded and consumer confidence was steady. China’s economy continued to expand.
Stocks grew more volatile in September on mixed economic data. U.S. economic activity continued to grow. However, only half of the 22 million jobs lost since the early spring had returned. The U.S. unemployment rate fell to 7.9% in September, a measurable improvement but far higher than the 3.5% pre-COVID-19 rate. Only 661,000 jobs were added for the month, down from 1.5 million in August. With the U.S. Congress failing to pass further fiscal relief and uncertainties surrounding a possible vaccine, doubts crept back into the markets. In the U.K., a lack of progress in Brexit talks with the European Union weighed on markets. China’s economy picked up steam, however, with growth fueled by increased global demand.
In October, capital markets took a step back from their six-month rally. Market volatility rose in advance of the U.S. election and amid a global increase in COVID-19 infections. Europe responded with more economic restrictions. Meanwhile, Brexit remained unresolved. U.S. markets looked favorably at a possible Democratic sweep and control of the federal purse strings in anticipation of additional fiscal stimulus, which could boost economic activity. Meanwhile, China continued to stand apart, reporting 4.9% third-quarter GDP growth year over year.
Global stocks rallied broadly in November, propelled by optimism over three promising COVID-19 vaccines, which reported high effectiveness in trials. Global stock indices notched double-digit monthly gains. In a reversal of recent trends, value stocks outperformed growth and cyclical stocks outpaced technology stocks. However, U.S. unemployment remained elevated, with a net job loss of 10 million since February. The Eurozone Services Purchasing Managers’ Index, a monthly survey of purchasing managers, contracted sharply while the region’s manufacturing activity gauge indicated growth. The U.S. election results added to the market’s upbeat mood as investors gave thumbs-up to the certainty of the outcome after an unusual delay and anticipated more consistent policies in the new administration.
Don’t let short-term uncertainty derail long-term investment goals.
Periods of investment uncertainty can present challenges, but experience has taught us that maintaining long-term investment goals can be an effective way to plan for the future. To help you create a sound strategy based on your personal goals and risk tolerance, Wells Fargo Funds offers more than 100 mutual funds spanning a wide range of asset classes and investment styles. Although diversification cannot guarantee an investment profit or prevent losses, we believe it can be an effective way to manage investment risk and potentially smooth out overall portfolio performance. We encourage investors to know their investments and to understand that appropriate levels of risk-taking may unlock opportunities.
Thank you for choosing to invest with Wells Fargo Funds. We appreciate your confidence in us and remain committed to helping you meet your financial needs.
Sincerely,

Andrew Owen
President
Wells Fargo Funds
“Global stocks rallied broadly in November, propelled by optimism over three promising COVID-19 vaccines, which reported high effectiveness in trials.”
|
|
|
For further information about your Fund, contact your investment professional, visit our website at wfam.com, or call us directly at 1-800-222-8222. |
Wells Fargo Index Fund | 3
Letter to shareholders (unaudited)
Notice to Shareholders
At a meeting held on August 10-12, 2020, the Board of Trustees of the Fund approved a change to the Fund’s automatic conversion feature for Class C shares in order to shorten the required holding period from 10 to 8 years. As a result, on a monthly basis beginning November 5, 2020, Class C shares will convert automatically into Class A shares 8 years after the initial date of purchase or, if you acquired your Class C shares through an exchange or conversion from another share class, 8 years after the date you acquired your Class C shares. When Class C shares that you acquired through a purchase or exchange convert, any other Class C shares that you purchased with reinvested dividends and distributions also will convert into Class A shares on a pro rata basis.
Please note that a shorter holding period may apply depending on your intermediary. Please see “Appendix A—Sales Charge Reductions and Waivers for Certain Intermediaries” in the Fund’s prospectus for further information.
4 | Wells Fargo Index Fund
This page is intentionally left blank.
Performance highlights (unaudited)
Investment objective
The Fund seeks to replicate the total return of S&P 500 Index, before fees and expenses.
Manager
Wells Fargo Funds Management, LLC
Subadviser for the affiliated master portfolio1
Wells Capital Management Incorporated
Portfolio managers
John R. Campbell, CFA®‡
David Neal, CFA®‡
Robert M. Wicentowski, CFA®‡
Average annual total returns (%) as of November 30, 2020
| | | | | | | | | | | | | | | | | | | | | | | | | | | | | | | | | | |
| | | | |
| | | | | Including sales charge | | | Excluding sales charge | | | Expense ratios2 (%) | |
| | | | | | | | | |
| | | Inception date | | 1 year | | | 5 year | | | 10 year | | | 1 year | | | 5 year | | | 10 year | | | Gross | | | Net3 | |
| | | | | | | | | | |
| Class A (WFILX) | | 11-4-1998 | | | 9.92 | | | | 12.08 | | | | 12.93 | | | | 16.62 | | | | 13.42 | | | | 13.60 | | | | 0.67 | | | | 0.45 | |
| | | | | | | | | | |
| Class C (WFINX) | | 4-30-1999 | | | 14.88 | | | | 12.60 | | | | 12.77 | | | | 15.88 | | | | 12.60 | | | | 12.77 | | | | 1.42 | | | | 1.20 | |
| | | | | | | | | | |
| Administrator Class (WFIOX) | | 2-14-1985 | | | – | | | | – | | | | – | | | | 16.84 | | | | 13.64 | | | | 13.89 | | | | 0.44 | | | | 0.25 | |
| | | | | | | | | | |
| S&P 500 Index4 | | – | | | – | | | | – | | | | – | | | | 17.46 | | | | 13.99 | | | | 14.19 | | | | – | | | | – | |
Figures quoted represent past performance, which is no guarantee of future results, and do not reflect taxes that a shareholder may pay on an investment in a fund. Investment return and principal value of an investment will fluctuate so that an investor’s shares, when redeemed, may be worth more or less than their original cost. Performance shown without sales charges would be lower if sales charges were reflected. Current performance may be lower or higher than the performance data quoted, which assumes the reinvestment of dividends and capital gains. Current month-end performance is available on the Fund’s website, wfam.com.
Index returns do not include transaction costs associated with buying and selling securities, any mutual fund fees or expenses, or any taxes. It is not possible to invest directly in an index.
For Class A shares, the maximum front-end sales charge is 5.75%. For Class C shares, the maximum contingent deferred sales charge is 1.00%. Performance including a contingent deferred sales charge assumes the sales charge for the corresponding time period. Administrator Class shares are sold without a front-end sales charge or contingent deferred sales charge.
Stock values fluctuate in response to the activities of individual companies and general market and economic conditions. The use of derivatives may reduce returns and/or increase volatility. Consult the Fund’s prospectus for additional information on these and other risks.
Please see footnotes on page 7.
6 | Wells Fargo Index Fund
Performance highlights (unaudited)
| | | | |
|
| Ten largest holdings (%) as of November 30, 20205 | |
| | |
Apple Incorporated | | | 6.41 | |
| | |
Microsoft Corporation | | | 5.43 | |
| | |
Amazon.com Incorporated | | | 4.52 | |
| | |
Facebook Incorporated Class A | | | 2.23 | |
| | |
Alphabet Incorporated Class A | | | 1.77 | |
| | |
Alphabet Incorporated Class C | | | 1.73 | |
| | |
Berkshire Hathaway Incorporated Class B | | | 1.52 | |
| | |
Johnson & Johnson | | | 1.28 | |
| | |
JPMorgan Chase & Company | | | 1.20 | |
| | |
Visa Incorporated Class A | | | 1.19 | |
|
|
| Sector allocation as of November 30, 20206 |
| |
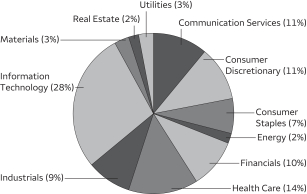
|
| ‡ | CFA® and Chartered Financial Analyst® are trademarks owned by CFA Institute. |
| 1 | The Fund is a feeder fund in a master-feeder structure that invests substantially all of its assets in a single affiliated master portfolio of the Wells Fargo Master Trust with a substantially identical investment objective and substantially similar investment strategies. References to the investment activities of the Fund are intended to refer to the investment activities of the affiliated master portfolio in which it invests. |
| 2 | Reflects the expense ratios as stated in the most recent prospectuses. The expense ratios shown are subject to change and may differ from the annualized expense ratios shown in the financial highlights of this report. |
| 3 | The manager has contractually committed through September 30, 2021, to waive fees and/or reimburse expenses to the extent necessary to cap total annual fund operating expenses after fee waivers at 0.45% for Class A, 1.20% for Class C, and 0.25% for Administrator Class. Brokerage commissions, stamp duty fees, interest, taxes, acquired fund fees and expenses (if any) from funds in which the affiliated master portfolios invest and from money market funds, and extraordinary expenses are excluded from the expense caps. Net expenses from the affiliated master portfolio are included in the expense caps. Prior to or after the commitment expiration date, the caps may be increased or the commitment to maintain the caps may be terminated only with the approval of the Board of Trustees. Without these caps, the Fund’s returns would have been lower. The expense ratio paid by an investor is the net expense ratio (the total annual fund operating expenses after fee waivers) as stated in the prospectuses. |
| 4 | The S&P 500 Index consists of 500 stocks chosen for market size, liquidity, and industry group representation. It is a market-value-weighted index with each stock’s weight in the index proportionate to its market value. You cannot invest directly in an index. |
| 5 | Each holding represents the Fund’s allocable portion of the affiliated master portfolio security. Figures represent each holding as a percentage of the Fund’s net assets. Holdings are subject to change and may have changed since the date specified. |
| 6 | Figures represent the sector allocation of the affiliated master portfolio as a percentage of the long-term investments of the affiliated master portfolio. These amounts are subject to change and may have changed since the date specified. |
Wells Fargo Index Fund | 7
Fund expenses (unaudited)
As a shareholder of the Fund, you incur two types of costs: (1) transaction costs, including sales charges (loads) on purchase payments and contingent deferred sales charges (if any) on redemptions and (2) ongoing costs, including management fees, distribution (12b-1) and/or shareholder servicing fees, and other Fund expenses. This example is intended to help you understand your ongoing costs (in dollars) of investing in the Fund and to compare these costs with the ongoing costs of investing in other mutual funds.
The example is based on an investment of $1,000 invested at the beginning of the six-month period and held for the entire period from June 1, 2020 to November 30, 2020.
Actual expenses
The “Actual” line of the table below provides information about actual account values and actual expenses. You may use the information in this line, together with the amount you invested, to estimate the expenses that you paid over the period. Simply divide your account value by $1,000 (for example, an $8,600 account value divided by $1,000 = 8.6), then multiply the result by the number in the “Actual” line under the heading entitled “Expenses paid during period” for your applicable class of shares to estimate the expenses you paid on your account during this period.
Hypothetical example for comparison purposes
The “Hypothetical” line of the table below provides information about hypothetical account values and hypothetical expenses based on the Fund’s actual expense ratio and an assumed rate of return of 5% per year before expenses, which is not the Fund’s actual return. The hypothetical account values and expenses may not be used to estimate the actual ending account balance or expenses you paid for the period. You may use this information to compare the ongoing costs of investing in the Fund and other funds. To do so, compare this 5% hypothetical example with the 5% hypothetical examples that appear in the shareholder reports of the other funds.
Please note that the expenses shown in the table are meant to highlight your ongoing costs only and do not reflect any transactional costs, such as sales charges (loads) and contingent deferred sales charges. Therefore, the “Hypothetical” line of the table is useful in comparing ongoing costs only and will not help you determine the relative total costs of owning different funds. In addition, if these transactional costs were included, your costs would have been higher.
| | | | | | | | | | | | | | | | |
| | | Beginning
account value
6-1-2020 | | | Ending
account value
11-30-2020 | | | Expenses
paid during
the period1,2 | | | Annualized net
expense ratio1 | |
| | | | | |
Class A | | | | | | | | | | | | | | | | |
| | | | |
Actual | | $ | 1,000.00 | | | $ | 1,197.24 | | | $ | 2.42 | | | | 0.44 | % |
| | | | |
Hypothetical (5% return before expenses) | | $ | 1,000.00 | | | $ | 1,022.86 | | | $ | 2.23 | | | | 0.44 | % |
| | | | | |
Class C | | | | | | | | | | | | | | | | |
| | | | |
Actual | | $ | 1,000.00 | | | $ | 1,194.27 | | | $ | 6.60 | | | | 1.20 | % |
| | | | |
Hypothetical (5% return before expenses) | | $ | 1,000.00 | | | $ | 1,019.05 | | | $ | 6.07 | | | | 1.20 | % |
| | | | | |
Administrator Class | | | | | | | | | | | | | | | | |
| | | | |
Actual | | $ | 1,000.00 | | | $ | 1,198.34 | | | $ | 1.38 | | | | 0.25 | % |
| | | | |
Hypothetical (5% return before expenses) | | $ | 1,000.00 | | | $ | 1,023.82 | | | $ | 1.27 | | | | 0.25 | % |
| 1 | Amounts reflect net expenses allocated from the affiliated Master Portfolio in which the Fund invests. |
| 2 | Expenses paid is equal to the annualized net expense ratio of each class multiplied by the average account value over the period, multiplied by the number of days in the most recent fiscal half-year divided by the number of days in the fiscal year (to reflect the one-half-year period). |
8 | Wells Fargo Index Fund
Portfolio of investments—November 30, 2020 (unaudited)
| | | | | | | | | | | | | | | | |
| | | | | | | | | | | | Value | |
Investment Companies: 99.99% | |
|
| Affiliated Master Portfolio: 99.99% | |
Wells Fargo Index Portfolio | | | | | | | | | | | | | | $ | 1,151,991,172 | |
| | | | | | | | | | | | | | | | |
| | | | |
Total Investment Companies (Cost $119,440,327) | | | | | | | | | | | | | | | 1,151,991,172 | |
| | | | | | | | | | | | | | | | |
| | | | | | | | |
| Total investments in securities (Cost $119,440,327) | | | 99.99 | % | | | 1,151,991,172 | |
| | |
Other assets and liabilities, net | | | 0.01 | | | | 99,883 | |
| | | | | | | | |
| Total net assets | | | 100.00 | % | | $ | 1,152,091,055 | |
| | | | | | | | |
Transactions with the affiliated Master Portfolio were as follows:
| | | | | | | | | | | | | | | | | | | | | | | | | | | | | | | | |
| | | % of
ownership,
beginning
of period | | | % of
ownership,
end of
period | | | Net realized
gains
(losses) on
securities
transactions
allocated
from
affiliated
Master
Portfolio | | | Net
change in
unrealized
gains
(losses) on
securities
transactions
allocated
from
affiliated
Master
Portfolio | | | Dividends
allocated
from
affiliated
Master
Portfolio | | | Affiliated
income
allocated
from
affiliated
Master
Portfolio | | | Value,
end of
period | | | % of
net
assets | |
Wells Fargo Index Portfolio | | | 97 | % | | | 97 | % | | $ | 38,936,485 | | | $ | 149,843,674 | | | $ | 8,993,254 | | | $ | 40,012 | | | $ | 1,151,991,172 | | | | 99.99 | % |
The accompanying notes are an integral part of these financial statements.
Wells Fargo Index Fund | 9
Statement of assets and liabilities—November 30, 2020 (unaudited)
| | | | |
| | | | |
| |
Assets | | | | |
Investments in affiliated Master Portfolio, at value (cost $119,440,327) | | $ | 1,151,991,172 | |
Receivable for Fund shares sold | | | 1,208,775 | |
Receivable from manager | | | 85,300 | |
Prepaid expenses and other assets | | | 15,541 | |
| | | | |
Total assets | | | 1,153,300,788 | |
| | | | |
| |
Liabilities | | | | |
Payable for Fund shares redeemed | | | 703,995 | |
Administration fees payable | | | 170,044 | |
Distribution fee payable | | | 8,747 | |
Shareholder servicing fees payable | | | 185,448 | |
Trustees’ fees and expenses payable | | | 1,066 | |
Accrued expenses and other liabilities | | | 140,433 | |
| | | | |
Total liabilities | | | 1,209,733 | |
| | | | |
Total net assets | | $ | 1,152,091,055 | |
| | | | |
| |
Net assets consist of | | | | |
Paid-in capital | | $ | (28,615,077 | ) |
Total distributable earnings | | | 1,180,706,132 | |
| | | | |
Total net assets | | $ | 1,152,091,055 | |
| | | | |
| |
Computation of net asset value and offering price per share | | | | |
Net assets – Class A | | $ | 751,580,999 | |
Shares outstanding – Class A1 | | | 15,212,061 | |
Net asset value per share – Class A | | | $49.41 | |
Maximum offering price per share – Class A2 | | | $52.42 | |
Net assets – Class C | | $ | 13,793,123 | |
Shares outstanding – Class C1 | | | 275,643 | |
Net asset value per share – Class C | | | $50.04 | |
Net assets – Administrator Class | | $ | 386,716,933 | |
Shares outstanding – Administrator Class1 | | | 7,656,720 | |
Net asset value per share – Administrator Class | | | $50.51 | |
| 1 | The Fund has an unlimited number of authorized shares. |
| 2 | Maximum offering price is computed as 100/94.25 of net asset value. On investments of $50,000 or more, the offering price is reduced. |
The accompanying notes are an integral part of these financial statements.
10 | Wells Fargo Index Fund
Statement of operations—six months ended November 30, 2020 (unaudited)
| | | | |
| | | | |
| |
Investment income | | | | |
Dividends allocated from affiliated Master Portfolio (net of foreign withholding taxes of $44,595) | | $ | 8,993,254 | |
Affiliated income allocated from affiliated Master Portfolio | | | 40,012 | |
Expenses allocated from affiliated Master Portfolio | | | (621,379 | ) |
| | | | |
Total investment income | | | 8,411,877 | |
| | | | |
| |
Expenses | | | | |
Management fee | | | 272,084 | |
Administration fees | |
Class A | | | 743,778 | |
Class C | | | 16,116 | |
Administrator Class | | | 237,008 | |
Shareholder servicing fees | |
Class A | | | 885,449 | |
Class C | | | 19,140 | |
Administrator Class | | | 168,231 | |
Distribution fee | |
Class C | | | 57,322 | |
Custody and accounting fees | | | 37,413 | |
Professional fees | | | 16,543 | |
Registration fees | | | 50,137 | |
Shareholder report expenses | | | 36,613 | |
Trustees’ fees and expenses | | | 11,029 | |
Other fees and expenses | | | 91,072 | |
| | | | |
Total expenses | | | 2,641,935 | |
Less: Fee waivers and/or expense reimbursements | | | | |
Fund-level | | | (976,860 | ) |
Class A | | | (176,606 | ) |
Class C | | | (4,761 | ) |
Administrator Class | | | (1,051 | ) |
| | | | |
Net expenses | | | 1,482,654 | |
| | | | |
Net investment income | | | 6,929,232 | |
| | | | |
| |
Realized and unrealized gains (losses) on investments | | | | |
Net realized gains on securities transactions allocated from affiliated Master Portfolio | | | 38,936,485 | |
Net change in unrealized gains (losses) on securities transactions allocated from affiliated Master Portfolio | | | 149,843,674 | |
| | | | |
Net realized and unrealized gains (losses) on investments | | | 188,780,159 | |
| | | | |
Net increase in net assets resulting from operations | | $ | 195,709,391 | |
| | | | |
The accompanying notes are an integral part of these financial statements.
Wells Fargo Index Fund | 11
Statement of changes in net assets
| | | | | | | | | | | | | | | | |
| | | Six months ended
November 30, 2020
(unaudited) | | | Year ended
May 31, 2020 | |
| | | | |
Operations | | | | | | | | | | | | | | | | |
Net investment income | | | | | | $ | 6,929,232 | | | | | | | $ | 17,076,939 | |
Net realized gains on investments | | | | | | | 38,936,485 | | | | | | | | 181,564,933 | |
Net change in unrealized gains (losses) on investments | | | | | | | 149,843,674 | | | | | | | | (64,676,797 | ) |
| | | | |
Net increase in net assets resulting from operations | | | | | | | 195,709,391 | | | | | | | | 133,965,075 | |
| | | | |
| | | | |
Distributions to shareholders from net investment income and net realized gains | | | | | | | | | | | | | | | | |
Class A | | | | | | | 0 | | | | | | | | (189,301,116 | ) |
Class C | | | | | | | 0 | | | | | | | | (4,981,676 | ) |
Administrator Class | | | | | | | 0 | | | | | | | | (116,506,789 | ) |
| | | | |
Total distributions to shareholders | | | | | | | 0 | | | | | | | | (310,789,581 | ) |
| | | | |
| | | | |
Capital share transactions | | | Shares | | | | | | | | Shares | | | | | |
Proceeds from shares sold | |
Class A | | | 250,003 | | | | 11,360,686 | | | | 732,292 | | | | 32,317,931 | |
Class C | | | 3,811 | | | | 171,832 | | | | 57,399 | | | | 2,669,398 | |
Administrator Class | | | 482,053 | | | | 22,482,960 | | | | 1,814,601 | | | | 90,665,958 | |
| | | | |
| | | | | | | 34,015,478 | | | | | | | | 125,653,287 | |
| | | | |
Reinvestment of distributions | | | | | | | | | | | | | | | | |
Class A | | | 0 | | | | 0 | | | | 4,215,720 | | | | 183,009,568 | |
Class C | | | 0 | | | | 0 | | | | 89,742 | | | | 3,933,010 | |
Administrator Class | | | 0 | | | | 0 | | | | 2,338,163 | | | | 103,711,408 | |
| | | | |
| | | | | | | 0 | | | | | | | | 290,653,986 | |
| | | | |
Payment for shares redeemed | | | | | | | | | | | | | | | | |
Class A | | | (1,033,770 | ) | | | (46,963,534 | ) | | | (2,625,376 | ) | | | (122,456,063 | ) |
Class C | | | (112,451 | ) | | | (5,195,943 | ) | | | (145,585 | ) | | | (6,654,277 | ) |
Administrator Class | | | (978,295 | ) | | | (45,286,703 | ) | | | (5,173,988 | ) | | | (247,150,828 | ) |
| | | | |
| | | | | | | (97,446,180 | ) | | | | | | | (376,261,168 | ) |
| | | | |
Net increase (decrease) in net assets resulting from capital share transactions | | | | | | | (63,430,702 | ) | | | | | | | 40,046,105 | |
| | | | |
Total increase (decrease) in net assets | | | | | | | 132,278,689 | | | | | | | | (136,778,401 | ) |
| | | | |
| | |
Net assets | | | | | | | | |
Beginning of period | | | | | | | 1,019,812,366 | | | | | | | | 1,156,590,767 | |
| | | | |
End of period | | | | | | $ | 1,152,091,055 | | | | | | | $ | 1,019,812,366 | |
| | | | |
The accompanying notes are an integral part of these financial statements.
12 | Wells Fargo Index Fund
Financial highlights
(For a share outstanding throughout each period)
| | | | | | | | | | | | | | | | | | | | | | | | |
| | | Six months ended
November 30, 2020
(unaudited) | | | Year ended May 31 | |
| CLASS A | | 2020 | | | 2019 | | | 2018 | | | 2017 | | | 2016 | |
Net asset value, beginning of period | | | $41.27 | | | | $49.48 | | | | $63.35 | | | | $66.85 | | | | $62.85 | | | | $67.32 | |
Net investment income | | | 0.27 | | | | 0.65 | | | | 0.82 | | | | 0.99 | 1 | | | 1.05 | | | | 0.81 | |
Net realized and unrealized gains (losses) on investments | | | 7.87 | | | | 5.82 | | | | 0.54 | | | | 7.99 | | | | 9.09 | | | | (0.17 | ) |
| | | | | | | | | | | | | | | | | | | | | | | | |
Total from investment operations | | | 8.14 | | | | 6.47 | | | | 1.36 | | | | 8.98 | | | | 10.14 | | | | 0.64 | |
Distributions to shareholders from | | | | | | | | | | | | | | | | | | | | | | | | |
Net investment income | | | 0.00 | | | | (0.67 | ) | | | (0.90 | ) | | | (1.02 | ) | | | (1.16 | ) | | | (1.08 | ) |
Net realized gains | | | 0.00 | | | | (14.01 | ) | | | (14.33 | ) | | | (11.46 | ) | | | (4.98 | ) | | | (4.03 | ) |
| | | | | | | | | | | | | | | | | | | | | | | | |
Total distributions to shareholders | | | 0.00 | | | | (14.68 | ) | | | (15.23 | ) | | | (12.48 | ) | | | (6.14 | ) | | | (5.11 | ) |
Net asset value, end of period | | | $49.41 | | | | $41.27 | | | | $49.48 | | | | $63.35 | | | | $66.85 | | | | $62.85 | |
Total return2 | | | 19.72 | % | | | 12.02 | % | | | 3.32 | % | | | 13.87 | % | | | 16.94 | % | | | 1.24 | % |
Ratios to average net assets (annualized) | | | | | | | | | | | | | | | | | | | | | | | | |
Gross expenses3 | | | 0.67 | % | | | 0.67 | % | | | 0.65 | % | | | 0.63 | % | | | 0.62 | % | | | 0.63 | % |
Net expenses3 | | | 0.44 | % | | | 0.44 | % | | | 0.45 | % | | | 0.45 | % | | | 0.45 | % | | | 0.48 | % |
Net investment income3 | | | 1.22 | % | | | 1.47 | % | | | 1.51 | % | | | 1.49 | % | | | 1.68 | % | | | 1.78 | % |
Supplemental data | | | | | | | | | | | | | | | | | | | | | | | | |
Portfolio turnover rate4 | | | 2 | % | | | 3 | % | | | 4 | % | | | 3 | % | | | 9 | % | | | 4 | % |
Net assets, end of period (000s omitted) | | | $751,581 | | | | $660,101 | | | | $676,511 | | | | $702,866 | | | | $684,004 | | | | $639,496 | |
| 1 | Calculated based upon average shares outstanding |
| 2 | Total return calculations do not include any sales charges. Returns for periods of less than one year are not annualized. |
| 3 | Ratios include net expenses allocated from the affiliated Master Portfolio which were as follows: |
| | | | |
Six months ended November 30, 2020 (unaudited) | | | 0.11 | % |
Year ended May 31, 2020 | | | 0.12 | % |
Year ended May 31, 2019 | | | 0.11 | % |
Year ended May 31, 2018 | | | 0.10 | % |
Year ended May 31, 2017 | | | 0.10 | % |
Year ended May 31, 2016 | | | 0.10 | % |
| 4 | Portfolio turnover rate is calculated by multiplying the affiliated Master Portfolio’s percentage of the Fund’s total investment in securities at the end of the period by the affiliated Master Portfolio’s portfolio turnover rate. |
The accompanying notes are an integral part of these financial statements.
Wells Fargo Index Fund | 13
Financial highlights
(For a share outstanding throughout each period)
| | | | | | | | | | | | | | | | | | | | | | | | |
| | | Six months ended
November 30, 2020
(unaudited) | | | Year ended May 31 | |
| CLASS C | | 2020 | | | 2019 | | | 2018 | | | 2017 | | | 2016 | |
Net asset value, beginning of period | | | $41.90 | | | | $50.02 | | | | $63.67 | | | | $67.11 | | | | $63.12 | | | | $67.55 | |
Net investment income | | | 0.10 | 1 | | | 0.30 | | | | 0.46 | 1 | | | 0.50 | 1 | | | 0.66 | | | | 0.62 | 1 |
Net realized and unrealized gains (losses) on investments | | | 8.04 | | | | 5.84 | | | | 0.52 | | | | 8.00 | | | | 9.02 | | | | (0.45 | ) |
| | | | | | | | | | | | | | | | | | | | | | | | |
Total from investment operations | | | 8.14 | | | | 6.14 | | | | 0.98 | | | | 8.50 | | | | 9.68 | | | | 0.17 | |
Distributions to shareholders from | | | | | | | | | | | | | | | | | | | | | | | | |
Net investment income | | | 0.00 | | | | (0.25 | ) | | | (0.30 | ) | | | (0.48 | ) | | | (0.71 | ) | | | (0.57 | ) |
Net realized gains | | | 0.00 | | | | (14.01 | ) | | | (14.33 | ) | | | (11.46 | ) | | | (4.98 | ) | | | (4.03 | ) |
| | | | | | | | | | | | | | | | | | | | | | | | |
Total distributions to shareholders | | | 0.00 | | | | (14.26 | ) | | | (14.63 | ) | | | (11.94 | ) | | | (5.69 | ) | | | (4.60 | ) |
Net asset value, end of period | | | $50.04 | | | | $41.90 | | | | $50.02 | | | | $63.67 | | | | $67.11 | | | | $63.12 | |
Total return2 | | | 19.43 | % | | | 11.17 | % | | | 2.54 | % | | | 13.02 | % | | | 16.07 | % | | | 0.48 | % |
Ratios to average net assets (annualized) | | | | | | | | | | | | | | | | | | | | | | | | |
Gross expenses3 | | | 1.41 | % | | | 1.42 | % | | | 1.39 | % | | | 1.38 | % | | | 1.37 | % | | | 1.38 | % |
Net expenses3 | | | 1.20 | % | | | 1.20 | % | | | 1.20 | % | | | 1.20 | % | | | 1.20 | % | | | 1.24 | % |
Net investment income3 | | | 0.45 | % | | | 0.72 | % | | | 0.77 | % | | | 0.72 | % | | | 0.93 | % | | | 0.99 | % |
Supplemental data | | | | | | | | | | | | | | | | | | | | | | | | |
Portfolio turnover rate4 | | | 2 | % | | | 3 | % | | | 4 | % | | | 3 | % | | | 9 | % | | | 4 | % |
Net assets, end of period (000s omitted) | | | $13,793 | | | | $16,103 | | | | $19,146 | | | | $66,117 | | | | $67,691 | | | | $79,858 | |
| 1 | Calculated based upon average shares outstanding |
| 2 | Total return calculations do not include any sales charges. Returns for periods of less than one year are not annualized. |
| 3 | Ratios include net expenses allocated from the affiliated Master Portfolio which were as follows: |
| | | | |
Six months ended November 30, 2020 (unaudited) | | | 0.11 | % |
Year ended May 31, 2020 | | | 0.12 | % |
Year ended May 31, 2019 | | | 0.11 | % |
Year ended May 31, 2018 | | | 0.10 | % |
Year ended May 31, 2017 | | | 0.10 | % |
Year ended May 31, 2016 | | | 0.10 | % |
| 4 | Portfolio turnover rate is calculated by multiplying the affiliated Master Portfolio’s percentage of the Fund’s total investment in securities at the end of the period by the affiliated Master Portfolio’s portfolio turnover rate. |
The accompanying notes are an integral part of these financial statements.
14 | Wells Fargo Index Fund
Financial highlights
(For a share outstanding throughout each period)
| | | | | | | | | | | | | | | | | | | | | | | | |
| | | Six months ended
November 30, 2020
(unaudited) | | | Year ended May 31 | |
| ADMINISTRATOR CLASS | | 2020 | | | 2019 | | | 2018 | | | 2017 | | | 2016 | |
Net asset value, beginning of period | | | $42.15 | | | | $50.24 | | | | $64.04 | | | | $67.43 | | | | $63.33 | | | | $67.80 | |
Net investment income | | | 0.40 | | | | 0.81 | | | | 1.02 | 1 | | | 1.26 | | | | 1.41 | | | | 1.31 | |
Net realized and unrealized gains (losses) on investments | | | 7.96 | | | | 5.85 | | | | 0.48 | | | | 7.94 | | | | 8.94 | | | | (0.51 | ) |
| | | | | | | | | | | | | | | | | | | | | | | | |
Total from investment operations | | | 8.36 | | | | 6.66 | | | | 1.50 | | | | 9.20 | | | | 10.35 | | | | 0.80 | |
Distributions to shareholders from | | | | | | | | | | | | | | | | | | | | | | | | |
Net investment income | | | 0.00 | | | | (0.74 | ) | | | (0.97 | ) | | | (1.13 | ) | | | (1.27 | ) | | | (1.24 | ) |
Net realized gains | | | 0.00 | | | | (14.01 | ) | | | (14.33 | ) | | | (11.46 | ) | | | (4.98 | ) | | | (4.03 | ) |
| | | | | | | | | | | | | | | | | | | | | | | | |
Total distributions to shareholders | | | 0.00 | | | | (14.75 | ) | | | (15.30 | ) | | | (12.59 | ) | | | (6.25 | ) | | | (5.27 | ) |
Net asset value, end of period | | | $50.51 | | | | $42.15 | | | | $50.24 | | | | $64.04 | | | | $67.43 | | | | $63.33 | |
Total return2 | | | 19.83 | % | | | 12.25 | % | | | 3.52 | % | | | 14.10 | % | | | 17.18 | % | | | 1.49 | % |
Ratios to average net assets (annualized) | | | | | | | | | | | | | | | | | | | | | | | | |
Gross expenses3 | | | 0.43 | % | | | 0.44 | % | | | 0.41 | % | | | 0.40 | % | | | 0.39 | % | | | 0.40 | % |
Net expenses3 | | | 0.25 | % | | | 0.25 | % | | | 0.25 | % | | | 0.25 | % | | | 0.25 | % | | | 0.25 | % |
Net investment income3 | | | 1.41 | % | | | 1.67 | % | | | 1.72 | % | | | 1.70 | % | | | 1.88 | % | | | 1.97 | % |
Supplemental data | | | | | | | | | | | | | | | | | | | | | | | | |
Portfolio turnover rate4 | | | 2 | % | | | 3 | % | | | 4 | % | | | 3 | % | | | 9 | % | | | 4 | % |
Net assets, end of period (000s omitted) | | | $386,717 | | | | $343,609 | | | | $460,934 | | | | $829,004 | | | | $1,151,522 | | | | $1,502,276 | |
| 1 | Calculated based upon average shares outstanding |
| 2 | Return for periods of less than one year are not annualized. |
| 3 | Ratios include net expenses allocated from the affiliated Master Portfolio which were as follows: |
| | | | |
Six months ended November 30, 2020 (unaudited) | | | 0.11 | % |
Year ended May 31, 2020 | | | 0.12 | % |
Year ended May 31, 2019 | | | 0.11 | % |
Year ended May 31, 2018 | | | 0.10 | % |
Year ended May 31, 2017 | | | 0.10 | % |
Year ended May 31, 2016 | | | 0.10 | % |
| 4 | Portfolio turnover rate is calculated by multiplying the affiliated Master Portfolio’s percentage of the Fund’s total investment in securities at the end of the period by the affiliated Master Portfolio’s portfolio turnover rate. |
The accompanying notes are an integral part of these financial statements.
Wells Fargo Index Fund | 15
Notes to financial statements (unaudited)
1. ORGANIZATION
Wells Fargo Funds Trust (the “Trust”), a Delaware statutory trust organized on March 10, 1999, is an open-end management investment company registered under the Investment Company Act of 1940, as amended (the “1940 Act”). As an investment company, the Trust follows the accounting and reporting guidance in Financial Accounting Standards Board (“FASB”) Accounting Standards Codification Topic 946, Financial Services – Investment Companies. These financial statements report on the Wells Fargo Index Fund (the “Fund”) which is a diversified series of the Trust.
The Fund is a feeder fund in a master-feeder structure that invests substantially all of its assets in a single master portfolio with a substantially identical investment objective and substantially similar investment strategies. The Fund invests in Wells Fargo Index Portfolio, a separate diversified portfolio (the “affiliated Master Portfolio”) of Wells Fargo Master Trust, a registered open-end management investment company. As of November 30, 2020, the Fund owned 97% of Wells Fargo Index Portfolio. The affiliated Master Portfolio directly acquires portfolio securities and the Fund acquires an indirect interest in those securities. The Fund accounts for its investment in the affiliated Master Portfolio as a partnership investment and records on a daily basis its share of the affiliated Master Portfolio’s income, expense and realized and unrealized gains and losses. The financial statements of the affiliated Master Portfolio for the six months ended November 30, 2020 are included in this report and should be read in conjunction with the Fund’s financial statements.
2. SIGNIFICANT ACCOUNTING POLICIES
The following significant accounting policies, which are consistently followed in the preparation of the financial statements of the Fund, are in conformity with U.S. generally accepted accounting principles which require management to make estimates and assumptions that affect the reported amounts of assets and liabilities, disclosure of contingent assets and liabilities at the date of the financial statements, and the reported amounts of revenues and expenses during the reporting period. Actual results could differ from those estimates.
Securities valuation
All investments are valued each business day as of the close of regular trading on the New York Stock Exchange (generally 4 p.m. Eastern Time), although the Fund may deviate from this calculation time under unusual or unexpected circumstances.
Investments in the affiliated Master Portfolio are valued daily based on the Fund’s proportionate share of the affiliated Master Portfolio’s net assets, which are also valued daily. Securities held in the affiliated Master Portfolio are valued as discussed in the Notes to Financial Statements of the affiliated Master Portfolio, which are included elsewhere in this report.
Investments which are not valued using the method discussed above are valued at their fair value, as determined in good faith by the Board of Trustees of the Fund. The Board of Trustees has established a Valuation Committee comprised of the Trustees and has delegated to it the authority to take any actions regarding the valuation of portfolio securities that the Valuation Committee deems necessary or appropriate, including determining the fair value of portfolio securities, unless the determination has been delegated to the Wells Fargo Asset Management Pricing Committee at Wells Fargo Funds Management, LLC (“Funds Management”). The Board of Trustees retains the authority to make or ratify any valuation decisions or approve any changes to the Valuation Procedures as it deems appropriate. On a quarterly basis, the Board of Trustees receives reports on any valuation actions taken by the Valuation Committee or the Wells Fargo Asset Management Pricing Committee which may include items for ratification.
Investment transactions, income and expenses
Investments in the affiliated Master Portfolio are recorded on a trade basis. The Fund records daily its proportionate share of the affiliated Master Portfolio’s income, expenses and realized and unrealized gains or losses. The Fund also accrues its own expenses.
Distributions to shareholders
Distributions to shareholders from net investment income and any net realized gains are recorded on the ex-dividend date and paid at least annually. Such distributions are determined in accordance with income tax regulations and may differ from U.S. generally accepted accounting principles. Dividend sources are estimated at the time of declaration. The tax character of distributions is determined as of the Fund’s fiscal year end. Therefore, a portion of the Fund’s distributions made prior to the Fund’s fiscal year end may be categorized as a tax return of capital at year end.
Federal and other taxes
The Fund intends to continue to qualify as a regulated investment company by distributing substantially all of its investment company taxable income and any net realized capital gains (after reduction for capital loss carryforwards) sufficient to relieve it from all, or substantially all, federal income taxes. Accordingly, no provision for federal income taxes was required.
16 | Wells Fargo Index Fund
Notes to financial statements (unaudited)
The Fund’s income and federal excise tax returns and all financial records supporting those returns for the prior three fiscal years are subject to examination by the federal and Delaware revenue authorities. Management has analyzed the Fund’s tax positions taken on federal, state, and foreign tax returns for all open tax years and does not believe that there are any uncertain tax positions that require recognition of a tax liability.
As of November 30, 2020, the aggregate cost of all investments for federal income tax purposes was $124,152,783 and the unrealized gains (losses) consisted of:
| | | | |
| |
Gross unrealized gains | | $ | 1,027,838,389 | |
| |
Gross unrealized losses | | | 0 | |
| |
Net unrealized gains | | $ | 1,027,838,389 | |
Class allocations
The separate classes of shares offered by the Fund differ principally in applicable sales charges, distribution, shareholder servicing, and administration fees. Class specific expenses are charged directly to that share class. Investment income, common fund-level expenses, and realized and unrealized gains (losses) on investments are allocated daily to each class of shares based on the relative proportion of net assets of each class.
3. FAIR VALUATION MEASUREMENTS
At November 30, 2020, the affiliated Master Portfolio was measured at fair value using the net asset value per share (or its equivalent) as a practical expedient. The investment objective and the value of the affiliate Master Portfolio was as follows:
| | | | |
| | |
| Affiliated Master Portfolio | | Investment objective | | Value of affiliated
Master Portfolio |
| | |
Wells Fargo Index Portfolio | | Seeks to replicate the total return of the S&P 500 Index, before fees and expenses | | $1,151,991,172 |
The affiliated Master Portfolio does not have a redemption period notice, can be redeemed daily and does not have any unfunded commitments.
4. TRANSACTIONS WITH AFFILIATES
Management fee
Funds Management, an indirect wholly owned subsidiary of Wells Fargo & Company (“Wells Fargo”), is the manager of the Fund and provides advisory and fund-level administrative services under an investment management agreement. Under the investment management agreement, Funds Management is responsible for, among other services, implementing the investment objectives and strategies of the Fund and providing fund-level administrative services in connection with the Fund’s operations. As long as the Fund continues to invest substantially all of its assets in a single affiliated Master Portfolio, the Fund pays Funds Management an investment management fee only for fund-level administrative services at the following annual rate based on the Fund’s average daily net assets:
| | |
| |
| Average daily net assets | | Management fee |
| |
First $5 billion | | 0.05% |
| |
Next $5 billion | | 0.04 |
| |
Over $10 billion | | 0.03 |
For the six months ended November 30, 2020, the management fee was equivalent to an annual rate of 0.05% of the Fund’s average daily net assets.
Funds Management also serves as the adviser to the affiliated Master Portfolio and is entitled to receive a fee from the affiliated Master Portfolio for those services.
Wells Fargo Index Fund | 17
Notes to financial statements (unaudited)
Administration fees
Under a class-level administration agreement, Funds Management provides class-level administrative services to the Fund, which includes paying fees and expenses for services provided by the transfer agent, sub-transfer agents, omnibus account servicers and record-keepers. As compensation for its services under the class-level administration agreement, Funds Management receives an annual fee which is calculated based on the average daily net assets of each class as follows:
| | |
| |
| | | Class-level
administration fee |
| |
Class A, Class C | | 0.21% |
| |
Administrator Class | | 0.13 |
Waivers and/or expense reimbursements
Funds Management has contractually waived and/or reimbursed management and administration fees to the extent necessary to maintain certain net operating expense ratios for the Fund. When each class of the Fund has exceeded its expense cap, Funds Management has waived fees and/or reimbursed expenses from fund-level expenses on a proportionate basis and then from class specific expenses. When only certain classes exceed their expense caps, waivers and/or reimbursements are applied against class specific expenses before fund-level expenses. Net expenses from the affiliated Master Portfolio are included in the expense caps. Funds Management has committed through September 30, 2021 to waive fees and/or reimburse expenses to the extent necessary to cap the Fund’s expenses at 0.45% for Class A shares, 1.20% for Class C shares, and 0.25% for Administrator Class shares. Prior to or after the commitment expiration date, the cap may be increased or the commitment to maintain the cap may be terminated only with the approval of the Board of Trustees.
Distribution fee
The Trust has adopted a distribution plan for Class C shares of the Fund pursuant to Rule 12b-1 under the 1940 Act. A distribution fee is charged to Class C shares and paid to Wells Fargo Funds Distributor, LLC (“Funds Distributor”), the principal underwriter, at an annual rate of 0.75% of the average daily net assets of Class C shares.
In addition, Funds Distributor is entitled to receive the front-end sales charge from the purchase of Class A shares and a contingent deferred sales charge on the redemption of certain Class A shares. Funds Distributor is also entitled to receive the contingent deferred sales charges from redemptions of Class C shares. For the six months ended November 30, 2020, Funds Distributor received $1,353 from the sale of Class A shares. No contingent deferred sales charges were incurred by Class A and Class C for the six months ended November 30, 2020.
Shareholder servicing fees
The Trust has entered into contracts with one or more shareholder servicing agents, whereby Class A and Class C of the Fund are charged a fee at an annual rate of 0.25% of the average daily net assets of each respective class. Administrator Class is charged a fee at an annual rate of 0.10% of its average daily net assets. A portion of these total shareholder servicing fees were paid to affiliates of Wells Fargo.
5. INVESTMENT PORTFOLIO TRANSACTIONS
The Fund seeks to achieve its investment objective by investing substantially all of its assets in a single affiliated Master Portfolio. Purchases and sales have been calculated by multiplying the Fund’s ownership percentage of the affiliated Master Portfolio by the affiliated Master Portfolio’s purchases and sales. Purchases and sales of investments, excluding U.S. government obligations (if any) and short-term securities, for the six months ended November 30, 2020 were $13,212,871 and $60,074,117, respectively.
6. BANK BORROWINGS
The Trust (excluding the money market funds), Wells Fargo Master Trust and Wells Fargo Variable Trust are parties to a $350,000,000 revolving credit agreement whereby the Fund is permitted to use bank borrowings for temporary or emergency purposes, such as to fund shareholder redemption requests. Interest under the credit agreement is charged to the Fund based on a borrowing rate equal to the higher of the Federal Funds rate in effect on that day plus 1.25% or the overnight LIBOR rate in effect on that day plus 1.25%. In addition, an annual commitment fee equal to 0.25% of the unused balance is allocated to each participating fund.
For the six months ended November 30, 2020, there were no borrowings by the Fund under the agreement.
18 | Wells Fargo Index Fund
Notes to financial statements (unaudited)
7. CONCENTRATION RISK
Concentration risk results from exposure to a limited number of sectors. Through its investment in the affiliated Master Portfolio which may invest a substantial portion of its assets in any sector, the Fund may in turn be more affected by changes in that sector than a fund whose investments are not heavily weighted in any sector. As of the end of the period, the Master Portfolio concentrated its portfolio in investments related to the information technology sector.
8. INDEMNIFICATION
Under the Fund’s organizational documents, the officers and Trustees have been granted certain indemnification rights against certain liabilities that may arise out of performance of their duties to the Fund. The Fund has entered into a separate agreement with each Trustee that converts indemnification rights currently existing under the Fund’s organizational documents into contractual rights that cannot be changed in the future without the consent of the Trustee. Additionally, in the normal course of business, the Fund may enter into contracts with service providers that contain a variety of indemnification clauses. The Fund’s maximum exposure under these arrangements is dependent on future claims that may be made against the Fund and, therefore, cannot be estimated.
11. NEW ACCOUNTING PRONOUNCEMENT
In August 2018, FASB issued Accounting Standards Update (“ASU”) No. 2018-13, Fair Value Measurement (Topic 820) Disclosure Framework—Changes to the Disclosure Requirements for Fair Value Measurement. ASU 2018-13 updates the disclosure requirements on fair value measurements in Topic 820, Fair Value Measurements. The amendments are effective for fiscal years, and interim periods within those fiscal years, beginning after December 15, 2019. Management has adopted this guidance which did not have a material impact on the financial statements.
12. CORONAVIRUS (COVID-19) PANDEMIC
On March 11, 2020, the World Health Organization announced that it had made the assessment that coronavirus disease 2019 (“COVID-19”) is a pandemic. The impacts of COVID-19 are adversely affecting the entire global economy, individual companies and investment products, and the market in general. There is significant uncertainty around the extent and duration of business disruptions related to COVID-19 and the impacts may be short term or may last for an extended period of time. The risk of further spreading of COVID-19 has led to significant uncertainty and volatility in the financial markets.
Wells Fargo Index Fund | 19
Portfolio of investments—November 30, 2020 (unaudited)
| | | | | | | | | | | | | | | | |
| | | | | | | | | Shares | | | Value | |
| Common Stocks: 97.31% | | | | | | | | | | | | | | | | |
| | | | |
Communication Services: 10.73% | | | | | | | | | | | | | | | | |
| | | | |
| Diversified Telecommunication Services: 1.51% | | | | | | | | | | | | |
AT&T Incorporated | | | | | | | | | | | 275,041 | | | $ | 7,907,429 | |
CenturyLink Incorporated | | | | | | | | | | | 38,131 | | | | 398,469 | |
Verizon Communications Incorporated | | | | | | | | | | | 159,738 | | | | 9,649,773 | |
| |
| | | | 17,955,671 | |
| | | | | | | | | | | | | | | | |
| | | | |
| Entertainment: 1.98% | | | | | | | | | | | | |
Activision Blizzard Incorporated | | | | | | | | | | | 29,796 | | | | 2,368,186 | |
Electronic Arts Incorporated | | | | | | | | | | | 11,148 | | | | 1,424,157 | |
Live Nation Entertainment Incorporated † | | | | | | | | | | | 5,486 | | | | 360,156 | |
Netflix Incorporated † | | | | | | | | | | | 17,024 | | | | 8,353,677 | |
Take-Two Interactive Software Incorporated † | | | | | | | | | | | 4,414 | | | | 796,771 | |
The Walt Disney Company | | | | | | | | | | | 69,757 | | | | 10,324,734 | |
| |
| | | | 23,627,681 | |
| | | | | | | | | | | | | | | | |
| | | | |
| Interactive Media & Services: 5.66% | | | | | | | | | | | | |
Alphabet Incorporated Class A † | | | | | | | | | | | 11,599 | | | | 20,349,286 | |
Alphabet Incorporated Class C † | | | | | | | | | | | 11,333 | | | | 19,954,466 | |
Facebook Incorporated Class A † | | | | | | | | | | | 92,811 | | | | 25,705,863 | |
Twitter Incorporated † | | | | | | | | | | | 30,532 | | | | 1,420,043 | |
| |
| | | | 67,429,658 | |
| | | | | | | | | | | | | | | | |
| | | | |
| Media: 1.33% | | | | | | | | | | | | |
Charter Communications Incorporated Class A † | | | | | | | | | | | 5,774 | | | | 3,764,590 | |
Comcast Corporation Class A | | | | | | | | | | | 175,975 | | | | 8,840,984 | |
Discovery Incorporated Class A † | | | | | | | | | | | 6,184 | | | | 166,411 | |
Discovery Incorporated Class C † | | | | | | | | | | | 11,950 | | | | 287,039 | |
DISH Network Corporation Class A † | | | | | | | | | | | 9,524 | | | | 341,626 | |
Fox Corporation Class A | | | | | | | | | | | 13,267 | | | | 382,620 | |
Fox Corporation Class B | | | | | | | | | | | 6,047 | | | | 171,614 | |
Interpublic Group of Companies Incorporated | | | | | | | | | | | 15,052 | | | | 335,359 | |
News Corporation Class A | | | | | | | | | | | 15,016 | | | | 265,032 | |
News Corporation Class B | | | | | | | | | | | 4,701 | | | | 83,725 | |
Omnicom Group Incorporated | | | | | | | | | | | 8,294 | | | | 522,522 | |
ViacomCBS Incorporated Class B | | | | | | | | | | | 21,763 | | | | 767,799 | |
| |
| | | | 15,929,321 | |
| | | | | | | | | | | | | | | | |
| | | | |
| Wireless Telecommunication Services: 0.25% | | | | | | | | | | | | |
T-Mobile US Incorporated † | | | | | | | | | | | 22,458 | | | | 2,985,567 | |
| | | | | | | | | | | | | | | | |
| | | | |
Consumer Discretionary: 11.03% | | | | | | | | | | | | | | | | |
| | | | |
| Auto Components: 0.14% | | | | | | | | | | | | |
Aptiv plc | | | | | | | | | | | 10,424 | | | | 1,237,329 | |
BorgWarner Incorporated | | | | | | | | | | | 9,436 | | | | 366,589 | |
| |
| | | | 1,603,918 | |
| | | | | | | | | | | | | | | | |
| | | | |
| Automobiles: 0.29% | | | | | | | | | | | | |
Ford Motor Company | | | | | | | | | | | 150,840 | | | | 1,369,627 | |
General Motors Company | | | | | | | | | | | 48,614 | | | | 2,131,238 | |
| |
| | | | 3,500,865 | |
| | | | | | | | | | | | | | | | |
The accompanying notes are an integral part of these financial statements.
20 | Wells Fargo Index Portfolio
Portfolio of investments—November 30, 2020 (unaudited)
| | | | | | | | | | | | | | | | |
| | | | | | | | | Shares | | | Value | |
| Distributors: 0.12% | |
Genuine Parts Company | | | | | | | | | | | 5,569 | | | $ | 547,823 | |
LKQ Corporation † | | | | | | | | | | | 10,807 | | | | 380,623 | |
Pool Corporation | | | | | | | | | | | 1,547 | | | | 535,432 | |
| |
| | | | 1,463,878 | |
| | | | | | | | | | | | | | | | |
| | | | |
| Hotels, Restaurants & Leisure: 1.64% | | | | | | | | | | | | |
Carnival Corporation | | | | | | | | | | | 19,992 | | | | 399,440 | |
Chipotle Mexican Grill Incorporated † | | | | | | | | | | | 1,080 | | | | 1,392,584 | |
Darden Restaurants Incorporated | | | | | | | | | | | 5,021 | | | | 542,168 | |
Domino’s Pizza Incorporated | | | | | | | | | | | 1,519 | | | | 596,314 | |
Hilton Worldwide Holdings Incorporated | | | | | | | | | | | 10,705 | | | | 1,109,359 | |
Las Vegas Sands Corporation | | | | | | | | | | | 12,678 | | | | 706,291 | |
Marriott International Incorporated Class A | | | | | | | | | | | 10,266 | | | | 1,302,447 | |
McDonald’s Corporation | | | | | | | | | | | 28,724 | | | | 6,245,747 | |
MGM Resorts International | | | | | | | | | | | 15,805 | | | | 446,491 | |
Norwegian Cruise Line Holdings Limited † | | | | | | | | | | | 12,184 | | | | 278,648 | |
Royal Caribbean Cruises Limited | | | | | | | | | | | 6,878 | | | | 542,055 | |
Starbucks Corporation | | | | | | | | | | | 45,126 | | | | 4,423,251 | |
Wynn Resorts Limited | | | | | | | | | | | 3,747 | | | | 376,574 | |
Yum! Brands Incorporated | | | | | | | | | | | 11,635 | | | | 1,230,983 | |
| |
| | | | 19,592,352 | |
| | | | | | | | | | | | | | | | |
| | | | |
| Household Durables: 0.40% | | | | | | | | | | | | |
D.R. Horton Incorporated | | | | | | | | | | | 12,776 | | | | 951,812 | |
Garmin Limited | | | | | | | | | | | 5,758 | | | | 672,304 | |
Leggett & Platt Incorporated | | | | | | | | | | | 5,111 | | | | 220,284 | |
Lennar Corporation Class A | | | | | | | | | | | 10,601 | | | | 804,192 | |
Mohawk Industries Incorporated † | | | | | | | | | | | 2,309 | | | | 290,541 | |
Newell Brands Incorporated | | | | | | | | | | | 14,577 | | | | 309,907 | |
NVR Incorporated † | | | | | | | | | | | 134 | | | | 535,622 | |
PulteGroup Incorporated | | | | | | | | | | | 10,352 | | | | 451,658 | |
Whirlpool Corporation | | | | | | | | | | | 2,405 | | | | 468,037 | |
| |
| | | | 4,704,357 | |
| | | | | | | | | | | | | | | | |
| | | | |
| Internet & Direct Marketing Retail: 4.86% | | | | | | | | | | | | |
Amazon.com Incorporated † | | | | | | | | | | | 16,435 | | | | 52,066,737 | |
Booking Holdings Incorporated † | | | | | | | | | | | 1,581 | | | | 3,206,979 | |
eBay Incorporated | | | | | | | | | | | 25,666 | | | | 1,294,336 | |
Etsy Incorporated † | | | | | | | | | | | 4,606 | | | | 740,184 | |
Expedia Group Incorporated | | | | | | | | | | | 5,238 | | | | 652,079 | |
| |
| | | | 57,960,315 | |
| | | | | | | | | | | | | | | | |
| | | | |
| Leisure Products: 0.04% | | | | | | | | | | | | |
Hasbro Incorporated | | | | | | | | | | | 4,919 | | | | 457,615 | |
| | | | | | | | | | | | | | | | |
| | | | |
| Multiline Retail: 0.55% | | | | | | | | | | | | |
Dollar General Corporation | | | | | | | | | | | 9,613 | | | | 2,101,210 | |
Dollar Tree Incorporated † | | | | | | | | | | | 9,161 | | | | 1,000,748 | |
Target Corporation | | | | | | | | | | | 19,325 | | | | 3,469,417 | |
| |
| | | | 6,571,375 | |
| | | | | | | | | | | | | | | | |
| | | | |
| Specialty Retail: 2.27% | | | | | | | | | | | | |
Advance Auto Parts Incorporated | | | | | | | | | | | 2,669 | | | | 394,211 | |
AutoZone Incorporated † | | | | | | | | | | | 902 | | | | 1,026,160 | |
Best Buy Company Incorporated | | | | | | | | | | | 8,892 | | | | 967,450 | |
The accompanying notes are an integral part of these financial statements.
Wells Fargo Index Portfolio | 21
Portfolio of investments—November 30, 2020 (unaudited)
| | | | | | | | | | | | | | | | |
| | | | | | | | | Shares | | | Value | |
| Specialty Retail (continued) | | | | | | | | | | | | |
CarMax Incorporated † | | | | | | | | | | | 6,295 | | | $ | 588,457 | |
L Brands Incorporated | | | | | | | | | | | 9,011 | | | | 349,717 | |
Lowe’s Companies Incorporated | | | | | | | | | | | 29,173 | | | | 4,545,737 | |
O’Reilly Automotive Incorporated † | | | | | | | | | | | 2,859 | | | | 1,264,936 | |
Ross Stores Incorporated | | | | | | | | | | | 13,739 | | | | 1,477,217 | |
The Gap Incorporated | | | | | | | | | | | 7,932 | | | | 166,255 | |
The Home Depot Incorporated | | | | | | | | | | | 41,554 | | | | 11,527,495 | |
The TJX Companies Incorporated | | | | | | | | | | | 46,286 | | | | 2,939,624 | |
Tiffany & Company | | | | | | | | | | | 4,170 | | | | 548,272 | |
Tractor Supply Company | | | | | | | | | | | 4,487 | | | | 631,814 | |
Ulta Beauty Incorporated † | | | | | | | | | | | 2,174 | | | | 598,720 | |
| |
| | | | 27,026,065 | |
| | | | | | | | | | | | | | | | |
| | | | |
| Textiles, Apparel & Luxury Goods: 0.72% | | | | | | | | | | | | |
HanesBrands Incorporated | | | | | | | | | | | 13,440 | | | | 190,848 | |
Nike Incorporated Class B | | | | | | | | | | | 48,055 | | | | 6,473,009 | |
PVH Corporation | | | | | | | | | | | 2,738 | | | | 217,644 | |
Ralph Lauren Corporation | | | | | | | | | | | 1,859 | | | | 159,409 | |
Tapestry Incorporated | | | | | | | | | | | 10,664 | | | | 302,004 | |
Under Armour Incorporated Class A † | | | | | | | | | | | 7,278 | | | | 120,596 | |
Under Armour Incorporated Class C † | | | | | | | | | | | 7,507 | | | | 109,227 | |
VF Corporation | | | | | | | | | | | 12,334 | | | | 1,028,656 | |
| |
| | | | 8,601,393 | |
| | | | | | | | | | | | | | | | |
| | | | |
| Consumer Staples: 6.60% | | | | | | | | | | | | |
| | | | |
| Beverages: 1.58% | | | | | | | | | | | | |
Brown-Forman Corporation Class B | | | | | | | | | | | 7,046 | | | | 568,330 | |
Constellation Brands Incorporated Class A | | | | | | | | | | | 6,486 | | | | 1,335,078 | |
Molson Coors Brewing Company Class B | | | | | | | | | | | 7,259 | | | | 333,914 | |
Monster Beverage Corporation † | | | | | | | | | | | 14,251 | | | | 1,208,200 | |
PepsiCo Incorporated | | | | | | | | | | | 53,450 | | | | 7,709,094 | |
The Coca-Cola Company | | | | | | | | | | | 149,232 | | | | 7,700,371 | |
| |
| | | | 18,854,987 | |
| | | | | | | | | | | | | | | | |
| | | | |
| Food & Staples Retailing: 1.54% | | | | | | | | | | | | |
Costco Wholesale Corporation | | | | | | | | | | | 17,044 | | | | 6,677,328 | |
Sysco Corporation | | | | | | | | | | | 19,631 | | | | 1,399,494 | |
The Kroger Company | | | | | | | | | | | 30,030 | | | | 990,990 | |
Walgreens Boots Alliance Incorporated | | | | | | | | | | | 27,764 | | | | 1,055,310 | |
Walmart Incorporated | | | | | | | | | | | 53,601 | | | | 8,189,697 | |
| |
| | | | 18,312,819 | |
| | | | | | | | | | | | | | | | |
| | | | |
| Food Products: 1.02% | | | | | | | | | | | | |
Archer Daniels Midland Company | | | | | | | | | | | 21,449 | | | | 1,067,517 | |
Campbell Soup Company | | | | | | | | | | | 7,815 | | | | 390,906 | |
ConAgra Brands Incorporated | | | | | | | | | | | 18,856 | | | | 689,375 | |
General Mills Incorporated | | | | | | | | | | | 23,583 | | | | 1,434,318 | |
Hormel Foods Corporation | | | | | | | | | | | 10,832 | | | | 511,054 | |
Kellogg Company | | | | | | | | | | | 9,796 | | | | 626,062 | |
Lamb Weston Holdings Incorporated | | | | | | | | | | | 5,609 | | | | 405,979 | |
McCormick & Company Incorporated | | | | | | | | | | | 4,785 | | | | 894,699 | |
Mondelez International Incorporated Class A | | | | | | | | | | | 55,137 | | | | 3,167,621 | |
The Hershey Company | | | | | | | | | | | 5,690 | | | | 841,494 | |
The J.M. Smucker Company | | | | | | | | | | | 4,404 | | | | 516,149 | |
The Kraft Heinz Company | | | | | | | | | | | 25,013 | | | | 823,928 | |
Tyson Foods Incorporated Class A | | | | | | | | | | | 11,359 | | | | 740,607 | |
| |
| | | | 12,109,709 | |
| | | | | | | | | | | | | | | | |
The accompanying notes are an integral part of these financial statements.
22 | Wells Fargo Index Portfolio
Portfolio of investments—November 30, 2020 (unaudited)
| | | | | | | | | | | | | | | | |
| | | | | | | | | Shares | | | Value | |
Household Products: 1.66% | | | | | | | | | | | | | | | | |
Church & Dwight Company Incorporated | | | | | | | | | | | 9,547 | | | $ | 837,940 | |
Colgate-Palmolive Company | | | | | | | | | | | 33,098 | | | | 2,834,513 | |
Kimberly-Clark Corporation | | | | | | | | | | | 13,165 | | | | 1,834,016 | |
The Clorox Company | | | | | | | | | | | 4,872 | | | | 988,821 | |
The Procter & Gamble Company | | | | | | | | | | | 96,105 | | | | 13,346,101 | |
| |
| | | | 19,841,391 | |
| | | | | | | | | | | | | | | | |
| | | | |
| Personal Products: 0.18% | | | | | | | | | | | | |
The Estee Lauder Companies Incorporated Class A | | | | | | | | | | | 8,707 | | | | 2,136,001 | |
| | | | | | | | | | | | | | | | |
| | | | |
| Tobacco: 0.62% | | | | | | | | | | | | |
Altria Group Incorporated | | | | | | | | | | | 71,738 | | | | 2,857,325 | |
Philip Morris International Incorporated | | | | | | | | | | | 60,115 | | | | 4,553,711 | |
| |
| | | | 7,411,036 | |
| | | | | | | | | | | | | | | | |
| | | | |
Energy: 2.24% | | | | | | | | | | | | | | | | |
| | | | |
| Energy Equipment & Services: 0.21% | | | | | | | | | | | | |
Baker Hughes Company | | | | | | | | | | | 25,336 | | | | 474,290 | |
Halliburton Company | | | | | | | | | | | 33,911 | | | | 562,583 | |
National Oilwell Varco Incorporated | | | | | | | | | | | 14,989 | | | | 183,765 | |
Schlumberger Limited | | | | | | | | | | | 53,584 | | | | 1,114,011 | |
TechnipFMC plc | | | | | | | | | | | 16,305 | | | | 135,495 | |
| |
| | | | 2,470,144 | |
| | | | | | | | | | | | | | | | |
| | | | |
| Oil, Gas & Consumable Fuels: 2.03% | | | | | | | | | | | | |
Apache Corporation | | | | | | | | | | | 14,571 | | | | 187,820 | |
Cabot Oil & Gas Corporation | | | | | | | | | | | 15,386 | | | | 269,563 | |
Chevron Corporation | | | | | | | | | | | 74,311 | | | | 6,478,433 | |
Concho Resources Incorporated | | | | | | | | | | | 7,593 | | | | 436,446 | |
ConocoPhillips | | | | | | | | | | | 41,403 | | | | 1,637,903 | |
Devon Energy Corporation | | | | | | | | | | | 14,777 | | | | 206,730 | |
Diamondback Energy Incorporated | | | | | | | | | | | 6,092 | | | | 243,436 | |
EOG Resources Incorporated | | | | | | | | | | | 22,476 | | | | 1,053,675 | |
Exxon Mobil Corporation | | | | | | | | | | | 163,219 | | | | 6,223,540 | |
Hess Corporation | | | | | | | | | | | 10,552 | | | | 497,843 | |
HollyFrontier Corporation | | | | | | | | | | | 5,754 | | | | 134,586 | |
Kinder Morgan Incorporated | | | | | | | | | | | 75,145 | | | | 1,080,585 | |
Marathon Oil Corporation | | | | | | | | | | | 30,474 | | | | 180,406 | |
Marathon Petroleum Corporation | | | | | | | | | | | 25,118 | | | | 976,588 | |
Occidental Petroleum Corporation | | | | | | | | | | | 32,315 | | | | 509,284 | |
ONEOK Incorporated | | | | | | | | | | | 17,147 | | | | 615,063 | |
Phillips 66 | | | | | | | | | | | 16,858 | | | | 1,021,258 | |
Pioneer Natural Resources Company | | | | | | | | | | | 6,341 | | | | 637,778 | |
The Williams Companies Incorporated | | | | | | | | | | | 46,846 | | | | 982,829 | |
Valero Energy Corporation | | | | | | | | | | | 15,740 | | | | 846,340 | |
| |
| | | | 24,220,106 | |
| | | | | | | | | | | | | | | | |
| | | | |
Financials: 10.13% | | | | | | | | | | | | | | | | |
| | | | |
| Banks: 3.66% | | | | | | | | | | | | |
Bank of America Corporation | | | | | | | | | | | 294,320 | | | | 8,288,051 | |
Citigroup Incorporated | | | | | | | | | | | 80,365 | | | | 4,425,701 | |
Citizens Financial Group Incorporated | | | | | | | | | | | 16,477 | | | | 538,139 | |
Comerica Incorporated | | | | | | | | | | | 5,367 | | | | 264,056 | |
Fifth Third Bancorp | | | | | | | | | | | 27,494 | | | | 696,698 | |
The accompanying notes are an integral part of these financial statements.
Wells Fargo Index Portfolio | 23
Portfolio of investments—November 30, 2020 (unaudited)
| | | | | | | | | | | | | | | | |
| | | | | | | | | Shares | | | Value | |
| Banks (continued) | | | | | | | | | | | | |
First Republic Bank | | | | | | | | | | | 6,644 | | | $ | 860,797 | |
Huntington Bancshares Incorporated | | | | | | | | | | | 39,270 | | | | 474,382 | |
JPMorgan Chase & Company | | | | | | | | | | | 117,645 | | | | 13,867,993 | |
KeyCorp | | | | | | | | | | | 37,676 | | | | 582,471 | |
M&T Bank Corporation | | | | | | | | | | | 4,952 | | | | 576,858 | |
People’s United Financial Incorporated | | | | | | | | | | | 16,397 | | | | 203,323 | |
PNC Financial Services Group Incorporated | | | | | | | | | | | 16,387 | | | | 2,262,553 | |
Regions Financial Corporation | | | | | | | | | | | 37,065 | | | | 565,983 | |
SVB Financial Group † | | | | | | | | | | | 1,998 | | | | 689,030 | |
Truist Financial Corporation | | | | | | | | | | | 52,021 | | | | 2,414,815 | |
US Bancorp | | | | | | | | | | | 52,916 | | | | 2,286,500 | |
Wells Fargo & Company (l) | | | | | | | | | | | 159,043 | | | | 4,349,826 | |
Zions Bancorporation | | | | | | | | | | | 6,330 | | | | 244,275 | |
| |
| | | | 43,591,451 | |
| | | | | | | | | | | | | | | | |
| | | | |
| Capital Markets: 2.67% | | | | | | | | | | | | |
Ameriprise Financial Incorporated | | | | | | | | | | | 4,643 | | | | 860,069 | |
Bank of New York Mellon Corporation | | | | | | | | | | | 31,461 | | | | 1,230,754 | |
BlackRock Incorporated | | | | | | | | | | | 5,474 | | | | 3,822,768 | |
Cboe Global Markets Incorporated | | | | | | | | | | | 4,198 | | | | 383,361 | |
CME Group Incorporated | | | | | | | | | | | 13,844 | | | | 2,423,115 | |
Franklin Resources Incorporated | | | | | | | | | | | 10,326 | | | | 227,069 | |
Intercontinental Exchange Incorporated | | | | | | | | | | | 21,665 | | | | 2,285,874 | |
Invesco Limited | | | | | | | | | | | 14,534 | | | | 235,887 | |
MarketAxess Holdings Incorporated | | | | | | | | | | | 1,466 | | | | 790,438 | |
Moody’s Corporation | | | | | | | | | | | 6,231 | | | | 1,759,261 | |
Morgan Stanley | | | | | | | | | | | 55,118 | | | | 3,407,946 | |
MSCI Incorporated | | | | | | | | | | | 3,229 | | | | 1,322,017 | |
Northern Trust Corporation | | | | | | | | | | | 8,033 | | | | 748,033 | |
Raymond James Financial Incorporated | | | | | | | | | | | 4,712 | | | | 428,556 | |
S&P Global Incorporated | | | | | | | | | | | 9,303 | | | | 3,272,609 | |
State Street Corporation | | | | | | | | | | | 13,603 | | | | 958,739 | |
T. Rowe Price Group Incorporated | | | | | | | | | | | 8,762 | | | | 1,256,558 | |
The Charles Schwab Corporation | | | | | | | | | | | 57,175 | | | | 2,788,997 | |
The Goldman Sachs Group Incorporated | | | | | | | | | | | 13,282 | | | | 3,062,564 | |
The NASDAQ Incorporated | | | | | | | | | | | 4,439 | | | | 568,148 | |
| |
| | | | 31,832,763 | |
| | | | | | | | | | | | | | | | |
| | | | |
| Consumer Finance: 0.51% | | | | | | | | | | | | |
American Express Company | | | | | | | | | | | 25,176 | | | | 2,985,622 | |
Capital One Financial Corporation | | | | | | | | | | | 17,627 | | | | 1,509,576 | |
Discover Financial Services | | | | | | | | | | | 11,829 | | | | 901,015 | |
Synchrony Financial | | | | | | | | | | | 20,957 | | | | 638,560 | |
| |
| | | | 6,034,773 | |
| | | | | | | | | | | | | | | | |
| | | | |
| Diversified Financial Services: 1.47% | | | | | | | | | | | | |
Berkshire Hathaway Incorporated Class B † | | | | | | | | | | | 76,518 | | | | 17,515,735 | |
| | | | | | | | | | | | | | | | |
| | | | |
| Insurance: 1.82% | | | | | | | | | | | | |
AFLAC Incorporated | | | | | | | | | | | 25,594 | | | | 1,124,344 | |
American International Group Incorporated | | | | | | | | | | | 33,253 | | | | 1,278,245 | |
Aon plc Class A | | | | | | | | | | | 8,942 | | | | 1,832,126 | |
Arthur J. Gallagher & Company | | | | | | | | | | | 7,392 | | | | 853,111 | |
Assurant Incorporated | | | | | | | | | | | 2,303 | | | | 297,363 | |
Chubb Limited | | | | | | | | | | | 17,424 | | | | 2,575,790 | |
Cincinnati Financial Corporation | | | | | | | | | | | 5,775 | | | | 440,921 | |
The accompanying notes are an integral part of these financial statements.
24 | Wells Fargo Index Portfolio
Portfolio of investments—November 30, 2020 (unaudited)
| | | | | | | | | | | | | | | | |
| | | | | | | | | Shares | | | Value | |
| Insurance (continued) | | | | | | | | | | | | |
Everest Reinsurance Group Limited | | | | | | | | | | | 1,543 | | | $ | 350,770 | |
Globe Life Incorporated | | | | | | | | | | | 3,783 | | | | 352,197 | |
Lincoln National Corporation | | | | | | | | | | | 7,012 | | | | 331,107 | |
Loews Corporation | | | | | | | | | | | 9,202 | | | | 385,656 | |
Marsh & McLennan Companies Incorporated | | | | | | | | | | | 19,553 | | | | 2,241,556 | |
MetLife Incorporated | | | | | | | | | | | 29,782 | | | | 1,375,035 | |
Principal Financial Group Incorporated | | | | | | | | | | | 9,855 | | | | 490,680 | |
Prudential Financial Incorporated | | | | | | | | | | | 15,248 | | | | 1,153,054 | |
The Allstate Corporation | | | | | | | | | | | 12,056 | | | | 1,233,932 | |
The Hartford Financial Services Group Incorporated | | | | | | | | | | | 13,827 | | | | 611,153 | |
The Progressive Corporation | | | | | | | | | | | 22,598 | | | | 1,968,512 | |
The Travelers Companies Incorporated | | | | | | | | | | | 9,774 | | | | 1,267,199 | |
Unum Group | | | | | | | | | | | 7,858 | | | | 174,683 | |
W.R. Berkley Corporation | | | | | | | | | | | 5,428 | | | | 353,526 | |
Willis Towers Watson plc | | | | | | | | | | | 4,974 | | | | 1,035,537 | |
| |
| | | | 21,726,497 | |
| | | | | | | | | | | | | | | | |
| | | | |
Health Care: 13.32% | | | | | | | | | | | | | | | | |
| | | | |
| Biotechnology: 1.89% | | | | | | | | | | | | |
AbbVie Incorporated | | | | | | | | | | | 68,127 | | | | 7,124,722 | |
Alexion Pharmaceuticals Incorporated † | | | | | | | | | | | 8,461 | | | | 1,033,173 | |
Amgen Incorporated | | | | | | | | | | | 22,609 | | | | 5,020,102 | |
Biogen Incorporated † | | | | | | | | | | | 6,111 | | | | 1,467,679 | |
Gilead Sciences Incorporated | | | | | | | | | | | 48,397 | | | | 2,936,246 | |
Incyte Corporation † | | | | | | | | | | | 7,176 | | | | 606,659 | |
Regeneron Pharmaceuticals Incorporated † | | | | | | | | | | | 4,036 | | | | 2,082,697 | |
Vertex Pharmaceuticals Incorporated † | | | | | | | | | | | 10,055 | | | | 2,290,026 | |
| |
| | | | 22,561,304 | |
| | | | | | | | | | | | | | | | |
| | | | |
| Health Care Equipment & Supplies: 3.72% | | | | | | | | | | | | |
Abbott Laboratories | | | | | | | | | | | 68,347 | | | | 7,396,512 | |
ABIOMED Incorporated † | | | | | | | | | | | 1,739 | | | | 476,660 | |
Align Technology Incorporated † | | | | | | | | | | | 2,768 | | | | 1,332,211 | |
Baxter International Incorporated | | | | | | | | | | | 19,542 | | | | 1,486,560 | |
Becton Dickinson & Company | | | | | | | | | | | 11,190 | | | | 2,627,860 | |
Boston Scientific Corporation † | | | | | | | | | | | 55,227 | | | | 1,830,775 | |
Danaher Corporation | | | | | | | | | | | 24,372 | | | | 5,474,682 | |
Dentsply Sirona Incorporated | | | | | | | | | | | 8,434 | | | | 429,206 | |
DexCom Incorporated † | | | | | | | | | | | 3,696 | | | | 1,181,537 | |
Edwards Lifesciences Corporation † | | | | | | | | | | | 24,001 | | | | 2,013,444 | |
Hologic Incorporated † | | | | | | | | | | | 9,997 | | | | 691,093 | |
IDEXX Laboratories Incorporated † | | | | | | | | | | | 3,283 | | | | 1,513,397 | |
Intuitive Surgical Incorporated † | | | | | | | | | | | 4,517 | | | | 3,279,568 | |
Medtronic plc | | | | | | | | | | | 51,890 | | | | 5,899,893 | |
ResMed Incorporated | | | | | | | | | | | 5,594 | | | | 1,172,502 | |
STERIS plc | | | | | | | | | | | 3,283 | | | | 636,278 | |
Stryker Corporation | | | | | | | | | | | 12,614 | | | | 2,944,108 | |
Teleflex Incorporated | | | | | | | | | | | 1,796 | | | | 687,419 | |
The Cooper Companies Incorporated | | | | | | | | | | | 1,897 | | | | 635,912 | |
Varian Medical Systems Incorporated † | | | | | | | | | | | 3,518 | | | | 612,062 | |
West Pharmaceutical Services Incorporated | | | | | | | | | | | 2,850 | | | | 784,206 | |
Zimmer Biomet Holdings Incorporated | | | | | | | | | | | 7,993 | | | | 1,191,916 | |
| |
| | | | 44,297,801 | |
| | | | | | | | | | | | | | | | |
The accompanying notes are an integral part of these financial statements.
Wells Fargo Index Portfolio | 25
Portfolio of investments—November 30, 2020 (unaudited)
| | | | | | | | | | | | | | | | |
| | | | | | | | | Shares | | | Value | |
| Health Care Providers & Services: 2.64% | | | | | | | | | | | | |
AmerisourceBergen Corporation | | | | | | | | | | | 5,674 | | | $ | 585,046 | |
Anthem Incorporated | | | | | | | | | | | 9,709 | | | | 3,024,548 | |
Cardinal Health Incorporated | | | | | | | | | | | 11,289 | | | | 616,267 | |
Centene Corporation † | | | | | | | | | | | 22,369 | | | | 1,379,049 | |
Cigna Corporation | | | | | | | | | | | 14,175 | | | | 2,964,560 | |
CVS Health Corporation | | | | | | | | | | | 50,519 | | | | 3,424,683 | |
DaVita Incorporated † | | | | | | | | | | | 2,905 | | | | 319,114 | |
HCA Healthcare Incorporated | | | | | | | | | | | 10,178 | | | | 1,527,820 | |
Henry Schein Incorporated † | | | | | | | | | | | 5,511 | | | | 354,412 | |
Humana Incorporated | | | | | | | | | | | 5,107 | | | | 2,045,456 | |
Laboratory Corporation of America Holdings † | | | | | | | | | | | 3,760 | | | | 751,398 | |
McKesson Corporation | | | | | | | | | | | 6,261 | | | | 1,126,417 | |
Quest Diagnostics Incorporated | | | | | | | | | | | 5,184 | | | | 642,712 | |
UnitedHealth Group Incorporated | | | | | | | | | | | 36,685 | | | | 12,338,633 | |
Universal Health Services Incorporated Class B | | | | | | | | | | | 2,999 | | | | 391,609 | |
| |
| | | | 31,491,724 | |
| | | | | | | | | | | | | | | | |
| | | | |
| Health Care Technology: 0.08% | | | | | | | | | | | | |
Cerner Corporation | | | | | | | | | | | 11,788 | | | | 882,214 | |
| | | | | | | | | | | | | | | | |
| | | | |
| Life Sciences Tools & Services: 1.19% | | | | | | | | | | | | |
Agilent Technologies Incorporated | | | | | | | | | | | 11,901 | | | | 1,391,227 | |
Bio-Rad Laboratories Incorporated Class A † | | | | | | | | | | | 826 | | | | 444,801 | |
Illumina Incorporated † | | | | | | | | | | | 5,636 | | | | 1,815,299 | |
IQVIA Holdings Incorporated † | | | | | | | | | | | 7,383 | | | | 1,247,653 | |
Mettler-Toledo International Incorporated † | | | | | | | | | | | 925 | | | | 1,063,787 | |
PerkinElmer Incorporated | | | | | | | | | | | 4,316 | | | | 574,028 | |
Thermo Fisher Scientific Incorporated | | | | | | | | | | | 15,271 | | | | 7,100,710 | |
Waters Corporation † | | | | | | | | | | | 2,390 | | | | 554,504 | |
| |
| | | | 14,192,009 | |
| | | | | | | | | | | | | | | | |
| | | | |
| Pharmaceuticals: 3.80% | | | | | | | | | | | | |
Bristol-Myers Squibb Company | | | | | | | | | | | 87,007 | | | | 5,429,237 | |
Catalent Incorporated † | | | | | | | | | | | 6,336 | | | | 609,143 | |
Eli Lilly & Company | | | | | | | | | | | 30,645 | | | | 4,463,444 | |
Johnson & Johnson | | | | | | | | | | | 101,633 | | | | 14,704,262 | |
Merck & Company Incorporated | | | | | | | | | | | 97,634 | | | | 7,848,797 | |
Perrigo Company plc | | | | | | | | | | | 5,268 | | | | 254,023 | |
Pfizer Incorporated | | | | | | | | | | | 214,508 | | | | 8,217,801 | |
Viatris Incorporated † | | | | | | | | | | | 46,570 | | | | 783,307 | |
Zoetis Incorporated | | | | | | | | | | | 18,342 | | | | 2,941,690 | |
| |
| | | | 45,251,704 | |
| | | | | | | | | | | | | | | | |
| | | | |
Industrials: 8.51% | | | | | | | | | | | | | | | | |
| | | | |
| Aerospace & Defense: 1.64% | | | | | | | | | | | | |
General Dynamics Corporation | | | | | | | | | | | 8,972 | | | | 1,339,968 | |
Howmet Aerospace Incorporated | | | | | | | | | | | 15,152 | | | | 355,466 | |
Huntington Ingalls Industries Incorporated | | | | | | | | | | | 1,563 | | | | 250,377 | |
L3Harris Technologies Incorporated | | | | | | | | | | | 8,346 | | | | 1,602,349 | |
Lockheed Martin Corporation | | | | | | | | | | | 9,496 | | | | 3,466,040 | |
Northrop Grumman Corporation | | | | | | | | | | | 5,985 | | | | 1,809,026 | |
Raytheon Technologies Corporation | | | | | | | | | | | 58,971 | | | | 4,229,400 | |
Teledyne Technologies Incorporated † | | | | | | | | | | | 1,423 | | | | 537,809 | |
Textron Incorporated | | | | | | | | | | | 8,803 | | | | 397,015 | |
The Boeing Company | | | | | | | | | | | 20,482 | | | | 4,315,762 | |
The accompanying notes are an integral part of these financial statements.
26 | Wells Fargo Index Portfolio
Portfolio of investments—November 30, 2020 (unaudited)
| | | | | | | | | | | | | | | | |
| | | | | | | | | Shares | | | Value | |
| Aerospace & Defense (continued) | | | | | | | | | | | | |
TransDigm Group Incorporated | | | | | | | | | | | 2,092 | | | $ | 1,211,665 | |
| |
| | | | 19,514,877 | |
| | | | | | | | | | | | | | | | |
| | | | |
| Air Freight & Logistics: 0.70% | | | | | | | | | | | | |
C.H. Robinson Worldwide Incorporated | | | | | | | | | | | 5,204 | | | | 489,020 | |
Expeditors International of Washington Incorporated | | | | | | | | | | | 6,472 | | | | 578,403 | |
FedEx Corporation | | | | | | | | | | | 9,305 | | | | 2,666,627 | |
United Parcel Service Incorporated Class B | | | | | | | | | | | 27,295 | | | | 4,669,356 | |
| |
| | | | 8,403,406 | |
| | | | | | | | | | | | | | | | |
| | | | |
| Airlines: 0.26% | | | | | | | | | | | | |
Alaska Air Group Incorporated | | | | | | | | | | | 4,773 | | | | 243,280 | |
American Airlines Group Incorporated « | | | | | | | | | | | 21,118 | | | | 298,397 | |
Delta Air Lines Incorporated | | | | | | | | | | | 24,623 | | | | 991,076 | |
Southwest Airlines Company | | | | | | | | | | | 22,770 | | | | 1,055,162 | |
United Airlines Holdings Incorporated † | | | | | | | | | | | 11,233 | | | | 506,047 | |
| |
| | | | 3,093,962 | |
| | | | | | | | | | | | | | | | |
| | | | |
| Building Products: 0.47% | | | | | | | | | | | | |
A.O. Smith Corporation | | | | | | | | | | | 5,226 | | | | 294,276 | |
Allegion plc | | | | | | | | | | | 3,560 | | | | 405,982 | |
Carrier Global Corporation | | | | | | | | | | | 31,430 | | | | 1,196,540 | |
Fortune Brands Home & Security Incorporated | | | | | | | | | | | 5,333 | | | | 445,306 | |
Johnson Controls International plc | | | | | | | | | | | 28,722 | | | | 1,322,361 | |
Masco Corporation | | | | | | | | | | | 10,096 | | | | 541,852 | |
Trane Technologies plc | | | | | | | | | | | 9,240 | | | | 1,351,258 | |
| |
| | | | 5,557,575 | |
| | | | | | | | | | | | | | | | |
| | | | |
| Commercial Services & Supplies: 0.42% | | | | | | | | | | | | |
Cintas Corporation | | | | | | | | | | | 3,356 | | | | 1,192,387 | |
Copart Incorporated † | | | | | | | | | | | 7,975 | | | | 920,714 | |
Republic Services Incorporated | | | | | | | | | | | 8,114 | | | | 784,786 | |
Rollins Incorporated | | | | | | | | | | | 5,694 | | | | 325,583 | |
Waste Management Incorporated | | | | | | | | | | | 15,003 | | | | 1,787,307 | |
| |
| | | | 5,010,777 | |
| | | | | | | | | | | | | | | | |
| | | | |
| Construction & Engineering: 0.08% | | | | | | | | | | | | |
Jacobs Engineering Group Incorporated | | | | | | | | | | | 5,026 | | | | 542,004 | |
Quanta Services Incorporated | | | | | | | | | | | 5,328 | | | | 364,116 | |
| |
| | | | 906,120 | |
| | | | | | | | | | | | | | | | |
| | | | |
| Electrical Equipment: 0.49% | | | | | | | | | | | | |
AMETEK Incorporated | | | | | | | | | | | 8,864 | | | | 1,050,650 | |
Eaton Corporation plc | | | | | | | | | | | 15,445 | | | | 1,870,544 | |
Emerson Electric Company | | | | | | | | | | | 23,068 | | | | 1,772,084 | |
Rockwell Automation Incorporated | | | | | | | | | | | 4,477 | | | | 1,144,142 | |
| |
| | | | 5,837,420 | |
| | | | | | | | | | | | | | | | |
| | | | |
| Industrial Conglomerates: 1.22% | | | | | | | | | | | | |
3M Company | | | | | | | | | | | 22,236 | | | | 3,840,824 | |
General Electric Company | | | | | | | | | | | 337,897 | | | | 3,439,791 | |
Honeywell International Incorporated | | | | | | | | | | | 27,090 | | | | 5,524,193 | |
Roper Technologies Incorporated | | | | | | | | | | | 4,042 | | | | 1,725,934 | |
| |
| | | | 14,530,742 | |
| | | | | | | | | | | | | | | | |
The accompanying notes are an integral part of these financial statements.
Wells Fargo Index Portfolio | 27
Portfolio of investments—November 30, 2020 (unaudited)
| | | | | | | | | | | | | | | | |
| | | | | | | | | Shares | | | Value | |
| Machinery: 1.67% | | | | | | | | | | | | |
Caterpillar Incorporated | | | | | | | | | | | 20,903 | | | $ | 3,628,552 | |
Cummins Incorporated | | | | | | | | | | | 5,701 | | | | 1,317,900 | |
Deere & Company | | | | | | | | | | | 12,097 | | | | 3,164,817 | |
Dover Corporation | | | | | | | | | | | 5,558 | | | | 678,243 | |
Flowserve Corporation | | | | | | | | | | | 5,024 | | | | 171,218 | |
Fortive Corporation | | | | | | | | | | | 13,012 | | | | 912,532 | |
IDEX Corporation | | | | | | | | | | | 2,915 | | | | 563,032 | |
Illinois Tool Works Incorporated | | | | | | | | | | | 11,106 | | | | 2,344,366 | |
Ingersoll Rand Incorporated † | | | | | | | | | | | 14,328 | | | | 634,301 | |
Otis Worldwide Corporation | | | | | | | | | | | 15,715 | | | | 1,051,962 | |
PACCAR Incorporated | | | | | | | | | | | 13,362 | | | | 1,163,296 | |
Parker-Hannifin Corporation | | | | | | | | | | | 4,963 | | | | 1,326,411 | |
Pentair plc | | | | | | | | | | | 6,404 | | | | 331,855 | |
Snap-on Incorporated | | | | | | | | | | | 2,103 | | | | 369,813 | |
Stanley Black & Decker Incorporated | | | | | | | | | | | 6,164 | | | | 1,136,087 | |
Wabtec Corporation | | | | | | | | | | | 6,905 | | | | 506,137 | |
Xylem Incorporated | | | | | | | | | | | 6,947 | | | | 666,704 | |
| |
| | | | 19,967,226 | |
| | | | | | | | | | | | | | | | |
| | | | |
| Professional Services: 0.33% | | | | | | | | | | | | |
Equifax Incorporated | | | | | | | | | | | 4,689 | | | | 782,594 | |
IHS Markit Limited | | | | | | | | | | | 14,399 | | | | 1,432,125 | |
Nielsen Holdings plc | | | | | | | | | | | 13,772 | | | | 222,693 | |
Robert Half International Incorporated | | | | | | | | | | | 4,425 | | | | 283,997 | |
Verisk Analytics Incorporated | | | | | | | | | | | 6,268 | | | | 1,243,007 | |
| |
| | | | 3,964,416 | |
| | | | | | | | | | | | | | | | |
| | | | |
| Road & Rail: 1.02% | | | | | | | | | | | | |
CSX Corporation | | | | | | | | | | | 29,533 | | | | 2,659,447 | |
J.B. Hunt Transport Services Incorporated | | | | | | | | | | | 3,218 | | | | 435,331 | |
Kansas City Southern | | | | | | | | | | | 3,642 | | | | 678,031 | |
Norfolk Southern Corporation | | | | | | | | | | | 9,848 | | | | 2,334,173 | |
Old Dominion Freight Line Incorporated | | | | | | | | | | | 3,714 | | | | 755,279 | |
Union Pacific Corporation | | | | | | | | | | | 26,205 | | | | 5,347,916 | |
| |
| | | | 12,210,177 | |
| | | | | | | | | | | | | | | | |
| | | | |
| Trading Companies & Distributors: 0.21% | | | | | | | | | | | | |
Fastenal Company | | | | | | | | | | | 22,143 | | | | 1,094,971 | |
United Rentals Incorporated † | | | | | | | | | | | 2,782 | | | | 631,458 | |
W.W. Grainger Incorporated | | | | | | | | | | | 1,737 | | | | 726,587 | |
| |
| | | | 2,453,016 | |
| | | | | | | | | | | | | | | | |
| | | | |
Information Technology: 26.83% | | | | | | | | | | | | | | | | |
| | | | |
| Communications Equipment: 0.79% | | | | | | | | | | | | |
Arista Networks Incorporated † | | | | | | | | | | | 2,113 | | | | 571,989 | |
Cisco Systems Incorporated | | | | | | | | | | | 163,420 | | | | 7,030,328 | |
F5 Networks Incorporated † | | | | | | | | | | | 2,361 | | | | 384,394 | |
Juniper Networks Incorporated | | | | | | | | | | | 12,806 | | | | 278,787 | |
Motorola Solutions Incorporated | | | | | | | | | | | 6,554 | | | | 1,124,208 | |
| |
| | | | 9,389,706 | |
| | | | | | | | | | | | | | | | |
| | | | |
| Electronic Equipment, Instruments & Components: 0.59% | | | | | | | | | | | | |
Amphenol Corporation Class A | | | | | | | | | | | 11,518 | | | | 1,506,670 | |
CDW Corporation of Delaware | | | | | | | | | | | 5,507 | | | | 718,608 | |
The accompanying notes are an integral part of these financial statements.
28 | Wells Fargo Index Portfolio
Portfolio of investments—November 30, 2020 (unaudited)
| | | | | | | | | | | | | | | | |
| | | | | | | | | Shares | | | Value | |
| Electronic Equipment, Instruments & Components (continued) | | | | | | | | | | | | |
Corning Incorporated | | | | | | | | | | | 29,374 | | | $ | 1,099,175 | |
FLIR Systems Incorporated | | | | | | | | | | | 5,062 | | | | 193,571 | |
IPG Photonics Corporation † | | | | | | | | | | | 1,377 | | | | 285,053 | |
Keysight Technologies Incorporated † | | | | | | | | | | | 7,224 | | | | 867,169 | |
TE Connectivity Limited | | | | | | | | | | | 12,740 | | | | 1,451,978 | |
Vontier Corporation † | | | | | | | | | | | 5,205 | | | | 172,650 | |
Zebra Technologies Corporation Class A † | | | | | | | | | | | 2,059 | | | | 779,167 | |
| |
| | | | 7,074,041 | |
| | | | | | | | | | | | | | | | |
| | | | |
| IT Services: 5.39% | | | | | | | | | | | | |
Accenture plc Class A | | | | | | | | | | | 24,559 | | | | 6,117,401 | |
Akamai Technologies Incorporated † | | | | | | | | | | | 6,281 | | | | 650,146 | |
Automatic Data Processing Incorporated | | | | | | | | | | | 16,598 | | | | 2,886,060 | |
Broadridge Financial Solutions Incorporated | | | | | | | | | | | 4,446 | | | | 653,028 | |
Cognizant Technology Solutions Corporation Class A | | | | | | | | | | | 20,932 | | | | 1,635,417 | |
DXC Technology Company | | | | | | | | | | | 9,813 | | | | 215,003 | |
Fidelity National Information Services Incorporated | | | | | | | | | | | 23,918 | | | | 3,549,670 | |
Fiserv Incorporated † | | | | | | | | | | | 21,456 | | | | 2,471,302 | |
FleetCor Technologies Incorporated † | | | | | | | | | | | 3,245 | | | | 860,606 | |
Gartner Incorporated † | | | | | | | | | | | 3,445 | | | | 523,640 | |
Global Payments Incorporated | | | | | | | | | | | 11,551 | | | | 2,254,640 | |
International Business Machines Corporation | | | | | | | | | | | 34,378 | | | | 4,246,371 | |
Jack Henry & Associates Incorporated | | | | | | | | | | | 2,959 | | | | 475,985 | |
Leidos Holdings Incorporated | | | | | | | | | | | 5,160 | | | | 519,612 | |
MasterCard Incorporated Class A | | | | | | | | | | | 34,100 | | | | 11,474,991 | |
Paychex Incorporated | | | | | | | | | | | 12,367 | | | | 1,151,986 | |
PayPal Holdings Incorporated † | | | | | | | | | | | 45,292 | | | | 9,697,923 | |
VeriSign Incorporated † | | | | | | | | | | | 3,902 | | | | 783,209 | |
Visa Incorporated Class A | | | | | | | | | | | 65,084 | | | | 13,690,419 | |
Western Union Company | | | | | | | | | | | 15,866 | | | | 357,937 | |
| |
| | | | 64,215,346 | |
| | | | | | | | | | | | | | | | |
| | | | |
| Semiconductors & Semiconductor Equipment: 5.10% | | | | | | | | | | | | |
Advanced Micro Devices Incorporated † | | | | | | | | | | | 45,321 | | | | 4,199,444 | |
Analog Devices Incorporated | | | | | | | | | | | 14,266 | | | | 1,984,115 | |
Applied Materials Incorporated | | | | | | | | | | | 35,255 | | | | 2,907,832 | |
Broadcom Incorporated | | | | | | | | | | | 15,525 | | | | 6,234,530 | |
Intel Corporation | | | | | | | | | | | 164,176 | | | | 7,937,910 | |
KLA Corporation | | | | | | | | | | | 6,001 | | | | 1,512,072 | |
Lam Research Corporation | | | | | | | | | | | 5,621 | | | | 2,544,402 | |
Maxim Integrated Products Incorporated | | | | | | | | | | | 10,306 | | | | 855,810 | |
Microchip Technology Incorporated | | | | | | | | | | | 9,745 | | | | 1,309,631 | |
Micron Technology Incorporated † | | | | | | | | | | | 42,887 | | | | 2,748,628 | |
NVIDIA Corporation | | | | | | | | | | | 23,818 | | | | 12,767,877 | |
Qorvo Incorporated † | | | | | | | | | | | 4,410 | | | | 690,959 | |
QUALCOMM Incorporated | | | | | | | | | | | 43,554 | | | | 6,409,842 | |
Skyworks Solutions Incorporated | | | | | | | | | | | 6,448 | | | | 910,264 | |
Teradyne Incorporated | | | | | | | | | | | 6,409 | | | | 707,169 | |
Texas Instruments Incorporated | | | | | | | | | | | 35,358 | | | | 5,701,478 | |
Xilinx Incorporated | | | | | | | | | | | 9,431 | | | | 1,372,682 | |
| |
| | | | 60,794,645 | |
| | | | | | | | | | | | | | | | |
| | | | |
| Software: 8.48% | | | | | | | | | | | | |
Adobe Incorporated † | | | | | | | | | | | 18,516 | | | | 8,859,351 | |
ANSYS Incorporated † | | | | | | | | | | | 3,312 | | | | 1,119,655 | |
Autodesk Incorporated † | | | | | | | | | | | 8,465 | | | | 2,372,147 | |
The accompanying notes are an integral part of these financial statements.
Wells Fargo Index Portfolio | 29
Portfolio of investments—November 30, 2020 (unaudited)
| | | | | | | | | | | | | | | | |
| | | | | | | | | Shares | | | Value | |
| Software (continued) | | | | | | | | | | | | |
Cadence Design Systems Incorporated † | | | | | | | | | | | 10,762 | | | $ | 1,251,621 | |
Citrix Systems Incorporated | | | | | | | | | | | 4,769 | | | | 590,974 | |
Fortinet Incorporated † | | | | | | | | | | | 5,185 | | | | 638,948 | |
Intuit Incorporated | | | | | | | | | | | 10,106 | | | | 3,557,514 | |
Microsoft Corporation | | | | | | | | | | | 292,129 | | | | 62,536,055 | |
NortonLifeLock Incorporated | | | | | | | | | | | 22,814 | | | | 415,899 | |
Oracle Corporation | | | | | | | | | | | 74,629 | | | | 4,307,586 | |
Paycom Software Incorporated † | | | | | | | | | | | 1,890 | | | | 788,281 | |
Salesforce.com Incorporated † | | | | | | | | | | | 35,128 | | | | 8,634,462 | |
ServiceNow Incorporated † | | | | | | | | | | | 7,404 | | | | 3,957,808 | |
Synopsys Incorporated † | | | | | | | | | | | 5,858 | | | | 1,332,695 | |
Tyler Technologies Incorporated † | | | | | | | | | | | 1,553 | | | | 664,063 | |
| |
| | | | 101,027,059 | |
| | | | | | | | | | | | | | | | |
| | | | |
| Technology Hardware, Storage & Peripherals: 6.48% | | | | | | | | | | | | |
Apple Incorporated | | | | | | | | | | | 620,585 | | | | 73,880,644 | |
Hewlett Packard Enterprise Company | | | | | | | | | | | 49,657 | | | | 548,213 | |
HP Incorporated | | | | | | | | | | | 53,020 | | | | 1,162,729 | |
NetApp Incorporated | | | | | | | | | | | 8,570 | | | | 456,867 | |
Seagate Technology plc | | | | | | | | | | | 8,616 | | | | 506,707 | |
Western Digital Corporation | | | | | | | | | | | 11,678 | | | | 524,109 | |
Xerox Holdings Corporation | | | | | | | | | | | 6,907 | | | | 151,194 | |
| |
| | | | 77,230,463 | |
| | | | | | | | | | | | | | | | |
| | | | |
Materials: 2.64% | | | | | | | | | | | | | | | | |
| | | | |
| Chemicals: 1.85% | | | | | | | | | | | | |
Air Products & Chemicals Incorporated | | | | | | | | | | | 8,527 | | | | 2,388,754 | |
Albemarle Corporation | | | | | | | | | | | 4,106 | | | | 558,293 | |
Celanese Corporation Series A | | | | | | | | | | | 4,566 | | | | 590,521 | |
CF Industries Holdings Incorporated | | | | | | | | | | | 8,256 | | | | 307,949 | |
Corteva Incorporated | | | | | | | | | | | 28,896 | | | | 1,107,295 | |
Dow Incorporated | | | | | | | | | | | 28,609 | | | | 1,516,563 | |
DuPont de Nemours Incorporated | | | | | | | | | | | 28,327 | | | | 1,797,065 | |
Eastman Chemical Company | | | | | | | | | | | 5,225 | | | | 508,915 | |
Ecolab Incorporated | | | | | | | | | | | 9,584 | | | | 2,129,086 | |
FMC Corporation | | | | | | | | | | | 5,002 | | | | 580,282 | |
International Flavors & Fragrances Incorporated « | | | | | | | | | | | 4,128 | | | | 462,749 | |
Linde plc | | | | | | | | | | | 20,280 | | | | 5,200,198 | |
LyondellBasell Industries NV Class A | | | | | | | | | | | 9,923 | | | | 844,447 | |
PPG Industries Incorporated | | | | | | | | | | | 9,109 | | | | 1,336,928 | |
The Mosaic Company | | | | | | | | | | | 13,317 | | | | 292,441 | |
The Sherwin-Williams Company | | | | | | | | | | | 3,163 | | | | 2,364,754 | |
| |
| | | | 21,986,240 | |
| | | | | | | | | | | | | | | | |
| | | | |
| Construction Materials: 0.11% | | | | | | | | | | | | |
Martin Marietta Materials Incorporated | | | | | | | | | | | 2,404 | | | | 638,575 | |
Vulcan Materials Company | | | | | | | | | | | 5,113 | | | | 714,030 | |
| |
| | | | 1,352,605 | |
| | | | | | | | | | | | | | | | |
| | | | |
| Containers & Packaging: 0.36% | | | | | | | | | | | | |
Amcor plc | | | | | | | | | | | 60,547 | | | | 685,998 | |
Avery Dennison Corporation | | | | | | | | | | | 3,222 | | | | 481,173 | |
Ball Corporation | | | | | | | | | | | 12,606 | | | | 1,210,302 | |
International Paper Company | | | | | | | | | | | 15,174 | | | | 750,810 | |
Packaging Corporation of America | | | | | | | | | | | 3,661 | | | | 475,930 | |
The accompanying notes are an integral part of these financial statements.
30 | Wells Fargo Index Portfolio
Portfolio of investments—November 30, 2020 (unaudited)
| | | | | | | | | | | | | | | | |
| | | | | | | | | Shares | | | Value | |
| Containers & Packaging (continued) | | | | | | | | | | | | |
Sealed Air Corporation | | | | | | | | | | | 6,009 | | | $ | 270,766 | |
WestRock Company | | | | | | | | | | | 10,023 | | | | 423,071 | |
| |
| | | | 4,298,050 | |
| | | | | | | | | | | | | | | | |
| | | | |
| Metals & Mining: 0.32% | | | | | | | | | | | | |
Freeport-McMoRan Incorporated | | | | | | | | | | | 56,059 | | | | 1,311,220 | |
Newmont Corporation | | | | | | | | | | | 31,000 | | | | 1,823,420 | |
Nucor Corporation | | | | | | | | | | | 11,654 | | | | 625,820 | |
| |
| | | | 3,760,460 | |
| | | | | | | | | | | | | | | | |
| | | | |
Real Estate: 2.46% | | | | | | | | | | | | | | | | |
| | | | |
| Equity REITs: 2.40% | | | | | | | | | | | | |
Alexandria Real Estate Equities Incorporated | | | | | | | | | | | 4,528 | | | | 741,369 | |
American Tower Corporation | | | | | | | | | | | 17,123 | | | | 3,958,838 | |
Apartment Investment & Management Company Class A | | | | | | | | | | | 7,077 | | | | 214,787 | |
AvalonBay Communities Incorporated | | | | | | | | | | | 5,433 | | | | 905,083 | |
Boston Properties Incorporated | | | | | | | | | | | 5,467 | | | | 536,641 | |
Crown Castle International Corporation | | | | | | | | | | | 16,200 | | | | 2,714,634 | |
Digital Realty Trust Incorporated | | | | | | | | | | | 10,384 | | | | 1,399,244 | |
Duke Realty Corporation | | | | | | | | | | | 14,305 | | | | 544,448 | |
Equinix Incorporated | | | | | | | | | | | 3,419 | | | | 2,385,744 | |
Equity Residential Company Limited | | | | | | | | | | | 13,219 | | | | 765,644 | |
Essex Property Trust Incorporated | | | | | | | | | | | 2,517 | | | | 618,880 | |
Extra Space Storage Incorporated | | | | | | | | | | | 4,982 | | | | 561,621 | |
Federal Realty Investment Trust | | | | | | | | | | | 2,657 | | | | 231,744 | |
Healthpeak Properties Incorporated | | | | | | | | | | | 20,780 | | | | 599,711 | |
Host Hotels & Resorts Incorporated | | | | | | | | | | | 27,225 | | | | 381,967 | |
Iron Mountain Incorporated | | | | | | | | | | | 11,123 | | | | 305,883 | |
Kimco Realty Corporation | | | | | | | | | | | 16,696 | | | | 241,090 | |
Mid-America Apartment Communities Incorporated | | | | | | | | | | | 4,415 | | | | 556,996 | |
Prologis Incorporated | | | | | | | | | | | 28,518 | | | | 2,853,226 | |
Public Storage Incorporated | | | | | | | | | | | 5,871 | | | | 1,317,805 | |
Realty Income Corporation | | | | | | | | | | | 13,319 | | | | 798,740 | |
Regency Centers Corporation | | | | | | | | | | | 6,090 | | | | 277,582 | |
SBA Communications Corporation | | | | | | | | | | | 4,321 | | | | 1,240,905 | |
Simon Property Group Incorporated | | | | | | | | | | | 12,555 | | | | 1,036,666 | |
SL Green Realty Corporation | | | | | | | | | | | 2,828 | | | | 163,741 | |
UDR Incorporated | | | | | | | | | | | 11,390 | | | | 438,173 | |
Ventas Incorporated | | | | | | | | | | | 14,402 | | | | 690,000 | |
Vornado Realty Trust | | | | | | | | | | | 6,051 | | | | 235,444 | |
Welltower Incorporated | | | | | | | | | | | 16,109 | | | | 1,014,545 | |
Weyerhaeuser Company | | | | | | | | | | | 28,808 | | | | 836,584 | |
| |
| | | | 28,567,735 | |
| | | | | | | | | | | | | | | | |
| | | | |
| Real Estate Management & Development: 0.06% | | | | | | | | | | | | |
CBRE Group Incorporated Class A † | | | | | | | | | | | 12,942 | | | | 791,274 | |
| | | | | | | | | | | | | | | | |
| | | | |
Utilities: 2.82% | | | | | | | | | | | | | | | | |
| | | | |
| Electric Utilities: 1.77% | | | | | | | | | | | | |
Alliant Energy Corporation | | | | | | | | | | | 9,637 | | | | 506,906 | |
American Electric Power Company Incorporated | | | | | | | | | | | 19,153 | | | | 1,625,898 | |
Duke Energy Corporation | | | | | | | | | | | 28,389 | | | | 2,630,525 | |
Edison International | | | | | | | | | | | 14,600 | | | | 895,856 | |
Entergy Corporation | | | | | | | | | | | 7,729 | | | | 841,302 | |
Evergy Incorporated | | | | | | | | | | | 8,756 | | | | 485,170 | |
The accompanying notes are an integral part of these financial statements.
Wells Fargo Index Portfolio | 31
Portfolio of investments—November 30, 2020 (unaudited)
| | | | | | | | | | | | | | | | |
| | | | | | | | | Shares | | | Value | |
| Electric Utilities (continued) | | | | | | | | | | | | |
Eversource Energy | | | | | | | | | | | 13,228 | | | $ | 1,157,582 | |
Exelon Corporation | | | | | | | | | | | 37,618 | | | | 1,544,971 | |
FirstEnergy Corporation | | | | | | | | | | | 20,927 | | | | 555,821 | |
NextEra Energy Incorporated | | | | | | | | | | | 75,606 | | | | 5,563,846 | |
NRG Energy Incorporated | | | | | | | | | | | 9,424 | | | | 308,636 | |
Pinnacle West Capital Corporation | | | | | | | | | | | 4,345 | | | | 355,638 | |
PPL Corporation | | | | | | | | | | | 29,677 | | | | 843,420 | |
The Southern Company | | | | | | | | | | | 40,769 | | | | 2,440,025 | |
Xcel Energy Incorporated | | | | | | | | | | | 20,279 | | | | 1,365,993 | |
| |
| | | | 21,121,589 | |
| | | | | | | | | | | | | | | | |
| | | | |
| Gas Utilities: 0.04% | | | | | | | | | | | | |
Atmos Energy Corporation | | | | | | | | | | | 4,762 | | | | 456,628 | |
| | | | | | | | | | | | | | | | |
| | | | |
| Independent Power & Renewable Electricity Producers: 0.04% | | | | | | | | | | | | |
AES Corporation | | | | | | | | | | | 25,676 | | | | 524,817 | |
| | | | | | | | | | | | | | | | |
| | | | |
Multi-Utilities: 0.88% | | | | | | | | | | | | | | | | |
Ameren Corporation | | | | | | | | | | | 9,538 | | | | 741,866 | |
CenterPoint Energy Incorporated | | | | | | | | | | | 21,031 | | | | 487,709 | |
CMS Energy Corporation | | | | | | | | | | | 11,051 | | | | 680,079 | |
Consolidated Edison Incorporated | | | | | | | | | | | 12,912 | | | | 984,540 | |
Dominion Energy Incorporated | | | | | | | | | | | 32,431 | | | | 2,545,509 | |
DTE Energy Company | | | | | | | | | | | 7,437 | | | | 935,649 | |
NiSource Incorporated | | | | | | | | | | | 14,786 | | | | 357,821 | |
Public Service Enterprise Group Incorporated | | | | | | | | | | | 19,523 | | | | 1,137,800 | |
Sempra Energy | | | | | | | | | | | 11,166 | | | | 1,423,442 | |
WEC Energy Group Incorporated | | | | | | | | | | | 12,177 | | | | 1,156,206 | |
| |
| | | | 10,450,621 | |
| | | | | | | | | | | | | | | | |
| | | | |
| Water Utilities: 0.09% | | | | | | | | | | | | |
American Water Works Company Incorporated | | | | | | | | | | | 6,995 | | | | 1,072,888 | |
| | | | | | | | | | | | | | | | |
| |
Total Common Stocks (Cost $292,003,222) | | | | 1,159,708,080 | |
| | | | | | | | | | | | | | | | |
| | | | |
| | | | | | | | | | | | | | | | |
| | | Yield | | | | | | | | | | |
| Short-Term Investments: 2.29% | |
| | | | |
| Investment Companies: 2.29% | | | | | | | | | | | | |
Securities Lending Cash Investments LLC (l)(r)(u) | | | 0.12 | % | | | | | | | 759,475 | | | | 759,475 | |
Wells Fargo Government Money Market Fund Select Class (l)(u) | | | 0.02 | | | | | | | | 26,524,325 | | | | 26,524,325 | |
| |
Total Short-Term Investments (Cost $27,283,800) | | | | 27,283,800 | |
| | | | | | | | | | | | | | | | |
| | | | | | | | |
| Total investments in securities (Cost $319,287,022) | | | 99.60 | % | | | 1,186,991,880 | |
| | |
Other assets and liabilities, net | | | 0.40 | | | | 4,762,103 | |
| | | | | | | | |
| Total net assets | | | 100.00 | % | | $ | 1,191,753,983 | |
| | | | | | | | |
| † | Non-income-earning security |
| « | All or a portion of this security is on loan. |
| (l) | The issuer of the security is an affiliated person of the Portfolio as defined in the Investment Company Act of 1940. |
| (r) | The investment is a non-registered investment company purchased with cash collateral received from securities on loan. |
| (u) | The rate represents the 7-day annualized yield at period end. |
Abbreviations:
| REIT | Real estate investment trust |
The accompanying notes are an integral part of these financial statements.
32 | Wells Fargo Index Portfolio
Portfolio of investments—November 30, 2020 (unaudited)
Futures Contracts
| | | | | | | | | | | | | | | | | | | | | | | | |
| Description | | Number of
contracts | | | Expiration
date | | | Notional
cost | | | Notional
value | | | Unrealized
gains | | | Unrealized
losses | |
| | | | | | |
Long | | | | | | | | | | | | | | | | | | | | | | | | |
| | | | | | |
E-Mini S&P 500 Index | | | 176 | | | | 12-18-2020 | | | $ | 29,704,327 | | | $ | 31,884,160 | | | $ | 2,179,833 | | | $ | 0 | |
Investments in Affiliates
An affiliated investment is an investment in which the Portfolio owns at least 5% of the outstanding voting shares of the issuer or as a result of other relationships, such as the Portfolio and the issuer having the same investment adviser or investment manager. Transactions with issuers that were either affiliated persons of the Portfolio at the beginning of the period or the end of the period were as follows:
| | | | | | | | | | | | | | | | | | | | | | | | | | | | | | | | | | | | |
| | | Value,
beginning of
period | | | Purchases | | | Sales
proceeds | | | Net
realized
gains
(losses) | | | Net
change in
unrealized
gains
(losses) | | | Value,
end of
period | | | % of
net
assets | | | Shares,
end of
period | | | Income
from
affiliated
securities | |
| | | | | | | | | |
| Common Stocks | | | | | | | | | | | | | | | | | | | | | | | | | | | |
Financials | | | | | | | | | | | | | | | | | | | | | | | | | | | | | | | | | | | | |
Banks | | | | | | | | | | | | | | | | | | | | | | | | | | | | | | | | | | | | |
Wells Fargo & Company | | $ | 4,100,362 | | | $ | 374,346 | | | $ | (266,767 | ) | | $ | (12,701 | ) | | $ | 154,586 | | | $ | 4,349,826 | | | | 0.36 | % | | | 159,043 | | | $ | 31,013 | |
| | | | | | | | | |
| Short-Term Investments | | | | | | | | | | | | | | | | | | | | | | | | | | | |
Investment Companies | | | | | | | | | | | | | | | | | | | | | | | | | | | | | | | | | | | | |
Securities Lending Cash Investments LLC | | | 0 | | | | 4,270,675 | | | | (3,511,200 | ) | | | 0 | | | | 0 | | | | 759,475 | | | | | | | | 759,475 | | | | 269 | # |
Wells Fargo Government Money Market Fund Select Class | | | 30,205,942 | | | | 66,530,491 | | | | (70,212,108 | ) | | | 0 | | | | 0 | | | | 26,524,325 | | | | | | | | 26,524,325 | | | | 8,479 | |
| | | | | | | | | | | | | | | | | | | | | | | 27,283,800 | | | | 2.29 | | | | | | | | | |
| | | | | | | | | | | | | | | | | | | | | | | | | | | | | | | | | | | | |
| | | | | | | | | | | | | | $ | (12,701 | ) | | $ | 154,586 | | | $ | 31,633,626 | | | | 2.65 | % | | | | | | $ | 39,761 | |
| | | | | | | | | | | | | | | | | | | | | | | | | | | | | | | | | | | | |
| # | Amount shown represents income before fees and rebates. |
The accompanying notes are an integral part of these financial statements.
Wells Fargo Index Portfolio | 33
Statement of assets and liabilities—November 30, 2020 (unaudited)
| | | | |
| | | | |
| |
Assets | | | | |
Investments in unaffiliated securities (including $739,793 of securities loaned), at value (cost $288,412,508) | | $ | 1,155,358,254 | |
Investments in affiliated securities, at value (cost $30,874,514) | | | 31,633,626 | |
Segregated cash for futures contracts | | | 3,867,009 | |
Receivable for dividends | | | 1,804,218 | |
Receivable for securities lending income, net | | | 884 | |
Prepaid expenses and other assets | | | 156,087 | |
| | | | |
Total assets | | | 1,192,820,078 | |
| | | | |
| |
Liabilities | | | | |
Payable upon receipt of securities loaned | | | 759,475 | |
Payable for investments purchased | | | 41,210 | |
Payable for daily variation margin on open futures contracts | | | 120,688 | |
Advisory fee payable | | | 92,565 | |
Accrued expenses and other liabilities | | | 52,157 | |
| | | | |
Total liabilities | | | 1,066,095 | |
| | | | |
Total net assets | | $ | 1,191,753,983 | |
| | | | |
The accompanying notes are an integral part of these financial statements.
34 | Wells Fargo Index Portfolio
Statement of operations—six months ended November 30, 2020 (unaudited)
| | | | |
| | | | |
| |
Investment income | | | | |
Dividends (net of foreign withholding taxes of $46,145) | | $ | 9,304,900 | |
Income from affiliated securities | | | 41,288 | |
Interest | | | 1,009 | |
| | | | |
Total investment income | | | 9,347,197 | |
| | | | |
| |
Expenses | | | | |
Advisory fee | | | 547,788 | |
Custody and accounting fees | | | 37,198 | |
Professional fees | | | 28,258 | |
Shareholder report expenses | | | 3,500 | |
Trustees’ fees and expenses | | | 9,556 | |
Other fees and expenses | | | 16,680 | |
| | | | |
Net expenses | | | 642,980 | |
| | | | |
Net investment income | | | 8,704,217 | |
| | | | |
| |
Realized and unrealized gains (losses) on investments | | | | |
Net realized gains (losses) on | | | | |
Unaffiliated securities | | | 36,035,120 | |
Affiiliated securities | | | (12,701 | ) |
Futures contracts | | | 4,245,394 | |
| | | | |
Net realized gains on investments | | | 40,267,813 | |
| | | | |
| |
Net change in unrealized gains (losses) on | | | | |
Unaffiliated securities | | | 153,393,045 | |
Affiiliated securities | | | 154,586 | |
Futures contracts | | | 1,514,162 | |
| | | | |
Net change in unrealized gains (losses) on investments | | | 155,061,793 | |
| | | | |
Net realized and unrealized gains (losses) on investments | | | 195,329,606 | |
| | | | |
Net increase in net assets resulting from operations | | $ | 204,033,823 | |
| | | | |
The accompanying notes are an integral part of these financial statements.
Wells Fargo Index Portfolio | 35
Statement of changes in net assets
| | | | | | | | |
| | | Six months ended
November 30, 2020
(unaudited) | | | Year ended
May 31, 2020 | |
| | |
Operations | | | | | | | | |
Net investment income | | $ | 8,704,217 | | | $ | 20,718,704 | |
Net realized gains on investments | | | 40,267,813 | | | | 187,218,582 | |
Net change in unrealized gains (losses) on investments | | | 155,061,793 | | | | (66,539,266 | ) |
| | | | |
Net increase in net assets resulting from operations | | | 204,033,823 | | | | 141,398,020 | |
| | | | |
| | |
Capital transactions | | | | | | | | |
Transactions in investors’ beneficial interests | | | | | | | | |
Contributions | | | 4,037,341 | | | | 47,457,547 | |
Withdrawals | | | (71,822,449 | ) | | | (328,736,831 | ) |
| | | | |
Net decrease in net assets resulting from capital transactions | | | (67,785,108 | ) | | | (281,279,284 | ) |
| | | | |
Total increase (decrease) in net assets | | | 136,248,715 | | | | (139,881,264 | ) |
| | | | |
| | |
Net assets | | | | | | | | |
Beginning of period | | | 1,055,505,268 | | | | 1,195,386,532 | |
| | | | |
End of period | | $ | 1,191,753,983 | | | $ | 1,055,505,268 | |
| | | | |
The accompanying notes are an integral part of these financial statements.
36 | Wells Fargo Index Portfolio
Financial highlights
| | | | | | | | | | | | | | | | | | | | | | | | |
| | | Six months ended
November 30, 2020
(unaudited) | | | Year ended May 31 | |
| | | 2020 | | | 2019 | | | 2018 | | | 2017 | | | 2016 | |
Total return1 | | | 19.92 | % | | | 12.74 | % | | | 3.67 | % | | | 14.27 | % | | | 17.36 | % | | | 1.62 | % |
Ratios to average net assets (annualized) | | | | | | | | | | | | | | | | | | | | | | | | |
Gross expenses | | | 0.11 | % | | | 0.12 | % | | | 0.11 | % | | | 0.10 | % | | | 0.10 | % | | | 0.11 | % |
Net expenses | | | 0.11 | % | | | 0.12 | % | | | 0.11 | % | | | 0.10 | % | | | 0.10 | % | | | 0.10 | % |
Net investment income | | | 1.55 | % | | | 1.80 | % | | | 1.86 | % | | | 1.84 | % | | | 2.03 | % | | | 2.12 | % |
Supplemental data | | | | | | | | | | | | | | | | | | | | | | | | |
Portfolio turnover rate | | | 2 | % | | | 3 | % | | | 4 | % | | | 3 | % | | | 9 | % | | | 4 | % |
| 1 | Returns for periods of less than one year are not annualized |
The accompanying notes are an integral part of these financial statements.
Wells Fargo Index Portfolio | 37
Notes to financial statements (unaudited)
1. ORGANIZATION
Wells Fargo Master Trust (the “Trust”), a Delaware statutory trust organized on March 10, 1999, is an open-end management investment company registered under the Investment Company Act of 1940, as amended (the “1940 Act”). As an investment company, the Trust follows the accounting and reporting guidance in Financial Accounting Standards Board (“FASB”) Accounting Standards Codification Topic 946, Financial Services – Investment Companies. These financial statements report on the Wells Fargo Index Portfolio (the “Portfolio”) which is a diversified series of the Trust.
2. SIGNIFICANT ACCOUNTING POLICIES
The following significant accounting policies, which are consistently followed in the preparation of the financial statements of the Portfolio, are in conformity with U.S. generally accepted accounting principles which require management to make estimates and assumptions that affect the reported amounts of assets and liabilities, disclosure of contingent assets and liabilities at the date of the financial statements, and the reported amounts of revenues and expenses during the reporting period. Actual results could differ from those estimates.
Securities valuation
All investments are valued each business day as of the close of regular trading on the New York Stock Exchange (generally 4 p.m. Eastern Time), although the Portfolio may deviate from this calculation time under unusual or unexpected circumstances
Equity securities and futures contracts that are listed on a foreign or domestic exchange or market are valued at the official closing price or, if none, the last sales price. If no sale occurs on the principal exchange or market that day, a fair value price will be determined in accordance with the Portfolio’s Valuation Procedures.
Debt securities are valued at the evaluated bid price provided by an independent pricing service (e.g. taking into account various factors, including yields, maturities, or credit ratings) or, if a reliable price is not available, the quoted bid price from an independent broker-dealer.
Investments in registered open-end investment companies are valued at net asset value. Interests in non-registered investment companies that are redeemable at net asset value are fair valued normally at net asset value.
Investments which are not valued using any of the methods discussed above are valued at their fair value, as determined in good faith by the Board of Trustees of the Portfolio. The Board of Trustees has established a Valuation Committee comprised of the Trustees and has delegated to it the authority to take any actions regarding the valuation of portfolio securities that the Valuation Committee deems necessary or appropriate, including determining the fair value of portfolio securities, unless the determination has been delegated to the Wells Fargo Asset Management Pricing Committee at Wells Fargo Funds Management, LLC (“Funds Management”). The Board of Trustees retains the authority to make or ratify any valuation decisions or approve any changes to the Valuation Procedures as it deems appropriate. On a quarterly basis, the Board of Trustees receives reports on any valuation actions taken by the Valuation Committee or the Wells Fargo Asset Management Pricing Committee which may include items for ratification.
Securities lending
The Portfolio may lend its securities from time to time in order to earn additional income in the form of fees or interest on securities received as collateral or the investment of any cash received as collateral. When securities are on loan, the Portfolio receives interest or dividends on those securities. Cash collateral received in connection with its securities lending transactions is invested in Securities Lending Cash Investments, LLC (the “Securities Lending Fund”). Investments in Securities Lending Fund are valued at the evaluated bid price provided by an independent pricing service. Income earned from investment in the Securities Lending Fund (net of fees and rebates), if any, is included in income from affiliated securities on the Statement of Operations.
In a securities lending transaction, the net asset value of the Portfolio is affected by an increase or decrease in the value of the securities loaned and by an increase or decrease in the value of the instrument in which collateral is invested. The amount of securities lending activity undertaken by the Portfolio fluctuates from time to time. The Portfolio has the right under the lending agreement to recover the securities from the borrower on demand. In the event of default or bankruptcy by the borrower, the Portfolio may be prevented from recovering the loaned securities or gaining access to the collateral or may experience delays or costs in doing so. In such an event, the terms of the agreement allow the unaffiliated securities lending agent to use the collateral to purchase replacement securities on behalf of the Portfolio or pay the Portfolio the market value of the loaned securities. The Portfolio bears the risk of loss with respect to depreciation of its investment of the cash collateral.
Futures contracts
Futures contracts are agreements between the Portfolio and a counterparty to buy or sell a specific amount of a commodity, financial instrument or currency at a specified price and on a specified date. The Portfolio may buy and sell futures contracts in
38 | Wells Fargo Index Portfolio
Notes to financial statements (unaudited)
order to gain exposure to, or protect against, changes in security values and is subject to equity price risk. The primary risks associated with the use of futures contracts are the imperfect correlation between changes in market values of securities held by the Portfolio and the prices of futures contracts, and the possibility of an illiquid market. Futures contracts are generally entered into on a regulated futures exchange and cleared through a clearinghouse associated with the exchange. With futures contracts, there is minimal counterparty risk to the Portfolio since futures contracts are exchange traded and the exchange’s clearinghouse, as the counterparty to all exchange traded futures, guarantees the futures contracts against default.
Upon entering into a futures contracts, the Portfolio is required to deposit either cash or securities (initial margin) with the broker in an amount equal to a certain percentage of the contract value. Subsequent payments (variation margin) are paid to or from the broker each day equal to the daily changes in the contract value. Such payments are recorded as unrealized gains or losses and, if any, shown as variation margin receivable (payable) in the Statement of Assets and Liabilities. Should the Portfolio fail to make requested variation margin payments, the broker can gain access to the initial margin to satisfy the Portfolio’s payment obligations. When the contracts are closed, a realized gain or loss is recorded in the Statement of Operations.
Security transactions and income recognition
Securities transactions are recorded on a trade date basis. Realized gains or losses are recorded on the basis of identified cost.
Dividend income is recognized on the ex-dividend date. Dividend income is recorded net of foreign taxes withheld where recovery of such taxes is not assured.
Interest income is accrued daily and bond discounts are accreted and premiums are amortized daily. To the extent debt obligations are placed on non-accrual status, any related interest income may be reduced by writing off interest receivables when the collection of all or a portion of interest has been determined to be doubtful based on consistently applied procedures and the fair value has decreased. If the issuer subsequently resumes interest payments or when the collectability of interest is reasonably assured, the debt obligation is removed from non-accrual status.
Federal and other taxes
The Portfolio is treated as a separate entity for federal income tax purposes. The Portfolio is not required to pay federal income taxes on its net investment income and net capital gains as it is treated as a partnership for federal income tax purposes. All interest, dividends, gains and losses of the Portfolio are deemed to have been “passed through” to the interest holders in proportion to their holdings of the Portfolio regardless of whether interest, dividends and gains have been distributed by the Portfolio.
The Portfolio’s income tax returns and all financial records supporting those returns for the prior three fiscal years are subject to examination by the federal revenue authority. Management has analyzed the Portfolio’s tax positions taken on federal, state, and foreign tax returns for all open tax years and does not believe that there are any uncertain tax positions that require recognition of a tax liability.
As of November 30, 2020, the aggregate cost of all investments for federal income tax purposes was $319,330,636 and the unrealized gains (losses) consisted of:
| | | | |
| |
Gross unrealized gains | | $ | 878,928,396 | |
| |
Gross unrealized losses | | | (9,087,319 | ) |
| |
Net unrealized gains | | $ | 869,841,077 | |
3. FAIR VALUATION MEASUREMENTS
Fair value measurements of investments are determined within a framework that has established a fair value hierarchy based upon the various data inputs utilized in determining the value of the Portfolio’s investments. The three-level hierarchy gives the highest priority to unadjusted quoted prices in active markets for identical assets or liabilities (Level 1) and the lowest priority to unobservable inputs (Level 3). The Portfolio’s investments are classified within the fair value hierarchy based on the lowest level of input that is significant to the fair value measurement. The inputs are summarized into three broad levels as follows:
| ∎ | | Level 1 – quoted prices in active markets for identical securities |
| ∎ | | Level 2 – other significant observable inputs (including quoted prices for similar securities, interest rates, prepayment speeds, credit risk, etc.) |
| ∎ | | Level 3 – significant unobservable inputs (including the Portfolio’s own assumptions in determining the fair value of investments) |
Wells Fargo Index Portfolio | 39
Notes to financial statements (unaudited)
The inputs or methodologies used for valuing investments in securities are not necessarily an indication of the risk associated with investing in those securities.
The following is a summary of the inputs used in valuing the Portfolio’s assets and liabilities as of November 30, 2020:
| | | | | | | | | | | | | | | | |
| | | | |
| | | Quoted prices
(Level 1) | | | Other significant
observable inputs
(Level 2) | | | Significant
unobservable inputs
(Level 3) | | | Total | |
| | | |
Assets | | | | | | | | | | | | |
Investments in: | | | | | | | | | | | | |
| | | |
Common stocks | | | | | | | | | | | | |
| | | | |
Communication services | | $ | 127,927,898 | | | $ | 0 | | | $ | 0 | | | $ | 127,927,898 | |
| | | | |
Consumer discretionary | | | 131,482,133 | | | | 0 | | | | 0 | | | | 131,482,133 | |
| | | | |
Consumer staples | | | 78,665,943 | | | | 0 | | | | 0 | | | | 78,665,943 | |
| | | | |
Energy | | | 26,690,250 | | | | 0 | | | | 0 | | | | 26,690,250 | |
| | | | |
Financials | | | 120,701,219 | | | | 0 | | | | 0 | | | | 120,701,219 | |
| | | | |
Health care | | | 158,676,756 | | | | 0 | | | | 0 | | | | 158,676,756 | |
| | | | |
Industrials | | | 101,449,714 | | | | 0 | | | | 0 | | | | 101,449,714 | |
| | | | |
Information technology | | | 319,731,260 | | | | 0 | | | | 0 | | | | 319,731,260 | |
| | | | |
Materials | | | 31,397,355 | | | | 0 | | | | 0 | | | | 31,397,355 | |
| | | | |
Real estate | | | 29,359,009 | | | | 0 | | | | 0 | | | | 29,359,009 | |
| | | | |
Utilities | | | 33,626,543 | | | | 0 | | | | 0 | | | | 33,626,543 | |
| | | |
Short-term investments | | | | | | | | | | | | |
| | | | |
Investment companies | | | 27,283,800 | | | | 0 | | | | 0 | | | | 27,283,800 | |
| | | | |
| | | 1,186,991,880 | | | | 0 | | | | 0 | | | | 1,186,991,880 | |
| | | | |
Futures contracts | | | 2,179,833 | | | | 0 | | | | 0 | | | | 2,179,833 | |
| | | | |
Total assets | | $ | 1,189,171,713 | | | $ | 0 | | | $ | 0 | | | $ | 1,189,171,713 | |
Additional sector, industry or geographic detail is included in the Portfolio of Investments.
Futures contracts reported at their cumulative unrealized gains (losses) at measurement date as reported in the table following the Portfolio of Investments. For futures contracts, the current day’s variation margin is reported on the Statement of Assets and Liabilities. All other assets and liabilities are reported at their market value at measurement date.
For the six months ended November, 2020, the Portfolio did not have any transfers into/out of Level 3.
4. TRANSACTIONS WITH AFFILIATES
Advisory fee
The Trust has entered into an advisory contract with Funds Management, an indirect wholly owned subsidiary of Wells Fargo & Company (“Wells Fargo”). The adviser is responsible for implementing investment policies and guidelines and for supervising the subadviser, who is responsible for day-to-day portfolio management of the Portfolio. Pursuant to the contract, Funds Management is entitled to receive an annual advisory fee at the following annual rate based on the Portfolio’s average daily net assets:
| | | | |
| |
| Average daily net assets | | Advisory fee | |
| |
First $500 million | | | 0.100 | % |
| |
Next $500 million | | | 0.100 | |
| |
Next $2 billion | | | 0.075 | |
| |
Next $2 billion | | | 0.075 | |
| |
Over $5 billion | | | 0.050 | |
For the six months ended November 30, 2020, the advisory fee was equivalent to an annual rate of 0.10% of the Portfolio’s average daily net assets.
40 | Wells Fargo Index Portfolio
Notes to financial statements (unaudited)
Funds Management has retained the services of a subadviser to provide daily portfolio management to the Portfolio. The fee for subadvisory services is borne by Funds Management. Wells Capital Management Incorporated (“WellsCap”), an affiliate of Funds Management and an indirect wholly owned subsidiary of Wells Fargo, is the subadviser to the Portfolio and is entitled to receive a fee from Funds Management at an annual rate starting at 0.05% and declining to 0.02% as the average daily net assets of the Portfolio increase.
Interfund transactions
The Portfolio may purchase or sell portfolio investment securities to certain other Wells Fargo affiliates pursuant to Rule 17a-7 under the 1940 Act and under procedures adopted by the Board of Trustees. The procedures have been designed to ensure that these interfund transactions, which do not incur broker commissions, are effected at current market prices.
5. INVESTMENT PORTFOLIO TRANSACTIONS
Purchases and sales of investments, excluding U.S. government obligations (if any) and short-term securities, for the six months ended November 30, 2020 were $13,668,935 and $62,147,671, respectively.
6. SECURITIES LENDING TRANSACTIONS
The Portfolio lends its securities through an unaffiliated securities lending agent and receives collateral in the form of cash or securities with a value at least equal to the value of the securities on loan. The value of the loaned securities is determined at the close of each business day and any increases or decreases in the required collateral are exchanged between the Portfolio and the counterparty on the next business day. Cash collateral received is invested in the Securities Lending Fund which seeks to provide a positive return compared to the daily Fed Funds Open Rate by investing in high-quality, U.S. dollar-denominated short-term money market instruments and is exempt from registration under Section 3(c)(7) of the 1940 Act. Securities Lending Fund is managed by Funds Management and is subadvised by WellsCap. Funds Management receives an advisory fee starting at 0.05% and declining to 0.01% as the average daily net assets of the Securities Lending Fund increase. All of the fees received by Funds Management are paid to WellsCap for its services as subadviser.
In the event of counterparty default or the failure of a borrower to return a loaned security, the Portfolio has the right to use the collateral to offset any losses incurred. As of November 30, 2020, the Fund had securities lending transactions with the following counterparties which are subject to offset:
| | | | | | | | | | | | |
| | | |
| Counterparty | | Value of
securities
on loan | | | Collateral
received1 | | | Net amount | |
| | | |
Morgan Stanley & Co. LLC | | $ | 440,193 | | | $ | (440,193 | ) | | $ | 0 | |
| | | |
National Financial Services LLC | | | 299,600 | | | | (299,600 | ) | | | 0 | |
| 1 | Collateral received within this table is limited to the collateral for the net transaction with the counterparty. |
7. DERIVATIVE TRANSACTIONS
During the six months ended November 30, 2020, the Portfolio entered into futures contracts to gain market exposure. The Portfolio had an average notional amount of $30,694,638 in long futures contracts during the six months ended November 30, 2020.
The fair value, realized gains or losses and change in unrealized gains or losses, if any, on derivative instruments are reflected in the corresponding financial statement captions.
8. BANK BORROWINGS
The Trust, along with Wells Fargo Variable Trust and Wells Fargo Funds Trust (excluding the money market funds), are parties to a $350,000,000 revolving credit agreement whereby the Portfolio is permitted to use bank borrowings for temporary or emergency purposes, such as to portfolio shareholder redemption requests. Interest under the credit agreement is charged to the Portfolio based on a borrowing rate equal to the higher of the Federal Funds rate in effect on that day plus 1.25% or the overnight LIBOR rate in effect on that day plus 1.25%. In addition, an annual commitment fee equal to 0.25% of the unused balance is allocated to each participating fund.
For the six months ended November 30, 2020, there were no borrowings by the Portfolio under the agreement.
Wells Fargo Index Portfolio | 41
Notes to financial statements (unaudited)
9. CONCENTRATION RISK
Concentration risk results from exposure to a limited number of sectors. As of the end of the period, the Portfolio concentrated its portfolio in investments related to the information technology sector. A fund that invests a substantial portion of its assets in any sector may be more affected by changes in that sector than would be a fund whose investments are not heavily weighted in any sector.
10. INDEMNIFICATION
Under the Portfolio’s organizational documents, the officers and Trustees have been granted certain indemnification rights against certain liabilities that may arise out of performance of their duties to the Portfolio. The Portfolio has entered into a separate agreement with each Trustee that converts indemnification rights currently existing under the Portfolio’s organizational documents into contractual rights that cannot be changed in the future without the consent of the Trustee. Additionally, in the normal course of business, the Portfolio may enter into contracts with service providers that contain a variety of indemnification clauses. The Portfolio’s maximum exposure under these arrangements is dependent on future claims that may be made against the Portfolio and, therefore, cannot be estimated.
11. NEW ACCOUNTING PRONOUNCEMENT
In August 2018, FASB issued Accounting Standards Update (“ASU”) No. 2018-13, Fair Value Measurement (Topic 820) Disclosure Framework—Changes to the Disclosure Requirements for Fair Value Measurement. ASU 2018-13 updates the disclosure requirements on fair value measurements in Topic 820, Fair Value Measurements. The amendments are effective for fiscal years, and interim periods within those fiscal years, beginning after December 15, 2019. Management has adopted this guidance which did not have a material impact on the financial statements.
12. CORONAVIRUS (COVID-19) PANDEMIC
On March 11, 2020, the World Health Organization announced that it had made the assessment that coronavirus disease 2019 (“COVID-19”) is a pandemic. The impacts of COVID-19 are adversely affecting the entire global economy, individual companies and investment products, and the market in general. There is significant uncertainty around the extent and duration of business disruptions related to COVID-19 and the impacts may be short term or may last for an extended period of time. The risk of further spreading of COVID-19 has led to significant uncertainty and volatility in the financial markets.
42 | Wells Fargo Index Portfolio
Other information (unaudited)
PROXY VOTING INFORMATION
A description of the policies and procedures used to determine how to vote proxies relating to portfolio securities is available, upon request, by calling 1-800-222-8222, visiting our website at wfam.com, or visiting the SEC website at sec.gov. Information regarding how the proxies related to portfolio securities were voted during the most recent 12-month period ended June 30 is available on the website at wfam.com or by visiting the SEC website at sec.gov.
QUARTERLY PORTFOLIO HOLDINGS INFORMATION
The Fund and Portfolio file their complete schedule of portfolio holdings with the SEC for the first and third quarters of each fiscal year as an exhibit to its reports on Form N-PORT. Shareholders may view the filed Form N-PORT by visiting the SEC website at sec.gov.
Wells Fargo Index Fund | 43
Other information (unaudited)
BOARD OF TRUSTEES AND OFFICERS
Each of the Trustees and Officers1 listed in the table below acts in identical capacities for each fund in the Wells Fargo family of funds, which consists of 144 mutual funds comprising the Wells Fargo Funds Trust, Wells Fargo Variable Trust, Wells Fargo Master Trust and four closed-end funds (collectively the “Fund Complex”). This table should be read in conjunction with the Prospectus and the Statement of Additional Information2. The mailing address of each Trustee and Officer is 525 Market Street, 12th Floor, San Francisco, CA 94105. Each Trustee and Officer serves an indefinite term, however, each Trustee serves such term until reaching the mandatory retirement age established by the Trustees.
Independent Trustees
| | | | | | |
Name and
year of birth | | Position held and
length of service* | | Principal occupations during past five years or longer | | Current other
public company or
investment
company
directorships |
| | | |
William R. Ebsworth
(Born 1957) | | Trustee,
since 2015 | | Retired. From 1984 to 2013, equities analyst, portfolio manager, research director and chief investment officer at Fidelity Management and Research Company in Boston, Tokyo, and Hong Kong, and retired in 2013 as Chief Investment Officer of Fidelity Strategic Advisers, Inc. where he led a team of investment professionals managing client assets. Prior thereto, Board member of Hong Kong Securities Clearing Co., Hong Kong Options Clearing Corp., the Thailand International Fund, Ltd., Fidelity Investments Life Insurance Company, and Empire Fidelity Investments Life Insurance Company. Audit Committee Chair and Investment Committee Chair of the Vincent Memorial Hospital Endowment (non-profit organization). Mr. Ebsworth is a CFA® charterholder. | | N/A |
| | | |
Jane A. Freeman
(Born 1953) | | Trustee,
since 2015;
Chair Liaison,
since 2018 | | Retired. From 2012 to 2014 and 1999 to 2008, Chief Financial Officer of Scientific Learning Corporation. From 2008 to 2012, Ms. Freeman provided consulting services related to strategic business projects. Prior to 1999, Portfolio Manager at Rockefeller & Co. and Scudder, Stevens & Clark. Board member of the Harding Loevner Funds from 1996 to 2014, serving as both Lead Independent Director and chair of the Audit Committee. Board member of the Russell Exchange Traded Funds Trust from 2011 to 2012 and the chair of the Audit Committee. Ms. Freeman is also an inactive Chartered Financial Analyst. | | N/A |
| | | |
Isaiah Harris, Jr.
(Born 1952) | | Trustee,
since 2009; Audit Committee Chair, since 2019 | | Retired. Chairman of the Board of CIGNA Corporation since 2009, and Director since 2005. From 2003 to 2011, Director of Deluxe Corporation. Prior thereto, President and CEO of BellSouth Advertising and Publishing Corp. from 2005 to 2007, President and CEO of BellSouth Enterprises from 2004 to 2005 and President of BellSouth Consumer Services from 2000 to 2003. Emeritus member of the Iowa State University Foundation Board of Governors. Emeritus Member of the Advisory Board of Iowa State University School of Business. Advisory Board Member, Palm Harbor Academy (private school). Mr. Harris is a certified public accountant (inactive status). | | CIGNA Corporation |
| | | |
Judith M. Johnson
(Born 1949) | | Trustee,
since 2008 | | Retired. Prior thereto, Chief Executive Officer and Chief Investment Officer of Minneapolis Employees Retirement Fund from 1996 to 2008. Ms. Johnson is an attorney, certified public accountant and a certified managerial accountant. | | N/A |
| | | |
David F. Larcker
(Born 1950) | | Trustee,
since 2009 | | James Irvin Miller Professor of Accounting at the Graduate School of Business (Emeritus), Stanford University, Director of the Corporate Governance Research Initiative and Senior Faculty of The Rock Center for Corporate Governance since 2006. From 2005 to 2008, Professor of Accounting at the Graduate School of Business, Stanford University. Prior thereto, Ernst & Young Professor of Accounting at The Wharton School, University of Pennsylvania from 1985 to 2005. | | N/A |
44 | Wells Fargo Index Fund
Other information (unaudited)
| | | | | | |
Name and
year of birth | | Position held and
length of service* | | Principal occupations during past five years or longer | | Current other
public company or
investment
company
directorships |
| | | |
Olivia S. Mitchell
(Born 1953) | | Trustee,
since 2006; Nominating and Governance Committee Chair, since 2018 | | International Foundation of Employee Benefit Plans Professor, Wharton School of the University of Pennsylvania since 1993. Director of Wharton’s Pension Research Council and Boettner Center on Pensions & Retirement Research, and Research Associate at the National Bureau of Economic Research. Previously, Cornell University Professor from 1978 to 1993. | | N/A |
| | | |
Timothy J. Penny
(Born 1951) | | Trustee,
since 1996; Chair, since 2018 | | President and Chief Executive Officer of Southern Minnesota Initiative Foundation, a non-profit organization, since 2007. Member of the Board of Trustees of NorthStar Education Finance, Inc., a non-profit organization, since 2007. | | N/A |
| | | |
James G. Polisson
(Born 1959) | | Trustee,
since 2018 | | Retired. Chief Marketing Officer, Source (ETF) UK Services, Ltd, from 2015 to 2017. From 2012 to 2015, Principal of The Polisson Group, LLC, a management consulting, corporate advisory and principal investing company. Chief Executive Officer and Managing Director at Russell Investments, Global Exchange Traded Funds from 2010 to 2012. Managing Director of Barclays Global Investors from 1998 to 2010 and Global Chief Marketing Officer for iShares and Barclays Global Investors from 2000 to 2010. Trustee of the San Francisco Mechanics’ Institute, a non-profit organization, from 2013 to 2015. Board member of the Russell Exchange Traded Fund Trust from 2011 to 2012. Director of Barclays Global Investors Holdings Deutschland GmbH from 2006 to 2009. Mr. Polisson is an attorney and has a retired status with the Massachusetts and District of Columbia Bar Associations. | | N/A |
| | | |
Pamela Wheelock
(Born 1959) | | Trustee, since January 2020; previously Trustee from January 2018 to July 2019 | | Board member of the Destination Medical Center Economic Development Agency, Rochester, Minnesota since 2019. Interim President of the McKnight Foundation from January to September 2020. Acting Commissioner, Minnesota Department of Human Services, July 2019 through September 2019. Human Services Manager (part-time), Minnesota Department of Human Services, October 2019 through December 2019. Chief Operating Officer, Twin Cities Habitat for Humanity from 2017 to 2019. Vice President of University Services, University of Minnesota from 2012 to 2016. Prior thereto, on the Board of Directors, Governance Committee and Finance Committee for the Minnesota Philanthropy Partners (Saint Paul Foundation) from 2012 to 2018, Interim Chief Executive Officer of Blue Cross Blue Shield of Minnesota from 2011 to 2012, Chairman of the Board from 2009 to 2012 and Board Director from 2003 to 2015. Vice President, Leadership and Community Engagement, Bush Foundation, Saint Paul, Minnesota (a private foundation) from 2009 to 2011. Executive Vice President and Chief Financial Officer, Minnesota Sports and Entertainment from 2004 to 2009 and Senior Vice President from 2002 to 2004. Executive Vice President of the Minnesota Wild Foundation from 2004 to 2008. Commissioner of Finance, State of Minnesota, from 1999 to 2002. Currently Board Chair of the Minnesota Wild Foundation since 2010. | | N/A |
| * | Length of service dates reflect the Trustee’s commencement of service with the Trust’s predecessor entities, where applicable. |
Wells Fargo Index Fund | 45
Other information (unaudited)
Officers
| | | | |
Name and
year of birth | | Position held and
length of service | | Principal occupations during past five years or longer |
| | |
Andrew Owen
(Born 1960) | | President,
since 2017 | | Executive Vice President of Wells Fargo & Company and Head of Affiliated Managers, Wells Fargo Asset Management, since 2014. In addition, Mr. Owen is currently President, Chief Executive Officer and Director of Wells Fargo Funds Management, LLC since 2017. Prior thereto, Executive Vice President responsible for marketing, investments and product development for Wells Fargo Funds Management, LLC, from 2009 to 2014. |
| | |
Nancy Wiser1
(Born 1967) | | Treasurer,
since 2012 | | Executive Vice President of Wells Fargo Funds Management, LLC since 2011. Chief Operating Officer and Chief Compliance Officer at LightBox Capital Management LLC, from 2008 to 2011. |
| | |
Michelle Rhee
(Born 1966) | | Chief Legal Officer,
since 2019 | | Secretary of Wells Fargo Funds Management, LLC and Chief Legal Counsel of Wells Fargo Asset Management since 2018. Deputy General Counsel of Wells Fargo Bank, N.A. since 2020 and Assistant General Counsel of Wells Fargo Bank, N.A. from 2018 to 2020. Associate General Counsel and Managing Director of Bank of America Corporation from 2004 to 2018. |
| | |
| Catherine Kennedy (Born 1969) | | Secretary,
since 2019 | | Vice President of Wells Fargo Funds Management, LLC and Senior Counsel of the Wells Fargo Legal Department since 2010. Vice President and Senior Counsel of Evergreen Investment Management Company, LLC from 1998 to 2010. |
| | |
Michael H. Whitaker
(Born 1967) | | Chief Compliance Officer,
since 2016 | | Chief Compliance Officer of Wells Fargo Asset Management since 2016. Senior Vice President and Chief Compliance Officer for Fidelity Investments from 2007 to 2016. |
| | |
Jeremy DePalma1
(Born 1974) | | Assistant Treasurer,
since 2009 | | Senior Vice President of Wells Fargo Funds Management, LLC since 2009. Senior Vice President of Evergreen Investment Management Company, LLC from 2008 to 2010 and head of the Fund Reporting and Control Team within Fund Administration from 2005 to 2010. |
| 1 | Nancy Wiser acts as Treasurer of 67 funds in the Fund Complex. Jeremy DePalma acts as the Treasurer of 77 funds and Assistant Treasurer of 67 funds in the Fund Complex. |
| 2 | The Statement of Additional Information includes additional information about the Trustees and is available, without charge, upon request, by calling 1-800-222-8222 or by visiting the website at wfam.com. |
46 | Wells Fargo Index Fund
This page is intentionally left blank.
This page is intentionally left blank.

For more information
More information about Wells Fargo Funds is available free upon request. To obtain literature, please write, visit the Fund’s website, or call:
Wells Fargo Funds
P.O. Box 219967
Kansas City, MO 64121-9967
Website: wfam.com
Individual investors: 1-800-222-8222
Retail investment professionals: 1-888-877-9275
Institutional investment professionals: 1-866-765-0778

This report and the financial statements contained herein are submitted for the general information of the shareholders of the Fund. If this report is used for promotional purposes, distribution of the report must be accompanied or preceded by a current prospectus. Before investing, please consider the investment objectives, risks, charges, and expenses of the investment. For a current prospectus and, if available, a summary prospectus, containing this information, call 1-800-222-8222 or visit the Fund’s website at wfam.com. Read the prospectus carefully before you invest or send money.
Wells Fargo Asset Management (WFAM) is the trade name for certain investment advisory/management firms owned by Wells Fargo & Company. These firms include but are not limited to Wells Capital Management Incorporated and Wells Fargo Funds Management, LLC. Certain products managed by WFAM entities are distributed by Wells Fargo Funds Distributor, LLC (a broker-dealer and Member FINRA).
This material is for general informational and educational purposes only and is NOT intended to provide investment advice or a recommendation of any kind—including a recommendation for any specific investment, strategy, or plan.
INVESTMENT PRODUCTS: NOT FDIC INSURED ◾ NO BANK GUARANTEE ◾ MAY LOSE VALUE
© 2021 Wells Fargo & Company. All rights reserved.
PAR-1220-00729 01-20
SA283/SAR283 11-20
Semi-Annual Report
November 30, 2020
Wells Fargo International Value Fund
|
|
|
Reduce clutter. Save trees. |
Sign up for electronic delivery of prospectuses and
shareholder reports at wellsfargo.com/
advantagedelivery |
The views expressed and any forward-looking statements are as of November 30, 2020, unless otherwise noted, and are those of the Fund’s portfolio managers and/or Wells Fargo Asset Management. Discussions of individual securities, or the markets generally, or any Wells Fargo Fund are not intended as individual recommendations. Future events or results may vary significantly from those expressed in any forward-looking statements. The views expressed are subject to change at any time in response to changing circumstances in the market. Wells Fargo Asset Management and the Fund disclaim any obligation to publicly update or revise any views expressed or forward-looking statements.
INVESTMENT PRODUCTS: NOT FDIC INSURED ◾ NO BANK GUARANTEE ◾ MAY LOSE VALUE
Wells Fargo International Value Fund | 1
Letter to shareholders (unaudited)

Andrew Owen
President
Wells Fargo Funds
“Global stock markets rallied strongly, driven by aggressive stimulus measures introduced by central banks and governments in response to challenges presented by the COVID-19 pandemic.”
Dear Shareholder:
We are pleased to offer you this semi-annual report for the Wells Fargo International Value Fund for the six-month period that ended November 30, 2020. Global stock markets rallied strongly, driven by aggressive stimulus measures introduced by central banks and governments in response to challenges presented by the COVID-19 pandemic. Emerging market equities had particularly robust results during the six-month period. Among bonds, high-yield issues led the way while U.S. bonds generally had more modest returns than their international counterparts.
For the period, U.S. stocks, based on the S&P 500 Index,1 returned 19.98% and international stocks, as measured by the MSCI ACWI ex USA Index (Net),2 gained 23.28%. The MSCI EM Index (Net)3 rallied 31.14%. Among bond investments, the Bloomberg Barclays U.S. Aggregate Bond Index4 returned a modest 1.79%, the Bloomberg Barclays Global Aggregate ex-USD Index5 gained a robust 8.19%, the Bloomberg Barclays Municipal Bond Index6 had a 3.29% return, and the ICE BofA U.S. High Yield Index7 gained a healthy 10.47%.
Equities enjoyed a strong tailwind from monetary and fiscal stimulus.
Financial markets posted widely positive returns in June despite ongoing economic weakness and uncertainty regarding COVID-19 and the timing of an effective vaccine. As economies reopened, optimism rose. Vitally important to market sentiment was the ongoing global central bank commitment to provide economic support through liquidity and low borrowing costs. U.S. economic activity was boosted by one-time $1,200 stimulus checks and $600 weekly bonus unemployment benefits for tens of millions of Americans through July. However, jobless rates remained historically high, easing somewhat from 14.7% in April to 11.1% in June. By late June, numerous states reported increases of COVID-19 cases, an ominous sign. China’s economic recovery picked up momentum in June.
July was broadly positive for both global equities and fixed income. However, economic data and a resurgence of COVID-19 cases pointed to the vulnerability of the global economy and the need to regain control of the pandemic. Second-quarter gross domestic product (GDP) shrank from the previous quarter by 9.5% and 12.1% in the U.S. and the eurozone, respectively. In contrast, China reported 3.2% year-over-year second-quarter GDP growth. U.S. unemployment remained high despite adding 1.8 million jobs in July, as a double-digit jobless rate persisted. However, manufacturing activity grew in both the U.S. and the eurozone. In Asia, while China’s manufacturing sector continued to expand, activity in Japan and South Korea contracted. A rising concern was the rapid and broad reemergence of COVID-19 infections.
| 1 | The S&P 500 Index consists of 500 stocks chosen for market size, liquidity, and industry group representation. It is a market-value-weighted index with each stock’s weight in the index proportionate to its market value. You cannot invest directly in an index. |
| 2 | The Morgan Stanley Capital International (MSCI) All Country World Index (ACWI) ex USA Index (Net) is a free-float-adjusted market-capitalization-weighted index that is designed to measure the equity market performance of developed and emerging markets, excluding the United States. Source: MSCI. MSCI makes no express or implied warranties or representations and shall have no liability whatsoever with respect to any MSCI data contained herein. The MSCI data may not be further redistributed or used as a basis for other indices or any securities or financial products. This report is not approved, reviewed, or produced by MSCI. You cannot invest directly in an index. |
| 3 | The MSCI Emerging Markets (EM) Index (Net) is a free-float-adjusted market-capitalization-weighted index that is designed to measure equity market performance of emerging markets. You cannot invest directly in an index. |
| 4 | The Bloomberg Barclays U.S. Aggregate Bond Index is a broad-based benchmark that measures the investment-grade, U.S. dollar-denominated, fixed-rate taxable bond market, including Treasuries, government-related and corporate securities, mortgage-backed securities (agency fixed-rate and hybrid adjustable-rate mortgage pass-throughs), asset-backed securities, and commercial mortgage-backed securities. You cannot invest directly in an index. |
| 5 | The Bloomberg Barclays Global Aggregate ex-USD Index is an unmanaged index that provides a broad-based measure of the global investment-grade fixed-income markets excluding the U.S. dollar-denominated debt market. You cannot invest directly in an index. |
| 6 | The Bloomberg Barclays Municipal Bond Index is an unmanaged index composed of long-term tax-exempt bonds with a minimum credit rating of Baa. You cannot invest directly in an index. |
| 7 | The ICE BofA U.S. High Yield Index is a market-capitalization-weighted index of domestic and Yankee high-yield bonds. The index tracks the performance of high-yield securities traded in the U.S. bond market. You cannot invest directly in an index. Copyright 2021. ICE Data Indices, LLC. All rights reserved. |
2 | Wells Fargo International Value Fund
Letter to shareholders (unaudited)
The stock market continued to rally in August despite concerns over rising COVID-19 cases in the U.S. and Europe, as well as the expiration of the $600 weekly bonus unemployment benefit in July. Generally stronger-than-expected second-quarter earnings boosted investor sentiment along with the Federal Reserve’s announcement of a more accommodative policy shift that could lead to longer-term low interest rates. U.S. indices measuring manufacturing and services activities beat expectations while the U.S. housing market maintained strength. In Europe, retail sales expanded and consumer confidence was steady. China’s economy continued to expand.
Stocks grew more volatile in September on mixed economic data. U.S. economic activity continued to grow. However, only half of the 22 million jobs lost since the early spring had returned. The U.S. unemployment rate fell to 7.9% in September, a measurable improvement but far higher than the 3.5% pre-COVID-19 rate. Only 661,000 jobs were added for the month, down from 1.5 million in August. With the U.S. Congress failing to pass further fiscal relief and uncertainties surrounding a possible vaccine, doubts crept back into the markets. In the U.K., a lack of progress in Brexit talks with the European Union weighed on markets. China’s economy picked up steam, however, with growth fueled by increased global demand.
In October, capital markets took a step back from their six-month rally. Market volatility rose in advance of the U.S. election and amid a global increase in COVID-19 infections. Europe responded with more economic restrictions. Meanwhile, Brexit remained unresolved. U.S. markets looked favorably at a possible Democratic sweep and control of the federal purse strings in anticipation of additional fiscal stimulus, which could boost economic activity. Meanwhile, China continued to stand apart, reporting 4.9% third-quarter GDP growth year over year.
Global stocks rallied broadly in November, propelled by optimism over three promising COVID-19 vaccines, which reported high effectiveness in trials. Global stock indices notched double-digit monthly gains. In a reversal of recent trends, value stocks outperformed growth and cyclical stocks outpaced technology stocks. However, U.S. unemployment remained elevated, with a net job loss of 10 million since February. The Eurozone Services Purchasing Managers’ Index, a monthly survey of purchasing managers, contracted sharply while the region’s manufacturing activity gauge indicated growth. The U.S. election results added to the market’s upbeat mood as investors gave thumbs-up to the certainty of the outcome after an unusual delay and anticipated more consistent policies in the new administration.
Don’t let short-term uncertainty derail long-term investment goals.
Periods of investment uncertainty can present challenges, but experience has taught us that maintaining long-term investment goals can be an effective way to plan for the future. To help you create a sound strategy based on your personal goals and risk tolerance, Wells Fargo Funds offers more than 100 mutual funds spanning a wide range of asset classes and investment styles. Although diversification cannot guarantee an investment profit or prevent losses, we believe it can be an effective way to manage investment risk and potentially smooth out overall portfolio performance. We encourage investors to know their investments and to understand that appropriate levels of risk-taking may unlock opportunities.
Thank you for choosing to invest with Wells Fargo Funds. We appreciate your confidence in us and remain committed to helping you meet your financial needs.
Sincerely,

Andrew Owen
President
Wells Fargo Funds
“Global stocks rallied broadly in November, propelled by optimism over three promising COVID-19 vaccines, which reported high effectiveness in trials.”
|
|
|
For further information about your Fund, contact your investment professional, visit our website at wfam.com, or call us directly at 1-800-222-8222. |
Wells Fargo International Value Fund | 3
Letter to shareholders (unaudited)
Notice to Shareholders
At a meeting held on August 10-12, 2020, the Board of Trustees of the Fund approved a change to the Fund’s automatic conversion feature for Class C shares in order to shorten the required holding period from 10 to 8 years. As a result, on a monthly basis beginning November 5, 2020, Class C shares will convert automatically into Class A shares 8 years after the initial date of purchase or, if you acquired your Class C shares through an exchange or conversion from another share class, 8 years after the date you acquired your Class C shares. When Class C shares that you acquired through a purchase or exchange convert, any other Class C shares that you purchased with reinvested dividends and distributions also will convert into Class A shares on a pro rata basis.
Please note that a shorter holding period may apply depending on your intermediary. Please see “Appendix A—Sales Charge Reductions and Waivers for Certain Intermediaries” in the Fund’s prospectus for further information.
4 | Wells Fargo International Value Fund
This page is intentionally left blank.
Performance highlights (unaudited)
Investment objective
The Fund seeks long-term capital appreciation.
Manager
Wells Fargo Funds Management, LLC
Subadviser for the affiliated master portfolio1
LSV Asset Management
Portfolio managers
Josef Lakonishok, Ph.D.
Puneet Mansharamani, CFA®‡
Menno Vermeulen, CFA®‡
Average annual total returns (%) as of November 30, 2020
| | | | | | | | | | | | | | | | | | | | | | | | | | | | | | | | | | |
| | | | |
| | | | | Including sales charge | | | Excluding sales charge | | | Expense ratios2 (%) | |
| | | | | | | | | |
| | | Inception date | | 1 year | | | 5 year | | | 10 year | | | 1 year | | | 5 year | | | 10 year | | | Gross | | | Net3 | |
| | | | | | | | | | |
| Class A (WFFAX) | | 10-31-2003 | | | -8.85 | | | | 1.79 | | | | 2.94 | | | | -3.29 | | | | 3.00 | | | | 3.55 | | | | 1.37 | | | | 1.24 | |
| | | | | | | | | | |
| Class C (WFVCX) | | 4-8-2005 | | | -5.03 | | | | 2.23 | | | | 2.77 | | | | -4.03 | | | | 2.23 | | | | 2.77 | | | | 2.12 | | | | 1.99 | |
| | | | | | | | | | |
| Class R6 (WFRVX)4 | | 7-31-2018 | | | – | | | | – | | | | – | | | | -2.92 | | | | 3.40 | | | | 3.97 | | | | 0.94 | | | | 0.84 | |
| | | | | | | | | | |
| Administrator Class (WFVDX) | | 4-8-2005 | | | – | | | | – | | | | – | | | | -3.19 | | | | 3.10 | | | | 3.69 | | | | 1.29 | | | | 1.14 | |
| | | | | | | | | | |
| Institutional Class (WFVIX) | | 8-31-2006 | | | – | | | | – | | | | – | | | | -2.85 | | | | 3.37 | | | | 3.96 | | | | 10.4 | | | | 0.89 | |
| | | | | | | | | | |
| MSCI EAFE Value Index (Net)5 | | – | | | – | | | | – | | | | – | | | | -3.35 | | | | 2.90 | | | | 3.75 | | | | – | | | | – | |
Figures quoted represent past performance, which is no guarantee of future results, and do not reflect taxes that a shareholder may pay on an investment in a fund. Investment return and principal value of an investment will fluctuate so that an investor’s shares, when redeemed, may be worth more or less than their original cost. Performance shown without sales charges would be lower if sales charges were reflected. Current performance may be lower or higher than the performance data quoted, which assumes the reinvestment of dividends and capital gains. Current month-end performance is available on the Fund’s website, wfam.com.
Index returns do not include transaction costs associated with buying and selling securities, any mutual fund fees or expenses, or any taxes. It is not possible to invest directly in an index.
For Class A shares, the maximum front-end sales charge is 5.75%. For Class C shares, the maximum contingent deferred sales charge is 1.00%. Performance including a contingent deferred sales charge assumes the sales charge for the corresponding time period. Class R6, Administrator Class, and Institutional Class shares are sold without a front-end sales charge or contingent deferred sales charge.
Stock values fluctuate in response to the activities of individual companies and general market and economic conditions. Foreign investments are especially volatile and can rise or fall dramatically due to differences in the political and economic conditions of the host country. These risks are generally intensified in emerging markets. The use of derivatives may reduce returns and/or increase volatility. Certain investment strategies tend to increase the total risk of an investment (relative to the broader market). The Fund is exposed to smaller-company securities risk. Consult the Fund’s prospectus for additional information on these and other risks.
Please see footnotes on page 7.
6 | Wells Fargo International Value Fund
Performance highlights (unaudited)
| | | | |
|
| Ten largest holdings (%) as of November 30, 20206 | |
| | |
Roche Holding AG | | | 2.59 | |
| | |
Sanofi SA | | | 2.03 | |
| | |
Novartis AG | | | 1.86 | |
| | |
KDDI Corporation | | | 1.52 | |
| | |
Nippon Telegraph & Telephone Corporation | | | 1.48 | |
| | |
GlaxoSmithKline plc | | | 1.40 | |
| | |
Volvo AB Class B | | | 1.24 | |
| | |
Securities Lending Cash Investments LLC | | | 1.16 | |
| | |
Koninklijke Ahold Delhaize NV | | | 1.14 | |
| | |
Bayer AG | | | 1.08 | |
| | |
|
| Sector allocation as of November 30, 20207 |
|
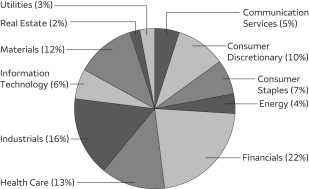 |
| | |
|
| Geographic allocation as of November 30, 20207 |
|
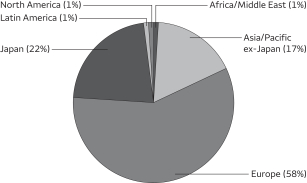 |
| ‡ | CFA® and Chartered Financial Analyst® are trademarks owned by CFA Institute. |
| 1 | The Fund is a feeder fund in a master-feeder structure that invests substantially all of its assets in a single affiliated master portfolio of the Wells Fargo Master Trust with a substantially identical investment objective and substantially similar investment strategies. References to the investment activities of the Fund are intended to refer to the investment activities of the affiliated master portfolio in which it invests. |
| 2 | Reflects the expense ratios as stated in the most recent prospectuses. The expense ratios shown are subject to change and may differ from the annualized expense ratios shown in the financial highlights of this report. |
| 3 | The manager has contractually committed through September 30, 2021, to waive fees and/or reimburse expenses to the extent necessary to cap total annual fund operating expenses after fee waivers at 1.24% for Class A, 1.99% for Class C, 0.84% for Class R6, 1.14% for Administrator Class, and 0.89% for Institutional Class. Brokerage commissions, stamp duty fees, interest, taxes, acquired fund fees and expenses (if any) from funds in which the affiliated master portfolios invest and from money market funds, and extraordinary expenses are excluded from the expense caps. Net expenses from the affiliated master portfolio are included in the expense caps. Prior to or after the commitment expiration date, the caps may be increased or the commitment to maintain the caps may be terminated only with the approval of the Board of Trustees. Without these caps, the Fund’s returns would have been lower. The expense ratio paid by an investor is the net expense ratio (the total annual fund operating expenses after fee waivers) as stated in the prospectuses. |
| 4 | Historical performance shown for the Class R6 shares prior to their inception reflects the performance of the Institutional Class shares, and includes the higher expenses applicable to the Institutional Class shares. If these expenses had not been included, returns for the Class R6 shares would be higher. |
| 5 | The Morgan Stanley Capital International (MSCI) Europe, Australasia, Far East (EAFE) Value Index (Net) is a free-float-adjusted market capitalization-weighted index that is designed to measure the equity market performance of value securities within developed equity markets, excluding the United States and Canada. Source: MSCI. MSCI makes no express or implied warranties or representations and shall have no liability whatsoever with respect to any MSCI data contained herein. The MSCI data may not be further redistributed or used as a basis for other indices or any securities or financial products. This report is not approved, reviewed, or produced by MSCI. You cannot invest directly in an index. |
| 6 | Each holding represents the Fund’s allocable portion of the affiliated master portfolio security. Figures represent each holding as a percentage of the Fund’s net assets. Holdings are subject to change and may have changed since the date specified. |
| 7 | Figures represent the sector allocation of the affiliated master portfolio as a percentage of the long-term investments of the affiliated master portfolio. These amounts are subject to change and may have changed since the date specified. |
Wells Fargo International Value Fund | 7
Fund expenses (unaudited)
As a shareholder of the Fund, you incur two types of costs: (1) transaction costs, including sales charges (loads) on purchase payments and contingent deferred sales charges (if any) on redemptions and (2) ongoing costs, including management fees, distribution (12b-1) and/or shareholder servicing fees, and other Fund expenses. This example is intended to help you understand your ongoing costs (in dollars) of investing in the Fund and to compare these costs with the ongoing costs of investing in other mutual funds.
The example is based on an investment of $1,000 invested at the beginning of the six-month period and held for the entire period from June 1, 2020 to November 30, 2020.
Actual expenses
The “Actual” line of the table below provides information about actual account values and actual expenses. You may use the information in this line, together with the amount you invested, to estimate the expenses that you paid over the period. Simply divide your account value by $1,000 (for example, an $8,600 account value divided by $1,000 = 8.6), then multiply the result by the number in the “Actual” line under the heading entitled “Expenses paid during period” for your applicable class of shares to estimate the expenses you paid on your account during this period.
Hypothetical example for comparison purposes
The “Hypothetical” line of the table below provides information about hypothetical account values and hypothetical expenses based on the Fund’s actual expense ratio and an assumed rate of return of 5% per year before expenses, which is not the Fund’s actual return. The hypothetical account values and expenses may not be used to estimate the actual ending account balance or expenses you paid for the period. You may use this information to compare the ongoing costs of investing in the Fund and other funds. To do so, compare this 5% hypothetical example with the 5% hypothetical examples that appear in the shareholder reports of the other funds.
Please note that the expenses shown in the table are meant to highlight your ongoing costs only and do not reflect any transactional costs, such as sales charges (loads) and contingent deferred sales charges. Therefore, the “Hypothetical” line of the table is useful in comparing ongoing costs only and will not help you determine the relative total costs of owning different funds. In addition, if these transactional costs were included, your costs would have been higher.
| | | | | | | | | | | | | | | | |
| | | Beginning
account value
6-1-2020 | | | Ending
account value
11-30-2020 | | | Expenses
paid during
the period1,2 | | | Annualized net
expense ratio1 | |
| | | | | |
Class A | | | | | | | | | | | | | | | | |
| | | | |
Actual | | $ | 1,000.00 | | | $ | 1,175.63 | | | $ | 6.76 | | | | 1.24 | % |
| | | | |
Hypothetical (5% return before expenses) | | $ | 1,000.00 | | | $ | 1,018.85 | | | $ | 6.28 | | | | 1.24 | % |
| | | | | |
Class C | | | | | | | | | | | | | | | | |
| | | | |
Actual | | $ | 1,000.00 | | | $ | 1,172.27 | | | $ | 10.78 | | | | 1.98 | % |
| | | | |
Hypothetical (5% return before expenses) | | $ | 1,000.00 | | | $ | 1,015.14 | | | $ | 10.00 | | | | 1.98 | % |
| | | | | |
Class R6 | | | | | | | | | | | | | | | | |
| | | | |
Actual | | $ | 1,000.00 | | | $ | 1,178.72 | | | $ | 4.59 | | | | 0.84 | % |
| | | | |
Hypothetical (5% return before expenses) | | $ | 1,000.00 | | | $ | 1,020.86 | | | $ | 4.26 | | | | 0.84 | % |
| | | | | |
Administrator Class | | | | | | | | | | | | | | | | |
| | | | |
Actual | | $ | 1,000.00 | | | $ | 1,176.67 | | | $ | 6.22 | | | | 1.14 | % |
| | | | |
Hypothetical (5% return before expenses) | | $ | 1,000.00 | | | $ | 1,019.35 | | | $ | 5.77 | | | | 1.14 | % |
| | | | | |
Institutional Class | | | | | | | | | | | | | | | | |
| | | | |
Actual | | $ | 1,000.00 | | | $ | 1,178.57 | | | $ | 4.86 | | | | 0.89 | % |
| | | | |
Hypothetical (5% return before expenses) | | $ | 1,000.00 | | | $ | 1,020.61 | | | $ | 4.51 | | | | 0.89 | % |
| 1 | Amounts reflect net expenses allocated from the affiliated Master Portfolio in which the Fund invests. |
| 2 | Expenses paid is equal to the annualized net expense ratio of each class multiplied by the average account value over the period, multiplied by the number of days in the most recent fiscal half-year divided by the number of days in the fiscal year (to reflect the one-half-year period). |
8 | Wells Fargo International Value Fund
Portfolio of investments—November 30, 2020 (unaudited)
| | | | | | | | | | | | | | | | |
| | | | | | | | | | | | Value | |
| Investment Companies: 99.80% | |
|
| Affiliated Master Portfolio: 99.80% | |
Wells Fargo International Value Portfolio | | | | | | | | | | | | | | $ | 153,230,473 | |
| | | | | | | | | | | | | | | | |
| | | | |
Total Investment Companies (Cost $161,761,570) | | | | | | | | | | | | | | | 153,230,473 | |
| | | | | | | | | | | | | | | | |
| | | | | | | | |
| Total investments in securities (Cost $161,761,570) | | | 99.80 | % | | | 153,230,473 | |
| | |
Other assets and liabilities, net | | | 0.20 | | | | 301,262 | |
| | | | | | | | |
| Total net assets | | | 100.00 | % | | $ | 153,531,735 | |
| | | | | | | | |
Transactions with the affiliated Master Portfolio were as follows:
| | | | | | | | | | | | | | | | | | | | | | | | | | | | | | | | |
| | | % of
ownership,
beginning
of period | | | % of
ownership,
end of
period | | | Net realized
gains
(losses) on
securities
transactions
allocated
from
affiliated
Master
Portfolio | | | Net
change in
unrealized
gains
(losses) on
securities
transactions
allocated
from
affiliated
Master
Portfolio | | | Dividends
allocated
from
affiliated
Master
Portfolio | | | Affiliated
income
allocated
from
affiliated
Master
Portfolio | | | Value,
end
of period | | | % of
net
assets | |
Wells Fargo International Value Portfolio | | | 75 | % | | | 52 | % | | $ | (58,553,038 | ) | | $ | 104,192,457 | | | $ | 2,510,396 | | | $ | 20,482 | | | $ | 153,230,473 | | | | 99.80 | % |
The accompanying notes are an integral part of these financial statements.
Wells Fargo International Value Fund | 9
Statement of assets and liabilities—November 30, 2020 (unaudited)
| | | | |
| | | | |
| |
Assets | | | | |
Investments in affiliated Master Portfolio, at value (cost $161,761,570) | | $ | 153,230,473 | |
Receivable for Fund shares sold | | | 377,540 | |
Receivable from manager | | | 48,354 | |
Prepaid expenses and other assets | | | 147,024 | |
| | | | |
Total assets | | | 153,803,391 | |
| | | | |
| |
Liabilities | | | | |
Payable for Fund shares redeemed | | | 138,635 | |
Administration fees payable | | | 18,551 | |
Distribution fee payable | | | 245 | |
Trustees’ fees and expenses payable | | | 1,097 | |
Accrued expenses and other liabilities | | | 113,128 | |
| | | | |
Total liabilities | | | 271,656 | |
| | | | |
Total net assets | | $ | 153,531,735 | |
| | | | |
| |
Net assets consist of | | | | |
Paid-in capital | | $ | 231,189,091 | |
Total distributable loss | | | (77,657,356 | ) |
| | | | |
Total net assets | | $ | 153,531,735 | |
| | | | |
| |
Computation of net asset value and offering price per share | | | | |
Net assets – Class A | | $ | 52,370,609 | |
Shares outstanding – Class A1 | | | 3,743,561 | |
Net asset value per share – Class A | | | $13.99 | |
Maximum offering price per share – Class A2 | | | $14.84 | |
Net assets – Class C | | $ | 398,773 | |
Shares outstanding – Class C1 | | | 29,308 | |
Net asset value per share – Class C | | | $13.61 | |
Net assets – Class R6 | | $ | 10,292,892 | |
Shares outstanding – Class R6 | | | 743,230 | |
Net asset value per share – Class R6 | | | $13.85 | |
Net assets – Administrator Class | | $ | 2,125,741 | |
Shares outstanding – Administrator Class1 | | | 150,558 | |
Net asset value per share – Administrator Class | | | $14.12 | |
Net assets – Institutional Class | | $ | 88,343,720 | |
Shares outstanding – Institutional Class1 | | | 6,375,295 | |
Net asset value per share – Institutional Class | | | $13.86 | |
| 1 | The Fund has an unlimited number of authorized shares. |
| 2 | Maximum offering price is computed as 100/94.25 of net asset value. On investments of $50,000 or more, the offering price is reduced. |
The accompanying notes are an integral part of these financial statements.
10 | Wells Fargo International Value Fund
Statement of operations—six months ended November 30, 2020 (unaudited)
| | | | |
| | | | |
| |
Investment income | | | | |
Dividends allocated from affiliated Master Portfolio (net of foreign withholding taxes of $302,189) | | $ | 2,510,396 | |
Affiliated income allocated from affiliated Master Portfolio | | | 20,482 | |
Expenses allocated from affiliated Master Portfolio | | | (826,557 | ) |
Waivers allocated from affiliated Master Portfolio | | | 76,053 | |
| | | | |
Total investment income | | | 1,780,374 | |
| | | | |
| |
Expenses | | | | |
Management fee | | | 43,666 | |
Administration fees | | | | |
Class A | | | 58,471 | |
Class C | | | 435 | |
Class R6 | | | 780 | |
Administrator Class | | | 1,493 | |
Institutional Class | | | 72,191 | |
Shareholder servicing fees | | | | |
Class A | | | 69,535 | |
Class C | | | 512 | |
Administrator Class | | | 2,858 | |
Distribution fee | | | | |
Class C | | | 1,535 | |
Custody and accounting fees | | | 13,000 | |
Professional fees | | | 19,711 | |
Registration fees | | | 92,225 | |
Shareholder report expenses | | | 101,578 | |
Trustees’ fees and expenses | | | 11,029 | |
Other fees and expenses | | | 12,735 | |
| | | | |
Total expenses | | | 501,754 | |
Less: Fee waivers and/or expense reimbursements | | | | |
Fund-level | | | (359,745 | ) |
Class A | | | (11,913 | ) |
Class C | | | (70 | ) |
Class R6 | | | (519 | ) |
Administrator Class | | | (675 | ) |
| | | | |
Net expenses | | | 128,832 | |
| | | | |
Net investment income | | | 1,651,542 | |
| | | | |
| |
Realized and unrealized gains (losses) on investments | | | | |
Net realized losses on securities transactions allocated from affiliated Master Portfolio | | | (58,553,038 | ) |
Net change in unrealized gains (losses) on securities transactions allocated from affiliated Master Portfolio | | | 104,192,457 | |
| | | | |
Net realized and unrealized gains (losses) on investments | | | 45,639,419 | |
| | | | |
Net increase in net assets resulting from operations | | $ | 47,290,961 | |
| | | | |
The accompanying notes are an integral part of these financial statements.
Wells Fargo International Value Fund | 11
Statement of changes in net assets
| | | | | | | | | | | | | | | | |
| | | Six months ended
November 30, 2020
(unaudited) | | | Year ended
May 31, 2020 | |
| | | |
Operations | | | | | | | | | | | | |
Net investment income | | | | | | $ | 1,651,542 | | | | | | | $ | 17,494,448 | |
Net realized losses on investments | | | | | | | (58,553,038 | ) | | | | | | | (11,553,693 | ) |
Net change in unrealized gains (losses) on investments | | | | | | | 104,192,457 | | | | | | | | (47,127,244 | ) |
| | | | |
Net increase (decrease) in net assets resulting from operations | | | | | | | 47,290,961 | | | | | | | | (41,186,489 | ) |
| | | | |
| | | |
Distributions to shareholders from Net investment income | | | | | | | | | | | | |
Class A | | | | | | | 0 | | | | | | | | (1,987,586 | ) |
Class C | | | | | | | 0 | | | | | | | | (10,928 | ) |
Class R6 | | | | | | | 0 | | | | | | | | (20,220 | ) |
Administrator Class | | | | | | | 0 | | | | | | | | (93,039 | ) |
Institutional Class | | | | | | | 0 | | | | | | | | (29,054,083 | ) |
| | | | |
Total distributions to shareholders | | | | | | | 0 | | | | | | | | (31,165,856 | ) |
| | | | |
| | | | |
Capital share transactions | | | Shares | | | | | | | | Shares | | | | | |
Proceeds from shares sold | | | | | | | | | | | | | | | | |
Class A | | | 307,280 | | | | 3,941,400 | | | | 2,695,644 | | | | 34,135,676 | |
Class C | | | 939 | | | | 11,588 | | | | 7,349 | | | | 103,617 | |
Class R6 | | | 541,971 | | | | 6,826,572 | | | | 245,451 | | | | 3,473,318 | |
Administrator Class | | | 8,425 | | | | 109,023 | | | | 12,438 | | | | 168,373 | |
Institutional Class | | | 1,808,210 | | | | 22,476,530 | | | | 14,319,614 | | | | 186,253,039 | |
| | | | |
| | | | | | | 33,365,113 | | | | | | | | 224,134,023 | |
| | | | |
Reinvestment of distributions | | | | | | | | | | | | | | | | |
Class A | | | 0 | | | | 0 | | | | 131,792 | | | | 1,986,109 | |
Class C | | | 0 | | | | 0 | | | | 741 | | | | 10,928 | |
Class R6 | | | 0 | | | | 0 | | | | 1,307 | | | | 19,422 | |
Administrator Class | | | 0 | | | | 0 | | | | 6,052 | | | | 91,935 | |
Institutional Class | | | 0 | | | | 0 | | | | 1,945,419 | | | | 28,908,926 | |
| | | | |
| | | | | | | 0 | | | | | | | | 31,017,320 | |
| | | | |
Payment for shares redeemed | | | | | | | | | | | | | | | | |
Class A | | | (1,978,359 | ) | | | (24,918,884 | ) | | | (1,650,931 | ) | | | (23,070,567 | ) |
Class C | | | (7,277 | ) | | | (92,056 | ) | | | (23,596 | ) | | | (307,728 | ) |
Class R6 | | | (40,631 | ) | | | (516,704 | ) | | | (29,425 | ) | | | (350,322 | ) |
Administrator Class | | | (47,104 | ) | | | (613,727 | ) | | | (76,336 | ) | | | (1,034,358 | ) |
Institutional Class | | | (38,834,505 | ) | | | (481,133,315 | ) | | | (31,599,337 | ) | | | (426,275,889 | ) |
| | | | |
| | | | | | | (507,274,686 | ) | | | | | | | (451,038,864 | ) |
| | | | |
Net decrease in net assets resulting from capital share transactions | | | | | | | (473,909,573 | ) | | | | | | | (195,887,521 | ) |
| | | | |
Total decrease in net assets | | | | | | | (426,618,612 | ) | | | | | | | (268,239,866 | ) |
| | | | |
| | |
Net assets | | | | | | | | |
Beginning of period | | | | | | | 580,150,347 | | | | | | | | 848,390,213 | |
| | | | |
End of period | | | | | | $ | 153,531,735 | | | | | | | $ | 580,150,347 | |
| | | | |
The accompanying notes are an integral part of these financial statements.
12 | Wells Fargo International Value Fund
Financial highlights
(For a share outstanding throughout each period)
| | | | | | | | | | | | | | | | | | | | | | | | |
| | | Six months ended
November 30, 2020
(unaudited) | | | Year ended May 31 | |
| CLASS A | | 2020 | | | 2019 | | | 2018 | | | 2017 | | | 2016 | |
Net asset value, beginning of period | | | $11.90 | | | | $13.55 | | | | $15.68 | | | | $14.88 | | | | $12.83 | | | | $14.85 | |
Net investment income | | | 0.10 | 1 | | | 0.27 | 1 | | | 0.47 | 1 | | | 0.72 | 1 | | | 0.09 | 1 | | | 0.26 | |
Net realized and unrealized gains (losses) on investments | | | 1.99 | | | | (1.49 | ) | | | (2.27 | ) | | | 0.35 | | | | 2.26 | | | | (2.08 | ) |
| | | | | | | | | | | | | | | | | | | | | | | | |
Total from investment operations | | | 2.09 | | | | (1.22 | ) | | | (1.80 | ) | | | 1.07 | | | | 2.35 | | | | (1.82 | ) |
Distributions to shareholders from | | | | | | | | | | | | | | | | | | | | | | | | |
Net investment income | | | 0.00 | | | | (0.43 | ) | | | (0.33 | ) | | | (0.27 | ) | | | (0.30 | ) | | | (0.20 | ) |
Net asset value, end of period | | | $13.99 | | | | $11.90 | | | | $13.55 | | | | $15.68 | | | | $14.88 | | | | $12.83 | |
Total return2 | | | 17.56 | % | | | (9.66 | )% | | | (11.42 | )% | | | 7.12 | % | | | 18.65 | % | | | (12.31 | )% |
Ratios to average net assets (annualized) | | | | | | | | | | | | | | | | | | | | | | | | |
Gross expenses3 | | | 1.69 | % | | | 1.37 | % | | | 1.34 | % | | | 1.34 | % | | | 1.39 | % | | | 1.46 | % |
Net expenses3 | | | 1.24 | % | | | 1.25 | % | | | 1.33 | % | | | 1.34 | % | | | 1.35 | % | | | 1.39 | % |
Net investment income3 | | | 1.58 | % | | | 1.99 | % | | | 3.22 | % | | | 4.48 | % | | | 0.69 | % | | | 1.98 | % |
Supplemental data | | | | | | | | | | | | | | | | | | | | | | | | |
Portfolio turnover rate4 | | | 2 | % | | | 20 | % | | | 13 | % | | | 15 | % | | | 41 | % | | | 14 | % |
Net assets, end of period (000s omitted) | | | $52,371 | | | | $64,414 | | | | $57,427 | | | | $38,677 | | | | $2,571 | | | | $4,981 | |
| 1 | Calculated based upon average shares outstanding |
| 2 | Total return calculations do not include any sales charges. Returns for periods of less than one year are not annualized. |
| 3 | Ratios include net expenses allocated from the affiliated Master Portfolio which were as follows: |
| | | | |
Six months ended November 30, 2020 (unaudited) | | | 0.87 | % |
Year ended May 31, 2020 | | | 0.80 | % |
Year ended May 31, 2019 | | | 0.80 | % |
Year ended May 31, 2018 | | | 0.81 | % |
Year ended May 31, 2017 | | | 0.85 | % |
Year ended May 31, 2016 | | | 0.91 | % |
| 4 | Portfolio turnover rate is calculated by multiplying the affiliated Master Portfolio’s percentage of the Fund’s total investment in securities at the end of the period by the affiliated Master Portfolio’s portfolio turnover rate. |
The accompanying notes are an integral part of these financial statements.
Wells Fargo International Value Fund | 13
Financial highlights
(For a share outstanding throughout each period)
| | | | | | | | | | | | | | | | | | | | | | | | |
| | | Six months ended
November 30, 2020
(unaudited) | | | Year ended May 31 | |
| CLASS C | | 2020 | | | 2019 | | | 2018 | | | 2017 | | | 2016 | |
Net asset value, beginning of period | | | $11.61 | | | | $13.20 | | | | $15.24 | | | | $14.60 | | | | $12.56 | | | | $14.54 | |
Net investment income | | | 0.05 | 1 | | | 0.15 | 1 | | | 0.36 | | | | 0.21 | | | | 0.23 | | | | 0.17 | |
Net realized and unrealized gains (losses) on investments | | | 1.95 | | | | (1.46 | ) | | | (2.21 | ) | | | 0.73 | | | | 1.97 | | | | (2.05 | ) |
| | | | | | | | | | | | | | | | | | | | | | | | |
Total from investment operations | | | 2.00 | | | | (1.31 | ) | | | (1.85 | ) | | | 0.94 | | | | 2.20 | | | | (1.88 | ) |
Distributions to shareholders from | | | | | | | | | | | | | | | | | | | | | | | | |
Net investment income | | | 0.00 | | | | (0.28 | ) | | | (0.19 | ) | | | (0.30 | ) | | | (0.16 | ) | | | (0.10 | ) |
Net asset value, end of period | | | $13.61 | | | | $11.61 | | | | $13.20 | | | | $15.24 | | | | $14.60 | | | | $12.56 | |
Total return2 | | | 17.23 | % | | | (10.38 | )% | | | (12.10 | )% | | | 6.36 | % | | | 17.69 | % | | | (12.95 | )% |
Ratios to average net assets (annualized) | | | | | | | | | | | | | | | | | | | | | | | | |
Gross expenses3 | | | 2.43 | % | | | 2.12 | % | | | 2.08 | % | | | 2.10 | % | | | 2.16 | % | | | 2.21 | % |
Net expenses3 | | | 1.98 | % | | | 2.00 | % | | | 2.08 | % | | | 2.10 | % | | | 2.10 | % | | | 2.14 | % |
Net investment income3 | | | 0.83 | % | | | 1.13 | % | | | 1.92 | % | | | 1.40 | % | | | 1.57 | % | | | 1.25 | % |
Supplemental data | | | | | | | | | | | | | | | | | | | | | | | | |
Portfolio turnover rate4 | | | 2 | % | | | 20 | % | | | 13 | % | | | 15 | % | | | 41 | % | | | 14 | % |
Net assets, end of period (000s omitted) | | | $399 | | | | $414 | | | | $675 | | | | $1,135 | | | | $832 | | | | $783 | |
| 1 | Calculated based upon average shares outstanding |
| 2 | Total return calculations do not include any sales charges. Returns for periods of less than one year are not annualized. |
| 3 | Ratios include net expenses allocated from the affiliated Master Portfolio which were as follows: |
| | | | |
Six months ended November 30, 2020 (unaudited) | | | 0.86 | % |
Year ended May 31, 2020 | | | 0.80 | % |
Year ended May 31, 2019 | | | 0.79 | % |
Year ended May 31, 2018 | | | 0.82 | % |
Year ended May 31, 2017 | | | 0.87 | % |
Year ended May 31, 2016 | | | 0.91 | % |
| 4 | Portfolio turnover rate is calculated by multiplying the affiliated Master Portfolio’s percentage of the Fund’s total investment in securities at the end of the period by the affiliated Master Portfolio’s portfolio turnover rate. |
The accompanying notes are an integral part of these financial statements.
14 | Wells Fargo International Value Fund
Financial highlights
(For a share outstanding throughout each period)
| | | | | | | | | | | | |
| | | Six months ended
November 30, 2020
(unaudited) | | | Year ended May 31 | |
| CLASS R6 | | 2020 | | | 20191 | |
Net asset value, beginning of period | | | $11.75 | | | | $13.39 | | | | $15.44 | |
Net investment income | | | 0.19 | | | | 0.37 | 2 | | | 0.51 | |
Net realized and unrealized gains (losses) on investments | | | 1.91 | | | | (1.52 | ) | | | (2.19 | ) |
| | | | | | | | | | | | |
Total from investment operations | | | 2.10 | | | | (1.15 | ) | | | (1.68 | ) |
Distributions to shareholders from | | | | | | | | | | | | |
Net investment income | | | 0.00 | | | | (0.49 | ) | | | (0.37 | ) |
Net asset value, end of period | | | $13.85 | | | | $11.75 | | | | $13.39 | |
Total return3 | | | 17.87 | % | | | (9.27 | )% | | | (10.85 | )% |
Ratios to average net assets (annualized) | | | | | | | | | | | | |
Gross expenses4 | | | 1.26 | % | | | 0.97 | % | | | 0.92 | % |
Net expenses4 | | | 0.84 | % | | | 0.84 | % | | | 0.89 | % |
Net investment income4 | | | 1.96 | % | | | 3.01 | % | | | 7.19 | % |
Supplemental data | | | | | | | | | | | | |
Portfolio turnover rate5 | | | 2 | % | | | 20 | % | | | 13 | % |
Net assets, end of period (000s omitted) | | | $10,293 | | | | $2,843 | | | | $329 | |
| 1 | For the period from July 31, 2018 (commencement of class operations) to May 31, 2019 |
| 2 | Calculated based upon average shares outstanding |
| 3 | Returns for periods of less than one year are not annualized. |
| 4 | Ratios include net expenses allocated from the affiliated Master Portfolio which were as follows: |
| | | | |
Six months ended November 30, 2020 (unaudited) | | | 0.85 | % |
Year ended May 31, 2020 | |
| 0.81
| %
|
Year ended May 31, 20191 | | | 0.79 | % |
| 5 | Portfolio turnover rate is calculated by multiplying the affiliated Master Portfolio’s percentage of the Fund’s total investment in securities at the end of the period by the affiliated Master Portfolio’s portfolio turnover rate. |
The accompanying notes are an integral part of these financial statements.
Wells Fargo International Value Fund | 15
Financial highlights
(For a share outstanding throughout each period)
| | | | | | | | | | | | | | | | | | | | | | | | |
| | | Six months ended
November 30, 2020
(unaudited) | | | Year ended May 31 | |
| ADMINISTRATOR CLASS | | 2020 | | | 2019 | | | 2018 | | | 2017 | | | 2016 | |
Net asset value, beginning of period | | | $12.00 | | | | $13.66 | | | | $15.76 | | | | $15.04 | | | | $12.91 | | | | $14.73 | |
Net investment income | | | 0.11 | 1 | | | 0.27 | 1 | | | 0.43 | 1 | | | 0.37 | 1 | | | 0.33 | 1 | | | 0.14 | 1 |
Net realized and unrealized gains (losses) on investments | | | 2.01 | | | | (1.49 | ) | | | (2.23 | ) | | | 0.73 | | | | 2.05 | | | | (1.96 | ) |
| | | | | | | | | | | | | | | | | | | | | | | | |
Total from investment operations | | | 2.12 | | | | (1.22 | ) | | | (1.80 | ) | | | 1.10 | | | | 2.38 | | | | (1.82 | ) |
Distributions to shareholders from | | | | | | | | | | | | | | | | | | | | | | | | |
Net investment income | | | 0.00 | | | | (0.44 | ) | | | (0.30 | ) | | | (0.38 | ) | | | (0.25 | ) | | | 0.00 | |
Net asset value, end of period | | | $14.12 | | | | $12.00 | | | | $13.66 | | | | $15.76 | | | | $15.04 | | | | $12.91 | |
Total return2 | | | 17.67 | % | | | (9.60 | )% | | | (11.33 | )% | | | 7.25 | % | | | 18.66 | % | | | (12.36 | )% |
Ratios to average net assets (annualized) | | | | | | | | | | | | | | | | | | | | | | | | |
Gross expenses3 | | | 1.61 | % | | | 1.29 | % | | | 1.25 | % | | | 1.27 | % | | | 1.33 | % | | | 1.36 | % |
Net expenses3 | | | 1.14 | % | | | 1.15 | % | | | 1.24 | % | | | 1.25 | % | | | 1.25 | % | | | 1.25 | % |
Net investment income3 | | | 1.72 | % | | | 1.99 | % | | | 2.92 | % | | | 2.30 | % | | | 2.46 | % | | | 0.99 | % |
Supplemental data | | | | | | | | | | | | | | | | | | | | | | | | |
Portfolio turnover rate4 | | | 2 | % | | | 20 | % | | | 13 | % | | | 15 | % | | | 41 | % | | | 14 | % |
Net assets, end of period (000s omitted) | | | $2,126 | | | | $2,271 | | | | $3,375 | | | | $5,961 | | | | $5,407 | | | | $11,873 | |
| 1 | Calculated based upon average shares outstanding |
| 2 | Returns for periods of less than one year are not annualized. |
| 3 | Ratios include net expenses allocated from the affiliated Master Portfolio which were as follows: |
| | | | |
Six months ended November 30, 2020 (unaudited) | | | 0.86 | % |
Year ended May 31, 2020 | |
| 0.80
| %
|
Year ended May 31, 2019 | |
| 0.79
| %
|
Year ended May 31, 2018 | |
| 0.82
| %
|
Year ended May 31, 2017 | |
| 0.87
| %
|
Year ended May 31, 2016 | |
| 0.91
| %
|
| 4 | Portfolio turnover rate is calculated by multiplying the affiliated Master Portfolio’s percentage of the Fund’s total investment in securities at the end of the period by the affiliated Master Portfolio’s portfolio turnover rate. |
The accompanying notes are an integral part of these financial statements.
16 | Wells Fargo International Value Fund
Financial highlights
(For a share outstanding throughout each period)
| | | | | | | | | | | | | | | | | | | | | | | | |
| | | Six months ended
November 30, 2020
(unaudited) | | | Year ended May 31 | |
| INSTITUTIONAL CLASS | | 2020 | | | 2019 | | | 2018 | | | 2017 | | | 2016 | |
Net asset value, beginning of period | | | $11.76 | | | | $13.39 | | | | $15.48 | | | | $14.80 | | | | $12.73 | | | | $14.75 | |
Net investment income | | | 0.13 | 1 | | | 0.29 | 1 | | | 0.48 | 1 | | | 0.41 | | | | 0.39 | | | | 0.36 | |
Net realized and unrealized gains (losses) on investments | | | 1.97 | | | | (1.44 | ) | | | (2.22 | ) | | | 0.71 | | | | 1.99 | | | | (2.12 | ) |
| | | | | | | | | | | | | | | | | | | | | | | | |
Total from investment operations | | | 2.10 | | | | (1.15 | ) | | | (1.74 | ) | | | 1.12 | | | | 2.38 | | | | (1.76 | ) |
Distributions to shareholders from | | | | | | | | | | | | | | | | | | | | | | | | |
Net investment income | | | 0.00 | | | | (0.48 | ) | | | (0.35 | ) | | | (0.44 | ) | | | (0.31 | ) | | | (0.26 | ) |
Net asset value, end of period | | | $13.86 | | | | $11.76 | | | | $13.39 | | | | $15.48 | | | | $14.80 | | | | $12.73 | |
Total return2 | | | 17.86 | % | | | (9.32 | )% | | | (11.13 | )% | | | 7.51 | % | | | 19.04 | % | | | (11.98 | )% |
Ratios to average net assets (annualized) | | | | | | | | | | | | | | | | | | | | | | | | |
Gross expenses3 | | | 1.30 | % | | | 1.04 | % | | | 1.01 | % | | | 1.02 | % | | | 1.07 | % | | | 1.13 | % |
Net expenses3 | | | 0.89 | % | | | 0.90 | % | | | 0.99 | % | | | 1.00 | % | | | 1.00 | % | | | 1.00 | % |
Net investment income3 | | | 2.05 | % | | | 2.13 | % | | | 3.35 | % | | | 2.43 | % | | | 2.95 | % | | | 2.81 | % |
Supplemental data | | | | | | | | | | | | | | | | | | | | | | | | |
Portfolio turnover rate4 | | | 2 | % | | | 20 | % | | | 13 | % | | | 15 | % | | | 41 | % | | | 14 | % |
Net assets, end of period (000s omitted) | | | $88,344 | | | | $510,209 | | | | $786,584 | | | | $825,247 | | | | $713,180 | | | | $456,239 | |
| 1 | Calculated based upon average shares outstanding |
| 2 | Returns for periods of less than one year are not annualized. |
| 3 | Ratios include net expenses allocated from the affiliated Master Portfolio which were as follows: |
| | | | |
Six months ended November 30, 2020 (unaudited) | | | 0.86 | % |
Year ended May 31, 2020 | | | 0.80 | % |
Year ended May 31, 2019 | | | 0.79 | % |
Year ended May 31, 2018 | | | 0.82 | % |
Year ended May 31, 2017 | | | 0.86 | % |
Year ended May 31, 2016 | | | 0.91 | % |
| 4 | Portfolio turnover rate is calculated by multiplying the affiliated Master Portfolio’s percentage of the Fund’s total investment in securities at the end of the period by the affiliated Master Portfolio’s portfolio turnover rate. |
The accompanying notes are an integral part of these financial statements.
Wells Fargo International Value Fund | 17
Notes to financial statements (unaudited)
1. ORGANIZATION
Wells Fargo Funds Trust (the “Trust”), a Delaware statutory trust organized on March 10, 1999, is an open-end management investment company registered under the Investment Company Act of 1940, as amended (the “1940 Act”). As an investment company, the Trust follows the accounting and reporting guidance in Financial Accounting Standards Board (“FASB”) Accounting Standards Codification Topic 946, Financial Services – Investment Companies. These financial statements report on the Wells Fargo International Value Fund (the “Fund”) which is a diversified series of the Trust.
The Fund is a feeder fund in a master-feeder structure that invests substantially all of its assets in a single master portfolio with a substantially identical investment objective and substantially similar investment strategies. The Fund seeks to achieve its investment objective by investing substantially all of its assets in a separate diversified portfolio (the “affiliated Master Portfolio”) of Wells Fargo Master Trust, a registered open-end management investment company. As of November 30, 2020, the Fund owned 52% of Wells Fargo International Value Portfolio. The affiliated Master Portfolio directly acquires portfolio securities and the Fund acquires an indirect interest in those securities. The Fund accounts for its investment in the affiliated Master Portfolio as a partnership investment and records on a daily basis its share of the affiliated Master Portfolio’s income, expense and realized and unrealized gains and losses. The financial statements of the affiliated Master Portfolio for the six months ended November 30, 2020 are included in this report and should be read in conjunction with the Fund’s financial statements.
2. SIGNIFICANT ACCOUNTING POLICIES
The following significant accounting policies, which are consistently followed in the preparation of the financial statements of the Fund, are in conformity with U.S. generally accepted accounting principles which require management to make estimates and assumptions that affect the reported amounts of assets and liabilities, disclosure of contingent assets and liabilities at the date of the financial statements, and the reported amounts of revenues and expenses during the reporting period. Actual results could differ from those estimates.
Securities valuation
All investments are valued each business day as of the close of regular trading on the New York Stock Exchange (generally 4 p.m. Eastern Time), although the Fund may deviate from this calculation time under unusual or unexpected circumstances.
Investments in the affiliated Master Portfolio are valued daily based on the Fund’s proportionate share of the affiliated Master Portfolio’s net assets, which are also valued daily. Securities held in the affiliated Master Portfolio are valued as discussed in the Notes to Financial Statements of the affiliated Master Portfolio, which are included elsewhere in this report.
Investments which are not valued using the method discussed above are valued at their fair value, as determined in good faith by the Board of Trustees. The Board of Trustees has established a Valuation Committee comprised of the Trustees and has delegated to it the authority to take any actions regarding the valuation of portfolio securities that the Valuation Committee deems necessary or appropriate, including determining the fair value of portfolio securities, unless the determination has been delegated to the Wells Fargo Asset Management Pricing Committee at Wells Fargo Funds Management, LLC (“Funds Management”). The Board of Trustees retains the authority to make or ratify any valuation decisions or approve any changes to the Valuation Procedures as it deems appropriate. On a quarterly basis, the Board of Trustees receives reports on any valuation actions taken by the Valuation Committee or the Wells Fargo Asset Management Pricing Committee which may include items for ratification.
Investment transactions, income and expenses
Investments in the affiliated Master Portfolio are recorded on a trade basis. The Fund records daily its proportionate share of the affiliated Master Portfolio’s income, expenses and realized and unrealized gains or losses. The Fund also accrues its own expenses.
Distributions to shareholders
Distributions to shareholders from net investment income and any net realized gains are recorded on the ex-dividend date and paid at least annually. Such distributions are determined in accordance with income tax regulations and may differ from U.S. generally accepted accounting principles. Dividend sources are estimated at the time of declaration. The tax character of distributions is determined as of the Fund’s fiscal year end. Therefore, a portion of the Fund’s distributions made prior to the Fund’s fiscal year end may be categorized as a tax return of capital at year end.
Federal and other taxes
The Fund intends to continue to qualify as a regulated investment company by distributing substantially all of its investment company taxable income and any net realized capital gains (after reduction for capital loss carryforwards) sufficient to relieve it from all, or substantially all, federal income taxes. Accordingly, no provision for federal income taxes was required.
18 | Wells Fargo International Value Fund
Notes to financial statements (unaudited)
The Fund’s income and federal excise tax returns and all financial records supporting those returns for the prior three fiscal years are subject to examination by the federal and Delaware revenue authorities. Management has analyzed the Fund’s tax positions taken on federal, state, and foreign tax returns for all open tax years and does not believe that there are any uncertain tax positions that require recognition of a tax liability.
As of November 30, 2020, the aggregate cost of all investments for federal income tax purposes was $166,393,416 and the unrealized gains (losses) consisted of:
| | | | |
| |
Gross unrealized gains | | $ | 0 | |
| |
Gross unrealized losses | | | (13,162,943 | ) |
| |
Net unrealized losses | | $ | (13,162,943 | ) |
As of May 31, 2020, the Fund had capital loss carryforwards which consisted of $13,306,325 in long-term capital losses.
Class allocations
The separate classes of shares offered by the Fund differ principally in applicable sales charges, distribution, shareholder servicing, and administration fees. Class specific expenses are charged directly to that share class. Investment income, common fund-level expenses, and realized and unrealized gains (losses) on investments are allocated daily to each class of shares based on the relative proportion of net assets of each class.
3. FAIR VALUATION MEASUREMENTS
At November 30, 2020, the affiliated Master Portfolio was measured at fair value using the net asset value per share (or its equivalent) as a practical expedient. The investment objective and the value of the affiliate Master Portfolio was as follows:
| | | | |
| | |
| Affiliated Master Portfolio | | Investment objective | | Fair value of affiliated Master Portfolio |
| | |
Wells Fargo International Value Portfolio | | Seek long-term capital appreciation | | $153,230,473 |
The affiliated Master Portfolio does not have a redemption period notice, can be redeemed daily and does not have any unfunded commitments.
4. TRANSACTIONS WITH AFFILIATES
Management fee
Funds Management, an indirect wholly owned subsidiary of Wells Fargo & Company (“Wells Fargo”), is the manager of the Fund and provides advisory and fund-level administrative services under an investment management agreement. Under the investment management agreement, Funds Management is responsible for, among other services, implementing the investment objectives and strategies of the Fund and providing fund-level administrative services in connection with the Fund’s operations. As long as the Fund continues to invest substantially all of its assets in a single affiliated Master Portfolio, the Fund pays Funds Management an investment management fee only for fund-level administrative services at the following annual rate based on the Fund’s average daily net assets:
| | |
| |
| Average daily net assets | | Management fee |
| |
First $5 billion | | 0.05% |
| |
Next $5 billion | | 0.04 |
| |
Over $10 billion | | 0.03 |
For the six months ended November 30, 2020, the management fee was equivalent to an annual rate of 0.05% of the Fund’s average daily net assets.
Funds Management also serves as the adviser to the affiliated Master Portfolio and is entitled to receive a fee from the affiliated Master Portfolio for those services.
Wells Fargo International Value Fund | 19
Notes to financial statements (unaudited)
Administration fees
Under a class-level administration agreement, Funds Management provides class-level administrative services to the Fund, which includes paying fees and expenses for services provided by the transfer agent, sub-transfer agents, omnibus account servicers and record-keepers. As compensation for its services under the class-level administration agreement, Funds Management receives an annual fee which is calculated based on the average daily net assets of each class as follows:
| | |
| |
| | | Class-level
administration fee |
| |
Class A, Class C | | 0.21% |
| |
Class R6 | | 0.03 |
| |
Administrator Class, Institutional Class | | 0.13 |
Waivers and/or expense reimbursements
Funds Management has contractually waived and/or reimbursed management and administration fees to the extent necessary to maintain certain net operating expense ratios for the Fund. When each class of the Fund has exceeded its expense cap, Funds Management has waived fees and/or reimbursed expenses from fund-level expenses on a proportionate basis and then from class specific expenses. When only certain classes exceed their expense caps, waivers and/or reimbursements are applied against class specific expenses before fund-level expenses. Funds Management has committed through September 30, 2021 to waive fees and/or reimburse expenses to the extent necessary to cap the Fund’s expenses at 1.24% for Class A shares, 1.99% for Class C shares, 0.84% for Class R6 shares, 1.14% for Administrator Class shares, and 0.89% for Institutional Class shares. Prior to or after the commitment expiration date, the cap may be increased or the commitment to maintain the cap may be terminated only with the approval of the Board of Trustees.
Distribution fee
The Trust has adopted a distribution plan for Class C shares of the Fund pursuant to Rule 12b-1 under the 1940 Act. A distribution fee is charged to Class C shares and paid to Wells Fargo Funds Distributor, LLC (“Funds Distributor”), the principal underwriter, at an annual rate of 0.75% of the average daily net assets of Class C shares.
In addition, Funds Distributor is entitled to receive the front-end sales charge from the purchase of Class A shares and a contingent deferred sales charge on the redemption of certain Class A shares. Funds Distributor is also entitled to receive the contingent deferred sales charges from redemptions of Class C shares. For the six months ended November 30, 2020, Funds Distributor received $24 from the sale of Class A shares. No contingent deferred sales charges were incurred by Class A and Class C shares for the six months ended November 30, 2020.
Shareholder servicing fees
The Trust has entered into contracts with one or more shareholder servicing agents, whereby Class A, Class C, and Administrator Class of the Fund are charged a fee at an annual rate of 0.25% of the average daily net assets of each respective class. A portion of these total shareholder servicing fees were paid to affiliates of Wells Fargo.
5. INVESTMENT PORTFOLIO TRANSACTIONS
The Fund seeks to achieve its investment objective by investing substantially all of its assets in a single affiliated Master Portfolio. Purchases and sales have been calculated by multiplying the Fund’s ownership percentage of the affiliated Master Portfolio by the affiliated Master Portfolio’s purchases and sales. Purchases and sales of investments, excluding U.S. government obligations (if any) and short-term securities, for the six months ended November 30, 2020 were $4,559,914 and $291,780,550, respectively.
6. BANK BORROWINGS
The Trust (excluding the money market funds), Wells Fargo Master Trust and Wells Fargo Variable Trust are parties to a $350,000,000 revolving credit agreement whereby the Fund is permitted to use bank borrowings for temporary or emergency purposes, such as to fund shareholder redemption requests. Interest under the credit agreement is charged to the Fund based on a borrowing rate equal to the higher of the Federal Funds rate in effect on that day plus 1.25% or the overnight LIBOR rate in effect on that day plus 1.25%. In addition, an annual commitment fee equal to 0.25% of the unused balance is allocated to each participating fund.
For the six months ended November 30, 2020, there were no borrowings by the Fund under the agreement.
20 | Wells Fargo International Value Fund
Notes to financial statements (unaudited)
7. CONCENTRATION RISK
Concentration risks result from exposure to a limited number of geographic regions. Through its investment in the affiliated Master Portfolio which may invest a substantial portion of its assets in any geographic region, the Fund may in turn be more affected by changes in that geographic region than a fund whose investments are not heavily weighted in any geographic region. As of the end of the period, the Master Portfolio concentrated its portfolio in investments in Europe.
8. INDEMNIFICATION
Under the Fund’s organizational documents, the officers and Trustees have been granted certain indemnification rights against certain liabilities that may arise out of performance of their duties to the Fund. The Fund has entered into a separate agreement with each Trustee that converts indemnification rights currently existing under the Fund’s organizational documents into contractual rights that cannot be changed in the future without the consent of the Trustee. Additionally, in the normal course of business, the Fund may enter into contracts with service providers that contain a variety of indemnification clauses. The Fund’s maximum exposure under these arrangements is dependent on future claims that may be made against the Fund and, therefore, cannot be estimated.
9. NEW ACCOUNTING PRONOUNCEMENT
In August 2018, FASB issued Accounting Standards Update (“ASU”) No. 2018-13, Fair Value Measurement (Topic 820) Disclosure Framework—Changes to the Disclosure Requirements for Fair Value Measurement. ASU 2018-13 updates the disclosure requirements on fair value measurements in Topic 820, Fair Value Measurements. The amendments are effective for fiscal years, and interim periods within those fiscal years, beginning after December 15, 2019. Management has adopted this guidance which did not have a material impact on the financial statements.
10. CORONAVIRUS (COVID-19) PANDEMIC
On March 11, 2020, the World Health Organization announced that it had made the assessment that coronavirus disease 2019 (“COVID-19”) is a pandemic. The impacts of COVID-19 are adversely affecting the entire global economy, individual companies and investment products, and the market in general. There is significant uncertainty around the extent and duration of business disruptions related to COVID-19 and the impacts may be short term or may last for an extended period of time. The risk of further spreading of COVID-19 has led to significant uncertainty and volatility in the financial markets.
Wells Fargo International Value Fund | 21
Portfolio of investments—November 30, 2020 (unaudited)
| | | | | | | | | | | | | | | | |
| | | | | | | | | Shares | | | Value | |
| Common Stocks: 97.48% | |
|
| Australia: 5.55% | |
AGL Energy Limited (Utilities, Multi-Utilities) | | | | | | | | | | | 132,100 | | | $ | 1,309,068 | |
Beach Petroleum Limited (Energy, Oil, Gas & Consumable Fuels) | | | | | | | | | | | 906,700 | | | | 1,171,391 | |
BlueScope Steel Limited (Materials, Metals & Mining) | | | | | | | | | | | 126,700 | | | | 1,590,371 | |
Fortescue Metals Group Limited (Materials, Metals & Mining) | | | | | | | | | | | 188,500 | | | | 2,522,456 | |
Harvey Norman Holdings Limited (Consumer Discretionary, Multiline Retail) | | | | | | | | | | | 534,000 | | | | 1,807,040 | |
Lendlease Corporation Limited (Real Estate, Real Estate Management & Development) | | | | | | | | | | | 104,900 | | | | 1,090,346 | |
Metcash Limited (Consumer Staples, Food & Staples Retailing) | | | | | | | | | | | 498,500 | | | | 1,079,476 | |
Mirvac Group (Real Estate, Equity REITs) | | | | | | | | | | | 439,900 | | | | 833,104 | |
Qantas Airways Limited (Industrials, Airlines) † | | | | | | | | | | | 366,700 | | | | 1,448,168 | |
Rio Tinto Limited (Materials, Metals & Mining) | | | | | | | | | | | 15,900 | | | | 1,183,479 | |
St. Barbara Limited (Materials, Metals & Mining) | | | | | | | | | | | 559,600 | | | | 1,006,397 | |
Super Cheap Auto Group Limited (Consumer Discretionary, Specialty Retail) | | | | | | | | | | | 183,200 | | | | 1,328,642 | |
| | | | |
| | | | | | | | | | | | | | | 16,369,938 | |
| | | | | | | | | | | | | | | | |
|
| Austria: 0.74% | |
OMV AG (Energy, Oil, Gas & Consumable Fuels) | | | | | | | | | | | 34,400 | | | | 1,165,367 | |
Raiffeisen Bank International AG (Financials, Banks) † | | | | | | | | | | | 52,900 | | | | 1,013,415 | |
| | | | |
| | | | | | | | | | | | | | | 2,178,782 | |
| | | | | | | | | | | | | | | | |
|
| Belgium: 0.78% | |
Bpost SA (Industrials, Air Freight & Logistics) | | | | | | | | | | | 105,700 | | | | 1,278,495 | |
UCB SA (Health Care, Pharmaceuticals) | | | | | | | | | | | 9,600 | | | | 1,025,584 | |
| | | | |
| | | | | | | | | | | | | | | 2,304,079 | |
| | | | | | | | | | | | | | | | |
|
| Brazil: 0.76% | |
Banco do Brasil SA (Financials, Banks) | | | | | | | | | | | 121,700 | | | | 769,172 | |
Companhia de Saneamento de Minas Gerais SA (Utilities, Water Utilities) | | | | | | | | | | | 225,900 | | | | 626,586 | |
JBS SA (Consumer Staples, Food Products) | | | | | | | | | | | 197,500 | | | | 853,422 | |
| | | | |
| | | | | | | | | | | | | | | 2,249,180 | |
| | | | | | | | | | | | | | | | |
|
| Canada: 0.97% | |
Loblaw Companies Limited (Consumer Staples, Food & Staples Retailing) | | | | | | | | | | | 22,400 | | | | 1,107,323 | |
Magna International Incorporated (Consumer Discretionary, Auto Components) | | | | | | | | | | | 28,500 | | | | 1,747,702 | |
| | | | |
| | | | | | | | | | | | | | | 2,855,025 | |
| | | | | | | | | | | | | | | | |
|
| China: 2.28% | |
Agile Property Holdings Limited (Real Estate, Real Estate Management & Development) | | | | | | | | | | | 632,000 | | | | 913,218 | |
China Communications Services Corporation Limited Class H (Industrials, Construction & Engineering) | | | | | | | | | | | 1,302,000 | | | | 695,426 | |
China Railway Construction Corporation Limited Class H (Industrials, Construction & Engineering) | | | | | | | | | | | 957,000 | | | | 632,152 | |
China Resources Cement Holdings Limited (Materials, Construction Materials) | | | | | | | | | | | 1,076,000 | | | | 1,338,224 | |
China Telecom Corporation Limited Class H (Communication Services, Diversified Telecommunication Services) | | | | | | | | | | | 2,794,000 | | | | 843,493 | |
Shanghai Pharmaceuticals Holding Company Limited Class H (Health Care, Health Care Providers & Services) | | | | | | | | | | | 458,900 | | | | 776,768 | |
Shenzhen International Holdings Limited Class H (Industrials, Transportation Infrastructure) | | | | | | | | | | | 502,000 | | | | 825,111 | |
YiChang HEC ChangJiang Pharmaceutical Company Limited H Shares (Health Care, Pharmaceuticals) 144A | | | | | | | | | | | 541,000 | | | | 704,950 | |
| | | | |
| | | | | | | | | | | | | | | 6,729,342 | |
| | | | | | | | | | | | | | | | |
|
| Denmark: 1.37% | |
Danske Bank AS (Financials, Banks) † | | | | | | | | | | | 63,800 | | | | 1,051,542 | |
DFDS AS (Industrials, Marine) † | | | | | | | | | | | 23,600 | | | | 1,021,121 | |
Pandora AS (Consumer Discretionary, Textiles, Apparel & Luxury Goods) | | | | | | | | | | | 9,100 | | | | 911,429 | |
The accompanying notes are an integral part of these financial statements.
22 | Wells Fargo International Value Portfolio
Portfolio of investments—November 30, 2020 (unaudited)
| | | | | | | | | | | | | | | | |
| | | | | | | | | Shares | | | Value | |
| Denmark (continued) | |
Sydbank AS (Financials, Banks) † | | | | | | | | | | | 51,500 | | | $ | 1,067,931 | |
| | | | |
| | | | | | | | | | | | | | | 4,052,023 | |
| | | | | | | | | | | | | | | | |
|
| Finland: 0.33% | |
Nordea Bank AB (Financials, Banks) † | | | | 115,100 | | | | 983,266 | |
| | | | | | | | | | | | | | | | |
|
| France: 9.90% | |
Arkema SA (Materials, Chemicals) | | | | | | | | | | | 20,400 | | | | 2,377,933 | |
AXA SA (Financials, Insurance) | | | | | | | | | | | 84,900 | | | | 1,996,294 | |
BNP Paribas SA (Financials, Banks) † | | | | | | | | | | | 44,100 | | | | 2,260,161 | |
Bouygues SA (Industrials, Construction & Engineering) | | | | | | | | | | | 38,600 | | | | 1,536,950 | |
Capgemini SE (Information Technology, IT Services) | | | | | | | | | | | 13,300 | | | | 1,845,089 | |
Carrefour SA (Consumer Staples, Food & Staples Retailing) | | | | | | | | | | | 71,300 | | | | 1,167,740 | |
Compagnie de Saint-Gobain SA (Industrials, Building Products) † | | | | | | | | | | | 52,900 | | | | 2,512,713 | |
Compagnie Generale des Etablissements Michelin SCA (Consumer Discretionary, Auto Components) | | | | | | | | | | | 16,600 | | | | 2,068,248 | |
Credit Agricole SA (Financials, Banks) † | | | | | | | | | | | 124,500 | | | | 1,436,685 | |
Engie SA (Utilities, Multi-Utilities) † | | | | | | | | | | | 62,200 | | | | 917,796 | |
Neopost SA (Information Technology, Technology Hardware, Storage & Peripherals) | | | | | | | | | | | 55,600 | | | | 991,521 | |
Orange SA (Communication Services, Diversified Telecommunication Services) « | | | | | | | | | | | 77,000 | | | | 972,686 | |
Sanofi SA (Health Care, Pharmaceuticals) | | | | | | | | | | | 59,200 | | | | 5,981,945 | |
Societe Bic SA (Industrials, Commercial Services & Supplies) | | | | | | | | | | | 19,900 | | | | 1,181,189 | |
Total SA (Energy, Oil, Gas & Consumable Fuels) | | | | | | | | | | | 45,900 | | | | 1,961,485 | |
| | | | |
| | | | | | | | | | | | | | | 29,208,435 | |
| | | | | | | | | | | | | | | | |
|
| Germany: 8.39% | |
Allianz AG (Financials, Insurance) | | | | | | | | | | | 13,300 | | | | 3,135,859 | |
Aurubis AG (Materials, Metals & Mining) | | | | | | | | | | | 21,200 | | | | 1,614,919 | |
Bayer AG (Health Care, Pharmaceuticals) | | | | | | | | | | | 55,500 | | | | 3,195,629 | |
Bayerische Motoren Werke AG (Consumer Discretionary, Automobiles) | | | | | | | | | | | 15,100 | | | | 1,315,600 | |
Daimler AG (Consumer Discretionary, Automobiles) | | | | | | | | | | | 23,600 | | | | 1,589,139 | |
Deutsche Lufthansa AG (Industrials, Airlines) † | | | | | | | | | | | 96,600 | | | | 1,111,502 | |
Deutsche Post AG (Industrials, Air Freight & Logistics) | | | | | | | | | | | 52,300 | | | | 2,526,636 | |
Fresenius SE & Company KGaA (Health Care, Health Care Providers & Services) | | | | | | | | | | | 32,100 | | | | 1,435,894 | |
Muenchener Rueckversicherungs Gesellschaft AG (Financials, Insurance) | | | | | | | | | | | 4,000 | | | | 1,114,600 | |
Rheinmetall AG (Industrials, Industrial Conglomerates) | | | | | | | | | | | 16,400 | | | | 1,458,599 | |
Siltronic AG (Information Technology, Semiconductors & Semiconductor Equipment) | | | | | | | | | | | 11,900 | | | | 1,734,619 | |
United Internet AG (Communication Services, Diversified Telecommunication Services) | | | | | | | | | | | 57,800 | | | | 2,304,890 | |
Volkswagen AG (Consumer Discretionary, Automobiles) | | | | | | | | | | | 11,900 | | | | 2,207,310 | |
| | | | |
| | | | | | | | | | | | | | | 24,745,196 | |
| | | | | | | | | | | | | | | | |
|
| Hong Kong: 2.98% | |
China Water Affairs Group Limited (Utilities, Water Utilities) | | | | | | | | | | | 1,110,000 | | | | 872,127 | |
CK Hutchison Holdings Limited (Industrials, Industrial Conglomerates) | | | | | | | | | | | 145,500 | | | | 1,055,905 | |
Kingboard Laminates Holdings Limited (Information Technology, Electronic Equipment, Instruments & Components) | | | | | | | | | | | 572,500 | | | | 926,216 | |
Lee & Man Paper Manufacturing Limited (Materials, Paper & Forest Products) | | | | | | | | | | | 1,526,000 | | | | 1,240,322 | |
Sinotruk Hong Kong Limited (Industrials, Machinery) | | | | | | | | | | | 280,000 | | | | 695,028 | |
WH Group Limited (Consumer Staples, Food Products) 144A | | | | | | | | | | | 1,938,000 | | | | 1,582,694 | |
Xinyi Glass Holdings Limited (Industrials, Building Products) | | | | | | | | | | | 584,000 | | | | 1,310,997 | |
Yue Yuen Industrial Holdings Limited (Consumer Discretionary, Textiles, Apparel & Luxury Goods) | | | | | | | | | | | 542,500 | | | | 1,115,649 | |
| | | | |
| | | | | | | | | | | | | | | 8,798,938 | |
| | | | | | | | | | | | | | | | |
|
| India: 0.64% | |
REC Limited (Financials, Diversified Financial Services) | | | | | | | | | | | 513,100 | | | | 836,766 | |
Tech Mahindra Limited (Information Technology, IT Services) | | | | | | | | | | | 89,200 | | | | 1,048,525 | |
| | | | |
| | | | | | | | | | | | | | | 1,885,291 | |
| | | | | | | | | | | | | | | | |
The accompanying notes are an integral part of these financial statements.
Wells Fargo International Value Portfolio | 23
Portfolio of investments—November 30, 2020 (unaudited)
| | | | | | | | | | | | | | | | |
| | | | | | | | | Shares | | | Value | |
| Ireland: 1.02% | |
C&C Group plc (Consumer Staples, Beverages) † | | | | | | | | | | | 240,000 | | | $ | 703,903 | |
Grafton Group plc (Industrials, Trading Companies & Distributors) † | | | | | | | | | | | 83,000 | | | | 942,197 | |
Smurfit Kappa Group plc (Materials, Containers & Packaging) | | | | | | | | | | | 32,100 | | | | 1,364,673 | |
| | | | |
| | | | | | | | | | | | | | | 3,010,773 | |
| | | | | | | | | | | | | | | | |
|
| Israel: 0.27% | |
Teva Pharmaceutical Industries Limited (Health Care, Pharmaceuticals) † | | | | | | | | | | | 83,500 | | | | 807,763 | |
| | | | | | | | | | | | | | | | |
|
| Italy: 2.26% | |
A2A SpA (Utilities, Multi-Utilities) | | | | | | | | | | | 674,100 | | | | 1,027,640 | |
Enel SpA (Utilities, Electric Utilities) | | | | | | | | | | | 252,700 | | | | 2,522,997 | |
Leonardo SpA (Industrials, Aerospace & Defense) | | | | | | | | | | | 147,900 | | | | 1,069,827 | |
Mediobanca SpA (Financials, Banks) | | | | | | | | | | | 110,500 | | | | 985,148 | |
UnipolSai Assicurazioni SpA (Financials, Insurance) | | | | | | | | | | | 399,200 | | | | 1,060,942 | |
| | | | |
| | | | | | | | | | | | | | | 6,666,554 | |
| | | | | | | | | | | | | | | | |
|
| Japan: 22.09% | |
Adeka Corporation (Materials, Chemicals) | | | | | | | | | | | 96,000 | | | | 1,524,598 | |
AGC Incorporated (Industrials, Building Products) | | | | | | | | | | | 30,600 | | | | 1,018,534 | |
Alfresa Holdings Corporation (Health Care, Health Care Providers & Services) | | | | | | | | | | | 48,100 | | | | 962,921 | |
Astellas Pharma Incorporated (Health Care, Pharmaceuticals) | | | | | | | | | | | 84,100 | | | | 1,195,042 | |
Brother Industries Limited (Information Technology, Technology Hardware, Storage & Peripherals) | | | | | | | | | | | 108,800 | | | | 2,084,291 | |
Credit Saison Company Limited (Financials, Consumer Finance) | | | | | | | | | | | 90,700 | | | | 1,038,185 | |
Daiwa House Industry Company Limited (Real Estate, Real Estate Management & Development) | | | | | | | | | | | 32,200 | | | | 986,973 | |
Denka Company Limited (Materials, Chemicals) | | | | | | | | | | | 53,200 | | | | 1,645,939 | |
DIC Incorporated (Materials, Chemicals) | | | | | | | | | | | 50,900 | | | | 1,251,535 | |
Fuji Machine Manufacturing Company Limited (Industrials, Machinery) | | | | | | | | | | | 44,200 | | | | 1,070,707 | |
Geo Holdings Corporation (Consumer Discretionary, Specialty Retail) | | | | | | | | | | | 64,300 | | | | 781,578 | |
Hitachi Capital Corporation (Financials, Consumer Finance) | | | | | | | | | | | 44,100 | | | | 1,011,259 | |
Hitachi Limited (Information Technology, Electronic Equipment, Instruments & Components) | | | | | | | | | | | 39,900 | | | | 1,515,741 | |
Honda Motor Company Limited (Consumer Discretionary, Automobiles) | | | | | | | | | | | 97,100 | | | | 2,670,715 | |
Isuzu Motors Limited (Consumer Discretionary, Automobiles) | | | | | | | | | | | 148,300 | | | | 1,446,067 | |
Itochu Corporation (Industrials, Trading Companies & Distributors) | | | | | | | | | | | 45,100 | | | | 1,191,651 | |
Japan Airlines Company Limited (Industrials, Airlines) † | | | | | | | | | | | 53,800 | | | | 1,018,799 | |
JXTG Holdings Incorporated (Energy, Oil, Gas & Consumable Fuels) | | | | | | | | | | | 270,800 | | | | 929,902 | |
Kaken Pharmaceutical Company Limited (Health Care, Pharmaceuticals) | | | | | | | | | | | 16,900 | | | | 616,753 | |
KDDI Corporation (Communication Services, Wireless Telecommunication Services) | | | | | | | | | | | 157,000 | | | | 4,485,177 | |
Marubeni Corporation (Industrials, Trading Companies & Distributors) | | | | | | | | | | | 301,500 | | | | 1,757,306 | |
Matsumotokiyoshi Holdings Company Limited (Consumer Staples, Food & Staples Retailing) | | | | | | | | | | | 27,200 | | | | 1,272,720 | |
MediPal Holdings Corporation (Health Care, Health Care Providers & Services) | | | | | | | | | | | 42,400 | | | | 797,234 | |
Mitsubishi Gas Chemical Company Incorporated (Materials, Chemicals) | | | | | | | | | | | 87,500 | | | | 1,855,603 | |
Mitsubishi UFJ Financial Group Incorporated (Financials, Banks) | | | | | | | | | | | 247,700 | | | | 1,064,114 | |
Mitsubishi UFJ Lease & Finance Company Limited (Financials, Diversified Financial Services) | | | | | | | | | | | 208,200 | | | | 955,247 | |
Mitsui Chemicals Incorporated (Materials, Chemicals) | | | | | | | | | | | 60,400 | | | | 1,696,870 | |
Mizuho Financial Group Incorporated (Financials, Banks) | | | | | | | | | | | 79,980 | | | | 1,016,987 | |
Nippon Telegraph & Telephone Corporation (Communication Services, Diversified Telecommunication Services) | | | | | | | | | | | 184,800 | | | | 4,363,333 | |
Nomura Holdings Incorporated (Financials, Capital Markets) | | | | | | | | | | | 217,500 | | | | 1,091,667 | |
ORIX Corporation (Financials, Diversified Financial Services) | | | | | | | | | | | 112,600 | | | | 1,674,979 | |
Resona Holdings Incorporated (Financials, Banks) | | | | | | | | | | | 378,000 | | | | 1,324,086 | |
Sawai Pharmaceutical Company Limited (Health Care, Pharmaceuticals) | | | | | | | | | | | 16,200 | | | | 731,638 | |
Sojitz Corporation (Industrials, Trading Companies & Distributors) | | | | | | | | | | | 678,500 | | | | 1,488,281 | |
Sompo Holdings Incorporated (Financials, Insurance) | | | | | | | | | | | 22,700 | | | | 871,906 | |
Sumitomo Corporation (Industrials, Trading Companies & Distributors) | | | | | | | | | | | 84,500 | | | | 1,041,276 | |
Sumitomo Heavy Industries Limited (Industrials, Machinery) | | | | | | | | | | | 75,500 | | | | 1,629,325 | |
Sumitomo Mitsui Financial Group Incorporated (Financials, Banks) | | | | | | | | | | | 44,900 | | | | 1,303,992 | |
The accompanying notes are an integral part of these financial statements.
24 | Wells Fargo International Value Portfolio
Portfolio of investments—November 30, 2020 (unaudited)
| | | | | | | | | | | | | | | | |
| | | | | | | | | Shares | | | Value | |
| Japan (continued) | |
T&D Holdings Incorporated (Financials, Insurance) | | | | | | | | | | | 76,800 | | | $ | 896,736 | |
Teijin Limited (Materials, Chemicals) | | | | | | | | | | | 79,300 | | | | 1,355,088 | |
The Keiyo Bank Limited (Financials, Banks) | | | | | | | | | | | 203,300 | | | | 889,924 | |
The Yokohama Rubber Company Limited (Consumer Discretionary, Auto Components) | | | | | | | | | | | 85,500 | | | | 1,247,284 | |
Toho Holdings Company Limited (Health Care, Health Care Providers & Services) | | | | | | | | | | | 50,700 | | | | 924,158 | |
Tokuyama Corporation (Materials, Chemicals) | | | | | | | | | | | 55,500 | | | | 1,178,578 | |
Toyo Ink SC Holding Company Limited (Materials, Chemicals) | | | | | | | | | | | 67,300 | | | | 1,264,131 | |
Toyota Boshoku Corporation (Consumer Discretionary, Auto Components) | | | | | | | | | | | 61,100 | | | | 801,791 | |
UBE Industries Limited (Materials, Chemicals) | | | | | | | | | | | 75,600 | | | | 1,285,345 | |
ULVAC Incorporated (Information Technology, Semiconductors & Semiconductor Equipment) | | | | | | | | | | | 23,300 | | | | 941,820 | |
| | | | |
| | | | | | | | | | | | | | | 65,167,786 | |
| | | | | | | | | | | | | | | | |
|
| Netherlands: 3.76% | |
ABN AMRO Group NV (Financials, Banks) †144A | | | | | | | | | | | 91,500 | | | | 944,111 | |
Aegon NV (Financials, Insurance) | | | | | | | | | | | 240,800 | | | | 900,780 | |
ASR Nederland NV (Financials, Insurance) | | | | | | | | | | | 31,200 | | | | 1,164,146 | |
ING Groep NV (Financials, Banks) † | | | | | | | | | | | 112,300 | | | | 1,095,099 | |
Koninklijke Ahold Delhaize NV (Consumer Staples, Food & Staples Retailing) | | | | | | | | | | | 117,200 | | | | 3,353,852 | |
RHI Magnesita NV (Materials, Construction Materials) | | | | | | | | | | | 25,200 | | | | 1,094,779 | |
Signify NV (Industrials, Electrical Equipment) †144A | | | | | | | | | | | 60,000 | | | | 2,540,772 | |
| | | | |
| | | | | | | | | | | | | | | 11,093,539 | |
| | | | | | | | | | | | | | | | |
|
| Norway: 0.88% | |
Den Norske Bank ASA (Financials, Banks) † | | | | | | | | | | | 86,700 | | | | 1,570,578 | |
Leroy Seafood Group ASA (Consumer Staples, Food Products) | | | | | | | | | | | 162,000 | | | | 1,012,511 | |
| | | | |
| | | | | | | | | | | | | | | 2,583,089 | |
| | | | | | | | | | | | | | | | |
|
| Poland: 0.29% | |
Asseco Poland SA (Information Technology, Software) | | | | | | | | | | | 48,400 | | | | 854,937 | |
| | | | | | | | | | | | | | | | |
|
| Russia: 0.63% | |
Gazprom Neft ADR (Energy, Oil, Gas & Consumable Fuels) | | | | | | | | | | | 53,914 | | | | 1,105,237 | |
Gazprom Neft ADR (Energy, Oil, Gas & Consumable Fuels) | | | | | | | | | | | 886 | | | | 18,234 | |
Lukoil PJSC ADR (Energy, Oil, Gas & Consumable Fuels) | | | | | | | | | | | 11,300 | | | | 745,800 | |
| | | | |
| | | | | | | | | | | | | | | 1,869,271 | |
| | | | | | | | | | | | | | | | |
|
| Singapore: 0.71% | |
DBS Group Holdings Limited (Financials, Banks) | | | | | | | | | | | 53,900 | | | | 1,012,773 | |
United Overseas Bank Limited (Financials, Banks) | | | | | | | | | | | 65,000 | | | | 1,090,967 | |
| | | | |
| | | | | | | | | | | | | | | 2,103,740 | |
| | | | | | | | | | | | | | | | |
|
| South Africa: 0.31% | |
Absa Group Limited (Financials, Banks) | | | | | | | | | | | 126,700 | | | | 901,596 | |
| | | | | | | | | | | | | | | | |
|
| South Korea: 1.95% | |
Industrial Bank of Korea (Financials, Banks) | | | | | | | | | | | 112,500 | | | | 945,506 | |
KB Financial Group Incorporated (Financials, Banks) | | | | | | | | | | | 27,700 | | | | 1,135,236 | |
KT&G Corporation (Consumer Staples, Tobacco) | | | | | | | | | | | 12,200 | | | | 909,584 | |
LG Uplus Corporation (Communication Services, Diversified Telecommunication Services) | | | | | | | | | | | 81,400 | | | | 879,066 | |
SK Telecom Company Limited (Communication Services, Wireless Telecommunication Services) | | | | | | | | | | | 4,800 | | | | 1,030,229 | |
Woori Financial Group Incorporated (Financials, Banks) | | | | | | | | | | | 94,600 | | | | 840,376 | |
| | | | |
| | | | | | | | | | | | | | | 5,739,997 | |
| | | | | | | | | | | | | | | | |
|
| Spain: 1.50% | |
Banco Santander Central Hispano SA (Financials, Banks) † | | | | | | | | | | | 311,800 | | | | 899,143 | |
Cia de Distribucion Integral Logista Holdings SA (Industrials, Air Freight & Logistics) | | | | | | | | | | | 20,000 | | | | 366,921 | |
The accompanying notes are an integral part of these financial statements.
Wells Fargo International Value Portfolio | 25
Portfolio of investments—November 30, 2020 (unaudited)
| | | | | | | | | | | | | | | | |
| | | | | | | | | Shares | | | Value | |
| Spain (continued) | |
Enagás SA (Utilities, Gas Utilities) | | | | | | | | | | | 49,700 | | | $ | 1,210,593 | |
International Consolidated Airlines Group SA (Industrials, Airlines) | | | | | | | | | | | 367,100 | | | | 754,654 | |
Repsol SA (Energy, Oil, Gas & Consumable Fuels) | | | | | | | | | | | 124,200 | | | | 1,193,809 | |
| | | | |
| | | | | | | | | | | | | | | 4,425,120 | |
| | | | | | | | | | | | | | | | |
|
| Sweden: 2.42% | |
Boliden AB (Materials, Metals & Mining) | | | | | | | | | | | 68,100 | | | | 2,346,250 | |
Securitas AB Class B (Industrials, Commercial Services & Supplies) † | | | | | | | | | | | 68,700 | | | | 1,129,394 | |
Volvo AB Class B (Industrials, Machinery) † | | | | | | | | | | | 161,400 | | | | 3,665,744 | |
| | | | |
| | | | | | | | | | | | | | | 7,141,388 | |
| | | | | | | | | | | | | | | | |
|
| Switzerland: 8.35% | |
Baloise Holding AG (Financials, Insurance) | | | | | | | | | | | 7,100 | | | | 1,224,286 | |
Credit Suisse Group AG (Financials, Capital Markets) | | | | | | | | | | | 184,800 | | | | 2,334,530 | |
Helvetia Holding AG (Financials, Insurance) | | | | | | | | | | | 8,900 | | | | 874,085 | |
Novartis AG (Health Care, Pharmaceuticals) | | | | | | | | | | | 60,700 | | | | 5,495,229 | |
Roche Holding AG (Health Care, Pharmaceuticals) | | | | | | | | | | | 23,200 | | | | 7,634,623 | |
Swiss Life Holding AG (Financials, Insurance) | | | | | | | | | | | 4,400 | | | | 1,964,809 | |
UBS Group AG (Financials, Capital Markets) | | | | | | | | | | | 214,200 | | | | 3,038,281 | |
Valiant Holding AG (Financials, Banks) | | | | | | | | | | | 10,500 | | | | 980,963 | |
Zurich Insurance Group AG (Financials, Insurance) | | | | | | | | | | | 2,700 | | | | 1,096,044 | |
| | | | |
| | | | | | | | | | | | | | | 24,642,850 | |
| | | | | | | | | | | | | | | | |
|
| Taiwan: 1.45% | |
Catcher Technology Company Limited (Information Technology, Technology Hardware, Storage & Peripherals) | | | | | | | | | | | 119,000 | | | | 784,914 | |
Hon Hai Precision Industry Company Limited (Information Technology, Electronic Equipment, Instruments & Components) | | | | | | | | | | | 333,000 | | | | 961,526 | |
Powertech Technology Incorporated (Information Technology, Semiconductors & Semiconductor Equipment) | | | | | | | | | | | 257,000 | | | | 829,541 | |
Tripod Technology Corporation (Information Technology, Electronic Equipment, Instruments & Components) | | | | | | | | | | | 212,000 | | | | 911,148 | |
Wistron Corporation (Information Technology, Technology Hardware, Storage & Peripherals) | | | | | | | | | | | 769,000 | | | | 805,356 | |
| | | | |
| | | | | | | | | | | | | | | 4,292,485 | |
| | | | | | | | | | | | | | | | |
|
| Thailand: 0.86% | |
Krung Thai Bank PCL ADR (Financials, Banks) | | | | | | | | | | | 2,365,200 | | | | 836,616 | |
Quality House PCL (Real Estate, Real Estate Management & Development) | | | | | | | | | | | 12,240,900 | | | | 938,806 | |
Thanachart Capital PCL (Financials, Banks) | | | | | | | | | | | 676,600 | | | | 760,476 | |
| | | | |
| | | | | | | | | | | | | | | 2,535,898 | |
| | | | | | | | | | | | | | | | |
|
| Turkey: 0.30% | |
Coca-Cola Icecek Uretim AS (Consumer Staples, Beverages) | | | | | | | | | | | 121,861 | | | | 873,441 | |
| | | | | | | | | | | | | | | | |
|
| United Kingdom: 13.74% | |
3i Group plc (Financials, Capital Markets) | | | | | | | | | | | 80,400 | | | | 1,147,418 | |
Anglo American plc (Materials, Metals & Mining) | | | | | | | | | | | 82,100 | | | | 2,422,712 | |
Aviva plc (Financials, Insurance) | | | | | | | | | | | 241,200 | | | | 1,032,837 | |
Babcock International Group plc (Industrials, Commercial Services & Supplies) | | | | | | | | | | | 241,900 | | | | 1,089,690 | |
BAE Systems plc (Industrials, Aerospace & Defense) | | | | | | | | | | | 438,200 | | | | 2,944,300 | |
Barclays plc (Financials, Banks) † | | | | | | | | | | | 449,400 | | | | 806,173 | |
Barratt Developments plc (Consumer Discretionary, Household Durables) † | | | | | | | | | | | 109,200 | | | | 902,596 | |
Bellway plc (Consumer Discretionary, Household Durables) | | | | | | | | | | | 25,100 | | | | 947,311 | |
Bovis Homes Group plc (Consumer Discretionary, Household Durables) † | | | | | | | | | | | 91,111 | | | | 1,005,727 | |
British American Tobacco plc (Consumer Staples, Tobacco) | | | | | | | | | | | 58,900 | | | | 2,072,603 | |
The accompanying notes are an integral part of these financial statements.
26 | Wells Fargo International Value Portfolio
Portfolio of investments—November 30, 2020 (unaudited)
| | | | | | | | | | | | | | | | |
| | | | | | | | | Shares | | | Value | |
| United Kingdom (continued) | |
BT Group plc (Communication Services, Diversified Telecommunication Services) | | | | | | | | | | | 700,200 | | | $ | 1,090,295 | |
Centrica plc (Utilities, Multi-Utilities) † | | | | | | | | | | | 1,625,800 | | | | 956,273 | |
Crest Nicholson Holdings plc (Consumer Discretionary, Household Durables) † | | | | | | | | | | | 254,500 | | | | 996,824 | |
GlaxoSmithKline plc (Health Care, Pharmaceuticals) | | | | | | | | | | | 226,200 | | | | 4,131,353 | |
Highland Gold Mining Limited (Materials, Metals & Mining) «(a) | | | | | | | | | | | 637,800 | | | | 2,550,850 | |
Imperial Brands plc (Consumer Staples, Tobacco) | | | | | | | | | | | 46,400 | | | | 841,890 | |
Inchcape plc (Consumer Discretionary, Distributors) † | | | | | | | | | | | 128,000 | | | | 1,021,300 | |
J Sainsbury plc (Consumer Staples, Food & Staples Retailing) | | | | | | | | | | | 532,300 | | | | 1,498,041 | |
Kingfisher plc (Consumer Discretionary, Specialty Retail) † | | | | | | | | | | | 399,800 | | | | 1,458,270 | |
Legal & General Group plc (Financials, Insurance) | | | | | | | | | | | 288,300 | | | | 971,245 | |
Lloyds Banking Group plc (Financials, Banks) † | | | | | | | | | | | 1,986,600 | | | | 943,373 | |
Marks & Spencer Group plc (Consumer Discretionary, Multiline Retail) | | | | | | | | | | | 580,700 | | | | 973,507 | |
Marston’s plc (Consumer Discretionary, Hotels, Restaurants & Leisure) | | | | | | | | | | | 660,700 | | | | 535,974 | |
Mitchells & Butlers plc (Consumer Discretionary, Hotels, Restaurants & Leisure) † | | | | | | | | | | | 235,200 | | | | 661,605 | |
Paragon Group of Companies plc (Financials, Thrifts & Mortgage Finance) | | | | | | | | | | | 121,500 | | | | 653,742 | |
Petrofac Limited (Energy, Energy Equipment & Services) † | | | | | | | | | | | 242,000 | | | | 494,419 | |
Premier Foods plc (Consumer Staples, Food Products) † | | | | | | | | | | | 73,926 | | | | 87,122 | |
QinetiQ Group plc (Industrials, Aerospace & Defense) | | | | | | | | | | | 238,400 | | | | 932,493 | |
Redrow plc (Consumer Discretionary, Household Durables) † | | | | | | | | | | | 143,800 | | | | 995,918 | |
Royal Dutch Shell plc Class B (Energy, Oil, Gas & Consumable Fuels) | | | | | | | | | | | 90,200 | | | | 1,484,127 | |
Tate & Lyle plc (Consumer Staples, Food Products) | | | | | | | | | | | 119,000 | | | | 1,011,837 | |
Tesco plc (Consumer Staples, Food & Staples Retailing) | | | | | | | | | | | 620,500 | | | | 1,877,789 | |
| | | | |
| | | | | | | | | | | | | | | 40,539,614 | |
| | | | | | | | | | | | | | | | |
| |
Total Common Stocks (Cost $275,221,250) | | | | 287,609,336 | |
| | | | | |
| | | | |
| | | | | | | | | | | | | | | | |
| | | Dividend
yield | | | | | | | | | | |
| Preferred Stocks: 0.24% | |
|
| Brazil: 0.24% | |
Banco do Estado do Rio Grande do Sul SA Class B (Financials, Banks) | | | 1.49 | % | | | | | | | 286,600 | | | | 706,149 | |
| | | | | | | | | | | | | | | | |
| |
Total Preferred Stocks (Cost $1,078,867) | | | | 706,149 | |
| | | | | |
| | | | |
| | | | | | | | | | | | | | | | |
| | | | | | Expiration
date | | | | | | | |
| Rights: 0.02% | |
|
| Spain: 0.02% | |
Banco Santander SA † | | | | | | | 11-30-2020 | | | | 311,800 | | | | 38,941 | |
| | | | | | | | | | | | | | | | |
| |
Total Rights (Cost $61,803) | | | | 38,941 | |
| | | | | |
| | | | |
| | | | | | | | | | | | | | | | |
| | | Yield | | | | | | | | | | |
| Short-Term Investments: 1.16% | |
|
| Investment Companies: 1.16% | |
Securities Lending Cash Investments LLC (l)(r)(u) | | | 0.12 | | | | | | | | 3,430,730 | | | | 3,430,730 | |
| | | | | | | | | | | | | | | | |
| |
Total Short-Term Investments (Cost $3,430,730) | | | | 3,430,730 | |
| | | | | |
| | | | | | | | |
| Total investments in securities (Cost $279,792,650) | | | 98.90 | % | | | 291,785,156 | |
| | |
Other assets and liabilities, net | | | 1.10 | | | | 3,259,526 | |
| | | | | | | | |
| Total net assets | | | 100.00 | % | | $ | 295,044,682 | |
| | | | | | | | |
The accompanying notes are an integral part of these financial statements.
Wells Fargo International Value Portfolio | 27
Portfolio of investments—November 30, 2020 (unaudited)
| † | Non-income-earning security |
| « | All or a portion of this security is on loan. |
| 144A | The security may be resold in transactions exempt from registration, normally to qualified institutional buyers, pursuant to Rule 144A under the Securities Act of 1933. |
| (a) | The security is fair valued in accordance with procedures approved by the Board of Trustees. |
| (l) | The issuer of the security is an affiliated person of the Portfolio as defined in the Investment Company Act of 1940. |
| (r) | The investment is a non-registered investment company purchased with cash collateral received from securities on loan. |
| (u) | The rate represents the 7-day annualized yield at period end. |
Abbreviations:
| ADR | American depositary receipt |
| REIT | Real estate investment trust |
Investments in Affiliates
An affiliated investment is an investment in which the Portfolio owns at least 5% of the outstanding voting shares of the issuer or as a result of other relationships, such as the Portfolio and the issuer having the same adviser or investment manager. Transactions with issuers that were either affiliated persons of the Portfolio at the beginning of the period or the end of the period were as follows:
| | | | | | | | | | | | | | | | | | | | | | | | | | | | | | | | | | | | |
| | | Value,
beginning of
period | | | Purchases | | | Sales
proceeds | | | Net
realized
gains
(losses) | | | Net
change in
unrealized
gains
(losses) | | | Value,
end of
priod | | | % of
net
assets | | | Shares,
end of
period | | | Income
from
affiliated
securities | |
| | | | | | | | | |
| Short-Term Investments | | | | | | | | | | | | | | | | | | | | | | | | | | | |
Investment Companies | | | | | | | | | | | | | | | | | | | | | | | | | | | | | | | | | | | | |
Securities Lending Cash Investments LLC | | $ | 0 | | | $ | 18,400,601 | | | $ | (14,969,871 | ) | | $ | 0 | | | $ | 0 | | | $ | 3,430,730 | | | | | | | | 3,430,730 | | | $ | 920 | # |
Wells Fargo Government Money Market Fund Select Class* | | | 3,130,999 | | | | 58,018,344 | | | | (61,149,343 | ) | | | 0 | | | | 0 | | | | 0 | | | | | | | | 0 | | | | 1,174 | |
| | | | | | | | | | | | | | | | | | | | | | | | | | | | | | | | | | | | |
| | | | | | | | | | | | | | $ | 0 | | | $ | 0 | | | $ | 3,430,730 | | | | 1.16 | % | | | | | | $ | 2,094 | |
| | | | | | | | | | | | | | | | | | | | | | | | | | | | | | | | | | | | |
| # | Amount shown represents income before fees and rebates. |
| * | No longer held at the end of the period |
The accompanying notes are an integral part of these financial statements.
28 | Wells Fargo International Value Portfolio
Statement of assets and liabilities—November 30, 2020 (unaudited)
| | | | |
| | | | |
| |
Assets | | | | |
Investments in unaffiliated securities (including $3,228,044 of securities loaned), at value (cost $276,361,920) | | $ | 288,354,426 | |
Investments in affiliated securities, at value (cost $3,430,730) | | | 3,430,730 | |
Foreign currency, at value (cost $3,527,045) | | | 3,546,417 | |
Receivable for dividends | | | 3,771,735 | |
Receivable for securities lending income, net | | | 5,784 | |
Prepaid expenses and other assets | | | 133,812 | |
| | | | |
Total assets | | | 299,242,904 | |
| | | | |
| |
Liabilities | | | | |
Payable upon receipt of securities loaned | | | 3,430,730 | |
Payable for investments purchased | | | 195,824 | |
Overdraft due to custodian bank | | | 408,536 | |
Advisory fee payable | | | 163,132 | |
| | | | |
Total liabilities | | | 4,198,222 | |
| | | | |
Total net assets | | $ | 295,044,682 | |
| | | | |
The accompanying notes are an integral part of these financial statements.
Wells Fargo International Value Portfolio | 29
Statement of operations—six months ended November 30, 2020 (unaudited)
| | | | |
| | | | |
| |
Investment income | | | | |
Dividends (net of foreign withholding taxes of $574,404) | | $ | 4,614,385 | |
Income from affiliated securities | | | 39,537 | |
| | | | |
Total investment income | | | 4,653,922 | |
| | | | |
| |
Expenses | | | | |
Advisory fee | | | 1,328,794 | |
Custody and accounting fees | | | 127,554 | |
Professional fees | | | 25,159 | |
Shareholder report expenses | | | 6,579 | |
Trustees’ fees and expenses | | | 9,582 | |
Interest expense | | | 3,991 | |
Other fees and expenses | | | 33,606 | |
| | | | |
Total expenses | | | 1,535,265 | |
Less: Fee waivers and/or expense reimbursements | | | (149,688 | ) |
| | | | |
Net expenses | | | 1,385,577 | |
| | | | |
Net investment income | | | 3,268,345 | |
| | | | |
| |
Realized and unrealized gains (losses) on investments | | | | |
Net realized losses on investments | | | (87,439,262 | ) |
Net change in unrealized gains (losses) on investments | | | 158,611,991 | |
| | | | |
Net realized and unrealized gains (losses) on investments | | | 71,172,729 | |
| | | | |
Net increase in net assets resulting from operations | | $ | 74,441,074 | |
| | | | |
The accompanying notes are an integral part of these financial statements.
30 | Wells Fargo International Value Portfolio
Statement of changes in net assets
| | | | | | | | |
| | | Six months ended
November 30, 2020 (unaudited) | | | Year ended
May 31, 2020 | |
| | |
Operations | | | | | | | | |
Net investment income | | $ | 3,268,345 | | | $ | 23,667,773 | |
Net realized losses on investments | | | (87,439,262 | ) | | | (20,032,340 | ) |
Net change in unrealized gains (losses) on investments | | | 158,611,991 | | | | (56,686,314 | ) |
| | | | |
Net increase (decrease) in net assets resulting from operations | | | 74,441,074 | | | | (53,050,881 | ) |
| | | | |
| | |
Capital transactions | | | | | | | | |
Transactions in investors’ beneficial interests | | | | | | | | |
Contributions | | | 147,712,104 | | | | 111,076,835 | |
Withdrawals | | | (717,301,675 | ) | | | (336,573,528 | ) |
| | | | |
Net decrease in net assets resulting from capital transactions | | | (569,589,571 | ) | | | (225,496,693 | ) |
| | | | |
Total decrease in net assets | | | (495,148,497 | ) | | | (278,547,574 | ) |
| | | | |
| | |
Net assets | | | | | | | | |
Beginning of period | | | 790,193,179 | | | | 1,068,740,753 | |
| | | | |
End of period | | $ | 295,044,682 | | | $ | 790,193,179 | |
| | | | |
The accompanying notes are an integral part of these financial statements.
Wells Fargo International Value Portfolio | 31
Financial highlights
| | | | | | | | | | | | | | | | | | | | | | | | |
| | | Six months ended
November 30, 2020
(unaudited) | | | Year ended May 31 | |
| | | 2020 | | | 2019 | | | 2018 | | | 2017 | | | 2016 | |
Total return1 | | | 18.31 | % | | | (8.99 | )% | | | (10.98 | )% | | | 7.74 | % | | | 19.16 | % | | | (11.85 | )% |
Ratios to average net assets (annualized) | | | | | | | | | | | | | | | | | | | | | | | | |
Gross expenses | | | 0.92 | % | | | 0.80 | % | | | 0.80 | % | | | 0.82 | % | | | 0.87 | % | | | 0.91 | % |
Net expenses | | | 0.83 | % | | | 0.80 | % | | | 0.80 | % | | | 0.82 | % | | | 0.87 | % | | | 0.91 | % |
Net investment income | | | 1.96 | % | | | 2.28 | % | | | 3.53 | % | | | 2.65 | % | | | 3.03 | % | | | 2.50 | % |
Supplemental data | | | | | | | | | | | | | | | | | | | | | | | | |
Portfolio turnover rate | | | 2 | % | | | 20 | % | | | 13 | % | | | 15 | % | | | 41 | % | | | 14 | % |
| 1 | Returns for periods of less than one year are not annualized |
The accompanying notes are an integral part of these financial statements.
32 | Wells Fargo International Value Portfolio
Notes to financial statements (unaudited)
1. ORGANIZATION
Wells Fargo Master Trust (the “Trust”), a Delaware statutory trust organized on March 10, 1999, is an open-end management investment company registered under the Investment Company Act of 1940, as amended (the “1940 Act”). As an investment company, the Trust follows the accounting and reporting guidance in Financial Accounting Standards Board (“FASB”) Accounting Standards Codification Topic 946, Financial Services – Investment Companies. These financial statements report on the Wells Fargo International Value Portfolio (the “Portfolio”) which is a diversified series of the Trust.
2. SIGNIFICANT ACCOUNTING POLICIES
The following significant accounting policies, which are consistently followed in the preparation of the financial statements of the Portfolio, are in conformity with U.S. generally accepted accounting principles which require management to make estimates and assumptions that affect the reported amounts of assets and liabilities, disclosure of contingent assets and liabilities at the date of the financial statements, and the reported amounts of revenues and expenses during the reporting period. Actual results could differ from those estimates.
Securities valuation
All investments are valued each business day as of the close of regular trading on the New York Stock Exchange (generally 4 p.m. Eastern Time), although the Portfolio may deviate from this calculation time under unusual or unexpected circumstances.
Equity securities that are listed on a foreign or domestic exchange or market are valued at the official closing price or, if none, the last sales price. If no sale occurs on the principal exchange or market that day, a fair value price will be determined in accordance with the Portfolio’s Valuation Procedures.
The values of securities denominated in foreign currencies are translated into U.S. dollars at rates provided by an independent foreign currency pricing source at a time each business day specified by the Wells Fargo Asset Management Pricing Committee at Wells Fargo Funds Management, LLC (“Funds Management”).
Many securities markets and exchanges outside the U.S. close prior to the close of the New York Stock Exchange and therefore may not fully reflect trading or events that occur after the close of the principal exchange in which the foreign securities are traded, but before the close of the New York Stock Exchange. If such trading or events are expected to materially affect the value of such securities, then fair value pricing procedures approved by the Board of Trustees of the Portfolio are applied. These procedures take into account multiple factors including movements in U.S. securities markets after foreign exchanges close. Foreign securities that are fair valued under these procedures are categorized as Level 2 and the application of these procedures may result in transfers between Level 1 and Level 2. Depending on market activity, such fair valuations may be frequent. Such fair value pricing may result in net asset values that are higher or lower than net asset values based on the last reported sales price or latest quoted bid price. On November 30, 2020, such fair value pricing was used in pricing certain foreign securities.
Investments in registered open-end investment companies are valued at net asset value. Interests in non-registered investment companies that are redeemable at net asset value are fair valued normally at net asset value.
Investments which are not valued using any of the methods discussed above are valued at their fair value, as determined in good faith by the Board of Trustees. The Board of Trustees has established a Valuation Committee comprised of the Trustees and has delegated to it the authority to take any actions regarding the valuation of portfolio securities that the Valuation Committee deems necessary or appropriate, including determining the fair value of portfolio securities, unless the determination has been delegated to the Wells Fargo Asset Management Pricing Committee at. The Board of Trustees retains the authority to make or ratify any valuation decisions or approve any changes to the Valuation Procedures as it deems appropriate. On a quarterly basis, the Board of Trustees receives reports on any valuation actions taken by the Valuation Committee or the Wells Fargo Asset Management Pricing Committee which may include items for ratification.
Foreign currency translation
The accounting records of the Portfolio are maintained in U.S. dollars. The values of other assets and liabilities denominated in foreign currencies are translated into U.S. dollars at rates provided by an independent foreign currency pricing source at a time each business day specified by the Wells Fargo Asset Management Pricing Committee. Purchases and sales of securities, and income and expenses are converted at the rate of exchange on the respective dates of such transactions. Net realized foreign exchange gains or losses arise from sales of foreign currencies, currency gains or losses realized between the trade and settlement dates on securities transactions, and the difference between the amounts of dividends, interest and foreign withholding taxes recorded and the U.S. dollar equivalent of the amounts actually paid or received. Net unrealized foreign exchange gains and losses arise from changes in the fair value of assets and liabilities other than investments in securities resulting from changes in exchange rates. The changes in net assets arising from changes in exchange rates of securities and the changes in net assets resulting from changes in market prices of securities are not separately presented. Such changes are included in net realized and unrealized gains or losses from investments.
Wells Fargo International Value Portfolio | 33
Notes to financial statements (unaudited)
Securities lending
The Portfolio may lend its securities from time to time in order to earn additional income in the form of fees or interest on securities received as collateral or the investment of any cash received as collateral. When securities are on loan, the Portfolio receives interest or dividends on those securities. Cash collateral received in connection with its securities lending transactions is invested in Securities Lending Cash Investments, LLC (the “Securities Lending Fund”). Investments in Securities Lending Fund are valued at the evaluated bid price provided by an independent pricing service. Income earned from investment in the Securities Lending Fund (net of fees and rebates), if any, is included in income from affiliated securities on the Statement of Operations.
In a securities lending transaction, the net asset value of the Portfolio is affected by an increase or decrease in the value of the securities loaned and by an increase or decrease in the value of the instrument in which collateral is invested. The amount of securities lending activity undertaken by the Portfolio fluctuates from time to time. The Portfolio has the right under the lending agreement to recover the securities from the borrower on demand. In the event of default or bankruptcy by the borrower, the Portfolio may be prevented from recovering the loaned securities or gaining access to the collateral or may experience delays or costs in doing so. In such an event, the terms of the agreement allow the unaffiliated securities lending agent to use the collateral to purchase replacement securities on behalf of the Portfolio or pay the Portfolio the market value of the loaned securities. The Portfolio bears the risk of loss with respect to depreciation of its investment of the cash collateral.
Security transactions and income recognition
Securities transactions are recorded on a trade date basis. Realized gains or losses are recorded on the basis of identified cost.
Dividend income is recognized on the ex-dividend date, except for certain dividends from foreign securities, which are recorded as soon as the custodian verifies the ex-dividend date. Dividend income from foreign securities is recorded net of foreign taxes withheld where recovery of such taxes is not assured.
Federal and other taxes
The Portfolio is treated as a separate entity for federal income tax purposes. The Portfolio is not required to pay federal income taxes on its net investment income and net capital gains as it is treated as a partnership for federal income tax purposes. All dividends, gains and losses of the Portfolio are deemed to have been “passed through” to the interest holders in proportion to their holdings of the Portfolio regardless of whether dividends and gains have been distributed by the Portfolio.
The Portfolio’s income tax returns and all financial records supporting those returns for the prior three fiscal years are subject to examination by the federal revenue authority. Management has analyzed the Portfolio’s tax positions taken on federal, state, and foreign tax returns for all open tax years and does not believe that there are any uncertain tax positions that require recognition of a tax liability.
As of November 30, 2020, the aggregate cost of all investments for federal income tax purposes was $280,764,694 and the unrealized gains (losses) consisted of:
| | | | |
| |
Gross unrealized gains | | $ | 51,851,249 | |
| |
Gross unrealized losses | | | (40,830,787 | ) |
| |
Net unrealized gains | | $ | 11,020,460 | |
3. FAIR VALUATION MEASUREMENTS
Fair value measurements of investments are determined within a framework that has established a fair value hierarchy based upon the various data inputs utilized in determining the value of the Portfolio’s investments. The three-level hierarchy gives the highest priority to unadjusted quoted prices in active markets for identical assets or liabilities (Level 1) and the lowest priority to unobservable inputs (Level 3). The Portfolio’s investments are classified within the fair value hierarchy based on the lowest level of input that is significant to the fair value measurement. The inputs are summarized into three broad levels as follows:
| ∎ | | Level 1 – quoted prices in active markets for identical securities |
| ∎ | | Level 2 – other significant observable inputs (including quoted prices for similar securities, interest rates, prepayment speeds, credit risk, etc.) |
| ∎ | | Level 3 – significant unobservable inputs (including the Portfolio’s own assumptions in determining the fair value of investments) |
The inputs or methodologies used for valuing investments in securities are not necessarily an indication of the risk associated with investing in those securities.
34 | Wells Fargo International Value Portfolio
Notes to financial statements (unaudited)
The following is a summary of the inputs used in valuing the Portfolio’s assets and liabilities as of November 30, 2020:
| | | | | | | | | | | | | | | | |
| | | | |
| | | Quoted prices
(Level 1) | | | Other significant observable inputs (Level 2) | | | Significant unobservable inputs (Level 3) | | | Total | |
| | | |
Assets | | | | | | | | | | | | |
Investments in: | | | | | | | | | | | | |
| | | |
Common stocks | | | | | | | | | | | | |
| | | | |
Australia | | $ | 16,369,938 | | | $ | 0 | | | $ | 0 | | | $ | 16,369,938 | |
| | | | |
Austria | | | 2,178,782 | | | | 0 | | | | 0 | | | | 2,178,782 | |
| | | | |
Belgium | | | 2,304,079 | | | | 0 | | | | 0 | | | | 2,304,079 | |
| | | | |
Brazil | | | 2,249,180 | | | | 0 | | | | 0 | | | | 2,249,180 | |
| | | | |
Canada | | | 2,855,025 | | | | 0 | | | | 0 | | | | 2,855,025 | |
| | | | |
China | | | 6,729,342 | | | | 0 | | | | 0 | | | | 6,729,342 | |
| | | | |
Denmark | | | 4,052,023 | | | | 0 | | | | 0 | | | | 4,052,023 | |
| | | | |
Finland | | | 983,266 | | | | 0 | | | | 0 | | | | 983,266 | |
| | | | |
France | | | 29,208,435 | | | | 0 | | | | 0 | | | | 29,208,435 | |
| | | | |
Germany | | | 24,745,196 | | | | 0 | | | | 0 | | | | 24,745,196 | |
| | | | |
Hong Kong | | | 8,798,938 | | | | 0 | | | | 0 | | | | 8,798,938 | |
| | | | |
India | | | 0 | | | | 1,885,291 | | | | 0 | | | | 1,885,291 | |
| | | | |
Ireland | | | 3,010,773 | | | | 0 | | | | 0 | | | | 3,010,773 | |
| | | | |
Israel | | | 807,763 | | | | 0 | | | | 0 | | | | 807,763 | |
| | | | |
Italy | | | 6,666,554 | | | | 0 | | | | 0 | | | | 6,666,554 | |
| | | | |
Japan | | | 65,167,786 | | | | 0 | | | | 0 | | | | 65,167,786 | |
| | | | |
Netherlands | | | 11,093,539 | | | | 0 | | | | 0 | | | | 11,093,539 | |
| | | | |
Norway | | | 2,583,089 | | | | 0 | | | | 0 | | | | 2,583,089 | |
| | | | |
Poland | | | 854,937 | | | | 0 | | | | 0 | | | | 854,937 | |
| | | | |
Russia | | | 1,869,271 | | | | 0 | | | | 0 | | | | 1,869,271 | |
| | | | |
Singapore | | | 2,103,740 | | | | 0 | | | | 0 | | | | 2,103,740 | |
| | | | |
South Africa | | | 901,596 | | | | 0 | | | | 0 | | | | 901,596 | |
| | | | |
South Korea | | | 5,739,997 | | | | 0 | | | | 0 | | | | 5,739,997 | |
| | | | |
Spain | | | 4,425,120 | | | | 0 | | | | 0 | | | | 4,425,120 | |
| | | | |
Sweden | | | 7,141,388 | | | | 0 | | | | 0 | | | | 7,141,388 | |
| | | | |
Switzerland | | | 24,642,850 | | | | 0 | | | | 0 | | | | 24,642,850 | |
| | | | |
Taiwan | | | 4,292,485 | | | | 0 | | | | 0 | | | | 4,292,485 | |
| | | | |
Thailand | | | 2,535,898 | | | | 0 | | | | 0 | | | | 2,535,898 | |
| | | | |
Turkey | | | 873,441 | | | | 0 | | | | 0 | | | | 873,441 | |
| | | | |
United Kingdom | | | 37,988,764 | | | | 2,550,850 | | | | 0 | | | | 40,539,614 | |
| | | |
Preferred stocks | | | | | | | | | | | | |
| | | | |
Brazil | | | 706,149 | | | | 0 | | | | 0 | | | | 706,149 | |
| | | |
Right | | | | | | | | | | | | |
| | | | |
Spain | | | 0 | | | | 38,941 | | | | 0 | | | | 38,941 | |
| | | | |
Short-term investments | | | | | | | | | | | | | | | | |
| | | | |
Investment companies | | | 3,430,730 | | | | 0 | | | | 0 | | | | 3,430,730 | |
| | | | |
Total assets | | $ | 287,310,074 | | | $ | 4,475,082 | | | $ | 0 | | | $ | 291,785,156 | |
Additional sector, industry or geographic detail is included in the Portfolio of Investments.
For the six months ended November 30, 2020, the Portfolio did not have any transfers into/out of Level 3.
Wells Fargo International Value Portfolio | 35
Notes to financial statements (unaudited)
4. TRANSACTIONS WITH AFFILIATES AND OTHER EXPENSES
Advisory fee
The Trust has entered into an advisory contract with Funds Management, an indirect wholly owned subsidiary of Wells Fargo & Company (“Wells Fargo”). The adviser is responsible for implementing investment policies and guidelines and for supervising the subadviser, who is responsible for day-to-day portfolio management of the Portfolio. Pursuant to the contract, Funds Management is entitled to receive an advisory fee at the following annual rate based on the Portfolio’s average daily net assets:
| | | | |
| |
| Average daily net assets | | Advisory fee | |
| |
First $500 million | | | 0.800 | % |
| |
Next $500 million | | | 0.750 | |
| |
Next $1 billion | | | 0.700 | |
| |
Next $2 billion | | | 0.675 | |
| |
Over $4 billion | | | 0.650 | |
For the six months ended November 30, 2020, the advisory fee was equivalent to an annual rate of 0.80% of the Portfolio’s average daily net assets.
Funds Management has retained the services of a subadviser to provide daily portfolio management to the Portfolio. The fee for subadvisory services is borne by Funds Management. LSV Asset Management, which is not an affiliate of the Funds Management, is the subadviser to the Portfolio and is entitled to receive a fee from Funds Management at an annual rate starting at 0.35% and declining to 0.30% as the average daily net assets of the Portfolio increase.
Funds Management has voluntarily waived and/or reimbursed advisory fees to reduce the net operating expense ratio of the Portfolio.
Interfund transactions
The Portfolio may purchase or sell portfolio investment securities to certain other Wells Fargo affiliates pursuant to Rule 17a-7 under the 1940 Act and under procedures adopted by the Board of Trustees. The procedures have been designed to ensure that these interfund transactions, which do not incur broker commissions, are effected at current market prices.
5. INVESTMENT PORTFOLIO TRANSACTIONS
Purchases and sales of investments, excluding U.S. government obligations (if any) and short-term securities, for the six months ended November 30, 2020 were $8,780,097 and $561,822,318, respectively.
6. SECURITIES LENDING TRANSACTIONS
The Portfolio lends its securities through an unaffiliated securities lending agent and receives collateral in the form of cash or securities with a value at least equal to the value of the securities on loan. The value of the loaned securities is determined at the close of each business day and any increases or decreases in the required collateral are exchanged between the Portfolio and the counterparty on the next business day. Cash collateral received is invested in the Securities Lending Fund which seeks to provide a positive return compared to the daily Federal Funds Open Rate by investing in high-quality, U.S. dollar-denominated short-term money market instruments and is exempt from registration under Section 3(c)(7) of the 1940 Act. Securities Lending Fund is managed by Funds Management and is subadvised by Wells Capital Management Incorporated (“WellsCap”), an affiliate of Funds Management and an indirect wholly owned subsidiary of Wells Fargo. Funds Management receives an advisory fee starting at 0.05% and declining to 0.01% as the average daily net assets of the Securities Lending Fund increase. All of the fees received by Funds Management are paid to WellsCap for its services as subadviser.
In the event of counterparty default or the failure of a borrower to return a loaned security, the Portfolio has the right to use the collateral to offset any losses incurred. As of November 30, 2020, the Portfolio had securities lending transactions with the following counterparties which are subject to offset:
| | | | | | | | | | | | |
| | | |
| Counterparty | | Value of
securities on
loan | | | Collateral
received1 | | | Net amount | |
| | | |
Bank of America Securities Inc. | | $ | 799,634 | | | $ | (799,634 | ) | | $ | 0 | |
| | | |
Citigroup Global Markets Inc. | | | 934,340 | | | | (934,340 | ) | | | 0 | |
| | | |
UBS Securities LLC | | | 1,494,070 | | | | (1,494,070 | ) | | | 0 | |
| 1 | Collateral received within this table is limited to the collateral for the net transaction with the counterparty. |
36 | Wells Fargo International Value Portfolio
Notes to financial statements (unaudited)
7. BANK BORROWINGS
The Trust, along with Wells Fargo Variable Trust and Wells Fargo Funds Trust (excluding the money market funds), are parties to a $350,000,000 revolving credit agreement whereby the Portfolio is permitted to use bank borrowings for temporary or emergency purposes, such as to fund shareholder redemption requests. Interest under the credit agreement is charged to the Portfolio based on a borrowing rate equal to the higher of the Federal Funds rate in effect on that day plus 1.25% or the overnight LIBOR rate in effect on that day plus 1.25%. In addition, an annual commitment fee equal to 0.25% of the unused balance is allocated to each participating fund.
During the six months ended November 30, 2020, the Portfolio had average borrowings outstanding of $293,456 (on an annualized basis) at an average rate of 1.36% and paid interest in the amount of $3,991.
8. CONCENTRATION RISK
Concentration risks result from exposure to a limited number of geographic regions. As of the end of the period, the Portfolio concentrated its portfolio in investments in Europe. A fund that invests a substantial portion of its assets in any geographic region may be more affected by changes in that geographic region than would be a fund whose investments are not heavily weighted in any geographic region.
9. INDEMNIFICATION
Under the Portfolio’s organizational documents, the officers and Trustees have been granted certain indemnification rights against certain liabilities that may arise out of performance of their duties to the Portfolio. The Portfolio has entered into a separate agreement with each Trustee that converts indemnification rights currently existing under the Portfolio’s organizational documents into contractual rights that cannot be changed in the future without the consent of the Trustee. Additionally, in the normal course of business, the Portfolio may enter into contracts with service providers that contain a variety of indemnification clauses. The Portfolio’s maximum exposure under these arrangements is dependent on future claims that may be made against the Portfolio and, therefore, cannot be estimated.
10. NEW ACCOUNTING PRONOUNCEMENT
In August 2018, FASB issued Accounting Standards Update (“ASU”) No. 2018-13, Fair Value Measurement (Topic 820) Disclosure Framework—Changes to the Disclosure Requirements for Fair Value Measurement. ASU 2018-13 updates the disclosure requirements on fair value measurements in Topic 820, Fair Value Measurements. The amendments are effective for fiscal years, and interim periods within those fiscal years, beginning after December 15, 2019. Management has adopted this guidance which did not have a material impact on the financial statements.
11. CORONAVIRUS (COVID-19) PANDEMIC
On March 11, 2020, the World Health Organization announced that it had made the assessment that coronavirus disease 2019 (“COVID-19”) is a pandemic. The impacts of COVID-19 are adversely affecting the entire global economy, individual companies and investment products, and the market in general. There is significant uncertainty around the extent and duration of business disruptions related to COVID-19 and the impacts may be short term or may last for an extended period of time. The risk of further spreading of COVID-19 has led to significant uncertainty and volatility in the financial markets.
Wells Fargo International Value Portfolio | 37
Other information (unaudited)
TAX INFORMATION
Pursuant to Section 853 of the Internal Revenue Code, the following amounts have been designated as foreign taxes paid for the fiscal year ended May 31, 2020. These amounts may be less than the actual foreign taxes paid for financial statement purposes. Foreign taxes paid or withheld should be included in taxable income with an offsetting deduction from gross income or as a credit for taxes paid to foreign governments. None of the income was derived from ineligible foreign sources as defined under Section 901(j) of the Internal Revenue Code.
| | | | |
Creditable foreign taxes paid | | Per share amount | | Foreign income as % of ordinary income distributions |
| | |
| $2,008,417 | | $0.040753 | | 100% |
PROXY VOTING INFORMATION
A description of the policies and procedures used to determine how to vote proxies relating to portfolio securities is available, upon request, by calling 1-800-222-8222, visiting our website at wfam.com, or visiting the SEC website at sec.gov. Information regarding how the proxies related to portfolio securities were voted during the most recent 12-month period ended June 30 is available on the website at wfam.com or by visiting the SEC website at sec.gov.
QUARTERLY PORTFOLIO HOLDINGS INFORMATION
The Fund and Portfolio file their complete schedule of portfolio holdings with the SEC for the first and third quarters of each fiscal year as an exhibit to its reports on Form N-PORT. Shareholders may view the filed Form N-PORT by visiting the SEC website at sec.gov.
38 | Wells Fargo International Value Fund
Other information (unaudited)
BOARD OF TRUSTEES AND OFFICERS
Each of the Trustees and Officers1 listed in the table below acts in identical capacities for each fund in the Wells Fargo family of funds, which consists of 144 mutual funds comprising the Wells Fargo Funds Trust, Wells Fargo Variable Trust, Wells Fargo Master Trust and four closed-end funds (collectively the “Fund Complex”). This table should be read in conjunction with the Prospectus and the Statement of Additional Information2. The mailing address of each Trustee and Officer is 525 Market Street, 12th Floor, San Francisco, CA 94105. Each Trustee and Officer serves an indefinite term, however, each Trustee serves such term until reaching the mandatory retirement age established by the Trustees.
Independent Trustees
| | | | | | |
Name and year of birth | | Position held and
length of service* | | Principal occupations during past five years or longer | | Current other
public company or
investment
company
directorships |
| | | |
William R. Ebsworth
(Born 1957) | | Trustee, since 2015 | | Retired. From 1984 to 2013, equities analyst, portfolio manager, research director and chief investment officer at Fidelity Management and Research Company in Boston, Tokyo, and Hong Kong, and retired in 2013 as Chief Investment Officer of Fidelity Strategic Advisers, Inc. where he led a team of investment professionals managing client assets. Prior thereto, Board member of Hong Kong Securities Clearing Co., Hong Kong Options Clearing Corp., the Thailand International Fund, Ltd., Fidelity Investments Life Insurance Company, and Empire Fidelity Investments Life Insurance Company. Audit Committee Chair and Investment Committee Chair of the Vincent Memorial Hospital Endowment (non-profit organization). Mr. Ebsworth is a CFA® charterholder. | | N/A |
| | | |
Jane A. Freeman
(Born 1953) | | Trustee, since 2015; Chair Liaison, since 2018 | | Retired. From 2012 to 2014 and 1999 to 2008, Chief Financial Officer of Scientific Learning Corporation. From 2008 to 2012, Ms. Freeman provided consulting services related to strategic business projects. Prior to 1999, Portfolio Manager at Rockefeller & Co. and Scudder, Stevens & Clark. Board member of the Harding Loevner Funds from 1996 to 2014, serving as both Lead Independent Director and chair of the Audit Committee. Board member of the Russell Exchange Traded Funds Trust from 2011 to 2012 and the chair of the Audit Committee. Ms. Freeman is also an inactive Chartered Financial Analyst. | | N/A |
| | | |
Isaiah Harris, Jr.
(Born 1952) | | Trustee, since 2009; Audit Committee Chair, since 2019 | | Retired. Chairman of the Board of CIGNA Corporation since 2009, and Director since 2005. From 2003 to 2011, Director of Deluxe Corporation. Prior thereto, President and CEO of BellSouth Advertising and Publishing Corp. from 2005 to 2007, President and CEO of BellSouth Enterprises from 2004 to 2005 and President of BellSouth Consumer Services from 2000 to 2003. Emeritus member of the Iowa State University Foundation Board of Governors. Emeritus Member of the Advisory Board of Iowa State University School of Business. Advisory Board Member, Palm Harbor Academy (private school). Mr. Harris is a certified public accountant (inactive status). | | CIGNA Corporation |
| | | |
Judith M. Johnson
(Born 1949) | | Trustee, since 2008 | | Retired. Prior thereto, Chief Executive Officer and Chief Investment Officer of Minneapolis Employees Retirement Fund from 1996 to 2008. Ms. Johnson is an attorney, certified public accountant and a certified managerial accountant. | | N/A |
| | | |
David F. Larcker
(Born 1950) | | Trustee, since 2009 | | James Irvin Miller Professor of Accounting at the Graduate School of Business (Emeritus), Stanford University, Director of the Corporate Governance Research Initiative and Senior Faculty of The Rock Center for Corporate Governance since 2006. From 2005 to 2008, Professor of Accounting at the Graduate School of Business, Stanford University. Prior thereto, Ernst & Young Professor of Accounting at The Wharton School, University of Pennsylvania from 1985 to 2005. | | N/A |
Wells Fargo International Value Fund | 39
Other information (unaudited)
| | | | | | |
Name and year of birth | | Position held and
length of service* | | Principal occupations during past five years or longer | | Current other
public company or
investment
company
directorships |
| | | |
Olivia S. Mitchell
(Born 1953) | | Trustee, since 2006; Nominating and Governance Committee Chair, since 2018 | | International Foundation of Employee Benefit Plans Professor, Wharton School of the University of Pennsylvania since 1993. Director of Wharton’s Pension Research Council and Boettner Center on Pensions & Retirement Research, and Research Associate at the National Bureau of Economic Research. Previously, Cornell University Professor from 1978 to 1993. | | N/A |
| | | |
Timothy J. Penny
(Born 1951) | | Trustee, since 1996; Chair, since 2018 | | President and Chief Executive Officer of Southern Minnesota Initiative Foundation, a non-profit organization, since 2007. Member of the Board of Trustees of NorthStar Education Finance, Inc., a non-profit organization, since 2007. | | N/A |
| | | |
James G. Polisson
(Born 1959) | | Trustee, since 2018 | | Retired. Chief Marketing Officer, Source (ETF) UK Services, Ltd, from 2015 to 2017. From 2012 to 2015, Principal of The Polisson Group, LLC, a management consulting, corporate advisory and principal investing company. Chief Executive Officer and Managing Director at Russell Investments, Global Exchange Traded Funds from 2010 to 2012. Managing Director of Barclays Global Investors from 1998 to 2010 and Global Chief Marketing Officer for iShares and Barclays Global Investors from 2000 to 2010. Trustee of the San Francisco Mechanics’ Institute, a non-profit organization, from 2013 to 2015. Board member of the Russell Exchange Traded Fund Trust from 2011 to 2012. Director of Barclays Global Investors Holdings Deutschland GmbH from 2006 to 2009. Mr. Polisson is an attorney and has a retired status with the Massachusetts and District of Columbia Bar Associations. | | N/A |
| | | |
Pamela Wheelock
(Born 1959) | | Trustee, since January 2020; previously Trustee from January 2018 to July 2019 | | Board member of the Destination Medical Center Economic Development Agency, Rochester, Minnesota since 2019. Interim President of the McKnight Foundation from January to September 2020. Acting Commissioner, Minnesota Department of Human Services, July 2019 through September 2019. Human Services Manager (part-time), Minnesota Department of Human Services, October 2019 through December 2019. Chief Operating Officer, Twin Cities Habitat for Humanity from 2017 to 2019. Vice President of University Services, University of Minnesota from 2012 to 2016. Prior thereto, on the Board of Directors, Governance Committee and Finance Committee for the Minnesota Philanthropy Partners (Saint Paul Foundation) from 2012 to 2018, Interim Chief Executive Officer of Blue Cross Blue Shield of Minnesota from 2011 to 2012, Chairman of the Board from 2009 to 2012 and Board Director from 2003 to 2015. Vice President, Leadership and Community Engagement, Bush Foundation, Saint Paul, Minnesota (a private foundation) from 2009 to 2011. Executive Vice President and Chief Financial Officer, Minnesota Sports and Entertainment from 2004 to 2009 and Senior Vice President from 2002 to 2004. Executive Vice President of the Minnesota Wild Foundation from 2004 to 2008. Commissioner of Finance, State of Minnesota, from 1999 to 2002. Currently Board Chair of the Minnesota Wild Foundation since 2010. | | N/A |
| * | Length of service dates reflect the Trustee’s commencement of service with the Trust’s predecessor entities, where applicable. |
40 | Wells Fargo International Value Fund
Other information (unaudited)
Officers
| | | | |
Name and year of birth | | Position held and
length of service | | Principal occupations during past five years or longer |
| | |
Andrew Owen
(Born 1960) | | President, since 2017 | | Executive Vice President of Wells Fargo & Company and Head of Affiliated Managers, Wells Fargo Asset Management, since 2014. In addition, Mr. Owen is currently President, Chief Executive Officer and Director of Wells Fargo Funds Management, LLC since 2017. Prior thereto, Executive Vice President responsible for marketing, investments and product development for Wells Fargo Funds Management, LLC, from 2009 to 2014. |
| | |
Jeremy DePalma1
(Born 1974) | | Treasurer, since 2012 | | Senior Vice President of Wells Fargo Funds Management, LLC since 2009. Senior Vice President of Evergreen Investment Management Company, LLC from 2008 to 2010 and head of the Fund Reporting and Control Team within Fund Administration from 2005 to 2010. |
| | |
Michelle Rhee
(Born 1966) | | Chief Legal Officer, since 2019 | | Secretary of Wells Fargo Funds Management, LLC and Chief Legal Counsel of Wells Fargo Asset Management since 2018. Deputy General Counsel of Wells Fargo Bank, N.A. since 2020 and Assistant General Counsel of Wells Fargo Bank, N.A. from 2018 to 2020. Associate General Counsel and Managing Director of Bank of America Corporation from 2004 to 2018. |
| | |
Catherine Kennedy
(Born 1969) | | Secretary, since 2019 | | Vice President of Wells Fargo Funds Management, LLC and Senior Counsel of the Wells Fargo Legal Department since 2010. Vice President and Senior Counsel of Evergreen Investment Management Company, LLC from 1998 to 2010. |
| | |
Michael H. Whitaker
(Born 1967) | | Chief Compliance Officer, since 2016 | | Chief Compliance Officer of Wells Fargo Asset Management since 2016. Senior Vice President and Chief Compliance Officer for Fidelity Investments from 2007 to 2016. |
| 1 | Jeremy DePalma acts as Treasurer of 77 funds in the Fund Complex. |
| 2 | The Statement of Additional Information includes additional information about the Trustees and is available, without charge, upon request, by calling 1-800-222-8222 or by visiting the website at wfam.com. |
Wells Fargo International Value Fund | 41
This page is intentionally left blank.
This page is intentionally left blank.
This page is intentionally left blank.

For more information
More information about Wells Fargo Funds is available free upon request. To obtain literature, please write, visit the Fund’s website, or call:
Wells Fargo Funds
P.O. Box 219967
Kansas City, MO 64121-9967
Website: wfam.com
Individual investors: 1-800-222-8222
Retail investment professionals: 1-888-877-9275
Institutional investment professionals: 1-866-765-0778

This report and the financial statements contained herein are submitted for the general information of the shareholders of the Fund. If this report is used for promotional purposes, distribution of the report must be accompanied or preceded by a current prospectus. Before investing, please consider the investment objectives, risks, charges, and expenses of the investment. For a current prospectus and, if available, a summary prospectus, containing this information, call 1-800-222-8222 or visit the Fund’s website at wfam.com. Read the prospectus carefully before you invest or send money.
Wells Fargo Asset Management (WFAM) is the trade name for certain investment advisory/management firms owned by Wells Fargo & Company. These firms include but are not limited to Wells Capital Management Incorporated and Wells Fargo Funds Management, LLC. Certain products managed by WFAM entities are distributed by Wells Fargo Funds Distributor, LLC (a broker-dealer and Member FINRA).
This material is for general informational and educational purposes only and is NOT intended to provide investment advice or a recommendation of any kind—including a recommendation for any specific investment, strategy, or plan.
INVESTMENT PRODUCTS: NOT FDIC INSURED ◾ NO BANK GUARANTEE ◾ MAY LOSE VALUE
© 2021 Wells Fargo & Company. All rights reserved.
PAR-1220-00731 01-20
SA284/SAR284 11-20
Semi-Annual Report
November 30, 2020
Wells Fargo
Small Company Growth Fund
|
|
|
Reduce clutter. Save trees. |
Sign up for
electronic delivery
of prospectuses
and
shareholder
reports at
wellsfargo.com/
advantagedelivery |
The views expressed and any forward-looking statements are as of November 30, 2020, unless otherwise noted, and are those of the Fund’s portfolio managers and/or Wells Fargo Asset Management. Discussions of individual securities, or the markets generally, or any Wells Fargo Fund are not intended as individual recommendations. Future events or results may vary significantly from those expressed in any forward-looking statements. The views expressed are subject to change at any time in response to changing circumstances in the market. Wells Fargo Asset Management and the Fund disclaim any obligation to publicly update or revise any views expressed or forward-looking statements.
INVESTMENT PRODUCTS: NOT FDIC INSURED ◾ NO BANK GUARANTEE ◾ MAY LOSE VALUE
Wells Fargo Small Company Growth Fund | 1
Letter to shareholders (unaudited)

Andrew Owen
President
Wells Fargo Funds
“Global stock markets rallied strongly, driven by aggressive stimulus measures introduced by central banks and governments in response to challenges presented by the COVID-19 pandemic.”
Dear Shareholder:
We are pleased to offer you this semi-annual report for the Wells Fargo Small Company Growth Fund for the six-month period that ended November 30, 2020. Global stock markets rallied strongly, driven by aggressive stimulus measures introduced by central banks and governments in response to challenges presented by the COVID-19 pandemic. Emerging market equities had particularly robust results during the six-month period. Among bonds, high-yield issues led the way while U.S. bonds generally had more modest returns than their international counterparts.
For the period, U.S. stocks, based on the S&P 500 Index,1 returned 19.98% and international stocks, as measured by the MSCI ACWI ex USA Index (Net),2 gained 23.28%. The MSCI EM Index (Net)3 rallied 31.14%. Among bond investments, the Bloomberg Barclays U.S. Aggregate Bond Index4 returned a modest 1.79%, the Bloomberg Barclays Global Aggregate ex-USD Index5 gained a robust 8.19%, the Bloomberg Barclays Municipal Bond Index6 had a 3.29% return, and the ICE BofA U.S. High Yield Index7 gained a healthy 10.47%.
Equities enjoyed a strong tailwind from monetary and fiscal stimulus.
Financial markets posted widely positive returns in June despite ongoing economic weakness and uncertainty regarding COVID-19 and the timing of an effective vaccine. As economies reopened, optimism rose. Vitally important to market sentiment was the ongoing global central bank commitment to provide economic support through liquidity and low borrowing costs. U.S. economic activity was boosted by one-time $1,200 stimulus checks and $600 weekly bonus unemployment benefits for tens of millions of Americans through July. However, jobless rates remained historically high, easing somewhat from 14.7% in April to 11.1% in June. By late June, numerous states reported increases of COVID-19 cases, an ominous sign. China’s economic recovery picked up momentum in June.
July was broadly positive for both global equities and fixed income. However, economic data and a resurgence of COVID-19 cases pointed to the vulnerability of the global economy and the need to regain control of the pandemic. Second-quarter gross domestic product (GDP) shrank from the previous quarter by 9.5% and 12.1% in the U.S. and the eurozone, respectively. In contrast, China reported 3.2% year-over-year second-quarter GDP growth. U.S. unemployment remained high despite adding 1.8 million jobs in July, as a double-digit jobless rate persisted. However, manufacturing activity grew in both the U.S. and the eurozone. In Asia, while China’s manufacturing sector continued to expand, activity in Japan and South Korea contracted. A rising concern was the rapid and broad reemergence of COVID-19 infections.
| 1 | The S&P 500 Index consists of 500 stocks chosen for market size, liquidity, and industry group representation. It is a market-value-weighted index with each stock’s weight in the index proportionate to its market value. You cannot invest directly in an index. |
| 2 | The Morgan Stanley Capital International (MSCI) All Country World Index (ACWI) ex USA Index (Net) is a free-float-adjusted market-capitalization-weighted index that is designed to measure the equity market performance of developed and emerging markets, excluding the United States. Source: MSCI. MSCI makes no express or implied warranties or representations and shall have no liability whatsoever with respect to any MSCI data contained herein. The MSCI data may not be further redistributed or used as a basis for other indices or any securities or financial products. This report is not approved, reviewed, or produced by MSCI. You cannot invest directly in an index. |
| 3 | The MSCI Emerging Markets (EM) Index (Net) is a free-float-adjusted market-capitalization-weighted index that is designed to measure equity market performance of emerging markets. You cannot invest directly in an index. |
| 4 | The Bloomberg Barclays U.S. Aggregate Bond Index is a broad-based benchmark that measures the investment-grade, U.S. dollar-denominated, fixed-rate taxable bond market, including Treasuries, government-related and corporate securities, mortgage-backed securities (agency fixed-rate and hybrid adjustable-rate mortgage pass-throughs), asset-backed securities, and commercial mortgage-backed securities. You cannot invest directly in an index. |
| 5 | The Bloomberg Barclays Global Aggregate ex-USD Index is an unmanaged index that provides a broad-based measure of the global investment-grade fixed-income markets excluding the U.S. dollar-denominated debt market. You cannot invest directly in an index. |
| 6 | The Bloomberg Barclays Municipal Bond Index is an unmanaged index composed of long-term tax-exempt bonds with a minimum credit rating of Baa. You cannot invest directly in an index. |
| 7 | The ICE BofA U.S. High Yield Index is a market-capitalization-weighted index of domestic and Yankee high-yield bonds. The index tracks the performance of high-yield securities traded in the U.S. bond market. You cannot invest directly in an index. Copyright 2021. ICE Data Indices, LLC. All rights reserved. |
2 | Wells Fargo Small Company Growth Fund
Letter to shareholders (unaudited)
The stock market continued to rally in August despite concerns over rising COVID-19 cases in the U.S. and Europe, as well as expiration of the $600 weekly bonus unemployment benefit in July. Generally stronger-than-expected second-quarter earnings boosted investor sentiment along with the Federal Reserve’s announcement of a more accommodative policy shift that could lead to longer-term low interest rates. U.S. indices measuring manufacturing and services activities beat expectations while the U.S. housing market maintained strength. In Europe, retail sales expanded and consumer confidence was steady. China’s economy continued to expand.
Stocks grew more volatile in September on mixed economic data. U.S. economic activity continued to grow. However, only half of the 22 million jobs lost since the early spring had returned. The U.S. unemployment rate fell to 7.9% in September, a measurable improvement but far higher than the 3.5% pre-COVID-19 rate. Only 661,000 jobs were added for the month, down from 1.5 million in August. With the U.S. Congress failing to pass further fiscal relief and uncertainties surrounding a possible vaccine, doubts crept back into the markets. In the U.K., a lack of progress in Brexit talks with the European Union weighed on markets. China’s economy picked up steam, however, with growth fueled by increased global demand.
In October, capital markets took a step back from their six-month rally. Market volatility rose in advance of the U.S. election and amid a global increase in COVID-19 infections. Europe responded with more economic restrictions. Meanwhile, Brexit remained unresolved. U.S. markets looked favorably at a possible Democratic sweep and control of the federal purse strings in anticipation of additional fiscal stimulus, which could boost economic activity. Meanwhile, China continued to stand apart, reporting 4.9% third-quarter GDP growth year over year.
Global stocks rallied broadly in November, propelled by optimism over three promising COVID-19 vaccines, which reported high effectiveness in trials. Global stock indices notched double-digit monthly gains. In a reversal of recent trends, value stocks outperformed growth and cyclical stocks outpaced technology stocks. However, U.S. unemployment remained elevated, with a net job loss of 10 million since February. The Eurozone Services Purchasing Managers’ Index, a monthly survey of purchasing managers, contracted sharply while the region’s manufacturing activity gauge indicated growth. The U.S. election results added to the market’s upbeat mood as investors gave thumbs-up to the certainty of the outcome after an unusual delay and anticipated more consistent policies in the new administration.
Don’t let short-term uncertainty derail long-term investment goals.
Periods of investment uncertainty can present challenges, but experience has taught us that maintaining long-term investment goals can be an effective way to plan for the future. To help you create a sound strategy based on your personal goals and risk tolerance, Wells Fargo Funds offers more than 100 mutual funds spanning a wide range of asset classes and investment styles. Although diversification cannot guarantee an investment profit or prevent losses, we believe it can be an effective way to manage investment risk and potentially smooth out overall portfolio performance. We encourage investors to know their investments and to understand that appropriate levels of risk-taking may unlock opportunities.
Thank you for choosing to invest with Wells Fargo Funds. We appreciate your confidence in us and remain committed to helping you meet your financial needs.
Sincerely,

Andrew Owen
President
Wells Fargo Funds
“Global stocks rallied broadly in November, propelled by optimism over three promising COVID-19 vaccines, which reported high effectiveness in trials.”
|
|
|
For further information about your Fund, contact your investment professional, visit our website at wfam.com, or call us directly at 1-800-222-8222. |
Wells Fargo Small Company Growth Fund | 3
Letter to shareholders (unaudited)
Notice to Shareholders
At a meeting held on August 10-12, 2020, the Board of Trustees of the Fund approved a change to the Fund’s automatic conversion feature for Class C shares in order to shorten the required holding period from 10 to 8 years. As a result, on a monthly basis beginning November 5, 2020, Class C shares will convert automatically into Class A shares 8 years after the initial date of purchase or, if you acquired your Class C shares through an exchange or conversion from another share class, 8 years after the date you acquired your Class C shares. When Class C shares that you acquired through a purchase or exchange convert, any other Class C shares that you purchased with reinvested dividends and distributions also will convert into Class A shares on a pro rata basis.
Please note that a shorter holding period may apply depending on your intermediary. Please see “Appendix A—Sales Charge Reductions and Waivers for Certain Intermediaries” in the Fund’s prospectus for further information.
4 | Wells Fargo Small Company Growth Fund
This page is intentionally left blank.
Performance highlights (unaudited)
Investment objective
The Fund seeks long-term capital appreciation.
Manager
Wells Fargo Funds Management, LLC
Subadviser for the affiliated master portfolio1
Peregrine Capital Management, LLC
Portfolio managers
William A. Grierson, CFA®‡
Daniel J. Hagen, CFA®‡
Paul E. von Kuster, CFA®‡
Average annual total returns (%) as of November 30, 2020
| | | | | | | | | | | | | | | | | | | | | | | | | | | | | | | | | | |
| | | | |
| | | | | Including sales charge | | | Excluding sales charge | | | Expense ratios2 (%) | |
| | | | | | | | | |
| | | Inception date | | 1 year | | | 5 year | | | 10 year | | | 1 year | | | 5 year | | | 10 year | | | Gross | | | Net3 | |
| | | | | | | | | | |
| Class A (WFSAX) | | 1-30-2004 | | | 12.42 | | | | 10.37 | | | | 12.23 | | | | 19.28 | | | | 11.69 | | | | 12.90 | | | | 1.33 | | | | 1.29 | |
| | | | | | | | | | |
| Class C (WSMCX) | | 1-30-2004 | | | 17.49 | | | | 10.88 | | | | 12.07 | | | | 18.49 | | | | 10.88 | | | | 12.07 | | | | 2.08 | | | | 2.04 | |
| | | | | | | | | | |
| Class R6 (WSCRX)4 | | 10-31-2014 | | | – | | | | – | | | | – | | | | 19.77 | | | | 12.18 | | | | 13.41 | | | | 0.90 | | | | 0.86 | |
| | | | | | | | | | |
| Administrator Class (NVSCX) | | 11-11-1994 | | | – | | | | – | | | | ��� | | | | 19.39 | | | | 11.83 | | | | 13.10 | | | | 1.25 | | | | 1.19 | |
| | | | | | | | | | |
| Institutional Class (WSCGX) | | 3-31-2008 | | | – | | | | – | | | | – | | | | 19.70 | | | | 12.10 | | | | 13.37 | | | | 1.00 | | | | 0.94 | |
| | | | | | | | | | |
| Russell 2000® Growth Index5 | | – | | | – | | | | – | | | | – | | | | 25.95 | | | | 13.19 | | | | 13.30 | | | | – | | | | – | |
Figures quoted represent past performance, which is no guarantee of future results, and do not reflect taxes that a shareholder may pay on an investment in a fund. Investment return and principal value of an investment will fluctuate so that an investor’s shares, when redeemed, may be worth more or less than their original cost. Performance shown without sales charges would be lower if sales charges were reflected. Current performance may be lower or higher than the performance data quoted, which assumes the reinvestment of dividends and capital gains. Current month-end performance is available on the Fund’s website, wfam.com.
Please keep in mind that high double-digit returns were primarily achieved during favorable market conditions. You should not expect that such favorable returns can be consistently achieved. A fund’s performance, especially for short time periods, should not be the sole factor in making your investment decision.
Index returns do not include transaction costs associated with buying and selling securities, any mutual fund fees or expenses, or any taxes. It is not possible to invest directly in an index.
For Class A shares, the maximum front-end sales charge is 5.75%. For Class C shares, the maximum contingent deferred sales charge is 1.00%. Performance including a contingent deferred sales charge assumes the sales charge for the corresponding time period. Class R6, Administrator Class, and Institutional Class shares are sold without a front-end sales charge or contingent deferred sales charge.
Stock values fluctuate in response to the activities of individual companies and general market and economic conditions. Smaller-company stocks tend to be more volatile and less liquid than those of larger companies. Certain investment strategies tend to increase the total risk of an investment (relative to the broader market). The Fund is exposed to foreign investment risk. Consult the Fund’s prospectus for additional information on these and other risks.
Please see footnotes on page 7.
6 | Wells Fargo Small Company Growth Fund
Performance highlights (unaudited)
| | | | |
|
| Ten largest holdings (%) as of November 30, 20206 | |
| | |
PTC Incorporated | | | 1.71 | |
| | |
Syneos Health Incorporated | | | 1.60 | |
| | |
SS&C Technologies Holdings Incorporated | | | 1.54 | |
| | |
Nuance Communications Incorporated | | | 1.51 | |
| | |
RealPage Incorporated | | | 1.45 | |
| | |
Black Knight Incorporated | | | 1.43 | |
| | |
ASGN Incorporated | | | 1.38 | |
| | |
Ciena Corporation | | | 1.32 | |
| | |
Goosehead Insurance Incorporated Class A | | | 1.31 | |
| | |
ICON plc ADR | | | 1.29 | |
|
|
| Sector allocation as of November 30, 20207 |
|
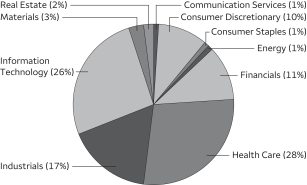 |
| ‡ | CFA® and Chartered Financial Analyst® are trademarks owned by CFA Institute. |
| 1 | The Fund is a feeder fund in a master-feeder structure that invests substantially all of its assets in a single affiliated master portfolio of the Wells Fargo Master Trust with a substantially identical investment objective and substantially similar investment strategies. References to the investment activities of the Fund are intended to refer to the investment activities of the affiliated master portfolio in which it invests. |
| 2 | Reflects the expense ratios as stated in the most recent prospectuses, which include the impact of 0.01% in acquired fund fees and expenses. The expense ratios shown are subject to change and may differ from the annualized expense ratios shown in the financial highlights of this report, which do not include acquired fund fees and expenses. |
| 3 | The manager has contractually committed through September 30, 2021, to waive fees and/or reimburse expenses to the extent necessary to cap total annual fund operating expenses after fee waivers at 1.29% for Class A, 2.04% for Class C, 0.86% for Class R6, 1.19% for Administrator Class, and 0.94% for Institutional Class. Brokerage commissions, stamp duty fees, interest, taxes, acquired fund fees and expenses (if any) from funds in which the affiliated master portfolios invest and from money market funds, and extraordinary expenses are excluded from the expense caps. Net expenses from the affiliated master portfolio are included in the expense caps. Prior to or after the commitment expiration date, the caps may be increased or the commitment to maintain the caps may be terminated only with the approval of the Board of Trustees. Without these caps, the Fund’s returns would have been lower. The expense ratio paid by an investor is the net expense ratio (the total annual fund operating expenses after fee waivers) as stated in the prospectuses. |
| 4 | Historical performance shown for the Class R6 shares prior to their inception reflects the performance of the Institutional Class shares, and includes the higher expenses applicable to the Institutional Class shares. If these expenses had not been included, returns for the Class R6 shares would be higher. |
| 5 | The Russell 2000® Growth Index measures the performance of those Russell 2000 companies with higher price/book ratios and higher forecasted growth values. You cannot invest directly in an index. |
| 6 | Each holding represents the Fund’s allocable portion of the affiliated master portfolio security. Figures represent each holding as a percentage of the Fund’s net assets. Holdings are subject to change and may have changed since the date specified. |
| 7 | Figures represent the sector allocation of the affiliated master portfolio as a percentage of the long-term investments of the affiliated master portfolio. These amounts are subject to change and may have changed since the date specified. |
Wells Fargo Small Company Growth Fund | 7
Fund expenses (unaudited)
As a shareholder of the Fund, you incur two types of costs: (1) transaction costs, including sales charges (loads) on purchase payments and contingent deferred sales charges (if any) on redemptions and (2) ongoing costs, including management fees, distribution (12b-1) and/or shareholder servicing fees, and other Fund expenses. This example is intended to help you understand your ongoing costs (in dollars) of investing in the Fund and to compare these costs with the ongoing costs of investing in other mutual funds.
The example is based on an investment of $1,000 invested at the beginning of the six-month period and held for the entire period from June 1, 2020 to November 30, 2020.
Actual expenses
The “Actual” line of the table below provides information about actual account values and actual expenses. You may use the information in this line, together with the amount you invested, to estimate the expenses that you paid over the period. Simply divide your account value by $1,000 (for example, an $8,600 account value divided by $1,000 = 8.6), then multiply the result by the number in the “Actual” line under the heading entitled “Expenses paid during period” for your applicable class of shares to estimate the expenses you paid on your account during this period.
Hypothetical example for comparison purposes
The “Hypothetical” line of the table below provides information about hypothetical account values and hypothetical expenses based on the Fund’s actual expense ratio and an assumed rate of return of 5% per year before expenses, which is not the Fund’s actual return. The hypothetical account values and expenses may not be used to estimate the actual ending account balance or expenses you paid for the period. You may use this information to compare the ongoing costs of investing in the Fund and other funds. To do so, compare this 5% hypothetical example with the 5% hypothetical examples that appear in the shareholder reports of the other funds.
Please note that the expenses shown in the table are meant to highlight your ongoing costs only and do not reflect any transactional costs, such as sales charges (loads) and contingent deferred sales charges. Therefore, the “Hypothetical” line of the table is useful in comparing ongoing costs only and will not help you determine the relative total costs of owning different funds. In addition, if these transactional costs were included, your costs would have been higher.
| | | | | | | | | | | | | | | | |
| | | Beginning
account value
6-1-2020 | | | Ending
account value
11-30-2020 | | | Expenses
paid during
the period1,2 | | | Annualized net
expense ratio1 | |
| | | | | |
Class A | | | | | | | | | | | | | | | | |
| | | | |
Actual | | $ | 1,000.00 | | | $ | 1,285.07 | | | $ | 7.39 | | | | 1.29 | % |
| | | | |
Hypothetical (5% return before expenses) | | $ | 1,000.00 | | | $ | 1,018.60 | | | $ | 6.53 | | | | 1.29 | % |
| | | | | |
Class C | | | | | | | | | | | | | | | | |
| | | | |
Actual | | $ | 1,000.00 | | | $ | 1,281.38 | | | $ | 11.67 | | | | 2.04 | % |
| | | | |
Hypothetical (5% return before expenses) | | $ | 1,000.00 | | | $ | 1,014.84 | | | $ | 10.30 | | | | 2.04 | % |
| | | | | |
Class R6 | | | | | | | | | | | | | | | | |
| | | | |
Actual | | $ | 1,000.00 | | | $ | 1,287.91 | | | $ | 4.93 | | | | 0.86 | % |
| | | | |
Hypothetical (5% return before expenses) | | $ | 1,000.00 | | | $ | 1,020.76 | | | $ | 4.36 | | | | 0.86 | % |
| | | | | |
Administrator Class | | | | | | | | | | | | | | | | |
| | | | |
Actual | | $ | 1,000.00 | | | $ | 1,285.66 | | | $ | 6.82 | | | | 1.19 | % |
| | | | |
Hypothetical (5% return before expenses) | | $ | 1,000.00 | | | $ | 1,019.10 | | | $ | 6.02 | | | | 1.19 | % |
| | | | | |
Institutional Class | | | | | | | | | | | | | | | | |
| | | | |
Actual | | $ | 1,000.00 | | | $ | 1,287.30 | | | $ | 5.39 | | | | 0.94 | % |
| | | | |
Hypothetical (5% return before expenses) | | $ | 1,000.00 | | | $ | 1,020.36 | | | $ | 4.76 | | | | 0.94 | % |
| 1 | Amounts reflect net expenses allocated from the affiliated Master Portfolio in which the Fund invests. |
| 2 | Expenses paid is equal to the annualized net expense ratio of each class multiplied by the average account value over the period, multiplied by the number of days in the most recent fiscal half-year divided by the number of days in the fiscal year (to reflect the one-half-year period). |
8 | Wells Fargo Small Company Growth Fund
Portfolio of investments—November 30, 2020 (unaudited)
| | | | | | | | | | | | | | | | |
| | | | | | | | | | | | Value | |
| Investment Companies: 100.05% | |
|
| Affiliated Master Portfolio: 100.05% | |
Wells Fargo Small Company Growth Portfolio | | | | | | | | | | | $ | 1,424,192,122 | |
| | | | | | | | | | | | | | | | |
| | | | |
Total Investment Companies (Cost $956,274,423) | | | | | | | | | | | | | | | 1,424,192,122 | |
| | | | | | | | | | | | | | | | |
| | | | | | | | |
| Total investments in securities (Cost $956,274,423) | | | 100.05 | % | | | 1,424,192,122 | |
| | |
Other assets and liabilities, net | | | (0.05 | ) | | | (709,670 | ) |
| | | | | | | | |
| Total net assets | | | 100.00 | % | | $ | 1,423,482,452 | |
| | | | | | | | |
Investments in Affiliates
Transactions with the affiliated Master Portfolio were as follows:
| | | | | | | | | | | | | | | | | | | | | | | | | | | | | | | | |
| | | % of
ownership,
beginning
of period | | | % of
ownership,
end of
period | | | Net
realized
gains
(losses) on
securities
transactions
allocated
from
affiliated
Master
Portfolio | | | Net
change in
unrealized
gains
(losses) on
securities
transactions
allocated
from
affiliated
Master
Portfolio | | | Dividends
allocated
from
affiliated
Master
Portfolio | | | Affiliated
income
allocated
from
affiliated
Master
Portfolio | | | Value,
end of
period | | | % of
net
assets | |
Wells Fargo Small Company Growth Portfolio | | | 98 | % | | | 98 | % | | $ | 168,746,288 | | | $ | 180,810,304 | | | $ | 3,989,948 | | | $ | 41,770 | | | $ | 1,424,192,122 | | | | 100.05 | % |
The accompanying notes are an integral part of these financial statements.
Wells Fargo Small Company Growth Fund | 9
Statement of assets and liabilities—November 30, 2020 (unaudited)
| | | | |
| | | | |
| |
Assets | | | | |
Investments in affiliated Master Portfolio, at value (cost $956,274,423) | | $ | 1,424,192,122 | |
Receivable for Fund shares sold | | | 1,553,449 | |
Prepaid expenses and other assets | | | 664 | |
| | | | |
Total assets | | | 1,425,746,235 | |
| | | | |
| |
Liabilities | | | | |
Payable for Fund shares redeemed | | | 1,777,296 | |
Management fee payable | | | 136,987 | |
Administration fees payable | | | 116,447 | |
Distribution fee payable | | | 5,676 | |
Shareholder report expenses payable | | | 148,467 | |
Trustees’ fees and expenses payable | | | 1,057 | |
Accrued expenses and other liabilities | | | 77,853 | |
| | | | |
Total liabilities | | | 2,263,783 | |
| | | | |
Total net assets | | $ | 1,423,482,452 | |
| | | | |
| |
Net assets consist of | | | | |
Paid-in capital | | $ | 762,227,907 | |
Total distributable earnings | | | 661,254,545 | |
| | | | |
Total net assets | | $ | 1,423,482,452 | |
| | | | |
| |
Computation of net asset value and offering price per share | | | | |
Net assets – Class A | | $ | 39,810,415 | |
Shares outstanding – Class A1 | | | 664,553 | |
Net asset value per share – Class A | | | $59.91 | |
Maximum offering price per share – Class A2 | | | $63.56 | |
Net assets – Class C | | $ | 9,323,304 | |
Shares outstanding – Class C1 | | | 182,622 | |
Net asset value per share – Class C | | | $51.05 | |
Net assets – Class R6 | | $ | 431,303,903 | |
Shares outstanding – Class R61 | | | 6,613,317 | |
Net asset value per share – Class R6 | | | $65.22 | |
Net assets – Administrator Class | | $ | 58,485,512 | |
Shares outstanding – Administrator Class1 | | | 930,809 | |
Net asset value per share – Administrator Class | | | $62.83 | |
Net assets – Institutional Class | | $ | 884,559,318 | |
Shares outstanding – Institutional Class1 | | | 13,615,527 | |
Net asset value per share – Institutional Class | | | $64.97 | |
| 1 | The Fund has an unlimited number of authorized shares. |
| 2 | Maximum offering price is computed as 100/94.25 of net asset value. On investments of $50,000 or more, the offering price is reduced. |
The accompanying notes are an integral part of these financial statements.
10 | Wells Fargo Small Company Growth Fund
Statement of operations—six months ended November 30, 2020 (unaudited)
| | | | |
| | | | |
| |
Investment income | | | | |
Dividends allocated from affiliated Master Portfolio | | $ | 3,989,948 | |
Affiliated income allocated from affiliated Master Portfolio | | | 41,770 | |
Expenses allocated from affiliated Master Portfolio | | | (5,436,002 | ) |
| | | | |
Total investment income | | | (1,404,284 | ) |
| | | | |
| |
Expenses | | | | |
Management fee | | | 343,111 | |
Administration fees | | | | |
Class A | | | 38,415 | |
Class C | | | 9,826 | |
Class R6 | | | 67,140 | |
Administrator Class | | | 37,592 | |
Institutional Class | | | 533,693 | |
Shareholder servicing fees | | | | |
Class A | | | 45,485 | |
Class C | | | 11,647 | |
Administrator Class | | | 71,978 | |
Distribution fee | | | | |
Class C | | | 34,871 | |
Custody and accounting fees | | | 33,191 | |
Professional fees | | | 16,543 | |
Registration fees | | | 77,596 | |
Shareholder report expenses | | | 86,081 | |
Trustees’ fees and expenses | | | 11,029 | |
Other fees and expenses | | | 31,590 | |
| | | | |
Total expenses | | | 1,449,788 | |
Less: Fee waivers and/or expense reimbursements | | | | |
Fund-level | | | (271,199 | ) |
Class A | | | (1,824 | ) |
Class C | | | (4 | ) |
Class R6 | | | (22,319 | ) |
Administrator Class | | | (8,651 | ) |
Institutional Class | | | (122,823 | ) |
| | | | |
Net expenses | | | 1,022,968 | |
| | | | |
Net investment loss | | | (2,427,252 | ) |
| | | | |
| |
Realized and unrealized gains (losses) on investments | | | | |
Net realized gains on securities transactions allocated from affiliated Master Portfolio | | | 168,746,288 | |
Net change in unrealized gains (losses) on securities transactions allocated from affiliated Master Portfolio | | | 180,810,304 | |
| | | | |
Net realized and unrealized gains (losses) on investments | | | 349,556,592 | |
| | | | |
Net increase in net assets resulting from operations | | $ | 347,129,340 | |
| | | | |
The accompanying notes are an integral part of these financial statements.
Wells Fargo Small Company Growth Fund | 11
Statement of changes in net assets
| | | | | | | | | | | | | | | | |
| | | Six months ended
November 30, 2020
(unaudited) | | | Year ended
May 31, 2020 | |
| |
Operations | | | | | |
Net investment loss | | | | | | $ | (2,427,252 | ) | | | | | | $ | (5,409,448 | ) |
Net realized gains on investments | | | | | | | 168,746,288 | | | | | | | | 107,501,645 | |
Net change in unrealized gains (losses) on investments | | | | | | | 180,810,304 | | | | | | | | (28,564,804 | ) |
| | | | |
Net increase in net assets resulting from operations | | | | | | | 347,129,340 | | | | | | | | 73,527,393 | |
| | | | |
| | | | |
Distributions to shareholders from net investment income and net realized gains | | | | | | | | | | | | | | | | |
Class A | | | | | | | 0 | | | | | | | | (4,577,702 | ) |
Class C | | | | | | | 0 | | | | | | | | (1,219,067 | ) |
Class R6 | | | | | | | 0 | | | | | | | | (43,043,975 | ) |
Administrator Class | | | | | | | 0 | | | | | | | | (6,401,809 | ) |
Institutional Class | | | | | | | 0 | | | | | | | | (80,415,302 | ) |
| | | | |
Total distributions to shareholders | | | | | | | 0 | | | | | | | | (135,657,855 | ) |
| | | | |
| | | | |
Capital share transactions | | | Shares | | | | | | | | Shares | | | | | |
Proceeds from shares sold | |
Class A | | | 88,948 | | | | 4,770,527 | | | | 188,284 | | | | 8,973,220 | |
Class C | | | 3,526 | | | | 159,075 | | | | 5,111 | | | | 206,315 | |
Class R6 | | | 488,912 | | | | 27,962,896 | | | | 1,859,972 | | | | 92,450,593 | |
Administrator Class | | | 61,938 | | | | 3,405,888 | | | | 170,705 | | | | 8,517,203 | |
Institutional Class | | | 1,158,606 | | | | 64,880,118 | | | | 4,127,985 | | | | 204,967,976 | |
| | | | |
| | | | | | | 101,178,504 | | | | | | | | 315,115,307 | |
| | | | |
Reinvestment of distributions | |
Class A | | | 0 | | | | 0 | | | | 79,105 | | | | 3,985,289 | |
Class C | | | 0 | | | | 0 | | | | 24,921 | | | | 1,076,603 | |
Class R6 | | | 0 | | | | 0 | | | | 698,418 | | | | 38,147,601 | |
Administrator Class | | | 0 | | | | 0 | | | | 121,124 | | | | 6,394,121 | |
Institutional Class | | | 0 | | | | 0 | | | | 1,085,956 | | | | 59,130,286 | |
| | | | |
| | | | | | | 0 | | | | | | | | 108,733,900 | |
| | | | |
Payment for shares redeemed | |
Class A | | | (208,087 | ) | | | (10,752,769 | ) | | | (793,982 | ) | | | (38,317,325 | ) |
Class C | | | (55,257 | ) | | | (2,482,933 | ) | | | (122,441 | ) | | | (5,026,553 | ) |
Class R6 | | | (2,999,288 | ) | | | (170,803,951 | ) | | | (4,156,884 | ) | | | (211,307,944 | ) |
Administrator Class | | | (275,291 | ) | | | (15,413,669 | ) | | | (866,918 | ) | | | (42,999,639 | ) |
Institutional Class | | | (3,267,512 | ) | | | (182,790,352 | ) | | | (9,445,990 | ) | | | (485,047,988 | ) |
| | | | |
| | | | | | | (382,243,674 | ) | | | | | | | (782,699,449 | ) |
| | | | |
Net decrease in net assets resulting from capital share transactions | | | | | | | (281,065,170 | ) | | | | | | | (358,850,242 | ) |
| | | | |
Total increase (decrease) in net assets | | | | | | | 66,064,170 | | | | | | | | (420,980,704 | ) |
| | | | |
| | |
Net assets | | | | | | | | |
Beginning of period | | | | | | | 1,357,418,282 | | | | | | | | 1,778,398,986 | |
| | | | |
End of period | | | | | | $ | 1,423,482,452 | | | | | | | $ | 1,357,418,282 | |
| | | | |
The accompanying notes are an integral part of these financial statements.
12 | Wells Fargo Small Company Growth Fund
Financial highlights
(For a share outstanding throughout each period)
| | | | | | | | | | | | | | | | | | | | | | | | |
| | | Six months ended
November 30, 2020
(unaudited) | | | Year ended May 31 | |
| CLASS A | | 2020 | | | 2019 | | | 2018 | | | 2017 | | | 2016 | |
Net asset value, beginning of period | | | $46.62 | | | | $48.98 | | | | $56.66 | | | | $44.26 | | | | $37.69 | | | | $44.23 | |
Net investment loss | | | (0.18 | )1 | | | (0.34 | )1 | | | (0.36 | ) | | | (0.35 | )1 | | | (0.28 | )1 | | | (0.22 | )1 |
Net realized and unrealized gains (losses) on investments | | | 13.47 | | | | 2.49 | | | | (3.22 | ) | | | 12.75 | | | | 6.85 | | | | (6.05 | ) |
| | | | | | | | | | | | | | | | | | | | | | | | |
Total from investment operations | | | 13.29 | | | | 2.15 | | | | (3.58 | ) | | | 12.40 | | | | 6.57 | | | | (6.27 | ) |
Distributions to shareholders from | | | | | | | | | | | | | | | | | | | | | | | | |
Net realized gains | | | 0.00 | | | | (4.51 | ) | | | (4.10 | ) | | | 0.00 | | | | 0.00 | | | | (0.27 | ) |
Net asset value, end of period | | | $59.91 | | | | $46.62 | | | | $48.98 | | | | $56.66 | | | | $44.26 | | | | $37.69 | |
Total return2 | | | 28.51 | % | | | 3.70 | % | | | (6.13 | )% | | | 28.02 | % | | | 17.43 | % | | | (14.20 | )% |
Ratios to average net assets (annualized) | | | | | | | | | | | | | | | | | | | | | | | | |
Gross expenses3 | | | 1.34 | % | | | 1.32 | % | | | 1.31 | % | | | 1.32 | % | | | 1.33 | % | | | 1.34 | % |
Net expenses3 | | | 1.29 | % | | | 1.32 | % | | | 1.31 | % | | | 1.32 | % | | | 1.33 | % | | | 1.34 | % |
Net investment loss3 | | | (0.69 | )% | | | (0.69 | )% | | | (0.63 | )% | | | (0.71 | )% | | | (0.68 | )% | | | (0.57 | )% |
Supplemental data | | | | | | | | | | | | | | | | | | | | | | | | |
Portfolio turnover rate4 | | | 22 | % | | | 41 | % | | | 54 | % | | | 37 | % | | | 82 | % | | | 49 | % |
Net assets, end of period (000s omitted) | | | $39,810 | | | | $36,534 | | | | $64,182 | | | | $76,065 | | | | $76,087 | | | | $128,675 | |
| 1 | Calculated based upon average shares outstanding |
| 2 | Total return calculations do not include any sales charges. Returns for periods of less than one year are not annualized. |
| 3 | Ratios include net expenses allocated from the affiliated Master Portfolio which were as follows: |
| | | | |
Six months ended November 30, 2020 (unaudited) | | | 0.79 | % |
Year ended May 31, 2020 | | | 0.78 | % |
Year ended May 31, 2019 | | | 0.78 | % |
Year ended May 31, 2018 | | | 0.78 | % |
Year ended May 31, 2017 | | | 0.78 | % |
Year ended May 31, 2016 | | | 0.80 | % |
| 4 | Portfolio turnover rate is calculated by multiplying the affiliated Master Portfolio’s percentage of the Fund’s total investments in securities at the end of the period by the affiliated Master Portfolio’s portfolio turnover rate. |
The accompanying notes are an integral part of these financial statements.
Wells Fargo Small Company Growth Fund | 13
Financial highlights
(For a share outstanding throughout each period)
| | | | | | | | | | | | | | | | | | | | | | | | |
| | | Six months ended
November 30, 2020
(unaudited) | | | Year ended May 31 | |
| CLASS C | | 2020 | | | 2019 | | | 2018 | | | 2017 | | | 2016 | |
Net asset value, beginning of period | | | $39.84 | | | | $42.75 | | | | $50.38 | | | | $39.65 | | | | $34.02 | | | | $40.25 | |
Net investment loss | | | (0.32 | )1 | | | (0.61 | )1 | | | (0.66 | )1 | | | (0.64 | )1 | | | (0.54 | )1 | | | (0.46 | )1 |
Net realized and unrealized gains (losses) on investments | | | 11.53 | | | | 2.21 | | | | (2.87 | ) | | | 11.37 | | | | 6.17 | | | | (5.50 | ) |
| | | | | | | | | | | | | | | | | | | | | | | | |
Total from investment operations | | | 11.21 | | | | 1.60 | | | | (3.53 | ) | | | 10.73 | | | | 5.63 | | | | (5.96 | ) |
Distributions to shareholders from | | | | | | | | | | | | | | | | | | | | | | | | |
Net realized gains | | | 0.00 | | | | (4.51 | ) | | | (4.10 | ) | | | 0.00 | | | | 0.00 | | | | (0.27 | ) |
Net asset value, end of period | | | $51.05 | | | | $39.84 | | | | $42.75 | | | | $50.38 | | | | $39.65 | | | | $34.02 | |
Total return2 | | | 28.14 | % | | | 2.92 | % | | | (6.82 | )% | | | 27.06 | % | | | 16.55 | % | | | (14.84 | )% |
Ratios to average net assets (annualized) | | | | | | | | | | | | | | | | | | | | | | | | |
Gross expenses3 | | | 2.08 | % | | | 2.07 | % | | | 2.06 | % | | | 2.07 | % | | | 2.08 | % | | | 2.09 | % |
Net expenses3 | | | 2.04 | % | | | 2.07 | % | | | 2.06 | % | | | 2.07 | % | | | 2.08 | % | | | 2.09 | % |
Net investment loss3 | | | (1.46 | )% | | | (1.44 | )% | | | (1.38 | )% | | | (1.47 | )% | | | (1.43 | )% | | | (1.32 | )% |
Supplemental data | | | | | | | | | | | | | | | | | | | | | | | | |
Portfolio turnover rate4 | | | 22 | % | | | 41 | % | | | 54 | % | | | 37 | % | | | 82 | % | | | 49 | % |
Net assets, end of period (000s omitted) | | | $9,323 | | | | $9,336 | | | | $13,968 | | | | $19,979 | | | | $22,410 | | | | $26,946 | |
| 1 | Calculated based upon average shares outstanding |
| 2 | Total return calculations do not include any sales charges. Returns for periods of less than one year are not annualized. |
| 3 | Ratios include net expenses allocated from the affiliated Master Portfolio which were as follows: |
| | | | |
Six months ended November 30, 2020 (unaudited) | | | 0.79 | % |
Year ended May 31, 2020 | | | 0.78 | % |
Year ended May 31, 2019 | | | 0.78 | % |
Year ended May 31, 2018 | | | 0.78 | % |
Year ended May 31, 2017 | | | 0.78 | % |
Year ended May 31, 2016 | | | 0.80 | % |
| 4 | Portfolio turnover rate is calculated by multiplying the affiliated Master Portfolio’s percentage of the Fund’s total investments in securities at the end of the period by the affiliated Master Portfolio’s portfolio turnover rate. |
The accompanying notes are an integral part of these financial statements.
14 | Wells Fargo Small Company Growth Fund
Financial highlights
(For a share outstanding throughout each period)
| | | | | | | | | | | | | | | | | | | | | | | | |
| | | Six months ended
November 30, 2020
(unaudited) | | | Year ended May 31 | |
| CLASS R6 | | 2020 | | | 2019 | | | 2018 | | | 2017 | | | 2016 | |
Net asset value, beginning of period | | | $50.64 | | | | $52.65 | | | | $60.31 | | | | $46.91 | | | | $39.77 | | | | $46.45 | |
Net investment loss | | | (0.08 | ) | | | (0.14 | )1 | | | (0.12 | ) | | | (0.14 | ) | | | (0.11 | ) | | | (0.03 | ) |
Net realized and unrealized gains (losses) on investments | | | 14.66 | | | | 2.64 | | | | (3.44 | ) | | | 13.54 | | | | 7.25 | | | | (6.38 | ) |
| | | | | | | | | | | | | | | | | | | | | | | | |
Total from investment operations | | | 14.58 | | | | 2.50 | | | | (3.56 | ) | | | 13.40 | | | | 7.14 | | | | (6.41 | ) |
Distributions to shareholders from | | | | | | | | | | | | | | | | | | | | | | | | |
Net realized gains | | | 0.00 | | | | (4.51 | ) | | | (4.10 | ) | | | 0.00 | | | | 0.00 | | | | (0.27 | ) |
Net asset value, end of period | | | $65.22 | | | | $50.64 | | | | $52.65 | | | | $60.31 | | | | $46.91 | | | | $39.77 | |
Total return2 | | | 28.79 | % | | | 4.12 | % | | | (5.73 | )% | | | 28.59 | % | | | 17.95 | % | | | (13.83 | )% |
Ratios to average net assets (annualized) | | | | | | | | | | | | | | | | | | | | | | | | |
Gross expenses3 | | | 0.91 | % | | | 0.90 | % | | | 0.88 | % | | | 0.89 | % | | | 0.90 | % | | | 0.91 | % |
Net expenses3 | | | 0.86 | % | | | 0.89 | % | | | 0.88 | % | | | 0.89 | % | | | 0.90 | % | | | 0.90 | % |
Net investment loss3 | | | (0.28 | )% | | | (0.27 | )% | | | (0.20 | )% | | | (0.29 | )% | | | (0.25 | )% | | | (0.09 | )% |
Supplemental data | | | | | | | | | | | | | | | | | | | | | | | | |
Portfolio turnover rate4 | | | 22 | % | | | 41 | % | | | 54 | % | | | 37 | % | | | 82 | % | | | 49 | % |
Net assets, end of period (000s omitted) | | | $431,304 | | | | $462,050 | | | | $564,516 | | | | $618,523 | | | | $418,111 | | | | $229,391 | |
| 1 | Calculated based upon average shares outstanding |
| 2 | Returns for periods of less than one year are not annualized. |
| 3 | Ratios include net expenses allocated from the affiliated Master Portfolio which were as follows: |
| | | | |
Six months ended November 30, 2020 (unaudited) | | | 0.79 | % |
Year ended May 31, 2020 | | | 0.78 | % |
Year ended May 31, 2019 | | | 0.78 | % |
Year ended May 31, 2018 | | | 0.78 | % |
Year ended May 31, 2017 | | | 0.78 | % |
Year ended May 31, 2016 | | | 0.80 | % |
| 4 | Portfolio turnover rate is calculated by multiplying the affiliated Master Portfolio’s percentage of the Fund’s total investments in securities at the end of the period by the affiliated Master Portfolio’s portfolio turnover rate. |
The accompanying notes are an integral part of these financial statements.
Wells Fargo Small Company Growth Fund | 15
Financial highlights
(For a share outstanding throughout each period)
| | | | | | | | | | | | | | | | | | | | | | | | |
| | | Six months ended
November 30, 2020
(unaudited) | | | Year ended May 31 | |
| ADMINISTRATOR CLASS | | 2020 | | | 2019 | | | 2018 | | | 2017 | | | 2016 | |
Net asset value, beginning of period | | | $48.87 | | | | $51.10 | | | | $58.85 | | | | $45.91 | | | | $39.05 | | | | $45.73 | |
Net investment loss | | | (0.16 | )1 | | | (0.29 | )1 | | | (0.29 | )1 | | | (0.30 | )1 | | | (0.24 | )1 | | | (0.19 | )1 |
Net realized and unrealized gains (losses) on investments | | | 14.12 | | | | 2.57 | | | | (3.36 | ) | | | 13.24 | | | | 7.10 | | | | (6.22 | ) |
| | | | | | | | | | | | | | | | | | | | | | | | |
Total from investment operations | | | 13.96 | | | | 2.28 | | | | (3.65 | ) | | | 12.94 | | | | 6.86 | | | | (6.41 | ) |
Distributions to shareholders from | | | | | | | | | | | | | | | | | | | | | | | | |
Net realized gains | | | 0.00 | | | | (4.51 | ) | | | (4.10 | ) | | | 0.00 | | | | 0.00 | | | | (0.27 | ) |
Net asset value, end of period | | | $62.83 | | | | $48.87 | | | | $51.10 | | | | $58.85 | | | | $45.91 | | | | $39.05 | |
Total return2 | | | 28.57 | % | | | 3.80 | % | | | (6.02 | )% | | | 28.19 | % | | | 17.57 | % | | | (14.04 | )% |
Ratios to average net assets (annualized) | | | | | | | | | | | | | | | | | | | | | | | | |
Gross expenses3 | | | 1.26 | % | | | 1.24 | % | | | 1.23 | % | | | 1.24 | % | | | 1.25 | % | | | 1.25 | % |
Net expenses3 | | | 1.19 | % | | | 1.20 | % | | | 1.20 | % | | | 1.20 | % | | | 1.20 | % | | | 1.20 | % |
Net investment loss3 | | | (0.60 | )% | | | (0.57 | )% | | | (0.51 | )% | | | (0.60 | )% | | | (0.55 | )% | | | (0.46 | )% |
Supplemental data | | | | | | | | | | | | | | | | | | | | | | | | |
Portfolio turnover rate4 | | | 22 | % | | | 41 | % | | | 54 | % | | | 37 | % | | | 82 | % | | | 49 | % |
Net assets, end of period (000s omitted) | | | $58,486 | | | | $55,917 | | | | $87,850 | | | | $114,429 | | | | $130,311 | | | | $130,104 | |
| 1 | Calculated based upon average shares outstanding |
| 2 | Returns for periods of less than one year are not annualized. |
| 3 | Ratios include net expenses allocated from the affiliated Master Portfolio which were as follows: |
| | | | |
Six months ended November 30, 2020 (unaudited) | | | 0.79 | % |
Year ended May 31, 2020 | | | 0.78 | % |
Year ended May 31, 2019 | | | 0.78 | % |
Year ended May 31, 2018 | | | 0.78 | % |
Year ended May 31, 2017 | | | 0.78 | % |
Year ended May 31, 2016 | | | 0.80 | % |
| 4 | Portfolio turnover rate is calculated by multiplying the affiliated Master Portfolio’s percentage of the Fund’s total investments in securities at the end of the period by the affiliated Master Portfolio’s portfolio turnover rate. |
The accompanying notes are an integral part of these financial statements.
16 | Wells Fargo Small Company Growth Fund
Financial highlights
(For a share outstanding throughout each period)
| | | | | | | | | | | | | | | | | | | | | | | | |
| | | Six months ended
November 30, 2020
(unaudited) | | | Year ended May 31 | |
| INSTITUTIONAL CLASS | | 2020 | | | 2019 | | | 2018 | | | 2017 | | | 2016 | |
Net asset value, beginning of period | | | $50.47 | | | | $52.51 | | | | $60.20 | | | | $46.85 | | | | $39.75 | | | | $46.44 | |
Net investment loss | | | (0.10 | )1 | | | (0.17 | )1 | | | (0.15 | ) | | | (0.19 | ) | | | (0.15 | ) | | | (0.09 | ) |
Net realized and unrealized gains (losses) on investments | | | 14.60 | | | | 2.64 | | | | (3.44 | ) | | | 13.54 | | | | 7.25 | | | | (6.33 | ) |
| | | | | | | | | | | | | | | | | | | | | | | | |
Total from investment operations | | | 14.50 | | | | 2.47 | | | | (3.59 | ) | | | 13.35 | | | | 7.10 | | | | (6.42 | ) |
Distributions to shareholders from | | | | | | | | | | | | | | | | | | | | | | | | |
Net realized gains | | | 0.00 | | | | (4.51 | ) | | | (4.10 | ) | | | 0.00 | | | | 0.00 | | | | (0.27 | ) |
Net asset value, end of period | | | $64.97 | | | | $50.47 | | | | $52.51 | | | | $60.20 | | | | $46.85 | | | | $39.75 | |
Total return2 | | | 28.73 | % | | | 4.07 | % | | | (5.77 | )% | | | 28.50 | % | | | 17.86 | % | | | (13.85 | )% |
Ratios to average net assets (annualized) | | | | | | | | | | | | | | | | | | | | | | | | |
Gross expenses3 | | | 1.01 | % | | | 1.00 | % | | | 0.98 | % | | | 0.99 | % | | | 1.00 | % | | | 1.01 | % |
Net expenses3 | | | 0.94 | % | | | 0.95 | % | | | 0.95 | % | | | 0.95 | % | | | 0.95 | % | | | 0.95 | % |
Net investment loss3 | | | (0.35 | )% | | | (0.32 | )% | | | (0.26 | )% | | | (0.35 | )% | | | (0.31 | )% | | | (0.18 | )% |
Supplemental data | | | | | | | | | | | | | | | | | | | | | | | | |
Portfolio turnover rate4 | | | 22 | % | | | 41 | % | | | 54 | % | | | 37 | % | | | 82 | % | | | 49 | % |
Net assets, end of period (000s omitted) | | | $884,559 | | | | $793,581 | | | | $1,047,883 | | | | $1,169,555 | | | | $1,014,847 | | | | $678,699 | |
| 1 | Calculated based upon average shares outstanding |
| 2 | Returns for periods of less than one year are not annualized. |
| 3 | Ratios include net expenses allocated from the affiliated Master Portfolio which were as follows: |
| | | | |
Six months ended November 30, 2020 (unaudited) | | | 0.79 | % |
Year ended May 31, 2020 | | | 0.78 | % |
Year ended May 31, 2019 | | | 0.78 | % |
Year ended May 31, 2018 | | | 0.78 | % |
Year ended May 31, 2017 | | | 0.78 | % |
Year ended May 31, 2016 | | | 0.80 | % |
| 4 | Portfolio turnover rate is calculated by multiplying the affiliated Master Portfolio’s percentage of the Fund’s total investments in securities at the end of the period by the affiliated Master Portfolio’s portfolio turnover rate. |
The accompanying notes are an integral part of these financial statements.
Wells Fargo Small Company Growth Fund | 17
Notes to financial statements (unaudited)
1. ORGANIZATION
Wells Fargo Funds Trust (the “Trust”), a Delaware statutory trust organized on March 10, 1999, is an open-end management investment company registered under the Investment Company Act of 1940, as amended (the “1940 Act”). As an investment company, the Trust follows the accounting and reporting guidance in Financial Accounting Standards Board (“FASB”) Accounting Standards Codification Topic 946, Financial Services – Investment Companies. These financial statements report on the Wells Fargo Small Company Growth Fund (the “Fund”) which is a diversified series of the Trust.
The Fund is a feeder fund in a master-feeder structure that invests substantially all of its assets in a single master portfolio with a substantially identical investment objective and substantially similar investment strategies. The Fund invests in Wells Fargo Small Company Growth Portfolio (the “affiliated Master Portfolio”) which is a separate diversified portfolio of Wells Fargo Master Trust, a registered open-end management investment company. As of November 30, 2020, the Fund owned 98% of Wells Fargo Small Company Growth Portfolio. The affiliated Master Portfolio directly acquires portfolio securities and the Fund acquires an indirect interest in those securities. The Fund accounts for its investment in the affiliated Master Portfolio as a partnership investment and records on a daily basis its share of the affiliated Master Portfolio’s income, expense and realized and unrealized gains and losses. The financial statements of the affiliated Master Portfolio for the six months November 30, 2020 are included in this report and should be read in conjunction with the Fund’s financial statements.
2. SIGNIFICANT ACCOUNTING POLICIES
The following significant accounting policies, which are consistently followed in the preparation of the financial statements of the Fund, are in conformity with U.S. generally accepted accounting principles which require management to make estimates and assumptions that affect the reported amounts of assets and liabilities, disclosure of contingent assets and liabilities at the date of the financial statements, and the reported amounts of revenues and expenses during the reporting period. Actual results could differ from those estimates.
Securities valuation
All investments are valued each business day as of the close of regular trading on the New York Stock Exchange (generally 4 p.m. Eastern Time), although the Fund may deviate from this calculation time under unusual or unexpected circumstances.
Investments in the affiliated Master Portfolio are valued daily based on the Fund’s proportionate share of the affiliated Master Portfolio’s net assets, which are also valued daily. Securities held in the affiliated Master Portfolio are valued as discussed in the Notes to Financial Statements of the affiliated Master Portfolio, which are included elsewhere in this report.
Investments which are not valued using the method discussed above are valued at their fair value, as determined in good faith by the Board of Trustees of the Fund. The Board of Trustees has established a Valuation Committee comprised of the Trustees and has delegated to it the authority to take any actions regarding the valuation of portfolio securities that the Valuation Committee deems necessary or appropriate, including determining the fair value of portfolio securities, unless the determination has been delegated to the Wells Fargo Asset Management Pricing Committee at Wells Fargo Funds Management, LLC (“Funds Management”). The Board of Trustees retains the authority to make or ratify any valuation decisions or approve any changes to the Valuation Procedures as it deems appropriate. On a quarterly basis, the Board of Trustees receives reports on any valuation actions taken by the Valuation Committee or the Wells Fargo Asset Management Pricing Committee which may include items for ratification.
Investment transactions, income and expenses
Investments in the affiliated Master Portfolio are recorded on a trade basis. The Fund records daily its proportionate share of the affiliated Master Portfolio’s income, expenses and realized and unrealized gains or losses. The Fund also accrues its own expenses.
Distributions to shareholders
Distributions to shareholders from net investment income and any net realized gains are recorded on the ex-dividend date and paid at least annually. Such distributions are determined in accordance with income tax regulations and may differ from U.S. generally accepted accounting principles. Dividend sources are estimated at the time of declaration. The tax character of distributions is determined as of the Fund’s fiscal year end. Therefore, a portion of the Fund’s distributions made prior to the Fund’s fiscal year end may be categorized as a tax return of capital at year end.
Federal and other taxes
The Fund intends to continue to qualify as a regulated investment company by distributing substantially all of its investment company taxable income and any net realized capital gains (after reduction for capital loss carryforwards) sufficient to relieve it from all, or substantially all, federal income taxes. Accordingly, no provision for federal income taxes was required.
18 | Wells Fargo Small Company Growth Fund
Notes to financial statements (unaudited)
The Fund’s income and federal excise tax returns and all financial records supporting those returns for the prior three fiscal years are subject to examination by the federal and Delaware revenue authorities. Management has analyzed the Fund’s tax positions taken on federal, state, and foreign tax returns for all open tax years and does not believe that there are any uncertain tax positions that require recognition of a tax liability.
As of November 30, 2020, the aggregate cost of all investments for federal income tax purposes was $960,758,123, and the unrealized gains (losses) consisted of:
| | | | |
| |
Gross unrealized gains | | $ | 463,433,999 | |
| |
Gross unrealized losses | | | 0 | |
| |
Net unrealized gains | | $ | 463,433,999 | |
Class allocations
The separate classes of shares offered by the Fund differ principally in applicable sales charges, distribution, shareholder servicing, and administration fees. Class specific expenses are charged directly to that share class. Investment income, common fund-level expenses, and realized and unrealized gains (losses) on investments are allocated daily to each class of shares based on the relative proportion of net assets of each class.
3. FAIR VALUATION MEASUREMENTS
At November 30, 2020, the affiliated Master Portfolio was measured at fair value using the net asset value per share (or its equivalent) as a practical expedient. The investment objective and the value of the affiliate Master Portfolio was as follows:
| | | | | | |
| | |
| Affiliated Master Portfolio | | Investment objective | | Value of affiliated
Master Portfolio | |
| | |
Wells Fargo Small Company Growth Portfolio | | Seeks long-term capital appreciation | | $ | 1,424,192,122 | |
The affiliated Master Portfolio does not have a redemption period notice, can be redeemed daily and does not have any unfunded commitments.
4. TRANSACTIONS WITH AFFILIATES
Management fee
Funds Management, an indirect wholly owned subsidiary of Wells Fargo & Company (“Wells Fargo”), is the manager of the Fund and provides advisory and fund-level administrative services under an investment management agreement. Under the investment management agreement, Funds Management is responsible for, among other services, implementing the investment objectives and strategies of the Fund and providing fund-level administrative services in connection with the Fund’s operations. As long as the Fund continues to invest substantially all of its assets in a single affiliated Master Portfolio, the Fund pays Funds Management an investment management fee only for fund-level administrative services at the following annual rate based on the Fund’s average daily net assets:
| | | | |
| |
| Average daily net assets | | Management fee | |
| |
First $5 billion | | | 0.05 | % |
| |
Next $5 billion | | | 0.04 | |
| |
Over $10 billion | | | 0.03 | |
For the six months ended November 30, 2020, the management fee was equivalent to an annual rate of 0.05% of the Fund’s average daily net assets.
Funds Management also serves as the adviser to the affiliated Master Portfolio and is entitled to receive a fee from the affiliated Master Portfolio for those services.
Wells Fargo Small Company Growth Fund | 19
Notes to financial statements (unaudited)
Administration fees
Under a class-level administration agreement, Funds Management provides class-level administrative services to the Fund, which includes paying fees and expenses for services provided by the transfer agent, sub-transfer agents, omnibus account servicers and record-keepers. As compensation for its services under the class-level administration agreement, Funds Management receives an annual fee which is calculated based on the average daily net assets of each class as follows:
| | | | |
| |
| | | Class-level
administration fee | |
| |
Class A, Class C | | | 0.21 | % |
| |
Class R6 | | | 0.03 | |
| |
Administrator Class, Institutional Class | | | 0.13 | |
Waivers and/or expense reimbursements
Funds Management has contractually waived and/or reimbursed management and administration fees to the extent necessary to maintain certain net operating expense ratios for the Fund. When each class of the Fund has exceeded its expense cap, Funds Management has waived fees and/or reimbursed expenses from fund-level expenses on a proportionate basis and then from class specific expenses. When only certain classes exceed their expense caps, waivers and/or reimbursements are applied against class specific expenses before fund-level expenses. Funds Management has committed through September 30, 2021 to waive fees and/or reimburse expenses to the extent necessary to cap the Fund’s expenses at 1.29% for Class A shares, 2.04% for Class C shares, 0.86% for Class R6 shares, 1.19% for Administrator Class shares and 0.94% for Institutional Class shares. Prior to or after the commitment expiration date, the cap may be increased or the commitment to maintain the cap may be terminated only with the approval of the Board of Trustees. Prior to June 1, 2020, the Fund’s expenses were capped at 1.33% for Class A shares, 2.08% for Class C shares, 0.90% for Class R6 shares, 1.20% for Administrator Class shares and 0.95% for Institutional Class shares.
Distribution fee
The Trust has adopted a distribution plan for Class C shares of the Fund pursuant to Rule 12b-1 under the 1940 Act. A distribution fee is charged to Class C shares and paid to Wells Fargo Funds Distributor, LLC (“Funds Distributor”), the principal underwriter, at an annual rate of 0.75% of the average daily net assets of Class C shares.
In addition, Funds Distributor is entitled to receive the front-end sales charge from the purchase of Class A shares and a contingent deferred sales charge on the redemption of certain Class A shares. Funds Distributor is also entitled to receive the contingent deferred sales charges from redemptions of Class C shares. For the six months ended November 30, 2020, Funds Distributor received $462 from the sale of Class A shares. No contingent deferred sales charges were incurred by Class A and Class C shares for the six months ended November 30, 2020.
Shareholder servicing fees
The Trust has entered into contracts with one or more shareholder servicing agents, whereby Class A, Class C, and Administrator Class of the Fund are charged a fee at an annual rate of 0.25% of the average daily net assets of each respective class. A portion of these total shareholder servicing fees were paid to affiliates of Wells Fargo.
5. INVESTMENT PORTFOLIO TRANSACTIONS
The Fund seeks to achieve its investment objective by investing substantially all of its assets in a single affiliated Master Portfolio. Purchases and sales have been calculated by multiplying the Fund’s ownership percentage of the affiliated Master Portfolio by the affiliated Master Portfolio’s purchases and sales. Purchases and sales of investments, excluding short-term securities, for the six months ended November 30, 2020 were $287,398,957 and $554,313,870, respectively.
6. BANK BORROWINGS
The Trust (excluding the money market funds), Wells Fargo Master Trust and Wells Fargo Variable Trust are parties to a $350,000,000 revolving credit agreement whereby the Fund is permitted to use bank borrowings for temporary or emergency purposes, such as to fund shareholder redemption requests. Interest under the credit agreement is charged to the Fund based on a borrowing rate equal to the higher of the Federal Funds rate in effect on that day plus 1.25% or the overnight LIBOR rate in effect on that day plus 1.25%. In addition, an annual commitment fee equal to 0.25% of the unused balance is allocated to each participating fund.
For the six months ended November 30, 2020, there were no borrowings by the Fund under the agreement.
20 | Wells Fargo Small Company Growth Fund
Notes to financial statements (unaudited)
7. CONCENTRATION RISKS
Concentration risks result from exposure to a limited number of sectors. Through its investment in the affiliated Master Portfolio which may invest a substantial portion of its assets in any sector, the Fund may in turn be more affected by changes in that sector than a fund whose investments are not heavily weighted in any sector. As of the end of the period, the Master Portfolio concentrated its portfolio in investments related to the health care and information technology sectors.
8. INDEMNIFICATION
Under the Fund’s organizational documents, the officers and Trustees have been granted certain indemnification rights against certain liabilities that may arise out of performance of their duties to the Fund. The Fund has entered into a separate agreement with each Trustee that converts indemnification rights currently existing under the Fund’s organizational documents into contractual rights that cannot be changed in the future without the consent of the Trustee. Additionally, in the normal course of business, the Fund may enter into contracts with service providers that contain a variety of indemnification clauses. The Fund’s maximum exposure under these arrangements is dependent on future claims that may be made against the Fund and, therefore, cannot be estimated.
9. NEW ACCOUNTING PRONOUNCEMENT
In August 2018, FASB issued Accounting Standards Update (“ASU”) No. 2018-13, Fair Value Measurement (Topic 820) Disclosure Framework—Changes to the Disclosure Requirements for Fair Value Measurement. ASU 2018-13 updates the disclosure requirements on fair value measurements in Topic 820, Fair Value Measurements. The amendments are effective for fiscal years, and interim periods within those fiscal years, beginning after December 15, 2019. Management has adopted this guidance which did not have a material impact on the financial statements.
10. CORONAVIRUS (COVID-19) PANDEMIC
On March 11, 2020, the World Health Organization announced that it had made the assessment that coronavirus disease 2019 (“COVID-19”) is a pandemic. The impacts of COVID-19 are adversely affecting the entire global economy, individual companies and investment products, and the market in general. There is significant uncertainty around the extent and duration of business disruptions related to COVID-19 and the impacts may be short term or may last for an extended period of time. The risk of further spreading of COVID-19 has led to significant uncertainty and volatility in the financial markets.
Wells Fargo Small Company Growth Fund | 21
Portfolio of investments—November 30, 2020 (unaudited)
| | | | | | | | | | | | | | | | |
| | | | | | | | | Shares | | | Value | |
| Common Stocks: 98.43% | |
|
| Communication Services: 1.26% | |
Entertainment: 1.26% | | | | | | | | | | | | | | | | |
Lions Gate Entertainment Class B † | | | | | | | | | | | 605,355 | | | $ | 5,436,088 | |
Zynga Incorporated Class A † | | | | | | | | | | | 1,564,773 | | | | 12,909,377 | |
| | | | |
| | | | | | | | | | | | | | | 18,345,465 | |
| | | | | | | | | | | | | | | | |
|
Consumer Discretionary: 9.39% | |
|
| Auto Components: 0.73% | |
Fox Factory Holding Corporation † | | | | | | | | | | | 121,981 | | | | 10,645,282 | |
| | | | | | | | | | | | | | | | |
|
| Diversified Consumer Services: 0.41% | |
Strategic Education Incorporated | | | | | | | | | | | 63,515 | | | | 5,963,423 | |
| | | | | | | | | | | | | | | | |
|
| Hotels, Restaurants & Leisure: 2.02% | |
Extended Stay America Incorporated | | | | | | | | | | | 691,900 | | | | 9,485,949 | |
International Game Technology | | | | | | | | | | | 790,800 | | | | 9,956,172 | |
Papa John’s International Incorporated | | | | | | | | | | | 123,092 | | | | 9,891,673 | |
| | | | |
| | | | | | | | | | | | | | | 29,333,794 | |
| | | | | | | | | | | | | | | | |
|
| Household Durables: 0.81% | |
Skyline Champion Corporation † | | | | | | | | | | | 383,389 | | | | 11,781,544 | |
| | | | | | | | | | | | | | | | |
|
| Leisure Products: 0.74% | |
Callaway Golf Company | | | | | | | | | | | 508,995 | | | | 10,816,144 | |
| | | | | | | | | | | | | | | | |
|
| Multiline Retail: 0.99% | |
Ollie’s Bargain Outlet Holdings Incorporated † | | | | | | | | | | | 163,132 | | | | 14,365,404 | |
| | | | | | | | | | | | | | | | |
|
| Specialty Retail: 3.69% | |
American Eagle Outfitters Incorporated | | | | | | | | | | | 594,061 | | | | 10,687,157 | |
Burlington Stores Incorporated † | | | | | | | | | | | 50,134 | | | | 10,956,284 | |
Five Below Incorporated † | | | | | | | | | | | 59,311 | | | | 9,276,240 | |
Monro Muffler Brake Incorporated | | | | | | | | | | | 164,488 | | | | 7,732,581 | |
Sleep Number Corporation † | | | | | | | | | | | 215,204 | | | | 14,933,006 | |
| | | | |
| | | | | | | | | | | | | | | 53,585,268 | |
| | | | | | | | | | | | | | | | |
|
Consumer Staples: 1.01% | |
|
| Food & Staples Retailing: 1.01% | |
Performance Food Group Company † | | | | | | | | | | | 337,534 | | | | 14,642,225 | |
| | | | | | | | | | | | | | | | |
|
Energy: 0.42% | |
| | | | |
| Oil, Gas & Consumable Fuels: 0.42% | | | | | | | | | | | | |
GasLog Limited « | | | | | | | | | | | 584,730 | | | | 1,724,954 | |
Parsley Energy Incorporated Class A | | | | | | | | | | | 350,944 | | | | 4,397,328 | |
| | | | |
| | | | | | | | | | | | | | | 6,122,282 | |
| | | | | | | | | | | | | | | | |
|
Financials: 11.05% | |
|
| Banks: 1.69% | |
SVB Financial Group † | | | | | | | | | | | 40,356 | | | | 13,917,170 | |
Triumph Bancorp Incorporated † | | | | | | | | | | | 234,137 | | | | 10,639,185 | |
| | | | |
| | | | | | | | | | | | | | | 24,556,355 | |
| | | | | | | | | | | | | | | | |
|
| Capital Markets: 4.24% | |
Evercore Partners Incorporated Class A | | | | | | | | | | | 165,795 | | | | 15,075,739 | |
Focus Financial Partners Incorporated Class A † | | | | | | | | | | | 352,981 | | | | 13,981,577 | |
The accompanying notes are an integral part of these financial statements.
22 | Wells Fargo Small Company Growth Portfolio
Portfolio of investments—November 30, 2020 (unaudited)
| | | | | | | | | | | | | | | | |
| | | | | | | | | Shares | | | Value | |
| Capital Markets (continued) | |
Open Lending Corporation Ǡ | | | | | | | | | | | 250,451 | | | $ | 7,042,682 | |
Stifel Financial Corporation | | | | | | | | | | | 228,564 | | | | 15,839,485 | |
VIRTU Financial Incorporated Class A | | | | | | | | | | | 427,955 | | | | 9,753,094 | |
| | | | |
| | | | | | | | | | | | | | | 61,692,577 | |
| | | | | | | | | | | | | | | | |
|
| Consumer Finance: 0.58% | |
FirstCash Financial Services Incorporated | | | | | | | | | | | 130,369 | | | | 8,374,905 | |
| | | | | | | | | | | | | | | | |
|
| Insurance: 3.46% | |
Argo Group International Holdings Limited | | | | | | | | | | | 200,594 | | | | 7,861,279 | |
BRP Group Incorporated Class A † | | | | | | | | | | | 382,621 | | | | 11,268,188 | |
Goosehead Insurance Incorporated Class A | | | | | | | | | | | 151,392 | | | | 18,637,869 | |
Palomar Holdings Incorporated † | | | | | | | | | | | 188,936 | | | | 12,488,670 | |
| | | | |
| | | | | | | | | | | | | | | 50,256,006 | |
| | | | | | | | | | | | | | | | |
|
| Thrifts & Mortgage Finance: 1.08% | |
Essent Group Limited | | | | | | | | | | | 357,423 | | | | 15,676,573 | |
| | | | | | | | | | | | | | | | |
|
Health Care: 27.84% | |
|
| Biotechnology: 8.18% | |
ACADIA Pharmaceuticals Incorporated † | | | | | | | | | | | 125,479 | | | | 7,109,640 | |
Agios Pharmaceuticals Incorporated † | | | | | | | | | | | 109,693 | | | | 5,080,980 | |
Amicus Therapeutics Incorporated † | | | | | | | | | | | 488,609 | | | | 11,184,260 | |
Black Diamond Therapeutics Incorporated † | | | | | | | | | | | 127,916 | | | | 4,264,719 | |
Blueprint Medicines Corporation † | | | | | | | | | | | 125,246 | | | | 13,536,588 | |
Chemocentryx Incorporated † | | | | | | | | | | | 125,074 | | | | 6,897,831 | |
Cytokinetics Incorporated † | | | | | | | | | | | 372,806 | | | | 6,263,141 | |
Emergent BioSolutions Incorporated † | | | | | | | | | | | 117,831 | | | | 9,653,894 | |
Flexion Therapeutics Incorporated Ǡ | | | | | | | | | | | 347,358 | | | | 3,720,204 | |
Global Blood Therapeutics Incorprated † | | | | | | | | | | | 138,415 | | | | 6,354,633 | |
Immunovant Incorporated † | | | | | | | | | | | 120,167 | | | | 5,911,015 | |
Ionis Pharmaceuticals Incorporated † | | | | | | | | | | | 128,801 | | | | 6,508,315 | |
Iovance Biotherapeutics Incorporated † | | | | | | | | | | | 218,037 | | | | 8,462,016 | |
Ironwood Pharmaceuticals Incorporated † | | | | | | | | | | | 743,901 | | | | 8,569,740 | |
Turning Point Therapeutics Incorporated † | | | | | | | | | | | 80,862 | | | | 8,611,803 | |
Zymeworks Incorporated † | | | | | | | | | | | 127,412 | | | | 6,708,242 | |
| | | | |
| | | | | | | | | | | | | | | 118,837,021 | |
| | | | | | | | | | | | | | | | |
|
| Health Care Equipment & Supplies: 5.15% | |
Atricure Incorporated † | | | | | | | | | | | 273,524 | | | | 11,892,824 | |
Axonics Modulation Technologies Incorporated † | | | | | | | | | | | 344,429 | | | | 15,116,989 | |
Cardiovascular Systems Incorporated † | | | | | | | | | | | 270,136 | | | | 9,308,887 | |
Cerus Corporation † | | | | | | | | | | | 1,148,123 | | | | 7,635,018 | |
Novocure Limited † | | | | | | | | | | | 61,404 | | | | 7,715,413 | |
Silk Road Medical Incorporated † | | | | | | | | | | | 233,435 | | | | 13,375,826 | |
Tactile Systems Technology Class I † | | | | | | | | | | | 226,336 | | | | 9,757,345 | |
| | | | |
| | | | | | | | | | | | | | | 74,802,302 | |
| | | | | | | | | | | | | | | | |
|
| Health Care Providers & Services: 3.81% | |
AMN Healthcare Services Incorporated † | | | | | | | | | | | 188,950 | | | | 12,311,982 | |
HealthEquity Incorporated † | | | | | | | | | | | 186,169 | | | | 13,346,456 | |
Oak Street Health Incorporated † | | | | | | | | | | | 180,570 | | | | 8,517,487 | |
PetIQ Incorporated † | | | | | | | | | | | 368,948 | | | | 10,618,323 | |
U.S. Physical Therapy Incorporated | | | | | | | | | | | 99,248 | | | | 10,542,123 | |
| | | | |
| | | | | | | | | | | | | | | 55,336,371 | |
| | | | | | | | | | | | | | | | |
The accompanying notes are an integral part of these financial statements.
Wells Fargo Small Company Growth Portfolio | 23
Portfolio of investments—November 30, 2020 (unaudited)
| | | | | | | | | | | | | | | | |
| | | | | | | | | Shares | | | Value | |
| Health Care Technology: 3.90% | |
Allscripts Healthcare Solutions Incorporated † | | | | | | | | | | | 806,118 | | | $ | 11,027,694 | |
Evolent Health Incorporated Class A † | | | | | | | | | | | 615,864 | | | | 8,948,504 | |
Omnicell Incorporated † | | | | | | | | | | | 174,470 | | | | 18,293,180 | |
Phreesia Incorporated † | | | | | | | | | | | 303,325 | | | | 13,394,832 | |
Tabula Rasa Healthcare Incorporated Ǡ | | | | | | | | | | | 145,028 | | | | 4,997,665 | |
| | | | |
| | | | | | | | | | | | | | | 56,661,875 | |
| | | | | | | | | | | | | | | | |
|
| Life Sciences Tools & Services: 5.67% | |
Adaptive Biotechnologies Corporation † | | | | | | | | | | | 240,249 | | | | 11,584,807 | |
Avantor Incorporated † | | | | | | | | | | | 670,097 | | | | 18,280,246 | |
ICON plc ADR † | | | | | | | | | | | 94,076 | | | | 18,333,531 | |
PRA Health Sciences Incorporated † | | | | | | | | | | | 102,477 | | | | 11,497,919 | |
Syneos Health Incorporated † | | | | | | | | | | | 345,029 | | | | 22,716,709 | |
| | | | |
| | | | | | | | | | | | | | | 82,413,212 | |
| | | | | | | | | | | | | | | | |
|
| Pharmaceuticals: 1.13% | |
Pacira Pharmaceuticals Incorporated † | | | | | | | | | | | 161,440 | | | | 9,781,650 | |
Theravance Biopharma Incorporated † | | | | | | | | | | | 402,597 | | | | 6,679,084 | |
| | | | |
| | | | | | | | | | | | | | | 16,460,734 | |
| | | | | | | | | | | | | | | | |
|
Industrials: 17.17% | |
|
| Aerospace & Defense: 0.92% | |
Kratos Defense & Security Solutions Incorporated † | | | | | | | | | | | 629,833 | | | | 13,333,565 | |
| | | | | | | | | | | | | | | | |
|
| Building Products: 2.84% | |
A.O. Smith Corporation | | | | | | | | | | | 94,390 | | | | 5,315,101 | |
Masonite International Corporation † | | | | | | | | | | | 154,627 | | | | 15,470,431 | |
PGT Incorporated † | | | | | | | | | | | 394,450 | | | | 7,344,659 | |
The AZEK Company Incorporated † | | | | | | | | | | | 369,641 | | | | 13,203,577 | |
| | | | |
| | | | | | | | | | | | | | | 41,333,768 | |
| | | | | | | | | | | | | | | | |
|
| Commercial Services & Supplies: 1.37% | |
IAA Incorporated † | | | | | | | | | | | 193,243 | | | | 11,579,121 | |
KAR Auction Services Incorporated | | | | | | | | | | | 457,336 | | | | 8,254,915 | |
| | | | |
| | | | | | | | | | | | | | | 19,834,036 | |
| | | | | | | | | | | | | | | | |
|
| Construction & Engineering: 0.56% | |
Dycom Industries Incorporated † | | | | | | | | | | | 129,175 | | | | 8,119,941 | |
| | | | | | | | | | | | | | | | |
|
| Electrical Equipment: 1.58% | |
Atkore International Incorporated † | | | | | | | | | | | 273,854 | | | | 10,674,829 | |
Generac Holdings Incorporated † | | | | | | | | | | | 56,790 | | | | 12,243,924 | |
| | | | |
| | | | | | | | | | | | | | | 22,918,753 | |
| | | | | | | | | | | | | | | | |
|
| Machinery: 4.71% | |
Chart Industries Incorporated † | | | | | | | | | | | 132,900 | | | | 13,736,544 | |
Ingersoll Rand Incorporated † | | | | | | | | | | | 386,900 | | | | 17,128,063 | |
SPX Corporation † | | | | | | | | | | | 344,545 | | | | 17,651,040 | |
Wabash National Corporation | | | | | | | | | | | 578,825 | | | | 10,233,626 | |
Woodward Governor Company | | | | | | | | | | | 86,140 | | | | 9,633,036 | |
| | | | |
| | | | | | | | | | | | | | | 68,382,309 | |
| | | | | | | | | | | | | | | | |
|
| Professional Services: 3.82% | |
ASGN Incorporated † | | | | | | | | | | | 250,932 | | | | 19,617,864 | |
Clarivate plc † | | | | | | | | | | | 497,751 | | | | 13,658,287 | |
The accompanying notes are an integral part of these financial statements.
24 | Wells Fargo Small Company Growth Portfolio
Portfolio of investments—November 30, 2020 (unaudited)
| | | | | | | | | | | | | | | | |
| | | | | | | | | Shares | | | Value | |
|
| Professional Services (continued) | |
FTI Consulting Incorporated † | | | | | | | | | | | 73,995 | | | $ | 7,770,955 | |
ICF International Incorporated | | | | | | | | | | | 199,253 | | | | 14,431,895 | |
| | | | |
| | | | | | | | | | | | | | | 55,479,001 | |
| | | | | | | | | | | | | | | | |
|
| Road & Rail: 1.37% | |
Knight-Swift Transportation Holdings Incorporated | | | | | | | | | | | 246,096 | | | | 10,161,304 | |
Schneider National Incorporated Class B | | | | | | | | | | | 469,647 | | | | 9,815,622 | |
| | | | |
| | | | | | | | | | | | | | | 19,976,926 | |
| | | | | | | | | | | | | | | | |
|
| Information Technology: 25.35% | |
Communications Equipment: 2.32% | | | | | | | | | | | | | | | | |
Ciena Corporation † | | | | | | | | | | | 419,079 | | | | 18,774,739 | |
Lumentum Holdings Incorporated † | | | | | | | | | | | 173,769 | | | | 15,010,166 | |
| | | | |
| | | | | | | | | | | | | | | 33,784,905 | |
| | | | | | | | | | | | | | | | |
|
| IT Services: 5.24% | |
Black Knight Incorporated † | | | | | | | | | | | 221,911 | | | | 20,331,486 | |
EVO Payments Incorporated Class A † | | | | | | | | | | | 433,891 | | | | 10,908,020 | |
KBR Incorporated | | | | | | | | | | | 436,572 | | | | 12,123,604 | |
LiveRamp Holdings Incorporated † | | | | | | | | | | | 295,209 | | | | 17,272,679 | |
Verra Mobility Corporation † | | | | | | | | | | | 499,489 | | | | 6,093,766 | |
WEX Incorporated † | | | | | | | | | | | 54,030 | | | | 9,360,157 | |
| | | | |
| | | | | | | | | | | | | | | 76,089,712 | |
| | | | | | | | | | | | | | | | |
|
| Semiconductors & Semiconductor Equipment: 3.89% | |
CMC Materials Incorporated | | | | | | | | | | | 72,048 | | | | 11,115,565 | |
FormFactor Incorporated † | | | | | | | | | | | 233,570 | | | | 9,576,370 | |
Onto Innovation Incorporated † | | | | | | | | | | | 267,354 | | | | 11,819,720 | |
Silicon Motion Technology Corporation ADR | | | | | | | | | | | 222,556 | | | | 8,831,022 | |
Teradyne Incorporated | | | | | | | | | | | 137,506 | | | | 15,172,412 | |
| | | | |
| | | | | | | | | | | | | | | 56,515,089 | |
| | | | | | | | | | | | | | | | |
|
| Software: 13.90% | |
Box Incorporated Class A † | | | | | | | | | | | 720,380 | | | | 13,463,902 | |
Cloudera Incorporated † | | | | | | | | | | | 599,769 | | | | 7,005,302 | |
Cornerstone OnDemand Incorporated † | | | | | | | | | | | 280,529 | | | | 12,385,355 | |
CyberArk Software Limited † | | | | | | | | | | | 115,389 | | | | 13,254,734 | |
Mimecast Limited † | | | | | | | | | | | 279,736 | | | | 12,582,525 | |
Nuance Communications Incorporated † | | | | | | | | | | | 497,230 | | | | 21,445,530 | |
Pagerduty Incorporated † | | | | | | | | | | | 462,531 | | | | 15,920,314 | |
PTC Incorporated † | | | | | | | | | | | 226,358 | | | | 24,412,710 | |
RealPage Incorporated † | | | | | | | | | | | 298,547 | | | | 20,596,758 | |
Sprout Social Incorporated Class A † | | | | | | | | | | | 228,649 | | | | 11,747,986 | |
SS&C Technologies Holdings Incorporated | | | | | | | | | | | 318,642 | | | | 21,951,247 | |
Talend SA ADR † | | | | | | | | | | | 129,039 | | | | 4,842,834 | |
Zendesk Incorporated † | | | | | | | | | | | 96,357 | | | | 12,863,660 | |
Zuora Incorporated † | | | | | | | | | | | 829,364 | | | | 9,446,456 | |
| | | | |
| | | | | | | | | | | | | | | 201,919,313 | |
| | | | | | | | | | | | | | | | |
|
| Materials: 3.38% | |
Chemicals: 1.70% | | | | | | | | | | | | | | | | |
Element Solutions Incorporated | | | | | | | | | | | 1,042,966 | | | | 14,403,360 | |
Orion Engineered Carbons SA | | | | | | | | | | | 663,935 | | | | 10,330,829 | |
| | | | |
| | | | | | | | | | | | | | | 24,734,189 | |
| | | | | | | | | | | | | | | | |
The accompanying notes are an integral part of these financial statements.
Wells Fargo Small Company Growth Portfolio | 25
Portfolio of investments—November 30, 2020 (unaudited)
| | | | | | | | | | | | | | | | |
| | | | | | | | | Shares | | | Value | |
| Metals & Mining: 0.75% | |
Steel Dynamics Incorporated | | | | | | | | | | | 300,689 | | | $ | 10,887,949 | |
| | | | | | | | | | | | | | | | |
|
| Paper & Forest Products: 0.93% | |
Boise Cascade Company | | | | | | | | | | | 310,492 | | | | 13,428,779 | |
| | | | | | | | | | | | | | | | |
|
Real Estate: 1.56% | |
|
| Equity REITs: 1.56% | |
QTS Realty Trust Incorporated Class A | | | | | | | | | | | 182,537 | | | | 10,844,523 | |
Ryman Hospitality Properties Incorporated | | | | | | | | | | | 183,057 | | | | 11,750,429 | |
| | | | |
| | | | | | | | | | | | | | | 22,594,952 | |
| | | | | | | | | | | | | | | | |
| | | | |
Total Common Stocks (Cost $904,335,955) | | | | | | | | | | | | | | | 1,430,001,949 | |
| | | | | |
| | | | |
| | | | | | | | | | | | | | | | |
| | | | | | Expiration
date | | | | | | | |
| Rights: 0.00% | |
| | | | |
Communication Services: 0.00% | | | | | | | | | | | | | | | | |
|
| Media: 0.00% | |
Media General Incorporated †(a) | | | | | | | 12-31-2020 | | | | 347,897 | | | | 0 | |
| | | | | | | | | | | | | | | | |
| |
Total Rights (Cost $0) | | | | 0 | |
| | | | | |
| | | | |
| | | | | | | | | | | | | | | | |
| | | Yield | | | | | | | | | | |
| Short-Term Investments: 2.25% | |
|
| Investment Companies: 2.25% | |
Securities Lending Cash Investments LLC (l)(r)(u) | | | 0.12 | % | | | | | | | 9,406,660 | | | | 9,406,660 | |
Wells Fargo Government Money Market Fund Select Class (l)(u) | | | 0.02 | | | | | | | | 23,334,146 | | | | 23,334,146 | |
| |
Total Short-Term Investments (Cost $32,740,806) | | | | 32,740,806 | |
| | | | | |
| | | | | | | | |
| Total investments in securities (Cost $937,076,761) | | | 100.68 | % | | | 1,462,742,755 | |
| | |
Other assets and liabilities, net | | | (0.68 | ) | | | (9,951,272 | ) |
| | | | | | | | |
| Total net assets | | | 100.00 | % | | $ | 1,452,791,483 | |
| | | | | | | | |
| † | Non-income-earning security |
| « | All or a portion of this security is on loan. |
| (a) | The security is fair valued in accordance with procedures approved by the Board of Trustees. |
| (l) | The issuer of the security is an affiliated person of the Portfolio as defined in the Investment Company Act of 1940. |
| (r) | The investment is a non-registered investment company purchased with cash collateral received from securities on loan. |
| (u) | The rate represents the 7-day annualized yield at period end. |
Abbreviations:
| ADR | American depositary receipt |
| REIT | Real estate investment trust |
The accompanying notes are an integral part of these financial statements.
26 | Wells Fargo Small Company Growth Portfolio
Portfolio of investments—November 30, 2020 (unaudited)
Investments in Affiliates
An affiliated investment is an investment in which the Portfolio owns at least 5% of the outstanding voting shares of the issuer or as a result of other relationships, such as the Portfolio and the issuer having the same adviser or investment manager. Transactions with issuers that were either affiliated persons of the Portfolio at the beginning of the period or the end of the period were as follows:
| | | | | | | | | | | | | | | | | | | | | | | | | | | | | | | | | | | | |
| | | Value,
beginning of
period | | | Purchases | | | Sale
proceeds | | | Net
realized
gains
(losses) | | | Net
change in
unrealized
gains
(losses) | | | Value,
end of
period | | | % of
net
assets | | | Shares
end
of period | | | Income
from
affiliated
securities | |
| | | | | | | | | |
| Short-Term Invesstments | | | | | | | | | | | | | | | | | | | | | | | | | | | |
Investment Companies | | | | | | | | | | | | | | | | | | | | | | | | | | | | | | | | | | | | |
Securities Lending Cash Investments LLC | | $ | 0 | | | $ | 76,915,805 | | | $ | (67,509,145 | ) | | $ | 0 | | | $ | 0 | | | $ | 9,406,660 | | | | | | | | 9,406,660 | | | $ | 5,736 | # |
Wells Fargo Government Money Market Fund Select Class | | | 39,427,080 | | | | 304,407,269 | | | | (320,500,203 | ) | | | 0 | | | | 0 | | | | 23,334,146 | | | | | | | | 23,334,146 | | | | 11,467 | |
| | | | | | | | | | | | | | | | | | | | | | | | | | | | | | | | | | | | |
| | | | | | | | | | | | | | $ | 0 | | | $ | 0 | | | $ | 32,740,806 | | | | 2.25 | % | | | | | | $ | 17,203 | |
| | | | | | | | | | | | | | | | | | | | | | | | | | | | | | | | | | | | |
| # | Amount shown represents income before fees and rebates. |
The accompanying notes are an integral part of these financial statements.
Wells Fargo Small Company Growth Portfolio | 27
Statement of assets and liabilities—November 30, 2020 (unaudited)
| | | | |
| | | | |
| |
Assets | | | | |
Investments in unaffiliated securities (including $9,176,541 of securities loaned), at value (cost $904,335,955) | | $ | 1,430,001,949 | |
Investments in affiliated securities, at value (cost $32,740,806) | | | 32,740,806 | |
Receivable for investments sold | | | 839,706 | |
Receivable for dividends | | | 549,470 | |
Receivable for securities lending income, net | | | 8,039 | |
Prepaid expenses and other assets | | | 68,393 | |
| | | | |
Total assets | | | 1,464,208,363 | |
| | | | |
| |
Liabilities | | | | |
Payable upon receipt of securities loaned | | | 9,406,660 | |
Payable for investments purchased | | | 1,084,698 | |
Advisory fee | | | 905,794 | |
Accrued expenses and other liabilities | | | 19,728 | |
| | | | |
Total liabilities | | | 11,416,880 | |
| | | | |
Total net assets | | $ | 1,452,791,483 | |
| | | | |
The accompanying notes are an integral part of these financial statements.
28 | Wells Fargo Small Company Growth Portfolio
Statement of operations—six months ended November 30, 2020 (unaudited)
| | | | |
| | | | |
| |
Investment income | | | | |
Dividends | | $ | 4,070,430 | |
Income from affiliated securities | | | 42,619 | |
| | | | |
Total investment income | | | 4,113,049 | |
| | | | |
| |
Expenses | | | | |
Advisory fee | | | 5,437,878 | |
Custody and accounting fees | | | 47,698 | |
Professional fees | | | 23,119 | |
Shareholder report expenses | | | 3,596 | |
Trustees’ fees and expenses | | | 9,582 | |
Other fees and expenses | | | 23,805 | |
| | | | |
Total expenses | | | 5,545,678 | |
| | | | |
Net investment loss | | | (1,432,629 | ) |
| | | | |
| |
Realized and unrealized gains (losses) on investments | | | | |
Net realized gains on investments | | | 172,149,103 | |
Net change in unrealized gains (losses) on investments | | | 184,474,903 | |
| | | | |
Net realized and unrealized gains (losses) on investments | | | 356,624,006 | |
| | | | |
Net increase in net assets resulting from operations | | $ | 355,191,377 | |
| | | | |
The accompanying notes are an integral part of these financial statements.
Wells Fargo Small Company Growth Portfolio | 29
Statement of changes in net assets
| | | | | | | | |
| | | Six months ended
November 30, 2020
(unaudited) | | | Year ended
May 31, 2020 | |
|
Operations | |
Net investment loss | | $ | (1,432,629 | ) | | $ | (2,562,794 | ) |
Net realized gains on investments | | | 172,149,103 | | | | 108,634,846 | |
Net change in unrealized gains (losses) on investments | | | 184,474,903 | | | | (27,501,699 | ) |
| | | | | | | | |
Net increase in net assets resulting from operations | | | 355,191,377 | | | | 78,570,353 | |
| | | | | | | | |
| | |
Capital share transactions | | | | | | | | |
Transactions in investors’ beneficial interests | | | | | | | | |
Contributions | | | 6,575,021 | | | | 51,028,631 | |
Withdrawals | | | (294,355,535 | ) | | | (551,302,982 | ) |
| | | | | | | | |
Net decrease in net assets resulting from capital share transactions | | | (287,780,514 | ) | | | (500,274,351 | ) |
| | | | | | | | |
Total increase (decrease) in net assets | | | 67,410,863 | | | | (421,703,998 | ) |
| | | | | | | | |
| | |
Net assets | | | | | | | | |
Beginning of period | | | 1,385,380,620 | | | | 1,807,084,618 | |
| | | | | | | | |
End of period | | $ | 1,452,791,483 | | | $ | 1,385,380,620 | |
| | | | | | | | |
The accompanying notes are an integral part of these financial statements.
30 | Wells Fargo Small Company Growth Portfolio
Financial highlights
| | | | | | | | | | | | | | | | | | | | | | | | |
| | | Six months ended
November 30, 2020
(unaudited) | | | Year ended May 31 | |
| | | 2020 | | | 2019 | | | 2018 | | | 2017 | | | 2016 | |
Total return1 | | | 28.83 | % | | | 4.08 | % | | | (5.64 | )% | | | 28.74 | % | | | 18.15 | % | | | (13.86 | )% |
Ratios to average net assets (annualized) | | | | | | | | | | | | | | | | | | | | | | | | |
Gross expenses | | | 0.79 | % | | | 0.78 | % | | | 0.78 | % | | | 0.78 | % | | | 0.79 | % | | | 0.80 | % |
Net expenses | | | 0.79 | % | | | 0.78 | % | | | 0.78 | % | | | 0.78 | % | | | 0.79 | % | | | 0.80 | % |
Net investment loss | | | (0.20 | )% | | | (0.16 | )% | | | (0.09 | )% | | | (0.18 | )% | | | (0.14 | )% | | | (0.03 | )% |
Supplemental data | | | | | | | | | | | | | | | | | | | | | | | | |
Portfolio turnover rate | | | 22 | % | | | 41 | % | | | 54 | % | | | 37 | % | | | 82 | % | | | 49 | % |
| 1 | Returns for periods of less than one year are not annualized |
The accompanying notes are an integral part of these financial statements.
Wells Fargo Small Company Growth Portfolio | 31
Notes to financial statements (unaudited)
1. ORGANIZATION
Wells Fargo Master Trust (the “Trust”), a Delaware statutory trust organized on March 10, 1999, is an open-end management investment company registered under the Investment Company Act of 1940, as amended (the “1940 Act”). As an investment company, the Trust follows the accounting and reporting guidance in Financial Accounting Standards Board (“FASB”) Accounting Standards Codification Topic 946, Financial Services – Investment Companies. These financial statements report on the Wells Fargo Small Company Growth Portfolio (the “Portfolio”) which is a diversified series of the Trust.
2. SIGNIFICANT ACCOUNTING POLICIES
The following significant accounting policies, which are consistently followed in the preparation of the financial statements of the Portfolio, are in conformity with U.S. generally accepted accounting principles which require management to make estimates and assumptions that affect the reported amounts of assets and liabilities, disclosure of contingent assets and liabilities at the date of the financial statements, and the reported amounts of revenues and expenses during the reporting period. Actual results could differ from those estimates.
Securities valuation
All investments are valued each business day as of the close of regular trading on the New York Stock Exchange (generally 4 p.m. Eastern Time), although the Portfolio may deviate from this calculation time under unusual or unexpected circumstances.
Equity securities that are listed on a foreign or domestic exchange or market are valued at the official closing price or, if none, the last sales price. If no sale occurs on the principal exchange or market that day, a fair value price will be determined in accordance with the Portfolio’s Valuation Procedures.
Investments in registered open-end investment companies are valued at net asset value. Interests in non-registered investment companies that are redeemable at net asset value are fair valued normally at net asset value.
Investments which are not valued using any of the methods discussed above are valued at their fair value, as determined in good faith by the Board of Trustees of the Portfolio. The Board of Trustees has established a Valuation Committee comprised of the Trustees and has delegated to it the authority to take any actions regarding the valuation of portfolio securities that the Valuation Committee deems necessary or appropriate, including determining the fair value of portfolio securities, unless the determination has been delegated to the Wells Fargo Asset Management Pricing Committee at Wells Fargo Funds Management, LLC (“Funds Management”). The Board of Trustees retains the authority to make or ratify any valuation decisions or approve any changes to the Valuation Procedures as it deems appropriate. On a quarterly basis, the Board of Trustees receives reports on any valuation actions taken by the Valuation Committee or the Wells Fargo Asset Management Pricing Committee which may include items for ratification.
Securities lending
The Portfolio may lend its securities from time to time in order to earn additional income in the form of fees or interest on securities received as collateral or the investment of any cash received as collateral. When securities are on loan, the Portfolio receives interest or dividends on those securities. Cash collateral received in connection with its securities lending transactions is invested in Securities Lending Cash Investments, LLC (the “Securities Lending Fund”). Investments in Securities Lending Fund are valued at the evaluated bid price provided by an independent pricing service. Income earned from investment in the Securities Lending Fund (net of fees and rebates), if any, is included in income from affiliated securities on the Statement of Operations.
In a securities lending transaction, the net asset value of the Portfolio is affected by an increase or decrease in the value of the securities loaned and by an In a securities lending transaction, the net asset value of the Portfolio will be affected by an increase or decrease in the value of the securities loaned and by an increase or decrease in the value of the instrument in which collateral is invested. The amount of securities lending activity undertaken by the Portfolio fluctuates from time to time. The Portfolio has the right under the lending agreement to recover the securities from the borrower on demand. In the event of default or bankruptcy by the borrower, the Portfolio may be prevented from recovering the loaned securities or gaining access to the collateral or may experience delays or costs in doing so. In such an event, the terms of the agreement allows the unaffiliated securities lending agent to use the collateral to purchase replacement securities on behalf of the Portfolio or pay the Portfolio the market value of the loaned securities. The Portfolio bears the risk of loss with respect to depreciation of its investment of the cash collateral.
Security transactions and income recognition
Securities transactions are recorded on a trade date basis. Realized gains or losses are recorded on the basis of identified cost.
32 | Wells Fargo Small Company Growth Portfolio
Notes to financial statements (unaudited)
Dividend income is recognized on the ex-dividend date.
Federal and other taxes
The Portfolio is treated as a separate entity for federal income tax purposes. The Portfolio is not required to pay federal income taxes on its net investment income and net capital gains as it is treated as a partnership for federal income tax purposes. All dividends, gains and losses of the Portfolio are deemed to have been “passed through” to the interest holders in proportion to their holdings of the Portfolio regardless of whether dividends and gains have been distributed by the Portfolio.
The Portfolio’s income tax returns and all financial records supporting those returns for the prior three fiscal years are subject to examination by the federal revenue authority. Management has analyzed the Portfolio’s tax positions taken on federal, state, and foreign tax returns for all open tax years and does not believe that there are any uncertain tax positions that require recognition of a tax liability.
As of November 30, 2020, the aggregate cost of all investments for federal income tax purposes was $964,179,219 and the unrealized gains (losses) consisted of:
| | | | |
| |
Gross unrealized gains | | $ | 561,350,752 | |
| |
Gross unrealized losses | | | (62,787,216 | ) |
| |
Net unrealized gains | | $ | 498,563,536 | |
3. FAIR VALUATION MEASUREMENTS
Fair value measurements of investments are determined within a framework that has established a fair value hierarchy based upon the various data inputs utilized in determining the value of the Portfolio’s investments. The three-level hierarchy gives the highest priority to unadjusted quoted prices in active markets for identical assets or liabilities (Level 1) and the lowest priority to unobservable inputs (Level 3). The Portfolio’s investments are classified within the fair value hierarchy based on the lowest level of input that is significant to the fair value measurement. The inputs are summarized into three broad levels as follows:
| ∎ | | Level 1 – quoted prices in active markets for identical securities |
| ∎ | | Level 2 – other significant observable inputs (including quoted prices for similar securities, interest rates, prepayment speeds, credit risk, etc.) |
| ∎ | | Level 3 – significant unobservable inputs (including the Portfolio’s own assumptions in determining the fair value of investments) |
The inputs or methodologies used for valuing investments in securities are not necessarily an indication of the risk associated with investing in those securities.
Wells Fargo Small Company Growth Portfolio | 33
Notes to financial statements (unaudited)
The following is a summary of the inputs used in valuing the Portfolio’s assets and liabilities as of November 30, 2020:
| | | | | | | | | | | | | | | | |
| | | | |
| | | Quoted prices
(Level 1) | | | Other significant
observable inputs
(Level 2) | | | Significant unobservable inputs (Level 3) | | | Total | |
| | | | |
Assets | | | | | | | | | | | | | | | | |
Investments in: | | | | | | | | | | | | | | | | |
| | | | |
Common stocks | | | | | | | | | | | | | | | | |
| | | | |
Communication services | | $ | 18,345,465 | | | $ | 0 | | | $ | 0 | | | $ | 18,345,465 | |
| | | | |
Consumer discretionary | | | 136,490,859 | | | | | | | | | | | | 136,490,859 | |
| | | | |
Consumer staples | | | 14,642,225 | | | | 0 | | | | 0 | | | | 14,642,225 | |
| | | | |
Energy | | | 6,122,282 | | | | 0 | | | | 0 | | | | 6,122,282 | |
| | | | |
Financials | | | 160,556,416 | | | | 0 | | | | 0 | | | | 160,556,416 | |
| | | | |
Health care | | | 404,511,515 | | | | 0 | | | | 0 | | | | 404,511,515 | |
| | | | |
Industrials | | | 249,378,299 | | | | 0 | | | | 0 | | | | 249,378,299 | |
| | | | |
Information technology | | | 368,309,019 | | | | 0 | | | | 0 | | | | 368,309,019 | |
| | | | |
Materials | | | 49,050,917 | | | | 0 | | | | 0 | | | | 49,050,917 | |
| | | | |
Real estate | | | 22,594,952 | | | | 0 | | | | 0 | | | | 22,594,952 | |
| | | | |
Rights | | | | | | | | | | | | | | | | |
| | | | |
Communication services | | | 0 | | | | 0 | | | | 0 | | | | 0 | |
| | | | |
Short-term investments | | | | | | | | | | | | | | | | |
| | | | |
Investment companies | | | 32,740,806 | | | | 0 | | | | 0 | | | | 32,740,806 | |
| | | | |
Total assets | | $ | 1,462,742,755 | | | $ | 0 | | | $ | 0 | | | $ | 1,462,742,755 | |
Additional sector, industry or geographic detail is included in the Portfolio of Investments.
For the six months ended November 30, 2020, the Portfolio did not have any transfers into/out of Level 3.
4. TRANSACTIONS WITH AFFILIATES AND OTHER EXPENSES
Advisory fee
The Trust has entered into an advisory contract with Funds Management , an indirect wholly owned subsidiary of Wells Fargo & Company (“Wells Fargo”). The adviser is responsible for implementing investment policies and guidelines and for supervising the subadviser, who is responsible for day-to-day portfolio management of the Portfolio. Pursuant to the contract, Funds Management is entitled to receive an advisory fee at the following annual rate based on the Portfolio’s average daily net assets:
| | | | |
| |
| Average daily net assets | | Advisory fee | |
| |
First $500 million | | | 0.800 | % |
| |
Next $500 million | | | 0.775 | |
| |
Next $1 billion | | | 0.750 | |
| |
Next $1 billion | | | 0.725 | |
| |
Next $1 billion | | | 0.700 | |
| |
Over $4 billion | | | 0.680 | |
For the six months ended November 30, 2020, the advisory fee was equivalent to an annual rate of 0.78% of the Portfolio’s average daily net assets.
Funds Management has retained the services of a subadviser to provide daily portfolio management to the Portfolio. The fee for subadvisory services is borne by Funds Management. Peregrine Capital Management, LLC, which is not an affiliate of Funds Management, is the subadviser to the Portfolio and is entitled to receive a fee from Funds Management at an annual rate of 0.38% of the Portfolio’s average daily net assets. Prior to June 1, 2020, the subadviser received an annual fee which started at 0.50% and declined to 0.45% as the average daily net assets of the Portfolio increased.
34 | Wells Fargo Small Company Growth Portfolio
Notes to financial statements (unaudited)
Interfund transactions
The Portfolio may purchase or sell portfolio investment securities to certain other Wells Fargo affiliates pursuant to Rule 17a-7 under the 1940 Act and under procedures adopted by the Board of Trustees. The procedures have been designed to ensure that these interfund transactions, which do not incur broker commissions, are effected at current market prices.
5. INVESTMENT PORTFOLIO TRANSACTIONS
Purchases and sales of investments, excluding U.S. government obligations (if any) and short-term securities, for the six months ended November 30, 2020 were $293,170,247 and $565,445,109, respectively.
6. SECURITIES LENDING TRANSACTIONS
The Portfolio lends its securities through an unaffiliated securities lending agent and receives collateral in the form of cash or securities with a value at least equal to the value of the securities on loan. The value of the loaned securities is determined at the close of each business day and any increases or decreases in the required collateral are exchanged between the Portfolio and the counterparty on the next business day. Cash collateral received is invested in the Securities Lending Fund which seeks to provide a positive return compared to the daily Federal Funds Open Rate by investing in high-quality, U.S. dollar-denominated short-term money market instruments and is exempt from registration under Section 3(c)(7) of the 1940 Act. Securities Lending Fund is managed by Funds Management and is subadvised by Wells Capital Management Incorporated (“WellsCap”), an affiliate of Funds Management and an indirect wholly owned subsidiary of Wells Fargo. Funds Management receives an advisory fee starting at 0.05% and declining to 0.01% as the average daily net assets of the Securities Lending Fund increase. All of the fees received by Funds Management are paid to WellsCap for its services as subadviser.
In the event of counterparty default or the failure of a borrower to return a loaned security, the Portfolio has the right to use the collateral to offset any losses incurred. As of November 30, 2020, the Portfolio had securities lending transactions with the following counterparties which are subject to offset:
| | | | | | | | | | | | |
| | | |
| Counterparty | | Value of
securities on
loan | | | Collateral
received1 | | | Net amount | |
| | | |
Bank of America Securities Inc. | | $ | 6,959,520 | | | $ | (6,959,520 | ) | | $ | 0 | |
| | | |
BNP Paribas Securities Corp. | | | 235,876 | | | | (235,876 | ) | | | 0 | |
| | | |
Citigroup Global Markets Inc. | | | 417,950 | | | | (417,950 | ) | | | 0 | |
| | | |
Credit Suisse Securities (USA) LLC | | | 109,200 | | | | (109,200 | ) | | | 0 | |
| | | |
Deutsche Bank Securities Inc. | | | 409,055 | | | | (409,055 | ) | | | 0 | |
| | | |
National Financial Services LLC | | | 71,140 | | | | (71,140 | ) | | | 0 | |
| | | |
UBS Securities LLC | | | 973,800 | | | | (973,800 | ) | | | 0 | |
| 1 | Collateral received within this table is limited to the collateral for the net transaction with the counterparty. |
7. BANK BORROWINGS
The Trust, along with Wells Fargo Variable Trust and Wells Fargo Funds Trust (excluding the money market funds), are parties to a $350,000,000 revolving credit agreement whereby the Portfolio is permitted to use bank borrowings for temporary or emergency purposes, such as to fund shareholder redemption requests. Interest under the credit agreement is charged to the Portfolio based on a borrowing rate equal to the higher of the Federal Funds rate in effect on that day plus 1.25% or the overnight LIBOR rate in effect on that day plus 1.25%. In addition, an annual commitment fee equal to 0.25% of the unused balance is allocated to each participating fund.
For the six months ended November 30, 2020, there were no borrowings by the Portfolio under the agreement.
8. CONCENTRATION RISKS
Concentration risks result from exposure to a limited number of sectors. As of the end of the period, the Portfolio concentrated its portfolio in investments related to the health care and information technology sectors. A fund that invests a substantial portion of its assets in any sector may be more affected by changes in that sector than would be a fund whose investments are not heavily weighted in any sector.
Wells Fargo Small Company Growth Portfolio | 35
Notes to financial statements (unaudited)
9. INDEMNIFICATION
Under the Portfolio’s organizational documents, the officers and Trustees have been granted certain indemnification rights against certain liabilities that may arise out of performance of their duties to the Portfolio. The Portfolio has entered into a separate agreement with each Trustee that converts indemnification rights currently existing under the Portfolio’s organizational documents into contractual rights that cannot be changed in the future without the consent of the Trustee. Additionally, in the normal course of business, the Portfolio may enter into contracts with service providers that contain a variety of indemnification clauses. The Portfolio’s maximum exposure under these arrangements is dependent on future claims that may be made against the Portfolio and, therefore, cannot be estimated.
10. NEW ACCOUNTING PRONOUNCEMENT
In August 2018, FASB issued Accounting Standards Update (“ASU”) No. 2018-13, Fair Value Measurement (Topic 820) Disclosure Framework—Changes to the Disclosure Requirements for Fair Value Measurement. ASU 2018-13 updates the disclosure requirements on fair value measurements in Topic 820, Fair Value Measurements. The amendments are effective for fiscal years, and interim periods within those fiscal years, beginning after December 15, 2019. Management has adopted this guidance which did not have a material impact on the financial statements.
11. CORONAVIRUS (COVID-19) PANDEMIC
On March 11, 2020, the World Health Organization announced that it had made the assessment that coronavirus disease 2019 (“COVID-19”) is a pandemic. The impacts of COVID-19 are adversely affecting the entire global economy, individual companies and investment products, and the market in general. There is significant uncertainty around the extent and duration of business disruptions related to COVID-19 and the impacts may be short term or may last for an extended period of time. The risk of further spreading of COVID-19 has led to significant uncertainty and volatility in the financial markets.
36 | Wells Fargo Small Company Growth Portfolio
Other information (unaudited)
PROXY VOTING INFORMATION
A description of the policies and procedures used to determine how to vote proxies relating to portfolio securities is available, upon request, by calling 1-800-222-8222, visiting our website at wfam.com, or visiting the SEC website at sec.gov. Information regarding how the proxies related to portfolio securities were voted during the most recent 12-month period ended June 30 is available on the website at wfam.com or by visiting the SEC website at sec.gov.
QUARTERLY PORTFOLIO HOLDINGS INFORMATION
The Fund and Portfolio file their complete schedule of portfolio holdings with the SEC for the first and third quarters of each fiscal year as an exhibit to its reports on Form N-PORT. Shareholders may view the filed Form N-PORT by visiting the SEC website at sec.gov.
Wells Fargo Small Company Growth Fund | 37
Other information (unaudited)
BOARD OF TRUSTEES AND OFFICERS
Each of the Trustees and Officers1 listed in the table below acts in identical capacities for each fund in the Wells Fargo family of funds, which consists of 144 mutual funds comprising the Wells Fargo Funds Trust, Wells Fargo Variable Trust, Wells Fargo Master Trust and four closed-end funds (collectively the “Fund Complex”). This table should be read in conjunction with the Prospectus and the Statement of Additional Information2. The mailing address of each Trustee and Officer is 525 Market Street, 12th Floor, San Francisco, CA 94105. Each Trustee and Officer serves an indefinite term, however, each Trustee serves such term until reaching the mandatory retirement age established by the Trustees.
Independent Trustees
| | | | | | |
Name and
year of birth | | Position held and
length of service* | | Principal occupations during past five years or longer | | Current other
public company or
investment
company
directorships |
| | | |
William R. Ebsworth
(Born 1957) | | Trustee, since 2015 | | Retired. From 1984 to 2013, equities analyst, portfolio manager, research director and chief investment officer at Fidelity Management and Research Company in Boston, Tokyo, and Hong Kong, and retired in 2013 as Chief Investment Officer of Fidelity Strategic Advisers, Inc. where he led a team of investment professionals managing client assets. Prior thereto, Board member of Hong Kong Securities Clearing Co., Hong Kong Options Clearing Corp., the Thailand International Fund, Ltd., Fidelity Investments Life Insurance Company, and Empire Fidelity Investments Life Insurance Company. Audit Committee Chair and Investment Committee Chair of the Vincent Memorial Hospital Endowment (non-profit organization). Mr. Ebsworth is a CFA® charterholder. | | N/A |
| | | |
Jane A. Freeman
(Born 1953) | | Trustee, since 2015; Chair Liaison, since 2018 | | Retired. From 2012 to 2014 and 1999 to 2008, Chief Financial Officer of Scientific Learning Corporation. From 2008 to 2012, Ms. Freeman provided consulting services related to strategic business projects. Prior to 1999, Portfolio Manager at Rockefeller & Co. and Scudder, Stevens & Clark. Board member of the Harding Loevner Funds from 1996 to 2014, serving as both Lead Independent Director and chair of the Audit Committee. Board member of the Russell Exchange Traded Funds Trust from 2011 to 2012 and the chair of the Audit Committee. Ms. Freeman is also an inactive Chartered Financial Analyst. | | N/A |
| | | |
Isaiah Harris, Jr.
(Born 1952) | | Trustee, since 2009; Audit Committee Chair, since 2019 | | Retired. Chairman of the Board of CIGNA Corporation since 2009, and Director since 2005. From 2003 to 2011, Director of Deluxe Corporation. Prior thereto, President and CEO of BellSouth Advertising and Publishing Corp. from 2005 to 2007, President and CEO of BellSouth Enterprises from 2004 to 2005 and President of BellSouth Consumer Services from 2000 to 2003. Emeritus member of the Iowa State University Foundation Board of Governors. Emeritus Member of the Advisory Board of Iowa State University School of Business. Advisory Board Member, Palm Harbor Academy (private school). Mr. Harris is a certified public accountant (inactive status). | | CIGNA Corporation |
| | | |
Judith M. Johnson
(Born 1949) | | Trustee, since 2008 | | Retired. Prior thereto, Chief Executive Officer and Chief Investment Officer of Minneapolis Employees Retirement Fund from 1996 to 2008. Ms. Johnson is an attorney, certified public accountant and a certified managerial accountant. | | N/A |
| | | |
David F. Larcker
(Born 1950) | | Trustee, since 2009 | | James Irvin Miller Professor of Accounting at the Graduate School of Business (Emeritus), Stanford University, Director of the Corporate Governance Research Initiative and Senior Faculty of The Rock Center for Corporate Governance since 2006. From 2005 to 2008, Professor of Accounting at the Graduate School of Business, Stanford University. Prior thereto, Ernst & Young Professor of Accounting at The Wharton School, University of Pennsylvania from 1985 to 2005. | | N/A |
38 | Wells Fargo Small Company Growth Fund
Other information (unaudited)
| | | | | | |
Name and year of birth | | Position held and
length of service* | | Principal occupations during past five years or longer | | Current other
public company or
investment
company
directorships |
| | | |
Olivia S. Mitchell
(Born 1953) | | Trustee, since 2006; Nominating and Governance Committee Chair, since 2018 | | International Foundation of Employee Benefit Plans Professor, Wharton School of the University of Pennsylvania since 1993. Director of Wharton’s Pension Research Council and Boettner Center on Pensions & Retirement Research, and Research Associate at the National Bureau of Economic Research. Previously, Cornell University Professor from 1978 to 1993. | | N/A |
| | | |
Timothy J. Penny
(Born 1951) | | Trustee, since 1996;
Chair, since 2018 | | President and Chief Executive Officer of Southern Minnesota Initiative Foundation, a non-profit organization, since 2007. Member of the Board of Trustees of NorthStar Education Finance, Inc., a non-profit organization, since 2007. | | N/A |
| | | |
James G. Polisson
(Born 1959) | | Trustee, since 2018 | | Retired. Chief Marketing Officer, Source (ETF) UK Services, Ltd, from 2015 to 2017. From 2012 to 2015, Principal of The Polisson Group, LLC, a management consulting, corporate advisory and principal investing company. Chief Executive Officer and Managing Director at Russell Investments, Global Exchange Traded Funds from 2010 to 2012. Managing Director of Barclays Global Investors from 1998 to 2010 and Global Chief Marketing Officer for iShares and Barclays Global Investors from 2000 to 2010. Trustee of the San Francisco Mechanics’ Institute, a non-profit organization, from 2013 to 2015. Board member of the Russell Exchange Traded Fund Trust from 2011 to 2012. Director of Barclays Global Investors Holdings Deutschland GmbH from 2006 to 2009. Mr. Polisson is an attorney and has a retired status with the Massachusetts and District of Columbia Bar Associations. | | N/A |
| | | |
Pamela Wheelock
(Born 1959) | | Trustee, since January 2020; previously Trustee from January 2018 to July 2019 | | Board member of the Destination Medical Center Economic Development Agency, Rochester, Minnesota since 2019. Interim President of the McKnight Foundation from January to September 2020. Acting Commissioner, Minnesota Department of Human Services, July 2019 through September 2019. Human Services Manager (part-time), Minnesota Department of Human Services, October 2019 through December 2019. Chief Operating Officer, Twin Cities Habitat for Humanity from 2017 to 2019. Vice President of University Services, University of Minnesota from 2012 to 2016. Prior thereto, on the Board of Directors, Governance Committee and Finance Committee for the Minnesota Philanthropy Partners (Saint Paul Foundation) from 2012 to 2018, Interim Chief Executive Officer of Blue Cross Blue Shield of Minnesota from 2011 to 2012, Chairman of the Board from 2009 to 2012 and Board Director from 2003 to 2015. Vice President, Leadership and Community Engagement, Bush Foundation, Saint Paul, Minnesota (a private foundation) from 2009 to 2011. Executive Vice President and Chief Financial Officer, Minnesota Sports and Entertainment from 2004 to 2009 and Senior Vice President from 2002 to 2004. Executive Vice President of the Minnesota Wild Foundation from 2004 to 2008. Commissioner of Finance, State of Minnesota, from 1999 to 2002. Currently Board Chair of the Minnesota Wild Foundation since 2010. | | N/A |
| * | Length of service dates reflect the Trustee’s commencement of service with the Trust’s predecessor entities, where applicable. |
Wells Fargo Small Company Growth Fund | 39
Other information (unaudited)
Officers
| | | | |
Name and
year of birth | | Position held and
length of service | | Principal occupations during past five years or longer |
| | |
Andrew Owen
(Born 1960) | | President, since 2017 | | Executive Vice President of Wells Fargo & Company and Head of Affiliated Managers, Wells Fargo Asset Management, since 2014. In addition, Mr. Owen is currently President, Chief Executive Officer and Director of Wells Fargo Funds Management, LLC since 2017. Prior thereto, Executive Vice President responsible for marketing, investments and product development for Wells Fargo Funds Management, LLC, from 2009 to 2014. |
| | |
Nancy Wiser1
(Born 1967) | | Treasurer, since 2012 | | Executive Vice President of Wells Fargo Funds Management, LLC since 2011. Chief Operating Officer and Chief Compliance Officer at LightBox Capital Management LLC, from 2008 to 2011. |
| | |
Michelle Rhee
(Born 1966) | | Chief Legal Officer, since 2019 | | Secretary of Wells Fargo Funds Management, LLC and Chief Legal Counsel of Wells Fargo Asset Management since 2018. Deputy General Counsel of Wells Fargo Bank, N.A. since 2020 and Assistant General Counsel of Wells Fargo Bank, N.A. from 2018 to 2020. Associate General Counsel and Managing Director of Bank of America Corporation from 2004 to 2018. |
| | |
Catherine Kennedy
(Born 1969) | | Secretary, since 2019 | | Vice President of Wells Fargo Funds Management, LLC and Senior Counsel of the Wells Fargo Legal Department since 2010. Vice President and Senior Counsel of Evergreen Investment Management Company, LLC from 1998 to 2010. |
| | |
Michael H. Whitaker
(Born 1967) | | Chief Compliance Officer, since 2016 | | Chief Compliance Officer of Wells Fargo Asset Management since 2016. Senior Vice President and Chief Compliance Officer for Fidelity Investments from 2007 to 2016. |
| | |
Jeremy DePalma1
(Born 1974) | | Assistant Treasurer, since 2009 | | Senior Vice President of Wells Fargo Funds Management, LLC since 2009. Senior Vice President of Evergreen Investment Management Company, LLC from 2008 to 2010 and head of the Fund Reporting and Control Team within Fund Administration from 2005 to 2010. |
| 1 | Nancy Wiser acts as Treasurer of 67 funds in the Fund Complex. Jeremy DePalma acts as the Treasurer of 77 funds and Assistant Treasurer of 67 funds in the Fund Complex. |
| 2 | The Statement of Additional Information includes additional information about the Trustees and is available, without charge, upon request, by calling 1-800-222-8222 or by visiting the website at wfam.com. |
40 | Wells Fargo Small Company Growth Fund

For more information
More information about Wells Fargo Funds is available free upon request. To obtain literature, please write, visit the Fund’s website, or call:
Wells Fargo Funds
P.O. Box 219967
Kansas City, MO 64121-9967
Website: wfam.com
Individual investors: 1-800-222-8222
Retail investment professionals: 1-888-877-9275
Institutional investment professionals: 1-866-765-0778

This report and the financial statements contained herein are submitted for the general information of the shareholders of the Fund. If this report is used for promotional purposes, distribution of the report must be accompanied or preceded by a current prospectus. Before investing, please consider the investment objectives, risks, charges, and expenses of the investment. For a current prospectus and, if available, a summary prospectus, containing this information, call 1-800-222-8222 or visit the Fund’s website at wfam.com. Read the prospectus carefully before you invest or send money.
Wells Fargo Asset Management (WFAM) is the trade name for certain investment advisory/management firms owned by Wells Fargo & Company. These firms include but are not limited to Wells Capital Management Incorporated and Wells Fargo Funds Management, LLC. Certain products managed by WFAM entities are distributed by Wells Fargo Funds Distributor, LLC (a broker-dealer and Member FINRA).
This material is for general informational and educational purposes only and is NOT intended to provide investment advice or a recommendation of any kind—including a recommendation for any specific investment, strategy, or plan.
INVESTMENT PRODUCTS: NOT FDIC INSURED ◾ NO BANK GUARANTEE ◾ MAY LOSE VALUE
© 2021 Wells Fargo & Company. All rights reserved.
PAR-1220-00733 01-20
SA285/SAR285 11-20
Semi-Annual Report
November 30, 2020
Wells Fargo
Small Company Value Fund
|
|
|
Reduce clutter. Save trees. |
Sign up for electronic delivery of prospectuses and shareholder reports at wellsfargo.com/ advantagedelivery |
The views expressed and any forward-looking statements are as of November 30, 2020, unless otherwise noted, and are those of the Fund’s portfolio managers and/or Wells Fargo Asset Management. Discussions of individual securities, or the markets generally, or any Wells Fargo Fund are not intended as individual recommendations. Future events or results may vary significantly from those expressed in any forward-looking statements. The views expressed are subject to change at any time in response to changing circumstances in the market. Wells Fargo Asset Management and the Fund disclaim any obligation to publicly update or revise any views expressed or forward-looking statements.
INVESTMENT PRODUCTS: NOT FDIC INSURED ◾ NO BANK GUARANTEE ◾ MAY LOSE VALUE
Wells Fargo Small Company Value Fund | 1
Letter to shareholders (unaudited)

Andrew Owen
President
Wells Fargo Funds
“Global stock markets rallied strongly, driven by aggressive stimulus measures introduced by central banks and governments in response to challenges presented by the COVID-19 pandemic.”
Dear Shareholder:
We are pleased to offer you this semi-annual report for the Wells Fargo Small Company Value Fund for the six-month period that ended November 30, 2020. Global stock markets rallied strongly, driven by aggressive stimulus measures introduced by central banks and governments in response to challenges presented by the COVID-19 pandemic. Emerging market equities had particularly robust results during the six-month period. Among bonds, high-yield issues led the way while U.S. bonds generally had more modest returns than their international counterparts.
For the period, U.S. stocks, based on the S&P 500 Index,1 returned 19.98% and international stocks, as measured by the MSCI ACWI ex USA Index (Net),2 gained 23.28%. The MSCI EM Index (Net)3 rallied 31.14%. Among bond investments, the Bloomberg Barclays U.S. Aggregate Bond Index4 returned a modest 1.79%, the Bloomberg Barclays Global Aggregate ex-USD Index5 gained a robust 8.19%, the Bloomberg Barclays Municipal Bond Index6 had a 3.29% return, and the ICE BofA U.S. High Yield Index7 gained a healthy 10.47%.
Equities enjoyed a strong tailwind from monetary and fiscal stimulus.
Financial markets posted widely positive returns in June despite ongoing economic weakness and uncertainty regarding COVID-19 and the timing of an effective vaccine. As economies reopened, optimism rose. Vitally important to market sentiment was the ongoing global central bank commitment to provide economic support through liquidity and low borrowing costs. U.S. economic activity was boosted by one-time $1,200 stimulus checks and $600 weekly bonus unemployment benefits for tens of millions of Americans through July. However, jobless rates remained historically high, easing somewhat from 14.7% in April to 11.1% in June. By late June, numerous states reported increases of COVID-19 cases, an ominous sign. China’s economic recovery picked up momentum in June.
July was broadly positive for both global equities and fixed income. However, economic data and a resurgence of COVID-19 cases pointed to the vulnerability of the global economy and the need to regain control of the pandemic. Second-quarter gross domestic product (GDP) shrank from the previous quarter by 9.5% and 12.1% in the U.S. and the eurozone, respectively. In contrast, China reported 3.2% year-over-year second-quarter GDP growth. U.S. unemployment remained high despite adding 1.8 million jobs in July, as a double-digit jobless rate persisted. However, manufacturing activity grew in both the U.S. and the eurozone. In Asia, while China’s manufacturing sector continued to expand, activity in Japan and South Korea contracted. A rising concern was the rapid and broad reemergence of COVID-19 infections.
| 1 | The S&P 500 Index consists of 500 stocks chosen for market size, liquidity, and industry group representation. It is a market-value-weighted index with each stock’s weight in the index proportionate to its market value. You cannot invest directly in an index. |
| 2 | The Morgan Stanley Capital International (MSCI) All Country World Index (ACWI) ex USA Index (Net) is a free-float-adjusted market-capitalization-weighted index that is designed to measure the equity market performance of developed and emerging markets, excluding the United States. Source: MSCI. MSCI makes no express or implied warranties or representations and shall have no liability whatsoever with respect to any MSCI data contained herein. The MSCI data may not be further redistributed or used as a basis for other indices or any securities or financial products. This report is not approved, reviewed, or produced by MSCI. You cannot invest directly in an index. |
| 3 | The MSCI Emerging Markets (EM) Index (Net) is a free-float-adjusted market-capitalization-weighted index that is designed to measure equity market performance of emerging markets. You cannot invest directly in an index. |
| 4 | The Bloomberg Barclays U.S. Aggregate Bond Index is a broad-based benchmark that measures the investment-grade, U.S. dollar-denominated, fixed-rate taxable bond market, including Treasuries, government-related and corporate securities, mortgage-backed securities (agency fixed-rate and hybrid adjustable-rate mortgage pass-throughs), asset-backed securities, and commercial mortgage-backed securities. You cannot invest directly in an index. |
| 5 | The Bloomberg Barclays Global Aggregate ex-USD Index is an unmanaged index that provides a broad-based measure of the global investment-grade fixed-income markets excluding the U.S. dollar-denominated debt market. You cannot invest directly in an index. |
| 6 | The Bloomberg Barclays Municipal Bond Index is an unmanaged index composed of long-term tax-exempt bonds with a minimum credit rating of Baa. You cannot invest directly in an index. |
| 7 | The ICE BofA U.S. High Yield Index is a market-capitalization-weighted index of domestic and Yankee high-yield bonds. The index tracks the performance of high-yield securities traded in the U.S. bond market. You cannot invest directly in an index. Copyright 2021. ICE Data Indices, LLC. All rights reserved. |
2 | Wells Fargo Small Company Value Fund
Letter to shareholders (unaudited)
The stock market continued to rally in August despite concerns over rising COVID-19 cases in the U.S. and Europe, as well as the expiration of the $600 weekly bonus unemployment benefit in July. Generally stronger-than-expected second-quarter earnings boosted investor sentiment along with the Federal Reserve’s announcement of a more accommodative policy shift that could lead to longer-term low interest rates. U.S. indices measuring manufacturing and services activities beat expectations while the U.S. housing market maintained strength. In Europe, retail sales expanded and consumer confidence was steady. China’s economy continued to expand.
Stocks grew more volatile in September on mixed economic data. U.S. economic activity continued to grow. However, only half of the 22 million jobs lost since the early spring had returned. The U.S. unemployment rate fell to 7.9% in September, a measurable improvement but far higher than the 3.5% pre-COVID-19 rate. Only 661,000 jobs were added for the month, down from 1.5 million in August. With the U.S. Congress failing to pass further fiscal relief and uncertainties surrounding a possible vaccine, doubts crept back into the markets. In the U.K., a lack of progress in Brexit talks with the European Union weighed on markets. China’s economy picked up steam, however, with growth fueled by increased global demand.
In October, capital markets took a step back from their six-month rally. Market volatility rose in advance of the U.S. election and amid a global increase in COVID-19 infections. Europe responded with more economic restrictions. Meanwhile, Brexit remained unresolved. U.S. markets looked favorably at a possible Democratic sweep and control of the federal purse strings in anticipation of additional fiscal stimulus, which could boost economic activity. Meanwhile, China continued to stand apart, reporting 4.9% third-quarter GDP growth year over year.
Global stocks rallied broadly in November, propelled by optimism over three promising COVID-19 vaccines, which reported high effectiveness in trials. Global stock indices notched double-digit monthly gains. In a reversal of recent trends, value stocks outperformed growth and cyclical stocks outpaced technology stocks. However, U.S. unemployment remained elevated, with a net job loss of 10 million since February. The Eurozone Services Purchasing Managers’ Index, a monthly survey of purchasing managers, contracted sharply while the region’s manufacturing activity gauge indicated growth. The U.S. election results added to the market’s upbeat mood as investors gave thumbs-up to the certainty of the outcome after an unusual delay and anticipated more consistent policies in the new administration.
Don’t let short-term uncertainty derail long-term investment goals.
Periods of investment uncertainty can present challenges, but experience has taught us that maintaining long-term investment goals can be an effective way to plan for the future. To help you create a sound strategy based on your personal goals and risk tolerance, Wells Fargo Funds offers more than 100 mutual funds spanning a wide range of asset classes and investment styles. Although diversification cannot guarantee an investment profit or prevent losses, we believe it can be an effective way to manage investment risk and potentially smooth out overall portfolio performance. We encourage investors to know their investments and to understand that appropriate levels of risk-taking may unlock opportunities.
Thank you for choosing to invest with Wells Fargo Funds. We appreciate your confidence in us and remain committed to helping you meet your financial needs.
Sincerely,

Andrew Owen
President
Wells Fargo Funds
“Global stocks rallied broadly in November, propelled by optimism over three promising COVID-19 vaccines, which reported high effectiveness in trials.”
|
|
|
For further information about your Fund, contact your investment professional, visit our website at wfam.com, or call us directly at 1-800-222-8222. |
Wells Fargo Small Company Value Fund | 3
Letter to shareholders (unaudited)
Notice to Shareholders
At a meeting held on August 10-12, 2020, the Board of Trustees of the Fund approved a change to the Fund’s automatic conversion feature for Class C shares in order to shorten the required holding period from 10 to 8 years. As a result, on a monthly basis beginning November 5, 2020, Class C shares will convert automatically into Class A shares 8 years after the initial date of purchase or, if you acquired your Class C shares through an exchange or conversion from another share class, 8 years after the date you acquired your Class C shares. When Class C shares that you acquired through a purchase or exchange convert, any other Class C shares that you purchased with reinvested dividends and distributions also will convert into Class A shares on a pro rata basis.
Please note that a shorter holding period may apply depending on your intermediary. Please see “Appendix A—Sales Charge Reductions and Waivers for Certain Intermediaries” in the Fund’s prospectus for further information.
4 | Wells Fargo Small Company Value Fund
This page is intentionally left blank.
Performance highlights (unaudited)
Investment objective
The Fund seeks long-term capital appreciation.
Manager
Wells Fargo Funds Management, LLC
Subadviser for the affiliated master portfolio1
Wells Capital Management Incorporated
Portfolio managers
Jeff Goverman
Garth R. Nisbet, CFA®‡
Craig Pieringer, CFA®‡
Ryan H. Smith, CFA®‡*
Samuel D. Smith, CFA®‡*
Average annual total returns (%) as of November 30, 2020
| | | | | | | | | | | | | | | | | | | | | | | | | | | | | | | | | | |
| | | | |
| | | | | Including sales charge | | | Excluding sales charge | | | Expense ratios2 (%) | |
| | | | | | | | | |
| | | Inception date | | 1 year | | | 5 year | | | 10 year | | | 1 year | | | 5 year | | | 10 year | | | Gross | | | Net3 | |
| | | | | | | | | | |
| Class A (SCVAX) | | 1-31-2002 | | | -7.11 | | | | 4.42 | | | | 7.75 | | | | -1.44 | | | | 5.66 | | | | 8.39 | | | | 1.33 | | | | 1.15 | |
| | | | | | | | | | |
| Class C (SCVFX) | | 8-30-2002 | | | -3.00 | | | | 4.91 | | | | 7.60 | | | | -2.00 | | | | 4.91 | | | | 7.60 | | | | 2.08 | | | | 1.90 | |
| | | | | | | | | | |
| Class R6 (SCVJX)4 | | 10-31-2016 | | | – | | | | – | | | | – | | | | -0.99 | | | | 6.10 | | | | 8.75 | | | | 0.90 | | | | 0.75 | |
| | | | | | | | | | |
| Administrator Class (SCVIX) | | 1-31-2002 | | | – | | | | – | | | | – | | | | -1.34 | | | | 5.79 | | | | 8.58 | | | | 1.25 | | | | 1.05 | |
| | | | | | | | | | |
| Institutional Class (SCVNX)5 | | 7-30-2010 | | | – | | | | – | | | | – | | | | -1.12 | | | | 6.02 | | | | 8.80 | | | | 1.00 | | | | 0.85 | |
| | | | | | | | | | |
| Russell 2000® Value Index6 | | – | | | – | | | | – | | | | – | | | | 0.35 | | | | 6.83 | | | | 8.70 | | | | – | | | | – | |
Figures quoted represent past performance, which is no guarantee of future results, and do not reflect taxes that a shareholder may pay on an investment in a fund. Investment return and principal value of an investment will fluctuate so that an investor’s shares, when redeemed, may be worth more or less than their original cost. Performance shown without sales charges would be lower if sales charges were reflected. Current performance may be lower or higher than the performance data quoted, which assumes the reinvestment of dividends and capital gains. Current month-end performance is available on the Fund’s website, wfam.com.
Index returns do not include transaction costs associated with buying and selling securities, any mutual fund fees or expenses, or any taxes. It is not possible to invest directly in an index.
For Class A shares, the maximum front-end sales charge is 5.75%. For Class C shares, the maximum contingent deferred sales charge is 1.00%. Performance including a contingent deferred sales charge assumes the sales charge for the corresponding time period. Class R6, Administrator Class, and Institutional Class shares are sold without a front-end sales charge or contingent deferred sales charge.
Stock values fluctuate in response to the activities of individual companies and general market and economic conditions. Smaller-company stocks tend to be more volatile and less liquid than those of larger companies. Certain investment strategies tend to increase the total risk of an investment (relative to the broader market). Consult the Fund’s prospectus for additional information on these and other risks.
Please see footnotes on page 7.
6 | Wells Fargo Small Company Value Fund
Performance highlights (unaudited)
| | | | |
|
| Ten largest holdings (%) as of November 30, 20207 | |
| | |
Alaska Air Group Incorporated | | | 1.44 | |
| | |
Schnitzer Steel Industries Incorporated Class A | | | 1.41 | |
| | |
Synovus Financial Corporation | | | 1.39 | |
| | |
Dana Incorporated | | | 1.38 | |
| | |
Piper Jaffray Companies Incorporated | | | 1.38 | |
| | |
Walker & Dunlop Incorporated | | | 1.36 | |
| | |
Western Alliance Bancorp | | | 1.35 | |
| | |
Ameris Bancorp | | | 1.32 | |
| | |
Axos Financial Incorporated | | | 1.26 | |
| | |
Atlantic Union Bankshares Corporation | | | 1.24 | |
|
|
| Sector allocation as of November 30, 20208 |
|
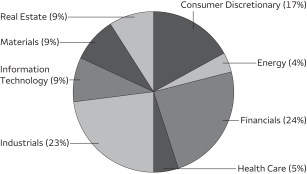
|
| ‡ | CFA® and Chartered Financial Analyst® are trademarks owned by CFA Institute. |
| * | Ryan Smith and Samuel Smith became portfolio managers of the Fund on January 12, 2021. |
| 1 | The Fund is a feeder fund in a master-feeder structure that invests substantially all of its assets in a single affiliated master portfolio of the Wells Fargo Master Trust with a substantially identical investment objective and substantially similar investment strategies. References to the investment activities of the Fund are intended to refer to the investment activities of the affiliated master portfolio in which it invests. |
| 2 | Reflects the expense ratios as stated in the most recent prospectuses. The expense ratios shown are subject to change and may differ from the annualized expense ratios shown in the financial highlights of this report. |
| 3 | The manager has contractually committed through September 30, 2021, to waive fees and/or reimburse expenses to the extent necessary to cap total annual fund operating expenses after fee waivers at 1.15% for Class A, 1.90% for Class C, 0.75% for Class R6, 1.05% for Administrator Class, and 0.85% for Institutional Class. Brokerage commissions, stamp duty fees, interest, taxes, acquired fund fees and expenses (if any) from funds in which the affiliated master portfolios invest and from money market funds, and extraordinary expenses are excluded from the expense caps. Net expenses from the affiliated master portfolio are included in the expense caps. Prior to or after the commitment expiration date, the caps may be increased or the commitment to maintain the caps may be terminated only with the approval of the Board of Trustees. Without these caps, the Fund’s returns would have been lower. The expense ratio paid by an investor is the net expense ratio (the total annual fund operating expenses after fee waivers) as stated in the prospectuses. |
| 4 | Historical performance shown for the Class R6 shares prior to their inception reflects the performance of the Institutional Class shares and includes the higher expenses applicable to the Institutional Class shares. If these expenses had not been included, returns for the Class R6 shares would be higher. |
| 5 | Historical performance shown for the Institutional Class shares prior to their inception reflects the performance of the Administrator Class shares and includes the higher expenses applicable to the Administrator Class shares. If these expenses had not been included, returns for the Institutional Class shares would be higher. |
| 6 | The Russell 2000® Value Index measures the performance of those Russell 2000 companies with lower price/book ratios and lower forecasted growth values. You cannot invest directly in an index. |
| 7 | Each holding represents the Fund’s allocable portion of the affiliated master portfolio security. Figures represent each holding as a percentage of the Fund’s net assets. Holdings are subject to change and may have changed since the date specified. |
| 8 | Figures represent the sector allocation of the affiliated master portfolio as a percentage of the long-term investments of the affiliated master portfolio. These amounts are subject to change and may have changed since the date specified. |
Wells Fargo Small Company Value Fund | 7
Fund expenses (unaudited)
As a shareholder of the Fund, you incur two types of costs: (1) transaction costs, including sales charges (loads) on purchase payments and contingent deferred sales charges (if any) on redemptions and (2) ongoing costs, including management fees, distribution (12b-1) and/or shareholder servicing fees, and other Fund expenses. This example is intended to help you understand your ongoing costs (in dollars) of investing in the Fund and to compare these costs with the ongoing costs of investing in other mutual funds.
The example is based on an investment of $1,000 invested at the beginning of the six-month period and held for the entire period from June 1, 2020 to November 30, 2020.
Actual expenses
The “Actual” line of the table below provides information about actual account values and actual expenses. You may use the information in this line, together with the amount you invested, to estimate the expenses that you paid over the period. Simply divide your account value by $1,000 (for example, an $8,600 account value divided by $1,000 = 8.6), then multiply the result by the number in the “Actual” line under the heading entitled “Expenses paid during period” for your applicable class of shares to estimate the expenses you paid on your account during this period.
Hypothetical example for comparison purposes
The “Hypothetical” line of the table below provides information about hypothetical account values and hypothetical expenses based on the Fund’s actual expense ratio and an assumed rate of return of 5% per year before expenses, which is not the Fund’s actual return. The hypothetical account values and expenses may not be used to estimate the actual ending account balance or expenses you paid for the period. You may use this information to compare the ongoing costs of investing in the Fund and other funds. To do so, compare this 5% hypothetical example with the 5% hypothetical examples that appear in the shareholder reports of the other funds.
Please note that the expenses shown in the table are meant to highlight your ongoing costs only and do not reflect any transactional costs, such as sales charges (loads) and contingent deferred sales charges. Therefore, the “Hypothetical” line of the table is useful in comparing ongoing costs only and will not help you determine the relative total costs of owning different funds. In addition, if these transactional costs were included, your costs would have been higher.
| | | | | | | | | | | | | | | | |
| | | Beginning
account value
6-1-2020 | | | Ending
account value
11-30-2020 | | | Expenses
paid during
the period1,2 | | | Annualized net
expense ratio1 | |
| | | | | |
Class A | | | | | | | | | | | | | | | | |
| | | | |
Actual | | $ | 1,000.00 | | | $ | 1,270.04 | | | $ | 6.43 | | | | 1.13 | % |
| | | | |
Hypothetical (5% return before expenses) | | $ | 1,000.00 | | | $ | 1,019.40 | | | $ | 5.72 | | | | 1.13 | % |
| | | | | |
Class C | | | | | | | | | | | | | | | | |
| | | | |
Actual | | $ | 1,000.00 | | | $ | 1,267.71 | | | $ | 10.80 | | | | 1.90 | % |
| | | | |
Hypothetical (5% return before expenses) | | $ | 1,000.00 | | | $ | 1,015.54 | | | $ | 9.60 | | | | 1.90 | % |
| | | | | |
R6 Class | | | | | | | | | | | | | | | | |
| | | | |
Actual | | $ | 1,000.00 | | | $ | 1,273.95 | | | $ | 4.28 | | | | 0.75 | % |
| | | | |
Hypothetical (5% return before expenses) | | $ | 1,000.00 | | | $ | 1,021.31 | | | $ | 3.80 | | | | 0.75 | % |
| | | | | |
Administrator Class | | | | | | | | | | | | | | | | |
| | | | |
Actual | | $ | 1,000.00 | | | $ | 1,270.86 | | | $ | 5.98 | | | | 1.05 | % |
| | | | |
Hypothetical (5% return before expenses) | | $ | 1,000.00 | | | $ | 1,019.80 | | | $ | 5.32 | | | | 1.05 | % |
| | | | | |
Institutional Class | | | | | | | | | | | | | | | | |
| | | | |
Actual | | $ | 1,000.00 | | | $ | 1,272.90 | | | $ | 4.84 | | | | 0.85 | % |
| | | | |
Hypothetical (5% return before expenses) | | $ | 1,000.00 | | | $ | 1,020.81 | | | $ | 4.31 | | | | 0.85 | % |
| 1 | Amounts reflect net expenses allocated from the affiliated Master Portfolio in which the Fund invests. |
| 2 | Expenses paid is equal to the annualized net expense ratio of each class multiplied by the average account value over the period, multiplied by the number of days in the most recent fiscal half-year divided by the number of days in the fiscal year (to reflect the one-half-year period). |
8 | Wells Fargo Small Company Value Fund
Portfolio of investments—November 30, 2020 (unaudited)
| | | | | | | | | | | | | | | | |
| | | | | | | | | | | | Value | |
| Investment Companies: 100.03% | | | | | | | | | | | | | | | | |
| | | | |
| Affiliated Master Portfolio: 100.03% | | | | | | | | | | | | |
Wells Fargo Small Company Value Portfolio | | | | | | | | | | | | | | $ | 383,705,483 | |
| | | | | | | | | | | | | | | | |
| | | | |
Total Investment Companies (Cost $333,955,430) | | | | | | | | | | | | | | | 383,705,483 | |
| | | | | | | | | | | | | | | | |
| | | | | | | | |
| Total investments in securities (Cost $333,955,430) | | | 100.03 | % | | | 383,705,483 | |
| | |
Other assets and liabilities, net | | | (0.03 | ) | | | (134,222 | ) |
| | | | | | | | |
| Total net assets | | | 100.00 | % | | $ | 383,571,261 | |
| | | | | | | | |
Transactions with the affiliated Master Portfolio were as follows:
| | | | | | | | | | | | | | | | | | | | | | | | | | | | | | | | |
| | | % of
ownership,
beginning
of period | | | % of
ownership,
end of
period | | | Net realized
gains on
securities
transactions
allocated
from
affiliated
Master
Portfolio | | | Net change in
unrealized
gains
(losses) on
securities
transactions
allocated
from
affiliated
Master
Portfolio | | | Dividends
allocated
from
affiliated
Master
Portfolio | | | Affiliated
income
allocated
from
affiliated
Master
Portfolio | | | Value,
end of period | | | % of
net
assets | |
Wells Fargo Small Company Value Portfolio | | | 80 | % | | | 83 | % | | $ | 511,980 | | | $ | 81,737,956 | | | $ | 3,505,533 | | | $ | 22,407 | | | $ | 383,705,483 | | | | 100.03 | % |
The accompanying notes are an integral part of these financial statements.
Wells Fargo Small Company Value Fund | 9
Statement of assets and liabilities—November 30, 2020 (unaudited)
| | | | |
| | | | |
| |
Assets | | | | |
Investments in affiliated Master Portfolio, at value (cost $333,955,430) | | $ | 383,705,483 | |
Receivable for Fund shares sold | | | 222,535 | |
Receivable from manager | | | 35,374 | |
Prepaid expenses and other assets | | | 182,334 | |
| | | | |
Total assets | | | 384,145,726 | |
| | | | |
| |
Liabilities | | | | |
Payable for Fund shares redeemed | | | 459,737 | |
Administration fees payable | | | 58,592 | |
Distribution fee payable | | | 1,708 | |
Trustees’ fees and expenses payable | | | 1,389 | |
Accrued expenses and other liabilities | | | 53,039 | |
| | | | |
Total liabilities | | | 574,465 | |
| | | | |
Total net assets | | | $383,571,261 | |
| | | | |
| |
Net assets consist of | | | | |
Paid-in capital | | $ | 380,541,014 | |
Total distributable earnings | | | 3,030,247 | |
| | | | |
Total net assets | | $ | 383,571,261 | |
| | | | |
| |
Computation of net asset value and offering price per share | | | | |
Net assets – Class A | | $ | 308,601,320 | |
Shares outstanding – Class A1 | | | 11,590,740 | |
Net asset value per share – Class A | | | $26.62 | |
Maximum offering price per share – Class A2 | | | $28.24 | |
Net assets – Class C | | $ | 2,648,020 | |
Shares outstanding – Class C1 | | | 112,950 | |
Net asset value per share – Class C | | | $23.44 | |
Net assets – Class R6 | | $ | 7,422,246 | |
Shares outstanding – Class R61 | | | 269,636 | |
Net asset value per share – Class R6 | | | $27.53 | |
Net assets – Administrator Class | | $ | 21,962,531 | |
Shares outstanding – Administrator Class1 | | | 805,729 | |
Net asset value per share – Administrator Class | | | $27.26 | |
Net assets – Institutional Class | | $ | 42,937,144 | |
Shares outstanding – Institutional Class1 | | | 1,568,454 | |
Net asset value per share – Institutional Class | | | $27.38 | |
| 1 | Each Fund has an unlimited number of authorized shares. |
| 2 | Maximum offering price is computed as 100/94.25 of net asset value. On investments of $50,000 or more, the offering price is reduced. |
The accompanying notes are an integral part of these financial statements.
10 | Wells Fargo Small Company Value Fund
Statement of operations—six months ended November 30, 2020 (unaudited)
| | | | |
| | | | |
| |
Investment income | | | | |
Dividends allocated from affiliated Master Portfolio (net foreign withholding taxes of $2,739) | | $ | 3,505,533 | |
Affiliated income allocated from affiliated Master Portfolio | | | 22,407 | |
Expenses allocated from affiliated Master Portfolio | | | (1,405,600 | ) |
Waivers allocated from affiliated Master Portfolio | | | 149,334 | |
| | | | |
Total investment income | | | 2,271,674 | |
| | | | |
| |
Expenses | | | | |
Management fee | | | 84,952 | |
Administration fees | |
Class A | | | 290,586 | |
Class C | | | 4,064 | |
Class R6 | | | 861 | |
Administrator Class | | | 11,401 | |
Institutional Class | | | 23,340 | |
Shareholder servicing fees | | | | |
Class A | | | 344,751 | |
Class C | | | 4,795 | |
Administrator Class | | | 21,827 | |
Distribution fee | | | | |
Class C | | | 14,352 | |
Custody and accounting fees | | | 3,071 | |
Professional fees | | | 16,543 | |
Registration fees | | | 65,655 | |
Shareholder report expenses | | | 23,715 | |
Trustees’ fees and expenses | | | 11,029 | |
Other fees and expenses | | | 6,750 | |
| | | | |
Total expenses | | | 927,692 | |
Less: Fee waivers and/or expense reimbursements | | | | |
Fund-level | | | (240,679 | ) |
Class A | | | (68,998 | ) |
Class C | | | (386 | ) |
Administrator Class | | | (4,373 | ) |
| | | | |
Net expenses | | | 613,256 | |
| | | | |
Net investment income | | | 1,658,418 | |
| | | | |
| |
Realized and unrealized gains (losses) on investments | | | | |
Net realized gains (losses) on securities transactions allocated from affiliated Master Portfolio | | | 511,980 | |
Net change in unrealized gains (losses) on securities transactions allocated from affiliated Master Portfolio | | | 81,737,956 | |
| | | | |
Net realized and unrealized gains (losses) on investments | | | 82,249,936 | |
| | | | |
Net increase in net assets resulting from operations | | $ | 83,908,354 | |
| | | | |
The accompanying notes are an integral part of these financial statements.
Wells Fargo Small Company Value Fund | 11
Statement of changes in net assets
| | | | | | | | | | | | | | | | |
| | | Six months ended
November 30, 2020 (unaudited) | | | Year ended
May 31, 2020 | |
| | | | |
Operations | | | | | | | | | | | | | | | | |
Net investment income | | | | | | $ | 1,658,418 | | | | | | | $ | 2,260,170 | |
Net realized gains (losses) on investments | | | | | | | 511,980 | | | | | | | | (36,100,494 | ) |
Net change in unrealized gains (losses) on investments | | | | | | | 81,737,956 | | | | | | | | (40,806,657 | ) |
| | | | |
Net increase (decrease) in net assets resulting from operations | | | | | | | 83,908,354 | | | | | | | | (74,646,981 | ) |
| | | | |
| | | | |
Distributions to shareholders from net investment income and net realized gains | | | | | | | | | | | | | | | | |
Class A | | | | | | | 0 | | | | | | | | (1,775,108 | ) |
Class C | | | | | | | 0 | | | | | | | | (20,482 | ) |
Class R6 | | | | | | | 0 | | | | | | | | (57,654 | ) |
Administrator Class | | | | | | | 0 | | | | | | | | (132,559 | ) |
Institutional Class | | | | | | | 0 | | | | | | | | (389,037 | ) |
| | | | |
Total distributions to shareholders | | | | | | | 0 | | | | | | | | (2,374,840 | ) |
| | | | |
| | | | |
Capital share transactions | | | Shares | | | | | | | | Shares | | | | | |
Proceeds from shares sold | | | | | | | | | | | | | | | | |
Class A | | | 471,826 | | | | 10,788,939 | | | | 660,800 | | | | 16,227,538 | |
Class C | | | 1,572 | | | | 30,548 | | | | 9,961 | | | | 227,898 | |
Class R6 | | | 134,614 | | | | 3,129,254 | | | | 64,570 | | | | 1,642,037 | |
Administrator Class | | | 165,688 | | | | 3,860,814 | | | | 106,132 | | | | 2,470,380 | |
Institutional Class | | | 248,570 | | | | 5,972,054 | | | | 309,975 | | | | 7,352,769 | |
| | | | |
| | | | | | | 23,781,609 | | | | | | | | 27,920,622 | |
| | | | |
Reinvestment of distributions | | | | | | | | | | | | | | | | |
Class A | | | 0 | | | | 0 | | | | 61,791 | | | | 1,738,175 | |
Class C | | | 0 | | | | 0 | | | | 745 | | | | 18,543 | |
Class R6 | | | 0 | | | | 0 | | | | 1,984 | | | | 57,454 | |
Administrator Class | | | 0 | | | | 0 | | | | 4,358 | | | | 125,424 | |
Institutional Class | | | 0 | | | | 0 | | | | 13,253 | | | | 382,205 | |
| | | | |
| | | | | | | 0 | | | | | | | | 2,321,801 | |
| | | | |
Payment for shares redeemed | | | | | | | | | | | | | | | | |
Class A | | | (1,437,623 | ) | | | (32,661,166 | ) | | | (1,647,283 | ) | | | (40,312,932 | ) |
Class C | | | (129,007 | ) | | | (2,619,937 | ) | | | (150,237 | ) | | | (3,268,340 | ) |
Class R6 | | | (165,981 | ) | | | (3,765,249 | ) | | | (949,988 | ) | | | (24,922,236 | ) |
Administrator Class | | | (88,043 | ) | | | (2,105,061 | ) | | | (185,643 | ) | | | (4,423,218 | ) |
Institutional Class | | | (245,849 | ) | | | (5,643,390 | ) | | | (876,293 | ) | | | (21,210,870 | ) |
| | | | |
| | | | | | | (46,794,803 | ) | | | | | | | (94,137,596 | ) |
| | | | |
Net asset value of shares issue in acquisition | | | | | | | | | | | | | | | | |
Class A | | | 0 | | | | 0 | | | | 12,989,900 | | | | 337,017,442 | |
Class C | | | 0 | | | | 0 | | | | 328,733 | | | | 7,545,278 | |
Class R6 | | | 0 | | | | 0 | | | | 1,155,117 | | | | 30,863,882 | |
Administrator Class | | | 0 | | | | 0 | | | | 242,559 | | | | 6,444,855 | |
Institutional Class | | | 0 | | | | 0 | | | | 786,790 | | | | 20,969,975 | |
| | | | |
| | | | | | | 0 | | | | | | | | 402,841,432 | |
| | | | |
Net increase (decrease) in net assets resulting from capital share transactions | | | | | | | (23,013,194 | ) | | | | | | | 338,946,259 | |
| | | | |
Total increase in net assets | | | | | | | 60,895,160 | | | | | | | | 261,924,438 | |
| | | | |
| | | | |
Net assets | | | | | | | | | | | | | | | | |
Beginning of period | | | | | | | 322,676,101 | | | | | | | | 60,751,663 | |
| | | | |
End of period | | | | | | $ | 383,571,261 | | | | | | | $ | 322,676,101 | |
| | | | |
The accompanying notes are an integral part of these financial statements.
12 | Wells Fargo Small Company Value Fund
Financial highlights
(For a share outstanding throughout each period)
| | | | | | | | | | | | | | | | | | | | | | | | |
| | | Six months ended
November 30, 2020
(unaudited) | | | Year ended May 31 | |
| CLASS A | | 2020 | | | 2019 | | | 2018 | | | 2017 | | | 2016 | |
Net asset value, beginning of period | | | $20.91 | | | | $24.22 | | | | $28.60 | | | | $24.01 | | | | $20.22 | | | | $21.42 | |
Net investment income | | | 0.11 | | | | 0.18 | 1 | | | 0.09 | | | | 0.09 | | | | 0.05 | | | | 0.08 | |
Net realized and unrealized gains (losses) on investments | | | 5.60 | | | | (3.35 | ) | | | (4.31 | ) | | | 4.58 | | | | 3.75 | | | | (1.25 | ) |
| | | | | | | | | | | | | | | | | | | | | | | | |
Total from investment operations | | | 5.71 | | | | (3.17 | ) | | | (4.22 | ) | | | 4.67 | | | | 3.80 | | | | (1.17 | ) |
Distributions to shareholders from | | | | | | | | | | | | | | | | | | | | | | | | |
Net investment income | | | 0.00 | | | | (0.14 | ) | | | (0.16 | ) | | | (0.08 | ) | | | (0.01 | ) | | | (0.03 | ) |
Net asset value, end of period | | | $26.62 | | | | $20.91 | | | | $24.22 | | | | $28.60 | | | | $24.01 | | | | $20.22 | |
Total return2 | | | 27.31 | % | | | (13.25 | )% | | | (14.72 | )% | | | 19.48 | % | | | 18.86 | % | | | (5.48 | )% |
Ratios to average net assets (annualized) | | | | | | | | | | | | | | | | | | | | | | | | |
Gross expenses3 | | | 1.32 | % | | | 1.32 | % | | | 1.49 | % | | | 1.47 | % | | | 1.47 | % | | | 1.48 | % |
Net expenses3 | | | 1.13 | % | | | 1.13 | % | | | 1.15 | % | | | 1.33 | % | | | 1.35 | % | | | 1.37 | % |
Net investment income3 | | | 0.94 | % | | | 0.74 | % | | | 0.38 | % | | | 0.46 | % | | | 0.20 | % | | | 0.11 | % |
Supplemental data | | | | | | | | | | | | | | | | | | | | | | | | |
Portfolio turnover rate4 | | | 43 | % | | | 78 | % | | | 168 | % | | | 144 | % | | | 110 | % | | | 72 | % |
Net assets, end of period (000s omitted) | | | $308,601 | | | | $262,574 | | | | $11,902 | | | | $15,665 | | | | $16,280 | | | | $23,151 | |
| 1 | Calculated based upon average shares outstanding |
| 2 | Total return calculation do not include any sale charges. Returns for periods of less than one year are not annualized. |
| 3 | Ratios include net expenses allocated from the affiliated Master Portfolio which were as follows: |
| | | | |
Six months ended November 30, 2020 (unaudited) | | | 0.74 | % |
Year ended May 31, 2020 | | | 0.74 | % |
Year ended May 31, 2019 | | | 0.75 | % |
Year ended May 31, 2018 | | | 0.84 | % |
Year ended May 31, 2017 | | | 0.84 | % |
Year ended May 31, 2016 | | | 0.84 | % |
| 4 | Portfolio turnover rate is calculated by multiplying the affiliated Master Portfolio’s percentage of the Fund’s total investment in securities at the end of the period by the affiliated Master Portfolio’s portfolio turnover rate. |
The accompanying notes are an integral part of these financial statements.
Wells Fargo Small Company Value Fund | 13
Financial highlights
(For a share outstanding throughout each period)
| | | | | | | | | | | | | | | | | | | | | | | | |
| | | Six months ended
November 30, 2020
(unaudited) | | | Year ended May 31 | |
| CLASS C | | 2020 | | | 2019 | | | 2018 | | | 2017 | | | 2016 | |
Net asset value, beginning of period | | | $18.43 | | | | $21.48 | | | | $25.38 | | | | $21.40 | | | | $18.15 | | | | $19.34 | |
Net investment income (loss) | | | 0.02 | 1 | | | 0.01 | 1 | | | (0.08 | )1 | | | (0.07 | )1 | | | (0.11 | )1 | | | (0.11 | )1 |
Net realized and unrealized gains (losses) on investments | | | 4.99 | | | | (3.00 | ) | | | (3.82 | ) | | | 4.05 | | | | 3.36 | | | | (1.08 | ) |
| | | | | | | | | | | | | | | | | | | | | | | | |
Total from investment operations | | | 5.01 | | | | (2.99 | ) | | | (3.90 | ) | | | 3.98 | | | | 3.25 | | | | (1.19 | ) |
Distributions to shareholders from | | | | | | | | | | | | | | | | | | | | | | | | |
Net investment income | | | 0.00 | | | | (0.06 | ) | | | 0.00 | | | | 0.00 | | | | 0.00 | | | | 0.00 | |
Net asset value, end of period | | | $23.44 | | | | $18.43 | | | | $21.48 | | | | $25.38 | | | | $21.40 | | | | $18.15 | |
Total return2 | | | 27.18 | % | | | (13.98 | )% | | | (15.37 | )% | | | 18.60 | % | | | 17.97 | % | | | (6.20 | )% |
Ratios to average net assets (annualized) | | | | | | | | | | | | | | | | | | | | | | | | |
Gross expenses3 | | | 2.06 | % | | | 2.08 | % | | | 2.22 | % | | | 2.21 | % | | | 2.22 | % | | | 2.23 | % |
Net expenses3 | | | 1.90 | % | | | 1.90 | % | | | 1.90 | % | | | 2.08 | % | | | 2.10 | % | | | 2.12 | % |
Net investment income (loss)3 | | | 0.17 | % | | | 0.02 | % | | | (0.35 | )% | | | (0.29 | )% | | | (0.54 | )% | | | (0.62 | )% |
Supplemental data | | | | | | | | | | | | | | | | | | | | | | | | |
Portfolio turnover rate4 | | | 43 | % | | | 78 | % | | | 168 | % | | | 144 | % | | | 110 | % | | | 72 | % |
Net assets, end of period (000s omitted) | | | $2,648 | | | | $4,431 | | | | $1,099 | | | | $1,980 | | | | $1,962 | | | | $2,004 | |
| 1 | Calculated based upon average shares outstanding |
| 2 | Total return calculation do not include any sale charges. Returns for periods of less than one year are not annualized. |
| 3 | Ratios include net expenses allocated from the affiliated Master Portfolio which were as follows: |
| | | | |
Six months ended November 30, 2020 (unaudited) | | | 0.74 | % |
Year ended May 31, 2020 | | | 0.74 | % |
Year ended May 31, 2019 | | | 0.75 | % |
Year ended May 31, 2018 | | | 0.84 | % |
Year ended May 31, 2017 | | | 0.84 | % |
Year ended May 31, 2016 | | | 0.84 | % |
| 4 | Portfolio turnover rate is calculated by multiplying the affiliated Master Portfolio’s percentage of the Fund’s total investment in securities at the end of the period by the affiliated Master Portfolio’s portfolio turnover rate. |
The accompanying notes are an integral part of these financial statements.
14 | Wells Fargo Small Company Value Fund
Financial highlights
(For a share outstanding throughout each period)
| | | | | | | | | | | | | | | | | | | | |
| | | Six months ended
November 30, 2020
(unaudited) | | | Year ended May 31 | |
| CLASS R6 | | 2020 | | | 2019 | | | 2018 | | | 20171 | |
Net asset value, beginning of period | | | $21.56 | | | | $24.92 | | | | $29.44 | | | | $24.69 | | | | $21.37 | |
Net investment income | | | 0.16 | 2 | | | 0.31 | | | | 0.21 | 2 | | | 0.29 | 2 | | | 0.08 | |
Net realized and unrealized gains (losses) on investments | | | 5.81 | | | | (3.50 | ) | | | (4.45 | ) | | | 4.65 | | | | 3.33 | |
| | | | | | | | | | | | | | | | | | | | |
Total from investment operations | | | 5.97 | | | | (3.19 | ) | | | (4.24 | ) | | | 4.94 | | | | 3.41 | |
Distributions to shareholders from | | | | | | | | | | | | | | | | | | | | |
Net investment income | | | 0.00 | | | | (0.17 | ) | | | (0.28 | ) | | | (0.19 | ) | | | (0.09 | ) |
Net asset value, end of period | | | $27.53 | | | | $21.56 | | | | $24.92 | | | | $29.44 | | | | $24.69 | |
Total return3 | | | 27.69 | % | | | (12.97 | )% | | | (14.38 | )% | | | 20.03 | % | | | 15.95 | % |
Ratios to average net assets (annualized) | | | | | | | | | | | | | | | | | | | | |
Gross expenses4 | | | 0.89 | % | | | 0.90 | % | | | 1.09 | % | | | 1.03 | % | | | 1.02 | % |
Net expenses4 | | | 0.75 | % | | | 0.75 | % | | | 0.75 | % | | | 0.88 | % | | | 0.90 | % |
Net investment income4 | | | 1.37 | % | | | 1.22 | % | | | 0.77 | % | | | 1.04 | % | | | 0.58 | % |
Supplemental data | | | | | | | | | | | | | | | | | | | | |
Portfolio turnover rate5 | | | 43 | % | | | 78 | % | | | 168 | % | | | 144 | % | | | 110 | % |
Net assets, end of period (000s omitted) | | | $7,422 | | | | $6,491 | | | | $731 | | | | $322 | | | | $29 | |
| 1 | For the period from October 31, 2016 (commencement of class operations) to May 31, 2017. |
| 2 | Calculated based upon average shares outstanding |
| 3 | Returns for periods of less than one year are not annualized. |
| 4 | Ratios include net expenses allocated from the affiliated Master Portfolio which were as follows: |
| | | | |
Six months ended November 30, 2020 (unaudited) | | | 0.74 | % |
Year ended May 31, 2020 | | | 0.74 | % |
Year ended May 31, 2019 | | | 0.75 | % |
Year ended May 31, 2018 | | | 0.84 | % |
Year ended May 31, 20171 | | | 0.83 | % |
| 5 | Portfolio turnover rate is calculated by multiplying the affiliated Master Portfolio’s percentage of the Fund’s total investment in securities at the end of the period by the affiliated Master Portfolio’s portfolio turnover rate. |
The accompanying notes are an integral part of these financial statements.
Wells Fargo Small Company Value Fund | 15
Financial highlights
(For a share outstanding throughout each period)
| | | | | | | | | | | | | | | | | | | | | | | | |
| | | Six months ended
November 30, 2020
(unaudited) | | | Year ended May 31 | |
| ADMINISTRATOR CLASS | | 2020 | | | 2019 | | | 2018 | | | 2017 | | | 2016 | |
Net asset value, beginning of period | | | $21.40 | | | | $24.80 | | | | $29.23 | | | | $24.53 | | | | $20.66 | | | | $21.90 | |
Net investment income | | | 0.12 | 1 | | | 0.21 | 1 | | | 0.14 | 1 | | | 0.20 | | | | 0.08 | 1 | | | 0.13 | |
Net realized and unrealized gains (losses) on investments | | | 5.74 | | | | (3.43 | ) | | | (4.43 | ) | | | 4.63 | | | | 3.83 | | | | (1.30 | ) |
| | | | | | | | | | | | | | | | | | | | | | | | |
Total from investment operations | | | 5.86 | | | | (3.22 | ) | | | (4.29 | ) | | | 4.83 | | | | 3.91 | | | | (1.17 | ) |
Distributions to shareholders from | | | | | | | | | | | | | | | | | | | | | | | | |
Net investment income | | | 0.00 | | | | (0.18 | ) | | | (0.14 | ) | | | (0.13 | ) | | | (0.04 | ) | | | (0.07 | ) |
Net asset value, end of period | | | $27.26 | | | | $21.40 | | | | $24.80 | | | | $29.23 | | | | $24.53 | | | | $20.66 | |
Total return2 | | | 27.38 | % | | | (13.18 | )% | | | (14.65 | )% | | | 19.71 | % | | | 19.00 | % | | | (5.36 | )% |
Ratios to average net assets (annualized) | | | | | | | | | | | | | | | | | | | | | | | | |
Gross expenses3 | | | 1.24 | % | | | 1.32 | % | | | 1.35 | % | | | 1.38 | % | | | 1.39 | % | | | 1.39 | % |
Net expenses3 | | | 1.05 | % | | | 1.05 | % | | | 1.05 | % | | | 1.19 | % | | | 1.20 | % | | | 1.20 | % |
Net investment income3 | | | 1.00 | % | | | 0.82 | % | | | 0.49 | % | | | 0.59 | % | | | 0.36 | % | | | 0.28 | % |
Supplemental data | | | | | | | | | | | | | | | | | | | | | | | | |
Portfolio turnover rate4 | | | 43 | % | | | 78 | % | | | 168 | % | | | 144 | % | | | 110 | % | | | 72 | % |
Net assets, end of period (000s omitted) | | | $21,963 | | | | $15,581 | | | | $13,905 | | | | $60,379 | | | | $57,591 | | | | $64,023 | |
| 1 | Calculated based upon average shares outstanding |
| 2 | Returns for periods of less than one year are not annualized. |
| 3 | Ratios include net expenses allocated from the affiliated Master Portfolio which were as follows: |
| | | | |
Six months ended November 30, 2020 (unaudited) | | | 0.74 | % |
Year ended May 31, 2020 | | | 0.74 | % |
Year ended May 31, 2019 | | | 0.75 | % |
Year ended May 31, 2018 | | | 0.84 | % |
Year ended May 31, 2017 | | | 0.84 | % |
Year ended May 31, 2016 | | | 0.84 | % |
| 4 | Portfolio turnover rate is calculated by multiplying the affiliated Master Portfolio’s percentage of the Fund’s total investment in securities at the end of the period by the affiliated Master Portfolio’s portfolio turnover rate. |
The accompanying notes are an integral part of these financial statements.
16 | Wells Fargo Small Company Value Fund
Financial highlights
(For a share outstanding throughout each period)
| | | | | | | | | | | | | | | | | | | | | | | | |
| | | Six months ended
November 30, 2020
(unaudited) | | | Year ended May 31 | |
| INSTITUTIONAL CLASS | | 2020 | | | 2019 | | | 2018 | | | 2017 | | | 2016 | |
Net asset value, beginning of period | | | $21.46 | | | | $24.86 | | | | $29.40 | | | | $24.68 | | | | $20.77 | | | | $22.02 | |
Net investment income | | | 0.14 | | | | 0.25 | | | | 0.19 | 1 | | | 0.21 | | | | 0.11 | | | | 0.08 | 1 |
Net realized and unrealized gains (losses) on investments | | | 5.78 | | | | (3.43 | ) | | | (4.45 | ) | | | 4.69 | | | | 3.89 | | | | (1.22 | ) |
| | | | | | | | | | | | | | | | | | | | | | | | |
Total from investment operations | | | 5.92 | | | | (3.18 | ) | | | (4.26 | ) | | | 4.90 | | | | 4.00 | | | | (1.14 | ) |
Distributions to shareholders from | | | | | | | | | | | | | | | | | | | | | | | | |
Net investment income | | | 0.00 | | | | (0.22 | ) | | | (0.28 | ) | | | (0.18 | ) | | | (0.09 | ) | | | (0.11 | ) |
Net asset value, end of period | | | $27.38 | | | | $21.46 | | | | $24.86 | | | | $29.40 | | | | $24.68 | | | | $20.77 | |
Total return2 | | | 27.59 | % | | | (13.03 | )% | | | (14.46 | )% | | | 19.90 | % | | | 13.70 | % | | | (5.13 | )% |
Ratios to average net assets (annualized) | | | | | | | | | | | | | | | | | | | | | | | | |
Gross expenses3 | | | 0.99 | % | | | 1.07 | % | | | 1.14 | % | | | 1.14 | % | | | 1.14 | % | | | 1.14 | % |
Net expenses3 | | | 0.85 | % | | | 0.85 | % | | | 0.85 | % | | | 0.99 | % | | | 1.00 | % | | | 1.00 | % |
Net investment income3 | | | 1.23 | % | | | 1.04 | % | | | 0.68 | % | | | 0.78 | % | | | 0.55 | % | | | 0.40 | % |
Supplemental data | | | | | | | | | | | | | | | | | | | | | | | | |
Portfolio turnover rate4 | | | 43 | % | | | 78 | % | | | 168 | % | | | 144 | % | | | 110 | % | | | 72 | % |
Net assets, end of period (000s omitted) | | | $42,937 | | | | $33,600 | | | | $33,116 | | | | $60,973 | | | | $52,072 | | | | $31,768 | |
| 1 | Calculated based upon average shares outstanding |
| 2 | Returns for periods of less than one year are not annualized. |
| 3 | Ratios include net expenses allocated from the affiliated Master Portfolio which were as follows: |
| | | | |
Six months ended November 30, 2020 (unaudited) | | | 0.74 | % |
Year ended May 31, 2020 | | | 0.74 | % |
Year ended May 31, 2019 | | | 0.75 | % |
Year ended May 31, 2018 | | | 0.84 | % |
Year ended May 31, 2017 | | | 0.84 | % |
Year ended May 31, 2016 | | | 0.84 | % |
| 4 | Portfolio turnover rate is calculated by multiplying the affiliated Master Portfolio’s percentage of the Fund’s total investment in securities at the end of the period by the affiliated Master Portfolio’s portfolio turnover rate. |
The accompanying notes are an integral part of these financial statements.
Wells Fargo Small Company Value Fund | 17
Notes to financial statements (unaudited)
1. ORGANIZATION
Wells Fargo Funds Trust (the “Trust”), a Delaware statutory trust organized on March 10, 1999, is an open-end management investment company registered under the Investment Company Act of 1940, as amended (the “1940 Act”). As an investment company, the Trust follows the accounting and reporting guidance in Financial Accounting Standards Board (“FASB”) Accounting Standards Codification Topic 946, Financial Services – Investment Companies. These financial statements report on the Wells Fargo Small Company Value Fund (the “Fund”) which is a diversified series of the Trust.
The Fund is a feeder fund in a master-feeder structure that invests substantially all of its assets in a single master portfolio with a substantially identical investment objective and substantially similar investment strategies. The Fund invests in Wells Fargo Small Company Value Portfolio, a separate diversified portfolio (the “affiliated Master Portfolio”) of Wells Fargo Master Trust, a registered open-end management investment company. As of November 30, 2020, the Fund owned 83% of Wells Fargo Small Company Value Portfolio. The affiliated Master Portfolio directly acquires portfolio securities and the Fund acquires an indirect interest in those securities. The Fund accounts for its investment in the affiliated Master Portfolio as a partnership investment and records on a daily basis its share of the affiliated Master Portfolio’s income, expense and realized and unrealized gains and losses. The financial statements of the affiliated Master Portfolio for the six months ended November 30, 2020 are included in this report and should be read in conjunction with the Fund’s financial statements.
2. SIGNIFICANT ACCOUNTING POLICIES
The following significant accounting policies, which are consistently followed in the preparation of the financial statements of the Fund, are in conformity with U.S. generally accepted accounting principles which require management to make estimates and assumptions that affect the reported amounts of assets and liabilities, disclosure of contingent assets and liabilities at the date of the financial statements, and the reported amounts of revenues and expenses during the reporting period. Actual results could differ from those estimates.
Securities valuation
All investments are valued each business day as of the close of regular trading on the New York Stock Exchange (generally 4 p.m. Eastern Time), although the Fund may deviate from this calculation time under unusual or unexpected circumstances.
Investments in the affiliated Master Portfolio are valued daily based on the Fund’s proportionate share of the affiliated Master Portfolio’s net assets, which are also valued daily. Securities held in the affiliated Master Portfolio are valued as discussed in the Notes to Financial Statements of the affiliated Master Portfolio, which are included elsewhere in this report.
Investments which are not valued using the method discussed above are valued at their fair value, as determined in good faith by the Board of Trustees of the Fund. The Board of Trustees has established a Valuation Committee comprised of the Trustees and has delegated to it the authority to take any actions regarding the valuation of portfolio securities that the Valuation Committee deems necessary or appropriate, including determining the fair value of portfolio securities, unless the determination has been delegated to the Wells Fargo Asset Management Pricing Committee at Wells Fargo Funds Management, LLC (“Funds Management”). The Board of Trustees retains the authority to make or ratify any valuation decisions or approve any changes to the Valuation Procedures as it deems appropriate. On a quarterly basis, the Board of Trustees receives reports on any valuation actions taken by the Valuation Committee or the Wells Fargo Asset Management Pricing Committee which may include items for ratification.
Investment transactions, income and expenses
Investments in the affiliated Master Portfolio are recorded on a trade basis. The Fund records daily its proportionate share of the affiliated Master Portfolio’s dividend income, expenses and realized and unrealized gains or losses. The Fund also accrues its own expenses.
Distributions to shareholders
Distributions to shareholders from net investment income and any net realized gains are recorded on the ex-dividend date and paid at least annually. Such distributions are determined in accordance with income tax regulations and may differ from U.S. generally accepted accounting principles. Dividend sources are estimated at the time of declaration. The tax character of distributions is determined as of the Fund’s fiscal year end. Therefore, a portion of the Fund’s distributions made prior to the Fund’s fiscal year end may be categorized as a tax return of capital at year end.
Federal and other taxes
The Fund intends to continue to qualify as a regulated investment company by distributing substantially all of its investment company taxable income and any net realized capital gains (after reduction for capital loss carryforwards) sufficient to relieve it from all, or substantially all, federal income taxes. Accordingly, no provision for federal income taxes was required.
18 | Wells Fargo Small Company Value Fund
Notes to financial statements (unaudited)
The Fund’s income and federal excise tax returns and all financial records supporting those returns for the prior three fiscal years are subject to examination by the federal and Delaware revenue authorities. Management has analyzed the Fund’s tax positions taken on federal, state, and foreign tax returns for all open tax years and does not believe that there are any uncertain tax positions that require recognition of a tax liability.
As of November 30, 2020, the aggregate cost of all investments for federal income tax purposes was $336,994,123 and the unrealized gains (losses) consisted of:
| | | | |
| |
Gross unrealized gains | | $ | 46,711,360 | |
| |
Gross unrealized losses | | | 0 | |
| |
Net unrealized gain | | $ | 46,711,360 | |
As of May 31, 2020, the Fund had capital loss carryforwards which consisted of $31,483,064 in short-term capital losses and $3,107,998 in long-term capital losses. Losses may be subject to certain limitations under Sections 382-384 of the InternalRevenue Code.
As of May 31, 2020, the Fund had a qualified late-year ordinary loss of $161,669 which was recognized on the first day of the current fiscal year.
Class allocations
The separate classes of shares offered by the Fund differ principally in applicable sales charges, distribution, shareholder servicing, and administration fees. Class specific expenses are charged directly to that share class. Investment income, common fund-level expenses, and realized and unrealized gains (losses) on investments are allocated daily to each class of shares based on the relative proportion of net assets of each class.
3. FAIR VALUATION MEASUREMENTS
At November 30, 2020, the affiliated Master Portfolio was measured at fair value using the net asset value per share (or its equivalent) as a practical expedient. The investment objective and the value of the affiliate Master Portfolio was as follows:
| | | | |
| | |
| Affiliated Master Portfolio | | Investment objective | | Value of affiliated Master Portfolio |
| | |
Wells Fargo Small Company Value Portfolio | | Seeks long-term capital appreciation | | $383,705,483 |
The affiliated Master Portfolio does not have a redemption period notice, can be redeemed daily and does not have any unfunded commitments.
4. TRANSACTIONS WITH AFFILIATES
Management fee
Funds Management, an indirect wholly owned subsidiary of Wells Fargo & Company (“Wells Fargo”), is the manager of the Fund and provides advisory and fund-level administrative services under an investment management agreement. Under the investment management agreement, Funds Management is responsible for, among other services, implementing the investment objectives and strategies of the Fund, and providing fund-level administrative services in connection with the Fund’s operations. As long as the Fund continues to invest substantially all of its assets in a single affiliated Master Portfolio, the Fund pays Funds Management an investment management fee only for fund-level administrative services at the following annual rate based on the Fund’s average daily net assets:
| | | | |
| |
| Average daily net assets | | Management fee | |
| |
First $5 billion | | | 0.05 | % |
| |
Next $5 billion | | | 0.04 | |
| |
Over $10 billion | | | 0.03 | |
For the six months ended November 30, 2020, the management fee was equivalent to an annual rate of 0.05% of the Fund’s average daily net assets.
Wells Fargo Small Company Value Fund | 19
Notes to financial statements (unaudited)
Funds Management also serves as the adviser to the affiliated Master Portfolio and is entitled to receive a fee from the affiliated Master Portfolio for those services.
Administration fees
Under a class-level administration agreement, Funds Management provides class-level administrative services to the Fund, which includes paying fees and expenses for services provided by the transfer agent, sub-transfer agents, omnibus account servicers and record-keepers. As compensation for its services under the class-level administration agreement, Funds Management receives an annual fee which is calculated based on the average daily net assets of each class as follows:
| | | | |
| |
| | | Class-level
administration fee | |
| |
Class A, Class C | | | 0.21 | % |
| |
Class R6 | | | 0.03 | |
| |
Administrator Class, Institutional Class | | | 0.13 | |
Waivers and/or expense reimbursements
Funds Management has contractually waived and/or reimbursed management and administration fees to the extent necessary to maintain certain net operating expense ratios for the Fund. When each class of the Fund has exceeded its expense cap, Funds Management has waived fees and/or reimbursed expenses from fund-level expenses on a proportionate basis and then from class specific expenses. When only certain classes exceed their expense caps, waivers and/or reimbursements are applied against class specific expenses before fund-level expenses. Net expenses from the affiliated Master Portfolio are included in the expense caps. Funds Management has committed through September 30, 2021 to waive fees and/or reimburse expenses to the extent necessary to cap the Fund’s expenses at 1.15% for Class A shares, 1.90% for Class C shares, 0.75% for Class R6 shares, 1.05% for Administrator Class shares and 0.85% for Institutional Class shares. Prior to or after the commitment expiration date, the cap may be increased or the commitment to maintain the cap may be terminated only with the approval of the Board of Trustees.
Distribution fee
The Trust has adopted a distribution plan for Class C shares of the Fund pursuant to Rule 12b-1 under the 1940 Act. A distribution fee is charged to Class C shares and paid to Wells Fargo Funds Distributor, LLC (“Funds Distributor”), the principal underwriter, at an annual rate of 0.75% of the average daily net assets of Class C shares.
In addition, Funds Distributor is entitled to receive the front-end sales charge from the purchase of Class A shares and a contingent deferred sales charge on the redemption of certain Class A shares. Funds Distributor is also entitled to receive the contingent deferred sales charges from redemptions of Class C shares. For the six months ended November 30, 2020, Funds Distributor received $910 from the sale of Class A shares. No contingent deferred sales charges were incurred by Class A and Class C shares for the six months ended November 30, 2020.
Shareholder servicing fees
The Trust has entered into contracts with one or more shareholder servicing agents, whereby Class A, Class C, and Administrator Class of the Fund are charged a fee at an annual rate of 0.25% of the average daily net assets of each respective class. A portion of these total shareholder servicing fees were paid to affiliates of Wells Fargo.
5. INVESTMENT PORTFOLIO TRANSACTIONS
The Fund seeks to achieve its investment objective by investing substantially all of its investable assets in a single affiliated Master Portfolio. Purchases and sales have been calculated by multiplying the Fund’s ownership percentage of the affiliated Master Portfolio by the affiliated Master Portfolio’s purchases and sales. Purchases and sales of investments, excluding U.S. government obligations (if any) and short-term securities, for the six months ended November 30, 2020 were $147,075,891 and $182,725,879, respectively.
6. ACQUISITION
After the close of business on September 20, 2019, the Fund acquired the net assets of Wells Fargo Small Cap Value Fund. The purpose of the transaction was to combine two funds with similar investment objectives and strategies. Wells Fargo Small Cap Value Fund transferred all of its portfolio securities to Wells Fargo Small Company Value Portfolio (a master portfolio in which it invested all of its assets) in exchange for interests in Wells Fargo Small Company Value Portfolio. Immediately thereafter, Wells Fargo Small Cap Value Fund transferred all of its equity interests in Wells Fargo Small Company Value Portfolio to
20 | Wells Fargo Small Company Value Fund
Notes to financial statements (unaudited)
Wells Fargo Small Cap Value Fund in exchange for shares of the Fund. Shareholders holding Class A, Class C, Class R6, Administrator Class, and Institutional Class shares of Wells Fargo Small Cap Value Fund received Class A, Class C, Class R6, Administrator Class, and Institutional Class shares, respectively, of the Fund in the reorganization. The acquisition was accomplished by a tax-free exchange of all of the shares of Wells Fargo Small Cap Value Fund for 15,503,099 shares of the Fund valued at $402,841,432 at an exchange ratio of 0.45, 0.28, 0.49, 0.49, and 0.49 for Class A, Class C, Class R6, Administrator Class and Institutional Class shares, respectively. The investment portfolio of Wells Fargo Small Cap Value Fund with a fair value of $399,448,746, identified cost of $378,004,130 and unrealized gains of $21,444,616 at September 20, 2019 were the principal assets acquired by the Fund. The aggregate net assets of Wells Fargo Small Cap Value Fund and the Fund immediately prior to the acquisition were $402,841,432 and $58,675,150, respectively. The aggregate net assets of the Fund immediately after the acquisition were $461,516,582. For financial reporting purposes, assets received and shares issued by the Fund were recorded at fair value; however, the cost basis of the investments received from Wells Fargo Small Cap Value Fund was carried forward to align with ongoing reporting of the Fund’s realized and unrealized gains and losses with amounts distributable to shareholders for tax purposes.
7. BANK BORROWINGS
The Trust (excluding the money market funds), Wells Fargo Master Trust and Wells Fargo Variable Trust are parties to a $350,000,000 revolving credit agreement whereby the Fund is permitted to use bank borrowings for temporary or emergency purposes, such as to fund shareholder redemption requests. Interest under the credit agreement is charged to the Fund based on a borrowing rate equal to the higher of the Federal Funds rate in effect on that day plus 1.25% or the overnight LIBOR rate in effect on that day plus 1.25%. In addition, an annual commitment fee equal to 0.25% of the unused balance is allocated to each participating fund.
For the six months ended November 30, 2020, there were no borrowings by the Fund under the agreement.
8. INDEMNIFICATION
Under the Fund’s organizational documents, the officers and Trustees have been granted certain indemnification rights against certain liabilities that may arise out of performance of their duties to the Fund. The Fund has entered into a separate agreement with each Trustee that converts indemnification rights currently existing under the Fund’s organizational documents into contractual rights that cannot be changed in the future without the consent of the Trustee. Additionally, in the normal course of business, the Fund may enter into contracts with service providers that contain a variety of indemnification clauses. The Fund’s maximum exposure under these arrangements is dependent on future claims that may be made against the Fund and, therefore, cannot be estimated.
9. NEW ACCOUNTING PRONOUNCEMENT
In August 2018, FASB issued Accounting Standards Update (“ASU”) No. 2018-13, Fair Value Measurement (Topic 820) Disclosure Framework—Changes to the Disclosure Requirements for Fair Value Measurement. ASU 2018-13 updates the disclosure requirements on fair value measurements in Topic 820, Fair Value Measurements. The amendments are effective for fiscal years, and interim periods within those fiscal years, beginning after December 15, 2019. Management has adopted this guidance which did not have a material impact on the financial statements.
10. CORONAVIRUS (COVID-19) PANDEMIC
On March 11, 2020, the World Health Organization announced that it had made the assessment that coronavirus disease 2019 (“COVID-19”) is a pandemic. The impacts of COVID-19 are adversely affecting the entire global economy, individual companies and investment products, and the market in general. There is significant uncertainty around the extent and duration of business disruptions related to COVID-19 and the impacts may be short term or may last for an extended period of time. The risk of further spreading of COVID-19 has led to significant uncertainty and volatility in the financial markets.
Wells Fargo Small Company Value Fund | 21
Portfolio of investments—November 30, 2020 (unaudited)
| | | | | | | | | | | | | | | | |
| | | | | | | | | Shares | | | Value | |
| Common Stocks: 98.98% | |
|
Communication Services: 0.47% | |
|
| Entertainment: 0.47% | |
Cinemark Holdings Incorporated | | | | | | | | | | | 139,624 | | | $ | 2,157,192 | |
| | | | | | | | | | | | | | | | |
|
Consumer Discretionary: 16.74% | |
|
| Auto Components: 1.38% | |
Dana Incorporated | | | | | | | | | | | 377,502 | | | | 6,357,134 | |
| | | | | | | | | | | | | | | | |
|
| Diversified Consumer Services: 0.40% | |
Collectors Universe Incorporated | | | | | | | | | | | 24,124 | | | | 1,861,167 | |
| | | | | | | | | | | | | | | | |
|
| Hotels, Restaurants & Leisure: 3.39% | |
Dave & Buster’s Entertainment Incorporated « | | | | | | | | | | | 85,191 | | | | 2,157,036 | |
Del Taco Restaurants Incorporated † | | | | | | | | | | | 308,108 | | | | 2,726,756 | |
Denny’s Corporation † | | | | | | | | | | | 235,664 | | | | 2,712,493 | |
Dine Brands Global Incorporated | | | | | | | | | | | 39,648 | | | | 2,496,635 | |
Wyndham Hotels & Resorts Incorporated | | | | | | | | | | | 96,121 | | | | 5,526,958 | |
| |
| | | | 15,619,878 | |
| | | | | |
|
| Household Durables: 3.81% | |
Beazer Homes Incorporated † | | | | | | | | | | | 216,726 | | | | 3,209,712 | |
GoPro Incorporated Class A † | | | | | | | | | | | 496,697 | | | | 3,471,912 | |
Green Brick Partners Incorporated † | | | | | | | | | | | 116,569 | | | | 2,537,707 | |
Hamilton Beach Brand Class A | | | | | | | | | | | 74,980 | | | | 1,408,124 | |
Hooker Furniture Corporation | | | | | | | | | | | 158,394 | | | | 4,794,586 | |
iRobot Corporation Ǡ | | | | | | | | | | | 27,239 | | | | 2,136,355 | |
| |
| | | | 17,558,396 | |
| | | | | |
|
| Internet & Direct Marketing Retail: 0.16% | |
Stamps.com Incorporated † | | | | | | | | | | | 3,845 | | | | 720,784 | |
| | | | | | | | | | | | | | | | |
|
| Leisure Products: 1.07% | |
Johnson Outdoors Incorporated Class A | | | | | | | | | | | 31,874 | | | | 2,664,666 | |
Malibu Boats Incorporated Class A † | | | | | | | | | | | 39,837 | | | | 2,270,311 | |
| |
| | | | 4,934,977 | |
| | | | | |
|
| Multiline Retail: 1.66% | |
Big Lots Stores Incorporated | | | | | | | | | | | 89,202 | | | | 4,609,067 | |
Nordstrom Incorporated « | | | | | | | | | | | 116,629 | | | | 3,023,024 | |
| |
| | | | 7,632,091 | |
| | | | | |
|
| Specialty Retail: 3.10% | |
American Eagle Outfitters Incorporated | | | | | | | | | | | 292,251 | | | | 5,257,595 | |
Dick’s Sporting Goods Incorporated | | | | | | | | | | | 58,538 | | | | 3,325,544 | |
Shoe Carnival Incorporated | | | | | | | | | | | 122,666 | | | | 4,485,896 | |
Urban Outfitters Incorporated † | | | | | | | | | | | 44,818 | | | | 1,227,117 | |
| |
| | | | 14,296,152 | |
| | | | | |
|
| Textiles, Apparel & Luxury Goods: 1.77% | |
Carter’s Incorporated | | | | | | | | | | | 21,202 | | | | 1,886,766 | |
Lakeland Industries Incorporated † | | | | | | | | | | | 123,509 | | | | 2,447,948 | |
Rocky Brands Incorporated | | | | | | | | | | | 131,113 | | | | 3,802,277 | |
| | | | |
| | | | | | | | | | | | | | | 8,136,991 | |
| | | | | | | | | | | | | | | | |
The accompanying notes are an integral part of these financial statements.
22 | Wells Fargo Small Company Value Portfolio
Portfolio of investments—November 30, 2020 (unaudited)
| | | | | | | | | | | | | | | | |
| | | | | | | | | Shares | | | Value | |
| Energy: 3.68% | | | | | | | | | | | | |
| | | | |
| Energy Equipment & Services: 1.81% | | | | | | | | | | | | |
Helmerich & Payne Incorporated | | | | | | | | | | | 195,566 | | | $ | 4,453,038 | |
Patterson-UTI Energy Incorporated | | | | | | | | | | | 899,418 | | | | 3,876,492 | |
| | | | |
| | | | | | | | | | | | | | | 8,329,530 | |
| | | | | | | | | | | | | | | | |
| | | | |
| Oil, Gas & Consumable Fuels: 1.87% | | | | | | | | | | | | |
Diamondback Energy Incorporated | | | | | | | | | | | 102,447 | | | | 4,093,782 | |
Southwestern Energy Company † | | | | | | | | | | | 953,313 | | | | 2,964,803 | |
W&T Offshore Incorporated Ǡ | | | | | | | | | | | 789,069 | | | | 1,546,575 | |
| | | | |
| | | | | | | | | | | | | | | 8,605,160 | |
| | | | | | | | | | | | | | | | |
| | | | |
Financials: 23.50% | | | | | | | | | | | | | | | | |
| | | | |
| Banks: 16.18% | | | | | | | | | | | | |
Ameris Bancorp | | | | | | | | | | | 179,087 | | | | 6,090,749 | |
Atlantic Union Bankshares Corporation | | | | | | | | | | | 191,187 | | | | 5,718,403 | |
Banc of California Incorporated | | | | | | | | | | | 169,864 | | | | 2,259,191 | |
Banner Corporation | | | | | | | | | | | 110,160 | | | | 4,552,913 | |
Customers Bancorp Incorporated † | | | | | | | | | | | 193,141 | | | | 3,262,151 | |
FB Financial Corporation | | | | | | | | | | | 129,204 | | | | 4,124,192 | |
First Foundation Incorporated | | | | | | | | | | | 225,404 | | | | 4,003,175 | |
First Interstate BancSystem Class A | | | | | | | | | | | 124,844 | | | | 4,750,314 | |
Great Southern Bancorp Incorporated | | | | | | | | | | | 80,973 | | | | 3,716,661 | |
Heritage Financial Corporation | | | | | | | | | | | 193,037 | | | | 4,491,971 | |
Independent Bank Corporation | | | | | | | | | | | 140,165 | | | | 2,384,207 | |
Midland States Bancorp Incorporated | | | | | | | | | | | 151,969 | | | | 2,575,875 | |
OceanFirst Financial Corporation | | | | | | | | | | | 184,113 | | | | 2,903,462 | |
OFG Bancorp | | | | | | | | | | | 232,843 | | | | 3,900,120 | |
Synovus Financial Corporation | | | | | | | | | | | 202,458 | | | | 6,391,599 | |
Umpqua Holdings Corporation | | | | | | | | | | | 290,956 | | | | 4,041,379 | |
Univest Corporation of Pennsylvania | | | | | | | | | | | 172,205 | | | | 3,153,074 | |
Western Alliance Bancorp | | | | | | | | | | | 121,257 | | | | 6,216,846 | |
| | | | |
| | | | | | | | | | | | | | | 74,536,282 | |
| | | | | | | | | | | | | | | | |
| | | | |
| Capital Markets: 1.38% | | | | | | | | | | | | |
Piper Jaffray Companies Incorporated | | | | | | | | | | | 68,970 | | | | 6,356,965 | |
| | | | | | | | | | | | | | | | |
| | | | |
| Insurance: 1.58% | | | | | | | | | | | | |
American Equity Investment Life Holding Company | | | | | | | | | | | 91,784 | | | | 2,412,084 | |
FBL Financial Group Incorporated | | | | | | | | | | | 54,400 | | | | 2,828,800 | |
State Auto Financial Corporation | | | | | | | | | | | 75,209 | | | | 1,129,639 | |
United Fire Group Incorporated | | | | | | | | | | | 41,591 | | | | 909,595 | |
| | | | |
| | | | | | | | | | | | | | | 7,280,118 | |
| | | | | | | | | | | | | | | | |
| | | | |
| Mortgage REITs: 0.84% | | | | | | | | | | | | |
Capstead Mortgage Corporation | | | | | | | | | | | 683,908 | | | | 3,850,402 | |
| | | | | | | | | | | | | | | | |
| | | | |
| Thrifts & Mortgage Finance: 3.52% | | | | | | | | | | | | |
Axos Financial Incorporated † | | | | | | | | | | | 172,570 | | | | 5,781,095 | |
Homestreet Incorporated | | | | | | | | | | | 128,484 | | | | 4,156,457 | |
Walker & Dunlop Incorporated | | | | | | | | | | | 78,434 | | | | 6,275,504 | |
| | | | |
| | | | | | | | | | | | | | | 16,213,056 | |
| | | | | | | | | | | | | | | | |
The accompanying notes are an integral part of these financial statements.
Wells Fargo Small Company Value Portfolio | 23
Portfolio of investments—November 30, 2020 (unaudited)
| | | | | | | | | | | | | | | | |
| | | | | | | | | Shares | | | Value | |
| Health Care: 5.40% | |
|
| Biotechnology: 0.82% | |
Eagle Pharmaceuticals Incorporated † | | | | | | | | | | | 10,555 | | | $ | 480,253 | |
Five Prime Therapeutics Incorporated † | | | | | | | | | | | 174,938 | | | | 3,288,834 | |
| |
| | | | 3,769,087 | |
| | | | | |
|
| Health Care Equipment & Supplies: 1.58% | |
AngioDynamics Incorporated † | | | | | | | | | | | 129,886 | | | | 1,846,979 | |
ICU Medical Incorporated † | | | | | | | | | | | 12,192 | | | | 2,300,630 | |
Merit Medical Systems Incorporated † | | | | | | | | | | | 56,613 | | | | 3,117,678 | |
| |
| | | | 7,265,287 | |
| | | | | |
|
| Health Care Providers & Services: 2.68% | |
AMN Healthcare Services Incorporated † | | | | | | | | | | | 52,494 | | | | 3,420,509 | |
Brookdale Senior Living Incorporated † | | | | | | | | | | | 397,621 | | | | 1,685,913 | |
LHC Group Incorporated † | | | | | | | | | | | 5,851 | | | | 1,148,668 | |
Option Care Health Incorporated † | | | | | | | | | | | 159,995 | | | | 2,519,921 | |
The Ensign Group Incorporated | | | | | | | | | | | 49,891 | | | | 3,585,666 | |
| |
| | | | 12,360,677 | |
| | | | | |
|
| Health Care Technology: 0.32% | |
Computer Programs & Systems Incorporated | | | | | | | | | | | 52,340 | | | | 1,488,026 | |
| | | | | | | | | | | | | | | | |
|
Industrials: 22.91% | |
|
| Aerospace & Defense: 1.06% | |
Ducommun Incorporated † | | | | | | | | | | | 98,513 | | | | 4,898,066 | |
| | | | | | | | | | | | | | | | |
|
| Air Freight & Logistics: 0.52% | |
Radiant Logistics Incorporated † | | | | | | | | | | | 404,206 | | | | 2,392,900 | |
| | | | | | | | | | | | | | | | |
|
| Airlines: 2.08% | |
Alaska Air Group Incorporated | | | | | | | | | | | 130,525 | | | | 6,652,859 | |
SkyWest Incorporated | | | | | | | | | | | 68,328 | | | | 2,933,321 | |
| |
| | | | 9,586,180 | |
| | | | | |
|
| Building Products: 2.28% | |
American Woodmark Corporation † | | | | | | | | | | | 49,650 | | | | 4,344,872 | |
CSW Industrials Incorporated | | | | | | | | | | | 24,864 | | | | 2,667,659 | |
Patrick Industries Incorporated | | | | | | | | | | | 55,180 | | | | 3,478,547 | |
| |
| | | | 10,491,078 | |
| | | | | |
|
| Commercial Services & Supplies: 2.77% | |
ABM Industries Incorporated | | | | | | | | | | | 95,906 | | | | 3,692,381 | |
Healthcare Services Group Incorporated | | | | | | | | | | | 103,200 | | | | 2,442,744 | |
Herman Miller Incorporated | | | | | | | | | | | 151,631 | | | | 5,404,129 | |
Stericycle Incorporated † | | | | | | | | | | | 17,359 | | | | 1,222,768 | |
| |
| | | | 12,762,022 | |
| | | | | |
|
| Construction & Engineering: 2.08% | |
Comfort Systems Incorporated | | | | | | | | | | | 52,348 | | | | 2,637,816 | |
Great Lakes Dredge & Dock Company † | | | | | | | | | | | 133,748 | | | | 1,510,015 | |
MYR Group Incorporated † | | | | | | | | | | | 38,687 | | | | 1,978,066 | |
Northwest Pipe Company † | | | | | | | | | | | 62,134 | | | | 1,788,217 | |
Sterling Construction Company Incorporated † | | | | | | | | | | | 102,745 | | | | 1,642,893 | |
| |
| | | | 9,557,007 | |
| | | | | |
The accompanying notes are an integral part of these financial statements.
24 | Wells Fargo Small Company Value Portfolio
Portfolio of investments—November 30, 2020 (unaudited)
| | | | | | | | | | | | | | | | |
| | | | | | | | | Shares | | | Value | |
| Electrical Equipment: 2.21% | |
Atkore International Incorporated † | | | | | | | | | | | 123,204 | | | $ | 4,802,492 | |
Encore Wire Corporation | | | | | | | | | | | 26,585 | | | | 1,373,647 | |
Regal-Beloit Corporation | | | | | | | | | | | 33,466 | | | | 3,983,793 | |
| |
| | | | 10,159,932 | |
| | | | | |
|
| Machinery: 6.28% | |
Columbus McKinnon Corporation | | | | | | | | | | | 63,255 | | | | 2,390,406 | |
Federal Signal Corporation | | | | | | | | | | | 83,339 | | | | 2,586,009 | |
Hillenbrand Incorporated | | | | | | | | | | | 134,520 | | | | 5,040,464 | |
Kadant Incorporated | | | | | | | | | | | 29,650 | | | | 3,792,532 | |
Lydall Incorporated † | | | | | | | | | | | 86,741 | | | | 2,376,703 | |
Miller Industries Incorporated | | | | | | | | | | | 107,646 | | | | 3,594,300 | |
Mueller Water Products Incorporated Class A | | | | | | | | | | | 210,380 | | | | 2,497,211 | |
Rexnord Corporation | | | | | | | | | | | 75,969 | | | | 2,849,597 | |
The Shyft Group Incorporated | | | | | | | | | | | 146,265 | | | | 3,792,651 | |
| |
| | | | 28,919,873 | |
| | | | | |
|
| Professional Services: 1.07% | |
CBIZ Incorporated † | | | | | | | | | | | 54,185 | | | | 1,312,361 | |
Kelly Services Incorporated Class A | | | | | | | | | | | 176,942 | | | | 3,620,233 | |
| |
| | | | 4,932,594 | |
| | | | | |
|
| Road & Rail: 1.06% | |
Arcbest Corporation | | | | | | | | | | | 116,813 | | | | 4,895,633 | |
| | | | | | | | | | | | | | | | |
|
| Trading Companies & Distributors: 1.50% | |
BMC Stock Holdings Incorporated † | | | | | | | | | | | 78,417 | | | | 3,837,728 | |
CAI International Incorporated | | | | | | | | | | | 97,489 | | | | 3,085,527 | |
| |
| | | | 6,923,255 | |
| | | | | |
|
Information Technology: 8.54% | |
|
| Communications Equipment: 0.62% | |
NETGEAR Incorporated † | | | | | | | | | | | 89,472 | | | | 2,846,104 | |
| | | | | | | | | | | | | | | | |
|
| Electronic Equipment, Instruments & Components: 3.04% | |
ePlus Incorporated † | | | | | | | | | | | 32,327 | | | | 2,725,489 | |
Insight Enterprises Incorporated † | | | | | | | | | | | 67,895 | | | | 4,853,135 | |
Methode Electronics Incorporated | | | | | | | | | | | 112,274 | | | | 3,931,835 | |
PC Connection Incorporated | | | | | | | | | | | 54,816 | | | | 2,502,350 | |
| |
| | | | 14,012,809 | |
| | | | | |
|
| IT Services: 1.53% | |
Conduent Incorporated † | | | | | | | | | | | 676,117 | | | | 2,853,214 | |
Hackett Group Incorporated | | | | | | | | | | | 14,521 | | | | 204,456 | |
TTEC Holdings Incorporated | | | | | | | | | | | 37,291 | | | | 2,523,109 | |
Unisys Corporation † | | | | | | | | | | | 101,903 | | | | 1,485,746 | |
| |
| | | | 7,066,525 | |
| | | | | |
|
| Semiconductors & Semiconductor Equipment: 2.47% | |
Cirrus Logic Incorporated † | | | | | | | | | | | 25,478 | | | | 2,040,788 | |
Diodes Incorporated † | | | | | | | | | | | 29,328 | | | | 1,993,131 | |
FormFactor Incorporated † | | | | | | | | | | | 61,252 | | | | 2,511,332 | |
Ichor Holdings Limited † | | | | | | | | | | | 71,087 | | | | 2,267,675 | |
Onto Innovation Incorporated † | | | | | | | | | | | 57,691 | | | | 2,550,519 | |
| |
| | | | 11,363,445 | |
| | | | | |
The accompanying notes are an integral part of these financial statements.
Wells Fargo Small Company Value Portfolio | 25
Portfolio of investments—November 30, 2020 (unaudited)
| | | | | | | | | | | | | | | | |
| | | | | | | | | Shares | | | Value | |
| Software: 0.23% | |
American Software Incorporated Class A | | | | | | | | | | | 65,316 | | | $ | 1,072,489 | |
| | | | | | | | | | | | | | | | |
|
| Technology Hardware, Storage & Peripherals: 0.65% | |
NCR Corporation † | | | | | | | | | | | 107,737 | | | | 2,981,083 | |
| | | | | | | | | | | | | | | | |
|
Materials: 8.91% | |
|
| Chemicals: 2.93% | |
Hawkins Incorporated | | | | | | | | | | | 57,504 | | | | 2,885,551 | |
Ingevity Corporation † | | | | | | | | | | | 61,355 | | | | 4,085,016 | |
Minerals Technologies Incorporated | | | | | | | | | | | 86,423 | | | | 5,243,283 | |
Stepan Company | | | | | | | | | | | 10,982 | | | | 1,275,669 | |
| |
| | | | 13,489,519 | |
| | | | | |
|
| Construction Materials: 1.07% | |
Eagle Materials Incorporated | | | | | | | | | | | 54,280 | | | | 4,938,937 | |
| | | | | | | | | | | | | | | | |
|
| Containers & Packaging: 0.38% | |
UFP Technologies Incorporated † | | | | | | | | | | | 39,500 | | | | 1,740,765 | |
| | | | | | | | | | | | | | | | |
|
| Metals & Mining: 3.67% | |
Kaiser Aluminum Corporation | | | | | | | | | | | 68,445 | | | | 5,337,341 | |
Schnitzer Steel Industries Incorporated Class A | | | | | | | | | | | 253,761 | | | | 6,501,357 | |
United States Steel Corporation | | | | | | | | | | | 355,820 | | | | 5,049,086 | |
| |
| | | | 16,887,784 | |
| | | | | |
|
| Paper & Forest Products: 0.86% | |
Schweitzer-Mauduit International Incorporated | | | | | | | | | | | 114,098 | | | | 3,968,328 | |
| | | | | | | | | | | | | | | | |
|
Real Estate: 8.83% | |
|
| Equity REITs: 8.83% | |
Agree Realty Corporation | | | | | | | | | | | 45,207 | | | | 2,979,141 | |
American Campus Communities Incorporated | | | | | | | | | | | 79,191 | | | | 3,151,802 | |
Armada Hoffler Properties Incorporated | | | | | | | | | | | 271,395 | | | | 2,879,501 | |
Global Medical REIT Incorporated | | | | | | | | | | | 198,134 | | | | 2,712,454 | |
Independence Realty Trust Incorporated | | | | | | | | | | | 285,382 | | | | 3,675,720 | |
Investors Real Estate Trust | | | | | | | | | | | 31,812 | | | | 2,207,753 | |
Lexington Corporate Properties Trust | | | | | | | | | | | 205,949 | | | | 2,102,739 | |
Monmouth Real Estate Investment Corporation | | | | | | | | | | | 147,786 | | | | 2,191,666 | |
One Liberty Properties Incorporated | | | | | | | | | | | 133,722 | | | | 2,377,577 | |
Outfront Media Incorporated | | | | | | | | | | | 215,894 | | | | 4,089,032 | |
PotlatchDeltic Corporation | | | | | | | | | | | 91,580 | | | | 4,262,133 | |
Retail Opportunity Investment Corporation | | | | | | | | | | | 64,077 | | | | 831,719 | |
RLJ Lodging Trust | | | | | | | | | | | 157,208 | | | | 1,938,375 | |
STAG Industrial Incorporated | | | | | | | | | | | 113,214 | | | | 3,371,513 | |
Summit Hotel Properties Incorporated | | | | | | | | | | | 217,987 | | | | 1,894,307 | |
| |
| | | | 40,665,432 | |
| | | | | |
| |
Total Common Stocks (Cost $378,017,724) | | | | 455,881,112 | |
| | | | | |
| | | | |
| | | | | | | | | | | | | | | | |
The accompanying notes are an integral part of these financial statements.
26 | Wells Fargo Small Company Value Portfolio
Portfolio of investments—November 30, 2020 (unaudited)
| | | | | | | | | | | | | | | | |
| | | | | | Expiration date | | | Shares | | | Value | |
| Warrants: 0.00% | | | | | | | | | | | | |
| | | | |
Energy: 0.00% | | | | | | | | | | | | | | | | |
| | | | |
| Energy Equipment & Services: 0.00% | | | | | | | | | | | | |
Parker Drilling Company †(a) | | | | | | | 9-16-2024 | | | | 8,457 | | | $ | 0 | |
| | | | | | | | | | | | | | | | |
| | | | |
Total Warrants (Cost $0) | | | | | | | | | | | | | | | 0 | |
| | | | | | | | | | | | | | | | |
| | | | |
| | | | | | | | | | | | | | | | |
| | | Yield | | | | | | | | | | |
| Short-Term Investments: 2.16% | | | | | | | | | | | | |
| | | | |
| Investment Companies: 2.16% | | | | | | | | | | | | |
Securities Lending Cash Investments LLC (l)(r)(u) | | | 0.12 | % | | | | | | | 6,188,169 | | | | 6,188,169 | |
Wells Fargo Government Money Market Fund Select Class (l)(u) | | | 0.02 | | | | | | | | 3,783,891 | | | | 3,783,891 | |
| | | | |
Total Short-Term Investments (Cost $9,972,060) | | | | | | | | | | | | | | | 9,972,060 | |
| | | | | | | | | | | | | | | | |
| | | | | | | | |
| Total investments in securities (Cost $387,989,784) | | | 101.14 | % | | | 465,853,172 | |
| | |
Other assets and liabilities, net | | | (1.14 | ) | | | (5,261,152 | ) |
| | | | | | | | |
| Total net assets | | | 100.00 | % | | $ | 460,592,020 | |
| | | | | | | | |
| « | All or a portion of this security is on loan. |
| † | Non-income-earning security |
| (a) | The security is fair valued in accordance with procedures approved by the Board of Trustees. |
| (l) | The issuer of the security is an affiliated person of the Portfolio as defined in the Investment Company Act of 1940. |
| (r) | The investment is a non-registered investment company purchased with cash collateral received from securities on loan. |
| (u) | The rate represents the 7-day annualized yield at period end. |
Abbreviations:
| REIT | Real estate investment trust |
Investments in Affiliates
An affiliated investment is an investment in which the Portfolio owns at least 5% of the outstanding voting shares of the issuer or as a result of other relationships, such as the Portfolio and the issuer having the same adviser or investment manager. Transactions with issuers that were either affiliated persons of the Portfolio at the beginning of the period or the end of the period were as follows:
| | | | | | | | | | | | | | | | | | | | | | | | | | | | | | | | | | | | |
| | | Value,
beginning of
period | | | Purchases | | | Sale
proceeds | | | Net
realized
gains
(losses) | | | Net
change in
unrealized
gains
(losses) | | | Value,
end of
period | | | % of
net
assets | | | Shares
end of
period | | | Income
from
affiliated
securities | |
| | | | | | | | | |
| Short-Term Investments | | | | | | | | | | | | | | | | | | | | | | | | | | | |
Investment Companies | | | | | | | | | | | | | | | | | | | | | | | | | | | | | | | | | | | | |
Securities Lending Cash Investments LLC | | $ | 0 | | | $ | 43,768,644 | | | $ | (37,580,475 | ) | | $ | 0 | | | $ | 0 | | | $ | 6,188,169 | | | | | | | | 6,188,169 | | | $ | 2,085 | # |
Wells Fargo Government Money Market Fund Select Class | | | 2,323,207 | | | | 41,031,781 | | | | (39,571,097 | ) | | | 0 | | | | 0 | | | | 3,783,891 | | | | | | | | 3,783,891 | | | | 1,132 | |
| | | | | | | | | | | | | | | | | | | | | | | | | | | | | | | | | | | | |
| | | | | | | | | | | | | | $ | 0 | | | $ | 0 | | | $ | 9,972,060 | | | | 2.16 | % | | | | | | $ | 3,217 | |
| | | | | | | | | | | | | | | | | | | | | | | | | | | | | | | | | | | | |
| # | Amount shown represents income before fees and rebates. |
The accompanying notes are an integral part of these financial statements.
Wells Fargo Small Company Value Portfolio | 27
Statement of assets and liabilities—November 30, 2020 (unaudited)
| | | | |
| | | | |
| |
Assets | | | | |
Investments in unaffiliated securities (Including $5,995,628 of securities loaned), at value (cost $378,017,724) | | $ | 455,881,112 | |
Investments in affiliated securities, at value (cost $9,972,060) | | | 9,972,060 | |
Receivable for investments sold | | | 792,576 | |
Receivable for dividends | | | 311,616 | |
Receivable for securities lending income, net | | | 3,981 | |
Prepaid expenses and other assets | | | 81,239 | |
| | | | |
Total assets | | | 467,042,584 | |
| | | | |
| |
Liabilities | | | | |
Payable upon receipt of securities loaned | | | 6,188,169 | |
Advisory fee payable | | | 251,487 | |
Accrued expenses and other liabilities | | | 10,908 | |
| | | | |
Total liabilities | | | 6,450,564 | |
| | | | |
Total net assets | | $ | 460,592,020 | |
| | | | |
The accompanying notes are an integral part of these financial statements.
28 | Wells Fargo Small Company Value Portfolio
Statement of operations—six months ended November 30, 2020 (unaudited)
| | | | |
| | | | |
| |
Investment income | | | | |
Dividends (net of foreign withholding taxes of $3,419) | | $ | 4,344,865 | |
Income from affiliated securities | | | 27,838 | |
| | | | |
Total investment income | | | 4,372,703 | |
| | | | |
| |
Expenses | | | | |
Advisory fee | | | 1,684,761 | |
Custody and accounting fees | | | 14,644 | |
Professional fees | | | 23,653 | |
Shareholder report expenses | | | 6,167 | |
Trustees’ fees and expenses | | | 9,583 | |
Other fees and expenses | | | 4,867 | |
| | | | |
Total expenses | | | 1,743,675 | |
Less: Fee waivers and/or expense reimbursements | | | (185,271 | ) |
| | | | |
Net expenses | | | 1,558,404 | |
| | | | |
Net investment income | | | 2,814,299 | |
| | | | |
| |
Realized and unrealized gains (losses) on investments | | | | |
Net realized gains on investments | | | 547,220 | |
Net change in unrealized gains (losses) on investments | | | 100,393,468 | |
| | | | |
Net realized and unrealized gains (losses) on investments | | | 100,940,688 | |
| | | | |
Net increase in net assets resulting from operations | | $ | 103,754,987 | |
| | | | |
The accompanying notes are an integral part of these financial statements.
Wells Fargo Small Company Value Portfolio | 29
Statement of changes in net assets
| | | | | | | | |
| | | Six months ended
November 30, 2020
(unaudited) | | | Year ended
May 31, 2020 | |
| | |
Operations | | | | | | | | |
Net investment income | | $ | 2,814,299 | | | $ | 4,223,447 | |
Net realized gains (losses) on investments | | | 547,220 | | | | (50,607,316 | ) |
Net change in unrealized gains (losses) on investments | | | 100,393,468 | | | | (40,450,997 | ) |
| | | | |
Net increase (decrease) in net assets resulting from operations | | | 103,754,987 | | | | (86,834,866 | ) |
| | | | |
| | |
Capital Transactions | | | | | | | | |
Transactions in investors’ beneficial interests | | | | | | | | |
Contribution | | | 17,803,789 | | | | 464,639,096 | |
Withdrawals | | | (62,636,146 | ) | | | (103,765,259 | ) |
| | | | | | | | |
Net increase (decrease) in net assets resulting from capital transactions | | | (44,832,357 | ) | | | 360,873,837 | |
| | | | |
Total increase in net assets | | | 58,922,630 | | | | 274,038,971 | |
| | | | |
| | |
Net assets | | | | | | | | |
Beginning of period | | | 401,669,390 | | | | 127,630,419 | |
| | | | |
End of period | | $ | 460,592,020 | | | $ | 401,669,390 | |
| | | | |
The accompanying notes are an integral part of these financial statements.
30 | Wells Fargo Small Company Value Portfolio
Financial highlights
| | | | | | | | | | | | | | | | | | | | | | | | |
| | | Six months ended
November 30, 2020
(unaudited) | | | Year ended May 31 | |
| | | 2020 | | | 2019 | | | 2018 | | | 2017 | | | 2016 | |
Total return1 | | | 27.60 | % | | | (13.74 | )% | | | (14.51 | )% | | | 20.10 | % | | | 19.44 | % | | | (4.96 | )% |
Ratios to average net assets (annualized) | | | | | | | | | | | | | | | | | | | | | | | | |
Gross expenses | | | 0.83 | % | | | 0.82 | % | | | 0.86 | % | | | 0.85 | % | | | 0.84 | % | | | 0.85 | % |
Net expenses | | | 0.74 | % | | | 0.74 | % | | | 0.75 | % | | | 0.84 | % | | | 0.84 | % | | | 0.85 | % |
Net investment income | | | 1.34 | % | | | 1.15 | % | | | 0.80 | % | | | 0.87 | % | | | 0.72 | % | | | 0.62 | % |
Supplemental data | | | | | | | | | | | | | | | | | | | | | | | | |
Portfolio turnover rate | | | 43 | % | | | 78 | % | | | 168 | % | | | 144 | % | | | 110 | % | | | 72 | % |
| 1 | Returns for periods of less than one year are not annualized |
The accompanying notes are an integral part of these financial statements.
Wells Fargo Small Company Value Portfolio | 31
Notes to financial statements (unaudited)
1. ORGANIZATION
Wells Fargo Master Trust (the “Trust”), a Delaware statutory trust organized on March 10, 1999, is an open-end management investment company registered under the Investment Company Act of 1940, as amended (the “1940 Act”). As an investment company, the Trust follows the accounting and reporting guidance in Financial Accounting Standards Board Accounting Standards Codification Topic 946, Financial Services – Investment Companies. These financial statements report on the Wells Fargo Small Company Value Portfolio (the “Portfolio”) which is a diversified series of the Trust.
2. SIGNIFICANT ACCOUNTING POLICIES
The following significant accounting policies, which are consistently followed in the preparation of the financial statements of the Portfolio, are in conformity with U.S. generally accepted accounting principles which require management to make estimates and assumptions that affect the reported amounts of assets and liabilities, disclosure of contingent assets and liabilities at the date of the financial statements, and the reported amounts of revenues and expenses during the reporting period. Actual results could differ from those estimates.
Securities valuation
All investments are valued each business day as of the close of regular trading on the New York Stock Exchange (generally 4 p.m. Eastern Time), although the Portfolio may deviate from this calculation time under unusual or unexpected circumstances.
Equity securities that are listed on a foreign or domestic exchange or market are valued at the official closing price or, if none, the last sales price. If no sale occurs on the principal exchange or market that day, a fair value price will be determined in accordance with the Portfolio’s Valuation Procedures.
Investments in registered open-end investment companies are valued at net asset value. Interests in non-registered investment companies that are redeemable at net asset value are fair valued normally at net asset value.
Investments which are not valued using any of the methods discussed above are valued at their fair value, as determined in good faith by the Board of Trustees of the Portfolio. The Board of Trustees has established a Valuation Committee comprised of the Trustees and has delegated to it the authority to take any actions regarding the valuation of portfolio securities that the Valuation Committee deems necessary or appropriate, including determining the fair value of portfolio securities, unless the determination has been delegated to the Wells Fargo Asset Management Pricing Committee at Wells Fargo Funds Management, LLC (“Funds Management”). The Board of Trustees retains the authority to make or ratify any valuation decisions or approve any changes to the Valuation Procedures as it deems appropriate. On a quarterly basis, the Board of Trustees receives reports on any valuation actions taken by the Valuation Committee or the Wells Fargo Asset Management Pricing Committee which may include items for ratification.
Securities lending
The Portfolio may lend its securities from time to time in order to earn additional income in the form of fees or interest on securities received as collateral or the investment of any cash received as collateral. When securities are on loan, the Portfolio receives interest or dividends on those securities. Cash collateral received in connection with its securities lending transactions is invested in Securities Lending Cash Investments, LLC (the “Securities Lending Fund”). Investments in Securities Lending Fund are valued at the evaluated bid price provided by an independent pricing service. Income earned from investment in the Securities Lending Fund (net of fees and rebates), if any, is included in income from affiliated securities on the Statements of Operations.
In a securities lending transaction, the net asset value of the Portfolio will be affected by an increase or decrease in the value of the securities loaned and by an increase or decrease in the value of the instrument in which collateral is invested. The amount of securities lending activity undertaken by the Portfolio fluctuates from time to time. The Portfolio has the right under the lending agreement to recover the securities from the borrower on demand. In the event of default or bankruptcy by the borrower, the Portfolio may be prevented from recovering the loaned securities or gaining access to the collateral or may experience delays or costs in doing so. In such an event, the terms of the agreement allows the unaffiliated securities lending agent to use the collateral to purchase replacement securities on behalf of the Portfolio or pay the Portfolio the market value of the loaned securities. The Portfolio bears the risk of loss with respect to depreciation of its investment of the cash collateral.
Security transactions and income recognition
Securities transactions are recorded on a trade date basis. Realized gains or losses are recorded on the basis of identified cost.
Dividend income is recognized on the ex-dividend date. Dividend income is recorded net of foreign taxes withheld where recovery of such taxes is not assured.
32 | Wells Fargo Small Company Value Portfolio
Notes to financial statements (unaudited)
Federal and other taxes
The Portfolio is treated as a separate entity for federal income tax purposes. The Portfolio is not required to pay federal income taxes on its net investment income and net capital gains as it is treated as a partnership for federal income tax purposes. All interest, dividends, gains and losses of the Portfolio are deemed to have been “passed through” to the interest holders in proportion to their holdings of the Portfolio regardless of whether such interest, dividends and gains have been distributed by the Portfolio.
The Portfolio’s income tax returns and all financial records supporting those returns for the prior three fiscal years are subject to examination by the federal revenue authority. Management has analyzed the Portfolio’s tax positions taken on federal, state, and foreign tax returns for all open tax years and does not believe that there are any uncertain tax positions that require recognition of a tax liability.
As of November 30, 2020, the aggregate cost of all investments for federal income tax purposes was $400,245,512 and the unrealized gains (losses) consisted of:
| | | | |
| |
Gross unrealized gains | | $ | 92,388,287 | |
| |
Gross unrealized losses | | | (26,780,627 | ) |
| |
Net unrealized gains | | $ | 65,607,660 | |
3. FAIR VALUATION MEASUREMENTS
Fair value measurements of investments are determined within a framework that has established a fair value hierarchy based upon the various data inputs utilized in determining the value of the Portfolio’s investments. The three-level hierarchy gives the highest priority to unadjusted quoted prices in active markets for identical assets or liabilities (Level 1) and the lowest priority to unobservable inputs (Level 3). The Portfolio’s investments are classified within the fair value hierarchy based on the lowest level of input that is significant to the fair value measurement. The inputs are summarized into three broad levels as follows:
| ∎ | | Level 1 – quoted prices in active markets for identical securities |
| ∎ | | Level 2 – other significant observable inputs (including quoted prices for similar securities, interest rates, prepayment speeds, credit risk, etc.) |
| ∎ | | Level 3 – significant unobservable inputs (including the Portfolio’s own assumptions in determining the fair value of investments) |
The inputs or methodologies used for valuing investments in securities are not necessarily an indication of the risk associated with investing in those securities.
The following is a summary of the inputs used in valuing the Portfolio’s assets and liabilities as of November 30, 2020:
| | | | | | | | | | | | | | | | |
| | | | |
| | | Quoted prices
(Level 1) | | | Other significant
observable inputs
(Level 2) | | | Significant
unobservable inputs (Level 3) | | | Total | |
| | | | |
Assets | | | | | | | | | | | | | | | | |
Investments in: | | | | | | | | | | | | | | | | |
| | | | |
Common stocks | | | | | | | | | | | | | | | | |
| | | | |
Communication services | | $ | 2,157,192 | | | $ | 0 | | | $ | 0 | | | $ | 2,157,192 | |
| | | | |
Consumer discretionary | | | 77,117,570 | | | | 0 | | | | 0 | | | | 77,117,570 | |
| | | | |
Energy | | | 16,934,690 | | | | 0 | | | | 0 | | | | 16,934,690 | |
| | | | |
Financials | | | 108,236,823 | | | | 0 | | | | 0 | | | | 108,236,823 | |
| | | | |
Health care | | | 24,883,077 | | | | 0 | | | | 0 | | | | 24,883,077 | |
| | | | |
Industrials | | | 105,518,540 | | | | 0 | | | | 0 | | | | 105,518,540 | |
| | | | |
Information technology | | | 39,342,455 | | | | 0 | | | | 0 | | | | 39,342,455 | |
| | | | |
Materials | | | 41,025,333 | | | | 0 | | | | 0 | | | | 41,025,333 | |
| | | | |
Real estate | | | 40,665,432 | | | | 0 | | | | 0 | | | | 40,665,432 | |
| | | | |
Warrants | | | | | | | | | | | | | | | | |
| | | | |
Energy | | | 0 | | | | 0 | | | | 0 | | | | 0 | |
| | | | |
Short-term investments | | | | | | | | | | | | | | | | |
| | | | |
Investment companies | | | 9,972,060 | | | | 0 | | | | 0 | | | | 9,972,060 | |
| | | | |
Total assets | | $ | 465,853,172 | | | $ | 0 | | | $ | 0 | | | $ | 465,853,172 | |
Wells Fargo Small Company Value Portfolio | 33
Notes to financial statements (unaudited)
Additional sector, industry or geographic detail for the Portfolio is included in the Portfolio of investments.
For the six months ended November 30, 2020, the Portfolio did not have any transfers into/out of Level 3.
4. TRANSACTIONS WITH AFFILIATES
Advisory fee
The Trust has entered into an advisory contract with Funds Management , an indirect wholly owned subsidiary of Wells Fargo & Company (“Wells Fargo”). The adviser is responsible for implementing investment policies and guidelines and for supervising the subadviser, who is responsible for day-to-day portfolio management of the Portfolio. Pursuant to the contract, Funds Management is entitled to receive an advisory fee at the following annual rate based on the Portfolio’s average daily net assets:
| | |
| |
| Average daily net assets | | Advisory fee |
| |
First $500 million | | 0.800% |
| |
Next $500 million | | 0.775 |
| |
Next $1 billion | | 0.750 |
| |
Next $1 billion | | 0.725 |
| |
Next $1 billion | | 0.700 |
| |
Over $4 billion | | 0.680 |
For the six months ended November 30, 2020, the advisory fee was equivalent to an annual rate of 0.80% of the Portfolio’s average daily net assets.
Funds Management has retained the services of a subadviser to provide daily portfolio management to the Portfolio. The fee for subadvisory services is borne by Funds Management. Wells Capital Management Incorporated (“WellsCap”), an affiliate of Funds Management and an indirect wholly owned subsidiary of Wells Fargo, is the subadviser to the Portfolio and is entitled to receive a fee from Funds Management at the following annual rate starting at 0.55% and declining to 0.40% as the average daily net assets of the Portfolio increase.
Funds Management has voluntarily waived and/or reimbursed advisory fees to reduce the net operating expense ratio of the Portfolio.
Interfund transactions
The Portfolio may purchase or sell portfolio investment securities to certain other Wells Fargo affiliates pursuant to Rule 17a-7 under the 1940 Act and under procedures adopted by the Board of Trustees. The procedures have been designed to ensure that these interfund transactions, which do not incur broker commissions, are effected at current market prices.
5. INVESTMENT PORTFOLIO TRANSACTIONS
Purchases and sales of investments, excluding U.S. government obligations (if any) and short-term securities, for the six months ended November 30, 2020 were $176,546,816 and $219,340,316, respectively.
6. SECURITIES LENDING TRANSACTIONS
The Portfolio lends its securities through an unaffiliated securities lending agent and receives collateral in the form of cash or securities with a value at least equal to the value of the securities on loan. The value of the loaned securities is determined at the close of each business day and any increases or decreases in the required collateral are exchanged between the Portfolio and the counterparty on the next business day. Cash collateral received is invested in the Securities Lending Fund which seeks to provide a positive return compared to the daily Federal Funds Open Rate by investing in high-quality, U.S. dollar-denominated short-term money market instruments and is exempt from registration under Section 3(c)(7) of the 1940 Act. Securities Lending Fund is managed by Funds Management and is subadvised by WellsCap. Funds Management receives an advisory fee starting at 0.05% and declining to 0.01% as the average daily net assets of the Securities Lending Fund increase. All of the fees received by Funds Management are paid to WellsCap for its services as subadviser.
34 | Wells Fargo Small Company Value Portfolio
Notes to financial statements (unaudited)
In the event of counterparty default or the failure of a borrower to return a loaned security, the Fund has the right to use the collateral to offset any losses incurred. As of November 30, 2020, the Fund had securities lending transactions with the following counterparties which are subject to offset:
| | | | | | | | | | | | |
| | | |
| Counterparty | | Value of
securities on
loan | | | Collateral
received1 | | | Net amount | |
| | | |
Bank of America Securities Inc. | | $ | 2,210,379 | | | $ | (2,210,379 | ) | | $ | 0 | |
| | | |
Barclays Capital Inc. | | | 1,636,097 | | | | (1,636,097 | ) | | | 0 | |
| | | |
Citigroup Global Markets Inc. | | | 1,667,952 | | | | (1,667,952 | ) | | | 0 | |
| | | |
Credit Suisse Securities (USA) LLC | | | 277,113 | | | | (277,113 | ) | | | 0 | |
| | | |
JPMorgan Securities LLC | | | 29,595 | | | | (29,595 | ) | | | 0 | |
| | | |
Morgan Stanley & Co. LLC | | | 174,492 | | | | (174,492 | ) | | | 0 | |
| 1 | Collateral received within this table is limited to the collateral for the net transaction with the counterparty. |
7. BANK BORROWINGS
The Trust, along with Wells Fargo Variable Trust and Wells Fargo Funds Trust (excluding the money market funds), are parties to a $350,000,000 revolving credit agreement whereby the Portfolio is permitted to use bank borrowings for temporary or emergency purposes, such as to fund shareholder redemption requests. Interest under the credit agreement is charged to the Portfolio based on a borrowing rate equal to the higher of the Federal Funds rate in effect on that day plus 1.25% or the overnight LIBOR rate in effect on that day plus 1.25%. In addition, an annual commitment fee equal to 0.25% of the unused balance is allocated to each participating fund.
For the six months ended November 30, 2020, there were no borrowings by the Portfolio under the agreement.
8. INDEMNIFICATION
Under the Portfolio’s organizational documents, the officers and Trustees have been granted certain indemnification rights against certain liabilities that may arise out of performance of their duties to the Portfolio. The Portfolio has entered into a separate agreement with each Trustee that converts indemnification rights currently existing under the Portfolio’s organizational documents into contractual rights that cannot be changed in the future without the consent of the Trustee. Additionally, in the normal course of business, the Portfolio may enter into contracts with service providers that contain a variety of indemnification clauses. The Portfolio’s maximum exposure under these arrangements is dependent on future claims that may be made against the Portfolio and, therefore, cannot be estimated.
9. NEW ACCOUNTING PRONOUNCEMENT
In August 2018, FASB issued Accounting Standards Update (“ASU”) No. 2018-13, Fair Value Measurement (Topic 820) Disclosure Framework—Changes to the Disclosure Requirements for Fair Value Measurement. ASU 2018-13 updates the disclosure requirements on fair value measurements in Topic 820, Fair Value Measurements. The amendments are effective for fiscal years, and interim periods within those fiscal years, beginning after December 15, 2019. Management has adopted this guidance which did not have a material impact on the financial statements.
10. CORONAVIRUS (COVID-19) PANDEMIC
On March 11, 2020, the World Health Organization announced that it had made the assessment that coronavirus disease 2019 (“COVID-19”) is a pandemic. The impacts of COVID-19 are adversely affecting the entire global economy, individual companies and investment products, and the market in general. There is significant uncertainty around the extent and duration of business disruptions related to COVID-19 and the impacts may be short term or may last for an extended period of time. The risk of further spreading of COVID-19 has led to significant uncertainty and volatility in the financial markets.
Wells Fargo Small Company Value Portfolio | 35
Other information (unaudited)
PROXY VOTING INFORMATION
A description of the policies and procedures used to determine how to vote proxies relating to portfolio securities is available, upon request, by calling 1-800-222-8222, visiting our website at wfam.com, or visiting the SEC website at sec.gov. Information regarding how the proxies related to portfolio securities were voted during the most recent 12-month period ended June 30 is available on the website at wfam.com or by visiting the SEC website at sec.gov.
QUARTERLY PORTFOLIO HOLDINGS INFORMATION
The Fund and Portfolio file their complete schedule of portfolio holdings with the SEC for the first and third quarters of each fiscal year as an exhibit to its reports on Form N-PORT. Shareholders may view the filed Form N-PORT by visiting the SEC website at sec.gov.
36 | Wells Fargo Small Company Value Fund
Other information (unaudited)
BOARD OF TRUSTEES AND OFFICERS
Each of the Trustees and Officers1 listed in the table below acts in identical capacities for each fund in the Wells Fargo family of funds, which consists of 144 mutual funds comprising the Wells Fargo Funds Trust, Wells Fargo Variable Trust, Wells Fargo Master Trust and four closed-end funds (collectively the “Fund Complex”). This table should be read in conjunction with the Prospectus and the Statement of Additional Information2. The mailing address of each Trustee and Officer is 525 Market Street, 12th Floor, San Francisco, CA 94105. Each Trustee and Officer serves an indefinite term, however, each Trustee serves such term until reaching the mandatory retirement age established by the Trustees.
Independent Trustees
| | | | | | |
Name and year of birth | | Position held and length of service* | | Principal occupations during past five years or longer | | Current other public company or investment
company
directorships |
| | | |
William R. Ebsworth (Born 1957) | | Trustee, since 2015 | | Retired. From 1984 to 2013, equities analyst, portfolio manager, research director and chief investment officer at Fidelity Management and Research Company in Boston, Tokyo, and Hong Kong, and retired in 2013 as Chief Investment Officer of Fidelity Strategic Advisers, Inc. where he led a team of investment professionals managing client assets. Prior thereto, Board member of Hong Kong Securities Clearing Co., Hong Kong Options Clearing Corp., the Thailand International Fund, Ltd., Fidelity Investments Life Insurance Company, and Empire Fidelity Investments Life Insurance Company. Audit Committee Chair and Investment Committee Chair of the Vincent Memorial Hospital Endowment (non-profit organization). Mr. Ebsworth is a CFA® charterholder. | | N/A |
| | | |
Jane A. Freeman (Born 1953) | | Trustee, since 2015; Chair Liaison, since 2018 | | Retired. From 2012 to 2014 and 1999 to 2008, Chief Financial Officer of Scientific Learning Corporation. From 2008 to 2012, Ms. Freeman provided consulting services related to strategic business projects. Prior to 1999, Portfolio Manager at Rockefeller & Co. and Scudder, Stevens & Clark. Board member of the Harding Loevner Funds from 1996 to 2014, serving as both Lead Independent Director and chair of the Audit Committee. Board member of the Russell Exchange Traded Funds Trust from 2011 to 2012 and the chair of the Audit Committee. Ms. Freeman is also an inactive Chartered Financial Analyst. | | N/A |
| | | |
Isaiah Harris, Jr. (Born 1952) | | Trustee, since 2009; Audit Committee Chair, since 2019 | | Retired. Chairman of the Board of CIGNA Corporation since 2009, and Director since 2005. From 2003 to 2011, Director of Deluxe Corporation. Prior thereto, President and CEO of BellSouth Advertising and Publishing Corp. from 2005 to 2007, President and CEO of BellSouth Enterprises from 2004 to 2005 and President of BellSouth Consumer Services from 2000 to 2003. Emeritus member of the Iowa State University Foundation Board of Governors. Emeritus Member of the Advisory Board of Iowa State University School of Business. Advisory Board Member, Palm Harbor Academy (private school). Mr. Harris is a certified public accountant (inactive status). | | CIGNA Corporation |
| | | |
Judith M. Johnson (Born 1949) | | Trustee, since 2008 | | Retired. Prior thereto, Chief Executive Officer and Chief Investment Officer of Minneapolis Employees Retirement Fund from 1996 to 2008. Ms. Johnson is an attorney, certified public accountant and a certified managerial accountant. | | N/A |
| | | |
David F. Larcker (Born 1950) | | Trustee, since 2009 | | James Irvin Miller Professor of Accounting at the Graduate School of Business (Emeritus), Stanford University, Director of the Corporate Governance Research Initiative and Senior Faculty of The Rock Center for Corporate Governance since 2006. From 2005 to 2008, Professor of Accounting at the Graduate School of Business, Stanford University. Prior thereto, Ernst & Young Professor of Accounting at The Wharton School, University of Pennsylvania from 1985 to 2005. | | N/A |
Wells Fargo Small Company Value Fund | 37
Other information (unaudited)
| | | | | | |
Name and year of birth | | Position held and length of service* | | Principal occupations during past five years or longer | | Current other public company or investment
company
directorships |
| | | |
Olivia S. Mitchell (Born 1953) | | Trustee, since 2006; Nominating and Governance Committee Chair, since 2018 | | International Foundation of Employee Benefit Plans Professor, Wharton School of the University of Pennsylvania since 1993. Director of Wharton’s Pension Research Council and Boettner Center on Pensions & Retirement Research, and Research Associate at the National Bureau of Economic Research. Previously, Cornell University Professor from 1978 to 1993. | | N/A |
| | | |
Timothy J. Penny (Born 1951) | | Trustee, since 1996; Chair, since 2018 | | President and Chief Executive Officer of Southern Minnesota Initiative Foundation, a non-profit organization, since 2007. Member of the Board of Trustees of NorthStar Education Finance, Inc., a non-profit organization, since 2007. | | N/A |
| | | |
James G. Polisson (Born 1959) | | Trustee, since 2018 | | Retired. Chief Marketing Officer, Source (ETF) UK Services, Ltd, from 2015 to 2017. From 2012 to 2015, Principal of The Polisson Group, LLC, a management consulting, corporate advisory and principal investing company. Chief Executive Officer and Managing Director at Russell Investments, Global Exchange Traded Funds from 2010 to 2012. Managing Director of Barclays Global Investors from 1998 to 2010 and Global Chief Marketing Officer for iShares and Barclays Global Investors from 2000 to 2010. Trustee of the San Francisco Mechanics’ Institute, a non-profit organization, from 2013 to 2015. Board member of the Russell Exchange Traded Fund Trust from 2011 to 2012. Director of Barclays Global Investors Holdings Deutschland GmbH from 2006 to 2009. Mr. Polisson is an attorney and has a retired status with the Massachusetts and District of Columbia Bar Associations. | | N/A |
| | | |
Pamela Wheelock (Born 1959) | | Trustee, since January 2020; previously Trustee from January 2018 to July 2019 | | Board member of the Destination Medical Center Economic Development Agency, Rochester, Minnesota since 2019. Interim President of the McKnight Foundation from January to September 2020. Acting Commissioner, Minnesota Department of Human Services, July 2019 through September 2019. Human Services Manager (part-time), Minnesota Department of Human Services, October 2019 through December 2019. Chief Operating Officer, Twin Cities Habitat for Humanity from 2017 to 2019. Vice President of University Services, University of Minnesota from 2012 to 2016. Prior thereto, on the Board of Directors, Governance Committee and Finance Committee for the Minnesota Philanthropy Partners (Saint Paul Foundation) from 2012 to 2018, Interim Chief Executive Officer of Blue Cross Blue Shield of Minnesota from 2011 to 2012, Chairman of the Board from 2009 to 2012 and Board Director from 2003 to 2015. Vice President, Leadership and Community Engagement, Bush Foundation, Saint Paul, Minnesota (a private foundation) from 2009 to 2011. Executive Vice President and Chief Financial Officer, Minnesota Sports and Entertainment from 2004 to 2009 and Senior Vice President from 2002 to 2004. Executive Vice President of the Minnesota Wild Foundation from 2004 to 2008. Commissioner of Finance, State of Minnesota, from 1999 to 2002. Currently Board Chair of the Minnesota Wild Foundation since 2010. | | N/A |
| * | Length of service dates reflect the Trustee’s commencement of service with the Trust’s predecessor entities, where applicable. |
38 | Wells Fargo Small Company Value Fund
Other information (unaudited)
Officers
| | | | |
Name and year of birth | | Position held and length of service | | Principal occupations during past five years or longer |
| | |
Andrew Owen (Born 1960) | | President, since 2017 | | Executive Vice President of Wells Fargo & Company and Head of Affiliated Managers, Wells Fargo Asset Management, since 2014. In addition, Mr. Owen is currently President, Chief Executive Officer and Director of Wells Fargo Funds Management, LLC since 2017. Prior thereto, Executive Vice President responsible for marketing, investments and product development for Wells Fargo Funds Management, LLC, from 2009 to 2014. |
| | |
Nancy Wiser1 (Born 1967) | | Treasurer, since 2012 | | Executive Vice President of Wells Fargo Funds Management, LLC since 2011. Chief Operating Officer and Chief Compliance Officer at LightBox Capital Management LLC, from 2008 to 2011. |
| | |
Michelle Rhee (Born 1966) | | Chief Legal Officer, since 2019 | | Secretary of Wells Fargo Funds Management, LLC and Chief Legal Counsel of Wells Fargo Asset Management since 2018. Deputy General Counsel of Wells Fargo Bank, N.A. since 2020 and Assistant General Counsel of Wells Fargo Bank, N.A. from 2018 to 2020. Associate General Counsel and Managing Director of Bank of America Corporation from 2004 to 2018. |
| | |
Catherine Kennedy (Born 1969) | | Secretary, since 2019 | | Vice President of Wells Fargo Funds Management, LLC and Senior Counsel of the Wells Fargo Legal Department since 2010. Vice President and Senior Counsel of Evergreen Investment Management Company, LLC from 1998 to 2010. |
| | |
Michael H. Whitaker (Born 1967) | | Chief Compliance Officer, since 2016 | | Chief Compliance Officer of Wells Fargo Asset Management since 2016. Senior Vice President and Chief Compliance Officer for Fidelity Investments from 2007 to 2016. |
| | |
Jeremy DePalma1 (Born 1974) | | Assistant Treasurer, since 2009 | | Senior Vice President of Wells Fargo Funds Management, LLC since 2009. Senior Vice President of Evergreen Investment Management Company, LLC from 2008 to 2010 and head of the Fund Reporting and Control Team within Fund Administration from 2005 to 2010. |
| 1 | Nancy Wiser acts as Treasurer of 67 funds in the Fund Complex. Jeremy DePalma acts as the Treasurer of 77 funds and Assistant Treasurer of 67 funds in the Fund Complex. |
| 2 | The Statement of Additional Information includes additional information about the Trustees and is available, without charge, upon request, by calling 1-800-222-8222 or by visiting the website at wfam.com. |
Wells Fargo Small Company Value Fund | 39
This page is intentionally left blank.

For more information
More information about Wells Fargo Funds is available free upon request. To obtain literature, please write, visit the Fund’s website, or call:
Wells Fargo Funds
P.O. Box 219967
Kansas City, MO 64121-9967
Website: wfam.com
Individual investors: 1-800-222-8222
Retail investment professionals: 1-888-877-9275
Institutional investment professionals: 1-866-765-0778

This report and the financial statements contained herein are submitted for the general information of the shareholders of the Fund. If this report is used for promotional purposes, distribution of the report must be accompanied or preceded by a current prospectus. Before investing, please consider the investment objectives, risks, charges, and expenses of the investment. For a current prospectus and, if available, a summary prospectus, containing this information, call 1-800-222-8222 or visit the Fund’s website at wfam.com. Read the prospectus carefully before you invest or send money.
Wells Fargo Asset Management (WFAM) is the trade name for certain investment advisory/management firms owned by Wells Fargo & Company. These firms include but are not limited to Wells Capital Management Incorporated and Wells Fargo Funds Management, LLC. Certain products managed by WFAM entities are distributed by Wells Fargo Funds Distributor, LLC (a broker-dealer and Member FINRA).
This material is for general informational and educational purposes only and is NOT intended to provide investment advice or a recommendation of any kind—including a recommendation for any specific investment, strategy, or plan.
INVESTMENT PRODUCTS: NOT FDIC INSURED ◾ NO BANK GUARANTEE ◾ MAY LOSE VALUE
© 2021 Wells Fargo & Company. All rights reserved.
PAR-1220-00734 01-20
SA286/SAR286 11-20
Semi-Annual Report
November 30, 2020
Wells Fargo Core Bond Fund
|
|
|
Reduce clutter. Save trees. |
Sign up for electronic delivery of prospectuses and
shareholder reports at wellsfargo.com/
advantagedelivery |
The views expressed and any forward-looking statements are as of November 30, 2020, unless otherwise noted, and are those of the Fund’s portfolio managers and/or Wells Fargo Asset Management. Discussions of individual securities, or the markets generally, or any Wells Fargo Fund are not intended as individual recommendations. Future events or results may vary significantly from those expressed in any forward-looking statements. The views expressed are subject to change at any time in response to changing circumstances in the market. Wells Fargo Asset Management and the Fund disclaim any obligation to publicly update or revise any views expressed or forward-looking statements.
INVESTMENT PRODUCTS: NOT FDIC INSURED ◾ NO BANK GUARANTEE ◾ MAY LOSE VALUE
Wells Fargo Index Fund | 1
Letter to shareholders (unaudited)

Andrew Owen
President
Wells Fargo Funds
“Global stock markets rallied strongly, driven by aggressive stimulus measures introduced by central banks and governments in response to challenges presented by the COVID-19 pandemic.”
Dear Shareholder:
We are pleased to offer you this semi-annual report for the Wells Fargo Core Bond Fund for the six-month period that ended November 30, 2020. Global stock markets rallied strongly, driven by aggressive stimulus measures introduced by central banks and governments in response to challenges presented by the COVID-19 pandemic. Emerging market equities had particularly robust results during the six-month period. Among bonds, high-yield issues led the way while U.S. bonds generally had more modest returns than their international counterparts.
For the period, U.S. stocks, based on the S&P 500 Index,1 returned 19.98% and international stocks, as measured by the MSCI ACWI ex USA Index (Net),2 gained 23.28%. The MSCI EM Index (Net)3 rallied 31.14%. Among bond investments, the Bloomberg Barclays U.S. Aggregate Bond Index4 returned a modest 1.79%, the Bloomberg Barclays Global Aggregate ex-USD Index5 gained a robust 8.19%, the Bloomberg Barclays Municipal Bond Index6 had a 3.29% return, and the ICE BofA U.S. High Yield Index7 gained a healthy 10.47%.
Equities enjoyed a strong tailwind from monetary and fiscal stimulus.
Financial markets posted widely positive returns in June despite ongoing economic weakness and uncertainty regarding COVID-19 and the timing of an effective vaccine. As economies reopened, optimism rose. Vitally important to market sentiment was the ongoing global central bank commitment to provide economic support through liquidity and low borrowing costs. U.S. economic activity was boosted by one-time $1,200 stimulus checks and $600 weekly bonus unemployment benefits for tens of millions of Americans through July. However, jobless rates remained historically high, easing somewhat from 14.7% in April to 11.1% in June. By late June, numerous states reported increases of COVID-19 cases, an ominous sign. China’s economic recovery picked up momentum in June.
July was broadly positive for both global equities and fixed income. However, economic data and a resurgence of COVID-19 cases pointed to the vulnerability of the global economy and the need to regain control of the pandemic. Second-quarter gross domestic product (GDP) shrank from the previous quarter by 9.5% and 12.1% in the U.S. and the eurozone, respectively. In contrast, China reported 3.2% year-over-year second-quarter GDP growth. U.S. unemployment remained high despite adding 1.8 million jobs in July, as a double-digit jobless rate persisted. However, manufacturing activity grew in both the U.S. and the eurozone. In Asia, while China’s manufacturing sector continued to expand, activity in Japan and South Korea contracted. A rising concern was the rapid and broad reemergence of COVID-19 infections.
| 1 | The S&P 500 Index consists of 500 stocks chosen for market size, liquidity, and industry group representation. It is a market-value-weighted index with each stock’s weight in the index proportionate to its market value. You cannot invest directly in an index. |
| 2 | The Morgan Stanley Capital International (MSCI) All Country World Index (ACWI) ex USA Index (Net) is a free-float-adjusted market-capitalization-weighted index that is designed to measure the equity market performance of developed and emerging markets, excluding the United States. Source: MSCI. MSCI makes no express or implied warranties or representations and shall have no liability whatsoever with respect to any MSCI data contained herein. The MSCI data may not be further redistributed or used as a basis for other indices or any securities or financial products. This report is not approved, reviewed, or produced by MSCI. You cannot invest directly in an index. |
| 3 | The MSCI Emerging Markets (EM) Index (Net) is a free-float-adjusted market-capitalization-weighted index that is designed to measure equity market performance of emerging markets. You cannot invest directly in an index. |
| 4 | The Bloomberg Barclays U.S. Aggregate Bond Index is a broad-based benchmark that measures the investment-grade, U.S. dollar-denominated, fixed-rate taxable bond market, including Treasuries, government- related and corporate securities, mortgage-backed securities (agency fixed-rate and hybrid adjustable-rate mortgage pass-throughs), asset-backed securities, and commercial mortgage-backed securities. You cannot invest directly in an index. |
| 5 | The Bloomberg Barclays Global Aggregate ex-USD Index is an unmanaged index that provides a broad-based measure of the global investment-grade fixed-income markets excluding the U.S. dollar-denominated debt market. You cannot invest directly in an index. |
| 6 | The Bloomberg Barclays Municipal Bond Index is an unmanaged index composed of long-term tax-exempt bonds with a minimum credit rating of Baa. You cannot invest directly in an index. |
| 7 | The ICE BofA U.S. High Yield Index is a market-capitalization-weighted index of domestic and Yankee high-yield bonds. The index tracks the performance of high-yield securities traded in the U.S. bond market. You cannot invest directly in an index. Copyright 2021. ICE Data Indices, LLC. All rights reserved. |
2 | Wells Fargo Core Bond Fund
Letter to shareholders (unaudited)
The stock market continued to rally in August despite concerns over rising COVID-19 cases in the U.S. and Europe, as well as the expiration of the $600 weekly bonus unemployment benefit in July. Generally stronger-than-expected second-quarter earnings boosted investor sentiment along with the Federal Reserve’s announcement of a more accommodative policy shift that could lead to longer-term low interest rates. U.S. indices measuring manufacturing and services activities beat expectations while the U.S. housing market maintained strength. In Europe, retail sales expanded and consumer confidence was steady. China’s economy continued to expand.
Stocks grew more volatile in September on mixed economic data. U.S. economic activity continued to grow. However, only half of the 22 million jobs lost since the early spring had returned. The U.S. unemployment rate fell to 7.9% in September, a measurable improvement but far higher than the 3.5% pre-COVID-19 rate. Only 661,000 jobs were added for the month, down from 1.5 million in August. With the U.S. Congress failing to pass further fiscal relief and uncertainties surrounding a possible vaccine, doubts crept back into the markets. In the U.K., a lack of progress in Brexit talks with the European Union weighed on markets. China’s economy picked up steam, however, with growth fueled by increased global demand.
In October, capital markets took a step back from their six-month rally. Market volatility rose in advance of the U.S. election and amid a global increase in COVID-19 infections. Europe responded with more economic restrictions. Meanwhile, Brexit remained unresolved. U.S. markets looked favorably at a possible Democratic sweep and control of the federal purse strings in anticipation of additional fiscal stimulus, which could boost economic activity. Meanwhile, China continued to stand apart, reporting 4.9% third-quarter GDP growth year over year.
Global stocks rallied broadly in November, propelled by optimism over three promising COVID-19 vaccines, which reported high effectiveness in trials. Global stock indices notched double-digit monthly gains. In a reversal of recent trends, value stocks outperformed growth and cyclical stocks outpaced technology stocks. However, U.S. unemployment remained elevated, with a net job loss of 10 million since February. The Eurozone Services Purchasing Managers’ Index, a monthly survey of purchasing managers, contracted sharply while the region’s manufacturing activity gauge indicated growth. The U.S. election results added to the market’s upbeat mood as investors gave thumbs-up to the certainty of the outcome after an unusual delay and anticipated more consistent policies in the new administration.
Don’t let short-term uncertainty derail long-term investment goals.
Periods of investment uncertainty can present challenges, but experience has taught us that maintaining long-term investment goals can be an effective way to plan for the future. To help you create a sound strategy based on your personal goals and risk tolerance, Wells Fargo Funds offers more than 100 mutual funds spanning a wide range of asset classes and investment styles. Although diversification cannot guarantee an investment profit or prevent losses, we believe it can be an effective way to manage investment risk and potentially smooth out overall portfolio performance. We encourage investors to know their investments and to understand that appropriate levels of risk-taking may unlock opportunities.
Thank you for choosing to invest with Wells Fargo Funds. We appreciate your confidence in us and remain committed to helping you meet your financial needs.
Sincerely,

Andrew Owen
President
Wells Fargo Funds
“Global stocks rallied broadly in November, propelled by optimism over three promising COVID-19 vaccines, which reported high effectiveness in trials.”
|
|
|
For further information about your Fund, contact your investment professional, visit our website at wfam.com, or call us directly at 1-800-222-8222. |
Wells Fargo Core Bond Fund | 3
Letter to shareholders (unaudited)
Notice to Shareholders
At a meeting held on August 10-12, 2020, the Board of Trustees of the Fund approved a change to the Fund’s automatic conversion feature for Class C shares in order to shorten the required holding period from 10 to 8 years. As a result, on a monthly basis beginning November 5, 2020, Class C shares will convert automatically into Class A shares 8 years after the initial date of purchase or, if you acquired your Class C shares through an exchange or conversion from another share class, 8 years after the date you acquired your Class C shares. When Class C shares that you acquired through a purchase or exchange convert, any other Class C shares that you purchased with reinvested dividends and distributions also will convert into Class A shares on a pro rata basis.
Please note that a shorter holding period may apply depending on your intermediary. Please see “Appendix A—Sales Charge Reductions and Waivers for Certain Intermediaries” in the Fund’s prospectus for further information.
Preparing for LIBOR Transition
The global financial industry is preparing to transition away from the London Interbank Offered Rate (LIBOR), a key benchmark interest rate, to new alternative rates. LIBOR underpins more than $350 trillion of financial contracts. It is the benchmark rate for a wide spectrum of products ranging from residential mortgages to corporate bonds to derivatives. Regulators have called for a market-wide transition away from LIBOR to successor reference rates by the end of 2021, which requires proactive steps be taken by issuers, counterparties, and asset managers to identify impacted products and adopt new reference rates.
The Fund holds at least one security that uses LIBOR as a floating reference rate and has a maturity date after 12-31-2021.
Although the transition process away from LIBOR has become increasingly well-defined in advance of the anticipated discontinuation date, there remains uncertainty regarding the nature of successor reference rates, and any potential effects of the transition away from LIBOR on investment instruments that use it as a benchmark rate. The transition process may result in, among other things, increased volatility or illiquidity in markets for instruments that currently rely on LIBOR and could negatively impact the value of certain instruments held by the Fund.
Wells Fargo Asset Management is monitoring LIBOR exposure closely and has put resources and controls in place to manage this transition effectively. The Fund’s portfolio management team is evaluating LIBOR holdings to understand what happens to those securities when LIBOR ceases to exist, including examining security documentation to identify the presence or absence of fallback language identifying a replacement rate to LIBOR.
While the pace of transition away from LIBOR will differ by asset class and investment strategy, the portfolio management team will monitor market conditions for those holdings to identify and mitigate deterioration or volatility in pricing and liquidity and ensure appropriate actions are taken in a timely manner.
Further information regarding the potential risks associated with the discontinuation of LIBOR can be found in the Fund’s Statement of Additional Information.
4 | Wells Fargo Core Bond Fund
This page is intentionally left blank.
Performance highlights (unaudited)
Investment objective
The Fund seeks total return, consisting of income and capital appreciation.
Manager
Wells Fargo Funds Management, LLC
Subadviser for the affiliated master portfolio1
Wells Capital Management Incorporated
Portfolio managers
Maulik Bhansali, CFA®‡
Jarad Vasquez
Average annual total returns (%) as of November 30, 2020
| | | | | | | | | | | | | | | | | | | | | | | | | | | | | | | | | | |
| | | | |
| | | | | Including sales charge | | | Excluding sales charge | | | Expense ratios2 (%) | |
| | | | | | | | | |
| | | Inception date | | 1 year | | | 5 year | | | 10 year | | | 1 year | | | 5 year | | | 10 year | | | Gross | | | Net3 | |
| | | | | | | | | | |
| Class A (MBFAX) | | 10-31-2001 | | | 3.21 | | | | 3.15 | | | | 3.27 | | | | 8.07 | | | | 4.09 | | | | 3.75 | | | | 0.82 | | | | 0.78 | |
| | | | | | | | | | |
| Class C (MBFCX) | | 10-31-2001 | | | 6.25 | | | | 3.33 | | | | 2.98 | | | | 7.25 | | | | 3.33 | | | | 2.98 | | | | 1.57 | | | | 1.53 | |
| | | | | | | | | | |
| Class R (WTRRX)4 | | 7-9-2010 | | | – | | | | – | | | | – | | | | 7.90 | | | | 3.85 | | | | 3.50 | | | | 1.07 | | | | 1.03 | |
| | | | | | | | | | |
| Class R4 (MBFRX)5 | | 11-30-2012 | | | – | | | | – | | | | – | | | | 8.35 | | | | 4.39 | | | | 4.04 | | | | 0.59 | | | | 0.52 | |
| | | | | | | | | | |
| Class R6 (WTRIX)6 | | 11-30-2012 | | | – | | | | – | | | | – | | | | 8.52 | | | | 4.52 | | | | 4.18 | | | | 0.44 | | | | 0.37 | |
| | | | | | | | | | |
| Administrator Class (MNTRX) | | 6-30-1997 | | | – | | | | – | | | | – | | | | 8.16 | | | | 4.17 | | | | 3.84 | | | | 0.76 | | | | 0.70 | |
| | | | | | | | | | |
| Institutional Class (MBFIX) | | 10-31-2001 | | | – | | | | – | | | | – | | | | 8.47 | | | | 4.48 | | | | 4.14 | | | | 0.49 | | | | 0.42 | |
| | | | | | | | | | |
| Bloomberg Barclays U.S. Aggregate Bond Index7 | | – | | | – | | | | – | | | | – | | | | 7.28 | | | | 4.34 | | | | 3.71 | | | | – | | | | – | |
Figures quoted represent past performance, which is no guarantee of future results, and do not reflect taxes that a shareholder may pay on an investment in a fund. Investment return and principal value of an investment will fluctuate so that an investor’s shares, when redeemed, may be worth more or less than their original cost. Performance shown without sales charges would be lower if sales charges were reflected. Current performance may be lower or higher than the performance data quoted, which assumes the reinvestment of dividends and capital gains. Current month-end performance is available on the Fund’s website, wfam.com.
Index returns do not include transaction costs associated with buying and selling securities, any mutual fund fees or expenses, or any taxes. It is not possible to invest directly in an index.
For Class A shares, the maximum front-end sales charge is 4.50%. For Class C shares, the maximum contingent deferred sales charge is 1.00%. Performance including a contingent deferred sales charge assumes the sales charge for the corresponding time period. Class R, Class R4, Class R6, Administrator Class, and Institutional Class shares are sold without a front-end sales charge or contingent deferred sales charge.
Bond values fluctuate in response to the financial condition of individual issuers, general market and economic conditions, and changes in interest rates. Changes in market conditions and government policies may lead to periods of heightened volatility in the bond market and reduced liquidity for certain bonds held by the Fund. In general, when interest rates rise, bond values fall and investors may lose principal value. Interest rate changes and their impact on the Fund and its share price can be sudden and unpredictable. The use of derivatives may reduce returns and/or increase volatility. Certain investment strategies tend to increase the total risk of an investment (relative to the broader market). Securities issued by U.S. government agencies or government-sponsored entities may not be guaranteed by the U.S. Treasury. The Fund is exposed to foreign investment risk and mortgage- and asset-backed securities risk. Consult the Fund’s prospectus for additional information on these and other risks.
Please see footnotes on page 7.
6 | Wells Fargo Core Bond Fund
Performance highlights (unaudited)
| | | | |
|
| Ten largest holdings (%) as of November 30, 20208 | |
| | |
FNMA, 2.00%, 1-14-2051 | | | 2.15 | |
| | |
U.S. Treasury Bond, 1.13%, 5-15-2040 | | | 2.12 | |
| | |
U.S. Treasury Note, 0.25%, 11-15-2023 | | | 1.96 | |
| | |
U.S. Treasury Note, 0.13%, 9-15-2023 | | | 1.90 | |
| | |
U.S. Treasury Note, 1.38%, 5-31-2021 | | | 1.78 | |
| | |
U.S. Treasury Note, 0.13%, 9-30-2022 | | | 1.72 | |
| | |
U.S. Treasury Note, 0.13%, 8-31-2022 | | | 1.63 | |
| | |
U.S. Treasury Note, 1.38%, 1-31-2021 | | | 1.54 | |
| | |
FNMA, 2.00%, 2-12-2051 | | | 1.53 | |
| | |
GNMA, 2.00%, 2-20-2051 | | | 1.52 | |
|
|
| Portfolio composition as of November 30, 20209 |
|
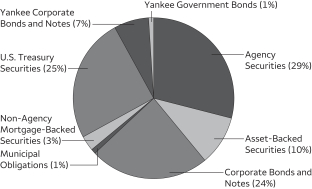 |
| ‡ | CFA® and Chartered Financial Analyst® are trademarks owned by CFA Institute. |
| 1 | The Fund is a feeder fund in a master-feeder structure that invests substantially all of its assets in a single affiliated master portfolio of the Wells Fargo Master Trust with a substantially identical investment objective and substantially similar investment strategies. References to the investment activities of the Fund are intended to refer to the investment activities of the affiliated master portfolio in which it invests. |
| 2 | Reflects the expense ratios as stated in the most recent prospectuses. The expense ratios shown are subject to change and may differ from the annualized expense ratios shown in the financial highlights of this report. |
| 3 | The manager has contractually committed through September 30, 2021, to waive fees and/or reimburse expenses to the extent necessary to cap total annual fund operating expenses after fee waivers at 0.78% for Class A, 1.53% for Class C, 1.03% for Class R, 0.52% for Class R4, 0.37% for Class R6, 0.70% for Administrator Class, and 0.42% for Institutional Class. Brokerage commissions, stamp duty fees, interest, taxes, acquired fund fees and expenses (if any) from funds in which the affiliated master portfolio invests, and extraordinary expenses are excluded from the expense caps. Net expenses from the affiliated master portfolio are included in the expense caps. Prior to or after the commitment expiration date, the caps may be increased or the commitment to maintain the caps may be terminated only with the approval of the Board of Trustees. Without theseis caps, the Fund’s returns would have been lower. The expense ratio paid by an investor is the net expense ratio (the total annual fund operating expenses after fee waivers) as stated in the prospectuses. |
| 4 | Historical performance shown for the Class R shares prior to their inception reflects the performance of the Administrator Class shares, adjusted to reflect the higher expenses applicable to the Class R shares. |
| 5 | Historical performance shown for the Class R4 shares prior to their inception reflects the performance of the Institutional Class shares, adjusted to reflect the higher expenses applicable to the Class R4 shares. |
| 6 | Historical performance shown for the Class R6 shares prior to their inception reflects the performance of the Institutional Class shares and includes the higher expenses applicable to the Institutional Class shares. If these expenses had not been included, returns for the Class R6 shares would be higher. |
| 7 | The Bloomberg Barclays U.S. Aggregate Bond Index is a broad-based benchmark that measures the investment-grade, U.S. dollar–denominated, fixed-rate taxable bond market, including Treasuries, government-related and corporate securities, mortgage-backed securities (agency fixed-rate and hybrid adjustable-rate mortgage pass-throughs), asset-backed securities, and commercial mortgage-backed securities. You cannot invest directly in an index. |
| 8 | Each holding represents the Fund’s allocable portion of the affiliated master portfolio security. Figures represent each holding as a percentage of the Fund’s net assets. Holdings are subject to change and may have changed since the date specified. |
| 9 | Figures represent the portfolio composition of the affiliated master portfolio as a percentage of the long-term investments of the affiliated master portfolio. These amounts are subject to change and may have changed since the date specified. |
Wells Fargo Core Bond Fund | 7
Fund expenses (unaudited)
As a shareholder of the Fund, you incur two types of costs: (1) transaction costs, including sales charges (loads) on purchase payments and contingent deferred sales charges (if any) on redemptions and (2) ongoing costs, including management fees, distribution (12b-1) and/or shareholder servicing fees, and other Fund expenses. This example is intended to help you understand your ongoing costs (in dollars) of investing in the Fund and to compare these costs with the ongoing costs of investing in other mutual funds.
The example is based on an investment of $1,000 invested at the beginning of the six-month period and held for the entire period from June 1, 2020 to November 30, 2020.
Actual expenses
The “Actual” line of the table below provides information about actual account values and actual expenses. You may use the information in this line, together with the amount you invested, to estimate the expenses that you paid over the period. Simply divide your account value by $1,000 (for example, an $8,600 account value divided by $1,000 = 8.6), then multiply the result by the number in the “Actual” line under the heading entitled “Expenses paid during period” for your applicable class of shares to estimate the expenses you paid on your account during this period.
Hypothetical example for comparison purposes
The “Hypothetical” line of the table below provides information about hypothetical account values and hypothetical expenses based on the Fund’s actual expense ratio and an assumed rate of return of 5% per year before expenses, which is not the Fund’s actual return. The hypothetical account values and expenses may not be used to estimate the actual ending account balance or expenses you paid for the period. You may use this information to compare the ongoing costs of investing in the Fund and other funds. To do so, compare this 5% hypothetical example with the 5% hypothetical examples that appear in the shareholder reports of the other funds.
Please note that the expenses shown in the table are meant to highlight your ongoing costs only and do not reflect any transactional costs, such as sales charges (loads) and contingent deferred sales charges. Therefore, the “Hypothetical” line of the table is useful in comparing ongoing costs only and will not help you determine the relative total costs of owning different funds. In addition, if these transactional costs were included, your costs would have been higher.
| | | | | | | | | | | | | | | | |
| | | Beginning
account value
6-1-2020 | | | Ending
account value
11-30-2020 | | | Expenses
paid during
the period1,2 | | | Annualized net
expense ratio1 | |
| | | | | |
Class A | | | | | | | | | | | | | | | | |
| | | | |
Actual | | $ | 1,000.00 | | | $ | 1,026.14 | | | $ | 3.96 | | | | 0.78 | % |
| | | | |
Hypothetical (5% return before expenses) | | $ | 1,000.00 | | | $ | 1,021.16 | | | $ | 3.95 | | | | 0.78 | % |
| | | | | |
Class C | | | | | | | | | | | | | | | | |
| | | | |
Actual | | $ | 1,000.00 | | | $ | 1,022.46 | | | $ | 7.76 | | | | 1.53 | % |
| | | | |
Hypothetical (5% return before expenses) | | $ | 1,000.00 | | | $ | 1,017.40 | | | $ | 7.74 | | | | 1.53 | % |
| | | | | |
Class R | | | | | | | | | | | | | | | | |
| | | | |
Actual | | $ | 1,000.00 | | | $ | 1,025.26 | | | $ | 4.52 | | | | 0.89 | % |
| | | | |
Hypothetical (5% return before expenses) | | $ | 1,000.00 | | | $ | 1,020.61 | | | $ | 4.51 | | | | 0.89 | % |
| | | | | |
Class R4 | | | | | | | | | | | | | | | | |
| | | | |
Actual | | $ | 1,000.00 | | | $ | 1,027.96 | | | $ | 2.64 | | | | 0.52 | % |
| | | | |
Hypothetical (5% return before expenses) | | $ | 1,000.00 | | | $ | 1,022.46 | | | $ | 2.64 | | | | 0.52 | % |
| | | | | |
Class R6 | | | | | | | | | | | | | | | | |
| | | | |
Actual | | $ | 1,000.00 | | | $ | 1,028.75 | | | $ | 1.88 | | | | 0.37 | % |
| | | | |
Hypothetical (5% return before expenses) | | $ | 1,000.00 | | | $ | 1,023.21 | | | $ | 1.88 | | | | 0.37 | % |
| | | | | |
Administrator Class | | | | | | | | | | | | | | | | |
| | | | |
Actual | | $ | 1,000.00 | | | $ | 1,026.31 | | | $ | 3.56 | | | | 0.70 | % |
| | | | |
Hypothetical (5% return before expenses) | | $ | 1,000.00 | | | $ | 1,021.56 | | | $ | 3.55 | | | | 0.70 | % |
| | | | | |
Institutional Class | | | | | | | | | | | | | | | | |
| | | | |
Actual | | $ | 1,000.00 | | | $ | 1,028.50 | | | $ | 2.14 | | | | 0.42 | % |
| | | | |
Hypothetical (5% return before expenses) | | $ | 1,000.00 | | | $ | 1,022.96 | | | $ | 2.13 | | | | 0.42 | % |
| 1 | Amounts reflect net expenses allocated from the affiliated Master Portfolio in which the Fund invests. |
| 2 | Expenses paid is equal to the annualized net expense ratio of each class multiplied by the average account value over the period, multiplied by the number of days in the most recent fiscal half-year divided by the number of days in the fiscal year (to reflect the one-half-year period). |
8 | Wells Fargo Core Bond Fund
Portfolio of investments—November 30, 2020 (unaudited)
| | | | | | | | | | | | | | | | |
| | | | | | | | | | | | Value | |
| Investment Companies: 100.07% | | | | | | | | | | | | |
| | | | |
| Affiliated Master Portfolio: 100.07% | | | | | | | | | | | | |
Wells Fargo Core Bond Portfolio | | | | | | | | | | | | | | $ | 5,774,258,310 | |
| | | | | | | | | | | | | | | | |
| | | | |
Total Investment Companies (Cost $5,595,388,697) | | | | | | | | | | | | | | | 5,774,258,310 | |
| | | | | | | | | | | | | | | | |
| | | | | | | | |
| Total investments in securities (Cost $5,595,388,697) | | | 100.07 | % | | | 5,774,258,310 | |
| | |
Other assets and liabilities, net | | | (0.07 | ) | | | (3,821,966 | ) |
| | | | | | | | |
| Total net assets | | | 100.00 | % | | $ | 5,770,436,344 | |
| | | | | | | | |
Transactions with the affiliated Master Portfolio were as follows:
| | | | | | | | | | | | | | | | | | | | | | | | | | | | | | | | |
| | | % of
ownership,
beginning
of period | | | % of
ownership,
end of
period | | | Net realized
gains
(losses) on
securities
transactions
allocated
from
affiliated
Master
Portfolio | | | Net
change in
unrealized
gains
(losses) on
securities
transactions
allocated
from
affiliated
Master
Portfolio | | | Interest
allocated
from
affiliated
Master
Portfolio | | | Affiliated
income
allocated
from
affiliated
Master
Portfolio | | | Value,
end
of period | | | % of
net
assets | |
Wells Fargo Core Bond Portfolio | | | 95 | % | | | 95 | % | | $ | 113,703,226 | | | $ | 4,956,522 | | | $ | 51,164,373 | | | $ | 117,135 | | | $ | 5,774,258,310 | | | | 100.07 | % |
The accompanying notes are an integral part of these financial statements.
Wells Fargo Core Bond Fund | 9
Statement of assets and liabilities—November 30, 2020 (unaudited)
| | | | |
| | | | |
| |
Assets | | | | |
Investments in affiliated Master Portfolio, at value (cost $5,595,388,697) | | $ | 5,774,258,310 | |
Receivable for Fund shares sold | | | 6,921,477 | |
Prepaid expenses and other assets | | | 10,947 | |
| | | | |
Total assets | | | 5,781,190,734 | |
| | | | |
| |
Liabilities | | | | |
Payable for Fund shares redeemed | | | 8,501,084 | |
Management fee payable | | | 21,853 | |
Distributions payable | | | 1,256,892 | |
Administration fees payable | | | 306,127 | |
Distribution fees and expenses payable | | | 10,948 | |
Trustee’s fees payable | | | 1,155 | |
Accrued expenses and other liabilities | | | 656,331 | |
| | | | |
Total liabilities | | | 10,754,390 | |
| | | | |
Total net assets | | $ | 5,770,436,344 | |
| | | | |
| |
Net assets consist of | | | | |
Paid-in capital | | $ | 5,326,067,146 | |
Total distributable earnings | | | 444,369,198 | |
| | | | |
Total net assets | | $ | 5,770,436,344 | |
| | | | |
| |
Computation of net asset value and offering price per share | | | | |
Net assets – Class A | | $ | 330,206,396 | |
Shares outstanding – Class A1 | | | 22,836,988 | |
Net asset value per share – Class A | | | $14.46 | |
Maximum offering price per share – Class A2 | | | $15.14 | |
Net assets – Class C | | $ | 16,746,775 | |
Shares outstanding – Class C1 | | | 1,169,603 | |
Net asset value per share – Class C | | | $14.32 | |
Net assets – Class R | | $ | 1,882,127 | |
Shares outstanding – Class R1 | | | 133,373 | |
Net asset value per share – Class R | | | $14.11 | |
Net assets – Class R4 | | $ | 4,289,893 | |
Share outstanding – Class R41 | | | 304,094 | |
Net asset value per share – Class R4 | | | $14.11 | |
Net assets – Class R6 | | $ | 2,415,430,780 | |
Shares outstanding – Class R61 | | | 171,314,189 | |
Net asset value per share – Class R6 | | | $14.10 | |
Net assets – Administrator Class | | $ | 256,657,027 | |
Shares outstanding – Administrator Class1 | | | 18,185,217 | |
Net asset value per share – Administrator Class | | | $14.11 | |
Net assets – Institutional Class | | $ | 2,745,223,346 | |
Shares outstanding – Institutional Class1 | | | 194,764,861 | |
Net asset value per share – Institutional Class | | | $14.10 | |
| 1 | The Fund has an unlimited number of authorized shares. |
| 2 | Maximum offering price is computed as 100/95.50 of net asset value. On investments of $50,000 or more, the offering price is reduced. |
The accompanying notes are an integral part of these financial statements.
10 | Wells Fargo Core Bond Fund
Statement of operations—six months ended November 30, 2020 (unaudited)
| | | | |
| | | | |
| |
Investment income | | | | |
Interest allocated from affiliated Master Portfolio (net of foreign withholding taxes of $3,669) | | $ | 51,164,373 | |
Affiliated income allocated from affiliated Master Portfolio | | | 117,135 | |
Expenses allocated from affiliated Master Portfolio | | | (9,967,396 | ) |
| | | | |
Total investment income | | | 41,314,112 | |
| | | | |
| |
Expenses | | | | |
Management fee | | | 1,398,006 | |
Administration fees | | | | |
Class A | | | 258,034 | |
Class C | | | 19,157 | |
Class R | | | 1,971 | |
Class R4 | | | 1,703 | |
Class R6 | | | 384,930 | |
Administrator Class | | | 120,870 | |
Institutional Class | | | 1,030,953 | |
Shareholder servicing fees | | | | |
Class A | | | 400,910 | |
Class C | | | 29,805 | |
Class R | | | 1,753 | |
Class R4 | | | 2,122 | |
Administrator Class | | | 295,375 | |
Distribution fees | | | | |
Class C | | | 89,332 | |
Class R | | | 2,324 | |
Custody and accounting fees | | | 92,574 | |
Professional fees | | | 17,758 | |
Registration fees | | | 119,283 | |
Shareholder report expenses | | | 163,673 | |
Trustees’ fees and expenses | | | 11,029 | |
Other fees and expenses | | | 51,398 | |
| | | | |
Total expenses | | | 4,492,960 | |
Less: Fee waivers and/or expense reimbursements | | | | |
Fund-level | | | (1,079,043 | ) |
Class A | | | (36,938 | ) |
Class C | | | (2,462 | ) |
Class R4 | | | (763 | ) |
Class R6 | | | (384,930 | ) |
Administrator Class | | | (35,319 | ) |
Institutional Class | | | (466,119 | ) |
| | | | |
Net expenses | | | 2,487,386 | |
| | | | |
Net investment income | | | 38,826,726 | |
| | | | |
| |
Realized and unrealized gains (losses) on investments | | | | |
Net realized gains on securities transactions allocated from affiliated Master Portfolio | | | 113,703,226 | |
Net change in unrealized gains (losses) on securities transactions allocated from affiliated Master Portfolio | | | 4,956,522 | |
| | | | |
Net realized and unrealized gains (losses) on investments | | | 118,659,748 | |
| | | | |
Net increase in net assets resulting from operations | | $ | 157,486,474 | |
| | | | |
The accompanying notes are an integral part of these financial statements.
Wells Fargo Core Bond Fund | 11
Statement of changes in net assets
| | | | | | | | | | | | | | | | |
| �� | | Six months ended
November 30, 2020
(unaudited) | | | Year ended
May 31, 2020 | |
| | | | |
Operations | | | | | | | | | | | | | | | | |
Net investment income | | | | | | $ | 38,826,726 | | | | | | | $ | 120,113,953 | |
Net realized gains on investments | | | | | | | 113,703,226 | | | | | | | | 306,742,964 | |
Net change in unrealized gains (losses) on investments | | | | | | | 4,956,522 | | | | | | | | 56,934,677 | |
| | | | |
Net increase in net assets resulting from operations | | | | | | | 157,486,474 | | | | | | | | 483,791,594 | |
| | | | |
| | | | |
Distributions to shareholders from net investment income and net realized gains | | | | | | | | | | | | | | | | |
Class A | | | | | | | (1,998,606 | ) | | | | | | | (6,294,414 | ) |
Class C | | | | | | | (61,316 | ) | | | | | | | (417,858 | ) |
Class R | | | | | | | (14,194 | ) | | | | | | | (97,982 | ) |
Class R4 | | | | | | | (31,989 | ) | | | | | | | (161,109 | ) |
Class R6 | | | | | | | (21,256,070 | ) | | | | | | | (63,508,068 | ) |
Administrator Class | | | | | | | (1,592,881 | ) | | | | | | | (4,506,235 | ) |
Institutional Class | | | | | | | (20,630,505 | ) | | | | | | | (59,496,339 | ) |
| | | | |
Total distributions to shareholders | | | | | | | (45,585,561 | ) | | | | | | | (134,482,005 | ) |
| | | | |
| | | | |
Capital share transactions | | | Shares | | | | | | | | Shares | | | | | |
Proceeds from shares sold | | | | | | | | | | | | | | | | |
Class A | | | 3,975,423 | | | | 57,145,100 | | | | 5,035,376 | | | | 68,831,957 | |
Class C | | | 348,418 | | | | 4,961,849 | | | | 737,031 | | | | 9,984,279 | |
Class R | | | 14,553 | | | | 203,415 | | | | 91,423 | | | | 1,215,599 | |
Class R4 | | | 39,118 | | | | 547,659 | | | | 183,129 | | | | 2,446,252 | |
Class R6 | | | 20,787,518 | | | | 291,035,956 | | | | 46,956,601 | | | | 627,133,874 | |
Administrator Class | | | 5,641,679 | | | | 79,270,173 | | | | 5,387,937 | | | | 72,239,222 | |
Institutional Class | | | 42,702,899 | | | | 598,700,209 | | | | 67,880,909 | | | | 903,670,274 | |
| | | | |
| | | | | | | 1,031,864,361 | | | | | | | | 1,685,521,457 | |
| | | | |
Reinvestment of distributions | | | | | | | | | | | | | | | | |
Class A | | | 122,458 | | | | 1,761,667 | | | | 399,765 | | | | 5,475,932 | |
Class C | | | 2,877 | | | | 40,971 | | | | 14,131 | | | | 191,525 | |
Class R | | | 457 | | | | 6,409 | | | | 1,589 | | | | 21,221 | |
Class R4 | | | 2,273 | | | | 31,898 | | | | 12,039 | | | | 160,382 | |
Class R6 | | | 1,088,189 | | | | 15,265,637 | | | | 3,578,858 | | | | 47,809,034 | |
Administrator Class | | | 109,602 | | | | 1,538,931 | | | | 324,731 | | | | 4,342,589 | |
Institutional Class | | | 1,305,997 | | | | 18,315,815 | | | | 3,940,416 | | | | 52,636,436 | |
| | | | |
| | | | | | | 36,961,328 | | | | | | | | 110,637,119 | |
| | | | |
Payment for shares redeemed | | | | | | | | | | | | | | | | |
Class A | | | (2,404,024 | ) | | | (34,535,591 | ) | | | (7,058,184 | ) | | | (96,112,855 | ) |
Class C | | | (1,174,718 | ) | | | (16,749,433 | ) | | | (1,381,669 | ) | | | (18,673,889 | ) |
Class R | | | (115,921 | ) | | | (1,623,923 | ) | | | (519,677 | ) | | | (6,891,248 | ) |
Class R4 | | | (66,275 | ) | | | (924,399 | ) | | | (700,264 | ) | | | (9,317,864 | ) |
Class R6 | | | (34,745,894 | ) | | | (487,222,961 | ) | | | (60,509,001 | ) | | | (803,022,923 | ) |
Administrator Class | | | (3,363,283 | ) | | | (47,207,210 | ) | | | (5,797,513 | ) | | | (77,110,768 | ) |
Institutional Class | | | (20,463,288 | ) | | | (286,704,563 | ) | | | (81,653,483 | ) | | | (1,088,476,808 | ) |
| | | | |
| | | | | | | (874,968,080 | ) | | | | | | | (2,099,606,355 | ) |
| | | | |
Net increase (decrease) in net assets resulting from capital share transactions | | | | | | | 193,857,609 | | | | | | | | (303,447,779 | ) |
| | | | |
Total increase in net assets | | | | | | | 305,758,522 | | | | | | | | 45,861,810 | |
| | | | |
| | | | |
Net assets | | | | | | | | | | | | | | | | |
Beginning of period | | | | | | | 5,464,677,822 | | | | | | | | 5,418,816,012 | |
| | | | |
End of period | | | | | | $ | 5,770,436,344 | | | | | | | $ | 5,464,677,822 | |
| | | | |
The accompanying notes are an integral part of these financial statements.
12 | Wells Fargo Core Bond Fund
Financial highlights
(For a share outstanding throughout each period)
| | | | | | | | | | | | | | | | | | | | | | | | |
| | | Six months ended
November 30, 2020
(unaudited) | | | Year ended May 31 | |
| CLASS A | | 2020 | | | 2019 | | | 2018 | | | 2017 | | | 2016 | |
Net asset value, beginning of period | | | $14.17 | | | | $13.28 | | | | $12.86 | | | | $13.22 | | | | $13.28 | | | | $13.16 | |
Net investment income | | | 0.07 | | | | 0.25 | | | | 0.32 | | | | 0.24 | | | | 0.19 | 1 | | | 0.19 | 1 |
Net realized and unrealized gains (losses) on investments | | | 0.31 | | | | 0.93 | | | | 0.42 | | | | (0.36 | ) | | | 0.00 | | | | 0.12 | |
| | | | | | | | | | | | | | | | | | | | | | | | |
Total from investment operations | | | 0.38 | | | | 1.18 | | | | 0.74 | | | | (0.12 | ) | | | 0.19 | | | | 0.31 | |
Distributions to shareholders from | | | | | | | | | | | | | | | | | | | | | | | | |
Net investment income | | | (0.09 | ) | | | (0.26 | ) | | | (0.32 | ) | | | (0.24 | ) | | | (0.19 | ) | | | (0.19 | ) |
Net realized gains | | | 0.00 | | | | (0.03 | ) | | | 0.00 | | | | 0.00 | | | | (0.06 | ) | | | 0.00 | |
| | | | | | | | | | | | | | | | | | | | | | | | |
Total distributions to shareholders | | | (0.09 | ) | | | (0.29 | ) | | | (0.32 | ) | | | (0.24 | ) | | | (0.25 | ) | | | (0.19 | ) |
Net asset value, end of period | | | $14.46 | | | | $14.17 | | | | $13.28 | | | | $12.86 | | | | $13.22 | | | | $13.28 | |
Total return2 | | | 2.69 | % | | | 9.03 | % | | | 5.87 | % | | | (0.96 | )% | | | 1.48 | % | | | 2.36 | % |
Ratios to average net assets (annualized) | | | | | | | | | | | | | | | | | | | | | | | | |
Gross expenses3 | | | 0.82 | % | | | 0.82 | % | | | 0.83 | % | | | 0.83 | % | | | 0.83 | % | | | 0.83 | % |
Net expenses3 | | | 0.78 | % | | | 0.78 | % | | | 0.78 | % | | | 0.78 | % | | | 0.78 | % | | | 0.78 | % |
Net investment income3 | | | 1.01 | % | | | 1.85 | % | | | 2.50 | % | | | 1.79 | % | | | 1.40 | % | | | 1.43 | % |
Supplemental data | | | | | | | | | | | | | | | | | | | | | | | | |
Portfolio turnover rate4 | | | 213 | % | | | 603 | % | | | 577 | % | | | 542 | % | | | 614 | % | | | 667 | % |
Net assets, end of period (000s omitted) | | | $330,206 | | | | $299,642 | | | | $302,246 | | | | $320,208 | | | | $360,276 | | | | $699,273 | |
| 1 | Calculated based upon average shares outstanding |
| 2 | Total return calculations do not include any sales charges. Returns for periods of less than one year are not annualized. |
| 3 | Ratios include net expenses allocated from the affiliated Master Portfolio which were as follows: |
| | | | |
Six months ended November 30, 2020 (unaudited) | | | 0.35 | % |
Year ended May 31, 2020 | | | 0.35 | % |
Year ended May 31, 2019 | | | 0.35 | % |
Year ended May 31, 2018 | | | 0.35 | % |
Year ended May 31, 2017 | | | 0.35 | % |
Year ended May 31, 2016 | | | 0.35 | % |
| 4 | Portfolio turnover rate is calculated by multiplying the affiliated Master Portfolio’s percentage of the Fund’s total investment in securities at the end of the period by the affiliated Master Portfolio’s portfolio turnover rate. |
The accompanying notes are an integral part of these financial statements.
Wells Fargo Core Bond Fund | 13
Financial highlights
(For a share outstanding throughout each period)
| | | | | | | | | | | | | | | | | | | | | | | | |
| | | Six months ended
November 30, 2020
(unaudited) | | | Year ended May 31 | |
| CLASS C | | 2020 | | | 2019 | | | 2018 | | | 2017 | | | 2016 | |
Net asset value, beginning of period | | | $14.03 | | | | $13.15 | | | | $12.74 | | | | $13.09 | | | | $13.15 | | | | $13.03 | |
Net investment income | | | 0.03 | | | | 0.15 | | | | 0.23 | | | | 0.14 | | | | 0.09 | | | | 0.09 | |
Net realized and unrealized gains (losses) on investments | | | 0.30 | | | | 0.92 | | | | 0.40 | | | | (0.35 | ) | | | 0.00 | | | | 0.12 | |
| | | | | | | | | | | | | | | | | | | | | | | | |
Total from investment operations | | | 0.33 | | | | 1.07 | | | | 0.63 | | | | (0.21 | ) | | | 0.09 | | | | 0.21 | |
Distributions to shareholders from | | | | | | | | | | | | | | | | | | | | | | | | |
Net investment income | | | (0.04 | ) | | | (0.16 | ) | | | (0.22 | ) | | | (0.14 | ) | | | (0.09 | ) | | | (0.09 | ) |
Net realized gains | | | 0.00 | | | | (0.03 | ) | | | 0.00 | | | | 0.00 | | | | (0.06 | ) | | | 0.00 | |
| | | | | | | | | | | | | | | | | | | | | | | | |
Total distributions to shareholders | | | (0.04 | ) | | | (0.19 | ) | | | (0.22 | ) | | | (0.14 | ) | | | (0.15 | ) | | | (0.09 | ) |
Net asset value, end of period | | | $14.32 | | | | $14.03 | | | | $13.15 | | | | $12.74 | | | | $13.09 | | | | $13.15 | |
Total return1 | | | 2.32 | % | | | 8.22 | % | | | 5.04 | % | | | (1.65 | )% | | | 0.72 | % | | | 1.61 | % |
Ratios to average net assets (annualized) | | | | | | | | | | | | | | | | | | | | | | | | |
Gross expenses2 | | | 1.57 | % | | | 1.57 | % | | | 1.58 | % | | | 1.58 | % | | | 1.58 | % | | | 1.58 | % |
Net expenses2 | | | 1.53 | % | | | 1.53 | % | | | 1.53 | % | | | 1.53 | % | | | 1.53 | % | | | 1.53 | % |
Net investment income2 | | | 0.27 | % | | | 1.11 | % | | | 1.75 | % | | | 1.04 | % | | | 0.68 | % | | | 0.68 | % |
Supplemental data | | | | | | | | | | | | | | | | | | | | | | | | |
Portfolio turnover rate3 | | | 213 | % | | | 603 | % | | | 577 | % | | | 542 | % | | | 614 | % | | | 667 | % |
Net assets, end of period (000s omitted) | | | $16,747 | | | | $27,971 | | | | $34,494 | | | | $47,843 | | | | $59,049 | | | | $66,612 | |
| 1 | Total return calculations do not include any sales charges. Returns for periods of less than one year are not annualized. |
| 2 | Ratios include net expenses allocated from the affiliated Master Portfolio which were as follows: |
| | | | |
Six months ended November 30, 2020 (unaudited) | | | 0.35 | % |
Year ended May 31, 2020 | | | 0.35 | % |
Year ended May 31, 2019 | | | 0.35 | % |
Year ended May 31, 2018 | | | 0.35 | % |
Year ended May 31, 2017 | | | 0.35 | % |
Year ended May 31, 2016 | | | 0.35 | % |
| 3 | Portfolio turnover rate is calculated by multiplying the affiliated Master Portfolio’s percentage of the Fund’s total investment in securities at the end of the period by the affiliated Master Portfolio’s portfolio turnover rate. |
The accompanying notes are an integral part of these financial statements.
14 | Wells Fargo Core Bond Fund
Financial highlights
(For a share outstanding throughout each period)
| | | | | | | | | | | | | | | | | | | | | | | | |
| | | Six months ended
November 30, 2020
(unaudited) | | | Year ended May 31 | |
| CLASS R | | 2020 | | | 2019 | | | 2018 | | | 2017 | | | 2016 | |
Net asset value, beginning of period | | | $13.83 | | | | $12.96 | | | | $12.55 | | | | $12.90 | | | | $12.97 | | | | $12.85 | |
Net investment income | | | 0.06 | 1 | | | 0.22 | 1 | | | 0.28 | 1 | | | 0.20 | 1 | | | 0.15 | 1 | | | 0.15 | 1 |
Net realized and unrealized gains (losses) on investments | | | 0.30 | | | | 0.90 | | | | 0.41 | | | | (0.35 | ) | | | (0.01 | ) | | | 0.12 | |
| | | | | | | | | | | | | | | | | | | | | | | | |
Total from investment operations | | | 0.36 | | | | 1.12 | | | | 0.69 | | | | (0.15 | ) | | | 0.14 | | | | 0.27 | |
Distributions to shareholders from | | | | | | | | | | | | | | | | | | | | | | | | |
Net investment income | | | (0.08 | ) | | | (0.22 | ) | | | (0.28 | ) | | | (0.20 | ) | | | (0.15 | ) | | | (0.15 | ) |
Net realized gains | | | 0.00 | | | | (0.03 | ) | | | 0.00 | | | | 0.00 | | | | (0.06 | ) | | | 0.00 | |
| | | | | | | | | | | | | | | | | | | | | | | | |
Total distributions to shareholders | | | (0.08 | ) | | | (0.25 | ) | | | (0.28 | ) | | | (0.20 | ) | | | (0.21 | ) | | | (0.15 | ) |
Net asset value, end of period | | | $14.11 | | | | $13.83 | | | | $12.96 | | | | $12.55 | | | | $12.90 | | | | $12.97 | |
Total return2 | | | 2.60 | % | | | 8.80 | % | | | 5.61 | % | | | (1.19 | )% | | | 1.15 | % | | | 2.13 | % |
Ratios to average net assets (annualized) | | | | | | | | | | | | | | | | | | | | | | | | |
Gross expenses3 | | | 0.90 | % | | | 1.05 | % | | | 1.07 | % | | | 1.08 | % | | | 1.08 | % | | | 1.08 | % |
Net expenses3 | | | 0.89 | % | | | 1.02 | % | | | 1.03 | % | | | 1.03 | % | | | 1.03 | % | | | 1.03 | % |
Net investment income3 | | | 0.90 | % | | | 1.66 | % | | | 2.25 | % | | | 1.54 | % | | | 1.18 | % | | | 1.18 | % |
Supplemental data | | | | | | | | | | | | | | | | | | | | | | | | |
Portfolio turnover rate4 | | | 213 | % | | | 603 | % | | | 577 | % | | | 542 | % | | | 614 | % | | | 667 | % |
Net assets, end of period (000s omitted) | | | $1,882 | | | | $3,241 | | | | $8,565 | | | | $12,230 | | | | $13,826 | | | | $17,985 | |
| 1 | Calculated based upon average shares outstanding |
| 2 | Returns for periods of less than one year are not annualized. |
| 3 | Ratios include net expenses allocated from the affiliated Master Portfolio which were as follows: |
| | | | |
Six months ended November 30, 2020 (unaudited) | | | 0.35 | % |
Year ended May 31, 2020 | | | 0.35 | % |
Year ended May 31, 2019 | | | 0.35 | % |
Year ended May 31, 2018 | | | 0.35 | % |
Year ended May 31, 2017 | | | 0.35 | % |
Year ended May 31, 2016 | | | 0.35 | % |
| 4 | Portfolio turnover rate is calculated by multiplying the affiliated Master Portfolio’s percentage of the Fund’s total investment in securities at the end of the period by the affiliated Master Portfolio’s portfolio turnover rate. |
The accompanying notes are an integral part of these financial statements.
Wells Fargo Core Bond Fund | 15
Financial highlights
(For a share outstanding throughout each period)
| | | | | | | | | | | | | | | | | | | | | | | | |
| | | Six months ended
November 30, 2020
(unaudited) | | | Year ended May 31 | |
| CLASS R4 | | 2020 | | | 2019 | | | 2018 | | | 2017 | | | 2016 | |
Net asset value, beginning of period | | | $13.83 | | | | $12.95 | | | | $12.55 | | | | $12.89 | | | | $12.95 | | | | $12.83 | |
Net investment income | | | 0.09 | 1 | | | 0.29 | 1 | | | 0.35 | | | | 0.26 | 1 | | | 0.22 | | | | 0.22 | |
Net realized and unrealized gains (losses) on investments | | | 0.30 | | | | 0.91 | | | | 0.40 | | | | (0.34 | ) | | | 0.00 | | | | 0.12 | |
| | | | | | | | | | | | | | | | | | | | | | | | |
Total from investment operations | | | 0.39 | | | | 1.20 | | | | 0.75 | | | | (0.08 | ) | | | 0.22 | | | | 0.34 | |
Distributions to shareholders from | | | | | | | | | | | | | | | | | | | | | | | | |
Net investment income | | | (0.11 | ) | | | (0.29 | ) | | | (0.35 | ) | | | (0.26 | ) | | | (0.22 | ) | | | (0.22 | ) |
Net realized gains | | | 0.00 | | | | (0.03 | ) | | | 0.00 | | | | 0.00 | | | | (0.06 | ) | | | 0.00 | |
| | | | | | | | | | | | | | | | | | | | | | | | |
Total distributions to shareholders | | | (0.11 | ) | | | (0.32 | ) | | | (0.35 | ) | | | (0.26 | ) | | | (0.28 | ) | | | (0.22 | ) |
Net asset value, end of period | | | $14.11 | | | | $13.83 | | | | $12.95 | | | | $12.55 | | | | $12.89 | | | | $12.95 | |
Total return2 | | | 2.80 | % | | | 9.34 | % | | | 6.07 | % | | | (0.61 | )% | | | 1.74 | % | | | 2.65 | % |
Ratios to average net assets (annualized) | | | | | | | | | | | | | | | | | | | | | | | | |
Gross expenses3 | | | 0.59 | % | | | 0.59 | % | | | 0.60 | % | | | 0.60 | % | | | 0.60 | % | | | 0.60 | % |
Net expenses3 | | | 0.52 | % | | | 0.52 | % | | | 0.52 | % | | | 0.52 | % | | | 0.52 | % | | | 0.52 | % |
Net investment income3 | | | 1.26 | % | | | 2.19 | % | | | 2.76 | % | | | 2.01 | % | | | 1.70 | % | | | 1.69 | % |
Supplemental data | | | | | | | | | | | | | | | | | | | | | | | | |
Portfolio turnover rate4 | | | 213 | % | | | 603 | % | | | 577 | % | | | 542 | % | | | 614 | % | | | 667 | % |
Net assets, end of period (000s omitted) | | | $4,290 | | | | $4,549 | | | | $10,805 | | | | $11,680 | | | | $43,205 | | | | $41,272 | |
| 1 | Calculated based upon average shares outstanding |
| 2 | Returns for periods of less than one year are not annualized. |
| 3 | Ratios include net expenses allocated from the affiliated Master Portfolio which were as follows: |
| | | | |
Six months ended November 30, 2020 (unaudited) | | | 0.35 | % |
Year ended May 31, 2020 | | | 0.35 | % |
Year ended May 31, 2019 | | | 0.35 | % |
Year ended May 31, 2018 | | | 0.35 | % |
Year ended May 31, 2017 | | | 0.35 | % |
Year ended May 31, 2016 | | | 0.35 | % |
| 4 | Portfolio turnover rate is calculated by multiplying the affiliated Master Portfolio’s percentage of the Fund’s total investment in securities at the end of the period by the affiliated Master Portfolio’s portfolio turnover rate. |
The accompanying notes are an integral part of these financial statements.
16 | Wells Fargo Core Bond Fund
Financial highlights
(For a share outstanding throughout each period)
| | | | | | | | | | | | | | | | | | | | | | | | |
| | | Six months ended
November 30, 2020
(unaudited) | | | Year ended May 31 | |
| CLASS R6 | | 2020 | | | 2019 | | | 2018 | | | 2017 | | | 2016 | |
Net asset value, beginning of period | | | $13.82 | | | | $12.95 | | | | $12.54 | | | | $12.89 | | | | $12.95 | | | | $12.83 | |
Net investment income | | | 0.10 | | | | 0.30 | | | | 0.37 | | | | 0.28 | | | | 0.24 | | | | 0.24 | |
Net realized and unrealized gains (losses) on investments | | | 0.30 | | | | 0.91 | | | | 0.41 | | | | (0.35 | ) | | | 0.00 | | | | 0.12 | |
| | | | | | | | | | | | | | | | | | | | | | | | |
Total from investment operations | | | 0.40 | | | | 1.21 | | | | 0.78 | | | | (0.07 | ) | | | 0.24 | | | | 0.36 | |
Distributions to shareholders from | | | | | | | | | | | | | | | | | | | | | | | | |
Net investment income | | | (0.12 | ) | | | (0.31 | ) | | | (0.37 | ) | | | (0.28 | ) | | | (0.24 | ) | | | (0.24 | ) |
Net realized gains | | | 0.00 | | | | (0.03 | ) | | | 0.00 | | | | 0.00 | | | | (0.06 | ) | | | 0.00 | |
| | | | | | | | | | | | | | | | | | | | | | | | |
Total distributions to shareholders | | | (0.12 | ) | | | (0.34 | ) | | | (0.37 | ) | | | (0.28 | ) | | | (0.30 | ) | | | (0.24 | ) |
Net asset value, end of period | | | $14.10 | | | | $13.82 | | | | $12.95 | | | | $12.54 | | | | $12.89 | | | | $12.95 | |
Total return1 | | | 2.87 | % | | | 9.42 | % | | | 6.31 | % | | | (0.54 | )% | | | 1.90 | % | | | 2.81 | % |
Ratios to average net assets (annualized) | | | | | | | | | | | | | | | | | | | | | | | | |
Gross expenses2 | | | 0.44 | % | | | 0.44 | % | | | 0.45 | % | | | 0.45 | % | | | 0.45 | % | | | 0.45 | % |
Net expenses2 | | | 0.37 | % | | | 0.37 | % | | | 0.37 | % | | | 0.37 | % | | | 0.37 | % | | | 0.37 | % |
Net investment income2 | | | 1.42 | % | | | 2.26 | % | | | 2.92 | % | | | 2.24 | % | | | 1.87 | % | | | 1.84 | % |
Supplemental data | | | | | | | | | | | | | | | | | | | | | | | | |
Portfolio turnover rate3 | | | 213 | % | | | 603 | % | | | 577 | % | | | 542 | % | | | 614 | % | | | 667 | % |
Net assets, end of period (000s omitted) | | | $2,415,431 | | | | $2,545,332 | | | | $2,513,644 | | | | $1,360,847 | | | | $797,896 | | | | $450,791 | |
| 1 | Returns for periods of less than one year are not annualized. |
| 2 | Ratios include net expenses allocated from the affiliated Master Portfolio which were as follows: |
| | | | |
Six months ended November 30, 2020 (unaudited) | | | 0.35 | % |
Year ended May 31, 2020 | | | 0.35 | % |
Year ended May 31, 2019 | | | 0.35 | % |
Year ended May 31, 2018 | | | 0.35 | % |
Year ended May 31, 2017 | | | 0.35 | % |
Year ended May 31, 2016 | | | 0.35 | % |
| 3 | Portfolio turnover rate is calculated by multiplying the affiliated Master Portfolio’s percentage of the Fund’s total investment in securities at the end of the period by the affiliated Master Portfolio’s portfolio turnover rate. |
The accompanying notes are an integral part of these financial statements.
Wells Fargo Core Bond Fund | 17
Financial highlights
(For a share outstanding throughout each period)
| | | | | | | | | | | | | | | | | | | | | | | | |
| | | Six months ended
November 30, 2020
(unaudited) | | | Year ended May 31 | |
| ADMINISTRATOR CLASS | | 2020 | | | 2019 | | | 2018 | | | 2017 | | | 2016 | |
Net asset value, beginning of period | | | $13.83 | | | | $12.96 | | | | $12.56 | | | | $12.90 | | | | $12.97 | | | | $12.85 | |
Net investment income | | | 0.08 | 1 | | | 0.26 | | | | 0.33 | 1 | | | 0.24 | 1 | | | 0.21 | | | | 0.19 | |
Net realized and unrealized gains (losses) on investments | | | 0.29 | | | | 0.90 | | | | 0.40 | | | | (0.34 | ) | | | (0.02 | ) | | | 0.12 | |
| | | | | | | | | | | | | | | | | | | | | | | | |
Total from investment operations | | | 0.37 | | | | 1.16 | | | | 0.73 | | | | (0.10 | ) | | | 0.19 | | | | 0.31 | |
Distributions to shareholders from | | | | | | | | | | | | | | | | | | | | | | | | |
Net investment income | | | (0.09 | ) | | | (0.26 | ) | | | (0.33 | ) | | | (0.24 | ) | | | (0.20 | ) | | | (0.19 | ) |
Net realized gains | | | 0.00 | | | | (0.03 | ) | | | 0.00 | | | | 0.00 | | | | (0.06 | ) | | | 0.00 | |
| | | | | | | | | | | | | | | | | | | | | | | | |
Total distributions to shareholders | | | (0.09 | ) | | | (0.29 | ) | | | (0.33 | ) | | | (0.24 | ) | | | (0.26 | ) | | | (0.19 | ) |
Net asset value, end of period | | | $14.11 | | | | $13.83 | | | | $12.96 | | | | $12.56 | | | | $12.90 | | | | $12.97 | |
Total return2 | | | 2.70 | % | | | 9.14 | % | | | 5.87 | % | | | (0.79 | )% | | | 1.48 | % | | | 2.47 | % |
Ratios to average net assets (annualized) | | | | | | | | | | | | | | | | | | | | | | | | |
Gross expenses3 | | | 0.76 | % | | | 0.76 | % | | | 0.76 | % | | | 0.77 | % | | | 0.77 | % | | | 0.77 | % |
Net expenses3 | | | 0.70 | % | | | 0.70 | % | | | 0.70 | % | | | 0.70 | % | | | 0.70 | % | | | 0.70 | % |
Net investment income3 | | | 1.09 | % | | | 1.92 | % | | | 2.58 | % | | | 1.86 | % | | | 1.50 | % | | | 1.51 | % |
Supplemental data | | | | | | | | | | | | | | | | | | | | | | | | |
Portfolio turnover rate4 | | | 213 | % | | | 603 | % | | | 577 | % | | | 542 | % | | | 614 | % | | | 667 | % |
Net assets, end of period (000s omitted) | | | $256,657 | | | | $218,522 | | | | $205,825 | | | | $269,057 | | | | $373,042 | | | | $529,530 | |
| 1 | Calculated based upon average shares outstanding |
| 2 | Returns for periods of less than one year are not annualized. |
| 3 | Ratios include net expenses allocated from the affiliated Master Portfolio which were as follows: |
| | | | |
Six months ended November 30, 2020 (unaudited) | | | 0.35 | % |
Year ended May 31, 2020 | | | 0.35 | % |
Year ended May 31, 2019 | | | 0.35 | % |
Year ended May 31, 2018 | | | 0.35 | % |
Year ended May 31, 2017 | | | 0.35 | % |
Year ended May 31, 2016 | | | 0.35 | % |
| 4 | Portfolio turnover rate is calculated by multiplying the affiliated Master Portfolio’s percentage of the Fund’s total investment in securities at the end of the period by the affiliated Master Portfolio’s portfolio turnover rate. |
The accompanying notes are an integral part of these financial statements.
18 | Wells Fargo Core Bond Fund
Financial highlights
(For a share outstanding throughout each period)
| | | | | | | | | | | | | | | | | | | | | | | | |
| | | Six months ended
November 30, 2020
(unaudited) | | | Year ended May 31 | |
| INSTITUTIONAL CLASS | | 2020 | | | 2019 | | | 2018 | | | 2017 | | | 2016 | |
Net asset value, beginning of period | | | $13.82 | | | | $12.94 | | | | $12.54 | | | | $12.88 | | | | $12.95 | | | | $12.83 | |
Net investment income | | | 0.10 | | | | 0.29 | | | | 0.36 | | | | 0.28 | | | | 0.23 | | | | 0.23 | |
Net realized and unrealized gains (losses) on investments | | | 0.29 | | | | 0.92 | | | | 0.40 | | | | (0.34 | ) | | | (0.01 | ) | | | 0.12 | |
| | | | | | | | | | | | | | | | | | | | | | | | |
Total from investment operations | | | 0.39 | | | | 1.21 | | | | 0.76 | | | | (0.06 | ) | | | 0.22 | | | | 0.35 | |
Distributions to shareholders from | | | | | | | | | | | | | | | | | | | | | | | | |
Net investment income | | | (0.11 | ) | | | (0.30 | ) | | | (0.36 | ) | | | (0.28 | ) | | | (0.23 | ) | | | (0.23 | ) |
Net realized gains | | | 0.00 | | | | (0.03 | ) | | | 0.00 | | | | 0.00 | | | | (0.06 | ) | | | 0.00 | |
| | | | | | | | | | | | | | | | | | | | | | | | |
Total distributions to shareholders | | | (0.11 | ) | | | (0.33 | ) | | | (0.36 | ) | | | (0.28 | ) | | | (0.29 | ) | | | (0.23 | ) |
Net asset value, end of period | | | $14.10 | | | | $13.82 | | | | $12.94 | | | | $12.54 | | | | $12.88 | | | | $12.95 | |
Total return1 | | | 2.85 | % | | | 9.45 | % | | | 6.18 | % | | | (0.51 | )% | | | 1.77 | % | | | 2.76 | % |
Ratios to average net assets (annualized) | | | | | | | | | | | | | | | | | | | | | | | | |
Gross expenses2 | | | 0.49 | % | | | 0.49 | % | | | 0.50 | % | | | 0.50 | % | | | 0.50 | % | | | 0.50 | % |
Net expenses2 | | | 0.42 | % | | | 0.42 | % | | | 0.42 | % | | | 0.42 | % | | | 0.42 | % | | | 0.42 | % |
Net investment income2 | | | 1.37 | % | | | 2.21 | % | | | 2.86 | % | | | 2.16 | % | | | 1.82 | % | | | 1.79 | % |
Supplemental data | | | | | | | | | | | | | | | | | | | | | | | | |
Portfolio turnover rate3 | | | 213 | % | | | 603 | % | | | 577 | % | | | 542 | % | | | 614 | % | | | 667 | % |
Net assets, end of period (000s omitted) | | | $2,745,223 | | | | $2,365,421 | | | | $2,343,238 | | | | $3,318,290 | | | | $3,166,348 | | | | $2,102,073 | |
| 1 | Returns for periods of less than one year are not annualized. |
| 2 | Ratios include net expenses allocated from the affiliated Master Portfolio which were as follows: |
| | | | |
Six months ended November 30, 2020 (unaudited) | | | 0.35 | % |
Year ended May 31, 2020 | | | 0.35 | % |
Year ended May 31, 2019 | | | 0.35 | % |
Year ended May 31, 2018 | | | 0.35 | % |
Year ended May 31, 2017 | | | 0.35 | % |
Year ended May 31, 2016 | | | 0.35 | % |
| 3 | Portfolio turnover rate is calculated by multiplying the affiliated Master Portfolio’s percentage of the Fund’s total investment in securities at the end of the period by the affiliated Master Portfolio’s portfolio turnover rate. |
The accompanying notes are an integral part of these financial statements.
Wells Fargo Core Bond Fund | 19
Notes to financial statements (unaudited)
1. ORGANIZATION
Wells Fargo Funds Trust (the “Trust”), a Delaware statutory trust organized on March 10, 1999, is an open-end management investment company registered under the Investment Company Act of 1940, as amended (the “1940 Act”). As an investment company, the Trust follows the accounting and reporting guidance in Financial Accounting Standards Board (“FASB”) Accounting Standards Codification Topic 946, Financial Services – Investment Companies. These financial statements report on the Wells Fargo Core Bond Fund (the “Fund”) which is a diversified series of the Trust.
The Fund is a feeder fund in a master-feeder structure that invests substantially all of its assets in a single master portfolio with a substantially identical investment objective and substantially similar investment strategies. The Fund invests in Wells Fargo Core Bond Portfolio, a separate diversified portfolio (the “affiliated Master Portfolio”) of Wells Fargo Master Trust, a registered open-end management investment company. As of November 30, 2020, the Fund owned 95% of Wells Fargo Core Bond Portfolio. The affiliated Master Portfolio directly acquires portfolio securities and the Fund acquires an indirect interest in those securities. The Fund accounts for its investment in the affiliated Master Portfolio as a partnership investment and records on a daily basis its share of the affiliated Master Portfolio’s income, expense and realized and unrealized gains and losses. The financial statements of the affiliated Master Portfolio for the six months ended November 30, 2020 are included in this report and should be read in conjunction with the Fund’s financial statements.
2. SIGNIFICANT ACCOUNTING POLICIES
The following significant accounting policies, which are consistently followed in the preparation of the financial statements of the Fund, are in conformity with U.S. generally accepted accounting principles which require management to make estimates and assumptions that affect the reported amounts of assets and liabilities, disclosure of contingent assets and liabilities at the date of the financial statements, and the reported amounts of income and expenses during the reporting period. Actual results could differ from those estimates.
Securities valuation
All investments are valued each business day as of the close of regular trading on the New York Stock Exchange (generally 4 p.m. Eastern Time), although the Fund may deviate from this calculation time under unusual or unexpected circumstances.
Investments in the affiliated Master Portfolio are valued daily based on the Fund’s proportionate share of the affiliated Master Portfolio’s net assets, which are also valued daily. Securities held in the affiliated Master Portfolio are valued as discussed in the Notes to Financial Statements of the affiliated Master Portfolio, which are included elsewhere in this report.
Investments which are not valued using the method discussed above are valued at their fair value, as determined in good faith by the Board of Trustees of the Fund. The Board of Trustees has established a Valuation Committee comprised of the Trustees and has delegated to it the authority to take any actions regarding the valuation of portfolio securities that the Valuation Committee deems necessary or appropriate, including determining the fair value of portfolio securities, unless the determination has been delegated to the Wells Fargo Asset Management Pricing Committee at Wells Fargo Funds Management, LLC (“Funds Management”). The Board of Trustees retains the authority to make or ratify any valuation decisions or approve any changes to the Valuation Procedures as it deems appropriate. On a quarterly basis, the Board of Trustees receives reports on any valuation actions taken by the Valuation Committee or the Wells Fargo Asset Management Pricing Committee which may include items for ratification.
Investment transactions, income and expenses
Investments in the affiliated Master Portfolio are recorded on a trade basis. The Fund records daily its proportionate share of the affiliated Master Portfolio’s income, expenses and realized and unrealized gains or losses. The Fund also accrues its own expenses.
Distributions to shareholders
Distributions to shareholders from net investment income are declared daily and paid monthly. Distributions from net realized gains, if any, are recorded on the ex-dividend date and paid at least annually. Such distributions are determined in accordance with income tax regulations and may differ from U.S. generally accepted accounting principles. Dividend sources are estimated at the time of declaration. The tax character of distributions is determined as of the Fund’s fiscal year end. Therefore, a portion of the Fund’s distributions made prior to the Fund’s fiscal year end may be categorized as a tax return of capital at year end.
Federal and other taxes
The Fund intends to continue to qualify as a regulated investment company by distributing substantially all of its investment company taxable income and any net realized capital gains (after reduction for capital loss carryforwards) sufficient to relieve it from all, or substantially all, federal income taxes. Accordingly, no provision for federal income taxes was required.
20 | Wells Fargo Core Bond Fund
Notes to financial statements (unaudited)
The Fund’s income and federal excise tax returns and all financial records supporting those returns for the prior three fiscal years are subject to examination by the federal and Delaware revenue authorities. Management has analyzed the Fund’s tax positions taken on federal, state, and foreign tax returns for all open tax years and does not believe that there are any uncertain tax positions that require recognition of a tax liability.
As of November 30, 2020, the aggregate cost of all investments for federal income tax purposes was $5,592,245,257 and the unrealized gains (losses) consisted of:
| | | | |
| |
Gross unrealized gains | | $ | 182,013,053 | |
| |
Gross unrealized losses | | | 0 | |
| |
Net unrealized gains | | $ | 182,013,053 | |
Class allocations
The separate classes of shares offered by the Fund differ principally in applicable sales charges, distribution, shareholder servicing, and administration fees. Class specific expenses are charged directly to that share class. Investment income, common fund-level expenses, and realized and unrealized gains (losses) on investments are allocated daily to each class of shares based on the relative proportion of net assets of each class.
3. FAIR VALUATION MEASUREMENTS
At November 30, 2020, the affiliated Master Portfolio was measured at fair value using the net asset value per share (or its equivalent) as a practical expedient. The investment objective and the value of the affiliate Master Portfolio was as follows:
| | | | |
| | |
| Affiliated Master Portfolio | | Investment objective | | Value of affiliated
Master Portfolio |
| | |
Wells Fargo Core Bond Portfolio | | Seeks total return, consisting of income and capital appreciation | | $5,774,258,310 |
The affiliated Master Portfolio does not have a redemption period notice, can be redeemed daily and does not have any unfunded commitments.
4. TRANSACTIONS WITH AFFILIATES
Management fee
Funds Management, an indirect wholly owned subsidiary of Wells Fargo & Company (“Wells Fargo”), is the manager of the Fund and provides advisory and fund-level administrative services under an investment management agreement. Under the investment management agreement, Funds Management is responsible for, among other services, implementing the investment objectives and strategies of the Fund and providing fund-level administrative services in connection with the Fund’s operations. As long as the Fund continues to invest substantially all of its assets in a single affiliated Master Portfolio, the Fund pays Funds Management an investment management fee only for fund-level administrative services at the following annual rate based on the Fund’s average daily net assets:
| | |
| |
| Average daily net assets | | Management fee |
| |
First $5 billion | | 0.05% |
| |
Next $5 billion | | 0.04 |
| |
Over $10 billion | | 0.03 |
For the six months ended November 30, 2020, the management fee was equivalent to an annual rate of 0.05% of the Fund’s average daily net assets.
Funds Management also serves as the adviser to the affiliated Master Portfolio and is entitled to receive a fee from the affiliated Master Portfolio for those services.
Wells Fargo Core Bond Fund | 21
Notes to financial statements (unaudited)
Administration fees
Under a class-level administration agreement, Funds Management provides class-level administrative services to the Fund, which includes paying fees and expenses for services provided by the transfer agent, sub-transfer agents, omnibus account servicers and record-keepers. As compensation for its services under the class-level administration agreement, Funds Management receives an annual fee which is calculated based on the average daily net assets of each class as follows:
| | | | |
| |
| | | Class-level
administration fee | |
| |
Class A, Class C, Class R | | | 0.16 | % |
| |
Class R4, Institutional Class | | | 0.08 | |
| |
Class R6 | | | 0.03 | |
| |
Administrator Class | | | 0.10 | |
Waivers and/or expense reimbursements
Funds Management has contractually waived and/or reimbursed management and administration fees to the extent necessary to maintain certain net operating expense ratios for the Fund. When each class of the Fund has exceeded its expense cap, Funds Management has waived fees and/or reimbursed expenses from fund-level expenses on a proportionate basis and then from class specific expenses. When only certain classes exceed their expense caps, waivers and/or reimbursements are applied against class specific expenses before fund-level expenses. Net expenses from the affiliated Master Portfolio are included in the expense caps. Funds Management has committed through September 30, 2021 to waive fees and/or reimburse expenses to the extent necessary to cap the Fund’s expenses at 0.78% for Class A shares, 1.53% for Class C shares, 1.03% for Class R shares, 0.52% for Class R4 shares, 0.37% for Class R6 shares, 0.70% for Administrator shares, and 0.42% for Institutional Class shares. Prior to or after the commitment expiration date, the cap may be increased or the commitment to maintain the cap may be terminated only with the approval of the Board of Trustees.
Distribution fees
The Trust has adopted a distribution plan for Class C and Class R shares of the Fund pursuant to Rule 12b-1 under the 1940 Act. Distribution fees are charged to Class C and Class R shares and paid to Wells Fargo Funds Distributor, LLC (“Funds Distributor”), the principal underwriter, at an annual rate of 0.75% of the average daily net assets of Class C shares and 0.25% of the average daily net assets of Class R shares.
In addition, Funds Distributor is entitled to receive the front-end sales charge from the purchase of Class A shares and a contingent deferred sales charge on the redemption of certain Class A shares. Funds Distributor is also entitled to receive the contingent deferred sales charges from redemptions of Class C shares. For the six months ended November 30, 2020, Funds Distributor received $5,417 from the sale of Class A shares. Funds Distributor did not receive any front-end or contingent deferred sales charges from Class A or Class C shares for the six months ended November 30, 2020.
Shareholder servicing fees
The Trust has entered into contracts with one or more shareholder servicing agents, whereby Class A, Class C, Class R, and Administrator Class of the Fund are charged a fee at an annual rate of 0.25% of the average daily net assets of each respective class. Class R4 is charged a fee at an annual rate of 0.10% of its average daily net assets. A portion of these total shareholder servicing fees were paid to affiliates of Wells Fargo.
5. INVESTMENT PORTFOLIO TRANSACTIONS
The Fund seeks to achieve its investment objective by investing substantially all of its assets in a single affiliated Master Portfolio. Purchases and sales have been calculated by multiplying the Fund’s ownership percentage of the affiliated Master Portfolio by the affiliated Master Portfolio’s purchases and sales. Purchases and sales of investments, excluding short-term securities, for the six months ended November 30, 2020 were as follows:
| | | | | | |
Purchases at cost | | Sales proceeds |
U.S.
government | | Non-U.S.
government | | U.S.
government | | Non-U.S.
government |
| $11,611,152,238 | | $1,892,826,772 | | $11,164,563,457 | | $1,682,795,393 |
22 | Wells Fargo Core Bond Fund
Notes to financial statements (unaudited)
6. BANK BORROWINGS
The Trust (excluding the money market funds), Wells Fargo Master Trust and Wells Fargo Variable Trust are parties to a $350,000,000 revolving credit agreement whereby the Fund is permitted to use bank borrowings for temporary or emergency purposes, such as to fund shareholder redemption requests. Interest under the credit agreement is charged to the Fund based on a borrowing rate equal to the higher of the Federal Funds rate in effect on that day plus 1.25% or the overnight LIBOR rate in effect on that day plus 1.25%. In addition, an annual commitment fee equal to 0.25% of the unused balance is allocated to each participating fund.
For the six months ended November 30, 2020, there were no borrowings by the Fund under the agreement.
7. INDEMNIFICATION
Under the Fund’s organizational documents, the officers and Trustees have been granted certain indemnification rights against certain liabilities that may arise out of performance of their duties to the Fund. The Fund has entered into a separate agreement with each Trustee that converts indemnification rights currently existing under the Fund’s organizational documents into contractual rights that cannot be changed in the future without the consent of the Trustee. Additionally, in the normal course of business, the Fund may enter into contracts with service providers that contain a variety of indemnification clauses. The Fund’s maximum exposure under these arrangements is dependent on future claims that may be made against the Fund and, therefore, cannot be estimated.
8. NEW ACCOUNTING PRONOUNCEMENT
In August 2018, FASB issued Accounting Standards Update (“ASU”) No. 2018-13, Fair Value Measurement (Topic 820) Disclosure Framework—Changes to the Disclosure Requirements for Fair Value Measurement. ASU 2018-13 updates the disclosure requirements on fair value measurements in Topic 820, Fair Value Measurements. The amendments are effective for fiscal years, and interim periods within those fiscal years, beginning after December 15, 2019. Management has adopted this guidance which did not have a material impact on the financial statements.
9. CORONAVIRUS (COVID-19) PANDEMIC
On March 11, 2020, the World Health Organization announced that it had made the assessment that coronavirus disease 2019 (“COVID-19”) is a pandemic. The impacts of COVID-19 are adversely affecting the entire global economy, individual companies and investment products, and the market in general. There is significant uncertainty around the extent and duration of business disruptions related to COVID-19 and the impacts may be short term or may last for an extended period of time. The risk of further spreading of COVID-19 has led to significant uncertainty and volatility in the financial markets.
Wells Fargo Core Bond Fund | 23
Portfolio of investments—November 30, 2020 (unaudited)
| | | | | | | | | | | | | | | | |
| | | Interest
rate | | | Maturity
date | | | Principal | | | Value | |
| Agency Securities: 30.69% | |
FHLMC (1 Month LIBOR +0.35%) ± | | | 0.49 | % | | | 12-15-2048 | | | $ | 1,241,276 | | | $ | 1,245,562 | |
FHLMC | | | 1.75 | | | | 5-15-2043 | | | | 2,994,601 | | | | 3,088,286 | |
FHLMC (1 Month LIBOR +0.35%) ± | | | 2.85 | | | | 10-15-2037 | | | | 4,838,938 | | | | 4,823,768 | |
FHLMC | | | 3.00 | | | | 10-15-2047 | | | | 12,028,184 | | | | 12,572,319 | |
FHLMC | | | 3.00 | | | | 2-1-2050 | | | | 999,365 | | | | 1,062,799 | |
FHLMC | | | 3.00 | | | | 5-15-2050 | | | | 6,249,920 | | | | 6,724,267 | |
FHLMC | | | 3.50 | | | | 4-1-2049 | | | | 4,899,034 | | | | 5,397,453 | |
FHLMC | | | 3.50 | | | | 8-1-2049 | | | | 4,704,516 | | | | 5,150,078 | |
FHLMC | | | 3.50 | | | | 11-1-2049 | | | | 15,429,035 | | | | 16,404,180 | |
FHLMC | | | 4.00 | | | | 1-1-2035 | | | | 154,988 | | | | 172,723 | |
FHLMC | | | 4.00 | | | | 1-1-2036 | | | | 255,855 | | | | 281,670 | |
FHLMC | | | 4.00 | | | | 10-1-2036 | | | | 1,805,311 | | | | 1,969,850 | |
FHLMC | | | 4.00 | | | | 3-1-2037 | | | | 212,339 | | | | 235,822 | |
FHLMC | | | 4.00 | | | | 3-1-2037 | | | | 238,197 | | | | 269,008 | |
FHLMC | | | 4.00 | | | | 3-1-2037 | | | | 410,576 | | | | 451,765 | |
FHLMC | | | 4.00 | | | | 4-1-2037 | | | | 1,684,545 | | | | 1,853,526 | |
FHLMC | | | 4.00 | | | | 4-1-2037 | | | | 2,181,716 | | | | 2,422,843 | |
FHLMC | | | 4.00 | | | | 8-1-2038 | | | | 12,901,520 | | | | 13,842,109 | |
FHLMC | | | 4.00 | | | | 1-1-2048 | | | | 1,496,008 | | | | 1,660,780 | |
FHLMC | | | 4.00 | | | | 11-1-2048 | | | | 11,721,246 | | | | 12,870,973 | |
FHLMC | | | 4.00 | | | | 7-1-2049 | | | | 14,835,567 | | | | 16,471,897 | |
FHLMC | | | 4.00 | | | | 7-1-2049 | | | | 41,720,255 | | | | 45,781,948 | |
FHLMC | | | 4.50 | | | | 6-1-2039 | | | | 205,096 | | | | 230,158 | |
FHLMC | | | 4.50 | | | | 7-1-2039 | | | | 265,786 | | | | 307,961 | |
FHLMC | | | 4.50 | | | | 11-1-2048 | | | | 6,624,862 | | | | 7,357,708 | |
FHLMC | | | 4.50 | | | | 3-1-2049 | | | | 2,725,406 | | | | 3,039,919 | |
FHLMC | | | 4.50 | | | | 8-1-2049 | | | | 23,749,644 | | | | 26,367,718 | |
FHLMC | | | 5.00 | | | | 5-1-2048 | | | | 8,014,649 | | | | 9,170,632 | |
FHLMC | | | 5.00 | | | | 3-1-2049 | | | | 15,707,313 | | | | 17,769,267 | |
FHLMC | | | 6.50 | | | | 4-1-2021 | | | | 26 | | | | 26 | |
FHLMC Series 1897 Class K | | | 7.00 | | | | 9-15-2026 | | | | 288 | | | | 320 | |
FHLMC Series 264 Class 30 | | | 3.00 | | | | 7-15-2042 | | | | 11,998,645 | | | | 12,852,316 | |
FHLMC Series 4426 Class QC | | | 1.75 | | | | 7-15-2037 | | | | 5,301,433 | | | | 5,481,258 | |
FHLMC Series 4705 Class A | | | 4.50 | | | | 9-15-2042 | | | | 2,315,575 | | | | 2,388,260 | |
FHLMC Series 4763 Class CA | | | 3.00 | | | | 9-15-2038 | | | | 1,399,145 | | | | 1,511,698 | |
FHLMC Series 4767 Class KA | | | 3.00 | | | | 3-15-2048 | | | | 3,746,893 | | | | 4,052,167 | |
FHLMC Series 4786 Class DP | | | 4.50 | | | | 7-15-2042 | | | | 435,584 | | | | 436,844 | |
FNMA (1 Month LIBOR +0.35%) ± | | | 0.50 | | | | 10-15-2037 | | | | 16,718,983 | | | | 16,715,417 | |
FNMA %% | | | 1.50 | | | | 12-16-2035 | | | | 21,000,000 | | | | 21,532,793 | |
FNMA | | | 1.50 | | | | 1-25-2043 | | | | 10,531,018 | | | | 10,765,867 | |
FNMA | | | 1.50 | | | | 1-25-2043 | | | | 4,037,971 | | | | 4,169,746 | |
FNMA | | | 1.50 | | | | 4-25-2043 | | | | 1,235,601 | | | | 1,262,686 | |
FNMA %% | | | 1.50 | | | | 2-12-2051 | | | | 29,300,000 | | | | 29,542,091 | |
FNMA | | | 1.70 | | | | 8-25-2033 | | | | 13,310,341 | | | | 13,766,663 | |
FNMA | | | 1.75 | | | | 5-25-2043 | | | | 4,274,525 | | | | 4,444,756 | |
FNMA | | | 1.75 | | | | 6-25-2046 | | | | 24,807,498 | | | | 25,812,239 | |
FNMA | | | 2.00 | | | | 11-1-2035 | | | | 44,231,062 | | | | 46,062,434 | |
FNMA %% | | | 2.00 | | | | 12-16-2035 | | | | 5,300,000 | | | | 5,517,072 | |
FNMA | | | 2.00 | | | | 6-25-2038 | | | | 13,509,119 | | | | 14,116,080 | |
FNMA %% | | | 2.00 | | | | 12-14-2050 | | | | 3,800,000 | | | | 3,947,575 | |
FNMA %% | | | 2.00 | | | | 1-14-2051 | | | | 126,100,000 | | | | 130,752,978 | |
FNMA %% | | | 2.00 | | | | 2-12-2051 | | | | 90,400,000 | | | | 93,477,555 | |
FNMA | | | 2.50 | | | | 11-25-2044 | | | | 2,937,559 | | | | 3,128,019 | |
FNMA | | | 2.50 | | | | 9-1-2050 | | | | 44,826,088 | | | | 47,637,645 | |
FNMA | | | 2.50 | | | | 10-1-2050 | | | | 41,012,763 | | | | 43,635,387 | |
FNMA (12 Month LIBOR +1.59%) ± | | | 2.69 | | | | 1-1-2046 | | | | 12,493,973 | | | | 12,974,097 | |
The accompanying notes are an integral part of these financial statements.
24 | Wells Fargo Core Bond Portfolio
Portfolio of investments—November 30, 2020 (unaudited)
| | | | | | | | | | | | | | | | |
| | | Interest
rate | | | Maturity
date | | | Principal | | | Value | |
| Agency Securities (continued) | |
FNMA (12 Month LIBOR +1.58%) ± | | | 2.76 | % | | | 6-1-2045 | | | $ | 3,553,064 | | | $ | 3,690,066 | |
FNMA | | | 3.00 | | | | 1-1-2043 | | | | 6,892,618 | | | | 7,343,763 | |
FNMA | | | 3.00 | | | | 11-25-2043 | | | | 3,177,965 | | | | 3,290,250 | |
FNMA | | | 3.00 | | | | 5-25-2048 | | | | 8,731,081 | | | | 9,365,213 | |
FNMA | | | 3.00 | | | | 7-25-2049 | | | | 4,132,951 | | | | 4,341,350 | |
FNMA | | | 3.00 | | | | 2-1-2050 | | | | 718,950 | | | | 764,585 | |
FNMA | | | 3.00 | | | | 6-1-2050 | | | | 24,700,793 | | | | 26,162,784 | |
FNMA | | | 3.50 | | | | 9-1-2032 | | | | 6,348,273 | | | | 6,716,170 | |
FNMA | | | 3.50 | | | | 6-1-2049 | | | | 1,902,794 | | | | 2,023,342 | |
FNMA | | | 3.50 | | | | 11-1-2049 | | | | 16,625,953 | | | | 17,652,565 | |
FNMA | | | 4.00 | | | | 9-1-2033 | | | | 3,448,831 | | | | 3,695,123 | |
FNMA | | | 4.00 | | | | 12-1-2036 | | | | 290,366 | | | | 319,603 | |
FNMA | | | 4.00 | | | | 10-1-2037 | | | | 2,012,567 | | | | 2,193,926 | |
FNMA | | | 4.00 | | | | 5-1-2038 | | | | 572,289 | | | | 613,117 | |
FNMA | | | 4.00 | | | | 9-1-2045 | | | | 1,098,171 | | | | 1,237,453 | |
FNMA | | | 4.00 | | | | 1-1-2046 | | | | 7,077,503 | | | | 7,974,448 | |
FNMA | | | 4.00 | | | | 10-1-2046 | | | | 487,806 | | | | 529,631 | |
FNMA | | | 4.00 | | | | 12-1-2046 | | | | 667,955 | | | | 725,175 | |
FNMA | | | 4.00 | | | | 1-1-2047 | | | | 4,584,390 | | | | 4,940,274 | |
FNMA | | | 4.00 | | | | 2-1-2047 | | | | 5,152,121 | | | | 5,720,847 | |
FNMA | | | 4.00 | | | | 4-1-2047 | | | | 685,153 | | | | 774,037 | |
FNMA | | | 4.00 | | | | 4-1-2047 | | | | 657,984 | | | | 707,923 | |
FNMA | | | 4.00 | | | | 4-1-2047 | | | | 722,022 | | | | 801,169 | |
FNMA | | | 4.00 | | | | 9-1-2047 | | | | 2,674,505 | | | | 2,897,304 | |
FNMA | | | 4.00 | | | | 10-1-2047 | | | | 669,245 | | | | 756,075 | |
FNMA | | | 4.00 | | | | 10-1-2047 | | | | 677,142 | | | | 757,314 | |
FNMA | | | 4.00 | | | | 10-1-2047 | | | | 1,794,078 | | | | 1,939,327 | |
FNMA | | | 4.00 | | | | 11-1-2047 | | | | 308,743 | | | | 334,063 | |
FNMA | | | 4.00 | | | | 11-1-2047 | | | | 632,918 | | | | 685,015 | |
FNMA | | | 4.00 | | | | 3-1-2048 | | | | 17,658,490 | | | | 19,943,970 | |
FNMA | | | 4.00 | | | | 7-1-2048 | | | | 24,920,352 | | | | 27,296,693 | |
FNMA | | | 4.00 | | | | 9-1-2048 | | | | 6,054,769 | | | | 6,640,743 | |
FNMA | | | 4.00 | | | | 10-1-2048 | | | | 5,152,271 | | | | 5,615,813 | |
FNMA | | | 4.00 | | | | 11-1-2048 | | | | 5,430,745 | | | | 5,985,651 | |
FNMA | | | 4.00 | | | | 12-1-2048 | | | | 3,709,641 | | | | 4,189,821 | |
FNMA | | | 4.00 | | | | 2-1-2049 | | | | 6,156,430 | | | | 6,842,953 | |
FNMA | | | 4.00 | | | | 3-1-2049 | | | | 2,553,506 | | | | 2,777,349 | |
FNMA | | | 4.00 | | | | 4-1-2049 | | | | 3,418,562 | | | | 3,719,981 | |
FNMA | | | 4.00 | | | | 5-1-2049 | | | | 475,797 | | | | 518,108 | |
FNMA | | | 4.00 | | | | 5-1-2049 | | | | 382,274 | | | | 418,739 | |
FNMA | | | 4.00 | | | | 5-1-2049 | | | | 3,443,179 | | | | 3,738,932 | |
FNMA | | | 4.00 | | | | 5-1-2049 | | | | 3,706,965 | | | | 4,145,784 | |
FNMA | | | 4.00 | | | | 5-1-2049 | | | | 12,556,626 | | | | 14,185,396 | |
FNMA | | | 4.00 | | | | 6-1-2049 | | | | 3,093,980 | | | | 3,366,190 | |
FNMA | | | 4.00 | | | | 6-1-2049 | | | | 1,512,509 | | | | 1,635,743 | |
FNMA | | | 4.00 | | | | 12-1-2049 | | | | 7,123,660 | | | | 8,052,182 | |
FNMA | | | 4.00 | | | | 12-1-2049 | | | | 4,170,839 | | | | 4,631,181 | |
FNMA | | | 4.50 | | | | 5-1-2034 | | | | 1,316,465 | | | | 1,460,959 | |
FNMA | | | 4.50 | | | | 6-1-2041 | | | | 264,913 | | | | 304,675 | |
FNMA | | | 4.50 | | | | 3-1-2043 | | | | 3,070,232 | | | | 3,530,540 | |
FNMA | | | 4.50 | | | | 3-1-2044 | | | | 940,905 | | | | 1,082,256 | |
FNMA | | | 4.50 | | | | 10-1-2045 | | | | 4,791,807 | | | | 5,511,723 | |
FNMA | | | 4.50 | | | | 2-1-2046 | | | | 95,448 | | | | 106,276 | |
FNMA | | | 4.50 | | | | 3-1-2048 | | | | 1,463,919 | | | | 1,617,131 | |
FNMA | | | 4.50 | | | | 4-1-2048 | | | | 2,977,409 | | | | 3,289,036 | |
FNMA | | | 4.50 | | | | 5-1-2048 | | | | 1,757,516 | | | | 1,940,400 | |
The accompanying notes are an integral part of these financial statements.
Wells Fargo Core Bond Portfolio | 25
Portfolio of investments—November 30, 2020 (unaudited)
| | | | | | | | | | | | | | | | |
| | | Interest
rate | | | Maturity
date | | | Principal | | | Value | |
| Agency Securities (continued) | |
FNMA | | | 4.50 | % | | | 6-1-2048 | | | $ | 1,905,528 | | | $ | 2,175,867 | |
FNMA | | | 4.50 | | | | 7-1-2048 | | | | 5,944,888 | | | | 6,693,755 | |
FNMA | | | 4.50 | | | | 8-1-2048 | | | | 9,884,873 | | | | 11,040,724 | |
FNMA | | | 4.50 | | | | 10-1-2048 | | | | 2,132,788 | | | | 2,361,893 | |
FNMA | | | 4.50 | | | | 10-1-2048 | | | | 8,913,751 | | | | 9,949,456 | |
FNMA | | | 4.50 | | | | 10-1-2048 | | | | 12,989,098 | | | | 14,422,729 | |
FNMA | | | 4.50 | | | | 11-1-2048 | | | | 2,683,933 | | | | 3,064,692 | |
FNMA | | | 4.50 | | | | 1-1-2049 | | | | 15,699,276 | | | | 17,535,217 | |
FNMA | | | 4.50 | | | | 2-1-2049 | | | | 8,899,247 | | | | 9,935,990 | |
FNMA | | | 4.50 | | | | 4-1-2049 | | | | 3,055,979 | | | | 3,386,714 | |
FNMA | | | 4.50 | | | | 5-1-2049 | | | | 1,401,131 | | | | 1,552,766 | |
FNMA | | | 4.50 | | | | 5-1-2049 | | | | 7,114,799 | | | | 7,744,785 | |
FNMA | | | 4.50 | | | | 6-1-2049 | | | | 6,840,452 | | | | 7,663,220 | |
FNMA | | | 4.50 | | | | 7-1-2049 | | | | 6,813,800 | | | | 7,633,383 | |
FNMA | | | 4.50 | | | | 7-1-2049 | | | | 10,965,172 | | | | 12,214,920 | |
FNMA | | | 4.50 | | | | 8-1-2049 | | | | 6,455,573 | | | | 7,232,045 | |
FNMA | | | 4.50 | | | | 2-1-2050 | | | | 2,103,116 | | | | 2,313,792 | |
FNMA | | | 4.50 | | | | 3-1-2050 | | | | 7,462,179 | | | | 8,392,041 | |
FNMA | | | 4.50 | | | | 3-1-2050 | | | | 12,936,619 | | | | 14,443,894 | |
FNMA | | | 4.50 | | | | 3-1-2050 | | | | 855,664 | | | | 942,748 | |
FNMA | | | 4.50 | | | | 4-1-2050 | | | | 2,518,007 | | | | 2,852,685 | |
FNMA | | | 4.50 | | | | 4-1-2050 | | | | 3,919,988 | | | | 4,500,523 | |
FNMA | | | 4.50 | | | | 4-1-2050 | | | | 1,923,593 | | | | 2,116,428 | |
FNMA | | | 4.50 | | | | 1-1-2059 | | | | 11,553,611 | | | | 13,270,019 | |
FNMA | | | 5.00 | | | | 7-1-2044 | | | | 420,469 | | | | 470,502 | |
FNMA | | | 5.00 | | | | 9-1-2048 | | | | 2,268,453 | | | | 2,556,434 | |
FNMA | | | 5.00 | | | | 9-1-2048 | | | | 761,580 | | | | 855,487 | |
FNMA | | | 5.00 | | | | 10-1-2048 | | | | 117,064 | | | | 133,636 | |
FNMA | | | 5.00 | | | | 12-1-2048 | | | | 5,250,760 | | | | 5,866,532 | |
FNMA | | | 5.00 | | | | 1-1-2049 | | | | 8,843,551 | | | | 9,970,886 | |
FNMA | | | 5.00 | | | | 6-1-2049 | | | | 34,888,422 | | | | 39,783,879 | |
FNMA | | | 5.00 | | | | 8-1-2049 | | | | 42,434,365 | | | | 49,068,430 | |
FNMA | | | 5.00 | | | | 8-1-2049 | | | | 22,762,620 | | | | 26,133,477 | |
FNMA | | | 5.00 | | | | 11-1-2049 | | | | 7,417,367 | | | | 8,359,012 | |
FNMA | | | 5.50 | | | | 12-1-2048 | | | | 5,393,025 | | | | 6,190,523 | |
FNMA | | | 5.50 | | | | 6-1-2049 | | | | 14,242,272 | | | | 16,643,028 | |
FNMA | | | 6.00 | | | | 4-1-2022 | | | | 1,383 | | | | 1,546 | |
FNMA | | | 6.00 | | | | 2-1-2029 | | | | 2,439 | | | | 2,737 | |
FNMA | | | 6.00 | | | | 3-1-2033 | | | | 27,610 | | | | 32,525 | |
FNMA | | | 6.00 | | | | 11-1-2033 | | | | 9,649 | | | | 11,438 | |
FNMA Series 2017-13 Class PA | | | 3.00 | | | | 8-25-2046 | | | | 4,574,674 | | | | 4,828,726 | |
FNMA Series 2017-M7 Class A2 ±± | | | 2.96 | | | | 2-25-2027 | | | | 2,040,000 | | | | 2,289,166 | |
FNMA Series 2018-14 Class KC | | | 3.00 | | | | 3-25-2048 | | | | 4,451,997 | | | | 4,795,776 | |
FNMA Series 2018-15 Class AB | | | 3.00 | | | | 3-25-2048 | | | | 1,533,255 | | | | 1,654,266 | |
FNMA Series 2018-8 Class KL | | | 2.50 | | | | 3-25-2047 | | | | 6,325,982 | | | | 6,604,326 | |
FNMA Series 414 Class A35 | | | 3.50 | | | | 10-25-2042 | | | | 10,323,934 | | | | 11,058,386 | |
GNMA %% | | | 2.00 | | | | 12-21-2050 | | | | 70,800,000 | | | | 74,058,425 | |
GNMA %% | | | 2.00 | | | | 2-20-2051 | | | | 88,900,000 | | | | 92,529,239 | |
GNMA %% | | | 2.50 | | | | 1-21-2051 | | | | 45,900,000 | | | | 48,249,125 | |
GNMA | | | 3.50 | | | | 1-20-2048 | | | | 5,042,777 | | | | 5,551,084 | |
GNMA | | | 3.50 | | | | 3-20-2049 | | | | 4,286,355 | | | | 4,529,243 | |
GNMA | | | 4.00 | | | | 6-20-2047 | | | | 45,075,053 | | | | 48,733,958 | |
GNMA | | | 4.00 | | | | 3-20-2048 | | | | 1,358,516 | | | | 1,470,310 | |
GNMA | | | 4.00 | | | | 4-20-2048 | | | | 2,412,068 | | | | 2,622,252 | |
GNMA | | | 4.00 | | | | 4-20-2048 | | | | 2,056,798 | | | | 2,263,090 | |
GNMA | | | 4.00 | | | | 4-20-2048 | | | | 1,544,479 | | | | 1,712,002 | |
The accompanying notes are an integral part of these financial statements.
26 | Wells Fargo Core Bond Portfolio
Portfolio of investments—November 30, 2020 (unaudited)
| | | | | | | | | | | | | | | | |
| | | Interest
rate | | | Maturity
date | | | Principal | | | Value | |
| Agency Securities (continued) | |
GNMA | | | 4.00 | % | | | 4-20-2048 | | | $ | 4,821,172 | | | $ | 5,181,938 | |
GNMA | | | 4.00 | | | | 5-20-2048 | | | | 13,939,628 | | | | 15,024,813 | |
GNMA | | | 4.00 | | | | 5-20-2049 | | | | 2,785,240 | | | | 3,028,524 | |
GNMA | | | 4.00 | | | | 6-20-2049 | | | | 9,380,200 | | | | 10,198,540 | |
GNMA | | | 4.00 | | | | 7-20-2049 | | | | 6,966,128 | | | | 7,573,479 | |
GNMA | | | 4.50 | | | | 8-15-2047 | | | | 1,244,283 | | | | 1,383,707 | |
GNMA %% | | | 4.50 | | | | 6-20-2048 | | | | 8,957,671 | | | | 9,676,727 | |
GNMA | | | 4.50 | | | | 2-20-2049 | | | | 8,277,391 | | | | 9,243,942 | |
GNMA | | | 4.50 | | | | 3-20-2049 | | | | 1,109,647 | | | | 1,215,949 | |
GNMA | | | 4.50 | | | | 4-20-2049 | | | | 2,059,299 | | | | 2,255,892 | |
GNMA | | | 4.50 | | | | 5-20-2049 | | | | 1,953,101 | | | | 2,141,126 | |
GNMA | | | 4.50 | | | | 5-20-2049 | | | | 2,164,682 | | | | 2,379,498 | |
GNMA | | | 4.50 | | | | 5-20-2049 | | | | 1,657,671 | | | | 1,824,032 | |
GNMA | | | 5.00 | | | | 12-20-2039 | | | | 177,781 | | | | 205,525 | |
GNMA | | | 5.00 | | | | 11-20-2045 | | | | 269,625 | | | | 300,153 | |
GNMA | | | 5.00 | | | | 3-20-2048 | | | | 13,119,324 | | | | 14,516,312 | |
GNMA | | | 5.00 | | | | 5-20-2048 | | | | 6,921,441 | | | | 7,595,613 | |
GNMA | | | 5.00 | | | | 6-20-2048 | | | | 25,470,807 | | | | 27,899,051 | |
GNMA | | | 5.00 | | | | 7-20-2048 | | | | 4,668,147 | | | | 5,119,821 | |
GNMA | | | 5.00 | | | | 8-20-2048 | | | | 7,488,073 | | | | 8,199,666 | |
GNMA | | | 5.00 | | | | 12-20-2048 | | | | 8,043,965 | | | | 8,787,625 | |
GNMA | | | 5.00 | | | | 1-20-2049 | | | | 1,594,809 | | | | 1,745,648 | |
GNMA | | | 5.00 | | | | 1-20-2049 | | | | 6,274,771 | | | | 7,189,303 | |
GNMA | | | 5.00 | | | | 2-20-2049 | | | | 1,499,467 | | | | 1,677,066 | |
GNMA | | | 5.00 | | | | 3-20-2049 | | | | 1,842,677 | | | | 2,058,658 | |
GNMA Series 2012-141 Class WA ±± | | | 4.54 | | | | 11-16-2041 | | | | 1,287,430 | | | | 1,437,292 | |
GNMA Series 2017-167 Class BQ | | | 2.50 | | | | 8-20-2044 | | | | 5,634,081 | | | | 5,843,340 | |
GNMA Series 2018-11 Class PC | | | 2.75 | | | | 12-20-2047 | | | | 9,803,895 | | | | 10,216,527 | |
GNMA Series 2019-132 Class NA | | | 3.50 | | | | 9-20-2049 | | | | 7,254,641 | | | | 7,627,697 | |
| |
Total Agency Securities (Cost $1,821,261,389) | | | | 1,870,498,311 | |
| | | | | | | | | | | | | | | | |
|
| Asset-Backed Securities: 10.01% | |
AmeriCredit Automobile Receivables Series 2020-1 Class A2 | | | 1.10 | | | | 3-20-2023 | | | | 942,746 | | | | 945,514 | |
AmeriCredit Automobile Receivables Series 2020-2 Class A2 | | | 0.60 | | | | 12-18-2023 | | | | 9,636,000 | | | | 9,652,935 | |
AmeriCredit Automobile Receivables Series 2020-3 Class A3 | | | 0.53 | | | | 6-18-2025 | | | | 5,324,000 | | | | 5,331,528 | |
Avis Budget Rental Car Funding LLC Series 2017-1A Class A 144A | | | 3.07 | | | | 9-20-2023 | | | | 1,620,000 | | | | 1,662,018 | |
Avis Budget Rental Car Funding LLC Series 2020-2A Class A 144A | | | 2.02 | | | | 2-20-2027 | | | | 9,026,000 | | | | 9,146,769 | |
Avis Budget Rental Car Funding LLC Series 2019-3A Class A1 144A | | | 2.36 | | | | 3-20-2026 | | | | 3,825,000 | | | | 3,938,889 | |
Capital One Multi-Asset Execution Trust Series 2016-A2 Class A2 (1 Month LIBOR +0.63%) ± | | | 0.77 | | | | 2-15-2024 | | | | 8,478,000 | | | | 8,496,003 | |
Capital One Multi-Asset Execution Trust Series 2016-A7 Class A7 (1 Month LIBOR +0.51%) ± | | | 0.65 | | | | 9-16-2024 | | | | 5,081,000 | | | | 5,102,646 | |
College Avenue Student Loan Trust Series 2017-A Class A1 (1 Month LIBOR +1.65%) 144A ± | | | 1.80 | | | | 11-26-2046 | | | | 2,819,783 | | | | 2,847,675 | |
College Avenue Student Loan Trust Series 2018-A Class A2 144A | | | 4.13 | | | | 12-26-2047 | | | | 2,036,406 | | | | 2,149,138 | |
College Avenue Student Loan Trust Series 2019- A Class A2 144A | | | 3.28 | | | | 12-28-2048 | | | | 3,873,941 | | | | 4,031,320 | |
Ford Credit Auto Lease Trust Series 2020-B Class A3 | | | 0.62 | | | | 8-15-2023 | | | | 11,029,000 | | | | 11,072,765 | |
Ford Credit Auto Owner Trust Series 2018-1 Class A 144A | | | 3.19 | | | | 7-15-2031 | | | | 16,494,000 | | | | 18,081,714 | |
Ford Credit Auto Owner Trust Series 2018-2 Class A 144A | | | 3.47 | | | | 1-15-2030 | | | | 6,806,000 | | | | 7,309,076 | |
Ford Credit Auto Owner Trust Series 2019-1 Class A 144A | | | 3.52 | | | | 7-15-2030 | | | | 11,868,000 | | | | 12,947,474 | |
Ford Credit Auto Owner Trust Series 2020-1 Class A 144A | | | 2.04 | | | | 8-15-2031 | | | | 13,168,000 | | | | 13,841,342 | |
Ford Credit Auto Owner Trust Series 2020-2 Class A 144A | | | 1.06 | | | | 4-15-2033 | | | | 14,632,000 | | | | 14,705,369 | |
Ford Credit Auto Owner Trust Series 2020-A Class A3 | | | 1.04 | | | | 8-15-2024 | | | | 5,068,000 | | | | 5,125,434 | |
Ford Credit Auto Owner Trust Series 2020-C Class A3 | | | 0.41 | | | | 7-15-2025 | | | | 5,229,000 | | | | 5,235,175 | |
Ford Credit Auto Owner Trust Series 2020-C Class A4 | | | 0.51 | | | | 8-15-2026 | | | | 3,750,000 | | | | 3,763,091 | |
Ford Credit Floorplan Master Owner Trust Series 2020-1 Class A1 | | | 0.70 | | | | 9-15-2025 | | | | 14,869,000 | | | | 14,940,997 | |
Ford Credit Floorplan Master Owner Trust Series 2020-2 Class A | | | 1.06 | | | | 9-15-2027 | | | | 21,118,000 | | | | 21,339,458 | |
The accompanying notes are an integral part of these financial statements.
Wells Fargo Core Bond Portfolio | 27
Portfolio of investments—November 30, 2020 (unaudited)
| | | | | | | | | | | | | | | | |
| | | Interest
rate | | | Maturity
date | | | Principal | | | Value | |
|
| Asset-Backed Securities (continued) | |
General Motors Company Series 2020-2 Class A 144A | | | 0.69 | % | | | 10-15-2025 | | | $ | 4,580,000 | | | $ | 4,584,357 | |
GM Financial Consumer Automobile Receivables Trust Series 2020-2 Class A4 | | | 1.01 | | | | 7-22-2024 | | | | 1,127,000 | | | | 1,141,722 | |
Navient Student Loan Trust Series 2016-3A Class A2 (1 Month LIBOR +0.85%) 144A ± | | | 1.00 | | | | 6-25-2065 | | | | 122,412 | | | | 122,432 | |
Navient Student Loan Trust Series 2016-AA Class A2B (1 Month LIBOR +2.15%) 144A ± | | | 2.29 | | | | 12-15-2045 | | | | 1,928,019 | | | | 1,972,072 | |
Navient Student Loan Trust Series 2018-BA Class A2A 144A | | | 3.61 | | | | 12-15-2059 | | | | 3,819,615 | | | | 3,979,716 | |
Navient Student Loan Trust Series 2018-CA Class A2 144A | | | 3.52 | | | | 6-16-2042 | | | | 1,359,221 | | | | 1,384,628 | |
Navient Student Loan Trust Series 2018-DA Class A2A 144A | | | 4.00 | | | | 12-15-2059 | | | | 9,761,040 | | | | 10,321,453 | |
Navient Student Loan Trust Series 2018-EA Class A2 144A | | | 4.00 | | | | 12-15-2059 | | | | 5,011,010 | | | | 5,192,090 | |
Navient Student Loan Trust Series 2019-A Class A2A 144A | | | 3.42 | | | | 1-15-2043 | | | | 10,118,535 | | | | 10,582,574 | |
Navient Student Loan Trust Series 2019-BA Class A2A 144A | | | 3.39 | | | | 12-15-2059 | | | | 8,228,000 | | | | 8,630,422 | |
Navient Student Loan Trust Series 2019-CA Class A2 144A | | | 3.13 | | | | 2-15-2068 | | | | 6,899,000 | | | | 7,089,817 | |
Navient Student Loan Trust Series 2019-D Class A2A 144A | | | 3.01 | | | | 12-15-2059 | | | | 10,199,000 | | | | 10,722,167 | |
Navient Student Loan Trust Series 2019-D Class A2B (1 Month LIBOR +1.05%) 144A ± | | | 1.19 | | | | 12-15-2059 | | | | 4,627,000 | | | | 4,638,689 | |
Navient Student Loan Trust Series 2019-FA Class A2 144A | | | 2.60 | | | | 8-15-2068 | | | | 11,883,000 | | | | 12,269,170 | |
Navient Student Loan Trust Series 2019-GA Class A 144A | | | 2.40 | | | | 10-15-2068 | | | | 7,971,902 | | | | 8,161,819 | |
Navient Student Loan Trust Series 2020-2A Class A1A 144A | | | 1.32 | | | | 8-26-2069 | | | | 9,985,000 | | | | 9,983,400 | |
Navient Student Loan Trust Series 2020-2A Class A1B (1 Month LIBOR +0.90%) 144A ± | | | 1.05 | | | | 8-26-2069 | | | | 5,769,000 | | | | 5,787,228 | |
Navient Student Loan Trust Series 2020-A Class A2A 144A | | | 2.46 | | | | 11-15-2068 | | | | 7,508,000 | | | | 7,819,495 | |
Navient Student Loan Trust Series 2020-A Class A2B (1 Month LIBOR +0.90%) 144A ± | | | 1.04 | | | | 11-15-2068 | | | | 4,776,000 | | | | 4,756,767 | |
Navient Student Loan Trust Series 2020-BA Class A2 144A | | | 2.12 | | | | 1-15-2069 | | | | 4,271,000 | | | | 4,382,657 | |
Navient Student Loan Trust Series 2020-DA Class A 144A | | | 1.69 | | | | 5-15-2069 | | | | 4,023,761 | | | | 4,091,676 | |
Navient Student Loan Trust Series 2020-EA Class A 144A | | | 1.69 | | | | 5-15-2069 | | | | 1,360,553 | | | | 1,380,984 | |
Navient Student Loan Trust Series 2020-FA Class A 144A | | | 1.22 | | | | 7-15-2069 | | | | 2,214,725 | | | | 2,228,086 | |
Navient Student Loan Trust Series 2020-GA Class A 144A | | | 1.17 | | | | 9-16-2069 | | | | 10,546,238 | | | | 10,604,515 | |
Navient Student Loan Trust Series 2020-HA Class A 144A | | | 1.31 | | | | 1-15-2069 | | | | 11,127,000 | | | | 11,213,279 | |
Nelnet Student Loan Trust Series 2004-4 Class A5 (3 Month LIBOR +0.16%) ± | | | 0.37 | | | | 1-25-2037 | | | | 6,222,565 | | | | 6,105,757 | |
Nelnet Student Loan Trust Series 2004-5 Class A5 (3 Month LIBOR +0.18%) ± | | | 0.39 | | | | 10-27-2036 | | | | 2,275,718 | | | | 2,237,214 | |
Nelnet Student Loan Trust Series 2005-1 Class A5 (3 Month LIBOR +0.11%) ± | | | 0.32 | | | | 10-25-2033 | | | | 18,921,938 | | | | 18,364,793 | |
Nelnet Student Loan Trust Series 2005-2 Class A5 (3 Month LIBOR +0.10%) ± | | | 0.33 | | | | 3-23-2037 | | | | 18,348,902 | | | | 17,780,552 | |
Nelnet Student Loan Trust Series 2005-3 Class A5 (3 Month LIBOR +0.12%) ± | | | 0.35 | | | | 12-24-2035 | | | | 13,937,051 | | | | 13,687,267 | |
Nelnet Student Loan Trust Series 2005-4 Class A4 (3 Month LIBOR +0.18%) ± | | | 0.41 | | | | 3-22-2032 | | | | 3,316,251 | | | | 3,127,719 | |
Santander Drive Auto Receivables Trust Series 2020-1 Class A3 | | | 2.03 | | | | 2-15-2024 | | | | 2,240,000 | | | | 2,273,610 | |
Santander Drive Auto Receivables Trust Series 2020-2 Class A2 | | | 0.62 | | | | 5-15-2023 | | | | 9,959,337 | | | | 9,969,081 | |
Santander Drive Auto Receivables Trust Series 2020-3 Class A3 | | | 0.52 | | | | 7-15-2024 | | | | 4,072,000 | | | | 4,081,127 | |
Santander Drive Auto Receivables Trust Series 2020-4 Class A3 | | | 0.48 | | | | 7-15-2024 | | | | 3,655,000 | | | | 3,657,268 | |
Santander Revolving Auto Loan Trust Series 2019-A Class A 144A | | | 2.51 | | | | 1-26-2032 | | | | 12,015,000 | | | | 12,785,052 | |
SLM Student Loan Trust Series 2003-1 Class A5C (3 Month LIBOR +0.75%) 144A ± | | | 1.00 | | | | 12-15-2032 | | | | 3,166,428 | | | | 3,006,906 | |
SLM Student Loan Trust Series 2007-2 Class A4 (3 Month LIBOR +0.06%) ± | | | 0.27 | | | | 7-25-2022 | | | | 8,947,615 | | | | 8,563,376 | |
SLM Student Loan Trust Series 2008-1 Class A4A (3 Month LIBOR +1.60%) ± | | | 1.85 | | | | 12-15-2032 | | | | 3,150,726 | | | | 3,198,545 | |
SLM Student Loan Trust Series 2010-1 Class A (1 Month LIBOR +0.40%) ± | | | 0.55 | | | | 3-25-2025 | | | | 1,486,343 | | | | 1,441,429 | |
SLM Student Loan Trust Series 2012-1 Class A3 (1 Month LIBOR +0.95%) ± | | | 1.10 | | | | 9-25-2028 | | | | 10,877,954 | | | | 10,512,112 | |
SLM Student Loan Trust Series 2012-2 Class A (1 Month LIBOR +0.70%) ± | | | 0.85 | | | | 1-25-2029 | | | | 9,480,212 | | | | 8,994,305 | |
SLM Student Loan Trust Series 2012-6 Class A3 (1 Month LIBOR +0.75%) ± | | | 0.90 | | | | 5-26-2026 | | | | 2,431,265 | | | | 2,353,870 | |
The accompanying notes are an integral part of these financial statements.
28 | Wells Fargo Core Bond Portfolio
Portfolio of investments—November 30, 2020 (unaudited)
| | | | | | | | | | | | | | | | |
| | | Interest
rate | | | Maturity
date | | | Principal | | | Value | |
|
| Asset-Backed Securities (continued) | |
SMB Private Education Loan Trust Series 2015-B Class A2A 144A | | | 2.98 | % | | | 7-15-2027 | | | $ | 307,093 | | | $ | 312,400 | |
SMB Private Education Loan Trust Series 2016-A Class A2A 144A | | | 2.70 | | | | 5-15-2031 | | | | 5,961,652 | | | | 6,109,122 | |
SMB Private Education Loan Trust Series 2016-B Class A2A 144A | | | 2.43 | | | | 2-17-2032 | | | | 2,877,364 | | | | 2,939,870 | |
SMB Private Education Loan Trust Series 2016-B Class A2B (1 Month LIBOR +1.45%) 144A ± | | | 1.59 | | | | 2-17-2032 | | | | 7,923,668 | | | | 7,983,737 | |
SMB Private Education Loan Trust Series 2016-C Class A2B (1 Month LIBOR +1.10%) 144A ± | | | 1.24 | | | | 9-15-2034 | | | | 3,094,512 | | | | 3,096,933 | |
SMB Private Education Loan Trust Series 2017-A Class A2B (1 Month LIBOR +0.90%) 144A ± | | | 1.04 | | | | 9-15-2034 | | | | 2,351,626 | | | | 2,359,835 | |
SMB Private Education Loan Trust Series 2018-C Class A2A 144A | | | 3.63 | | | | 11-15-2035 | | | | 3,552,686 | | | | 3,767,400 | |
SMB Private Education Loan Trust Series 2019-A Class A2A 144A | | | 3.44 | | | | 7-15-2036 | | | | 16,441,924 | | | | 17,338,948 | |
SMB Private Education Loan Trust Series 2020-BA Class A1A 144A | | | 1.29 | | | | 7-15-2053 | | | | 11,157,108 | | | | 11,187,374 | |
SMB Private Education Loan Trust Series 2020-PTA Class A2A 144A | | | 1.60 | | | | 9-15-2054 | | | | 10,058,000 | | | | 10,132,124 | |
SMB Private Education Loan Trust Series 2020-PTB Class A2A 144A | | | 1.60 | | | | 9-15-2054 | | | | 26,019,000 | | | | 26,148,939 | |
SoFi Professional Loan Program LLC Series 2016-A Class A2 144A | | | 2.76 | | | | 12-26-2036 | | | | 1,487,851 | | | | 1,509,190 | |
SoFi Professional Loan Program LLC Series 2016-D Class A1 (1 Month LIBOR +0.95%) 144A ± | | | 1.10 | | | | 1-25-2039 | | | | 252,814 | | | | 254,022 | |
SoFi Professional Loan Program LLC Series 2016-E Class A1 (1 Month LIBOR +0.85%) 144A ± | | | 1.00 | | | | 7-25-2039 | | | | 439,278 | | | | 438,580 | |
SoFi Professional Loan Program LLC Series 2017-A Class A1 (1 Month LIBOR +0.70%) 144A ± | | | 0.85 | | | | 3-26-2040 | | | | 557,599 | | | | 557,591 | |
SoFi Professional Loan Program LLC Series 2017-D Class A2 144A | | | 2.65 | | | | 9-25-2040 | | | | 385,216 | | | | 396,351 | |
SoFi Professional Loan Program LLC Series 2017-E Class A1 (1 Month LIBOR +0.50%) 144A ± | | | 0.65 | | | | 11-26-2040 | | | | 320,023 | | | | 319,684 | |
SoFi Professional Loan Program LLC Series 2017-E Class A2B 144A | | | 2.72 | | | | 11-26-2040 | | | | 1,933,755 | | | | 1,964,326 | |
SoFi Professional Loan Program LLC Series 2018-A Class A2B 144A | | | 2.95 | | | | 2-25-2042 | | | | 2,831,812 | | | | 2,896,276 | |
SoFi Professional Loan Program LLC Series 2018-B Class A2FX 144A | | | 3.34 | | | | 8-25-2047 | | | | 6,401,679 | | | | 6,583,752 | |
SoFi Professional Loan Program LLC Series 2020-A Class A2 144A | | | 2.54 | | | | 5-15-2046 | | | | 10,245,000 | | | | 10,580,760 | |
SoFi Professional Loan Program LLC Series 2020-C Class AFX 144A | | | 1.95 | | | | 2-15-2046 | | | | 4,729,990 | | | | 4,827,869 | |
Triton Container Finance LLC Series 2020-1A Class A 144A | | | 2.11 | | | | 9-20-2045 | | | | 4,637,357 | | | | 4,657,502 | |
Verizon Owner Trust Series 2019-C Class A1A | | | 1.94 | | | | 4-22-2024 | | | | 3,017,000 | | | | 3,083,771 | |
Verizon Owner Trust Series 2020-A Class A1A | | | 1.85 | | | | 7-22-2024 | | | | 9,683,000 | | | | 9,920,254 | |
Verizon Owner Trust Series 2020-C Class A | | | 0.41 | | | | 4-21-2025 | | | | 4,323,000 | | | | 4,325,869 | |
| |
Total Asset-Backed Securities (Cost $601,163,929) | | | | 610,540,007 | |
| | | | | | | | | | | | | | | | |
|
Corporate Bonds and Notes: 25.92% | |
|
Communication Services: 2.82% | |
|
| Diversified Telecommunication Services: 1.82% | |
AT&T Incorporated | | | 1.65 | | | | 2-1-2028 | | | | 2,982,000 | | | | 3,023,902 | |
AT&T Incorporated | | | 2.25 | | | | 2-1-2032 | | | | 3,962,000 | | | | 4,008,833 | |
AT&T Incorporated | | | 2.30 | | | | 6-1-2027 | | | | 5,989,000 | | | | 6,347,364 | |
AT&T Incorporated | | | 2.75 | | | | 6-1-2031 | | | | 5,989,000 | | | | 6,362,198 | |
AT&T Incorporated | | | 3.00 | | | | 6-30-2022 | | | | 4,597,000 | | | | 4,768,084 | |
AT&T Incorporated | | | 3.10 | | | | 2-1-2043 | | | | 966,000 | | | | 987,959 | |
AT&T Incorporated | | | 3.30 | | | | 2-1-2052 | | | | 3,673,000 | | | | 3,649,859 | |
AT&T Incorporated | | | 3.50 | | | | 6-1-2041 | | | | 1,995,000 | | | | 2,148,492 | |
AT&T Incorporated 144A | | | 3.50 | | | | 9-15-2053 | | | | 3,462,000 | | | | 3,545,569 | |
AT&T Incorporated 144A | | | 3.55 | | | | 9-15-2055 | | | | 2,907,000 | | | | 2,975,111 | |
AT&T Incorporated 144A | | | 3.65 | | | | 9-15-2059 | | | | 2,712,000 | | | | 2,763,055 | |
AT&T Incorporated | | | 3.85 | | | | 6-1-2060 | | | | 1,995,000 | | | | 2,109,424 | |
AT&T Incorporated | | | 4.50 | | | | 3-9-2048 | | | | 3,045,000 | | | | 3,710,806 | |
T-Mobile USA Incorporated 144A | | | 1.50 | | | | 2-15-2026 | | | | 4,971,000 | | | | 5,045,118 | |
T-Mobile USA Incorporated 144A | | | 2.05 | | | | 2-15-2028 | | | | 10,104,000 | | | | 10,395,702 | |
T-Mobile USA Incorporated 144A | | | 3.00 | | | | 2-15-2041 | | | | 890,000 | | | | 915,863 | |
The accompanying notes are an integral part of these financial statements.
Wells Fargo Core Bond Portfolio | 29
Portfolio of investments—November 30, 2020 (unaudited)
| | | | | | | | | | | | | | | | |
| | | Interest
rate | | | Maturity
date | | | Principal | | | Value | |
|
| Diversified Telecommunication Services (continued) | |
T-Mobile USA Incorporated 144A | | | 3.50 | % | | | 4-15-2025 | | | $ | 2,831,000 | | | $ | 3,130,746 | |
T-Mobile USA Incorporated 144A | | | 3.75 | | | | 4-15-2027 | | | | 6,159,000 | | | | 6,972,604 | |
Verizon Communications Incorporated | | | 1.75 | | | | 1-20-2031 | | | | 7,008,000 | | | | 7,045,932 | |
Verizon Communications Incorporated | | | 2.65 | | | | 11-20-2040 | | | | 7,809,000 | | | | 8,030,038 | |
Verizon Communications Incorporated | | | 3.00 | | | | 3-22-2027 | | | | 1,874,000 | | | | 2,080,919 | |
Verizon Communications Incorporated | | | 3.00 | | | | 11-20-2060 | | | | 3,794,000 | | | | 4,010,150 | |
Verizon Communications Incorporated | | | 3.50 | | | | 11-1-2024 | | | | 4,354,000 | | | | 4,805,902 | |
Verizon Communications Incorporated | | | 4.02 | | | | 12-3-2029 | | | | 2,246,000 | | | | 2,671,204 | |
Verizon Communications Incorporated | | | 4.27 | | | | 1-15-2036 | | | | 817,000 | | | | 1,023,837 | |
Verizon Communications Incorporated | | | 4.40 | | | | 11-1-2034 | | | | 3,909,000 | | | | 4,936,258 | |
Verizon Communications Incorporated | | | 4.52 | | | | 9-15-2048 | | | | 2,431,000 | | | | 3,229,822 | |
| | | | |
| | | | | | | | | | | | | | | 110,694,751 | |
| | | | | | | | | | | | | | | | |
|
| Entertainment: 0.16% | |
Activision Blizzard Incorporated | | | 2.50 | | | | 9-15-2050 | | | | 3,277,000 | | | | 3,164,863 | |
The Walt Disney Company | | | 3.50 | | | | 5-13-2040 | | | | 2,277,000 | | | | 2,662,618 | |
The Walt Disney Company | | | 3.60 | | | | 1-13-2051 | | | | 2,044,000 | | | | 2,419,622 | |
The Walt Disney Company | | | 3.80 | | | | 5-13-2060 | | | | 1,420,000 | | | | 1,757,038 | |
| | | | |
| | | | | | | | | | | | | | | 10,004,141 | |
| | | | | | | | | | | | | | | | |
|
| Media: 0.84% | |
Charter Communications Operating LLC | | | 4.46 | | | | 7-23-2022 | | | | 1,779,000 | | | | 1,880,332 | |
Charter Communications Operating LLC | | | 4.80 | | | | 3-1-2050 | | | | 3,622,000 | | | | 4,341,264 | |
Comcast Corporation | | | 1.50 | | | | 2-15-2031 | | | | 3,530,000 | | | | 3,509,902 | |
Comcast Corporation | | | 1.95 | | | | 1-15-2031 | | | | 2,665,000 | | | | 2,748,971 | |
Comcast Corporation | | | 2.45 | | | | 8-15-2052 | | | | 4,509,000 | | | | 4,427,834 | |
Comcast Corporation | | | 2.80 | | | | 1-15-2051 | | | | 1,178,000 | | | | 1,235,697 | |
Comcast Corporation | | | 3.10 | | | | 4-1-2025 | | | | 1,860,000 | | | | 2,045,443 | |
Comcast Corporation | | | 3.75 | | | | 4-1-2040 | | | | 4,551,000 | | | | 5,522,204 | |
Comcast Corporation | | | 3.95 | | | | 10-15-2025 | | | | 1,314,000 | | | | 1,506,275 | |
Comcast Corporation | | | 4.15 | | | | 10-15-2028 | | | | 2,262,000 | | | | 2,721,917 | |
Comcast Corporation | | | 4.60 | | | | 10-15-2038 | | | | 4,569,000 | | | | 6,038,760 | |
Time Warner Cable Incorporated | | | 6.55 | | | | 5-1-2037 | | | | 1,283,000 | | | | 1,768,535 | |
ViacomCBS Incorporated | | | 4.20 | | | | 5-19-2032 | | | | 5,872,000 | | | | 6,947,430 | |
ViacomCBS Incorporated | | | 4.38 | | | | 3-15-2043 | | | | 554,000 | | | | 643,180 | |
ViacomCBS Incorporated | | | 4.60 | | | | 1-15-2045 | | | | 358,000 | | | | 420,539 | |
ViacomCBS Incorporated | | | 4.75 | | | | 5-15-2025 | | | | 3,091,000 | | | | 3,580,465 | |
ViacomCBS Incorporated | | | 4.95 | | | | 5-19-2050 | | | | 67,000 | | | | 85,435 | |
ViacomCBS Incorporated | | | 5.85 | | | | 9-1-2043 | | | | 1,305,000 | | | | 1,794,826 | |
| | | | |
| | | | | | | | | | | | | | | 51,219,009 | |
| | | | | | | | | | | | | | | | |
|
Consumer Discretionary: 1.77% | |
|
| Auto Components: 0.07% | |
BorgWarner Incorporated « | | | 2.65 | | | | 7-1-2027 | | | | 4,142,000 | | | | 4,426,987 | |
| | | | | | | | | | | | | | | | |
|
| Beverages: 0.07% | |
Anheuser-Busch InBev Company | | | 4.38 | | | | 4-15-2038 | | | | 3,667,000 | | | | 4,531,149 | |
| | | | | | | | | | | | | | | | |
|
| Diversified Consumer Services: 0.12% | |
Stanford University | | | 1.29 | | | | 6-1-2027 | | | | 782,000 | | | | 800,813 | |
Yale University | | | 0.87 | | | | 4-15-2025 | | | | 3,329,000 | | | | 3,378,233 | |
Yale University | | | 1.48 | | | | 4-15-2030 | | | | 2,852,000 | | | | 2,897,921 | |
| | | | |
| | | | | | | | | | | | | | | 7,076,967 | |
| | | | | | | | | | | | | | | | |
The accompanying notes are an integral part of these financial statements.
30 | Wells Fargo Core Bond Portfolio
Portfolio of investments—November 30, 2020 (unaudited)
| | | | | | | | | | | | | | | | |
| | | Interest
rate | | | Maturity
date | | | Principal | | | Value | |
| Hotels, Restaurants & Leisure: 0.37% | |
GLP Capital LP | | | 4.00 | % | | | 1-15-2030 | | | $ | 1,546,000 | | | $ | 1,657,467 | |
GLP Capital LP | | | 5.30 | | | | 1-15-2029 | | | | 1,887,000 | | | | 2,166,276 | |
Marriott International Incorporated | | | 4.63 | | | | 6-15-2030 | | | | 736,000 | | | | 849,790 | |
Marriott International Incorporated | | | 5.75 | | | | 5-1-2025 | | | | 3,451,000 | | | | 4,000,386 | |
McDonald’s Corporation | | | 1.45 | | | | 9-1-2025 | | | | 1,447,000 | | | | 1,498,629 | |
McDonald’s Corporation | | | 2.13 | | | | 3-1-2030 | | | | 543,000 | | | | 570,881 | |
McDonald’s Corporation | | | 3.70 | | | | 1-30-2026 | | | | 2,852,000 | | | | 3,239,145 | |
Starbucks Corporation | | | 1.30 | | | | 5-7-2022 | | | | 2,372,000 | | | | 2,402,685 | |
Starbucks Corporation | | | 3.35 | | | | 3-12-2050 | | | | 1,901,000 | | | | 2,102,814 | |
Starbucks Corporation | | | 3.50 | | | | 11-15-2050 | | | | 3,371,000 | | | | 3,861,014 | |
| | | | |
| | | | | | | | | | | | | | | 22,349,087 | |
| | | | | | | | | | | | | | | | |
|
| Internet & Direct Marketing Retail: 0.07% | |
Amazon.com Incorporated | | | 2.50 | | | | 6-3-2050 | | | | 2,183,000 | | | | 2,303,622 | |
Amazon.com Incorporated | | | 2.70 | | | | 6-3-2060 | | | | 1,985,000 | | | | 2,159,991 | |
| | | | |
| | | | | | | | | | | | | | | 4,463,613 | |
| | | | | | | | | | | | | | | | |
|
| Specialty Retail: 0.75% | |
Advance Auto Parts Company | | | 1.75 | | | | 10-1-2027 | | | | 3,881,000 | | | | 3,914,589 | |
Advance Auto Parts Company | | | 3.90 | | | | 4-15-2030 | | | | 7,970,000 | | | | 9,152,737 | |
Home Depot Incorporated | | | 2.70 | | | | 4-15-2030 | | | | 2,318,000 | | | | 2,569,554 | |
Home Depot Incorporated | | | 2.95 | | | | 6-15-2029 | | | | 1,082,000 | | | | 1,224,408 | |
Home Depot Incorporated | | | 3.13 | | | | 12-15-2049 | | | | 5,301,000 | | | | 6,102,364 | |
Home Depot Incorporated | | | 3.30 | | | | 4-15-2040 | | | | 793,000 | | | | 937,485 | |
Home Depot Incorporated | | | 3.35 | | | | 4-15-2050 | | | | 3,821,000 | | | | 4,542,128 | |
Lowe’s Companies Incorporated | | | 1.70 | | | | 10-15-2030 | | | | 5,017,000 | | | | 5,037,916 | |
Lowe’s Companies Incorporated | | | 3.00 | | | | 10-15-2050 | | | | 1,178,000 | | | | 1,265,216 | |
Lowe’s Companies Incorporated | | | 4.00 | | | | 4-15-2025 | | | | 2,022,000 | | | | 2,294,303 | |
O’Reilly Automotive Incorporated | | | 1.75 | | | | 3-15-2031 | | | | 6,046,000 | | | | 6,012,512 | |
O’Reilly Automotive Incorporated | | | 4.20 | | | | 4-1-2030 | | | | 1,938,000 | | | | 2,325,130 | |
| | | | |
| | | | | | | | | | | | | | | 45,378,342 | |
| | | | | | | | | | | | | | | | |
|
| Textiles, Apparel & Luxury Goods: 0.32% | |
Nike Incorporated | | | 2.40 | | | | 3-27-2025 | | | | 2,754,000 | | | | 2,959,046 | |
Nike Incorporated | | | 2.75 | | | | 3-27-2027 | | | | 1,838,000 | | | | 2,039,522 | |
Nike Incorporated | | | 2.85 | | | | 3-27-2030 | | | | 1,810,000 | | | | 2,049,320 | |
Nike Incorporated | | | 3.38 | | | | 3-27-2050 | | | | 2,246,000 | | | | 2,710,210 | |
Ralph Lauren Corporation | | | 1.70 | | | | 6-15-2022 | | | | 3,235,000 | | | | 3,300,040 | |
Ralph Lauren Corporation | | | 2.95 | | | | 6-15-2030 | | | | 6,269,000 | | | | 6,643,340 | |
| | | | |
| | | | | | | | | | | | | | | 19,701,478 | |
| | | | | | | | | | | | | | | | |
|
Consumer Staples: 1.16% | |
|
| Beverages: 0.42% | |
Anheuser-Busch InBev Company | | | 4.90 | | | | 2-1-2046 | | | | 556,000 | | | | 725,102 | |
Anheuser-Busch InBev Worldwide Incorporated | | | 3.75 | | | | 7-15-2042 | | | | 766,000 | | | | 875,729 | |
Anheuser-Busch InBev Worldwide Incorporated | | | 4.15 | | | | 1-23-2025 | | | | 3,927,000 | | | | 4,460,162 | |
Anheuser-Busch InBev Worldwide Incorporated | | | 4.60 | | | | 4-15-2048 | | | | 3,837,000 | | | | 4,886,230 | |
Anheuser-Busch InBev Worldwide Incorporated | | | 4.70 | | | | 2-1-2036 | | | | 5,301,000 | | | | 6,771,787 | |
Constellation Brands Incorporated | | | 3.20 | | | | 2-15-2023 | | | | 931,000 | | | | 983,845 | |
Constellation Brands Incorporated | | | 3.70 | | | | 12-6-2026 | | | | 578,000 | | | | 662,941 | |
Constellation Brands Incorporated | | | 4.40 | | | | 11-15-2025 | | | | 280,000 | | | | 325,544 | |
Keurig Dr Pepper Incorporated | | | 3.43 | | | | 6-15-2027 | | | | 2,841,000 | | | | 3,236,097 | |
Keurig Dr Pepper Incorporated | | | 3.80 | | | | 5-1-2050 | | | | 1,945,000 | | | | 2,341,599 | |
| | | | |
| | | | | | | | | | | | | | | 25,269,036 | |
| | | | | | | | | | | | | | | | |
The accompanying notes are an integral part of these financial statements.
Wells Fargo Core Bond Portfolio | 31
Portfolio of investments—November 30, 2020 (unaudited)
| | | | | | | | | | | | | | | | |
| | | Interest
rate | | | Maturity
date | | | Principal | | | Value | |
| Food & Staples Retailing: 0.27% | |
Costco Wholesale Corporation | | | 1.60 | % | | | 4-20-2030 | | | $ | 11,250,000 | | | $ | 11,543,475 | |
Costco Wholesale Corporation | | | 1.75 | | | | 4-20-2032 | | | | 1,287,000 | | | | 1,333,469 | |
Sysco Corporation | | | 6.60 | | | | 4-1-2050 | | | | 1,004,000 | | | | 1,556,939 | |
Walmart Incorporated | | | 3.05 | | | | 7-8-2026 | | | | 1,752,000 | | | | 1,968,566 | |
Walmart Incorporated | | | 4.05 | | | | 6-29-2048 | | | | 43,000 | | | | 59,167 | |
| | | | |
| | | | | | | | | | | | | | | 16,461,616 | |
| | | | | | | | | | | | | | | | |
|
| Food Products: 0.10% | |
General Mills Incorporated | | | 2.88 | | | | 4-15-2030 | | | | 1,341,000 | | | | 1,490,953 | |
Mars Incorporated 144A | | | 1.63 | | | | 7-16-2032 | | | | 4,814,000 | | | | 4,786,758 | |
| | | | |
| | | | | | | | | | | | | | | 6,277,711 | |
| | | | | | | | | | | | | | | | |
|
| Tobacco: 0.37% | |
Altria Group Incorporated | | | 2.35 | | | | 5-6-2025 | | | | 830,000 | | | | 879,602 | |
Altria Group Incorporated | | | 3.88 | | | | 9-16-2046 | | | | 1,631,000 | | | | 1,755,575 | |
Altria Group Incorporated | | | 4.45 | | | | 5-6-2050 | | | | 1,690,000 | | | | 1,987,909 | |
BAT Capital Corporation | | | 2.26 | | | | 3-25-2028 | | | | 212,000 | | | | 218,600 | |
BAT Capital Corporation | | | 2.73 | | | | 3-25-2031 | | | | 7,288,000 | | | | 7,493,228 | |
BAT Capital Corporation | | | 3.56 | | | | 8-15-2027 | | | | 3,725,000 | | | | 4,138,812 | |
BAT Capital Corporation | | | 4.70 | | | | 4-2-2027 | | | | 3,989,000 | | | | 4,669,653 | |
BAT Capital Corporation | | | 4.91 | | | | 4-2-2030 | | | | 1,021,000 | | | | 1,226,907 | |
| | | | |
| | | | | | | | | | | | | | | 22,370,286 | |
| | | | | | | | | | | | | | | | |
|
Energy: 1.50% | |
|
| Oil, Gas & Consumable Fuels: 1.50% | |
BP Capital Markets America Incorporated | | | 1.75 | | | | 8-10-2030 | | | | 3,805,000 | | | | 3,829,874 | |
BP Capital Markets America Incorporated | | | 2.77 | | | | 11-10-2050 | | | | 4,568,000 | | | | 4,523,602 | |
BP Capital Markets America Incorporated | | | 3.19 | | | | 4-6-2025 | | | | 4,637,000 | | | | 5,090,516 | |
BP Capital Markets America Incorporated | | | 3.54 | | | | 4-6-2027 | | | | 4,672,000 | | | | 5,244,766 | |
Concho Resources Incorporated | | | 2.40 | | | | 2-15-2031 | | | | 2,380,000 | | | | 2,485,058 | |
Devon Energy Corporation | | | 5.00 | | | | 6-15-2045 | | | | 1,011,000 | | | | 1,135,158 | |
Devon Energy Corporation | | | 5.60 | | | | 7-15-2041 | | | | 1,506,000 | | | | 1,762,309 | |
Diamondback Energy Incorporated | | | 3.25 | | | | 12-1-2026 | | | | 3,688,000 | | | | 3,903,021 | |
Diamondback Energy Incorporated | | | 3.50 | | | | 12-1-2029 | | | | 2,422,000 | | | | 2,537,319 | |
Energy Transfer Operating Partners LP | | | 2.90 | | | | 5-15-2025 | | | | 1,827,000 | | | | 1,895,529 | |
Energy Transfer Operating Partners LP | | | 3.60 | | | | 2-1-2023 | | | | 475,000 | | | | 493,312 | |
Energy Transfer Operating Partners LP | | | 4.05 | | | | 3-15-2025 | | | | 6,724,000 | | | | 7,230,232 | |
Energy Transfer Operating Partners LP | | | 4.20 | | | | 4-15-2027 | | | | 1,421,000 | | | | 1,539,568 | |
Energy Transfer Operating Partners LP | | | 4.25 | | | | 3-15-2023 | | | | 2,722,000 | | | | 2,864,945 | |
Energy Transfer Operating Partners LP | | | 4.50 | | | | 4-15-2024 | | | | 605,000 | | | | 652,099 | |
Energy Transfer Operating Partners LP | | �� | 4.75 | | | | 1-15-2026 | | | | 1,323,000 | | | | 1,468,321 | |
Energy Transfer Operating Partners LP | | | 5.50 | | | | 6-1-2027 | | | | 983,000 | | | | 1,129,772 | |
Energy Transfer Operating Partners LP | | | 6.05 | | | | 6-1-2041 | | | | 890,000 | | | | 990,727 | |
Enterprise Products Operating LLC | | | 2.80 | | | | 1-31-2030 | | | | 4,000 | | | | 4,331 | |
Enterprise Products Operating LLC | | | 3.70 | | | | 1-31-2051 | | | | 1,743,000 | | | | 1,891,143 | |
Enterprise Products Operating LLC | | | 3.95 | | | | 1-31-2060 | | | | 1,927,000 | | | | 2,085,301 | |
Gray Oak Pipeline LLC 144A | | | 2.60 | | | | 10-15-2025 | | | | 1,998,000 | | | | 2,028,408 | |
HollyFrontier Corporation | | | 2.63 | | | | 10-1-2023 | | | | 2,018,000 | | | | 2,035,514 | |
Marathon Oil Corporation | | | 5.20 | | | | 6-1-2045 | | | | 975,000 | | | | 1,070,685 | |
Marathon Oil Corporation | | | 6.80 | | | | 3-15-2032 | | | | 702,000 | | | | 831,049 | |
Marathon Petroleum Corporation | | | 4.40 | | | | 7-15-2027 | | | | 3,661,000 | | | | 3,993,716 | |
MPLX LP | | | 1.75 | | | | 3-1-2026 | | | | 2,976,000 | | | | 3,015,385 | |
MPLX LP | | | 2.65 | | | | 8-15-2030 | | | | 3,996,000 | | | | 4,043,143 | |
Pioneer Natural Resource | | | 1.90 | | | | 8-15-2030 | | | | 4,987,000 | | | | 4,901,147 | |
The accompanying notes are an integral part of these financial statements.
32 | Wells Fargo Core Bond Portfolio
Portfolio of investments—November 30, 2020 (unaudited)
| | | | | | | | | | | | | | | | |
| | | Interest
rate | | | Maturity
date | | | Principal | | | Value | |
|
| Oil, Gas & Consumable Fuels (continued) | |
Plains All American Pipeline LP | | | 3.55 | % | | | 12-15-2029 | | | $ | 4,179,000 | | | $ | 4,283,517 | |
Plains All American Pipeline LP | | | 4.90 | | | | 2-15-2045 | | | | 825,000 | | | | 830,504 | |
Regency Energy Partners LP | | | 4.50 | | | | 11-1-2023 | | | | 918,000 | | | | 989,735 | |
Sunoco Logistics Partner LP | | | 3.45 | | | | 1-15-2023 | | | | 464,000 | | | | 481,738 | |
Sunoco Logistics Partner LP | | | 4.25 | | | | 4-1-2024 | | | | 1,222,000 | | | | 1,308,975 | |
Transcontinental Gas Pipe Line Company LLC 144A | | | 3.25 | | | | 5-15-2030 | | | | 1,973,000 | | | | 2,171,052 | |
Transcontinental Gas Pipe Line Company LLC 144A | | | 3.95 | | | | 5-15-2050 | | | | 3,159,000 | | | | 3,491,336 | |
Valero Energy Corporation | | | 1.20 | | | | 3-15-2024 | | | | 1,905,000 | | | | 1,904,644 | |
Williams Companies Incorporated | | | 3.90 | | | | 1-15-2025 | | | | 1,321,000 | | | | 1,457,988 | |
| | | | |
| | | | | | | | | | | | | | | 91,595,439 | |
| | | | | | | | | | | | | | | | |
|
Financials: 7.10% | |
|
| Banks: 2.95% | |
Bank of America Corporation (U.S. SOFR +0.74%) ± | | | 0.81 | | | | 10-24-2024 | | | | 9,982,000 | | | | 10,020,960 | |
Bank of America Corporation (U.S. SOFR +0.91%) ± | | | 0.98 | | | | 9-25-2025 | | | | 8,409,000 | | | | 8,456,816 | |
Bank of America Corporation (U.S. SOFR +1.01%) ± | | | 1.20 | | | | 10-24-2026 | | | | 9,608,000 | | | | 9,670,259 | |
Bank of America Corporation (U.S. SOFR +1.15%) ± | | | 1.32 | | | | 6-19-2026 | | | | 8,418,000 | | | | 8,518,161 | |
Bank of America Corporation (U.S. SOFR +1.53%) ± | | | 1.90 | | | | 7-23-2031 | | | | 7,619,000 | | | | 7,648,058 | |
Bank of America Corporation (U.S. SOFR +1.37%) ± | | | 1.92 | | | | 10-24-2031 | | | | 3,117,000 | | | | 3,141,907 | |
Bank of America Corporation (3 Month LIBOR +0.64%) ± | | | 2.02 | | | | 2-13-2026 | | | | 970,000 | | | | 1,012,034 | |
Bank of America Corporation (3 Month LIBOR +0.87%) ± | | | 2.46 | | | | 10-22-2025 | | | | 5,159,000 | | | | 5,475,241 | |
Bank of America Corporation (3 Month LIBOR +0.99%) ± | | | 2.50 | | | | 2-13-2031 | | | | 5,241,000 | | | | 5,542,146 | |
Bank of America Corporation (U.S. SOFR +2.15%) ± | | | 2.59 | | | | 4-29-2031 | | | | 5,099,000 | | | | 5,429,978 | |
Bank of America Corporation (3 Month LIBOR +0.79%) ± | | | 3.00 | | | | 12-20-2023 | | | | 9,893,000 | | | | 10,393,015 | |
Bank of America Corporation (3 Month LIBOR +1.09%) ± | | | 3.09 | | | | 10-1-2025 | | | | 7,075,000 | | | | 7,649,008 | |
Bank of America Corporation (3 Month LIBOR +1.04%) ± | | | 3.42 | | | | 12-20-2028 | | | | 12,745,000 | | | | 14,341,583 | |
Bank of America Corporation | | | 3.50 | | | | 4-19-2026 | | | | 1,671,000 | | | | 1,895,004 | |
Bank of America Corporation | | | 4.13 | | | | 1-22-2024 | | | | 638,000 | | | | 705,938 | |
Bank of America Corporation | | | 4.18 | | | | 11-25-2027 | | | | 5,279,000 | | | | 6,091,578 | |
Citigroup Incorporated (U.S. SOFR +0.69%) ± | | | 0.78 | | | | 10-30-2024 | | | | 6,412,000 | | | | 6,429,400 | |
Citigroup Incorporated | | | 3.20 | | | | 10-21-2026 | | | | 9,784,000 | | | | 10,853,938 | |
Deutsche Bank (U.S. SOFR +1.87%) ± | | | 2.13 | | | | 11-24-2026 | | | | 5,752,000 | | | | 5,821,597 | |
Deutsche Bank (U.S. SOFR +2.16%) ± | | | 2.22 | | | | 9-18-2024 | | | | 3,965,000 | | | | 4,045,813 | |
JPMorgan Chase & Company (U.S. SOFR +0.80%) ± | | | 1.05 | | | | 11-19-2026 | | | | 11,403,000 | | | | 11,463,323 | |
JPMorgan Chase & Company (U.S. SOFR +1.11%) ± | | | 1.76 | | | | 11-19-2031 | | | | 5,700,000 | | | | 5,714,126 | |
JPMorgan Chase & Company (U.S. SOFR +1.89%) ± | | | 2.18 | | | | 6-1-2028 | | | | 5,715,000 | | | | 5,994,316 | |
JPMorgan Chase & Company (U.S. SOFR +2.52%) ± | | | 2.96 | | | | 5-13-2031 | | | | 5,329,000 | | | | 5,797,676 | |
Santander Holdings USA Incorporated | | | 3.24 | | | | 10-5-2026 | | | | 4,276,000 | | | | 4,632,009 | |
Santander Holdings USA Incorporated | | | 3.40 | | | | 1-18-2023 | | | | 1,369,000 | | | | 1,438,806 | |
Santander Holdings USA Incorporated | | | 3.45 | | | | 6-2-2025 | | | | 8,011,000 | | | | 8,674,407 | |
Santander Holdings USA Incorporated | | | 4.40 | | | | 7-13-2027 | | | | 2,155,000 | | | | 2,442,027 | |
Santander Holdings USA Incorporated | | | 4.50 | | | | 7-17-2025 | | | | 429,000 | | | | 481,541 | |
| | | | |
| | | | | | | | | | | | | | | 179,780,665 | |
| | | | | | | | | | | | | | | | |
|
| Capital Markets: 1.88% | |
Affiliated Managers Group Incorporated | | | 3.30 | | | | 6-15-2030 | | | | 5,956,000 | | | | 6,483,070 | |
Ares Capital Corporation | | | 3.88 | | | | 1-15-2026 | | | | 3,487,000 | | | | 3,663,640 | |
Franklin Resources Incorporated | | | 1.60 | | | | 10-30-2030 | | | | 4,518,000 | | | | 4,458,489 | |
Goldman Sachs Group Incorporated (U.S. SOFR +0.54%) ± | | | 0.63 | | | | 11-17-2023 | | | | 15,498,000 | | | | 15,539,042 | |
Goldman Sachs Group Incorporated | | | 3.50 | | | | 4-1-2025 | | | | 7,270,000 | | | | 8,054,078 | |
Goldman Sachs Group Incorporated | | | 3.50 | | | | 11-16-2026 | | | | 2,690,000 | | | | 3,008,299 | |
Goldman Sachs Group Incorporated | | | 6.75 | | | | 10-1-2037 | | | | 3,168,000 | | | | 4,848,349 | |
Golub Capital LLC | | | 3.38 | | | | 4-15-2024 | | | | 9,617,000 | | | | 9,679,657 | |
The accompanying notes are an integral part of these financial statements.
Wells Fargo Core Bond Portfolio | 33
Portfolio of investments—November 30, 2020 (unaudited)
| | | | | | | | | | | | | | | | |
| | | Interest
rate | | | Maturity
date | | | Principal | | | Value | |
|
| Capital Markets (continued) | |
IntercontinentalExchange Incorporated | | | 1.85 | % | | | 9-15-2032 | | | $ | 3,991,000 | | | $ | 4,034,442 | |
IntercontinentalExchange Incorporated | | | 2.65 | | | | 9-15-2040 | | | | 1,398,000 | | | | 1,449,669 | |
Morgan Stanley (U.S. SOFR +0.47%) ± | | | 0.56 | | | | 11-10-2023 | | | | 6,669,000 | | | | 6,673,624 | |
Morgan Stanley (U.S. SOFR +0.75%) ± | | | 0.86 | | | | 10-21-2025 | | | | 6,719,000 | | | | 6,760,990 | |
Morgan Stanley (U.S. SOFR +1.03%) ± | | | 1.79 | | | | 2-13-2032 | | | | 11,433,000 | | | | 11,511,399 | |
Morgan Stanley (U.S. SOFR +1.99%) ± | | | 2.19 | | | | 4-28-2026 | | | | 951,000 | | | | 1,003,029 | |
Morgan Stanley (U.S. SOFR +3.12%) ± | | | 3.62 | | | | 4-1-2031 | | | | 703,000 | | | | 817,828 | |
Morgan Stanley | | | 3.63 | | | | 1-20-2027 | | | | 5,035,000 | | | | 5,753,572 | |
Morgan Stanley | | | 4.00 | | | | 7-23-2025 | | | | 6,646,000 | | | | 7,607,525 | |
PPL Capital Funding Incorporated | | | 3.10 | | | | 5-15-2026 | | | | 4,538,000 | | | | 5,042,195 | |
PPL Capital Funding Incorporated | | | 3.40 | | | | 6-1-2023 | | | | 550,000 | | | | 585,360 | |
PPL Capital Funding Incorporated | | | 4.13 | | | | 4-15-2030 | | | | 4,852,000 | | | | 5,753,833 | |
PPL Capital Funding Incorporated | | | 5.00 | | | | 3-15-2044 | | | | 1,522,000 | | | | 1,985,636 | |
| | | | |
| | | | | | | | | | | | | | | 114,713,726 | |
| | | | | | | | | | | | | | | | |
|
| Consumer Finance: 1.62% | |
Ally Financial Incorporated | | | 1.45 | | | | 10-2-2023 | | | | 7,741,000 | | | | 7,890,590 | |
Ally Financial Incorporated | | | 5.13 | | | | 9-30-2024 | | | | 6,159,000 | | | | 7,063,685 | |
Ally Financial Incorporated | | | 5.75 | | | | 11-20-2025 | | | | 6,708,000 | | | | 7,833,404 | |
Aviation Capital Group LLC 144A | | | 5.50 | | | | 12-15-2024 | | | | 4,962,000 | | | | 5,312,066 | |
Bunge Limited Finance Corporation | | | 1.63 | | | | 8-17-2025 | | | | 4,949,000 | | | | 5,051,359 | |
Bunge Limited Finance Corporation | | | 3.25 | | | | 8-15-2026 | | | | 4,037,000 | | | | 4,430,579 | |
Bunge Limited Finance Corporation | | | 3.75 | | | | 9-25-2027 | | | | 3,508,000 | | | | 3,908,051 | |
General Motors Financial Company Incorporated | | | 1.70 | | | | 8-18-2023 | | | | 6,161,000 | | | | 6,309,887 | |
General Motors Financial Company Incorporated | | | 2.70 | | | | 8-20-2027 | | | | 8,692,000 | | | | 9,170,566 | |
General Motors Financial Company Incorporated | | | 2.75 | | | | 6-20-2025 | | | | 6,210,000 | | | | 6,572,160 | |
General Motors Financial Company Incorporated | | | 5.20 | | | | 3-20-2023 | | | | 4,234,000 | | | | 4,643,844 | |
General Motors Financial Company Incorporated | | | 5.40 | | | | 4-1-2048 | | | | 3,760,000 | | | | 4,742,423 | |
Harley Davidson Financial Services Company 144A | | | 3.35 | | | | 6-8-2025 | | | | 3,823,000 | | | | 4,109,913 | |
Hyundai Capital America 144A | | | 1.25 | | | | 9-18-2023 | | | | 2,903,000 | | | | 2,923,390 | |
Hyundai Capital America 144A | | | 1.80 | | | | 10-15-2025 | | | | 2,903,000 | | | | 2,941,752 | |
Hyundai Capital America 144A | | | 2.38 | | | | 10-15-2027 | | | | 2,903,000 | | | | 2,993,394 | |
John Deere Capital Corporation | | | 0.55 | | | | 7-5-2022 | | | | 5,706,000 | | | | 5,735,153 | |
John Deere Capital Corporation | | | 1.20 | | | | 4-6-2023 | | | | 4,394,000 | | | | 4,487,437 | |
John Deere Capital Corporation | | | 1.75 | | | | 3-9-2027 | | | | 2,633,000 | | | | 2,769,056 | |
| | | | |
| | | | | | | | | | | | | | | 98,888,709 | |
| | | | | | | | | | | | | | | | |
|
| Diversified Financial Services: 0.04% | |
Andrew W. Mellon Foundation | | | 0.95 | | | | 8-1-2027 | | | | 2,272,000 | | | | 2,269,060 | |
| | | | | | | | | | | | | | | | |
|
| Insurance: 0.61% | |
American International Group Incorporated | | | 3.40 | | | | 6-30-2030 | | | | 4,204,000 | | | | 4,792,159 | |
American International Group Incorporated | | | 4.20 | | | | 4-1-2028 | | | | 2,799,000 | | | | 3,335,353 | |
American International Group Incorporated | | | 4.50 | | | | 7-16-2044 | | | | 2,493,000 | | | | 3,198,896 | |
American International Group Incorporated | | | 4.75 | | | | 4-1-2048 | | | | 3,869,000 | | | | 5,218,106 | |
American International Group Incorporated | | | 5.25 | | | | 4-2-2030 | | | | 4,803,000 | | | | 5,796,325 | |
Brighthouse Financial Incorporated | | | 4.70 | | | | 6-22-2047 | | | | 2,089,000 | | | | 2,158,113 | |
Fidelity & Guaranty Life Company 144A | | | 5.50 | | | | 5-1-2025 | | | | 1,911,000 | | | | 2,208,848 | |
Fidelity National Financial Incorporated | | | 3.40 | | | | 6-15-2030 | | | | 2,405,000 | | | | 2,649,662 | |
Nationwide Financial Services Incorporated 144A | | | 3.90 | | | | 11-30-2049 | | | | 4,484,000 | | | | 4,967,521 | |
Nationwide Mutual Insurance Company 144A | | | 4.35 | | | | 4-30-2050 | | | | 2,498,000 | | | | 2,920,368 | |
| | | | |
| | | | | | | | | | | | | | | 37,245,351 | |
| | | | | | | | | | | | | | | | |
The accompanying notes are an integral part of these financial statements.
34 | Wells Fargo Core Bond Portfolio
Portfolio of investments—November 30, 2020 (unaudited)
| | | | | | | | | | | | | | | | |
| | | Interest
rate | | | Maturity
date | | | Principal | | | Value | |
| Health Care: 3.20% | |
|
| Biotechnology: 1.18% | |
AbbVie Incorporated | | | 2.30 | % | | | 11-21-2022 | | | $ | 5,819,000 | | | $ | 6,023,916 | |
AbbVie Incorporated | | | 2.60 | | | | 11-21-2024 | | | | 4,641,000 | | | | 4,960,250 | |
AbbVie Incorporated | | | 2.90 | | | | 11-6-2022 | | | | 5,980,000 | | | | 6,253,455 | |
AbbVie Incorporated | | | 2.95 | | | | 11-21-2026 | | | | 1,865,000 | | | | 2,062,242 | |
AbbVie Incorporated | | | 3.20 | | | | 11-21-2029 | | | | 7,876,000 | | | | 8,929,968 | |
AbbVie Incorporated | | | 3.75 | | | | 11-14-2023 | | | | 513,000 | | | | 560,992 | |
AbbVie Incorporated | | | 3.80 | | | | 3-15-2025 | | | | 7,754,000 | | | | 8,662,821 | |
AbbVie Incorporated | | | 4.05 | | | | 11-21-2039 | | | | 2,166,000 | | | | 2,625,565 | |
AbbVie Incorporated | | | 4.25 | | | | 11-14-2028 | | | | 1,401,000 | | | | 1,690,730 | |
AbbVie Incorporated | | | 4.25 | | | | 11-21-2049 | | | | 4,936,000 | | | | 6,238,304 | |
AbbVie Incorporated | | | 4.30 | | | | 5-14-2036 | | | | 1,354,000 | | | | 1,684,061 | |
AbbVie Incorporated | | | 4.45 | | | | 5-14-2046 | | | | 1,372,000 | | | | 1,729,302 | |
Amgen Incorporated | | | 3.15 | | | | 2-21-2040 | | | | 674,000 | | | | 727,938 | |
Gilead Sciences Incorporated | | | 1.20 | | | | 10-1-2027 | | | | 3,035,000 | | | | 3,054,229 | |
Gilead Sciences Incorporated | | | 1.65 | | | | 10-1-2030 | | | | 3,035,000 | | | | 3,021,358 | |
Gilead Sciences Incorporated | | | 2.60 | | | | 10-1-2040 | | | | 2,290,000 | | | | 2,318,833 | |
Gilead Sciences Incorporated | | | 2.80 | | | | 10-1-2050 | | | | 1,416,000 | | | | 1,422,389 | |
Regeneron Pharmaceutical Incorporated | | | 1.75 | | | | 9-15-2030 | | | | 7,615,000 | | | | 7,486,714 | |
Regeneron Pharmaceutical Incorporated | | | 2.80 | | | | 9-15-2050 | | | | 2,303,000 | | | | 2,258,648 | |
| | | | |
| | | | | | | | | | | | | | | 71,711,715 | |
| | | | | | | | | | | | | | | | |
|
| Health Care Equipment & Supplies: 0.27% | |
Abbott Laboratories | | | 3.75 | | | | 11-30-2026 | | | | 2,350,000 | | | | 2,742,187 | |
Danaher Corporation | | | 2.60 | | | | 10-1-2050 | | | | 2,383,000 | | | | 2,505,878 | |
Danaher Corporation | | | 3.35 | | | | 9-15-2025 | | | | 1,869,000 | | | | 2,077,432 | |
Stryker Corporation | | | 1.15 | | | | 6-15-2025 | | | | 3,995,000 | | | | 4,060,901 | |
Stryker Corporation | | | 1.95 | | | | 6-15-2030 | | | | 1,755,000 | | | | 1,815,338 | |
Stryker Corporation | | | 2.90 | | | | 6-15-2050 | | | | 2,799,000 | | | | 2,978,243 | |
| | | | |
| | | | | | | | | | | | | | | 16,179,979 | |
| | | | | | | | | | | | | | | | |
|
| Health Care Providers & Services: 0.74% | |
Aetna Incorporated | | | 3.88 | | | | 8-15-2047 | | | | 1,478,000 | | | | 1,761,885 | |
Anthem Incorporated | | | 2.25 | | | | 5-15-2030 | | | | 4,942,000 | | | | 5,173,788 | |
Cigna Corporation | | | 3.40 | | | | 9-17-2021 | | | | 4,106,000 | | | | 4,204,987 | |
Cigna Corporation | | | 3.40 | | | | 3-1-2027 | | | | 2,887,000 | | | | 3,242,324 | |
Cigna Corporation | | | 3.88 | | | | 10-15-2047 | | | | 3,958,000 | | | | 4,750,617 | |
Cigna Corporation | | | 4.38 | | | | 10-15-2028 | | | | 955,000 | | | | 1,147,604 | |
CVS Health Corporation | | | 3.00 | | | | 8-15-2026 | | | | 2,013,000 | | | | 2,216,979 | |
CVS Health Corporation | | | 1.75 | | | | 8-21-2030 | | | | 998,000 | | | | 997,827 | |
CVS Health Corporation | | | 2.70 | | | | 8-21-2040 | | | | 1,391,000 | | | | 1,405,926 | |
CVS Health Corporation | | | 3.70 | | | | 3-9-2023 | | | | 2,148,000 | | | | 2,297,866 | |
CVS Health Corporation | | | 4.30 | | | | 3-25-2028 | | | | 4,779,000 | | | | 5,620,444 | |
CVS Health Corporation | | | 4.78 | | | | 3-25-2038 | | | | 1,438,000 | | | | 1,822,577 | |
HCA Incorporated | | | 5.13 | | | | 6-15-2039 | | | | 1,054,000 | | | | 1,354,634 | |
HCA Incorporated | | | 5.25 | | | | 6-15-2049 | | | | 1,015,000 | | | | 1,337,613 | |
UnitedHealth Group Incorporated | | | 2.75 | | | | 5-15-2040 | | | | 1,428,000 | | | | 1,564,519 | |
UnitedHealth Group Incorporated | | | 3.50 | | | | 8-15-2039 | | | | 651,000 | | | | 774,503 | |
UnitedHealth Group Incorporated | | | 3.70 | | | | 12-15-2025 | | | | 2,013,000 | | | | 2,302,520 | |
UnitedHealth Group Incorporated | | | 3.75 | | | | 10-15-2047 | | | | 1,604,000 | | | | 2,017,421 | |
UnitedHealth Group Incorporated | | | 3.88 | | | | 8-15-2059 | | | | 1,041,000 | | | | 1,378,655 | |
| | | | |
| | | | | | | | | | | | | | | 45,372,689 | |
| | | | | | | | | | | | | | | | |
The accompanying notes are an integral part of these financial statements.
Wells Fargo Core Bond Portfolio | 35
Portfolio of investments—November 30, 2020 (unaudited)
| | | | | | | | | | | | | | | | |
| | | Interest
rate | | | Maturity
date | | | Principal | | | Value | |
| Life Sciences Tools & Services: 0.14% | | | | | | | | | | | | |
Thermo Fisher Scientific Incorporated | | | 4.50 | % | | | 3-25-2030 | | | $ | 6,955,000 | | | $ | 8,722,259 | |
| | | | | | | | | | | | | | | | |
| | | | |
| Pharmaceuticals: 0.87% | | | | | | | | | | | | |
Bristol Myers Squibb Company | | | 0.75 | | | | 11-13-2025 | | | | 3,987,000 | | | | 3,989,406 | |
Bristol Myers Squibb Company | | | 1.13 | | | | 11-13-2027 | | | | 5,980,000 | | | | 6,023,189 | |
Bristol Myers Squibb Company | | | 1.45 | | | | 11-13-2030 | | | | 6,974,000 | | | | 7,002,064 | |
Bristol Myers Squibb Company | | | 2.35 | | | | 11-13-2040 | | | | 1,495,000 | | | | 1,534,716 | |
Bristol Myers Squibb Company | | | 2.55 | | | | 11-13-2050 | | | | 4,584,000 | | | | 4,727,222 | |
Bristol Myers Squibb Company | | | 3.40 | | | | 7-26-2029 | | | | 2,440,000 | | | | 2,847,702 | |
Bristol Myers Squibb Company | | | 3.45 | | | | 11-15-2027 | | | | 2,692,000 | | | | 3,092,615 | |
Bristol Myers Squibb Company | | | 3.90 | | | | 2-20-2028 | | | | 2,885,000 | | | | 3,416,532 | |
Bristol Myers Squibb Company | | | 4.25 | | | | 10-26-2049 | | | | 1,518,000 | | | | 2,054,534 | |
Bristol Myers Squibb Company | | | 4.35 | | | | 11-15-2047 | | | | 912,000 | | | | 1,241,441 | |
Eli Lilly and Company | | | 2.25 | | | | 5-15-2050 | | | | 2,827,000 | | | | 2,750,289 | |
Eli Lilly and Company | | | 2.50 | | | | 9-15-2060 | | | | 1,905,000 | | | | 1,920,572 | |
Johnson & Johnson | | | 2.10 | | | | 9-1-2040 | | | | 681,000 | | | | 695,505 | |
Johnson & Johnson | | | 2.45 | | | | 9-1-2060 | | | | 972,000 | | | | 1,018,574 | |
Merck & Company Incorporated | | | 2.35 | | | | 6-24-2040 | | | | 1,386,000 | | | | 1,449,064 | |
Merck & Company Incorporated | | | 2.45 | | | | 6-24-2050 | | | | 1,386,000 | | | | 1,444,631 | |
Merck & Company Incorporated | | | 3.70 | | | | 2-10-2045 | | | | 1,325,000 | | | | 1,666,790 | |
Pfizer Incorporated | | | 2.80 | | | | 3-11-2022 | | | | 1,792,000 | | | | 1,849,113 | |
Royalty Pharma plc 144A | | | 0.75 | | | | 9-2-2023 | | | | 989,000 | | | | 993,278 | |
Royalty Pharma plc 144A | | | 1.20 | | | | 9-2-2025 | | | | 989,000 | | | | 997,313 | |
Royalty Pharma plc 144A | | | 3.55 | | | | 9-2-2050 | | | | 2,520,000 | | | | 2,617,503 | |
| | | | |
| | | | | | | | | | | | | | | 53,332,053 | |
| | | | | | | | | | | | | | | | |
| | | | |
Industrials: 1.91% | | | | | | | | | | | | | | | | |
| | | | |
| Aerospace & Defense: 0.70% | | | | | | | | | | | | |
Northrop Grumman Corporation | | | 2.55 | | | | 10-15-2022 | | | | 5,898,000 | | | | 6,127,974 | |
Northrop Grumman Corporation | | | 2.93 | | | | 1-15-2025 | | | | 271,000 | | | | 294,298 | |
Northrop Grumman Corporation | | | 3.25 | | | | 8-1-2023 | | | | 5,436,000 | | | | 5,863,910 | |
Northrop Grumman Corporation | | | 3.25 | | | | 1-15-2028 | | | | 3,365,000 | | | | 3,798,395 | |
Northrop Grumman Corporation | | | 4.03 | | | | 10-15-2047 | | | | 1,936,000 | | | | 2,460,323 | |
Northrop Grumman Corporation | | | 5.15 | | | | 5-1-2040 | | | | 2,907,000 | | | | 4,047,183 | |
The Boeing Company | | | 3.25 | | | | 2-1-2028 | | | | 4,038,000 | | | | 4,205,609 | |
The Boeing Company | | | 3.63 | | | | 2-1-2031 | | | | 5,082,000 | | | | 5,363,945 | |
The Boeing Company | | | 3.75 | | | | 2-1-2050 | | | | 2,117,000 | | | | 2,141,554 | |
The Boeing Company | | | 5.81 | | | | 5-1-2050 | | | | 1,262,000 | | | | 1,667,208 | |
United Technologies Corporation | | | 3.65 | | | | 8-16-2023 | | | | 390,000 | | | | 420,409 | |
United Technologies Corporation | | | 3.95 | | | | 8-16-2025 | | | | 2,686,000 | | | | 3,077,494 | |
United Technologies Corporation | | | 4.45 | | | | 11-16-2038 | | | | 2,502,000 | | | | 3,227,914 | |
| | | | |
| | | | | | | | | | | | | | | 42,696,216 | |
| | | | | | | | | | | | | | | | |
| Airlines: 0.36% | |
Delta Air Lines Incorporated 144A | | | 4.50 | | | | 10-20-2025 | | | | 6,004,000 | | | | 6,338,253 | |
Delta Air Lines Incorporated 144A | | | 4.75 | | | | 10-20-2028 | | | | 4,004,000 | | | | 4,310,220 | |
Southwest Airlines Company | | | 4.75 | | | | 5-4-2023 | | | | 3,989,000 | | | | 4,325,491 | |
Southwest Airlines Company | | | 5.13 | | | | 6-15-2027 | | | | 5,984,000 | | | | 6,960,267 | |
| | | | |
| | | | | | | | | | | | | | | 21,934,231 | |
| | | | | | | | | | | | | | | | |
| | | | |
| Commercial Services & Supplies: 0.08% | | | | | | | | | | | | |
Republic Services Incorporated | | | 1.75 | | | | 2-15-2032 | | | | 3,990,000 | | | | 4,017,813 | |
Waste Management Incorporated | | | 2.50 | | | | 11-15-2050 | | | | 956,000 | | | | 962,794 | |
| | | | |
| | | | | | | | | | | | | | | 4,980,607 | |
| | | | | | | | | | | | | | | | |
The accompanying notes are an integral part of these financial statements.
36 | Wells Fargo Core Bond Portfolio
Portfolio of investments—November 30, 2020 (unaudited)
| | | | | | | | | | | | | | | | |
| | | Interest
rate | | | Maturity
date | | | Principal | | | Value | |
| Industrial Conglomerates: 0.25% | | | | | | | | | | | | |
Alphabet Incorporated | | | 2.25 | % | | | 8-15-2060 | | | $ | 2,664,000 | | | $ | 2,639,240 | |
General Electric Company | | | 3.10 | | | | 1-9-2023 | | | | 666,000 | | | | 700,156 | |
General Electric Company | | | 3.45 | | | | 5-1-2027 | | | | 5,548,000 | | | | 6,111,013 | |
General Electric Company | | | 3.63 | | | | 5-1-2030 | | | | 2,849,000 | | | | 3,193,548 | |
General Electric Company | | | 4.35 | | | | 5-1-2050 | | | | 1,491,000 | | | | 1,750,369 | |
General Electric Company | | | 5.88 | | | | 1-14-2038 | | | | 317,000 | | | | 409,926 | |
| | | | |
| | | | | | | | | | | | | | | 14,804,252 | |
| | | | | | | | | | | | | | | | |
| | | | |
| Machinery: 0.10% | | | | | | | | | | | | |
Deere & Company | | | 2.75 | | | | 4-15-2025 | | | | 3,891,000 | | | | 4,233,644 | |
Deere & Company | | | 3.75 | | | | 4-15-2050 | | | | 1,507,000 | | | | 1,967,084 | |
| | | | |
| | | | | | | | | | | | | | | 6,200,728 | |
| | | | | | | | | | | | | | | | |
| | | | |
| Road & Rail: 0.37% | | | | | | | | | | | | |
Burlington Northern Santa Fe LLC | | | 3.05 | | | | 2-15-2051 | | | | 1,332,000 | | | | 1,538,475 | |
CSX Corporation | | | 4.30 | | | | 3-1-2048 | | | | 238,000 | | | | 312,944 | |
CSX Corporation | | | 4.75 | | | | 11-15-2048 | | | | 1,292,000 | | | | 1,806,659 | |
Union Pacific Corporation | | | 2.15 | | | | 2-5-2027 | | | | 2,951,000 | | | | 3,130,747 | |
Union Pacific Corporation | | | 2.40 | | | | 2-5-2030 | | | | 3,653,000 | | | | 3,952,482 | |
Union Pacific Corporation | | | 2.95 | | | | 3-1-2022 | | | | 3,307,000 | | | | 3,414,945 | |
Union Pacific Corporation 144A | | | 2.97 | | | | 9-16-2062 | | | | 500,000 | | | | 528,319 | |
Union Pacific Corporation | | | 3.15 | | | | 3-1-2024 | | | | 1,582,000 | | | | 1,707,986 | |
Union Pacific Corporation | | | 3.25 | | | | 2-5-2050 | | | | 4,690,000 | | | | 5,369,944 | |
Union Pacific Corporation | | | 3.75 | | | | 2-5-2070 | | | | 606,000 | | | | 729,921 | |
| | | | |
| | | | | | | | | | | | | | | 22,492,422 | |
| | | | | | | | | | | | | | | | |
|
| Transportation Infrastructure: 0.05% | |
Crowley Conro LLC | | | 4.18 | | | | 8-15-2043 | | | | 2,667,033 | | | | 3,214,280 | |
| | | | | | | | | | | | | | | | |
|
Information Technology: 2.12% | |
|
| Electronic Equipment, Instruments & Components: 0.10% | |
Flex Limited | | | 4.88 | | | | 5-12-2030 | | | | 4,987,000 | | | | 5,927,389 | |
| | | | | | | | | | | | | | | | |
|
| IT Services: 0.32% | |
Fiserv Incorporated | | | 3.20 | | | | 7-1-2026 | | | | 3,199,000 | | | | 3,586,542 | |
Fiserv Incorporated | | | 3.50 | | | | 7-1-2029 | | | | 922,000 | | | | 1,055,601 | |
IBM Corporation | | | 3.30 | | | | 5-15-2026 | | | | 1,095,000 | | | | 1,234,347 | |
IBM Corporation | | | 4.15 | | | | 5-15-2039 | | | | 477,000 | | | | 611,075 | |
Paypal Holdings Incorporated | | | 1.35 | | | | 6-1-2023 | | | | 5,148,000 | | | | 5,275,086 | |
Paypal Holdings Incorporated | | | 1.65 | | | | 6-1-2025 | | | | 7,206,000 | | | | 7,492,806 | |
| | | | |
| | | | | | | | | | | | | | | 19,255,457 | |
| | | | | | | | | | | | | | | | |
|
| Semiconductors & Semiconductor Equipment: 0.94% | |
Broadcom Incorporated | | | 3.15 | | | | 11-15-2025 | | | | 10,440,000 | | | | 11,372,666 | |
Broadcom Incorporated | | | 3.88 | | | | 1-15-2027 | | | | 4,520,000 | | | | 5,078,645 | |
Broadcom Incorporated | | | 4.15 | | | | 11-15-2030 | | | | 5,914,000 | | | | 6,860,086 | |
Broadcom Incorporated | | | 4.25 | | | | 4-15-2026 | | | | 3,199,000 | | | | 3,652,873 | |
Broadcom Incorporated | | | 4.70 | | | | 4-15-2025 | | | | 4,699,000 | | | | 5,377,967 | |
Intel Corporation | | | 4.60 | | | | 3-25-2040 | | | | 1,896,000 | | | | 2,546,606 | |
KLA Corporation | | | 3.30 | | | | 3-1-2050 | | | | 2,538,000 | | | | 2,848,470 | |
Micron Technology Incorporated | | | 2.50 | | | | 4-24-2023 | | | | 5,891,000 | | | | 6,151,741 | |
NVIDIA Corporation | | | 2.85 | | | | 4-1-2030 | | | | 1,047,000 | | | | 1,173,460 | |
NVIDIA Corporation | | | 3.50 | | | | 4-1-2050 | | | | 8,033,000 | | | | 9,765,705 | |
Texas Instruments Incorporated | | | 1.38 | | | | 3-12-2025 | | | | 2,363,000 | | | | 2,441,496 | |
| | | | |
| | | | | | | | | | | | | | | 57,269,715 | |
| | | | | | | | | | | | | | | | |
The accompanying notes are an integral part of these financial statements.
Wells Fargo Core Bond Portfolio | 37
Portfolio of investments—November 30, 2020 (unaudited)
| | | | | | | | | | | | | | | | |
| | | Interest
rate | | | Maturity
date | | | Principal | | | Value | |
| Software: 0.38% | | | | | | | | | | | | |
Microsoft Corporation | | | 2.68 | % | | | 6-1-2060 | | | $ | 1,467,000 | | | $ | 1,608,093 | |
Microsoft Corporation | | | 4.10 | | | | 2-6-2037 | | | | 1,883,000 | | | | 2,481,307 | |
Oracle Corporation | | | 2.63 | | | | 2-15-2023 | | | | 2,471,000 | | | | 2,586,383 | |
Oracle Corporation | | | 2.80 | | | | 4-1-2027 | | | | 5,697,000 | | | | 6,268,846 | |
Oracle Corporation | | | 2.95 | | | | 11-15-2024 | | | | 1,321,000 | | | | 1,433,048 | |
Oracle Corporation | | | 3.80 | | | | 11-15-2037 | | | | 1,349,000 | | | | 1,614,308 | |
Oracle Corporation | | | 3.85 | | | | 4-1-2060 | | | | 3,144,000 | | | | 3,865,398 | |
Oracle Corporation | | | 4.00 | | | | 11-15-2047 | | | | 2,871,000 | | | | 3,508,573 | |
| | | | |
| | | | | | | | | | | | | | | 23,365,956 | |
| | | | | | | | | | | | | | | | |
| | | | |
| Technology Hardware, Storage & Peripherals: 0.38% | | | | | | | | | | | | |
Apple Incorporated | | | 2.65 | | | | 5-11-2050 | | | | 4,595,000 | | | | 4,927,367 | |
Apple Incorporated | | | 4.25 | | | | 2-9-2047 | | | | 1,346,000 | | | | 1,850,465 | |
Apple Incorporated | | | 2.55 | | | | 8-20-2060 | | | | 4,378,000 | | | | 4,539,112 | |
Dell International LLC 144A | | | 4.90 | | | | 10-1-2026 | | | | 972,000 | | | | 1,135,157 | |
Dell International LLC 144A | | | 5.30 | | | | 10-1-2029 | | | | 1,911,000 | | | | 2,308,508 | |
Dell International LLC 144A | | | 6.10 | | | | 7-15-2027 | | | | 1,902,000 | | | | 2,330,653 | |
HP Incorporated | | | 2.20 | | | | 6-17-2025 | | | | 5,989,000 | | | | 6,327,725 | |
| | | | |
| | | | | | | | | | | | | | | 23,418,987 | |
| | | | | | | | | | | | | | | | |
|
Materials: 0.76% | |
|
| Chemicals: 0.34% | |
Dow Chemical Corporation | | | 2.10 | | | | 11-15-2030 | | | | 5,715,000 | | | | 5,833,340 | |
Dow Chemical Corporation | | | 3.60 | | | | 11-15-2050 | | | | 2,026,000 | | | | 2,260,257 | |
Dow Chemical Corporation | | | 4.38 | | | | 11-15-2042 | | | | 974,000 | | | | 1,188,902 | |
LYB International Finance III Company | | | 1.25 | | | | 10-1-2025 | | | | 2,222,000 | | | | 2,241,833 | |
LYB International Finance III Company | | | 2.25 | | | | 10-1-2030 | | | | 980,000 | | | | 1,000,370 | |
LYB International Finance III Company | | | 3.38 | | | | 10-1-2040 | | | | 1,246,000 | | | | 1,311,826 | |
LYB International Finance III Company | | | 3.63 | | | | 4-1-2051 | | | | 1,746,000 | | | | 1,885,196 | |
Nutrition and Biosciences Incorporated 144A | | | 1.23 | | | | 10-1-2025 | | | | 2,016,000 | | | | 2,040,985 | |
Nutrition and Biosciences Incorporated 144A | | | 2.30 | | | | 11-1-2030 | | | | 3,022,000 | | | | 3,106,832 | |
| | | | |
| | | | | | | | | | | | | | | 20,869,541 | |
| | | | | | | | | | | | | | | | |
| | | | |
| Metals & Mining: 0.42% | | | | | | | | | | | | |
Barrick Gold Finance Company LLC | | | 5.70 | | | | 5-30-2041 | | | | 1,154,000 | | | | 1,660,109 | |
Newmont Mining Corporation | | | 2.25 | | | | 10-1-2030 | | | | 12,670,000 | | | | 13,271,678 | |
Nucor Corporation | | | 2.00 | | | | 6-1-2025 | | | | 1,991,000 | | | | 2,091,274 | |
Nucor Corporation | | | 2.70 | | | | 6-1-2030 | | | | 2,549,000 | | | | 2,782,447 | |
Reliance Steel & Aluminum Company | | | 1.30 | | | | 8-15-2025 | | | | 1,571,000 | | | | 1,589,111 | |
Reliance Steel & Aluminum Company | | | 2.15 | | | | 8-15-2030 | | | | 4,080,000 | | | | 4,164,820 | |
| | | | |
| | | | | | | | | | | | | | | 25,559,439 | |
| | | | | | | | | | | | | | | | |
|
Real Estate: 1.18% | |
|
| Equity REITs: 0.96% | |
Agree LP | | | 2.90 | | | | 10-1-2030 | | | | 1,391,000 | | | | 1,457,420 | |
Crown Castle International Corporation | | | 3.30 | | | | 7-1-2030 | | | | 1,585,000 | | | | 1,768,843 | |
Crown Castle International Corporation | | | 4.00 | | | | 3-1-2027 | | | | 951,000 | | | | 1,086,042 | |
Equinix Incorporated | | | 2.63 | | | | 11-18-2024 | | | | 2,516,000 | | | | 2,680,067 | |
Equinix Incorporated | | | 2.90 | | | | 11-18-2026 | | | | 5,252,000 | | | | 5,727,080 | |
Healthpeak Properties | | | 2.88 | | | | 1-15-2031 | | | | 1,316,000 | | | | 1,405,658 | |
Kimco Realty Corporation | | | 1.90 | | | | 3-1-2028 | | | | 1,985,000 | | | | 1,994,244 | |
Mid-America Apartments LP | | | 1.70 | | | | 2-15-2031 | | | | 1,759,000 | | | | 1,745,842 | |
Mid-America Apartments LP | | | 3.60 | | | | 6-1-2027 | | | | 284,000 | | | | 319,764 | |
The accompanying notes are an integral part of these financial statements.
38 | Wells Fargo Core Bond Portfolio
Portfolio of investments—November 30, 2020 (unaudited)
| | | | | | | | | | | | | | | | |
| | | Interest
rate | | | Maturity
date | | | Principal | | | Value | |
|
| Equity REITs (continued) | |
Mid-America Apartments LP | | | 3.75 | % | | | 6-15-2024 | | | $ | 4,371,000 | | | $ | 4,737,861 | |
Mid-America Apartments LP | | | 3.95 | | | | 3-15-2029 | | | | 1,878,000 | | | | 2,196,497 | |
Mid-America Apartments LP | | | 4.00 | | | | 11-15-2025 | | | | 2,287,000 | | | | 2,586,674 | |
Mid-America Apartments LP | | | 4.30 | | | | 10-15-2023 | | | | 1,914,000 | | | | 2,089,331 | |
Realty Income Corporation | | | 3.25 | | | | 1-15-2031 | | | | 4,263,000 | | | | 4,824,380 | |
Regency Centers LP | | | 2.95 | | | | 9-15-2029 | | | | 4,062,000 | | | | 4,291,002 | |
Store Capital Corporation | | | 2.75 | | | | 11-18-2030 | | | | 3,294,000 | | | | 3,325,094 | |
Store Capital Corporation | | | 4.50 | | | | 3-15-2028 | | | | 7,031,000 | | | | 7,901,087 | |
Store Capital Corporation | | | 4.63 | | | | 3-15-2029 | | | | 2,381,000 | | | | 2,721,079 | |
VEREIT Operating Partnership LP | | | 2.20 | | | | 6-15-2028 | | | | 1,992,000 | | | | 2,003,779 | |
VEREIT Operating Partnership LP | | | 2.85 | | | | 12-15-2032 | | | | 1,394,000 | | | | 1,427,609 | |
VEREIT Operating Partnership LP | | | 3.40 | | | | 1-15-2028 | | | | 1,985,000 | | | | 2,148,057 | |
| | | | |
| | | | | | | | | | | | | | | 58,437,410 | |
| | | | | | | | | | | | | | | | |
| | | | |
| Real Estate Management & Development: 0.22% | | | | | | | | | | | | |
Federal Realty Investment Trust | | | 3.95 | | | | 1-15-2024 | | | | 2,960,000 | | | | 3,216,306 | |
Highwoods Realty LP | | | 2.60 | | | | 2-1-2031 | | | | 1,645,000 | | | | 1,656,427 | |
Spirit Realty LP | | | 3.20 | | | | 2-15-2031 | | | | 4,423,000 | | | | 4,622,562 | |
Spirit Realty LP | | | 3.40 | | | | 1-15-2030 | | | | 2,250,000 | | | | 2,391,694 | |
Spirit Realty LP | | | 4.00 | | | | 7-15-2029 | | | | 1,104,000 | | | | 1,226,828 | |
Spirit Realty LP | | | 4.45 | | | | 9-15-2026 | | | | 233,000 | | | | 261,583 | |
| | | | |
| | | | | | | | | | | | | | | 13,375,400 | |
| | | | | | | | | | | | | | | | |
|
Utilities: 2.40% | |
|
| Electric Utilities: 1.48% | |
Duke Energy Corporation | | | 1.80 | | | | 9-1-2021 | | | | 3,936,000 | | | | 3,973,624 | |
Duke Energy Progress Incorporated | | | 2.50 | | | | 8-15-2050 | | | | 2,283,000 | | | | 2,320,939 | |
Entergy Arkansas LLC 1st Mortgage | | | 2.65 | | | | 6-15-2051 | | | | 2,495,000 | | | | 2,599,500 | |
Entergy Texas Incorporated 1st Mortgage | | | 1.75 | | | | 3-15-2031 | | | | 2,522,000 | | | | 2,530,302 | |
Evergy Incorporated | | | 2.25 | | | | 6-1-2030 | | | | 2,440,000 | | | | 2,593,102 | |
Evergy Incorporated | | | 2.45 | | | | 9-15-2024 | | | | 3,491,000 | | | | 3,698,645 | |
Evergy Incorporated | | | 2.90 | | | | 9-15-2029 | | | | 2,480,000 | | | | 2,692,508 | |
Evergy Kansas Central Incorporated | | | 3.45 | | | | 4-15-2050 | | | | 4,060,000 | | | | 4,751,107 | |
Exelon Corporation | | | 4.70 | | | | 4-15-2050 | | | | 3,613,000 | | | | 4,876,829 | |
Interstate Power & Light Company | | | 3.50 | | | | 9-30-2049 | | | | 1,431,000 | | | | 1,610,260 | |
ITC Holdings Corporation | | | 2.70 | | | | 11-15-2022 | | | | 3,761,000 | | | | 3,911,472 | |
Metropolitan Edison Company 144A | | | 4.30 | | | | 1-15-2029 | | | | 4,189,000 | | | | 4,791,552 | |
Mississippi Power Company | | | 3.95 | | | | 3-30-2028 | | | | 4,588,000 | | | | 5,295,913 | |
Mississippi Power Company | | | 4.25 | | | | 3-15-2042 | | | | 2,754,000 | | | | 3,369,710 | |
Pacific Gas & Electric Company | | | 2.10 | | | | 8-1-2027 | | | | 3,745,000 | | | | 3,776,624 | |
Pacific Gas & Electric Company | | | 2.50 | | | | 2-1-2031 | | | | 5,160,000 | | | | 5,196,668 | |
Pacific Gas & Electric Company | | | 3.15 | | | | 1-1-2026 | | | | 803,000 | | | | 848,359 | |
Pacific Gas & Electric Company | | | 3.30 | | | | 12-1-2027 | | | | 6,785,000 | | | | 7,206,140 | |
Pacific Gas & Electric Company | | | 3.30 | | | | 8-1-2040 | | | | 1,254,000 | | | | 1,267,343 | |
Pacific Gas & Electric Company | | | 3.95 | | | | 12-1-2047 | | | | 3,055,000 | | | | 3,182,454 | |
Pacific Gas & Electric Company | | | 4.50 | | | | 7-1-2040 | | | | 968,000 | | | | 1,085,785 | |
Pacific Gas & Electric Company | | | 4.55 | | | | 7-1-2030 | | | | 4,164,000 | | | | 4,753,823 | |
Pennsylvania Electric Company 144A | | | 3.25 | | | | 3-15-2028 | | | | 1,582,000 | | | | 1,704,591 | |
Public Service Electric and Gas Company | | | 2.05 | �� | | | 8-1-2050 | | | | 778,000 | | | | 723,078 | |
Public Service Electric and Gas Company | | | 2.70 | | | | 5-1-2050 | | | | 4,146,000 | | | | 4,401,170 | |
South Carolina Edison Company | | | 4.13 | | | | 3-1-2048 | | | | 2,097,000 | | | | 2,540,047 | |
Southern California Edison Company | | | 2.85 | | | | 8-1-2029 | | | | 1,900,000 | | | | 2,054,666 | |
Southern California Edison Company | | | 4.65 | | | | 10-1-2043 | | | | 914,000 | | | | 1,136,898 | |
Trans-Allegheny Interstate Line Company 144A | | | 3.85 | | | | 6-1-2025 | | | | 1,312,000 | | | | 1,429,301 | |
| | | | |
| | | | | | | | | | | | | | | 90,322,410 | |
| | | | | | | | | | | | | | | | |
The accompanying notes are an integral part of these financial statements.
Wells Fargo Core Bond Portfolio | 39
Portfolio of investments—November 30, 2020 (unaudited)
| | | | | | | | | | | | | | | | |
| | | Interest
rate | | | Maturity
date | | | Principal | | | Value | |
| Gas Utilities: 0.06% | |
Southern Company Gas Capital Corporation | | | 1.75 | % | | | 1-15-2031 | | | $ | 3,810,000 | | | $ | 3,840,877 | |
| | | | | | | | | | | | | | | | |
|
| Independent Power & Renewable Electricity Producers: 0.07% | |
The AES Corporation 144A%% | | | 1.38 | | | | 1-15-2026 | | | | 4,017,000 | | | | 4,050,656 | |
| | | | | | | | | | | | | | | | |
|
| Multi-Utilities: 0.79% | |
Black Hills Corporation | | | 3.05 | | | | 10-15-2029 | | | | 2,286,000 | | | | 2,497,605 | |
Black Hills Corporation | | | 3.88 | | | | 10-15-2049 | | | | 1,681,000 | | | | 1,924,501 | |
CenterPoint Energy Incorporated | | | 2.50 | | | | 9-1-2022 | | | | 386,000 | | | | 399,049 | |
CenterPoint Energy Incorporated | | | 2.50 | | | | 9-1-2024 | | | | 4,069,000 | | | | 4,319,821 | |
CenterPoint Energy Incorporated | | | 2.90 | | | | 7-1-2050 | | | | 1,290,000 | | | | 1,403,280 | |
CenterPoint Energy Incorporated | | | 2.95 | | | | 3-1-2030 | | | | 1,593,000 | | | | 1,741,556 | |
CenterPoint Energy Incorporated | | | 4.10 | | | | 9-1-2047 | | | | 1,825,000 | | | | 2,219,581 | |
Consumers Energy Company | | | 2.50 | | | | 5-1-2060 | | | | 1,582,000 | | | | 1,614,181 | |
Dominion Resources Incorporated | | | 2.00 | | | | 8-15-2021 | | | | 2,628,000 | | | | 2,654,352 | |
DTE Energy Company | | | 1.05 | | | | 6-1-2025 | | | | 3,805,000 | | | | 3,836,468 | |
DTE Energy Company | | | 2.53 | | | | 10-1-2024 | | | | 515,000 | | | | 548,389 | |
DTE Energy Company | | | 2.95 | | | | 3-1-2030 | | | | 2,502,000 | | | | 2,734,945 | |
DTE Energy Company | | | 2.95 | | | | 3-1-2050 | | | | 4,128,000 | | | | 4,600,814 | |
DTE Energy Company | | | 3.80 | | | | 3-15-2027 | | | | 3,765,000 | | | | 4,285,275 | |
Midamerican Energy Company | | | 3.65 | | | | 8-1-2048 | | | | 1,985,000 | | | | 2,443,903 | |
NextEra Energy Capital Company | | | 2.25 | | | | 6-1-2030 | | | | 3,038,000 | | | | 3,180,636 | |
NextEra Energy Capital Company | | | 2.75 | | | | 5-1-2025 | | | | 3,210,000 | | | | 3,478,035 | |
WEC Energy Group Incorporated | | | 1.38 | | | | 10-15-2027 | | | | 4,179,000 | | | | 4,194,247 | |
| | | | |
| | | | | | | | | | | | | | | 48,076,638 | |
| | | | | | | | | | | | | | | | |
| |
Total Corporate Bonds and Notes (Cost $1,481,624,908) | | | | 1,580,128,429 | |
| | | | | | | | | | | | | | | | |
|
Municipal Obligations: 0.45% | |
|
California: 0.06% | |
|
| GO Revenue: 0.06% | |
Los Angeles CA Community College District Build America Bonds | | | 6.75 | | | | 8-1-2049 | | | | 2,105,000 | | | | 3,772,497 | |
| | | | | | | | | | | | | | | | |
|
Nevada: 0.09% | |
|
| Airport Revenue: 0.09% | |
Clark County NV Airport Authority Build America Bonds Series C | | | 6.82 | | | | 7-1-2045 | | | | 3,365,000 | | | | 5,556,826 | |
| | | | | | | | | | | | | | | | |
|
New York: 0.12% | |
|
| Airport Revenue: 0.12% | |
Port Authority of New York & New Jersey Consolidated Bonds Series 174 | | | 4.46 | | | | 10-1-2062 | | | | 5,505,000 | | | | 7,172,024 | |
| | | | | | | | | | | | | | | | |
|
Ohio: 0.05% | |
|
| Education Revenue: 0.05% | |
Ohio State University General Receipts Taxable Bonds Series A | | | 4.80 | | | | 6-1-2111 | | | | 1,957,000 | | | | 2,819,274 | |
| | | | | | | | | | | | | | | | |
|
Texas: 0.13% | |
|
| Education Revenue: 0.03% | |
University of Texas Financing System Bond Series B | | | 2.44 | | | | 8-15-2049 | | | | 1,695,000 | | | | 1,728,900 | |
| | | | | | | | | | | | | | | | |
|
| Transportation Revenue: 0.10% | |
North Texas Tollway Authority | | | 6.72 | | | | 1-1-2049 | | | | 3,609,000 | | | | 6,251,690 | |
| | | | | | | | | | | | | | | | |
| | | | |
| | | | | | | | | | | | | | | 7,980,590 | |
| | | | | | | | | | | | | | | | |
| |
Total Municipal Obligations (Cost $19,305,170) | | | | 27,301,211 | |
| | | | | | | | | | | | | | | | |
The accompanying notes are an integral part of these financial statements.
40 | Wells Fargo Core Bond Portfolio
Portfolio of investments—November 30, 2020 (unaudited)
| | | | | | | | | | | | | | | | |
| | | Interest
rate | | | Maturity
date | | | Principal | | | Value | |
| Non-Agency Mortgage-Backed Securities: 3.36% | |
Angel Oak Mortgage Trust Series 2019-2 Class A1 144A ±± | | | 3.63 | % | | | 3-25-2049 | | | $ | 1,838,790 | | | $ | 1,883,962 | |
Angel Oak Mortgage Trust Series 2020-2 Class A1 144A ±± | | | 2.53 | | | | 1-26-2065 | | | | 6,576,616 | | | | 6,710,976 | |
Angel Oak Mortgage Trust Series 2020-5 Class A1 144A ±± | | | 1.37 | | | | 5-25-2065 | | | | 2,269,702 | | | | 2,273,353 | |
Benchmark Mortgage Trust Series 2018-B1 Class ASB ±± | | | 3.60 | | | | 1-15-2051 | | | | 787,000 | | | | 880,607 | |
Benchmark Mortgage Trust Series 2020-B20 Class A5 | | | 2.03 | | | | 10-15-2053 | | | | 5,004,000 | | | | 5,195,930 | |
Benchmark Mortgage Trust Series 2020-B21 Class A5 | | | 1.98 | | | | 12-15-2053 | | | | 4,871,000 | | | | 5,021,647 | |
Bunker Hill Loan Depositary Trust Series 2019-1 Class A1 144A | | | 3.61 | | | | 10-26-2048 | | | | 2,578,287 | | | | 2,684,815 | |
Bunker Hill Loan Depositary Trust Series 2019-2 Class A1 144A | | | 2.88 | | | | 7-25-2049 | | | | 4,494,226 | | | | 4,619,633 | |
Bunker Hill Loan Depositary Trust Series 2019-3 Class A1 144A | | | 2.72 | | | | 11-25-2059 | | | | 5,215,307 | | | | 5,358,227 | |
CD Commercial Mortgage Trust Series 2017-CD4 Class ASB | | | 3.32 | | | | 5-10-2050 | | | | 2,105,000 | | | | 2,295,507 | |
CD Commercial Mortgage Trust Series 2017-CD6 Class ASB | | | 3.33 | | | | 11-13-2050 | | | | 5,323,000 | | | | 5,859,686 | |
CFCRE Commercial Mortgage Trust Series 2017-C8 Class A1 | | | 1.96 | | | | 6-15-2050 | | | | 156,405 | | | | 156,429 | |
CFCRE Commercial Mortgage Trust Series 2017-C8 Class ASB | | | 3.37 | | | | 6-15-2050 | | | | 2,014,000 | | | | 2,190,022 | |
Citigroup Commercial Mortgage Trust Series 2016- P5 Class A1 | | | 1.41 | | | | 10-10-2049 | | | | 270,817 | | | | 270,983 | |
Colt Funding LLC Series 2019-1 Class A1 144A ±± | | | 3.71 | | | | 3-25-2049 | | | | 1,452,224 | | | | 1,467,635 | |
Colt Funding LLC Series 2019-2 Class A1 144A ±± | | | 3.34 | | | | 5-25-2049 | | | | 2,787,108 | | | | 2,808,622 | |
Colt Funding LLC Series 2019-4 Class A1 144A ±± | | | 2.58 | | | | 11-25-2049 | | | | 3,760,558 | | | | 3,805,798 | |
Colt Funding LLC Series 2020-2 Class A1 144A ±± | | | 1.85 | | | | 3-25-2065 | | | | 4,069,146 | | | | 4,122,689 | |
Commercial Mortgage Trust Series 2013-CR6 Class A4 | | | 3.10 | | | | 3-10-2046 | | | | 8,286,000 | | | | 8,580,492 | |
Commercial Mortgage Trust Series 2014-UBS4 Class A4 | | | 3.42 | | | | 8-10-2047 | | | | 4,380,000 | | | | 4,643,087 | |
Commercial Mortgage Trust Series 2015-LC21 Class A4 | | | 3.71 | | | | 7-10-2048 | | | | 1,777,000 | | | | 1,968,636 | |
CSAIL Commercial Mortgage Trust Series 2015-C4 Class A4 | | | 3.81 | | | | 11-15-2048 | | | | 2,010,200 | | | | 2,249,217 | |
Deutsche Bank Commercial Mortgage Trust Series 2017-C6 Class ASB | | | 3.12 | | | | 6-10-2050 | | | | 1,249,000 | | | | 1,351,327 | |
Deutsche Bank Commercial Mortgage Trust Series 2020-C9 Class A5 | | | 1.93 | | | | 9-15-2053 | | | | 976,000 | | | | 1,004,686 | |
GCAT Series 2019-NQM1 Class A1 144A | | | 2.99 | | | | 2-25-2059 | | | | 1,642,990 | | | | 1,674,650 | |
Goldman Sachs Mortgage Securities Trust Series 2012-GCJ7 Class AAB | | | 2.94 | | | | 5-10-2045 | | | | 8,937 | | �� | | 8,936 | |
Goldman Sachs Mortgage Securities Trust Series 2014-GCJ18 Class A3 | | | 3.80 | | | | 1-10-2047 | | | | 1,727,233 | | | | 1,788,648 | |
Goldman Sachs Mortgage Securities Trust Series 2015-GC34 Class A4 | | | 3.51 | | | | 10-10-2048 | | | | 3,317,000 | | | | 3,657,050 | |
GS Mortgage Securities Trust Series 2014-GC18 Class A4 | | | 4.07 | | | | 1-10-2047 | | | | 5,804,323 | | | | 6,257,534 | |
GS Mortgage Securities Trust Series 2017-GS18 Class A4 | | | 3.47 | | | | 11-10-2050 | | | | 4,741,000 | | | | 5,365,882 | |
Impact Funding LLC Series 2010-1 Class A1 144A | | | 5.31 | | | | 1-25-2051 | | | | 6,182,518 | | | | 6,679,630 | |
JPMDB Commercial Mortgage Securities Series 2014-C23 Class A4 | | | 3.67 | | | | 9-15-2047 | | | | 2,419,000 | | | | 2,597,756 | |
JPMDB Commercial Mortgage Securities Series 2017-C5 Class ASB | | | 3.49 | | | | 3-15-2050 | | | | 861,000 | | | | 936,661 | |
JPMDB Commercial Mortgage Securities Series 2018-C8 Class ASB | | | 4.15 | | | | 6-15-2051 | | | | 2,714,000 | | | | 3,118,335 | |
JPMorgan Chase Commercial Mortgage Securities Trust Series 2015-C28 Class A3 | | | 2.91 | | | | 10-15-2048 | | | | 9,951,788 | | | | 10,464,537 | |
JPMorgan Chase Commercial Mortgage Securities Trust Series 2015-C29 Class A4 | | | 3.61 | | | | 5-15-2048 | | | | 2,663,000 | | | | 2,941,689 | |
JPMorgan Chase Commercial Mortgage Securities Trust Series 2017-JP6 Class ASB | | | 3.28 | | | | 7-15-2050 | | | | 2,343,000 | | | | 2,553,442 | |
Morgan Stanley Bank of America Merrill Lynch Trust Series 2015-C20 Class A4 | | | 3.25 | | | | 2-15-2048 | | | | 800,041 | | | | 863,781 | |
New Residential Mortgage Loan Trust Series 2019-NQM2 Class A1 144A ±± | | | 3.60 | | | | 4-25-2049 | | | | 2,084,966 | | | | 2,115,150 | |
New Residential Mortgage Loan Trust Series 2019-NQM4 Class A1 144A ±± | | | 2.49 | | | | 9-25-2059 | | | | 3,555,840 | | | | 3,620,773 | |
SG Capital Partners Series 2019-3 Class A1 144A ±± | | | 2.70 | | | | 9-25-2059 | | | | 3,184,135 | | | | 3,227,661 | |
Starwood Mortgage Residential Trust Series 2019-INV1 Class A1 144A ±± | | | 2.61 | | | | 9-27-2049 | | | | 3,879,453 | | | | 3,948,115 | |
Starwood Mortgage Residential Trust Series 2020-1 Class A1 144A ±± | | | 2.28 | | | | 2-25-2050 | | | | 6,422,610 | | | | 6,559,660 | |
Starwood Mortgage Residential Trust Series 2020-3 Class A1 144A ±± | | | 1.49 | | | | 4-25-2065 | | | | 5,912,701 | | | | 5,948,234 | |
Verus Securitization Trust Series 2019-1 Class A1 144A ±± | | | 3.40 | | | | 12-25-2059 | | | | 2,930,161 | | | | 3,015,859 | |
Verus Securitization Trust Series 2019-1 Class A1 144A ±± | | | 3.84 | | | | 2-25-2059 | | | | 1,410,330 | | | | 1,421,442 | |
Verus Securitization Trust Series 2019-2 Class A1 144A ±± | | | 2.91 | | | | 7-25-2059 | | | | 3,885,311 | | | | 3,987,052 | |
Verus Securitization Trust Series 2019-2 Class A1 144A ±± | | | 3.21 | | | | 5-25-2059 | | | | 5,288,937 | | | | 5,355,142 | |
The accompanying notes are an integral part of these financial statements.
Wells Fargo Core Bond Portfolio | 41
Portfolio of investments—November 30, 2020 (unaudited)
| | | | | | | | | | | | | | | | |
| | | Interest
rate | | | Maturity
date | | | Principal | | | Value | |
|
| Non-Agency Mortgage-Backed Securities (continued) | |
Verus Securitization Trust Series 2019-3 Class A1 144A ±± | | | 2.69 | % | | | 11-25-2059 | | | $ | 2,525,534 | | | $ | 2,591,437 | |
Verus Securitization Trust Series 2019-3 Class A1 144A | | | 2.78 | | | | 7-25-2059 | | | | 7,218,128 | | | | 7,378,425 | |
Verus Securitization Trust Series 2019-4 Class A1 144A | | | 2.64 | | | | 11-25-2059 | | | | 9,768,571 | | | | 9,989,730 | |
Verus Securitization Trust Series 2020-1 Class A1 144A | | | 2.42 | | | | 1-25-2060 | | | | 2,346,576 | | | | 2,390,166 | |
Verus Securitization Trust Series 2020-2 Class A1 144A ±± | | | 2.23 | | | | 5-25-2060 | | | | 8,674,251 | | | | 8,758,709 | |
Verus Securitization Trust Series 2020-5 Class A1 144A | | | 1.22 | | | | 5-25-2065 | | | | 1,749,724 | | | | 1,751,309 | |
Visio Trust Series 2019-1 Class A1 144A ±± | | | 3.57 | | | | 6-25-2054 | | | | 2,120,637 | | | | 2,149,054 | |
Visio Trust Series 2020-1R Class A1 144A%%(a) | | | 1.31 | | | | 11-25-2055 | | | | 4,520,000 | | | | 4,519,989 | |
| |
Total Non-Agency Mortgage-Backed Securities (Cost $200,297,244) | | | | 205,040,404 | |
| | | | | | | | | | | | | | | | |
|
| U.S. Treasury Securities: 27.33% | |
U.S. Treasury Bond | | | 0.25 | | | | 8-31-2025 | | | | 24,908,000 | | | | 24,797,082 | |
U.S. Treasury Bond | | | 1.13 | | | | 5-15-2040 | | | | 134,293,000 | | | | 129,026,196 | |
U.S. Treasury Bond | | | 1.13 | | | | 8-15-2040 | | | | 71,466,000 | | | | 68,484,528 | |
U.S. Treasury Bond | | | 1.25 | | | | 5-15-2050 | | | | 22,057,000 | | | | 20,309,672 | |
U.S. Treasury Bond | | | 1.38 | | | | 11-15-2040 | | | | 35,274,000 | | | | 35,285,023 | |
U.S. Treasury Bond | | | 1.38 | | | | 8-15-2050 | | | �� | 89,210,000 | | | | 84,763,439 | |
U.S. Treasury Bond | | | 1.63 | | | | 11-15-2050 | | | | 29,373,000 | | | | 29,680,499 | |
U.S. Treasury Bond | | | 2.50 | | | | 2-15-2045 | | | | 15,226,000 | | | | 18,380,042 | |
U.S. Treasury Bond | | | 2.88 | | | | 5-15-2043 | | | | 52,278,000 | | | | 66,921,966 | |
U.S. Treasury Note | | | 0.13 | | | | 5-31-2022 | | | | 33,602,000 | | | | 33,598,062 | |
U.S. Treasury Note | | | 0.13 | | | | 6-30-2022 | | | | 22,213,000 | | | | 22,209,529 | |
U.S. Treasury Note | | | 0.13 | | | | 7-31-2022 | | | | 5,663,000 | | | | 5,661,230 | |
U.S. Treasury Note | | | 0.13 | | | | 8-31-2022 | | | | 99,251,000 | | | | 99,216,107 | |
U.S. Treasury Note ## | | | 0.13 | | | | 9-30-2022 | | | | 104,950,000 | | | | 104,921,302 | |
U.S. Treasury Note | | | 0.13 | | | | 10-31-2022 | | | | 41,390,000 | | | | 41,373,832 | |
U.S. Treasury Note | | | 0.13 | | | | 11-30-2022 | | | | 31,203,000 | | | | 31,190,811 | |
U.S. Treasury Note | | | 0.13 | | | | 9-15-2023 | | | | 116,043,000 | | | | 115,852,618 | |
U.S. Treasury Note | | | 0.13 | | | | 10-15-2023 | | | | 82,284,000 | | | | 82,136,146 | |
U.S. Treasury Note | | | 0.25 | | | | 6-15-2023 | | | | 18,871,000 | | | | 18,907,857 | |
U.S. Treasury Note ## | | | 0.25 | | | | 11-15-2023 | | | | 119,381,000 | | | | 119,595,513 | |
U.S. Treasury Note | | | 0.25 | | | | 9-30-2025 | | | | 33,600,000 | | | | 33,434,625 | |
U.S. Treasury Note « | | | 0.25 | | | | 10-31-2025 | | | | 60,663,000 | | | | 60,345,467 | |
U.S. Treasury Note | | | 0.38 | | | | 11-30-2025 | | | | 59,272,000 | | | | 59,304,415 | |
U.S. Treasury Note | | | 0.50 | | | | 10-31-2027 | | | | 39,860,000 | | | | 39,548,594 | |
U.S. Treasury Note | | | 0.88 | | | | 11-15-2030 | | | | 60,185,000 | | | | 60,326,059 | |
U.S. Treasury Note ## | | | 1.38 | | | | 1-31-2021 | | | | 93,393,000 | | | | 93,584,046 | |
U.S. Treasury Note ## | | | 1.38 | | | | 5-31-2021 | | | | 107,586,000 | | | | 108,275,223 | |
U.S. Treasury Note | | | 2.13 | | | | 5-15-2022 | | | | 3,363,000 | | | | 3,459,818 | |
U.S. Treasury Note | | | 2.25 | | | | 4-30-2021 | | | | 28,262,000 | | | | 28,514,812 | |
U.S. Treasury Note | | | 3.13 | | | | 5-15-2021 | | | | 26,340,000 | | | | 26,704,233 | |
| |
Total U.S. Treasury Securities (Cost $1,667,179,959) | | | | 1,665,808,746 | |
| | | | | | | | | | | | | | | | |
|
Yankee Corporate Bonds and Notes: 7.00% | |
|
Communication Services: 0.07% | |
|
| Wireless Telecommunication Services: 0.07% | |
Vodafone Group plc | | | 4.25 | | | | 9-17-2050 | | | | 3,540,000 | | | | 4,332,239 | |
| | | | | | | | | | | | | | | | |
|
Consumer Discretionary: 0.16% | |
|
| Automobiles: 0.16% | |
Nissan Motor Company 144A | | | 3.52 | | | | 9-17-2025 | | | | 1,806,000 | | | | 1,885,431 | |
Nissan Motor Company 144A | | | 4.35 | | | | 9-17-2027 | | | | 4,887,000 | | | | 5,239,771 | |
Nissan Motor Company 144A | | | 4.81 | | | | 9-17-2030 | | | | 2,244,000 | | | | 2,477,513 | |
| | | | |
| | | | | | | | | | | | | | | 9,602,715 | |
| | | | | | | | | | | | | | | | |
The accompanying notes are an integral part of these financial statements.
42 | Wells Fargo Core Bond Portfolio
Portfolio of investments—November 30, 2020 (unaudited)
| | | | | | | | | | | | | | | | |
| | | Interest
rate | | | Maturity
date | | | Principal | | | Value | |
Consumer Staples: 0.15% | |
|
| Beverages: 0.15% | |
Bacardi Limited 144A | | | 4.70 | % | | | 5-15-2028 | | | $ | 3,449,000 | | | $ | 3,989,799 | |
Bacardi Limited 144A | | | 5.15 | | | | 5-15-2038 | | | | 1,632,000 | | | | 2,051,445 | |
Bacardi Limited 144A | | | 5.30 | | | | 5-15-2048 | | | | 2,450,000 | | | | 3,300,374 | |
| | | | |
| | | | | | | | | | | | | | | 9,341,618 | |
| | | | | | | | | | | | | | | | |
|
Energy: 1.06% | |
|
| Oil, Gas & Consumable Fuels: 1.06% | |
Aker BP ASA 144A | | | 2.88 | | | | 1-15-2026 | | | | 5,234,000 | | | | 5,241,893 | |
Aker BP ASA 144A | | | 4.00 | | | | 1-15-2031 | | | | 2,699,000 | | | | 2,724,183 | |
Ecopetrol SA | | | 5.88 | | | | 5-28-2045 | | | | 2,196,000 | | | | 2,610,495 | |
Enbridge Incorporated | | | 2.50 | | | | 1-15-2025 | | | | 8,829,000 | | | | 9,301,674 | |
Enbridge Incorporated | | | 3.13 | | | | 11-15-2029 | | | | 4,038,000 | | | | 4,382,544 | |
Equinor ASA | | | 1.75 | | | | 1-22-2026 | | | | 2,343,000 | | | | 2,449,442 | |
Equinor ASA | | | 3.25 | | | | 11-18-2049 | | | | 1,370,000 | | | | 1,524,745 | |
FEL Energy Company 144A%% | | | 5.75 | | | | 12-1-2040 | | | | 1,937,000 | | | | 2,037,724 | |
Galaxy Pipeline Assets Company 144A | | | 1.75 | | | | 9-30-2027 | | | | 5,844,000 | | | | 5,876,563 | |
Galaxy Pipeline Assets Company 144A | | | 2.63 | | | | 3-31-2036 | | | | 2,755,000 | | | | 2,848,321 | |
Oleoducto Central SA 144A | | | 4.00 | | | | 7-14-2027 | | | | 1,951,000 | | | | 2,107,080 | |
Petroleos Mexicanos Company | | | 2.38 | | | | 4-15-2025 | | | | 1,633,050 | | | | 1,703,336 | |
Petroleos Mexicanos Company | | | 2.46 | | | | 12-15-2025 | | | | 4,435,750 | | | | 4,628,550 | |
Saudi Arabian Oil Company 144A | | | 1.63 | | | | 11-24-2025 | | | | 2,967,000 | | | | 3,020,436 | |
Saudi Arabian Oil Company 144A | | | 2.25 | | | | 11-24-2030 | | | | 2,967,000 | | | | 3,005,637 | |
Saudi Arabian Oil Company 144A | | | 3.25 | | | | 11-24-2050 | | | | 660,000 | | | | 661,373 | |
Suncor Energy Incorporated | | | 3.10 | | | | 5-15-2025 | | | | 3,958,000 | | | | 4,299,906 | |
Tengizchevroil LLP 144A | | | 2.63 | | | | 8-15-2025 | | | | 3,111,000 | | | | 3,217,552 | |
Total Capital International SA | | | 3.13 | | | | 5-29-2050 | | | | 2,916,000 | | | | 3,191,953 | |
| | | | |
| | | | | | | | | | | | | | | 64,833,407 | |
| | | | | | | | | | | | | | | | |
|
Financials: 4.61% | |
|
| Banks: 2.59% | |
Asian Development Bank | | | 0.63 | | | | 4-7-2022 | | | | 7,177,000 | | | | 7,219,294 | |
Banco Bilbao Vizcaya Argentaria SA | | | 1.13 | | | | 9-18-2025 | | | | 4,600,000 | | | | 4,615,437 | |
Banco Santander SA | | | 2.75 | | | | 5-28-2025 | | | | 3,600,000 | | | | 3,831,827 | |
Banco Santander SA %% | | | 2.75 | | | | 12-3-2030 | | | | 3,000,000 | | | | 3,000,000 | |
Banco Santander SA | | | 3.49 | | | | 5-28-2030 | | | | 1,800,000 | | | | 2,005,670 | |
Barclays plc (3 Month LIBOR +3.05%) ± | | | 5.09 | | | | 6-20-2030 | | | | 6,684,000 | | | | 7,876,944 | |
Danske Bank A/S (1 Year Treasury Constant Maturity +1.03%) 144A± | | | 1.17 | | | | 12-8-2023 | | | | 7,825,000 | | | | 7,854,600 | |
Danske Bank A/S (3 Month LIBOR +1.25%) 144A± | | | 3.00 | | | | 9-20-2022 | | | | 9,081,000 | | | | 9,235,466 | |
Danske Bank A/S (3 Month LIBOR +1.59%) 144A± | | | 3.24 | | | | 12-20-2025 | | | | 8,694,000 | | | | 9,288,976 | |
Danske Bank A/S 144A | | | 5.00 | | | | 1-12-2022 | | | | 4,619,000 | | | | 4,835,112 | |
HSBC Holdings plc (U.S. SOFR +1.29%) ± | | | 1.59 | | | | 5-24-2027 | | | | 10,944,000 | | | | 11,038,179 | |
HSBC Holdings plc (U.S. SOFR +1.54%) ± | | | 1.65 | | | | 4-18-2026 | | | | 8,489,000 | | | | 8,608,835 | |
HSBC Holdings plc (U.S. SOFR +1.73%) ± | | | 2.01 | | | | 9-22-2028 | | | | 9,614,000 | | | | 9,768,954 | |
Inter-American Development Bank | | | 0.88 | | | | 4-3-2025 | | | | 7,363,000 | | | | 7,501,119 | |
Landwirtschaftliche Rentenbank | | | 0.50 | | | | 5-27-2025 | | | | 11,429,000 | | | | 11,451,709 | |
National Australia Bank 144A | | | 2.33 | | | | 8-21-2030 | | | | 5,461,000 | | | | 5,501,929 | |
Perrigo Finance plc | | | 4.90 | | | | 12-15-2044 | | | | 1,656,000 | | | | 1,861,444 | |
Perrigo Finance Unlimited Company | | | 3.15 | | | | 6-15-2030 | | | | 3,125,000 | | | | 3,308,532 | |
Royal Bank Scotland Group plc (1 Year Treasury Constant Maturity +2.15%) ± | | | 2.36 | | | | 5-22-2024 | | | | 1,639,000 | | | | 1,698,600 | |
Royal Bank Scotland Group plc (1 Year Treasury Constant Maturity +2.55%) ± | | | 3.07 | | | | 5-22-2028 | | | | 2,969,000 | | | | 3,205,559 | |
Royal Bank Scotland Group plc (5 Year Treasury Constant Maturity +2.10%) ± | | | 3.75 | | | | 11-1-2029 | | | | 2,937,000 | | | | 3,109,795 | |
The accompanying notes are an integral part of these financial statements.
Wells Fargo Core Bond Portfolio | 43
Portfolio of investments—November 30, 2020 (unaudited)
| | | | | | | | | | | | | | | | |
| | | Interest
rate | | | Maturity
date | | | Principal | | | Value | |
|
| Banks (continued) | |
Santander UK Group Holdings plc (1 Year Treasury Constant Maturity +1.25%) ± | | | 1.53 | % | | | 8-21-2026 | | | $ | 12,378,000 | | | $ | 12,470,217 | |
Societe Generale (5 Year Treasury Constant Maturity +3.00%) 144A ± | | | 3.65 | | | | 7-8-2035 | | | | 2,532,000 | | | | 2,658,692 | |
Swedish Export Credit Corporation | | | 0.75 | | | | 4-6-2023 | | | | 9,883,000 | | | | 9,984,032 | |
Westpac Banking Corporation (5 Year Treasury Constant Maturity +1.75%) ± | | | 2.67 | | | | 11-15-2035 | | | | 4,764,000 | | | | 4,923,022 | |
Westpac Banking Corporation | | | 2.96 | | | | 11-16-2040 | | | | 1,151,000 | | | | 1,238,072 | |
| | | | |
| | | | | | | | | | | | | | | 158,092,016 | |
| | | | | | | | | | | | | | | | |
|
| Capital Markets: 0.65% | |
Credit Suisse Group Funding Limited (U.S. SOFR +2.04%) 144A ± | | | 2.19 | | | | 6-5-2026 | | | | 7,231,000 | | | | 7,539,821 | |
Credit Suisse Group Funding Limited (U.S. SOFR +1.56%) 144A ± | | | 2.59 | | | | 9-11-2025 | | | | 1,367,000 | | | | 1,442,223 | |
Credit Suisse Group Funding Limited (3 Month LIBOR +1.20%) 144A ± | | | 3.00 | | | | 12-14-2023 | | | | 3,476,000 | | | | 3,632,942 | |
Credit Suisse Group Funding Limited | | | 3.80 | | | | 6-9-2023 | | | | 3,131,000 | | | | 3,369,679 | |
Credit Suisse Group Funding Limited (U.S. SOFR +3.73%) 144A ± | | | 4.19 | | | | 4-1-2031 | | | | 8,443,000 | | | | 9,949,633 | |
Nomura Holdings Incorporated | | | 2.65 | | | | 1-16-2025 | | | | 3,450,000 | | | | 3,663,223 | |
Nomura Holdings Incorporated | | | 2.68 | | | | 7-16-2030 | | | | 2,862,000 | | | | 3,023,004 | |
Nomura Holdings Incorporated | | | 3.10 | | | | 1-16-2030 | | | | 6,118,000 | | | | 6,664,931 | |
| | | | |
| | | | | | | | | | | | | | | 39,285,456 | |
| | | | | | | | | | | | | | | | |
|
| Diversified Financial Services: 1.24% | |
AerCap Ireland Capital DAC | | | 3.15 | | | | 2-15-2024 | | | | 3,940,000 | | | | 4,055,681 | |
AerCap Ireland Capital DAC | | | 3.50 | | | | 5-26-2022 | | | | 1,794,000 | | | | 1,845,110 | |
AerCap Ireland Capital DAC | | | 3.95 | | | | 2-1-2022 | | | | 992,000 | | | | 1,018,033 | |
AerCap Ireland Capital DAC | | | 4.63 | | | | 7-1-2022 | | | | 838,000 | | | | 879,248 | |
AerCap Ireland Capital DAC | | | 4.88 | | | | 1-16-2024 | | | | 1,868,000 | | | | 2,011,903 | |
AerCap Ireland Capital DAC | | | 6.50 | | | | 7-15-2025 | | | | 3,843,000 | | | | 4,441,882 | |
BAT International Finance plc | | | 1.67 | | | | 3-25-2026 | | | | 10,411,000 | | | | 10,596,854 | |
Brookfield Finance Incorporated | | | 4.35 | | | | 4-15-2030 | | | | 4,883,000 | | | | 5,925,045 | |
DH Europe Finance II | | | 2.05 | | | | 11-15-2022 | | | | 2,978,000 | | | | 3,075,717 | |
DH Europe Finance II | | | 2.20 | | | | 11-15-2024 | | | | 5,104,000 | | | | 5,412,496 | |
DH Europe Finance II | | | 2.60 | | | | 11-15-2029 | | | | 5,520,000 | | | | 6,082,493 | |
DH Europe Finance II | | | 3.40 | | | | 11-15-2049 | | | | 39,000 | | | | 46,451 | |
Element Fleet Management Corporation 144A | | | 3.85 | | | | 6-15-2025 | | | | 3,823,000 | | | | 4,084,821 | |
GE Capital International Funding Company 144A | | | 3.45 | | | | 5-15-2025 | | | | 2,250,000 | | | | 2,450,109 | |
GE Capital International Funding Company 144A | | | 4.40 | | | | 5-15-2030 | | | | 4,527,000 | | | | 5,212,703 | |
GE Capital International Funding Company | | | 4.42 | | | | 11-15-2035 | | | | 6,562,000 | | | | 7,568,407 | |
Trust Fibrauno 144A | | | 4.87 | | | | 1-15-2030 | | | | 2,649,000 | | | | 2,925,821 | |
Trust Fibrauno 144A | | | 6.39 | | | | 1-15-2050 | | | | 1,663,000 | | | | 1,835,952 | |
UBS Group AG (1 Year Treasury Constant Maturity +1.08%) 144A ± | | | 1.36 | | | | 1-30-2027 | | | | 6,030,000 | | | | 6,091,499 | |
| | | | |
| | | | | | | | | | | | | | | 75,560,225 | |
| | | | | | | | | | | | | | | | |
|
| Insurance: 0.13% | |
Arch Capital Group Limited | | | 3.64 | | | | 6-30-2050 | | | | 2,476,000 | | | | 2,921,393 | |
Athene Holding Limited | | | 3.50 | | | | 1-15-2031 | | | | 1,405,000 | | | | 1,485,339 | |
Athene Holding Limited | | | 6.15 | | | | 4-3-2030 | | | | 2,927,000 | | | | 3,646,805 | |
| | | | |
| | | | | | | | | | | | | | | 8,053,537 | |
| | | | | | | | | | | | | | | | |
|
Health Care: 0.39% | |
| | | | |
| Pharmaceuticals: 0.39% | | | | | | | | | | | | |
Astrazeneca plc | | | 0.70 | | | | 4-8-2026 | | | | 3,861,000 | | | | 3,845,128 | |
Shire plc ADR | | | 2.88 | | | | 9-23-2023 | | | | 3,878,000 | | | | 4,115,838 | |
Takeda Pharmaceutical | | | 2.05 | | | | 3-31-2030 | | | | 7,069,000 | | | | 7,219,757 | |
Takeda Pharmaceutical | | | 3.18 | | | | 7-9-2050 | | | | 4,327,000 | | | | 4,624,482 | |
The accompanying notes are an integral part of these financial statements.
44 | Wells Fargo Core Bond Portfolio
Portfolio of investments—November 30, 2020 (unaudited)
| | | | | | | | | | | | | | | | |
| | | Interest
rate | | | Maturity
date | | | Principal | | | Value | |
| | | | |
| Pharmaceuticals (continued) | | | | | | | | | | | | |
Takeda Pharmaceutical | | | 4.40 | % | | | 11-26-2023 | | | $ | 3,391,000 | | | $ | 3,764,003 | |
| | | | |
| | | | | | | | | | | | | | | 23,569,208 | |
| | | | | | | | | | | | | | | | |
|
Industrials: 0.10% | |
|
| Construction & Engineering: 0.04% | |
Hutama Karya Persero PT 144A | | | 3.75 | | | | 5-11-2030 | | | | 2,193,000 | | | | 2,436,182 | |
| | | | | | | | | | | | | | | | |
|
Transportation Infrastructure: 0.06% | |
Adani Ports & Special Company 144A | | | 4.20 | | | | 8-4-2027 | | | | 3,484,000 | | | | 3,709,694 | |
| | | | | | | | | | | | | | | | |
|
Information Technology: 0.27% | |
|
| Semiconductors & Semiconductor Equipment: 0.27% | |
NXP BV 144A | | | 3.15 | | | | 5-1-2027 | | | | 3,217,000 | | | | 3,510,174 | |
NXP BV 144A | | | 3.88 | | | | 6-18-2026 | | | | 7,599,000 | | | | 8,610,829 | |
NXP BV 144A | | | 4.30 | | | | 6-18-2029 | | | | 2,498,000 | | | | 2,930,401 | |
TSMC Global Limited Company 144A | | | 1.38 | | | | 9-28-2030 | | | | 1,227,000 | | | | 1,201,769 | |
| | | | |
| | | | | | | | | | | | | | | 16,253,173 | |
| | | | | | | | | | | | | | | | |
|
Materials: 0.14% | |
|
| Chemicals: 0.07% | |
Nutrien Limited | | | 5.00 | | | | 4-1-2049 | | | | 2,885,000 | | | | 3,992,597 | |
| | | | | | | | | | | | | | | | |
|
Metals & Mining: 0.07% | |
Teck Resources Limited | | | 5.20 | | | | 3-1-2042 | | | | 1,462,000 | | | | 1,629,663 | |
Teck Resources Limited | | | 6.25 | | | | 7-15-2041 | | | | 2,339,000 | | | | 2,908,035 | |
| | | | |
| | | | | | | | | | | | | | | 4,537,698 | |
| | | | | | | | | | | | | | | | |
|
Real Estate: 0.05% | |
|
| Real Estate Management & Development: 0.05% | |
Scentre Group Trust 144A | | | 3.63 | | | | 1-28-2026 | | | | 2,951,000 | | | | 3,201,923 | |
| | | | | | | | | | | | | | | | |
| |
Total Yankee Corporate Bonds and Notes (Cost $406,679,715) | | | | 426,801,688 | |
| | | | | | | | | | | | | | | | |
|
| Yankee Government Bonds: 1.28% | |
Abu Dhabi Government International 144A | | | 2.50 | | | | 4-16-2025 | | | | 10,650,000 | | | | 11,367,370 | |
Bermuda 144A | | | 3.38 | | | | 8-20-2050 | | | | 2,234,000 | | | | 2,368,040 | |
Japan Bank for International Cooperation | | | 1.75 | | | | 10-17-2024 | | | | 5,082,000 | | | | 5,317,976 | |
Republic of Indonesia | | | 4.45 | | | | 4-15-2070 | | | | 2,939,000 | | | | 3,629,769 | |
Republic of Paraguay 144A | | | 4.95 | | | | 4-28-2031 | | | | 2,400,000 | | | | 2,844,024 | |
Republic of Paraguay 144A | | | 5.40 | | | | 3-30-2050 | | | | 2,956,000 | | | | 3,687,610 | |
Republic of Peru %% | | | 1.86 | | | | 12-1-2032 | | | | 2,866,000 | | | | 2,843,072 | |
Republic of Peru | | | 2.39 | | | | 1-23-2026 | | | | 5,029,000 | | | | 5,293,023 | |
Republic of Peru %% | | | 2.78 | | | | 12-1-2060 | | | | 1,579,000 | | | | 1,559,263 | |
Republic of Peru %% | | | 3.23 | | | | 7-28-2121 | | | | 765,000 | | | | 755,438 | |
State of Israel | | | 3.38 | | | | 1-15-2050 | | | | 2,126,000 | | | | 2,347,189 | |
State of Israel | | | 4.50 | | | | 4-3-2120 | | | | 728,000 | | | | 963,326 | |
State of Qatar 144A | | | 3.40 | | | | 4-16-2025 | | | | 205,000 | | | | 225,500 | |
United Mexican States | | | 2.66 | | | | 5-24-2031 | | | | 11,292,000 | | | | 11,293,807 | |
United Mexican States | | | 3.77 | | | | 5-24-2061 | | | | 1,725,000 | | | | 1,720,688 | |
United Mexican States | | | 3.90 | | | | 4-27-2025 | | | | 4,768,000 | | | | 5,280,560 | |
United Mexican States | | | 4.35 | | | | 1-15-2047 | | | | 1,753,000 | | | | 1,938,836 | |
United Mexican States | | | 4.50 | | | | 4-22-2029 | | | | 8,500,000 | | | | 9,813,250 | |
United Mexican States | | | 4.60 | | | | 2-10-2048 | | | | 1,782,000 | | | | 2,020,806 | |
United Mexican States | | | 4.75 | | | | 3-8-2044 | | | | 2,478,000 | | | | 2,852,798 | |
| |
Total Yankee Government Bonds (Cost $72,047,240) | | | | 78,122,345 | |
| | | | | | | | | | | | | | | | |
The accompanying notes are an integral part of these financial statements.
Wells Fargo Core Bond Portfolio | 45
Portfolio of investments—November 30, 2020 (unaudited)
| | | | | | | | | | | | | | | | |
| | | Yield | | | �� | | | Principal | | | Value | |
| Short-Term Investments: 3.68% | |
|
| Investment Companies: 3.68% | |
Securities Lending Cash Investments LLC (l)(r)(u) | | | 0.12 | % | | | | | | $ | 54,037,500 | | | $ | 54,037,500 | |
Wells Fargo Government Money Market Fund Select Class (l)(u)## | | | 0.02 | | | | | | | | 170,055,243 | | | | 170,055,243 | |
| |
Total Short-Term Investments (Cost $224,092,743) | | | | 224,092,743 | |
| | | | | | | | | | | | | | | | |
| | | | | | | | |
| Total investments in securities (Cost $6,493,652,297) | | | 109.72 | % | | | 6,688,333,884 | |
| | |
Other assets and liabilities, net | | | (9.72 | ) | | | (592,746,887 | ) |
| | | | | | | | |
| Total net assets | | | 100.00 | % | | $ | 6,095,586,997 | |
| | | | | | | | |
| ± | Variable rate investment. The rate shown is the rate in effect at period end. |
| %% | The security is purchased on a when-issued basis. |
| ±± | The coupon of the security is adjusted based on the principal and interest payments received from the underlying pool of mortgages as well as the credit quality and the actual prepayment speed of the underlying mortgages. |
| 144A | The security may be resold in transactions exempt from registration, normally to qualified institutional buyers, pursuant to Rule 144A under the Securities Act of 1933. |
| « | All or a portion of this security is on loan. |
| (a) | The security is fair valued in accordance with procedures approved by the Board of Trustees. |
| ## | All or a portion of this security is segregated for when-issued securities. |
| (l) | The issuer of the security is an affiliated person of the Portfolio as defined in the Investment Company Act of 1940. |
| (r) | The investment is a non-registered investment company purchased with cash collateral received from securities on loan. |
| (u) | The rate represents the 7-day annualized yield at period end. |
Abbreviations:
| ADR | American depositary receipt |
| FHLMC | Federal Home Loan Mortgage Corporation |
| FNMA | Federal National Mortgage Association |
| GNMA | Government National Mortgage Association |
| LIBOR | London Interbank Offered Rate |
| REIT | Real estate investment trust |
| SOFR | Secured Overnight Financing Rate |
Investments in Affiliates
An affiliated investment is an investment in which the Portfolio owns at least 5% of the outstanding voting shares of the issuer or as a result of other relationships, such as the Portfolio and the issuer having the same adviser or investment manager. Transactions with issuers that were either affiliated persons of the Portfolio at the beginning of the period or the end of the period were as follows:
| | | | | | | | | | | | | | | | | | | | | | | | | | | | | | | | | | | | |
| | | Value,
beginning of
period | | | Purchases | | | Sales
proceeds | | | Net
realized
gains
(losses) | | | Net
change in
unrealized
gains
(losses) | | | Value,
end of period | | | % of
net
assets | | | Shares,
end of
period | | | Income
from
affiliated
securities | |
| | | | | | | | |
| Short-Term Investments | | | | | | | | | | | | | | | | | | | | | | | | | |
Investment Companies | | | | | | | | | | | | | | | | | | | | | | | | | | | | | | | | | |
Securities Lending Cash Investments LLC | | $ | 0 | | | $ | 54,097,500 | | | $ | (60,000 | ) | | $ | 0 | | | $ | 0 | | | $ | 54,037,500 | | | | | | | | 54,037,500 | | | $ | 534 | # |
Wells Fargo Government Money Market Fund Select Class | | | 315,907,475 | | | | 2,475,977,232 | | | | (2,621,829,464 | ) | | | 0 | | | | 0 | | | | 170,055,243 | | | | | | | | 170,055,243 | | | | 121,381 | |
| | | | | | | | | | | | | | | | | | | | | | | | | | | | | | | | | | | | |
| | | | | | | | | | | | | | $ | 0 | | | $ | 0 | | | $ | 224,092,743 | | | | 3.68 | % | | | | | | $ | 121,915 | |
| | | | | | | | | | | | | | | | | | | | | | | | | | | | | | | | | | | | |
| # | Amount shown represents income before fees and rebates. |
The accompanying notes are an integral part of these financial statements.
46 | Wells Fargo Core Bond Portfolio
Statement of assets and liabilities—November 30, 2020 (unaudited)
| | | | |
| | | | |
| |
Assets | | | | |
Investments in unaffiliated securities (including $52,976,648 of securities loaned), at value (cost $6,269,559,554) | | $ | 6,464,241,141 | |
Investments in affiliated securities, at value (cost $224,092,743) | | | 224,092,743 | |
Receivable for investments sold | | | 826,853,596 | |
Principal paydown receivable | | | 673,358 | |
Receivable for interest | | | 20,194,640 | |
Receivable for securities lending income, net | | | 915 | |
Prepaid expenses and other assets | | | 271,927 | |
| | | | |
Total assets | | | 7,536,328,320 | |
| | | | |
| |
Liabilities | | | | |
Payable upon receipt of securities loaned | | | 53,869,375 | |
Payable for investments purchased | | | 828,498,144 | |
Payable for when-issued transactions | | | 553,637,122 | |
Cash collateral due to broker | | | 3,082,539 | |
Overdraft due to custodian bank | | | 2,856 | |
Advisory fee payable | | | 1,651,287 | |
| | | | |
Total liabilities | | | 1,440,741,323 | |
| | | | |
Total net assets | | $ | 6,095,586,997 | |
| | | | |
The accompanying notes are an integral part of these financial statements.
Wells Fargo Core Bond Portfolio | 47
Statement of operations—six months ended November 30, 2020 (unaudited)
| | | | |
| | | | |
| |
Investment income | | | | |
Interest (net of foreign withholding taxes of $3,863) | | $ | 53,928,274 | |
Income from affiliated securities | | | 123,544 | |
| | | | |
Total investment income | | | 54,051,818 | |
| | | | |
| |
Expenses | | | | |
Advisory fee | | | 10,267,456 | |
Custody and accounting fees | | | 132,138 | |
Professional fees | | | 48,147 | |
Shareholder report expenses | | | 3,829 | |
Trustees’ fees and expenses | | | 9,576 | |
Other fees and expenses | | | 44,708 | |
| | | | |
Net expenses | | | 10,505,854 | |
| | | | |
Net investment income | | | 43,545,964 | |
| | | | |
| |
Realized and unrealized gains (losses) on investments | | | | |
Net realized gains on investments | | | 119,819,612 | |
Net change in unrealized gains (losses) on investments | | | 5,227,398 | |
| | | | |
Net realized and unrealized gains (losses) on investments | | | 125,047,010 | |
| | | | |
Net increase in net assets resulting from operations | | $ | 168,592,974 | |
| | | | |
The accompanying notes are an integral part of these financial statements.
48 | Wells Fargo Core Bond Portfolio
Statement of changes in net assets
| | | | | | | | |
| | | Six months ended
November 30, 2020
(unaudited) | | | Year ended
May 31, 2020 | |
|
Operations | |
Net investment income | | $ | 43,545,964 | | | $ | 132,899,852 | |
Net realized gains on investments | | | 119,819,612 | | | | 327,904,415 | |
Net change in unrealized gains (losses) on investments | | | 5,227,398 | | | | 58,392,982 | |
| | | | |
Net increase in net assets resulting from operations | | | 168,592,974 | | | | 519,197,249 | |
| | | | |
| | |
Capital transactions | | | | | | | | |
Transactions in investors’ beneficial interests | |
Contributions | | | 684,363,108 | | | | 2,488,553,741 | |
Withdrawals | | | (519,224,929 | ) | | | (3,071,640,078 | ) |
| | | | |
Net increase (decrease) in net assets resulting from capital transactions | | | 165,138,179 | | | | (583,086,337 | ) |
| | | | |
Total increase (decrease) in net assets | | | 333,731,153 | | | | (63,889,088 | ) |
| | | | |
| | |
Net assets | | | | | | | | |
Beginning of period | | | 5,761,855,844 | | | | 5,825,744,932 | |
| | | | |
End of period | | $ | 6,095,586,997 | | | $ | 5,761,855,844 | |
| | | | |
The accompanying notes are an integral part of these financial statements.
Wells Fargo Core Bond Portfolio | 49
Financial highlights
| | | | | | | | | | | | | | | | | | | | | | | | |
| | | Six months ended
November 30, 2020
(unaudited) | | | Year ended May 31 | |
| | | 2020 | | | 2019 | | | 2018 | | | 2017 | | | 2016 | |
Total return1 | | | 2.85 | % | | | 9.49 | % | | | 6.30 | % | | | (0.53 | )% | | | 1.89 | % | | | 2.78 | % |
Ratios to average net assets (annualized) | | | | | | | | | | | | | | | | | | | | | | | | |
Gross expenses | | | 0.35 | % | | | 0.35 | % | | | 0.35 | % | | | 0.35 | % | | | 0.35 | % | | | 0.36 | % |
Net expenses | | | 0.35 | % | | | 0.35 | % | | | 0.35 | % | | | 0.35 | % | | | 0.35 | % | | | 0.35 | % |
Net investment income | | | 1.44 | % | | | 2.28 | % | | | 2.93 | % | | | 2.23 | % | | | 1.87 | % | | | 1.86 | % |
Supplemental data | | | | | | | | | | | | | | | | | | | | | | | | |
Portfolio turnover rate | | | 213 | % | | | 603 | % | | | 577 | % | | | 542 | % | | | 614 | % | | | 667 | % |
| 1 | Returns for periods of less than one year are not annualized. |
The accompanying notes are an integral part of these financial statements.
50 | Wells Fargo Core Bond Portfolio
Notes to financial statements (unaudited)
1. ORGANIZATION
Wells Fargo Master Trust (the “Trust”), a Delaware statutory trust organized on March 10, 1999, is an open-end management investment company registered under the Investment Company Act of 1940, as amended (the “1940 Act”). As an investment company, the Trust follows the accounting and reporting guidance in Financial Accounting Standards Board (“FASB”) Accounting Standards Codification Topic 946, Financial Services – Investment Companies. These financial statements report on the Wells Fargo Core Bond Portfolio (the “Portfolio”) which is a diversified series of the Trust.
2. SIGNIFICANT ACCOUNTING POLICIES
The following significant accounting policies, which are consistently followed in the preparation of the financial statements of the Portfolio, are in conformity with U.S. generally accepted accounting principles which require management to make estimates and assumptions that affect the reported amounts of assets and liabilities, disclosure of contingent assets and liabilities at the date of the financial statements, and the reported amounts of revenues and expenses during the reporting period. Actual results could differ from those estimates.
Securities valuation
All investments are valued each business day as of the close of regular trading on the New York Stock Exchange (generally 4 p.m. Eastern Time), although the Portfolio may deviate from this calculation time under unusual or unexpected circumstances.
Debt securities are valued at the evaluated bid price provided by an independent pricing service (e.g. taking into account various factors, including yields, maturities, or credit ratings) or, if a reliable price is not available, the quoted bid price from an independent broker-dealer.
The values of securities denominated in foreign currencies are translated into U.S. dollars at rates provided by an independent foreign currency pricing source at a time each business day specified by the Wells Fargo Asset Management Pricing Committee at Wells Fargo Funds Management, LLC (“Funds Management”).
Investments in registered open-end investment companies are valued at net asset value. Interests in non-registered investment companies that are redeemable at net asset value are fair valued normally at net asset value.
Investments which are not valued using any of the methods discussed above are valued at their fair value, as determined in good faith by the Board of Trustees of the Portfolio. The Board of Trustees has established a Valuation Committee comprised of the Trustees and has delegated to it the authority to take any actions regarding the valuation of portfolio securities that the Valuation Committee deems necessary or appropriate, including determining the fair value of portfolio securities, unless the determination has been delegated to the Wells Fargo Asset Management Pricing Committee. The Board of Trustees retains the authority to make or ratify any valuation decisions or approve any changes to the Valuation Procedures as it deems appropriate. On a quarterly basis, the Board of Trustees receives reports on any valuation actions taken by the Valuation Committee or the Wells Fargo Asset Management Pricing Committee which may include items for ratification.
Foreign currency translation
The accounting records of the Portfolio are maintained in U.S. dollars. The values of other assets and liabilities denominated in foreign currencies are translated into U.S. dollars at rates provided by an independent foreign currency pricing source at a time each business day specified by the Wells Fargo Asset Management Pricing Committee. Purchases and sales of securities, and income and expenses are converted at the rate of exchange on the respective dates of such transactions. Net realized foreign exchange gains or losses arise from sales of foreign currencies, currency gains or losses realized between the trade and settlement dates on securities transactions, and the difference between the amounts of dividends, interest and foreign withholding taxes recorded and the U.S. dollar equivalent of the amounts actually paid or received. Net unrealized foreign exchange gains and losses arise from changes in the fair value of assets and liabilities other than investments in securities resulting from changes in exchange rates. The changes in net assets arising from changes in exchange rates of securities and the changes in net assets resulting from changes in market prices of securities are not separately presented. Such changes are included in net realized and unrealized gains or losses from investments.
Securities lending
The Portfolio may lend its securities from time to time in order to earn additional income in the form of fees or interest on securities received as collateral or the investment of any cash received as collateral. When securities are on loan, the Portfolio receives interest or dividends on those securities. Cash collateral received in connection with its securities lending transactions is invested in Securities Lending Cash Investments, LLC (the “Securities Lending Fund”). Investments in Securities Lending Fund are valued at the evaluated bid price provided by an independent pricing service. Income earned from investment in the Securities Lending Fund (net of fees and rebates), if any, is included in income from affiliated securities on the Statement of Operations.
Wells Fargo Core Bond Portfolio | 51
Notes to financial statements (unaudited)
In a securities lending transaction, the net asset value of the Portfolio is affected by an increase or decrease in the value of the securities loaned and by an increase or decrease in the value of the instrument in which collateral is invested. The amount of securities lending activity undertaken by the Portfolio fluctuates from time to time. The Portfolio has the right under the lending agreement to recover the securities from the borrower on demand. In the event of default or bankruptcy by the borrower, the Portfolio may be prevented from recovering the loaned securities or gaining access to the collateral or may experience delays or costs in doing so. In such an event, the terms of the agreement allows the unaffiliated securities lending agent to use the collateral to purchase replacement securities on behalf of the Portfolio or pay the Portfolio the market value of the loaned securities. The Portfolio bears the risk of loss with respect to depreciation of its investment of the cash collateral.
When-issued transactions
The Portfolio may purchase securities on a forward commitment or when-issued basis. The Portfolio records a when-issued transaction on the trade date and will segregate assets in an amount at least equal in value to the Portfolio’s commitment to purchase when-issued securities. Securities purchased on a when-issued basis are marked-to-market daily and the Portfolio begins earning interest on the settlement date. Losses may arise due to changes in the market value of the underlying securities or if the counterparty does not perform under the contract.
Security transactions and income recognition
Securities transactions are recorded on a trade date basis. Realized gains or losses are recorded on the basis of identified cost.
Interest income is accrued daily and bond discounts are accreted and premiums are amortized daily. To the extent debt obligations are placed on non-accrual status, any related interest income may be reduced by writing off interest receivables when the collection of all or a portion of interest has been determined to be doubtful based on consistently applied procedures and the fair value has decreased. If the issuer subsequently resumes interest payments or when the collectability of interest is reasonably assured, the debt obligation is removed from non-accrual status.
Income from foreign securities is recorded net of foreign taxes withheld where recovery of such taxes is not assured.
Federal and other taxes
The Portfolio is treated as a separate entity for federal income tax purposes. The Portfolio is not required to pay federal income taxes on its net investment income and net capital gains as it is treated as a partnership for federal income tax purposes. All interest, gains and losses of the Portfolio are deemed to have been “passed through” to the interest holders in proportion to their holdings of the Portfolio regardless of whether interest and gains have been distributed by the Portfolio.
The Portfolio’s income tax returns and all financial records supporting those returns for the prior three fiscal years are subject to examination by the federal revenue authority. Management has analyzed the Portfolio’s tax positions taken on federal, state, and foreign tax returns for all open tax years and does not believe that there are any uncertain tax positions that require recognition of a tax liability.
As of November 30, 2020, the aggregate cost of all investments for federal income tax purposes was $6,498,269,871 and the unrealized gains (losses) consisted of:
| | | | |
| |
Gross unrealized gains | | $ | 202,197,380 | |
| |
Gross unrealized losses | | | (12,133,367 | ) |
| |
Net unrealized gains | | $ | 190,064,013 | |
3. FAIR VALUATION MEASUREMENTS
Fair value measurements of investments are determined within a framework that has established a fair value hierarchy based upon the various data inputs utilized in determining the value of the Portfolio’s investments. The three-level hierarchy gives the highest priority to unadjusted quoted prices in active markets for identical assets or liabilities (Level 1) and the lowest priority to unobservable inputs (Level 3). The Portfolio’s investments are classified within the fair value hierarchy based on the lowest level of input that is significant to the fair value measurement. The inputs are summarized into three broad levels as follows:
| ∎ | | Level 1 – quoted prices in active markets for identical securities |
| ∎ | | Level 2 – other significant observable inputs (including quoted prices for similar securities, interest rates, prepayment speeds, credit risk, etc.) |
| ∎ | | Level 3 – significant unobservable inputs (including the Portfolio’s own assumptions in determining the fair value of investments) |
The inputs or methodologies used for valuing investments in securities are not necessarily an indication of the risk associated with investing in those securities.
52 | Wells Fargo Core Bond Portfolio
Notes to financial statements (unaudited)
The following is a summary of the inputs used in valuing the Portfolio’s assets and liabilities as of November 30, 2020:
| | | | | | | | | | | | | | | | |
| | | | |
| | | Quoted prices
(Level 1) | | | Other significant
observable inputs
(Level 2) | | | Significant
unobservable inputs (Level 3) | | | Total | |
| | | | |
Assets | | | | | | | | | | | | | | | | |
Investments in: | | | | | | | | | | | | | | | | |
| | | | |
Agency securities | | $ | 0 | | | $ | 1,870,498,311 | | | $ | 0 | | | $ | 1,870,498,311 | |
| | | | |
Asset-backed securities | | | 0 | | | | 610,540,007 | | | | 0 | | | | 610,540,007 | |
| | | | |
Corporate bonds and notes | | | 0 | | | | 1,580,128,429 | | | | 0 | | | | 1,580,128,429 | |
| | | | |
Municipal obligations | | | 0 | | | | 27,301,211 | | | | 0 | | | | 27,301,211 | |
| | | | |
Non-agency mortgage-back securities | | | 0 | | | | 205,040,404 | | | | 0 | | | | 205,040,404 | |
| | | | |
U.S. Treasury securities | | | 1,665,808,746 | | | | 0 | | | | 0 | | | | 1,665,808,746 | |
| | | | |
Yankee corporate bonds and notes | | | 0 | | | | 426,801,688 | | | | 0 | | | | 426,801,688 | |
| | | | |
Yankee government bonds | | | 0 | | | | 78,122,345 | | | | 0 | | | | 78,122,345 | |
| | | | |
Short-term investments | | | | | | | | | | | | | | | | |
| | | | |
Investment companies | | | 224,092,743 | | | | 0 | | | | 0 | | | | 224,092,743 | |
| | | | |
Total assets | | $ | 1,889,901,489 | | | $ | 4,798,432,395 | | | $ | 0 | | | $ | 6,688,333,884 | |
Additional sector, industry or geographic detail is included in the Portfolio of Investments.
For the six months ended November 30, 2020, the Portfolio did not have any transfers into/out of Level 3.
4. TRANSACTIONS WITH AFFILIATES
Advisory fee
The Trust has entered into an advisory contract with Funds Management, an indirect wholly owned subsidiary of Wells Fargo & Company (“Wells Fargo”). The adviser is responsible for implementing investment policies and guidelines and for supervising the subadviser, who is responsible for day-to-day portfolio management of the Portfolio. Pursuant to the contract, Funds Management is entitled to receive an annual advisory fee at the following annual rate based on the Portfolio’s average daily net assets:
| | |
| |
| Average daily net assets | | Advisory fee |
| |
First $500 million | | 0.400% |
| |
Next $500 million | | 0.375 |
| |
Next $2 billion | | 0.350 |
| |
Next $2 billion | | 0.325 |
| |
Next $5 billion | | 0.300 |
| |
Over $10 billion | | 0.290 |
For the six months ended November 30, 2020, the advisory fee was equivalent to an annual rate of 0.34% of the Portfolio’s average daily net assets.
Funds Management has retained the services of a subadviser to provide daily portfolio management to the Portfolio. The fee for subadvisory services is borne by Funds Management. Wells Capital Management Incorporated (“WellsCap”), an affiliate of Funds Management and an indirect wholly owned subsidiary of Wells Fargo, is the subadviser to the Portfolio and is entitled to receive a fee from Funds Management at an annual rate starting at 0.20% and declining to 0.10% as the average daily net assets of the Portfolio increase.
Interfund transactions
The Portfolio may purchase or sell portfolio investment securities to certain other Wells Fargo affiliates pursuant to Rule 17a-7 under the 1940 Act and under procedures adopted by the Board of Trustees. The procedures have been designed to ensure that these interfund transactions, which do not incur broker commissions, are effected at current market prices.
Wells Fargo Core Bond Portfolio | 53
Notes to financial statements (unaudited)
5. INVESTMENT PORTFOLIO TRANSACTIONS
Purchases and sales of investments, excluding short-term securities, for the six months ended November 30, 2020 were as follows:
| | | | | | |
Purchases at cost | | Sales proceeds |
U.S.
government | | Non-U.S.
government | | U.S.
government | | Non-U.S.
government |
| $12,257,295,189 | | $1,998,159,702 | | $11,785,854,423 | | $1,776,440,396 |
6. SECURITIES LENDING TRANSACTIONS
The Portfolio lends its securities through an unaffiliated securities lending agent and receives collateral in the form of cash or securities with a value at least equal to the value of the securities on loan. The value of the loaned securities is determined at the close of each business day and any increases or decreases in the required collateral are exchanged between the Portfolio and the counterparty on the next business day. Cash collateral received is invested in the Securities Lending Fund which seeks to provide a positive return compared to the daily Fed Funds Open Rate by investing in high-quality, U.S. dollar-denominated short-term money market instruments and is exempt from registration under Section 3(c)(7) of the 1940 Act. Securities Lending Fund is managed by Funds Management and is subadvised by WellsCap. Funds Management receives an advisory fee starting at 0.05% and declining to 0.01% as the average daily net assets of the Securities Lending Fund increase. All of the fees received by Funds Management are paid to WellsCap for its services as subadviser.
In the event of counterparty default or the failure of a borrower to return a loaned security, the Portfolio has the right to use the collateral to offset any losses incurred. As of November 30, 2020, the Portfolio had securities lending transactions with the following counterparties which are subject to offset:
| | | | | | | | |
| | | |
| Counterparty | | Value of
securities on
loan | | Collateral
received1 | | Net amount | |
| | | |
Nomura Securities International Inc. | | $49,732,070 | | $(49,732,070) | | | $0 | |
| | | |
UBS Securities LLC | | 3,244,578 | | (3,244,578) | | | 0 | |
| 1 | Collateral received within this table is limited to the collateral for the net transaction with the counterparty. |
7. BANK BORROWINGS
The Trust, along with Wells Fargo Variable Trust and Wells Fargo Funds Trust (excluding the money market funds), are parties to a $350,000,000 revolving credit agreement whereby the Portfolio is permitted to use bank borrowings for temporary or emergency purposes, such as to fund shareholder redemption requests. Interest under the credit agreement is charged to the Portfolio based on a borrowing rate equal to the higher of the Federal Funds rate in effect on that day plus 1.25% or the overnight LIBOR rate in effect on that day plus 1.25%. In addition, an annual commitment fee equal to 0.25% of the unused balance is allocated to each participating fund.
For the six months ended November 30, 2020, there were no borrowings by the Portfolio under the agreement.
8. INDEMNIFICATION
Under the Portfolio’s organizational documents, the officers and Trustees have been granted certain indemnification rights against certain liabilities that may arise out of performance of their duties to the Portfolio. The Portfolio has entered into a separate agreement with each Trustee that converts indemnification rights currently existing under the Portfolio’s organizational documents into contractual rights that cannot be changed in the future without the consent of the Trustee. Additionally, in the normal course of business, the Portfolio may enter into contracts with service providers that contain a variety of indemnification clauses. The Portfolio’s maximum exposure under these arrangements is dependent on future claims that may be made against the Portfolio and, therefore, cannot be estimated.
9. NEW ACCOUNTING PRONOUNCEMENT
In August 2018, FASB issued Accounting Standards Update (“ASU”) No. 2018-13, Fair Value Measurement (Topic 820) Disclosure Framework—Changes to the Disclosure Requirements for Fair Value Measurement. ASU 2018-13 updates the disclosure requirements on fair value measurements in Topic 820, Fair Value Measurements. The amendments are effective for fiscal years, and interim periods within those fiscal years, beginning after December 15, 2019. Management has adopted this guidance which did not have a material impact on the financial statements.
54 | Wells Fargo Core Bond Portfolio
Notes to financial statements (unaudited)
10. CORONAVIRUS (COVID-19) PANDEMIC
On March 11, 2020, the World Health Organization announced that it had made the assessment that coronavirus disease 2019 (“COVID-19”) is a pandemic. The impacts of COVID-19 are adversely affecting the entire global economy, individual companies and investment products, and the market in general. There is significant uncertainty around the extent and duration of business disruptions related to COVID-19 and the impacts may be short term or may last for an extended period of time. The risk of further spreading of COVID-19 has led to significant uncertainty and volatility in the financial markets.
Wells Fargo Core Bond Portfolio | 55
Other information (unaudited)
PROXY VOTING INFORMATION
A description of the policies and procedures used to determine how to vote proxies relating to portfolio securities is available, upon request, by calling 1-800-222-8222, visiting our website at wfam.com, or visiting the SEC website at sec.gov. Information regarding how the proxies related to portfolio securities were voted during the most recent 12-month period ended June 30 is available on the website at wfam.com or by visiting the SEC website at sec.gov.
QUARTERLY PORTFOLIO HOLDINGS INFORMATION
The Fund and Portfolio file their complete schedule of portfolio holdings with the SEC for the first and third quarters of each fiscal year as an exhibit to its reports on Form N-PORT. Shareholders may view the filed Form N-PORT by visiting the SEC website at sec.gov.
56 | Wells Fargo Core Bond Fund
Other information (unaudited)
BOARD OF TRUSTEES AND OFFICERS
Each of the Trustees and Officers1 listed in the table below acts in identical capacities for each fund in the Wells Fargo family of funds, which consists of 144 mutual funds comprising the Wells Fargo Funds Trust, Wells Fargo Variable Trust, Wells Fargo Master Trust and four closed-end funds (collectively the “Fund Complex”). This table should be read in conjunction with the Prospectus and the Statement of Additional Information2. The mailing address of each Trustee and Officer is 525 Market Street, 12th Floor, San Francisco, CA 94105. Each Trustee and Officer serves an indefinite term, however, each Trustee serves such term until reaching the mandatory retirement age established by the Trustees.
Independent Trustees
| | | | | | |
Name and
year of birth | | Position held and
length of service* | | Principal occupations during past five years or longer | | Current other
public company or
investment
company
directorships |
| | | |
| William R. Ebsworth (Born 1957) | | Trustee, since 2015 | | Retired. From 1984 to 2013, equities analyst, portfolio manager, research director and chief investment officer at Fidelity Management and Research Company in Boston, Tokyo, and Hong Kong, and retired in 2013 as Chief Investment Officer of Fidelity Strategic Advisers, Inc. where he led a team of investment professionals managing client assets. Prior thereto, Board member of Hong Kong Securities Clearing Co., Hong Kong Options Clearing Corp., the Thailand International Fund, Ltd., Fidelity Investments Life Insurance Company, and Empire Fidelity Investments Life Insurance Company. Audit Committee Chair and Investment Committee Chair of the Vincent Memorial Hospital Endowment (non-profit organization). Mr. Ebsworth is a CFA® charterholder. | | N/A |
| | | |
| Jane A. Freeman (Born 1953) | | Trustee, since 2015; Chair Liaison, since 2018 | | Retired. From 2012 to 2014 and 1999 to 2008, Chief Financial Officer of Scientific Learning Corporation. From 2008 to 2012, Ms. Freeman provided consulting services related to strategic business projects. Prior to 1999, Portfolio Manager at Rockefeller & Co. and Scudder, Stevens & Clark. Board member of the Harding Loevner Funds from 1996 to 2014, serving as both Lead Independent Director and chair of the Audit Committee. Board member of the Russell Exchange Traded Funds Trust from 2011 to 2012 and the chair of the Audit Committee. Ms. Freeman is also an inactive Chartered Financial Analyst. | | N/A |
| | | |
| Isaiah Harris, Jr. (Born 1952) | | Trustee, since 2009; Audit Committee Chair, since 2019 | | Retired. Chairman of the Board of CIGNA Corporation since 2009, and Director since 2005. From 2003 to 2011, Director of Deluxe Corporation. Prior thereto, President and CEO of BellSouth Advertising and Publishing Corp. from 2005 to 2007, President and CEO of BellSouth Enterprises from 2004 to 2005 and President of BellSouth Consumer Services from 2000 to 2003. Emeritus member of the Iowa State University Foundation Board of Governors. Emeritus Member of the Advisory Board of Iowa State University School of Business. Advisory Board Member, Palm Harbor Academy (private school). Mr. Harris is a certified public accountant (inactive status). | | CIGNA Corporation |
| | | |
| Judith M. Johnson (Born 1949) | | Trustee, since 2008 | | Retired. Prior thereto, Chief Executive Officer and Chief Investment Officer of Minneapolis Employees Retirement Fund from 1996 to 2008. Ms. Johnson is an attorney, certified public accountant and a certified managerial accountant. | | N/A |
| | | |
| David F. Larcker (Born 1950) | | Trustee, since 2009 | | James Irvin Miller Professor of Accounting at the Graduate School of Business (Emeritus), Stanford University, Director of the Corporate Governance Research Initiative and Senior Faculty of The Rock Center for Corporate Governance since 2006. From 2005 to 2008, Professor of Accounting at the Graduate School of Business, Stanford University. Prior thereto, Ernst & Young Professor of Accounting at The Wharton School, University of Pennsylvania from 1985 to 2005. | | N/A |
Wells Fargo Core Bond Fund | 57
Other information (unaudited)
| | | | | | |
Name and
year of birth | | Position held and
length of service* | | Principal occupations during past five years or longer | | Current other
public company or
investment
company
directorships |
| | | |
| Olivia S. Mitchell (Born 1953) | | Trustee, since 2006; Nominating and Governance Committee Chair, since 2018 | | International Foundation of Employee Benefit Plans Professor, Wharton School of the University of Pennsylvania since 1993. Director of Wharton’s Pension Research Council and Boettner Center on Pensions & Retirement Research, and Research Associate at the National Bureau of Economic Research. Previously, Cornell University Professor from 1978 to 1993. | | N/A |
| | | |
| Timothy J. Penny (Born 1951) | | Trustee, since 1996; Chair, since 2018 | | President and Chief Executive Officer of Southern Minnesota Initiative Foundation, a non-profit organization, since 2007. Member of the Board of Trustees of NorthStar Education Finance, Inc., a non-profit organization, since 2007. | | N/A |
| | | |
| James G. Polisson (Born 1959) | | Trustee, since 2018 | | Retired. Chief Marketing Officer, Source (ETF) UK Services, Ltd, from 2015 to 2017. From 2012 to 2015, Principal of The Polisson Group, LLC, a management consulting, corporate advisory and principal investing company. Chief Executive Officer and Managing Director at Russell Investments, Global Exchange Traded Funds from 2010 to 2012. Managing Director of Barclays Global Investors from 1998 to 2010 and Global Chief Marketing Officer for iShares and Barclays Global Investors from 2000 to 2010. Trustee of the San Francisco Mechanics’ Institute, a non-profit organization, from 2013 to 2015. Board member of the Russell Exchange Traded Fund Trust from 2011 to 2012. Director of Barclays Global Investors Holdings Deutschland GmbH from 2006 to 2009. Mr. Polisson is an attorney and has a retired status with the Massachusetts and District of Columbia Bar Associations. | | N/A |
| | | |
| Pamela Wheelock (Born 1959) | | Trustee, since January 2020; previously Trustee from January 2018 to July 2019 | | Board member of the Destination Medical Center Economic Development Agency, Rochester, Minnesota since 2019. Interim President of the McKnight Foundation from January to September 2020. Acting Commissioner, Minnesota Department of Human Services, July 2019 through September 2019. Human Services Manager (part-time), Minnesota Department of Human Services, October 2019 through December 2019. Chief Operating Officer, Twin Cities Habitat for Humanity from 2017 to 2019. Vice President of University Services, University of Minnesota from 2012 to 2016. Prior thereto, on the Board of Directors, Governance Committee and Finance Committee for the Minnesota Philanthropy Partners (Saint Paul Foundation) from 2012 to 2018, Interim Chief Executive Officer of Blue Cross Blue Shield of Minnesota from 2011 to 2012, Chairman of the Board from 2009 to 2012 and Board Director from 2003 to 2015. Vice President, Leadership and Community Engagement, Bush Foundation, Saint Paul, Minnesota (a private foundation) from 2009 to 2011. Executive Vice President and Chief Financial Officer, Minnesota Sports and Entertainment from 2004 to 2009 and Senior Vice President from 2002 to 2004. Executive Vice President of the Minnesota Wild Foundation from 2004 to 2008. Commissioner of Finance, State of Minnesota, from 1999 to 2002. Currently Board Chair of the Minnesota Wild Foundation since 2010. | | N/A |
| * | Length of service dates reflect the Trustee’s commencement of service with the Trust’s predecessor entities, where applicable. |
58 | Wells Fargo Core Bond Fund
Other information (unaudited)
Officers
| | | | |
Name and
year of birth | | Position held and
length of service | | Principal occupations during past five years or longer |
| | |
| Andrew Owen (Born 1960) | | President, since 2017 | | Executive Vice President of Wells Fargo & Company and Head of Affiliated Managers, Wells Fargo Asset Management, since 2014. In addition, Mr. Owen is currently President, Chief Executive Officer and Director of Wells Fargo Funds Management, LLC since 2017. Prior thereto, Executive Vice President responsible for marketing, investments and product development for Wells Fargo Funds Management, LLC, from 2009 to 2014. |
| | |
| Nancy Wiser1 (Born 1967) | | Treasurer, since 2012 | | Executive Vice President of Wells Fargo Funds Management, LLC since 2011. Chief Operating Officer and Chief Compliance Officer at LightBox Capital Management LLC, from 2008 to 2011. |
| | |
| Michelle Rhee (Born 1966) | | Chief Legal Officer, since 2019 | | Secretary of Wells Fargo Funds Management, LLC and Chief Legal Counsel of Wells Fargo Asset Management since 2018. Deputy General Counsel of Wells Fargo Bank, N.A. since 2020 and Assistant General Counsel of Wells Fargo Bank, N.A. from 2018 to 2020. Associate General Counsel and Managing Director of Bank of America Corporation from 2004 to 2018. |
| | |
| Catherine Kennedy (Born 1969) | | Secretary, since 2019 | | Vice President of Wells Fargo Funds Management, LLC and Senior Counsel of the Wells Fargo Legal Department since 2010. Vice President and Senior Counsel of Evergreen Investment Management Company, LLC from 1998 to 2010. |
| | |
| Michael H. Whitaker (Born 1967) | | Chief Compliance Officer, since 2016 | | Chief Compliance Officer of Wells Fargo Asset Management since 2016. Senior Vice President and Chief Compliance Officer for Fidelity Investments from 2007 to 2016. |
| | |
| Jeremy DePalma1 (Born 1974) | | Assistant Treasurer, since 2009 | | Senior Vice President of Wells Fargo Funds Management, LLC since 2009. Senior Vice President of Evergreen Investment Management Company, LLC from 2008 to 2010 and head of the Fund Reporting and Control Team within Fund Administration from 2005 to 2010. |
| 1 | Nancy Wiser acts as Treasurer of 67 funds in the Fund Complex. Jeremy DePalma acts as the Treasurer of 77 funds and Assistant Treasurer of 67 funds in the Fund Complex. |
| 2 | The Statement of Additional Information includes additional information about the Trustees and is available, without charge, upon request, by calling 1-800-222-8222 or by visiting the website at wfam.com. |
Wells Fargo Core Bond Fund | 59
This page is intentionally left blank.

For more information
More information about Wells Fargo Funds is available free upon request. To obtain literature, please write, visit the Fund’s website, or call:
Wells Fargo Funds
P.O. Box 219967
Kansas City, MO 64121-9967
Website: wfam.com
Individual investors: 1-800-222-8222
Retail investment professionals: 1-888-877-9275
Institutional investment professionals: 1-866-765-0778

This report and the financial statements contained herein are submitted for the general information of the shareholders of the Fund. If this report is used for promotional purposes, distribution of the report must be accompanied or preceded by a current prospectus. Before investing, please consider the investment objectives, risks, charges, and expenses of the investment. For a current prospectus and, if available, a summary prospectus, containing this information, call 1-800-222-8222 or visit the Fund’s website at wfam.com. Read the prospectus carefully before you invest or send money.
Wells Fargo Asset Management (WFAM) is the trade name for certain investment advisory/management firms owned by Wells Fargo & Company. These firms include but are not limited to Wells Capital Management Incorporated and Wells Fargo Funds Management, LLC. Certain products managed by WFAM entities are distributed by Wells Fargo Funds Distributor, LLC (a broker-dealer and Member FINRA).
This material is for general informational and educational purposes only and is NOT intended to provide investment advice or a recommendation of any kind—including a recommendation for any specific investment, strategy, or plan.
INVESTMENT PRODUCTS: NOT FDIC INSURED ◾ NO BANK GUARANTEE ◾ MAY LOSE VALUE
© 2021 Wells Fargo & Company. All rights reserved.
PAR-1220-00735 01-20
SA287/SAR287 11-20
Semi-Annual Report
November 30, 2020
Wells Fargo Real Return Fund
|
|
|
Reduce clutter. Save trees. |
Sign up for electronic delivery of prospectuses and shareholder reports at wellsfargo.com/
advantagedelivery |
The views expressed and any forward-looking statements are as of November 30, 2020, unless otherwise noted, and are those of the Fund’s portfolio managers and/or Wells Fargo Asset Management. Discussions of individual securities, or the markets generally, or any Wells Fargo Fund are not intended as individual recommendations. Future events or results may vary significantly from those expressed in any forward-looking statements. The views expressed are subject to change at any time in response to changing circumstances in the market. Wells Fargo Asset Management and the Fund disclaim any obligation to publicly update or revise any views expressed or forward-looking statements.
INVESTMENT PRODUCTS: NOT FDIC INSURED ◾ NO BANK GUARANTEE ◾ MAY LOSE VALUE
Wells Fargo Real Return Fund | 1
Letter to shareholders (unaudited)

Andrew Owen
President
Wells Fargo Funds
“Global stock markets rallied strongly, driven by aggressive stimulus measures introduced by central banks and governments in response to challenges presented by the COVID-19 pandemic.”
Dear Shareholder:
We are pleased to offer you this semi-annual report for the Wells Fargo Real Return Fund for the six-month period that ended November 30, 2020. Global stock markets rallied strongly, driven by aggressive stimulus measures introduced by central banks and governments in response to challenges presented by the COVID-19 pandemic. Emerging market equities had particularly robust results during the six-month period. Among bonds, high-yield issues led the way while U.S. bonds generally had more modest returns than their international counterparts.
For the period, U.S. stocks, based on the S&P 500 Index,1 returned 19.98% and international stocks, as measured by the MSCI ACWI ex USA Index (Net),2 gained 23.28%. The MSCI EM Index (Net)3 rallied 31.14%. Among bond investments, the Bloomberg Barclays U.S. Aggregate Bond Index4 returned a modest 1.79%, the Bloomberg Barclays Global Aggregate ex-USD Index5 gained a robust 8.19%, the Bloomberg Barclays Municipal Bond Index6 had a 3.29% return, and the ICE BofA U.S. High Yield Index7 gained a healthy 10.47%.
Equities enjoyed a strong tailwind from monetary and fiscal stimulus.
Financial markets posted widely positive returns in June despite ongoing economic weakness and uncertainty regarding COVID-19 and the timing of an effective vaccine. As economies reopened, optimism rose. Vitally important to market sentiment was the ongoing global central bank commitment to provide economic support through liquidity and low borrowing costs. U.S. economic activity was boosted by one-time $1,200 stimulus checks and $600 weekly bonus unemployment benefits for tens of millions of Americans through July. However, jobless rates remained historically high, easing somewhat from 14.7% in April to 11.1% in June. By late June, numerous states reported increases of COVID-19 cases, an ominous sign. China’s economic recovery picked up momentum in June.
July was broadly positive for both global equities and fixed income. However, economic data and a resurgence of COVID-19 cases pointed to the vulnerability of the global economy and the need to regain control of the pandemic. Second-quarter gross domestic product (GDP) shrank from the previous quarter by 9.5% and 12.1% in the U.S. and the eurozone, respectively. In contrast, China reported 3.2% year-over-year second-quarter GDP growth. U.S. unemployment remained high despite adding 1.8 million jobs in July, as a double-digit jobless rate persisted. However, manufacturing activity grew in both the U.S. and the eurozone. In Asia, while China’s manufacturing sector continued to expand, activity in Japan and South Korea contracted. A rising concern was the rapid and broad reemergence of COVID-19 infections.
| 1 | The S&P 500 Index consists of 500 stocks chosen for market size, liquidity, and industry group representation. It is a market-value-weighted index with each stock’s weight in the index proportionate to its market value. You cannot invest directly in an index. |
| 2 | The Morgan Stanley Capital International (MSCI) All Country World Index (ACWI) ex USA Index (Net) is a free-float-adjusted market-capitalization-weighted index that is designed to measure the equity market performance of developed and emerging markets, excluding the United States. Source: MSCI. MSCI makes no express or implied warranties or representations and shall have no liability whatsoever with respect to any MSCI data contained herein. The MSCI data may not be further redistributed or used as a basis for other indices or any securities or financial products. This report is not approved, reviewed, or produced by MSCI. You cannot invest directly in an index. |
| 3 | The MSCI Emerging Markets (EM) Index (Net) is a free-float-adjusted market-capitalization-weighted index that is designed to measure equity market performance of emerging markets. You cannot invest directly in an index. |
| 4 | The Bloomberg Barclays U.S. Aggregate Bond Index is a broad-based benchmark that measures the investment-grade, U.S. dollar-denominated, fixed-rate taxable bond market, including Treasuries, government-related and corporate securities, mortgage-backed securities (agency fixed-rate and hybrid adjustable-rate mortgage pass-throughs), asset-backed securities, and commercial mortgage-backed securities. You cannot invest directly in an index. |
| 5 | The Bloomberg Barclays Global Aggregate ex-USD Index is an unmanaged index that provides a broad-based measure of the global investment-grade fixed-income markets excluding the U.S. dollar-denominated debt market. You cannot invest directly in an index. |
| 6 | The Bloomberg Barclays Municipal Bond Index is an unmanaged index composed of long-term tax-exempt bonds with a minimum credit rating of Baa. You cannot invest directly in an index. |
| 7 | The ICE BofA U.S. High Yield Index is a market-capitalization-weighted index of domestic and Yankee high-yield bonds. The index tracks the performance of high-yield securities traded in the U.S. bond market. You cannot invest directly in an index. Copyright 2021. ICE Data Indices, LLC. All rights reserved. |
2 | Wells Fargo Real Return Fund
Letter to shareholders (unaudited)
The stock market continued to rally in August despite concerns over rising COVID-19 cases in the U.S. and Europe, as well as the expiration of the $600 weekly bonus unemployment benefit in July. Generally stronger-than-expected second-quarter earnings boosted investor sentiment along with the Federal Reserve’s announcement of a more accommodative policy shift that could lead to longer-term low interest rates. U.S. indices measuring manufacturing and services activities beat expectations while the U.S. housing market maintained strength. In Europe, retail sales expanded and consumer confidence was steady. China’s economy continued to expand.
Stocks grew more volatile in September on mixed economic data. U.S. economic activity continued to grow. However, only half of the 22 million jobs lost since the early spring had returned. The U.S. unemployment rate fell to 7.9% in September, a measurable improvement but far higher than the 3.5% pre-COVID-19 rate. Only 661,000 jobs were added for the month, down from 1.5 million in August. With the U.S. Congress failing to pass further fiscal relief and uncertainties surrounding a possible vaccine, doubts crept back into the markets. In the U.K., a lack of progress in Brexit talks with the European Union weighed on markets. China’s economy picked up steam, however, with growth fueled by increased global demand.
In October, capital markets took a step back from their six-month rally. Market volatility rose in advance of the U.S. election and amid a global increase in COVID-19 infections. Europe responded with more economic restrictions. Meanwhile, Brexit remained unresolved. U.S. markets looked favorably at a possible Democratic sweep and control of the federal purse strings in anticipation of additional fiscal stimulus, which could boost economic activity. Meanwhile, China continued to stand apart, reporting 4.9% third-quarter GDP growth year over year.
Global stocks rallied broadly in November, propelled by optimism over three promising COVID-19 vaccines, which reported high effectiveness in trials. Global stock indices notched double-digit monthly gains. In a reversal of recent trends, value stocks outperformed growth and cyclical stocks outpaced technology stocks. However, U.S. unemployment remained elevated, with a net job loss of 10 million since February. The Eurozone Services Purchasing Managers’ Index, a monthly survey of purchasing managers, contracted sharply while the region’s manufacturing activity gauge indicated growth. The U.S. election results added to the market’s upbeat mood as investors gave thumbs-up to the certainty of the outcome after an unusual delay and anticipated more consistent policies in the new administration.
Don’t let short-term uncertainty derail long-term investment goals.
Periods of investment uncertainty can present challenges, but experience has taught us that maintaining long-term investment goals can be an effective way to plan for the future. To help you create a sound strategy based on your personal goals and risk tolerance, Wells Fargo Funds offers more than 100 mutual funds spanning a wide range of asset classes and investment styles. Although diversification cannot guarantee an investment profit or prevent losses, we believe it can be an effective way to manage investment risk and potentially smooth out overall portfolio performance. We encourage investors to know their investments and to understand that appropriate levels of risk-taking may unlock opportunities.
Thank you for choosing to invest with Wells Fargo Funds. We appreciate your confidence in us and remain committed to helping you meet your financial needs.
Sincerely,

Andrew Owen
President
Wells Fargo Funds
“Global stocks rallied broadly in November, propelled by optimism over three promising COVID-19 vaccines, which reported high effectiveness in trials.”
|
|
|
For further information about your Fund, contact your investment professional, visit our website at wfam.com, or call us directly at 1-800-222-8222. |
Wells Fargo Real Return Fund | 3
Letter to shareholders (unaudited)
Notice to Shareholders
At a meeting held on August 10-12, 2020, the Board of Trustees of the Fund approved a change to the Fund’s automatic conversion feature for Class C shares in order to shorten the required holding period from 10 to 8 years. As a result, on a monthly basis beginning November 5, 2020, Class C shares will convert automatically into Class A shares 8 years after the initial date of purchase or, if you acquired your Class C shares through an exchange or conversion from another share class, 8 years after the date you acquired your Class C shares. When Class C shares that you acquired through a purchase or exchange convert, any other Class C shares that you purchased with reinvested dividends and distributions also will convert into Class A shares on a pro rata basis.
Please note that a shorter holding period may apply depending on your intermediary. Please see “Appendix A—Sales Charge Reductions and Waivers for Certain Intermediaries” in the Fund’s prospectus for further information.
Preparing for LIBOR Transition
The global financial industry is preparing to transition away from the London Interbank Offered Rate (LIBOR), a key benchmark interest rate, to new alternative rates. LIBOR underpins more than $350 trillion of financial contracts. It is the benchmark rate for a wide spectrum of products ranging from residential mortgages to corporate bonds to derivatives. Regulators have called for a market-wide transition away from LIBOR to successor reference rates by the end of 2021, which requires proactive steps be taken by issuers, counterparties, and asset managers to identify impacted products and adopt new reference rates.
The Fund holds at least one security that uses LIBOR as a floating reference rate and has a maturity date after 12-31-2021.
Although the transition process away from LIBOR has become increasingly well-defined in advance of the anticipated discontinuation date, there remains uncertainty regarding the nature of successor reference rates, and any potential effects of the transition away from LIBOR on investment instruments that use it as a benchmark rate. The transition process may result in, among other things, increased volatility or illiquidity in markets for instruments that currently rely on LIBOR and could negatively impact the value of certain instruments held by the Fund.
Wells Fargo Asset Management is monitoring LIBOR exposure closely and has put resources and controls in place to manage this transition effectively. The Fund’s portfolio management team is evaluating LIBOR holdings to understand what happens to those securities when LIBOR ceases to exist, including examining security documentation to identify the presence or absence of fallback language identifying a replacement rate to LIBOR.
While the pace of transition away from LIBOR will differ by asset class and investment strategy, the portfolio management team will monitor market conditions for those holdings to identify and mitigate deterioration or volatility in pricing and liquidity and ensure appropriate actions are taken in a timely manner.
Further information regarding the potential risks associated with the discontinuation of LIBOR can be found in the Fund’s Statement of Additional Information.
4 | Wells Fargo Real Return Fund
This page is intentionally left blank.
Performance highlights (unaudited)
Investment objective
The Fund seeks returns that exceed the rate of inflation over the long-term.
Manager
Wells Fargo Funds Management, LLC
Subadviser for the affiliated master portfolio1
Wells Capital Management Incorporated
Portfolio managers
Kandarp R. Acharya, CFA®‡, FRM
Petros N. Bocray, CFA®‡, FRM
Michael Bradshaw, CFA®‡
Christian L. Chan, CFA®‡
Jay N. Mueller, CFA®‡
Garth B. Newport, CFA®‡
Michael Schueller, CFA®‡
Average annual total returns (%) as of November 30, 2020
| | | | | | | | | | | | | | | | | | | | | | | | | | | | | | | | | | |
| | | | |
| | | | | Including sales charge | | | Excluding sales charge | | | Expense ratios2 (%) | |
| | | | | | | | | |
| | | Inception date | | 1 year | | | 5 year | | | 10 year | | | 1 year | | | 5 year | | | 10 year | | | Gross | | | Net3 | |
| | | | | | | | | | |
| Class A (IPBAX) | | 2-28-2003 | | | 2.80 | | | | 3.27 | | | | 2.57 | | | | 7.64 | | | | 4.23 | | | | 3.04 | | | | 1.43 | | | | 0.78 | |
| | | | | | | | | | |
| Class C (IPBCX) | | 2-28-2003 | | | 5.79 | | | | 3.45 | | | | 2.28 | | | | 6.79 | | | | 3.45 | | | | 2.28 | | | | 2.18 | | | | 1.53 | |
| | | | | | | | | | |
| Class R6 (IPBJX)4 | | 10-31-2016 | | | – | | | | – | | | | – | | | | 7.98 | | | | 4.60 | | | | 3.35 | | | | 1.05 | | | | 0.40 | |
| | | | | | | | | | |
| Administrator Class (IPBIX) | | 2-28-2003 | | | – | | | | – | | | | – | | | | 7.90 | | | | 4.46 | | | | 3.28 | | | | 1.37 | | | | 0.60 | |
| | | | | | | | | | |
| Institutional Class (IPBNX)5 | | 10-31-2016 | | | – | | | | – | | | | – | | | | 8.02 | | | | 4.57 | | | | 3.34 | | | | 1.10 | | | | 0.45 | |
| | | | | | | | | | |
| Bloomberg Barclays U.S. TIPS Index6 | | – | | | – | | | | – | | | | – | | | | 10.15 | | | | 4.68 | | | | 3.53 | | | | – | | | | – | |
| | | | | | | | | | |
| CPI7 | | – | | | – | | | | – | | | | – | | | | 1.17 | | | | 1.86 | | | | 1.75 | | | | – | | | | – | |
Figures quoted represent past performance, which is no guarantee of future results, and do not reflect taxes that a shareholder may pay on an investment in a fund. Investment return and principal value of an investment will fluctuate so that an investor’s shares, when redeemed, may be worth more or less than their original cost. Performance shown without sales charges would be lower if sales charges were reflected. Current performance may be lower or higher than the performance data quoted, which assumes the reinvestment of dividends and capital gains. Current month-end performance is available on the Fund’s website, wfam.com.
Index returns do not include transaction costs associated with buying and selling securities, any mutual fund fees or expenses, or any taxes. It is not possible to invest directly in an index.
For Class A shares, the maximum front-end sales charge is 4.50%. For Class C shares, the maximum contingent deferred sales charge is 1.00%. Performance including a contingent deferred sales charge assumes the sales charge for the corresponding time period. Class R6, Administrator Class, and Institutional Class shares are sold without a front-end sales charge or contingent deferred sales charge.
Bond values fluctuate in response to the financial condition of individual issuers, general market and economic conditions, and changes in interest rates. Changes in market conditions and government policies may lead to periods of heightened volatility in the bond market and reduced liquidity for certain bonds held by the Fund. In general, when interest rates rise, bond values fall and investors may lose principal value. Interest rate changes and their impact on the Fund and its share price can be sudden and unpredictable. Stock values fluctuate in response to the activities of individual companies and general market and economic conditions. High-yield securities have a greater risk of default and tend to be more volatile than higher-rated debt securities. Loans are subject to risks similar to those associated with other below investment-grade bond investments, such as credit risk (for example, risk of issuer default), below-investment-grade bond risk (for example, risk of greater volatility in value), and risk that the loan may become illiquid or difficult to price. The use of derivatives may reduce returns and/or increase volatility. Foreign investments are especially volatile and can rise or fall dramatically due to differences in the political and economic conditions of the host country. These risks are generally intensified in emerging markets. The Fund is exposed to mortgage- and asset-backed securities risk and small company securities risk. Securities issued by U.S. government agencies or government-sponsored entities may not be guaranteed by the U.S. Treasury. Consult the Fund’s prospectus for additional information on these and other risks.
Please see footnotes on page 7.
6 | Wells Fargo Real Return Fund
Performance highlights (unaudited)
| | | | |
|
| Ten largest holdings (%) as of November 30, 20208 | |
| | |
TIPS, 0.38%, 7-15-2025 | | | 3.07 | |
| | |
TIPS, 0.63%, 1-15-2026 | | | 2.73 | |
| | |
TIPS, 0.13%, 1-15-2023 | | | 2.56 | |
| | |
TIPS, 0.63%, 1-15-2024 | | | 2.46 | |
| | |
TIPS, 0.13%, 7-15-2024 | | | 2.39 | |
| | |
TIPS, 0.38%, 7-15-2023 | | | 2.24 | |
| | |
TIPS, 0.25%, 1-15-2025 | | | 2.23 | |
| | |
TIPS, 0.13%, 7-15-2022 | | | 2.20 | |
| | |
TIPS, 0.13%, 7-15-2030 | | | 2.15 | |
| | |
TIPS, 0.50%, 1-15-2028 | | | 2.04 | |
|
|
| Portfolio allocation as of November 30, 20209 |
|
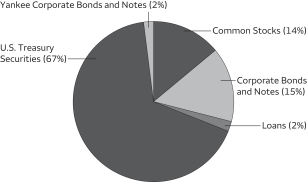 |
| ‡ | CFA® and Chartered Financial Analyst® are trademarks owned by CFA Institute. |
| 1 | The Fund is a feeder fund in a master-feeder structure that invests substantially all of its assets in a single affiliated master portfolio of the Wells Fargo Master Trust with a substantially identical investment objective and substantially similar investment strategies. References to the investment activities of the Fund are intended to refer to the investment activities of the affiliated master portfolio in which it invests. |
| 2 | Reflects the expense ratios as stated in the most recent prospectuses. The expense ratios shown are subject to change and may differ from the annualized expense ratios shown in the financial highlights of this report. |
| 3 | The manager has contractually committed through September 30, 2021, to waive fees and/or reimburse expenses to the extent necessary to cap total annual fund operating expenses after fee waivers at 0.78% for Class A, 1.53% for Class C, 0.40% for Class R6, 0.60% for Administrator Class, and 0.45% for Institutional Class. Brokerage commissions, stamp duty fees, interest, taxes, acquired fund fees and expenses (if any) from funds in which the affiliated master portfolio invests, and extraordinary expenses are excluded from the expense caps. Net expenses from the affiliated master portfolio are included in the expense caps. Prior to or after the commitment expiration date, the caps may be increased or the commitment to maintain the caps may be terminated only with the approval of the Board of Trustees. Without these caps, the Fund’s returns would have been lower. The expense ratio paid by an investor is the net expense ratio (the total annual fund operating expenses after fee waivers) as stated in the prospectuses. |
| 4 | Historical performance shown for the Class R6 shares prior to their inception reflects the performance of the Administrator Class shares, and is not adjusted to reflect the Class R6 expenses. If these expenses had been included, returns for the Class R6 shares would be higher. |
| 5 | Historical performance shown for the Institutional Class shares prior to their inception reflects the performance of the Administrator Class shares, and is not adjusted to reflect the Institutional Class expenses. If these expenses had been included, returns for the Institutional Class shares would be higher. |
| 6 | The Bloomberg Barclays U.S. Treasury Inflation-Protected Securities (TIPS) Index is an index of inflation-indexed-linked U.S. Treasury securities. You cannot invest directly in an index. |
| 7 | The Consumer Price Index (CPI) for All Urban Consumers in U.S. All Items is published monthly by the U.S. government as an indicator of changes in price levels (or inflation) paid by urban consumers for a representative basket of goods and services. You cannot invest directly in an index. |
| 8 | Each holding represents the Fund’s allocable portion of the affiliated master portfolio security. Figures represent each holding as a percentage of the Fund’s net assets. Holdings are subject to change and may have changed since the date specified. |
| 9 | Figures represent the portfolio composition of the affiliated master portfolio as a percentage of the total long-term investments of the affiliated master portfolio. These amounts are subject to change and may have changed since the date specified. |
Wells Fargo Real Return Fund | 7
Fund expenses (unaudited)
As a shareholder of the Fund, you incur two types of costs: (1) transaction costs, including sales charges (loads) on purchase payments and contingent deferred sales charges (if any) on redemptions and (2) ongoing costs, including management fees, distribution (12b-1) and/or shareholder servicing fees, and other Fund expenses. This example is intended to help you understand your ongoing costs (in dollars) of investing in the Fund and to compare these costs with the ongoing costs of investing in other mutual funds.
The example is based on an investment of $1,000 invested at the beginning of the six-month period and held for the entire period from June 1, 2020 to November 30, 2020.
Actual expenses
The “Actual” line of the table below provides information about actual account values and actual expenses. You may use the information in this line, together with the amount you invested, to estimate the expenses that you paid over the period. Simply divide your account value by $1,000 (for example, an $8,600 account value divided by $1,000 = 8.6), then multiply the result by the number in the “Actual” line under the heading entitled “Expenses paid during period” for your applicable class of shares to estimate the expenses you paid on your account during this period.
Hypothetical example for comparison purposes
The “Hypothetical” line of the table below provides information about hypothetical account values and hypothetical expenses based on the Fund’s actual expense ratio and an assumed rate of return of 5% per year before expenses, which is not the Fund’s actual return. The hypothetical account values and expenses may not be used to estimate the actual ending account balance or expenses you paid for the period. You may use this information to compare the ongoing costs of investing in the Fund and other funds. To do so, compare this 5% hypothetical example with the 5% hypothetical examples that appear in the shareholder reports of the other funds.
Please note that the expenses shown in the table are meant to highlight your ongoing costs only and do not reflect any transactional costs, such as sales charges (loads) and contingent deferred sales charges. Therefore, the “Hypothetical” line of the table is useful in comparing ongoing costs only and will not help you determine the relative total costs of owning different funds. In addition, if these transactional costs were included, your costs would have been higher.
| | | | | | | | | | | | | | | | |
| | | Beginning
account value
6-1-2020 | | | Ending
account value
11-30-2020 | | | Expenses
paid during
the period1,2 | | | Annualized net
expense ratio1 | |
| | | | | |
Class A | | | | | | | | | | | | | | | | |
| | | | |
Actual | | $ | 1,000.00 | | | $ | 1,052.92 | | | $ | 4.01 | | | | 0.78 | % |
| | | | |
Hypothetical (5% return before expenses) | | $ | 1,000.00 | | | $ | 1,021.16 | | | $ | 3.95 | | | | 0.78 | % |
| | | | | |
Class C | | | | | | | | | | | | | | | | |
| | | | |
Actual | | $ | 1,000.00 | | | $ | 1,048.99 | | | $ | 7.86 | | | | 1.53 | % |
| | | | |
Hypothetical (5% return before expenses) | | $ | 1,000.00 | | | $ | 1,017.40 | | | $ | 7.74 | | | | 1.53 | % |
| | | | | |
Class R6 | | | | | | | | | | | | | | | | |
| | | | |
Actual | | $ | 1,000.00 | | | $ | 1,054.39 | | | $ | 2.06 | | | | 0.40 | % |
| | | | |
Hypothetical (5% return before expenses) | | $ | 1,000.00 | | | $ | 1,023.06 | | | $ | 2.03 | | | | 0.40 | % |
| | | | | |
Administrator Class | | | | | | | | | | | | | | | | |
| | | | |
Actual | | $ | 1,000.00 | | | $ | 1,054.37 | | | $ | 3.09 | | | | 0.60 | % |
| | | | |
Hypothetical (5% return before expenses) | | $ | 1,000.00 | | | $ | 1,022.06 | | | $ | 3.04 | | | | 0.60 | % |
| | | | | |
Institutional Class | | | | | | | | | | | | | | | | |
| | | | |
Actual | | $ | 1,000.00 | | | $ | 1,055.06 | | | $ | 2.32 | | | | 0.45 | % |
| | | | |
Hypothetical (5% return before expenses) | | $ | 1,000.00 | | | $ | 1,022.81 | | | $ | 2.28 | | | | 0.45 | % |
| 1 | Amounts reflect net expenses allocated from the affiliated Master Portfolio in which the Fund invests. |
| 2 | Expenses paid is equal to the annualized net expense ratio of each class multiplied by the average account value over the period, multiplied by the number of days in the most recent fiscal half-year divided by the number of days in the fiscal year (to reflect the one-half-year period). |
8 | Wells Fargo Real Return Fund
Portfolio of investments—November 30, 2020 (unaudited)
| | | | | | | | | | | | | | | | |
| | | | | | | | | | | | Value | |
Investment Companies: 99.87% | |
|
| Affiliated Master Portfolio: 99.87% | |
Wells Fargo Real Return Portfolio | | | | | | | | | | | | | | $ | 59,698,728 | |
| | | | | | | | | | | | | | | | |
| | | | |
Total Investment Companies (Cost $52,913,313) | | | | | | | | | | | | | | | 59,698,728 | |
| | | | | | | | | | | | | | | | |
| | | | | | | | |
| Total investments in securities (Cost $52,913,313) | | | 99.87 | % | | | 59,698,728 | |
| | |
Other assets and liabilities, net | | | 0.13 | | | | 78,964 | |
| | | | | | | | |
| Total net assets | | | 100.00 | % | | $ | 59,777,692 | |
| | | | | | | | |
Transactions with the affiliated Master Portfolio were as follows:
| | | | | | | | | | | | | | | | | | | | | | | | | | | | | | | | | | | | |
| | | % of
ownership,
beginning
of period | | | % of
ownership,
end of
period | | | Net realized
gains
(losses) on
securities
transactions
allocated
from
affiliated
Master
Portfolio | | | Net change in
unrealized
gains (losses) on
securities
transactions
allocated
from
affiliated
Master
Portfolio | | | Interest
allocated
from
affiliated
Master
Portfolio | | | Dividends
allocated
from
affiliated
Master
Portfolio | | | Affiliated
income
allocated
from
affiliated
Master
Portfolio | | | Value,
end of period | | | % of
net
assets | |
Wells Fargo Real Return Portfolio | | | 35 | % | | | 27 | % | | $ | (69,454 | ) | | $ | 2,692,438 | | | $ | 637,079 | | | $ | 94,708 | | | $ | 350 | | | $ | 59,698,728 | | | | 99.87 | % |
The accompanying notes are an integral part of these financial statements.
Wells Fargo Real Return Fund | 9
Statement of assets and liabilities—November 30, 2020 (unaudited)
| | | | |
| | | | |
| |
Assets | | | | |
Investments in affiliated Master Portfolio, at value (cost $52,913,313) | | $ | 59,698,728 | |
Receivable for Fund shares sold | | | 115,356 | |
Receivable from manager | | | 10,397 | |
Prepaid expenses and other assets | | | 1,352 | |
| | | | |
Total assets | | | 59,825,833 | |
| | | | |
| |
Liabilities | | | | |
Payable for Fund shares redeemed | | | 25,981 | |
Administration fees payable | | | 4,216 | |
Distribution fee payable | | | 923 | |
Shareholder report expenses payable | | | 4,858 | |
Shareholder servicing fees payable | | | 5,650 | |
Trustees’ fees and expenses payable | | | 1,066 | |
Accrued expenses and other liabilities | | | 5,447 | |
| | | | |
Total liabilities | | | 48,141 | |
| | | | |
Total net assets | | $ | 59,777,692 | |
| | | | |
| |
Net assets consist of | | | | |
Paid-in capital | | $ | 55,087,686 | |
Total distributable earnings | | | 4,690,006 | |
| | | | |
Total net assets | | $ | 59,777,692 | |
| | | | |
| |
Computation of net asset value and offering price per share | | | | |
Net assets – Class A | | $ | 13,273,112 | |
Shares outstanding – Class A1 | | | 1,243,835 | |
Net asset value per share – Class A | | | $10.67 | |
Maximum offering price per share – Class A2 | | | $11.17 | |
Net assets – Class C | | $ | 1,472,429 | |
Shares outstanding – Class C1 | | | 140,413 | |
Net asset value per share – Class C | | | $10.49 | |
Net assets – Class R6 | | $ | 21,641,244 | |
Shares outstanding – Class R61 | | | 2,007,254 | |
Net asset value per share – Class R6 | | | $10.78 | |
Net assets – Administrator Class | | $ | 13,443,186 | |
Shares outstanding – Administrator Class1 | | | 1,239,568 | |
Net asset value per share – Administrator Class | | | $10.85 | |
Net assets – Institutional Class | | $ | 9,947,721 | |
Shares outstanding – Institutional Class1 | | | 922,260 | |
Net asset value per share – Institutional Class | | | $10.79 | |
| 1 | The Fund has an unlimited number of authorized shares. |
| 2 | Maximum offering price is computed as 100/95.50 of net asset value. On investments of $50,000 or more, the offering price is reduced. |
The accompanying notes are an integral part of these financial statements.
10 | Wells Fargo Real Return Fund
Statement of operations—six months ended November 30, 2020 (unaudited)
| | | | |
| | | | |
| |
Investment income | | | | |
Interest allocated from affiliated Master Portfolio | | $ | 637,079 | |
Dividends allocated from affiliated Master Portfolio (net of foreign withholding taxes of $791) | | | 94,708 | |
Affiliated income allocated from affiliated Master Portfolio | | | 350 | |
Expenses allocated from affiliated Master Portfolio | | | (139,904 | ) |
Waivers allocated from affiliated Master Portfolio | | | 24,123 | |
| | | | |
Total investment income | | | 616,356 | |
| | | | |
| |
Expenses | | | | |
Management fee | | | 14,886 | |
Administration fees | | | | |
Class A | | | 11,164 | |
Class C | | | 1,349 | |
Class R6 | | | 2,945 | |
Administrator Class | | | 7,047 | |
Institutional Class | | | 4,070 | |
Shareholder servicing fees | | | | |
Class A | | | 17,428 | |
Class C | | | 2,101 | |
Administrator Class | | | 17,599 | |
Distribution fee | | | | |
Class C | | | 6,319 | |
Custody and accounting fees | | | 2,020 | |
Professional fees | | | 18,048 | |
Registration fees | | | 100,273 | |
Shareholder report expenses | | | 34,759 | |
Trustees’ fees and expenses | | | 11,029 | |
Other fees and expenses | | | 7,721 | |
| | | | |
Total expenses | | | 258,758 | |
Less: Fee waivers and/or expense reimbursements | | | | |
Fund-level | | | (193,866 | ) |
Class A | | | (696 | ) |
Administrator Class | | | (8,434 | ) |
| | | | |
Net expenses | | | 55,762 | |
| | | | |
Net investment income | | | 560,594 | |
| | | | |
| |
Realized and unrealized gains (losses) on investments | | | | |
Net realized losses on securities transactions allocated from affiliated Master Portfolio | | | (69,454 | ) |
Net change in unrealized gains (losses) on securities transactions allocated from affiliated Master Portfolio | | | 2,692,438 | |
| | | | |
Net realized and unrealized gains (losses) on investments | | | 2,622,984 | |
| | | | |
Net increase in net assets resulting from operations | | $ | 3,183,578 | |
| | | | |
The accompanying notes are an integral part of these financial statements.
Wells Fargo Real Return Fund | 11
Statement of changes in net assets
| | | | | | | | | | | | | | | | |
| | | Six months ended
November 30, 2020
(unaudited) | | | Year ended
May 31, 2020 | |
| | | | |
Operations | | | | | | | | | | | | | | | | |
Net investment income | | | | | | $ | 560,594 | | | | | | | $ | 1,149,193 | |
Net realized losses on investments | | | | | | | (69,454 | ) | | | | | | | (1,121,387 | ) |
Net change in unrealized gains (losses) on investments | | | | | | | 2,692,438 | | | | | | | | 3,059,682 | |
| | | | |
Net increase in net assets resulting from operations | | | | | | | 3,183,578 | | | | | | | | 3,087,488 | |
| | | | |
| | | | |
Distributions to shareholders from net investment income and net realized gains | | | | | | | | | | | | | | | | |
Class A | | | | | | | (113,765 | ) | | | | | | | (333,051 | ) |
Class C | | | | | | | (9,527 | ) | | | | | | | (28,644 | ) |
Class R6 | | | | | | | (203,448 | ) | | | | | | | (410,590 | ) |
Administrator Class | | | | | | | (118,115 | ) | | | | | | | (268,283 | ) |
Institutional Class | | | | | | | (97,958 | ) | | | | | | | (274,619 | ) |
| | | | |
Total distributions to shareholders | | | | | | | (542,813 | ) | | | | | | | (1,315,187 | ) |
| | | | |
| | | | |
Capital share transactions | | | Shares | | | | | | | | Shares | | | | | |
Proceeds from shares sold | | | | | | | | | | | | | | | | |
Class A | | | 234,470 | | | | 2,450,862 | | | | 341,385 | | | | 3,446,122 | |
Class C | | | 22,278 | | | | 228,745 | | | | 58,887 | | | | 586,232 | |
Class R6 | | | 486,193 | | | | 5,175,121 | | | | 700,870 | | | | 7,155,041 | |
Administrator Class | | | 319,355 | | | | 3,412,800 | | | | 754,263 | | | | 7,722,657 | |
Institutional Class | | | 186,884 | | | | 1,980,252 | | | | 587,649 | | | | 6,004,061 | |
| | | | |
| | | | | | | 13,247,780 | | | | | | | | 24,914,113 | |
| | | | |
Reinvestment of distributions | | | | | | | | | | | | | | | | |
Class A | | | 8,021 | | | | 84,905 | | | | 23,714 | | | | 238,785 | |
Class C | | | 871 | | | | 9,052 | | | | 2,484 | | | | 24,671 | |
Class R6 | | | 11,490 | | | | 122,982 | | | | 22,788 | | | | 231,443 | |
Administrator Class | | | 10,659 | | | | 114,697 | | | | 25,943 | | | | 265,162 | |
Institutional Class | | | 9,127 | | | | 97,689 | | | | 26,962 | | | | 274,014 | |
| | | | |
| | | | | | | 429,325 | | | | | | | | 1,034,075 | |
| | | | |
Payment for shares redeemed | | | | | | | | | | | | | | | | |
Class A | | | (289,746 | ) | | | (3,073,050 | ) | | | (865,507 | ) | | | (8,666,594 | ) |
Class C | | | (53,208 | ) | | | (552,035 | ) | | | (153,174 | ) | | | (1,519,143 | ) |
Class R6 | | | (255,333 | ) | | | (2,736,788 | ) | | | (395,994 | ) | | | (4,031,485 | ) |
Administrator Class | | | (395,313 | ) | | | (4,254,378 | ) | | | (827,804 | ) | | | (8,434,604 | ) |
Institutional Class | | | (298,671 | ) | | | (3,189,919 | ) | | | (699,776 | ) | | | (7,084,487 | ) |
| | | | |
| | | | | | | (13,806,170 | ) | | | | | | | (29,736,313 | ) |
| | | | |
Net decrease in net assets resulting from capital share transactions | | | | | | | (129,065 | ) | | | | | | | (3,788,125 | ) |
| | | | |
Total increase (decrease) in net assets | | | | | | | 2,511,700 | | | | | | | | (2,015,824 | ) |
| | | | |
| | | | |
Net assets | | | | | | | | | | | | | | | | |
Beginning of period | | | | | | | 57,265,992 | | | | | | | | 59,281,816 | |
| | | | |
End of period | | | | | | $ | 59,777,692 | | | | | | | $ | 57,265,992 | |
| | | | |
The accompanying notes are an integral part of these financial statements.
12 | Wells Fargo Real Return Fund
Financial highlights
(For a share outstanding throughout each period)
| | | | | | | | | | | | | | | | | | | | | | | | |
| | | Six months ended
November 30, 2020
(unaudited) | | | Year ended May 31 | |
| CLASS A | | 2020 | | | 2019 | | | 2018 | | | 2017 | | | 2016 | |
Net asset value, beginning of period | | | $10.22 | | | | $9.89 | | | | $9.87 | | | | $9.96 | | | | $9.95 | | | | $10.07 | |
Net investment income | | | 0.09 | | | | 0.12 | | | | 0.15 | | | | 0.21 | | | | 0.19 | 1 | | | 0.10 | 1 |
Net realized and unrealized gains (losses) on investments | | | 0.45 | | | | 0.42 | | | | 0.09 | | | | (0.09 | ) | | | 0.03 | | | | (0.01 | ) |
| | | | | | | | | | | | | | | | | | | | | | | | |
Total from investment operations | | | 0.54 | | | | 0.54 | | | | 0.24 | | | | 0.12 | | | | 0.22 | | | | 0.09 | |
Distributions to shareholders from | | | | | | | | | | | | | | | | | | | | | | | | |
Net investment income | | | (0.09 | ) | | | (0.21 | ) | | | (0.19 | ) | | | (0.21 | ) | | | (0.20 | ) | | | (0.07 | ) |
Net realized gains | | | 0.00 | | | | 0.00 | | | | (0.03 | ) | | | 0.00 | | | | (0.01 | ) | | | (0.14 | ) |
| | | | | | | | | | | | | | | | | | | | | | | | |
Total distributions to shareholders | | | (0.09 | ) | | | (0.21 | ) | | | (0.22 | ) | | | (0.21 | ) | | | (0.21 | ) | | | (0.21 | ) |
Net asset value, end of period | | | $10.67 | | | | $10.22 | | | | $9.89 | | | | $9.87 | | | | $9.96 | | | | $9.95 | |
Total return2 | | | 5.29 | % | | | 5.48 | % | | | 2.56 | % | | | 1.25 | % | | | 2.23 | % | | | 1.01 | % |
Ratios to average net assets (annualized) | | | | | | | | | | | | | | | | | | | | | | | | |
Gross expenses3 | | | 1.43 | % | | | 1.43 | % | | | 1.16 | % | | | 1.04 | % | | | 1.11 | % | | | 1.20 | % |
Net expenses3 | | | 0.78 | % | | | 0.78 | % | | | 0.77 | % | | | 0.80 | % | | | 0.85 | % | | | 0.85 | % |
Net investment income3 | | | 1.68 | % | | | 1.79 | % | | | 1.95 | % | | | 2.15 | % | | | 1.92 | % | | | 0.98 | % |
Supplemental data | | | | | | | | | | | | | | | | | | | | | | | | |
Portfolio turnover rate4 | | | 9 | % | | | 24 | % | | | 39 | % | | | 29 | % | | | 25 | % | | | 29 | % |
Net assets, end of period (000s omitted) | | | $13,273 | | | | $13,196 | | | | $17,716 | | | | $26,133 | | | | $29,678 | | | | $18,938 | |
| 1 | Calculated based upon average shares outstanding |
| 2 | Total return calculations do not include any sales charges. Returns for periods of less than one year are not annualized. |
| 3 | Ratios include net expenses allocated from the affiliated Master Portfolio which were as follows: |
| | | | |
Six months ended November 30, 2020 (unaudited) | | | 0.39 | % |
Year ended May 31, 2020 | | | 0.39 | % |
Year ended May 31, 2019 | | | 0.39 | % |
Year ended May 31, 2018 | | | 0.41 | % |
Year ended May 31, 2017 | | | 0.44 | % |
Year ended May 31, 2016 | | | 0.44 | % |
| 4 | Portfolio turnover rate is calculated by multiplying the affiliated Master Portfolio’s percentage of the Fund’s total investment in securities at the end of the period by the affiliated Master Portfolio’s portfolio turnover rate. |
The accompanying notes are an integral part of these financial statements.
Wells Fargo Real Return Fund | 13
Financial highlights
(For a share outstanding throughout each period)
| | | | | | | | | | | | | | | | | | | | | | | | |
| | | Six months ended
November 30, 2020
(unaudited) | | | Year ended May 31 | |
| CLASS C | | 2020 | | | 2019 | | | 2018 | | | 2017 | | | 2016 | |
Net asset value, beginning of period | | | $10.06 | | | | $9.73 | | | | $9.73 | | | | $9.82 | | | | $9.77 | | | | $9.92 | |
Net investment income | | | 0.05 | 1 | | | 0.11 | 1 | | | 0.10 | 1 | | | 0.03 | | | | 0.04 | | | | 0.03 | 1 |
Net realized and unrealized gains (losses) on investments | | | 0.44 | | | | 0.35 | | | | 0.07 | | | | 0.02 | | | | 0.10 | | | | (0.02 | ) |
| | | | | | | | | | | | | | | | | | | | | | | | |
Total from investment operations | | | 0.49 | | | | 0.46 | | | | 0.17 | | | | 0.05 | | | | 0.14 | | | | 0.01 | |
Distributions to shareholders from | | | | | | | | | | | | | | | | | | | | | | | | |
Net investment income | | | (0.06 | ) | | | (0.13 | ) | | | (0.14 | ) | | | (0.14 | ) | | | (0.08 | ) | | | (0.02 | ) |
Net realized gains | | | 0.00 | | | | 0.00 | | | | (0.03 | ) | | | 0.00 | | | | (0.01 | ) | | | (0.14 | ) |
| | | | | | | | | | | | | | | | | | | | | | | | |
Total distributions to shareholders | | | (0.06 | ) | | | (0.13 | ) | | | (0.17 | ) | | | (0.14 | ) | | | (0.09 | ) | | | (0.16 | ) |
Net asset value, end of period | | | $10.49 | | | | $10.06 | | | | $9.73 | | | | $9.73 | | | | $9.82 | | | | $9.77 | |
Total return2 | | | 4.90 | % | | | 4.77 | % | | | 1.79 | % | | | 0.53 | % | | | 1.44 | % | | | 0.21 | % |
Ratios to average net assets (annualized) | | | | | | | | | | | | | | | | | | | | | | | | |
Gross expenses3 | | | 2.18 | % | | | 2.18 | % | | | 1.91 | % | | | 1.79 | % | | | 1.86 | % | | | 1.95 | % |
Net expenses3 | | | 1.53 | % | | | 1.53 | % | | | 1.52 | % | | | 1.56 | % | | | 1.60 | % | | | 1.60 | % |
Net investment income3 | | | 0.87 | % | | | 1.09 | % | | | 1.08 | % | | | 1.39 | % | | | 1.23 | % | | | 0.30 | % |
Supplemental data | | | | | | | | | | | | | | | | | | | | | | | | |
Portfolio turnover rate4 | | | 9 | % | | | 24 | % | | | 39 | % | | | 29 | % | | | 25 | % | | | 29 | % |
Net assets, end of period (000s omitted) | | | $1,472 | | | | $1,714 | | | | $2,553 | | | | $3,517 | | | | $4,580 | | | | $5,654 | |
| 1 | Calculated based upon average shares outstanding |
| 2 | Total return calculations do not include any sales charges. Returns for periods of less than one year are not annualized. |
| 3 | Ratios include net expenses allocated from the affiliated Master Portfolio which were as follows: |
| | | | |
Six months ended November 30, 2020 (unaudited) | | | 0.39 | % |
Year ended May 31, 2020 | | | 0.39 | % |
Year ended May 31, 2019 | | | 0.39 | % |
Year ended May 31, 2018 | | | 0.44 | % |
Year ended May 31, 2017 | | | 0.44 | % |
Year ended May 31, 2016 | | | 0.44 | % |
| 4 | Portfolio turnover rate is calculated by multiplying the affiliated Master Portfolio’s percentage of the Fund’s total investment in securities at the end of the period by the affiliated Master Portfolio’s portfolio turnover rate. |
The accompanying notes are an integral part of these financial statements.
14 | Wells Fargo Real Return Fund
Financial highlights
(For a share outstanding throughout each period)
| | | | | | | | | | | | | | | | | | | | |
| | | Six months ended
November 30, 2020
(unaudited) | | | Year ended May 31 | |
| CLASS R6 | | 2020 | | | 2019 | | | 2018 | | | 20171 | |
Net asset value, beginning of period | | | $10.33 | | | | $9.99 | | | | $9.96 | | | | $10.05 | | | | $10.17 | |
Net investment income | | | 0.12 | | | | 0.22 | | | | 0.23 | 2 | | | 0.22 | | | | 0.10 | |
Net realized and unrealized gains (losses) on investments | | | 0.44 | | | | 0.37 | | | | 0.06 | | | | (0.06 | ) | | | (0.07 | ) |
| | | | | | | | | | | | | | | | | | | | |
Total from investment operations | | | 0.56 | | | | 0.59 | | | | 0.29 | | | | 0.16 | | | | 0.03 | |
Distributions to shareholders from | | | | | | | | | | | | | | | | | | | | |
Net investment income | | | (0.11 | ) | | | (0.25 | ) | | | (0.23 | ) | | | (0.25 | ) | | | (0.14 | ) |
Net realized gains | | | 0.00 | | | | 0.00 | | | | (0.03 | ) | | | 0.00 | | | | (0.01 | ) |
| | | | | | | | | | | | | | | | | | | | |
Total distributions to shareholders | | | (0.11 | ) | | | (0.25 | ) | | | (0.26 | ) | | | (0.25 | ) | | | (0.15 | ) |
Net asset value, end of period | | | $10.78 | | | | $10.33 | | | | $9.99 | | | | $9.96 | | | | $10.05 | |
Total return3 | | | 5.44 | % | | | 5.94 | % | | | 2.99 | % | | | 1.63 | % | | | 0.36 | % |
Ratios to average net assets (annualized) | | | | | | | | | | | | | | | | | | | | |
Gross expenses4 | | | 1.05 | % | | | 1.05 | % | | | 0.82 | % | | | 0.66 | % | | | 0.69 | % |
Net expenses4 | | | 0.40 | % | | | 0.40 | % | | | 0.39 | % | | | 0.42 | % | | | 0.47 | % |
Net investment income4 | | | 2.10 | % | | | 2.08 | % | | | 2.34 | % | | | 2.52 | % | | | 1.32 | % |
Supplemental data | | | | | | | | | | | | | | | | | | | | |
Portfolio turnover rate5 | | | 9 | % | | | 24 | % | | | 39 | % | | | 29 | % | | | 25 | % |
Net assets, end of period (000s omitted) | | | $21,641 | | | | $18,224 | | | | $14,358 | | | | $11,750 | | | | $7,438 | |
| 1 | For the period from October 31, 2016 (commencement of class operations) to May 31, 2017 |
| 2 | Calculated based upon average shares outstanding |
| 3 | Returns for periods of less than one year are not annualized. |
| 4 | Ratios include net expenses allocated from the affiliated Master Portfolio which were as follows: |
| | | | |
Six months ended November 30, 2020 (unaudited) | | | 0.39 | % |
Year ended May 31, 2020 | | | 0.39 | % |
Year ended May 31, 2019 | | | 0.39 | % |
Year ended May 31, 2018 | | | 0.41 | % |
Year ended May 31, 20171 | | | 0.44 | % |
| 5 | Portfolio turnover rate is calculated by multiplying the affiliated Master Portfolio’s percentage of the Fund’s total investment in securities at the end of the period by the affiliated Master Portfolio’s portfolio turnover rate. |
The accompanying notes are an integral part of these financial statements.
Wells Fargo Real Return Fund | 15
Financial highlights
(For a share outstanding throughout each period)
| | | | | | | | | | | | | | | | | | | | | | | | |
| | | Six months ended
November 30, 2020
(unaudited) | | | Year ended May 31 | |
| ADMINISTRATOR CLASS | | 2020 | | | 2019 | | | 2018 | | | 2017 | | | 2016 | |
Net asset value, beginning of period | | | $10.38 | | | | $10.03 | | | | $9.99 | | | | $10.06 | | | | $10.03 | | | | $10.15 | |
Net investment income | | | 0.10 | 1 | | | 0.20 | 1 | | | 0.21 | 1 | | | 0.24 | 1 | | | 0.22 | 1 | | | 0.13 | 1 |
Net realized and unrealized gains (losses) on investments | | | 0.46 | | | | 0.36 | | | | 0.06 | | | | (0.09 | ) | | | 0.02 | | | | (0.02 | ) |
| | | | | | | | | | | | | | | | | | | | | | | | |
Total from investment operations | | | 0.56 | | | | 0.56 | | | | 0.27 | | | | 0.15 | | | | 0.24 | | | | 0.11 | |
Distributions to shareholders from | | | | | | | | | | | | | | | | | | | | | | | | |
Net investment income | | | (0.09 | ) | | | (0.21 | ) | | | (0.20 | ) | | | (0.22 | ) | | | (0.20 | ) | | | (0.09 | ) |
Net realized gains | | | 0.00 | | | | 0.00 | | | | (0.03 | ) | | | 0.00 | | | | (0.01 | ) | | | (0.14 | ) |
| | | | | | | | | | | | | | | | | | | | | | | | |
Total distributions to shareholders | | | (0.09 | ) | | | (0.21 | ) | | | (0.23 | ) | | | (0.22 | ) | | | (0.21 | ) | | | (0.23 | ) |
Net asset value, end of period | | | $10.85 | | | | $10.38 | | | | $10.03 | | | | $9.99 | | | | $10.06 | | | | $10.03 | |
Total return2 | | | 5.44 | % | | | 5.67 | % | | | 2.78 | % | | | 1.50 | % | | | 2.46 | % | | | 1.21 | % |
Ratios to average net assets (annualized) | | | | | | | | | | | | | | | | | | | | | | | | |
Gross expenses3 | | | 1.37 | % | | | 1.37 | % | | | 1.10 | % | | | 0.97 | % | | | 1.04 | % | | | 1.13 | % |
Net expenses3 | | | 0.60 | % | | | 0.60 | % | | | 0.59 | % | | | 0.60 | % | | | 0.60 | % | | | 0.60 | % |
Net investment income3 | | | 1.91 | % | | | 1.92 | % | | | 2.15 | % | | | 2.39 | % | | | 2.20 | % | | | 1.30 | % |
Supplemental data | | | | | | | | | | | | | | | | | | | | | | | | |
Portfolio turnover rate4 | | | 9 | % | | | 24 | % | | | 39 | % | | | 29 | % | | | 25 | % | | | 29 | % |
Net assets, end of period (000s omitted) | | | $13,443 | | | | $13,544 | | | | $13,562 | | | | $23,331 | | | | $26,100 | | | | $20,607 | |
| 1 | Calculated based upon average shares outstanding |
| 2 | Returns for periods of less than one year are not annualized. |
| 3 | Ratios include net expenses allocated from the affiliated Master Portfolio which were as follows: |
| | | | |
Six months ended November 30, 2020 (unaudited) | | | 0.39 | % |
Year ended May 31, 2020 | | | 0.39 | % |
Year ended May 31, 2019 | | | 0.39 | % |
Year ended May 31, 2018 | | | 0.41 | % |
Year ended May 31, 2017 | | | 0.44 | % |
Year ended May 31, 2016 | | | 0.44 | % |
| 4 | Portfolio turnover rate is calculated by multiplying the affiliated Master Portfolio’s percentage of the Fund’s total investment in securities at the end of the period by the affiliated Master Portfolio’s portfolio turnover rate. |
The accompanying notes are an integral part of these financial statements.
16 | Wells Fargo Real Return Fund
Financial highlights
(For a share outstanding throughout each period)
| | | | | | | | | | | | | | | | | | | | |
| | | Six months ended
November 30, 2020
(unaudited) | | | Year ended May 31 | |
| INSTITUTIONAL CLASS | | 2020 | | | 2019 | | | 2018 | | | 20171 | |
Net asset value, beginning of period | | | $10.33 | | | | $9.99 | | | | $9.97 | | | | $10.06 | | | | $10.17 | |
Net investment income | | | 0.10 | | | | 0.21 | | | | 0.22 | | | | 0.24 | | | | 0.14 | |
Net realized and unrealized gains (losses) on investments | | | 0.47 | | | | 0.37 | | | | 0.05 | | | | (0.08 | ) | | | (0.10 | ) |
| | | | | | | | | | | | | | | | | | | | |
Total from investment operations | | | 0.57 | | | | 0.58 | | | | 0.27 | | | | 0.16 | | | | 0.04 | |
Distributions to shareholders from | | | | | | | | | | | | | | | | | | | | |
Net investment income | | | (0.11 | ) | | | (0.24 | ) | | | (0.22 | ) | | | (0.25 | ) | | | (0.14 | ) |
Net realized gains | | | 0.00 | | | | 0.00 | | | | (0.03 | ) | | | 0.00 | | | | (0.01 | ) |
| | | | | | | | | | | | | | | | | | | | |
Total distributions to shareholders | | | (0.11 | ) | | | (0.24 | ) | | | (0.25 | ) | | | (0.25 | ) | | | (0.15 | ) |
Net asset value, end of period | | | $10.79 | | | | $10.33 | | | | $9.99 | | | | $9.97 | | | | $10.06 | |
Total return2 | | | 5.51 | % | | | 5.78 | % | | | 2.84 | % | | | 1.57 | % | | | 0.41 | % |
Ratios to average net assets (annualized) | | | | | | | | | | | | | | | | | | | | |
Gross expenses3 | | | 1.10 | % | | | 1.10 | % | | | 0.84 | % | | | 0.71 | % | | | 0.76 | % |
Net expenses3 | | | 0.45 | % | | | 0.45 | % | | | 0.44 | % | | | 0.47 | % | | | 0.52 | % |
Net investment income3 | | | 1.87 | % | | | 2.09 | % | | | 2.20 | % | | | 2.62 | % | | | 2.24 | % |
Supplemental data | | | | | | | | | | | | | | | | | | | | |
Portfolio turnover rate4 | | | 9 | % | | | 24 | % | | | 39 | % | | | 29 | % | | | 25 | % |
Net assets, end of period (000s omitted) | | | $9,948 | | | | $10,587 | | | | $11,094 | | | | $12,110 | | | | $5,229 | |
| 1 | For the period from October 31, 2016 (commencement of class operations) to May 31, 2017 |
| 2 | Returns for periods of less than one year are not annualized. |
| 3 | Ratios include net expenses allocated from the affiliated Master Portfolio which were as follows: |
| | | | |
Six months ended November 30, 2020 (unaudited) | | | 0.39 | % |
Year ended May 31, 2020 | | | 0.39 | % |
Year ended May 31, 2019 | | | 0.39 | % |
Year ended May 31, 2018 | | | 0.41 | % |
Year ended May 31, 20171 | | | 0.44 | % |
| 4 | Portfolio turnover rate is calculated by multiplying the affiliated Master Portfolio’s percentage of the Fund’s total investments in securities at the end of the period by the affiliated Master Portfolio’s portfolio turnover rate. |
The accompanying notes are an integral part of these financial statements.
Wells Fargo Real Return Fund | 17
Notes to financial statements (unaudited)
1. ORGANIZATION
Wells Fargo Funds Trust (the “Trust”), a Delaware statutory trust organized on March 10, 1999, is an open-end management investment company registered under the Investment Company Act of 1940, as amended (the “1940 Act”). As an investment company, the Trust follows the accounting and reporting guidance in Financial Accounting Standards Board (“FASB”) Accounting Standards Codification Topic 946, Financial Services – Investment Companies. These financial statements report on the Wells Fargo Real Return Fund (the “Fund”) which is a diversified series of the Trust.
The Fund is a feeder fund in a master-feeder structure that invests substantially all of its assets in a single master portfolio with a substantially identical investment objective and substantially similar investment strategies. The Fund invests in Wells Fargo Real Return Portfolio, a separate diversified portfolio (the “affiliated Master Portfolio”) of Wells Fargo Master Trust, a registered open-end management investment company. As of November 30, 2020, the Fund owned 27% of Wells Fargo Real Return Portfolio. The affiliated Master Portfolio directly acquires portfolio securities and the Fund acquires an indirect interest in those securities. The Fund accounts for its investment in the affiliated Master Portfolio as a partnership investment and records on a daily basis its share of the affiliated Master Portfolio’s income, expense and realized and unrealized gains and losses. The financial statements of the affiliated Master Portfolio for the six months ended November 30, 2020 are included in this report and should be read in conjunction with the Fund’s financial statements.
2. SIGNIFICANT ACCOUNTING POLICIES
The following significant accounting policies, which are consistently followed in the preparation of the financial statements of the Fund, are in conformity with U.S. generally accepted accounting principles which require management to make estimates and assumptions that affect the reported amounts of assets and liabilities, disclosure of contingent assets and liabilities at the date of the financial statements, and the reported amounts of revenues and expenses during the reporting period. Actual results could differ from those estimates.
Securities valuation
All investments are valued each business day as of the close of regular trading on the New York Stock Exchange (generally 4 p.m. Eastern Time), although the Fund may deviate from this calculation time under unusual or unexpected circumstances.
Investments in the affiliated Master Portfolio are valued daily based on the Fund’s proportionate share of the affiliated Master Portfolio’s net assets, which are also valued daily. Securities held in the affiliated Master Portfolio are valued as discussed in the Notes to Financial Statements of the affiliated Master Portfolio, which are included elsewhere in this report.
Investments which are not valued using the method discussed above are valued at their fair value, as determined in good faith by the Board of Trustees of the Fund. The Board of Trustees has established a Valuation Committee comprised of the Trustees and has delegated to it the authority to take any actions regarding the valuation of portfolio securities that the Valuation Committee deems necessary or appropriate, including determining the fair value of portfolio securities, unless the determination has been delegated to the Wells Fargo Asset Management Pricing Committee at Wells Fargo Funds Management, LLC (“Funds Management”). The Board of Trustees retains the authority to make or ratify any valuation decisions or approve any changes to the Valuation Procedures as it deems appropriate. On a quarterly basis, the Board of Trustees receives reports on any valuation actions taken by the Valuation Committee or the Wells Fargo Asset Management Pricing Committee which may include items for ratification.
Investment transactions, income and expenses
Investments in the affiliated Master Portfolio are recorded on a trade basis. The Fund records daily its proportionate share of the affiliated Master Portfolio’s income, expenses and realized and unrealized gains or losses. The Fund also accrues its own expenses.
Distributions to shareholders
Distributions to shareholders are recorded on the ex-dividend date and paid from net investment income monthly and any net realized gains are paid at least annually. Such distributions are determined in accordance with income tax regulations and may differ from U.S. generally accepted accounting principles. Dividend sources are estimated at the time of declaration. The tax character of distributions is determined as of the Fund’s fiscal year end. Therefore, a portion of the Fund’s distributions made prior to the Fund’s fiscal year end may be categorized as a tax return of capital at year end.
Federal and other taxes
The Fund intends to continue to qualify as a regulated investment company by distributing substantially all of its investment company taxable income and any net realized capital gains (after reduction for capital loss carryforwards) sufficient to relieve it from all, or substantially all, federal income taxes. Accordingly, no provision for federal income taxes was required.
18 | Wells Fargo Real Return Fund
Notes to financial statements (unaudited)
The Fund’s income and federal excise tax returns and all financial records supporting those returns for the prior three fiscal years are subject to examination by the federal and Delaware revenue authorities. Management has analyzed the Fund’s tax positions taken on federal, state, and foreign tax returns for all open tax years and does not believe that there are any uncertain tax positions that require recognition of a tax liability.
As of November 30, 2020, the aggregate cost of all investments for federal income tax purposes was $53,040,192 and the unrealized gains (losses) consisted of:
| | | | |
| |
Gross unrealized gains | | $ | 6,658,536 | |
| |
Gross unrealized losses | | | 0 | |
| |
Net unrealized gains | | $ | 6,658,536 | |
As of May 31, 2020, the Fund had capital loss carryforwards which consisted of $1,082,708 in short-term capital losses and $906,231 in long-term capital losses.
Class allocations
The separate classes of shares offered by the Fund differ principally in applicable sales charges, distribution, shareholder servicing, and administration fees. Class specific expenses are charged directly to that share class. Investment income, common fund-level expenses, and realized and unrealized gains (losses) on investments are allocated daily to each class of shares based on the relative proportion of net assets of each class.
3. FAIR VALUATION MEASUREMENTS
At November 30, 2020, the affiliated Master Portfolio was measured at fair value using the net asset value per share (or its equivalent) as a practical expedient. The investment objective and the value of the affiliate Master Portfolio was as follows:
| | | | | | |
| | |
| Affiliated Master Portfolio | | Investment objective | | Value of affiliated Master Portfolio | |
| | |
Wells Fargo Real Return Portfolio | | Seeks returns that exceed the rate of inflation over the long-term | | $ | 59,698,728 | |
The affiliated Master Portfolio does not have a redemption period notice, can be redeemed daily and does not have any unfunded commitments.
4. TRANSACTIONS WITH AFFILIATES
Management fee
Funds Management, an indirect wholly owned subsidiary of Wells Fargo & Company (“Wells Fargo”), is the manager of the Fund and provides advisory and fund-level administrative services under an investment management agreement. Under the investment management agreement, Funds Management is responsible for, among other services, implementing the investment objectives and strategies of the Fund and providing fund-level administrative services in connection with the Fund’s operations. As long as the Fund continues to invest substantially all of its assets in a single affiliated Master Portfolio, the Fund pays Funds Management an investment management fee only for fund-level administrative services at the following annual rate based on the Fund’s average daily net assets:
| | | | |
| |
| Average daily net assets | | Management fee | |
| |
First $5 billion | | | 0.05 | % |
| |
Next $5 billion | | | 0.04 | |
| |
Over $10 billion | | | 0.03 | |
For the six months ended November 30, 2020, the management fee was equivalent to an annual rate of 0.05% of the Fund’s average daily net assets.
Funds Management also serves as the adviser to the affiliated Master Portfolio and is entitled to receive a fee from each affiliated Master Portfolio for those services.
Administration fees
Under a class-level administration agreement, Funds Management provides class-level administrative services to the Fund, which includes paying fees and expenses for services provided by the transfer agent, sub-transfer agents, omnibus account
Wells Fargo Real Return Fund | 19
Notes to financial statements (unaudited)
servicers and record-keepers. As compensation for its services under the class-level administration agreement, Funds Management receives an annual fee which is calculated based on the average daily net assets of each class as follows:
| | | | |
| |
| | | Class-level administration fee | |
| |
Class A, Class C | | | 0.16 | % |
| |
Class R6 | | | 0.03 | |
| |
Administrator Class | | | 0.10 | |
| |
Institutional Class | | | 0.08 | |
Waivers and/or expense reimbursements
Funds Management has contractually waived and/or reimbursed management and administration fees to the extent necessary to maintain certain net operating expense ratios for the Fund. When each class of the Fund has exceeded its expense cap, Funds Management has waived fees and/or reimbursed expenses from fund-level expenses on a proportionate basis and then from class specific expenses. When only certain classes exceed their expense caps, waivers and/or reimbursements are applied against class specific expenses before fund-level expenses. Net expenses from the affiliated Master Portfolio are included in the expense caps. Funds Management has committed through September 30, 2021 to waive fees and/or reimburse expenses to the extent necessary to cap the Fund’s expenses at 0.78% for Class A shares, 1.53% for Class C shares, 0.40% for Class R6 shares, and 0.60% for Administrator Class shares, and 0.45% for Institutional Class shares. Prior to or after the commitment expiration date, the cap may be increased or the commitment to maintain the cap may be terminated only with the approval of the Board of Trustees.
Distribution fee
The Trust has adopted a distribution plan for Class C shares of the Fund pursuant to Rule 12b-1 under the 1940 Act. A distribution fee is charged to Class C shares and paid to Wells Fargo Funds Distributor, LLC (“Funds Distributor”), the principal underwriter, at an annual rate of 0.75% of the average daily net assets of Class C shares.
In addition, Funds Distributor is entitled to receive the front-end sales charge from the purchase of Class A shares and a contingent deferred sales charge on the redemption of certain Class A shares. Funds Distributor is also entitled to receive the contingent deferred sales charges from redemptions of Class C shares. For the six months ended November 30, 2020, Funds Distributor received $367 from the sale of Class A shares. No contingent deferred sales charges were incurred by Class A and Class C shares for the six months ended November 30, 2020.
Shareholder servicing fees
The Trust has entered into contracts with one or more shareholder servicing agents, whereby Class A, Class C, and Administrator Class of the Fund are charged a fee at an annual rate of 0.25% of the average daily net assets of each respective class. A portion of these total shareholder servicing fees were paid to affiliates of Wells Fargo.
5. INVESTMENT PORTFOLIO TRANSACTIONS
The Fund seeks to achieve its investment objective by investing substantially all of its assets in a single affiliated Master Portfolio. Purchases and sales have been calculated by multiplying the Fund’s ownership percentage of the affiliated Master Portfolio by the affiliated Master Portfolio’s purchases and sales. Purchases and sales of investments, excluding short-term securities, for the six months ended November 30, 2020 were as follows:
| | | | | | |
Purchases at cost | | Sales proceeds |
U.S. government | | Non-U.S. government | | U.S. government | | Non-U.S. government |
| $9,094,158 | | $8,171,588 | | $839,712 | | $3,480,931 |
6. BANK BORROWINGS
The Trust (excluding the money market funds), Wells Fargo Master Trust and Wells Fargo Variable Trust are parties to a $350,000,000 revolving credit agreement whereby the Fund is permitted to use bank borrowings for temporary or emergency purposes, such as to fund shareholder redemption requests. Interest under the credit agreement is charged to the Fund based on a borrowing rate equal to the higher of the Federal Funds rate in effect on that day plus 1.25% or the overnight LIBOR rate in effect on that day plus 1.25%. In addition, an annual commitment fee equal to 0.25% of the unused balance is allocated to each participating fund.
20 | Wells Fargo Real Return Fund
Notes to financial statements (unaudited)
For the six months ended November 30, 2020, there were no borrowings by the Fund under the agreement.
7. INDEMNIFICATION
Under the Fund’s organizational documents, the officers and Trustees have been granted certain indemnification rights against certain liabilities that may arise out of performance of their duties to the Fund. The Fund has entered into a separate agreement with each Trustee that converts indemnification rights currently existing under the Fund’s organizational documents into contractual rights that cannot be changed in the future without the consent of the Trustee. Additionally, in the normal course of business, the Fund may enter into contracts with service providers that contain a variety of indemnification clauses. The Fund’s maximum exposure under these arrangements is dependent on future claims that may be made against the Fund and, therefore, cannot be estimated.
8. NEW ACCOUNTING PRONOUNCEMENT
In August 2018, FASB issued Accounting Standards Update (“ASU”) No. 2018-13, Fair Value Measurement (Topic 820) Disclosure Framework—Changes to the Disclosure Requirements for Fair Value Measurement. ASU 2018-13 updates the disclosure requirements on fair value measurements in Topic 820, Fair Value Measurements. The amendments are effective for fiscal years, and interim periods within those fiscal years, beginning after December 15, 2019. Management has adopted this guidance which did not have a material impact on the financial statements.
9. CORONAVIRUS (COVID-19) PANDEMIC
On March 11, 2020, the World Health Organization announced that it had made the assessment that coronavirus disease 2019 (“COVID-19”) is a pandemic. The impacts of COVID-19 are adversely affecting the entire global economy, individual companies and investment products, and the market in general. There is significant uncertainty around the extent and duration of business disruptions related to COVID-19 and the impacts may be short term or may last for an extended period of time. The risk of further spreading of COVID-19 has led to significant uncertainty and volatility in the financial markets.
Wells Fargo Real Return Fund | 21
Portfolio of investments—November 30, 2020 (unaudited)
| | | | | | | | | | | | | | | | |
| | | | | | | | | Shares | | | Value | |
| Common Stocks: 13.41% | |
|
Consumer Staples: 4.47% | |
|
| Beverages: 0.68% | |
PepsiCo Incorporated | | | | | | | | | | | 10,246 | | | $ | 1,477,781 | |
| | | | | | | | | | | | | | | | |
|
| Food & Staples Retailing: 1.47% | |
Costco Wholesale Corporation | | | | | | | | | | | 2,497 | | | | 978,250 | |
Sysco Corporation | | | | | | | | | | | 8,236 | | | | 587,144 | |
Walmart Incorporated | | | | | | | | | | | 10,637 | | | | 1,625,227 | |
| | | | |
| | | | | | | | | | | | | | | 3,190,621 | |
| | | | | | | | | | | | | | | | |
|
| Food Products: 0.61% | |
Mondelez International Incorporated Class A | | | | | | | | | | | 13,731 | | | | 788,846 | |
Nomad Foods Limited † | | | | | | | | | | | 22,626 | | | | 546,418 | |
| | | | |
| | | | | | | | | | | | | | | 1,335,264 | |
| | | | | | | | | | | | | | | | |
|
| Household Products: 1.56% | |
Church & Dwight Company Incorporated | | | | | | | | | | | 8,444 | | | | 741,130 | |
The Clorox Company | | | | | | | | | | | 2,189 | | | | 444,279 | |
The Procter & Gamble Company | | | | | | | | | | | 15,936 | | | | 2,213,032 | |
| | | | |
| | | | | | | | | | | | | | | 3,398,441 | |
| | | | | | | | | | | | | | | | |
|
| Tobacco: 0.15% | |
Philip Morris International Incorporated | | | | | | | | | | | 4,390 | | | | 332,543 | |
| | | | | | | | | | | | | | | | |
|
Energy: 0.98% | |
|
| Oil, Gas & Consumable Fuels: 0.98% | |
Chevron Corporation | | | | | | | | | | | 14,933 | | | | 1,301,859 | |
Phillips 66 | | | | | | | | | | | 13,681 | | | | 828,795 | |
| | | | |
| | | | | | | | | | | | | | | 2,130,654 | |
| | | | | | | | | | | | | | | | |
|
Financials: 0.11% | |
|
| Mortgage REITs: 0.11% | |
AGNC Investment Corporation | | | | | | | | | | | 15,892 | | | | 242,830 | |
| | | | | | | | | | | | | | | | |
|
Materials: 3.49% | |
|
| Chemicals: 1.46% | |
Ecolab Incorporated | | | | | | | | | | | 2,642 | | | | 586,920 | |
Linde plc | | | | | | | | | | | 4,987 | | | | 1,278,767 | |
The Sherwin-Williams Company | | | | | | | | | | | 1,009 | | | | 754,359 | |
Westlake Chemical Corporation | | | | | | | | | | | 7,573 | | | | 569,111 | |
| | | | |
| | | | | | | | | | | | | | | 3,189,157 | |
| | | | | | | | | | | | | | | | |
|
| Construction Materials: 0.18% | |
Martin Marietta Materials Incorporated | | | | | | | | | | | 1,432 | | | | 380,382 | |
| | | | | | | | | | | | | | | | |
|
| Containers & Packaging: 0.18% | |
Crown Holdings Incorporated † | | | | | | | | | | | 4,206 | | | | 396,416 | |
| | | | | | | | | | | | | | | | |
|
| Metals & Mining: 1.67% | |
Agnico-Eagle Mines Limited | | | | | | | | | | | 2,500 | | | | 164,675 | |
Alamos Gold Incorporated Class A | | | | | | | | | | | 8,000 | | | | 66,220 | |
AngloGold Ashanti Limited ADR | | | | | | | | | | | 4,200 | | | | 91,014 | |
B2Gold Corporation | | | | 28,000 | | | | 156,095 | |
The accompanying notes are an integral part of these financial statements.
22 | Wells Fargo Real Return Portfolio
Portfolio of investments—November 30, 2020 (unaudited)
| | | | | | | | | | | | | | | | |
| | | | | | | | | Shares | | | Value | |
|
| Metals & Mining (continued) | |
Barrick Gold Corporation | | | | 10,956 | | | $ | 253,522 | |
Centerra Gold Incorporated | | | | 6,000 | | | | 58,582 | |
Endeavour Mining Corporation † | | | | 3,300 | | | | 77,831 | |
Evolution Mining Limited | | | | 22,000 | | | | 80,261 | |
Fortuna Silver Mines Incorporated † | | | | 6,000 | | | | 38,207 | |
Franco-Nevada Corporation | | | | 1,300 | | | | 173,043 | |
Gold Fields Limited ADR | | | | 11,500 | | | | 100,165 | |
Kinross Gold Corporation | | | | 30,000 | | | | 213,675 | |
Kirkland Lake Gold Limited | | | | 5,037 | | | | 206,375 | |
Lundin Gold Incorporated † | | | | 5,000 | | | | 44,275 | |
MAG Silver Corporation † | | | | 6,000 | | | | 91,384 | |
Newcrest Mining Limited | | | | 6,000 | | | | 118,608 | |
Newmont Corporation | | | | 5,090 | | | | 299,394 | |
Northern Star Resources Limited | | | | 14,000 | | | | 129,589 | |
Pan American Silver Corporation | | | | 3,300 | | | | 97,449 | |
Royal Gold Incorporated | | | | 3,084 | | | | 340,689 | |
SilverCrest Metals Incorporated † | | | | 4,000 | | | | 35,112 | |
SSR Mining Incorporated † | | | | 2,272 | | | | 42,057 | |
SSR Mining Incorporated † | | | | 3,100 | | | | 57,071 | |
Steel Dynamics Incorporated | | | | 9,914 | | | | 358,986 | |
Teranga Gold Corporation † | | | | 4,000 | | | | 44,167 | |
Torex Gold Resources Incorporated † | | | | 6,600 | | | | 91,070 | |
Wheaton Precious Metals Corporation | | | | 3,900 | | | | 150,541 | |
Yamana Gold Incorporated | | | | 12,000 | | | | 62,647 | |
| | | | |
| | | | | | | | | | | | | | | 3,642,704 | |
| | | | | | | | | | | | | | | | |
|
Real Estate: 4.36% | |
|
| Equity REITs: 4.36% | |
Alexandria Real Estate Equities Incorporated | | | | 2,828 | | | | 463,028 | |
American Homes 4 Rent Class A | | | | 13,884 | | | | 398,748 | |
American Tower Corporation | | | | 4,503 | | | | 1,041,094 | |
Camden Property Trust | | | | 4,094 | | | | 404,610 | |
CoreSite Realty Corporation | | | | 3,197 | | | | 400,872 | |
Equinix Incorporated | | | | 1,388 | | | | 968,533 | |
Federal Realty Investment Trust | | | | 2,676 | | | | 233,401 | |
Four Corners Property Trust Incorporated | | | | 17,679 | | | | 495,189 | |
Healthcare Realty Trust Incorporated | | | | 10,353 | | | | 305,414 | |
Host Hotels & Resorts Incorporated | | | | 19,066 | | | | 267,496 | |
Invitation Homes Incorporated | | | | 15,334 | | | | 438,246 | |
Mid-America Apartment Communities Incorporated | | | | 3,257 | | | | 410,903 | |
Prologis Incorporated | | | | 8,930 | | | | 893,447 | |
SBA Communications Corporation | | | | 2,086 | | | | 599,057 | |
Simon Property Group Incorporated | | | | 2,409 | | | | 198,911 | |
STAG Industrial Incorporated | | | | 11,242 | | | | 334,787 | |
Sun Communities Incorporated | | | | 4,020 | | | | 558,780 | |
VICI Properties Incorporated | | | | 25,295 | | | | 639,711 | |
Welltower Incorporated | | | | 6,879 | | | | 433,239 | |
| | | | |
| | | | | | | | | | | | | | | 9,485,466 | |
| | | | | | | | | | | | | | | | |
| |
Total Common Stocks (Cost $22,516,767) | | | | 29,202,259 | |
| | | | | |
| | | | |
| | | | | | | | | | | | | | | | |
The accompanying notes are an integral part of these financial statements.
Wells Fargo Real Return Portfolio | 23
Portfolio of investments—November 30, 2020 (unaudited)
| | | | | | | | | | | | | | | | |
| | | Interest rate | | | Maturity date | | | Principal | | | Value | |
| Corporate Bonds and Notes: 14.31% | |
|
Communication Services: 2.02% | |
|
| Diversified Telecommunication Services: 0.44% | |
CenturyLink Incorporated | | | 6.75 | % | | | 12-1-2023 | | | $ | 260,000 | | | $ | 288,353 | |
CenturyLink Incorporated | | | 6.45 | | | | 6-15-2021 | | | | 155,000 | | | | 159,108 | |
CommScope Holding Company Incorporated 144A | | | 5.50 | | | | 3-1-2024 | | | | 290,000 | | | | 297,975 | |
Level 3 Financing Incorporated | | | 5.38 | | | | 1-15-2024 | | | | 125,000 | | | | 125,875 | |
Level 3 Financing Incorporated | | | 5.38 | | | | 5-1-2025 | | | | 85,000 | | | | 87,257 | |
| | | | |
| | | | | | | | | | | | | | | 958,568 | |
| | | | | | | | | | | | | | | | |
|
| Entertainment: 0.43% | |
Live Nation Entertainment Incorporated 144A | | | 4.88 | | | | 11-1-2024 | | | | 170,000 | | | | 168,725 | |
Live Nation Entertainment Incorporated 144A | | | 6.50 | | | | 5-15-2027 | | | | 150,000 | | | | 166,125 | |
Netflix Incorporated | | | 5.38 | | | | 2-1-2021 | | | | 600,000 | | | | 604,500 | |
| | | | |
| | | | | | | | | | | | | | | 939,350 | |
| | | | | | | | | | | | | | | | |
|
| Media: 0.98% | |
CCO Holdings LLC 144A | | | 5.13 | | | | 5-1-2027 | | | | 600,000 | | | | 631,269 | |
CSC Holdings LLC 144A | | | 5.50 | | | | 4-15-2027 | | | | 200,000 | | | | 211,100 | |
CSC Holdings LLC | | | 6.75 | | | | 11-15-2021 | | | | 105,000 | | | | 109,840 | |
DISH DBS Corporation | | | 5.88 | | | | 7-15-2022 | | | | 190,000 | | | | 199,553 | |
DISH DBS Corporation | | | 6.75 | | | | 6-1-2021 | | | | 155,000 | | | | 158,371 | |
Sirius XM Radio Incorporated 144A | | | 3.88 | | | | 8-1-2022 | | | | 800,000 | | | | 812,000 | |
| | | | |
| | | | | | | | | | | | | | | 2,122,133 | |
| | | | | | | | | | | | | | | | |
|
| Wireless Telecommunication Services: 0.17% | |
Sprint Corporation | | | 7.88 | | | | 9-15-2023 | | | | 155,000 | | | | 178,638 | |
Sprint Spectrum Company LLC 144A | | | 3.36 | | | | 3-20-2023 | | | | 43,750 | | | | 44,215 | |
T-Mobile USA Incorporated | | | 4.00 | | | | 4-15-2022 | | | | 145,000 | | | | 149,534 | |
| | | | |
| | | | | | | | | | | | | | | 372,387 | |
| | | | | | | | | | | | | | | | |
|
Consumer Discretionary: 2.34% | |
|
| Auto Components: 0.11% | |
Goodyear Tire & Rubber Company | | | 5.13 | | | | 11-15-2023 | | | | 245,000 | | | | 245,196 | |
| | | | | | | | | | | | | | | | |
|
| Automobiles: 0.18% | |
Ford Motor Company | | | 8.50 | | | | 4-21-2023 | | | | 355,000 | | | | 398,267 | |
| | | | | | | | | | | | | | | | |
|
| Hotels, Restaurants & Leisure: 0.19% | |
Carnival Corporation 144A | | | 11.50 | | | | 4-1-2023 | | | | 50,000 | | | | 56,938 | |
Royal Caribbean Cruises Limited 144A | | | 9.13 | | | | 6-15-2023 | | | | 325,000 | | | | 351,813 | |
| | | | |
| | | | | | | | | | | | | | | 408,751 | |
| | | | | | | | | | | | | | | | |
|
| Household Durables: 0.61% | |
KB Home Class B | | | 7.50 | | | | 9-15-2022 | | | | 315,000 | | | | 344,925 | |
Lennar Corporation | | | 6.25 | | | | 12-15-2021 | | | | 250,000 | | | | 257,000 | |
Newell Brands Incorporated | | | 4.35 | | | | 4-1-2023 | | | | 93,000 | | | | 97,878 | |
PulteGroup Incorporated | | | 4.25 | | | | 3-1-2021 | | | | 400,000 | | | | 401,840 | |
Toll Brothers Finance Corporation | | | 5.88 | | | | 2-15-2022 | | | | 225,000 | | | | 233,928 | |
| | | | |
| | | | | | | | | | | | | | | 1,335,571 | |
| | | | | | | | | | | | | | | | |
|
| Internet & Direct Marketing Retail: 0.07% | |
QVC Incorporated | | | 4.38 | | | | 3-15-2023 | | | | 140,000 | | | | 146,650 | |
| | | | | | | | | | | | | | | | |
The accompanying notes are an integral part of these financial statements.
24 | Wells Fargo Real Return Portfolio
Portfolio of investments—November 30, 2020 (unaudited)
| | | | | | | | | | | | | | | | |
| | | Interest rate | | | Maturity date | | | Principal | | | Value | |
| Multiline Retail: 0.72% | |
Macy’s Incorporated 144A | | | 8.38 | % | | | 6-15-2025 | | | $ | 605,000 | | | $ | 659,420 | |
Macy’s Retail Holdings Incorporated | | | 3.45 | | | | 1-15-2021 | | | | 100,000 | | | | 99,922 | |
Nordstrom Incorporated 144A | | | 8.75 | | | | 5-15-2025 | | | | 730,000 | | | | 813,950 | |
| | | | |
| | | | | | | | | | | | | | | 1,573,292 | |
| | | | | | | | | | | | | | | | |
|
| Specialty Retail: 0.37% | |
L Brands Incorporated | | | 5.63 | | | | 10-15-2023 | | | | 65,000 | | | | 69,443 | |
L Brands Incorporated 144A | | | 9.38 | | | | 7-1-2025 | | | | 225,000 | | | | 274,500 | |
Penske Auto Group Incorporated | | | 3.50 | | | | 9-1-2025 | | | | 140,000 | | | | 141,400 | |
The Gap Incorporated 144A | | | 8.63 | | | | 5-15-2025 | | | | 295,000 | | | | 327,819 | |
| | | | |
| | | | | | | | | | | | | | | 813,162 | |
| | | | | | | | | | | | | | | | |
|
| Textiles, Apparel & Luxury Goods: 0.09% | |
Levi Strauss & Company | | | 5.00 | | | | 5-1-2025 | | | | 180,000 | | | | 184,950 | |
| | | | | | | | | | | | | | | | |
|
Consumer Staples: 0.03% | |
|
| Personal Products: 0.03% | |
Edgewell Personal Care Company | | | 4.70 | | | | 5-24-2022 | | | | 60,000 | | | | 62,250 | |
| | | | | | | | | | | | | | | | |
|
Energy: 2.72% | |
|
| Energy Equipment & Services: 0.09% | |
Hilcorp Energy Company 144A | | | 5.00 | | | | 12-1-2024 | | | | 175,000 | | | | 170,625 | |
USA Compression Partners LP | | | 6.88 | | | | 9-1-2027 | | | | 20,000 | | | | 21,082 | |
| | | | |
| | | | | | | | | | | | | | | 191,707 | |
| | | | | | | | | | | | | | | | |
|
| Oil, Gas & Consumable Fuels: 2.63% | |
Apache Corporation | | | 4.63 | | | | 11-15-2025 | | | | 70,000 | | | | 72,779 | |
Buckeye Partners LP 144A | | | 4.13 | | | | 3-1-2025 | | | | 50,000 | | | | 49,875 | |
Buckeye Partners LP | | | 4.15 | | | | 7-1-2023 | | | | 200,000 | | | | 202,000 | |
Cheniere Energy Partners LP | | | 5.25 | | | | 10-1-2025 | | | | 500,000 | | | | 513,125 | |
Continental Resources Incorporated | | | 4.50 | | | | 4-15-2023 | | | | 600,000 | | | | 615,000 | |
Crestwood Midstream Partners LP | | | 6.25 | | | | 4-1-2023 | | | | 480,000 | | | | 482,174 | |
DCP Midstream Operating LP 144A | | | 4.75 | | | | 9-30-2021 | | | | 300,000 | | | | 304,125 | |
EnLink Midstream Partners LP | | | 4.15 | | | | 6-1-2025 | | | | 685,000 | | | | 635,338 | |
Enviva Partners LP 144A | | | 6.50 | | | | 1-15-2026 | | | | 445,000 | | | | 475,445 | |
EQT Corporation | | | 7.88 | | | | 2-1-2025 | | | | 85,000 | | | | 97,325 | |
Newfield Exploration Company | | | 5.75 | | | | 1-30-2022 | | | | 90,000 | | | | 93,199 | |
Occidental Petroleum Corporation (3 Month LIBOR +1.45%) ± | | | 1.67 | | | | 8-15-2022 | | | | 120,000 | | | | 114,641 | |
Occidental Petroleum Corporation « | | | 8.00 | | | | 7-15-2025 | | | | 155,000 | | | | 169,965 | |
Ovintiiv Incorporated | | | 3.90 | | | | 11-15-2021 | | | | 155,000 | | | | 156,116 | |
Sabine Pass Liquefaction LLC | | | 6.25 | | | | 3-15-2022 | | | | 250,000 | | | | 264,018 | |
Southern Star Central Corporation 144A | | | 5.13 | | | | 7-15-2022 | | | | 222,000 | | | | 222,134 | |
Suburban Propane Partners LP | | | 5.50 | | | | 6-1-2024 | | | | 345,000 | | | | 352,671 | |
Tallgrass Energy Partners LP 144A | | | 4.75 | | | | 10-1-2023 | | | | 460,000 | | | | 451,352 | |
Tallgrass Energy Partners LP 144A | | | 7.50 | | | | 10-1-2025 | | | | 115,000 | | | | 118,450 | |
Targa Resources Partners LP | | | 4.25 | | | | 11-15-2023 | | | | 345,000 | | | | 346,725 | |
| | | | |
| | | | | | | | | | | | | | | 5,736,457 | |
| | | | | | | | | | | | | | | | |
|
Financials: 2.28% | |
|
| Banks: 0.15% | |
CIT Group Incorporated | | | 5.00 | | | | 8-15-2022 | | | | 305,000 | | | | 324,444 | |
| | | | | | | | | | | | | | | | |
The accompanying notes are an integral part of these financial statements.
Wells Fargo Real Return Portfolio | 25
Portfolio of investments—November 30, 2020 (unaudited)
| | | | | | | | | | | | | | | | |
| | | Interest rate | | | Maturity date | | | Principal | | | Value | |
| Capital Markets: 0.19% | |
Blue Cube Spinco Incorporated | | | 10.00 | % | | | 10-15-2025 | | | $ | 390,000 | | | $ | 411,938 | |
| | | | | | | | | | | | | | | | |
|
| Consumer Finance: 0.85% | |
Ford Motor Credit Company LLC | | | 4.13 | | | | 8-17-2027 | | | | 400,000 | | | | 413,500 | |
General Motors Financial Company Incorporated | | | 2.75 | | | | 6-20-2025 | | | | 135,000 | | | | 142,873 | |
Navient Corporation | | | 7.25 | | | | 9-25-2023 | | | | 145,000 | | | | 158,050 | |
Onemain Finance Corporation | | | 6.13 | | | | 3-15-2024 | | | | 295,000 | | | | 319,618 | |
Onemain Finance Corporation | | | 7.75 | | | | 10-1-2021 | | | | 390,000 | | | | 408,525 | |
SLM Corporation | | | 5.50 | | | | 1-25-2023 | | | | 400,000 | | | | 415,000 | |
| | | | |
| | | | | | | | | | | | | | | 1,857,566 | |
| | | | | | | | | | | | | | | | |
|
| Diversified Financial Services: 0.24% | |
LPL Holdings Incorporated 144A | | | 5.75 | | | | 9-15-2025 | | | | 495,000 | | | | 512,335 | |
| | | | | | | | | | | | | | | | |
|
| Insurance: 0.37% | |
Genworth Mortgage Holdings LLC 144A | | | 6.50 | | | | 8-15-2025 | | | | 750,000 | | | | 798,750 | |
| | | | | | | | | | | | | | | | |
|
| Mortgage REITs: 0.23% | |
Starwood Property Trust Incorporated | | | 5.00 | | | | 12-15-2021 | | | | 500,000 | | | | 507,500 | |
| | | | | | | | | | | | | | | | |
|
| Thrifts & Mortgage Finance: 0.25% | |
Ladder Capital Finance Holdings LP 144A | | | 5.25 | | | | 3-15-2022 | | | | 545,000 | | | | 543,638 | |
| | | | | | | | | | | | | | | | |
|
Health Care: 1.04% | |
|
| Health Care Providers & Services: 0.99% | |
Centene Corporation | | | 4.75 | | | | 1-15-2025 | | | | 130,000 | | | | 133,995 | |
Emcompass Health Corporation | | | 5.13 | | | | 3-15-2023 | | | | 290,000 | | | | 291,450 | |
Magellan Health Incorporated | | | 4.90 | | | | 9-22-2024 | | | | 680,000 | | | | 714,000 | |
MEDNAX Incorporated 144A | | | 5.25 | | | | 12-1-2023 | | | | 335,000 | | | | 338,343 | |
Molina Healthcare Incorporated 144A | | | 4.88 | | | | 6-15-2025 | | | | 5,000 | | | | 5,122 | |
Molina Healthcare Incorporated | | | 5.38 | | | | 11-15-2022 | | | | 400,000 | | | | 420,000 | |
Tenet Healthcare Corporation | | | 4.63 | | | | 7-15-2024 | | | | 240,000 | | | | 244,200 | |
| | | | |
| | | | | | | | | | | | | | | 2,147,110 | |
| | | | | | | | | | | | | | | | |
|
| Life Sciences Tools & Services: 0.05% | |
Charles River Laboratories Incorporated 144A | | | 5.50 | | | | 4-1-2026 | | | | 110,000 | | | | 115,500 | |
| | | | | | | | | | | | | | | | |
|
Industrials: 2.29% | |
|
| Aerospace & Defense: 0.09% | |
RBS Global & Rexnord LLC 144A | | | 4.88 | | | | 12-15-2025 | | | | 200,000 | | | | 204,000 | |
| | | | | | | | | | | | | | | | |
|
| Airlines: 1.17% | |
American Airlines Group Company 144A | | | 5.00 | | | | 6-1-2022 | | | | 430,000 | | | | 355,825 | |
Delta Air Lines Incorporated 144A | | | 4.50 | | | | 10-20-2025 | | | | 995,000 | | | | 1,050,393 | |
Mileage Plus Holdings LLC 144A | | | 6.50 | | | | 6-20-2027 | | | | 850,000 | | | | 921,719 | |
United Airlines Pass-Through Trust Certificates Series 2020-1 Class A | | | 5.88 | | | | 4-15-2029 | | | | 210,000 | | | | 223,506 | |
| | | | |
| | | | | | | | | | | | | | | 2,551,443 | |
| | | | | | | | | | | | | | | | |
|
| Commercial Services & Supplies: 0.21% | |
Covanta Holding Corporation | | | 5.88 | | | | 7-1-2025 | | | | 65,000 | | | | 67,681 | |
Plastipak Holdings Incorporated 144A | | | 6.25 | | | | 10-15-2025 | | | | 380,000 | | | | 391,400 | |
| | | | |
| | | | | | | | | | | | | | | 459,081 | |
| | | | | | | | | | | | | | | | |
The accompanying notes are an integral part of these financial statements.
26 | Wells Fargo Real Return Portfolio
Portfolio of investments—November 30, 2020 (unaudited)
| | | | | | | | | | | | | | | | |
| | | Interest rate | | | Maturity date | | | Principal | | | Value | |
| Construction & Engineering: 0.24% | |
Great Lakes Dredge & Dock Corporation | | | 8.00 | % | | | 5-15-2022 | | | $ | 395,000 | | | $ | 404,875 | |
Taylor Morrison Communities Incorporated 144A | | | 5.88 | | | | 4-15-2023 | | | | 110,000 | | | | 116,325 | |
| | | | |
| | | | | | | | | | | | | | | 521,200 | |
| | | | | | | | | | | | | | | | |
|
| Electronic Equipment, Instruments & Components: 0.03% | |
Wesco Distribution Incorporated Company 144A | | | 7.13 | | | | 6-15-2025 | | | | 55,000 | | | | 59,881 | |
| | | | | | | | | | | | | | | | |
|
| Machinery: 0.05% | |
Stevens Holding Company Incorporated 144A | | | 6.13 | | | | 10-1-2026 | | | | 10,000 | | | | 10,838 | |
Trimas Corporation 144A | | | 4.88 | | | | 10-15-2025 | | | | 85,000 | | | | 86,726 | |
| | | | |
| | | | | | | | | | | | | | | 97,564 | |
| | | | | | | | | | | | | | | | |
|
| Trading Companies & Distributors: 0.50% | |
Aircastle Limited | | | 5.13 | | | | 3-15-2021 | | | | 275,000 | | | | 278,202 | |
Fortress Transportation & Infrastructure Investors LLC 144A | | | 6.75 | | | | 3-15-2022 | | | | 815,000 | | | | 820,844 | |
| | | | |
| | | | | | | | | | | | | | | 1,099,046 | |
| | | | | | | | | | | | | | | | |
|
Information Technology: 0.34% | |
|
| IT Services: 0.16% | |
Cardtronics Incorporated 144A | | | 5.50 | | | | 5-1-2025 | | | | 345,000 | | | | 356,213 | |
| | | | | | | | | | | | | | | | |
|
| Software: 0.06% | |
NortonLifeLock Incorporated 144A | | | 5.00 | | | | 4-15-2025 | | | | 120,000 | | | | 122,404 | |
| | | | | | | | | | | | | | | | |
|
| Technology Hardware, Storage & Peripherals: 0.12% | |
Dell International LLC 144A | | | 7.13 | | | | 6-15-2024 | | | | 245,000 | | | | 254,158 | |
| | | | | | | | | | | | | | | | |
|
Materials: 0.31% | |
|
| Chemicals: 0.03% | |
Chemours Company | | | 6.63 | | | | 5-15-2023 | | | | 65,000 | | | | 66,151 | |
| | | | | | | | | | | | | | | | |
|
| Containers & Packaging: 0.12% | |
Reynolds Group Holding Limited 144A | | | 5.13 | | | | 7-15-2023 | | | | 5,000 | | | | 5,061 | |
Sealed Air Corporation 144A | | | 5.13 | | | | 12-1-2024 | | | | 50,000 | | | | 54,813 | |
Sealed Air Corporation 144A | | | 5.25 | | | | 4-1-2023 | | | | 190,000 | | | | 202,056 | |
| | | | |
| | | | | | | | | | | | | | | 261,930 | |
| | | | | | | | | | | | | | | | |
|
| Metals & Mining: 0.16% | |
Cleveland-Cliffs Incorporated 144A | | | 9.88 | | | | 10-17-2025 | | | | 300,000 | | | | 349,875 | |
| | | | | | | | | | | | | | | | |
|
Real Estate: 0.61% | |
|
| Equity REITs: 0.61% | |
CoreCivic Incorporated | | | 4.63 | | | | 5-1-2023 | | | | 245,000 | | | | 230,300 | |
CoreCivic Incorporated | | | 5.00 | | | | 10-15-2022 | | | | 105,000 | | | | 103,289 | |
SBA Communications Corporation | | | 4.00 | | | | 10-1-2022 | | | | 60,000 | | | | 60,675 | |
Service Properties Trust Company | | | 4.35 | | | | 10-1-2024 | | | | 500,000 | | | | 478,750 | |
Service Properties Trust Company | | | 7.50 | | | | 9-15-2025 | | | | 420,000 | | | | 467,993 | |
| | | | |
| | | | | | | | | | | | | | | 1,341,007 | |
| | | | | | | | | | | | | | | | |
|
Utilities: 0.33% | |
|
| Electric Utilities: 0.05% | |
NextEra Energy Operating Partners LP 144A | | | 4.25 | | | | 7-15-2024 | | | | 100,000 | | | | 105,253 | |
| | | | | | | | | | | | | | | | |
The accompanying notes are an integral part of these financial statements.
Wells Fargo Real Return Portfolio | 27
Portfolio of investments—November 30, 2020 (unaudited)
| | | | | | | | | | | | | | | | |
| | | Interest rate | | | Maturity date | | | Principal | | | Value | |
| Independent Power & Renewable Electricity Producers: 0.28% | |
TerraForm Power Operating LLC 144A | | | 4.25 | % | | | 1-31-2023 | | | $ | 600,000 | | | $ | 619,500 | |
| | | | | | | | | | | | | | | | |
| |
Total Corporate Bonds and Notes (Cost $30,731,247) | | | | 31,176,178 | |
| | | | | |
|
Loans: 2.37% | |
|
Communication Services: 0.63% | |
|
| Entertainment: 0.06% | |
Live Nation Entertainment Incorporated (1 Month LIBOR +1.75%) ± | | | 1.94 | | | | 10-17-2026 | | | | 135,474 | | | | 129,716 | |
| | | | | | | | | | | | | | | | |
|
| Media: 0.38% | |
CSC Holdings LLC (1 Month LIBOR +2.50%) ± | | | 2.64 | | | | 4-15-2027 | | | | 368,830 | | | | 359,872 | |
Diamond Sports Group LLC (1 Month LIBOR +3.25%) ± | | | 3.40 | | | | 8-24-2026 | | | | 346,500 | | | | 287,595 | |
Virgin Media Bristol LLC (1 Month LIBOR +2.50%) ± | | | 2.64 | | | | 1-31-2028 | | | | 175,000 | | | | 171,483 | |
| | | | |
| | | | | | | | | | | | | | | 818,950 | |
| | | | | | | | | | | | | | | | |
|
| Wireless Telecommunication Services: 0.19% | |
SBA Senior Finance II LLC (1 Month LIBOR +1.75%) ± | | | 1.90 | | | | 4-11-2025 | | | | 428,596 | | | | 422,129 | |
| | | | | | | | | | | | | | | | |
|
Consumer Discretionary: 0.22% | |
|
| Auto Components: 0.07% | |
Belron Finance US LLC (3 Month LIBOR +2.25%) ±‡ | | | 2.46 | | | | 11-7-2024 | | | | 155,600 | | | | 152,877 | |
| | | | | | | | | | | | | | | | |
|
| Hotels, Restaurants & Leisure: 0.12% | |
Carnival Corporation (1 Month LIBOR +7.50%) ± | | | 8.50 | | | | 6-30-2025 | | | | 49,875 | | | | 51,496 | |
Wyndham Hotels & Resorts Incorporated (1 Month LIBOR +1.75%) ± | | | 1.90 | | | | 5-30-2025 | | | | 215,600 | | | | 210,480 | |
| | | | |
| | | | | | | | | | | | | | | 261,976 | |
| | | | | | | | | | | | | | | | |
|
| Specialty Retail: 0.03% | |
Sally Beauty Holdings Incorporated (1 Month LIBOR +2.25%) ± | | | 2.40 | | | | 7-5-2024 | | | | 64,064 | | | | 62,943 | |
| | | | | | | | | | | | | | | | |
|
Consumer Staples: 0.05% | |
|
| Food Products: 0.05% | |
Prestige Brands Incorporated (1 Month LIBOR +2.00%) ± | | | 2.15 | | | | 1-26-2024 | | | | 106,657 | | | | 106,479 | |
| | | | | | | | | | | | | | | | |
|
Energy: 0.16% | |
|
| Oil, Gas & Consumable Fuels: 0.16% | |
Apergy Corporation (3 Month LIBOR +5.00%) ±‡ | | | 5.50 | | | | 5-28-2027 | | | | 339,967 | | | | 342,516 | |
| | | | | | | | | | | | | | | | |
|
Financials: 0.06% | |
|
| Diversified Financial Services: 0.06% | |
Delos Finance SARL (3 Month LIBOR +1.75%) ± | | | 1.97 | | | | 10-6-2023 | | | | 140,000 | | | | 137,550 | |
| | | | | | | | | | | | | | | | |
|
Health Care: 0.25% | |
|
| Health Care Providers & Services: 0.25% | |
Select Medical Corporation (6 Month LIBOR +2.50%) ± | | | 2.78 | | | | 3-6-2025 | | | | 549,214 | | | | 538,746 | |
| | | | | | | | | | | | | | | | |
|
Industrials: 0.57% | |
|
| Aerospace & Defense: 0.07% | |
Rexnord LLC (1 Month LIBOR +1.75%) ± | | | 1.90 | | | | 8-21-2024 | | | | 156,250 | | | | 155,636 | |
| | | | | | | | | | | | | | | | |
The accompanying notes are an integral part of these financial statements.
28 | Wells Fargo Real Return Portfolio
Portfolio of investments—November 30, 2020 (unaudited)
| | | | | | | | | | | | | | | | |
| | | Interest rate | | | Maturity date | | | Principal | | | Value | |
| Building Products: 0.25% | |
Advanced Drainage Systems Incorporated (1 Month LIBOR +2.25%) ± | | | 2.44 | % | | | 7-31-2026 | | | $ | 271,500 | | | $ | 270,821 | |
Flex Acquisition Company (1 Month LIBOR +3.00%) ± | | | 5.12 | | | | 12-29-2023 | | | | 288,996 | | | | 284,901 | |
| | | | |
| | | | | | | | | | | | | | | 555,722 | |
| | | | | | | | | | | | | | | | |
|
| Commercial Services & Supplies: 0.23% | |
Aramark Services Incorporated (1 Month LIBOR +1.75%) ± | | | 1.90 | | | | 3-28-2024 | | | | 106,844 | | | | 103,528 | |
Aramark Services Incorporated (1 Month LIBOR +1.75%) ± | | | 1.90 | | | | 3-11-2025 | | | | 364,323 | | | | 352,286 | |
KAR Auction Services Incorporated (1 Month LIBOR +2.25%) ± | | | 2.44 | | | | 9-19-2026 | | | | 38,774 | | | | 37,804 | |
| | | | |
| | | | | | | | | | | | | | | 493,618 | |
| | | | | | | | | | | | | | | | |
|
| Machinery: 0.02% | |
Columbus McKinnon Corporation (3 Month LIBOR +2.50%) ±‡ | | | 3.50 | | | | 1-31-2024 | | | | 37,558 | | | | 37,464 | |
| | | | | | | | | | | | | | | | |
|
Information Technology: 0.30% | |
|
| Electronic Equipment, Instruments & Components: 0.09% | |
CDW LLC (1 Month LIBOR +1.75%) ± | | | 1.90 | | | | 10-13-2026 | | | | 194,911 | | | | 194,728 | |
| | | | | | | | | | | | | | | | |
|
| Semiconductors & Semiconductor Equipment: 0.14% | |
ON Semiconductor Corporation (1 Month LIBOR +2.00%) ± | | | 2.15 | | | | 9-19-2026 | | | | 311,850 | | | | 309,424 | |
| | | | | | | | | | | | | | | | |
|
| Software: 0.07% | |
SS&C Technologies Incorporated (1 Month LIBOR +1.75%) ± | | | 1.90 | | | | 4-16-2025 | | | | 91,006 | | | | 89,448 | |
SS&C Technologies Incorporated (1 Month LIBOR +1.75%) ± | | | 1.90 | | | | 4-16-2025 | | | | 68,925 | | | | 67,745 | |
| | | | |
| | | | | | | | | | | | | | | 157,193 | |
| | | | | | | | | | | | | | | | |
|
Materials: 0.13% | |
|
| Chemicals: 0.05% | |
Ineos US Finance LLC (1 Month LIBOR +2.00%) ± | | | 2.15 | | | | 4-1-2024 | | | | 108,830 | | | | 106,574 | |
| | | | | | | | | | | | | | | | |
|
| Containers & Packaging: 0.08% | |
Berry Global Incorporated (1 Month LIBOR +2.00%) ± | | | 2.13 | | | | 10-1-2022 | | | | 175,000 | | | | 174,270 | |
| | | | | | | | | | | | | | | | |
| |
Total Loans (Cost $5,277,240) | | | | 5,158,511 | |
| | | | | |
|
| U.S. Treasury Securities: 66.15% | |
TIPS | | | 0.13 | | | | 7-15-2022 | | | | 4,685,569 | | | | 4,802,525 | |
TIPS | | | 0.13 | | | | 1-15-2023 | | | | 5,423,612 | | | | 5,586,391 | |
TIPS | | | 0.13 | | | | 7-15-2024 | | | | 4,927,014 | | | | 5,211,473 | |
TIPS | | | 0.13 | | | | 10-15-2024 | | | | 3,753,391 | | | | 3,975,320 | |
TIPS | | | 0.13 | | | | 4-15-2025 | | | | 3,768,499 | | | | 4,000,988 | |
TIPS | | | 0.13 | | | | 10-15-2025 | | | | 1,986,098 | | | | 2,131,177 | |
TIPS | | | 0.13 | | | | 7-15-2026 | | | | 3,686,291 | | | | 3,992,186 | |
TIPS | | | 0.13 | | | | 1-15-2030 | | | | 4,248,720 | | | | 4,678,018 | |
TIPS | | | 0.13 | | | | 7-15-2030 | | | | 3,085,965 | | | | 3,416,139 | |
TIPS | | | 0.25 | | | | 1-15-2025 | | | | 4,560,228 | | | | 4,857,889 | |
TIPS | | | 0.25 | | | | 7-15-2029 | | | | 3,428,941 | | | | 3,821,350 | |
TIPS | | | 0.25 | | | | 2-15-2050 | | | | 1,741,225 | | | | 2,061,062 | |
TIPS | | | 0.38 | | | | 7-15-2023 | | | | 4,669,237 | | | | 4,899,902 | |
TIPS | | | 0.38 | | | | 7-15-2025 | | | | 6,168,006 | | | | 6,683,854 | |
TIPS | | | 0.38 | | | | 1-15-2027 | | | | 3,205,414 | | | | 3,523,409 | |
TIPS | | | 0.38 | | | | 7-15-2027 | | | | 1,553,411 | | | | 1,722,789 | |
TIPS | | | 0.50 | | | | 4-15-2024 | | | | 3,214,555 | | | | 3,408,517 | |
TIPS | | | 0.50 | | | | 1-15-2028 | | | | 3,972,602 | | | | 4,443,418 | |
TIPS | | | 0.63 | | | | 4-15-2023 | | | | 4,138,850 | | | | 4,322,619 | |
The accompanying notes are an integral part of these financial statements.
Wells Fargo Real Return Portfolio | 29
Portfolio of investments—November 30, 2020 (unaudited)
| | | | | | | | | | | | | | | | |
| | | Interest rate | | | Maturity date | | | Principal | | | Value | |
|
| U.S. Treasury Securities (continued) | |
TIPS | | | 0.63 | % | | | 1-15-2024 | | | $ | 5,047,411 | | | $ | 5,359,391 | |
TIPS | | | 0.63 | | | | 1-15-2026 | | | | 5,416,506 | | | | 5,957,381 | |
TIPS | | | 0.63 | | | | 2-15-2043 | | | | 2,077,293 | | | | 2,571,976 | |
TIPS | | | 0.75 | | | | 7-15-2028 | | | | 3,535,693 | | | | 4,058,266 | |
TIPS | | | 0.75 | | | | 2-15-2042 | | | | 2,804,706 | | | | 3,543,899 | |
TIPS | | | 0.75 | | | | 2-15-2045 | | | | 2,514,467 | | | | 3,219,925 | |
TIPS | | | 0.88 | | | | 1-15-2029 | | | | 2,906,715 | | | | 3,370,578 | |
TIPS | | | 0.88 | | | | 2-15-2047 | | | | 1,590,330 | | | | 2,123,277 | |
TIPS | | | 1.00 | | | | 2-15-2046 | | | | 1,570,755 | | | | 2,127,432 | |
TIPS | | | 1.00 | | | | 2-15-2048 | | | | 1,208,479 | | | | 1,672,091 | |
TIPS | | | 1.00 | | | | 2-15-2049 | | | | 1,380,804 | | | | 1,932,320 | |
TIPS | | | 1.38 | | | | 2-15-2044 | | | | 2,267,003 | | | | 3,244,795 | |
TIPS | | | 1.75 | | | | 1-15-2028 | | | | 2,379,100 | | | | 2,884,039 | |
TIPS | | | 2.00 | | | | 1-15-2026 | | | | 2,950,470 | | | | 3,461,462 | |
TIPS | | | 2.13 | | | | 2-15-2040 | | | | 1,252,337 | | | | 1,927,196 | |
TIPS | | | 2.13 | | | | 2-15-2041 | | | | 1,598,519 | | | | 2,488,382 | |
TIPS | | | 2.38 | | | | 1-15-2025 | | | | 3,037,672 | | | | 3,511,399 | |
TIPS | | | 2.38 | | | | 1-15-2027 | | | | 2,187,567 | | | | 2,684,526 | |
TIPS | | | 2.50 | | | | 1-15-2029 | | | | 2,291,134 | | | | 2,975,371 | |
TIPS | | | 3.38 | | | | 4-15-2032 | | | | 923,769 | | | | 1,389,984 | |
TIPS | | | 3.63 | | | | 4-15-2028 | | | | 1,858,591 | | | | 2,530,153 | |
TIPS | | | 3.88 | | | | 4-15-2029 | | | | 2,438,128 | | | | 3,478,491 | |
| |
Total U.S. Treasury Securities (Cost $130,263,887) | | | | 144,051,360 | |
| | | | | |
|
Yankee Corporate Bonds and Notes: 2.20% | |
|
Communication Services: 0.26% | |
|
| Media: 0.26% | |
Nielsen Holding and Finance BV 144A | | | 5.00 | | | | 2-1-2025 | | | | 65,000 | | | | 66,869 | |
Nielsen Holding and Finance BV 144A | | | 5.50 | | | | 10-1-2021 | | | | 102,000 | | | | 101,490 | |
Videotron Limited | | | 5.00 | | | | 7-15-2022 | | | | 375,000 | | | | 395,156 | |
| | | | |
| | | | | | | | | | | | | | | 563,515 | |
| | | | | | | | | | | | | | | | |
|
Consumer Discretionary: 0.12% | |
|
| Hotels, Restaurants & Leisure: 0.12% | |
International Game Technology plc 144A | | | 6.25 | | | | 2-15-2022 | | | | 250,000 | | | | 256,250 | |
| | | | | | | | | | | | | | | | |
|
Energy: 0.17% | |
|
| Energy Equipment & Services: 0.16% | |
Alcoa Nederland Holding Company BV 144A | | | 6.75 | | | | 9-30-2024 | | | | 355,000 | | | | 366,981 | |
| | | | | | | | | | | | | | | | |
|
| Oil, Gas & Consumable Fuels: 0.01% | |
Cenovus Energy Incorporated | | | 5.38 | | | | 7-15-2025 | | | | 10,000 | | | | 11,028 | |
| | | | | | | | | | | | | | | | |
|
Financials: 0.64% | |
|
| Diversified Financial Services: 0.64% | |
DAE Funding LLC 144A | | | 5.25 | | | | 11-15-2021 | | | | 270,000 | | | | 277,763 | |
DAE Funding LLC 144A | | | 5.75 | | | | 11-15-2023 | | | | 175,000 | | | | 180,250 | |
Park Aerospace Holdings Company 144A | | | 5.25 | | | | 8-15-2022 | | | | 550,000 | | | | 575,157 | |
Park Aerospace Holdings Limited 144A | | | 5.50 | | | | 2-15-2024 | | | | 345,000 | | | | 368,267 | |
| | | | |
| | | | | | | | | | | | | | | 1,401,437 | |
| | | | | | | | | | | | | | | | |
The accompanying notes are an integral part of these financial statements.
30 | Wells Fargo Real Return Portfolio
Portfolio of investments—November 30, 2020 (unaudited)
| | | | | | | | | | | | | | | | |
| | | Interest rate | | | Maturity date | | | Principal | | | Value | |
Health Care: 0.30% | |
|
| Pharmaceuticals: 0.30% | |
Teva Pharmaceutical Finance BV | | | 2.20 | % | | | 7-21-2021 | | | $ | 275,000 | | | $ | 275,096 | |
Teva Pharmaceutical Finance BV | | | 2.80 | | | | 7-21-2023 | | | | 310,000 | | | | 304,532 | |
Teva Pharmaceutical Finance BV | | | 3.65 | | | | 11-10-2021 | | | | 70,000 | | | | 70,525 | |
| | | | |
| | | | | | | | | | | | | | | 650,153 | |
| | | | | | | | | | | | | | | | |
|
Industrials: 0.34% | |
|
| Airlines: 0.26% | |
Air Canada Company 144A | | | 7.75 | | | | 4-15-2021 | | | | 565,000 | | | | 567,825 | |
| | | | | | | | | | | | | | | | |
|
| Commercial Services & Supplies: 0.08% | |
NorthRiver Midstream Finance LP 144A | | | 5.63 | | | | 2-15-2026 | | | | 170,000 | | | | 172,550 | |
| | | | | | | | | | | | | | | | |
|
Information Technology: 0.09% | |
|
| Communications Equipment: 0.09% | |
Nokia OYJ | | | 3.38 | | | | 6-12-2022 | | | | 180,000 | | | | 185,456 | |
| | | | | | | | | | | | | | | | |
|
Materials: 0.28% | |
|
| Metals & Mining: 0.28% | |
Constellium Company 144A | | | 5.75 | | | | 5-15-2024 | | | | 250,000 | | | | 254,988 | |
FMG Resources Proprietary Limited 144A | | | 4.75 | | | | 5-15-2022 | | | | 345,000 | | | | 355,350 | |
| | | | |
| | | | | | | | | | | | | | | 610,338 | |
| | | | | | | | | | | | | | | | |
| |
Total Yankee Corporate Bonds and Notes (Cost $4,667,134) | | | | 4,785,533 | |
| | | | | |
| | | | |
| | | | | | | | | | | | | | | | |
| | | Yield | | | | | | Shares | | | | |
| Short-Term Investments: 1.17% | | | | | | | | | | | | |
| | | | |
| Investment Companies: 1.17% | | | | | | | | | | | | |
Securities Lending Cash Investments LLC (l)(r)(u) | | | 0.12 | | | | | | | | 115,000 | | | | 115,000 | |
Wells Fargo Government Money Market Fund Select Class (l)(u) | | | 0.02 | | | | | | | | 2,434,127 | | | | 2,434,127 | |
| | | | |
Total Short-Term Investments (Cost $2,549,127) | | | | | | | | | | | | | | | 2,549,127 | |
| | | | | |
| | | | | | | | |
| Total investments in securities (Cost $196,005,402) | | | 99.61 | % | | | 216,922,968 | |
| | |
Other assets and liabilities, net | | | 0.39 | | | | 847,014 | |
| | | | | | | | |
| Total net assets | | | 100.00 | % | | $ | 217,769,982 | |
| | | | | | | | |
| † | Non-income-earning security |
| 144A | The security may be resold in transactions exempt from registration, normally to qualified institutional buyers, pursuant to Rule 144A under the Securities Act of 1933. |
| ± | Variable rate investment. The rate shown is the rate in effect at period end. |
| « | All or a portion of this security is on loan. |
| ‡ | Security is valued using significant unobservable inputs. |
| (l) | The issuer of the security is an affiliated person of the Portfolio as defined in the Investment Company Act of 1940. |
| (r) | The investment is a non-registered investment company purchased with cash collateral received from securities on loan. |
| (u) | The rate represents the 7-day annualized yield at period end. |
Abbreviations:
| ADR | American depositary receipt |
| LIBOR | London Interbank Offered Rate |
| TIPS | Treasury Inflation-Protected Securities |
| REIT | Real estate investment trust |
The accompanying notes are an integral part of these financial statements.
Wells Fargo Real Return Portfolio | 31
Portfolio of investments—November 30, 2020 (unaudited)
Futures Contracts
| | | | | | | | | | | | | | | | | | | | | | | | |
| Description | | Number of contracts | | | Expiration date | | | Notional cost | | | Notional value | | | Unrealized gains | | | Unrealized losses | |
| | | | | | |
Long | | | | | | | | | | | | | | | | | | | | | | | | |
| | | | | | |
2-Year U.S. Treasury Notes | | | 14 | | | | 3-31-2021 | | | $ | 3,090,851 | | | $ | 3,091,922 | | | $ | 1,071 | | | $ | 0 | |
| | | | | | |
Short | | | | | | | | | | | | | | | | | | | | | | | | |
| | | | | | |
10-Year U.S. Treasury Notes | | | (5) | | | | 3-22-2021 | | | | (689,241 | ) | | | (690,859 | ) | | | 0 | | | | (1,618 | ) |
| | | | | | |
10-Year Ultra Futures | | | (3) | | | | 3-22-2021 | | | | (469,889 | ) | | | (471,375 | ) | | | 0 | | | | (1,486 | ) |
| | | | | | |
U.S. Ultra Bond | | | (8) | | | | 3-22-2021 | | | | (1,725,734 | ) | | | (1,728,250 | ) | | | 0 | | | | (2,516 | ) |
| | | | | | |
5-Year U.S. Treasury Notes | | | (63) | | | | 3-31-2021 | | | | (7,929,532 | ) | | | (7,939,969 | ) | | | 0 | | | | (10,437 | ) |
| | | | | | | | | | | | | | | | | | | | | | | | |
| | | | | | |
| | | | | | | | | | | | | | | | | | $ | 1,071 | | | $ | (16,057 | ) |
| | | | | | | | | | | | | | | | | | | | | | | | |
Investments in Affiliates
An affiliated investment is an investment in which the Portfolio owns at least 5% of the outstanding voting shares of the issuer or as a result of other relationships, such as the Portfolio and the issuer having the same adviser or investment manager. Transactions with issuers that were either affiliates of the Portfolio at the beginning of the period or the end of the period were as follows:
| | | | | | | | | | | | | | | | | | | | | | | | | | | | | | | | | | | | |
| | | Value, beginning of period | | | Purchases | | | Sales proceeds | | | Net realized gains (losses) | | | Net change in unrealized gains (losses) | | | Value, end of period | | | % of net assets | | | Shares, end of period | | | Income from affiliated securities | |
| | | | | | | | | |
| Short-Term Investments | | | | | | | | | | | | | | | | | | | | | | | | | | | |
Investment Companies | | | | | | | | | | | | | | | | | | | | | | | | | | | | | | | | | | | | |
Securities Lending Cash Investments LLC | | $ | 0 | | | $ | 1,071,969 | | | $ | (956,969 | ) | | $ | 0 | | | $ | 0 | | | $ | 115,000 | | | | | | | | 115,000 | | | $ | 42 | # |
Wells Fargo Government Money Market Fund Select Class | | | 923,723 | | | | 64,212,161 | | | | (62,701,757 | ) | | | 0 | | | | 0 | | | | 2,434,127 | | | | | | | | 2,434,127 | | | | 899 | |
| | | | | | | | | | | | | | | | | | | | | | | | | | | | | | | | | | | | |
| | | | | | | | | | | | | | $ | 0 | | | $ | 0 | | | $ | 2,549,127 | | | | 1.17 | % | | | | | | $ | 941 | |
| | | | | | | | | | | | | | | | | | | | | | | | | | | | | | | | | | | | |
| # | Amount shown represents income before fees and rebates. |
The accompanying notes are an integral part of these financial statements.
32 | Wells Fargo Real Return Portfolio
Statement of assets and liabilities—November 30, 2020 (unaudited)
| | | | |
| | | | |
| |
Assets | | | | |
Investments in unaffiliated securities (including $113,235 of securities loaned), at value (cost $193,456,275) | | $ | 214,373,841 | |
Investments in affiliated securities, at value (cost $2,549,127) | | | 2,549,127 | |
Segregated cash for future contracts | | | 226,321 | |
Foreign currency, at value (cost $10) | | | 11 | |
Receivable for investments sold | | | 195,247 | |
Receivable for dividends and interest | | | 834,588 | |
Receivable for securities lending income, net | | | 20 | |
Prepaid expenses and other assets | | | 40,335 | |
| | | | |
Total assets | | | 218,219,490 | |
| | | | |
| |
Liabilities | | | | |
Payable upon receipt of securities loaned | | | 115,000 | |
Payable for investments purchased | | | 275,376 | |
Payable for daily variation margin on open futures contracts | | | 1,655 | |
Advisory fee payable | | | 57,477 | |
| | | | |
Total liabilities | | | 449,508 | |
| | | | |
Total net assets | | $ | 217,769,982 | |
| | | | |
The accompanying notes are an integral part of these financial statements.
Wells Fargo Real Return Portfolio | 33
Statement of operations—six months ended November 30, 2020 (unaudited)
| | | | |
| | | | |
| |
Investment income | | | | |
Interest | | $ | 1,890,886 | |
Dividends (net of foreign withholding taxes of $2,372) | | | 281,946 | |
Income from affiliated securities | | | 1,027 | |
| | | | |
Total investment income | | | 2,173,859 | |
| | | | |
| |
Expenses | | | | |
Advisory fee | | | 351,221 | |
Custody and accounting fees | | | 12,918 | |
Professional fees | | | 21,915 | |
Shareholder report expenses | | | 7,679 | |
Trustees’ fees and expenses | | | 9,716 | |
Other fees and expenses | | | 9,860 | |
| | | | |
Total expenses | | | 413,309 | |
Less: Fee waivers and/or expense reimbursements | | | (70,868 | ) |
| | | | |
Net expenses | | | 342,441 | |
| | | | |
Net investment income | | | 1,831,418 | |
| | | | |
| |
Realized and unrealized gains (losses) on investments | | | | |
Net realized gains (losses) on | | | | |
Unaffiliated securities | | | (172,286 | ) |
Futures contracts | | | 1,178 | |
| | | | |
Net realized losses on investments | | | (171,108 | ) |
| | | | |
| |
Net change in unrealized gains (losses) on | | | | |
Unaffiliated securities | | | 8,057,253 | |
Futures contracts | | | 17,906 | |
| | | | |
Net change in unrealized gains (losses) on investments | | | 8,075,159 | |
| | | | |
Net realized and unrealized gains (losses) on investments | | | 7,904,051 | |
| | | | |
Net increase in net assets resulting from operations | | $ | 9,735,469 | |
| | | | |
The accompanying notes are an integral part of these financial statements.
34 | Wells Fargo Real Return Portfolio
Statement of changes in net assets
| | | | | | | | |
| | | Six months ended
November 30, 2020
(unaudited) | | | Year ended
May 31, 2020 | |
|
Operations | |
Net investment income | | $ | 1,831,418 | | | $ | 3,780,486 | |
Net realized losses on investments | | | (171,108 | ) | | | (2,934,511 | ) |
Net change in unrealized gains (losses) on investments | | | 8,075,159 | | | | 8,799,280 | |
| | | | |
Net increase in net assets resulting from operations | | | 9,735,469 | | | | 9,645,255 | |
| | | | |
| | |
Capital transactions | | | | | | | | |
Transactions in investors’ beneficial interests | |
Contributions | | | 66,425,740 | | | | 25,838,830 | |
Withdrawals | | | (20,446,099 | ) | | | (56,167,504 | ) |
| | | | |
Net increase (decrease) in net assets resulting from capital transactions | | | 45,979,641 | | | | (30,328,674 | ) |
| | | | |
Total increase (decrease) in net assets | | | 55,715,110 | | | | (20,683,419 | ) |
| | | | |
| | |
Net assets | | | | | | | | |
Beginning of period | | | 162,054,872 | | | | 182,738,291 | |
| | | | |
End of period | | $ | 217,769,982 | | | $ | 162,054,872 | |
| | | | |
The accompanying notes are an integral part of these financial statements.
Wells Fargo Real Return Portfolio | 35
Financial highlights
| | | | | | | | | | | | | | | | | | | | | | | | |
| | | Six months ended
November 30, 2020
(unaudited) | | | Year ended May 31 | |
| | | 2020 | | | 2019 | | | 2018 | | | 2017 | | | 2016 | |
Total return1 | | | 5.49 | % | | | 5.92 | % | | | 2.99 | % | | | 1.67 | % | | | 2.65 | % | | | 1.29 | % |
Ratios to average net assets (annualized) | | | | | | | | | | | | | | | | | | | | | | | | |
Gross expenses | | | 0.47 | % | | | 0.45 | % | | | 0.45 | % | | | 0.48 | % | | | 0.52 | % | | | 0.56 | % |
Net expenses | | | 0.39 | % | | | 0.39 | % | | | 0.40 | % | | | 0.41 | % | | | 0.44 | % | | | 0.44 | % |
Net investment income | | | 2.09 | % | | | 2.16 | % | | | 2.29 | % | | | 2.40 | % | | | 2.36 | % | | | 1.45 | % |
Supplemental data | | | | | | | | | | | | | | | | | | | | | | | | |
Portfolio turnover rate | | | 9 | % | | | 24 | % | | | 39 | % | | | 29 | % | | | 25 | % | | | 29 | % |
| 1 | Returns for periods of less than one year are not annualized. |
The accompanying notes are an integral part of these financial statements.
36 | Wells Fargo Real Return Portfolio
Notes to financial statements (unaudited)
1. ORGANIZATION
Wells Fargo Master Trust (the “Trust”), a Delaware statutory trust organized on March 10, 1999, is an open-end management investment company registered under the Investment Company Act of 1940, as amended (the “1940 Act”). As an investment company, the Trust follows the accounting and reporting guidance in Financial Accounting Standards Board (“FASB”) Accounting Standards Codification Topic 946, Financial Services – Investment Companies. These financial statements report on the Wells Fargo Real Return Portfolio (the “Portfolio”) which is a diversified series of the Trust.
2. SIGNIFICANT ACCOUNTING POLICIES
The following significant accounting policies, which are consistently followed in the preparation of the financial statements of the Portfolio, are in conformity with U.S. generally accepted accounting principles which require management to make estimates and assumptions that affect the reported amounts of assets and liabilities, disclosure of contingent assets and liabilities at the date of the financial statements, and the reported amounts of revenues and expenses during the reporting period. Actual results could differ from those estimates.
Securities valuation
All investments are valued each business day as of the close of regular trading on the New York Stock Exchange (generally 4 p.m. Eastern Time), although the Portfolio may deviate from this calculation time under unusual or unexpected circumstances.
Debt securities are valued at the evaluated bid price provided by an independent pricing service (e.g. taking into account various factors, including yields, maturities, or credit ratings) or, if a reliable price is not available, the quoted bid price from an independent broker-dealer.
Equity securities and futures contracts that are listed on a foreign or domestic exchange or market are valued at the official closing price or, if none, the last sales price. If no sale occurs on the principal exchange or market that day, a fair value price will be determined in accordance with the Portfolio’s Valuation Procedures.
Many securities markets and exchanges outside the U.S. close prior to the close of the New York Stock Exchange and therefore may not fully reflect trading or events that occur after the close of the principal exchange in which the foreign securities are traded, but before the close of the New York Stock Exchange. If such trading or events are expected to materially affect the value of such securities, then fair value pricing procedures approved by the Board of Trustees of the Portfolio are applied. These procedures take into account multiple factors including movements in U.S. securities markets after foreign exchanges close. Foreign securities that are fair valued under these procedures are categorized as Level 2 and the application of these procedures may result in transfers between Level 1 and Level 2. Depending on market activity, such fair valuations may be frequent. Such fair value pricing may result in net asset values that are higher or lower than net asset values based on the last reported sales price or latest quoted bid price. On November 30, 2020, such fair value pricing was not used in pricing foreign securities.
Investments in registered open-end investment companies are valued at net asset value. Interests in non-registered investment companies that are redeemable at net asset value are fair valued normally at net asset value.
Investments which are not valued using any of the methods discussed above are valued at their fair value, as determined in good faith by the Board of Trustees. The Board of Trustees has established a Valuation Committee comprised of the Trustees and has delegated to it the authority to take any actions regarding the valuation of portfolio securities that the Valuation Committee deems necessary or appropriate, including determining the fair value of portfolio securities, unless the determination has been delegated to the Wells Fargo Asset Management Pricing Committee at Wells Fargo Funds Management, LLC (“Funds Management”). The Board of Trustees retains the authority to make or ratify any valuation decisions or approve any changes to the Valuation Procedures as it deems appropriate. On a quarterly basis, the Board of Trustees receives reports on any valuation actions taken by the Valuation Committee or the Wells Fargo Asset Management Pricing Committee which may include items for ratification.
Foreign currency translation
The accounting records of the Portfolio are maintained in U.S. dollars. The values of other assets and liabilities denominated in foreign currencies are translated into U.S. dollars at rates provided by an independent foreign currency pricing source at a time each business day specified by the Wells Fargo Asset Management Pricing Committee. Purchases and sales of securities, and income and expenses are converted at the rate of exchange on the respective dates of such transactions. Net realized foreign exchange gains or losses arise from sales of foreign currencies, currency gains or losses realized between the trade and settlement dates on securities transactions, and the difference between the amounts of dividends, interest and foreign withholding taxes recorded and the U.S. dollar equivalent of the amounts actually paid or received. Net unrealized foreign exchange gains and losses arise from changes in the fair value of assets and liabilities other than investments in securities
Wells Fargo Real Return Portfolio | 37
Notes to financial statements (unaudited)
resulting from changes in exchange rates. The changes in net assets arising from changes in exchange rates of securities and the changes in net assets resulting from changes in market prices of securities are not separately presented. Such changes are included in net realized and unrealized gains or losses from investments.
Securities lending
The Portfolio may lend its securities from time to time in order to earn additional income in the form of fees or interest on securities received as collateral or the investment of any cash received as collateral. When securities are on loan, the Portfolio receives interest or dividends on those securities. Cash collateral received in connection with its securities lending transactions is invested in Securities Lending Cash Investments, LLC (the “Securities Lending Fund”). Investments in Securities Lending Fund are valued at the evaluated bid price provided by an independent pricing service. Income earned from investment in the Securities Lending Fund (net of fees and rebates), if any, is included in income from affiliated securities on the Statement of Operations.
In a securities lending transaction, the net asset value of the Portfolio is affected by an increase or decrease in the value of the securities loaned and by an increase or decrease in the value of the instrument in which collateral is invested. The amount of securities lending activity undertaken by the Portfolio fluctuates from time to time. The Portfolio has the right under the lending agreement to recover the securities from the borrower on demand. In the event of default or bankruptcy by the borrower, the Portfolio may be prevented from recovering the loaned securities or gaining access to the collateral or may experience delays or costs in doing so. In such an event, the terms of the agreement allow the unaffiliated securities lending agent to use the collateral to purchase replacement securities on behalf of the Portfolio or pay the Portfolio the market value of the loaned securities. The Portfolio bears the risk of loss with respect to depreciation of its investment of the cash collateral.
When-issued transactions
The Portfolio may purchase securities on a forward commitment or when-issued basis. The Portfolio records a when-issued transaction on the trade date and will segregate assets in an amount at least equal in value to the Portfolio’s commitment to purchase when-issued securities. Securities purchased on a when-issued basis are marked-to-market daily and the Portfolio begins earning interest on the settlement date. Losses may arise due to changes in the market value of the underlying securities or if the counterparty does not perform under the contract.
Loans
The Portfolio may invest in direct debt instruments which are interests in amounts owed to lenders by corporate or other borrowers. The loans pay interest at rates which are periodically reset by reference to a base lending rate plus a spread. Investments in loans may be in the form of participations in loans or assignments of all or a portion of loans from third parties. When the Portfolio purchases participations, it generally has no rights to enforce compliance with the terms of the loan agreement with the borrower. As a result, the Portfolio assumes the credit risk of both the borrower and the lender that is selling the participation. When the Portfolio purchases assignments from lenders, it acquires direct rights against the borrower on the loan and may enforce compliance by the borrower with the terms of the loan agreement. Loans may include fully funded term loans or unfunded loan commitments, which are contractual obligations for future funding.
Futures contracts
Futures contracts are agreements between the Portfolio and a counterparty to buy or sell a specific amount of a commodity, financial instrument or currency at a specified price and on a specified date. The Portfolio may buy and sell futures contracts in order to gain exposure to, or protect against, changes in interest rates and is subject to interest rate risk. The primary risks associated with the use of futures contracts are the imperfect correlation between changes in market values of securities held by the Portfolio and the prices of futures contracts, and the possibility of an illiquid market. Futures contracts are generally entered into on a regulated futures exchange and cleared through a clearinghouse associated with the exchange. With futures contracts, there is minimal counterparty risk to the Portfolio since futures contracts are exchange traded and the exchange’s clearinghouse, as the counterparty to all exchange traded futures, guarantees the futures contracts against default.
Upon entering into a futures contracts, the Portfolio is required to deposit either cash or securities (initial margin) with the broker in an amount equal to a certain percentage of the contract value. Subsequent payments (variation margin) are paid to or from the broker each day equal to the daily changes in the contract value. Such payments are recorded as unrealized gains or losses and, if any, shown as variation margin receivable (payable) in the Statement of Assets and Liabilities. Should the Portfolio fail to make requested variation margin payments, the broker can gain access to the initial margin to satisfy the Portfolio’s payment obligations. When the contracts are closed, a realized gain or loss is recorded in the Statement of Operations.
38 | Wells Fargo Real Return Portfolio
Notes to financial statements (unaudited)
Inflation-indexed bonds and TIPS
The Portfolio may invest in inflation-indexed bonds, including Treasury inflation-protected securities (TIPS). Inflation-indexed bonds are fixed income securities whose principal value is periodically adjusted according to the rate of inflation. If the index measuring inflation falls, the principal value of inflation-indexed bonds (other than municipal inflation-indexed bonds and certain corporate inflation-indexed bonds) will be adjusted downward, and consequently the interest payable on these securities (calculated with respect to a smaller principal amount) will be reduced. Repayment of the original bond principal upon maturity (as adjusted for inflation) is guaranteed in the case of U.S. Treasury inflation-indexed bonds. For bonds that do not provide a similar guarantee, the adjusted principal value of the bond repaid at maturity may be less than the original principal. The value of inflation-indexed bonds is expected to change in response to changes in real interest rates. Real interest rates are tied to the relationship between nominal interest rates and the rate of inflation. If nominal interest rates increase at a faster rate than inflation, real interest rates may rise, leading to a decrease in value of inflation-indexed bonds. Inflation-indexed bonds, including TIPS, decline in value when real interest rates rise. In certain interest rate environments, such as when real interest rates are rising faster than nominal interest rates, inflation-indexed bonds may experience greater losses than other fixed income securities with similar durations.
Security transactions and income recognition
Securities transactions are recorded on a trade date basis. Realized gains or losses are recorded on the basis of identified cost.
Interest income is accrued daily and bond discounts are accreted and premiums are amortized daily. To the extent debt obligations are placed on non-accrual status, any related interest income may be reduced by writing off interest receivables when the collection of all or a portion of interest has been determined to be doubtful based on consistently applied procedures and the fair value has decreased. If the issuer subsequently resumes interest payments or when the collectability of interest is reasonably assured, the debt obligation is removed from non-accrual status.
Dividend income is recognized on the ex-dividend date, except for certain dividends from foreign securities, which are recorded as soon as the custodian verifies the ex-dividend date. Dividend income from foreign securities is recorded net of foreign taxes withheld where recovery of such taxes is not assured.
Federal and other taxes
The Portfolio is treated as a separate entity for federal income tax purposes. The Portfolio is not required to pay federal income taxes on its net investment income and net capital gains as it is treated as a partnership for federal income tax purposes. All income, gains and losses of the Portfolio are deemed to have been “passed through” to the interest holders in proportion to their holdings of the Portfolio regardless of whether income and gains have been distributed by the Portfolio.
The Portfolio’s income tax returns and all financial records supporting those returns for the prior three fiscal years are subject to examination by the federal revenue authority. Management has analyzed the Portfolio’s tax positions taken on federal, state, and foreign tax returns for all open tax years and does not believe that there are any uncertain tax positions that require recognition of a tax liability.
As of November 30, 2020, the aggregate cost of all investments for federal income tax purposes was $196,787,193 and the unrealized gains (losses) consisted of:
| | | | |
| |
Gross unrealized gains | | $ | 21,510,205 | |
| |
Gross unrealized losses | | | (1,389,416 | ) |
| |
Net unrealized gains | | $ | 20,120,789 | |
3. FAIR VALUATION MEASUREMENTS
Fair value measurements of investments are determined within a framework that has established a fair value hierarchy based upon the various data inputs utilized in determining the value of the Portfolio’s investments. The three-level hierarchy gives the highest priority to unadjusted quoted prices in active markets for identical assets or liabilities (Level 1) and the lowest priority to unobservable inputs (Level 3). The Portfolio’s investments are classified within the fair value hierarchy based on the lowest level of input that is significant to the fair value measurement. The inputs are summarized into three broad levels as follows:
| ∎ | | Level 1 – quoted prices in active markets for identical securities |
| ∎ | | Level 2 – other significant observable inputs (including quoted prices for similar securities, interest rates, prepayment speeds, credit risk, etc.) |
| ∎ | | Level 3 – significant unobservable inputs (including the Portfolio’s own assumptions in determining the fair value of investments) |
Wells Fargo Real Return Portfolio | 39
Notes to financial statements (unaudited)
The inputs or methodologies used for valuing investments in securities are not necessarily an indication of the risk associated with investing in those securities.
The following is a summary of the inputs used in valuing the Portfolio’s assets and liabilities as of November 30, 2020:
| | | | | | | | | | | | | | | | |
| | | | |
| | | Quoted prices
(Level 1) | | | Other significant
observable inputs (Level 2) | | | Significant
unobservable inputs (Level 3) | | | Total | |
| | | | |
Assets | | | | | | | | | | | | | | | | |
Investments in: | | | | | | | | | | | | | | | | |
| | | | |
Common stocks | | | | | | | | | | | | | | | | |
| | | | |
Consumer staples | | $ | 9,734,650 | | | $ | 0 | | | $ | 0 | | | $ | 9,734,650 | |
| | | | |
Energy | | | 2,130,654 | | | | 0 | | | | 0 | | | | 2,130,654 | |
| | | | |
Financials | | | 242,830 | | | | 0 | | | | 0 | | | | 242,830 | |
| | | | |
Materials | | | 7,608,659 | | | | 0 | | | | 0 | | | | 7,608,659 | |
| | | | |
Real estate | | | 9,485,466 | | | | 0 | | | | 0 | | | | 9,485,466 | |
| | | | |
Corporate bonds and notes | | | 0 | | | | 31,176,178 | | | | 0 | | | | 31,176,178 | |
| | | | |
Loans | | | 0 | | | | 4,625,654 | | | | 532,857 | | | | 5,158,511 | |
| | | | |
U.S. Treasury securities | | | 144,051,360 | | | | 0 | | | | 0 | | | | 144,051,360 | |
| | | | |
Yankee corporate bonds and notes | | | 0 | | | | 4,785,533 | | | | 0 | | | | 4,785,533 | |
| | | | |
Short-term investments | | | | | | | | | | | | | | | | |
| | | | |
Investment companies | | | 2,549,127 | | | | 0 | | | | 0 | | | | 2,549,127 | |
| | | | |
| | | 175,802,746 | | | | 40,587,365 | | | | 532,857 | | | | 216,922,968 | |
| | | | |
Futures contracts | | | 1,071 | | | | 0 | | | | 0 | | | | 1,071 | |
| | | | |
Total assets | | $ | 175,803,817 | | | $ | 40,587,365 | | | $ | 532,857 | | | $ | 216,924,039 | |
| | | | |
Liabilities | | | | | | | | | | | | | | | | |
| | | | |
Futures contracts | | $ | 16,057 | | | $ | 0 | | | $ | 0 | | | $ | 16,057 | |
| | | | |
Total liabilities | | $ | 16,057 | | | $ | 0 | | | $ | 0 | | | $ | 16,057 | |
Additional sector, industry or geographic detail is included in the Portfolio of Investments.
Futures contracts are reported at their cumulative unrealized gains (losses) at measurement date as reported in the table following the Portfolio of Investments. For futures contracts, the current day’s variation margin is reported on the Statement of Assets and Liabilities. All other assets and liabilities are reported at their market value at measurement date.
For the six months ended November 30, 2020, the Portfolio did not have any transfers into/out of Level 3.
4. TRANSACTIONS WITH AFFILIATES
Advisory fee
The Trust has entered into an advisory contract with Funds Management, an indirect wholly owned subsidiary of Wells Fargo & Company (“Wells Fargo”). The adviser is responsible for implementing investment policies and guidelines and for supervising the subadviser, who is responsible for day-to-day portfolio management of the Portfolio. Pursuant to the contract, Funds Management is entitled to receive an advisory fee at the following annual rate based on the Portfolio’s average daily net assets:
| | | | |
| |
| Average daily net assets | | Advisory fee | |
| |
First $500 million | | | 0.400 | % |
| |
Next $500 million | | | 0.375 | |
| |
Next $2 billion | | | 0.350 | |
| |
Next $2 billion | | | 0.325 | |
| |
Next $5 billion | | | 0.300 | |
| |
Over $10 billion | | | 0.290 | |
40 | Wells Fargo Real Return Portfolio
Notes to financial statements (unaudited)
For the six months ended November 30, 2020, the advisory fee was equivalent to an annual rate of 0.40% of the Portfolio’s average daily net assets.
Funds Management has retained the services of a subadviser a subadviser to provide daily portfolio management to the Portfolio. The fee for subadvisory services is borne by Funds Management. Wells Capital Management Incorporated (“WellsCap”), an affiliate of Funds Management and an indirect wholly owned subsidiary of Wells Fargo, is the subadviser to the Portfolio and is entitled to receive a fee from Funds Management at an annual rate starting at 0.28% and declining to 0.18% as the average daily net assets of the Portfolio increase.
Funds Management has voluntarily waived and/or reimbursed advisory fees to reduce the net operating expense ratio of the Portfolio.
Interfund transactions
The Portfolio may purchase or sell portfolio investment securities to certain other Wells Fargo affiliates pursuant to Rule 17a-7 under the 1940 Act and under procedures adopted by the Board of Trustees. The procedures have been designed to ensure that these interfund transactions, which do not incur broker commissions, are effected at current market prices. Pursuant to these procedures, the Portfolio had $4,796,238, $0 and $0 in interfund purchases, sales and net realized gains (losses), respectively, during the six months ended November 30, 2020.
5. INVESTMENT PORTFOLIO TRANSACTIONS
Purchases and sales of investments, excluding short-term securities, for the six months ended November 30, 2020 were as follows:
| | | | | | |
Purchases at cost | | Sales proceeds |
U.S.
government | | Non-U.S.
government | | U.S.
government | | Non-U.S.
government |
| $33,173,817 | | $29,808,452 | | $3,063,116 | | $12,697,798 |
6. SECURITIES LENDING TRANSACTIONS
The Portfolio lends its securities through an unaffiliated securities lending agent and receives collateral in the form of cash or securities with a value at least equal to the value of the securities on loan. The value of the loaned securities is determined at the close of each business day and any increases or decreases in the required collateral are exchanged between the Portfolio and the counterparty on the next business day. Cash collateral received is invested in the Securities Lending Fund which seeks to provide a positive return compared to the daily Federal Funds Open Rate by investing in high-quality, U.S. dollar-denominated short-term money market instruments and is exempt from registration under Section 3(c)(7) of the 1940 Act. Securities Lending Fund is managed by Funds Management and is subadvised by WellsCap. Funds Management receives an advisory fee starting at 0.05% and declining to 0.01% as the average daily net assets of the Securities Lending Fund increase. All of the fees received by Funds Management are paid to WellsCap for its services as subadviser.
In the event of counterparty default or the failure of a borrower to return a loaned security, the Portfolio has the right to use the collateral to offset any losses incurred. As of November 30, 2020, the Portfolio had securities lending transactions with the following counterparties which are subject to offset:
| | | | | | | | |
| | | |
| Counterparty | | Value of
securities on
loan | | Collateral
received1 | | Net amount | |
| | | |
Barclays Capital Inc. | | $113,235 | | $(113,235) | | $ | 0 | |
| 1 | Collateral received within this table is limited to the collateral for the net transaction with the counterparty. |
7. DERIVATIVE TRANSACTIONS
During the six months ended November 30, 2020, the Portfolio entered into futures contracts to speculate on interest rates and to help manage the duration of the portfolio. The Portfolio had an average notional amount of $3,108,435 in long futures contracts and $11,944,403 in short futures contracts during the six months ended November 30, 2020.
The fair value, realized gains or losses and change in unrealized gains or losses, if any, on derivative instruments are reflected in the corresponding financial statement captions.
Wells Fargo Real Return Portfolio | 41
Notes to financial statements (unaudited)
8. BORROWINGS
The Trust, along with Wells Fargo Variable Trust and Wells Fargo Funds Trust (excluding the money market funds), are parties to a $350,000,000 revolving credit agreement whereby the Portfolio is permitted to use bank borrowings for temporary or emergency purposes, such as to fund shareholder redemption requests. Interest under the credit agreement is charged to the Portfolio based on a borrowing rate equal to the higher of the Federal Funds rate in effect on that day plus 1.25% or the overnight LIBOR rate in effect on that day plus 1.25%. In addition, an annual commitment fee equal to 0.25% of the unused balance is allocated to each participating fund.
For the six months ended November 30, 2020, there were no borrowings by the Portfolio under the agreement.
9. INDEMNIFICATION
Under the Portfolio’s organizational documents, the officers and Trustees have been granted certain indemnification rights against certain liabilities that may arise out of performance of their duties to the Portfolio. The Portfolio has entered into a separate agreement with each Trustee that converts indemnification rights currently existing under the Portfolio’s organizational documents into contractual rights that cannot be changed in the future without the consent of the Trustee. Additionally, in the normal course of business, the Portfolio may enter into contracts with service providers that contain a variety of indemnification clauses. The Portfolio’s maximum exposure under these arrangements is dependent on future claims that may be made against the Portfolio and, therefore, cannot be estimated.
10. NEW ACCOUNTING PRONOUNCEMENT
In August 2018, FASB issued Accounting Standards Update (“ASU”) No. 2018-13, Fair Value Measurement (Topic 820) Disclosure Framework—Changes to the Disclosure Requirements for Fair Value Measurement. ASU 2018-13 updates the disclosure requirements on fair value measurements in Topic 820, Fair Value Measurements. The amendments are effective for fiscal years, and interim periods within those fiscal years, beginning after December 15, 2019. Management has adopted this guidance which did not have a material impact on the financial statements.
11. CORONAVIRUS (COVID-19) PANDEMIC
On March 11, 2020, the World Health Organization announced that it had made the assessment that coronavirus disease 2019 (“COVID-19”) is a pandemic. The impacts of COVID-19 are adversely affecting the entire global economy, individual companies and investment products, and the market in general. There is significant uncertainty around the extent and duration of business disruptions related to COVID-19 and the impacts may be short term or may last for an extended period of time. The risk of further spreading of COVID-19 has led to significant uncertainty and volatility in the financial markets.
42 | Wells Fargo Real Return Portfolio
Other information (unaudited)
PROXY VOTING INFORMATION
A description of the policies and procedures used to determine how to vote proxies relating to portfolio securities is available, upon request, by calling 1-800-222-8222, visiting our website at wfam.com, or visiting the SEC website at sec.gov. Information regarding how the proxies related to portfolio securities were voted during the most recent 12-month period ended June 30 is available on the website at wfam.com or by visiting the SEC website at sec.gov.
QUARTERLY PORTFOLIO HOLDINGS INFORMATION
The Fund and Portfolio file their complete schedule of portfolio holdings with the SEC for the first and third quarters of each fiscal year as an exhibit to its reports on Form N-PORT. Shareholders may view the filed Form N-PORT by visiting the SEC website at sec.gov.
Wells Fargo Real Return Fund | 43
Other information (unaudited)
BOARD OF TRUSTEES AND OFFICERS
Each of the Trustees and Officers1 listed in the table below acts in identical capacities for each fund in the Wells Fargo family of funds, which consists of 144 mutual funds comprising the Wells Fargo Funds Trust, Wells Fargo Variable Trust, Wells Fargo Master Trust and four closed-end funds (collectively the “Fund Complex”). This table should be read in conjunction with the Prospectus and the Statement of Additional Information2. The mailing address of each Trustee and Officer is 525 Market Street, 12th Floor, San Francisco, CA 94105. Each Trustee and Officer serves an indefinite term, however, each Trustee serves such term until reaching the mandatory retirement age established by the Trustees.
Independent Trustees
| | | | | | |
Name and year of birth | | Position held and
length of service* | | Principal occupations during past five years or longer | | Current other
public company or
investment
company
directorships |
| | | |
William R. Ebsworth (Born 1957) | | Trustee, since 2015 | | Retired. From 1984 to 2013, equities analyst, portfolio manager, research director and chief investment officer at Fidelity Management and Research Company in Boston, Tokyo, and Hong Kong, and retired in 2013 as Chief Investment Officer of Fidelity Strategic Advisers, Inc. where he led a team of investment professionals managing client assets. Prior thereto, Board member of Hong Kong Securities Clearing Co., Hong Kong Options Clearing Corp., the Thailand International Fund, Ltd., Fidelity Investments Life Insurance Company, and Empire Fidelity Investments Life Insurance Company. Audit Committee Chair and Investment Committee Chair of the Vincent Memorial Hospital Endowment (non-profit organization). Mr. Ebsworth is a CFA® charterholder. | | N/A |
| | | |
Jane A. Freeman (Born 1953) | | Trustee, since 2015; Chair Liaison, since 2018 | | Retired. From 2012 to 2014 and 1999 to 2008, Chief Financial Officer of Scientific Learning Corporation. From 2008 to 2012, Ms. Freeman provided consulting services related to strategic business projects. Prior to 1999, Portfolio Manager at Rockefeller & Co. and Scudder, Stevens & Clark. Board member of the Harding Loevner Funds from 1996 to 2014, serving as both Lead Independent Director and chair of the Audit Committee. Board member of the Russell Exchange Traded Funds Trust from 2011 to 2012 and the chair of the Audit Committee. Ms. Freeman is also an inactive Chartered Financial Analyst. | | N/A |
| | | |
Isaiah Harris, Jr. (Born 1952) | | Trustee, since 2009; Audit Committee Chair, since 2019 | | Retired. Chairman of the Board of CIGNA Corporation since 2009, and Director since 2005. From 2003 to 2011, Director of Deluxe Corporation. Prior thereto, President and CEO of BellSouth Advertising and Publishing Corp. from 2005 to 2007, President and CEO of BellSouth Enterprises from 2004 to 2005 and President of BellSouth Consumer Services from 2000 to 2003. Emeritus member of the Iowa State University Foundation Board of Governors. Emeritus Member of the Advisory Board of Iowa State University School of Business. Advisory Board Member, Palm Harbor Academy (private school). Mr. Harris is a certified public accountant (inactive status). | | CIGNA Corporation |
| | | |
Judith M. Johnson (Born 1949) | | Trustee, since 2008 | | Retired. Prior thereto, Chief Executive Officer and Chief Investment Officer of Minneapolis Employees Retirement Fund from 1996 to 2008. Ms. Johnson is an attorney, certified public accountant and a certified managerial accountant. | | N/A |
| | | |
David F. Larcker (Born 1950) | | Trustee, since 2009 | | James Irvin Miller Professor of Accounting at the Graduate School of Business (Emeritus), Stanford University, Director of the Corporate Governance Research Initiative and Senior Faculty of The Rock Center for Corporate Governance since 2006. From 2005 to 2008, Professor of Accounting at the Graduate School of Business, Stanford University. Prior thereto, Ernst & Young Professor of Accounting at The Wharton School, University of Pennsylvania from 1985 to 2005. | | N/A |
44 | Wells Fargo Real Return Fund
Other information (unaudited)
| | | | | | |
Name and year of birth | | Position held and
length of service* | | Principal occupations during past five years or longer | | Current other
public company or
investment
company
directorships |
| | | |
Olivia S. Mitchell (Born 1953) | | Trustee, since 2006; Nominating and Governance Committee Chair, since 2018 | | International Foundation of Employee Benefit Plans Professor, Wharton School of the University of Pennsylvania since 1993. Director of Wharton’s Pension Research Council and Boettner Center on Pensions & Retirement Research, and Research Associate at the National Bureau of Economic Research. Previously, Cornell University Professor from 1978 to 1993. | | N/A |
| | | |
Timothy J. Penny (Born 1951) | | Trustee, since 1996; Chair, since 2018 | | President and Chief Executive Officer of Southern Minnesota Initiative Foundation, a non-profit organization, since 2007. Member of the Board of Trustees of NorthStar Education Finance, Inc., a non-profit organization, since 2007. | | N/A |
| | | |
James G. Polisson (Born 1959) | | Trustee, since 2018 | | Retired. Chief Marketing Officer, Source (ETF) UK Services, Ltd, from 2015 to 2017. From 2012 to 2015, Principal of The Polisson Group, LLC, a management consulting, corporate advisory and principal investing company. Chief Executive Officer and Managing Director at Russell Investments, Global Exchange Traded Funds from 2010 to 2012. Managing Director of Barclays Global Investors from 1998 to 2010 and Global Chief Marketing Officer for iShares and Barclays Global Investors from 2000 to 2010. Trustee of the San Francisco Mechanics’ Institute, a non-profit organization, from 2013 to 2015. Board member of the Russell Exchange Traded Fund Trust from 2011 to 2012. Director of Barclays Global Investors Holdings Deutschland GmbH from 2006 to 2009. Mr. Polisson is an attorney and has a retired status with the Massachusetts and District of Columbia Bar Associations. | | N/A |
| | | |
Pamela Wheelock (Born 1959) | | Trustee, since January 2020; previously Trustee from January 2018 to July 2019 | | Board member of the Destination Medical Center Economic Development Agency, Rochester, Minnesota since 2019. Interim President of the McKnight Foundation from January to September 2020. Acting Commissioner, Minnesota Department of Human Services, July 2019 through September 2019. Human Services Manager (part-time), Minnesota Department of Human Services, October 2019 through December 2019. Chief Operating Officer, Twin Cities Habitat for Humanity from 2017 to 2019. Vice President of University Services, University of Minnesota from 2012 to 2016. Prior thereto, on the Board of Directors, Governance Committee and Finance Committee for the Minnesota Philanthropy Partners (Saint Paul Foundation) from 2012 to 2018, Interim Chief Executive Officer of Blue Cross Blue Shield of Minnesota from 2011 to 2012, Chairman of the Board from 2009 to 2012 and Board Director from 2003 to 2015. Vice President, Leadership and Community Engagement, Bush Foundation, Saint Paul, Minnesota (a private foundation) from 2009 to 2011. Executive Vice President and Chief Financial Officer, Minnesota Sports and Entertainment from 2004 to 2009 and Senior Vice President from 2002 to 2004. Executive Vice President of the Minnesota Wild Foundation from 2004 to 2008. Commissioner of Finance, State of Minnesota, from 1999 to 2002. Currently Board Chair of the Minnesota Wild Foundation since 2010. | | N/A |
| * | Length of service dates reflect the Trustee’s commencement of service with the Trust’s predecessor entities, where applicable. |
Wells Fargo Real Return Fund | 45
Other information (unaudited)
Officers
| | | | |
Name and year of birth | | Position held and
length of service | | Principal occupations during past five years or longer |
| | |
Andrew Owen (Born 1960) | | President, since 2017 | | Executive Vice President of Wells Fargo & Company and Head of Affiliated Managers, Wells Fargo Asset Management, since 2014. In addition, Mr. Owen is currently President, Chief Executive Officer and Director of Wells Fargo Funds Management, LLC since 2017. Prior thereto, Executive Vice President responsible for marketing, investments and product development for Wells Fargo Funds Management, LLC, from 2009 to 2014. |
| | |
Nancy Wiser1 (Born 1967) | | Treasurer, since 2012 | | Executive Vice President of Wells Fargo Funds Management, LLC since 2011. Chief Operating Officer and Chief Compliance Officer at LightBox Capital Management LLC, from 2008 to 2011. |
| | |
Michelle Rhee (Born 1966) | | Chief Legal Officer, since 2019 | | Secretary of Wells Fargo Funds Management, LLC and Chief Legal Counsel of Wells Fargo Asset Management since 2018. Deputy General Counsel of Wells Fargo Bank, N.A. since 2020 and Assistant General Counsel of Wells Fargo Bank, N.A. from 2018 to 2020. Associate General Counsel and Managing Director of Bank of America Corporation from 2004 to 2018. |
| | |
Catherine Kennedy (Born 1969) | | Secretary, since 2019 | | Vice President of Wells Fargo Funds Management, LLC and Senior Counsel of the Wells Fargo Legal Department since 2010. Vice President and Senior Counsel of Evergreen Investment Management Company, LLC from 1998 to 2010. |
| | |
Michael H. Whitaker (Born 1967) | | Chief Compliance Officer, since 2016 | | Chief Compliance Officer of Wells Fargo Asset Management since 2016. Senior Vice President and Chief Compliance Officer for Fidelity Investments from 2007 to 2016. |
| | |
Jeremy DePalma1 (Born 1974) | | Assistant Treasurer, since 2009 | | Senior Vice President of Wells Fargo Funds Management, LLC since 2009. Senior Vice President of Evergreen Investment Management Company, LLC from 2008 to 2010 and head of the Fund Reporting and Control Team within Fund Administration from 2005 to 2010. |
| 1 | Nancy Wiser acts as Treasurer of 67 funds in the Fund Complex. Jeremy DePalma acts as the Treasurer of 77 funds and Assistant Treasurer of 67 funds in the Fund Complex. |
| 2 | The Statement of Additional Information includes additional information about the Trustees and is available, without charge, upon request, by calling 1-800-222-8222 or by visiting the website at wfam.com. |
46 | Wells Fargo Real Return Fund
This page is intentionally left blank.
This page is intentionally left blank.

For more information
More information about Wells Fargo Funds is available free upon request. To obtain literature, please write, visit the Fund’s website, or call:
Wells Fargo Funds
P.O. Box 219967
Kansas City, MO 64121-9967
Website: wfam.com
Individual investors: 1-800-222-8222
Retail investment professionals: 1-888-877-9275
Institutional investment professionals: 1-866-765-0778

This report and the financial statements contained herein are submitted for the general information of the shareholders of the Fund. If this report is used for promotional purposes, distribution of the report must be accompanied or preceded by a current prospectus. Before investing, please consider the investment objectives, risks, charges, and expenses of the investment. For a current prospectus and, if available, a summary prospectus, containing this information, call 1-800-222-8222 or visit the Fund’s website at wfam.com. Read the prospectus carefully before you invest or send money.
Wells Fargo Asset Management (WFAM) is the trade name for certain investment advisory/management firms owned by Wells Fargo & Company. These firms include but are not limited to Wells Capital Management Incorporated and Wells Fargo Funds Management, LLC. Certain products managed by WFAM entities are distributed by Wells Fargo Funds Distributor, LLC (a broker-dealer and Member FINRA).
This material is for general informational and educational purposes only and is NOT intended to provide investment advice or a recommendation of any kind—including a recommendation for any specific investment, strategy, or plan.
INVESTMENT PRODUCTS: NOT FDIC INSURED ◾ NO BANK GUARANTEE ◾ MAY LOSE VALUE
© 2021 Wells Fargo & Company. All rights reserved.
PAR-1220-00737 01-20
SA288/SAR288 11-20
Semi-Annual Report
November 30, 2020
Multi-Asset Funds
| ∎ | | Wells Fargo Spectrum Aggressive Growth Fund (formerly, Wells Fargo WealthBuilder Equity Fund) |
| ∎ | | Wells Fargo Spectrum Conservative Growth Fund (formerly, Wells Fargo WealthBuilder Moderate Balanced Fund) |
| ∎ | | Wells Fargo Spectrum Growth Fund (formerly, Wells Fargo WealthBuilder Growth Allocation Fund) |
| ∎ | | Wells Fargo Spectrum Income Allocation Fund (formerly, Wells Fargo WealthBuilder Conservative Allocation Fund) |
| ∎ | | Wells Fargo Spectrum Moderate Growth Fund (formerly, Wells Fargo WealthBuilder Growth Balanced Fund) |
|
|
|
Reduce clutter. Save trees. |
Sign up for electronic delivery of prospectuses and shareholder reports at wellsfargo.com/
advantagedelivery |
The views expressed and any forward-looking statements are as of November 30, 2020, unless otherwise noted, and are those of the Fund’s portfolio managers and/or Wells Fargo Asset Management. Discussions of individual securities, or the markets generally, or any Wells Fargo Fund are not intended as individual recommendations. Future events or results may vary significantly from those expressed in any forward looking statements. The views expressed are subject to change at any time in response to changing circumstances in the market. Wells Fargo Asset Management and the Fund disclaim any obligation to publicly update or revise any views expressed or forward-looking statements.
INVESTMENT PRODUCTS: NOT FDIC INSURED ◾ NO BANK GUARANTEE ◾ MAY LOSE VALUE
Wells Fargo Multi-Asset Funds | 1
Letter to shareholders (unaudited)

Andrew Owen
President
Wells Fargo Funds
“Global stock markets rallied strongly, driven by aggressive stimulus measures introduced by central banks and governments in response to challenges presented by the COVID-19 pandemic.”
Dear Shareholder:
We are pleased to offer you this semi-annual report for the Wells Fargo Spectrum Funds for the six-month period that ended November 30, 2020. Effective November 2, 2020, the Funds changed their name from Wells Fargo WealthBuilder Funds to Wells Fargo Spectrum Funds. Global stock markets rallied strongly, driven by aggressive stimulus measures introduced by central banks and governments in response to challenges presented by the COVID-19 pandemic. Emerging market equities had particularly robust results during the six-month period. Among bonds, high-yield issues led the way while U.S. bonds generally had more modest returns than their international counterparts.
For the period, U.S. stocks, based on the S&P 500 Index,1 returned 19.98% and international stocks, as measured by the MSCI ACWI ex USA Index (Net),2 gained 23.28%. The MSCI EM Index (Net)3 rallied 31.14%. Among bond investments, the Bloomberg Barclays U.S. Aggregate Bond Index4 returned a modest 1.79%, the Bloomberg Barclays Global Aggregate ex-USD Index5 gained a robust 8.19%, the Bloomberg Barclays Municipal Bond Index6 had a 3.29% return, and the ICE BofA U.S. High Yield Index7 gained a healthy 10.47%.
Equities enjoyed a strong tailwind from monetary and fiscal stimulus.
Financial markets posted widely positive returns in June despite ongoing economic weakness and uncertainty regarding COVID-19 and the timing of an effective vaccine. As economies reopened, optimism rose. Vitally important to market sentiment was the ongoing global central bank commitment to provide economic support through liquidity and low borrowing costs. U.S. economic activity was boosted by one-time $1,200 stimulus checks and $600 weekly bonus unemployment benefits for tens of millions of Americans through July. However, jobless rates remained historically high, easing somewhat from 14.7% in April to 11.1% in June. By late June, numerous states reported increases of COVID-19 cases, an ominous sign. China’s economic recovery picked up momentum in June.
July was broadly positive for both global equities and fixed income. However, economic data and a resurgence of COVID-19 cases pointed to the vulnerability of the global economy and the need to regain control of the pandemic. Second-quarter gross domestic product (GDP) shrank from the previous quarter by 9.5% and 12.1% in the U.S. and the eurozone, respectively. In contrast, China reported 3.2% year-over-year second-quarter GDP growth. U.S. unemployment remained high despite adding 1.8 million jobs in July, as a double-digit jobless rate persisted. However, manufacturing activity grew in both the U.S. and the eurozone. In Asia, while China’s manufacturing sector continued to expand, activity in Japan and South Korea contracted. A rising concern was the rapid and broad reemergence of COVID-19 infections.
| 1 | The S&P 500 Index consists of 500 stocks chosen for market size, liquidity, and industry group representation. It is a market-value-weighted index with each stock’s weight in the index proportionate to its market value. You cannot invest directly in an index. |
| 2 | The Morgan Stanley Capital International (MSCI) All Country World Index (ACWI) ex USA Index (Net) is a free-float-adjusted market-capitalization-weighted index that is designed to measure the equity market performance of developed and emerging markets, excluding the United States. Source: MSCI. MSCI makes no express or implied warranties or representations and shall have no liability whatsoever with respect to any MSCI data contained herein. The MSCI data may not be further redistributed or used as a basis for other indices or any securities or financial products. This report is not approved, reviewed, or produced by MSCI. You cannot invest directly in an index. |
| 3 | The MSCI Emerging Markets (EM) Index (Net) is a free-float-adjusted market-capitalization-weighted index that is designed to measure equity market performance of emerging markets. You cannot invest directly in an index. |
| 4 | The Bloomberg Barclays U.S. Aggregate Bond Index is a broad-based benchmark that measures the investment-grade, U.S. dollar-denominated, fixed-rate taxable bond market, including Treasuries, government-related and corporate securities, mortgage-backed securities (agency fixed-rate and hybrid adjustable-rate mortgage pass-throughs), asset-backed securities, and commercial mortgage-backed securities. You cannot invest directly in an index. |
| 5 | The Bloomberg Barclays Global Aggregate ex-USD Index is an unmanaged index that provides a broad-based measure of the global investment-grade fixed-income markets excluding the U.S. dollar-denominated debt market. You cannot invest directly in an index. |
| 6 | The Bloomberg Barclays Municipal Bond Index is an unmanaged index composed of long-term tax-exempt bonds with a minimum credit rating of Baa. You cannot invest directly in an index. |
| 7 | The ICE BofA U.S. High Yield Index is a market-capitalization-weighted index of domestic and Yankee high-yield bonds. The index tracks the performance of high-yield securities traded in the U.S. bond market. You cannot invest directly in an index. Copyright 2021. ICE Data Indices, LLC. All rights reserved. |
2 | Wells Fargo Multi-Asset Funds
Letter to shareholders (unaudited)
The stock market continued to rally in August despite concerns over rising COVID-19 cases in the U.S. and Europe, as well as the expiration of the $600 weekly bonus unemployment benefit in July. Generally stronger-than-expected second-quarter earnings boosted investor sentiment along with the Federal Reserve’s announcement of a more accommodative policy shift that could lead to longer-term low interest rates. U.S. indices measuring manufacturing and services activities beat expectations while the U.S. housing market maintained strength. In Europe, retail sales expanded and consumer confidence was steady. China’s economy continued to expand.
Stocks grew more volatile in September on mixed economic data. U.S. economic activity continued to grow. However, only half of the 22 million jobs lost since the early spring had returned. The U.S. unemployment rate fell to 7.9% in September, a measurable improvement but far higher than the 3.5% pre-COVID-19 rate. Only 661,000 jobs were added for the month, down from 1.5 million in August. With the U.S. Congress failing to pass further fiscal relief and uncertainties surrounding a possible vaccine, doubts crept back into the markets. In the U.K., a lack of progress in Brexit talks with the European Union weighed on markets. China’s economy picked up steam, however, with growth fueled by increased global demand.
In October, capital markets took a step back from their six-month rally. Market volatility rose in advance of the U.S. election and amid a global increase in COVID-19 infections. Europe responded with more economic restrictions. Meanwhile, Brexit remained unresolved. U.S. markets looked favorably at a possible Democratic sweep and control of the federal purse strings in anticipation of additional fiscal stimulus, which could boost economic activity. Meanwhile, China continued to stand apart, reporting 4.9% third-quarter GDP growth year over year.
Global stocks rallied broadly in November, propelled by optimism over three promising COVID-19 vaccines, which reported high effectiveness in trials. Global stock indices notched double-digit monthly gains. In a reversal of recent trends, value stocks outperformed growth and cyclical stocks outpaced technology stocks. However, U.S. unemployment remained elevated, with a net job loss of 10 million since February. The Eurozone Services Purchasing Managers’ Index, a monthly survey of purchasing managers, contracted sharply while the region’s manufacturing activity gauge indicated growth. The U.S. election results added to the market’s upbeat mood as investors gave thumbs-up to the certainty of the outcome after an unusual delay and anticipated more consistent policies in the new administration.
Don’t let short-term uncertainty derail long-term investment goals.
Periods of investment uncertainty can present challenges, but experience has taught us that maintaining long-term investment goals can be an effective way to plan for the future. To help you create a sound strategy based on your personal goals and risk tolerance, Wells Fargo Funds offers more than 100 mutual funds spanning a wide range of asset classes and investment styles. Although diversification cannot guarantee an investment profit or prevent losses, we believe it can be an effective way to manage investment risk and potentially smooth out overall portfolio performance. We encourage investors to know their investments and to understand that appropriate levels of risk-taking may unlock opportunities.
Thank you for choosing to invest with Wells Fargo Funds. We appreciate your confidence in us and remain committed to helping you meet your financial needs.
Sincerely,

Andrew Owen
President
Wells Fargo Funds
“Global stocks rallied broadly in November, propelled by optimism over three promising COVID-19 vaccines, which reported high effectiveness in trials.”
|
|
|
For further information about your Fund, contact your investment professional, visit our website at wfam.com, or call us directly at 1-800-222-8222. |
Wells Fargo Multi-Asset Funds | 3
Letter to shareholders (unaudited)
Notice to Shareholders
At a meeting held on August 10-12, 2020, the Board of Trustees of the Funds approved a change to each Fund’s automatic conversion feature for Class C shares in order to shorten the required holding period from 10 to 8 years. As a result, on a monthly basis beginning November 5, 2020, Class C shares will convert automatically into Class A shares 8 years after the initial date of purchase or, if you acquired your Class C shares through an exchange or conversion from another share class, 8 years after the date you acquired your Class C shares. When Class C shares that you acquired through a purchase or exchange convert, any other Class C shares that you purchased with reinvested dividends and distributions also will convert into Class A shares on a pro rata basis.
Please note that a shorter holding period may apply depending on your intermediary. Please see “Appendix A—Sales Charge Reductions and Waivers for Certain Intermediaries” in the Fund’s prospectus for further information.
Notice to Shareholders
Preparing for LIBOR Transition
The global financial industry is preparing to transition away from the London Interbank Offered Rate (LIBOR), a key benchmark interest rate, to new alternative rates. LIBOR underpins more than $350 trillion of financial contracts. It is the benchmark rate for a wide spectrum of products ranging from residential mortgages to corporate bonds to derivatives. Regulators have called for a market-wide transition away from LIBOR to successor reference rates by the end of 2021, which requires proactive steps be taken by issuers, counterparties, and asset managers to identify impacted products and adopt new reference rates.
Each Fund (except Wells Fargo Spectrum Aggressive Growth Fund) holds at least one security that uses LIBOR as a floating reference rate and has a maturity date after 12-31-2021.
Although the transition process away from LIBOR has become increasingly well-defined in advance of the anticipated discontinuation date, there remains uncertainty regarding the nature of successor reference rates, and any potential effects of the transition away from LIBOR on investment instruments that use it as a benchmark rate. The transition process may result in, among other things, increased volatility or illiquidity in markets for instruments that currently rely on LIBOR and could negatively impact the value of certain instruments held by the Fund.
Wells Fargo Asset Management is monitoring LIBOR exposure closely and has put resources and controls in place to manage this transition effectively. The portfolio management team is evaluating LIBOR holdings to understand what happens to those securities when LIBOR ceases to exist, including examining security documentation to identify the presence or absence of fallback language identifying a replacement rate to LIBOR.
While the pace of transition away from LIBOR will differ by asset class and investment strategy, the portfolio management team will monitor market conditions for those holdings to identify and mitigate deterioration or volatility in pricing and liquidity and ensure appropriate actions are taken in a timely manner.
Further information regarding the potential risks associated with the discontinuation of LIBOR can be found in the Fund’s Statement of Additional Information.
4 | Wells Fargo Multi-Asset Funds
This page is intentionally left blank.
Performance highlights (unaudited)
Wells Fargo Spectrum Aggressive Growth Fund
Investment objective
The Fund seeks long-term capital appreciation with no emphasis on income.
Manager
Wells Fargo Funds Management, LLC
Subadviser
Wells Capital Management Incorporated
Portfolio managers
Kandarp R. Acharya, CFA®‡, FRM
Christian L. Chan, CFA®‡
Travis L. Keshemberg, CFA®‡, CIPM, FRM
Average annual total returns (%) as of November 30, 2020
| | | | | | | | | | | | | | | | | | | | | | | | | | | | | | | | | | |
| | | | |
| | | | | Including sales charge | | | Excluding sales charge | | | Expense ratios1 (%) | |
| | | | | | | | | |
| | | Inception date | | 1 year | | | 5 year | | | 10 year | | | 1 year | | | 5 year | | | 10 year | | | Gross | | | Net2 | |
| | | | | | | | | | |
| Class A (WEAFX)3 | | 2-10-2017 | | | 13.69 | | | | 9.77 | | | | 9.31 | | | | 20.62 | | | | 11.08 | | | | 9.96 | | | | 1.05 | | | | 1.03 | |
| | | | | | | | | | |
| Class C (WEACX)4 | | 10-1-1997 | | | 18.80 | | | | 10.45 | | | | 9.65 | | | | 19.80 | | | | 10.45 | | | | 9.65 | | | | 1.80 | | | | 1.78 | |
| | | | | | | | | | |
| Institutional Class (WEAYX)5 | | 7-31-2018 | | | – | | | | – | | | | – | | | | 20.95 | | | | 11.24 | | | | 10.05 | | | | 0.72 | | | | 0.70 | |
| | | | | | | | | | |
| Spectrum Aggressive Growth Blended Index6 | | – | | | – | | | | – | | | | – | | | | 16.16 | | | | 12.00 | | | | 11.37 | | | | – | | | | – | |
| | | | | | | | | | |
| MSCI ACWI ex USA Index (Net)7 | | – | | | – | | | | – | | | | – | | | | 9.52 | | | | 7.38 | | | | 5.16 | | | | – | | | | – | |
| | | | | | | | | | |
| Russell 3000® Index8 | | – | | | – | | | | – | | | | – | | | | 19.02 | | | | 13.95 | | | | 14.04 | | | | – | | | | – | |
Figures quoted represent past performance, which is no guarantee of future results, and do not reflect taxes that a shareholder may pay on an investment in a fund. Investment return and principal value of an investment will fluctuate so that an investor’s shares, when redeemed, may be worth more or less than their original cost. Performance shown without sales charges would be lower if sales charges were reflected. Current performance may be lower or higher than the performance data quoted, which assumes the reinvestment of dividends and capital gains. Current month-end performance is available on the Fund’s website, wfam.com.
Index returns do not include transaction costs associated with buying and selling securities, any mutual fund fees or expenses, or any taxes. It is not possible to invest directly in an index.
For Class A shares, the maximum front-end sales charge is 5.75%. For Class C shares, the maximum contingent deferred sales charge is 1.00%. Performance including a contingent deferred sales charge assumes the sales charge for the corresponding time period. Institutional Class shares are sold without a front-end sales charge or contingent deferred sales charge.
Stock values fluctuate in response to the activities of individual companies and general market and economic conditions. The Fund will indirectly be exposed to all of the risks of an investment in the underlying funds and will indirectly bear expenses of the underlying funds. The use of derivatives may reduce returns and/or increase volatility. Certain investment strategies tend to increase the total risk of an investment (relative to the broader market). The Fund is exposed to alternative investment risk, foreign investment risk and smaller-company investment risk. Consult the Fund’s prospectus for additional information on these and other risks.
Please see footnotes on page 7.
6 | Wells Fargo Multi-Asset Funds
Performance highlights (unaudited)
Wells Fargo Spectrum Aggressive Growth Fund (continued)
| | | | |
|
| Ten largest holdings (%) as of November 30, 20209 | |
| | |
Wells Fargo Disciplined Large Cap Portfolio | | | 27.33 | |
| | |
Wells Fargo Factor Enhanced U.S. Large Cap Equity Portfolio | | | 21.51 | |
| | |
Wells Fargo Factor Enhanced International Equity Portfolio | | | 19.56 | |
| | |
Wells Fargo Factor Enhanced U.S. Small Cap Equity Portfolio | | | 6.57 | |
| | |
Wells Fargo Factor Enhanced Emerging Markets Equity Portfolio | | | 4.83 | |
| | |
Wells Fargo Endeavor Select Fund Class R6 | | | 3.96 | |
| | |
Wells Fargo Large Cap Growth Fund Class R6 | | | 3.93 | |
| | |
iShares Core MSCI EAFE ETF | | | 2.42 | |
| | |
iShares Core S&P 500 Index ETF | | | 1.95 | |
| | |
Wells Fargo Emerging Markets Equity Fund Class R6 | | | 1.92 | |
| | | | | | | | |
|
| Allocations (%) as of November 30, 2020 | |
| | |
| | | Neutral
allocation | | | Effective
allocation10 | |
| | | |
U.S. Large Cap Stock Funds | | | 60 | | | | 60 | |
| | | |
International Stock Funds | | | 30 | | | | 30 | |
| | | |
U.S. Small Cap Stock Funds | | | 10 | | | | 10 | |
| ‡ | CFA® and Chartered Financial Analyst® are trademarks owned by CFA Institute. |
| 1 | Reflects the expense ratios as stated in the most recent prospectuses, which include the impact of 0.28% of acquired fund fees and expenses. Net expenses from affiliated master portfolios are included in the acquired fund fees and expense amount. The expense ratios shown are subject to change and may differ from the annualized expense ratios shown in the financial highlights of this report, which do not include acquired fund fees and expenses. |
| 2 | The manager has contractually committed through September 30, 2021, to waive fees and/or reimburse expenses to the extent necessary to cap total annual fund operating expenses after fee waivers at 0.75% for Class A, 1.50% for Class C, and 0.42% for Institutional Class. Brokerage commissions, stamp duty fees, interest, taxes, acquired fund fees and expenses (if any), net expenses from affiliated master portfolios, and extraordinary expenses are excluded from the expense caps. Prior to or after the commitment expiration date, the caps may be increased or the commitment to maintain the cap may be terminated only with the approval of the Board of Trustees. Without these caps, the Fund’s returns would have been lower. The expense ratio paid by an investor is the net expense ratio (the total annual fund operating expenses after fee waivers) as stated in the prospectuses. |
| 3 | Historical performance for the Class A shares prior to their inception reflects the performance of the Class C shares and includes the higher expenses applicable to the Class C shares. If these expenses had not been included, returns for the Class A shares would be higher. |
| 4 | Prior to February 13, 2017, historical performance shown for the Class C shares reflects the performance of the Fund’s predecessor WealthBuilder Portfolio share class and does not reflect the front-end sales load previously attributable to the predecessor class. The expenses for the Class C shares and the predecessor share class are similar. |
| 5 | Historical performance shown for the Institutional Class shares prior to their inception reflects the performance of the Class A shares adjusted to reflect that the Institutional Class shares do not have a sales load but not adjusted to reflect the Institutional Class expenses. If these expenses had been included, returns for the Institutional Class shares would be higher. |
| 6 | Source: Wells Fargo Funds Management, LLC. The Spectrum Aggressive Growth Blended Index is composed 70% of the Russell 3000® Index and 30% of the MSCI ACWI ex USA Index (Net). Effective November 2, 2020, the WealthBuilder Equity Blended Index was renamed the Spectrum Aggressive Growth Blended Index. You cannot invest directly in an index. |
| 7 | The Morgan Stanley Capital International (MSCI) All Country World Index (ACWI) ex USA Index (Net) is a free-float-adjusted market-capitalization-weighted index that is designed to measure the equity market performance of developed and emerging markets, excluding the U.S. Source: MSCI. MSCI makes no express or implied warranties or representations and shall have no liability whatsoever with respect to any MSCI data contained herein. The MSCI data may not be further redistributed or used as a basis for other indexes or any securities or financial products. This report is not approved, reviewed, or produced by MSCI. You cannot invest directly in an index. |
| 8 | The Russell 3000® Index measures the performance of the 3,000 largest U.S. companies based on total market capitalization, which represents approximately 98% of the investable U.S. equity market. You cannot invest directly in an index. |
| 9 | Figures represent the percentage of the Fund’s net assets. Holdings are subject to change and may have changed since the date specified. |
| 10 | Effective allocation includes the effect of any tactical futures overlay that may be in place. Effective cash, if any, represents the net offset to such future positions. These amounts are subject to change and may have changed since the date specified. |
Wells Fargo Multi-Asset Funds | 7
Performance highlights (unaudited)
Wells Fargo Spectrum Conservative Growth Fund
Investment objective
The Fund seeks a combination of current income and capital appreciation.
Manager
Wells Fargo Funds Management, LLC
Subadviser
Wells Capital Management Incorporated
Portfolio managers
Kandarp R. Acharya, CFA®‡, FRM
Christian L. Chan, CFA®‡
Travis L. Keshemberg, CFA®‡, CIPM, FRM
Average annual total returns (%) as of November 30, 2020
| | | | | | | | | | | | | | | | | | | | | | | | | | | | | | | | | | |
| | | | |
| | | | | Including sales charge | | | Excluding sales charge | | | Expense ratios1 (%) | |
| | | | | | | | | |
| | | Inception date | | 1 year | | | 5 year | | | 10 year | | | 1 year | | | 5 year | | | 10 year | | | Gross | | | Net2 | |
| | | | | | | | | | |
| Class A (WMBGX)3 | | 2-10-2017 | | | 5.22 | | | | 5.40 | | | | 5.16 | | | | 11.64 | | | | 6.66 | | | | 5.79 | | | | 1.10 | | | | 1.08 | |
| | | | | | | | | | |
| Class C (WMBFX)4 | | 9-30-2004 | | | 9.80 | | | | 6.06 | | | | 5.49 | | | | 10.80 | | | | 6.06 | | | | 5.49 | | | | 1.85 | | | | 1.83 | |
| | | | | | | | | | |
| Institutional Class (WMBZX)5 | | 7-31-2018 | | | – | | | | – | | | | – | | | | 12.04 | | | | 6.83 | | | | 5.87 | | | | 0.77 | | | | 0.75 | |
| | | | | | | | | | |
| Spectrum Conservative Growth Blended Index6 | | – | | | – | | | | – | | | | – | | | | 10.75 | | | | 7.50 | | | | 6.91 | | | | – | | | | – | |
| | | | | | | | | | |
| Bloomberg Barclays U.S. Aggregate Bond Index7 | | – | | | – | | | | – | | | | – | | | | 7.28 | | | | 4.34 | | | | 3.71 | | | | – | | | | – | |
| | | | | | | | | | |
| Bloomberg Barclays U.S. TIPS Index8 | | – | | | – | | | | – | | | | – | | | | 10.15 | | | | 4.68 | | | | 3.53 | | | | – | | | | – | |
| | | | | | | | | | |
| ICE BofA U.S. High Yield Constrained Index9 | | – | | | – | | | | – | | | | – | | | | 6.26 | | | | 7.44 | | | | 6.60 | | | | – | | | | – | |
| | | | | | | | | | |
| MSCI ACWI ex USA Index (Net)10 | | – | | | | | | | | | | | | | | | 9.52 | | | | 7.38 | | | | 5.16 | | | | – | | | | – | |
| | | | | | | | | | |
| Russell 3000® Index11 | | – | | | – | | | | – | | | | – | | | | 19.02 | | | | 13.95 | | | | 14.04 | | | | – | | | | – | |
Figures quoted represent past performance, which is no guarantee of future results, and do not reflect taxes that a shareholder may pay on an investment in a fund. Investment return and principal value of an investment will fluctuate so that an investor’s shares, when redeemed, may be worth more or less than their original cost. Performance shown without sales charges would be lower if sales charges were reflected. Current performance may be lower or higher than the performance data quoted, which assumes the reinvestment of dividends and capital gains. Current month-end performance is available on the Fund’s website, wfam.com.
Index returns do not include transaction costs associated with buying and selling securities, any mutual fund fees or expenses, or any taxes. It is not possible to invest directly in an index.
For Class A shares, the maximum front-end sales charge is 5.75%. For Class C shares, the maximum contingent deferred sales charge is 1.00%. Performance including a contingent deferred sales charge assumes the sales charge for the corresponding time period. Institutional Class shares are sold without a front-end sales charge or contingent deferred sales charge.
Balanced funds may invest in stocks and bonds. Stock values fluctuate in response to the activities of individual companies and general market and economic conditions. Bond values fluctuate in response to the financial condition of individual issuers, general market and economic conditions, and changes in interest rates. Changes in market conditions and government policies may lead to periods of heightened volatility in the bond market and reduced liquidity for certain bonds held by the Fund. In general, when interest rates rise, bond values fall and investors may lose principal value. Interest rate changes and their impact on the Fund and its share price can be sudden and unpredictable. The use of derivatives may reduce returns and/or increase volatility. The Fund will indirectly be exposed to all of the risks of an investment in the underlying funds and will indirectly bear expenses of the underlying funds. Certain investment strategies tend to increase the total risk of an investment (relative to the broader market). The Fund is exposed to alternative investment risk, foreign investment risk, high-yield securities risk, mortgage-and asset-backed securities risk, and smaller-company investment risk. Consult the Fund’s prospectus for additional information on these and other risks.
Please see footnotes on page 9.
8 | Wells Fargo Multi-Asset Funds
Performance highlights (unaudited)
Wells Fargo Spectrum Conservative Growth Fund (continued)
| | | | |
| |
| Ten largest holdings (%) as of November 30, 202012 | | | |
| | |
Wells Fargo Core Bond Portfolio | | | 16.86 | |
| | |
Wells Fargo Bloomberg Barclays US Aggregate ex-Corporate Portfolio | | | 11.96 | |
| | |
Wells Fargo Disciplined Large Cap Portfolio | | | 10.17 | |
| | |
Wells Fargo Strategic Income Fund Institutional Class | | | 9.01 | |
| | |
Wells Fargo Real Return Portfolio | | | 6.24 | |
| | |
Wells Fargo Strategic Retirement Bond Portfolio | | | 6.23 | |
| | |
Wells Fargo Factor Enhanced International Equity Portfolio | | | 5.29 | |
| | |
Wells Fargo Factor Enhanced U.S. Large Cap Equity Portfolio | | | 4.50 | |
| | |
Wells Fargo Diversified Income Builder Fund Class R6 | | | 3.47 | |
| | |
Wells Fargo High Yield Bond Fund Institutional Class | | | 2.92 | |
| | | | | | | | |
|
| Allocations (%) as of November 30, 2020 | |
| | |
| | | Neutral
allocation | | | Effective
allocation13 | |
| | | |
Bond Funds | | | 54 | | | | 55 | |
| | | |
Stock Funds | | | 28 | | | | 31 | |
| | | |
Inflation Sensitive Funds | | | 14 | | | | 12 | |
| | | |
Alternative Investment Funds | | | 4 | | | | 2 | |
| ‡ | CFA® and Chartered Financial Analyst® are trademarks owned by CFA Institute. |
| 1 | Reflects the expense ratios as stated in the most recent prospectuses, which include the impact of 0.33% of acquired fund fees and expenses. Net expenses from affiliated master portfolios are included in the acquired fund fees and expense amount. The expense ratios shown are subject to change and may differ from the annualized expense ratios shown in the financial highlights of this report, which do not include acquired fund fees and expenses. |
| 2 | The manager has contractually committed through September 30, 2021, to waive fees and/or reimburse expenses to the extent necessary to cap total annual fund operating expenses after fee waivers at 0.75% for Class A, 1.50% for Class C, and 0.42% for Institutional Class. Brokerage commissions, stamp duty fees, interest, taxes, acquired fund fees and expenses (if any), net expenses from affiliated master portfolios, and extraordinary expenses are excluded from the expense caps. Prior to or after the commitment expiration date, the caps may be increased or the commitment to maintain the cap may be terminated only with the approval of the Board of Trustees. Without these caps, the Fund’s returns would have been lower. The expense ratio paid by an investor is the net expense ratio (the total annual fund operating expenses after fee waivers) as stated in the prospectuses. |
| 3 | Historical performance for the Class A shares prior to their inception reflects the performance of the Class C shares and includes the higher expenses applicable to the Class C shares. If these expenses had not been included, returns for the Class A shares would be higher. |
| 4 | Prior to February 13, 2017, historical performance shown for the Class C shares reflects the performance of the Fund’s predecessor WealthBuilder Portfolio share class and does not reflect the front-end sales load previously attributable to the predecessor class. The expenses for the Class C shares and the predecessor share class are similar. |
| 5 | Historical performance shown for the Institutional Class shares prior to their inception reflects the performance of the Class A shares adjusted to reflect that the Institutional Class shares do not have a sales load but not adjusted to reflect the Institutional Class expenses. If these expenses had been included, returns for the Institutional Class shares would be higher. |
| 6 | Source: Wells Fargo Funds Management, LLC. Spectrum Conservative Growth Blended Index is composed 41% of the Bloomberg Barclays U.S. Aggregate Bond Index, 20% of the Russell 3000® Index, 15% of the Bloomberg Barclays U.S. TIPS Index, 15% of ICE BofA U.S. High Yield Constrained Index, and 9% of the MSCI ACWI ex USA Index (Net). Effective November 2, 2020, the WealthBuilder Moderate Balanced Blended Index, which was composed 60% of the Bloomberg Barclays U.S. Aggregate Bond Index, 28% of the Russell 3000® Index, and 12% of the MSCI ACWI ex USA Index (Net), was renamed the Spectrum Conservative Growth Blended Index. You cannot invest directly in an index. |
| 7 | The Bloomberg Barclays U.S. Aggregate Bond Index is a broad-based benchmark that measures the investment-grade, U.S. dollar–denominated, fixed-rate taxable bond market, including Treasuries, government-related and corporate securities, mortgage-backed securities (agency fixed-rate and hybrid adjustable rate mortgage pass-throughs), asset-backed securities, and commercial mortgage-backed securities. You cannot invest directly in an index. |
| 8 | The Bloomberg Barclays U.S. Treasury Inflation-Protected Securities (TIPS) Index is an index of inflation-indexed-linked U.S. Treasury securities. You cannot invest directly in an index. |
| 9 | The ICE BofA U.S. High Yield Constrained Index is a market-value-weighted index of all domestic and Yankee high-yield bonds, including deferred interest bonds and payment-in-kind securities. Issues included in the index have maturities of one year or more and have a credit rating lower than BBB-/Baa3 but are not in default. The ICE BofA U.S. High Yield Constrained Index limits any individual issuer to a maximum of 2% benchmark exposure. You cannot invest directly in an index. Copyright 2021. ICE Data Indices, LLC. All rights reserved. |
| 10 | The Morgan Stanley Capital International (MSCI) All Country World Index (ACWI) ex USA Index (Net) is a free-float-adjusted market-capitalization-weighted index that is designed to measure the equity market performance of developed and emerging markets, excluding the U.S. Source: MSCI. MSCI makes no express or implied warranties or representations and shall have no liability whatsoever with respect to any MSCI data contained herein. The MSCI data may not be further redistributed or used as a basis for other indexes or any securities or financial products. This report is not approved, reviewed, or produced by MSCI. You cannot invest directly in an index. |
| 11 | The Russell 3000® Index measures the performance of the 3,000 largest U.S. companies based on total market capitalization, which represents approximately 98% of the investable U.S. equity market. You cannot invest directly in an index. |
| 12 | Figures represent the percentage of the Fund’s net assets. Holdings are subject to change and may have changed since the date specified. |
| 13 | Effective allocation includes the effect of any tactical futures overlay that may be in place. Effective cash, if any, represents the net offset to such future positions. These amounts are subject to change and may have changed since the date specified. |
Wells Fargo Multi-Asset Funds | 9
Performance highlights (unaudited)
Wells Fargo Spectrum Growth Fund
Investment objective
The Fund seeks capital appreciation with a secondary emphasis on current income.
Manager
Wells Fargo Funds Management, LLC
Subadviser
Wells Capital Management Incorporated
Portfolio managers
Kandarp R. Acharya, CFA®‡, FRM
Christian L. Chan, CFA®‡
Travis L. Keshemberg, CFA®‡, CIPM, FRM
Average annual total returns (%) as of November 30, 2020
| | | | | | | | | | | | | | | | | | | | | | | | | | | | | | | | | | |
| | | | |
| | | | | Including sales charge | | | Excluding sales charge | | | Expense ratios1 (%) | |
| | | | | | | | | |
| | | Inception date | | 1 year | | | 5 year | | | 10 year | | | 1 year | | | 5 year | | | 10 year | | | Gross | | | Net2 | |
| | | | | | | | | | |
| Class A (WGAFX)3 | | 2-10-2017 | | | 9.22 | | | | 8.13 | | | | 8.13 | | | | 15.89 | | | | 9.42 | | | | 8.77 | | | | 1.10 | | | | 1.06 | |
| | | | | | | | | | |
| Class C (WGCFX)4 | | 9-30-2004 | | | 14.02 | | | | 8.84 | | | | 8.48 | | | | 15.02 | | | | 8.84 | | | | 8.48 | | | | 1.85 | | | | 1.81 | |
| | | | | | | | | | |
| Institutional Class (WGAYX)5 | | 7-31-2018 | | | – | | | | – | | | | – | | | | 16.25 | | | | 9.56 | | | | 8.84 | | | | 0.77 | | | | 0.73 | |
| | | | | | | | | | |
| Spectrum Growth Blended Index6 | | – | | | – | | | | – | | | | – | | | | 12.60 | | | | 10.20 | | | | 9.76 | | | | – | | | | – | |
| | | | | | | | | | |
| Bloomberg Barclays U.S. Aggregate Bond Index7 | | – | | | – | | | | – | | | | – | | | | 7.28 | | | | 4.34 | | | | 3.71 | | | | – | | | | – | |
| | | | | | | | | | |
| Bloomberg Barclays U.S. TIPS Index8 | | – | | | – | | | | – | | | | – | | | | 10.15 | | | | 4.68 | | | | 3.53 | | | | – | | | | – | |
| | | | | | | | | | |
| ICE BofA U.S. High Yield Constrained Index9 | | – | | | – | | | | – | | | | – | | | | 6.26 | | | | 7.44 | | | | 6.60 | | | | – | | | | – | |
| | | | | | | | | | |
| MSCI ACWI ex USA Index (Net)10 | | – | | | – | | | | – | | | | – | | | | 9.52 | | | | 7.38 | | | | 5.16 | | | | – | | | | – | |
| | | | | | | | | | |
| Russell 3000® Index11 | | – | | | – | | | | – | | | | – | | | | 19.02 | | | | 13.95 | | | | 14.04 | | | | – | | | | – | |
Figures quoted represent past performance, which is no guarantee of future results, and do not reflect taxes that a shareholder may pay on an investment in a fund. Investment return and principal value of an investment will fluctuate so that an investor’s shares, when redeemed, may be worth more or less than their original cost. Performance shown without sales charges would be lower if sales charges were reflected. Current performance may be lower or higher than the performance data quoted, which assumes the reinvestment of dividends and capital gains. Current month-end performance is available on the Fund’s website, wfam.com.
Index returns do not include transaction costs associated with buying and selling securities, any mutual fund fees or expenses, or any taxes. It is not possible to invest directly in an index.
For Class A shares, the maximum front-end sales charge is 5.75%. For Class C shares, the maximum contingent deferred sales charge is 1.00%. Performance including a contingent deferred sales charge assumes the sales charge for the corresponding time period. Institutional Class shares are sold without a front-end sales charge or contingent deferred sales charge.
Balanced funds may invest in stocks and bonds. Stock values fluctuate in response to the activities of individual companies and general market and economic conditions. Bond values fluctuate in response to the financial condition of individual issuers, general market and economic conditions, and changes in interest rates. Changes in market conditions and government policies may lead to periods of heightened volatility in the bond market and reduced liquidity for certain bonds held by the Fund. In general, when interest rates rise, bond values fall and investors may lose principal value. Interest rate changes and their impact on the Fund and its share price can be sudden and unpredictable. The use of derivatives may reduce returns and/or increase volatility. The Fund will indirectly be exposed to all of the risks of an investment in the underlying funds and will indirectly bear expenses of the underlying funds. Certain investment strategies tend to increase the total risk of an investment (relative to the broader market). The Fund is exposed to alternative investment risk, foreign investment risk, high-yield securities risk, mortgage- and asset-backed securities risk, and smaller-company investment risk. Consult the Fund’s prospectus for additional information on these and other risks.
Please see footnotes on page 11.
10 | Wells Fargo Multi-Asset Funds
Performance highlights (unaudited)
Wells Fargo Spectrum Growth Fund (continued)
| | | | |
|
| Ten largest holdings (%) as of November 30, 202012 | |
| | |
Wells Fargo Disciplined Large Cap Portfolio | | | 18.96 | |
| | |
Wells Fargo Factor Enhanced U.S. Large Cap Equity Portfolio | | | 11.64 | |
| | |
Wells Fargo Factor Enhanced International Equity Portfolio | | | 11.55 | |
| | |
Wells Fargo Strategic Retirement Bond Portfolio | | | 6.20 | |
| | |
Wells Fargo Real Return Portfolio | | | 6.20 | |
| | |
Wells Fargo Income Plus Fund Institutional Class | | | 5.19 | |
| | |
Wells Fargo High Yield Bond Fund Institutional Class | | | 3.89 | |
| | |
Wells Fargo Factor Enhanced U.S. Small Cap Equity Portfolio | | | 3.89 | |
| | |
Wells Fargo Diversified Income Builder Fund Class R6 | | | 3.42 | |
| | |
Wells Fargo Factor Enhanced Emerging Markets Equity Portfolio | | | 2.79 | |
| | | | | | | | |
|
| Allocations (%) as of November 30, 2020 | |
| | |
| | | Neutral
allocation | | | Effective
allocation13 | |
| | | |
Stock Funds | | | 58 | | | | 62 | |
| | | |
Bond Funds | | | 24 | | | | 25 | |
| | | |
Inflation Sensitive Funds | | | 15 | | | | 12 | |
| | | |
Alternative Investment Funds | | | 3 | | | | 1 | |
| ‡ | CFA® and Chartered Financial Analyst® are trademarks owned by CFA Institute. |
| 1 | Reflects the expense ratios as stated in the most recent prospectuses, which include the impact of 0.31% of acquired fund fees and expenses. Net expenses from affiliated master portfolios are included in the acquired fund fees and expense amount. The expense ratios shown are subject to change and may differ from the annualized expense ratios shown in the financial highlights of this report, which do not include acquired fund fees and expenses. |
| 2 | The manager has contractually committed through September 30, 2021, to waive fees and/or reimburse expenses to the extent necessary to cap total annual fund operating expenses after fee waivers at 0.75% for Class A, 1.50% for Class C, and 0.42% for Institutional Class. Brokerage commissions, stamp duty fees, interest, taxes, acquired fund fees and expenses (if any), net expenses from affiliated master portfolios, and extraordinary expenses are excluded from the expense caps. Prior to or after the commitment expiration date, the caps may be increased or the commitment to maintain the cap may be terminated only with the approval of the Board of Trustees. Without these caps, the Fund’s returns would have been lower. The expense ratio paid by an investor is the net expense ratio (the total annual fund operating expenses after fee waivers) as stated in the prospectuses. |
| 3 | Historical performance for the Class A shares prior to their inception reflects the performance of the Class C shares and includes the higher expenses applicable to the Class C shares. If these expenses had not been included, returns for the Class A shares would be higher. |
| 4 | Prior to February 13, 2017, historical performance shown for the Class C shares reflects the performance of the Fund’s predecessor WealthBuilder Portfolio share class and does not reflect the front-end sales load previously attributable to the predecessor class. The expenses for the Class C shares and the predecessor share class are similar. |
| 5 | Historical performance shown for the Institutional Class shares prior to their inception reflects the performance of the Class A shares adjusted to reflect that the Institutional Class shares do not have a sales load but not adjusted to reflect the Institutional Class expenses. If these expenses had been included, returns for the Institutional Class shares would be higher. |
| 6 | Source: Wells Fargo Funds Management, LLC. Spectrum Growth Blended Index is composed 40% of the Russell 3000® Index, 17% of the MSCI ACWI ex USA Index (Net), 15% of the Bloomberg Barclays U.S. Aggregate Bond Index, 14% of the Bloomberg Barclays U.S. TIPS Index, and 14% of ICE BofA U.S. High Yield Constrained Index. Effective November 2, 2020, the WealthBuilder Growth Allocation Blended Index, which was composed 56% of the Russell 3000®Index, 24% of the MSCI ACWI ex USA Index (Net), and 20% of the Bloomberg Barclays U.S. Aggregate Bond Index, was renamed the Spectrum Growth Blended Index. You cannot invest directly in an index. |
| 7 | The Bloomberg Barclays U.S. Aggregate Bond Index is a broad-based benchmark that measures the investment-grade, U.S. dollar–denominated, fixed-rate taxable bond market, including Treasuries, government-related and corporate securities, mortgage-backed securities (agency fixed-rate and hybrid adjustable rate mortgage pass-throughs), asset-backed securities, and commercial mortgage-backed securities. You cannot invest directly in an index. |
| 8 | The Bloomberg Barclays U.S. Treasury Inflation-Protected Securities (TIPS) Index is an index of inflation-indexed-linked U.S. Treasury securities. You cannot invest directly in an index. |
| 9 | The ICE BofA U.S. High Yield Constrained Index is a market-value-weighted index of all domestic and Yankee high-yield bonds, including deferred interest bonds and payment-in-kind securities. Issues included in the index have maturities of one year or more and have a credit rating lower than BBB-/Baa3 but are not in default. The ICE BofA U.S. High Yield Constrained Index limits any individual issuer to a maximum of 2% benchmark exposure. You cannot invest directly in an index. Copyright 2021. ICE Data Indices, LLC. All rights reserved. |
| 10 | The Morgan Stanley Capital International (MSCI) All Country World Index (ACWI) ex USA Index (Net) is a free-float-adjusted market-capitalization-weighted index that is designed to measure the equity market performance of developed and emerging markets, excluding the U.S. Source: MSCI. MSCI makes no express or implied warranties or representations and shall have no liability whatsoever with respect to any MSCI data contained herein. The MSCI data may not be further redistributed or used as a basis for other indexes or any securities or financial products. This report is not approved, reviewed, or produced by MSCI. You cannot invest directly in an index. |
| 11 | The Russell 3000® Index measures the performance of the 3,000 largest U.S. companies based on total market capitalization, which represents approximately 98% of the investable U.S. equity market. You cannot invest directly in an index. |
| 12 | Figures represent the percentage of the Fund’s net assets. Holdings are subject to change and may have changed since the date specified. |
| 13 | Effective allocation includes the effect of any tactical futures overlay that may be in place. Effective cash, if any, represents the net offset to such future positions. These amounts are subject to change and may have changed since the date specified. |
Wells Fargo Multi-Asset Funds | 11
Performance highlights (unaudited)
Wells Fargo Spectrum Income Allocation Fund
Investment objective
The Fund seeks current income with a secondary emphasis on capital appreciation.
Manager
Wells Fargo Funds Management, LLC
Subadviser
Wells Capital Management Incorporated
Portfolio managers
Kandarp R. Acharya, CFA®‡ , FRM
Christian L. Chan, CFA®‡
Travis L. Keshemberg, CFA®‡ , CIPM, FRM
Average annual total returns (%) as of November 30, 2020
| | | | | | | | | | | | | | | | | | | | | | | | | | | | | | | | | | |
| | | | |
| | | | | Including sales charge | | | Excluding sales charge | | | Expense ratios1 (%) | |
| | | | | | | | | |
| | | Inception date | | 1 year | | | 5 year | | | 10 year | | | 1 year | | | 5 year | | | 10 year | | | Gross | | | Net2 | |
| | | | | | | | | | |
| Class A (WCAFX)3 | | 2-10-2017 | | | 2.47 | | | | 3.75 | | | | 3.33 | | | | 8.72 | | | | 4.99 | | | | 3.94 | | | | 1.11 | | | | 1.06 | |
| | | | | | | | | | |
| Class C (WCCFX)4 | | 9-30-2004 | | | 6.99 | | | | 4.35 | | | | 3.62 | | | | 7.99 | | | | 4.35 | | | | 3.62 | | | | 1.86 | | | | 1.81 | |
| | | | | | | | | | |
| Institutional Class (WCYFX)5 | | 7-31-2018 | | | – | | | | – | | | | – | | | | 9.06 | | | | 5.12 | | | | 4.00 | | | | 0.78 | | | | 0.73 | |
| | | | | | | | | | |
| Spectrum Income Allocation Blended Index6 | | – | | | – | | | | – | | | | – | | | | 8.82 | | | | 5.90 | | | | 5.31 | | | | – | | | | – | |
| | | | | | | | | | |
| Bloomberg Barclays U.S. Aggregate Bond Index7 | | – | | | – | | | | – | | | | – | | | | 7.28 | | | | 4.34 | | | | 3.71 | | | | – | | | | – | |
| | | | | | | | | | |
| Bloomberg Barclays U.S. TIPS Index8 | | – | | | – | | | | – | | | | – | | | | 10.15 | | | | 4.68 | | | | 3.53 | | | | – | | | | – | |
| | | | | | | | | | |
| ICE BofA U.S. High Yield Constrained Index9 | | – | | | – | | | | – | | | | – | | | | 6.26 | | | | 7.44 | | | | 6.60 | | | | – | | | | – | |
| | | | | | | | | | |
| MSCI ACWI ex USA Index (Net)10 | | – | | | – | | | | – | | | | – | | | | 9.52 | | | | 7.38 | | | | 5.16 | | | | – | | | | – | |
| | | | | | | | | | |
| Russell 3000® Index11 | | – | | | – | | | | – | | | | – | | | | 19.02 | | | | 13.95 | | | | 14.04 | | | | – | | | | – | |
Figures quoted represent past performance, which is no guarantee of future results, and do not reflect taxes that a shareholder may pay on an investment in a fund. Investment return and principal value of an investment will fluctuate so that an investor’s shares, when redeemed, may be worth more or less than their original cost. Performance shown without sales charges would be lower if sales charges were reflected. Current performance may be lower or higher than the performance data quoted, which assumes the reinvestment of dividends and capital gains. Current month-end performance is available on the Fund’s website, wfam.com.
Index returns do not include transaction costs associated with buying and selling securities, any mutual fund fees or expenses, or any taxes. It is not possible to invest directly in an index.
For Class A shares, the maximum front-end sales charge is 5.75%. For Class C shares, the maximum contingent deferred sales charge is 1.00%. Performance including a contingent deferred sales charge assumes the sales charge for the corresponding time period. Institutional Class shares are sold without a front-end sales charge or contingent deferred sales charge.
Balanced funds may invest in stocks and bonds. Stock values fluctuate in response to the activities of individual companies and general market and economic conditions. Bond values fluctuate in response to the financial condition of individual issuers, general market and economic conditions, and changes in interest rates. Changes in market conditions and government policies may lead to periods of heightened volatility in the bond market and reduced liquidity for certain bonds held by the Fund. In general, when interest rates rise, bond values fall and investors may lose principal value. Interest rate changes and their impact on the Fund and its share price can be sudden and unpredictable. The use of derivatives may reduce returns and/or increase volatility. The Fund will indirectly be exposed to all of the risks of an investment in the underlying funds and will indirectly bear expenses of the underlying funds. Certain investment strategies tend to increase the total risk of an investment (relative to the broader market). The Fund is exposed to alternative investment risk, foreign investment risk, high-yield securities risk, mortgage- and asset-backed securities risk, and smaller-company investment risk. Consult the Fund’s prospectus for additional information on these and other risks.
Please see footnotes on page 13.
12 | Wells Fargo Multi-Asset Funds
Performance highlights (unaudited)
Wells Fargo Spectrum Income Allocation Fund (continued)
| | | | |
|
| Ten largest holdings (%) as of November 30, 202012 | |
| | |
Wells Fargo Core Bond Portfolio | | | 33.83 | |
| | |
Wells Fargo Bloomberg Barclays US Aggregate ex-Corporate Portfolio | | | 22.22 | |
| | |
Wells Fargo Income Plus Fund Institutional Class | | | 8.06 | |
| | |
Wells Fargo Real Return Portfolio | | | 3.93 | |
| | |
Wells Fargo Strategic Retirement Bond Portfolio | | | 3.92 | |
| | |
Wells Fargo Disciplined Large Cap Portfolio | | | 3.22 | |
| | |
iShares Core U.S. Aggregate Bond ETF | | | 2.97 | |
| | |
Wells Fargo Global Investment Grade Credit Fund Class R6 | | | 2.89 | |
| | |
Wells Fargo Diversified Income Builder Fund Class R6 | | | 2.48 | |
| | |
PIMCO CommodityRealReturn Strategy Fund Institutional Class | | | 1.99 | |
| | | | | | | | |
|
| Allocations (%) as of November 30, 2020 | |
| | |
| | | Neutral
allocation | | | Effective
allocation13 | |
| | | |
Bond Funds | | | 77 | | | | 79 | |
| | | |
Stock Funds | | | 10 | | | | 11 | |
| | | |
Inflation Sensitive Funds | | | 10 | | | | 8 | |
| | | |
Alternative Investment Funds | | | 3 | | | | 2 | |
| ‡ | CFA® and Chartered Financial Analyst® are trademarks owned by CFA Institute. |
| 1 | Reflects the expense ratios as stated in the most recent prospectuses, which include the impact of 0.31% of acquired fund fees and expenses. Net expenses from affiliated master portfolios are included in the acquired fund fees and expense amount. The expense ratios shown are subject to change and may differ from the annualized expense ratios shown in the financial highlights of this report, which do not include acquired fund fees and expenses. |
| 2 | The manager has contractually committed through September 30, 2021, to waive fees and/or reimburse expenses to the extent necessary to cap total annual fund operating expenses after fee waivers at 0.75% for Class A, 1.50% for Class C, and 0.42% for Institutional Class. Brokerage commissions, stamp duty fees, interest, taxes, acquired fund fees and expenses (if any), net expenses from affiliated master portfolios, and extraordinary expenses are excluded from the expense caps. Prior to or after the commitment expiration date, the caps may be increased or the commitment to maintain the cap may be terminated only with the approval of the Board of Trustees. Without these caps, the Fund’s returns would have been lower. The expense ratio paid by an investor is the net expense ratio (the total annual fund operating expenses after fee waivers) as stated in the prospectuses. |
| 3 | Historical performance for the Class A shares prior to their inception reflects the performance of the Class C shares and includes the higher expenses applicable to the Class C shares. If these expenses had not been included, returns for the Class A shares would be higher. |
| 4 | Prior to February 13, 2017, historical performance shown for the Class C shares reflects the performance of the Fund’s predecessor WealthBuilder Portfolio share class and does not reflect the front-end sales load previously attributable to the predecessor class. The expenses for the Class C shares and the predecessor share class are similar. |
| 5 | Historical performance shown for the Institutional Class shares prior to their inception reflects the performance of the Class A shares adjusted to reflect that the Institutional Class shares do not have a sales load but not adjusted to reflect the Institutional Class expenses. If these expenses had been included, returns for the Institutional Class shares would be higher. |
| 6 | Source: Wells Fargo Funds Management, LLC. Spectrum Income Allocation Blended Index is composed 65% of the Bloomberg Barclays U.S. Aggregate Bond Index, 15% of ICE BofA U.S. High Yield Constrained Index, 10% of the Bloomberg Barclays U.S. TIPS Index, 7% of the Russell 3000® Index, and 3% of the MSCI ACWI ex USA Index (Net). Effective November 2, 2020, the WealthBuilder Growth Allocation Blended Index, which was composed 80% of Bloomberg Barclays U.S. Aggregate Bond Index, 14% of the Russell 3000® Index, and 6% of the MSCI ACWI ex USA Index (Net), was renamed the Spectrum Income Allocation Blended Index. You cannot invest directly in an index. |
| 7 | The Bloomberg Barclays U.S. Aggregate Bond Index is a broad-based benchmark that measures the investment-grade, U.S. dollar–denominated, fixed-rate taxable bond market, including Treasuries, government-related and corporate securities, mortgage-backed securities (agency fixed-rate and hybrid adjustable rate mortgage pass-throughs), asset-backed securities, and commercial mortgage-backed securities. You cannot invest directly in an index. |
| 8 | The Bloomberg Barclays U.S. Treasury Inflation-Protected Securities (TIPS) Index is an index of inflation-indexed-linked U.S. Treasury securities. You cannot invest directly in an index. |
| 9 | The ICE BofA U.S. High Yield Constrained Index is a market-value-weighted index of all domestic and Yankee high-yield bonds, including deferred interest bonds and payment-in-kind securities. Issues included in the index have maturities of one year or more and have a credit rating lower than BBB-/Baa3 but are not in default. The ICE BofA U.S. High Yield Constrained Index limits any individual issuer to a maximum of 2% benchmark exposure. You cannot invest directly in an index. Copyright 2021. ICE Data Indices, LLC. All rights reserved. |
| 10 | The Morgan Stanley Capital International (MSCI) All Country World Index (ACWI) ex USA Index (Net) is a free-float-adjusted market-capitalization-weighted index that is designed to measure the equity market performance of developed and emerging markets, excluding the United States. Source: MSCI. MSCI makes no express or implied warranties or representations and shall have no liability whatsoever with respect to any MSCI data contained herein. The MSCI data may not be further redistributed or used as a basis for other indexes or any securities or financial products. This report is not approved, reviewed, or produced by MSCI. You cannot invest directly in an index. |
| 11 | The Russell 3000® Index measures the performance of the 3,000 largest U.S. companies based on total market capitalization, which represents approximately 98% of the investable U.S. equity market. You cannot invest directly in an index. |
| 12 | Figures represent the percentage of the Fund’s net assets. Holdings are subject to change and may have changed since the date specified. |
| 13 | Effective allocation includes the effect of any tactical futures overlay that may be in place. Effective cash, if any, represents the net offset to such future positions. These amounts are subject to change and may have changed since the date specified. |
Wells Fargo Multi-Asset Funds | 13
Performance highlights (unaudited)
Wells Fargo Spectrum Moderate Growth Fund
Investment objective
The Fund seeks a combination of capital appreciation and current income.
Manager
Wells Fargo Funds Management, LLC
Subadviser
Wells Capital Management Incorporated
Portfolio managers
Kandarp R. Acharya, CFA®‡, FRM
Christian L. Chan, CFA®‡
Travis L. Keshemberg, CFA®‡, CIPM, FRM
Average annual total returns (%) as of November 30, 2020
| | | | | | | | | | | | | | | | | | | | | | | | | | | | | | | | | | |
| | | | |
| | | | | Including sales charge | | | Excluding sales charge | | | Expense ratios1 (%) | |
| | | | | | | | | |
| | | Inception date | | 1 year | | | 5 year | | | 10 year | | | 1 year | | | 5 year | | | 10 year | | | Gross | | | Net2 | |
| | | | | | | | | | |
| Class A (WGBAX)3 | | 2-10-2017 | | | 7.52 | | | | 6.93 | | | | 7.01 | | | | 14.08 | | | | 8.21 | | | | 7.65 | | | | 1.08 | | | | 1.07 | |
| | | | | | | | | | |
| Class C (WGBFX)4 | | 10-1-1997 | | | 12.26 | | | | 7.60 | | | | 7.35 | | | | 13.26 | | | | 7.60 | | | | 7.35 | | | | 1.83 | | | | 1.82 | |
| | | | | | | | | | |
| Institutional Class (WGBIX)5 | | 7-31-2018 | | | – | | | | – | | | | – | | | | 14.45 | | | | 8.36 | | | | 7.72 | | | | 0.75 | | | | 0.74 | |
| | | | | | | | | | |
| Spectrum Moderate Growth Blended Index6 | | – | | | – | | | | – | | | | – | | | | 12.15 | | | | 8.96 | | | | 8.40 | | | | – | | | | – | |
| | | | | | | | | | |
| Bloomberg Barclays U.S. Aggregate Bond Index7 | | – | | | – | | | | – | | | | – | | | | 7.28 | | | | 4.34 | | | | 3.71 | | | | – | | | | – | |
| | | | | | | | | | |
| Bloomberg Barclays U.S. TIPS Index8 | | – | | | – | | | | – | | | | – | | | | 10.15 | | | | 4.68 | | | | 3.53 | | | | – | | | | – | |
| | | | | | | | | | |
| ICE BofA U.S. High Yield Constrained Index9 | | – | | | – | | | | – | | | | – | | | | 6.26 | | | | 7.44 | | | | 6.60 | | | | – | | | | – | |
| | | | | | | | | | |
| MSCI ACWI ex USA Index (Net)10 | | – | | | – | | | | – | | | | – | | | | 9.52 | | | | 7.38 | | | | 5.16 | | | | – | | | | – | |
| | | | | | | | | | |
| Russell 3000® Index11 | | – | | | – | | | | – | | | | – | | | | 19.02 | | | | 13.95 | | | | 14.04 | | | | – | | | | – | |
Figures quoted represent past performance, which is no guarantee of future results, and do not reflect taxes that a shareholder may pay on an investment in a fund. Investment return and principal value of an investment will fluctuate so that an investor’s shares, when redeemed, may be worth more or less than their original cost. Performance shown without sales charges would be lower if sales charges were reflected. Current performance may be lower or higher than the performance data quoted, which assumes the reinvestment of dividends and capital gains. Current month-end performance is available on the Fund’s website, wfam.com.
Index returns do not include transaction costs associated with buying and selling securities, any mutual fund fees or expenses, or any taxes. It is not possible to invest directly in an index.
For Class A shares, the maximum front-end sales charge is 5.75%. For Class C shares, the maximum contingent deferred sales charge is 1.00%. Performance including a contingent deferred sales charge assumes the sales charge for the corresponding time period. Institutional Class shares are sold without a front-end sales charge or contingent deferred sales charge.
Balanced funds may invest in stocks and bonds. Stock values fluctuate in response to the activities of individual companies and general market and economic conditions. Bond values fluctuate in response to the financial condition of individual issuers, general market and economic conditions, and changes in interest rates. Changes in market conditions and government policies may lead to periods of heightened volatility in the bond market and reduced liquidity for certain bonds held by the Fund. In general, when interest rates rise, bond values fall and investors may lose principal value. Interest rate changes and their impact on the Fund and its share price can be sudden and unpredictable. The use of derivatives may reduce returns and/or increase volatility. The Fund will indirectly be exposed to all of the risks of an investment in the underlying funds and will indirectly bear expenses of the underlying funds. Certain investment strategies tend to increase the total risk of an investment (relative to the broader market). The Fund is exposed to alternative investment risk, foreign investment risk, high-yield securities risk, mortgage- and asset-backed securities risk, and smaller-company investment risk. Consult the Fund’s prospectus for additional information on these and other risks.
Please see footnotes on page 15.
14 | Wells Fargo Multi-Asset Funds
Performance highlights (unaudited)
Wells Fargo Spectrum Moderate Growth Fund (continued)
| | | | |
|
| Ten largest holdings (%) as of November 30, 202012 | |
| | |
Wells Fargo Disciplined Large Cap Portfolio | | | 16.43 | |
| | |
Wells Fargo Factor Enhanced International Equity Portfolio | | | 9.23 | |
| | |
Wells Fargo Factor Enhanced U.S. Large Cap Equity Portfolio | | | 8.64 | |
| | |
Wells Fargo Bloomberg Barclays US Aggregate ex-Corporate Portfolio | | | 7.57 | |
| | |
Wells Fargo Core Bond Portfolio | | | 7.29 | |
| | |
Wells Fargo Income Plus Fund Institutional Class | | | 6.93 | |
| | |
Wells Fargo Real Return Portfolio | | | 6.22 | |
| | |
Wells Fargo Strategic Retirement Bond Portfolio | | | 6.21 | |
| | |
Wells Fargo Factor Enhanced U.S. Small Cap Equity Portfolio | | | 3.01 | |
| | |
Wells Fargo Diversified Income Builder Fund Class R6 | | | 2.95 | |
| | | | | | | | |
|
| Allocations (%) as of November 30, 2020 | |
| | |
| | | Neutral
allocation | | | Effective
allocation13 | |
| | | |
Stock Funds | | | 45 | | | | 49 | |
| | | |
Bond Funds | | | 37 | | | | 37 | |
| | | |
Inflation Sensitive Funds | | | 14 | | | | 12 | |
| | | |
Alternative Investment Funds | | | 4 | | | | 2 | |
| ‡ | CFA® and Chartered Financial Analyst® are trademarks owned by CFA Institute. |
| 1 | Reflects the expense ratios as stated in the most recent prospectuses, which include the impact of 0.32% of acquired fund fees and expenses. Net expenses from affiliated master portfolios are included in the acquired fund fees and expense amount. The expense ratios shown are subject to change and may differ from the annualized expense ratios shown in the financial highlights of this report, which do not include acquired fund fees and expenses. |
| 2 | The manager has contractually committed through September 30, 2021, to waive fees and/or reimburse expenses to the extent necessary to cap total annual fund operating expenses after fee waivers at 0.75% for Class A, 1.50% for Class C, and 0.42% for Institutional Class. Brokerage commissions, stamp duty fees, interest, taxes, acquired fund fees and expenses (if any), net expenses from affiliated master portfolios, and extraordinary expenses are excluded from the expense caps. Prior to or after the commitment expiration date, the caps may be increased or the commitment to maintain the cap may be terminated only with the approval of the Board of Trustees. Without these caps, the Fund’s returns would have been lower. The expense ratio paid by an investor is the net expense ratio (the total annual fund operating expenses after fee waivers) as stated in the prospectuses. |
| 3 | Historical performance for the Class A shares prior to their inception reflects the performance of the Class C shares and includes the higher expenses applicable to the Class C shares. If these expenses had not been included, returns for the Class A shares would be higher. |
| 4 | Prior to February 13, 2017, historical performance shown for Class C shares reflects the performance of the Fund’s predecessor WealthBuilder Portfolio share class and does not reflect the front-end sales load previously attributable to the predecessor class. The expenses for Class C shares and the predecessor share class are similar. |
| 5 | Historical performance shown for the Institutional Class shares prior to their inception reflects the performance of Class A shares adjusted to reflect that the Institutional Class shares do not have a sales load but not adjusted to reflect the Institutional Class expenses. If these expenses had been included, returns for the Institutional Class shares would be higher. |
| 6 | Source: Wells Fargo Funds Management, LLC. Spectrum Moderate Growth Blended Index is composed 32% of the Russell 3000® Index, 26% of the Bloomberg Barclays U.S. Aggregate Bond Index, 14% of the Bloomberg Barclays U.S. TIPS Index, 14% of ICE BofA U.S. High Yield Constrained Index, and 14% of the MSCI ACWI ex USA Index (Net). Effective November 2, 2020, the WealthBuilder Growth Balanced Blended Index, which was composed of 42% of the Russell 3000® Index, 40% of the Bloomberg Barclays U.S. Aggregate Bond Index, and 18% of the MSCI ACWI ex USA Index (Net), was renamed the Spectrum Moderate Growth Blended Index. You cannot invest directly in an index. |
| 7 | The Bloomberg Barclays U.S. Aggregate Bond Index is a broad-based benchmark that measures the investment-grade, U.S. dollar–denominated, fixed-rate taxable bond market, including Treasuries, government-related and corporate securities, mortgage-backed securities (agency fixed-rate and hybrid adjustable rate mortgage pass-throughs), asset-backed securities, and commercial mortgage-backed securities. You cannot invest directly in an index. |
| 8 | The Bloomberg Barclays U.S. Treasury Inflation-Protected Securities (TIPS) Index is an index of inflation-indexed-linked U.S. Treasury securities. You cannot invest directly in an index. |
| 9 | The ICE BofA U.S. High Yield Constrained Index is a market-value-weighted index of all domestic and Yankee high-yield bonds, including deferred interest bonds and payment-in-kind securities. Issues included in the index have maturities of one year or more and have a credit rating lower than BBB-/Baa3 but are not in default. The ICE BofA U.S. High Yield Constrained Index limits any individual issuer to a maximum of 2% benchmark exposure. You cannot invest directly in an index. Copyright 2021. ICE Data Indices, LLC. All rights reserved. |
| 10 | The Morgan Stanley Capital International (MSCI) All Country World Index (ACWI) ex USA Index (Net) is a free-float-adjusted market-capitalization-weighted index that is designed to measure the equity market performance of developed and emerging markets, excluding the U.S. Source: MSCI. MSCI makes no express or implied warranties or representations and shall have no liability whatsoever with respect to any MSCI data contained herein. The MSCI data may not be further redistributed or used as a basis for other indexes or any securities or financial products. This report is not approved, reviewed, or produced by MSCI. You cannot invest directly in an index. |
| 11 | The Russell 3000® Index measures the performance of the 3,000 largest U.S. companies based on total market capitalization, which represents approximately 98% of the investable U.S. equity market. You cannot invest directly in an index. |
| 12 | Figures represent the percentage of the Fund’s net assets. Holdings are subject to change and may have changed since the date specified. |
| 13 | Effective allocation includes the effect of any tactical futures overlay that may be in place. Effective cash, if any, is comprised of the net impact of long and/or short futures contracts held as part of a dynamic risk management strategy. These amounts are subject to change and may have changed since the date specified. |
Wells Fargo Multi-Asset Funds | 15
Fund expenses (unaudited)
As a shareholder of the Fund, you incur two types of costs: (1) transaction costs, including sales charges (loads) on purchase payments and contingent deferred sales charges (if any) on redemptions and (2) ongoing costs, including management fees, distribution (12b-1) and/or shareholder servicing fees, and other Fund expenses. This example is intended to help you understand your ongoing costs (in dollars) of investing in the Fund and to compare these costs with the ongoing costs of investing in other mutual funds.
The example is based on an investment of $1,000 invested at the beginning of the six-month period and held for the entire period from June 1, 2020 to November 30, 2020.
Actual expenses
The “Actual” line of the table below provides information about actual account values and actual expenses. You may use the information in this line, together with the amount you invested, to estimate the expenses that you paid over the period. Simply divide your account value by $1,000 (for example, an $8,600 account value divided by $1,000 = 8.6), then multiply the result by the number in the “Actual” line under the heading entitled “Expenses paid during period” for your applicable class of shares to estimate the expenses you paid on your account during this period.
Hypothetical example for comparison purposes
The “Hypothetical” line of the table below provides information about hypothetical account values and hypothetical expenses based on the Fund’s actual expense ratio and an assumed rate of return of 5% per year before expenses, which is not the Fund’s actual return. The hypothetical account values and expenses may not be used to estimate the actual ending account balance or expenses you paid for the period. You may use this information to compare the ongoing costs of investing in the Fund and other funds. To do so, compare this 5% hypothetical example with the 5% hypothetical examples that appear in the shareholder reports of the other funds.
Please note that the expenses shown in the table are meant to highlight your ongoing costs only and do not reflect any transactional costs, such as sales charges (loads) and contingent deferred sales charges. Therefore, the “Hypothetical” line of the table is useful in comparing ongoing costs only and will not help you determine the relative total costs of owning different funds. In addition, if these transactional costs were included, your costs would have been higher.
| | | | | | | | | | | | | | | | |
| Spectrum Aggressive Growth Fund | | Beginning
account value
6-1-2020 | | | Ending
account value
11-30-2020 | | | Expenses
paid during
the period1,2 | | | Annualized net
expense ratio1 | |
| | | | | |
Class A | | | | | | | | | | | | | | | | |
| | | | |
Actual | | $ | 1,000.00 | | | $ | 1,180.74 | | | $ | 4.10 | | | | 0.75 | % |
| | | | |
Hypothetical (5% return before expenses) | | $ | 1,000.00 | | | $ | 1,021.31 | | | $ | 3.80 | | | | 0.75 | % |
| | | | | |
Class C | | | | | | | | | | | | | | | | |
| | | | |
Actual | | $ | 1,000.00 | | | $ | 1,177.24 | | | $ | 8.19 | | | | 1.50 | % |
| | | | |
Hypothetical (5% return before expenses) | | $ | 1,000.00 | | | $ | 1,017.55 | | | $ | 7.59 | | | | 1.50 | % |
| | | | | |
Institutional Class | | | | | | | | | | | | | | | | |
| | | | |
Actual | | $ | 1,000.00 | | | $ | 1,182.60 | | | $ | 2.30 | | | | 0.42 | % |
| | | | |
Hypothetical (5% return before expenses) | | $ | 1,000.00 | | | $ | 1,022.96 | | | $ | 2.13 | | | | 0.42 | % |
| Spectrum Conservative Growth Fund | | | | | | | | | | | | |
| | | | | |
Class A | | | | | | | | | | | | | | | | |
| | | | |
Actual | | $ | 1,000.00 | | | $ | 1,085.95 | | | $ | 3.92 | | | | 0.75 | % |
| | | | |
Hypothetical (5% return before expenses) | | $ | 1,000.00 | | | $ | 1,021.31 | | | $ | 3.80 | | | | 0.75 | % |
| | | | | |
Class C | | | | | | | | | | | | | | | | |
| | | | |
Actual | | $ | 1,000.00 | | | $ | 1,081.88 | | | $ | 7.83 | | | | 1.50 | % |
| | | | |
Hypothetical (5% return before expenses) | | $ | 1,000.00 | | | $ | 1,017.55 | | | $ | 7.59 | | | | 1.50 | % |
| | | | | |
Institutional Class | | | | | | | | | | | | | | | | |
| | | | |
Actual | | $ | 1,000.00 | | | $ | 1,087.88 | | | $ | 2.20 | | | | 0.42 | % |
| | | | |
Hypothetical (5% return before expenses) | | $ | 1,000.00 | | | $ | 1,022.96 | | | $ | 2.13 | | | | 0.42 | % |
| 1 | Amounts do not reflect expenses allocated from the affiliated Master Portfolios in which the Fund invests. |
| 2 | Expenses paid is equal to the annualized net expense ratio of each class multiplied by the average account value over the period, multiplied by the number of days in the most recent fiscal half-year divided by the number of days in the fiscal year (to reflect the one-half-year period). |
16 | Wells Fargo Multi-Asset Funds
Fund expenses (unaudited)
| | | | | | | | | | | | | | | | |
| Spectrum Growth Fund | | Beginning
account value
6-1-2020 | | | Ending
account value
11-30-2020 | | | Expenses
paid during
the period1,2 | | | Annualized net
expense ratio1 | |
| | | | | |
Class A | | | | | | | | | | | | | | | | |
| | | | |
Actual | | $ | 1,000.00 | | | $ | 1,136.22 | | | $ | 4.02 | | | | 0.75 | % |
| | | | |
Hypothetical (5% return before expenses) | | $ | 1,000.00 | | | $ | 1,021.31 | | | $ | 3.80 | | | | 0.75 | % |
| | | | | |
Class C | | | | | | | | | | | | | | | | |
| | | | |
Actual | | $ | 1,000.00 | | | $ | 1,131.94 | | | $ | 8.02 | | | | 1.50 | % |
| | | | |
Hypothetical (5% return before expenses) | | $ | 1,000.00 | | | $ | 1,017.55 | | | $ | 7.59 | | | | 1.50 | % |
| | | | | |
Institutional Class | | | | | | | | | | | | | | | | |
| | | | |
Actual | | $ | 1,000.00 | | | $ | 1,137.80 | | | $ | 2.25 | | | | 0.42 | % |
| | | | |
Hypothetical (5% return before expenses) | | $ | 1,000.00 | | | $ | 1,022.96 | | | $ | 2.13 | | | | 0.42 | % |
| Spectrum Income Allocation Fund | | | | | | | | | | | | |
| | | | | |
Class A | | | | | | | | | | | | | | | | |
| | | | |
Actual | | $ | 1,000.00 | | | $ | 1,054.67 | | | $ | 3.86 | | | | 0.75 | % |
| | | | |
Hypothetical (5% return before expenses) | | $ | 1,000.00 | | | $ | 1,021.31 | | | $ | 3.80 | | | | 0.75 | % |
| | | | | |
Class C | | | | | | | | | | | | | | | | |
| | | | |
Actual | | $ | 1,000.00 | | | $ | 1,050.67 | | | $ | 7.71 | | | | 1.50 | % |
| | | | |
Hypothetical (5% return before expenses) | | $ | 1,000.00 | | | $ | 1,017.55 | | | $ | 7.59 | | | | 1.50 | % |
| | | | | |
Institutional Class | | | | | | | | | | | | | | | | |
| | | | |
Actual | | $ | 1,000.00 | | | $ | 1,056.40 | | | $ | 2.17 | | | | 0.42 | % |
| | | | |
Hypothetical (5% return before expenses) | | $ | 1,000.00 | | | $ | 1,022.96 | | | $ | 2.13 | | | | 0.42 | % |
| Spectrum Moderate Growth Fund | | | | | | | | | | | | |
| | | | | |
Class A | | | | | | | | | | | | | | | | |
| | | | |
Actual | | $ | 1,000.00 | | | $ | 1,112.34 | | | $ | 3.97 | | | | 0.75 | % |
| | | | |
Hypothetical (5% return before expenses) | | $ | 1,000.00 | | | $ | 1,021.31 | | | $ | 3.80 | | | | 0.75 | % |
| | | | | |
Class C | | | | | | | | | | | | | | | | |
| | | | |
Actual | | $ | 1,000.00 | | | $ | 1,109.56 | | | $ | 7.93 | | | | 1.50 | % |
| | | | |
Hypothetical (5% return before expenses) | | $ | 1,000.00 | | | $ | 1,017.55 | | | $ | 7.59 | | | | 1.50 | % |
| | | | | |
Institutional Class | | | | | | | | | | | | | | | | |
| | | | |
Actual | | $ | 1,000.00 | | | $ | 1,114.72 | | | $ | 2.23 | | | | 0.42 | % |
| | | | |
Hypothetical (5% return before expenses) | | $ | 1,000.00 | | | $ | 1,022.96 | | | $ | 2.13 | | | | 0.42 | % |
| 1 | Amounts do not reflect expenses allocated from the affiliated Master Portfolios in which the Fund invests. |
| 2 | Expenses paid is equal to the annualized net expense ratio of each class multiplied by the average account value over the period, multiplied by the number of days in the most recent fiscal half-year divided by the number of days in the fiscal year (to reflect the one-half-year period). |
Wells Fargo Multi-Asset Funds | 17
Portfolio of investments—November 30, 2020 (unaudited)
WELLS FARGO SPECTRUM AGGRESSIVE GROWTH FUND
| | | | | | | | | | | | | | | | |
| | | | | | | | | Shares | | | Value | |
| Exchange-Traded Funds: 6.16% | | | | | | | | | | | | |
iShares Core MSCI EAFE ETF | | | | | | | | | | | 151,106 | | | $ | 10,009,261 | |
iShares Core MSCI Emerging Markets ETF | | | | | | | | | | | 34,165 | | | | 2,002,752 | |
iShares Core S&P 500 ETF | | | | | | | | | | | 22,194 | | | | 8,063,524 | |
iShares Core S&P Small-Cap ETF | | | | | | | | | | | 63,212 | | | | 5,381,870 | |
| | | | |
Total Exchange-Traded Funds (Cost $20,283,213) | | | | | | | | | | | | | | | 25,457,407 | |
| | | | | | | | | | | | | | | | |
| | | | |
Investment Companies: 91.59% | | | | | | | | | | | | | | | | |
| | | | |
| Affiliated Master Portfolios: 81.78% | | | | | | | | | | | | |
Wells Fargo Disciplined Large Cap Portfolio | | | | | | | | | | | | | | | 112,850,969 | |
Wells Fargo Emerging Growth Portfolio | | | | | | | | | | | | | | | 4,105,577 | |
Wells Fargo Factor Enhanced Emerging Markets Equity Portfolio | | | | | | | | | | | | | | | 19,944,473 | |
Wells Fargo Factor Enhanced International Equity Portfolio | | | | | | | | | | | | | | | 80,764,657 | |
Wells Fargo Factor Enhanced U.S. Large Cap Equity Portfolio | | | | | | | | | | | | | | | 88,794,207 | |
Wells Fargo Factor Enhanced U.S. Small Cap Equity Portfolio | | | | | | | | | | | | | | | 27,115,537 | |
Wells Fargo Small Company Value Portfolio | | | | | | | | | | | | | | | 4,045,655 | |
| | | | |
| | | | | | | | | | | | | | | 337,621,075 | |
| | | | | | | | | | | | | | | | |
| | | | |
| Stock Funds: 9.81% | | | | | | | | | | | | |
Wells Fargo Emerging Markets Equity Fund Class R6 (l) | | | | | | | | | | | 252,193 | | | | 7,941,542 | |
Wells Fargo Endeavor Select Fund Class R6 (l)† | | | | | | | | | | | 1,296,481 | | | | 16,361,593 | |
Wells Fargo Large Cap Growth Fund Class R6 (l) | | | | | | | | | | | 285,093 | | | | 16,210,411 | |
| | | | |
| | | | | | | | | | | | | | | 40,513,546 | |
| | | | | | | | | | | | | | | | |
| | | | |
Total Investment Companies (Cost $313,137,759) | | | | | | | | | | | | | | | 378,134,621 | |
| | | | | | | | | | | | | | | | |
| | | | |
| | | | | | | | | | | | | | | | |
| | | Yield | | | | | | | | | | |
| Short-Term Investments: 0.58% | | | | | | | | | | | | | | | | |
| | | | |
| Investment Companies: 0.58% | | | | | | | | | | | | |
Wells Fargo Government Money Market Fund Select Class (l)(u) | | | 0.02 | % | | | | | | | 2,400,000 | | | | 2,400,000 | |
| | | | | | | | | | | | | | | | |
| | | | |
Total Short-Term Investments (Cost $2,400,000) | | | | | | | | | | | | | | | 2,400,000 | |
| | | | | | | | | | | | | | | | |
| | | | | | | | |
| Total investments in securities (Cost $335,820,972) | | | 98.33 | % | | | 405,992,028 | |
| | |
Other assets and liabilities, net | | | 1.67 | | | | 6,875,991 | |
| | | | | | | | |
| Total net assets | | | 100.00 | % | | $ | 412,868,019 | |
| | | | | | | | |
| (l) | The issuer of the security is an affiliated person of the Fund as defined in the Investment Company Act of 1940. |
| † | Non-income-earning security |
| (u) | The rate represents the 7-day annualized yield at period end. |
The accompanying notes are an integral part of these financial statements.
18 | Wells Fargo Multi-Asset Funds
Portfolio of investments—November 30, 2020 (unaudited)
WELLS FARGO SPECTRUM AGGRESSIVE GROWTH FUND
Futures Contracts
| | | | | | | | | | | | | | | | | | | | | | | | |
| Description | | Number of
contracts | | | Expiration
date | | | Notional
cost | | | Notional
value | | | Unrealized
gains | | | Unrealized
losses | |
| | | | | | |
Long | | | | | | | | | | | | | | | | | | | | | | | | |
| | | | | | |
Japanese Yen Futures | | | 171 | | | | 12-14-2020 | | | $ | 20,426,171 | | | $ | 20,491,144 | | | $ | 64,973 | | | $ | 0 | |
| | | | | | |
E-Mini Nasdaq 100 Index | | | 33 | | | | 12-18-2020 | | | | 7,927,891 | | | | 8,102,820 | | | | 174,929 | | | | 0 | |
| | | | | | |
E-Mini Russell 2000 Index | | | 140 | | | | 12-18-2020 | | | | 12,206,690 | | | | 12,740,700 | | | | 534,010 | | | | 0 | |
| | | | | | |
IBEX 35 Index | | | 179 | | | | 12-18-2020 | | | | 16,889,783 | | | | 17,215,924 | | | | 326,141 | | | | 0 | |
| | | | | | |
MSCI Emerging Markets Index | | | 69 | | | | 12-18-2020 | | | | 4,079,720 | | | | 4,147,935 | | | | 68,215 | | | | 0 | |
| | | | | | |
Long Gilt Futures | | | 172 | | | | 3-29-2021 | | | | 30,718,792 | | | | 30,770,014 | | | | 51,222 | | | | 0 | |
| | | | | | |
Short | | | | | | | | | | | | | | | | | | | | | | | | |
| | | | | | |
E-Mini S&P 500 Index | | | (68) | | | | 12-18-2020 | | | | (12,136,406 | ) | | | (12,318,880 | ) | | | 0 | | | | (182,474 | ) |
| | | | | | |
Mini-DAX Futures | | | (208) | | | | 12-18-2020 | | | | (16,358,233 | ) | | | (16,539,207 | ) | | | 0 | | | | (180,974 | ) |
| | | | | | |
Euro-Bund Futures | | | (120) | | | | 3-8-2021 | | | | (25,440,385 | ) | | | (25,422,031 | ) | | | 18,354 | | | | 0 | |
| | | | | | | | | | | | | | | | | | | | | | | | |
| | | | | | |
| | | | | | | | | | | | | | | | | | $ | 1,237,844 | | | $ | (363,448 | ) |
| | | | | | | | | | | | | | | | | | | | | | | | |
Investments in Affiliates
An affiliated investment is an investment in which the Fund owns at least 5% of the outstanding voting shares of the issuer or as a result of other relationships, such as the Fund and the issuer having the same investment manager. Transactions with issuers that were either affiliated persons of the Fund at the beginning of the period or the end of the period were as follows:
| | | | | | | | | | | | | | | | | | | | | | | | | | | | | | | | | | | | |
| | | Value,
beginning of
period | | | Purchases | | | Sales
proceeds | | | Net
realized
gains
(losses) on
affiliated
Underlying
Funds | | | Net
change in
unrealized
gains
(losses) on
affiliated
Underlying
Funds | | | Value,
end
of period | | | % of
net
assets | | | Shares,
end of
period | | | Dividends
from
affiliated
Underlying
Funds | |
Investment Companies | | | | | | | | | | | | | | | | | | | | | | | | | | | | | | | | | | | | |
Stock Funds | | | | | | | | | | | | | | | | | | | | | | | | | | | | | | | | | | | | |
Wells Fargo Emerging Markets Equity Fund Class R6 | | $ | 6,253,466 | | | $ | 1,437,336 | | | $ | (1,619,562 | ) | | $ | 162,562 | | | $ | 1,707,740 | | | $ | 7,941,542 | | | | | | | | 252,193 | | | $ | 0 | |
Wells Fargo Endeavor Select Fund Class R6 † | | | 14,166,330 | | | | 1,573,634 | | | | (2,395,760 | ) | | | 244,525 | | | | 2,772,865 | | | | 16,361,593 | | | | | | | | 1,296,481 | | | | 0 | |
Wells Fargo Large Cap Growth Fund Class R6 | | | 14,167,621 | | | | 2,553,879 | | | | (3,393,521 | ) | | | 189,569 | | | | 2,692,863 | | | | 16,210,411 | | | | | | | | 285,093 | | | | 0 | |
| | | | | | | | | |
| | | | | | | | | | | | | | | | | | | | | | | 40,513,546 | | | | 9.81 | % | | | | | | | | |
| | | | | | | | | | | | | | | | | | | | | | | | | | | | | | | | | | | | |
Short-Term Investments | | | | | | | | | | | | | | | | | | | | | | | | | | | | | | | | | | | | |
Investment Companies | | | | | | | | | | | | | | | | | | | | | | | | | | | | | | | | | | | | |
Wells Fargo Government Money Market Fund Select Class | | | 2,220,697 | | | | 48,652,063 | | | | (48,472,760 | ) | | | 0 | | | | 0 | | | | 2,400,000 | | | | 0.58 | | | | 2,400,000 | | | | 936 | |
| | | | | | | | | | | | | | | | | | | | | | | | | | | | | | | | | | | | |
| | | | | | | | | | | | | | $ | 596,656 | | | $ | 7,173,468 | | | $ | 42,913,546 | | | | 10.39 | % | | | | | | $ | 936 | |
| | | | | | | | | | | | | | | | | | | | | | | | | | | | | | | | | | | | |
| † | Non-income-earning security |
The accompanying notes are an integral part of these financial statements.
Wells Fargo Multi-Asset Funds | 19
Portfolio of investments—November 30, 2020 (unaudited)
WELLS FARGO SPECTRUM AGGRESSIVE GROWTH FUND
Transactions with the affiliated Master Portfolios were as follows:
| | | | | | | | | | | | | | | | | | | | | | | | | | | | | | | | | | | | |
| | | % of
ownership,
beginning
of period | | | % of
ownership,
end of
period | | | Net
realized
gains
(losses) on
securities
transactions
allocated
from
affiliated
Master
Portfolios | | | Net
change in
unrealized
gains
(losses) on
securities
transactions
allocated
from
affiliated
Master
Portfolios | | | Dividends
allocated
from
affiliated
Master
Portfolios | | | Affiliated
income
allocated
from
affiliated
Master
Portfolios | | | Interest
allocated
from
affiliated
Master
Portfolios | | | Value,
end
of period | | | % of
net
assets | |
Affiliated Master Portfolio | | | | | | | | | | | | | | | | | | | | | | | | | | | | | | | | | | | | |
Wells Fargo Disciplined Large Cap Portfolio | | | 31.68 | % | | | 35.95 | % | | $ | 1,049,614 | | | $ | 16,731,762 | | | $ | 879,204 | | | $ | 4,849 | | | $ | 378 | | | $ | 112,850,969 | | | | | |
Wells Fargo Emerging Growth Portfolio | | | 1.53 | | | | 0.48 | | | | 1,602,961 | | | | 1,269,876 | | | | 6,539 | | | | 1,524 | | | | 0 | | | | 4,105,577 | | | | | |
Wells Fargo Factor Enhanced Emerging Markets Equity Portfolio | | | 8.55 | | | | 9.89 | | | | 103,894 | | | | 3,711,080 | | | | 339,131 | | | | 147 | | | | 0 | | | | 19,944,473 | | | | | |
Wells Fargo Factor Enhanced International Equity Portfolio | | | 7.93 | | | | 11.72 | | | | 1,927,513 | | | | 9,060,987 | | | | 605,949 | | | | 504 | | | | 0 | | | | 80,764,657 | | | | | |
Wells Fargo Factor Enhanced U.S. Large Cap Equity Portfolio | | | 7.84 | | | | 9.67 | | | | 6,281,263 | | | | 3,682,774 | | | | 587,754 | | | | 672 | | | | 0 | | | | 88,794,207 | | | | | |
Wells Fargo Factor Enhanced U.S. Small Cap Equity Portfolio | | | 6.74 | | | | 11.13 | | | | 92,422 | | | | 5,039,485 | | | | 105,217 | | | | 184 | | | | 0 | | | | 27,115,537 | | | | | |
Wells Fargo Small Company Value Portfolio | | | 1.54 | | | | 0.88 | | | | (770 | ) | | | 1,222,915 | | | | 63,594 | | | | 448 | | | | 0 | | | | 4,045,655 | | | | | |
| | | | | | | | | | | | | | | | | | | | | | | | | | | | | | | | | | | | |
| | | | | | | | | | $ | 11,056,897 | | | $ | 40,718,879 | | | $ | 2,587,388 | | | $ | 8,328 | | | $ | 378 | | | $ | 337,621,075 | | | | 81.78 | % |
| | | | | | | | | | | | | | | | | | | | | | | | | | | | | | | | | | | | |
The accompanying notes are an integral part of these financial statements.
20 | Wells Fargo Multi-Asset Funds
Portfolio of investments—November 30, 2020 (unaudited)
WELLS FARGO SPECTRUM CONSERVATIVE GROWTH FUND
| | | | | | | | | | | | | | | | |
| | | | | | | | | Shares | | | Value | |
| Exchange-Traded Funds: 7.74% | | | | | | | | | | | | |
Aberdeen Standard Bloomberg All Commodity Strategy K-1 Free ETF | | | | | | | | | | | 73,063 | | | $ | 1,535,784 | |
iShares Core MSCI EAFE ETF | | | | | | | | | | | 60,725 | | | | 4,022,424 | |
iShares Core MSCI Emerging Markets ETF | | | | | | | | | | | 13,369 | | | | 783,691 | |
iShares Core S&P 500 ETF | | | | | | | | | | | 17,526 | | | | 6,367,546 | |
iShares Core S&P Small-Cap ETF | | | | | | | | | | | 19,414 | | | | 1,652,908 | |
iShares Core U.S. Aggregate Bond ETF | | | | | | | | | | | 79,071 | | | | 9,363,588 | |
The Industrial Select Sector SPDR Fund | | | | | | | | | | | 70,169 | | | | 6,176,977 | |
| | | | |
Total Exchange-Traded Funds (Cost $25,691,006) | | | | | | | | | | | | | | | 29,902,918 | |
| | | | | | | | | | | | | | | | |
| | | | |
Investment Companies: 90.47% | | | | | | | | | | | | | | | | |
| | | | |
| Affiliated Master Portfolios: 65.97% | | | | | | | | | | | | |
Wells Fargo Bloomberg Barclays US Aggregate ex-Corporate Portfolio | | | | | | | | | | | | | | | 46,185,100 | |
Wells Fargo Core Bond Portfolio | | | | | | | | | | | | | | | 65,099,316 | |
Wells Fargo Disciplined Large Cap Portfolio | | | | | | | | | | | | | | | 39,272,650 | |
Wells Fargo Emerging Growth Portfolio | | | | | | | | | | | | | | | 1,175,357 | |
Wells Fargo Factor Enhanced Emerging Markets Equity Portfolio | | | | | | | | | | | | | | | 5,087,424 | |
Wells Fargo Factor Enhanced International Equity Portfolio | | | | | | | | | | | | | | | 20,433,107 | |
Wells Fargo Factor Enhanced U.S. Large Cap Equity Portfolio | | | | | | | | | | | | | | | 17,359,574 | |
Wells Fargo Factor Enhanced U.S. Small Cap Equity Portfolio | | | | | | | | | | | | | | | 7,400,827 | |
Wells Fargo High Yield Corporate Bond Portfolio | | | | | | | | | | | | | | | 3,398,403 | |
Wells Fargo Real Return Portfolio | | | | | | | | | | | | | | | 24,103,314 | |
Wells Fargo Small Company Value Portfolio | | | | | | | | | | | | | | | 1,094,268 | |
Wells Fargo Strategic Retirement Bond Portfolio | | | | | | | | | | | | | | | 24,049,620 | |
| | | | |
| | | | | | | | | | | | | | | 254,658,960 | |
| | | | | | | | | | | | | | | | |
| | | | |
| Alternative Investment Funds: 3.77% | | | | | | | | | | | | |
PIMCO CommodityRealReturn Strategy Fund Institutional Class | | | | | | | | | | | 1,371,899 | | | | 7,641,476 | |
Wells Fargo Alternative Risk Premia Fund Class R6 (l) | | | | | | | | | | | 880,591 | | | | 6,903,833 | |
| | | | |
| | | | | | | | | | | | | | | 14,545,309 | |
| | | | | | | | | | | | | | | | |
| | | | |
| Bond Funds: 14.78% | | | | | | | | | | | | |
Wells Fargo Global Investment Grade Credit Fund Class R6 (l) | | | | | | | | | | | 988,435 | | | | 10,981,516 | |
Wells Fargo High Yield Bond Fund Institutional Class (l) | | | | | | | | | | | 3,327,712 | | | | 11,280,943 | |
Wells Fargo Strategic Income Fund Institutional Class (l) | | | | | | | | | | | 3,513,536 | | | | 34,784,008 | |
| | | | |
| | | | | | | | | | | | | | | 57,046,467 | |
| | | | | | | | | | | | | | | | |
| | | | |
| Stock Funds: 5.95% | | | | | | | | | | | | |
Wells Fargo Diversified Income Builder Fund Class R6 (I) | | | | | | | | | | | 2,227,213 | | | | 13,407,823 | |
Wells Fargo Emerging Markets Equity Fund Class R6 (l) | | | | | | | | | | | 60,700 | | | | 1,911,434 | |
Wells Fargo Endeavor Select Fund Class R6 (l)† | | | | | | | | | | | 305,166 | | | | 3,851,196 | |
Wells Fargo Large Cap Growth Fund Class R6 (l) | | | | | | | | | | | 67,141 | | | | 3,817,648 | |
| | | | |
| | | | | | | | | | | | | | | 22,988,101 | |
| | | | | | | | | | | | | | | | |
| | | | |
Total Investment Companies (Cost $324,354,997) | | | | | | | | | | | | | | | 349,238,837 | |
| | | | | | | | | | | | | | | | |
| | | | |
| | | | | | | | | | | | | | | | |
| | | Yield | | | | | | | | | | |
| Short-Term Investments: 0.33% | | | | | | | | | | | | | | | | |
| | | | |
| Investment Companies: 0.33% | | | | | | | | | | | | |
Wells Fargo Government Money Market Fund Select Class (l)(u) | | | 0.02 | % | | | | | | | 1,280,700 | | | | 1,280,700 | |
| | | | | | | | | | | | | | | | |
| | | | |
Total Short-Term Investments (Cost $1,280,700) | | | | | | | | | | | | | | | 1,280,700 | |
| | | | | | | | | | | | | | | | |
| | | | | | | | |
| Total investments in securities (Cost $351,326,703) | | | 98.54 | % | | | 380,422,455 | |
| | |
Other assets and liabilities, net | | | 1.46 | | | | 5,623,340 | |
| | | | | | | | |
| Total net assets | | | 100.00 | % | | $ | 386,045,795 | |
| | | | | | | | |
| (l) | The issuer of the security is an affiliated person of the Fund as defined in the Investment Company Act of 1940. |
| † | Non-income-earning security |
| (u) | The rate represents the 7-day annualized yield at period end. |
The accompanying notes are an integral part of these financial statements.
Wells Fargo Multi-Asset Funds | 21
Portfolio of investments—November 30, 2020 (unaudited)
WELLS FARGO SPECTRUM CONSERVATIVE GROWTH FUND
Futures Contracts
| | | | | | | | | | | | | | | | | | | | | | | | |
| Description | | Number of
contracts | | | Expiration
date | | | Notional
cost | | | Notional
value | | | Unrealized
gains | | | Unrealized
losses | |
| | | | | | |
Long | | | | | | | | | | | | | | | | | | | | | | | | |
| | | | | | |
Japanese Yen Futures | | | 161 | | | | 12-14-2020 | | | $ | 19,231,575 | | | $ | 19,292,831 | | | $ | 61,256 | | | $ | 0 | |
| | | | | | |
E-Mini Nasdaq 100 Index | | | 31 | | | | 12-18-2020 | | | | 7,447,413 | | | | 7,611,740 | | | | 164,327 | | | | 0 | |
| | | | | | |
E-Mini Russell 2000 Index | | | 132 | | | | 12-18-2020 | | | | 11,499,614 | | | | 12,012,660 | | | | 513,046 | | | | 0 | |
| | | | | | |
IBEX 35 Index | | | 170 | | | | 12-18-2020 | | | | 16,040,610 | | | | 16,350,319 | | | | 309,709 | | | | 0 | |
| | | | | | |
MSCI Emerging Markets Index | | | 65 | | | | 12-18-2020 | | | | 3,835,535 | | | | 3,907,475 | | | | 71,940 | | | | 0 | |
| | | | | | |
Long Gilt Bonds | | | 170 | | | | 3-29-2021 | | | | 30,361,597 | | | | 30,412,224 | | | | 50,627 | | | | 0 | |
| | | | | | |
Short | | | | | | | | | | | | | | | | | | | | | | | | |
| | | | | | |
E-Mini S&P 500 Index | | | 64 | | | | 12-18-2020 | | | | 11,437,817 | | | | 11,594,240 | | | | 0 | | | | (156,423 | ) |
| | | | | | |
Mini-DAX Futures | | | 196 | | | | 12-18-2020 | | | | 15,414,418 | | | | 15,585,022 | | | | 0 | | | | (170,604 | ) |
| | | | | | |
Euro-Bund Futures | | | 118 | | | | 12-8-2020 | | | | 25,016,378 | | | | 24,998,330 | | | | 18,048 | | | | 0 | |
| | | | | | | | | | | | | | | | | | | | | | | | |
| | | | | | |
| | | | | | | | | | | | | | | | | | $ | 1,188,953 | | | $ | (327,027 | ) |
| | | | | | | | | | | | | | | | | | | | | | | | |
Investments in Affiliates
An affiliated investment is an investment in which the Fund owns at least 5% of the outstanding voting shares of the issuer or as a result of other relationships, such as the Fund and the issuer having the same investment manager or adviser. Transactions with issuers that were either affiliated persons of the Fund at the beginning of the period or the end of the period were as follows:
| | | | | | | | | | | | | | | | | | | | | | | | | | | | | | | | | | | | |
| | | Value,
beginning of
period | | | Purchases | | | Sales
proceeds | | | Net
realized
gains
(losses) on
affiliated
Underlying
Funds | | | Net
change in
unrealized
gains
(losses) on
affiliated
Underlying
Funds | | | Value,
end
of period | | | % of
net
assets | | | Shares,
end of
period | | | Dividends
from
affiliated
Underlying
Funds | |
Investment Companies | | | | | | | | | | | | | | | | | | | | | | | | | | | | | | | | | | | | |
Alternative Investment Funds | | | | | | | | | | | | | | | | | | | | | | | | | | | | | | | | | | | | |
Wells Fargo Alternative Risk Premia Fund Class R6 | | $ | 13,783,975 | | | $ | 30,492 | | | $ | (6,387,113 | ) | | $ | (1,501,142 | ) | | $ | 977,621 | | | $ | 6,903,833 | | | | 1.79 | % | | | 880,591 | | | $ | 0 | |
| | | | | | | | | | | | | | | | | | | | | | | | | | | | | | | | | | | | |
Bond Funds | | | | | | | | | | | | | | | | | | | | | | | | | | | | | | | | | | | | |
Wells Fargo Global Investment Grade Credit Fund Class R6 | | | 14,693,669 | | | | 634,977 | | | | (5,009,154 | ) | | | 146,075 | | | | 515,949 | | | | 10,981,516 | | | | | | | | 988,435 | | | | 239,186 | |
Wells Fargo High Yield Bond Fund Institutional Class | | | 3,984,855 | | | | 7,536,837 | | | | (661,343 | ) | | | (11,071 | ) | | | 431,665 | | | | 11,280,943 | | | | | | | | 3,327,712 | | | | 103,723 | |
Wells Fargo Income Plus Fund Institutional Class | | | 35,821,977 | | | | 2,680,556 | | | | (5,787,174 | ) | | | 121,544 | | | | 1,947,105 | | | | 34,784,008 | | | | | | | | 3,513,536 | | | | 877,559 | |
| | | | | | | | | |
| | | | | | | | | | | | | | | | | | | | | | | 57,046,467 | | | | 14.78 | | | | | | | | | |
| | | | | | | | | | | | | | | | | | | | | | | | | | | | | | | | | | | | |
Stock Funds | | | | | | | | | | | | | | | | | | | | | | | | | | | | | | | | | | | | |
Wells Fargo Diversified Income Builder Fund Class R6 | | | 0 | | | | 13,105,428 | | | | (122,455 | ) | | | 3,162 | | | | 421,688 | | | | 13,407,823 | | | | | | | | 2,227,213 | | | | 52,321 | |
Wells Fargo Emerging Markets Equity Fund Class R6 | | | 2,711,234 | | | | 2,927 | | | | (1,481,246 | ) | | | 411,624 | | | | 266,895 | | | | 1,911,434 | | | | | | | | 60,700 | | | | 0 | |
Wells Fargo Endeavor Select Fund Class R6 † | | | 6,165,200 | | | | 6,624 | | | | (3,342,885 | ) | | | 561,331 | | | | 460,926 | | | | 3,851,196 | | | | | | | | 305,166 | | | | 0 | |
Wells Fargo Large Cap Growth Fund Class R6 | | | 6,179,364 | | | | 10,395 | | | | (3,378,436 | ) | | | 239,104 | | | | 767,221 | | | | 3,817,648 | | | | | | | | 67,141 | | | | 0 | |
| | | | | | | | | |
| | | | | | | | | | | | | | | | | | | | | | | 22,988,101 | | | | 5.95 | | | | | | | | | |
| | | | | | | | | | | | | | | | | | | | | | | | | | | | | | | | | | | | |
Short-Term Investments | | | | | | | | | | | | | | | | | | | | | | | | | | | | | | | | | | | | |
Investment Companies | | | | | | | | | | | | | | | | | | | | | | | | | | | | | | | | | | | | |
Wells Fargo Government Money Market Fund Select Class | | | 1,087,098 | | | | 9,494,456 | | | | (9,300,774 | ) | | | 0 | | | | 0 | | | | 1,280,700 | | | | 0.33 | | | | 1,280,700 | | | | 449 | |
| | | | | | | | | | | | | | | | | | | | | | | | | | | | | | | | | | | | |
| | | | | | | | | | | | | | $ | (29,373 | ) | | $ | 5,789,070 | | | $ | 88,219,101 | | | | 22.85 | % | | | | | | $ | 1,273,238 | |
| | | | | | | | | | | | | | | | | | | | | | | | | | | | | | | | | | | | |
| † | Non-income-earning security |
The accompanying notes are an integral part of these financial statements.
22 | Wells Fargo Multi-Asset Funds
Portfolio of investments—November 30, 2020 (unaudited)
WELLS FARGO SPECTRUM CONSERVATIVE GROWTH FUND
Transactions with the affiliated Master Portfolios were as follows:
| | | | | | | | | | | | | | | | | | | | | | | | | | | | | | | | | | | | |
| | | % of
ownership,
beginning
of period | | | % of
ownership,
end of
period | | | Net realized
gains
(losses) on
securities
transactions
allocated
from
affiliated
Master
Portfolios | | | Net
change in
unrealized
gains
(losses) on
securities
transactions
allocated
from
affiliated
Master
Portfolios | | | Dividends
allocated
from
affiliated
Master
Portfolios | | | Affiliated
income
allocated
from
affiliated
Master
Portfolios | | | Interest
allocated
from
affiliated
Master
Portfolios | | | Value,
end
of period | | | % of
net
assets | |
Wells Fargo Bloomberg Barclays US Aggregate ex-Corporate Portfolio | | | 8.64 | % | | | 7.92 | % | | $ | 335,841 | | | $ | (687,795 | ) | | $ | 0 | | | $ | 1,121 | | | $ | 390,670 | | | $ | 46,185,100 | | | | | |
Wells Fargo Core Bond Portfolio | | | 1.08 | | | | 1.07 | | | | 1,332,489 | | | | (41,053 | ) | | | 0 | | | | 1,358 | | | | 592,380 | | | | 65,099,316 | | | | | |
Wells Fargo Disciplined Large Cap Portfolio | | | 13.67 | | | | 12.51 | | | | 359,177 | | | | 6,577,562 | | | | 367,597 | | | | 1,944 | | | | 51 | | | | 39,272,650 | | | | | |
Wells Fargo Emerging Growth Portfolio | | | 0.67 | | | | 0.14 | | | | 646,241 | | | | 483,204 | | | | 3,339 | | | | 577 | | | | 0 | | | | 1,175,357 | | | | | |
Wells Fargo Factor Enhanced Emerging Markets Equity Portfolio | | | 3.71 | | | | 2.52 | | | | 24,152 | | | | 1,358,452 | | | | 111,878 | | | | 54 | | | | 0 | | | | 5,087,424 | | | | | |
Wells Fargo Factor Enhanced International Equity Portfolio | | | 3.42 | | | | 2.96 | | | | 652,003 | | | | 2,543,009 | | | | 211,668 | | | | 173 | | | | 0 | | | | 20,433,107 | | | | | |
Wells Fargo Factor Enhanced U.S. Large Cap Equity Portfolio | | | 3.38 | | | | 1.89 | | | | 2,502,406 | | | | (3,689 | ) | | | 218,491 | | | | 236 | | | | 0 | | | | 17,359,574 | | | | | |
Wells Fargo Factor Enhanced U.S. Small Cap Equity Portfolio | | | 2.94 | | | | 3.04 | | | | (19,435 | ) | | | 1,656,534 | | | | 44,503 | | | | 56 | | | | 6 | | | | 7,400,827 | | | | | |
Wells Fargo High Yield Corporate Bond Portfolio | | | 2.33 | | | | 6.84 | | | | 252,152 | | | | (24,401 | ) | | | 0 | | | | 19 | | | | 119,892 | | | | 3,398,403 | | | | | |
Wells Fargo Real Return Portfolio | | | 7.25 | | | | 11.07 | | | | 2,878 | | | | 672,322 | | | | 22,945 | | | | 82 | | | | 152,485 | | | | 24,103,314 | | | | | |
Wells Fargo Small Company Value Portfolio | | | 0.67 | | | | 0.24 | | | | (1,713 | ) | | | 426,267 | | | | 25,397 | | | | 168 | | | | 0 | | | | 1,094,268 | | | | | |
Wells Fargo Strategic Retirement Bond Portfolio | | | 0.00 | | | | 15.95 | | | | 3,704 | | | | 58,218 | | | | 0 | | | | 0 | | | | 17,125 | | | | 24,049,620 | | | | | |
| | | | | | | | | | | | | | | | | | | | | | | | | | | | | | | | | | | | |
| | | | | | | | | | $ | 6,089,895 | | | $ | 13,018,630 | | | $ | 1,005,818 | | | $ | 5,788 | | | $ | 1,272,609 | | | $ | 254,658,960 | | | | 65.97 | % |
| | | | | | | | | | | | | | | | | | | | | | | | | | | | | | | | | | | | |
The accompanying notes are an integral part of these financial statements.
Wells Fargo Multi-Asset Funds | 23
Portfolio of investments—November 30, 2020 (unaudited)
WELLS FARGO SPECTRUM GROWTH FUND
| | | | | | | | | | | | | | | | |
| | | | | | | | | Shares | | | Value | |
| Exchange-Traded Funds: 7.81% | | | | | | | | | | | | | | | | |
Aberdeen Standard Bloomberg All Commodity Strategy K-1 Free ETF | | | | | | | | | | | 53,281 | | | $ | 1,119,967 | |
iShares Core MSCI EAFE ETF | | | | | | | | | | | 58,522 | | | | 3,876,497 | |
iShares Core MSCI Emerging Markets ETF | | | | | | | | | | | 19,708 | | | | 1,155,283 | |
iShares Core S&P 500 ETF | | | | | | | | | | | 12,809 | | | | 4,653,765 | |
iShares Core S&P Small-Cap ETF | | | | | | | | | | | 32,506 | | | | 2,767,561 | |
iShares Core U.S. Aggregate Bond ETF | | | | | | | | | | | 36,816 | | | | 4,359,751 | |
The Industrial Select Sector SPDR Fund | | | | | | | | | | | 52,189 | | | | 4,594,198 | |
| | | | |
Total Exchange-Traded Funds (Cost $19,195,904) | | | | | | | | | | | | | | | 22,527,022 | |
| | | | | | | | | | | | | | | | |
| | | | |
Investment Companies: 90.20% | | | | | | | | | | | | | | | | |
| | | | |
| Affiliated Master Portfolios: 66.88% | | | | | | | | | | | | |
Wells Fargo Bloomberg Barclays US Aggregate ex-Corporate Portfolio | | | | | | | | | | | | | | | 6,148,933 | |
Wells Fargo Core Bond Portfolio | | | | | | | | | | | | | | | 4,740,819 | |
Wells Fargo Disciplined Large Cap Portfolio | | | | | | | | | | | | | | | 54,689,066 | |
Wells Fargo Emerging Growth Portfolio | | | | | | | | | | | | | | | 1,432,042 | |
Wells Fargo Factor Enhanced Emerging Markets Equity Portfolio | | | | | | | | | | | | | | | 8,061,950 | |
Wells Fargo Factor Enhanced International Equity Portfolio | | | | | | | | | | | | | | | 33,310,821 | |
Wells Fargo Factor Enhanced U.S. Large Cap Equity Portfolio | | | | | | | | | | | | | | | 33,572,299 | |
Wells Fargo Factor Enhanced U.S. Small Cap Equity Portfolio | | | | | | | | | | | | | | | 11,207,925 | |
Wells Fargo High Yield Corporate Bond Portfolio | | | | | | | | | | | | | | | 2,541,052 | |
Wells Fargo Real Return Portfolio | | | | | | | | | | | | | | | 17,871,510 | |
Wells Fargo Small Company Value Portfolio | | | | | | | | | | | | | | | 1,428,777 | |
Wells Fargo Strategic Retirement Bond Portfolio | | | | | | | | | | | | | | | 17,896,513 | |
| | | | |
| | | | | | | | | | | | | | | 192,901,707 | |
| | | | | | | | | | | | | | | | |
| | | | |
| Alternative Investment Funds: 3.13% | | | | | | | | | | | | |
PIMCO CommodityRealReturn Strategy Fund Institutional Class | | | | | | | | | | | 1,006,163 | | | | 5,604,329 | |
Wells Fargo Alternative Risk Premia Fund Class R6 (l) | | | | | | | | | | | 437,662 | | | | 3,431,268 | |
| | | | |
| | | | | | | | | | | | | | | 9,035,597 | |
| | | | | | | | | | | | | | | | |
| | | | |
| Bond Funds: 11.87% | | | | | | | | | | | | |
Wells Fargo Global Investment Grade Credit Fund Class R6 (l) | | | | | | | | | | | 723,926 | | | | 8,042,816 | |
Wells Fargo High Yield Bond Fund Institutional Class (l) | | | | | | | | | | | 3,309,444 | | | | 11,219,014 | |
Wells Fargo Income Plus Fund Institutional Class (l) | | | | | | | | | | | 1,511,269 | | | | 14,961,562 | |
| | | | |
| | | | | | | | | | | | | | | 34,223,392 | |
| | | | | | | | | | | | | | | | |
| | | | |
| Stock Funds: 8.32% | | | | | | | | | | | | |
Wells Fargo Diversified Income Builder Fund Class R6 (l) | | | | | | | | | | | 1,637,863 | | | | 9,859,933 | |
Wells Fargo Emerging Markets Equity Fund Class R6 (l) | | | | | | | | | | | 89,824 | | | | 2,828,570 | |
Wells Fargo Endeavor Select Fund Class R6 (l)† | | | | | | | | | | | 450,882 | | | | 5,690,130 | |
Wells Fargo Large Cap Growth Fund Class R6 (l) | | | | | | | | | | | 99,051 | | | | 5,632,021 | |
| | | | |
| | | | | | | | | | | | | | | 24,010,654 | |
| | | | | | | | | | | | | | | | |
| | | | |
Total Investment Companies (Cost $228,273,677) | | | | | | | | | | | | | | | 260,171,350 | |
| | | | | | | | | | | | | | | | |
| | | | |
| | | | | | | | | | | | | | | | |
| | | Yield | | | | | | | | | | |
| Short-Term Investments: 0.33% | | | | | | | | | | | | |
| | | | |
| Investment Companies: 0.33% | | | | | | | | | | | | |
Wells Fargo Government Money Market Fund Select Class (l)(u) | | | 0.02 | % | | | | | | | 966,950 | | | | 966,950 | |
| | | | | | | | | | | | | | | | |
| | | | |
Total Short-Term Investments (Cost $966,950) | | | | | | | | | | | | | | | 966,950 | |
| | | | | | | | | | | | | | | | |
| | | | | | | | |
| Total investments in securities (Cost $248,436,531) | | | 98.34 | % | | | 283,665,322 | |
| | |
Other assets and liabilities, net | | | 1.66 | | | | 4,781,294 | |
| | | | | | | | |
| Total net assets | | | 100.00 | % | | $ | 288,446,616 | |
| | | | | | | | |
The accompanying notes are an integral part of these financial statements.
24 | Wells Fargo Multi-Asset Funds
Portfolio of investments—November 30, 2020 (unaudited)
WELLS FARGO SPECTRUM GROWTH FUND
| (l) | The issuer of the security is an affiliated person of the Fund as defined in the Investment Company Act of 1940. |
| † | Non-income-earning security |
| (u) | The rate represents the 7-day annualized yield at period end. |
Futures Contracts
| | | | | | | | | | | | | | | | | | | | | | | | |
| Description | | Number of
contracts | | | Expiration
date | | | Notional
cost | | | Notional
value | | | Unrealized
gains | | | Unrealized
losses | |
| | | | | | |
Long | | | | | | | | | | | | | | | | | | | | | | | | |
| | | | | | |
Japanese Yen Futures | | | 120 | | | | 12-14-2020 | | | $ | 14,334,121 | | | $ | 14,379,750 | | | $ | 45,629 | | | $ | 0 | |
| | | | | | |
E-Mini Nasdaq 100 Index | | | 23 | | | | 12-18-2020 | | | | 5,525,500 | | | | 5,647,420 | | | | 121,920 | | | | 0 | |
| | | | | | |
E-Mini Russell 2000 Index | | | 98 | | | | 12-18-2020 | | | | 8,538,901 | | | | 8,918,490 | | | | 379,589 | | | | 0 | |
| | | | | | |
IBEX 35 Index | | | 126 | | | | 12-18-2020 | | | | 11,888,780 | | | | 12,118,472 | | | | 229,692 | | | | 0 | |
| | | | | | |
MSCI Emerging Markets Index | | | 48 | | | | 12-18-2020 | | | | 2,832,998 | | | | 2,885,520 | | | | 52,522 | | | | 0 | |
| | | | | | |
Long Gilt Futures | | | 124 | | | | 3-29-2021 | | | | 22,146,106 | | | | 22,183,034 | | | | 36,928 | | | | 0 | |
| | | | | | |
Short | | | | | | | | | | | | | | | | | | | | | | | | |
| | | | | | |
E-Mini S&P 500 Index | | | (47) | | | | 12-18-2020 | | | | (8,390,627 | ) | | | (8,514,520 | ) | | | 0 | | | | (123,893 | ) |
| | | | | | |
Mini-DAX Futures | | | (146) | | | | 12-18-2020 | | | | (11,482,101 | ) | | | (11,609,251 | ) | | | 0 | | | | (127,150 | ) |
| | | | | | |
Euro-Bund Futures | | | (86) | | | | 3-8-2021 | | | | (18,232,275 | ) | | | (18,219,122 | ) | | | 13,153 | | | | 0 | |
| | | | | | | | | | | | | | | | | | | | | | | | |
| | | | | | |
| | | | | | | | | | | | | | | | | | $ | 879,433 | | | $ | (251,043 | ) |
| | | | | | | | | | | | | | | | | | | | | | | | |
Investments in Affiliates
An affiliated investment is an investment in which the Fund owns at least 5% of the outstanding voting shares of the issuer or as a result of other relationships, such as the Fund and the issuer having the same investment manager. Transactions with issuers that were either affiliated persons of the Fund at the beginning of the period or the end of the period were as follows:
| | | | | | | | | | | | | | | | | | | | | | | | | | | | | | | | | | | | |
| | | Value,
beginning of
period | | | Purchases | | | Sales
proceeds | | | Net
realized
gains
(losses) on
affiliated
Underlying
Funds | | | Net
change in
unrealized
gains
(losses) on
affiliated
Underlying
Funds | | | Value,
end
of period | | | % of
net
assets | | | Shares,
end of
period | | | Dividends
from
affiliated
Underlying
Funds | |
Investment Companies | | | | | | | | | | | | | | | | | | | | | | | | | | | | | | | | | | | | |
Alternative Investment Funds | | | | | | | | | | | | | | | | | | | | | | | | | | | | | | | | | | | | |
Wells Fargo Alternative Risk Premia Fund Class R6 | | $ | 9,261,772 | | | $ | 770,951 | | | $ | (6,257,810 | ) | | $ | (1,459,719 | ) | | $ | 1,116,074 | | | $ | 3,431,268 | | | | 1.19 | % | | | 437,662 | | | $ | 0 | |
| | | | | | | | | | | | | | | | | | | | | | | | | | | | | | | | | | | | |
Bond Funds | | | | | | | | | | | | | | | | | | | | | | | | | | | | | | | | | | | | |
Wells Fargo Global Investment Grade Credit Fund Class R6 | | | 2,706,836 | | | | 5,157,916 | | | | (55,146 | ) | | | (605 | ) | | | 233,815 | | | | 8,042,816 | | | | | | | | 723,926 | | | | 65,773 | |
Wells Fargo High Yield Bond Fund Institutional Class | | | 742,599 | | | | 10,619,365 | | | | (433,740 | ) | | | (2,495 | ) | | | 293,285 | | | | 11,219,014 | | | | | | | | 3,309,444 | | | | 46,001 | |
Wells Fargo Income Plus Fund Institutional Class | | | 6,675,119 | | | | 8,905,985 | | | | (1,239,839 | ) | | | 1,099 | | | | 619,198 | | | | 14,961,562 | | | | | | | | 1,511,269 | | | | 203,199 | |
| | | | | | | | | |
| | | | | | | | | | | | | | | | | | | | | | | 34,223,392 | | | | 11.87 | | | | | | | | | |
| | | | | | | | | | | | | | | | | | | | | | | | | | | | | | | | | | | | |
Stock Funds | | | | | | | | | | | | | | | | | | | | | | | | | | | | | | | | | | | | |
Wells Fargo Diversified Income Builder Fund Class R6 | | | 0 | | | | 9,549,829 | | | | 0 | | | | 0 | | | | 310,104 | | | | 9,859,933 | | | | | | | | 1,637,863 | | | | 38,453 | |
Wells Fargo Emerging Markets Equity Fund Class R6 | | | 3,706,105 | | | | 115,860 | | | | (1,946,773 | ) | | | 505,131 | | | | 448,247 | | | | 2,828,570 | | | | | | | | 89,824 | | | | 0 | |
Wells Fargo Endeavor Select Fund Class R6 † | | | 8,508,998 | | | | 269,230 | | | | (4,535,619 | ) | | | 808,155 | | | | 639,366 | | | | 5,690,130 | | | | | | | | 450,882 | | | | 0 | |
Wells Fargo Large Cap Growth Fund Class R6 | | | 8,550,041 | | | | 303,662 | | | | (4,644,467 | ) | | | 334,591 | | | | 1,088,194 | | | | 5,632,021 | | | | | | | | 99,051 | | | | 0 | |
| | | | | | | | | |
| | | | | | | | | | | | | | | | | | | | | | | 24,010,654 | | | | 8.32 | | | | | | | | | |
| | | | | | | | | | | | | | | | | | | | | | | | | | | | | | | | | | | | |
Short-Term Investments | | | | | | | | | | | | | | | | | | | | | | | | | | | | | | | | | | | | |
Investment Companies | | | | | | | | | | | | | | | | | | | | | | | | | | | | | | | | | | | | |
Wells Fargo Government Money Market Fund Select Class | | | 768,588 | | | | 44,740,466 | | | | (44,542,104 | ) | | | 0 | | | | 0 | | | | 966,950 | | | | 0.33 | | | | 966,950 | | | | 342 | |
| | | | | | | | | | | | | | | | | | | | | | | | | | | | | | | | | | | | |
| | | | | | | | | | | | | | $ | 186,157 | | | $ | 4,748,283 | | | $ | 62,632,264 | | | | 21.71 | % | | | | | | $ | 353,768 | |
| | | | | | | | | | | | | | | | | | | | | | | | | | | | | | | | | | | | |
| † | Non-income-earning security |
The accompanying notes are an integral part of these financial statements.
Wells Fargo Multi-Asset Funds | 25
Portfolio of investments—November 30, 2020 (unaudited)
WELLS FARGO SPECTRUM GROWTH FUND
Transactions with the affiliated Master Portfolios were as follows:
| | | | | | | | | | | | | | | | | | | | | | | | | | | | | | | | | | | | |
| | | % of
ownership,
beginning
of period | | | % of
ownership,
end of
period | | | Net realized
gains
(losses) on
securities
transactions
allocated
from
affiliated
Master
Portfolios | | | Net
change in
unrealized
gains
(losses) on
securities
transactions
allocated
from
affiliated
Master
Portfolios | | | Dividends
allocated
from
affiliated
Master
Portfolios | | | Affiliated
income
allocated
from
affiliated
Master
Portfolios | | | Interest
allocated
from
affiliated
Master
Portfolios | | | Value,
end
of period | | | % of
net
assets | |
Wells Fargo Bloomberg Barclays US Aggregate ex-Corporate Portfolio | | | 1.61 | % | | | 1.06 | % | | $ | 56,645 | | | $ | (128,458 | ) | | $ | 0 | | | $ | 218 | | | $ | 73,516 | | | $ | 6,148,933 | | | | | |
Wells Fargo Core Bond Portfolio | | | 0.20 | | | | 0.08 | | | | 225,826 | | | | (37,806 | ) | | | 0 | | | | 255 | | | | 90,442 | | | | 4,740,819 | | | | | |
Wells Fargo Disciplined Large Cap Portfolio | | | 18.85 | | | | 17.42 | | | | 495,376 | | | | 9,079,477 | | | | 525,362 | | | | 2,790 | | | | 46 | | | | 54,689,066 | | | | | |
Wells Fargo Emerging Growth Portfolio | | | 0.93 | | | | 0.17 | | | | 922,103 | | | | 656,822 | | | | 4,615 | | | | 829 | | | | 0 | | | | 1,432,042 | | | | | |
Wells Fargo Factor Enhanced Emerging Markets Equity Portfolio | | | 5.04 | | | | 4.00 | | | | 38,537 | | | | 1,945,778 | | | | 158,041 | | | | 77 | | | | 0 | | | | 8,061,950 | | | | | |
Wells Fargo Factor Enhanced International Equity Portfolio | | | 4.71 | | | | 4.83 | | | | 970,442 | | | | 3,982,574 | | | | 308,402 | | | | 247 | | | | 0 | | | | 33,310,821 | | | | | |
Wells Fargo Factor Enhanced U.S. Large Cap Equity Portfolio | | | 4.65 | | | | 3.65 | | | | 3,591,166 | | | | 737,101 | | | | 332,577 | | | | 339 | | | | 0 | | | | 33,572,299 | | | | | |
Wells Fargo Factor Enhanced U.S. Small Cap Equity Portfolio | | | 4.06 | | | | 4.60 | | | | (16,010 | ) | | | 2,424,078 | | | | 64,977 | | | | 81 | | | | 8 | | | | 11,207,925 | | | | | |
Wells Fargo High Yield Bond Portfolio | | | 0.44 | | | | 5.11 | | | | 183,258 | | | | (80,278 | ) | | | 0 | | | | 4 | | | | 31,051 | | | | 2,541,052 | | | | | |
Wells Fargo Real Return Portfolio | | | 1.35 | | | | 8.21 | | | | 6,160 | | | | 294,873 | | | | 8,070 | | | | 26 | | | | 48,871 | | | | 17,871,510 | | | | | |
Wells Fargo Small Company Value Portfolio | | | 0.92 | | | | 0.31 | | | | (3,900 | ) | | | 590,625 | | | | 36,480 | | | | 246 | | | | 0 | | | | 1,428,777 | | | | | |
Wells Fargo Strategic Retirement Bond Portfolio | | | 0.00 | | | | 11.87 | | | | 5,595 | | | | (128,737 | ) | | | 0 | | | | 0 | | | | 11,571 | | | | 17,896,513 | | | | | |
| | | | | | | | | | | | | | | | | | | | | | | | | | | | | | | | | | | | |
| | | | | | | | | | $ | 6,475,198 | | | $ | 19,336,049 | | | $ | 1,438,524 | | | $ | 5,112 | | | $ | 255,505 | | | $ | 192,901,707 | | | | 66.88 | % |
| | | | | | | | | | | | | | | | | | | | | | | | | | | | | | | | | | | | |
The accompanying notes are an integral part of these financial statements.
26 | Wells Fargo Multi-Asset Funds
Portfolio of investments—November 30, 2020 (unaudited)
WELLS FARGO SPECTRUM INCOME ALLOCATION FUND
| | | | | | | | | | | | | | | | |
| | | | | | | | | Shares | | | Value | |
| Exchange-Traded Funds: 6.35% | | | | | | | | | | | | | | | | |
Aberdeen Standard Bloomberg All Commodity Strategy K-1 Free ETF | | | | | | | | | | | 44,570 | | | $ | 936,861 | |
iShares Core MSCI EAFE ETF | | | | | | | | | | | 24,475 | | | | 1,621,224 | |
iShares Core S&P 500 ETF | | | | | | | | | | | 5,167 | | | | 1,877,274 | |
iShares Core U.S. Aggregate Bond ETF | | | | | | | | | | | 58,887 | | | | 6,973,399 | |
The Industrial Select Sector SPDR Fund | | | | | | | | | | | 39,867 | | | | 3,509,492 | |
| | | | |
Total Exchange-Traded Funds (Cost $13,315,727) | | | | | | | | | | | | | | | 14,918,250 | |
| | | | | | | | | | | | | | | | |
| | | | |
Investment Companies: 91.75% | | | | | | | | | | | | | | | | |
| | | | |
| Affiliated Master Portfolios: 71.64% | | | | | | | | | | | | |
Wells Fargo Bloomberg Barclays US Aggregate ex-Corporate Portfolio | | | | | | | | | | | | | | | 52,213,414 | |
Wells Fargo Core Bond Portfolio | | | | | | | | | | | | | | | 79,477,404 | |
Wells Fargo Disciplined Large Cap Portfolio | | | | | | | | | | | | | | | 7,562,970 | |
Wells Fargo Emerging Growth Portfolio | | | | | | | | | | | | | | | 447,462 | |
Wells Fargo Factor Enhanced Emerging Markets Equity Portfolio | | | | | | | | | | | | | | | 869,772 | |
Wells Fargo Factor Enhanced International Equity Portfolio | | | | | | | | | | | | | | | 2,963,984 | |
Wells Fargo Factor Enhanced U.S. Large Cap Equity Portfolio | | | | | | | | | | | | | | | 2,395,256 | |
Wells Fargo Factor Enhanced U.S. Small Cap Equity Portfolio | | | | | | | | | | | | | | | 1,397,839 | |
Wells Fargo High Yield Corporate Bond Portfolio | | | | | | | | | | | | | | | 2,081,614 | |
Wells Fargo Real Return Portfolio | | | | | | | | | | | | | | | 9,223,059 | |
Wells Fargo Small Company Value Portfolio | | | | | | | | | | | | | | | 462,864 | |
Wells Fargo Strategic Retirement Bond Portfolio | | | | | | | | | | | | | | | 9,207,502 | |
| | | | |
| | | | | | | | | | | | | | | 168,303,140 | |
| | | | | | | | | | | | | | | | |
| | | | |
| Alternative Investment Funds: 3.53% | | | | | | | | | | | | |
PIMCO CommodityRealReturn Strategy Fund Institutional Class | | | | | | | | | | | 837,553 | | | | 4,665,171 | |
Wells Fargo Alternative Risk Premia Fund Class R6 (l) | | | | | | | | | | | 462,207 | | | | 3,623,700 | |
| | | | |
| | | | | | | | | | | | | | | 8,288,871 | |
| | | | | | | | | | | | | | | | |
| | | | |
| Bond Funds: 12.90% | | | | | | | | | | | | |
Wells Fargo Global Investment Grade Credit Fund Class R6 (l) | | | | | | | | | | | 610,251 | | | | 6,779,893 | |
Wells Fargo High Yield Bond Fund Institutional Class (l) | | | | | | | | | | | 1,358,041 | | | | 4,603,758 | |
Wells Fargo Income Plus Fund Institutional Class (l) | | | | | | | | | | | 1,912,766 | | | | 18,936,383 | |
| | | | |
| | | | | | | | | | | | | | | 30,320,034 | |
| | | | | | | | | | | | | | | | |
| | | | |
| Stock Funds: 3.68% | | | | | | | | | | | | |
Wells Fargo Diversified Income Builder Fund Class R6 (l) | | | | | | | | | | | 969,254 | | | | 5,834,909 | |
Wells Fargo Emerging Markets Equity Fund Class R6 (l) | | | | | | | | | | | 14,577 | | | | 459,037 | |
Wells Fargo Endeavor Select Fund Class R6 (l)† | | | | | | | | | | | 93,572 | | | | 1,180,885 | |
Wells Fargo Large Cap Growth Fund Class R6 (l) | | | | | | | | | | | 20,654 | | | | 1,174,397 | |
| | | | |
| | | | | | | | | | | | | | | 8,649,228 | |
| | | | | | | | | | | | | | | | |
| | | | |
Total Investment Companies (Cost $205,288,057) | | | | | | | | | | | | | | | 215,561,273 | |
| | | | | | | | | | | | | | | | |
| | | | |
| | | | | | | | | | | | | | | | |
| | | Yield | | | | | | | | | | |
| Short-Term Investments: 0.47% | | | | | | | | | | | | |
| | | | |
| Investment Companies: 0.47% | | | | | | | | | | | | |
Wells Fargo Government Money Market Fund Select Class (l)(u) | | | 0.02 | % | | | | | | | 1,100,000 | | | | 1,100,000 | |
| | | | | | | | | | | | | | | | |
| | | | |
Total Short-Term Investments (Cost $1,100,000) | | | | | | | | | | | | | | | 1,100,000 | |
| | | | | | | | | | | | | | | | |
| | | | | | | | |
| Total investments in securities (Cost $219,703,784) | | | 98.57 | % | | | 231,579,523 | |
| | |
Other assets and liabilities, net | | | 1.43 | | | | 3,352,665 | |
| | | | | | | | |
| Total net assets | | | 100.00 | % | | $ | 234,932,188 | |
| | | | | | | | |
The accompanying notes are an integral part of these financial statements.
Wells Fargo Multi-Asset Funds | 27
Portfolio of investments—November 30, 2020 (unaudited)
WELLS FARGO SPECTRUM INCOME ALLOCATION FUND
| (l) | The issuer of the security is an affiliated person of the Fund as defined in the Investment Company Act of 1940. |
| † | Non-income-earning security |
| (u) | The rate represents the 7-day annualized yield at period end. |
Futures Contracts
| | | | | | | | | | | | | | | | | | | | | | | | |
| Description | | Number of
contracts | | | Expiration
date | | | Notional
cost | | | Notional
value | | | Unrealized
gains | | | Unrealized
losses | |
| | | | | | |
Long | | | | | | | | | | | | | | | | | | | | | | | | |
| | | | | | |
Japanese Yen Futures | | | 98 | | | | 12-14-2020 | | | $ | 11,706,155 | | | $ | 11,743,464 | | | $ | 37,309 | | | $ | 0 | |
| | | | | | |
E-Mini Nasdaq 100 Index | | | 19 | | | | 12-18-2020 | | | | 4,564,544 | | | | 4,665,260 | | | | 100,716 | | | | 0 | |
| | | | | | |
E-Mini Russell 2000 Index | | | 81 | | | | 12-18-2020 | | | | 7,052,505 | | | | 7,371,405 | | | | 318,900 | | | | 0 | |
| | | | | | |
IBEX 35 Index | | | 104 | | | | 12-18-2020 | | | | 9,813,222 | | | | 10,002,548 | | | | 189,326 | | | | 0 | |
| | | | | | |
MSCI Emerging Markets Index | | | 40 | | | | 12-18-2020 | | | | 2,356,874 | | | | 2,404,600 | | | | 47,726 | | | | 0 | |
| | | | | | |
Long Gilt Futures | | | 106 | | | | 3-29-2021 | | | | 18,931,349 | | | | 18,962,916 | | | | 31,567 | | | | 0 | |
| | | | | | |
Short | | | | | | | | | | | | | | | | | | | | | | | | |
| | | | | | |
E-Mini S&P 500 Index | | | (39) | | | | 12-18-2020 | | | | (6,971,757 | ) | | | (7,065,240 | ) | | | 0 | | | | (93,483 | ) |
| | | | | | |
Mini-DAX Futures | | | (121) | | | | 12-18-2020 | | | | (9,516,187 | ) | | | (9,621,365 | ) | | | 0 | | | | (105,178 | ) |
| | | | | | |
Euro-Bund Futures | | | (74) | | | | 3-8-2021 | | | | (15,688,237 | ) | | | (15,676,919 | ) | | | 11,318 | | | | 0 | |
| | | | | | | | | | | | | | | | | | | | | | | | |
| | | | | | |
| | | | | | | | | | | | | | | | | | $ | 736,862 | | | $ | (198,661 | ) |
| | | | | | | | | | | | | | | | | | | | | | | | |
Investments in Affiliates
An affiliated investment is an investment in which the Fund owns at least 5% of the outstanding voting shares of the issuer or as a result of other relationships, such as the Fund and the issuer having the same investment manager. Transactions with issuers that were either affiliated persons of the Fund at the beginning of the period or the end of the period were as follows:
| | | | | | | | | | | | | | | | | | | | | | | | | | | | | | | | | | | | |
| | | Value,
beginning of
period | | | Purchases | | | Sales
proceeds | | | Net
realized
gains
(losses) on
affiliated
Underlying
Funds | | | Net
change in
unrealized
gains
(losses) on
affiliated
Underlying
Funds | | | Value,
end
of period | | | % of
net
assets | | | Shares,
end of period | | | Dividends
from
affiliated
Underlying
Funds | |
Investment Companies | | | | | | | | | | | | | | | | | | | | | | | | | | | | | | | | | | | | |
Alternative Investment Funds | | | | | | | | | | | | | | | | | | | | | | | | | | | | | | | | | | | | |
Wells Fargo Alternative Risk Premia Fund Class R6 | | $ | 8,895,359 | | | $ | 172,355 | | | $ | (5,124,263 | ) | | $ | (1,197,187 | ) | | $ | 877,436 | | | $ | 3,623,700 | | | | 1.54 | % | | $ | 462,207 | | | $ | 0 | |
| | | | | | | | | | | | | | | | | | | | | | | | | | | | | | | | | | | | |
Bond Funds | | | | | | | | | | | | | | | | | | | | | | | | | | | | | | | | | | | | |
Wells Fargo Global Investment Grade Credit Fund Class R6 | | | 12,824,937 | | | | 347,144 | | | | (6,921,059 | ) | | | 223,741 | | | | 305,130 | | | | 6,779,893 | | | | | | | | 610,251 | | | | 195,806 | |
Wells Fargo High Yield Bond Fund Institutional Class | | | 3,469,313 | | | | 1,371,269 | | | | (478,767 | ) | | | (11,209 | ) | | | 253,152 | | | | 4,603,758 | | | | | | | | 1,358,041 | | | | 74,041 | |
Wells Fargo Income Plus Fund Institutional Class | | | 31,161,289 | | | | 1,542,035 | | | | (15,248,113 | ) | | | 438,396 | | | | 1,042,776 | | | | 18,936,383 | | | | | | | | 1,912,766 | | | | 705,586 | |
| | | | | | | | | |
| | | | | | | | | | | | | | | | | | | | | | | 30,320,034 | | | | 12.90 | | | | | | | | | |
| | | | | | | | | | | | | | | | | | | | | | | | | | | | | | | | | | | | |
Stock Funds | | | | | | | | | | | | | | | | | | | | | | | | | | | | | | | | | | | | |
Wells Fargo Diversified Income Builder Fund Class R6 | | | 0 | | | | 5,825,480 | | | | (179,028 | ) | | | 4,299 | | | | 184,158 | | | | 5,834,909 | | | | | | | | 969,254 | | | | 22,895 | |
Wells Fargo Emerging Markets Equity Fund Class R6 | | | 855,847 | | | | 3,975 | | | | (603,553 | ) | | | 198,534 | | | | 4,234 | | | | 459,037 | | | | | | | | 14,577 | | | | 0 | |
Wells Fargo Endeavor Select Fund Class R6 † | | | 1,939,111 | | | | 14,486 | | | | (1,093,714 | ) | | | 189,364 | | | | 131,638 | | | | 1,180,885 | | | | | | | | 93,572 | | | | 0 | |
Wells Fargo Large Cap Growth Fund Class R6 | | | 1,940,462 | | | | 16,359 | | | | (1,098,646 | ) | | | 120,280 | | | | 195,942 | | | | 1,174,397 | | | | | | | | 20,654 | | | | 0 | |
| | | | | | | | | |
| | | | | | | | | | | | | | | | | | | | | | | 8,649,228 | | | | 3.68 | | | | | | | | | |
| | | | | | | | | | | | | | | | | | | | | | | | | | | | | | | | | | | | |
Short-Term Investments | | | | | | | | | | | | | | | | | | | | | | | | | | | | | | | | | | | | |
Investment Companies | | | | | | | | | | | | | | | | | | | | | | | | | | | | | | | | | | | | |
Wells Fargo Government Money Market Fund Select Class | | | 976,721 | | | | 21,256,596 | | | | (21,133,317 | ) | | | 0 | | | | 0 | | | | 1,100,000 | | | | 0.47 | | | | 1,100,000 | | | | 429 | |
| | | | | | | | | | | | | | | | | | | | | | | | | | | | | | | | | | | | |
| | | | | | | | | | | | | | $ | (33,782 | ) | | $ | 2,994,466 | | | $ | 43,692,962 | | | | 18.59 | % | | | | | | $ | 998,757 | |
| | | | | | | | | | | | | | | | | | | | | | | | | | | | | | | | | | | | |
| † | Non-income-earning security |
The accompanying notes are an integral part of these financial statements.
28 | Wells Fargo Multi-Asset Funds
Portfolio of investments—November 30, 2020 (unaudited)
WELLS FARGO SPECTRUM INCOME ALLOCATION FUND
Transactions with the affiliated Master Portfolios were as follows:
| | | | | | | | | | | | | | | | | | | | | | | | | | | | | | | | | | | | |
| | | % of
ownership,
beginning
of period | | | % of
ownership,
end of
period | | | Net realized
gains
(losses) on
securities
transactions
allocated
from
affiliated
Master
Portfolios | | | Net
change in
unrealized
gains
(losses) on
securities
transactions
allocated
from
affiliated
Master
Portfolios | | | Dividends
allocated
from
affiliated
Master
Portfolios | | | Affiliated
income
allocated
from
affiliated
Master
Portfolios | | | Interest
allocated
from
affiliated
Master
Portfolios | | | Value,
end
of period | | | % of
net
assets | |
Affiliated Master Portfolio | | | | | | | | | | | | | | | | | | | | | | | | | | | | | | | | | | | | |
Wells Fargo Bloomberg Barclays US Aggregate ex-Corporate Portfolio | | | 7.52 | % | | | 8.96 | % | | $ | 295,900 | | | $ | (365,683 | ) | | $ | 0 | | | $ | 977 | | | $ | 348,854 | | | $ | 52,213,414 | | | | | |
Wells Fargo Core Bond Portfolio | | | 0.94 | | | | 1.30 | | | | 1,156,325 | | | | 520,648 | | | | 0 | | | | 1,177 | | | | 528,864 | | | | 79,477,404 | | | | | |
Wells Fargo Disciplined Large Cap Portfolio | | | 4.29 | | | | 2.41 | | | | 73,899 | | | | 1,688,817 | | | | 99,314 | | | | 534 | | | | 13 | | | | 7,562,970 | | | | | |
Wells Fargo Emerging Growth Portfolio | | | 0.21 | | | | 0.05 | | | | 200,557 | | | | 158,193 | | | | 1,099 | | | | 181 | | | | 0 | | | | 447,462 | | | | | |
Wells Fargo Factor Enhanced Emerging Markets Equity Portfolio | | | 1.17 | | | | 0.43 | | | | 2,650 | | | | (331,226 | ) | | | 40,036 | | | | 16 | | | | 0 | | | | 869,772 | | | | | |
Wells Fargo Factor Enhanced International Equity Portfolio | | | 1.07 | | | | 0.43 | | | | 168,049 | | | | 429,782 | | | | 62,356 | | | | 52 | | | | 0 | | | | 2,963,984 | | | | | |
Wells Fargo Factor Enhanced U.S. Large Cap Equity Portfolio | | | 1.06 | | | | 0.26 | | | | 764,688 | | | | (238,099 | ) | | | 61,117 | | | | 71 | | | | 0 | | | | 2,395,256 | | | | | |
Wells Fargo Factor Enhanced U.S. Small Cap Equity Portfolio | | | 0.91 | | | | 0.57 | | | | (18,453 | ) | | | 423,370 | | | | 12,616 | | | | 17 | | | | 2 | | | | 1,397,839 | | | | | |
Wells Fargo High Yield Corporate Bond Portfolio | | | 2.03 | | | | 4.19 | | | | 155,242 | | | | 24,484 | | | | 0 | | | | 16 | | | | 98,514 | | | | 2,081,614 | | | | | |
Wells Fargo Real Return Portfolio | | | 6.31 | | | | 4.42 | | | | (12,287 | ) | | | 486,940 | | | | 16,487 | | | | 61 | | | | 111,935 | | | | 9,223,059 | | | | | |
Wells Fargo Small Company Value Portfolio | | | 0.21 | | | | 0.10 | | | | (658 | ) | | | 156,853 | | | | 8,150 | | | | 53 | | | | 0 | | | | 462,864 | | | | | |
Wells Fargo Strategic Retirement Bond Portfolio | | | 0.00 | | | | 6.11 | | | | 1,430 | | | | 64,265 | | | | 0 | | | | 7 | | | | 6,563 | | | | 9,207,502 | | | | | |
| | | | | | | | | | | | | | | | | | | | | | | | | | | | | | | | | | | | |
| | | | | | | | | | $ | 2,787,342 | | | $ | 3,018,344 | | | $ | 301,175 | | | $ | 3,162 | | | $ | 1,094,745 | | | $ | 168,303,140 | | | | 71.64 | % |
| | | | | | | | | | | | | | | | | | | | | | | | | | | | | | | | | | | | |
The accompanying notes are an integral part of these financial statements.
Wells Fargo Multi-Asset Funds | 29
Portfolio of investments—November 30, 2020 (unaudited)
WELLS FARGO SPECTRUM MODERATE GROWTH FUND
| | | | | | | | | | | | | | | | |
| | | | | | | | | Shares | | | Value | |
| Exchange-Traded Funds: 6.79% | | | | | | | | | | | | |
Aberdeen Standard Bloomberg All Commodity Strategy K-1 Free ETF | | | | | | | | | | | 102,587 | | | $ | 2,156,379 | |
iShares Core MSCI EAFE ETF | | | | | | | | | | | 77,903 | | | | 5,160,295 | |
iShares Core MSCI Emerging Markets ETF | | | | | | | | | | | 37,885 | | | | 2,220,819 | |
iShares Core S&P 500 ETF | | | | | | | | | | | 15,267 | | | | 5,546,806 | |
iShares Core S&P Small-Cap ETF | | | | | | | | | | | 34,641 | | | | 2,949,335 | |
iShares Core U.S. Aggregate Bond ETF | | | | | | | | | | | 88,467 | | | | 10,476,261 | |
The Industrial Select Sector SPDR Fund | | | | | | | | | | | 100,070 | | | | 8,809,162 | |
| | | | |
Total Exchange-Traded Funds (Cost $32,693,673) | | | | | | | | | | | | | | | 37,319,057 | |
| | | | | | | | | | | | | | | | |
| | | | |
Investment Companies: 91.23% | | | | | | | | | | | | | | | | |
| | | | |
| Affiliated Master Portfolios: 68.62% | | | | | | | | | | | | |
Wells Fargo Bloomberg Barclays US Aggregate ex-Corporate Portfolio | | | | | | | | | | | | | | | 41,592,326 | |
Wells Fargo Core Bond Portfolio | | | | | | | | | | | | | | | 40,053,706 | |
Wells Fargo Disciplined Large Cap Portfolio | | | | | | | | | | | | | | | 90,319,769 | |
Wells Fargo Emerging Growth Portfolio | | | | | | | | | | | | | | | 2,741,474 | |
Wells Fargo Factor Enhanced Emerging Markets Equity Portfolio | | | | | | | | | | | | | | | 11,822,111 | |
Wells Fargo Factor Enhanced International Equity Portfolio | | | | | | | | | | | | | | | 50,749,521 | |
Wells Fargo Factor Enhanced U.S. Large Cap Equity Portfolio | | | | | | | | | | | | | | | 47,494,727 | |
Wells Fargo Factor Enhanced U.S. Small Cap Equity Portfolio | | | | | | | | | | | | | | | 16,554,945 | |
Wells Fargo High Yield Corporate Bond Portfolio | | | | | | | | | | | | | | | 4,824,582 | |
Wells Fargo Real Return Portfolio | | | | | | | | | | | | | | | 34,189,837 | |
Wells Fargo Small Company Value Portfolio | | | | | | | | | | | | | | | 2,752,547 | |
Wells Fargo Strategic Retirement Bond Portfolio | | | | | | | | | | | | | | | 34,160,701 | |
| | | | |
| | | | | | | | | | | | | | | 377,256,246 | |
| | | | | | | | | | | | | | | | |
| | | | |
| Alternative Investment Funds: 3.80% | | | | | | | | | | | | |
PIMCO CommodityRealReturn Strategy Fund Institutional Class | | | | | | | | | | | 1,933,813 | | | | 10,771,336 | |
Wells Fargo Alternative Risk Premia Fund Class R6 (l) | | | | | | | | | | | 1,287,429 | | | | 10,093,441 | |
| | | | |
| | | | | | | | | | | | | | | 20,864,777 | |
| | | | | | | | | | | | | | | | |
| | | | |
| Bond Funds: 12.13% | | | | | | | | | | | | |
Wells Fargo Global Investment Grade Credit Fund Class R6 (l) | | | | | | | | | | | 1,373,005 | | | | 15,254,086 | |
Wells Fargo High Yield Bond Fund Institutional Class (l) | | | | | | | | | | | 3,932,831 | | | | 13,332,296 | |
Wells Fargo Income Plus Fund Institutional Class (l) | | | | | | | | | | | 3,847,565 | | | | 38,090,893 | |
| | | | |
| | | | | | | | | | | | | | | 66,677,275 | |
| | | | | | | | | | | | | | | | |
| | | | |
| Stock Funds: 6.68% | | | | | | | | | | | | |
Wells Fargo Diversified Income Builder Fund Class R6 (l) | | | | | | | | | | | 2,692,036 | | | | 16,206,057 | |
Wells Fargo Emerging Markets Equity Fund Class R6 (l) | | | | | | | | | | | 137,617 | | | | 4,333,554 | |
Wells Fargo Endeavor Select Fund Class R6 (l)† | | | | | | | | | | | 644,506 | | | | 8,133,663 | |
Wells Fargo Large Cap Growth Fund Class R6 (l) | | | | | | | | | | | 141,883 | | | | 8,067,450 | |
| | | | |
| | | | | | | | | | | | | | | 36,740,724 | |
| | | | | | | | | | | | | | | | |
| | | | |
Total Investment Companies (Cost $452,466,215) | | | | | | | | | | | | | | | 501,539,022 | |
| | | | | | | | | | | | | | | | |
| | | | |
| | | | | | | | | | | | | | | | |
| | | Yield | | | | | | | | | | |
| Short-Term Investments: 0.48% | | | | | | | | | | | | |
| | | | |
| Investment Companies: 0.48% | | | | | | | | | | | | |
Wells Fargo Government Money Market Fund Select Class (l)(u) | | | 0.02 | % | | | | | | | 2,652,130 | | | | 2,652,130 | |
| | | | | | | | | | | | | | | | |
| | | | |
Total Short-Term Investments (Cost $2,652,130) | | | | | | | | | | | | | | | 2,652,130 | |
| | | | | | | | | | | | | | | | |
| | | | | | | | |
| Total investments in securities (Cost $487,812,018) | | | 98.50 | % | | | 541,510,209 | |
| | |
Other assets and liabilities, net | | | 1.50 | | | | 8,254,666 | |
| | | | | | | | |
| Total net assets | | | 100.00 | % | | $ | 549,764,875 | |
| | | | | | | | |
The accompanying notes are an integral part of these financial statements.
30 | Wells Fargo Multi-Asset Funds
Portfolio of investments—November 30, 2020 (unaudited)
WELLS FARGO SPECTRUM MODERATE GROWTH FUND
| (l) | The issuer of the security is an affiliated person of the Fund as defined in the Investment Company Act of 1940. |
| † | Non-income-earning security |
| (u) | The rate represents the 7-day annualized yield at period end. |
Futures Contracts
| | | | | | | | | | | | | | | | | | | | | | | | |
| Description | | Number of
contracts | | | Expiration
date | | | Notional
cost | | | Notional
value | | | Unrealized
gains | | | Unrealized
losses | |
| | | | | | |
Long | | | | | | | | | | | | | | | | | | | | | | | | |
| | | | | | |
Japanese Yen Futures | | | 229 | | | | 12-14-2020 | | | $ | 27,354,248 | | | $ | 27,441,356 | | | $ | 87,108 | | | $ | 0 | |
| | | | | | |
E-Mini Nasdaq 100 Index | | | 44 | | | | 12-18-2020 | | | | 10,570,522 | | | | 10,803,760 | | | | 233,238 | | | | 0 | |
| | | | | | |
E-Mini Russell 2000 Index | | | 187 | | | | 12-18-2020 | | | | 16,292,643 | | | | 17,017,935 | | | | 725,292 | | | | 0 | |
| | | | | | |
IBEX 35 Index | | | 240 | | | | 12-18-2020 | | | | 22,645,567 | | | | 23,082,803 | | | | 437,236 | | | | 0 | |
| | | | | | |
MSCI Emerging Markets Index | | | 92 | | | | 12-18-2020 | | | | 5,428,280 | | | | 5,530,580 | | | | 102,300 | | | | 0 | |
| | | | | | |
Long Gilt Futures | | | 238 | | | | 3-29-2021 | | | | 42,506,236 | | | | 42,577,113 | | | | 70,877 | | | | 0 | |
| | | | | | |
Short | | | | | | | | | | | | | | | | | | | | | | | | |
| | | | | | |
E-Mini S&P 500 Index | | | (91) | | | | 12-18-2020 | | | | (16,256,549 | ) | | | (16,485,560 | ) | | | 0 | | | | (229,011 | ) |
| | | | | | |
Mini-DAX Futures | | | (278) | | | | 12-18-2020 | | | | (21,863,330 | ) | | | (22,105,286 | ) | | | 0 | | | | (241,956 | ) |
| | | | | | |
Euro-Bund Futures | | | (166) | | | | 3-8-2021 | | | | (35,192,531 | ) | | | (35,167,142 | ) | | | 25,389 | | | | 0 | |
| | | | | | | | | | | | | | | | | | | | | | | | |
| | | | | | |
| | | | | | | | | | | | | | | | | | $ | 1,681,440 | | | $ | (470,967 | ) |
| | | | | | | | | | | | | | | | | | | | | | | | |
Investments in Affiliates
An affiliated investment is an investment in which the Fund owns at least 5% of the outstanding voting shares of the issuer or as a result of other relationships, such as the Fund and the issuer having the same investment manager. Transactions with issuers that were either affiliated persons of the Fund at the beginning of the period or the end of the period were as follows:
| | | | | | | | | | | | | | | | | | | | | | | | | | | | | | | | | | | | |
| | | Value,
beginning of
period | | | Purchases | | | Sales
proceeds | | | Net
realized
gains
(losses) on
affiliated
Underlying
Funds | | | Net
change in
unrealized
gains
(losses) on
affiliated
Underlying
Funds | | | Value,
end
of period | | | % of
net
assets | | | Shares,
end of
period | | | Dividends
from
affiliated
Underlying
Funds | |
Investment Companies | | | | | | | | | | | | | | | | | | | | | | | | | | | | | | | | | | | | |
Alternative Investment Funds | | | | | | | | | | | | | | | | | | | | | | | | | | | | | | | | | | | | |
Wells Fargo Alternative Risk Premia Fund Class R6 | | $ | 18,667,657 | | | $ | 460,037 | | | $ | (8,306,491 | ) | | $ | (1,950,358 | ) | | $ | 1,222,596 | | | $ | 10,093,441 | | | | 1.84 | % | | | 1,287,429 | | | $ | 0 | |
| | | | | | | | | | | | | | | | | | | | | | | | | | | | | | | | | | | | |
Bond Funds | | | | | | | | | | | | | | | | | | | | | | | | | | | | | | | | | | | | |
Wells Fargo Global Investment Grade Credit Fund Class R6 | | | 12,739,817 | | | | 2,080,531 | | | | (244,086 | ) | | | (2,300 | ) | | | 680,124 | | | | 15,254,086 | | | | | | | | 1,373,005 | | | | 229,617 | |
Wells Fargo High Yield Bond Fund Institutional Class | | | 3,490,191 | | | | 9,991,819 | | | | (596,508 | ) | | | (10,313 | ) | | | 457,107 | | | | 13,332,296 | | | | | | | | 3,932,831 | | | | 101,328 | |
Wells Fargo Income Plus Fund Institutional Class | | | 31,365,106 | | | | 7,387,148 | | | | (2,677,149 | ) | | | 9,271 | | | | 2,006,517 | | | | 38,090,893 | | | | | | | | 3,847,565 | | | | 806,170 | |
| | | | | | | | | |
| | | | | | | | | | | | | | | | | | | | | | | 66,677,275 | | | | 12.13 | | | | | | | | | |
| | | | | | | | | | | | | | | | | | | | | | | | | | | | | | | | | | | | |
Stock Funds | | | | | | | | | | | | | | | | | | | | | | | | | | | | | | | | | | | | |
Wells Fargo Diversified Income Builder Fund Class R6 | | | 0 | | | | 15,760,288 | | | | (65,581 | ) | | | 1,654 | | | | 509,696 | | | | 16,206,057 | | | | | | | | 2,692,036 | | | | 63,206 | |
Wells Fargo Emerging Markets Equity Fund Class R6 | | | 5,608,025 | | | | 77,673 | | | | (2,788,046 | ) | | | 741,521 | | | | 694,381 | | | | 4,333,554 | | | | | | | | 137,617 | | | | 0 | |
Wells Fargo Endeavor Select Fund Class R6 † | | | 12,750,258 | | | | 174,764 | | | | (6,914,343 | ) | | | 1,205,446 | | | | 917,538 | | | | 8,133,663 | | | | | | | | 644,506 | | | | 0 | |
Wells Fargo Large Cap Growth Fund Class R6 | | | 12,787,291 | | | | 200,715 | | | | (7,005,936 | ) | | | 5,075,090 | | | | (2,989,710 | ) | | | 8,067,450 | | | | | | | | 141,883 | | | | 0 | |
| | | | | | | | | |
| | | | | | | | | | | | | | | | | | | | | | | 36,740,724 | | | | 6.68 | | | | | | | | | |
| | | | | | | | | | | | | | | | | | | | | | | | | | | | | | | | | | | | |
Short-Term Investments | | | | | | | | | | | | | | | | | | | | | | | | | | | | | | | | | | | | |
Investment Companies | | | | | | | | | | | | | | | | | | | | | | | | | | | | | | | | | | | | |
Wells Fargo Government Money Market Fund Select Class | | | 2,350,179 | | | | 60,962,820 | | | | (60,660,869 | ) | | | 0 | | | | 0 | | | | 2,652,130 | | | | 0.48 | | | | 2,652,130 | | | | 998 | |
| | | | | | | | | | | | | | | | | | | | | | | | | | | | | | | | | | | | |
| | | | | | | | | | | | | | $ | 5,070,011 | | | $ | 3,498,249 | | | $ | 116,163,570 | | | | 21.13 | % | | | | | | $ | 1,201,319 | |
| | | | | | | | | | | | | | | | | | | | | | | | | | | | | | | | | | | | |
| † | Non-income-earning security |
The accompanying notes are an integral part of these financial statements.
Wells Fargo Multi-Asset Funds | 31
Portfolio of investments—November 30, 2020 (unaudited)
WELLS FARGO SPECTRUM MODERATE GROWTH FUND
Transactions with the affiliated Master Portfolios were as follows:
| | | | | | | | | | | | | | | | | | | | | | | | | | | | | | | | | | | | |
| | | % of
ownership,
beginning
of period | | | % of
ownership,
end of
period | | | Net realized
gains
(losses) on
securities
transactions
allocated
from
affiliated
Master
Portfolios | | | Net
change in
unrealized
gains
(losses) on
securities
transactions
allocated
from
affiliated
Master
Portfolios | | | Dividends
allocated
from
affiliated
Master
Portfolios | | | Affiliated
income
allocated
from
affiliated
Master
Portfolios | | | Interest
allocated
from
affiliated
Master
Portfolios | | | Value,
end
of period | | | % of
net
assets | |
Wells Fargo Bloomberg Barclays US Aggregate ex-Corporate Portfolio | | | 7.53 | % | | | 7.14 | % | | $ | 494,649 | | | $ | (548,571 | ) | | $ | 0 | | | $ | 999 | | | $ | 345,846 | | | $ | 41,592,326 | | | | | |
Wells Fargo Core Bond Portfolio | | | 0.94 | | | | 0.66 | | | | 1,345,966 | | | | (130,631 | ) | | | 0 | | | | 1,206 | | | | 493,917 | | | | 40,053,706 | | | | | |
Wells Fargo Disciplined Large Cap Portfolio | | | 28.30 | | | | 28.77 | | | | 1,239,644 | | | | 14,489,738 | | | | 791,834 | | | | 4,195 | | | | 68 | | | | 90,319,769 | | | | | |
Wells Fargo Emerging Growth Portfolio | | | 1.38 | | | | 0.32 | | | | 1,371,451 | | | | 1,038,589 | | | | 7,249 | | | | 1,232 | | | | 0 | | | | 2,741,474 | | | | | |
Wells Fargo Factor Enhanced Emerging Markets Equity Portfolio | | | 7.64 | | | | 5.87 | | | | 114,827 | | | | 2,907,498 | | | | 232,787 | | | | 113 | | | | 0 | | | | 11,822,111 | | | | | |
Wells Fargo Factor Enhanced International Equity Portfolio | | | 7.08 | | | | 7.36 | | | | 1,681,474 | | | | 6,171,697 | | | | 451,446 | | | | 365 | | | | 0 | | | | 50,749,521 | | | | | |
Wells Fargo Factor Enhanced U.S. Large Cap Equity Portfolio | | | 7.00 | | | | 5.17 | | | | 5,476,366 | | | | 981,412 | | | | 482,445 | | | | 499 | | | | 0 | | | | 47,494,727 | | | | | |
Wells Fargo Factor Enhanced U.S. Small Cap Equity Portfolio | | | 6.09 | | | | 6.80 | | | | 55,146 | | | | 3,603,001 | | | | 94,864 | | | | 119 | | | | 12 | | | | 16,554,945 | | | | | |
Wells Fargo High Yield Bond Portfolio | | | 2.06 | | | | 9.71 | | | | 374,782 | | | | (87,280 | ) | | | 0 | | | | 17 | | | | 113,526 | | | | 4,824,582 | | | | | |
Wells Fargo Real Return Portfolio | | | 6.33 | | | | 15.70 | | | | 174,539 | | | | 800,870 | | | | 23,902 | | | | 83 | | | | 153,949 | | | | 34,189,837 | | | | | |
Wells Fargo Small Company Value Portfolio | | | 1.39 | | | | 0.60 | | | | 12,384 | | | | 975,287 | | | | 54,317 | | | | 361 | | | | 0 | | | | 2,752,547 | | | | | |
Wells Fargo Strategic Retirement Bond Portfolio | | | 0.00 | | | | 22.66 | | | | 182,210 | | | | (556,804 | ) | | | 0 | | | | 0 | | | | 22,149 | | | | 34,160,701 | | | | | |
| | | | | | | | | | | | | | | | | | | | | | | | | | | | | | | | | | | | |
| | | | | | | | | | $ | 12,523,438 | | | $ | 29,644,806 | | | $ | 2,138,844 | | | $ | 9,189 | | | $ | 1,129,467 | | | $ | 377,256,246 | | | | 68.62 | % |
| | | | | | | | | | | | | | | | | | | | | | | | | | | | | | | | | | | | |
The accompanying notes are an integral part of these financial statements.
32 | Wells Fargo Multi-Asset Funds
Statements of assets and liabilities—November 30, 2020 (unaudited)
| | | | | | | | |
| | | Spectrum
Aggressive
Growth Fund | | | Spectrum
Conservative
Growth Fund | |
| | |
Assets | | | | | | | | |
Investments in affiliated Master Portfolios, at value (see cost below) | | $ | 337,621,075 | | | $ | 254,658,960 | |
Investments in unaffiliated Underlying Funds, at value (see cost below) | | | 25,457,407 | | | | 37,544,394 | |
Investments in affiliated Underlying Funds, at value (see cost below) | | | 42,913,546 | | | | 88,219,101 | |
Cash | | | 32,048 | | | | 0 | |
Segregated cash for futures contracts | | | 7,967,406 | | | | 6,748,611 | |
Receivable for investments sold | | | 0 | | | | 86,247 | |
Receivable for Fund shares sold | | | 126,664 | | | | 34,524 | |
Receivable for dividends | | | 0 | | | | 32,838 | |
Prepaid expenses and other assets | | | 58,178 | | | | 108,527 | |
| | | | |
Total assets | | | 414,176,324 | | | | 387,433,202 | |
| | | | |
| | |
Liabilities | | | | | | | | |
Payable for investments purchased | | | 16,564 | | | | 34,498 | |
Payable for Fund shares redeemed | | | 340,832 | | | | 385,345 | |
Payable for daily variation margin on open futures contracts | | | 486,689 | | | | 460,050 | |
Overdraft due to custodian bank | | | 0 | | | | 79,705 | |
Management fee payable | | | 79,283 | | | | 72,340 | |
Administration fees payable | | | 69,614 | | | | 65,942 | |
Distribution fee payable | | | 214,105 | | | | 211,366 | |
Shareholder servicing fees payable | | | 82,450 | | | | 78,161 | |
Accrued expenses and other liabilities | | | 18,768 | | | | 0 | |
| | | | |
Total liabilities | | | 1,308,305 | | | | 1,387,407 | |
| | | | |
Total net assets | | $ | 412,868,019 | | | $ | 386,045,795 | |
| | | | |
| | |
Net assets consist of | | | | | | | | |
Paid-in capital | | $ | 292,367,629 | | | $ | 325,546,590 | |
Total distributable earnings | | | 120,500,390 | | | | 60,499,205 | |
| | | | |
Total net assets | | $ | 412,868,019 | | | $ | 386,045,795 | |
| | | | |
| | |
Computation of net asset value and offering price per share | | | | | | | | |
Net assets – Class A | | $ | 56,212,317 | | | $ | 38,402,925 | |
Shares outstanding – Class A1 | | | 2,561,250 | | | | 3,256,678 | |
Net asset value per share – Class A | | | $21.95 | | | | $11.79 | |
Maximum offering price per share – Class A2 | | | $23.29 | | | | $12.51 | |
Net assets – Class C | | $ | 353,208,391 | | | $ | 344,775,541 | |
Shares outstanding – Class C1 | | | 16,263,194 | | | | 28,628,914 | |
Net asset value per share – Class C | | | $21.72 | | | | $12.04 | |
Net assets – Institutional Class | | $ | 3,447,311 | | | $ | 2,867,329 | |
Shares outstanding – Institutional Class1 | | | 156,549 | | | | 242,595 | |
Net asset value per share – Institutional Class | | | $22.02 | | | | $11.82 | |
| | |
Investments in affiliated Master Portfolios, at cost | | $ | 284,072,747 | | | $ | 234,160,073 | |
| | | | |
Investments in unaffiliated Underlying Funds, at cost | | $ | 20,283,213 | | | $ | 33,154,135 | |
| | | | |
Investments in affiliated Underlying Funds, at cost | | $ | 31,465,012 | | | $ | 84,012,495 | |
| | | | |
| 1 | Each Fund has an unlimited number of authorized shares. |
| 2 | Maximum offering price is computed as 100/94.25 of net asset value. On investments of $50,000 or more, the offering price is reduced. |
The accompanying notes are an integral part of these financial statements.
Wells Fargo Multi-Asset Funds | 33
Statements of assets and liabilities—November 30, 2020 (unaudited)
| | | | | | | | | | | | |
| | | Spectrum
Growth Fund | | | Spectrum Income
Allocation Fund | | | Spectrum Moderate
Growth Fund | |
| | | |
Assets | | | | | | | | | | | | |
Investments in affiliated Master Portfolios, at value (see cost below) | | $ | 192,901,707 | | | $ | 168,303,140 | | | $ | 377,256,246 | |
Investments in unaffiliated Underlying Funds, at value (see cost below) | | | 28,131,351 | | | | 19,583,421 | | | | 48,090,393 | |
Investments in affiliated Underlying Funds, at value (see cost below) | | | 62,632,264 | | | | 43,692,962 | | | | 116,163,570 | |
Segregated cash for futures contracts | | | 5,347,589 | | | | 3,999,824 | | | | 9,887,293 | |
Receivable for investments sold | | | 93,756 | | | | 191,024 | | | | 17,594 | |
Receivable for Fund shares sold | | | 46,094 | | | | 83,444 | | | | 114,909 | |
Receivable for dividends | | | 32,176 | | | | 13,653 | | | | 38,532 | |
Prepaid expenses and other assets | | | 107,777 | | | | 66,313 | | | | 15,098 | |
| | | | |
Total assets | | | 289,292,714 | | | | 235,933,781 | | | | 551,583,635 | |
| | | | |
| | | |
Liabilities | | | | | | | | | | | | |
Payable for investments purchased | | | 33,465 | | | | 14,527 | | | | 40,361 | |
Payable for Fund shares redeemed | | | 73,574 | | | | 244,279 | | | | 444,601 | |
Payable for daily variation margin on open futures contracts | | | 340,801 | | | | 281,341 | | | | 649,421 | |
Overdraft due to custodian bank | | | 84,643 | | | | 189,023 | | | | 4,058 | |
Management fee payable | | | 50,055 | | | | 38,565 | | | | 110,279 | |
Administration fees payable | | | 48,946 | | | | 40,468 | | | | 93,643 | |
Distribution fee payable | | | 156,580 | | | | 129,402 | | | | 302,145 | |
Shareholder servicing fees payable | | | 58,034 | | | | 48,101 | | | | 111,305 | |
Accrued expenses and other liabilities | | | 0 | | | | 15,887 | | | | 62,947 | |
| | | | |
Total liabilities | | | 846,098 | | | | 1,001,593 | | | | 1,818,760 | |
| | | | |
Total net assets | | $ | 288,446,616 | | | $ | 234,932,188 | | | $ | 549,764,875 | |
| | | | |
| | | |
Net assets consist of | | | | | | | | | | | | |
Paid-in capital | | $ | 221,530,753 | | | $ | 209,785,641 | | | $ | 438,606,913 | |
Total distributable earnings | | | 66,915,863 | | | | 25,146,547 | | | | 111,157,962 | |
| | | | |
Total net assets | | $ | 288,446,616 | | | $ | 234,932,188 | | | $ | 549,764,875 | |
| | | | |
| | | |
Computation of net asset value and offering price per share | | | | | | | | | | | | |
Net assets – Class A | | $ | 29,056,150 | | | $ | 24,730,596 | | | $ | 52,899,859 | |
Shares outstanding – Class A1 | | | 2,013,985 | | | | 2,275,218 | | | | 3,761,830 | |
Net asset value per share – Class A | | | $14.43 | | | | $10.87 | | | | $14.06 | |
Maximum offering price per share – Class A2 | | | $15.31 | | | | $11.53 | | | | $14.92 | |
Net assets – Class C | | $ | 257,522,245 | | | $ | 209,574,364 | | | $ | 495,475,715 | |
Shares outstanding – Class C1 | | | 17,558,176 | | | | 19,299,252 | | | | 34,690,850 | |
Net asset value per share – Class C | | | $14.67 | | | | $10.86 | | | | $14.28 | |
Net assets – Institutional Class | | $ | 1,868,221 | | | $ | 627,228 | | | $ | 1,389,301 | |
Shares outstanding – Institutional Class1 | | | 129,324 | | | | 57,801 | | | | 98,600 | |
Net asset value per share – Institutional Class | | | $14.45 | | | | $10.85 | | | | $14.09 | |
| | | |
Investments in affiliated Master Portfolios, at cost | | $ | 165,727,130 | | | $ | 159,961,012 | | | $ | 335,315,891 | |
| | | | |
Investments in unaffiliated Underlying Funds, at cost | | $ | 24,669,433 | | | $ | 17,872,016 | | | $ | 43,213,613 | |
| | | | |
Investments in affiliated Underlying Funds, at cost | | $ | 58,039,968 | | | $ | 41,870,756 | | | $ | 109,282,514 | |
| | | | |
| 1 | Each Fund has an unlimited number of authorized shares. |
| 2 | Maximum offering price is computed as 100/94.25 of net asset value. On investments of $50,000 or more, the offering price is reduced. |
The accompanying notes are an integral part of these financial statements.
34 | Wells Fargo Multi-Asset Funds
Statements of operations—six months ended November 30, 2020 (unaudited)
| | | | | | | | |
| | | Spectrum
Aggressive
Growth
Fund | | | Spectrum
Conservative
Growth Fund | |
| | |
Investment income | | | | | | | | |
Dividends allocated from affiliated Master Portfolios* | | $ | 2,587,388 | | | $ | 1,005,818 | |
Dividends from unaffiliated Underlying Funds | | | 439,860 | | | | 331,058 | |
Affiliated income allocated from affiliated Master Portfolios | | | 8,328 | | | | 5,788 | |
Dividends from affiliated Underlying Funds | | | 936 | | | | 1,273,238 | |
Interest allocated from affiliated Master Portfolios | | | 378 | | | | 1,272,609 | |
Expenses allocated from affiliated Master Portfolios | | | (387,175 | ) | | | (324,214 | ) |
Waivers allocated from affiliated Master Portfolios | | | 59,840 | | | | 34,994 | |
| | | | |
Total investment income | | | 2,709,555 | | | | 3,599,291 | |
| | | | |
| | |
Expenses | | | | | | | | |
Management fee | | | 491,321 | | | | 479,637 | |
Administration fees | | | | | | | | |
Class A | | | 51,681 | | | | 36,059 | |
Class C | | | 357,932 | | | | 363,957 | |
Institutional Class | | | 1,917 | | | | 1,782 | |
Shareholder servicing fees | |
Class A | | | 61,435 | | | | 42,899 | |
Class C | | | 425,297 | | | | 432,682 | |
Distribution fee | |
Class C | | | 1,273,120 | | | | 1,297,252 | |
Custody and accounting fees | | | 19,252 | | | | 25,569 | |
Professional fees | | | 17,046 | | | | 17,065 | |
Registration fees | | | 26,348 | | | | 29,404 | |
Shareholder report expenses | | | 25,064 | | | | 26,065 | |
Trustees’ fees and expenses | | | 11,029 | | | | 11,029 | |
Other fees and expenses | | | 6,456 | | | | 6,567 | |
| | | | |
Total expenses | | | 2,767,898 | | | | 2,769,967 | |
Less: Fee waivers and/or expense reimbursements | | | | | | | | |
Fund-level | | | (21,633 | ) | | | (37,353 | ) |
Class A | | | (4 | ) | | | (12 | ) |
Class C | | | 0 | | | | (38 | ) |
Institutional Class | | | (138 | ) | | | 0 | |
| | | | |
Net expenses | | | 2,746,123 | | | | 2,732,564 | |
| | | | |
Net investment income (loss) | | | (36,568 | ) | | | 866,727 | |
| | | | |
| | |
Realized and unrealized gains (losses) on investments | | | | | | | | |
Net realized gains (losses) on | |
Securities transactions allocated from affiliated Master Portfolios | | | 11,056,897 | | | | 6,089,895 | |
Unaffiliated Underlying Funds | | | 8,522,133 | | | | 2,938,438 | |
Affiliated Underlying Funds | | | 596,656 | | | | (29,373 | ) |
Futures contracts | | | (4,012,687 | ) | | | 2,257,650 | |
| | | | |
Net realized gains on investments | | | 16,162,999 | | | | 11,256,610 | |
| | | | |
| | |
Net change in unrealized gains (losses) on | | | | | | | | |
Securities transactions allocated from affiliated Master Portfolios | | | 40,718,879 | | | | 13,018,630 | |
Unaffiliated Underlying Funds | | | (783,154 | ) | | | 1,648,739 | |
Affiliated Underlying Funds | | | 7,173,468 | | | | 5,789,070 | |
Futures contracts | | | 893,931 | | | | (2,291,116 | ) |
| | | | |
Net change in unrealized gains (losses) on investments | | | 48,003,124 | | | | 18,165,323 | |
| | | | |
Net realized and unrealized gains (losses) on investments | | | 64,166,123 | | | | 29,421,933 | |
| | | | |
Net increase in net assets resulting from operations | | $ | 64,129,555 | | | $ | 30,288,660 | |
| | | | |
| | |
* Net of foreign withholding taxes allocated from affiliated Master Portfolios in the amount of | | | $103,078 | | | | $38,654 | |
The accompanying notes are an integral part of these financial statements.
Wells Fargo Multi-Asset Funds | 35
Statements of operations—six months ended November 30, 2020 (unaudited)
| | | | | | | | | | | | |
| | | Spectrum
Growth Fund | | | Spectrum
Income
Allocation
Fund | | | Spectrum
Moderate
Growth
Fund | |
| | | |
Investment income | | | | | | | | | | | | |
Dividends allocated from affiliated Master Portfolios* | | $ | 1,438,524 | | | $ | 301,175 | | | $ | 2,138,844 | |
Dividends from unaffiliated Underlying Funds | | | 306,054 | | | | 194,057 | | | | 524,239 | |
Affiliated income allocated from affiliated Master Portfolios | | | 5,112 | | | | 3,162 | | | | 9,189 | |
Dividends from affiliated Underlying Funds | | | 353,768 | | | | 998,757 | | | | 1,201,319 | |
Interest allocated from affiliated Master Portfolios | | | 255,505 | | | | 1,094,745 | | | | 1,129,467 | |
Expenses allocated from affiliated Master Portfolios | | | (252,710 | ) | | | (195,674 | ) | | | (475,933 | ) |
Waivers allocated from affiliated Master Portfolios | | | 36,795 | | | | 16,402 | | | | 60,477 | |
| | | | |
Total investment income | | | 2,143,048 | | | | 2,412,624 | | | | 4,587,602 | |
| | | | |
| | | |
Expenses | | | | | | | | | | | | |
Management fee | | | 351,986 | | | | 297,564 | | | | 677,547 | |
Administration fees | | | | | | | | | | | | |
Class A | | | 28,605 | | | | 23,992 | | | | 51,808 | |
Class C | | | 265,170 | | | | 225,288 | | | | 515,621 | |
Institutional Class | | | 1,172 | | | | 417 | | | | 1,059 | |
Shareholder servicing fees | | | | | |
Class A | | | 34,029 | | | | 28,562 | | | | 61,611 | |
Class C | | | 315,095 | | | | 268,133 | | | | 612,925 | |
Distribution fee | | | | | |
Class C | | | 943,597 | | | | 803,602 | | | | 1,837,316 | |
Custody and accounting fees | | | 20,053 | | | | 25,744 | | | | 26,070 | |
Professional fees | | | 17,284 | | | | 16,545 | | | | 17,284 | |
Registration fees | | | 29,079 | | | | 24,363 | | | | 27,574 | |
Shareholder report expenses | | | 25,009 | | | | 21,382 | | | | 27,265 | |
Trustees’ fees and expenses | | | 11,029 | | | | 11,029 | | | | 11,029 | |
Other fees and expenses | | | 5,550 | | | | 6,916 | | | | 7,655 | |
| | | | |
Total expenses | | | 2,047,658 | | | | 1,753,537 | | | | 3,874,764 | |
Less: Fee waivers and/or expense reimbursements | | | | | | | | | | | | |
Fund-level | | | (48,658 | ) | | | (57,919 | ) | | | (7,067 | ) |
Class A | | | (76 | ) | | | (12 | ) | | | (15 | ) |
Class C | | | (94 | ) | | | (35 | ) | | | (63 | ) |
Institutional Class | | | 0 | | | | 0 | | | | (41 | ) |
| | | | |
Net expenses | | | 1,998,830 | | | | 1,695,571 | | | | 3,867,578 | |
| | | | |
Net investment income | | | 144,218 | | | | 717,053 | | | | 720,024 | |
| | | | |
| | | |
Realized and unrealized gains (losses) on investments | | | | | | | | | | | | |
Net realized gains (losses) on | | | | | |
Securities transactions allocated from affiliated Master Portfolios | | | 6,475,198 | | | | 2,787,342 | | | | 12,523,438 | |
Unaffiliated Underlying Funds | | | 4,661,077 | | | | 1,263,034 | | | | 7,760,319 | |
Affiliated Underlying Funds | | | 186,157 | | | | (33,782 | ) | | | 5,070,011 | |
Futures contracts | | | 305,136 | | | | 1,975,280 | | | | (76,018 | ) |
| | | | |
Net realized gains on investments | | | 11,627,568 | | | | 5,991,874 | | | | 25,277,750 | |
| | | | |
| | | |
Net change in unrealized gains (losses) on | | | | | | | | | | | | |
Securities transactions allocated from affiliated Master Portfolios | | | 19,336,049 | | | | 3,018,344 | | | | 29,644,806 | |
Unaffiliated Underlying Funds | | | 363,944 | | | | 489,497 | | | | (142,848 | ) |
Affiliated Underlying Funds | | | 4,748,283 | | | | 2,994,466 | | | | 3,498,249 | |
Futures contracts | | | (1,541,247 | ) | | | (1,451,249 | ) | | | (2,886,063 | ) |
| | | | |
Net change in unrealized gains (losses) on investments | | | 22,907,029 | | | | 5,051,058 | | | | 30,114,144 | |
| | | | |
Net realized and unrealized gains (losses) on investments | | | 34,534,597 | | | | 11,042,932 | | | | 55,391,894 | |
| | | | |
Net increase in net assets resulting from operations | | $ | 34,678,815 | | | $ | 11,759,985 | | | $ | 56,111,918 | |
| | | | |
| | | |
* Net of foreign withholding taxes allocated from affiliated Master Portfolios in the amount of | | | $58,832 | | | | $12,523 | | | | $86,491 | |
The accompanying notes are an integral part of these financial statements.
36 | Wells Fargo Multi-Asset Funds
Statements of changes in net assets
| | | | | | | | | | | | | | | | |
| | | Spectrum Aggressive Growth Fund | |
| | | Six months ended
November 30, 2020
(unaudited) | | | Year ended
May 31, 2020 | |
| | | | |
Operations | | | | | | | | | | | | | | | | |
Net investment income (loss) | | | | | | $ | (36,568 | ) | | | | | | $ | 1,639,003 | |
Net realized gains on investments | | | | | | | 16,162,999 | | | | | | | | 24,590,770 | |
Net change in unrealized gains (losses) on investments | | | | | | | 48,003,124 | | | | | | | | 21,688,508 | |
| | | | |
Net increase in net assets resulting from operations | | | | | | | 64,129,555 | | | | | | | | 47,918,281 | |
| | | | |
| | | | |
Distributions to shareholders from net investment income and net realized gains | | | | | | | | | | | | | | | | |
Class A | | | | | | | 0 | | | | | | | | (567,930 | ) |
Class C | | | | | | | 0 | | | | | | | | (1,552,546 | ) |
Institutional Class | | | | | | | 0 | | | | | | | | (29,699 | ) |
| | | | |
Total distributions to shareholders | | | | | | | 0 | | | | | | | | (2,150,175 | ) |
| | | | |
| | | | |
Capital share transactions | | | Shares | | | | | | | | Shares | | | | | |
Proceeds from shares sold | | | | | | | | | | | | | | | | |
Class A | | | 314,330 | | | | 6,463,052 | | | | 298,353 | | | | 5,199,857 | |
Class C | | | 190,055 | | | | 3,796,572 | | | | 359,085 | | | | 6,260,353 | |
Institutional Class | | | 95,561 | | | | 1,915,346 | | | | 160,349 | | | | 2,796,790 | |
| | | | |
| | | | | | | 12,174,970 | | | | | | | | 14,257,000 | |
| | | | |
Reinvestment of distributions | | | | | | | | | | | | | | | | |
Class A | | | 0 | | | | 0 | | | | 30,298 | | | | 567,646 | |
Class C | | | 0 | | | | 0 | | | | 83,857 | | | | 1,551,446 | |
Institutional Class | | | 0 | | | | 0 | | | | 1,565 | | | | 29,353 | |
| | | | |
| | | | | | | 0 | | | | | | | | 2,148,445 | |
| | | | |
Payment for shares redeemed | | | | | | | | | | | | | | | | |
Class A | | | (158,982 | ) | | | (3,186,514 | ) | | | (500,951 | ) | | | (8,818,583 | ) |
Class C | | | (1,478,032 | ) | | | (29,783,360 | ) | | | (4,600,956 | ) | | | (80,224,929 | ) |
Institutional Class | | | (61,553 | ) | | | (1,239,863 | ) | | | (110,171 | ) | | | (1,953,391 | ) |
| | | | |
| | | | | | | (34,209,737 | ) | | | | | | | (90,996,903 | ) |
| | | | |
Net decrease in net assets resulting from capital share transactions | | | | | | | (22,034,767 | ) | | | | | | | (74,591,458 | ) |
| | | | |
Total increase (decrease) in net assets | | | | | | | 42,094,788 | | | | | | | | (28,823,352 | ) |
| | | | |
| | | | |
Net assets | | | | | | | | | | | | | | | | |
Beginning of period | | | | | | | 370,773,231 | | | | | | | | 399,596,583 | |
| | | | |
End of period | | | | | | $ | 412,868,019 | | | | | | | $ | 370,773,231 | |
| | | | |
The accompanying notes are an integral part of these financial statements.
Wells Fargo Multi-Asset Funds | 37
Statements of changes in net assets
| | | | | | | | | | | | | | | | |
| | | Spectrum Conservative Growth Fund | |
| | | Six months ended
November 30, 2020
(unaudited) | | | Year ended
May 31, 2020 | |
| | | | |
Operations | | | | | | | | | | | | | | | | |
Net investment income | | | | | | $ | 866,727 | | | | | | | $ | 3,179,134 | |
Net realized gains on investments | | | | | | | 11,256,610 | | | | | | | | 15,599,553 | |
Net change in unrealized gains (losses) on investments | | | | | | | 18,165,323 | | | | | | | | 13,024,227 | |
| | | | |
Net increase in net assets resulting from operations | | | | | | | 30,288,660 | | | | | | | | 31,802,914 | |
| | | | |
| | | | |
Distributions to shareholders from net investment income and net realized gains | | | | | | | | | | | | | | | | |
Class A | | | | | | | (193,130 | ) | | | | | | | (890,327 | ) |
Class C | | | | | | | (344,561 | ) | | | | | | | (7,430,688 | ) |
Institutional Class | | | | | | | (17,802 | ) | | | | | | | (71,252 | ) |
| | | | |
Total distributions to shareholders | | | | | | | (555,493 | ) | | | | | | | (8,392,267 | ) |
| | | | |
| | | | |
Capital share transactions | | | Shares | | | | | | | | Shares | | | | | |
Proceeds from shares sold | | | | | | | | | | | | | | | | |
Class A | | | 591,161 | | | | 6,772,223 | | | | 495,127 | | | | 5,210,475 | |
Class C | | | 329,675 | | | | 3,846,684 | | | | 635,339 | | | | 6,853,024 | |
Institutional Class | | | 114,744 | | | | 1,316,518 | | | | 478,608 | | | | 5,104,224 | |
| | | | |
| | | | | | | 11,935,425 | | | | | | | | 17,167,723 | |
| | | | |
Reinvestment of distributions | | | | | | | | | | | | | | | | |
Class A | | | 17,119 | | | | 192,421 | | | | 83,080 | | | | 889,538 | |
Class C | | | 29,954 | | | | 344,470 | | | | 677,973 | | | | 7,425,458 | |
Institutional Class | | | 1,565 | | | | 17,627 | | | | 6,589 | | | | 70,517 | |
| | | | |
| | | | | | | 554,518 | | | | | | | | 8,385,513 | |
| | | | |
Payment for shares redeemed | | | | | | | | | | | | | | | | |
Class A | | | (278,197 | ) | | | (3,179,135 | ) | | | (963,431 | ) | | | (10,195,020 | ) |
Class C | | | (2,206,058 | ) | | | (25,762,044 | ) | | | (8,292,697 | ) | | | (89,328,473 | ) |
Institutional Class | | | (118,502 | ) | | | (1,360,705 | ) | | | (416,582 | ) | | | (4,444,469 | ) |
| | | | |
| | | | | | | (30,301,884 | ) | | | | | | | (103,967,962 | ) |
| | | | |
Net decrease in net assets resulting from capital share transactions | | | | | | | (17,811,941 | ) | | | | | | | (78,414,726 | ) |
| | | | |
Total increase (decrease) in net assets | | | | | | | 11,921,226 | | | | | | | | (55,004,079 | ) |
| | | | |
| | | | |
Net assets | | | | | | | | | | | | | | | | |
Beginning of period | | | | | | | 374,124,569 | | | | | | | | 429,128,648 | |
| | | | |
End of period | | | | | | $ | 386,045,795 | | | | | | | $ | 374,124,569 | |
| | | | |
The accompanying notes are an integral part of these financial statements.
38 | Wells Fargo Multi-Asset Funds
Statements of changes in net assets
| | | | | | | | | | | | | | | | |
| | | Spectrum Growth Fund | |
| | | Six months ended
November 30, 2020 (unaudited) | | | Year ended
May 31, 2020 | |
| | | | |
Operations | | | | | | | | | | | | | | | | |
Net investment income | | | | | | $ | 144,218 | | | | | | | $ | 1,302,605 | |
Net realized gains on investments | | | | | | | 11,627,568 | | | | | | | | 13,023,850 | |
Net change in unrealized gains (losses) on investments | | | | | | | 22,907,029 | | | | | | | | 13,881,246 | |
| | | | |
Net increase in net assets resulting from operations | | | | | | | 34,678,815 | | | | | | | | 28,207,701 | |
| | | | |
| | | | |
Distributions to shareholders from net investment income and net realized gains | | | | | | | | | | | | | | | | |
Class A | | | | | | | 0 | | | | | | | | (354,829 | ) |
Class C | | | | | | | 0 | | | | | | | | (1,568,479 | ) |
Institutional Class | | | | | | | 0 | | | | | | | | (19,520 | ) |
| | | | |
Total distributions to shareholders | | | | | | | 0 | | | | | | | | (1,942,828 | ) |
| | | | |
| | | | |
Capital share transactions | | | Shares | | | | | | | | Shares | | | | | |
Proceeds from shares sold | | | | | | | | | | | | | | | | |
Class A | | | 152,164 | | | | 2,067,524 | | | | 328,720 | | | | 4,010,239 | |
Class C | | | 274,510 | | | | 3,800,589 | | | | 732,564 | | | | 9,057,872 | |
Institutional Class | | | 199,482 | | | | 2,735,852 | | | | 255,491 | | | | 3,119,078 | |
| | | | |
| | | | | | | 8,603,965 | | | | | | | | 16,187,189 | |
| | | | |
Reinvestment of distributions | | | | | | | | | | | | | | | | |
Class A | | | 0 | | | | 0 | | | | 27,608 | | | | 352,213 | |
Class C | | | 0 | | | | 0 | | | | 120,114 | | | | 1,566,754 | |
Institutional Class | | | 0 | | | | 0 | | | | 1,501 | | | | 19,123 | |
| | | | |
| | | | | | | 0 | | | | | | | | 1,938,090 | |
| | | | |
Payment for shares redeemed | | | | | | | | | | | | | | | | |
Class A | | | (113,501 | ) | | | (1,549,828 | ) | | | (405,547 | ) | | | (4,933,473 | ) |
Class C | | | (1,388,538 | ) | | | (19,305,421 | ) | | | (4,402,354 | ) | | | (54,313,865 | ) |
Institutional Class | | | (150,140 | ) | | | (2,066,094 | ) | | | (237,408 | ) | | | (2,898,904 | ) |
| | | | |
| | | | | | | (22,921,343 | ) | | | | | | | (62,146,242 | ) |
| | | | |
Net decrease in net assets resulting from capital share transactions | | | | | | | (14,317,378 | ) | | | | | | | (44,020,963 | ) |
| | | | |
Total increase (decrease) in net assets | | | | | | | 20,361,437 | | | | | | | | (17,756,090 | ) |
| | | | |
| | | | |
Net assets | | | | | | | | | | | | | | | | |
Beginning of period | | | | | | | 268,085,179 | | | | | | | | 285,841,269 | |
| | | | |
End of period | | | | | | $ | 288,446,616 | | | | | | | $ | 268,085,179 | |
| | | | |
The accompanying notes are an integral part of these financial statements.
Wells Fargo Multi-Asset Funds | 39
Statements of changes in net assets
| | | | | | | | | | | | | | | | |
| | | Spectrum Income Allocation Fund | |
| | | Six months ended
November 30, 2020
(unaudited) | | | Year ended
May 31, 2020 | |
| | | | |
Operations | | | | | | | | | | | | | | | | |
Net investment income | | | | | | $ | 717,053 | | | | | | | $ | 2,265,590 | |
Net realized gains on investments | | | | | | | 5,991,874 | | | | | | | | 7,022,927 | |
Net change in unrealized gains (losses) on investments | | | | | | | 5,051,058 | | | | | | | | 7,306,614 | |
| | | | |
Net increase in net assets resulting from operations | | | | | | | 11,759,985 | | | | | | | | 16,595,131 | |
| | | | |
| | | | |
Distributions to shareholders from net investment income and net realized gains | | | | | | | | | | | | | | | | |
Class A | | | | | | | (206,571 | ) | | | | | | | (296,807 | ) |
Class C | | | | | | | (491,662 | ) | | | | | | | (2,755,368 | ) |
Institutional Class | | | | | | | (7,385 | ) | | | | | | | (12,973 | ) |
| | | | |
Total distributions to shareholders | | | | | | | (705,618 | ) | | | | | | | (3,065,148 | ) |
| | | | |
| | | | |
Capital share transactions | | | Shares | | | | | | | | Shares | | | | | |
Proceeds from shares sold | | | | | | | | | | | | | | | | |
Class A | | | 473,867 | | | | 5,078,219 | | | | 784,255 | | | | 7,929,477 | |
Class C | | | 251,415 | | | | 2,685,756 | | | | 1,484,720 | | | | 14,624,150 | |
Institutional Class | | | 36,037 | | | | 385,415 | | | | 154,637 | | | | 1,542,234 | |
| | | | |
| | | | | | | 8,149,390 | | | | | | | | 24,095,861 | |
| | | | |
Reinvestment of distributions | | | | | | | | | | | | | | | | |
Class A | | | 19,127 | | | | 206,307 | | | | 29,412 | | | | 296,366 | |
Class C | | | 45,556 | | | | 490,641 | | | | 271,115 | | | | 2,729,197 | |
Institutional Class | | | 657 | | | | 7,078 | | | | 1,242 | | | | 12,499 | |
| | | | |
| | | | | | | 704,026 | | | | | | | | 3,038,062 | |
| | | | |
Payment for shares redeemed | | | | | | | | | | | | | | | | |
Class A | | | (261,312 | ) | | | (2,794,263 | ) | | | (424,008 | ) | | | (4,271,019 | ) |
Class C | | | (1,504,432 | ) | | | (16,108,284 | ) | | | (5,428,685 | ) | | | (54,474,256 | ) |
Institutional Class | | | (47,188 | ) | | | (503,634 | ) | | | (131,864 | ) | | | (1,316,978 | ) |
| | | | |
| | | | | | | (19,406,181 | ) | | | | | | | (60,062,253 | ) |
| | | | |
Net decrease in net assets resulting from capital share transactions | | | | | | | (10,552,765 | ) | | | | | | | (32,928,330 | ) |
| | | | |
Total increase (decrease) in net assets | | | | | | | 501,602 | | | | | | | | (19,398,347 | ) |
| | | | |
| | | | |
Net assets | | | | | | | | | | | | | | | | |
Beginning of period | | | | | | | 234,430,586 | | | | | | | | 253,828,933 | |
| | | | |
End of period | | | | | | $ | 234,932,188 | | | | | | | $ | 234,430,586 | |
| | | | |
The accompanying notes are an integral part of these financial statements.
40 | Wells Fargo Multi-Asset Funds
Statements of changes in net assets
| | | | | | | | | | | | | | | | |
| | | Spectrum Moderate Growth Fund | |
| | | Six months ended
November 30, 2020 (unaudited) | | | Year ended
May 31, 2020 | |
| | | | |
Operations | | | | | | | | | | | | | | | | |
Net investment income | | | | | | $ | 720,024 | | | | | | | $ | 3,517,264 | |
Net realized gains on investments | | | | | | | 25,277,750 | | | | | | | | 19,877,805 | |
Net change in unrealized gains (losses) on investments | | | | | | | 30,114,144 | | | | | | | | 28,068,408 | |
| | | | |
Net increase in net assets resulting from operations | | | | | | | 56,111,918 | | | | | | | | 51,463,477 | |
| | | | |
| | | | |
Distributions to shareholders from net investment income and net realized gains | | | | | | | | | | | | | | | | |
Class A | | | | | | | 0 | | | | | | | | (813,632 | ) |
Class C | | | | | | | 0 | | | | | | | | (4,579,863 | ) |
Institutional Class | | | | | | | 0 | | | | | | | | (28,805 | ) |
| | | | |
Total distributions to shareholders | | | | | | | 0 | | | | | | | | (5,422,300 | ) |
| | | | |
| | | | |
Capital share transactions | | | Shares | | | | | | | | Shares | | | | | |
Proceeds from shares sold | | | | | | | | | | | | | | | | |
Class A | | | 439,058 | | | | 5,869,427 | | | | 470,169 | | | | 5,729,591 | |
Class C | | | 285,386 | | | | 3,902,454 | | | | 736,920 | | | | 9,120,542 | |
Institutional Class | | | 148,077 | | | | 1,997,631 | | | | 450,633 | | | | 5,535,084 | |
| | | | |
| | | | | | | 11,769,512 | | | | | | | | 20,385,217 | |
| | | | |
Reinvestment of distributions | | | | | | | | | | | | | | | | |
Class A | | | 0 | | | | 0 | | | | 64,744 | | | | 813,231 | |
Class C | | | 0 | | | | 0 | | | | 356,445 | | | | 4,574,503 | |
Institutional Class | | | 0 | | | | 0 | | | | 2,256 | | | | 28,316 | |
| | | | |
| | | | | | | 0 | | | | | | | | 5,416,050 | |
| | | | |
Payment for shares redeemed | | | | | | | | | | | | | | | | |
Class A | | | (328,271 | ) | | | (4,391,791 | ) | | | (867,171 | ) | | | (10,544,636 | ) |
Class C | | | (2,721,526 | ) | | | (37,078,790 | ) | | | (9,473,999 | ) | | | (117,217,925 | ) |
Institutional Class | | | (203,356 | ) | | | (2,722,323 | ) | | | (390,561 | ) | | | (4,802,340 | ) |
| | | | |
| | | | | | | (44,192,904 | ) | | | | | | | (132,564,901 | ) |
| | | | |
Net decrease in net assets resulting from capital share transactions | | | | | | | (32,423,392 | ) | | | | | | | (106,763,634 | ) |
| | | | |
Total increase (decrease) in net assets | | | | | | | 23,688,526 | | | | | | | | (60,722,457 | ) |
| | | | |
| | | | |
Net assets | | | | | | | | | | | | | | | | |
Beginning of period | | | | | | | 526,076,349 | | | | | | | | 586,798,806 | |
| | | | |
End of period | | | | | | $ | 549,764,875 | | | | | | | $ | 526,076,349 | |
| | | | |
The accompanying notes are an integral part of these financial statements.
Wells Fargo Multi-Asset Funds | 41
Financial highlights
| | | | | | | | | | | | | | | | | | | | | | | | |
| | | Beginning
net asset
value per
share | | | Net
investment
income
(loss) | | | Net realized
and unrealized
gains (losses)
on investments | | | Distributions
from net
investment
income | | | Distributions
from net
realized
gains | | | Ending
net asset
value per
share | |
| | | | | | |
Spectrum Aggressive Growth Fund | | | | | | | | | | | | | | | | | | | | | | | | |
| | | | | | |
Class A | | | | | | | | | | | | | | | | | | | | | | | | |
Six months ended November 30, 2020 (unaudited) | | $ | 18.59 | | | | 0.07 | | | | 3.29 | | | | 0.00 | | | | 0.00 | | | $ | 21.95 | |
Year ended May 31, 2020 | | $ | 16.52 | | | | 0.19 | | | | 2.11 | | | | (0.19 | ) | | | (0.04 | ) | | $ | 18.59 | |
Year ended May 31, 2019 | | $ | 20.55 | | | | 0.17 | 4 | | | (0.81 | ) | | | (0.26 | ) | | | (3.13 | ) | | $ | 16.52 | |
Year ended May 31, 2018 | | $ | 21.41 | | | | 0.10 | | | | 2.59 | | | | 0.00 | | | | (3.55 | ) | | $ | 20.55 | |
Year ended May 31, 20175 | | $ | 20.15 | | | | (0.02 | )4 | | | 1.28 | | | | 0.00 | | | | 0.00 | | | $ | 21.41 | |
| | | | | | |
Class C6 | | | | | | | | | | | | | | | | | | | | | | | | |
Six months ended November 30, 2020 (unaudited) | | $ | 18.45 | | | | (0.01 | ) | | | 3.28 | | | | 0.00 | | | | 0.00 | | | $ | 21.72 | |
Year ended May 31, 2020 | | $ | 16.39 | | | | 0.07 | | | | 2.07 | | | | (0.04 | ) | | | (0.04 | ) | | $ | 18.45 | |
Year ended May 31, 2019 | | $ | 20.33 | | | | 0.06 | | | | (0.82 | ) | | | (0.05 | ) | | | (3.13 | ) | | $ | 16.39 | |
Year ended May 31, 2018 | | $ | 21.36 | | | | (0.02 | )4 | | | 2.54 | | | | 0.00 | | | | (3.55 | ) | | $ | 20.33 | |
Year ended May 31, 2017 | | $ | 18.25 | | | | (0.07 | ) | | | 3.19 | | | | 0.00 | | | | (0.01 | ) | | $ | 21.36 | |
Year ended May 31, 2016 | | $ | 19.44 | | | | (0.08 | ) | | | (1.11 | ) | | | 0.00 | | | | 0.00 | | | $ | 18.25 | |
| | | | | | |
Institutional Class | | | | | | | | | | | | | | | | | | | | | | | | |
Six months ended November 30, 2020 (unaudited) | | $ | 18.62 | | | | 0.10 | 4 | | | 3.30 | | | | 0.00 | | | | 0.00 | | | $ | 22.02 | |
Year ended May 31, 2020 | | $ | 16.55 | | | | 0.29 | | | | 2.07 | | | | (0.25 | ) | | | (0.04 | ) | | $ | 18.62 | |
Year ended May 31, 20197 | | $ | 21.08 | | | | 0.14 | | | | (1.26 | ) | | | (0.28 | ) | | | (3.13 | ) | | $ | 16.55 | |
| 1 | Including net expenses allocated from the affiliated Master Portfolios, the expense ratios would be increased by the following amounts: |
| | | | | | | | | | | | | | | | | | | | | | | | |
| | | Six Months ended
November 30, 2020
(unaudited) | | | Year ended May 31 | |
| | | 2020 | | | 2019 | | | 2018 | | | 2017 | | | 2016 | |
Class A | | | 0.17 | % | | | 0.18 | % | | | 0.18 | % | | | 0.12 | % | | | 0.12 | %5 | | | N/A | |
Class C6 | | | 0.17 | % | | | 0.18 | % | | | 0.18 | % | | | 0.12 | % | | | 0.12 | % | | | 0.12 | % |
Institutional Class | | | 0.17 | % | | | 0.18 | % | | | 0.18 | %7 | | | N/A | | | | N/A | | | | N/A | |
| 2 | Total return calculations do not include any sales charges. Returns for periods of less than one year are not annualized. |
| 3 | Portfolio turnover rate is calculated by multiplying the Fund’s ownership percentage in the respective affiliated Master Portfolio by the corresponding affiliated Master Portfolio’s purchases and sales. These purchases and sales amounts are aggregated with the direct purchases and sales in Underlying Funds and unaffiliated securities and included in the portfolio turnover calculation. |
| 4 | Calculated based upon average shares outstanding |
| 5 | For the period from February 10, 2017 (commencement of class operations) to May 31, 2017 |
| 6 | Effective at the close of business on February 10, 2017, the Fund’s existing share class, WealthBuilder Portfolio shares, was renamed Class C. |
| 7 | For the period from July 31, 2018 (commencement of class operations) to May 31, 2019 |
The accompanying notes are an integral part of these financial statements.
42 | Wells Fargo Multi-Asset Funds
Financial highlights
| | | | | | | | | | | | | | | | | | | | | | |
| Ratio to average net assets (annualized) | | | Total
return2 | | | Portfolio
turnover
rate3 | | | Net assets at
end of period
(000s omitted) | |
Net investment
income (loss) | | | Gross
expenses1 | | | Net
expenses1 | |
| | | | | |
| | | | | | | | | | | | | | | | | | | | | | | |
| | | | | |
| | | | | | | | | | | | | | | | | | | | | | |
| | 0.63 | % | | | 0.76 | % | | | 0.75 | % | | | 18.07 | % | | | 47 | % | | $ | 56,212 | |
| | 1.08 | % | | | 0.77 | % | | | 0.75 | % | | | 13.91 | % | | | 71 | % | | $ | 44,714 | |
| | 0.97 | % | | | 0.76 | % | | | 0.75 | % | | | (2.35 | )% | | | 78 | % | | $ | 42,588 | |
| | 0.75 | % | | | 0.75 | % | | | 0.75 | % | | | 12.61 | % | | | 63 | % | | $ | 3,993 | |
| | (0.30 | )% | | | 0.75 | % | | | 0.75 | % | | | 6.25 | % | | | 30 | % | | $ | 1,669 | |
| | | | | |
| | | | | | | | | | | | | | | | | | | | | | |
| | (0.12 | )% | | | 1.51 | % | | | 1.50 | % | | | 17.72 | % | | | 47 | % | | $ | 353,208 | |
| | 0.33 | % | | | 1.52 | % | | | 1.50 | % | | | 13.06 | % | | | 71 | % | | $ | 323,778 | |
| | 0.32 | % | | | 1.51 | % | | | 1.50 | % | | | (3.16 | )% | | | 78 | % | | $ | 355,837 | |
| | (0.10 | )% | | | 1.50 | % | | | 1.50 | % | | | 11.80 | % | | | 63 | % | | $ | 491,304 | |
| | (0.37 | )% | | | 1.50 | % | | | 1.50 | % | | | 17.07 | % | | | 30 | % | | $ | 532,454 | |
| | (0.46 | )% | | | 1.51 | % | | | 1.50 | % | | | (6.12 | )% | | | 27 | % | | $ | 423,109 | |
| | | | | |
| | | | | | | | | | | | | | | | | | | | | | |
| | 0.96 | % | | | 0.43 | % | | | 0.42 | % | | | 18.26 | % | | | 47 | % | | $ | 3,447 | |
| | 1.40 | % | | | 0.44 | % | | | 0.42 | % | | | 14.26 | % | | | 71 | % | | $ | 2,281 | |
| | 1.40 | % | | | 0.43 | % | | | 0.42 | % | | | (4.54 | )% | | | 78 | % | | $ | 1,172 | |
The accompanying notes are an integral part of these financial statements.
Wells Fargo Multi-Asset Funds | 43
Financial highlights
| | | | | | | | | | | | | | | | | | | | | | | | |
| | | Beginning
net asset
value per
share | | | Net
investment
income | | | Net realized
and unrealized
gains (losses)
on investments | | | Distributions
from net
investment
income | | | Distributions
from net
realized
gains | | | Ending
net asset
value per
share | |
| | | | | | |
Spectrum Conservative Growth Fund | | | | | | | | | | | | | | | | | | | | | | | | |
| | | | | | |
Class A | | | | | | | | | | | | | | | | | | | | | | | | |
Six months ended November 30, 2020 (unaudited) | | $ | 10.92 | | | | 0.07 | | | | 0.87 | | | | (0.07 | ) | | | 0.00 | | | $ | 11.79 | |
Year ended May 31, 2020 | | $ | 10.30 | | | | 0.15 | | | | 0.76 | | | | (0.21 | ) | | | (0.08 | ) | | $ | 10.92 | |
Year ended May 31, 2019 | | $ | 10.90 | | | | 0.19 | 4 | | | 0.03 | | | | (0.18 | ) | | | (0.64 | ) | | $ | 10.30 | |
Year ended May 31, 2018 | | $ | 11.83 | | | | 0.18 | 4 | | | 0.40 | | | | (0.50 | ) | | | (1.01 | ) | | $ | 10.90 | |
Year ended May 31, 20175 | | $ | 11.56 | | | | 0.07 | | | | 0.28 | | | | (0.08 | ) | | | 0.00 | | | $ | 11.83 | |
| | | | | | |
Class C6 | | | | | | | | | | | | | | | | | | | | | | | | |
Six months ended November 30, 2020 (unaudited) | | $ | 11.14 | | | | 0.02 | | | | 0.89 | | | | (0.01 | ) | | | 0.00 | | | $ | 12.04 | |
Year ended May 31, 2020 | | $ | 10.50 | | | | 0.09 | | | | 0.77 | | | | (0.14 | ) | | | (0.08 | ) | | $ | 11.14 | |
Year ended May 31, 2019 | | $ | 11.10 | | | | 0.12 | 4 | | | 0.02 | | | | (0.10 | ) | | | (0.64 | ) | | $ | 10.50 | |
Year ended May 31, 2018 | | $ | 11.83 | | | | 0.09 | | | | 0.41 | | | | (0.22 | ) | | | (1.01 | ) | | $ | 11.10 | |
Year ended May 31, 2017 | | $ | 11.40 | | | | 0.06 | | | | 0.80 | | | | (0.08 | ) | | | (0.35 | ) | | $ | 11.83 | |
Year ended May 31, 2016 | | $ | 12.19 | | | | 0.05 | | | | (0.30 | ) | | | (0.07 | ) | | | (0.47 | ) | | $ | 11.40 | |
| | | | | | |
Institutional Class | | | | | | | | | | | | | | | | | | | | | | | | |
Six months ended November 30, 2020 (unaudited) | | $ | 10.94 | | | | 0.09 | | | | 0.87 | | | | (0.08 | ) | | | 0.00 | | | $ | 11.82 | |
Year ended May 31, 2020 | | $ | 10.32 | | | | 0.20 | | | | 0.74 | | | | (0.24 | ) | | | (0.08 | ) | | $ | 10.94 | |
Year ended May 31, 20197 | | $ | 11.06 | | | | 0.14 | | | | (0.04 | ) | | | (0.20 | ) | | | (0.64 | ) | | $ | 10.32 | |
| 1 | Including net expenses allocated from the affiliated Master Portfolios, the expense ratios would be increased by the following amounts: |
| | | | | | | | | | | | | | | | | | | | | | | | |
| | | Six months ended
May 31, 2020
(unaudited) | | | Year ended May 31 | |
| | | 2020 | | | 2019 | | | 2018 | | | 2017 | | | 2016 | |
Class A | | | 0.15 | % | | | 0.16 | % | | | 0.16 | % | | | 0.13 | % | | | 0.11 | %5 | | | N/A | |
Class C6 | | | 0.15 | % | | | 0.16 | % | | | 0.17 | % | | | 0.13 | % | | | 0.11 | % | | | 0.11 | % |
Institutional Class | | | 0.15 | % | | | 0.16 | % | | | 0.16 | %7 | | | N/A | | | | N/A | | | | N/A | |
| 2 | Total return calculations do not include any sales charges. Returns for periods of less than one year are not annualized. |
| 3 | Portfolio turnover rate is calculated by multiplying the Fund’s ownership percentage in the respective affiliated Master Portfolio by the corresponding affiliated Master Portfolio’s purchases and sales. These purchases and sales amounts are aggregated with the direct purchases and sales in Underlying Funds and unaffiliated securities and included in the portfolio turnover calculation. |
| 4 | Calculated based upon average shares outstanding |
| 5 | For the period from February 10, 2017 (commencement of class operations) to May 31, 2017 |
| 6 | Effective at the close of business on February 10, 2017, the Fund’s existing share class, WealthBuilder Portfolio shares, was renamed Class C. |
| 7 | For the period from July 31, 2018 (commencement of class operations) to May 31, 2019 |
The accompanying notes are an integral part of these financial statements.
44 | Wells Fargo Multi-Asset Funds
Financial highlights
| | | | | | | | | | | | | | | | | | | | | | |
| Ratio to average net assets (annualized) | | | Total
return2 | | | Portfolio
turnover
rate3 | | | Net assets at
end of period
(000s omitted) | |
Net investment
income | | | Gross
expenses1 | | | Net
expenses1 | |
| | | | | |
| | | | | | | | | | | | | | | | | | | | | | | |
| | | | | |
| | | | | | | | | | | | | | | | | | | | | | |
| | 1.13 | % | | | 0.77 | % | | | 0.75 | % | | | 8.59 | % | | | 82 | % | | $ | 38,403 | |
| | 1.47 | % | | | 0.77 | % | | | 0.75 | % | | | 8.95 | % | | | 162 | % | | $ | 31,965 | |
| | 1.81 | % | | | 0.76 | % | | | 0.75 | % | | | 2.40 | % | | | 155 | % | | $ | 34,104 | |
| | 1.58 | % | | | 0.75 | % | | | 0.75 | % | | | 4.87 | % | | | 161 | % | | $ | 2,712 | |
| | 1.03 | % | | | 0.74 | % | | | 0.74 | % | | | 3.06 | % | | | 136 | % | | $ | 800 | |
| | | | | |
| | | | | | | | | | | | | | | | | | | | | | |
| | 0.38 | % | | | 1.52 | % | | | 1.50 | % | | | 8.19 | % | | | 82 | % | | $ | 344,776 | |
| | 0.73 | % | | | 1.52 | % | | | 1.50 | % | | | 8.24 | % | | | 162 | % | | $ | 339,482 | |
| | 1.13 | % | | | 1.51 | % | | | 1.50 | % | | | 1.58 | % | | | 155 | % | | $ | 393,207 | |
| | 0.81 | % | | | 1.50 | % | | | 1.50 | % | | | 4.11 | % | | | 161 | % | | $ | 559,104 | |
| | 0.52 | % | | | 1.49 | % | | | 1.49 | % | | | 7.75 | % | | | 136 | % | | $ | 707,284 | |
| | 0.48 | % | | | 1.49 | % | | | 1.49 | % | | | (2.02 | )% | | | 150 | % | | $ | 833,218 | |
| | | | | |
| | | | | | | | | | | | | | | | | | | | | | |
| | 1.47 | % | | | 0.44 | % | | | 0.42 | % | | | 8.79 | % | | | 82 | % | | $ | 2,867 | |
| | 1.80 | % | | | 0.44 | % | | | 0.42 | % | | | 9.26 | % | | | 162 | % | | $ | 2,678 | |
| | 1.37 | % | | | 0.43 | % | | | 0.42 | % | | | 1.28 | % | | | 155 | % | | $ | 1,817 | |
The accompanying notes are an integral part of these financial statements.
Wells Fargo Multi-Asset Funds | 45
Financial highlights
| | | | | | | | | | | | | | | | | | | | | | | | |
| | | Beginning
net asset
value per
share | | | Net
investment
income
(loss) | | | Net realized
and unrealized
gains (losses)
on investments | | | Distributions
from net
investment
income | | | Distributions
from net
realized
gains | | | Ending
net asset
value per
share | |
| | | | | | |
Spectrum Growth Fund | | | | | | | | | | | | | | | | | | | | | | | | |
| | | | | | |
Class A | | | | | | | | | | | | | | | | | | | | | | | | |
Six months ended November 30, 2020 (unaudited) | | $ | 12.70 | | | | 0.05 | 4 | | | 1.68 | | | | 0.00 | | | | 0.00 | | | $ | 14.43 | |
Year ended May 31, 2020 | | $ | 11.57 | | | | 0.15 | | | | 1.17 | | | | (0.18 | ) | | | (0.01 | ) | | $ | 12.70 | |
Year ended May 31, 2019 | | $ | 13.88 | | | | 0.14 | 4 | | | (0.30 | ) | | | (0.23 | ) | | | (1.92 | ) | | $ | 11.57 | |
Year ended May 31, 2018 | | $ | 14.60 | | | | 0.12 | | | | 1.39 | | | | (0.30 | ) | | | (1.93 | ) | | $ | 13.88 | |
Year ended May 31, 20176 | | $ | 13.92 | | | | 0.01 | 4 | | | 0.67 | | | | 0.00 | | | | 0.00 | | | $ | 14.60 | |
| | | | | | |
Class C7 | | | | | | | | | | | | | | | | | | | | | | | | |
Six months ended November 30, 2020 (unaudited) | | $ | 12.96 | | | | 0.00 | 4,5 | | | 1.71 | | | | 0.00 | | | | 0.00 | | | $ | 14.67 | |
Year ended May 31, 2020 | | $ | 11.78 | | | | 0.06 | | | | 1.20 | | | | (0.07 | ) | | | (0.01 | ) | | $ | 12.96 | |
Year ended May 31, 2019 | | $ | 14.02 | | | | 0.08 | | | | (0.33 | ) | | | (0.07 | ) | | | (1.92 | ) | | $ | 11.78 | |
Year ended May 31, 2018 | | $ | 14.58 | | | | 0.04 | | | | 1.34 | | | | (0.01 | ) | | | (1.93 | ) | | $ | 14.02 | |
Year ended May 31, 2017 | | $ | 13.39 | | | | (0.01 | )4 | | | 1.84 | | | | 0.00 | | | | (0.64 | ) | | $ | 14.58 | |
Year ended May 31, 2016 | | $ | 14.92 | | | | (0.01 | ) | | | (0.71 | ) | | | (0.04 | ) | | | (0.77 | ) | | $ | 13.39 | |
| | | | | | |
Institutional Class | | | | | | | | | | | | | | | | | | | | | | | | |
Six months ended November 30, 2020 (unaudited) | | $ | 12.70 | | | | 0.07 | 4 | | | 1.68 | | | | 0.00 | | | | 0.00 | | | $ | 14.45 | |
Year ended May 31, 2020 | | $ | 11.57 | | | | 0.16 | | | | 1.20 | | | | (0.22 | ) | | | (0.01 | ) | | $ | 12.70 | |
Year ended May 31, 20198 | | $ | 14.20 | | | | 0.18 | | | | (0.65 | ) | | | (0.24 | ) | | | (1.92 | ) | | $ | 11.57 | |
| 1 | Including net expenses allocated from the affiliated Master Portfolios, the expense ratios would be increased by the following amounts: |
| | | | | | | | | | | | | | | | | | | | | | | | |
| | | Six months ended
November 30, 2020
(unaudited) | | | Year ended May 31 | |
| | | 2020 | | | 2019 | | | 2018 | | | 2017 | | | 2016 | |
Class A | | | 0.15 | % | | | 0.16 | % | | | 0.17 | % | | | 0.12 | % | | | 0.11 | %6 | | | N/A | |
Class C7 | | | 0.15 | % | | | 0.16 | % | | | 0.17 | % | | | 0.12 | % | | | 0.11 | % | | | 0.11 | % |
Institutional Class | | | 0.15 | % | | | 0.16 | % | | | 0.17 | %8 | | | N/A | | | | N/A | | | | N/A | |
| 2 | Total return calculations do not include any sales charges. Returns for periods of less than one year are not annualized. |
| 3 | Portfolio turnover rate is calculated by multiplying the Fund’s ownership percentage in the respective affiliated Master Portfolio by the corresponding affiliated Master Portfolio’s purchases and sales. These purchases and sales amounts are aggregated with the direct purchases and sales in Underlying Funds and unaffiliated securities and included in the portfolio turnover calculation. |
| 4 | Calculated based upon average shares outstanding |
| 5 | Amount is less than $0.005. |
| 6 | For the period from February 10, 2017 (commencement of class operations) to May 31, 2017 |
| 7 | Effective at the close of business on February 10, 2017, the Fund’s existing share class, WealthBuilder Portfolio shares, was renamed Class C. |
| 8 | For the period from July 31, 2018 (commencement of class operations) to May 31, 2019 |
The accompanying notes are an integral part of these financial statements.
46 | Wells Fargo Multi-Asset Funds
Financial highlights
| | | | | | | | | | | | | | | | | | | | | | |
| Ratio to average net assets (annualized) | | | Total
return2 | | | Portfolio
turnover
rate3 | | | Net assets at
end of period
(000s omitted) | |
Net investment
income (loss) | | | Gross
expenses1 | | | Net
expenses1 | |
| | | | | |
| | | | | | | | | | | | | | | | | | | | | | | |
| | | | | |
| | | | | | | | | | | | | | | | | | | | | | |
| | 0.77 | % | | | 0.79 | % | | | 0.75 | % | | | 13.62 | % | | | 69 | % | | $ | 29,056 | |
| | 1.14 | % | | | 0.79 | % | | | 0.75 | % | | | 11.34 | % | | | 98 | % | | $ | 25,089 | |
| | 1.20 | % | | | 0.78 | % | | | 0.75 | % | | | (0.38 | )% | | | 97 | % | | $ | 23,420 | |
| | 1.07 | % | | | 0.78 | % | | | 0.75 | % | | | 10.33 | % | | | 93 | % | | $ | 2,009 | |
| | 0.16 | % | | | 0.76 | % | | | 0.75 | % | | | 4.89 | % | | | 58 | % | | $ | 357 | |
| | | | | |
| | | | | | | | | | | | | | | | | | | | | | |
| | 0.02 | % | | | 1.53 | % | | | 1.50 | % | | | 13.19 | % | | | 69 | % | | $ | 257,522 | |
| | 0.40 | % | | | 1.53 | % | | | 1.50 | % | | | 10.67 | % | | | 98 | % | | $ | 241,980 | |
| | 0.56 | % | | | 1.52 | % | | | 1.50 | % | | | (1.12 | )% | | | 97 | % | | $ | 261,722 | |
| | 0.26 | % | | | 1.51 | % | | | 1.50 | % | | | 9.45 | % | | | 93 | % | | $ | 354,185 | |
| | (0.06 | )% | | | 1.51 | % | | | 1.50 | % | | | 14.05 | % | | | 58 | % | | $ | 402,997 | |
| | (0.06 | )% | | | 1.51 | % | | | 1.50 | % | | | (4.79 | )% | | | 59 | % | | $ | 429,628 | |
| | | | | |
| | | | | | | | | | | | | | | | | | | | | | |
| | 1.09 | % | | | 0.46 | % | | | 0.42 | % | | | 13.78 | % | | | 69 | % | | $ | 1,868 | |
| | 1.44 | % | | | 0.46 | % | | | 0.42 | % | | | 11.71 | % | | | 98 | % | | $ | 1,016 | |
| | 1.84 | % | | | 0.45 | % | | | 0.42 | % | | | (2.47 | )% | | | 97 | % | | $ | 699 | |
The accompanying notes are an integral part of these financial statements.
Wells Fargo Multi-Asset Funds | 47
Financial highlights
| | | | | | | | | | | | | | | | | | | | | | | | |
| | | Beginning
net asset
value per
share | | | Net
investment
income | | | Net realized
and unrealized
gains (losses)
on investments | | | Distributions
from net
investment
income | | | Distributions
from net
realized
gains | | | Ending
net asset
value per
share | |
| | | | | | |
Spectrum Income Allocation Fund | | | | | | | | | | | | | | | | | | | | | | | | |
| | | | | | |
Class A | | | | | | | | | | | | | | | | | | | | | | | | |
Six months ended November 30, 2020 (unaudited) | | $ | 10.40 | | | | 0.07 | | | | 0.50 | | | | (0.10 | ) | | | 0.00 | | | $ | 10.87 | |
Year ended May 31, 2020 | | $ | 9.82 | | | | 0.16 | | | | 0.59 | | | | (0.17 | ) | | | 0.00 | | | $ | 10.40 | |
Year ended May 31, 2019 | | $ | 10.05 | | | | 0.18 | | | | 0.18 | | | | (0.19 | ) | | | (0.40 | ) | | $ | 9.82 | |
Year ended May 31, 2018 | | $ | 10.52 | | | | 0.20 | | | | 0.02 | | | | (0.19 | ) | | | (0.50 | ) | | $ | 10.05 | |
Year ended May 31, 20174 | | $ | 10.34 | | | | 0.04 | | | | 0.18 | | | | (0.04 | ) | | | 0.00 | | | $ | 10.52 | |
| | | | | | |
Class C5 | | | | | | | | | | | | | | | | | | | | | | | | |
Six months ended November 30, 2020 (unaudited) | | $ | 10.36 | | | | 0.03 | | | | 0.50 | | | | (0.03 | ) | | | 0.00 | | | $ | 10.86 | |
Year ended May 31, 2020 | | $ | 9.81 | | | | 0.09 | | | | 0.58 | | | | (0.12 | ) | | | 0.00 | | | $ | 10.36 | |
Year ended May 31, 2019 | | $ | 10.06 | | | | 0.14 | 6 | | | 0.13 | | | | (0.12 | ) | | | (0.40 | ) | | $ | 9.81 | |
Year ended May 31, 2018 | | $ | 10.51 | | | | 0.11 | | | | 0.04 | | | | (0.10 | ) | | | (0.50 | ) | | $ | 10.06 | |
Year ended May 31, 2017 | | $ | 10.33 | | | | 0.07 | | | | 0.38 | | | | (0.10 | ) | | | (0.17 | ) | | $ | 10.51 | |
Year ended May 31, 2016 | | $ | 10.82 | | | | 0.07 | | | | (0.20 | ) | | | (0.08 | ) | | | (0.28 | ) | | $ | 10.33 | |
| | | | | | |
Institutional Class | | | | | | | | | | | | | | | | | | | | | | | | |
Six months ended November 30, 2020 (unaudited) | | $ | 10.39 | | | | 0.08 | | | | 0.50 | | | | (0.12 | ) | | | 0.00 | | | $ | 10.85 | |
Year ended May 31, 2020 | | $ | 9.80 | | | | 0.21 | | | | 0.57 | | | | (0.19 | ) | | | 0.00 | | | $ | 10.39 | |
Year ended May 31, 20197 | | $ | 10.15 | | | | 0.15 | | | | 0.12 | | | | (0.22 | ) | | | (0.40 | ) | | $ | 9.80 | |
| 1 | Including net expenses allocated from the affiliated Master Portfolios, the expense ratios would be increased by the following amounts: |
| | | | | | | | | | | | | | | | | | | | | | | | |
| | | Six Months ended
November 30, 2020
(unaudited) | | | Year ended May 31 | |
| | | 2020 | | | 2019 | | | 2018 | | | 2017 | | | 2016 | |
Class A | | | 0.15 | % | | | 0.15 | % | | | 0.16 | % | | | 0.13 | % | | | 0.11 | %4 | | | N/A | |
Class C5 | | | 0.15 | % | | | 0.15 | % | | | 0.16 | % | | | 0.13 | % | | | 0.11 | % | | | 0.11 | % |
Institutional Class | | | 0.15 | % | | | 0.15 | % | | | 0.16 | %7 | | | N/A | | | | N/A | | | | N/A | |
| 2 | Total return calculations do not include any sales charges. Returns for periods of less than one year are not annualized. |
| 3 | Portfolio turnover rate is calculated by multiplying the Fund’s ownership percentage in the respective affiliated Master Portfolio by the corresponding affiliated Master Portfolio’s purchases and sales. These purchases and sales amounts are aggregated with the direct purchases and sales in Underlying Funds and unaffiliated securities and included in the portfolio turnover calculation. |
| 4 | For the period from February 10, 2017 (commencement of class operations) to May 31, 2017 |
| 5 | Effective at the close of business on February 10, 2017, the Fund’s existing share class, WealthBuilder Portfolio shares, was renamed Class C. |
| 6 | Calculated based upon average shares outstanding |
| 7 | For the period from July 31, 2018 (commencement of class operations) to May 31, 2019. |
The accompanying notes are an integral part of these financial statements.
48 | Wells Fargo Multi-Asset Funds
Financial highlights
| | | | | | | | | | | | | | | | | | | | | | |
| Ratio to average net assets (annualized) | | | Total
return2 | | | Portfolio
turnover
rate3 | | | Net assets at
end of period
(000s omitted) | |
Net investment
income | | | Gross
expenses1 | | | Net
expenses1 | |
| | | | | |
| | | | | | | | | | | | | | | | | | | | | | | |
| | | | | |
| | | | | | | | | | | | | | | | | | | | | | |
| | 1.28 | % | | | 0.80 | % | | | 0.75 | % | | | 5.47 | % | | | 93 | % | | $ | 24,731 | |
| | 1.61 | % | | | 0.80 | % | | | 0.75 | % | | | 7.72 | % | | | 197 | % | | $ | 21,256 | |
| | 2.15 | % | | | 0.79 | % | | | 0.75 | % | | | 3.84 | % | | | 183 | % | | $ | 16,242 | |
| | 1.81 | % | | | 0.77 | % | | | 0.75 | % | | | 2.05 | % | | | 192 | % | | $ | 4,532 | |
| | 1.34 | % | | | 0.76 | % | | | 0.75 | % | | | 2.14 | % | | | 175 | % | | $ | 4,468 | |
| | | | | |
| | | | | | | | | | | | | | | | | | | | | | |
| | 0.53 | % | | | 1.55 | % | | | 1.50 | % | | | 5.07 | % | | | 93 | % | | $ | 209,574 | |
| | 0.89 | % | | | 1.55 | % | | | 1.50 | % | | | 6.90 | % | | | 197 | % | | $ | 212,465 | |
| | 1.41 | % | | | 1.54 | % | | | 1.50 | % | | | 2.89 | % | | | 183 | % | | $ | 237,153 | |
| | 1.05 | % | | | 1.52 | % | | | 1.50 | % | | | 1.37 | % | | | 192 | % | | $ | 319,498 | |
| | 0.72 | % | | | 1.50 | % | | | 1.50 | % | | | 4.42 | % | | | 175 | % | | $ | 425,400 | |
| | 0.68 | % | | | 1.51 | % | | | 1.50 | % | | | (1.11 | )% | | | 198 | % | | $ | 523,832 | |
| | | | | |
| | | | | | | | | | | | | | | | | | | | | | |
| | 1.62 | % | | | 0.47 | % | | | 0.42 | % | | | 5.64 | % | | | 93 | % | | $ | 627 | |
| | 1.96 | % | | | 0.47 | % | | | 0.42 | % | | | 8.07 | % | | | 197 | % | | $ | 710 | |
| | 1.61 | % | | | 0.46 | % | | | 0.42 | % | | | 2.95 | % | | | 183 | % | | $ | 434 | |
The accompanying notes are an integral part of these financial statements.
Wells Fargo Multi-Asset Funds | 49
Financial highlights
| | | | | | | | | | | | | | | | | | | | | | | | |
| | | Beginning
net asset
value per
share | | | Net
investment
income | | | Net realized
and unrealized
gains (losses)
on investments | | | Distributions
from net
investment
income | | | Distributions
from net
realized
gains | | | Ending
net asset
value per
share | |
| | | | | | |
Spectrum Moderate Growth Fund | | | | | | | | | | | | | | | | | | | | | | | | |
| | | | | | |
Class A | | | | | | | | | | | | | | | | | | | | | | | | |
Six months ended November 30, 2020 (unaudited) | | $ | 12.64 | | | | 0.06 | 4 | | | 1.36 | | | | 0.00 | | | | 0.00 | | | $ | 14.06 | |
Year ended May 31, 2020 | | $ | 11.64 | | | | 0.15 | | | | 1.07 | | | | (0.21 | ) | | | (0.01 | ) | | $ | 12.64 | |
Year ended May 31, 2019 | | $ | 13.27 | | | | 0.18 | 4 | | | (0.14 | ) | | | (0.23 | ) | | | (1.44 | ) | | $ | 11.64 | |
Year ended May 31, 2018 | | $ | 14.24 | | | | 0.19 | 4 | | | 0.89 | | | | (0.42 | ) | | | (1.63 | ) | | $ | 13.27 | |
Year ended May 31, 20175 | | $ | 13.68 | | | | 0.01 | | | | 0.55 | | | | 0.00 | | | | 0.00 | | | $ | 14.24 | |
| | | | | | |
Class C6 | | | | | | | | | | | | | | | | | | | | | | | | |
Six months ended November 30, 2020 (unaudited) | | $ | 12.87 | | | | 0.03 | | | | 1.38 | | | | 0.00 | | | | 0.00 | | | $ | 14.28 | |
Year ended May 31, 2020 | | $ | 11.85 | | | | 0.08 | | | | 1.06 | | | | (0.11 | ) | | | (0.01 | ) | | $ | 12.87 | |
Year ended May 31, 2019 | | $ | 13.40 | | | | 0.11 | | | | (0.14 | ) | | | (0.08 | ) | | | (1.44 | ) | | $ | 11.85 | |
Year ended May 31, 2018 | | $ | 14.21 | | | | 0.09 | | | | 0.87 | | | | (0.14 | ) | | | (1.63 | ) | | $ | 13.40 | |
Year ended May 31, 2017 | | $ | 13.29 | | | | 0.05 | | | | 1.40 | | | | 0.00 | | | | (0.53 | ) | | $ | 14.21 | |
Year ended May 31, 2016 | | $ | 14.52 | | | | 0.03 | | | | (0.53 | ) | | | (0.06 | ) | | | (0.67 | ) | | $ | 13.29 | |
| | | | | | |
Institutional Class | | | | | | | | | | | | | | | | | | | | | | | | |
Six months ended November 30, 2020 (unaudited) | | $ | 12.64 | | | | 0.08 | 4 | | | 1.37 | | | | 0.00 | | | | 0.00 | | | $ | 14.09 | |
Year ended May 31, 2020 | | $ | 11.65 | | | | 0.25 | | | | 1.01 | | | | (0.26 | ) | | | (0.01 | ) | | $ | 12.64 | |
Year ended May 31, 20197 | | $ | 13.52 | | | | 0.15 | | | | (0.33 | ) | | | (0.25 | ) | | | (1.44 | ) | | $ | 11.65 | |
| 1 | Including net expenses allocated from the affiliated Master Portfolios, the expense ratios would be increased by the following amounts: |
| | | | | | | | | | | | | | | | | | | | | | | | |
| | | Six months ended
November 30, 2020
(unaudited) | | | Year ended May 31 | |
| | | 2020 | | | 2019 | | | 2018 | | | 2017 | | | 2016 | |
Class A | | | 0.15 | % | | | 0.16 | % | | | 0.17 | % | | | 0.12 | % | | | 0.11 | %5 | | | N/A | |
Class C6 | | | 0.15 | % | | | 0.16 | % | | | 0.17 | % | | | 0.12 | % | | | 0.11 | % | | | 0.11 | % |
Institutional Class | | | 0.15 | % | | | 0.16 | % | | | 0.16 | %7 | | | N/A | | | | N/A | | | | N/A | |
| 2 | Total return calculations do not include any sales charges. Returns for periods of less than one year are not annualized. |
| 3 | Portfolio turnover rate is calculated by multiplying the Fund’s ownership percentage in the respective affiliated Master Portfolio by the corresponding affiliated Master Portfolio’s purchases and sales. These purchases and sales amounts are aggregated with the direct purchases and sales in Underlying Funds and unaffiliated securities and included in the portfolio turnover calculation. |
| 4 | Calculated based upon average shares outstanding |
| 5 | For the period from February 10, 2017 (commencement of class operations) to May 31, 2017 |
| 6 | Effective at the close of business on February 10, 2017, the Fund’s existing share class, WealthBuilder Portfolio shares, was renamed Class C. |
| 7 | For the period from July 31, 2018 (commencement of class operations) to May 31, 2019 |
The accompanying notes are an integral part of these financial statements.
50 | Wells Fargo Multi-Asset Funds
Financial highlights
| | | | | | | | | | | | | | | | | | | | | | |
| Ratio to average net assets (annualized) | | | Total
return2 | | | Portfolio
turnover
rate3 | | | Net assets at
end of period
(000s omitted) | |
Net investment
income | | | Gross
expenses1 | | | Net
expenses1 | |
| | | | | |
| | | | | | | | | | | | | | | | | | | | | | | |
| | | | | |
| | | | | | | | | | | | | | | | | | | | | | |
| | 0.94 | % | | | 0.75 | % | | | 0.75 | % | | | 11.23 | % | | | 75 | % | | $ | 52,900 | |
| | 1.31 | % | | | 0.76 | % | | | 0.75 | % | | | 10.49 | % | | | 131 | % | | $ | 46,133 | |
| | 1.51 | % | | | 0.76 | % | | | 0.75 | % | | | 1.02 | % | | | 126 | % | | $ | 46,380 | |
| | 1.33 | % | | | 0.75 | % | | | 0.75 | % | | | 7.51 | % | | | 129 | % | | $ | 3,031 | |
| | 0.54 | % | | | 0.74 | % | | | 0.74 | % | | | 4.09 | % | | | 102 | % | | $ | 1,464 | |
| | | | | |
| | | | | | | | | | | | | | | | | | | | | | |
| | 0.19 | % | | | 1.50 | % | | | 1.50 | % | | | 10.96 | % | | | 75 | % | | $ | 495,476 | |
| | 0.57 | % | | | 1.51 | % | | | 1.50 | % | | | 9.58 | % | | | 131 | % | | $ | 477,998 | |
| | 0.84 | % | | | 1.50 | % | | | 1.50 | % | | | 0.31 | % | | | 126 | % | | $ | 539,352 | |
| | 0.56 | % | | | 1.50 | % | | | 1.50 | % | | | 6.65 | % | | | 129 | % | | $ | 732,031 | |
| | 0.30 | % | | | 1.49 | % | | | 1.49 | % | | | 11.14 | % | | | 102 | % | | $ | 867,751 | |
| | 0.26 | % | | | 1.49 | % | | | 1.49 | % | | | (3.39 | )% | | | 100 | % | | $ | 966,932 | |
| | | | | |
| | | | | | | | | | | | | | | | | | | | | | |
| | 1.26 | % | | | 0.42 | % | | | 0.42 | % | | | 11.47 | % | | | 75 | % | | $ | 1,389 | |
| | 1.63 | % | | | 0.43 | % | | | 0.42 | % | | | 10.78 | % | | | 131 | % | | $ | 1,945 | |
| | 1.38 | % | | | 0.43 | % | | | 0.42 | % | | | (0.62 | )% | | | 126 | % | | $ | 1,067 | |
The accompanying notes are an integral part of these financial statements.
Wells Fargo Multi-Asset Funds | 51
Notes to financial statements (unaudited)
1. ORGANIZATION
Wells Fargo Funds Trust (the “Trust”), a Delaware statutory trust organized on March 10, 1999, is an open-end management investment company registered under the Investment Company Act of 1940, as amended (the “1940 Act”). As an investment company, the Trust follows the accounting and reporting guidance in Financial Accounting Standards Board Accounting Standards Codification Topic 946, Financial Services – Investment Companies. These financial statements report on the following funds: Wells Fargo Spectrum Aggressive Growth Fund (“Spectrum Aggressive Growth Fund”), Wells Fargo Spectrum Conservative Growth Fund (“Spectrum Conservative Growth Fund”), Wells Fargo Spectrum Growth Fund (“Spectrum Growth Fund” ), Wells Fargo Spectrum Income Allocation Fund (“Spectrum Income Allocation Fund” ) and Wells Fargo Spectrum Moderate Growth Fund (“Spectrum Moderate Growth Fund” ) (each, a “Fund”, collectively, the “Funds”). Each Fund is a diversified series of the Trust.
Effective at the close of business on October 30, 2020, each Fund changed its name and four of the Funds changed its investment strategy and revised its neutral asset allocation. The name changes of each Fund were as follows:
| | |
| |
| Former fund name | | New fund name |
| |
WealthBuilder Equity Fund | | Spectrum Aggressive Growth Fund |
| |
WealthBuilder Moderate Balanced Fund | | Spectrum Conservative Growth Fund |
| |
WealthBuilder Growth Allocation Fund | | Spectrum Growth Fund |
| |
WealthBuilder Conservative Allocation Fund | | Spectrum Income Allocation Fund |
| |
WealthBuilder Growth Balanced Fund | | Spectrum Moderate Growth Fund |
Each Fund is a fund-of-funds that may invest in various affiliated mutual funds, unaffiliated mutual funds and exchange-traded funds (collectively, the “Underlying Funds”) to pursue its investment objective. The Underlying Funds incur separate expenses in seeking to achieve their investment objectives. Investments in affiliated mutual funds may also include investments in one or more separate diversified portfolios (each, an “affiliated Master Portfolio”, collectively, the “affiliated Master Portfolios”) of Wells Fargo Master Trust, a registered open-end management investment company. Each affiliated Master Portfolio directly acquires portfolio securities, and each Fund investing in an affiliated Master Portfolio acquires an indirect interest in those securities. Each Fund accounts for its investment in the affiliated Master Portfolios as partnership investments and records on a daily basis its share of each affiliated Master Portfolio’s income, expense and realized and unrealized gains and losses. The financial statements for the Underlying Funds are presented in separate financial statements and may be obtained by contacting Investor Services for the affiliated mutual funds or by contacting the servicing agent of the unaffiliated mutual funds and exchange-traded funds. The financial statements of the affiliated Master Portfolios are available by visiting the SEC website at sec.gov and are filed with the SEC under Wells Fargo Master Trust. The financial statements for all other affiliated Underlying Funds are also publicly available on the SEC website at sec.gov.
2. SIGNIFICANT ACCOUNTING POLICIES
The following significant accounting policies, which are consistently followed in the preparation of the financial statements of each Fund, are in conformity with U.S. generally accepted accounting principles which require management to make estimates and assumptions that affect the reported amounts of assets and liabilities, disclosure of contingent assets and liabilities at the date of the financial statements, and the reported amounts of revenues and expenses during the reporting period. Actual results could differ from those estimates.
Securities valuation
All investments are valued each business day as of the close of regular trading on the New York Stock Exchange (generally 4 p.m. Eastern Time), although the Funds may deviate from this calculation time under unusual or unexpected circumstances.
Investments in underlying mutual funds are valued at net asset per share as reported by the Underlying Funds as of the close of the regular trading on the New York Stock Exchange on each day the exchange is open for trading. Investments in affiliated Master Portfolios are valued daily based on each Fund’s proportionate share of each affiliated Master Portfolio’s net assets, which are also valued daily.
Equity securities and futures contracts that are listed on a foreign or domestic exchange or market are valued at the official closing price or, if none, the last sales price. If no sale occurs on the principal exchange or market that day, a fair value price will be determined in accordance with the Funds’ Valuation Procedures.
Debt securities are valued at the evaluated bid price provided by an independent pricing service (e.g. taking into account various factors, including yields, maturities, or credit ratings) or, if a reliable price is not available, the quoted bid price from an independent broker-dealer.
52 | Wells Fargo Multi-Asset Funds
Notes to financial statements (unaudited)
Investments which are not valued using the methods discussed above are valued at their fair value, as determined in good faith by the Board of Trustees of the Funds. The Board of Trustees has established a Valuation Committee comprised of the Trustees and has delegated to it the authority to take any actions regarding the valuation of portfolio securities that the Valuation Committee deems necessary or appropriate, including determining the fair value of portfolio securities, unless the determination has been delegated to the Wells Fargo Asset Management Pricing Committee at Wells Fargo Funds Management, LLC (“Funds Management”). The Board of Trustees retains the authority to make or ratify any valuation decisions or approve any changes to the Valuation Procedures as it deems appropriate. On a quarterly basis, the Board of Trustees receives reports on any valuation actions taken by the Valuation Committee or the Wells Fargo Asset Management Pricing Committee which may include items for ratification.
Futures contracts
Futures contracts are agreements between each Fund and a counterparty to buy or sell a specific amount of a commodity, financial instrument or currency at a specified price and on a specified date. A Fund may buy and sell futures contracts in order to gain exposure to, or protect against, changes in interest rates, security values and foreign exchange rates and is subject to interest rate risk, equity price risk, and/or foreign currency risk. The primary risks associated with the use of futures contracts are the imperfect correlation between changes in market values of securities held by the Fund and the prices of futures contracts, and the possibility of an illiquid market. Futures contracts are generally entered into on a regulated futures exchange and cleared through a clearinghouse associated with the exchange. With futures contracts, there is minimal counterparty risk to the Fund since futures contracts are exchange traded and the exchange’s clearinghouse, as the counterparty to all exchange traded futures, guarantees the futures contracts against default.
Upon entering into a futures contracts, the Fund is required to deposit either cash or securities (initial margin) with the broker in an amount equal to a certain percentage of the contract value. Subsequent payments (variation margin) are paid to or from the broker each day equal to the daily changes in the contract value. Such payments are recorded as unrealized gains or losses and, if any, shown as variation margin receivable (payable) in the Statements of Assets and Liabilities. Should the Fund fail to make requested variation margin payments, the broker can gain access to the initial margin to satisfy the Fund’s payment obligations. When the contracts are closed, a realized gain or loss is recorded in the Statements of Operations.
Security transactions and income recognition
Securities transactions are recorded on a trade date basis. Realized gains or losses are recorded on the basis of identified cost.
Each Fund records on a daily basis its proportionate share of each affiliated Master Portfolio’s income, expenses and realized and unrealized gains and losses. Income from foreign securities in each affiliated Master Portfolio is recorded net of foreign taxes withheld where recovery of such taxes is not assured.
Income dividends and capital gain distributions from Underlying Funds are recorded on the ex-dividend date. Capital gain distributions from Underlying Funds are treated as realized gains.
Distributions to shareholders
Distributions to shareholders from net investment income and any net realized gains are recorded on the ex-dividend date for each Fund as follows:
| | | | | | | | |
| | |
| | | Net investment income | | | Net realized gains | |
| | |
Spectrum Aggressive Growth Fund | | | Annually | | | | Annually | |
| | |
Spectrum Conservative Growth Fund | | | Quarterly | | | | Annually | |
| | |
Spectrum Growth Fund | | | Annually | | | | Annually | |
| | |
Spectrum Income Allocation Fund | | | Monthly | | | | Annually | |
| | |
Spectrum Moderate Growth Fund | | | Annually | | | | Annually | |
Federal and other taxes
Each Fund is treated as a separate entity for federal income tax purposes. Each Fund intends to continue to qualify as a regulated investment company by distributing substantially all of its investment company taxable income and any net realized capital gains (after reduction for capital loss carryforwards) sufficient to relieve it from all, or substantially all, federal income taxes. Accordingly, no provision for federal income taxes was required.
Each Fund’s income and federal excise tax returns and all financial records supporting those returns for the prior three fiscal years are subject to examination by the federal and Delaware revenue authorities. Management has analyzed each Fund’s tax positions taken on federal, state, and foreign tax returns for all open tax years and does not believe that there are any uncertain tax positions that require recognition of a tax liability.
Wells Fargo Multi-Asset Funds | 53
Notes to financial statements (unaudited)
As of November 30, 2020, the aggregate cost of all investments for federal income tax purposes and the unrealized gains (losses) were as follows:
| | | | | | | | | | | | | | | | |
| | | | |
| | | Tax cost | | | Gross
unrealized
gains | | | Gross
unrealized
losses | | | Net
unrealized
gains | |
| | | | |
Spectrum Aggressive Growth Fund | | $ | 324,275,285 | | | $ | 88,047,453 | | | $ | (5,456,314 | ) | | $ | 82,591,139 | |
| | | | |
Spectrum Conservative Growth Fund | | | 352,133,294 | | | | 30,693,570 | | | | (1,542,483 | ) | | | 29,151,087 | |
| | | | |
Spectrum Growth Fund | | | 256,197,524 | | | | 147,384,752 | | | | (119,288,564 | ) | | | 28,096,188 | |
| | | | |
Spectrum Income Allocation Fund | | | 214,149,032 | | | | 19,178,571 | | | | (1,209,879 | ) | | | 17,968,692 | |
| | | | |
Spectrum Moderate Growth Fund | | | 492,331,104 | | | | 302,223,251 | | | | (251,833,673 | ) | | | 50,389,578 | |
Class allocations
The separate classes of shares offered by each Fund differ principally in applicable sales charges, distribution, shareholder servicing, and administration fees. Class specific expenses are charged directly to that share class. Investment income, common fund-level expenses, and realized and unrealized gains (losses) on investments are allocated daily to each class of shares based on the relative proportion of net assets of each class.
3. FAIR VALUATION MEASUREMENTS
Fair value measurements of investments are determined within a framework that has established a fair value hierarchy based upon the various data inputs utilized in determining the value of each Fund’s investments. The three-level hierarchy gives the highest priority to unadjusted quoted prices in active markets for identical assets or liabilities (Level 1) and the lowest priority to unobservable inputs (Level 3). Each Fund’s investments are classified within the fair value hierarchy based on the lowest level of input that is significant to the fair value measurement. The inputs are summarized into three broad levels as follows:
| ∎ | | Level 1 – quoted prices in active markets for identical securities |
| ∎ | | Level 2 – other significant observable inputs (including quoted prices for similar securities, interest rates, prepayment speeds, credit risk, etc.) |
| ∎ | | Level 3 – significant unobservable inputs (including the Fund’s own assumptions in determining the fair value of investments) |
The inputs or methodologies used for valuing investments in securities are not necessarily an indication of the risk associated with investing in those securities.
The following is a summary of the inputs used in valuing each Fund’s assets and liabilities as of November 30, 2020:
| | | | | | | | | | | | | | | | |
| | | | |
| Spectrum Aggressive Growth Fund | | Quoted prices
(Level 1) | | | Other significant
observable inputs
(Level 2) | | | Significant
unobservable inputs (Level 3) | | | Total | |
| | | | |
Assets | | | | | | | | | | | | | | | | |
Investments in: | | | | | | | | | | | | | | | | |
| | | | |
Exchange-traded funds | | $ | 25,457,407 | | | $ | 0 | | | $ | 0 | | | $ | 25,457,407 | |
| | | | |
Investment companies | | | 40,513,546 | | | | 0 | | | | 0 | | | | 40,513,546 | |
| | | | |
Short-term investments | | | | | | | | | | | | | | | | |
| | | | |
Investment companies | | | 2,400,000 | | | | 0 | | | | 0 | | | | 2,400,000 | |
| | | | |
Investments measured at net asset value* | | | | | | | | | | | | | | | 337,621,075 | |
| | | | |
| | | 68,370,953 | | | | 0 | | | | 0 | | | | 405,992,028 | |
| | | | |
Futures contracts | | | 1,237,844 | | | | 0 | | | | 0 | | | | 1,237,844 | |
| | | | |
Total assets | | $ | 69,608,797 | | | $ | 0 | | | $ | 0 | | | $ | 407,229,872 | |
| | | | |
Liabilities | | | | | | | | | | | | | | | | |
| | | | |
Futures contracts | | $ | 363,448 | | | $ | 0 | | | $ | 0 | | | $ | 363,448 | |
| | | | |
Total liabilities | | $ | 363,448 | | | $ | 0 | | | $ | 0 | | | $ | 363,448 | |
| * | Investments that are measured at fair value using the net asset value per share (or its equivalent) as a practical expedient have not been categorized in the fair value hierarchy. The fair value amount presented in the table is intended to permit reconciliation of the fair value hierarchy to the amounts presented in the Statements of Assets and Liabilities. The Fund’s investment in affiliated Master Portfolios valued at $337,621,075 does not have a redemption period notice, can be redeemed daily and does not have any unfunded commitments. |
54 | Wells Fargo Multi-Asset Funds
Notes to financial statements (unaudited)
| | | | | | | | | | | | | | | | |
| | | | |
| Spectrum Conservative Growth Fund | | Quoted prices (Level 1) | | | Other significant observable inputs (Level 2) | | | Significant unobservable inputs (Level 3) | | | Total | |
| | | | |
Assets | | | | | | | | | | | | | | | | |
Investments in: | | | | | | | | | | | | | | | | |
| | | | |
Exchange-traded funds | | $ | 29,902,918 | | | $ | 0 | | | $ | 0 | | | $ | 29,902,918 | |
| | | | |
Investment companies | | | 94,579,877 | | | | 0 | | | | 0 | | | | 94,579,877 | |
| | | | |
Short-term investments | | | | | | | | | | | | | | | | |
| | | | |
Investment companies | | | 1,280,700 | | | | 0 | | | | 0 | | | | 1,280,700 | |
| | | | |
Investments measured at net asset value* | | | | | | | | | | | | | | | 254,658,960 | |
| | | | |
| | | 125,763,495 | | | | 0 | | | | 0 | | | | 380,422,455 | |
| | | | |
Futures contracts | | | 1,188,953 | | | | 0 | | | | 0 | | | | 1,188,953 | |
| | | | |
Total assets | | $ | 126,952,448 | | | $ | 0 | | | $ | 0 | | | $ | 381,161,408 | |
| | | | |
Liabilities | | | | | | | | | | | | | | | | |
| | | | |
Futures contracts | | $ | 327,027 | | | $ | 0 | | | $ | 0 | | | $ | 327,027 | |
| | | | |
Total liabilities | | $ | 327,027 | | | $ | 0 | | | $ | 0 | | | $ | 327,027 | |
| * | Investments that are measured at fair value using the net asset value per share (or its equivalent) as a practical expedient have not been categorized in the fair value hierarchy. The fair value amount presented in the table is intended to permit reconciliation of the fair value hierarchy to the amounts presented in the Statements of Assets and Liabilities. The Fund’s investment in affiliated Master Portfolios valued at $254,658,960 does not have a redemption period notice, can be redeemed daily and does not have any unfunded commitments. |
| | | | | | | | | | | | | | | | |
| | | | |
| Spectrum Growth Fund | | Quoted prices (Level 1) | | | Other significant observable inputs (Level 2) | | | Significant unobservable inputs (Level 3) | | | Total | |
| | | | |
Assets | | | | | | | | | | | | | | | | |
Investments in: | | | | | | | | | | | | | | | | |
| | | | |
Exchange-traded funds | | $ | 22,527,022 | | | $ | 0 | | | $ | 0 | | | $ | 22,527,022 | |
| | | | |
Investment companies | | | 67,269,643 | | | | 0 | | | | 0 | | | | 67,269,643 | |
| | | | |
Short-term investments | | | | | | | | | | | | | | | | |
| | | | |
Investment companies | | | 966,950 | | | | 0 | | | | 0 | | | | 966,950 | |
| | | | |
Investments measured at net asset value* | | | | | | | | | | | | | | | 192,901,707 | |
| | | | |
| | | 90,763,615 | | | | 0 | | | | 0 | | | | 283,665,322 | |
| | | | |
Futures contracts | | | 879,433 | | | | 0 | | | | 0 | | | | 879,433 | |
| | | | |
Total assets | | $ | 91,643,048 | | | $ | 0 | | | $ | 0 | | | $ | 284,544,755 | |
| | | | |
Liabilities | | | | | | | | | | | | | | | | |
| | | | |
Futures contracts | | $ | 251,043 | | | $ | 0 | | | $ | 0 | | | $ | 251,043 | |
| | | | |
Total liabilities | | $ | 251,043 | | | $ | 0 | | | $ | 0 | | | $ | 251,043 | |
| * | Investments that are measured at fair value using the net asset value per share (or its equivalent) as a practical expedient have not been categorized in the fair value hierarchy. The fair value amount presented in the table is intended to permit reconciliation of the fair value hierarchy to the amounts presented in the Statements of Assets and Liabilities. The Fund’s investment in affiliated Master Portfolios valued at $192,901,707 does not have a redemption period notice, can be redeemed daily and does not have any unfunded commitments. |
Wells Fargo Multi-Asset Funds | 55
Notes to financial statements (unaudited)
| | | | | | | | | | | | | | | | |
| | | | |
| Spectrum Income Allocation Fund | | Quoted prices (Level 1) | | | Other significant observable inputs (Level 2) | | | Significant unobservable inputs (Level 3) | | | Total | |
| | | | |
Assets | | | | | | | | | | | | | | | | |
Investments in: | | | | | | | | | | | | | | | | |
| | | | |
Exchange-traded funds | | $ | 14,918,250 | | | $ | 0 | | | $ | 0 | | | $ | 14,918,250 | |
| | | | |
Investment companies | | | 47,258,133 | | | | 0 | | | | 0 | | | | 47,258,133 | |
| | | | |
Short-term investments | | | | | | | | | | | | | | | | |
| | | | |
Investment companies | | | 1,100,000 | | | | 0 | | | | 0 | | | | 1,100,000 | |
| | | | |
Investments measured at net asset value* | | | | | | | | | | | | | | | 168,303,140 | |
| | | | |
| | | 63,276,383 | | | | 0 | | | | 0 | | | | 231,579,523 | |
| | | | |
Futures contracts | | | 736,862 | | | | 0 | | | | 0 | | | | 736,862 | |
| | | | |
Total assets | | $ | 64,013,245 | | | $ | 0 | | | $ | 0 | | | $ | 232,316,385 | |
| | | | |
Liabilities | | | | | | | | | | | | | | | | |
| | | | |
Futures contracts | | $ | 198,661 | | | $ | 0 | | | $ | 0 | | | $ | 198,661 | |
| | | | |
Total liabilities | | $ | 198,661 | | | $ | 0 | | | $ | 0 | | | $ | 198,661 | |
| * | Investments that are measured at fair value using the net asset value per share (or its equivalent) as a practical expedient have not been categorized in the fair value hierarchy. The fair value amount presented in the table is intended to permit reconciliation of the fair value hierarchy to the amounts presented in the Statements of Assets and Liabilities. The Fund’s investment in affiliated master portfolios valued at $168,303,140 does not have a redemption period notice, can be redeemed daily and does not have any unfunded commitments. |
| | | | | | | | | | | | | | | | |
| | | | |
| Spectrum Moderate Growth Fund | | Quoted prices (Level 1) | | | Other significant observable inputs (Level 2) | | | Significant unobservable inputs (Level 3) | | | Total | |
| | | | |
Assets | | | | | | | | | | | | | | | | |
Investments in: | | | | | | | | | | | | | | | | |
| | | | |
Exchange-traded funds | | $ | 37,319,057 | | | $ | 0 | | | $ | 0 | | | $ | 37,319,057 | |
| | | | |
Investment companies | | | 124,282,776 | | | | 0 | | | | 0 | | | | 124,282,776 | |
| | | | |
Short-term investments | | | | | | | | | | | | | | | | |
| | | | |
Investment companies | | | 2,652,130 | | | | 0 | | | | 0 | | | | 2,652,130 | |
| | | | |
Investments measured at net asset value* | | | | | | | | | | | | | | | 377,256,246 | |
| | | | |
| | | 164,253,963 | | | | 0 | | | | 0 | | | | 541,510,209 | |
| | | | |
Futures contracts | | | 1,681,440 | | | | 0 | | | | 0 | | | | 1,681,440 | |
| | | | |
Total assets | | $ | 165,935,403 | | | $ | 0 | | | $ | 0 | | | $ | 543,191,649 | |
| | | | |
Liabilities | | | | | | | | | | | | | | | | |
| | | | |
Futures contracts | | $ | 470,967 | | | $ | 0 | | | $ | 0 | | | $ | 470,967 | |
| | | | |
Total liabilities | | $ | 470,967 | | | $ | 0 | | | $ | 0 | | | $ | 470,967 | |
| * | Investments that are measured at fair value using the net asset value per share (or its equivalent) as a practical expedient have not been categorized in the fair value hierarchy. The fair value amount presented in the table is intended to permit reconciliation of the fair value hierarchy to the amounts presented in the Statements of Assets and Liabilities. The Fund’s investment in affiliated Master Portfolios valued at $377,256,246 does not have a redemption period notice, can be redeemed daily and does not have any unfunded commitments. |
Futures contracts are reported at their cumulative unrealized gains (losses) at measurement date as reported in the tables following each applicable Portfolio of Investments. For futures contracts, the current day’s variation margin is reported on the Statements of Assets and Liabilities. All other assets and liabilities are reported at their market value at measurement date.
For the six months ended November 30, 2020, the Funds did not have any transfers into/out of Level 3.
56 | Wells Fargo Multi-Asset Funds
Notes to financial statements (unaudited)
The investment objective of each affiliated Master Portfolio is as follows:
| | |
| |
| Affiliated Master Portfolio | | Investment objective |
| |
Wells Fargo Bloomberg Barclays US Aggregate ex-Corporate Portfolio | | Seeks to replicate the total return of the Bloomberg Barclays U.S. Aggregate ex-Corporate Index, before fees and expenses |
| |
Wells Fargo Core Bond Portfolio | | Seeks total return, consisting of income and capital appreciation |
| |
Wells Fargo Disciplined Large Cap Portfolio | | Seeks long-term capital appreciation |
| |
Wells Fargo Emerging Growth Portfolio | | Seeks long-term capital appreciation |
| |
Wells Fargo Factor Enhanced Emerging Markets Equity Portfolio | | Seeks long-term capital appreciation |
| |
Wells Fargo Factor Enhanced International Equity Portfolio | | Seeks long-term capital appreciation |
| |
Wells Fargo Factor Enhanced U.S. Large Cap Equity Portfolio | | Seeks long-term capital appreciation |
| |
Wells Fargo Factor Enhanced U.S. Small Cap Equity Portfolio | | Seeks long-term capital appreciation |
| |
Wells Fargo High Yield Corporate Bond Portfolio | | Seeks to replicate the total return of the Wells Fargo U.S. High Yield Bond Index, before fees and expenses |
| |
Wells Fargo Real Return Portfolio | | Seeks returns that exceed the rate of inflation over the long-term |
| |
Wells Fargo Small Company Value Portfolio | | Seeks long-term capital appreciation |
| |
Wells Fargo Strategic Retirement Bond Portfolio | | Seeks to replicate the total return of a blended index that is weighted 50% to the Bloomberg Barclays U.S. Treasury Inflation-Linked 1-10 Year Bond Index and 50% to the Bloomberg Barclays U.S. Intermediate Government Bond Index, before fees and expenses |
4. TRANSACTIONS WITH AFFILIATES
Management fee
Funds Management, an indirect wholly owned subsidiary of Wells Fargo & Company (“Wells Fargo”), is the manager of each Fund and provides advisory and fund-level administrative services under an investment management agreement. Under the investment management agreement, Funds Management is responsible for, among other services, implementing the investment objectives and strategies of each Fund, supervising the subadviser and providing fund-level administrative services in connection with each Fund’s operations. As compensation for its services under the investment management agreement, Funds Management is entitled to receive a management fee at the following annual rate based on each Fund’s average daily net assets
| | | | |
| |
| Average daily net assets | | Management fee | |
| |
First $1 billion | | | 0.250 | % |
| |
Next $4 billion | | | 0.225 | |
| |
Next $5 billion | | | 0.190 | |
| |
Over $10 billion | | | 0.180 | |
For the six months ended November 30, 2020, the management fee was equivalent to an annual rate of 0.25% of each Fund’s average daily net assets.
Funds Management has retained the services of a subadviser to provide daily portfolio management to the Funds. The fee for subadvisory services is borne by Funds Management. Wells Capital Management Incorporated, an affiliate of Funds Management and an indirect wholly owned subsidiary of Wells Fargo, is the subadviser to each Fund and is entitled to receive a an annual subadvisory fee of 0.15% of each Fund’s average daily net assets
Funds Management also serves as the adviser to each affiliated Master Portfolio and is entitled to receive a fee from each affiliated Master Portfolio for those services.
Administration fees
Under a class-level administration agreement, Funds Management provides class-level administrative services to each Fund, which includes paying fees and expenses for services provided by the transfer agent, sub-transfer agents, omnibus account
Wells Fargo Multi-Asset Funds | 57
Notes to financial statements (unaudited)
servicers and record-keepers. As compensation for its services under the class-level administration agreement, Funds Management receives an annual fee which is calculated based on the average daily net assets of each class as follows:
| | | | |
| |
| | | Class-level administration fee | |
| |
Class A, Class C | | | 0.21 | % |
| |
Institutional Class | | | 0.13 | |
Waivers and/or expense reimbursements
Funds Management has contractually waived and/or reimbursed management and administration fees to the extent necessary to maintain certain net operating expense ratios for each Fund. When each class of a Fund has exceeded its expense cap, Funds Management has waived fees and/or reimbursed expenses from fund-level expenses on a proportionate basis and then from class specific expenses. When only certain classes exceed their expense caps, waivers and/or reimbursements are applied against class specific expenses before fund-level expenses. Funds Management has committed through September 30, 2021 to waive fees and/or reimburse expenses to the extent necessary to cap each Fund’s expenses at 0.75% for Class A shares, 1.50% for Class C shares, and 0.42% for Institutional Class shares. Acquired fund fees and expenses (including net expenses from affiliated Master Portfolios) are excluded from the expense caps. Prior to or after the commitment expiration date, the cap may be increased or the commitment to maintain the cap may be terminated only with the approval of the Board of Trustees.
Distribution fee
The Trust has adopted a Distribution Plan for Class C shares of the Funds pursuant to Rule 12b-1 under the 1940 Act. A distribution fee is charged to Class C shares and paid to Wells Fargo Funds Distributor, LLC (“Funds Distributor”), the principal underwriter of each Fund, at an annual rate of 0.75% of the average daily net assets of Class C.
In addition, Funds Distributor is entitled to receive the front-end sales charge from the purchase of Class A shares and a contingent deferred sales charge on the redemption of certain Class A shares. Funds Distributor is also entitled to receive the contingent deferred sales charges from redemptions of Class C shares. For the six months ended November 30, 2020, Funds Distributor received front-end sales charges and contingent deferred sales charges from the following Funds:
| | | | | | | | |
| | | Front-end
sales charges | | | Contingent deferred
sales charges | |
| | |
| | | Class A | | | Class C | |
| | |
Spectrum Aggressive Growth Fund | | $ | 3,566 | | | $ | 569 | |
| | |
Spectrum Conservative Growth Fund | | | 2,685 | | | | 512 | |
| | |
Spectrum Growth Fund | | | 2,151 | | | | 529 | |
| | |
Spectrum Income Allocation Fund | | | 1,384 | | | | 68 | |
| | |
Spectrum Moderate Growth Fund | | | 2,154 | | | | 535 | |
No contingent deferred sales charges were incurred by Class A shares of each Fund for the six months ended November 30, 2020.
Shareholder servicing fees
The Trust has entered into contracts with one or more shareholder servicing agents, whereby Class A and Class C of each Fund are charged a fee at an annual rate of 0.25% of the average daily net assets of each respective class. A portion of these total shareholder servicing fees were paid to affiliates of Wells Fargo.
5. INVESTMENT PORTFOLIO TRANSACTIONS
The Funds seek to achieve their investment objectives by investing some of their investable assets in affiliated Master Portfolios. Purchases and sales related to these investments have been calculated by aggregating the results of multiplying each Fund’s ownership percentage in the respective affiliated Master Portfolio by the corresponding affiliated Master Portfolio’s purchases and sales. Purchases and sales in Underlying Funds in which the Funds invest are actual aggregate purchases and sales of those investments.
58 | Wells Fargo Multi-Asset Funds
Notes to financial statements (unaudited)
Purchases and sales of investments, excluding short-term securities, for the six months ended November 30, 2020 were as follows:
| | | | | | | | | | | | | | | | |
| | | Purchases at cost | | | Sales proceeds | |
| | | | |
| | | U.S.
government | | | Non-U.S.
government | | | U.S.
government | | | Non-U.S.
government | |
| | | | |
Spectrum Aggressive Growth Fund | | $ | 0 | | | $ | 171,671,821 | | | $ | 0 | | | $ | 227,993,259 | |
| | | | |
Spectrum Conservative Growth Fund | | | 161,313,286 | | | | 151,197,710 | | | | 147,269,239 | | | | 158,575,202 | |
| | | | |
Spectrum Growth Fund | | | 15,815,146 | | | | 171,580,957 | | | | 12,221,676 | | | | 171,863,188 | |
| | | | |
Spectrum Income Allocation Fund | | | 191,448,471 | | | | 25,719,496 | | | | 177,608,951 | | | | 52,818,959 | |
| | | | |
Spectrum Moderate Growth Fund | | | 109,828,134 | | | | 277,588,482 | | | | 96,890,982 | | | | 296,099,278 | |
6. DERIVATIVE TRANSACTIONS
During the six months ended November 30, 2020, the following Funds entered into futures contracts to gain market exposure to certain asset classes consistent with an active asset allocation strategy. The volume of each Fund’s futures contracts during the six months ended November 30, 2020 was as follows:
| | | | | | | | |
| | | Average notional balance | |
| | |
| | | Long futures | | | Short
futures | |
| | |
Spectrum Aggressive Growth Fund | | $ | 31,924,458 | | | $ | 43,297,390 | |
| | |
Spectrum Conservative Growth Fund | | | 25,266,592 | | | | 29,749,344 | |
| | |
Spectrum Growth Fund | | | 22,892,213 | | | | 30,755,406 | |
| | |
Spectrum Income Allocation Fund | | | 19,400,198 | | | | 20,241,025 | |
| | |
Spectrum Moderate Growth Fund | | | 46,356,740 | | | | 57,277,922 | |
A summary of the location of derivative instruments on the financial statements by primary risk exposure is outlined following tables.
The fair value of derivative instruments as of November 30, 2020 by primary risk type was as follows for Spectrum Aggressive Growth Fund:
| | | | | | | | | | | | |
| | | Asset derivatives | | | Liability derivatives | |
| | | | |
| | | Statements of Assets and
Liabilities location | | Fair value | | | Statements of Assets and
Liabilities location | | Fair value | |
| | | | |
Equity risk | | Unrealized gains on futures contracts | | $ | 1,103,295 | * | | Unrealized losses on futures contracts | | $ | 363,448 | * |
| | | | |
Foreign currency risk | | Unrealized gains on futures contracts | | | 64,973 | * | | Unrealized losses on futures contracts | | | 0 | * |
| | | | |
Interest rate risk | | Unrealized gains on futures contracts | | | 69,576 | * | | Unrealized losses on futures contracts | | | 0 | * |
| | | | |
| | | | | $ | 1,237,844 | | | | | $ | 363,448 | |
| * | Amount represents cumulative unrealized gains (losses) on futures contracts as reported in the table following the Portfolio of Investments. Only the current day’s variation margin as of November 30, 2020 is reported separately on the Statement of Assets and Liabilities. |
Wells Fargo Multi-Asset Funds | 59
Notes to financial statements (unaudited)
The effect of derivative instruments on the Statements of Operations for the six months ended November 30, 2020 was as follows:
| | | | | | | | |
| | |
| | | Realized
gains (losses) on
derivatives | | | Change in unrealized
gains (losses) on
derivatives | |
|
| | |
Equity risk | | $ | (3,925,695 | ) | | $ | 597,993 | |
| | |
Foreign currency risk | | | 80,268 | | | | 226,362 | |
| | |
Interest rate risk | | | (167,260 | ) | | | 69,576 | |
| | |
| | | $ | (4,012,687 | ) | | $ | 893,931 | |
The fair value of derivative instruments as of November 30, 2020 by primary risk type was as follows for Spectrum Conservative Growth Fund:
| | | | | | | | | | | | |
| | | Asset derivatives | | | Liability derivatives | |
| | | | |
| | | Statements of Assets and
Liabilities location | | Fair value | | | Statements of Assets and
Liabilities location | | Fair value | |
| | | | |
Equity risk | | Unrealized gains on futures contracts | | $ | 1,059,022 | * | | Unrealized losses on futures contracts | | $ | 327,027 | * |
| | | | |
Foreign currency risk | | Unrealized gains on futures contracts | | | 61,256 | * | | Unrealized losses on futures contracts | | | 0 | * |
| | | | |
Interest rate risk | | Unrealized gains on futures contracts | | | 68,675 | * | | Unrealized losses on futures contracts | | | 0 | * |
| | | | |
| | | | | $ | 1,188,953 | | | | | $ | 327,027 | |
| * | Amount represents cumulative unrealized gains (losses) on futures contracts as reported in the table following the Portfolio of Investments. Only the current day’s variation margin as of November 30, 2020 is reported separately on the Statement of Assets and Liabilities. |
The effect of derivative instruments on the Statements of Operations for the six months ended November 30, 2020 was as follows:
| | | | | | | | |
| | |
| | | Realized
gains (losses) on
derivatives | | | Change in unrealized
gains (losses) on
derivatives | |
|
| | |
Equity risk | | $ | 3,041,512 | | | $ | (2,589,305 | ) |
| | |
Interest rate risk | | | 181,148 | | | | 68,675 | |
| | |
Foreign currency risk | | | (965,010 | ) | | | 229,514 | |
| | |
| | | $ | 2,257,650 | | | $ | (2,291,116 | ) |
The fair value of derivative instruments as of November 30, 2020 by primary risk type was as follows for Spectrum Growth Fund:
| | | | | | | | | | | | |
| | | Asset derivatives | | | Liability derivatives | |
| | | | |
| | | Statements of Assets and
Liabilities location | | Fair value | | | Statements of Assets and
Liabilities location | | Fair value | |
| | | | |
Equity risks | | Unrealized gains on futures contracts | | $ | 783,723 | * | | Unrealized losses on futures contracts | | $ | 251,043 | * |
| | | | |
Interest rate risk | | Unrealized gains on futures contracts | | | 50,081 | * | | Unrealized losses on futures contracts | | | 0 | * |
| | | | |
Foreign currency risk | | Unrealized gains on futures contracts | | | 45,629 | * | | Unrealized losses on futures contracts | | | 0 | * |
| | | | |
| | | | | $ | 879,433 | | | | | $ | 251,043 | |
| * | Amount represents cumulative unrealized gains (losses) on futures contracts as reported in the table following the Portfolio of Investments. Only the current day’s variation margin as of November 30, 2020 is reported separately on the Statement of Assets and Liabilities. |
60 | Wells Fargo Multi-Asset Funds
Notes to financial statements (unaudited)
The effect of derivative instruments on the Statements of Operations for the six months ended November 30, 2020 was as follows:
| | | | | | | | |
| | |
| | | Realized
gains (losses) on
derivatives | | | Change in unrealized
gains (losses) on
derivatives | |
|
| | |
Equity risk | | $ | 848,971 | | | $ | (1,754,565 | ) |
| | |
Foreign currency risk | | | (679,392 | ) | | | 163,237 | |
| | |
Interest rate risk | | | 135,557 | | | | 50,081 | |
| | |
| | | $ | 305,136 | | | $ | (1,541,247 | ) |
The fair value of derivative instruments as of November 30, 2020 by primary risk type was as follows for Spectrum Income Allocation Fund:
| | | | | | | | | | | | |
| | | Asset derivatives | | | Liability derivatives | |
| | | | |
| | | Statements of Assets and
Liabilities location | | Fair value | | | Statements of Assets and
Liabilities location | | Fair value | |
| | | | |
Equity risk | | Unrealized gains on futures contracts | | $ | 656,668 | * | | Unrealized losses on futures contracts | | $ | 198,661 | * |
| | | | |
Foreign currency risk | | Unrealized gains on futures contracts | | | 37,309 | * | | Unrealized losses on futures contracts | | | 0 | * |
| | | | |
Interest rate risk | | Unrealized gains on futures contracts | | | 42,885 | * | | Unrealized losses on futures contracts | | | 0 | * |
| | | | |
| | | | | $ | 736,862 | | | | | $ | 198,661 | |
| * | Amount represents cumulative unrealized gains (losses) on futures contracts as reported in the table following the Portfolio of Investments. Only the current day’s variation margin as of November 30, 2020 is reported separately on the Statement of Assets and Liabilities. |
The effect of derivative instruments on the Statements of Operations for the six months ended November 30, 2020 was as follows:
| | | | | | | | |
| | |
| | | Realized
gains (losses) on
derivatives | | | Change in unrealized
gains (losses) on
derivatives | |
|
| | |
Equity risk | | $ | 2,472,509 | | | $ | (1,637,122 | ) |
| | |
Interest rate risk | | | 109,371 | | | | 42,885 | |
| | |
Foreign currency risk | | | (606,600 | ) | | | 142,988 | |
| | |
| | | $ | 1,975,280 | | | $ | (1,451,249 | ) |
The fair value of derivative instruments as of November 30, 2020 by primary risk type was as follows for Spectrum Moderate Growth Fund:
| | | | | | | | | | | | |
| | | Asset derivatives | | | Liability derivatives | |
| | | | |
| | | Statements of Assets and
Liabilities location | | Fair value | | | Statements of Assets and
Liabilities location | | Fair value | |
| | | | |
Equity risk | | Unrealized gains on futures contracts | | $ | 1,498,066 | * | | Unrealized losses on futures contracts | | $ | 470,967 | * |
| | | | |
Foreign currency risk | | Unrealized gains on futures contracts | | | 87,108 | * | | Unrealized losses on futures contracts | | | 0 | * |
| | | | |
Interest rate risk | | Unrealized gains on futures contracts | | | 96,266 | * | | Unrealized losses on futures contracts | | | 0 | * |
| | | | |
| | | | | $ | 1,681,440 | | | | | $ | 470,967 | |
| * | Amount represents cumulative unrealized gains (losses) on futures contracts as reported in the table following the Portfolio of Investments. Only the current day’s variation margin as of November 30, 2020 is reported separately on the Statement of Assets and Liabilities. |
Wells Fargo Multi-Asset Funds | 61
Notes to financial statements (unaudited)
The effect of derivative instruments on the Statements of Operations for the six months ended November 30, 2020 was as follows:
| | | | | | | | |
| | |
| | | Realized
gains (losses) on
derivatives | | | Change in unrealized
gains (losses) on
derivatives | |
|
| | |
Equity risk | | $ | 1,010,182 | | | $ | (3,303,970 | ) |
| | |
Interest rate risk | | | 263,843 | | | | 96,266 | |
| | |
Foreign currency risk | | | (1,350,043 | ) | | | 321,641 | |
| | |
| | | $ | (76,018 | ) | | $ | (2,886,063 | ) |
7. BANK BORROWINGS
The Trust (excluding the money market funds), Wells Fargo Master Trust and Wells Fargo Variable Trust are parties to a $350,000,000 revolving credit agreement whereby each Fund is permitted to use bank borrowings for temporary or emergency purposes, such as to fund shareholder redemption requests. Interest under the credit agreement is charged to each Fund based on a borrowing rate equal to the higher of the Federal Funds rate in effect on that day plus 1.25% or the overnight LIBOR rate in effect on that day plus 1.25%. In addition, an annual commitment fee equal to 0.25% of the unused balance is allocated to each participating fund.
For the six months ended November 30, 2020, there were no borrowings by each Fund under the agreement.
8. INDEMNIFICATION
Under the Funds’ organizational documents, the officers and Trustees have been granted certain indemnification rights against certain liabilities that may arise out of performance of their duties to each Fund. Each Fund has entered into a separate agreement with each Trustee that converts indemnification rights currently existing under the Fund’s organizational documents into contractual rights that cannot be changed in the future without the consent of the Trustee. Additionally, in the normal course of business, each Fund may enter into contracts with service providers that contain a variety of indemnification clauses. Each Fund’s maximum exposure under these arrangements is dependent on future claims that may be made against the Fund and, therefore, cannot be estimated.
9. NEW ACCOUNTING PRONOUNCEMENT
In August 2018, FASB issued Accounting Standards Update (“ASU”) No. 2018-13, Fair Value Measurement (Topic 820) Disclosure Framework—Changes to the Disclosure Requirements for Fair Value Measurement. ASU 2018-13 updates the disclosure requirements on fair value measurements in Topic 820, Fair Value Measurements. The amendments are effective for fiscal years, and interim periods within those fiscal years, beginning after December 15, 2019. Management has adopted this guidance which did not have a material impact on the financial statements.
10. CORONAVIRUS (COVID-19) PANDEMIC
On March 11, 2020, the World Health Organization announced that it had made the assessment that coronavirus disease 2019 (“COVID-19”) is a pandemic. The impacts of COVID-19 are adversely affecting the entire global economy, individual companies and investment products, and the market in general. There is significant uncertainty around the extent and duration of business disruptions related to COVID-19 and the impacts may be short term or may last for an extended period of time. The risk of further spreading of COVID-19 has led to significant uncertainty and volatility in the financial markets.
62 | Wells Fargo Multi-Asset Funds
Other information (unaudited)
PROXY VOTING INFORMATION
A description of the policies and procedures used to determine how to vote proxies relating to portfolio securities is available without charge, upon request, by calling 1-800-222-8222, visiting our website at wfam.com, or visiting the SEC website at sec.gov. Information regarding how the proxies related to portfolio securities were voted during the most recent 12-month period ended June 30 is available on the website at wfam.com or by visiting the SEC website at sec.gov.
QUARTERLY PORTFOLIO HOLDINGS INFORMATION
The Funds file their complete schedule of portfolio holdings with the SEC for the first and third quarters of each fiscal year as an exhibit to their reports on Form N-PORT. Shareholders may view the filed Form N-PORT by visiting the SEC website at sec.gov.
Wells Fargo Multi-Asset Funds | 63
Other information (unaudited)
BOARD OF TRUSTEES AND OFFICERS
Each of the Trustees and Officers1 listed in the table below acts in identical capacities for each fund in the Wells Fargo family of funds, which consists of 144 mutual funds comprising the Wells Fargo Funds Trust, Wells Fargo Variable Trust, Wells Fargo Master Trust and four closed-end funds (collectively the “Fund Complex”). This table should be read in conjunction with the Prospectus and the Statement of Additional Information2. The mailing address of each Trustee and Officer is 525 Market Street, 12th Floor, San Francisco, CA 94105. Each Trustee and Officer serves an indefinite term, however, each Trustee serves such term until reaching the mandatory retirement age established by the Trustees.
Independent Trustees
| | | | | | |
Name and year of birth | | Position held and
length of service* | | Principal occupations during past five years or longer | | Current other
public company or
investment
company
directorships |
| | | |
William R. Ebsworth (Born 1957) | | Trustee, since 2015 | | Retired. From 1984 to 2013, equities analyst, portfolio manager, research director and chief investment officer at Fidelity Management and Research Company in Boston, Tokyo, and Hong Kong, and retired in 2013 as Chief Investment Officer of Fidelity Strategic Advisers, Inc. where he led a team of investment professionals managing client assets. Prior thereto, Board member of Hong Kong Securities Clearing Co., Hong Kong Options Clearing Corp., the Thailand International Fund, Ltd., Fidelity Investments Life Insurance Company, and Empire Fidelity Investments Life Insurance Company. Audit Committee Chair and Investment Committee Chair of the Vincent Memorial Hospital Endowment (non-profit organization). Mr. Ebsworth is a CFA® charterholder. | | N/A |
| | | |
Jane A. Freeman (Born 1953) | | Trustee, since 2015; Chair Liaison, since 2018 | | Retired. From 2012 to 2014 and 1999 to 2008, Chief Financial Officer of Scientific Learning Corporation. From 2008 to 2012, Ms. Freeman provided consulting services related to strategic business projects. Prior to 1999, Portfolio Manager at Rockefeller & Co. and Scudder, Stevens & Clark. Board member of the Harding Loevner Funds from 1996 to 2014, serving as both Lead Independent Director and chair of the Audit Committee. Board member of the Russell Exchange Traded Funds Trust from 2011 to 2012 and the chair of the Audit Committee. Ms. Freeman is also an inactive Chartered Financial Analyst. | | N/A |
| | | |
Isaiah Harris, Jr. (Born 1952) | | Trustee, since 2009; Audit Committee Chair, since 2019 | | Retired. Chairman of the Board of CIGNA Corporation since 2009, and Director since 2005. From 2003 to 2011, Director of Deluxe Corporation. Prior thereto, President and CEO of BellSouth Advertising and Publishing Corp. from 2005 to 2007, President and CEO of BellSouth Enterprises from 2004 to 2005 and President of BellSouth Consumer Services from 2000 to 2003. Emeritus member of the Iowa State University Foundation Board of Governors. Emeritus Member of the Advisory Board of Iowa State University School of Business. Advisory Board Member, Palm Harbor Academy (private school). Mr. Harris is a certified public accountant (inactive status). | | CIGNA Corporation |
| | | |
Judith M. Johnson (Born 1949) | | Trustee, since 2008 | | Retired. Prior thereto, Chief Executive Officer and Chief Investment Officer of Minneapolis Employees Retirement Fund from 1996 to 2008. Ms. Johnson is an attorney, certified public accountant and a certified managerial accountant. | | N/A |
| | | |
David F. Larcker (Born 1950) | | Trustee, since 2009 | | James Irvin Miller Professor of Accounting at the Graduate School of Business (Emeritus), Stanford University, Director of the Corporate Governance Research Initiative and Senior Faculty of The Rock Center for Corporate Governance since 2006. From 2005 to 2008, Professor of Accounting at the Graduate School of Business, Stanford University. Prior thereto, Ernst & Young Professor of Accounting at The Wharton School, University of Pennsylvania from 1985 to 2005. | | N/A |
64 | Wells Fargo Multi-Asset Funds
Other information (unaudited)
| | | | | | |
Name and year of birth | | Position held and
length of service* | | Principal occupations during past five years or longer | | Current other
public company or
investment
company
directorships |
| | | |
Olivia S. Mitchell (Born 1953) | | Trustee, since 2006; Nominating and Governance Committee Chair, since 2018 | | International Foundation of Employee Benefit Plans Professor, Wharton School of the University of Pennsylvania since 1993. Director of Wharton’s Pension Research Council and Boettner Center on Pensions & Retirement Research, and Research Associate at the National Bureau of Economic Research. Previously, Cornell University Professor from 1978 to 1993. | | N/A |
| | | |
Timothy J. Penny (Born 1951) | | Trustee, since 1996; Chair, since 2018 | | President and Chief Executive Officer of Southern Minnesota Initiative Foundation, a non-profit organization, since 2007. Member of the Board of Trustees of NorthStar Education Finance, Inc., a non-profit organization, since 2007. | | N/A |
| | | |
James G. Polisson (Born 1959) | | Trustee, since 2018 | | Retired. Chief Marketing Officer, Source (ETF) UK Services, Ltd, from 2015 to 2017. From 2012 to 2015, Principal of The Polisson Group, LLC, a management consulting, corporate advisory and principal investing company. Chief Executive Officer and Managing Director at Russell Investments, Global Exchange Traded Funds from 2010 to 2012. Managing Director of Barclays Global Investors from 1998 to 2010 and Global Chief Marketing Officer for iShares and Barclays Global Investors from 2000 to 2010. Trustee of the San Francisco Mechanics’ Institute, a non-profit organization, from 2013 to 2015. Board member of the Russell Exchange Traded Fund Trust from 2011 to 2012. Director of Barclays Global Investors Holdings Deutschland GmbH from 2006 to 2009. Mr. Polisson is an attorney and has a retired status with the Massachusetts and District of Columbia Bar Associations. | | N/A |
| | | |
Pamela Wheelock (Born 1959) | | Trustee, since January 2020; previously Trustee from January 2018 to July 2019 | | Board member of the Destination Medical Center Economic Development Agency, Rochester, Minnesota since 2019. Interim President of the McKnight Foundation from January to September 2020. Acting Commissioner, Minnesota Department of Human Services, July 2019 through September 2019. Human Services Manager (part-time), Minnesota Department of Human Services, October 2019 through December 2019. Chief Operating Officer, Twin Cities Habitat for Humanity from 2017 to 2019. Vice President of University Services, University of Minnesota from 2012 to 2016. Prior thereto, on the Board of Directors, Governance Committee and Finance Committee for the Minnesota Philanthropy Partners (Saint Paul Foundation) from 2012 to 2018, Interim Chief Executive Officer of Blue Cross Blue Shield of Minnesota from 2011 to 2012, Chairman of the Board from 2009 to 2012 and Board Director from 2003 to 2015. Vice President, Leadership and Community Engagement, Bush Foundation, Saint Paul, Minnesota (a private foundation) from 2009 to 2011. Executive Vice President and Chief Financial Officer, Minnesota Sports and Entertainment from 2004 to 2009 and Senior Vice President from 2002 to 2004. Executive Vice President of the Minnesota Wild Foundation from 2004 to 2008. Commissioner of Finance, State of Minnesota, from 1999 to 2002. Currently Board Chair of the Minnesota Wild Foundation since 2010. | | N/A |
| * | Length of service dates reflect the Trustee’s commencement of service with the Trust’s predecessor entities, where applicable. |
Wells Fargo Multi-Asset Funds | 65
Other information (unaudited)
Officers
| | | | |
Name and year of birth | | Position held and
length of service | | Principal occupations during past five years or longer |
| | |
Andrew Owen (Born 1960) | | President, since 2017 | | Executive Vice President of Wells Fargo & Company and Head of Affiliated Managers, Wells Fargo Asset Management, since 2014. In addition, Mr. Owen is currently President, Chief Executive Officer and Director of Wells Fargo Funds Management, LLC since 2017. Prior thereto, Executive Vice President responsible for marketing, investments and product development for Wells Fargo Funds Management, LLC, from 2009 to 2014. |
| | |
Jeremy DePalma1 (Born 1974) | | Treasurer, since 2012 | | Senior Vice President of Wells Fargo Funds Management, LLC since 2009. Senior Vice President of Evergreen Investment Management Company, LLC from 2008 to 2010 and head of the Fund Reporting and Control Team within Fund Administration from 2005 to 2010. |
| | |
Michelle Rhee (Born 1966) | | Chief Legal Officer, since 2019 | | Secretary of Wells Fargo Funds Management, LLC and Chief Legal Counsel of Wells Fargo Asset Management since 2018. Deputy General Counsel of Wells Fargo Bank, N.A. since 2020 and Assistant General Counsel of Wells Fargo Bank, N.A. from 2018 to 2020. Associate General Counsel and Managing Director of Bank of America Corporation from 2004 to 2018. |
| | |
Catherine Kennedy (Born 1969) | | Secretary, since 2019 | | Vice President of Wells Fargo Funds Management, LLC and Senior Counsel of the Wells Fargo Legal Department since 2010. Vice President and Senior Counsel of Evergreen Investment Management Company, LLC from 1998 to 2010. |
| | |
Michael H. Whitaker (Born 1967) | | Chief Compliance Officer, since 2016 | | Chief Compliance Officer of Wells Fargo Asset Management since 2016. Senior Vice President and Chief Compliance Officer for Fidelity Investments from 2007 to 2016. |
| 1 | Jeremy DePalma acts as Treasurer of 77 funds in the Fund Complex. |
| 2 | The Statement of Additional Information includes additional information about the Trustees and is available, without charge, upon request, by calling 1-800-222-8222 or by visiting the website at wfam.com. |
66 | Wells Fargo Multi-Asset Funds
This page is intentionally left blank.
This page is intentionally left blank.

For more information
More information about Wells Fargo Funds is available free upon request. To obtain literature, please write, visit the Funds’ website, or call:
Wells Fargo Funds
P.O. Box 219967
Kansas City, MO 64121-9967
Website: wfam.com
Individual investors: 1-800-222-8222
Retail investment professionals: 1-888-877-9275
Institutional investment professionals: 1-866-765-0778

This report and the financial statements contained herein are submitted for the general information of the shareholders of Wells Fargo Funds. If this report is used for promotional purposes, distribution of the report must be accompanied or preceded by a current prospectus. Before investing, please consider the investment objectives, risks, charges, and expenses of the investment. For a current prospectus and, if available, a summary prospectus, containing this information, call 1-800-222-8222 or visit the Funds’ website at wfam.com. Read the prospectus carefully before you invest or send money.
Wells Fargo Asset Management (WFAM) is the trade name for certain investment advisory/management firms owned by Wells Fargo & Company. These firms include but are not limited to Wells Capital Management Incorporated and Wells Fargo Funds Management, LLC. Certain products managed by WFAM entities are distributed by Wells Fargo Funds Distributor, LLC (a broker-dealer and Member FINRA).
This material is for general informational and educational purposes only and is NOT intended to provide investment advice or a recommendation of any kind—including a recommendation for any specific investment, strategy, or plan.
INVESTMENT PRODUCTS: NOT FDIC INSURED ◾ NO BANK GUARANTEE ◾ MAY LOSE VALUE
© 2021 Wells Fargo & Company. All rights reserved.
PAR-1220-00738 01-20
SWBP/SAR102 11-20
Not applicable.
| ITEM 3. | AUDIT COMMITTEE FINANCIAL EXPERT |
Not applicable.
| ITEM 4. | PRINCIPAL ACCOUNTANT FEES AND SERVICES |
Not applicable.
| ITEM 5. | AUDIT COMMITTEE OF LISTED REGISTRANTS |
Not applicable.
A Portfolio of Investments for each series of Wells Fargo Funds Trust is included as part of the report to shareholders filed under Item 1 of this Form.
| ITEM 7. | DISCLOSURE OF PROXY VOTING POLICIES AND PROCEDURES FOR CLOSED-END MANAGEMENT INVESTMENT COMPANIES |
Not applicable.
| ITEM 8. | PORTFOLIO MANAGERS OF CLOSED-END MANAGEMENT INVESTMENT COMPANIES |
Not applicable.
| ITEM 9. | PURCHASES OF EQUITY SECURITIES BY CLOSED-END MANAGEMEENT INVESTMENT COMPANY AND AFFILIATED PURCHASERS |
Not applicable.
| ITEM 10. | SUBMISSION OF MATTERS TO A VOTE OF SECURITY HOLDERS |
There have been no material changes to the procedures by which shareholders may recommend nominees to the registrant’s Board of Trustees that have been implemented since the registrant’s last provided disclosure in response to the requirements of this Item.
| ITEM 11. | CONTROLS AND PROCEDURES |
(a) The President and Treasurer have concluded that the Wells Fargo Funds Trust disclosure controls and procedures (as defined in Rule 30a-3(c) under the Investment Company Act of 1940) provide reasonable assurances that material information relating to the registrant is made known to them by the appropriate persons, based on their evaluation of these controls and procedures as of a date within 90 days of the filing of this report.
(b) There were no significant changes in the registrant’s internal controls over financial reporting (as defined in Rule 30a-3(d) under the Investment Company Act of 1940) that occurred during the most recent fiscal half-year of the period covered by this report that materially affected, or is reasonably likely to materially affect, the registrant’s internal control over financial reporting.
| ITEM 12. | DISCLOSURES OF SECURITIES LENDING ACTIVITES FOR CLOSED-END MANAGEMENT INVESTMENT COMPANIES |
Not applicable.
(a)(1) Not applicable.
(a)(2) Certifications pursuant to Section 302 of the Sarbanes-Oxley Act of 2002.
(b) Certifications pursuant to Section 906 of the Sarbanes-Oxley Act of 2002.
SIGNATURES
Pursuant to the requirements of the Securities Exchange Act of 1934 and the Investment Company Act of 1940, the registrant has duly caused this report to be signed on its behalf by the undersigned, thereunto duly authorized.
| | |
| Wells Fargo Funds Trust |
| |
| By: | | |
| | /s/ Andrew Owen |
| |
| | Andrew Owen |
| | President |
| |
| Date: | | January 27, 2021 |
Pursuant to the requirements of the Securities Exchange Act of 1934 and the Investment Company Act of 1940, this report has been signed below by the following persons on behalf of the registrant and in the capacities and on the date indicated.
| | |
| Wells Fargo Funds Trust |
| |
| By: | | |
| | /s/ Andrew Owen |
| |
| | Andrew Owen |
| | President |
| |
| Date: | | January 27, 2021 |
| | |
| By: | | |
| | /s/ Nancy Wiser |
| |
| | Nancy Wiser |
| | Treasurer |
| |
| Date: | | January 27, 2021 |
| | |
| By: | | |
| |
| | /s/ Jeremy DePalma |
| |
| | Jeremy DePalma |
| | Treasurer |
| Date: | | January 27, 2021 |