
UNITED STATES
SECURITIES AND EXCHANGE COMMISSION
Washington, D.C. 20549
FORM N-CSRS
CERTIFIED SHAREHOLDER REPORT OF REGISTERED
MANAGEMENT INVESTMENT COMPANIES
Investment Company Act file number: 811-09253
Wells Fargo Funds Trust
(Exact name of registrant as specified in charter)
525 Market St., San Francisco, CA 94105
(Address of principal executive offices) (Zip code)
Catherine Kennedy
Wells Fargo Funds Management, LLC
525 Market St., San Francisco, CA 94105
(Name and address of agent for service)
Registrant’s telephone number, including area code: 800-222-8222
Date of fiscal year end: March 31
Registrant is making a filing for 7 of its series:
Wells Fargo Intrinsic Small Cap Value Fund, Wells Fargo Disciplined Small Cap Fund, Wells Fargo Special Small Cap Value Fund, Wells Fargo Fundamental Small Cap Growth Fund, Wells Fargo Precious Metals Fund, Wells Fargo Specialized Technology Fund, and Wells Fargo Utility and Telecommunications Fund.
Date of reporting period: September 30, 2020
ITEM 1. REPORT TO STOCKHOLDERS
Semi-Annual Report
September 30, 2020
Wells Fargo Disciplined Small Cap Fund
Beginning on January 1, 2021, as permitted by new regulations adopted by the Securities and Exchange Commission, paper copies of the Wells Fargo Funds’ annual and semi-annual shareholder reports issued after this date will no longer be sent by mail, unless you specifically request paper copies of the reports. Instead, the reports will be made available on the Funds’ website, and you will be notified by mail each time a report is posted and provided with a website address to access the report.
If you already elected to receive shareholder reports electronically, you will not be affected by this change and you need not take any action. You may elect to receive shareholder reports and other communications from the Fund electronically at any time by contacting your financial intermediary (such as a broker-dealer or bank) or, if you are a direct investor, by calling 1-800-222-8222 or by enrolling at wellsfargo.com/advantagedelivery.
You may elect to receive all future reports in paper free of charge. If you invest through a financial intermediary, you can contact your financial intermediary to request that you continue to receive paper copies of your shareholder reports; if you invest directly with the Fund, you can call 1-800-222-8222. Your election to receive reports in paper will apply to all Wells Fargo Funds held in your account with your financial intermediary or, if you are a direct investor, to all Wells Fargo Funds that you hold.
|
|
|
Reduce clutter. Save trees. |
Sign up for electronic delivery of prospectuses and shareholder reports at wellsfargo.com/
advantagedelivery |
The views expressed and any forward-looking statements are as of September 30, 2020, unless otherwise noted, and are those of the Fund’s portfolio managers and/or Wells Fargo Asset Management. Discussions of individual securities, or the markets generally, or any Wells Fargo Fund are not intended as individual recommendations. Future events or results may vary significantly from those expressed in any forward-looking statements. The views expressed are subject to change at any time in response to changing circumstances in the market. Wells Fargo Asset Management and the Fund disclaim any obligation to publicly update or revise any views expressed or forward-looking statements.
INVESTMENT PRODUCTS: NOT FDIC INSURED ◾ NO BANK GUARANTEE ◾ MAY LOSE VALUE
Wells Fargo Disciplined Small Cap Fund | 1
Letter to shareholders (unaudited)

Andrew Owen
President
Wells Fargo Funds
“As the six-month period began in April, markets rebounded strongly from an earlier sharp sell-off, fueled by unprecedented government and central bank stimulus measures.”
Dear Shareholder:
We are pleased to offer you this semi-annual report for the Wells Fargo Disciplined Small Cap Fund for the six-month period that ended September 30, 2020. Global stock markets experienced unprecedented volatility in response to drastic government measures to stop the spread of COVID-19 at the expense of short-term economic output. However, financial markets rebounded from April on to more than offset earlier losses as central banks bolstered capital markets and confidence. Stocks rallied broadly with U.S. equities leading the way while bonds had more modest returns for the six-month period.
For the period, U.S. stocks, based on the S&P 500 Index,1 returned 31.31% and international stocks, as measured by the MSCI ACWI ex USA Index (Net),2 gained 23.38%. The MSCI EM Index (Net)3 gained a robust 29.37%. Among bond investments, the Bloomberg Barclays U.S. Aggregate Bond Index4 added 3.53%, the Bloomberg Barclays Global Aggregate ex-USD Index5 returned 7.66%, the Bloomberg Barclays Municipal Bond Index6 had a 3.99% return, and the ICE BofA U.S. High Yield Index7 gained 14.76%.
Concerns about COVID-19 took over the market.
As the six-month period began in April, markets rebounded strongly from an earlier sharp sell-off, fueled by unprecedented government and central bank stimulus measures. The U.S. economy contracted by an annualized 5.0% pace in the first quarter, with 30 million new unemployment insurance claims in six weeks. In the eurozone, first-quarter real gross domestic product (GDP) shrank 3.8%, with the composite April Flash Purchasing Managers’ Index (PMI), a monthly survey of purchasing managers, falling to an all-time low of 13.5. The European Central Bank expanded its quantitative easing to include the purchase of additional government bonds of countries with the greatest virus-related need, including Italy and Spain. China’s first-quarter GDP fell by 6.8% year over year. However, retail sales, production, and investment showed signs of recovery. Extreme oil-price volatility continued as global supply far exceeded demand.
The equity market rebound continued in May, with widespread strong monthly gains. Investors regained confidence on reports of early signs of success in human trials of a COVID-19 vaccine. Growth stocks continued to outperform value stocks while returns on global government bonds were generally flat. In the U.S., a gap grew between the stock market rebound and devastating economic data points, including an April unemployment rate of 14.7%, the highest level since World War II. PMIs continued to reflect weakening activity in May in both the manufacturing and services sectors. U.S.
| 1 | The S&P 500 Index consists of 500 stocks chosen for market size, liquidity, and industry group representation. It is a market-value-weighted index with each stock’s weight in the index proportionate to its market value. You cannot invest directly in an index. |
| 2 | The Morgan Stanley Capital International (MSCI) All Country World Index (ACWI) ex USA Index (Net) is a free-float-adjusted market-capitalization-weighted index that is designed to measure the equity market performance of developed and emerging markets, excluding the United States. Source: MSCI. MSCI makes no express or implied warranties or representations and shall have no liability whatsoever with respect to any MSCI data contained herein. The MSCI data may not be further redistributed or used as a basis for other indices or any securities or financial products. This report is not approved, reviewed, or produced by MSCI. You cannot invest directly in an index. |
| 3 | The MSCI Emerging Markets (EM) Index (Net) is a free-float-adjusted market-capitalization-weighted index that is designed to measure equity market performance of emerging markets. You cannot invest directly in an index. |
| 4 | The Bloomberg Barclays U.S. Aggregate Bond Index is a broad-based benchmark that measures the investment-grade, U.S. dollar-denominated, fixed-rate taxable bond market, including Treasuries, government-related and corporate securities, mortgage-backed securities (agency fixed-rate and hybrid adjustable-rate mortgage pass-throughs), asset-backed securities, and commercial mortgage-backed securities. You cannot invest directly in an index. |
| 5 | The Bloomberg Barclays Global Aggregate ex-USD Index is an unmanaged index that provides a broad-based measure of the global investment-grade fixed-income markets excluding the U.S. dollar-denominated debt market. You cannot invest directly in an index. |
| 6 | The Bloomberg Barclays Municipal Bond Index is an unmanaged index composed of long-term tax-exempt bonds with a minimum credit rating of Baa. You cannot invest directly in an index. |
| 7 | The ICE BofA U.S. High Yield Index is a market-capitalization-weighted index of domestic and Yankee high-yield bonds. The index tracks the performance of high-yield securities traded in the U.S. bond market. You cannot invest directly in an index. Copyright 2020. ICE Data Indices, LLC. All rights reserved. |
2 | Wells Fargo Disciplined Small Cap Fund
Letter to shareholders (unaudited)
corporate earnings reports indicated a 14% year-over-year contraction in earnings from the first quarter of 2019. However, high demand for technology, driven by remote activity, helped maintain robust information technology sector earnings, which helped drive leading technology stocks higher.
Financial markets posted widely positive returns in June despite ongoing economic weakness and high levels of uncertainty on the containment of COVID-19 and the timing of an effective vaccine. There were hopeful signs as economies reopened, with U.S. and U.K. retail sales rebounding sharply in May. However, year over year, sales remained depressed. Vitally important to market sentiment was the ongoing commitment by central banks globally to do all they could to provide economic support through liquidity and low borrowing costs. U.S. economic activity was aided by one-time $1,200 stimulus checks and $600 bonus weekly unemployment benefits that expired at the end of July. However, unemployment remained historically high but eased from 14.7% in April to 11.1% in June. At month-end, numerous states reported increases in COVID-19 cases. China’s economic recovery picked up momentum in June, though it remained far from a full recovery.
July was a broadly positive month for both global equities and fixed income. However, economic data and a resurgence of COVID-19 cases pointed to the vulnerability of the global economy and the ongoing imperative to regain control of the pandemic. Second-quarter GDP shrank from the previous quarter by 9.5% and 12.1% in the U.S. and the eurozone, respectively. In contrast, China reported a 3.2% year-over-year expansion in its second-quarter GDP. U.S. unemployment remained high despite adding 1.8 million jobs in July, with a double-digit jobless rate persisting. However, manufacturing activity grew in both the U.S. and the eurozone. In Asia, while China’s manufacturing sector continued to expand, activity in Japan and South Korea contracted. In July, a rising concern was the rapid and broad reemergence of COVID-19 infections.
The stock market continued to rally in August despite concerns over rising numbers of COVID-19 cases in the United States and several European countries, including France and Spain, as well as the expiration of the $600 weekly bonus unemployment benefit at the end of July. U.S. stocks had strong monthly gains, led by the FAANG stocks—Facebook, Apple, Amazon, Netflix, and Google (Alphabet)—which dominate these indices and continued to rally. U.S. stocks generally surpassed other broadly positive global equity performance while fixed-income market monthly returns were broadly flat. Generally stronger-than-expected second-quarter earnings boosted investor sentiment along with the U.S. Federal Reserve’s announcement of a policy shift that will likely lead to longer-term low interest rates and supportive monetary policy. The U.S. flash PMIs for both manufacturing and services beat expectations while U.S. housing market indicators were strong. In Europe, retail sales expanded and consumer confidence remained steady. Overall, developed markets performed better than emerging market equities for the month of August as people took comfort in better-known equities in perceived safer markets.
Stocks grew more volatile in September on mixed economic data. U.S. PMIs showed solid growth in economic activity in both manufacturing and services. However, six months after the bottom fell out of the labor market in the early spring, only half of the 22 million jobs lost had returned. The U.S. unemployment rate fell to 7.9% in September, the fifth straight month of improvement but far higher than the 3.5% pre-COVID-19 rate. Only 661,000 jobs were added for the month, down from 1.5 million in August. Meanwhile, a reported 2.3 million people have given up looking for work. With U.S. Congress failing to pass further fiscal relief and uncertainties surrounding a possible vaccine, doubts crept back into the financial markets. In the U.K., a lack of progress in Brexit talks with the European Union weighed on markets. China’s economy picked up steam, however, with growth fueled by increased global demand and China’s service sector had its strongest PMI reading in seven years.
“The stock market continued to rally in August despite concerns over rising numbers of COVID-19 cases in the United States and several European countries, including France and Spain, as well as the expiration of the $600 weekly bonus unemployment benefit at the end of July.”
Wells Fargo Disciplined Small Cap Fund | 3
Letter to shareholders (unaudited)
|
|
|
For further information about your Fund, contact your investment professional, visit our website at wfam.com, or call us directly at 1-800-222-8222. |
Don’t let short-term uncertainty derail long-term investment goals.
Periods of investment uncertainty can present challenges, but experience has taught us that maintaining long-term investment goals can be an effective way to plan for the future. To help you create a sound strategy based on your personal goals and risk tolerance, Wells Fargo Funds offers more than 100 mutual funds spanning a wide range of asset classes and investment styles. Although diversification cannot guarantee an investment profit or prevent losses, we believe it can be an effective way to manage investment risk and potentially smooth out overall portfolio performance. We encourage investors to know their investments and to understand that appropriate levels of risk-taking may unlock opportunities.
Thank you for choosing to invest with Wells Fargo Funds. We appreciate your confidence in us and remain committed to helping you meet your financial needs.
Sincerely,

Andrew Owen
President
Wells Fargo Funds
4 | Wells Fargo Disciplined Small Cap Fund
This page is intentionally left blank.
Performance highlights (unaudited)
Investment objective
The Fund seeks long-term capital appreciation.
Manager
Wells Fargo Funds Management, LLC
Subadviser
Wells Capital Management Incorporated
Portfolio managers
Justin P. Carr, CFA®‡
Robert M. Wicentowski, CFA®‡
Average annual total returns (%) as of September 30, 2020
| | | | | | | | | | | | | | | | | | | | | | | | | | | | | | | | | | |
| | | | |
| | | | | Including sales charge | | | Excluding sales charge | | | Expense ratios1 (%) | |
| | | | | | | | | |
| | | Inception date | | 1 year | | | 5 year | | | 10 year | | | 1 year | | | 5 year | | | 10 year | | | Gross | | | Net2 | |
| | | | | | | | | | |
| Class A (WDSAX)3 | | 7-31-2018 | | | -9.75 | | | | 3.15 | | | | 7.10 | | | | -4.25 | | | | 4.37 | | | | 7.73 | | | | 1.32 | | | | 0.93 | |
| | | | | | | | | | |
| Class R6 (WSCJX)4 | | 10-31-2016 | | | – | | | | – | | | | – | | | | -4.26 | | | | 4.50 | | | | 7.83 | | | | 0.89 | | | | 0.50 | |
| | | | | | | | | | |
| Administrator Class (NVSOX) | | 8-1-1993 | | | – | | | | – | | | | – | | | | -4.26 | | | | 4.25 | | | | 7.67 | | | | 1.24 | | | | 0.85 | |
| | | | | | | | | | |
| Institutional Class (WSCOX)5 | | 10-31-2014 | | | – | | | | – | | | | – | | | | -4.01 | | | | 4.52 | | | | 7.83 | | | | 0.99 | | | | 0.60 | |
| | | | | | | | | | |
| Russell 2000® Index6 | | – | | | – | | | | – | | | | – | | | | 0.39 | | | | 8.00 | | | | 9.85 | | | | – | | | | – | |
Figures quoted represent past performance, which is no guarantee of future results, and do not reflect taxes that a shareholder may pay on an investment in a fund. Investment return and principal value of an investment will fluctuate so that an investor’s shares, when redeemed, may be worth more or less than their original cost. Performance shown without sales charges would be lower if sales charges were reflected. Current performance may be lower or higher than the performance data quoted, which assumes the reinvestment of dividends and capital gains. Current month-end performance is available on the Fund’s website, wfam.com.
Index returns do not include transaction costs associated with buying and selling securities, any mutual fund fees or expenses, or any taxes. It is not possible to invest directly in an index.
For Class A shares, the maximum front-end sales charge is 5.75%. Performance including a contingent deferred sales charge assumes the sales charge for the corresponding time period. Class R6, Administrator Class, and Institutional Class shares are sold without a front-end sales charge or contingent deferred sales charge.
Stock values fluctuate in response to the activities of individual companies and general market and economic conditions. Smaller-company stocks tend to be more volatile and less liquid than those of larger companies. The use of derivatives may reduce returns and/or increase volatility. Consult the Fund’s prospectus for additional information on these and other risks.
Please see footnotes on page 7.
6 | Wells Fargo Disciplined Small Cap Fund
Performance highlights (unaudited)
| | | | |
|
| Ten largest holdings (%) as of September 30, 20207 | |
| | |
Helen of Troy Limited | | | 0.84 | |
| | |
Penn National Gaming Incorporated | | | 0.84 | |
| | |
Builders FirstSource Incorporated | | | 0.79 | |
| | |
Performance Food Group Company | | | 0.78 | |
| | |
Deckers Outdoor Corporation | | | 0.76 | |
| | |
Stamps.com Incorporated | | | 0.75 | |
| | |
Taylor Morrison Home Corporation | | | 0.73 | |
| | |
SPS Commerce Incorporated | | | 0.69 | |
| | |
EMCOR Group Incorporated | | | 0.68 | |
| | |
Green Dot Corporation Class A | | | 0.68 | |
|
|
| Sector allocation as of September 30, 20208 |
|
 |
| ‡ | CFA® and Chartered Financial Analyst® are trademarks owned by CFA Institute. |
| 1 | Reflects the expense ratios as stated in the most recent prospectuses. The expense ratios shown are subject to change and may differ from the annualized expense ratios shown in the financial highlights of this report. |
| 2 | The manager has contractually committed through July 31, 2021, to waive fees and/or reimburse expenses to the extent necessary to cap total annual fund operating expenses after fee waivers at 0.93% for Class A, 0.50% for Class R6, 0.85% for Administrator Class, and 0.60% for Institutional Class. Brokerage commissions, stamp duty fees, interest, taxes, acquired fund fees and expenses (if any), and extraordinary expenses are excluded from the expense caps. Prior to or after the commitment expiration date, the caps may be increased or the commitment to maintain the caps may be terminated only with the approval of the Board of Trustees. Without these caps, the Fund’s returns would have been lower. The expense ratio paid by an investor is the net expense ratio (the total annual fund operating expenses after fee waivers) as stated in the prospectuses. |
| 3 | Historical performance shown for the Class A shares prior to their inception reflects the performance of the Administrator Class shares, and is adjusted to reflect the higher expenses and sales charges of the Class A shares. |
| 4 | Historical performance shown for the Class R6 shares prior to their inception reflects the performance of the Institutional Class shares, and includes the higher expenses applicable to the Institutional Class shares. If these expenses had been included, returns for the Class R6 would be higher. |
| 5 | Historical performance shown for the Institutional Class shares prior to their inception reflects the performance of the Administrator Class shares, and includes the higher expenses applicable to the Administrator Class shares. If these expenses had been included, returns for the Institutional Class shares would be higher. |
| 6 | The Russell 2000® Index measures the performance of the 2,000 smallest companies in the Russell 3000® Index, which represents approximately 8% of the total market capitalization of the Russell 3000® Index. You cannot invest directly in an index. |
| 7 | The ten largest holdings, excluding cash, cash equivalents and any money market funds, are calculated based on the value of the investments divided by total net assets of the Fund. Holdings are subject to change and may have changed since the date specified. |
| 8 | Amounts are calculated based on the total long-term investments of the Fund. These amounts are subject to change and may have changed since the date specified. |
Wells Fargo Disciplined Small Cap Fund | 7
Fund expenses (unaudited)
As a shareholder of the Fund, you incur two types of costs: (1) transaction costs, including sales charges (loads) on purchase payments and contingent deferred sales charges (if any) on redemptions and (2) ongoing costs, including management fees, shareholder servicing fees, and other Fund expenses. This example is intended to help you understand your ongoing costs (in dollars) of investing in the Fund and to compare these costs with the ongoing costs of investing in other mutual funds.
The example is based on an investment of $1,000 invested at the beginning of the six-month period and held for the entire period from April 1, 2020 to September 30, 2020.
Actual expenses
The “Actual” line of the table below provides information about actual account values and actual expenses. You may use the information in this line, together with the amount you invested, to estimate the expenses that you paid over the period. Simply divide your account value by $1,000 (for example, an $8,600 account value divided by $1,000 = 8.6), then multiply the result by the number in the “Actual” line under the heading entitled “Expenses paid during period” for your applicable class of shares to estimate the expenses you paid on your account during this period.
Hypothetical example for comparison purposes
The “Hypothetical” line of the table below provides information about hypothetical account values and hypothetical expenses based on the Fund’s actual expense ratio and an assumed rate of return of 5% per year before expenses, which is not the Fund’s actual return. The hypothetical account values and expenses may not be used to estimate the actual ending account balance or expenses you paid for the period. You may use this information to compare the ongoing costs of investing in the Fund and other funds. To do so, compare this 5% hypothetical example with the 5% hypothetical examples that appear in the shareholder reports of the other funds.
Please note that the expenses shown in the table are meant to highlight your ongoing costs only and do not reflect any transactional costs, such as sales charges (loads) and contingent deferred sales charges. Therefore, the “Hypothetical” line of the table is useful in comparing ongoing costs only and will not help you determine the relative total costs of owning different funds. In addition, if these transactional costs were included, your costs would have been higher.
| | | | | | | | | | | | | | | | |
| | | Beginning
account value
4-1-2020 | | | Ending
account value
9-30-2020 | | | Expenses
paid during
the period1 | | | Annualized net
expense ratio | |
| | | | | |
Class A | | | | | | | | | | | | | | | | |
| | | | |
Actual | | $ | 1,000.00 | | | $ | 1,308.82 | | | $ | 5.38 | | | | 0.93 | % |
| | | | |
Hypothetical (5% return before expenses) | | $ | 1,000.00 | | | $ | 1,020.41 | | | $ | 4.71 | | | | 0.93 | % |
| | | | | |
Class R6 | | | | | | | | | | | | | | | | |
| | | | |
Actual | | $ | 1,000.00 | | | $ | 1,310.57 | | | $ | 2.90 | | | | 0.50 | % |
| | | | |
Hypothetical (5% return before expenses) | | $ | 1,000.00 | | | $ | 1,022.56 | | | $ | 2.54 | | | | 0.50 | % |
| | | | | |
Administrator Class | | | | | | | | | | | | | | | | |
| | | | |
Actual | | $ | 1,000.00 | | | $ | 1,308.20 | | | $ | 4.92 | | | | 0.85 | % |
| | | | |
Hypothetical (5% return before expenses) | | $ | 1,000.00 | | | $ | 1,020.81 | | | $ | 4.31 | | | | 0.85 | % |
| | | | | |
Institutional Class | | | | | | | | | | | | | | | | |
| | | | |
Actual | | $ | 1,000.00 | | | $ | 1,309.84 | | | $ | 3.47 | | | | 0.60 | % |
| | | | |
Hypothetical (5% return before expenses) | | $ | 1,000.00 | | | $ | 1,022.06 | | | $ | 3.04 | | | | 0.60 | % |
| 1 | Expenses paid is equal to the annualized net expense ratio of each class multiplied by the average account value over the period, multiplied by the number of days in the most recent fiscal half-year divided by the number of days in the fiscal year (to reflect the one-half-year period). |
8 | Wells Fargo Disciplined Small Cap Fund
Portfolio of investments—September 30, 2020 (unaudited)
| | | | | | | | | | | | | | | | |
| | | | | | | | | Shares | | | Value | |
| Common Stocks: 96.46% | |
|
Communication Services: 1.33% | |
|
| Entertainment: 0.14% | |
Glu Mobile Incorporated † | | | | | | | | | | | 4,066 | | | $ | 31,200 | |
| | | | | | | | | | | | | | | | |
|
| Interactive Media & Services: 0.19% | |
QuinStreet Incorporated † | | | | | | | | | | | 2,583 | | | | 40,915 | |
| | | | | | | | | | | | | | | | |
|
| Media: 0.71% | |
Gray Television Incorporated † | | | | | | | | | | | 4,325 | | | | 59,555 | |
Nexstar Media Group Incorporated Class A | | | | | | | | | | | 1,045 | | | | 93,977 | |
| | | | |
| | | | | | | | | | | | | | | 153,532 | |
| | | | | | | | | | | | | | | | |
|
| Wireless Telecommunication Services: 0.29% | |
Shenandoah Telecommunications Company | | | | | | | | | | | 1,434 | | | | 63,720 | |
| | | | | | | | | | | | | | | | |
|
Consumer Discretionary: 13.50% | |
|
| Auto Components: 0.60% | |
Cooper Tire & Rubber Company | | | | | | | | | | | 2,132 | | | | 67,584 | |
Standard Motor Products Incorporated | | | | | | | | | | | 1,435 | | | | 64,073 | |
| | | | |
| | | | | | | | | | | | | | | 131,657 | |
| | | | | | | | | | | | | | | | |
|
| Diversified Consumer Services: 1.04% | |
Grand Canyon Education Incorporated † | | | | | | | | | | | 447 | | | | 35,733 | |
K12 Incorporated † | | | | | | | | | | | 2,320 | | | | 61,109 | |
Perdoceo Education Corporation † | | | | | | | | | | | 6,823 | | | | 83,514 | |
Strategic Education Incorporated | | | | | | | | | | | 513 | | | | 46,924 | |
| | | | |
| | | | | | | | | | | | | | | 227,280 | |
| | | | | | | | | | | | | | | | |
|
| Hotels, Restaurants & Leisure: 2.61% | |
Bloomin’ Brands Incorporated | | | | | | | | | | | 3,289 | | | | 50,223 | |
Brinker International Incorporated | | | | | | | | | | | 1,604 | | | | 68,523 | |
International Game Technology | | | | | | | | | | | 10,257 | | | | 114,160 | |
Marriott Vacations Worldwide Corporation | | | | | | | | | | | 776 | | | | 70,469 | |
Penn National Gaming Incorporated † | | | | | | | | | | | 2,429 | | | | 176,588 | |
The Cheesecake Factory Incorporated « | | | | | | | | | | | 1,641 | | | | 45,521 | |
Wingstop Incorporated | | | | | | | | | | | 303 | | | | 41,405 | |
| | | | |
| | | | | | | | | | | | | | | 566,889 | |
| | | | | | | | | | | | | | | | |
|
| Household Durables: 3.52% | |
Beazer Homes Incorporated † | | | | | | | | | | | 3,612 | | | | 47,678 | |
Helen of Troy Limited † | | | | | | | | | | | 914 | | | | 176,877 | |
Installed Building Products Incorporated † | | | | | | | | | | | 500 | | | | 50,875 | |
KB Home Incorporated | | | | | | | | | | | 1,908 | | | | 73,248 | |
La-Z-Boy Incorporated | | | | | | | | | | | 807 | | | | 25,525 | |
Meritage Corporation † | | | | | | | | | | | 752 | | | | 83,013 | |
Taylor Morrison Home Corporation † | | | | | | | | | | | 6,263 | | | | 154,007 | |
TopBuild Corporation † | | | | | | | | | | | 412 | | | | 70,324 | |
Universal Electronics Incorporated † | | | | | | | | | | | 2,208 | | | | 83,330 | |
| | | | |
| | | | | | | | | | | | | | | 764,877 | |
| | | | | | | | | | | | | | | | |
|
| Internet & Direct Marketing Retail: 0.97% | |
Stamps.com Incorporated † | | | | | | | | | | | 651 | | | | 156,858 | |
Stitch Fix Incorporated Class A †« | | | | | | | | | | | 1,986 | | | | 53,880 | |
| | | | |
| | | | | | | | | | | | | | | 210,738 | |
| | | | | | | | | | | | | | | | |
The accompanying notes are an integral part of these financial statements.
Wells Fargo Disciplined Small Cap Fund | 9
Portfolio of investments—September 30, 2020 (unaudited)
| | | | | | | | | | | | | | | | |
| | | | | | | | | Shares | | | Value | |
| Multiline Retail: 0.59% | |
Big Lots Stores Incorporated | | | | | | | | | | | 2,876 | | | $ | 128,270 | |
| | | | | | | | | | | | | | | | |
|
| Specialty Retail: 2.99% | |
Aaron’s Incorporated | | | | | | | | | | | 1,385 | | | | 78,460 | |
American Eagle Outfitters Incorporated | | | | | | | | | | | 2,337 | | | | 34,611 | |
Asbury Automotive Group Incorporated † | | | | | | | | | | | 965 | | | | 94,039 | |
Bed Bath & Beyond Incorporated | | | | | | | | | | | 6,164 | | | | 92,337 | |
Hibbett Sports Incorporated † | | | | | | | | | | | 3,068 | | | | 120,327 | |
Rent-A-Center Incorporated | | | | | | | | | | | 835 | | | | 24,958 | |
Sportsman’s Warehouse Holdings Incorporated † | | | | | | | | | | | 7,343 | | | | 105,078 | |
The ODP Corporation | | | | | | | | | | | 2,588 | | | | 50,337 | |
Zumiez Incorporated † | | | | | | | | | | | 1,836 | | | | 51,078 | |
| | | | |
| | | | | | | | | | | | | | | 651,225 | |
| | | | | | | | | | | | | | | | |
|
| Textiles, Apparel & Luxury Goods: 1.18% | |
Deckers Outdoor Corporation † | | | | | | | | | | | 728 | | | | 160,167 | |
Skechers USA Incorporated Class A † | | | | | | | | | | | 916 | | | | 27,682 | |
Steven Madden Limited | | | | | | | | | | | 3,507 | | | | 68,387 | |
| | | | |
| | | | | | | | | | | | | | | 256,236 | |
| | | | | | | | | | | | | | | | |
|
Consumer Staples: 3.84% | |
|
| Beverages: 0.66% | |
Boston Beer Company Incorporated Class A † | | | | | | | | | | | 99 | | | | 87,453 | |
National Beverage Corporation † | | | | | | | | | | | 818 | | | | 55,632 | |
| | | | |
| | | | | | | | | | | | | | | 143,085 | |
| | | | | | | | | | | | | | | | |
|
| Food & Staples Retailing: 1.27% | |
Performance Food Group Company † | | | | | | | | | | | 4,723 | | | | 163,510 | |
SpartanNash Company | | | | | | | | | | | 5,507 | | | | 90,039 | |
United Natural Foods Incorporated † | | | | | | | | | | | 1,590 | | | | 23,643 | |
| | | | |
| | | | | | | | | | | | | | | 277,192 | |
| | | | | | | | | | | | | | | | |
|
| Food Products: 0.93% | |
Fresh Del Monte Produce Incorporated | | | | | | | | | | | 1,834 | | | | 42,035 | |
John B. Sanfilippo & Son Incorporated | | | | | | | | | | | 752 | | | | 56,686 | |
Sanderson Farms Incorporated | | | | | | | | | | | 357 | | | | 42,115 | |
The Simply Good Foods Company † | | | | | | | | | | | 2,758 | | | | 60,814 | |
| | | | |
| | | | | | | | | | | | | | | 201,650 | |
| | | | | | | | | | | | | | | | |
|
| Personal Products: 0.98% | |
Medifast Incorporated | | | | | | | | | | | 676 | | | | 111,168 | |
USANA Health Sciences Incorporated † | | | | | | | | | | | 1,401 | | | | 103,184 | |
| | | | |
| | | | | | | | | | | | | | | 214,352 | |
| | | | | | | | | | | | | | | | |
|
Energy: 1.90% | |
|
| Energy Equipment & Services: 0.40% | |
Helix Energy Solutions Group Incorporated † | | | | | | | | | | | 5,348 | | | | 12,889 | |
Matrix Service Company † | | | | | | | | | | | 3,204 | | | | 26,753 | |
Nextier Oilfield Solutions Incorporated † | | | | | | | | | | | 25,682 | | | | 47,512 | |
| | | | |
| | | | | | | | | | | | | | | 87,154 | |
| | | | | | | | | | | | | | | | |
The accompanying notes are an integral part of these financial statements.
10 | Wells Fargo Disciplined Small Cap Fund
Portfolio of investments—September 30, 2020 (unaudited)
| | | | | | | | | | | | | | | | |
| | | | | | | | | Shares | | | Value | |
| Oil, Gas & Consumable Fuels: 1.50% | |
Ardmore Shipping Corporation | | | | | | | | | | | 7,590 | | | $ | 27,020 | |
Bonanza Creek Energy Incorporated † | | | | | | | | | | | 837 | | | | 15,736 | |
DHT Holdings Incorporated | | | | | | | | | | | 13,969 | | | | 72,080 | |
Renewable Energy Group Incorporated † | | | | | | | | | | | 2,625 | | | | 140,228 | |
Scorpio Tankers Incorporated | | | | | | | | | | | 2,167 | | | | 23,989 | |
World Fuel Services Corporation | | | | | | | | | | | 2,209 | | | | 46,809 | |
| | | | |
| | | | | | | | | | | | | | | 325,862 | |
| | | | | | | | | | | | | | | | |
|
Financials: 13.57% | |
|
| Banks: 6.05% | |
BancFirst Corporation | | | | | | | | | | | 1,570 | | | | 64,119 | |
Bank of N.T. Butterfield & Son Limited | | | | | | | | | | | 2,527 | | | | 56,302 | |
Brookline Bancorp Incorporated | | | | | | | | | | | 6,671 | | | | 57,671 | |
C&F Financial Corporation | | | | | | | | | | | 1,147 | | | | 34,066 | |
CNB Financial Corporation | | | | | | | | | | | 2,805 | | | | 41,710 | |
Customers Bancorp Incorporated † | | | | | | | | | | | 3,213 | | | | 35,986 | |
Enterprise Financial Services Corporation | | | | | | | | | | | 1,532 | | | | 41,778 | |
First Bancorp of North Carolina | | | | | | | | | | | 2,663 | | | | 55,737 | |
First Financial Corporation | | | | | | | | | | | 1,848 | | | | 58,027 | |
First Interstate BancSystem Class A | | | | | | | | | | | 2,441 | | | | 77,746 | |
First Merchants Corporation | | | | | | | | | | | 1,492 | | | | 34,555 | |
Great Southern Bancorp Incorporated | | | | | | | | | | | 1,733 | | | | 62,769 | |
Hancock Holding Company | | | | | | | | | | | 2,577 | | | | 48,473 | |
Hilltop Holdings Incorporated | | | | | | | | | | | 4,770 | | | | 98,167 | |
Independent Bank Corporation | | | | | | | | | | | 4,043 | | | | 50,821 | |
Mercantile Bank Corporation | | | | | | | | | | | 2,348 | | | | 42,311 | |
NBT Bancorp Incorporated | | | | | | | | | | | 1,657 | | | | 44,441 | |
OFG Bancorp | | | | | | | | | | | 3,888 | | | | 48,444 | |
Preferred Bank | | | | | | | | | | | 2,097 | | | | 67,356 | |
South State Corporation | | | | | | | | | | | 855 | | | | 41,168 | |
Sterling Bancorp | | | | | | | | | | | 3,355 | | | | 35,295 | |
The Bancorp Incorporated † | | | | | | | | | | | 9,386 | | | | 81,095 | |
TriCo Bancshares | | | | | | | | | | | 2,010 | | | | 49,225 | |
Westamerica Bancorporation | | | | | | | | | | | 1,642 | | | | 89,243 | |
| | | | |
| | | | | | | | | | | | | | | 1,316,505 | |
| | | | | | | | | | | | | | | | |
|
| Capital Markets: 2.26% | |
Artisan Partners Asset Management Incorporated Class A | | | | | | | | | | | 2,102 | | | | 81,957 | |
Evercore Partners Incorporated Class A | | | | | | | | | | | 1,168 | | | | 76,457 | |
Federated Hermes Incorporated | | | | | | | | | | | 2,201 | | | | 47,344 | |
Houlihan Lokey Incorporated | | | | | | | | | | | 1,625 | | | | 95,956 | |
PJT Partners Incorporated Class A | | | | | | | | | | | 966 | | | | 58,549 | |
Stifel Financial Corporation | | | | | | | | | | | 2,575 | | | | 130,192 | |
| | | | |
| | | | | | | | | | | | | | | 490,455 | |
| | | | | | | | | | | | | | | | |
|
| Consumer Finance: 0.93% | |
Enova International Incorporated † | | | | | | | | | | | 3,633 | | | | 59,545 | |
Green Dot Corporation Class A † | | | | | | | | | | | 2,825 | | | | 142,973 | |
| | | | |
| | | | | | | | | | | | | | | 202,518 | |
| | | | | | | | | | | | | | | | |
|
| Insurance: 1.60% | |
American Equity Investment Life Holding Company | | | | | | | | | | | 2,921 | | | | 64,233 | |
CNO Financial Group Incorporated | | | | | | | | | | | 8,282 | | | | 132,843 | |
Genworth Financial Incorporated Class A † | | | | | | | | | | | 13,115 | | | | 43,935 | |
The accompanying notes are an integral part of these financial statements.
Wells Fargo Disciplined Small Cap Fund | 11
Portfolio of investments—September 30, 2020 (unaudited)
| | | | | | | | | | | | | | | | |
| | | | | | | | | Shares | | | Value | |
|
| Insurance (continued) | |
Kemper Corporation | | | | | | | | | | | 803 | | | $ | 53,664 | |
Selective Insurance Group Incorporated | | | | | | | | | | | 1,056 | | | | 54,373 | |
| | | | |
| | | | | | | | | | | | | | | 349,048 | |
| | | | | | | | | | | | | | | | |
|
| Mortgage REITs: 0.37% | |
Hannon Armstrong Sustainable Infrastructure Capital Incorporated | | | | | | | | | | | 1,892 | | | | 79,975 | |
| | | | | | | | | | | | | | | | |
|
| Thrifts & Mortgage Finance: 2.36% | |
Essent Group Limited | | | | | | | | | | | 2,905 | | | | 107,514 | |
MGIC Investment Corporation | | | | | | | | | | | 6,689 | | | | 59,265 | |
NMI Holdings Incorporated Class A † | | | | | | | | | | | 3,395 | | | | 60,431 | |
OP Bancorp | | | | | | | | | | | 2,066 | | | | 11,818 | |
PennyMac Financial Services Incorporated | | | | | | | | | | | 1,401 | | | | 81,426 | |
Premier Financial Corporation | | | | | | | | | | | 3,453 | | | | 53,780 | |
Radian Group Incorporated | | | | | | | | | | | 7,206 | | | | 105,280 | |
Walker & Dunlop Incorporated | | | | | | | | | | | 650 | | | | 34,450 | |
| | | | |
| | | | | | | | | | | | | | | 513,964 | |
| | | | | | | | | | | | | | | | |
|
Health Care: 20.80% | |
|
| Biotechnology: 10.95% | |
ACADIA Pharmaceuticals Incorporated † | | | | | | | | | | | 1,450 | | | | 59,813 | |
Aduro Biotech Incorporated † | | | | | | | | | | | 22,078 | | | | 53,650 | |
Agenus Incorporated † | | | | | | | | | | | 5,758 | | | | 23,032 | |
Amicus Therapeutics Incorporated † | | | | | | | | | | | 6,949 | | | | 98,120 | |
Arcturus Therapeutics Holdings Incorporated † | | | | | | | | | | | 1,712 | | | | 73,445 | |
Arena Pharmaceuticals Incorporated † | | | | | | | | | | | 1,445 | | | | 108,072 | |
Arrowhead Pharmaceuticals Incorporated † | | | | | | | | | | | 1,123 | | | | 48,356 | |
Biocryst Pharmaceuticals Incorporated † | | | | | | | | | | | 18,765 | | | | 64,458 | |
Blueprint Medicines Corporation † | | | | | | | | | | | 855 | | | | 79,259 | |
Cabaletta Bio Incorporated † | | | | | | | | | | | 7,809 | | | | 84,650 | |
Castle Biosciences Incorporated † | | | | | | | | | | | 1,222 | | | | 62,872 | |
Concert Pharmaceuticals Incorporated † | | | | | | | | | | | 4,748 | | | | 46,625 | |
Emergent BioSolutions Incorporated † | | | | | | | | | | | 380 | | | | 39,265 | |
Exelixis Incorporated † | | | | | | | | | | | 2,561 | | | | 62,616 | |
Fibrogen Incorporated † | | | | | | | | | | | 2,203 | | | | 90,587 | |
GlycoMimetics Incorporated † | | | | | | | | | | | 4,561 | | | | 14,002 | |
Gossamer Bio Incorporated † | | | | | | | | | | | 5,508 | | | | 68,354 | |
Halozyme Therapeutics Incorporated † | | | | | | | | | | | 3,619 | | | | 95,107 | |
Heron Therapeutics Incorporated † | | | | | | | | | | | 3,135 | | | | 46,461 | |
Intellia Therapeutics Incorporated † | | | | | | | | | | | 2,432 | | | | 48,348 | |
Jounce Therapeutics Incorporated † | | | | | | | | | | | 5,776 | | | | 47,132 | |
Kezar Life Sciences Incorporated † | | | | | | | | | | | 12,771 | | | | 61,812 | |
Kiniksa Pharmaceuticals Limited Class A † | | | | | | | | | | | 4,207 | | | | 64,451 | |
Kodiak Sciences Incorporated † | | | | | | | | | | | 1,449 | | | | 85,795 | |
Ligand Pharmaceuticals Incorporated † | | | | | | | | | | | 447 | | | | 42,608 | |
Molecular Templates Incorporated † | | | | | | | | | | | 3,691 | | | | 40,306 | |
Momenta Pharmaceuticals Incorporated † | | | | | | | | | | | 2,475 | | | | 129,888 | |
NextCure Incorporated † | | | | | | | | | | | 5,633 | | | | 49,570 | |
Novavax Incorporated † | | | | | | | | | | | 513 | | | | 55,584 | |
Pfenex Incorporated † | | | | | | | | | | | 5,162 | | | | 65,816 | |
Protagonist Therapeutics Incorporated † | | | | | | | | | | | 3,504 | | | | 68,503 | |
Rigel Pharmaceuticals Incorporated † | | | | | | | | | | | 28,165 | | | | 67,596 | |
Rocket Pharmaceuticals Incorporated † | | | | | | | | | | | 1,523 | | | | 34,816 | |
Sangamo Therapeutics Incorporated † | | | | | | | | | | | 7,307 | | | | 69,051 | |
Savara Incorporated † | | | | | | | | | | | 26,728 | | | | 29,134 | |
The accompanying notes are an integral part of these financial statements.
12 | Wells Fargo Disciplined Small Cap Fund
Portfolio of investments—September 30, 2020 (unaudited)
| | | | | | | | | | | | | | | | |
| | | | | | | | | Shares | | | Value | |
|
| Biotechnology (continued) | |
TCR2 Therapeutics Incorporated † | | | | | | | | | | | 3,484 | | | $ | 70,795 | |
Ultragenyx Pharmaceutical Incorporated † | | | | | | | | | | | 922 | | | | 75,779 | |
Voyager Therapeutics Incorporated † | | | | | | | | | | | 5,266 | | | | 56,188 | |
| | | | |
| | | | | | | | | | | | | | | 2,381,916 | |
| | | | | | | | | | | | | | | | |
|
| Health Care Equipment & Supplies: 3.53% | |
Apyx Medical Corporation † | | | | | | | | | | | 6,077 | | | | 28,623 | |
Globus Medical Incorporated Class A † | | | | | | | | | | | 1,969 | | | | 97,505 | |
Haemonetics Corporation † | | | | | | | | | | | 920 | | | | 80,270 | |
Lantheus Holdings Incorporated † | | | | | | | | | | | 5,919 | | | | 74,994 | |
Novocure Limited † | | | | | | | | | | | 882 | | | | 98,175 | |
Orthofix Medical Incorporated † | | | | | | | | | | | 889 | | | | 27,683 | |
Seaspine Holdings Corporation † | | | | | | | | | | | 3,908 | | | | 55,884 | |
STAAR Surgical Company † | | | | | | | | | | | 1,971 | | | | 111,480 | |
Surmodics Incorporated † | | | | | | | | | | | 2,586 | | | | 100,621 | |
Zynex Incorporated †« | | | | | | | | | | | 5,341 | | | | 93,200 | |
| | | | |
| | | | | | | | | | | | | | | 768,435 | |
| | | | | | | | | | | | | | | | |
|
| Health Care Providers & Services: 2.28% | |
Amedisys Incorporated † | | | | | | | | | | | 500 | | | | 118,215 | |
Centene Corporation † | | | | | | | | | | | 1,246 | | | | 72,679 | |
R1 RCM Incorporated † | | | | | | | | | | | 3,772 | | | | 64,690 | |
Tenet Healthcare Corporation † | | | | | | | | | | | 5,236 | | | | 128,334 | |
The Ensign Group Incorporated | | | | | | | | | | | 1,952 | | | | 111,381 | |
| | | | |
| | | | | | | | | | | | | | | 495,299 | |
| | | | | | | | | | | | | | | | |
|
| Health Care Technology: 1.05% | |
HMS Holdings Corporation † | | | | | | | | | | | 1,713 | | | | 41,026 | |
NextGen Healthcare Incorporated † | | | | | | | | | | | 3,290 | | | | 41,915 | |
Omnicell Incorporated † | | | | | | | | | | | 886 | | | | 66,149 | |
Simulations Plus Incorporated | | | | | | | | | | | 1,040 | | | | 78,374 | |
| | | | |
| | | | | | | | | | | | | | | 227,464 | |
| | | | | | | | | | | | | | | | |
|
| Life Sciences Tools & Services: 0.26% | |
Repligen Corporation † | | | | | | | | | | | 389 | | | | 57,393 | |
| | | | | | | | | | | | | | | | |
|
| Pharmaceuticals: 2.73% | |
BioDelivery Sciences International Incorporated † | | | | | | | | | | | 14,177 | | | | 52,880 | |
Catalent Incorporated † | | | | | | | | | | | 1,340 | | | | 114,784 | |
Horizon Therapeutics plc † | | | | | | | | | | | 1,386 | | | | 107,664 | |
Intra Cellular Therapies Incorporated † | | | | | | | | | | | 4,500 | | | | 115,470 | |
Pacira Pharmaceuticals Incorporated † | | | | | | | | | | | 2,368 | | | | 142,364 | |
Supernus Pharmaceuticals Incorporated † | | | | | | | | | | | 2,899 | | | | 60,415 | |
| | | | |
| | | | | �� | | | | | | | | | | 593,577 | |
| | | | | | | | | | | | | | | | |
|
Industrials: 14.85% | |
|
| Aerospace & Defense: 0.70% | |
AAR Corporation | | | | | | | | | | | 2,095 | | | | 39,386 | |
Ducommun Incorporated † | | | | | | | | | | | 1,031 | | | | 33,941 | |
Moog Incorporated Class A | | | | | | | | | | | 1,241 | | | | 78,841 | |
| | | | |
| | | | | | | | | | | | | | | 152,168 | |
| | | | | | | | | | | | | | | | |
|
| Airlines: 0.21% | |
SkyWest Incorporated | | | | | | | | | | | 1,541 | | | | 46,014 | |
| | | | | | | | | | | | | | | | |
The accompanying notes are an integral part of these financial statements.
Wells Fargo Disciplined Small Cap Fund | 13
Portfolio of investments—September 30, 2020 (unaudited)
| | | | | | | | | | | | | | | | |
| | | | | | | | | Shares | | | Value | |
| Building Products: 2.22% | |
Builders FirstSource Incorporated † | | | | | | | | | | | 5,107 | | | $ | 166,590 | |
CSW Industrials Incorporated | | | | | | | | | | | 1,553 | | | | 119,969 | |
Griffon Corporation | | | | | | | | | | | 5,372 | | | | 104,969 | |
Simpson Manufacturing Company Incorporated | | | | | | | | | | | 943 | | | | 91,622 | |
| | | | |
| | | | | | | | | | | | | | | 483,150 | |
| | | | | | | | | | | | | | | | |
|
| Commercial Services & Supplies: 1.36% | |
Ennis Incorporated | | | | | | | | | | | 3,162 | | | | 55,145 | |
McGrath RentCorp | | | | | | | | | | | 1,862 | | | | 110,957 | |
Tetra Tech Incorporated | | | | | | | | | | | 852 | | | | 81,366 | |
UniFirst Corporation | | | | | | | | | | | 251 | | | | 47,532 | |
| | | | |
| | | | | | | | | | | | | | | 295,000 | |
| | | | | | | | | | | | | | | | |
|
| Construction & Engineering: 2.24% | |
Comfort Systems Incorporated | | | | | | | | | | | 1,258 | | | | 64,800 | |
EMCOR Group Incorporated | | | | | | | | | | | 2,122 | | | | 143,681 | |
MasTec Incorporated † | | | | | | | | | | | 2,862 | | | | 120,776 | |
MYR Group Incorporated † | | | | | | | | | | | 1,739 | | | | 64,656 | |
Primoris Services Corporation | | | | | | | | | | | 2,171 | | | | 39,165 | |
Tutor Perini Corporation † | | | | | | | | | | | 4,847 | | | | 53,947 | |
| | | | |
| | | | | | | | | | | | | | | 487,025 | |
| | | | | | | | | | | | | | | | |
|
| Electrical Equipment: 1.65% | |
Atkore International Incorporated † | | | | | | | | | | | 3,589 | | | | 81,578 | |
Encore Wire Corporation | | | | | | | | | | | 2,120 | | | | 98,410 | |
EnerSys | | | | | | | | | | | 485 | | | | 32,553 | |
Generac Holdings Incorporated † | | | | | | | | | | | 541 | | | | 104,759 | |
Plug Power Incorporated † | | | | | | | | | | | 3,085 | | | | 41,370 | |
| | | | |
| | | | | | | | | | | | | | | 358,670 | |
| | | | | | | | | | | | | | | | |
|
| Machinery: 2.66% | |
Alamo Group Incorporated | | | | | | | | | | | 629 | | | | 67,951 | |
EnPro Industries Incorporated | | | | | | | | | | | 612 | | | | 34,523 | |
Federal Signal Corporation | | | | | | | | | | | 3,722 | | | | 108,869 | |
Hillenbrand Incorporated | | | | | | | | | | | 2,447 | | | | 69,397 | |
Meritor Incorporated † | | | | | | | | | | | 1,908 | | | | 39,954 | |
Mueller Industries Incorporated | | | | | | | | | | | 4,545 | | | | 122,988 | |
Omega Flex Incorporated | | | | | | | | | | | 294 | | | | 46,076 | |
Park Ohio Holdings Corporation | | | | | | | | | | | 5,550 | | | | 89,189 | |
| | | | |
| | | | | | | | | | | | | | | 578,947 | |
| | | | | | | | | | | | | | | | |
|
| Professional Services: 2.05% | |
CBIZ Incorporated † | | | | | | | | | | | 2,157 | | | | 49,331 | |
CRA International Incorporated | | | | | | | | | | | 636 | | | | 23,831 | |
FTI Consulting Incorporated † | | | | | | | | | | | 779 | | | | 82,551 | |
Insperity Incorporated | | | | | | | | | | | 846 | | | | 55,405 | |
Kelly Services Incorporated Class A | | | | | | | | | | | 7,184 | | | | 122,415 | |
TriNet Group Incorporated † | | | | | | | | | | | 1,877 | | | | 111,344 | |
| | | | |
| | | | | | | | | | | | | | | 444,877 | |
| | | | | | | | | | | | | | | | |
|
| Road & Rail: 0.39% | |
Arcbest Corporation | | | | | | | | | | | 1,674 | | | | 51,994 | |
Universal Logistics Holdings Incorporated | | | | | | | | | | | 1,601 | | | | 33,397 | |
| | | | |
| | | | | | | | | | | | | | | 85,391 | |
| | | | | | | | | | | | | | | | |
The accompanying notes are an integral part of these financial statements.
14 | Wells Fargo Disciplined Small Cap Fund
Portfolio of investments—September 30, 2020 (unaudited)
| | | | | | | | | | | | | | | | |
| | | | | | | | | Shares | | | Value | |
| Trading Companies & Distributors: 1.37% | |
Applied Industrial Technologies Incorporated | | | | | | | | | | | 1,090 | | | $ | 60,059 | |
DXP Enterprises Incorporated † | | | | | | | | | | | 3,017 | | | | 48,664 | |
GMS Incorporated † | | | | | | | | | | | 2,473 | | | | 59,599 | |
Rush Enterprises Incorporated Class A | | | | | | | | | | | 2,575 | | | | 130,141 | |
| | | | |
| | | | | | | | | | | | | | | 298,463 | |
| | | | | | | | | | | | | | | | |
|
Information Technology: 14.12% | |
|
| Communications Equipment: 1.08% | |
Ciena Corporation † | | | | | | | | | | | 1,933 | | | | 76,721 | |
Digi International Incorporated † | | | | | | | | | | | 5,265 | | | | 82,292 | |
InterDigital Incorporated | | | | | | | | | | | 1,333 | | | | 76,061 | |
| | | | |
| | | | | | | | | | | | | | | 235,074 | |
| | | | | | | | | | | | | | | | |
|
| Electronic Equipment, Instruments & Components: 2.40% | |
ePlus Incorporated † | | | | | | | | | | | 418 | | | | 30,598 | |
Fabrinet † | | | | | | | | | | | 855 | | | | 53,891 | |
Insight Enterprises Incorporated † | | | | | | | | | | | 1,614 | | | | 91,320 | |
Methode Electronics Incorporated | | | | | | | | | | | 2,505 | | | | 71,393 | |
Plexus Corporation † | | | | | | | | | | | 832 | | | | 58,764 | |
Sanmina Corporation † | | | | | | | | | | | 3,783 | | | | 102,330 | |
SYNNEX Corporation | | | | | | | | | | | 818 | | | | 114,569 | |
| | | | |
| | | | | | | | | | | | | | | 522,865 | |
| | | | | | | | | | | | | | | | |
|
| IT Services: 2.86% | |
CACI International Incorporated Class A † | | | | | | | | | | | 411 | | | | 87,609 | |
EPAM Systems Incorporated † | | | | | | | | | | | 285 | | | | 92,135 | |
Evertec Incorporated | | | | | | | | | | | 3,994 | | | | 138,632 | |
EXLService Holdings Incorporated † | | | | | | | | | | | 815 | | | | 53,766 | |
International Money Express Incorporated † | | | | | | | | | | | 1,910 | | | | 27,437 | |
Perficient Incorporated † | | | | | | | | | | | 3,028 | | | | 129,417 | |
Science Applications International Corporation | | | | | | | | | | | 1,174 | | | | 92,065 | |
| | | | |
| | | | | | | | | | | | | | | 621,061 | |
| | | | | | | | | | | | | | | | |
|
| Semiconductors & Semiconductor Equipment: 3.02% | |
Diodes Incorporated † | | | | | | | | | | | 649 | | | | 36,636 | |
Enphase Energy Incorporated † | | | | | | | | | | | 1,600 | | | | 132,144 | |
FormFactor Incorporated † | | | | | | | | | | | 3,881 | | | | 96,753 | |
Ichor Holdings Limited † | | | | | | | | | | | 3,590 | | | | 77,436 | |
Inphi Corporation † | | | | | | | | | | | 490 | | | | 55,003 | |
MKS Instruments Incorporated | | | | | | | | | | | 425 | | | | 46,423 | |
Silicon Laboratories Incorporated † | | | | | | | | | | | 699 | | | | 68,397 | |
Smart Global Holdings Incorporated † | | | | | | | | | | | 2,052 | | | | 56,102 | |
Ultra Clean Holdings Incorporated † | | | | | | | | | | | 4,081 | | | | 87,578 | |
| | | | |
| | | | | | | | | | | | | | | 656,472 | |
| | | | | | | | | | | | | | | | |
|
| Software: 4.76% | |
A10 Networks Incorporated † | | | | | | | | | | | 14,887 | | | | 94,830 | |
ACI Worldwide Incorporated † | | | | | | | | | | | 2,991 | | | | 78,155 | |
American Software Incorporated Class A | | | | | | | | | | | 6,884 | | | | 96,651 | |
Arlo Technologies Incorporated † | | | | | | | | | | | 11,276 | | | | 59,312 | |
Cloudera Incorporated † | | | | | | | | | | | 12,567 | | | | 136,855 | |
eGain Corporation † | | | | | | | | | | | 6,215 | | | | 88,067 | |
J2 Global Incorporated † | | | | | | | | | | | 1,742 | | | | 120,581 | |
Qualys Incorporated † | | | | | | | | | | | 372 | | | | 36,460 | |
The accompanying notes are an integral part of these financial statements.
Wells Fargo Disciplined Small Cap Fund | 15
Portfolio of investments—September 30, 2020 (unaudited)
| | | | | | | | | | | | | | | | |
| | | | | | | | | Shares | | | Value | |
|
| Software (continued) | |
SPS Commerce Incorporated † | | | | | | | | | | | 1,854 | | | $ | 144,371 | |
TeleNav Incorporated † | | | | | | | | | | | 4,365 | | | | 15,714 | |
Verint Systems Incorporated † | | | | | | | | | | | 1,562 | | | | 75,257 | |
Workiva Incorporated † | | | | | | | | | | | 535 | | | | 29,832 | |
Xperi Holding Corporation | | | | | | | | | | | 5,133 | | | | 58,978 | |
| | | | |
| | | | | | | | | | | | | | | 1,035,063 | |
| | | | | | | | | | | | | | | | |
|
Materials: 3.17% | |
|
| Chemicals: 0.79% | |
Innospec Incorporated | | | | | | | | | | | 1,537 | | | | 97,323 | |
Kooper Holdings Incorporated † | | | | | | | | | | | 3,537 | | | | 73,959 | |
| | | | |
| | | | | | | | | | | | | | | 171,282 | |
| | | | | | | | | | | | | | | | |
|
| Construction Materials: 0.45% | |
Forterra Incorporated † | | | | | | | | | | | 8,285 | | | | 97,929 | |
| | | | | | | | | | | | | | | | |
|
| Containers & Packaging: 0.48% | |
Berry Global Group Incorporated † | | | | | | | | | | | 1,172 | | | | 56,631 | |
UFP Technologies Incorporated † | | | | | | | | | | | 1,171 | | | | 48,503 | |
| | | | |
| | | | | | | | | | | | | | | 105,134 | |
| | | | | | | | | | | | | | | | |
|
| Metals & Mining: 0.98% | |
Commercial Metals Company | | | | | | | | | | | 2,891 | | | | 57,762 | |
Kaiser Aluminum Corporation | | | | | | | | | | | 474 | | | | 25,402 | |
Materion Corporation | | | | | | | | | | | 1,691 | | | | 87,983 | |
Suncoke Energy Incorporated | | | | | | | | | | | 12,375 | | | | 42,323 | |
| | | | |
| | | | | | | | | | | | | | | 213,470 | |
| | | | | | | | | | | | | | | | |
|
| Paper & Forest Products: 0.47% | |
Boise Cascade Company | | | | | | | | | | | 2,546 | | | | 101,636 | |
| | | | | | | | | | | | | | | | |
|
Real Estate: 5.68% | |
|
| Equity REITs: 5.13% | |
Armada Hoffler Properties Incorporated | | | | | | | | | | | 5,710 | | | | 52,875 | |
Catchmark Timber Trust Incorporated Class A | | | | | | | | | | | 7,336 | | | | 65,510 | |
CyrusOne Incorporated | | | | | | | | | | | 1,293 | | | | 90,549 | |
Digital Realty Trust Incorporated | | | | | | | | | | | 243 | | | | 35,663 | |
Diversified Healthcare Trust | | | | | | | | | | | 34,465 | | | | 121,317 | |
Easterly Government Properties Incorporated | | | | | | | | | | | 4,100 | | | | 91,881 | |
First Industrial Realty Trust Incorporated | | | | | | | | | | | 2,802 | | | | 111,520 | |
Global Medical REIT Incorporated | | | | | | | | | | | 7,796 | | | | 105,246 | |
Global Net Lease Incorporated | | | | | | | | | | | 3,417 | | | | 54,330 | |
Industrial Logistics Properties Trust | | | | | | | | | | | 3,178 | | | | 69,503 | |
NexPoint Residential Trust Incorporated | | | | | | | | | | | 2,758 | | | | 122,317 | |
Piedmont Office Realty Trust Incorporated Class A | | | | | | | | | | | 6,064 | | | | 82,288 | |
STAG Industrial Incorporated | | | | | | | | | | | 3,723 | | | | 113,514 | |
| | | | |
| | | | | | | | | | | | | | | 1,116,513 | |
| | | | | | | | | | | | | | | | |
|
| Real Estate Management & Development: 0.55% | |
Kennedy Wilson Holdings Incorporated | | | | | | | | | | | 4,211 | | | | 61,144 | |
Newmark Group Incorporated Class A | | | | | | | | | | | 13,369 | | | | 57,754 | |
| | | | |
| | | | | | | | | | | | | | | 118,898 | |
| | | | | | | | | | | | | | | | |
The accompanying notes are an integral part of these financial statements.
16 | Wells Fargo Disciplined Small Cap Fund
Portfolio of investments—September 30, 2020 (unaudited)
| | | | | | | | | | | | | | | | |
| | | | | | | | | Shares | | | Value | |
Utilities: 3.70% | |
|
| Electric Utilities: 1.19% | |
IDACORP Incorporated | | | | | | | | | | | 1,311 | | | $ | 104,749 | |
Portland General Electric Company | | | | | | | | | | | 2,722 | | | | 96,631 | |
Spark Energy Incorporated Class A | | | | | | | | | | | 7,008 | | | | 58,307 | |
| | | | |
| | | | | | | | | | | | | | | 259,687 | |
| | | | | | | | | | | | | | | | |
| | | | |
| Gas Utilities: 0.59% | | | | | | | | | | | | |
Southwest Gas Holdings Incorporated | | | | | | | | | | | 2,030 | | | | 128,093 | |
| | | | | | | | | | | | | | | | |
| | | | |
| Independent Power & Renewable Electricity Producers: 1.12% | | | | | | | | | | | | |
Brookfield Renewable Corporation Class A | | | | | | | | | | | 1,964 | | | | 115,090 | |
Clearway Energy Incorporated Class A | | | | | | | | | | | 5,164 | | | | 127,551 | |
| | | | |
| | | | | | | | | | | | | | | 242,641 | |
| | | | | | | | | | | | | | | | |
| | | | |
| Multi-Utilities: 0.64% | | | | | | | | | | | | |
Black Hills Corporation | | | | | | | | | | | 916 | | | | 48,997 | |
Northwestern Corporation | | | | | | | | | | | 1,844 | | | | 89,692 | |
| | | | |
| | | | | | | | | | | | | | | 138,689 | |
| | | | | | | | | | | | | | | | |
| | | | |
| Water Utilities: 0.16% | | | | | | | | | | | | |
Consolidated Water Company | | | | | | | | | | | 3,368 | | | | 35,061 | |
| | | | | | | | | | | | | | | | |
| | | | |
Total Common Stocks (Cost $20,888,118) | | | | | | | | | | | | | | | 20,981,656 | |
| | | | | | | | | | | | | | | | |
| | | | |
| | | | | | | | | | | | | | | | |
| | | Yield | | | | | | | | | | |
| Short-Term Investments: 4.21% | | | | | | | | | | | | |
| | | | |
| Investment Companies: 3.87% | | | | | | | | | | | | |
Securities Lending Cash Investments LLC (l)(r)(u) | | | 0.12 | % | | | | | | | 185,125 | | | | 185,125 | |
Wells Fargo Government Money Market Fund Select Class (l)(u) | | | 0.05 | | | | | | | | 679,845 | | | | 679,845 | |
| | | | |
| | | | | | | | | | | | | | | 864,970 | |
| | | | | | | | | | | | | | | | |
| | | | |
| | | | | | | | | | | | | | | | |
| | | | | | Maturity
date | | | Principal | | | | |
| U.S. Treasury Securities: 0.23% | | | | | | | | | | | | |
U.S. Treasury Bill (z)# | | | 0.11 | | | | 10-1-2020 | | | $ | 50,000 | | | | 50,000 | |
| | | | | | | | | | | | | | | | |
| | | | |
Total Short-Term Investments (Cost $914,970) | | | | | | | | | | | | | | | 914,970 | |
| | | | | | | | | | | | | | | | |
| | | | | | | | |
| Total investments in securities (Cost $21,803,088) | | | 100.67 | % | | | 21,896,626 | |
| | |
Other assets and liabilities, net | | | (0.67 | ) | | | (145,879 | ) |
| | | | | | | | |
| Total net assets | | | 100.00 | % | | $ | 21,750,747 | |
| | | | | | | | |
| † | Non-income-earning security |
| « | All or a portion of this security is on loan. |
| (l) | The issuer of the security is an affiliated person of the Fund as defined in the Investment Company Act of 1940. |
| (r) | The investment is a non-registered investment company purchased with cash collateral received from securities on loan. |
| (u) | The rate represents the 7-day annualized yield at period end. |
| (z) | Zero coupon security. The rate represents the current yield to maturity. |
| # | All or portion of this security is segregated as collateral for investments in derivative instruments. |
The accompanying notes are an integral part of these financial statements.
Wells Fargo Disciplined Small Cap Fund | 17
Portfolio of investments—September 30, 2020 (unaudited)
Futures Contracts
| | | | | | | | | | | | | | | | | | | | | | | | |
| Description | | Number of
contracts | | | Expiration
date | | | Notional
cost | | | Notional
value | | | Unrealized
gains | | | Unrealized
losses | |
| | | | | | |
Long | | | | | | | | | | | | | | | | | | | | | | | | |
| | | | | | |
Russell 2000 E-Mini Index | | | 9 | | | | 12-18-2020 | | | $ | 668,404 | | | $ | 676,980 | | | $ | 8,576 | | | $ | 0 | |
Investments in Affiliates
An affiliated investment is an investment in which the Fund owns at least 5% of the outstanding voting shares of the issuer or as a result of other relationships, such as the Fund and the issuer having the same investment manager. Transactions with issuers that were either affiliated persons of the Fund at the beginning of the period or the end of the period were as follows:
| | | | | | | | | | | | | | | | | | | | | | | | | | | | | | | | |
| | | Value,
beginning of
period | | | Purchases | | | Sales
proceeds | | | Net
realized
gains
(losses) | | | Net
change in
unrealized
gains
(losses) | | | Income
from
affiliated
securities | | | Value,
end of
period | | | % of
net
assets | |
| | | | | | | | |
| Short-Term Investments | | | | | | | | | | | | | | | | | | | | | | | | |
Investment Companies | | | | | | | | | | | | | | | | | | | | | | | | | | | | | | | | |
Securities Lending Cash Investments LLC | | $ | 240,539 | | | $ | 588,502 | | | $ | (643,933 | ) | | $ | 19 | | | $ | (2 | ) | | $ | 46 | # | | $ | 185,125 | | | | | |
Wells Fargo Government Money Market Fund Select Class | | | 392,852 | | | | 3,333,676 | | | | (3,046,683 | ) | | | 0 | | | | 0 | | | | 257 | | | | 679,845 | | | | | |
| | | | | | | | | | | | | | | | | | | | | | | | | | | | | | | | |
| | | | | | | | | | | | | | $ | 19 | | | $ | (2 | ) | | $ | 303 | | | $ | 864,970 | | | | 3.87 | % |
| | | | | | | | | | | | | | | | | | | | | | | | | | | | | | | | |
| # | Amount shown represents income before fees and rebates. |
The accompanying notes are an integral part of these financial statements.
18 | Wells Fargo Disciplined Small Cap Fund
Statement of assets and liabilities—September 30, 2020 (unaudited)
| | | | |
| | | | |
| |
Assets | | | | |
Investments in unaffiliated securities (including $180,673 of securities loaned), at value (cost $20,938,118) | | $ | 21,031,656 | |
Investments in affiliated securities, at value (cost $864,970) | | | 864,970 | |
Cash | | | 1,644 | |
Due from broker | | | 15,000 | |
Receivable for investments sold | | | 1,227,179 | |
Receivable for Fund shares sold | | | 997 | |
Receivable for dividends | | | 11,141 | |
Receivable for securities lending income, net | | | 47 | |
Receivable from manager | | | 8,257 | |
Prepaid expenses and other assets | | | 43,202 | |
| | | | |
Total assets | | | 23,204,093 | |
| | | | |
| |
Liabilities | | | | |
Payable upon receipt of securities loaned | | | 184,625 | |
Payable for investments purchased | | | 1,244,004 | |
Payable for Fund shares redeemed | | | 3,512 | |
Payable for daily variation margin on open futures contracts | | | 1,170 | |
Administration fees payable | | | 2,373 | |
Trustees’ fees and expenses payable | | | 2,657 | |
Accrued expenses and other liabilities | | | 15,005 | |
| | | | |
Total liabilities | | | 1,453,346 | |
| | | | |
Total net assets | | $ | 21,750,747 | |
| | | | |
| |
Net assets consist of | | | | |
Paid-in capital | | $ | 26,760,160 | |
Total distributable loss | | | (5,009,413 | ) |
| | | | |
Total net assets | | $ | 21,750,747 | |
| | | | |
| |
Computation of net asset value and offering price per share | | | | |
Net assets – Class A | | $ | 132,017 | |
Shares outstanding – Class A1 | | | 16,480 | |
Net asset value per share – Class A | | | $8.01 | |
Maximum offering price per share – Class A2 | | | $8.50 | |
Net assets – Class R6 | | $ | 83,849 | |
Shares outstanding – Class R61 | | | 10,398 | |
Net asset value per share – Class R6 | | | $8.06 | |
Net assets – Administrator Class | | $ | 19,869,610 | |
Shares outstanding – Administrator Class1 | | | 2,488,742 | |
Net asset value per share – Administrator Class | | | $7.98 | |
Net assets – Institutional Class | | $ | 1,665,271 | |
Shares outstanding – Institutional Class1 | | | 208,452 | |
Net asset value per share – Institutional Class | | | $7.99 | |
| 1 | The Fund has an unlimited number of authorized shares. |
| 2 | Maximum offering price is computed as 100/94.25 of net asset value. On investments of $50,000 or more, the offering price is reduced. |
The accompanying notes are an integral part of these financial statements.
Wells Fargo Disciplined Small Cap Fund | 19
Statement of operations—six months ended September 30, 2020 (unaudited)
| | | | |
| | | | |
| |
Investment income | | | | |
Dividends (net of foreign withholding taxes of $191) | | $ | 143,923 | |
Income from affiliated securities | | | 461 | |
Interest | | | 30 | |
| | | | |
Total investment income | | | 144,414 | |
| | | | |
| |
Expenses | | | | |
Management fee | | | 54,742 | |
Administration fees | |
Class A | | | 144 | |
Class R6 | | | 20 | |
Administrator Class | | | 12,822 | |
Institutional Class | | | 1,234 | |
Shareholder servicing fees | |
Class A | | | 171 | |
Administrator Class | | | 24,461 | |
Custody and accounting fees | | | 13,390 | |
Professional fees | | | 21,266 | |
Registration fees | | | 33,591 | |
Shareholder report expenses | | | 15,315 | |
Trustees’ fees and expenses | | | 9,776 | |
Other fees and expenses | | | 9,335 | |
| | | | |
Total expenses | | | 196,267 | |
Less: Fee waivers and/or expense reimbursements | |
Fund-level | | | (67,081 | ) |
Class A | | | (148 | ) |
Class R6 | | | (20 | ) |
Administrator Class | | | (37,328 | ) |
Institutional Class | | | (1,233 | ) |
| | | | |
Net expenses | | | 90,457 | |
| | | | |
Net investment income | | | 53,957 | |
| | | | |
| |
Realized and unrealized gains (losses) on investments | | | | |
Net realized gains (losses) on | |
Unaffiliated securities | | | (698,382 | ) |
Affiliated securities | | | 19 | |
Futures contracts | | | 133,164 | |
| | | | |
Net realized losses on investments | | | (565,199 | ) |
| | | | |
|
Net change in unrealized gains (losses) on | |
Unaffiliated securities | | | 6,250,258 | |
Affiliated securities | | | (2 | ) |
Futures contracts | | | (31,311 | ) |
| | | | |
Net change in unrealized gains (losses) on investments | | | 6,218,945 | |
| | | | |
Net realized and unrealized gains (losses) on investments | | | 5,653,746 | |
| | | | |
Net increase in net assets resulting from operations | | $ | 5,707,703 | |
| | | | |
The accompanying notes are an integral part of these financial statements.
20 | Wells Fargo Disciplined Small Cap Fund
Statement of changes in net assets
| | | | | | | | | | | | | | | | |
| | | Six months ended
September 30, 2020
(unaudited) | | | Year ended
March 31, 2020 | |
| |
Operations | | | | | |
Net investment income | | | | | | $ | 53,957 | | | | | | | $ | 253,910 | |
Net realized losses on investments | | | | | | | (565,199 | ) | | | | | | | (2,039,014 | ) |
Net change in unrealized gains (losses) on investments | | | | | | | 6,218,945 | | | | | | | | (3,224,191 | ) |
| | | | |
Net increase (decrease) in net assets resulting from operations | | | | | | | 5,707,703 | | | | | | | | (5,027,295 | ) |
| | | | |
| | | | |
Distributions to shareholders from net investment income and net realized gains | | | | | | | | | | | | | | | | |
Class A | | | | | | | 0 | | | | | | | | (554 | ) |
Class R6 | | | | | | | 0 | | | | | | | | (81,474 | ) |
Administrator Class | | | | | | | 0 | | | | | | | | (181,213 | ) |
Institutional Class | | | | | | | 0 | | | | | | | | (43,675 | ) |
| | | | |
Total distributions to shareholders | | | | | | | 0 | | | | | | | | (306,916 | ) |
| | | | |
| | | | |
Capital share transactions | | | Shares | | | | | | | | Shares | | | | | |
Proceeds from shares sold | |
Class A | | | 9,133 | | | | 63,134 | | | | 27,557 | | | | 215,498 | |
Class R6 | | | 2,916 | | | | 19,351 | | | | 863,028 | | | | 7,504,615 | |
Administrator Class | | | 59,365 | | | | 432,024 | | | | 270,851 | | | | 2,220,286 | |
Institutional Class | | | 31,994 | | | | 233,649 | | | | 114,826 | | | | 975,446 | |
| | | | |
| | | | | | | 748,158 | | | | | | | | 10,915,845 | |
| | | | |
Reinvestment of distributions | |
Class A | | | 0 | | | | 0 | | | | 55 | | | | 503 | |
Class R6 | | | 0 | | | | 0 | | | | 8,871 | | | | 81,355 | |
Administrator Class | | | 0 | | | | 0 | | | | 18,976 | | | | 171,926 | |
Institutional Class | | | 0 | | | | 0 | | | | 3,482 | | | | 31,516 | |
| | | | |
| | | | | | | 0 | | | | | | | | 285,300 | |
| | | | |
Payment for shares redeemed | |
Class A | | | (9,238 | ) | | | (69,357 | ) | | | (15,141 | ) | | | (120,195 | ) |
Class R6 | | | (15,527 | ) | | | (117,500 | ) | | | (1,320,920 | ) | | | (11,737,903 | ) |
Administrator Class | | | (365,890 | ) | | | (2,738,456 | ) | | | (3,435,590 | ) | | | (29,722,535 | ) |
Institutional Class | | | (83,779 | ) | | | (658,460 | ) | | | (2,882,808 | ) | | | (25,024,602 | ) |
| | | | |
| | | | | | | (3,583,773 | ) | | | | | | | (66,605,235 | ) |
| | | | |
Net decrease in net assets resulting from capital share transactions | | | | | | | (2,835,615 | ) | | | | | | | (55,404,090 | ) |
| | | | |
Total increase (decrease) in net assets | | | | | | | 2,872,088 | | | | | | | | (60,738,301 | ) |
| | | | |
| | |
Net assets | | | | | | | | |
Beginning of period | | | | | | | 18,878,659 | | | | | | | | 79,616,960 | |
| | | | |
End of period | | | | | | $ | 21,750,747 | | | | | | | $ | 18,878,659 | |
| | | | |
The accompanying notes are an integral part of these financial statements.
Wells Fargo Disciplined Small Cap Fund | 21
Financial highlights
(For a share outstanding throughout each period)
| | | | | | | | | | | | |
| | | Six months ended
September 30, 2020
(unaudited) | | | Year ended March 31 | |
| CLASS A | | 2020 | | | 20191 | |
Net asset value, beginning of period | | | $6.12 | | | | $8.39 | | | | $23.70 | |
Net investment income (loss) | | | 0.02 | | | | (0.00 | )2,3 | | | 0.02 | |
Net realized and unrealized gains (losses) on investments | | | 1.87 | | | | (2.22 | ) | | | (3.37 | ) |
| | | | | | | | | | | | |
Total from investment operations | | | 1.89 | | | | (2.22 | ) | | | (3.35 | ) |
Distributions to shareholders from | | | | | | | | | |
Net investment income | | | 0.00 | | | | (0.05 | ) | | | (0.04 | ) |
Net realized gains | | | 0.00 | | | | 0.00 | | | | (11.92 | ) |
| | | | | | | | | | | | |
Total distributions to shareholders | | | 0.00 | | | | (0.05 | ) | | | (11.96 | ) |
Net asset value, end of period | | | $8.01 | | | | $6.12 | | | | $8.39 | |
Total return4 | | | 30.88 | % | | | (26.67 | )% | | | (11.52 | )% |
Ratios to average net assets (annualized) | | | | | | | | | |
Gross expenses | | | 1.90 | % | | | 1.40 | % | | | 1.14 | % |
Net expenses | | | 0.93 | % | | | 0.93 | % | | | 0.92 | % |
Net investment income (loss) | | | 0.44 | % | | | (0.05 | )% | | | 0.16 | % |
Supplemental data | | | | | | | | | |
Portfolio turnover rate | | | 29 | % | | | 67 | % | | | 176 | % |
Net assets, end of period (000s omitted) | | | $132 | | | | $102 | | | | $34 | |
| 1 | For the period from July 31, 2018 (commencement of class operations) to March 31, 2019 |
| 2 | Calculated based upon average shares outstanding |
| 3 | Amount is more than $(0.005). |
| 4 | Total return calculations do not include any sales charges. Returns for periods of less than one year are not annualized. |
The accompanying notes are an integral part of these financial statements.
22 | Wells Fargo Disciplined Small Cap Fund
Financial highlights
(For a share outstanding throughout each period)
| | | | | | | | | | | | | | | | | | | | |
| | | Six months ended
September 30, 2020
(unaudited) | | | Year ended March 31 | |
| CLASS R6 | | 2020 | | | 2019 | | | 2018 | | | 20171 | |
Net asset value, beginning of period | | | $6.15 | | | | $8.50 | | | | $22.63 | | | | $23.82 | | | | $22.43 | |
Net investment income | | | 0.03 | 2 | | | 0.08 | 2 | | | 0.06 | | | | 0.07 | | | | 0.14 | |
Net realized and unrealized gains (losses) on investments | | | 1.88 | | | | (2.35 | ) | | | (2.19 | ) | | | 2.08 | | | | 3.32 | |
| | | | | | | | | | | | | | | | | | | | |
Total from investment operations | | | 1.91 | | | | (2.27 | ) | | | (2.13 | ) | | | 2.15 | | | | 3.46 | |
Distributions to shareholders from | | | | | | | | | | | | | | | | | | | | |
Net investment income | | | 0.00 | | | | (0.08 | ) | | | (0.08 | ) | | | (0.06 | ) | | | (0.14 | ) |
Net realized gains | | | 0.00 | | | | 0.00 | | | | (11.92 | ) | | | (3.28 | ) | | | (1.93 | ) |
| | | | | | | | | | | | | | | | | | | | |
Total distributions to shareholders | | | 0.00 | | | | (0.08 | ) | | | (12.00 | ) | | | (3.34 | ) | | | (2.07 | ) |
Net asset value, end of period | | | $8.06 | | | | $6.15 | | | | $8.50 | | | | $22.63 | | | | $23.82 | |
Total return3 | | | 31.06 | % | | | (27.03 | )% | | | (6.75 | )% | | | 8.95 | % | | | 15.63 | % |
Ratios to average net assets (annualized) | | | | | | | | | | | | | | | | | | | | |
Gross expenses | | | 1.48 | % | | | 0.89 | % | | | 0.82 | % | | | 1.06 | % | | | 0.92 | % |
Net expenses | | | 0.50 | % | | | 0.50 | % | | | 0.64 | % | | | 0.85 | % | | | 0.85 | % |
Net investment income | | | 0.84 | % | | | 0.95 | % | | | 0.48 | % | | | 0.14 | % | | | 0.67 | % |
Supplemental data | | | | | | | | | | | | | | | | | | | | |
Portfolio turnover rate | | | 29 | % | | | 67 | % | | | 176 | % | | | 48 | % | | | 73 | % |
Net assets, end of period (000s omitted) | | | $84 | | | | $141 | | | | $4,014 | | | | $23,871 | | | | $1,626 | |
| 1 | For the period from October 31, 2016 (commencement of class operations) to March 31, 2017 |
| 2 | Calculated based upon average shares outstanding |
| 3 | Returns for periods of less than one year are not annualized. |
The accompanying notes are an integral part of these financial statements.
Wells Fargo Disciplined Small Cap Fund | 23
Financial highlights
(For a share outstanding throughout each period)
| | | | | | | | | | | | | | | | | | | | | | | | |
| | | Six months ended
September 30, 2020
(unaudited) | | | Year ended March 31 | |
| ADMINISTRATOR CLASS | | 2020 | | | 2019 | | | 2018 | | | 2017 | | | 2016 | |
Net asset value, beginning of period | | | $6.10 | | | | $8.40 | | | | $22.53 | | | | $23.79 | | | | $21.15 | | | | $25.19 | |
Net investment income | | | 0.02 | | | | 0.02 | 1 | | | 0.03 | 1 | | | 0.06 | | | | 0.08 | 1 | | | 0.06 | |
Net realized and unrealized gains (losses) on investments | | | 1.86 | | | | (2.27 | ) | | | (2.21 | ) | | | 2.00 | | | | 4.56 | | | | (1.24 | ) |
| | | | | | | | | | | | | | | | | | | | | | | | |
Total from investment operations | | | 1.88 | | | | (2.25 | ) | | | (2.18 | ) | | | 2.06 | | | | 4.64 | | | | (1.18 | ) |
Distributions to shareholders from | | | | | | | | | | | | | | | | | | | | | | | | |
Net investment income | | | 0.00 | | | | (0.05 | ) | | | (0.03 | ) | | | (0.04 | ) | | | (0.07 | ) | | | (0.02 | ) |
Net realized gains | | | 0.00 | | | | 0.00 | | | | (11.92 | ) | | | (3.28 | ) | | | (1.93 | ) | | | (2.84 | ) |
| | | | | | | | | | | | | | | | | | | | | | | | |
Total distributions to shareholders | | | 0.00 | | | | (0.05 | ) | | | (11.95 | ) | | | (3.32 | ) | | | (2.00 | ) | | | (2.86 | ) |
Net asset value, end of period | | | $7.98 | | | | $6.10 | | | | $8.40 | | | | $22.53 | | | | $23.79 | | | | $21.15 | |
Total return2 | | | 30.82 | % | | | (26.99 | )% | | | (7.01 | )% | | | 8.52 | % | | | 22.13 | % | | | (4.39 | )% |
Ratios to average net assets (annualized) | | | | | | | | | | | | | | | | | | | | | | | | |
Gross expenses | | | 1.82 | % | | | 1.25 | % | | | 1.13 | % | | | 1.30 | % | | | 1.28 | % | | | 1.29 | % |
Net expenses | | | 0.85 | % | | | 0.85 | % | | | 0.95 | % | | | 1.20 | % | | | 1.20 | % | | | 1.20 | % |
Net investment income | | | 0.47 | % | | | 0.27 | % | | | 0.16 | % | | | 0.12 | % | | | 0.36 | % | | | 0.25 | % |
Supplemental data | | | | | | | | | | | | | | | | | | | | | | | | |
Portfolio turnover rate | | | 29 | % | | | 67 | % | | | 176 | % | | | 48 | % | | | 73 | % | | | 59 | % |
Net assets, end of period (000s omitted) | | | $19,870 | | | | $17,049 | | | | $49,911 | | | | $91,506 | | | | $231,039 | | | | $264,560 | |
| 1 | Calculated based upon average shares outstanding |
| 2 | Returns for periods of less than one year are not annualized. |
The accompanying notes are an integral part of these financial statements.
24 | Wells Fargo Disciplined Small Cap Fund
Financial highlights
(For a share outstanding throughout each period)
| | | | | | | | | | | | | | | | | | | | | | | | |
| | | Six months ended
September 30, 2020
(unaudited) | | | Year ended March 31 | |
| INSTITUTIONAL CLASS | | 2020 | | | 2019 | | | 2018 | | | 2017 | | | 2016 | |
Net asset value, beginning of period | | | $6.10 | | | | $8.48 | | | | $22.61 | | | | $23.82 | | | | $21.18 | | | | $25.22 | |
Net investment income | | | 0.03 | 1 | | | 0.06 | 1 | | | 0.07 | 1 | | | 0.09 | | | | 0.09 | | | | 0.16 | 1 |
Net realized and unrealized gains (losses) on investments | | | 1.86 | | | | (2.28 | ) | | | (2.22 | ) | | | 2.03 | | | | 4.61 | | | | (1.28 | ) |
| | | | | | | | | | | | | | | | | | | | | | | | |
Total from investment operations | | | 1.89 | | | | (2.22 | ) | | | (2.15 | ) | | | 2.12 | | | | 4.70 | | | | (1.12 | ) |
Distributions to shareholders from | | | | | | | | | | | | | | | | | | | | | | | | |
Net investment income | | | 0.00 | | | | (0.16 | ) | | | (0.06 | ) | | | (0.05 | ) | | | (0.13 | ) | | | (0.08 | ) |
Net realized gains | | | 0.00 | | | | 0.00 | | | | (11.92 | ) | | | (3.28 | ) | | | (1.93 | ) | | | (2.84 | ) |
| | | | | | | | | | | | | | | | | | | | | | | | |
Total distributions to shareholders | | | 0.00 | | | | (0.16 | ) | | | (11.98 | ) | | | (3.33 | ) | | | (2.06 | ) | | | (2.92 | ) |
Net asset value, end of period | | | $7.99 | | | | $6.10 | | | | $8.48 | | | | $22.61 | | | | $23.82 | | | | $21.18 | |
Total return2 | | | 30.98 | % | | | (26.80 | )% | | | (6.79 | )% | | | 8.81 | % | | | 22.43 | % | | | (4.12 | )% |
Ratios to average net assets (annualized) | | | | | | | | | | | | | | | | | | | | | | | | |
Gross expenses | | | 1.57 | % | | | 0.94 | % | | | 0.89 | % | | | 1.07 | % | | | 1.03 | % | | | 1.05 | % |
Net expenses | | | 0.60 | % | | | 0.60 | % | | | 0.71 | % | | | 0.95 | % | | | 0.95 | % | | | 0.95 | % |
Net investment income | | | 0.73 | % | | | 0.69 | % | | | 0.41 | % | | | 0.37 | % | | | 0.56 | % | | | 0.71 | % |
Supplemental data | | | | | | | | | | | | | | | | | | | | | | | | |
Portfolio turnover rate | | | 29 | % | | | 67 | % | | | 176 | % | | | 48 | % | | | 73 | % | | | 59 | % |
Net assets, end of period (000s omitted) | | | $1,665 | | | | $1,586 | | | | $25,658 | | | | $67,798 | | | | $54,375 | | | | $263 | |
| 1 | Calculated based upon average shares outstanding |
| 2 | Returns for periods of less than one year are not annualized. |
The accompanying notes are an integral part of these financial statements.
Wells Fargo Disciplined Small Cap Fund | 25
Notes to financial statements (unaudited)
1. ORGANIZATION
Wells Fargo Funds Trust (the “Trust”), a Delaware statutory trust organized on March 10, 1999, is an open-end management investment company registered under the Investment Company Act of 1940, as amended (the “1940 Act”). As an investment company, the Trust follows the accounting and reporting guidance in Financial Accounting Standards Board (“FASB”) Accounting Standards Codification Topic 946, Financial Services – Investment Companies. These financial statements report on the Wells Fargo Disciplined Small Cap Fund (the “Fund”) which is a diversified series of the Trust.
2. SIGNIFICANT ACCOUNTING POLICIES
The following significant accounting policies, which are consistently followed in the preparation of the financial statements of the Fund, are in conformity with U.S. generally accepted accounting principles which require management to make estimates and assumptions that affect the reported amounts of assets and liabilities, disclosure of contingent assets and liabilities at the date of the financial statements, and the reported amounts of revenues and expenses during the reporting period. Actual results could differ from those estimates.
Securities valuation
All investments are valued each business day as of the close of regular trading on the New York Stock Exchange (generally 4 p.m. Eastern Time), although the Fund may deviate from this calculation time under unusual or unexpected circumstances.
Equity securities and futures contracts that are listed on a foreign or domestic exchange or market are valued at the official closing price or, if none, the last sales price. If no sale occurs on the principal exchange or market that day, a fair value price will be determined in accordance with the Fund’s Valuation Procedures.
Debt securities are valued at the evaluated bid price provided by an independent pricing service (e.g. taking into account various factors, including yields, maturities, or credit ratings) or, if a reliable price is not available, the quoted bid price from an independent broker-dealer.
Investments in registered open-end investment companies are valued at net asset value. Interests in non-registered investment companies that are redeemable at net asset value are fair valued normally at net asset value.
Investments which are not valued using any of the methods discussed above are valued at their fair value, as determined in good faith by the Board of Trustees. The Board of Trustees has established a Valuation Committee comprised of the Trustees and has delegated to it the authority to take any actions regarding the valuation of portfolio securities that the Valuation Committee deems necessary or appropriate, including determining the fair value of portfolio securities, unless the determination has been delegated to the Wells Fargo Asset Management Pricing Committee at Wells Fargo Funds Management, LLC (“Funds Management”). The Board of Trustees retains the authority to make or ratify any valuation decisions or approve any changes to the Valuation Procedures as it deems appropriate. On a quarterly basis, the Board of Trustees receives reports on any valuation actions taken by the Valuation Committee or the Wells Fargo Asset Management Pricing Committee which may include items for ratification.
Securities lending
The Fund may lend its securities from time to time in order to earn additional income in the form of fees or interest on securities received as collateral or the investment of any cash received as collateral. When securities are on loan, the Fund receives interest or dividends on those securities. Cash collateral received in connection with its securities lending transactions is invested in Securities Lending Cash Investments, LLC (the “Securities Lending Fund”). Investments in Securities Lending Fund are valued at the evaluated bid price provided by an independent pricing service. Income earned from investment in the Securities Lending Fund (net of fees and rebates), if any, is included in income from affiliated securities on the Statement of Operations.
In a securities lending transaction, the net asset value of the Fund is affected by an increase or decrease in the value of the securities loaned and by an increase or decrease in the value of the instrument in which collateral is invested. The amount of securities lending activity undertaken by the Fund fluctuates from time to time. The Fund has the right under the lending agreement to recover the securities from the borrower on demand. In the event of default or bankruptcy by the borrower, the Fund may be prevented from recovering the loaned securities or gaining access to the collateral or may experience delays or costs in doing so. In such an event, the terms of the agreement allows the unaffiliated securities lending agent to use the collateral to purchase replacement securities on behalf of the Fund or pay the Fund the market value of the loaned securities. The Fund bears the risk of loss with respect to depreciation of its investment of the cash collateral.
26 | Wells Fargo Disciplined Small Cap Fund
Notes to financial statements (unaudited)
Futures contracts
Futures contracts are agreements between the Fund and a counterparty to buy or sell a specific amount of a commodity, financial instrument or currency at a specified price and on a specified date. The Fund may buy and sell futures contracts in order to gain exposure to, or protect against, changes in security values and is subject to equity price risk. The primary risks associated with the use of futures contracts are the imperfect correlation between changes in market values of securities held by the Fund and the prices of futures contracts, and the possibility of an illiquid market. Futures contracts are generally entered into on a regulated futures exchange and cleared through a clearinghouse associated with the exchange. With futures contracts, there is minimal counterparty risk to the Fund since futures contracts are exchange traded and the exchange’s clearinghouse, as the counterparty to all exchange traded futures, guarantees the futures contracts against default.
Upon entering into a futures contracts, the Fund is required to deposit either cash or securities (initial margin) with the broker in an amount equal to a certain percentage of the contract value. Subsequent payments (variation margin) are paid to or from the broker each day equal to the daily changes in the contract value. Such payments are recorded as unrealized gains or losses and, if any, shown as variation margin receivable (payable) in the Statement of Assets and Liabilities. Should the Fund fail to make requested variation margin payments, the broker can gain access to the initial margin to satisfy the Fund’s payment obligations. When the contracts are closed, a realized gain or loss is recorded in the Statement of Operations.
Security transactions and income recognition
Securities transactions are recorded on a trade date basis. Realized gains or losses are recorded on the basis of identified cost.
Dividend income is recognized on the ex-dividend date. Dividend income is recorded net of foreign taxes withheld where recovery of such taxes is not assured.
Interest income is accrued daily and bond discounts are accreted and premiums are amortized daily. To the extent debt obligations are placed on non-accrual status, any related interest income may be reduced by writing off interest receivables when the collection of all or a portion of interest has been determined to be doubtful based on consistently applied procedures and the fair value has decreased. If the issuer subsequently resumes interest payments or when the collectability of interest is reasonably assured, the debt obligation is removed from non-accrual status.
Distributions to shareholders
Distributions to shareholders from net investment income and any net realized gains are recorded on the ex-dividend date and paid at least annually. Such distributions are determined in accordance with income tax regulations and may differ from U.S. generally accepted accounting principles. Dividend sources are estimated at the time of declaration. The tax character of distributions is determined as of the Fund’s fiscal year end. Therefore, a portion of the Fund’s distributions made prior to the Fund’s fiscal year end may be categorized as a tax return of capital at year end.
Federal and other taxes
The Fund intends to continue to qualify as a regulated investment company by distributing substantially all of its investment company taxable income and any net realized capital gains (after reduction for capital loss carryforwards) sufficient to relieve it from all, or substantially all, federal income taxes. Accordingly, no provision for federal income taxes was required.
The Fund’s income and federal excise tax returns and all financial records supporting those returns for the prior three fiscal years are subject to examination by the federal and Delaware revenue authorities. Management has analyzed the Fund’s tax positions taken on federal, state, and foreign tax returns for all open tax years and does not believe that there are any uncertain tax positions that require recognition of a tax liability.
As of September 30, 2020, the aggregate cost of all investments for federal income tax purposes was $22,074,243 and the unrealized gains (losses) consisted of:
| | | | |
| |
Gross unrealized gains | | $ | 3,214,799 | |
| |
Gross unrealized losses | | | (3,383,840 | ) |
| |
Net unrealized losses | | $ | (169,041 | ) |
As of March 31, 2020, the Fund had capital loss carryforwards which consist of $3,683,644 in short-term capital losses.
Class allocations
The separate classes of shares offered by the Fund differ principally in applicable sales charges, shareholder servicing, and administration fees. Class specific expenses are charged directly to that share class. Investment income, common fund-level expenses, and realized and unrealized gains (losses) on investments are allocated daily to each class of shares based on the relative proportion of net assets of each class.
Wells Fargo Disciplined Small Cap Fund | 27
Notes to financial statements (unaudited)
3. FAIR VALUATION MEASUREMENTS
Fair value measurements of investments are determined within a framework that has established a fair value hierarchy based upon the various data inputs utilized in determining the value of the Fund’s investments. The three-level hierarchy gives the highest priority to unadjusted quoted prices in active markets for identical assets or liabilities (Level 1) and the lowest priority to unobservable inputs (Level 3). The Fund’s investments are classified within the fair value hierarchy based on the lowest level of input that is significant to the fair value measurement. The inputs are summarized into three broad levels as follows:
| ∎ | | Level 1 – quoted prices in active markets for identical securities |
| ∎ | | Level 2 – other significant observable inputs (including quoted prices for similar securities, interest rates, prepayment speeds, credit risk, etc.) |
| ∎ | | Level 3 – significant unobservable inputs (including the Fund’s own assumptions in determining the fair value of investments) |
The inputs or methodologies used for valuing investments in securities are not necessarily an indication of the risk associated with investing in those securities.
The following is a summary of the inputs used in valuing the Fund’s assets and liabilities as of September 30, 2020:
| | | | | | | | | | | | | | | | |
| | | | |
| | | Quoted prices
(Level 1) | | | Other significant
observable inputs
(Level 2) | | | Significant
unobservable inputs (Level 3) | | | Total | |
| | | | |
Assets | | | | | | | | | | | | | | | | |
Investments in: | | | | | | | | | | | | | | | | |
| | | | |
Common stocks | | | | | | | | | | | | | | | | |
| | | | |
Communication services | | $ | 289,367 | | | $ | 0 | | | $ | 0 | | | $ | 289,367 | |
| | | | |
Consumer discrepancy | | | 2,937,172 | | | | 0 | | | | 0 | | | | 2,937,172 | |
| | | | |
Consumer staples | | | 836,279 | | | | 0 | | | | 0 | | | | 836,279 | |
| | | | |
Energy | | | 413,016 | | | | 0 | | | | 0 | | | | 413,016 | |
| | | | |
Financials | | | 2,952,465 | | | | 0 | | | | 0 | | | | 2,952,465 | |
| | | | |
Health care | | | 4,524,084 | | | | 0 | | | | 0 | | | | 4,524,084 | |
| | | | |
Industrials | | | 3,229,705 | | | | 0 | | | | 0 | | | | 3,229,705 | |
| | | | |
Information technology | | | 3,070,535 | | | | 0 | | | | 0 | | | | 3,070,535 | |
| | | | |
Materials | | | 689,451 | | | | 0 | | | | 0 | | | | 689,451 | |
| | | | |
Real estate | | | 1,235,411 | | | | 0 | | | | 0 | | | | 1,235,411 | |
| | | | |
Utilities | | | 804,171 | | | | 0 | | | | 0 | | | | 804,171 | |
| | | | |
Short-term investments | | | | | | | | | | | | | | | | |
| | | | |
Investment companies | | | 864,970 | | | | 0 | | | | 0 | | | | 864,970 | |
| | | | |
U.S. Treasury securities | | | 50,000 | | | | 0 | | | | 0 | | | | 50,000 | |
| | | | |
| | | 21,896,626 | | | | | | | | | | | | 21,896,626 | |
| | | | |
Futures contracts | | | 8,576 | | | | 0 | | | | 0 | | | | 8,576 | |
| | | | |
Total assets | | $ | 21,905,202 | | | $ | 0 | | | $ | 0 | | | $ | 21,905,202 | |
Futures contracts are reported at their cumulative unrealized gains (losses) at measurement date as reported in the table following the Portfolio of Investments. For futures contracts, the current day’s variation margin is reported on the Statement of Assets and Liabilities. All other assets and liabilities are reported at their market value at measurement date.
Additional sector, industry or geographic detail is included in the Portfolio of Investments.
For the six months ended September 30, 2020, the Fund did not have any transfers into/out of Level 3.
28 | Wells Fargo Disciplined Small Cap Fund
Notes to financial statements (unaudited)
4. TRANSACTIONS WITH AFFILIATES
Management fee
Funds Management, an indirect wholly owned subsidiary of Wells Fargo & Company (“Wells Fargo”), is the manager of the Fund and provides advisory and fund-level administrative services under an investment management agreement. Under the investment management agreement, Funds Management is responsible for, among other services, implementing the investment objectives and strategies of the Fund, supervising the subadviser and providing fund-level administrative services in connection with the Fund’s operations. As compensation for its services under the investment management agreement, Funds Management is entitled to receive a management fee at the following annual rate based on the Fund’s average daily net assets:
| | | | |
| |
| Average daily net assets | | Management fee | |
| |
First $1 billion | | | 0.500 | % |
| |
Next $4 billion | | | 0.475 | |
| |
Next $5 billion | | | 0.440 | |
| |
Over $10 billion | | | 0.430 | |
For the six months ended September 30, 2020, the management fee was equivalent to an annual rate of 0.50% of the Fund’s average daily net assets.
Funds Management has retained the services of a subadviser to provide daily portfolio management to the Fund. The fee for subadvisory services is borne by Funds Management. Wells Capital Management Incorporated (“WellsCap”), an affiliate of Funds Management and an indirect wholly owned subsidiary of Wells Fargo, is the subadviser to the Fund and is entitled to receive a fee from Funds Management at an annual rate starting at 0.35% and declining to 0.25% as the average daily net assets of the Fund increase.
Administration fees
Under a class-level administration agreement, Funds Management provides class-level administrative services to the Fund, which includes paying fees and expenses for services provided by the transfer agent, sub-transfer agents, omnibus account servicers and record-keepers. As compensation for its services under the class-level administration agreement, Funds Management receives an annual fee which is calculated based on the average daily net assets of each class as follows:
| | | | |
| |
| | | Class-level
administration fee | |
| |
Class A | | | 0.21 | % |
| |
Class R6 | | | 0.03 | |
| |
Administrator Class, Institutional Class | | | 0.13 | |
Waivers and/or expense reimbursements
Funds Management has contractually waived and/or reimbursed management and administration fees to the extent necessary to maintain certain net operating expense ratios for the Fund. When each class of the Fund has exceeded its expense cap, Funds Management has waived fees and/or reimbursed expenses from fund-level expenses on a proportionate basis and then from class specific expenses. When only certain classes exceed their expense caps, waivers and/or reimbursements are applied against class specific expenses before fund-level expenses. Funds Management has committed through July 31, 2021 to waive fees and/ or reimburse expenses to the extent necessary to cap the Fund’s expenses at 0.93% for Class A shares, 0.50% for Class R6 shares, 0.85% for Administrator Class shares, and 0.60% for Institutional Class shares. Prior to or after the commitment expiration date, the cap may be increased or the commitment to maintain the cap may be terminated only with the approval of the Board of Trustees.
Sales charges
Wells Fargo Funds Distributor, LLC (“Funds Distributor”), the principal underwriter, is entitled to receive the front-end sales charge from the purchase of Class A shares and a contingent deferred sales charge on the redemption of certain Class A shares. Funds Distributor did not receive any front-end or contingent deferred sales charges from Class A shares for the six months ended September 30, 2020.
Wells Fargo Disciplined Small Cap Fund | 29
Notes to financial statements (unaudited)
Shareholder servicing fees
The Trust has entered into contracts with one or more shareholder servicing agents, whereby Class A and Administrator Class of the Fund are charged a fee at an annual rate of 0.25% of the average daily net assets of each respective class. A portion of these total shareholder servicing fees were paid to affiliates of Wells Fargo.
Interfund transactions
The Fund may purchase or sell portfolio investment securities to certain other Wells Fargo affiliates pursuant to Rule 17a-7 under the 1940 Act and under procedures adopted by the Board of Trustees. The procedures have been designed to ensure that these interfund transactions, which do not incur broker commissions, are effected at current market prices.
5. INVESTMENT PORTFOLIO TRANSACTIONS
Purchases and sales of investments, excluding U.S. government obligations (if any) and short-term securities, for the six months ended September 30, 2020 were $6,120,718 and $8,886,049, respectively.
6. SECURITIES LENDING TRANSACTIONS
The Fund lends its securities through an unaffiliated securities lending agent and receives collateral in the form of cash or securities with a value at least equal to the value of the securities on loan. The value of the loaned securities is determined at the close of each business day and any increases or decreases in the required collateral are exchanged between the Fund and the counterparty on the next business day. Cash collateral received is invested in the Securities Lending Fund which seeks to provide a positive return compared to the daily Federal Funds Open Rate by investing in high-quality, U.S. dollar-denominated short-term money market instruments and is exempt from registration under Section 3(c)(7) of the 1940 Act. Securities Lending Fund is managed by Funds Management and is subadvised by WellsCap. Funds Management receives an advisory fee starting at 0.05% and declining to 0.01% as the average daily net assets of the Securities Lending Fund increase. All of the fees received by Funds Management are paid to WellsCap for its services as subadviser.
In the event of counterparty default or the failure of a borrower to return a loaned security, the Fund has the right to use the collateral to offset any losses incurred. As of September 30, 2020, the Fund had securities lending transactions with the following counterparties which are subject to offset:
| | | | | | | | | | | | |
| | | |
| Counterparty | | Value of
securities on
loan | | | Collateral
received1 | | | Net amount | |
| | | |
Barclays Capital Inc. | | $ | 88,712 | | | $ | (88,712 | ) | | $ | 0 | |
| | | |
Citigroup Global Markets Inc. | | | 40,575 | | | | (40,575 | ) | | | 0 | |
| | | |
Morgan Stanley & Co. LLC | | | 51,386 | | | | (51,386 | ) | | | 0 | |
| 1 | Collateral received within this table is limited to the collateral for the net transaction with the counterparty. |
7. DERIVATIVE TRANSACTIONS
During the six months ended September 30, 2020, the Fund entered into futures contracts for economic hedging purposes. The Fund had an average notional amount of $432,896 in long futures contracts during the six months ended September 30, 2020.
The fair value, realized gains or losses and change in unrealized gains or losses, if any, on derivative instruments are reflected in the corresponding financial statement captions.
8. BANK BORROWINGS
The Trust (excluding the money market funds), Wells Fargo Master Trust and Wells Fargo Variable Trust are parties to a $350,000,000 revolving credit agreement whereby the Fund is permitted to use bank borrowings for temporary or emergency purposes, such as to fund shareholder redemption requests. Interest under the credit agreement is charged to the Fund based on a borrowing rate equal to the higher of the Federal Funds rate in effect on that day plus 1.25% or the overnight LIBOR rate in effect on that day plus 1.25%. In addition, an annual commitment fee equal to 0.25% of the unused balance is allocated to each participating fund.
During the six months ended September 30, 2020, there were no borrowings by the Fund under the agreement.
30 | Wells Fargo Disciplined Small Cap Fund
Notes to financial statements (unaudited)
9. INDEMNIFICATION
Under the Fund’s organizational documents, the officers and Trustees have been granted certain indemnification rights against certain liabilities that may arise out of performance of their duties to the Fund. The Fund has entered into a separate agreement with each Trustee that converts indemnification rights currently existing under the Fund’s organizational documents into contractual rights that cannot be changed in the future without the consent of the Trustee. Additionally, in the normal course of business, the Fund may enter into contracts with service providers that contain a variety of indemnification clauses. The Fund’s maximum exposure under these arrangements is dependent on future claims that may be made against the Fund and, therefore, cannot be estimated.
10. NEW ACCOUNTING PRONOUNCEMENT
In August 2018, FASB issued Accounting Standards Update (“ASU”) No. 2018-13, Fair Value Measurement (Topic 820) Disclosure Framework—Changes to the Disclosure Requirements for Fair Value Measurement. ASU 2018-13 updates the disclosure requirements on fair value measurements in Topic 820, Fair Value Measurements. The amendments are effective for fiscal years, and interim periods within those fiscal years, beginning after December 15, 2019. Management has adopted this guidance which did not have a material impact on the financial statements.
11. CORONAVIRUS (COVID -19) PANDEMIC
On March 11, 2020, the World Health Organization announced that it had made the assessment that coronavirus disease 2019 (“COVID-19”) is a pandemic. The impacts of COVID-19 are adversely affecting the entire global economy, individual companies and investment products, and the market in general. There is significant uncertainty around the extent and duration of business disruptions related to COVID-19 and the impacts may be short term or may last for an extended period of time. The risk of further spreading of COVID-19 has led to significant uncertainty and volatility in the financial markets.
Wells Fargo Disciplined Small Cap Fund | 31
Other information (unaudited)
PROXY VOTING INFORMATION
A description of the policies and procedures used to determine how to vote proxies relating to portfolio securities is available, upon request, by calling 1-800-222-8222, visiting our website at wfam.com, or visiting the SEC website at sec.gov. Information regarding how the proxies related to portfolio securities were voted during the most recent 12-month period ended June 30 is available on the website at wfam.com or by visiting the SEC website at sec.gov.
QUARTERLY PORTFOLIO HOLDINGS INFORMATION
The Fund files its complete schedule of portfolio holdings with the SEC for the first and third quarters of each fiscal year as an exhibit to its reports on Form N-PORT. Shareholders may view the filed Form N-PORT by visiting the SEC website at sec.gov.
32 | Wells Fargo Disciplined Small Cap Fund
Other information (unaudited)
BOARD OF TRUSTEES AND OFFICERS
Each of the Trustees and Officers1 listed in the table below acts in identical capacities for each fund in the Wells Fargo family of funds, which consists of 142 mutual funds comprising the Wells Fargo Funds Trust, Wells Fargo Variable Trust, Wells Fargo Master Trust and four closed-end funds (collectively the “Fund Complex”). This table should be read in conjunction with the Prospectus and the Statement of Additional Information2. The mailing address of each Trustee and Officer is 525 Market Street, 12th Floor, San Francisco, CA 94105. Each Trustee and Officer serves an indefinite term, however, each Trustee serves such term until reaching the mandatory retirement age established by the Trustees.
Independent Trustees
| | | | | | |
Name and
year of birth | | Position held and
length of service* | | Principal occupations during past five years or longer | | Current other
public company or
investment
company
directorships |
| | | |
| William R. Ebsworth (Born 1957) | | Trustee, since 2015 | | Retired. From 1984 to 2013, equities analyst, portfolio manager, research director and chief investment officer at Fidelity Management and Research Company in Boston, Tokyo, and Hong Kong, and retired in 2013 as Chief Investment Officer of Fidelity Strategic Advisers, Inc. where he led a team of investment professionals managing client assets. Prior thereto, Board member of Hong Kong Securities Clearing Co., Hong Kong Options Clearing Corp., the Thailand International Fund, Ltd., Fidelity Investments Life Insurance Company, and Empire Fidelity Investments Life Insurance Company. Audit Committee Chair and Investment Committee Chair of the Vincent Memorial Hospital Endowment (non-profit organization). Mr. Ebsworth is a CFA® charterholder. | | N/A |
| | | |
| Jane A. Freeman (Born 1953) | | Trustee, since 2015; Chair Liaison, since 2018 | | Retired. From 2012 to 2014 and 1999 to 2008, Chief Financial Officer of Scientific Learning Corporation. From 2008 to 2012, Ms. Freeman provided consulting services related to strategic business projects. Prior to 1999, Portfolio Manager at Rockefeller & Co. and Scudder, Stevens & Clark. Board member of the Harding Loevner Funds from 1996 to 2014, serving as both Lead Independent Director and chair of the Audit Committee. Board member of the Russell Exchange Traded Funds Trust from 2011 to 2012 and the chair of the Audit Committee. Ms. Freeman is also an inactive Chartered Financial Analyst. | | N/A |
| | | |
| Isaiah Harris, Jr. (Born 1952) | | Trustee, since 2009; Audit Committee Chairman, since 2019 | | Retired. Chairman of the Board of CIGNA Corporation since 2009, and Director since 2005. From 2003 to 2011, Director of Deluxe Corporation. Prior thereto, President and CEO of BellSouth Advertising and Publishing Corp. from 2005 to 2007, President and CEO of BellSouth Enterprises from 2004 to 2005 and President of BellSouth Consumer Services from 2000 to 2003. Emeritus member of the Iowa State University Foundation Board of Governors. Emeritus Member of the Advisory Board of Iowa State University School of Business. Advisory Board Member, Palm Harbor Academy (private school). Mr. Harris is a certified public accountant (inactive status). | | CIGNA Corporation |
| | | |
| Judith M. Johnson (Born 1949) | | Trustee, since 2008 | | Retired. Prior thereto, Chief Executive Officer and Chief Investment Officer of Minneapolis Employees Retirement Fund from 1996 to 2008. Ms. Johnson is an attorney, certified public accountant and a certified managerial accountant. | | N/A |
| | | |
| David F. Larcker (Born 1950) | | Trustee, since 2009 | | James Irvin Miller Professor of Accounting at the Graduate School of Business (Emeritus), Stanford University, Director of the Corporate Governance Research Initiative and Senior Faculty of The Rock Center for Corporate Governance since 2006. From 2005 to 2008, Professor of Accounting at the Graduate School of Business, Stanford University. Prior thereto, Ernst & Young Professor of Accounting at The Wharton School, University of Pennsylvania from 1985 to 2005. | | N/A |
Wells Fargo Disciplined Small Cap Fund | 33
Other information (unaudited)
| | | | | | |
Name and
year of birth | | Position held and
length of service* | | Principal occupations during past five years or longer | | Current other
public company or
investment
company
directorships |
| | | |
| Olivia S. Mitchell (Born 1953) | | Trustee, since 2006; Nominating and Governance Committee Chair, since 2018 | | International Foundation of Employee Benefit Plans Professor, Wharton School of the University of Pennsylvania since 1993. Director of Wharton’s Pension Research Council and Boettner Center on Pensions & Retirement Research, and Research Associate at the National Bureau of Economic Research. Previously, Cornell University Professor from 1978 to 1993. | | N/A |
| | | |
| Timothy J. Penny (Born 1951) | | Trustee, since 1996; Chairman, since 2018 | | President and Chief Executive Officer of Southern Minnesota Initiative Foundation, a non-profit organization, since 2007. Member of the Board of Trustees of NorthStar Education Finance, Inc., a non-profit organization, since 2007. | | N/A |
| | | |
| James G. Polisson (Born 1959) | | Trustee, since 2018 | | Retired. Chief Marketing Officer, Source (ETF) UK Services, Ltd, from 2015 to 2017. From 2012 to 2015, Principal of The Polisson Group, LLC, a management consulting, corporate advisory and principal investing company. Chief Executive Officer and Managing Director at Russell Investments, Global Exchange Traded Funds from 2010 to 2012. Managing Director of Barclays Global Investors from 1998 to 2010 and Global Chief Marketing Officer for iShares and Barclays Global Investors from 2000 to 2010. Trustee of the San Francisco Mechanics’ Institute, a non-profit organization, from 2013 to 2015. Board member of the Russell Exchange Traded Fund Trust from 2011 to 2012. Director of Barclays Global Investors Holdings Deutschland GmbH from 2006 to 2009. Mr. Polisson is an attorney and has a retired status with the Massachusetts and District of Columbia Bar Associations. | | N/A |
| | | |
| Pamela Wheelock (Born 1959) | | Trustee, since January 2020; previously Trustee from January 2018 to July 2019 | | Board member of the Destination Medical Center Economic Development Agency, Rochester, Minnesota since 2019. Interim President of the McKnight Foundation from January to September 2020. Acting Commissioner, Minnesota Department of Human Services, July 2019 through September 2019. Human Services Manager (part-time), Minnesota Department of Human Services, October 2019 through December 2019. Chief Operating Officer, Twin Cities Habitat for Humanity from 2017 to 2019. Vice President of University Services, University of Minnesota from 2012 to 2016. Prior thereto, on the Board of Directors, Governance Committee and Finance Committee for the Minnesota Philanthropy Partners (Saint Paul Foundation) from 2012 to 2018, Interim Chief Executive Officer of Blue Cross Blue Shield of Minnesota from 2011 to 2012, Chairman of the Board from 2009 to 2012 and Board Director from 2003 to 2015. Vice President, Leadership and Community Engagement, Bush Foundation, Saint Paul, Minnesota (a private foundation) from 2009 to 2011. Executive Vice President and Chief Financial Officer, Minnesota Sports and Entertainment from 2004 to 2009 and Senior Vice President from 2002 to 2004. Executive Vice President of the Minnesota Wild Foundation from 2004 to 2008. Commissioner of Finance, State of Minnesota, from 1999 to 2002. Currently Board Chair of the Minnesota Wild Foundation since 2010. | | N/A |
| * | Length of service dates reflect the Trustee’s commencement of service with the Trust’s predecessor entities, where applicable. |
34 | Wells Fargo Disciplined Small Cap Fund
Other information (unaudited)
Officers
| | | | |
Name and
year of birth | | Position held and
length of service | | Principal occupations during past five years or longer |
| | |
| Andrew Owen (Born 1960) | | President, since 2017 | | Executive Vice President of Wells Fargo & Company and Head of Affiliated Managers, Wells Fargo Asset Management, since 2014. In addition, Mr. Owen is currently President, Chief Executive Officer and Director of Wells Fargo Funds Management, LLC since 2017. Prior thereto, Executive Vice President responsible for marketing, investments and product development for Wells Fargo Funds Management, LLC, from 2009 to 2014. |
| | |
| Nancy Wiser1 (Born 1967) | | Treasurer, since 2012 | | Executive Vice President of Wells Fargo Funds Management, LLC since 2011. Chief Operating Officer and Chief Compliance Officer at LightBox Capital Management LLC, from 2008 to 2011. |
| | |
| Michelle Rhee (Born 1966) | | Chief Legal Officer, since 2019 | | Secretary of Wells Fargo Funds Management, LLC, Chief Legal Counsel of Wells Fargo Asset Management and Assistant General Counsel of Wells Fargo Bank, N.A. since 2018. Associate General Counsel and Managing Director of Bank of America Corporation from 2004 to 2018. |
| | |
| Catherine Kennedy (Born 1969) | | Secretary, since 2019 | | Vice President of Wells Fargo Funds Management, LLC and Senior Counsel of the Wells Fargo Legal Department since 2010. Vice President and Senior Counsel of Evergreen Investment Management Company, LLC from 1998 to 2010. |
| | |
| Michael H. Whitaker (Born 1967) | | Chief Compliance Officer, since 2016 | | Chief Compliance Officer of Wells Fargo Asset Management since 2016. Senior Vice President and Chief Compliance Officer for Fidelity Investments from 2007 to 2016. |
| | |
| Jeremy DePalma1 (Born 1974) | | Assistant Treasurer, since 2009 | | Senior Vice President of Wells Fargo Funds Management, LLC since 2009. Senior Vice President of Evergreen Investment Management Company, LLC from 2008 to 2010 and head of the Fund Reporting and Control Team within Fund Administration from 2005 to 2010. |
| 1 | Nancy Wiser acts as Treasurer of 65 funds in the Fund Complex. Jeremy DePalma acts as the Treasurer of 77 funds and Assistant Treasurer of 65 funds in the Fund Complex. |
| 2 | The Statement of Additional Information includes additional information about the Trustees and is available, without charge, upon request, by calling 1-800-222-8222 or by visiting the website at wfam.com. |
Wells Fargo Disciplined Small Cap Fund | 35
Other information (unaudited)
BOARD CONSIDERATION OF INVESTMENT MANAGEMENT AND SUB-ADVISORY AGREEMENTS:
Wells Fargo Disciplined Small Cap Fund
Under the Investment Company Act of 1940 (the “1940 Act”), the Board of Trustees (the “Board”) of Wells Fargo Funds Trust (the “Trust”) must determine annually whether to approve the continuation of the Trust’s investment management and sub-advisory agreements. In this regard, at a Board meeting held on May 26, 2020 and May 28, 2020 (together, the “Meeting”), the Board, all the members of which have no direct or indirect interest in the investment management and sub-advisory agreements and are not “interested persons” of the Trust, as defined in the 1940 Act (the “Independent Trustees”), reviewed and approved for Wells Fargo Disciplined Small Cap Fund (the “Fund”): (i) an investment management agreement (the “Management Agreement”) with Wells Fargo Funds Management, LLC (“Funds Management”); and (ii) an investment sub-advisory agreement (the “Sub-Advisory Agreement”) with Wells Capital Management Incorporated (the “Sub-Adviser”), an affiliate of Funds Management. The Management Agreement and the Sub-Advisory Agreement are collectively referred to as the “Advisory Agreements.”
At the Meeting, the Board considered the factors and reached the conclusions described below relating to the selection of Funds Management and the Sub-Adviser and the approval of the Advisory Agreements. Prior to the Meeting, including at a Board meeting held in April 2020, the Trustees conferred extensively among themselves and with representatives of Funds Management about these matters. Also, the Board has adopted a team-based approach, with each team consisting of a sub-set of Trustees, to assist the full Board in the discharge of its duties in reviewing investment performance and other matters throughout the year. The Independent Trustees were assisted in their evaluation of the Advisory Agreements by independent legal counsel, from whom they received separate legal advice and with whom they met separately.
In providing information to the Board, Funds Management and the Sub-Adviser were guided by a detailed set of requests for information submitted to them by independent legal counsel on behalf of the Independent Trustees at the start of the Board’s annual contract renewal process earlier in 2020. In considering and approving the Advisory Agreements, the Trustees considered the information they believed relevant, including but not limited to the information discussed below. The Board considered not only the specific information presented in connection with the Meeting, but also the knowledge gained over time through interaction with Funds Management and the Sub-Adviser about various topics. In this regard, the Board reviewed reports of Funds Management at each of its quarterly meetings, which included, among other things, portfolio reviews and investment performance reports. In addition, the Board and the teams mentioned above confer with portfolio managers at various times throughout the year. The Board did not identify any particular information or consideration that was all-important or controlling, and each individual Trustee may have attributed different weights to various factors.
After its deliberations, the Board unanimously approved the continuation of the Advisory Agreements for a one-year term and determined that the compensation payable to Funds Management and the Sub-Adviser under each of the Advisory Agreements was reasonable. The Board considered the approval of the Advisory Agreements for the Fund as part of its consideration of agreements for funds across the complex, but its approvals were made on a fund-by-fund basis. The following summarizes a number of important, but not necessarily all, factors considered by the Board in support of its approvals.
Nature, extent and quality of services
The Board received and considered various information regarding the nature, extent and quality of services provided to the Fund by Funds Management and the Sub-Adviser under the Advisory Agreements. This information included a description of the investment advisory services and Fund-level administrative services covered by the Management Agreement, as well as, among other things, a summary of the background and experience of senior management of Wells Fargo Asset Management (“WFAM”), of which Funds Management and the Sub-Adviser are a part, and a summary of investments made in the business of WFAM. The Board also received a description of Funds Management’s and the Sub-Adviser’s business continuity plans and of their approaches to data privacy and cybersecurity, and related testing. The Board also received and reviewed information about Funds Management’s role as administrator of the Fund’s liquidity risk management program, Funds Management’s approach to risk management, and Funds Management’s intermediary and vendor oversight program.
The Board also considered the qualifications, background, tenure and responsibilities of each of the portfolio managers primarily responsible for the day-to-day portfolio management of the Fund. The Board evaluated the ability of Funds Management and the Sub-Adviser to attract and retain qualified investment professionals, including research, advisory and supervisory personnel. The Board further considered the compliance programs and compliance records of Funds Management and the Sub-Adviser. In addition, the Board took into account the full range of services provided to the Fund by Funds Management and its affiliates.
36 | Wells Fargo Disciplined Small Cap Fund
Other information (unaudited)
Fund investment performance and expenses
The Board considered the investment performance results for the Fund over various time periods ended December 31, 2019. The Board also considered more current results for various time periods ended March 31, 2020. The Board considered these results in comparison to the investment performance of funds in a universe that was determined by Broadridge Inc. (“Broadridge”) to be similar to the Fund (the “Universe”), and in comparison to the Fund’s benchmark index and to other comparative data. Broadridge is an independent provider of investment company data. The Board received a description of the methodology used by Broadridge to select the mutual funds in the performance Universe. The Board noted that the investment performance of the Fund (Administrator Class) was lower than the average investment performance of the Universe for the one-, three-, five- and ten-year periods ended December 31, 2019. The Board also noted that the investment performance of the Fund (Administrator Class) was lower than the average investment performance of the Universe for all periods ended March 31, 2020. The Board also noted that the investment performance of the Fund was lower than its benchmark index, the Russell 2000® Index, for all periods ended December 31, 2019. The Board also noted that the investment performance of the Fund was lower than its benchmark index, the Russell 2000® Index, for all periods ended March 31, 2020.
The Board received information concerning, and discussed factors contributing to, the underperformance of the Fund relative to the Universe and benchmark for the periods identified above. The Board took note of the explanations for the relative underperformance during these periods, including with respect to investment decisions and market factors that affected the Fund’s investment performance.
The Board also received and considered information regarding the Fund’s net operating expense ratios and their various components, including actual management fees, custodian and other non-management fees, and Rule 12b-1 and non-Rule 12b-1 shareholder service fees. The Board considered these ratios in comparison to the median ratios of funds in class-specific expense groups that were determined by Broadridge to be similar to the Fund (the “Groups”). The Board received a description of the methodology used by Broadridge to select the mutual funds in the expense Groups and an explanation of how funds comprising expense groups and their expense ratios may vary from year-to-year. Based on the Broadridge reports, the Board noted that the net operating expense ratios of the Fund were lower than or equal to the median net operating expense ratios of the expense Groups for each share class.
The Board took into account the Fund’s investment performance and expense information provided to it among the factors considered in deciding to re-approve the Advisory Agreements.
Investment management and sub-advisory fee rates
The Board reviewed and considered the contractual fee rates payable by the Fund to Funds Management under the Management Agreement, as well as the contractual fee rates payable by the Fund to Funds Management for class-level administrative services under a Class-Level Administration Agreement, which include, among other things, class-level transfer agency and sub-transfer agency costs (collectively, the “Management Rates”). The Board also reviewed and considered the contractual investment sub-advisory fee rates that are payable by Funds Management to the Sub-Adviser for investment sub-advisory services.
Among other information reviewed by the Board was a comparison of the Fund’s Management Rates with the average contractual investment management fee rates of funds in the expense Groups at a common asset level as well as transfer agency costs of the funds in the expense Groups. The Board noted that the Management Rates of the Fund were lower than or in range of the sum of these average rates for the Fund’s expense Groups for all share classes.
The Board also received and considered information about the portion of the total management fee that was retained by Funds Management after payment of the fee to the Sub-Adviser for sub-advisory services. In assessing the reasonableness of this amount, the Board received and evaluated information about the nature and extent of responsibilities retained and risks assumed by Funds Management and not delegated to or assumed by the Sub-Adviser, and about Funds Management’s on-going oversight services. Given the affiliation between Funds Management and the Sub-Adviser, the Board ascribed limited relevance to the allocation of fees between them.
The Board also received and considered information about the nature and extent of services offered and fee rates charged by Funds Management and the Sub-Adviser to other types of clients with investment strategies similar to those of the Fund. In this regard, the Board received information about the significantly greater scope of services, and compliance, reporting and other legal burdens and risks of managing proprietary mutual funds compared with those associated with managing assets of other types of clients, including third-party sub-advised fund clients and non-mutual fund clients such as institutional separate accounts.
Based on its consideration of the factors and information it deemed relevant, including those described here, the Board determined that the compensation payable to Funds Management under the Management Agreement and to the Sub-Adviser under the Sub-Advisory Agreement was reasonable.
Wells Fargo Disciplined Small Cap Fund | 37
Other information (unaudited)
Profitability
The Board received and considered information concerning the profitability of Funds Management, as well as the profitability of both WFAM and Wells Fargo & Co. (“Wells Fargo”) from providing services to the fund family as a whole. The Board noted that the Sub-Adviser’s profitability information with respect to providing services to the Fund and other funds in the family was subsumed in the WFAM and Wells Fargo profitability analysis.
Funds Management reported on the methodologies and estimates used in calculating profitability, including a description of the methodology used to allocate certain expenses. Among other things, the Board noted that the levels of profitability reported on a fund-by-fund basis varied widely, depending on factors such as the size, type and age of fund.
Based on its review, the Board did not deem the profits reported by Funds Management, WFAM or Wells Fargo from services provided to the Fund to be at a level that would prevent it from approving the continuation of the Advisory Agreements.
Economies of scale
The Board received and considered information about the potential for Funds Management to experience economies of scale in the provision of management services to the Fund, the difficulties of calculating economies of scale at an individual fund level, and the extent to which potential scale benefits are shared with shareholders. The Board noted the existence of breakpoints in the Fund’s management fee structure, which operate generally to reduce the Fund’s expense ratios as the Fund grows in size, and the size of the Fund in relation to such breakpoints. The Board considered that in addition to management fee breakpoints, Funds Management shares potential economies of scale from its management business in a variety of ways, including through fee waiver and expense reimbursement arrangements, services that benefit shareholders, competitive management fee rates set at the outset without regard to breakpoints, and investments in the business intended to enhance services available to shareholders.
The Board concluded that Funds Management’s arrangements with respect to the Fund, including contractual breakpoints, constituted a reasonable approach to sharing potential economies of scale with the Fund and its shareholders.
Other benefits to Funds Management and the Sub-Adviser
The Board received and considered information regarding potential “fall-out” or ancillary benefits received by Funds Management and its affiliates, including the Sub-Adviser, as a result of their relationships with the Fund. Ancillary benefits could include, among others, benefits directly attributable to other relationships with the Fund and benefits potentially derived from an increase in Funds Management’s and the Sub-Adviser’s business as a result of their relationships with the Fund. The Board noted that various affiliates of Funds Management may receive distribution-related fees, shareholder servicing payments and sub-transfer agency fees in respect of shares sold or held through them and services provided.
The Board also reviewed information about soft dollar credits earned and utilized by the Sub-Adviser, fees earned by Funds Management and the Sub-Adviser from managing a private investment vehicle for the fund family’s securities lending collateral, and commissions earned by an affiliated broker from portfolio transactions.
Based on its consideration of the factors and information it deemed relevant, including those described here, the Board did not find that any ancillary benefits received by Funds Management and its affiliates, including the Sub-Adviser, were unreasonable.
Conclusion
At the Meeting, after considering the above-described factors and based on its deliberations and its evaluation of the information described above, the Board unanimously approved the continuation of the Advisory Agreements for a one-year term and determined that the compensation payable to Funds Management and the Sub-Adviser under each of the Advisory Agreements was reasonable.
38 | Wells Fargo Disciplined Small Cap Fund
Other information (unaudited)
LIQUIDITY RISK MANAGEMENT PROGRAM
In accordance with Rule 22e-4 under the Investment Company Act of 1940, as amended (the “Liquidity Rule”), Wells Fargo Funds Trust (the “Trust”) has adopted and implemented a liquidity risk management program (the “Program”) on behalf of each of its series, including the Fund, which is reasonably designed to assess and manage the Fund’s liquidity risk. “Liquidity risk” is defined as the risk that the Fund is unable to meet redemption requests without significantly diluting remaining investors’ interests in the Fund. The Trust’s Board of Trustees (the “Board”) previously approved the designation of Wells Fargo Funds Management, LLC (“Funds Management”), the Fund’s investment manager, as the administrator of the Program, and Funds Management has established a Liquidity Risk Management Council composed of personnel from multiple departments within Funds Management and its affiliates to assist Funds Management in the implementation and on-going administration of the Program.
The Program is comprised of various components designed to support the assessment and/or management of liquidity risk, including: (1) the periodic assessment (no less frequently than annually) of certain factors that influence the Fund’s liquidity risk; (2) the periodic classification (no less frequently than monthly) of the Fund’s investments into one of four liquidity categories that reflect an estimate of their liquidity under current market conditions; (3) a 15% limit on the acquisition of “illiquid investments” (as defined under the Liquidity Rule); (4) to the extent the Fund does not invest primarily in “highly liquid investments” (as defined under the Liquidity Rule), the determination of a minimum percentage of the Fund’s assets that generally will be invested in highly liquid investments (an “HLIM”); (5) if the Fund has established an HLIM, the periodic review (no less frequently than annually) of the HLIM and the adoption of policies and procedures for responding to a shortfall of the Fund’s “highly liquid investments” below its HLIM; and (6) periodic reporting to the Board.
At a meeting of the Board held on May 26 and 28, 2020, the Board received a written report (the “Report”) from Funds Management that addressed the operation of the Program and assessed its adequacy and effectiveness of implementation. The Report covered the initial period from December 1, 2018 through December 31, 2019 (the “Reporting Period”). No significant liquidity events impacting the Fund were noted in the Report. There were no material changes to the Program during the Reporting Period. The Report concluded that the Program is operating effectively to assess and manage the Fund’s liquidity risk, and that the Program has been and continues to be adequately and effectively implemented to monitor and, as applicable, respond to the Fund’s liquidity developments.
There can be no assurance that the Program will achieve its objectives under all circumstances in the future. Please refer to the Fund’s prospectus for more information regarding the Fund’s exposure to liquidity risk and other risks to which an investment in the Fund may be subject.
Wells Fargo Disciplined Small Cap Fund | 39
Appendix I (unaudited)
Effective June 1, 2020, shareholders purchasing Fund shares through an Oppenheimer & Co. Inc. (“Oppenheimer”) platform or account are eligible only for the following load waivers (front-end sales charge waivers and contingent deferred or back-end, sales charge waivers) and discounts, which may differ from those disclosed in the Fund’s Prospectus or SAI.
|
| Front-end Sales Load Waivers on Class A Shares available at Oppenheimer |
|
| Employer-sponsored retirement, deferred compensation and employee benefit plans (including health savings accounts) and trusts used to fund those plans, provided that the shares are not held in a commission-based brokerage account and shares are held for the benefit of the plan. |
|
| Shares purchased by or through a 529 Plan. |
|
| Shares purchased through an Oppenheimer affiliated investment advisory program. |
|
| Shares purchased through reinvestment of capital gains distributions and dividend reinvestment when purchasing shares of the same fund (but not any other fund within the fund family). |
|
| Shares purchased from the proceeds of redemptions within the same fund family, provided (1) the repurchase occurs within 90 days following the redemption, (2) the redemption and purchase occur in the same account, and (3) redeemed shares were subject to a front-end or deferred sales load (known as Rights of Restatement). |
|
| A shareholder in the Fund’s Class C shares will have their shares exchanged at net asset value to Class A shares (or the appropriate share class) of the Fund if the shares are no longer subject to a CDSC and the exchange is in line with the policies and procedures of Oppenheimer. |
|
| Employees and registered representatives of Oppenheimer or its affiliates and their family members. |
|
| Directors or Trustees of the Fund, and employees of the Fund’s investment adviser or any of its affiliates, as described in the Prospectus. |
| CDSC Waivers on A and C Shares available at Oppenheimer |
|
| Death or disability of the shareholder. |
|
| Shares sold as part of a systematic withdrawal plan as described in the Prospectus. |
|
| Return of excess contributions from an IRA Account. |
|
| Shares sold as part of a required minimum distribution for IRA and retirement accounts due to the shareholder reaching the qualified age based on applicable IRS regulations as described in the Prospectus. |
|
| Shares sold to pay Oppenheimer fees but only if the transaction is initiated by Oppenheimer. |
|
| Shares acquired through a right of reinstatement. |
| Front-end load Discounts Available at Oppenheimer: Breakpoints, Rights of Accumulation & Letters of Intent |
|
| Breakpoints as described in the Prospectus. |
|
| Rights of Accumulation (ROA), which entitle shareholders to breakpoint discounts, will be automatically calculated based on the aggregated holding of fund family assets held by accounts within the purchaser’s household at Oppenheimer. Eligible fund family assets not held at Oppenheimer may be included in the ROA calculation only if the shareholder notifies his or her financial advisor about such assets. |
40 | Wells Fargo Disciplined Small Cap Fund
Appendix II (unaudited)
Effective June 15, 2020, shareholders purchasing fund shares through a Robert W. Baird & Co. (“Baird”) platform or account will only be eligible for the following sales charge waivers (front-end sales charge waivers and CDSC waivers) and discounts, which may differ from those disclosed elsewhere in the Fund’s Prospectus or the SAI.
|
| Front-end Sales Load Waivers on Class A Shares available at Baird |
|
| Shares purchased through reinvestment of capital gains distributions and dividend reinvestment when purchasing share of the same fund. |
|
| Share purchase by employees and registers representatives of Baird or its affiliate and their family members as designated by Baird. |
|
| Shares purchase from the proceeds of redemptions within the same fund family, provided (1) the repurchase occurs within 90 days following the redemption, (2) the redemption and purchase occur in the same accounts, and (3) redeemed shares were subject to a front-end or deferred sales charge (known as rights of reinstatement). |
|
| A shareholder in the Funds Investor C Shares will have their share exchanged at net asset value to Investor A shares of the fund if the shares are no longer subject to CDSC and the exchange is in line with the policies and procedures of Baird. |
|
| Employer-sponsored retirement plans or charitable accounts in a transactional brokerage account at Baird, including 401(k) plans, 457 plans, employer-sponsored 403(b) plans, profit sharing and money purchase pension plans and defined benefit plans. For purposes of this provision, employer-sponsored retirement plans do not include SEP IRAs, Simple IRAs or SAR-SEPs. |
| CDSC Waivers on A and C Shares available at Baird |
|
| Shares sold due to death or disability of the shareholder. |
|
| Shares sold as part of a systematic withdrawal plan as described in the Fund’s Prospectus. |
|
| Shares bought due to returns of excess contributions from an IRA Account. |
|
| Shares sold as part of a required minimum distribution for IRA and retirement accounts due to the shareholder reaching age 72 as described in the Fund’s Prospectus. |
|
| Shares sold to pay Baird fees but only if the transaction is initiated by Baird. |
|
| Shares acquired through a right of reinstatement. |
| Front-end load Discounts Available at Baird: Breakpoint and/or Rights of Accumulation |
|
| Breakpoints as described in the Prospectus. |
|
| Rights of accumulations which entitles shareholders to breakpoint discounts will be automatically calculated based on the aggregated holding of fund family assets held by accounts within the purchaser’s household at Baird. Eligible fund family assets not held at Baird may be included in the rights of accumulations calculation only if the shareholder notifies his or her financial advisor about such assets. |
|
| Letters of Intent (LOI) allow for breakpoint discounts based on anticipated purchases within a fund family through Baird, over a 13-month period of time. |
Wells Fargo Disciplined Small Cap Fund | 41
This page is intentionally left blank.
This page is intentionally left blank.
This page is intentionally left blank.

For more information
More information about Wells Fargo Funds is available free upon request. To obtain literature, please write, visit the Fund’s website, or call:
Wells Fargo Funds
P.O. Box 219967
Kansas City, MO 64121-9967
Website: wfam.com
Individual investors: 1-800-222-8222
Retail investment professionals: 1-888-877-9275
Institutional investment professionals: 1-866-765-0778

This report and the financial statements contained herein are submitted for the general information of the shareholders of the Fund. If this report is used for promotional purposes, distribution of the report must be accompanied or preceded by a current prospectus. Before investing, please consider the investment objectives, risks, charges, and expenses of the investment. For a current prospectus and, if available, a summary prospectus, containing this information, call 1-800-222-8222 or visit the Fund’s website at wfam.com. Read the prospectus carefully before you invest or send money.
Wells Fargo Asset Management (WFAM) is the trade name for certain investment advisory/management firms owned by Wells Fargo & Company. These firms include but are not limited to Wells Capital Management Incorporated and Wells Fargo Funds Management, LLC. Certain products managed by WFAM entities are distributed by Wells Fargo Funds Distributor, LLC (a broker-dealer and Member FINRA).
This material is for general informational and educational purposes only and is NOT intended to provide investment advice or a recommendation of any kind—including a recommendation for any specific investment, strategy, or plan.
INVESTMENT PRODUCTS: NOT FDIC INSURED ◾ NO BANK GUARANTEE ◾ MAY LOSE VALUE
© 2020 Wells Fargo & Company. All rights reserved.
PAR-1020-00578 11-20
SA243/SAR243 09-20
Semi-Annual Report
September 30, 2020
Wells Fargo
Specialized Technology Fund
Beginning on January 1, 2021, as permitted by new regulations adopted by the Securities and Exchange Commission, paper copies of the Wells Fargo Funds’ annual and semi-annual shareholder reports issued after this date will no longer be sent by mail, unless you specifically request paper copies of the reports. Instead, the reports will be made available on the Funds’ website, and you will be notified by mail each time a report is posted and provided with a website address to access the report.
If you already elected to receive shareholder reports electronically, you will not be affected by this change and you need not take any action. You may elect to receive shareholder reports and other communications from the Fund electronically at any time by contacting your financial intermediary (such as a broker-dealer or bank) or, if you are a direct investor, by calling 1-800-222-8222 or by enrolling at wellsfargo.com/advantagedelivery.
You may elect to receive all future reports in paper free of charge. If you invest through a financial intermediary, you can contact your financial intermediary to request that you continue to receive paper copies of your shareholder reports; if you invest directly with the Fund, you can call 1-800-222-8222. Your election to receive reports in paper will apply to all Wells Fargo Funds held in your account with your financial intermediary or, if you are a direct investor, to all Wells Fargo Funds that you hold.
|
|
|
Reduce clutter. Save trees. |
Sign up for electronic delivery of prospectuses and shareholder reports at wellsfargo.com/
advantagedelivery |
The views expressed and any forward-looking statements are as of September 30, 2020, unless otherwise noted, and are those of the Fund’s portfolio managers and/or Wells Fargo Asset Management. Discussions of individual securities, or the markets generally, or any Wells Fargo Fund are not intended as individual recommendations. Future events or results may vary significantly from those expressed in any forward-looking statements. The views expressed are subject to change at any time in response to changing circumstances in the market. Wells Fargo Asset Management and the Fund disclaim any obligation to publicly update or revise any views expressed or forward-looking statements.
INVESTMENT PRODUCTS: NOT FDIC INSURED ◾ NO BANK GUARANTEE ◾ MAY LOSE VALUE
Wells Fargo Specialized Technology Fund | 1
Letter to shareholders (unaudited)

Andrew Owen
President
Wells Fargo Funds
“As the six-month period began in April, markets rebounded strongly from an earlier sharp sell-off, fueled by unprecedented government and central bank stimulus measures.”
Dear Shareholder:
We are pleased to offer you this semi-annual report for the Wells Fargo Specialized Technology Fund for the six-month period that ended September 30, 2020. Global stock markets experienced unprecedented volatility in response to drastic government measures to stop the spread of COVID-19 at the expense of short-term economic output. However, financial markets rebounded from April on to more than offset earlier losses as central banks bolstered capital markets and confidence. Stocks rallied broadly with U.S. equities leading the way while bonds had more modest returns for the six-month period.
For the period, U.S. stocks, based on the S&P 500 Index,1 returned 31.31% and international stocks, as measured by the MSCI ACWI ex USA Index (Net),2 gained 23.38%. The MSCI EM Index (Net)3 gained a robust 29.37%. Among bond investments, the Bloomberg Barclays U.S. Aggregate Bond Index4 added 3.53%, the Bloomberg Barclays Global Aggregate ex-USD Index5 returned 7.66%, the Bloomberg Barclays Municipal Bond Index6 had a 3.99% return, and the ICE BofA U.S. High Yield Index7 gained 14.76%.
Concerns about COVID-19 took over the market.
As the six-month period began in April, markets rebounded strongly from an earlier sharp sell-off, fueled by unprecedented government and central bank stimulus measures. The U.S. economy contracted by an annualized 5.0% pace in the first quarter, with 30 million new unemployment insurance claims in six weeks. In the eurozone, first-quarter real gross domestic product (GDP) shrank 3.8%, with the composite April Flash Purchasing Managers’ Index (PMI), a monthly survey of purchasing managers, falling to an all-time low of 13.5. The European Central Bank expanded its quantitative easing to include the purchase of additional government bonds of countries with the greatest virus-related need, including Italy and Spain. China’s first-quarter GDP fell by 6.8% year over year. However, retail sales, production, and investment showed signs of recovery. Extreme oil-price volatility continued as global supply far exceeded demand.
The equity market rebound continued in May, with widespread strong monthly gains. Investors regained confidence on reports of early signs of success in human trials of a COVID-19 vaccine. Growth stocks continued to outperform value stocks while returns on global government bonds were generally flat. In the U.S., a gap grew between the stock market rebound and devastating economic data points, including an April unemployment rate of 14.7%, the highest level since World War II. PMIs continued to reflect weakening activity in May in both the manufacturing and services sectors. U.S.
| 1 | The S&P 500 Index consists of 500 stocks chosen for market size, liquidity, and industry group representation. It is a market-value-weighted index with each stock’s weight in the index proportionate to its market value. You cannot invest directly in an index. |
| 2 | The Morgan Stanley Capital International (MSCI) All Country World Index (ACWI) ex USA Index (Net) is a free-float-adjusted market-capitalization-weighted index that is designed to measure the equity market performance of developed and emerging markets, excluding the United States. Source: MSCI. MSCI makes no express or implied warranties or representations and shall have no liability whatsoever with respect to any MSCI data contained herein. The MSCI data may not be further redistributed or used as a basis for other indices or any securities or financial products. This report is not approved, reviewed, or produced by MSCI. You cannot invest directly in an index. |
| 3 | The MSCI Emerging Markets (EM) Index (Net) is a free-float-adjusted market-capitalization-weighted index that is designed to measure equity market performance of emerging markets. You cannot invest directly in an index. |
| 4 | The Bloomberg Barclays U.S. Aggregate Bond Index is a broad-based benchmark that measures the investment-grade, U.S. dollar-denominated, fixed-rate taxable bond market, including Treasuries, government-related and corporate securities, mortgage-backed securities (agency fixed-rate and hybrid adjustable-rate mortgage pass-throughs), asset-backed securities, and commercial mortgage-backed securities. You cannot invest directly in an index. |
| 5 | The Bloomberg Barclays Global Aggregate ex-USD Index is an unmanaged index that provides a broad-based measure of the global investment-grade fixed-income markets excluding the U.S. dollar-denominated debt market. You cannot invest directly in an index. |
| 6 | The Bloomberg Barclays Municipal Bond Index is an unmanaged index composed of long-term tax-exempt bonds with a minimum credit rating of Baa. You cannot invest directly in an index. |
| 7 | The ICE BofA U.S. High Yield Index is a market-capitalization-weighted index of domestic and Yankee high-yield bonds. The index tracks the performance of high-yield securities traded in the U.S. bond market. You cannot invest directly in an index. Copyright 2020. ICE Data Indices, LLC. All rights reserved. |
2 | Wells Fargo Specialized Technology Fund
Letter to shareholders (unaudited)
corporate earnings reports indicated a 14% year-over-year contraction in earnings from the first quarter of 2019. However, high demand for technology, driven by remote activity, helped maintain robust information technology sector earnings, which helped drive leading technology stocks higher.
Financial markets posted widely positive returns in June despite ongoing economic weakness and high levels of uncertainty on the containment of COVID-19 and the timing of an effective vaccine. There were hopeful signs as economies reopened, with U.S. and U.K. retail sales rebounding sharply in May. However, year over year, sales remained depressed. Vitally important to market sentiment was the ongoing commitment by central banks globally to do all they could to provide economic support through liquidity and low borrowing costs. U.S. economic activity was aided by one-time $1,200 stimulus checks and $600 bonus weekly unemployment benefits that expired at the end of July. However, unemployment remained historically high but eased from 14.7% in April to 11.1% in June. At month-end, numerous states reported increases in COVID-19 cases. China’s economic recovery picked up momentum in June, though it remained far from a full recovery.
July was a broadly positive month for both global equities and fixed income. However, economic data and a resurgence of COVID-19 cases pointed to the vulnerability of the global economy and the ongoing imperative to regain control of the pandemic. Second-quarter GDP shrank from the previous quarter by 9.5% and 12.1% in the U.S. and the eurozone, respectively. In contrast, China reported a 3.2% year-over-year expansion in its second-quarter GDP. U.S. unemployment remained high despite adding 1.8 million jobs in July, with a double-digit jobless rate persisting. However, manufacturing activity grew in both the U.S. and the eurozone. In Asia, while China’s manufacturing sector continued to expand, activity in Japan and South Korea contracted. In July, a rising concern was the rapid and broad reemergence of COVID-19 infections.
The stock market continued to rally in August despite concerns over rising numbers of COVID-19 cases in the United States and several European countries, including France and Spain, as well as the expiration of the $600 weekly bonus unemployment benefit at the end of July. U.S. stocks had strong monthly gains, led by the FAANG stocks—Facebook, Apple, Amazon, Netflix, and Google (Alphabet)—which dominate these indices and continued to rally. U.S. stocks generally surpassed other broadly positive global equity performance while fixed-income market monthly returns were broadly flat. Generally stronger-than-expected second-quarter earnings boosted investor sentiment along with the U.S. Federal Reserve’s announcement of a policy shift that will likely lead to longer-term low interest rates and supportive monetary policy. The U.S. flash PMIs for both manufacturing and services beat expectations while U.S. housing market indicators were strong. In Europe, retail sales expanded and consumer confidence remained steady. Overall, developed markets performed better than emerging market equities for the month of August as people took comfort in better-known equities in perceived safer markets.
Stocks grew more volatile in September on mixed economic data. U.S. PMIs showed solid growth in economic activity in both manufacturing and services. However, six months after the bottom fell out of the labor market in the early spring, only half of the 22 million jobs lost had returned. The U.S. unemployment rate fell to 7.9% in September, the fifth straight month of improvement but far higher than the 3.5% pre-COVID-19 rate. Only 661,000 jobs were added for the month, down from 1.5 million in August. Meanwhile, a reported 2.3 million people have given up looking for work. With U.S. Congress failing to pass further fiscal relief and uncertainties surrounding a possible vaccine, doubts crept back into the financial markets. In the U.K., a lack of progress in Brexit talks with the European Union weighed on markets. China’s economy picked up steam, however, with growth fueled by increased global demand and China’s service sector had its strongest PMI reading in seven years.
“The stock market continued to rally in August despite concerns over rising numbers of COVID-19 cases in the United States and several European countries, including France and Spain, as well as the expiration of the $600 weekly bonus unemployment benefit at the end of July.”
Wells Fargo Specialized Technology Fund | 3
Letter to shareholders (unaudited)
|
|
|
For further information about your Fund, contact your investment professional, visit our website at wfam.com, or call us directly at 1-800-222-8222. |
Don’t let short-term uncertainty derail long-term investment goals.
Periods of investment uncertainty can present challenges, but experience has taught us that maintaining long-term investment goals can be an effective way to plan for the future. To help you create a sound strategy based on your personal goals and risk tolerance, Wells Fargo Funds offers more than 100 mutual funds spanning a wide range of asset classes and investment styles. Although diversification cannot guarantee an investment profit or prevent losses, we believe it can be an effective way to manage investment risk and potentially smooth out overall portfolio performance. We encourage investors to know their investments and to understand that appropriate levels of risk-taking may unlock opportunities.
Thank you for choosing to invest with Wells Fargo Funds. We appreciate your confidence in us and remain committed to helping you meet your financial needs.
Sincerely,

Andrew Owen
President
Wells Fargo Funds
Notice to Shareholders
At a meeting held on August 10-12, 2020, the Board of Trustees of the Fund approved a change to the Fund’s automatic conversion feature for Class C shares in order to shorten the required holding period from 10 to 8 years. As a result, on a monthly basis beginning November 5, 2020, Class C shares will convert automatically into Class A shares 8 years after the initial date of purchase or, if you acquired your Class C shares through an exchange or conversion from another share class, 8 years after the date you acquired your Class C shares. When Class C shares that you acquired through a purchase or exchange convert, any other Class C shares that you purchased with reinvested dividends and distributions also will convert into Class A shares on a pro rata basis.
Please note that a shorter holding period may apply depending on your intermediary. Please see “Appendix A—Sales Charge Reductions and Waivers for Certain Intermediaries” in the Fund’s prospectus for further information.
4 | Wells Fargo Specialized Technology Fund
This page is intentionally left blank.
Performance highlights (unaudited)
Investment objective
The Fund seeks long-term capital appreciation.
Manager
Wells Fargo Funds Management, LLC
Subadviser
Allianz Global Investors U.S. LLC
Portfolio managers
Huachen Chen, CFA®‡
Walter C. Price, Jr., CFA®‡
Michael A. Seidenberg
Average annual total returns (%) as of September 30, 2020
| | | | | | | | | | | | | | | | | | | | | | | | | | | | | | | | | | |
| | | | |
| | | | | Including sales charge | | | Excluding sales charge | | | Expense ratios1 (%) | |
| | | | | | | | | |
| | | Inception date | | 1 year | | | 5 year | | | 10 year | | | 1 year | | | 5 year | | | 10 year | | | Gross | | | Net2 | |
| | | | | | | | | | |
| Class A (WFSTX) | | 9-18-2000 | | | 46.55 | | | | 24.69 | | | | 17.98 | | | | 55.49 | | | | 26.16 | | | | 18.68 | | | | 1.36 | | | | 1.35 | |
| | | | | | | | | | |
| Class C (WFTCX) | | 9-18-2000 | | | 53.61 | | | | 25.28 | | | | 17.81 | | | | 54.61 | | | | 25.28 | | | | 17.81 | | | | 2.11 | | | | 2.10 | |
| | | | | | | | | | |
| Administrator Class (WFTDX) | | 7-30-2010 | | | – | | | | – | | | | – | | | | 55.56 | | | | 26.30 | | | | 18.85 | | | | 1.28 | | | | 1.28 | |
| | | | | | | | | | |
| Institutional Class (WFTIX)4 | | 10-31-2016 | | | – | | | | – | | | | – | | | | 56.00 | | | | 26.53 | | | | 18.96 | | | | 1.03 | | | | 1.03 | |
| | | | | | | | | | |
| S&P North American Technology Index5 | | – | | | – | | | | – | | | | – | | | | 42.95 | | | | 26.55 | | | | 20.31 | | | | – | | | | – | |
| | | | | | | | | | |
| S&P 500 Index6 | | – | | | – | | | | – | | | | – | | | | 15.15 | | | | 14.15 | | | | 13.74 | | | | – | | | | – | |
Figures quoted represent past performance, which is no guarantee of future results, and do not reflect taxes that a shareholder may pay on an investment in a fund. Investment return and principal value of an investment will fluctuate so that an investor’s shares, when redeemed, may be worth more or less than their original cost. Performance shown without sales charges would be lower if sales charges were reflected. Current performance may be lower or higher than the performance data quoted, which assumes the reinvestment of dividends and capital gains. Current month-end performance is available on the Fund’s website, wfam.com.
While the S&P 500 Index is comprised of U.S. equity securities of companies diversified across ten sectors, the Fund’s holdings are concentrated primarily in technology related stocks. Therefore, the performance of the S&P 500 Index is displayed only to show how the concentrated Fund performed compared with a diversified selection of U.S. equity securities.
Please keep in mind that high double-digit returns were primarily achieved during favorable market conditions. You should not expect that such favorable returns can be consistently achieved. A fund’s performance, especially for short time periods, should not be the sole factor in making your investment decision.
Index returns do not include transaction costs associated with buying and selling securities, any mutual fund fees or expenses, or any taxes. It is not possible to invest directly in an index.
For Class A shares, the maximum front-end sales charge is 5.75%. For Class C shares, the maximum contingent deferred sales charge is 1.00%. Performance including a contingent deferred sales charge assumes the sales charge for the corresponding time period. Administrator Class and Institutional Class shares are sold without a front-end sales charge or contingent deferred sales charge.
Stock values fluctuate in response to the activities of individual companies and general market and economic conditions. Funds that concentrate their investments in limited sectors, such as information technology, are more vulnerable to adverse market, economic, regulatory, political, or other developments affecting those sectors. Certain investment strategies tend to increase the total risk of an investment (relative to the broader market). The Fund is exposed to convertible securities risk, foreign investment risk, non-diversification risk, and smaller-company securities risk. Consult the Fund’s prospectus for additional information on these and other risks.
Please see footnotes on page 7.
6 | Wells Fargo Specialized Technology Fund
Performance highlights (unaudited)
| | | | |
|
| Ten largest holdings (%) as of September 30, 20207 | |
| | |
Apple Incorporated | | | 9.67 | |
| | |
Amazon.com Incorporated | | | 8.22 | |
| | |
Facebook Incorporated Class A | | | 6.05 | |
| | |
Twilio Incorporated Class A | | | 3.98 | |
| | |
NVIDIA Corporation | | | 3.42 | |
| | |
Microsoft Corporation | | | 3.35 | |
| | |
Paycom Software Incorporated | | | 3.30 | |
| | |
Crowdstrike Holdings Incorporated Class A | | | 3.17 | |
| | |
Okta Incorporated | | | 3.01 | |
| | |
PayPal Holdings Incorporated | | | 2.89 | |
|
|
| Industry allocation as of September 30, 20208 |
|
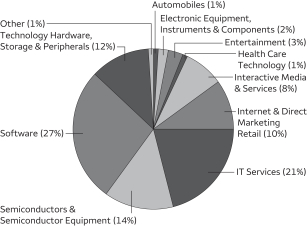 |
| ‡ | CFA® and Chartered Financial Analyst® are trademarks owned by CFA Institute. |
| 1 | Reflects the expense ratios as stated in the most recent prospectuses. The expense ratios shown are subject to change and may differ from the annualized expense ratios shown in the financial highlights of this report. |
| 2 | The manager has contractually committed through July 31, 2021, to waive fees and/or reimburse expenses to the extent necessary to cap total annual fund operating expenses after fee waivers at 1.35% for Class A, 2.10% for Class C, 1.28% for Administrator Class, and 1.03% for Institutional Class. Brokerage commissions, stamp duty fees, interest, taxes, acquired fund fees and expenses (if any), and extraordinary expenses are excluded from the expense caps. Prior to or after the commitment expiration date, the caps may be increased or the commitment to maintain the caps .may be terminated only with the approval of the Board of Trustees. Without these caps, the Fund’s returns would have been lower. The expense ratio paid by an investor is the net expense ratio (the total annual fund operating expenses after fee waivers) as stated in the prospectuses. |
| 3 | Historical performance shown for the Institutional Class shares prior to their inception reflects the performance of the Administrator Class shares, and is not adjusted to reflect the Institutional Class expenses. If these expenses had been included, returns for the Institutional Class shares would be higher. |
| 4 | The S&P North American Technology Index is a modified market-capitalization-weighted index of select technology stocks. You cannot invest directly in an index. |
| 5 | The S&P 500 Index consists of 500 stocks chosen for market size, liquidity, and industry group representation. It is a market-value weighted index with each stock’s weight in the index proportionate to its market value. You cannot invest directly in an index. |
| 6 | The ten largest holdings, excluding cash, cash equivalents and any money market funds, are calculated based on the value of the investments divided by total net assets of the Fund. Holdings are subject to change and may have changed since the date specified. |
| 7 | Amounts are calculated based on the total long-term investments of the Fund. These amounts are subject to change and may have changed since the date specified. |
Wells Fargo Specialized Technology Fund | 7
Fund expenses (unaudited)
As a shareholder of the Fund, you incur two types of costs: (1) transaction costs, including sales charges (loads) on purchase payments and contingent deferred sales charges (if any) on redemptions and (2) ongoing costs, including management fees, distribution (12b-1) and/or shareholder servicing fees, and other Fund expenses. This example is intended to help you understand your ongoing costs (in dollars) of investing in the Fund and to compare these costs with the ongoing costs of investing in other mutual funds.
The example is based on an investment of $1,000 invested at the beginning of the six-month period and held for the entire period from April 1, 2020 to September 30, 2020.
Actual expenses
The “Actual” line of the table below provides information about actual account values and actual expenses. You may use the information in this line, together with the amount you invested, to estimate the expenses that you paid over the period. Simply divide your account value by $1,000 (for example, an $8,600 account value divided by $1,000 = 8.6), then multiply the result by the number in the “Actual” line under the heading entitled “Expenses paid during period” for your applicable class of shares to estimate the expenses you paid on your account during this period.
Hypothetical example for comparison purposes
The “Hypothetical” line of the table below provides information about hypothetical account values and hypothetical expenses based on the Fund’s actual expense ratio and an assumed rate of return of 5% per year before expenses, which is not the Fund’s actual return. The hypothetical account values and expenses may not be used to estimate the actual ending account balance or expenses you paid for the period. You may use this information to compare the ongoing costs of investing in the Fund and other funds. To do so, compare this 5% hypothetical example with the 5% hypothetical examples that appear in the shareholder reports of the other funds.
Please note that the expenses shown in the table are meant to highlight your ongoing costs only and do not reflect any transactional costs, such as sales charges (loads) and contingent deferred sales charges. Therefore, the “Hypothetical” line of the table is useful in comparing ongoing costs only and will not help you determine the relative total costs of owning different funds. In addition, if these transactional costs were included, your costs would have been higher.
| | | | | | | | | | | | | | | | |
| | | Beginning account value 4-1-2020 | | | Ending account value 9-30-2020 | | | Expenses paid during the period1 | | | Annualized net expense ratio | |
| | | | | |
Class A | | | | | | | | | | | | | | | | |
| | | | |
Actual | | $ | 1,000.00 | | | $ | 1,530.63 | | | $ | 8.56 | | | | 1.35 | % |
| | | | |
Hypothetical (5% return before expenses) | | $ | 1,000.00 | | | $ | 1,018.30 | | | $ | 6.83 | | | | 1.35 | % |
| | | | | |
Class C | | | | | | | | | | | | | | | | |
| | | | |
Actual | | $ | 1,000.00 | | | $ | 1,528.41 | | | $ | 13.37 | | | | 2.11 | % |
| | | | |
Hypothetical (5% return before expenses) | | $ | 1,000.00 | | | $ | 1,014.49 | | | $ | 10.66 | | | | 2.11 | % |
| | | | | |
Administrator Class | | | | | | | | | | | | | | | | |
| | | | |
Actual | | $ | 1,000.00 | | | $ | 1,531.88 | | | $ | 8.06 | | | | 1.27 | % |
| | | | |
Hypothetical (5% return before expenses) | | $ | 1,000.00 | | | $ | 1,018.70 | | | $ | 6.43 | | | | 1.27 | % |
| | | | | |
Institutional Class | | | | | | | | | | | | | | | | |
| | | | |
Actual | | $ | 1,000.00 | | | $ | 1,533.97 | | | $ | 6.48 | | | | 1.02 | % |
| | | | |
Hypothetical (5% return before expenses) | | $ | 1,000.00 | | | $ | 1,019.95 | | | $ | 5.16 | | | | 1.02 | % |
| 1 | Expenses paid is equal to the annualized net expense ratio of each class multiplied by the average account value over the period, multiplied by the number of days in the most recent fiscal half-year divided by the number of days in the fiscal year (to reflect the one-half-year period). |
8 | Wells Fargo Specialized Technology Fund
Portfolio of investments—September 30, 2020 (unaudited)
| | | | | | | | | | | | | | | | |
| | | | | | | | | Shares | | | Value | |
| Common Stocks: 95.33% | |
|
Communication Services: 10.09% | |
|
| Entertainment: 2.84% | |
Activision Blizzard Incorporated | | | | | | | | | | | 52,800 | | | $ | 4,274,160 | |
NetEase Incorporated ADR | | | | | | | | | | | 7,365 | | | | 3,348,645 | |
Netflix Incorporated † | | | | | | | | | | | 5,750 | | | | 2,875,173 | |
Spotify Technology † | | | | | | | | | | | 2,140 | | | | 519,100 | |
Take-Two Interactive Software Incorporated † | | | | | | | | | | | 3,790 | | | | 626,184 | |
Zynga Incorporated Class A † | | | | | | | | | | | 650,320 | | | | 5,930,918 | |
| | | | |
| | | | | | | | | | | | | | | 17,574,180 | |
| | | | | | | | | | | | | | | | |
|
| Interactive Media & Services: 7.25% | |
Alphabet Incorporated Class C † | | | | | | | | | | | 3,395 | | | | 4,989,292 | |
Facebook Incorporated Class A † | | | | | | | | | | | 142,640 | | | | 37,357,416 | |
Pinterest Incorporated Class A † | | | | | | | | | | | 23,565 | | | | 978,183 | |
Tencent Holdings Limited | | | | | | | | | | | 21,800 | | | | 1,472,445 | |
| | | | |
| | | | | | | | | | | | | | | 44,797,336 | |
| | | | | | | | | | | | | | | | |
|
Consumer Discretionary: 10.18% | |
|
| Automobiles: 0.67% | |
Tesla Motors Incorporated † | | | | | | | | | | | 9,675 | | | | 4,150,672 | |
| | | | | | | | | | | | | | | | |
|
| Internet & Direct Marketing Retail: 9.51% | |
Alibaba Group Holding Limited ADR † | | | | | | | | | | | 7,220 | | | | 2,122,536 | |
Amazon.com Incorporated † | | | | | | | | | | | 16,135 | | | | 50,804,758 | |
Booking Holdings Incorporated † | | | | | | | | | | | 1,920 | | | | 3,284,506 | |
Expedia Group Incorporated | | | | | | | | | | | 11,500 | | | | 1,054,435 | |
JD.com Incorporated ADR † | | | | | | | | | | | 19,355 | | | | 1,502,142 | |
| | | | |
| | | | | | | | | | | | | | | 58,768,377 | |
| | | | | | | | | | | | | | | | |
|
Health Care: 0.80% | |
|
| Health Care Technology: 0.80% | |
Veeva Systems Incorporated Class A † | | | | | | | | | | | 17,570 | | | | 4,940,508 | |
| | | | | | | | | | | | | | | | |
|
Industrials: 0.12% | |
|
| Electrical Equipment: 0.12% | |
Bloom Energy Corporation Class A Ǡ | | | | | | | | | | | 39,270 | | | | 705,682 | |
| | | | | | | | | | | | | | | | |
|
Information Technology: 74.04% | |
|
| Communications Equipment: 0.21% | |
F5 Networks Incorporated † | | | | | | | | | | | 3,835 | | | | 470,823 | |
Telefonaktiebolaget LM Ericsson ADR | | | | | | | | | | | 78,015 | | | | 849,583 | |
| | | | |
| | | | | | | | | | | | | | | 1,320,406 | |
| | | | | | | | | | | | | | | | |
|
| Electronic Equipment, Instruments & Components: 2.04% | |
Amphenol Corporation Class A | | | | | | | | | | | 17,715 | | | | 1,918,003 | |
Cognex Corporation | | | | | | | | | | | 17,545 | | | | 1,142,180 | |
Flex Limited † | | | | | | | | | | | 143,630 | | | | 1,600,038 | |
IPG Photonics Corporation † | | | | | | | | | | | 9,400 | | | | 1,597,718 | |
Samsung SDI Company Limited | | | | | | | | | | | 17,140 | | | | 6,331,831 | |
| | | | |
| | | | | | | | | | | | | | | 12,589,770 | |
| | | | | | | | | | | | | | | | |
The accompanying notes are an integral part of these financial statements.
Wells Fargo Specialized Technology Fund | 9
Portfolio of investments—September 30, 2020 (unaudited)
| | | | | | | | | | | | | | | | |
| | | | | | | | | Shares | | | Value | |
| IT Services: 20.22% | |
Adyen NV 144A† | | | | | | | | | | | 1,210 | | | $ | 2,231,824 | |
Akamai Technologies Incorporated † | | | | | | | | | | | 7,180 | | | | 793,677 | |
Fidelity National Information Services Incorporated | | | | | | | | | | | 33,811 | | | | 4,977,317 | |
Fiserv Incorporated † | | | | | | | | | | | 46,195 | | | | 4,760,395 | |
Global Payments Incorporated | | | | | | | | | | | 29,459 | | | | 5,231,329 | |
MasterCard Incorporated Class A | | | | | | | | | | | 8,240 | | | | 2,786,521 | |
MongoDB Incorporated † | | | | | | | | | | | 58,195 | | | | 13,472,724 | |
Okta Incorporated † | | | | | | | | | | | 86,835 | | | | 18,569,665 | |
PayPal Holdings Incorporated † | | | | | | | | | | | 90,605 | | | | 17,851,903 | |
Shopify Incorporated Class A † | | | | | | | | | | | 8,455 | | | | 8,649,211 | |
Snowflake Incorporated Class A Ǡ | | | | | | | | | | | 4,331 | | | | 1,087,081 | |
Square Incorporated Class A † | | | | | | | | | | | 108,510 | | | | 17,638,301 | |
Twilio Incorporated Class A † | | | | | | | | | | | 99,570 | | | | 24,602,751 | |
Visa Incorporated Class A | | | | | | | | | | | 11,555 | | | | 2,310,653 | |
| | | | |
| | | | | | | | | | | | | | | 124,963,352 | |
| | | | | | | | | | | | | | | | |
|
| Semiconductors & Semiconductor Equipment: 13.90% | |
Advanced Micro Devices Incorporated † | | | | | | | | | | | 159,260 | | | | 13,057,727 | |
ASML Holding NV | | | | | | | | | | | 4,270 | | | | 1,576,783 | |
Cree Incorporated † | | | | | | | | | | | 31,390 | | | | 2,000,799 | |
Lam Research Corporation | | | | | | | | | | | 12,520 | | | | 4,153,510 | |
Marvell Technology Group Limited | | | | | | | | | | | 100,410 | | | | 3,986,277 | |
Micron Technology Incorporated † | | | | | | | | | | | 84,575 | | | | 3,971,642 | |
NVIDIA Corporation | | | | | | | | | | | 39,080 | | | | 21,150,878 | |
NXP Semiconductors NV | | | | | | | | | | | 16,095 | | | | 2,008,817 | |
Qorvo Incorporated † | | | | | | | | | | | 17,360 | | | | 2,239,614 | |
QUALCOMM Incorporated | | | | | | | | | | | 87,375 | | | | 10,282,290 | |
Skyworks Solutions Incorporated | | | | | | | | | | | 55,400 | | | | 8,060,700 | |
STMicroelectronics NV | | | | | | | | | | | 110,000 | | | | 3,375,900 | |
Taiwan Semiconductor Manufacturing Company Limited ADR | | | | | | | | | | | 30,115 | | | | 2,441,423 | |
Teradyne Incorporated | | | | | | | | | | | 56,655 | | | | 4,501,806 | |
Texas Instruments Incorporated | | | | | | | | | | | 21,495 | | | | 3,069,271 | |
| | | | |
| | | | | | | | | | | | | | | 85,877,437 | |
| | | | | | | | | | | | | | | | |
|
| Software: 26.16% | |
Alteryx Incorporated Class A † | | | | | | | | | | | 26,785 | | | | 3,041,437 | |
Atlassian Corporation plc Class A † | | | | | | | | | | | 83,370 | | | | 15,155,832 | |
Autodesk Incorporated † | | | | | | | | | | | 4,605 | | | | 1,063,801 | |
Avalara Incorporated † | | | | | | | | | | | 4,395 | | | | 559,659 | |
Cloudflare Incorporated Class A † | | | | | | | | | | | 16,105 | | | | 661,271 | |
Coupa Software Incorporated † | | | | | | | | | | | 3,650 | | | | 1,000,976 | |
Crowdstrike Holdings Incorporated Class A † | | | | | | | | | | | 142,680 | | | | 19,592,818 | |
Datadog Incorporated Class A † | | | | | | | | | | | 19,845 | | | | 2,027,365 | |
DocuSign Incorporated † | | | | | | | | | | | 35,195 | | | | 7,575,372 | |
HubSpot Incorporated † | | | | | | | | | | | 37,515 | | | | 10,963,008 | |
Microsoft Corporation | | | | | | | | | | | 98,435 | | | | 20,703,834 | |
NortonLifeLock Incorporated | | | | | | | | | | | 54,695 | | | | 1,139,844 | |
Palo Alto Networks Incorporated † | | | | | | | | | | | 4,780 | | | | 1,169,905 | |
Paycom Software Incorporated † | | | | | | | | | | | 65,455 | | | | 20,376,142 | |
RingCentral Incorporated Class A † | | | | | | | | | | | 62,800 | | | | 17,245,508 | |
Salesforce.com Incorporated † | | | | | | | | | | | 3,655 | | | | 918,575 | |
ServiceNow Incorporated † | | | | | | | | | | | 1,435 | | | | 695,975 | |
Splunk Incorporated † | | | | | | | | | | | 21,580 | | | | 4,059,845 | |
Varonis Systems Incorporated † | | | | | | | | | | | 21,660 | | | | 2,499,997 | |
Workday Incorporated Class A † | | | | | | | | | | | 2,900 | | | | 623,877 | |
Zendesk Incorporated † | | | | | | | | | | | 11,770 | | | | 1,211,368 | |
The accompanying notes are an integral part of these financial statements.
10 | Wells Fargo Specialized Technology Fund
Portfolio of investments—September 30, 2020 (unaudited)
| | | | | | | | | | | | | | | | |
| | | | | | | | | Shares | | | Value | |
|
| Software (continued) | |
Zoom Video Communications Incorporated † | | | | | | | | | | | 28,340 | | | $ | 13,322,917 | |
Zscaler Incorporated † | | | | | | | | | | | 114,095 | | | | 16,052,026 | |
| | | | |
| | | | | | | | | | | | | | | 161,661,352 | |
| | | | | | | | | | | | | | | | |
| | | | |
| Technology Hardware, Storage & Peripherals: 11.51% | | | | | | | | | | | | |
Apple Incorporated | | | | | | | | | | | 515,960 | | | | 59,753,328 | |
Pure Storage Incorporated Class A † | | | | | | | | | | | 228,990 | | | | 3,524,156 | |
Samsung Electronics Company Limited | | | | | | | | | | | 157,791 | | | | 7,833,396 | |
| | | | |
| | | | | | | | | | | | | | | 71,110,880 | |
| | | | | | | | | | | | | | | | |
| | | | |
Real Estate: 0.10% | | | | | | | | | | | | | | | | |
| | | | |
| Equity REITs: 0.10% | | | | | | | | | | | | |
Equinix Incorporated | | | | | | | | | | | 790 | | | | 600,503 | |
| | | | | | | | | | | | | | | | |
| | | | |
Total Common Stocks (Cost $316,963,616) | | | | | | | | | | | | | | | 589,060,455 | |
| | | | | | | | | | | | | | | | |
| | | | |
| | | | | | | | | | | | | | | | |
| | | Yield | | | | | | | | | | |
| Short-Term Investments: 5.32% | | | | | | | | | | | | |
| | | | |
| Investment Companies: 5.32% | | | | | | | | | | | | |
Securities Lending Cash Investments LLC (l)(r)(u) | | | 0.12 | % | | | | | | | 1,727,875 | | | | 1,727,875 | |
Wells Fargo Government Money Market Fund Select Class (l)(u) | | | 0.05 | | | | | | | | 31,149,932 | | | | 31,149,932 | |
| | | | |
Total Short-Term Investments (Cost $32,877,807) | | | | | | | | | | | | | | | 32,877,807 | |
| | | | | | | | | | | | | | | | |
| | | | | | | | |
| Total investments in securities (Cost $349,841,423) | | | 100.65 | % | | | 621,938,262 | |
| | |
Other assets and liabilities, net | | | (0.65 | ) | | | (3,992,549 | ) |
| | | | | | | | |
| Total net assets | | | 100.00 | % | | $ | 617,945,713 | |
| | | | | | | | |
| † | Non-income-earning security |
| « | All or a portion of this security is on loan. |
| 144A | The security may be resold in transactions exempt from registration, normally to qualified institutional buyers, pursuant to Rule 144A under the Securities Act of 1933. |
| (l) | The issuer of the security is an affiliated person of the Fund as defined in the Investment Company Act of 1940. |
| (r) | The investment is a non-registered investment company purchased with cash collateral received from securities on loan. |
| (u) | The rate represents the 7-day annualized yield at period end. |
Abbreviations:
| ADR | American depositary receipt |
| REIT | Real estate investment trust |
The accompanying notes are an integral part of these financial statements.
Wells Fargo Specialized Technology Fund | 11
Portfolio of investments—September 30, 2020 (unaudited)
Investments in Affiliates
An affiliated investment is an investment in which the Fund owns at least 5% of the outstanding voting shares of the issuer or as a result of other relationships, such as the Fund and the issuer having the same investment manager. Transactions with issuers that were either affiliated persons of the Fund at the beginning of the period or the end of the period were as follows:
| | | | | | | | | | | | | | | | | | | | | | | | | | | | | | | | |
| | | Value, beginning of period | | | Purchases | | | Sales proceeds | | | Net realized gains (losses) | | | Net change in unrealized gains (losses) | | | Income from affiliated securities | | | Value, end of period | | | % of net assets | |
| | | | | | | | |
| Short-Term Investments | | | | | | | | | | | | | | | | | | | | | | | | |
Investment Companies | | | | | | | | | | | | | | | | | | | | | | | | | | | | | | | | |
Securities Lending Cash Investments LLC | | $ | 53,595 | | | $ | 16,745,430 | | | $ | (15,071,155 | ) | | $ | 11 | | | $ | (6 | ) | | $ | 303 | # | | $ | 1,727,875 | | | | | |
Wells Fargo Government Money Market Fund Select Class | | | 18,610,094 | | | | 150,109,755 | | | | (137,569,917 | ) | | | 0 | | | | 0 | | | | 15,915 | | | | 31,149,932 | | | | | |
| | | | | | | | | | | | | | | | | | | | | | | | | | | | | | | | |
| | | | | | | | | | | | | | $ | 11 | | | $ | (6 | ) | | $ | 16,218 | | | $ | 32,877,807 | | | | 5.32 | % |
| | | | | | | | | | | | | | | | | | | | | | | | | | | | | | | | |
| # | Amount shown represents income before fees and rebates. |
The accompanying notes are an integral part of these financial statements.
12 | Wells Fargo Specialized Technology Fund
Statement of assets and liabilities—September 30, 2020 (unaudited)
| | | | |
| | | | |
| |
Assets | | | | |
Investments in unaffiliated securities (including $1,692,057 of securities loaned), at value (cost $316,963,616) | | $ | 589,060,455 | |
Investments in affiliated securities, at value (cost $32,877,807) | | | 32,877,807 | |
Receivable for Fund shares sold | | | 525,853 | |
Receivable for dividends | | | 49,699 | |
Receivable for securities lending income, net | | | 832 | |
Prepaid expenses and other assets | | | 37,684 | |
| | | | |
Total assets | | | 622,552,330 | |
| | | | |
| |
Liabilities | | | | |
Payable upon receipt of securities loaned | | | 1,724,901 | |
Payable for investments purchased | | | 1,905,939 | |
Payable for Fund shares redeemed | | | 252,822 | |
Management fee payable | | | 421,112 | |
Administration fees payable | | | 98,899 | |
Distribution fee payable | | | 7,189 | |
Trustees’ fees and expenses payable | | | 2,716 | |
Accrued expenses and other liabilities | | | 193,039 | |
| | | | |
Total liabilities | | | 4,606,617 | |
| | | | |
Total net assets | | $ | 617,945,713 | |
| | | | |
| |
Net assets consist of | | | | |
Paid-in capital | | $ | 228,165,872 | |
Total distributable earnings | | | 389,779,841 | |
| | | | |
Total net assets | | $ | 617,945,713 | |
| | | | |
| |
Computation of net asset value and offering price per share | | | | |
Net assets – Class A | | $ | 520,457,685 | |
Shares outstanding – Class A1 | | | 28,142,433 | |
Net asset value per share – Class A | | | $18.49 | |
Maximum offering price per share – Class A2 | | | $19.62 | |
Net assets – Class C | | $ | 12,028,439 | |
Shares outstanding – Class C1 | | | 894,530 | |
Net asset value per share – Class C | | | $13.45 | |
Net assets – Administrator Class | | $ | 10,292,809 | |
Shares outstanding – Administrator Class1 | | | 542,220 | |
Net asset value per share – Administrator Class | | | $18.98 | |
Net assets – Institutional Class | | $ | 75,166,780 | |
Shares outstanding – Institutional Class1 | | | 3,917,340 | |
Net asset value per share – Institutional Class | | | $19.19 | |
| 1 | The Fund has an unlimited number of authorized shares. |
| 2 | Maximum offering price is computed as 100/94.25 of net asset value. On investments of $50,000 or more, the offering price is reduced. |
The accompanying notes are an integral part of these financial statements.
Wells Fargo Specialized Technology Fund | 13
Statement of operations—six months ended September 30, 2020 (unaudited)
| | | | |
| | | | |
| |
Investment income | | | | |
Dividends (net of foreign withholding taxes of $31,081) | | $ | 848,098 | |
Income from affiliated securities | | | 17,298 | |
| | | | |
Total investment income | | | 865,396 | |
| | | | |
| |
Expenses | | | | |
Management fee | | | 2,329,358 | |
Administration fees | |
Class A | | | 480,624 | |
Class C | | | 11,387 | |
Administrator Class | | | 5,978 | |
Institutional Class | | | 42,528 | |
Shareholder servicing fees | |
Class A | | | 571,497 | |
Class C | | | 13,471 | |
Administrator Class | | | 11,334 | |
Distribution fee | |
Class C | | | 40,531 | |
Custody and accounting fees | | | 23,869 | |
Professional fees | | | 20,487 | |
Registration fees | | | 36,501 | |
Shareholder report expenses | | | 26,846 | |
Trustees’ fees and expenses | | | 9,776 | |
Other fees and expenses | | | 8,824 | |
| | | | |
Total expenses | | | 3,633,011 | |
Less: Fee waivers and/or expense reimbursements | |
Fund-level | | | (10,442 | ) |
Class A | | | (20,818 | ) |
Administrator Class | | | (307 | ) |
Institutional Class | | | (1,713 | ) |
| | | | |
Net expenses | | | 3,599,731 | |
| | | | |
Net investment loss | | | (2,734,335 | ) |
| | | | |
| |
Realized and unrealized gains (losses) on investments | | | | |
Net realized gains on | | | | |
Unaffiliated securities | | | 52,090,790 | |
Affiliated securities | | | 11 | |
| | | | |
Net realized gains on investments | | | 52,090,801 | |
| | | | |
|
Net change in unrealized gains (losses) on | |
Unaffiliated securities | | | 167,836,038 | |
Affiliated securities | | | (6 | ) |
| | | | |
Net change in unrealized gains (losses) on investments | | | 167,836,032 | |
| | | | |
Net realized and unrealized gains (losses) on investments | | | 219,926,833 | |
| | | | |
Net increase in net assets resulting from operations | | $ | 217,192,498 | |
| | | | |
The accompanying notes are an integral part of these financial statements.
14 | Wells Fargo Specialized Technology Fund
Statement of changes in net assets
| | | | | | | | | | | | | | | | |
| | | Six months ended
September 30, 2020
(unaudited) | | | Year ended
March 31, 2020 | |
| |
Operations | | | | | |
Net investment loss | | | | | | $ | (2,734,335 | ) | | | | | | $ | (3,722,238 | ) |
Net realized gains on investments | | | | | | | 52,090,801 | | | | | | | | 74,062,664 | |
Net change in unrealized gains (losses) on investments | | | | | | | 167,836,032 | | | | | | | | (74,516,995 | ) |
| | | | |
Net increase (decrease) in net assets resulting from operations | | | | | | | 217,192,498 | | | | | | | | (4,176,569 | ) |
| | | | |
| | | | |
Distributions to shareholders from net investment income and net realized gains | | | | | | | | | | | | | | | | |
Class A | | | | | | | 0 | | | | | | | | (31,171,888 | ) |
Class C | | | | | | | 0 | | | | | | | | (1,047,506 | ) |
Administrator Class | | | | | | | 0 | | | | | | | | (1,113,358 | ) |
Institutional Class | | | | | | | 0 | | | | | | | | (4,318,998 | ) |
| | | | |
Total distributions to shareholders | | | | | | | 0 | | | | | | | | (37,651,750 | ) |
| | | | |
| | | | |
Capital share transactions | | | Shares | | | | | | | | Shares | | | | | |
Proceeds from shares sold | |
Class A | | | 1,228,497 | | | | 19,830,045 | | | | 1,724,961 | | | | 23,395,221 | |
Class C | | | 172,506 | | | | 1,902,422 | | | | 171,525 | | | | 1,707,541 | |
Administrator Class | | | 146,589 | | | | 2,377,400 | | | | 266,990 | | | | 3,760,903 | |
Institutional Class | | | 836,449 | | | | 13,558,483 | | | | 1,773,569 | | | | 24,663,966 | |
| | | | |
| | | | | | | 37,668,350 | | | | | | | | 53,527,631 | |
| | | | |
Reinvestment of distributions | |
Class A | | | 0 | | | | 0 | | | | 2,378,590 | | | | 30,303,237 | |
Class C | | | 0 | | | | 0 | | | | 107,421 | | | | 999,020 | |
Administrator Class | | | 0 | | | | 0 | | | | 84,495 | | | | 1,104,349 | |
Institutional Class | | | 0 | | | | 0 | | | | 323,832 | | | | 4,268,105 | |
| | | | |
| | | | | | | 0 | | | | | | | | 36,674,711 | |
| | | | |
Payment for shares redeemed | |
Class A | | | (1,650,228 | ) | | | (26,822,664 | ) | | | (5,688,194 | ) | | | (76,162,836 | ) |
Class C | | | (191,195 | ) | | | (2,258,709 | ) | | | (517,350 | ) | | | (5,055,114 | ) |
Administrator Class | | | (562,223 | ) | | | (7,901,331 | ) | | | (1,040,848 | ) | | | (14,045,822 | ) |
Institutional Class | | | (796,044 | ) | | | (13,293,669 | ) | | | (1,951,266 | ) | | | (27,057,139 | ) |
| | | | |
| | | | | | | (50,276,373 | ) | | | | | | | (122,320,911 | ) |
| | | | |
Net decrease in net assets resulting from capital share transactions | | | | | | | (12,608,023 | ) | | | | | | | (32,118,569 | ) |
| | | | |
Total increase (decrease) in net assets | | | | | | | 204,584,475 | | | | | | | | (73,946,888 | ) |
| | | | |
| | |
Net assets | | | | | | | | |
Beginning of period | | | | | | | 413,361,238 | | | | | | | | 487,308,126 | |
| | | | |
End of period | | | | | | $ | 617,945,713 | | | | | | | $ | 413,361,238 | |
| | | | |
The accompanying notes are an integral part of these financial statements.
Wells Fargo Specialized Technology Fund | 15
Financial highlights
(For a share outstanding throughout each period)
| | | | | | | | | | | | | | | | | | | | | | | | |
| | | Six months ended
September 30, 2020
(unaudited) | | | Year ended March 31 | |
| CLASS A | | 2020 | | | 2019 | | | 2018 | | | 2017 | | | 2016 | |
Net asset value, beginning of period | | | $12.08 | | | | $13.33 | | | | $14.08 | | | | $10.95 | | | | $9.39 | | | | $10.74 | |
Net investment loss | | | (0.08 | ) | | | (0.11 | ) | | | (0.11 | ) | | | (0.10 | )1 | | | (0.03 | )1 | | | (0.06 | ) |
Net realized and unrealized gains (losses) on investments | | | 6.49 | | | | (0.01 | ) | | | 2.06 | | | | 4.20 | | | | 2.17 | | | | 0.02 | |
| | | | | | | | | | | | | | | | | | | | | | | | |
Total from investment operations | | | 6.41 | | | | (0.12 | ) | | | 1.95 | | | | 4.10 | | | | 2.14 | | | | (0.04 | ) |
Distributions to shareholders from | | | | | | | | | | | | | | | | | | | | | | | | |
Net realized gains | | | 0.00 | | | | (1.13 | ) | | | (2.70 | ) | | | (0.97 | ) | | | (0.58 | ) | | | (1.31 | ) |
Net asset value, end of period | | | $18.49 | | | | $12.08 | | | | $13.33 | | | | $14.08 | | | | $10.95 | | | | $9.39 | |
Total return2 | | | 53.06 | % | | | (1.31 | )% | | | 16.80 | % | | | 38.41 | % | | | 23.55 | % | | | (0.66 | )% |
Ratios to average net assets (annualized) | | | | | | | | | | | | | | | | | | | | | | | | |
Gross expenses | | | 1.36 | % | | | 1.39 | % | | | 1.40 | % | | | 1.41 | % | | | 1.44 | % | | | 1.45 | % |
Net expenses | | | 1.35 | % | | | 1.38 | % | | | 1.39 | % | | | 1.41 | % | | | 1.44 | % | | | 1.45 | % |
Net investment loss | | | (1.03 | )% | | | (0.80 | )% | | | (0.77 | )% | | | (0.75 | )% | | | (0.28 | )% | | | (0.53 | )% |
Supplemental data | | | | | | | | | | | | | | | | | | | | | | | | |
Portfolio turnover rate | | | 69 | % | | | 149 | % | | | 107 | % | | | 109 | % | | | 131 | % | | | 153 | % |
Net assets, end of period (000s omitted) | | | $520,458 | | | | $344,949 | | | | $401,990 | | | | $353,552 | | | | $266,329 | | | | $267,811 | |
| 1 | Calculated based upon average shares outstanding |
| 2 | Total return calculations do not include any sales charges. Returns for periods of less than one year are not annualized. |
The accompanying notes are an integral part of these financial statements.
16 | Wells Fargo Specialized Technology Fund
Financial highlights
(For a share outstanding throughout each period)
| | | | | | | | | | | | | | | | | | | | | | | | |
| | | Six months ended
September 30, 2020
(unaudited) | | | Year ended March 31 | |
| CLASS C | | 2020 | | | 2019 | | | 2018 | | | 2017 | | | 2016 | |
Net asset value, beginning of period | | | $8.80 | | | | $10.09 | | | | $11.38 | | | | $9.06 | | | | $7.92 | | | | $9.33 | |
Net investment loss | | | (0.10 | )1 | | | (0.16 | )1 | | | (0.17 | )1 | | | (0.16 | ) | | | (0.09 | )1 | | | (0.12 | )1 |
Net realized and unrealized gains (losses) on investments | | | 4.75 | | | | (0.00 | )2 | | | 1.58 | | | | 3.45 | | | | 1.81 | | | | 0.02 | |
| | | | | | | | | | | | | | | | | | | | | | | | |
Total from investment operations | | | 4.65 | | | | (0.16 | ) | | | 1.41 | | | | 3.29 | | | | 1.72 | | | | (0.10 | ) |
Distributions to shareholders from | | | | | | | | | | | | | | | | | | | | | | | | |
Net realized gains | | | 0.00 | | | | (1.13 | ) | | | (2.70 | ) | | | (0.97 | ) | | | (0.58 | ) | | | (1.31 | ) |
Net asset value, end of period | | | $13.45 | | | | $8.80 | | | | $10.09 | | | | $11.38 | | | | $9.06 | | | | $7.92 | |
Total return3 | | | 52.84 | % | | | (2.15 | )% | | | 16.01 | % | | | 37.45 | % | | | 22.59 | % | | | (1.45 | )% |
Ratios to average net assets (annualized) | | | | | | | | | | | | | | | | | | | | | | | | |
Gross expenses | | | 2.11 | % | | | 2.14 | % | | | 2.15 | % | | | 2.16 | % | | | 2.19 | % | | | 2.20 | % |
Net expenses | | | 2.11 | % | | | 2.13 | % | | | 2.14 | % | | | 2.16 | % | | | 2.19 | % | | | 2.20 | % |
Net investment loss | | | (1.79 | )% | | | (1.57 | )% | | | (1.52 | )% | | | (1.49 | )% | | | (1.03 | )% | | | (1.34 | )% |
Supplemental data | | | | | | | | | | | | | | | | | | | | | | | | |
Portfolio turnover rate | | | 69 | % | | | 149 | % | | | 107 | % | | | 109 | % | | | 131 | % | | | 153 | % |
Net assets, end of period (000s omitted) | | | $12,028 | | | | $8,035 | | | | $11,615 | | | | $15,932 | | | | $12,827 | | | | $13,797 | |
| 1 | Calculated based upon average shares outstanding |
| 2 | Amount is more than $(0.005). |
| 3 | Total return calculations do not include any sales charges. Returns for periods of less than one year are not annualized. |
The accompanying notes are an integral part of these financial statements.
Wells Fargo Specialized Technology Fund | 17
Financial highlights
(For a share outstanding throughout each period)
| | | | | | | | | | | | | | | | | | | | | | | | |
| | | Six months ended
September 30, 2020
(unaudited) | | | Year ended March 31 | |
| ADMINISTRATOR CLASS | | 2020 | | | 2019 | | | 2018 | | | 2017 | | | 2016 | |
Net asset value, beginning of period | | | $12.40 | | | | $13.65 | | | | $14.34 | | | | $11.12 | | | | $9.52 | | | | $10.86 | |
Net investment loss | | | (0.08 | )1 | | | (0.10 | )1 | | | (0.09 | )1 | | | (0.09 | )1 | | | (0.02 | ) | | | (0.05 | ) |
Net realized and unrealized gains (losses) on investments | | | 6.66 | | | | (0.02 | ) | | | 2.10 | | | | 4.28 | | | | 2.20 | | | | 0.02 | |
| | | | | | | | | | | | | | | | | | | | | | | | |
Total from investment operations | | | 6.58 | | | | (0.12 | ) | | | 2.01 | | | | 4.19 | | | | 2.18 | | | | (0.03 | ) |
Distributions to shareholders from | | | | | | | | | | | | | | | | | | | | | | | | |
Net realized gains | | | 0.00 | | | | (1.13 | ) | | | (2.70 | ) | | | (0.97 | ) | | | (0.58 | ) | | | (1.31 | ) |
Net asset value, end of period | | | $18.98 | | | | $12.40 | | | | $13.65 | | | | $14.34 | | | | $11.12 | | | | $9.52 | |
Total return2 | | | 53.19 | % | | | (1.28 | )% | | | 17.02 | % | | | 38.55 | % | | | 23.65 | % | | | (0.56 | )% |
Ratios to average net assets (annualized) | | | | | | | | | | | | | | | | | | | | | | | | |
Gross expenses | | | 1.28 | % | | | 1.31 | % | | | 1.32 | % | | | 1.33 | % | | | 1.36 | % | | | 1.35 | % |
Net expenses | | | 1.27 | % | | | 1.28 | % | | | 1.29 | % | | | 1.32 | % | | | 1.33 | % | | | 1.33 | % |
Net investment loss | | | (0.96 | )% | | | (0.71 | )% | | | (0.65 | )% | | | (0.66 | )% | | | (0.17 | )% | | | (0.48 | )% |
Supplemental data | | | | | | | | | | | | | | | | | | | | | | | | |
Portfolio turnover rate | | | 69 | % | | | 149 | % | | | 107 | % | | | 109 | % | | | 131 | % | | | 153 | % |
Net assets, end of period (000s omitted) | | | $10,293 | | | | $11,873 | | | | $22,480 | | | | $19,140 | | | | $39,833 | | | | $32,373 | |
| 1 | Calculated based upon average shares outstanding |
| 2 | Returns for periods of less than one year are not annualized. |
The accompanying notes are an integral part of these financial statements.
18 | Wells Fargo Specialized Technology Fund
Financial highlights
(For a share outstanding throughout each period)
| | | | | | | | | | | | | | | | | | | | |
| | | Six months ended
September 30, 2020
(unaudited) | | | Year ended March 31 | |
| INSTITUTIONAL CLASS | | 2020 | | | 2019 | | | 2018 | | | 20171 | |
Net asset value, beginning of period | | | $12.51 | | | | $13.73 | | | | $14.37 | | | | $11.12 | | | | $10.42 | |
Net investment income (loss) | | | (0.06 | ) | | | (0.07 | ) | | | (0.07 | ) | | | (0.05 | ) | | | 0.01 | 2 |
Net realized and unrealized gains (losses) on investments | | | 6.74 | | | | (0.02 | ) | | | 2.13 | | | | 4.27 | | | | 1.27 | |
| | | | | | | | | | | | | | | | | | | | |
Total from investment operations | | | 6.68 | | | | (0.09 | ) | | | 2.06 | | | | 4.22 | | | | 1.28 | |
Distributions to shareholders from | | | | | | | | | | | | | | | | | | | | |
Net realized gains | | | 0.00 | | | | (1.13 | ) | | | (2.70 | ) | | | (0.97 | ) | | | (0.58 | ) |
Net asset value, end of period | | | $19.19 | | | | $12.51 | | | | $13.73 | | | | $14.37 | | | | $11.12 | |
Total return3 | | | 53.40 | % | | | (1.05 | )% | | | 17.25 | % | | | 38.91 | % | | | 12.97 | % |
Ratios to average net assets (annualized) | | | | | | | | | | | | | | | | | | | | |
Gross expenses | | | 1.03 | % | | | 1.06 | % | | | 1.07 | % | | | 1.08 | % | | | 1.11 | % |
Net expenses | | | 1.02 | % | | | 1.03 | % | | | 1.04 | % | | | 1.07 | % | | | 1.08 | % |
Net investment income (loss) | | | (0.70 | )% | | | (0.47 | )% | | | (0.42 | )% | | | (0.40 | )% | | | 0.17 | % |
Supplemental data | | | | | | | | | | | | | | | | | | | | |
Portfolio turnover rate | | | 69 | % | | | 149 | % | | | 107 | % | | | 109 | % | | | 131 | % |
Net assets, end of period (000s omitted) | | | $75,167 | | | | $48,504 | | | | $51,223 | | | | $27,509 | | | | $19,869 | |
| 1 | For the period from October 31, 2016 (commencement of class operations) to March 31, 2017 |
| 2 | Calculated based upon average shares outstanding |
| 3 | Returns for periods of less than one year are not annualized. |
The accompanying notes are an integral part of these financial statements.
Wells Fargo Specialized Technology Fund | 19
Notes to financial statements (unaudited)
1. ORGANIZATION
Wells Fargo Funds Trust (the “Trust”), a Delaware statutory trust organized on March 10, 1999, is an open-end management investment company registered under the Investment Company Act of 1940, as amended (the “1940 Act”). As an investment company, the Trust follows the accounting and reporting guidance in Financial Accounting Standards Board (“FASB”) Accounting Standards Codification Topic 946, Financial Services – Investment Companies. These financial statements report on the Wells Fargo Specialized Technology Fund (the “Fund”) which is a non-diversified series of the Trust.
2. SIGNIFICANT ACCOUNTING POLICIES
The following significant accounting policies, which are consistently followed in the preparation of the financial statements of the Fund, are in conformity with U.S. generally accepted accounting principles which require management to make estimates and assumptions that affect the reported amounts of assets and liabilities, disclosure of contingent assets and liabilities at the date of the financial statements, and the reported amounts of revenues and expenses during the reporting period. Actual results could differ from those estimates.
Securities valuation
All investments are valued each business day as of the close of regular trading on the New York Stock Exchange (generally 4 p.m. Eastern Time), although the Fund may deviate from this calculation time under unusual or unexpected circumstances.
Equity securities that are listed on a foreign or domestic exchange or market are valued at the official closing price or, if none, the last sales price. If no sale occurs on the principal exchange or market that day, a fair value price will be determined in accordance with the Fund’s Valuation Procedures.
The values of securities denominated in foreign currencies are translated into U.S. dollars at rates provided by an independent foreign currency pricing source at a time each business day specified by the Wells Fargo Asset Management Pricing Committee at Wells Fargo Funds Management, LLC (“Funds Management”).
Many securities markets and exchanges outside the U.S. close prior to the close of the New York Stock Exchange and therefore may not fully reflect trading or events that occur after the close of the principal exchange in which the foreign securities are traded, but before the close of the New York Stock Exchange. If such trading or events are expected to materially affect the value of such securities, then fair value pricing procedures approved by the Board of Trustees of the Fund are applied. These procedures take into account multiple factors including movements in U.S. securities markets after foreign exchanges close. Foreign securities that are fair valued under these procedures are categorized as Level 2 and the application of these procedures may result in transfers between Level 1 and Level 2. Depending on market activity, such fair valuations may be frequent. Such fair value pricing may result in net asset values that are higher or lower than net asset values based on the last reported sales price or latest quoted bid price. On September 30, 2020, such fair value pricing was used in pricing certain foreign securities.
Investments in registered open-end investment companies are valued at net asset value. Interests in non-registered investment companies that are redeemable at net asset value are fair valued normally at net asset value.
Investments which are not valued using any of the methods discussed above are valued at their fair value, as determined in good faith by the Board of Trustees. The Board of Trustees has established a Valuation Committee comprised of the Trustees and has delegated to it the authority to take any actions regarding the valuation of portfolio securities that the Valuation Committee deems necessary or appropriate, including determining the fair value of portfolio securities, unless the determination has been delegated to the Wells Fargo Asset Management Pricing Committee. The Board of Trustees retains the authority to make or ratify any valuation decisions or approve any changes to the Valuation Procedures as it deems appropriate. On a quarterly basis, the Board of Trustees receives reports on any valuation actions taken by the Valuation Committee or the Wells Fargo Asset Management Pricing Committee which may include items for ratification.
Foreign currency translation
The accounting records of the Fund are maintained in U.S. dollars. The values of other assets and liabilities denominated in foreign currencies are translated into U.S. dollars at rates provided by an independent foreign currency pricing source at a time each business day specified by the Wells Fargo Asset Management Pricing Committee. Purchases and sales of securities, and income and expenses are converted at the rate of exchange on the respective dates of such transactions. Net realized foreign exchange gains or losses arise from sales of foreign currencies, currency gains or losses realized between the trade and settlement dates on securities transactions, and the difference between the amounts of dividends, interest and foreign withholding taxes recorded and the U.S. dollar equivalent of the amounts actually paid or received. Net unrealized foreign exchange gains and losses arise from changes in the fair value of assets and liabilities other than investments in securities resulting from changes in exchange rates. The changes in net assets arising from changes in exchange rates of securities and the changes in net assets resulting from changes in market prices of securities are not separately presented. Such changes are included in net realized and unrealized gains or losses from investments.
20 | Wells Fargo Specialized Technology Fund
Notes to financial statements (unaudited)
Securities lending
The Fund may lend its securities from time to time in order to earn additional income in the form of fees or interest on securities received as collateral or the investment of any cash received as collateral. When securities are on loan, the Fund receives interest or dividends on those securities. Cash collateral received in connection with its securities lending transactions is invested in Securities Lending Cash Investments, LLC (the “Securities Lending Fund”). Investments in Securities Lending Fund are valued at the evaluated bid price provided by an independent pricing service. Income earned from investment in the Securities Lending Fund (net of fees and rebates), if any, is included in income from affiliated securities on the Statement of Operations.
In a securities lending transaction, the net asset value of the Fund is affected by an increase or decrease in the value of the securities loaned and by an increase or decrease in the value of the instrument in which collateral is invested. The amount of securities lending activity undertaken by the Fund fluctuates from time to time. The Fund has the right under the lending agreement to recover the securities from the borrower on demand. In the event of default or bankruptcy by the borrower, the Fund may be prevented from recovering the loaned securities or gaining access to the collateral or may experience delays or costs in doing so. In such an event, the terms of the agreement allow the unaffiliated securities lending agent to use the collateral to purchase replacement securities on behalf of the Fund or pay the Fund the market value of the loaned securities. The Fund bears the risk of loss with respect to depreciation of its investment of the cash collateral.
Security transactions and income recognition
Securities transactions are recorded on a trade date basis. Realized gains or losses are recorded on the basis of identified cost.
Dividend income is recognized on the ex-dividend date, except for certain dividends from foreign securities, which are recorded as soon as the custodian verifies the ex-dividend date. Dividend income from foreign securities is recorded net of foreign taxes withheld where recovery of such taxes is not assured.
Distributions to shareholders
Distributions to shareholders from net investment income and any net realized gains are recorded on the ex-dividend date and paid at least annually. Such distributions are determined in accordance with income tax regulations and may differ from U.S. generally accepted accounting principles. Dividend sources are estimated at the time of declaration. The tax character of distributions is determined as of the Fund’s fiscal year end. Therefore, a portion of the Fund’s distributions made prior to the Fund’s fiscal year end may be categorized as a tax return of capital at year end.
Federal and other taxes
The Fund intends to continue to qualify as a regulated investment company by distributing substantially all of its investment company taxable income and any net realized capital gains (after reduction for capital loss carryforwards) sufficient to relieve it from all, or substantially all, federal income taxes. Accordingly, no provision for federal income taxes was required.
The Fund’s income and federal excise tax returns and all financial records supporting those returns for the prior three fiscal years are subject to examination by the federal and Delaware revenue authorities. Management has analyzed the Fund’s tax positions taken on federal, state, and foreign tax returns for all open tax years and does not believe that there are any uncertain tax positions that require recognition of a tax liability.
As of September 30, 2020, the aggregate cost of all investments for federal income tax purposes was $376,460,461 and the unrealized gains (losses) consisted of:
| | | | |
| |
Gross unrealized gains | | $ | 260,697,071 | |
| |
Gross unrealized losses | | | (15,219,270 | ) |
| |
Net unrealized gains | | $ | 245,477,801 | |
As of March 31, 2020, the Fund had a qualified late-year ordinary loss of $1,932,818 which will was recognized on the first day of the current fiscal year.
Class allocations
The separate classes of shares offered by the Fund differ principally in applicable sales charges, distribution, shareholder servicing, and administration fees. Class specific expenses are charged directly to that share class. Investment income, common fund-level expenses, and realized and unrealized gains (losses) on investments are allocated daily to each class of shares based on the relative proportion of net assets of each class.
Wells Fargo Specialized Technology Fund | 21
Notes to financial statements (unaudited)
3. FAIR VALUATION MEASUREMENTS
Fair value measurements of investments are determined within a framework that has established a fair value hierarchy based upon the various data inputs utilized in determining the value of the Fund’s investments. The three-level hierarchy gives the highest priority to unadjusted quoted prices in active markets for identical assets or liabilities (Level 1) and the lowest priority to unobservable inputs (Level 3). The Fund’s investments are classified within the fair value hierarchy based on the lowest level of input that is significant to the fair value measurement. The inputs are summarized into three broad levels as follows:
| ∎ | | Level 1 – quoted prices in active markets for identical securities |
| ∎ | | Level 2 – other significant observable inputs (including quoted prices for similar securities, interest rates, prepayment speeds, credit risk, etc.) |
| ∎ | | Level 3 – significant unobservable inputs (including the Fund’s own assumptions in determining the fair value of investments) |
The inputs or methodologies used for valuing investments in securities are not necessarily an indication of the risk associated with investing in those securities.
The following is a summary of the inputs used in valuing the Fund’s assets and liabilities as of September 30, 2020:
| | | | | | | | | | | | | | | | |
| | | | |
| | | Quoted prices
(Level 1) | | | Other significant observable inputs (Level 2) | | | Significant unobservable inputs (Level 3) | | | Total | |
| | | | |
Assets | | | | | | | | | | | | | | | | |
Investments in: | | | | | | | | | | | | | | | | |
| | | | |
Common stocks | | | | | | | | | | | | | | | | |
| | | | |
Communication services | | $ | 60,899,071 | | | $ | 1,472,445 | | | $ | 0 | | | $ | 62,371,516 | |
| | | | |
Consumer discretionary | | | 62,919,049 | | | | 0 | | | | 0 | | | | 62,919,049 | |
| | | | |
Health care | | | 4,940,508 | | | | 0 | | | | 0 | | | | 4,940,508 | |
| | | | |
Industrials | | | 705,682 | | | | 0 | | | | 0 | | | | 705,682 | |
| | | | |
Information technology | | | 441,126,146 | | | | 16,397,051 | | | | 0 | | | | 457,523,197 | |
| | | | |
Real estate | | | 600,503 | | | | 0 | | | | 0 | | | | 600,503 | |
| | | | |
Short-term investments | | | | | | | | | | | | | | | | |
| | | | |
Investment companies | | | 32,877,807 | | | | 0 | | | | 0 | | | | 32,877,807 | |
| | | | |
Total assets | | $ | 604,068,766 | | | $ | 17,869,496 | | | $ | 0 | | | $ | 621,938,262 | |
Additional sector, industry or geographic detail is included in the Portfolio of Investments.
For the six months ended September 30, 2020, the Fund did not have any transfers into/out of Level 3.
4. TRANSACTIONS WITH AFFILIATES AND OTHER EXPENSES
Management fee
Funds Management, an indirect wholly owned subsidiary of Wells Fargo & Company (“Wells Fargo”), is the manager of the Fund and provides advisory and fund-level administrative services under an investment management agreement. Under the investment management agreement, Funds Management is responsible for, among other services, implementing the investment objectives and strategies of the Fund, supervising the subadviser and providing fund-level administrative services in connection with the Fund’s operations. As compensation for its services under the investment management agreement, Funds Management is entitled to receive a management fee at the following annual rate based on the Fund’s average daily net assets:
| | | | | | | | |
| | |
| Average daily net assets | | Management fee | | | Rate prior to June 1, 2020 | |
| | |
First $500 million | | | 0.850 | % | | | 0.880 | % |
| | |
Next $500 million | | | 0.840 | | | | 0.875 | |
| | |
Next $1 billion | | | 0.815 | | | | 0.850 | |
| | |
Next $2 billion | | | 0.790 | | | | 0.825 | |
| | |
Next $1 billion | | | 0.765 | | | | 0.800 | |
| | |
Next $5 billion | | | 0.755 | | | | 0.790 | |
| | |
Over $10 billion | | | 0.745 | | | | 0.780 | |
22 | Wells Fargo Specialized Technology Fund
Notes to financial statements (unaudited)
For the six months ended September 30, 2020, the management fee was equivalent to an annual rate of 0.86% of the Fund’s average daily net assets.
Funds Management has retained the services of a subadviser to provide daily portfolio management to the Fund. The fee for subadvisory services is borne by Funds Management. Allianz Global Investors U.S. LLC, which is not an affiliate of Funds Management, is the subadviser to the Fund and is entitled to receive a fee from Funds Management at an annual rate starting at 0.57% and declining to 0.50% as the average daily net assets of the Fund increase. Prior to June 1, 2020, Allianz Global Investors U.S. LLC, received a fee at an annual rate which started at 0.80% and declined to 0.55% as the average daily net assets of the Fund increased.
Administration fees
Under a class-level administration agreement, Funds Management provides class-level administrative services to the Fund, which includes paying fees and expenses for services provided by the transfer agent, sub-transfer agents, omnibus account servicers and record-keepers. As compensation for its services under the class-level administration agreement, Funds Management receives an annual fee which is calculated based on the average daily net assets of each class as follows:
| | | | |
| |
| | | Class-level administration fee | |
| |
Class A, Class C | | | 0.21 | % |
| |
Administrator Class, Institutional Class | | | 0.13 | |
Waivers and/or expense reimbursements
Funds Management has contractually waived and/or reimbursed management and administration fees to the extent necessary to maintain certain net operating expense ratios for the Fund. When each class of the Fund has exceeded its expense cap, Funds Management has waived fees and/or reimbursed expenses from fund-level expenses on a proportionate basis and then from class specific expenses. When only certain classes exceed their expense caps, waivers and/or reimbursements are applied against class specific expenses before fund-level expenses. Funds Management has committed through July 31, 2021 to waive fees and/or reimburse expenses to the extent necessary to cap the Fund’s expenses at 1.35% for Class A shares, 2.10% for Class C shares, 1.28% for Administrator Class shares, and 1.03% for Institutional Class shares. Prior to or after the commitment expiration date, the cap may be increased or the commitment to maintain the cap may be terminated only with the approval of the Board of Trustees. Prior to June 1, 2020, the Fund’s expenses were capped at 1.38% for Class A shares and 2.13% for Class C shares.
Distribution fee
The Trust has adopted a distribution plan for Class C shares of the Fund pursuant to Rule 12b-1 under the 1940 Act. A distribution fees are charged to Class C shares and paid to Wells Fargo Funds Distributor, LLC (“Funds Distributor”), the principal underwriter, at an annual rate of 0.75% of the average daily net assets of Class C shares.
In addition, Funds Distributor is entitled to receive the front-end sales charge from the purchase of Class A shares and a contingent deferred sales charge on the redemption of certain Class A shares. Funds Distributor is also entitled to receive the contingent deferred sales charges from redemptions of Class C shares. For the six months ended September 30, 2020, Funds Distributor received $9,357 from the sale of Class A shares and $30 in contingent deferred sales charges from redemptions of Class C shares. No contingent deferred sales charges were incurred by Class A shares for the six months ended September 30, 2020.
Shareholder servicing fees
The Trust has entered into contracts with one or more shareholder servicing agents, whereby Class A, Class C, and Administrator Class of the Fund are charged a fee at an annual rate of 0.25% of the average daily net assets of each respective class. A portion of these total shareholder servicing fees were paid to affiliates of Wells Fargo.
Interfund transactions
The Fund may purchase or sell portfolio investment securities to certain other Wells Fargo affiliates pursuant to Rule 17a-7 under the 1940 Act and under procedures adopted by the Board of Trustees. The procedures have been designed to ensure that these interfund transactions, which do not incur broker commissions, are effected at current market prices.
5. INVESTMENT PORTFOLIO TRANSACTIONS
Purchases and sales of investments, excluding U.S. government obligations (if any) and short-term securities, for the six months ended September 30, 2020 were $360,075,853 and $376,205,449, respectively.
Wells Fargo Specialized Technology Fund | 23
Notes to financial statements (unaudited)
6. SECURITIES LENDING TRANSACTIONS
The Fund lends its securities through an unaffiliated securities lending agent and receives collateral in the form of cash or securities with a value at least equal to the value of the securities on loan. The value of the loaned securities is determined at the close of each business day and any increases or decreases in the required collateral are exchanged between the Fund and the counterparty on the next business day. Cash collateral received is invested in the Securities Lending Fund which seeks to provide a positive return compared to the daily Federal Funds Open Rate by investing in high-quality, U.S. dollar-denominated short-term money market instruments and is exempt from registration under Section 3(c)(7) of the 1940 Act. Securities Lending Fund is managed by Funds Management and is subadvised by WellsCap. Funds Management receives an advisory fee starting at 0.05% and declining to 0.01% as the average daily net assets of the Securities Lending Fund increase. All of the fees received by Funds Management are paid to WellsCap for its services as subadviser.
In the event of counterparty default or the failure of a borrower to return a loaned security, the Fund has the right to use the collateral to offset any losses incurred. As of September 30, 2020, the Fund had securities lending transactions with the following counterparties which are subject to offset:
| | | | | | | | | | | | |
| | | |
| Counterparty | | Value of securities on loan | | | Collateral received1 | | | Net amount | |
| | | |
Bank of America Securities Incorporated | | $ | 1,062,433 | | | $ | (1,062,433 | ) | | $ | 0 | |
| | | |
BNP Paribas Securities Corporation | | | 629,624 | | | | (629,624 | ) | | | 0 | |
| 1 | Collateral received within this table is limited to the collateral for the net transaction with the counterparty. |
7. BANK BORROWINGS
The Trust (excluding the money market funds), Wells Fargo Master Trust and Wells Fargo Variable Trust are parties to a $350,000,000 revolving credit agreement whereby the Fund is permitted to use bank borrowings for temporary or emergency purposes, such as to fund shareholder redemption requests. Interest under the credit agreement is charged to the Fund based on a borrowing rate equal to the higher of the Federal Funds rate in effect on that day plus 1.25% or the overnight LIBOR rate in effect on that day plus 1.25%. In addition, an annual commitment fee equal to 0.25% of the unused balance is allocated to each participating fund.
For the six months ended September 30, 2020, there were no borrowings by the Fund under the agreement.
8. CONCENTRATION RISK
The Fund invests a substantial portion of its assets in information technology companies and, therefore, would be more affected by changes in the information technology sector than would be a fund whose investments are not heavily weighted in the sector.
9. INDEMNIFICATION
Under the Fund’s organizational documents, the officers and Trustees have been granted certain indemnification rights against certain liabilities that may arise out of performance of their duties to the Fund. The Fund has entered into a separate agreement with each Trustee that converts indemnification rights currently existing under the Fund’s organizational documents into contractual rights that cannot be changed in the future without the consent of the Trustee. Additionally, in the normal course of business, the Fund may enter into contracts with service providers that contain a variety of indemnification clauses. The Fund’s maximum exposure under these arrangements is dependent on future claims that may be made against the Fund and, therefore, cannot be estimated.
10. NEW ACCOUNTING PRONOUNCEMENT
In August 2018, FASB issued Accounting Standards Update (“ASU”) No. 2018-13, Fair Value Measurement (Topic 820) Disclosure Framework—Changes to the Disclosure Requirements for Fair Value Measurement. ASU 2018-13 updates the disclosure requirements on fair value measurements in Topic 820, Fair Value Measurements. The amendments are effective for fiscal years, and interim periods within those fiscal years, beginning after December 15, 2019. Management has adopted this guidance which did not have a material impact on the financial statements.
24 | Wells Fargo Specialized Technology Fund
Notes to financial statements (unaudited)
11. CORONAVIRUS (COVID-19) PANDEMIC
On March 11, 2020, the World Health Organization announced that it had made the assessment that coronavirus disease 2019 (“COVID-19”) is a pandemic. The impacts of COVID-19 are adversely affecting the entire global economy, individual companies and investment products, and the market in general. There is significant uncertainty around the extent and duration of business disruptions related to COVID-19 and the impacts may be short term or may last for an extended period of time. The risk of further spreading of COVID-19 has led to significant uncertainty and volatility in the financial markets.
Wells Fargo Specialized Technology Fund | 25
Other information (unaudited)
PROXY VOTING INFORMATION
A description of the policies and procedures used to determine how to vote proxies relating to portfolio securities is available, upon request, by calling 1-800-222-8222, visiting our website at wfam.com, or visiting the SEC website at sec.gov. Information regarding how the proxies related to portfolio securities were voted during the most recent 12-month period ended June 30 is available on the website at wfam.com or by visiting the SEC website at sec.gov.
QUARTERLY PORTFOLIO HOLDINGS INFORMATION
The Fund files its complete schedule of portfolio holdings with the SEC for the first and third quarters of each fiscal year as an exhibit to its reports on Form N-PORT. Shareholders may view the filed Form N-PORT by visiting the SEC website at sec.gov.
26 | Wells Fargo Specialized Technology Fund
Other information (unaudited)
BOARD OF TRUSTEES AND OFFICERS
Each of the Trustees and Officers1 listed in the table below acts in identical capacities for each fund in the Wells Fargo family of funds, which consists of 142 mutual funds comprising the Wells Fargo Funds Trust, Wells Fargo Variable Trust, Wells Fargo Master Trust and four closed-end funds (collectively the “Fund Complex”). This table should be read in conjunction with the Prospectus and the Statement of Additional Information2. The mailing address of each Trustee and Officer is 525 Market Street, 12th Floor, San Francisco, CA 94105. Each Trustee and Officer serves an indefinite term, however, each Trustee serves such term until reaching the mandatory retirement age established by the Trustees.
Independent Trustees
| | | | | | |
Name and
year of birth | | Position held and
length of service* | | Principal occupations during past five years or longer | | Current other
public company or
investment
company
directorships |
| | | |
| William R. Ebsworth (Born 1957) | | Trustee, since 2015 | | Retired. From 1984 to 2013, equities analyst, portfolio manager, research director and chief investment officer at Fidelity Management and Research Company in Boston, Tokyo, and Hong Kong, and retired in 2013 as Chief Investment Officer of Fidelity Strategic Advisers, Inc. where he led a team of investment professionals managing client assets. Prior thereto, Board member of Hong Kong Securities Clearing Co., Hong Kong Options Clearing Corp., the Thailand International Fund, Ltd., Fidelity Investments Life Insurance Company, and Empire Fidelity Investments Life Insurance Company. Audit Committee Chair and Investment Committee Chair of the Vincent Memorial Hospital Endowment (non-profit organization). Mr. Ebsworth is a CFA® charterholder. | | N/A |
| | | |
| Jane A. Freeman (Born 1953) | | Trustee, since 2015; Chair Liaison, since 2018 | | Retired. From 2012 to 2014 and 1999 to 2008, Chief Financial Officer of Scientific Learning Corporation. From 2008 to 2012, Ms. Freeman provided consulting services related to strategic business projects. Prior to 1999, Portfolio Manager at Rockefeller & Co. and Scudder, Stevens & Clark. Board member of the Harding Loevner Funds from 1996 to 2014, serving as both Lead Independent Director and chair of the Audit Committee. Board member of the Russell Exchange Traded Funds Trust from 2011 to 2012 and the chair of the Audit Committee. Ms. Freeman is also an inactive Chartered Financial Analyst. | | N/A |
| | | |
| Isaiah Harris, Jr. (Born 1952) | | Trustee, since 2009; Audit Committee Chairman, since 2019 | | Retired. Chairman of the Board of CIGNA Corporation since 2009, and Director since 2005. From 2003 to 2011, Director of Deluxe Corporation. Prior thereto, President and CEO of BellSouth Advertising and Publishing Corp. from 2005 to 2007, President and CEO of BellSouth Enterprises from 2004 to 2005 and President of BellSouth Consumer Services from 2000 to 2003. Emeritus member of the Iowa State University Foundation Board of Governors. Emeritus Member of the Advisory Board of Iowa State University School of Business. Advisory Board Member, Palm Harbor Academy (private school). Mr. Harris is a certified public accountant (inactive status). | | CIGNA Corporation |
| | | |
| Judith M. Johnson (Born 1949) | | Trustee, since 2008 | | Retired. Prior thereto, Chief Executive Officer and Chief Investment Officer of Minneapolis Employees Retirement Fund from 1996 to 2008. Ms. Johnson is an attorney, certified public accountant and a certified managerial accountant. | | N/A |
| | | |
| David F. Larcker (Born 1950) | | Trustee, since 2009 | | James Irvin Miller Professor of Accounting at the Graduate School of Business (Emeritus), Stanford University, Director of the Corporate Governance Research Initiative and Senior Faculty of The Rock Center for Corporate Governance since 2006. From 2005 to 2008, Professor of Accounting at the Graduate School of Business, Stanford University. Prior thereto, Ernst & Young Professor of Accounting at The Wharton School, University of Pennsylvania from 1985 to 2005. | | N/A |
Wells Fargo Specialized Technology Fund | 27
Other information (unaudited)
| | | | | | |
Name and
year of birth | | Position held and
length of service* | | Principal occupations during past five years or longer | | Current other
public company or
investment
company
directorships |
| | | |
| Olivia S. Mitchell (Born 1953) | | Trustee, since 2006; Nominating and Governance Committee Chair, since 2018 | | International Foundation of Employee Benefit Plans Professor, Wharton School of the University of Pennsylvania since 1993. Director of Wharton’s Pension Research Council and Boettner Center on Pensions & Retirement Research, and Research Associate at the National Bureau of Economic Research. Previously, Cornell University Professor from 1978 to 1993. | | N/A |
| | | |
| Timothy J. Penny (Born 1951) | | Trustee, since 1996; Chairman, since 2018 | | President and Chief Executive Officer of Southern Minnesota Initiative Foundation, a non-profit organization, since 2007. Member of the Board of Trustees of NorthStar Education Finance, Inc., a non-profit organization, since 2007. | | N/A |
| | | |
| James G. Polisson (Born 1959) | | Trustee, since 2018 | | Retired. Chief Marketing Officer, Source (ETF) UK Services, Ltd, from 2015 to 2017. From 2012 to 2015, Principal of The Polisson Group, LLC, a management consulting, corporate advisory and principal investing company. Chief Executive Officer and Managing Director at Russell Investments, Global Exchange Traded Funds from 2010 to 2012. Managing Director of Barclays Global Investors from 1998 to 2010 and Global Chief Marketing Officer for iShares and Barclays Global Investors from 2000 to 2010. Trustee of the San Francisco Mechanics’ Institute, a non-profit organization, from 2013 to 2015. Board member of the Russell Exchange Traded Fund Trust from 2011 to 2012. Director of Barclays Global Investors Holdings Deutschland GmbH from 2006 to 2009. Mr. Polisson is an attorney and has a retired status with the Massachusetts and District of Columbia Bar Associations. | | N/A |
| | | |
| Pamela Wheelock (Born 1959) | | Trustee, since January 2020; previously Trustee from January 2018 to July 2019 | | Board member of the Destination Medical Center Economic Development Agency, Rochester, Minnesota since 2019. Interim President of the McKnight Foundation from January to September 2020. Acting Commissioner, Minnesota Department of Human Services, July 2019 through September 2019. Human Services Manager (part-time), Minnesota Department of Human Services, October 2019 through December 2019. Chief Operating Officer, Twin Cities Habitat for Humanity from 2017 to 2019. Vice President of University Services, University of Minnesota from 2012 to 2016. Prior thereto, on the Board of Directors, Governance Committee and Finance Committee for the Minnesota Philanthropy Partners (Saint Paul Foundation) from 2012 to 2018, Interim Chief Executive Officer of Blue Cross Blue Shield of Minnesota from 2011 to 2012, Chairman of the Board from 2009 to 2012 and Board Director from 2003 to 2015. Vice President, Leadership and Community Engagement, Bush Foundation, Saint Paul, Minnesota (a private foundation) from 2009 to 2011. Executive Vice President and Chief Financial Officer, Minnesota Sports and Entertainment from 2004 to 2009 and Senior Vice President from 2002 to 2004. Executive Vice President of the Minnesota Wild Foundation from 2004 to 2008. Commissioner of Finance, State of Minnesota, from 1999 to 2002. Currently Board Chair of the Minnesota Wild Foundation since 2010. | | N/A |
| * | Length of service dates reflect the Trustee’s commencement of service with the Trust’s predecessor entities, where applicable. |
28 | Wells Fargo Specialized Technology Fund
Other information (unaudited)
Officers
| | | | |
Name and
year of birth | | Position held and
length of service | | Principal occupations during past five years or longer |
| | |
| Andrew Owen (Born 1960) | | President, since 2017 | | Executive Vice President of Wells Fargo & Company and Head of Affiliated Managers, Wells Fargo Asset Management, since 2014. In addition, Mr. Owen is currently President, Chief Executive Officer and Director of Wells Fargo Funds Management, LLC since 2017. Prior thereto, Executive Vice President responsible for marketing, investments and product development for Wells Fargo Funds Management, LLC, from 2009 to 2014. |
| | |
| Nancy Wiser1 (Born 1967) | | Treasurer, since 2012 | | Executive Vice President of Wells Fargo Funds Management, LLC since 2011. Chief Operating Officer and Chief Compliance Officer at LightBox Capital Management LLC, from 2008 to 2011. |
| | |
| Michelle Rhee (Born 1966) | | Chief Legal Officer, since 2019 | | Secretary of Wells Fargo Funds Management, LLC, Chief Legal Counsel of Wells Fargo Asset Management and Assistant General Counsel of Wells Fargo Bank, N.A. since 2018. Associate General Counsel and Managing Director of Bank of America Corporation from 2004 to 2018. |
| | |
| Catherine Kennedy (Born 1969) | | Secretary, since 2019 | | Vice President of Wells Fargo Funds Management, LLC and Senior Counsel of the Wells Fargo Legal Department since 2010. Vice President and Senior Counsel of Evergreen Investment Management Company, LLC from 1998 to 2010. |
| | |
| Michael H. Whitaker (Born 1967) | | Chief Compliance Officer, since 2016 | | Chief Compliance Officer of Wells Fargo Asset Management since 2016. Senior Vice President and Chief Compliance Officer for Fidelity Investments from 2007 to 2016. |
| | |
| Jeremy DePalma1 (Born 1974) | | Assistant Treasurer, since 2009 | | Senior Vice President of Wells Fargo Funds Management, LLC since 2009. Senior Vice President of Evergreen Investment Management Company, LLC from 2008 to 2010 and head of the Fund Reporting and Control Team within Fund Administration from 2005 to 2010. |
| 1 | Nancy Wiser acts as Treasurer of 65 funds in the Fund Complex. Jeremy DePalma acts as the Treasurer of 77 funds and Assistant Treasurer of 65 funds in the Fund Complex. |
| 2 | The Statement of Additional Information includes additional information about the Trustees and is available, without charge, upon request, by calling 1-800-222-8222 or by visiting the website at wfam.com. |
Wells Fargo Specialized Technology Fund | 29
Other information (unaudited)
BOARD CONSIDERATION OF INVESTMENT MANAGEMENT AND SUB-ADVISORY AGREEMENTS:
Wells Fargo Specialized Technology Fund
Under the Investment Company Act of 1940 (the “1940 Act”), the Board of Trustees (the “Board”) of Wells Fargo Funds Trust (the “Trust”) must determine annually whether to approve the continuation of the Trust’s investment management and sub-advisory agreements. In this regard, at a Board meeting held on May 26, 2020 and May 28, 2020 (together, the “Meeting”), the Board, all the members of which have no direct or indirect interest in the investment management and sub-advisory agreements and are not “interested persons” of the Trust, as defined in the 1940 Act (the “Independent Trustees”), reviewed and approved for Wells Fargo Specialized Technology Fund (the “Fund”): (i) an investment management agreement (the “Management Agreement”) with Wells Fargo Funds Management, LLC (“Funds Management”); and (ii) an investment sub-advisory agreement (the “Sub-Advisory Agreement”) with Allianz Global Investors U.S. LLC (the “Sub-Adviser”). The Management Agreement and the Sub-Advisory Agreement are collectively referred to as the “Advisory Agreements.”
At the Meeting, the Board considered the factors and reached the conclusions described below relating to the selection of Funds Management and the Sub-Adviser and the approval of the Advisory Agreements. Prior to the Meeting, including at a Board meeting held in April 2020, the Trustees conferred extensively among themselves and with representatives of Funds Management about these matters. Also, the Board has adopted a team-based approach, with each team consisting of a sub-set of Trustees, to assist the full Board in the discharge of its duties in reviewing investment performance and other matters throughout the year. The Independent Trustees were assisted in their evaluation of the Advisory Agreements by independent legal counsel, from whom they received separate legal advice and with whom they met separately.
In providing information to the Board, Funds Management and the Sub-Adviser were guided by a detailed set of requests for information submitted to them by independent legal counsel on behalf of the Independent Trustees at the start of the Board’s annual contract renewal process earlier in 2020. In considering and approving the Advisory Agreements, the Trustees considered the information they believed relevant, including but not limited to the information discussed below. The Board considered not only the specific information presented in connection with the Meeting, but also the knowledge gained over time through interaction with Funds Management and the Sub-Adviser about various topics. In this regard, the Board reviewed reports of Funds Management at each of its quarterly meetings, which included, among other things, portfolio reviews and investment performance reports. In addition, the Board and the teams mentioned above confer with portfolio managers at various times throughout the year. The Board did not identify any particular information or consideration that was all-important or controlling, and each individual Trustee may have attributed different weights to various factors.
After its deliberations, the Board unanimously approved the continuation of the Advisory Agreements for a one-year term and determined that the compensation payable to Funds Management and the Sub-Adviser under each of the Advisory Agreements was reasonable. The Board considered the approval of the Advisory Agreements for the Fund as part of its consideration of agreements for funds across the complex, but its approvals were made on a fund-by-fund basis. The following summarizes a number of important, but not necessarily all, factors considered by the Board in support of its approvals.
Nature, extent and quality of services
The Board received and considered various information regarding the nature, extent and quality of services provided to the Fund by Funds Management and the Sub-Adviser under the Advisory Agreements. This information included a description of the investment advisory services and Fund-level administrative services covered by the Management Agreement, as well as, among other things, a summary of the background and experience of senior management of Wells Fargo Asset Management (“WFAM”), of which Funds Management is a part, and a summary of investments made in the business of WFAM. The Board also received a description of Funds Management’s and the Sub-Adviser’s business continuity plans and of their approaches to data privacy and cybersecurity, and related testing. The Board also received and reviewed information about Funds Management’s role as administrator of the Fund’s liquidity risk management program, Funds Management’s approach to risk management, and Funds Management’s intermediary and vendor oversight program.
The Board also considered the qualifications, background, tenure and responsibilities of each of the portfolio managers primarily responsible for the day-to-day portfolio management of the Fund. The Board evaluated the ability of Funds Management and the Sub-Adviser to attract and retain qualified investment professionals, including research, advisory and supervisory personnel. The Board further considered the compliance programs and compliance records of Funds Management and the Sub-Adviser. In addition, the Board took into account the full range of services provided to the Fund by Funds Management and its affiliates.
30 | Wells Fargo Specialized Technology Fund
Other information (unaudited)
Fund investment performance and expenses
The Board considered the investment performance results for the Fund over various time periods ended December 31, 2019. The Board also considered more current results for various time periods ended March 31, 2020. The Board considered these results in comparison to the investment performance of funds in a universe that was determined by Broadridge Inc. (“Broadridge”) to be similar to the Fund (the “Universe”), and in comparison to the Fund’s benchmark index and to other comparative data. Broadridge is an independent provider of investment company data. The Board received a description of the methodology used by Broadridge to select the mutual funds in the performance Universe. The Board noted that the investment performance of the Fund (Class A) was higher than the average investment performance of the Universe for the three-, five- and ten-year periods ended December 31, 2019, and lower than the average investment performance of the Universe for the one-year period ended December 31, 2019. The Board also noted that the investment performance of the Fund (Administrator Class) was higher than the average performance of the Universe for the all periods ended March 31, 2020. The Board also noted that the investment performance of the Fund was lower than its benchmark index, the S&P North American Technology Index, for all periods ended December 31, 2019. The Board also noted that the investment performance of the Fund was lower than its benchmark index, the S&P North American Technology Index, for the one-, five- and ten-year periods ended March 31, 2020, and higher than its benchmark index for the three-year period ended March 31, 2020.
The Board received information concerning, and discussed factors contributing to, the underperformance of the Fund relative to the Universe and benchmark for the periods identified above. The Board took note of the explanations for the relative underperformance during these periods, including with respect to investment decisions, specific industry allocations and market factors that affected the Fund’s investment performance. The Board also took note of the Fund’s outperformance relative to the Universe over the longer time periods under review.
The Board also received and considered information regarding the Fund’s net operating expense ratios and their various components, including actual management fees, custodian and other non-management fees, and Rule 12b-1 and non-Rule 12b-1 shareholder service fees. The Board considered these ratios in comparison to the median ratios of funds in class-specific expense groups that were determined by Broadridge to be similar to the Fund (the “Groups”). The Board received a description of the methodology used by Broadridge to select the mutual funds in the expense Groups and an explanation of how funds comprising expense groups and their expense ratios may vary from year-to-year. Based on the Broadridge reports, the Board noted that the net operating expense ratios of the Fund were equal to or in range of the median net operating expense ratios of the expense Groups for each share class, except Class A. The Board noted that the Fund’s expense caps, including the expense caps for Class A, were lowered in 2017 and 2018, and that they would be maintained.
The Board took into account the Fund’s investment performance and expense information provided to it among the factors considered in deciding to re-approve the Advisory Agreements.
Investment management and sub-advisory fee rates
The Board reviewed and considered the contractual fee rates payable by the Fund to Funds Management under the Management Agreement, as well as the contractual fee rates payable by the Fund to Funds Management for class-level administrative services under a Class-Level Administration Agreement, which include, among other things, class-level transfer agency and sub-transfer agency costs (collectively, the “Management Rates”). The Board also reviewed and considered the contractual investment sub-advisory fee rates that are payable by Funds Management to the Sub-Adviser for investment sub-advisory services.
Among other information reviewed by the Board was a comparison of the Fund’s Management Rates with the average contractual investment management fee rates of funds in the expense Groups at a common asset level as well as transfer agency costs of the funds in the expense Groups. The Board noted that the Management Rates of the Fund were in range of the sum of these average rates for the Fund’s expense Groups for all share classes, except for Class A. The Board noted that the Fund’s expense caps, including the expense caps for Class A, were lowered in 2017 and 2018, and that they would be maintained. The Board also discussed and accepted Funds Management’s proposal to amend the Management Agreement to reduce the management fees paid by the Fund to Funds Management.
The Board also received and considered information about the portion of the total management fee that was retained by Funds Management after payment of the fee to the Sub-Adviser for sub-advisory services. The Board considered this amount in comparison to the median amount retained by advisers to funds in a sub-advised expense universe that was determined by Broadridge to be similar to the Fund. The Board noted the small size of the sub-advised expense universe. In assessing the reasonableness of this amount, the Board received and evaluated information about the nature and extent of responsibilities retained and risks assumed by Funds Management and not delegated to or assumed by the Sub-Adviser, and about Funds Management’s on-going oversight services. The Board also considered that the sub-advisory fees paid to the Sub-Adviser had been negotiated by Funds Management on an arm’s length basis, and it discussed and accepted Funds Management’s proposal to amend the Subadvisory Agreement to reduce the subadvisory fees paid by Funds Management to the Sub-Adviser.
Wells Fargo Specialized Technology Fund | 31
Other information (unaudited)
The Board also received and considered information about the nature and extent of services offered and fee rates charged by Funds Management and the Sub-Adviser to other types of clients with investment strategies similar to those of the Fund. In this regard, the Board received information about the significantly greater scope of services, and compliance, reporting and other legal burdens and risks of managing proprietary mutual funds compared with those associated with managing assets of other types of clients, including third-party sub-advised fund clients and non-mutual fund clients such as institutional separate accounts.
Based on its consideration of the factors and information it deemed relevant, including those described here, the Board determined that the compensation payable to Funds Management under the Management Agreement and to the Sub-Adviser under the Sub-Advisory Agreement was reasonable.
Profitability
The Board received and considered information concerning the profitability of Funds Management, as well as the profitability of both WFAM and Wells Fargo & Co. (“Wells Fargo”) from providing services to the fund family as a whole. Funds Management reported on the methodologies and estimates used in calculating profitability, including a description of the methodology used to allocate certain expenses. Among other things, the Board noted that the levels of profitability reported on a fund-by-fund basis varied widely, depending on factors such as the size, type and age of fund. The Board did not consider profitability with respect to the Sub-Adviser, as the sub-advisory fees paid to the Sub-Adviser had been negotiated by Funds Management on an arm’s-length basis.
Based on its review, the Board did not deem the profits reported by Funds Management, WFAM or Wells Fargo from services provided to the Fund to be at a level that would prevent it from approving the continuation of the Advisory Agreements.
Economies of scale
The Board received and considered information about the potential for Funds Management to experience economies of scale in the provision of management services to the Fund, the difficulties of calculating economies of scale at an individual fund level, and the extent to which potential scale benefits are shared with shareholders. The Board noted the existence of breakpoints in the Fund’s management fee structure, which operate generally to reduce the Fund’s expense ratios as the Fund grows in size, and the size of the Fund in relation to such breakpoints. The Board also discussed and accepted Funds Management’s proposal to amend the Management Agreement to reduce the management fees paid by the Fund to Funds Management at each breakpoint.
The Board considered that in addition to management fee breakpoints, Funds Management shares potential economies of scale from its management business in a variety of ways, including through fee waiver and expense reimbursement arrangements, services that benefit shareholders, competitive management fee rates set at the outset without regard to breakpoints, and investments in the business intended to enhance services available to shareholders.
The Board concluded that Funds Management’s arrangements with respect to the Fund, including contractual breakpoints, constituted a reasonable approach to sharing potential economies of scale with the Fund and its shareholders.
Other benefits to Funds Management and the Sub-Adviser
The Board received and considered information regarding potential “fall-out” or ancillary benefits received by Funds Management, the Sub-Adviser, and their affiliates as a result of their relationships with the Fund. Ancillary benefits could include, among others, benefits directly attributable to other relationships with the Fund and benefits potentially derived from an increase in Funds Management’s and the Sub-Adviser’s business as a result of their relationships with the Fund. The Board noted that various affiliates of Funds Management may receive distribution-related fees, shareholder servicing payments and sub-transfer agency fees in respect of shares sold or held through them and services provided.
The Board also reviewed information about soft dollar credits earned and utilized by the Sub-Adviser, fees earned by Funds Management and its affiliate from managing a private investment vehicle for the fund family’s securities lending collateral, and commissions earned by an affiliated broker from portfolio transactions.
Based on its consideration of the factors and information it deemed relevant, including those described here, the Board did not find that any ancillary benefits received by Funds Management, the Sub-Adviser, and their affiliates were unreasonable.
Conclusion
At the Meeting, after considering the above-described factors and based on its deliberations and its evaluation of the information described above, the Board unanimously approved the continuation of the Advisory Agreements for a one-year term and determined that the compensation payable to Funds Management and the Sub-Adviser under each of the Advisory Agreements was reasonable.
32 | Wells Fargo Specialized Technology Fund
Other information (unaudited)
LIQUIDITY RISK MANAGEMENT PROGRAM
In accordance with Rule 22e-4 under the Investment Company Act of 1940, as amended (the “Liquidity Rule”), Wells Fargo Funds Trust (the “Trust”) has adopted and implemented a liquidity risk management program (the “Program”) on behalf of each of its series, including the Fund, which is reasonably designed to assess and manage the Fund’s liquidity risk. “Liquidity risk” is defined as the risk that the Fund is unable to meet redemption requests without significantly diluting remaining investors’ interests in the Fund. The Trust’s Board of Trustees (the “Board”) previously approved the designation of Wells Fargo Funds Management, LLC (“Funds Management”), the Fund’s investment manager, as the administrator of the Program, and Funds Management has established a Liquidity Risk Management Council composed of personnel from multiple departments within Funds Management and its affiliates to assist Funds Management in the implementation and on-going administration of the Program.
The Program is comprised of various components designed to support the assessment and/or management of liquidity risk, including: (1) the periodic assessment (no less frequently than annually) of certain factors that influence the Fund’s liquidity risk; (2) the periodic classification (no less frequently than monthly) of the Fund’s investments into one of four liquidity categories that reflect an estimate of their liquidity under current market conditions; (3) a 15% limit on the acquisition of “illiquid investments” (as defined under the Liquidity Rule); (4) to the extent the Fund does not invest primarily in “highly liquid investments” (as defined under the Liquidity Rule), the determination of a minimum percentage of the Fund’s assets that generally will be invested in highly liquid investments (an “HLIM”); (5) if the Fund has established an HLIM, the periodic review (no less frequently than annually) of the HLIM and the adoption of policies and procedures for responding to a shortfall of the Fund’s “highly liquid investments” below its HLIM; and (6) periodic reporting to the Board.
At a meeting of the Board held on May 26 and 28, 2020, the Board received a written report (the “Report”) from Funds Management that addressed the operation of the Program and assessed its adequacy and effectiveness of implementation. The Report covered the initial period from December 1, 2018 through December 31, 2019 (the “Reporting Period”). No significant liquidity events impacting the Fund were noted in the Report. There were no material changes to the Program during the Reporting Period. The Report concluded that the Program is operating effectively to assess and manage the Fund’s liquidity risk, and that the Program has been and continues to be adequately and effectively implemented to monitor and, as applicable, respond to the Fund’s liquidity developments.
There can be no assurance that the Program will achieve its objectives under all circumstances in the future. Please refer to the Fund’s prospectus for more information regarding the Fund’s exposure to liquidity risk and other risks to which an investment in the Fund may be subject.
Wells Fargo Specialized Technology Fund | 33
Appendix I (unaudited)
Effective June 1, 2020, shareholders purchasing Fund shares through an Oppenheimer & Co. Inc. (“Oppenheimer”) platform or account are eligible only for the following load waivers (front-end sales charge waivers and contingent deferred or back-end, sales charge waivers) and discounts, which may differ from those disclosed in the Fund’s Prospectus or SAI.
|
| Front-end Sales Load Waivers on Class A Shares available at Oppenheimer |
|
| Employer-sponsored retirement, deferred compensation and employee benefit plans (including health savings accounts) and trusts used to fund those plans, provided that the shares are not held in a commission-based brokerage account and shares are held for the benefit of the plan. |
|
| Shares purchased by or through a 529 Plan. |
|
| Shares purchased through an Oppenheimer affiliated investment advisory program. |
|
| Shares purchased through reinvestment of capital gains distributions and dividend reinvestment when purchasing shares of the same fund (but not any other fund within the fund family). |
|
| Shares purchased from the proceeds of redemptions within the same fund family, provided (1) the repurchase occurs within 90 days following the redemption, (2) the redemption and purchase occur in the same account, and (3) redeemed shares were subject to a front-end or deferred sales load (known as Rights of Restatement). |
|
| A shareholder in the Fund’s Class C shares will have their shares exchanged at net asset value to Class A shares (or the appropriate share class) of the Fund if the shares are no longer subject to a CDSC and the exchange is in line with the policies and procedures of Oppenheimer. |
|
| Employees and registered representatives of Oppenheimer or its affiliates and their family members. |
|
| Directors or Trustees of the Fund, and employees of the Fund’s investment adviser or any of its affiliates, as described in the Prospectus. |
| CDSC Waivers on A and C Shares available at Oppenheimer |
|
| Death or disability of the shareholder. |
|
| Shares sold as part of a systematic withdrawal plan as described in the Prospectus. |
|
| Return of excess contributions from an IRA Account. |
|
| Shares sold as part of a required minimum distribution for IRA and retirement accounts due to the shareholder reaching the qualified age based on applicable IRS regulations as described in the Prospectus. |
|
| Shares sold to pay Oppenheimer fees but only if the transaction is initiated by Oppenheimer. |
|
| Shares acquired through a right of reinstatement. |
| Front-end load Discounts Available at Oppenheimer: Breakpoints, Rights of Accumulation & Letters of Intent |
|
| Breakpoints as described in the Prospectus. |
|
| Rights of Accumulation (ROA), which entitle shareholders to breakpoint discounts, will be automatically calculated based on the aggregated holding of fund family assets held by accounts within the purchaser’s household at Oppenheimer. Eligible fund family assets not held at Oppenheimer may be included in the ROA calculation only if the shareholder notifies his or her financial advisor about such assets. |
34 | Wells Fargo Specialized Technology Fund
Appendix II (unaudited)
Effective June 15, 2020, shareholders purchasing fund shares through a Robert W. Baird & Co. (“Baird”) platform or account will only be eligible for the following sales charge waivers (front-end sales charge waivers and CDSC waivers) and discounts, which may differ from those disclosed elsewhere in the Fund’s Prospectus or the SAI.
|
| Front-end Sales Load Waivers on Class A Shares available at Baird |
|
| Shares purchased through reinvestment of capital gains distributions and dividend reinvestment when purchasing share of the same fund. |
|
| Share purchase by employees and registers representatives of Baird or its affiliate and their family members as designated by Baird. |
|
| Shares purchase from the proceeds of redemptions within the same fund family, provided (1) the repurchase occurs within 90 days following the redemption, (2) the redemption and purchase occur in the same accounts, and (3) redeemed shares were subject to a front-end or deferred sales charge (known as rights of reinstatement). |
|
| A shareholder in the Funds Investor C Shares will have their share exchanged at net asset value to Investor A shares of the fund if the shares are no longer subject to CDSC and the exchange is in line with the policies and procedures of Baird. |
|
| Employer-sponsored retirement plans or charitable accounts in a transactional brokerage account at Baird, including 401(k) plans, 457 plans, employer-sponsored 403(b) plans, profit sharing and money purchase pension plans and defined benefit plans. For purposes of this provision, employer-sponsored retirement plans do not include SEP IRAs, Simple IRAs or SAR-SEPs. |
| CDSC Waivers on A and C Shares available at Baird |
|
| Shares sold due to death or disability of the shareholder. |
|
| Shares sold as part of a systematic withdrawal plan as described in the Fund’s Prospectus. |
|
| Shares bought due to returns of excess contributions from an IRA Account. |
|
| Shares sold as part of a required minimum distribution for IRA and retirement accounts due to the shareholder reaching age 72 as described in the Fund’s Prospectus. |
|
| Shares sold to pay Baird fees but only if the transaction is initiated by Baird. |
|
| Shares acquired through a right of reinstatement. |
| Front-end load Discounts Available at Baird: Breakpoint and/or Rights of Accumulation |
|
| Breakpoints as described in the Prospectus. |
|
| Rights of accumulations which entitles shareholders to breakpoint discounts will be automatically calculated based on the aggregated holding of fund family assets held by accounts within the purchaser’s household at Baird. Eligible fund family assets not held at Baird may be included in the rights of accumulations calculation only if the shareholder notifies his or her financial advisor about such assets. |
|
| Letters of Intent (LOI) allow for breakpoint discounts based on anticipated purchases within a fund family through Baird, over a 13-month period of time. |
Wells Fargo Specialized Technology Fund | 35
This page is intentionally left blank.

For more information
More information about Wells Fargo Funds is available free upon request. To obtain literature, please write, visit the Fund’s website, or call:
Wells Fargo Funds
P.O. Box 219967
Kansas City, MO 64121-9967
Website: wfam.com
Individual investors: 1-800-222-8222
Retail investment professionals: 1-888-877-9275
Institutional investment professionals: 1-866-765-0778

This report and the financial statements contained herein are submitted for the general information of the shareholders of the Fund. If this report is used for promotional purposes, distribution of the report must be accompanied or preceded by a current prospectus. Before investing, please consider the investment objectives, risks, charges, and expenses of the investment. For a current prospectus and, if available, a summary prospectus, containing this information, call 1-800-222-8222 or visit the Fund’s website at wfam.com. Read the prospectus carefully before you invest or send money.
Wells Fargo Asset Management (WFAM) is the trade name for certain investment advisory/management firms owned by Wells Fargo & Company. These firms include but are not limited to Wells Capital Management Incorporated and Wells Fargo Funds Management, LLC. Certain products managed by WFAM entities are distributed by Wells Fargo Funds Distributor, LLC (a broker-dealer and Member FINRA).
This material is for general informational and educational purposes only and is NOT intended to provide investment advice or a recommendation of any kind—including a recommendation for any specific investment, strategy, or plan.
INVESTMENT PRODUCTS: NOT FDIC INSURED ◾ NO BANK GUARANTEE ◾ MAY LOSE VALUE
© 2020 Wells Fargo & Company. All rights reserved.
PAR-1020-00764 11-20
SA317/SAR317 09-20
Semi-Annual Report
September 30, 2020
Wells Fargo
Fundamental Small Cap Growth Fund
Beginning on January 1, 2021, as permitted by new regulations adopted by the Securities and Exchange Commission, paper copies of the Wells Fargo Funds’ annual and semi-annual shareholder reports issued after this date will no longer be sent by mail, unless you specifically request paper copies of the reports. Instead, the reports will be made available on the Funds’ website, and you will be notified by mail each time a report is posted and provided with a website address to access the report.
If you already elected to receive shareholder reports electronically, you will not be affected by this change and you need not take any action. You may elect to receive shareholder reports and other communications from the Fund electronically at any time by contacting your financial intermediary (such as a broker-dealer or bank) or, if you are a direct investor, by calling 1-800-222-8222 or by enrolling at wellsfargo.com/advantagedelivery.
You may elect to receive all future reports in paper free of charge. If you invest through a financial intermediary, you can contact your financial intermediary to request that you continue to receive paper copies of your shareholder reports; if you invest directly with the Fund, you can call 1-800-222-8222. Your election to receive reports in paper will apply to all Wells Fargo Funds held in your account with your financial intermediary or, if you are a direct investor, to all Wells Fargo Funds that you hold.
|
|
|
Reduce clutter. Save trees. |
Sign up for electronic delivery of prospectuses and shareholder reports at wellsfargo.com/advantagedelivery |
The views expressed and any forward-looking statements are as of September 30, 2020, unless otherwise noted, and are those of the Fund’s portfolio managers and/or Wells Fargo Asset Management. Discussions of individual securities, or the markets generally, or any Wells Fargo Fund are not intended as individual recommendations. Future events or results may vary significantly from those expressed in any forward-looking statements. The views expressed are subject to change at any time in response to changing circumstances in the market. Wells Fargo Asset Management and the Fund disclaim any obligation to publicly update or revise any views expressed or forward-looking statements.
INVESTMENT PRODUCTS: NOT FDIC INSURED ◾ NO BANK GUARANTEE ◾ MAY LOSE VALUE
Wells Fargo Fundamental Small Cap Growth Fund | 1
Letter to shareholders (unaudited)

Andrew Owen
President
Wells Fargo Funds
“As the six-month period began in April, markets rebounded strongly from an earlier sharp sell-off, fueled by unprecedented government and central bank stimulus measures.”
Dear Shareholder:
We are pleased to offer you this semi-annual report for the Wells Fargo Fundamental Small Cap Growth Fund for the six-month period that ended September 30, 2020. Global stock markets experienced unprecedented volatility in response to drastic government measures to stop the spread of COVID-19 at the expense of short-term economic output. However, financial markets rebounded from April on to more than offset earlier losses as central banks bolstered capital markets and confidence. Stocks rallied broadly with U.S. equities leading the way while bonds had more modest returns for the six-month period.
For the period, U.S. stocks, based on the S&P 500 Index,1 returned 31.31% and international stocks, as measured by the MSCI ACWI ex USA Index (Net),2 gained 23.38%. The MSCI EM Index (Net)3 gained a robust 29.37%. Among bond investments, the Bloomberg Barclays U.S. Aggregate Bond Index4 added 3.53%, the Bloomberg Barclays Global Aggregate ex-USD Index5 returned 7.66%, the Bloomberg Barclays Municipal Bond Index6 had a 3.99% return, and the ICE BofA U.S. High Yield Index7 gained 14.76%.
Concerns about COVID-19 took over the market.
As the six-month period began in April, markets rebounded strongly from an earlier sharp sell-off, fueled by unprecedented government and central bank stimulus measures. The U.S. economy contracted by an annualized 5.0% pace in the first quarter, with 30 million new unemployment insurance claims in six weeks. In the eurozone, first-quarter real gross domestic product (GDP) shrank 3.8%, with the composite April Flash Purchasing Managers’ Index (PMI), a monthly survey of purchasing managers, falling to an all-time low of 13.5. The European Central Bank expanded its quantitative easing to include the purchase of additional government bonds of countries with the greatest virus-related need, including Italy and Spain. China’s first-quarter GDP fell by 6.8% year over year. However, retail sales, production, and investment showed signs of recovery. Extreme oil-price volatility continued as global supply far exceeded demand.
The equity market rebound continued in May, with widespread strong monthly gains. Investors regained confidence on reports of early signs of success in human trials of a COVID-19 vaccine. Growth stocks continued to outperform value stocks while returns on global government bonds were generally flat. In the U.S., a gap grew between the stock market rebound and devastating economic data points, including an April unemployment rate of 14.7%, the highest level since World War II. PMIs continued to reflect weakening activity in May in both the manufacturing and services sectors. U.S.
| 1 | The S&P 500 Index consists of 500 stocks chosen for market size, liquidity, and industry group representation. It is a market-value-weighted index with each stock’s weight in the index proportionate to its market value. You cannot invest directly in an index. |
| 2 | The Morgan Stanley Capital International (MSCI) All Country World Index (ACWI) ex USA Index (Net) is a free-float-adjusted market-capitalization-weighted index that is designed to measure the equity market performance of developed and emerging markets, excluding the United States. Source: MSCI. MSCI makes no express or implied warranties or representations and shall have no liability whatsoever with respect to any MSCI data contained herein. The MSCI data may not be further redistributed or used as a basis for other indices or any securities or financial products. This report is not approved, reviewed, or produced by MSCI. You cannot invest directly in an index. |
| 3 | The MSCI Emerging Markets (EM) Index (Net) is a free-float-adjusted market-capitalization-weighted index that is designed to measure equity market performance of emerging markets. You cannot invest directly in an index. |
| 4 | The Bloomberg Barclays U.S. Aggregate Bond Index is a broad-based benchmark that measures the investment-grade, U.S. dollar-denominated, fixed-rate taxable bond market, including Treasuries, government-related and corporate securities, mortgage-backed securities (agency fixed-rate and hybrid adjustable-rate mortgage pass-throughs), asset-backed securities, and commercial mortgage-backed securities. You cannot invest directly in an index. |
| 5 | The Bloomberg Barclays Global Aggregate ex-USD Index is an unmanaged index that provides a broad-based measure of the global investment-grade fixed-income markets excluding the U.S. dollar-denominated debt market. You cannot invest directly in an index. |
| 6 | The Bloomberg Barclays Municipal Bond Index is an unmanaged index composed of long-term tax-exempt bonds with a minimum credit rating of Baa. You cannot invest directly in an index. |
| 7 | The ICE BofA U.S. High Yield Index is a market-capitalization-weighted index of domestic and Yankee high-yield bonds. The index tracks the performance of high-yield securities traded in the U.S. bond market. You cannot invest directly in an index. Copyright 2020. ICE Data Indices, LLC. All rights reserved. |
2 | Wells Fargo Fundamental Small Cap Growth Fund
Letter to shareholders (unaudited)
corporate earnings reports indicated a 14% year-over-year contraction in earnings from the first quarter of 2019. However, high demand for technology, driven by remote activity, helped maintain robust information technology sector earnings, which helped drive leading technology stocks higher.
Financial markets posted widely positive returns in June despite ongoing economic weakness and high levels of uncertainty on the containment of COVID-19 and the timing of an effective vaccine. There were hopeful signs as economies reopened, with U.S. and U.K. retail sales rebounding sharply in May. However, year over year, sales remained depressed. Vitally important to market sentiment was the ongoing commitment by central banks globally to do all they could to provide economic support through liquidity and low borrowing costs. U.S. economic activity was aided by one-time $1,200 stimulus checks and $600 bonus weekly unemployment benefits that expired at the end of July. However, unemployment remained historically high but eased from 14.7% in April to 11.1% in June. At month-end, numerous states reported increases in COVID-19 cases. China’s economic recovery picked up momentum in June, though it remained far from a full recovery.
July was a broadly positive month for both global equities and fixed income. However, economic data and a resurgence of COVID-19 cases pointed to the vulnerability of the global economy and the ongoing imperative to regain control of the pandemic. Second-quarter GDP shrank from the previous quarter by 9.5% and 12.1% in the U.S. and the eurozone, respectively. In contrast, China reported a 3.2% year-over-year expansion in its second-quarter GDP. U.S. unemployment remained high despite adding 1.8 million jobs in July, with a double-digit jobless rate persisting. However, manufacturing activity grew in both the U.S. and the eurozone. In Asia, while China’s manufacturing sector continued to expand, activity in Japan and South Korea contracted. In July, a rising concern was the rapid and broad reemergence of COVID-19 infections.
The stock market continued to rally in August despite concerns over rising numbers of COVID-19 cases in the United States and several European countries, including France and Spain, as well as the expiration of the $600 weekly bonus unemployment benefit at the end of July. U.S. stocks had strong monthly gains, led by the FAANG stocks—Facebook, Apple, Amazon, Netflix, and Google (Alphabet)—which dominate these indices and continued to rally. U.S. stocks generally surpassed other broadly positive global equity performance while fixed-income market monthly returns were broadly flat. Generally stronger-than-expected second-quarter earnings boosted investor sentiment along with the U.S. Federal Reserve’s announcement of a policy shift that will likely lead to longer-term low interest rates and supportive monetary policy. The U.S. flash PMIs for both manufacturing and services beat expectations while U.S. housing market indicators were strong. In Europe, retail sales expanded and consumer confidence remained steady. Overall, developed markets performed better than emerging market equities for the month of August as people took comfort in better-known equities in perceived safer markets.
Stocks grew more volatile in September on mixed economic data. U.S. PMIs showed solid growth in economic activity in both manufacturing and services. However, six months after the bottom fell out of the labor market in the early spring, only half of the 22 million jobs lost had returned. The U.S. unemployment rate fell to 7.9% in September, the fifth straight month of improvement but far higher than the 3.5% pre-COVID-19 rate. Only 661,000 jobs were added for the month, down from 1.5 million in August. Meanwhile, a reported 2.3 million people have given up looking for work. With U.S. Congress failing to pass further fiscal relief and uncertainties surrounding a possible vaccine, doubts crept back into the financial markets. In the U.K., a lack of progress in Brexit talks with the European Union weighed on markets. China’s economy picked up steam, however, with growth fueled by increased global demand and China’s service sector had its strongest PMI reading in seven years.
“The stock market continued to rally in August despite concerns over rising numbers of COVID-19 cases in the United States and several European countries, including France and Spain, as well as the expiration of the $600 weekly bonus unemployment benefit at the end of July.”
Wells Fargo Fundamental Small Cap Growth Fund | 3
Letter to shareholders (unaudited)
|
|
|
For further information about your Fund, contact your investment professional, visit our website at wfam.com, or call us directly at 1-800-222-8222. |
Don’t let short-term uncertainty derail long-term investment goals.
Periods of investment uncertainty can present challenges, but experience has taught us that maintaining long-term investment goals can be an effective way to plan for the future. To help you create a sound strategy based on your personal goals and risk tolerance, Wells Fargo Funds offers more than 100 mutual funds spanning a wide range of asset classes and investment styles. Although diversification cannot guarantee an investment profit or prevent losses, we believe it can be an effective way to manage investment risk and potentially smooth out overall portfolio performance. We encourage investors to know their investments and to understand that appropriate levels of risk-taking may unlock opportunities.
Thank you for choosing to invest with Wells Fargo Funds. We appreciate your confidence in us and remain committed to helping you meet your financial needs.
Sincerely,

Andrew Owen
President
Wells Fargo Funds
Notice to Shareholders
At a meeting held on August 10-12, 2020, the Board of Trustees of the Fund approved a change to the Fund’s automatic conversion feature for Class C shares in order to shorten the required holding period from 10 to 8 years. As a result, on a monthly basis beginning November 5, 2020, Class C shares will convert automatically into Class A shares 8 years after the initial date of purchase or, if you acquired your Class C shares through an exchange or conversion from another share class, 8 years after the date you acquired your Class C shares. When Class C shares that you acquired through a purchase or exchange convert, any other Class C shares that you purchased with reinvested dividends and distributions also will convert into Class A shares on a pro rata basis.
Please note that a shorter holding period may apply depending on your intermediary. Please see “Appendix A—Sales Charge Reductions and Waivers for Certain Intermediaries” in the Fund’s prospectus for further information.
4 | Wells Fargo Fundamental Small Cap Growth Fund
This page is intentionally left blank.
Performance highlights (unaudited)
Investment objective
The Fund seeks long-term capital appreciation.
Manager
Wells Fargo Funds Management, LLC
Subadviser
Wells Capital Management Incorporated
Portfolio managers
Michael T. Smith, CFA®‡
Christopher J. Warner, CFA®‡
Average annual total returns (%) as of September 30, 2020
| | | | | | | | | | | | | | | | | | | | | | | | | | | | | | | | | | | | |
| | | | |
| | | | | | Including sales charge | | | Excluding sales charge | | | Expense ratios1 (%) | |
| | | | | | | | | |
| | | Inception date | | | 1 year | | | 5 year | | | 10 year | | | 1 year | | | 5 year | | | 10 year | | | Gross | | | Net2 | |
| | | | | | | | | | |
| Class A (EGWAX) | | | 6-5-1995 | | | | 32.82 | | | | 16.45 | | | | 13.74 | | | | 40.92 | | | | 17.85 | | | | 14.42 | | | | 1.53 | | | | 1.24 | |
| | | | | | | | | | |
| Class C (EGWCX) | | | 7-30-2010 | | | | 38.95 | | | | 16.99 | | | | 13.58 | | | | 39.95 | | | | 16.99 | | | | 13.58 | | | | 2.28 | | | | 1.99 | |
| | | | | | | | | | |
| Class R6 (EGWRX)3 | | | 5-29-2020 | | | | – | | | | – | | | | – | | | | 41.42 | | | | 18.25 | | | | 14.81 | | | | 1.10 | | | | 0.81 | |
| | | | | | | | | | |
| Administrator Class (EGWDX) | | | 7-30-2010 | | | | – | | | | – | | | | – | | | | 42.73 | | | | 18.29 | | | | 14.72 | | | | 1.45 | | | | 1.16 | |
| | | | | | | | | | |
| Institutional Class (EGRYX) | | | 11-19-1997 | | | | – | | | | – | | | | – | | | | 41.35 | | | | 18.24 | | | | 14.81 | | | | 1.20 | | | | 0.91 | |
| | | | | | | | | | |
| Russell 2000® Growth Index4 | | | – | | | | – | | | | – | | | | – | | | | 15.71 | | | | 11.42 | | | | 12.34 | | | | – | | | | – | |
Figures quoted represent past performance, which is no guarantee of future results, and do not reflect taxes that a shareholder may pay on an investment in a fund. Investment return and principal value of an investment will fluctuate so that an investor’s shares, when redeemed, may be worth more or less than their original cost. Performance shown without sales charges would be lower if sales charges were reflected. Current performance may be lower or higher than the performance data quoted, which assumes the reinvestment of dividends and capital gains. Current month-end performance is available on the Fund’s website, wfam.com.
Please keep in mind that high double-digit returns were primarily achieved during favorable market conditions. You should not expect that such favorable returns can be consistently achieved. A fund’s performance, especially for short time periods, should not be the sole factor in making your investment decision.
Index returns do not include transaction costs associated with buying and selling securities, any mutual fund fees or expenses, or any taxes. It is not possible to invest directly in an index.
For Class A shares, the maximum front-end sales charge is 5.75%. For Class C shares, the maximum contingent deferred sales charge is 1.00%. Performance including a contingent deferred sales charge assumes the sales charge for the corresponding time period. Class R6, Administrator Class, and Institutional Class shares are sold without a front-end sales charge or contingent deferred sales charge.
Stock values fluctuate in response to the activities of individual companies and general market and economic conditions. Smaller-company stocks tend to be more volatile and less liquid than those of larger companies. Consult the Fund’s prospectus for additional information on these and other risks.
Please see footnotes on page 6.
6 | Wells Fargo Fundamental Small Cap Growth Fund
Performance highlights (unaudited)
| | | | |
|
| Ten largest holdings (%) as of September 30, 20208 | |
| | |
iRhythm Technologies Incorporated | | | 3.05 | |
| | |
Casella Waste Systems Incorporated Class A | | | 2.34 | |
| | |
Five9 Incorporated | | | 2.19 | |
| | |
SiteOne Landscape Supply Incorporated | | | 2.01 | |
| | |
QTS Realty Trust Incorporated Class A | | | 1.96 | |
| | |
Advanced Drainage Systems Incorporated | | | 1.75 | |
| | |
Purple Innovation Incorporated | | | 1.75 | |
| | |
Natera Incorporated | | | 1.74 | |
| | |
Tetra Tech Incorporated | | | 1.61 | |
| | |
Envestnet Incorporated | | | 1.60 | |
|
|
| Sector allocation as of September 30, 20209 |
|
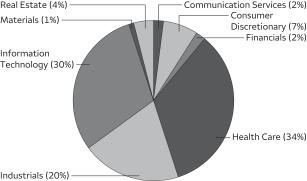 |
| ‡ | CFA® and Chartered Financial Analyst® are trademarks owned by CFA Institute. |
| 1 | Reflects the expense ratios as stated in the most recent prospectuses, which include the impact of 0.01% in acquired fund fees and expenses. The expense ratios shown are subject to change and may differ from the annualized expense ratios shown in the financial highlights of this report, which do not include acquired fund fees and expenses. |
| 2 | The manager has contractually committed through July 31, 2021, to waive fees and/or reimburse expenses to the extent necessary to cap total annual fund operating expenses after fee waivers at 1.23% for Class A, 1.98% for Class C, 0.80% for Class R6, 1.15% for Administrator Class, and 0.90% for Institutional Class. Brokerage commissions, stamp duty fees, interest, taxes, acquired fund fees and expenses (if any), and extraordinary expenses are excluded from the expense caps. Prior to or after the commitment expiration date, the caps may be increased or the commitment to maintain the caps may be terminated only with the approval of the Board of Trustees. Without these caps, the Fund’s returns would have been lower. The expense ratio paid by an investor is the net expense ratio (the total annual fund operating expenses after fee waivers) as stated in the prospectuses. |
| 3 | Historical performance shown for the Class R6 shares prior to their inception reflects the performance of the Institutional Class shares and includes the higher expenses applicable to the Institutional Class shares. If these expenses had not been included, returns for the Class R6 shares would be higher. |
| 4 | The Russell 2000® Growth Index measures the performance of those Russell 2000 companies with higher price/book ratios and higher forecasted growth values. You cannot invest directly in an index. |
| 5 | The ten largest holdings, excluding cash, cash equivalents and any money market funds, are calculated based on the value of the investments divided by total net assets of the Fund. Holdings are subject to change and may have changed since the date specified. |
| 6 | Amounts are calculated based on the total long-term investments of the Fund. These amounts are subject to change and may have changed since the date specified. |
Wells Fargo Fundamental Small Cap Growth Fund | 7
Fund expenses (unaudited)
As a shareholder of the Fund, you incur two types of costs: (1) transaction costs, including sales charges (loads) on purchase payments and contingent deferred sales charges (if any) on redemptions and (2) ongoing costs, including management fees, distribution (12b-1) and/or shareholder servicing fees, and other Fund expenses. This example is intended to help you understand your ongoing costs (in dollars) of investing in the Fund and to compare these costs with the ongoing costs of investing in other mutual funds.
The example is based on an investment of $1,000 invested at the beginning of the six-month period and held for the entire period from April 1, 2020 to September 30, 2020.
Actual expenses
The “Actual” line of the table below provides information about actual account values and actual expenses. You may use the information in this line, together with the amount you invested, to estimate the expenses that you paid over the period. Simply divide your account value by $1,000 (for example, an $8,600 account value divided by $1,000 = 8.6), then multiply the result by the number in the “Actual” line under the heading entitled “Expenses paid during period” for your applicable class of shares to estimate the expenses you paid on your account during this period.
Hypothetical example for comparison purposes
The “Hypothetical” line of the table below provides information about hypothetical account values and hypothetical expenses based on the Fund’s actual expense ratio and an assumed rate of return of 5% per year before expenses, which is not the Fund’s actual return. The hypothetical account values and expenses may not be used to estimate the actual ending account balance or expenses you paid for the period. You may use this information to compare the ongoing costs of investing in the Fund and other funds. To do so, compare this 5% hypothetical example with the 5% hypothetical examples that appear in the shareholder reports of the other funds.
Please note that the expenses shown in the table are meant to highlight your ongoing costs only and do not reflect any transactional costs, such as sales charges (loads) and contingent deferred sales charges. Therefore, the “Hypothetical” line of the table is useful in comparing ongoing costs only and will not help you determine the relative total costs of owning different funds. In addition, if these transactional costs were included, your costs would have been higher.
| | | | | | | | | | | | | | | | |
| | | Beginning
account value
4-1-2020 | | | Ending
account value
9-30-2020 | | | Expenses
paid during
the period1 | | | Annualized net
expense ratio | |
| | | | | |
Class A | | | | | | | | | | | | | | | | |
| | | | |
Actual | | $ | 1,000.00 | | | $ | 1,611.82 | | | $ | 8.05 | | | | 1.23 | % |
| | | | |
Hypothetical (5% return before expenses) | | $ | 1,000.00 | | | $ | 1,018.90 | | | $ | 6.23 | | | | 1.23 | % |
| | | | | |
Class C | | | | | | | | | | | | | | | | |
| | | | |
Actual | | $ | 1,000.00 | | | $ | 1,608.09 | | | $ | 12.95 | | | | 1.98 | % |
| | | | |
Hypothetical (5% return before expenses) | | $ | 1,000.00 | | | $ | 1,015.14 | | | $ | 10.00 | | | | 1.98 | % |
| | | | | |
Class R6 | | | | | | | | | | | | | | | | |
| | | | |
Actual | | $ | 1,000.00 | | | $ | 1,616.13 | | | $ | 3.47 | | | | 0.80 | % |
| | | | |
Hypothetical (5% return before expenses) | | $ | 1,000.00 | | | | 1,013.92 | | | $ | 2.67 | | | | 0.80 | % |
| | | | | |
Administrator Class | | | | | | | | | | | | | | | | |
| | | | |
Actual | | $ | 1,000.00 | | | $ | 1,632.07 | | | $ | 7.59 | | | | 1.15 | % |
| | | | |
Hypothetical (5% return before expenses) | | $ | 1,000.00 | | | $ | 1,019.30 | | | $ | 5.82 | | | | 1.15 | % |
| | | | | |
Institutional Class | | | | | | | | | | | | | | | | |
| | | | |
Actual | | $ | 1,000.00 | | | $ | 1,615.38 | | | $ | 5.90 | | | | 0.90 | % |
| | | | |
Hypothetical (5% return before expenses) | | $ | 1,000.00 | | | $ | 1,020.56 | | | $ | 4.56 | | | | 0.90 | % |
| 1 | Expenses paid is equal to the annualized net expense ratio of each class multiplied by the average account value over the period, multiplied by the number of days in the most recent fiscal half-year divided by the number of days in the fiscal year (to reflect the one-half-year period). |
8 | Wells Fargo Fundamental Small Cap Growth Fund
Portfolio of investments—September 30, 2020 (unaudited)
| | | | | | | | | | | | | | | | |
| | | | | | | | | Shares | | | Value | |
| Common Stocks: 99.15% | | | | | | | | | | | | | | | | |
| | | | |
Communication Services: 2.13% | | | | | | | | | | | | | | | | |
| | | | |
| Entertainment: 1.23% | | | | | | | | | | | | |
CD Projekt SA † | | | | | | | | | | | 13,285 | | | $ | 1,468,364 | |
| | | | | | | | | | | | | | | | |
|
| Media: 0.90% | |
Cardlytics Incorporated †« | | | | | | | | | | | 15,225 | | | | 1,074,428 | |
| | | | | | | | | | | | | | | | |
|
Consumer Discretionary: 7.04% | |
|
| Auto Components: 0.58% | |
Stoneridge Incorporated † | | | | | | | | | | | 37,372 | | | | 686,524 | |
| | | | | | | | | | | | | | | | |
|
| Diversified Consumer Services: 1.38% | |
Chegg Incorporated † | | | | | | | | | | | 23,057 | | | | 1,647,192 | |
| | | | | | | | | | | | | | | | |
|
| Hotels, Restaurants & Leisure: 0.62% | |
GAN Limited † | | | | | | | | | | | 43,998 | | | | 743,566 | |
| | | | | | | | | | | | | | | | |
|
| Household Durables: 1.75% | |
Purple Innovation Incorporated † | | | | | | | | | | | 83,908 | | | | 2,085,953 | |
| | | | | | | | | | | | | | | | |
|
| Internet & Direct Marketing Retail: 1.18% | |
Etsy Incorporated † | | | | | | | | | | | 11,627 | | | | 1,414,192 | |
| | | | | | | | | | | | | | | | |
|
| Leisure Products: 1.53% | |
Games Workshop Group plc | | | | | | | | | | | 13,948 | | | | 1,829,990 | |
| | | | | | | | | | | | | | | | |
|
Financials: 2.27% | |
|
| Consumer Finance: 0.82% | |
LendingTree Incorporated † | | | | | | | | | | | 3,182 | | | | 976,524 | |
| | | | | | | | | | | | | | | | |
|
| Insurance: 1.45% | |
Goosehead Insurance Incorporated Class A | | | | | | | | | | | 19,969 | | | | 1,729,116 | |
| | | | | | | | | | | | | | | | |
|
Health Care: 33.15% | |
|
| Biotechnology: 13.52% | |
Black Diamond Therapeutics Incorporated †« | | | | | | | | | | | 14,239 | | | | 430,445 | |
Bluebird Bio Incorporated † | | | | | | | | | | | 7,951 | | | | 428,956 | |
CareDx Incorporated † | | | | | | | | | | | 39,611 | | | | 1,502,841 | |
Chemocentryx Incorporated † | | | | | | | | | | | 13,976 | | | | 765,885 | |
Coherus Biosciences Incorporated † | | | | | | | | | | | 40,148 | | | | 736,314 | |
CRISPR Therapeutics AG † | | | | | | | | | | | 6,730 | | | | 562,897 | |
Deciphera Pharmaceuticals Incorporated † | | | | | | | | | | | 12,206 | | | | 626,168 | |
Halozyme Therapeutics Incorporated † | | | | | | | | | | | 38,338 | | | | 1,007,523 | |
Mirati Therapeutics Incorporated † | | | | | | | | | | | 6,440 | | | | 1,069,362 | |
Natera Incorporated † | | | | | | | | | | | 28,786 | | | | 2,079,501 | |
Nurix Therapeutics Incorporated † | | | | | | | | | | | 24,815 | | | | 866,292 | |
ORIC Pharmaceuticals Incorporated † | | | | | | | | | | | 10,893 | | | | 272,434 | |
Relay Therapeutics Incorporated †« | | | | | | | | | | | 7,673 | | | | 326,793 | |
Turning Point Therapeutics Incorporated † | | | | | | | | | | | 11,489 | | | | 1,003,679 | |
Twist Bioscience Corporation † | | | | | | | | | | | 20,170 | | | | 1,532,315 | |
Veracyte Incorporated † | | | | | | | | | | | 40,816 | | | | 1,326,112 | |
Zai Lab Limited ADR † | | | | | | | | | | | 12,184 | | | | 1,013,343 | |
Zymeworks Incorporated † | | | | | | | | | | | 12,509 | | | | 582,669 | |
| | | | |
| | | | | | | | | | | | | | | 16,133,529 | |
| | | | | | | | | | | | | | | | |
The accompanying notes are an integral part of these financial statements.
Wells Fargo Fundamental Small Cap Growth Fund | 9
Portfolio of investments—September 30, 2020 (unaudited)
| | | | | | | | | | | | | | | | |
| | | | | | | | | Shares | | | Value | |
| Health Care Equipment & Supplies: 11.91% | | | | | | | | | | | | |
Axonics Modulation Technologies Incorporated † | | | | | | | | | | | 22,702 | | | $ | 1,158,710 | |
BioLife Solutions Incorporated † | | | | | | | | | | | 33,704 | | | | 975,394 | |
Haemonetics Corporation † | | | | | | | | | | | 15,068 | | | | 1,314,683 | |
Inari Medical Incorporated † | | | | | | | | | | | 26,410 | | | | 1,822,818 | |
iRhythm Technologies Incorporated † | | | | | | | | | | | 15,274 | | | | 3,636,892 | |
Novocure Limited † | | | | | | | | | | | 8,545 | | | | 951,144 | |
Orthopediatrics Corporation † | | | | | | | | | | | 25,704 | | | | 1,180,328 | |
Quidel Corporation † | | | | | | | | | | | 6,239 | | | | 1,368,712 | |
Shockwave Medical Incorporated † | | | | | | | | | | | 23,909 | | | | 1,812,302 | |
| | | | |
| | | | | | | | | | | | | | | 14,220,983 | |
| | | | | | | | | | | | | | | | |
| | | | |
| Health Care Providers & Services: 3.16% | | | | | | | | | | | | |
Amedisys Incorporated † | | | | | | | | | | | 7,475 | | | | 1,767,314 | |
HealthEquity Incorporated † | | | | | | | | | | | 23,528 | | | | 1,208,633 | |
Progyny Incorporated † | | | | | | | | | | | 27,114 | | | | 797,965 | |
| | | | |
| | | | | | | | | | | | | | | 3,773,912 | |
| | | | | | | | | | | | | | | | |
| | | | |
| Health Care Technology: 3.61% | | | | | | | | | | | | |
Inspire Medical Systems Incorporated † | | | | | | | | | | | 13,154 | | | | 1,697,524 | |
Phreesia Incorporated † | | | | | | | | | | | 31,659 | | | | 1,017,204 | |
Simulations Plus Incorporated | | | | | | | | | | | 21,223 | | | | 1,599,365 | |
| | | | |
| | | | | | | | | �� | | | | | | 4,314,093 | |
| | | | | | | | | | | | | | | | |
|
| Life Sciences Tools & Services: 0.95% | |
Berkeley Lights Incorporated † | | | | | | | | | | | 14,774 | | | | 1,128,143 | |
| | | | | | | | | | | | | | | | |
|
Industrials: 19.61% | |
|
| Aerospace & Defense: 1.99% | |
Kratos Defense & Security Solutions Incorporated † | | | | | | | | | | | 39,664 | | | | 764,722 | |
Mercury Systems Incorporated † | | | | | | | | | | | 20,736 | | | | 1,606,211 | |
| | | | |
| | | | | | | | | | | | | | | 2,370,933 | |
| | | | | | | | | | | | | | | | |
|
| Air Freight & Logistics: 1.31% | |
Cargojet Incorporated | | | | | | | | | | | 10,887 | | | | 1,559,280 | |
| | | | | | | | | | | | | | | | |
|
| Building Products: 2.98% | |
Advanced Drainage Systems Incorporated | | | | | | | | | | | 33,426 | | | | 2,087,119 | |
Trex Company Incorporated † | | | | | | | | | | | 20,520 | | | | 1,469,232 | |
| | | | |
| | | | | | | | | | | | | | | 3,556,351 | |
| | | | | | | | | | | | | | | | |
| | | | |
| Commercial Services & Supplies: 6.50% | | | | | | | | | | | | |
Casella Waste Systems Incorporated Class A † | | | | | | | | | | | 49,998 | | | | 2,792,388 | |
IAA Incorporated † | | | | | | | | | | | 27,320 | | | | 1,422,552 | |
MSA Safety Incorporated | | | | | | | | | | | 12,086 | | | | 1,621,579 | |
Tetra Tech Incorporated | | | | | | | | | | | 20,184 | | | | 1,927,572 | |
| | | | |
| | | | | | | | | | | | | | | 7,764,091 | |
| | | | | | | | | | | | | | | | |
|
| Construction & Engineering: 1.12% | |
Construction Partners Incorporated Class A † | | | | | | | | | | | 73,426 | | | | 1,336,353 | |
| | | | | | | | | | | | | | | | |
|
| Electrical Equipment: 0.81% | |
Allied Motion Technologies Incorporated | | | | | | | | | | | 23,488 | | | | 969,585 | |
| | | | | | | | | | | | | | | | |
|
| Professional Services: 1.56% | |
Clarivate plc † | | | | | | | | | | | 60,302 | | | | 1,868,759 | |
| | | | | | | | | | | | | | | | |
The accompanying notes are an integral part of these financial statements.
10 | Wells Fargo Fundamental Small Cap Growth Fund
Portfolio of investments—September 30, 2020 (unaudited)
| | | | | | | | | | | | | | | | |
| | | | | | | | | Shares | | | Value | |
| Road & Rail: 1.33% | |
Saia Incorporated † | | | | | | | | | | | 12,559 | | | $ | 1,584,192 | |
| | | | | | | | | | | | | | | | |
|
| Trading Companies & Distributors: 2.01% | |
SiteOne Landscape Supply Incorporated † | | | | | | | | | | | 19,661 | | | | 2,397,659 | |
| | | | | | | | | | | | | | | | |
|
Information Technology: 29.78% | |
|
| Electronic Equipment, Instruments & Components: 2.43% | |
Littelfuse Incorporated | | | | | | | | | | | 5,980 | | | | 1,060,493 | |
Novanta Incorporated † | | | | | | | | | | | 17,538 | | | | 1,847,453 | |
| | | | |
| | | | | | | | | | | | | | | 2,907,946 | |
| | | | | | | | | | | | | | | | |
|
| IT Services: 8.29% | |
EPAM Systems Incorporated † | | | | | | | | | | | 5,394 | | | | 1,743,772 | |
Euronet Worldwide Incorporated † | | | | | | | | | | | 8,903 | | | | 811,063 | |
Keywords Studios plc | | | | | | | | | | | 62,628 | | | | 1,758,469 | |
MongoDB Incorporated † | | | | | | | | | | | 5,678 | | | | 1,314,514 | |
Shift4 Payments Incorporated Class A † | | | | | | | | | | | 29,115 | | | | 1,408,001 | |
WEX Incorporated † | | | | | | | | | | | 9,257 | | | | 1,286,445 | |
WNS Holdings Limited ADR † | | | | | | | | | | | 24,596 | | | | 1,573,160 | |
| | | | |
| | | | | | | | | | | | | | | 9,895,424 | |
| | | | | | | | | | | | | | | | |
|
| Semiconductors & Semiconductor Equipment: 3.38% | |
Lattice Semiconductor Corporation † | | | | | | | | | | | 60,897 | | | | 1,763,577 | |
MKS Instruments Incorporated | | | | | | | | | | | 11,764 | | | | 1,284,982 | |
Universal Display Corporation | | | | | | | | | | | 5,434 | | | | 982,141 | |
| | | | |
| | | | | | | | | | | | | | | 4,030,700 | |
| | | | | | | | | | | | | | | | |
|
| Software: 14.93% | |
Avalara Incorporated † | | | | | | | | | | | 9,837 | | | | 1,252,644 | |
Bill.com Holdings Incorporated † | | | | | | | | | | | 12,463 | | | | 1,250,164 | |
Elastic NV † | | | | | | | | | | | 17,223 | | | | 1,858,189 | |
Envestnet Incorporated † | | | | | | | | | | | 24,777 | | | | 1,911,793 | |
Everbridge Incorporated † | | | | | | | | | | | 9,294 | | | | 1,168,535 | |
Five9 Incorporated † | | | | | | | | | | | 20,176 | | | | 2,616,424 | |
Globant SA † | | | | | | | | | | | 10,347 | | | | 1,854,389 | |
LivePerson Incorporated † | | | | | | | | | | | 27,355 | | | | 1,422,186 | |
Model N Incorporated † | | | | | | | | | | | 47,964 | | | | 1,692,170 | |
Smartsheet Incorporated Class A † | | | | | | | | | | | 11,931 | | | | 589,630 | |
Sprout Social Incorporated Class A † | | | | | | | | | | | 27,532 | | | | 1,059,983 | |
Workiva Incorporated † | | | | | | | | | | | 20,646 | | | | 1,151,221 | |
| | | | |
| | | | | | | | | | | | | | | 17,827,328 | |
| | | | | | | | | | | | | | | | |
|
| Technology Hardware, Storage & Peripherals: 0.75% | |
NCR Corporation † | | | | | | | | | | | 40,276 | | | | 891,711 | |
| | | | | | | | | | | | | | | | |
|
Materials: 1.04% | |
|
| Metals & Mining: 1.04% | |
Sandstorm Gold Limited † | | | | | | | | | | | 146,798 | | | | 1,238,975 | |
| | | | | | | | | | | | | | | | |
|
Real Estate: 4.13% | |
|
| Equity REITs: 4.13% | |
Innovative Industrial Properties Incorporated | | | | | | | | | | | 9,283 | | | | 1,152,113 | |
QTS Realty Trust Incorporated Class A | | | | | | | | | | | 37,206 | | | | 2,344,722 | |
Rexford Industrial Realty Incorporated | | | | | | | | 31,421 | | | | 1,437,825 | |
| | | | |
| | | | | | | | | | | | | | | 4,934,660 | |
| | | | | | | | | | | | | | | | |
| |
Total Common Stocks (Cost $73,528,896) | | | | 118,360,456 | |
| | | | | | | | | | | | | | | | |
The accompanying notes are an integral part of these financial statements.
Wells Fargo Fundamental Small Cap Growth Fund | 11
Portfolio of investments—September 30, 2020 (unaudited)
| | | | | | | | | | | | | | | | |
| | | Yield | | | | | | Shares | | | Value | |
| Short-Term Investments: 2.64% | | | | | | | | | | | | |
| | | | |
| Investment Companies: 2.64% | | | | | | | | | | | | |
Securities Lending Cash Investments LLC (l)(r)(u) | | | 0.12 | % | | | | | | | 1,745,235 | | | $ | 1,745,235 | |
Wells Fargo Government Money Market Fund Select Class (l)(u) | | | 0.05 | | | | | | | | 1,404,003 | | | | 1,404,003 | |
| | | | |
Total Short-Term Investments (Cost $3,149,238) | | | | | | | | | | | | | | | 3,149,238 | |
| | | | | | | | | | | | | | | | |
| | | | | | | | |
| Total investments in securities (Cost $76,678,134) | | | 101.79 | % | | | 121,509,694 | |
| | |
Other assets and liabilities, net | | | (1.79 | ) | | | (2,135,930 | ) |
| | | | | | | | |
| Total net assets | | | 100.00 | % | | $ | 119,373,764 | |
| | | | | | | | |
| † | Non-income-earning security |
| « | All or a portion of this security is on loan. |
| (l) | The issuer of the security is an affiliated person of the Fund as defined in the Investment Company Act of 1940. |
| (r) | The investment is a non-registered investment company purchased with cash collateral received from securities on loan. |
| (u) | The rate represents the 7-day annualized yield at period end. |
Abbreviations:
| ADR | American depositary receipt |
| REIT | Real estate investment trust |
Investments In Affiliates
An affiliated investment is an investment in which the Fund owns at least 5% of the outstanding voting shares of the issuer or as a result of other relationships, such as the Fund and the issuer having the same investment manager. Transactions with issuers that were either affiliates of the Fund at the beginning of the period or the end of the period were as follows:
| | | | | | | | | | | | | | | | | | | | | | | | | | | | | | | | |
| | | Value,
beginning of
period | | | Purchases | | | Sales
proceeeds | | | Net
realized
gains
(losses) | | | Net
change in
unrealized
gains
(losses) | | | Income
from
affiliated
securities | | | Value,
end of period | | | % of
net
assets | |
| | | | | | | | |
| Short-Term Investments | | | | | | | | | | | | | | | | | | | | | | | | |
Investment Companies | | | | | | | | | | | | | | | | | | | | | | | | | | | | | | | | |
Securities Lending Cash Investments LLC | | $ | 3,270,006 | | | $ | 11,224,764 | | | $ | (12,749,839 | ) | | $ | 304 | | | $ | 0 | | | $ | 1,081 | # | | $ | 1,745,235 | | | | | |
Wells Fargo Government Money Market Fund Select Class | | | 2,099,810 | | | | 9,013,145 | | | | (9,708,952 | ) | | | 0 | | | | 0 | | | | 816 | | | | 1,404,003 | | | | | |
| | | | | | | | | | | | | | | | | | | | | | | | | | | | | | | | |
| | | | | | | | | | | | | | $ | 304 | | | $ | 0 | | | $ | 1,897 | | | $ | 3,149,238 | | | | 2.64 | % |
| | | | | | | | | | | | | | | | | | | | | | | | | | | | | | | | |
| # | Amount shown represents income before fees and rebates. |
The accompanying notes are an integral part of these financial statements.
12 | Wells Fargo Fundamental Small Cap Growth Fund
Statement of assets and liabilities—September 30, 2020 (unaudited)
| | | | |
| | | | |
| |
Assets | | | | |
Investments in unaffiliated securities (including $1,706,535 of securities loaned), at value (cost $73,528,896) | | $ | 118,360,456 | |
Investments in affiliated securities, at value (cost $3,149,238) | | | 3,149,238 | |
Foreign currency, at value (cost $5,746) | | | 5,737 | |
Receivable for Fund shares sold | | | 29,282 | |
Receivable for dividends | | | 43,636 | |
Receivable for securities lending income, net | | | 1,098 | |
Prepaid expenses and other assets | | | 68,162 | |
| | | | |
Total assets | | | 121,657,609 | |
| | | | |
| |
Liabilities | | | | |
Payable upon receipt of securities loaned | | | 1,745,235 | |
Payable for investments purchased | | | 323,458 | |
Payable for Fund shares redeemed | | | 109,557 | |
Management fee payable | | | 56,807 | |
Administration fees payable | | | 18,858 | |
Distribution fee payable | | | 374 | |
Trustees’ fees and expenses payable | | | 2,084 | |
Accrued expenses and other liabilities | | | 27,472 | |
| | | | |
Total liabilities | | | 2,283,845 | |
| | | | |
Total net assets | | $ | 119,373,764 | |
| | | | |
| |
Net assets consist of | | | | |
Paid-in capital | | $ | 71,258,201 | |
Total distributable earnings | | | 48,115,563 | |
| | | | |
Total net assets | | $ | 119,373,764 | |
| | | | |
| |
Computation of net asset value and offering price per share | | | | |
Net assets – Class A | | $ | 103,323,355 | |
Shares outstanding – Class A1 | | | 5,828,465 | |
Net asset value per share – Class A | | | $17.73 | |
Maximum offering price per share – Class A2 | | | $18.81 | |
Net assets – Class C | | $ | 673,742 | |
Shares outstanding – Class C1 | | | 44,609 | |
Net asset value per share – Class C | | | $15.10 | |
Net assets – Class R6 | | $ | 41,286 | |
Shares outstanding – Class R61 | | | 1,908 | |
Net asset value per share – Class R6 | | | $21.64 | |
Net assets – Administrator Class | | $ | 172,298 | |
Shares outstanding – Administrator Class1 | | | 8,176 | |
Net asset value per share – Administrator Class | | | $21.07 | |
Net assets – Institutional Class | | $ | 15,163,083 | |
Shares outstanding – Institutional Class1 | | | 700,992 | |
Net asset value per share – Institutional Class | | | $21.63 | |
| 1 | The Fund has an unlimited number of authorized shares. |
| 2 | Maximum offering price is computed as 100/94.25 of net asset value. On investments of $50,000 or more, the offering price is reduced. |
The accompanying notes are an integral part of these financial statements.
Wells Fargo Fundamental Small Cap Growth Fund | 13
Statement of operations—six months ended September 30, 2020 (unaudited)
| | | | |
| | | | |
| |
Investment income | | | | |
Dividends (net of foreign withholding taxes of $483) | | $ | 143,678 | |
Income from affiliated securities | | | 5,371 | |
| | | | |
Total investment income | | | 149,049 | |
| | | | |
| |
Expenses | | | | |
Management fee | | | 431,106 | |
Administration fees | | | | |
Class A | | | 93,588 | |
Class C | | | 587 | |
Class R6 | | | 3 | 1 |
Administrator Class | | | 82 | |
Institutional Class | | | 7,540 | |
Shareholder servicing fees | | | | |
Class A | | | 111,181 | |
Class C | | | 694 | |
Administrator Class | | | 158 | |
Distribution fee | | | | |
Class C | | | 2,015 | |
Custody and accounting fees | | | 9,445 | |
Professional fees | | | 22,864 | |
Registration fees | | | 31,425 | |
Shareholder report expenses | | | 16,336 | |
Trustees’ fees and expenses | | | 9,776 | |
Other fees and expenses | | | 7,155 | |
| | | | |
Total expenses | | | 743,955 | |
Less: Fee waivers and/or expense reimbursements | | | | |
Class A | | | (121,648 | ) |
Class C | | | (14,002 | ) |
Administrator Class | | | (19 | ) |
Institutional Class | | | (1,837 | ) |
| | | | |
Net expenses | | | 606,449 | |
| | | | |
Net investment loss | | | (457,400 | ) |
| | | | |
Payment from affiliate | | | 2,422 | |
| | | | |
| |
Realized and unrealized gains (losses) on investments | | | | |
Net realized gains on | | | | |
Unaffiliated securities | | | 3,374,832 | |
Affiliated securities | | | 304 | |
| | | | |
Net realized gains on investments | | | 3,375,136 | |
Net change in unrealized gains (losses) on investments | | | 42,524,320 | |
| | | | |
Net realized and unrealized gains (losses) on investments | | | 45,899,456 | |
| | | | |
Net increase in net assets resulting from operations | | $ | 45,444,478 | |
| | | | |
| 1 | For the period from May 29, 2020 (commencement of class operations) to September 30, 2020 |
The accompanying notes are an integral part of these financial statements.
14 | Wells Fargo Fundamental Small Cap Growth Fund
Statement of changes in net assets
| | | | | | | | | | | | | | | | |
| | | Six months ended
September 30, 2020
(unaudited) | | | Year ended
March 31, 2020 | |
| | | | |
Operations | | | | | | | | | | | | | | | | |
Net investment loss | | | | | | $ | (457,400 | ) | | | | | | $ | (677,336 | ) |
Payment from affiliate | | | | | | | 2,422 | | | | | | | | 0 | |
Net realized gains on investments | | | | | | | 3,375,136 | | | | | | | | 4,662,301 | |
Net change in unrealized gains (losses) on investments | | | | | | | 42,524,320 | | | | | | | | (13,268,383 | ) |
| | | | |
Net increase (decrease) in net assets resulting from operations | | | | | | | 45,444,478 | | | | | | | | (9,283,418 | ) |
| | | | |
| | | | |
Distributions to shareholders from net investment income and net realized gains | | | | | | | | | | | | | | | | |
Class A | | | | | | | 0 | | | | | | | | (5,407,235 | ) |
Class C | | | | | | | 0 | | | | | | | | (40,489 | ) |
Administrator Class | | | | | | | 0 | | | | | | | | (5,538 | ) |
Institutional Class | | | | | | | 0 | | | | | | | | (511,148 | ) |
| | | | |
Total distributions to shareholders | | | | | | | 0 | | | | | | | | (5,964,410 | ) |
| | | | |
| | | | |
Capital share transactions | | | Shares | | | | | | | | Shares | | | | | |
Proceeds from shares sold | | | | | | | | | | | | | | | | |
Class A | | | 98,049 | | | | 1,531,715 | | | | 172,227 | | | | 2,351,366 | |
Class C | | | 6,711 | | | | 89,574 | | | | 29,980 | | | | 352,632 | |
Class R6 | | | 1,927 | 1 | | | 36,343 | 1 | | | N/A | | | | N/A | |
Administrator Class | | | 1,129 | | | | 23,020 | | | | 3,192 | | | | 48,485 | |
Institutional Class | | | 143,710 | | | | 2,809,954 | | | | 182,070 | | | | 3,063,503 | |
| | | | |
| | | | | | | 4,490,606 | | | | | | | | 5,815,986 | |
| | | | |
Reinvestment of distributions | | | | | | | | | | | | | | | | |
Class A | | | 0 | | | | 0 | | | | 395,603 | | | | 5,293,176 | |
Class C | | | 0 | | | | 0 | | | | 3,263 | | | | 37,357 | |
Administrator Class | | | 0 | | | | 0 | | | | 236 | | | | 3,704 | |
Institutional Class | | | 0 | | | | 0 | | | | 26,458 | | | | 430,729 | |
| | | | |
| | | | | | | 0 | | | | | | | | 5,764,966 | |
| | | | |
Payment for shares redeemed | | | | | | | | | | | | | | | | |
Class A | | | (315,010 | ) | | | (4,748,713 | ) | | | (998,017 | ) | | | (13,561,347 | ) |
Class C | | | (4,159 | ) | | | (57,132 | ) | | | (21,365 | ) | | | (235,126 | ) |
Class R6 | | | (19 | )1 | | | (401 | )1 | | | N/A | | | | N/A | |
Administrator Class | | | (175 | ) | | | (2,361 | ) | | | (2,944 | ) | | | (46,329 | ) |
Institutional Class | | | (38,481 | ) | | | (693,052 | ) | | | (220,852 | ) | | | (3,703,000 | ) |
| | | | |
| | | | | | | (5,501,659 | ) | | | | | | | (17,545,802 | ) |
| | | | |
Net decrease in net assets resulting from capital share transactions | | | | | | | (1,011,053 | ) | | | | | | | (5,964,850 | ) |
| | | | |
Total increase (decrease) in net assets | | | | | | | 44,433,425 | | | | | | | | (21,212,678 | ) |
| | | | |
| | | | |
Net assets | | | | | | | | | | | | | | | | |
Beginning of period | | | | | | | 74,940,339 | | | | | | | | 96,153,017 | |
| | | | |
End of period | | | | | | $ | 119,373,764 | | | | | | | $ | 74,940,339 | |
| | | | |
| 1 | For the period from May 29, 2020 (commencement of class operations) to September 30, 2020 |
The accompanying notes are an integral part of these financial statements.
Wells Fargo Fundamental Small Cap Growth Fund | 15
Financial highlights
(For a share outstanding throughout each period)
| | | | | | | | | | | | | | | | | | | | | | | | |
| | | Six months ended
September 30, 2020
(unaudited) | | | Year ended March 31 | |
| CLASS A | | 2020 | | | 2019 | | | 2018 | | | 2017 | | | 2016 | |
Net asset value, beginning of period | | | $11.00 | | | | $13.28 | | | | $15.32 | | | | $14.08 | | | | $12.05 | | | | $18.04 | |
Net investment loss | | | (0.07 | )1 | | | (0.10 | )1 | | | (0.11 | )1 | | | (0.12 | )1 | | | (0.10 | )1 | | | (0.12 | )1 |
Net realized and unrealized gains (losses) on investments | | | 6.80 | | | | (1.27 | ) | | | 2.17 | | | | 2.35 | | | | 2.51 | | | | (2.13 | ) |
| | | | | | | | | | | | | | | | | | | | | | | | |
Total from investment operations | | | 6.73 | | | | (1.37 | ) | | | 2.06 | | | | 2.23 | | | | 2.41 | | | | (2.25 | ) |
Distributions to shareholders from | | | | | | | | | | | | | | | | | | | | | | | | |
Net realized gains | | | 0.00 | | | | (0.91 | ) | | | (4.10 | ) | | | (0.99 | ) | | | (0.38 | ) | | | (3.74 | ) |
Net asset value, end of period | | | $17.73 | | | | $11.00 | | | | $13.28 | | | | $15.32 | | | | $14.08 | | | | $12.05 | |
Total return2 | | | 61.18 | % | | | (11.52 | )% | | | 17.46 | % | | | 16.08 | % | | | 20.10 | % | | | (12.86 | )% |
Ratios to average net assets (annualized) | | | | | | | | | | | | | | | | | | | | | | | | |
Gross expenses | | | 1.50 | % | | | 1.52 | % | | | 1.51 | % | | | 1.52 | % | | | 1.51 | % | | | 1.50 | % |
Net expenses | | | 1.23 | % | | | 1.23 | % | | | 1.23 | % | | | 1.33 | % | | | 1.33 | % | | | 1.33 | % |
Net investment loss | | | (0.94 | )% | | | (0.74 | )% | | | (0.74 | )% | | | (0.79 | )% | | | (0.77 | )% | | | (0.74 | )% |
Supplemental data | | | | | | | | | | | | | | | | | | | | | | | | |
Portfolio turnover rate | | | 21 | % | | | 63 | % | | | 155 | % | | | 44 | % | | | 113 | % | | | 123 | % |
Net assets, end of period (000s omitted) | | | $103,323 | | | | $66,472 | | | | $86,006 | | | | $84,738 | | | | $82,734 | | | | $84,139 | |
| 1 | Calculated based upon average shares outstanding |
| 2 | Total return calculations do not include any sales charges. Returns for periods of less than one year are not annualized. |
The accompanying notes are an integral part of these financial statements.
16 | Wells Fargo Fundamental Small Cap Growth Fund
Financial highlights
(For a share outstanding throughout each period)
| | | | | | | | | | | | | | | | | | | | | | | | |
| | | Six months ended
September 30, 2020
(unaudited) | | | Year ended March 31 | |
| CLASS C | | 2020 | | | 2019 | | | 2018 | | | 2017 | | | 2016 | |
Net asset value, beginning of period | | | $9.39 | | | | $11.55 | | | | $13.94 | | | | $12.99 | | | | $11.22 | | | | $17.21 | |
Net investment loss | | | (0.11 | )1 | | | (0.18 | )1 | | | (0.20 | )1 | | | (0.21 | )1 | | | (0.18 | )1 | | | (0.18 | )1 |
Payment from affiliate | | | 0.02 | | | | 0.00 | | | | 0.00 | | | | 0.00 | | | | 0.00 | | | | 0.00 | |
Net realized and unrealized gains (losses) on investments | | | 5.80 | | | | (1.07 | ) | | | 1.91 | | | | 2.15 | | | | 2.33 | | | | (2.07 | ) |
| | | | | | | | | | | | | | | | | | | | | | | | |
Total from investment operations | | | 5.71 | | | | (1.25 | ) | | | 1.71 | | | | 1.94 | | | | 2.15 | | | | (2.25 | ) |
Distributions to shareholders from | | | | | | | | | | | | | | | | | | | | | | | | |
Net realized gains | | | 0.00 | | | | (0.91 | ) | | | (4.10 | ) | | | (0.99 | ) | | | (0.38 | ) | | | (3.74 | ) |
Net asset value, end of period | | | $15.10 | | | | $9.39 | | | | $11.55 | | | | $13.94 | | | | $12.99 | | | | $11.22 | |
Total return2 | | | 60.81 | %3 | | | (12.30 | )% | | | 16.69 | % | | | 15.17 | % | | | 19.26 | % | | | (13.55 | )% |
Ratios to average net assets (annualized) | | | | | | | | | | | | | | | | | | | | | | | | |
Gross expenses | | | 2.22 | % | | | 2.26 | % | | | 2.26 | % | | | 2.27 | % | | | 2.26 | % | | | 2.25 | % |
Net expenses | | | 1.98 | % | | | 1.98 | % | | | 1.98 | % | | | 2.08 | % | | | 2.08 | % | | | 2.08 | % |
Net investment loss | | | (1.69 | )% | | | (1.49 | )% | | | (1.48 | )% | | | (1.54 | )% | | | (1.52 | )% | | | (1.49 | )% |
Supplemental data | | | | | | | | | | | | | | | | | | | | | | | | |
Portfolio turnover rate | | | 21 | % | | | 63 | % | | | 155 | % | | | 44 | % | | | 113 | % | | | 123 | % |
Net assets, end of period (000s omitted) | | | $674 | | | | $395 | | | | $349 | | | | $274 | | | | $225 | | | | $162 | |
| 1 | Calculated based upon average shares outstanding |
| 2 | Total return calculations do not include any sales charges. Returns for periods of less than one year are not annualized. |
| 3 | During the six months ended September 30, 2020, the Fund received a payment from an affiliate which had a 0.17% impact on the total return. See Note 4 in the Notes to Financial Statements for additional information. |
The accompanying notes are an integral part of these financial statements.
Wells Fargo Fundamental Small Cap Growth Fund | 17
Financial highlights
(For a share outstanding throughout the period)
| | | | |
| | | Period ended
September 30, 20201
(unaudited) | |
| CLASS R6 |
Net asset value, beginning of period | | | $17.87 | |
Net investment loss | | | (0.03 | )2 |
Net realized and unrealized gains (losses) on investments | | | 3.80 | |
| | | | |
Total from investment operations | | | 3.77 | |
Net asset value, end of period | | | $21.64 | |
Total return3 | | | 21.10 | % |
Ratios to average net assets (annualized) | | | | |
Gross expenses | | | 1.04 | % |
Net expenses | | | 0.80 | % |
Net investment loss | | | (0.44 | )% |
Supplemental data | | | | |
Portfolio turnover rate | | | 21 | % |
Net assets, end of period (000s omitted) | | | $41 | |
| 1 | For the period from May 29, 2020 (commencement of class operations) to September 30, 2020 |
| 2 | Calculated based upon average shares outstanding |
| 3 | Returns for periods of less than one year are not annualized. |
The accompanying notes are an integral part of these financial statements.
18 | Wells Fargo Fundamental Small Cap Growth Fund
Financial highlights
(For a share outstanding throughout each period)
| | | | | | | | | | | | | | | | | | | | | | | | |
| | | Six months ended
September 30, 2020
(unaudited) | | | Year ended March 31 | |
| ADMINISTRATOR CLASS | | 2020 | | | 2019 | | | 2018 | | | 2017 | | | 2016 | |
Net asset value, beginning of period | | | $12.91 | | | | $15.43 | | | | $17.14 | | | | $15.63 | | | | $13.29 | | | | $19.44 | |
Net investment loss | | | (0.08 | )1 | | | (0.11 | )1 | | | (0.11 | )1 | | | (0.11 | )1 | | | (0.09 | )1 | | | (0.10 | )1 |
Payment from affiliate | | | 0.21 | | | | 0.00 | | | | 0.00 | | | | 0.00 | | | | 0.00 | | | | 0.00 | |
Net realized and unrealized gains (losses) on investments | | | 8.03 | | | | (1.50 | ) | | | 2.50 | | | | 2.61 | | | | 2.81 | | | | (2.31 | ) |
| | | | | | | | | | | | | | | | | | | | | | | | |
Total from investment operations | | | 8.16 | | | | (1.61 | ) | | | 2.39 | | | | 2.50 | | | | 2.72 | | | | (2.41 | ) |
Distributions to shareholders from | | | | | | | | | | | | | | | | | | | | | | | | |
Net realized gains | | | 0.00 | | | | (0.91 | ) | | | (4.10 | ) | | | (0.99 | ) | | | (0.38 | ) | | | (3.74 | ) |
Net asset value, end of period | | | $21.07 | | | | $12.91 | | | | $15.43 | | | | $17.14 | | | | $15.63 | | | | $13.29 | |
Total return2 | | | 63.21 | %3 | | | (11.52 | )% | | | 17.59 | % | | | 16.21 | % | | | 20.56 | % | | | (12.76 | )% |
Ratios to average net assets (annualized) | | | | | | | | | | | | | | | | | | | | | | | | |
Gross expenses | | | 1.42 | % | | | 1.44 | % | | | 1.43 | % | | | 1.44 | % | | | 1.43 | % | | | 1.39 | % |
Net expenses | | | 1.15 | % | | | 1.15 | % | | | 1.15 | % | | | 1.20 | % | | | 1.20 | % | | | 1.20 | % |
Net investment loss | | | (0.85 | )% | | | (0.66 | )% | | | (0.62 | )% | | | (0.66 | )% | | | (0.64 | )% | | | (0.61 | )% |
Supplemental data | | | | | | | | | | | | | | | | | | | | | | | | |
Portfolio turnover rate | | | 21 | % | | | 63 | % | | | 155 | % | | | 44 | % | | | 113 | % | | | 123 | % |
Net assets, end of period (000s omitted) | | | $172 | | | | $93 | | | | $104 | | | | $133 | | | | $174 | | | | $2,413 | |
| 1 | Calculated based upon average shares outstanding |
| 2 | Returns for periods of less than one year are not annualized. |
| 3 | During the six months ended September 30, 2020, the Fund received a payment from an affiliate which had a 1.64% impact on the total return. See Note 4 in the Notes to Financial Statements for additional information. |
The accompanying notes are an integral part of these financial statements.
Wells Fargo Fundamental Small Cap Growth Fund | 19
Financial highlights
(For a share outstanding throughout each period)
| | | | | | | | | | | | | | | | | | | | | | | | |
| | | Six months ended
September 30, 2020
(unaudited) | | | Year ended March 31 | |
| INSTITUTIONAL CLASS | | 2020 | | | 2019 | | | 2018 | | | 2017 | | | 2016 | |
Net asset value, beginning of period | | | $13.39 | | | | $15.94 | | | | $17.53 | | | | $15.94 | | | | $13.54 | | | | $19.69 | |
Net investment loss | | | (0.06 | )1 | | | (0.07 | )1 | | | (0.07 | )1 | | | (0.08 | )1 | | | (0.06 | )1 | | | (0.07 | )1 |
Net realized and unrealized gains (losses) on investments | | | 8.30 | | | | (1.57 | ) | | | 2.58 | | | | 2.66 | | | | 2.84 | | | | (2.34 | ) |
| | | | | | | | | | | | | | | | | | | | | | | | |
Total from investment operations | | | 8.24 | | | | (1.64 | ) | | | 2.51 | | | | 2.58 | | | | 2.78 | | | | (2.41 | ) |
Distributions to shareholders from | | | | | | | | | | | | | | | | | | | | | | | | |
Net realized gains | | | 0.00 | | | | (0.91 | ) | | | (4.10 | ) | | | (0.99 | ) | | | (0.38 | ) | | | (3.74 | ) |
Net asset value, end of period | | | $21.63 | | | | $13.39 | | | | $15.94 | | | | $17.53 | | | | $15.94 | | | | $13.54 | |
Total return2 | | | 61.54 | % | | | (11.29 | )% | | | 17.85 | % | | | 16.40 | % | | | 20.62 | % | | | (12.58 | )% |
Ratios to average net assets (annualized) | | | | | | | | | | | | | | | | | | | | | | | | |
Gross expenses | | | 1.17 | % | | | 1.19 | % | | | 1.18 | % | | | 1.19 | % | | | 1.18 | % | | | 1.14 | % |
Net expenses | | | 0.90 | % | | | 0.90 | % | | | 0.90 | % | | | 0.98 | % | | | 0.98 | % | | | 0.98 | % |
Net investment loss | | | (0.60 | )% | | | (0.41 | )% | | | (0.41 | )% | | | (0.44 | )% | | | (0.43 | )% | | | (0.39 | )% |
Supplemental data | | | | | | | | | | | | | | | | | | | | | | | | |
Portfolio turnover rate | | | 21 | % | | | 63 | % | | | 155 | % | | | 44 | % | | | 113 | % | | | 123 | % |
Net assets, end of period (000s omitted) | | | $15,163 | | | | $7,980 | | | | $9,695 | | | | $8,878 | | | | $8,001 | | | | $8,980 | |
| 1 | Calculated based upon average shares outstanding |
| 2 | Returns for periods of less than one year are not annualized. |
The accompanying notes are an integral part of these financial statements.
20 | Wells Fargo Fundamental Small Cap Growth Fund
Notes to financial statements (unaudited)
1. ORGANIZATION
Wells Fargo Funds Trust (the “Trust”), a Delaware statutory trust organized on March 10, 1999, is an open-end management investment company registered under the Investment Company Act of 1940, as amended (the “1940 Act”). As an investment company, the Trust follows the accounting and reporting guidance in Financial Accounting Standards Board (“FASB”) Accounting Standards Codification Topic 946, Financial Services – Investment Companies. These financial statements report on the Wells Fargo Fundamental Small Cap Growth Fund (the “Fund”) which is a diversified series of the Trust.
2. SIGNIFICANT ACCOUNTING POLICIES
The following significant accounting policies, which are consistently followed in the preparation of the financial statements of the Fund, are in conformity with U.S. generally accepted accounting principles which require management to make estimates and assumptions that affect the reported amounts of assets and liabilities, disclosure of contingent assets and liabilities at the date of the financial statements, and the reported amounts of revenues and expenses during the reporting period. Actual results could differ from those estimates.
Securities valuation
All investments are valued each business day as of the close of regular trading on the New York Stock Exchange (generally 4 p.m. Eastern Time), although the Fund may deviate from this calculation time under unusual or unexpected circumstances.
Equity securities that are listed on a foreign or domestic exchange or market are valued at the official closing price or, if none, the last sales price. If no sale occurs on the principal exchange or market that day, a fair value price will be determined in accordance with the Fund’s Valuation Procedures.
The values of securities denominated in foreign currencies are translated into U.S. dollars at rates provided by an independent foreign currency pricing source at a time each business day specified by the Wells Fargo Asset Management Pricing Committee at Wells Fargo Funds Management, LLC (“Funds Management”)
Many securities markets and exchanges outside the U.S. close prior to the close of the New York Stock Exchange and therefore may not fully reflect trading or events that occur after the close of the principal exchange in which the foreign securities are traded, but before the close of the New York Stock Exchange. If such trading or events are expected to materially affect the value of such securities, then fair value pricing procedures approved by the Board of Trustees of the Fund are applied. These procedures take into account multiple factors including movements in U.S. securities markets after foreign exchanges close. Foreign securities that are fair valued under these procedures are categorized as Level 2 and the application of these procedures may result in transfers between Level 1 and Level 2. Depending on market activity, such fair valuations may be frequent. Such fair value pricing may result in net asset values that are higher or lower than net asset values based on the last reported sales price or latest quoted bid price. On September 30, 2020, such fair value pricing was used in pricing certain foreign securities.
Investments in registered open-end investment companies are valued at net asset value. Interests in non-registered investment companies that are redeemable at net asset value are fair valued normally at net asset value.
Investments which are not valued using any of the methods discussed above are valued at their fair value, as determined in good faith by the Board of Trustees. The Board of Trustees has established a Valuation Committee comprised of the Trustees and has delegated to it the authority to take any actions regarding the valuation of portfolio securities that the Valuation Committee deems necessary or appropriate, including determining the fair value of portfolio securities, unless the determination has been delegated to the Wells Fargo Asset Management Pricing Committee. The Board of Trustees retains the authority to make or ratify any valuation decisions or approve any changes to the Valuation Procedures as it deems appropriate. On a quarterly basis, the Board of Trustees receives reports on any valuation actions taken by the Valuation Committee or the Wells Fargo Asset Management Pricing Committee which may include items for ratification.
Foreign currency translation
The accounting records of the Fund are maintained in U.S. dollars. The values of other assets and liabilities denominated in foreign currencies are translated into U.S. dollars at rates provided by an independent foreign currency pricing source at a time each business day specified by the Wells Fargo Asset Management Pricing Committee. Purchases and sales of securities, and income and expenses are converted at the rate of exchange on the respective dates of such transactions. Net realized foreign exchange gains or losses arise from sales of foreign currencies, currency gains or losses realized between the trade and settlement dates on securities transactions, and the difference between the amounts of dividends, interest and foreign withholding taxes recorded and the U.S. dollar equivalent of the amounts actually paid or received. Net unrealized foreign exchange gains and losses arise from changes in the fair value of assets and liabilities other than investments in securities resulting from changes in exchange rates. The changes in net assets arising from changes in exchange rates of securities and the
Wells Fargo Fundamental Small Cap Growth Fund | 21
Notes to financial statements (unaudited)
changes in net assets resulting from changes in market prices of securities are not separately presented. Such changes are included in net realized and unrealized gains or losses from investments.
Securities lending
The Fund may lend its securities from time to time in order to earn additional income in the form of fees or interest on securities received as collateral or the investment of any cash received as collateral. When securities are on loan, the Fund receives interest or dividends on those securities. Cash collateral received in connection with its securities lending transactions is invested in Securities Lending Cash Investments, LLC (the “Securities Lending Fund”). Investments in Securities Lending Fund are valued at the evaluated bid price provided by an independent pricing service. Income earned from investment in the Securities Lending Fund (net of fees and rebates), if any, is included in income from affiliated securities on the Statement of Operations.
In a securities lending transaction, the net asset value of the Fund is affected by an increase or decrease in the value of the securities loaned and by an increase or decrease in the value of the instrument in which collateral is invested. The amount of securities lending activity undertaken by the Fund fluctuates from time to time. The Fund has the right under the lending agreement to recover the securities from the borrower on demand. In the event of default or bankruptcy by the borrower, the Fund may be prevented from recovering the loaned securities or gaining access to the collateral or may experience delays or costs in doing so. In such an event, the terms of the agreement allow the unaffiliated securities lending agent to use the collateral to purchase replacement securities on behalf of the Fund or pay the Fund the market value of the loaned securities. The Fund bears the risk of loss with respect to depreciation of its investment of the cash collateral.
Security transactions and income recognition
Securities transactions are recorded on a trade date basis. Realized gains or losses are recorded on the basis of identified cost.
Dividend income is recognized on the ex-dividend date, except for certain dividends from foreign securities, which are recorded as soon as the custodian verifies the ex-dividend date. Dividend income from foreign securities is recorded net of foreign taxes withheld where recovery of such taxes is not assured.
Distributions to shareholders
Distributions to shareholders from net investment income and any net realized gains are recorded on the ex-dividend date and paid at least annually. Such distributions are determined in accordance with income tax regulations and may differ from U.S. generally accepted accounting principles. Dividend sources are estimated at the time of declaration. The tax character of distributions is determined as of the Fund’s fiscal year end. Therefore, a portion of the Fund’s distributions made prior to the Fund’s fiscal year end may be categorized as a tax return of capital at year end.
Federal and other taxes
The Fund intends to continue to qualify as a regulated investment company by distributing substantially all of its investment company taxable income and any net realized capital gains (after reduction for capital loss carryforwards) sufficient to relieve it from all, or substantially all, federal income taxes. Accordingly, no provision for federal income taxes was required.
The Fund’s income and federal excise tax returns and all financial records supporting those returns for the prior three fiscal years are subject to examination by the federal and Delaware revenue authorities. Management has analyzed the Fund’s tax positions taken on federal, state, and foreign tax returns for all open tax years and does not believe that there are any uncertain tax positions that require recognition of a tax liability.
As of September 30, 2020, the aggregate cost of all investments for federal income tax purposes was $77,008,742 and the unrealized gains (losses) consisted of:
| | | | |
| |
Gross unrealized gains | | $ | 45,999,509 | |
| |
Gross unrealized losses | | | (1,498,557 | ) |
| |
Net unrealized gains | | $ | 44,500,952 | |
As of March 31, 2020, the Fund had a qualified late-year ordinary loss of $221,448 which was recognized on the first day of the current fiscal year.
Class allocations
The separate classes of shares offered by the Fund differ principally in applicable sales charges, distribution, shareholder servicing, and administration fees. Class specific expenses are charged directly to that share class. Investment income, common
fund-level expenses, and realized and unrealized gains (losses) on investments are allocated daily to each class of shares based on the relative proportion of net assets of each class.
22 | Wells Fargo Fundamental Small Cap Growth Fund
Notes to financial statements (unaudited)
3. FAIR VALUATION MEASUREMENTS
Fair value measurements of investments are determined within a framework that has established a fair value hierarchy based upon the various data inputs utilized in determining the value of the Fund’s investments. The three-level hierarchy gives the highest priority to unadjusted quoted prices in active markets for identical assets or liabilities (Level 1) and the lowest priority to unobservable inputs (Level 3). The Fund’s investments are classified within the fair value hierarchy based on the lowest level of input that is significant to the fair value measurement. The inputs are summarized into three broad levels as follows:
| ∎ | | Level 1 – quoted prices in active markets for identical securities |
| ∎ | | Level 2 – other significant observable inputs (including quoted prices for similar securities, interest rates, prepayment speeds, credit risk, etc.) |
| ∎ | | Level 3 – significant unobservable inputs (including the Fund’s own assumptions in determining the fair value of investments) |
The inputs or methodologies used for valuing investments in securities are not necessarily an indication of the risk associated with investing in those securities.
The following is a summary of the inputs used in valuing the Fund’s assets and liabilities as of September 30, 2020:
| | | | | | | | | | | | | | | | |
| | | | |
| | | Quoted prices
(Level 1) | | | Other significant
observable inputs
(Level 2) | | | Significant unobservable inputs (Level 3) | | | Total | |
| | | | |
Assets | | | | | | | | | | | | | | | | |
Investments in: | | | | | | | | | | | | | | | | |
| | | | |
Common stocks | | | | | | | | | | | | | | | | |
| | | | |
Communication services | | $ | 1,074,428 | | | $ | 1,468,364 | | | $ | 0 | | | $ | 2,542,792 | |
| | | | |
Consumer discretionary | | | 6,577,427 | | | | 1,829,990 | | | | 0 | | | | 8,407,417 | |
| | | | |
Financials | | | 2,705,640 | | | | 0 | | | | 0 | | | | 2,705,640 | |
| | | | |
Health care | | | 39,570,660 | | | | 0 | | | | 0 | | | | 39,570,660 | |
| | | | |
Industrials | | | 23,407,203 | | | | 0 | | | | 0 | | | | 23,407,203 | |
| | | | |
Information technology | | | 35,553,109 | | | | 0 | | | | 0 | | | | 35,553,109 | |
| | | | |
Materials | | | 1,238,975 | | | | 0 | | | | 0 | | | | 1,238,975 | |
| | | | |
Real estate | | | 4,934,660 | | | | 0 | | | | 0 | | | | 4,934,660 | |
| | | | |
Short-term investments | | | | | | | | | | | | | | | | |
| | | | |
Investment companies | | | 3,149,238 | | | | 0 | | | | 0 | | | | 3,149,238 | |
| | | | |
Total assets | | $ | 118,211,340 | | | $ | 3,298,354 | | | $ | 0 | | | $ | 121,509,694 | |
Additional sector, industry or geographic detail is included in the Portfolio of Investments.
For the six months ended September 30, 2020, the Fund did not have any transfers into/out of Level 3.
4. TRANSACTIONS WITH AFFILIATES
Management fee
Funds Management, an indirect wholly owned subsidiary of Wells Fargo & Company (“Wells Fargo”), is the manager of the Fund and provides advisory and fund-level administrative services under an investment management agreement. Under the investment management agreement, Funds Management is responsible for, among other services, implementing the investment objectives and strategies of the Fund, supervising the subadviser and providing fund-level administrative services in
Wells Fargo Fundamental Small Cap Growth Fund | 23
Notes to financial statements (unaudited)
connection with the Fund’s operations. As compensation for its services under the investment management agreement, Funds Management is entitled to receive a management fee at the following annual rate based on the Fund’s average daily net assets:
| | | | | | |
| | |
| Average daily net assets | | | | Management fee | |
| | |
First $500 million | | | | | 0.850 | % |
| | |
Next $500 million | | | | | 0.825 | |
| | |
Next $1 billion | | | | | 0.800 | |
| | |
Next $1 billion | | | | | 0.775 | |
| | |
Next $1 billion | | | | | 0.750 | |
| | |
Next $1 billion | | | | | 0.730 | |
| | |
Next $5 billion | | | | | 0.720 | |
| | |
Over $10 billion | | | | | 0.710 | |
For the six months ended September 30, 2020, the management fee was equivalent to an annual rate of 0.85% of the Fund’s average daily net assets.
Funds Management has retained the services of a subadviser to provide daily portfolio management to the Fund. The fee for subadvisory services is borne by Funds Management. Wells Capital Management Incorporated (“WellsCap”), an affiliate of Funds Management and an indirect wholly owned subsidiary of Wells Fargo, is the subadviser to the Fund and is entitled to receive a fee from Funds Management at an annual rate starting at 0.55% and declining to 0.40% as the average daily net assets of the Fund increase.
Administration fees
Under a class-level administration agreement, Funds Management provides class-level administrative services to the Fund, which includes paying fees and expenses for services provided by the transfer agent, sub-transfer agents, omnibus account servicers and record-keepers. As compensation for its services under the class-level administration agreement, Funds Management receives an annual fee which is calculated based on the average daily net assets of each class as follows:
| | |
| |
| | | Class-level
administration fee |
| |
Class A, Class C | | 0.21% |
| |
Class R6 | | 0.03 |
| |
Administrator Class, Institutional Class | | 0.13 |
Waivers and/or expense reimbursements
Funds Management has contractually waived and/or reimbursed management and administration fees to the extent necessary to maintain certain net operating expense ratios for the Fund. When each class of the Fund has exceeded its expense cap, Funds Management has waived fees and/or reimbursed expenses from fund-level expenses on a proportionate basis and then from class specific expenses. When only certain classes exceed their expense caps, waivers and/or reimbursements are applied against class specific expenses before fund-level expenses. Funds Management has committed through July 31, 2021 to waive fees and/or reimburse expenses to the extent necessary to cap the Fund’s expenses at 1.23% for Class A shares, 1.98% for Class C shares, 0.80% for Class R6 shares, 1.15% for Administrator Class shares, and 0.90% for Institutional Class shares. Prior to or after the commitment expiration date, the cap may be increased or the commitment to maintain the cap may be terminated only with the approval of the Board of Trustees.
Distribution fee
The Trust has adopted a distribution plan for Class C shares of the Fund pursuant to Rule 12b-1 under the 1940 Act. A distribution fee is charged to Class C shares and paid to Wells Fargo Funds Distributor, LLC (“Funds Distributor”), the principal underwriter, at an annual rate of 0.75% of the average daily net assets of Class C shares.
In addition, Funds Distributor is entitled to receive the front-end sales charge from the purchase of Class A shares and a contingent deferred sales charge on the redemption of certain Class A shares. Funds Distributor is also entitled to receive the contingent deferred sales charges from redemptions of Class C shares. For the six months ended September 30, 2020, Funds Distributor received $488 from the sale of Class A shares. No contingent deferred sales charges were incurred by Class A and Class C shares for the six months ended September 30, 2020.
24 | Wells Fargo Fundamental Small Cap Growth Fund
Notes to financial statements (unaudited)
Shareholder servicing fees
The Trust has entered into contracts with one or more shareholder servicing agents, whereby Class A, Class C, and Administrator Class of the Fund are charged a fee at an annual rate of 0.25% of the average daily net assets of each respective class. A portion of these total shareholder servicing fees were paid to affiliates of Wells Fargo.
Interfund transactions
The Fund may purchase or sell portfolio investment securities to certain other Wells Fargo affiliates pursuant to Rule 17a-7 under the 1940 Act and under procedures adopted by the Board of Trustees. The procedures have been designed to ensure that these interfund transactions, which do not incur broker commissions, are effected at current market prices.
Other transactions
On August 14, 2020, Class C and Administrator Class of the Fund were reimbursed by Funds Management in the amount of $698 and $1,724, respectively. The reimbursements were made in connection with resolving certain fee reimbursements.
5. INVESTMENT PORTFOLIO TRANSACTIONS
Purchases and sales of investments, excluding U.S. government obligations (if any) and short-term securities, for the six months ended September 30, 2020 were $20,696,365 and $21,460,142, respectively.
6. SECURITIES LENDING TRANSACTIONS
The Fund lends its securities through an unaffiliated securities lending agent and receives collateral in the form of cash or securities with a value at least equal to the value of the securities on loan. The value of the loaned securities is determined at the close of each business day and any increases or decreases in the required collateral are exchanged between the Fund and the counterparty on the next business day. Cash collateral received is invested in the Securities Lending Fund which seeks to provide a positive return compared to the daily Federal Funds Open Rate by investing in high-quality, U.S. dollar-denominated short-term money market instruments and is exempt from registration under Section 3(c)(7) of the 1940 Act. Securities Lending Fund is managed by Funds Management and is subadvised by WellsCap. Funds Management receives an advisory fee starting at 0.05% and declining to 0.01% as the average daily net assets of the Securities Lending Fund increase. All of the fees received by Funds Management are paid to WellsCap for its services as subadviser.
In the event of counterparty default or the failure of a borrower to return a loaned security, the Fund has the right to use the collateral to offset any losses incurred. As of September 30, 2020, the Fund had securities lending transactions with the following counterparties which are subject to offset:
| | | | | | | | | | | | |
| | | |
| Counterparty | | Value of
securities on
loan | | | Collateral
received1 | | | Net amount | |
| | | |
BNP Paribas Securities Corp. | | $ | 1,008,144 | | | $ | (1,008,144 | ) | | $ | 0 | |
| | | |
Citigroup Global Markets Inc. | | | 287,856 | | | | (287,856 | ) | | | 0 | |
| | | |
JP Morgan Securities LLC | | | 410,535 | | | | (410,535 | ) | | | 0 | |
| 1 | Collateral received within this table is limited to the collateral for the net transaction with the counterparty. |
7. BANK BORROWINGS
The Trust (excluding the money market funds), Wells Fargo Master Trust and Wells Fargo Variable Trust are parties to a $350,000,000 revolving credit agreement whereby the Fund is permitted to use bank borrowings for temporary or emergency purposes, such as to fund shareholder redemption requests. Interest under the credit agreement is charged to the Fund based on a borrowing rate equal to the higher of the Federal Funds rate in effect on that day plus 1.25% or the overnight LIBOR rate in effect on that day plus 1.25%. In addition, an annual commitment fee equal to 0.25% of the unused balance is allocated to each participating fund.
For the six months ended September 30, 2020, there were no borrowings by the Fund under the agreement.
8. CONCENTRATION RISK
Concentration risks result from exposure to a limited number of sectors. As of the end of the period, the Fund concentrated its portfolio in investments related to the health care and information technology sectors. A fund that invests a substantial portion of its assets in any sector may be more affected by changes in that sector than would be a fund whose investments are not heavily weighted in any sector.
Wells Fargo Fundamental Small Cap Growth Fund | 25
Notes to financial statements (unaudited)
9. INDEMNIFICATION
Under the Fund’s organizational documents, the officers and Trustees have been granted certain indemnification rights against certain liabilities that may arise out of performance of their duties to the Fund. The Fund has entered into a separate agreement with each Trustee that converts indemnification rights currently existing under the Fund’s organizational documents into contractual rights that cannot be changed in the future without the consent of the Trustee. Additionally, in the normal course of business, the Fund may enter into contracts with service providers that contain a variety of indemnification clauses. The Fund’s maximum exposure under these arrangements is dependent on future claims that may be made against the Fund and, therefore, cannot be estimated.
10. NEW ACCOUNTING PRONOUNCEMENT
In August 2018, FASB issued Accounting Standards Update (“ASU”) No. 2018-13, Fair Value Measurement (Topic 820) Disclosure Framework—Changes to the Disclosure Requirements for Fair Value Measurement. ASU 2018-13 updates the disclosure requirements on fair value measurements in Topic 820, Fair Value Measurements. The amendments are effective for fiscal years, and interim periods within those fiscal years, beginning after December 15, 2019. Management has adopted this guidance which did not have a material impact on the financial statements.
11. CORONAVIRUS (COVID-19) PANDEMIC
On March 11, 2020, the World Health Organization announced that it had made the assessment that coronavirus disease 2019 (“COVID-19”) is a pandemic. The impacts of COVID-19 are adversely affecting the entire global economy, individual companies and investment products, and the market in general. There is significant uncertainty around the extent and duration of business disruptions related to COVID-19 and the impacts may be short term or may last for an extended period of time. The risk of further spreading of COVID-19 has led to significant uncertainty and volatility in the financial markets.
26 | Wells Fargo Fundamental Small Cap Growth Fund
Other information (unaudited)
PROXY VOTING INFORMATION
A description of the policies and procedures used to determine how to vote proxies relating to portfolio securities is available, upon request, by calling 1-800-222-8222, visiting our website at wfam.com, or visiting the SEC website at sec.gov. Information regarding how the proxies related to portfolio securities were voted during the most recent 12-month period ended June 30 is available on the website at wfam.com or by visiting the SEC website at sec.gov.
QUARTERLY PORTFOLIO HOLDINGS INFORMATION
The Fund files its complete schedule of portfolio holdings with the SEC for the first and third quarters of each fiscal year as an exhibit to its reports on Form N-PORT. Shareholders may view the filed Form N-PORT by visiting the SEC website at sec.gov.
Wells Fargo Fundamental Small Cap Growth Fund | 27
Other information (unaudited)
BOARD OF TRUSTEES AND OFFICERS
Each of the Trustees and Officers1 listed in the table below acts in identical capacities for each fund in the Wells Fargo family of funds, which consists of 142 mutual funds comprising the Wells Fargo Funds Trust, Wells Fargo Variable Trust, Wells Fargo Master Trust and four closed-end funds (collectively the “Fund Complex”). This table should be read in conjunction with the Prospectus and the Statement of Additional Information2. The mailing address of each Trustee and Officer is 525 Market Street, 12th Floor, San Francisco, CA 94105. Each Trustee and Officer serves an indefinite term, however, each Trustee serves such term until reaching the mandatory retirement age established by the Trustees.
Independent Trustees
| | | | | | |
Name and
year of birth | | Position held and
length of service* | | Principal occupations during past five years or longer | | Current other
public company or
investment
company
directorships |
| | | |
| William R. Ebsworth (Born 1957) | | Trustee,
since 2015 | | Retired. From 1984 to 2013, equities analyst, portfolio manager, research director and chief investment officer at Fidelity Management and Research Company in Boston, Tokyo, and Hong Kong, and retired in 2013 as Chief Investment Officer of Fidelity Strategic Advisers, Inc. where he led a team of investment professionals managing client assets. Prior thereto, Board member of Hong Kong Securities Clearing Co., Hong Kong Options Clearing Corp., the Thailand International Fund, Ltd., Fidelity Investments Life Insurance Company, and Empire Fidelity Investments Life Insurance Company. Audit Committee Chair and Investment Committee Chair of the Vincent Memorial Hospital Endowment (non-profit organization). Mr. Ebsworth is a CFA® charterholder. | | N/A |
| | | |
| Jane A. Freeman (Born 1953) | | Trustee, since 2015; Chair Liaison,
since 2018 | | Retired. From 2012 to 2014 and 1999 to 2008, Chief Financial Officer of Scientific Learning Corporation. From 2008 to 2012, Ms. Freeman provided consulting services related to strategic business projects. Prior to 1999, Portfolio Manager at Rockefeller & Co. and Scudder, Stevens & Clark. Board member of the Harding Loevner Funds from 1996 to 2014, serving as both Lead Independent Director and chair of the Audit Committee. Board member of the Russell Exchange Traded Funds Trust from 2011 to 2012 and the chair of the Audit Committee. Ms. Freeman is also an inactive Chartered Financial Analyst. | | N/A |
| | | |
| Isaiah Harris, Jr. (Born 1952) | | Trustee, since 2009; Audit Committee Chairman,
since 2019 | | Retired. Chairman of the Board of CIGNA Corporation since 2009, and Director since 2005. From 2003 to 2011, Director of Deluxe Corporation. Prior thereto, President and CEO of BellSouth Advertising and Publishing Corp. from 2005 to 2007, President and CEO of BellSouth Enterprises from 2004 to 2005 and President of BellSouth Consumer Services from 2000 to 2003. Emeritus member of the Iowa State University Foundation Board of Governors. Emeritus Member of the Advisory Board of Iowa State University School of Business. Advisory Board Member, Palm Harbor Academy (private school). Mr. Harris is a certified public accountant (inactive status). | | CIGNA Corporation |
| | | |
| Judith M. Johnson (Born 1949) | | Trustee,
since 2008 | | Retired. Prior thereto, Chief Executive Officer and Chief Investment Officer of Minneapolis Employees Retirement Fund from 1996 to 2008. Ms. Johnson is an attorney, certified public accountant and a certified managerial accountant. | | N/A |
| | | |
| David F. Larcker (Born 1950) | | Trustee,
since 2009 | | James Irvin Miller Professor of Accounting at the Graduate School of Business (Emeritus), Stanford University, Director of the Corporate Governance Research Initiative and Senior Faculty of The Rock Center for Corporate Governance since 2006. From 2005 to 2008, Professor of Accounting at the Graduate School of Business, Stanford University. Prior thereto, Ernst & Young Professor of Accounting at The Wharton School, University of Pennsylvania from 1985 to 2005. | | N/A |
28 | Wells Fargo Fundamental Small Cap Growth Fund
Other information (unaudited)
| | | | | | |
Name and
year of birth | | Position held and
length of service* | | Principal occupations during past five years or longer | | Current other
public company or
investment
company
directorships |
| | | |
| Olivia S. Mitchell (Born 1953) | | Trustee,
since 2006; Nominating and Governance Committee Chair, since 2018 | | International Foundation of Employee Benefit Plans Professor, Wharton School of the University of Pennsylvania since 1993. Director of Wharton’s Pension Research Council and Boettner Center on Pensions & Retirement Research, and Research Associate at the National Bureau of Economic Research. Previously, Cornell University Professor from 1978 to 1993. | | N/A |
| | | |
| Timothy J. Penny (Born 1951) | | Trustee, since 1996; Chairman, since 2018 | | President and Chief Executive Officer of Southern Minnesota Initiative Foundation, a non-profit organization, since 2007. Member of the Board of Trustees of NorthStar Education Finance, Inc., a non-profit organization, since 2007. | | N/A |
| | | |
| James G. Polisson (Born 1959) | | Trustee,
since 2018 | | Retired. Chief Marketing Officer, Source (ETF) UK Services, Ltd, from 2015 to 2017. From 2012 to 2015, Principal of The Polisson Group, LLC, a management consulting, corporate advisory and principal investing company. Chief Executive Officer and Managing Director at Russell Investments, Global Exchange Traded Funds from 2010 to 2012. Managing Director of Barclays Global Investors from 1998 to 2010 and Global Chief Marketing Officer for iShares and Barclays Global Investors from 2000 to 2010. Trustee of the San Francisco Mechanics’ Institute, a non-profit organization, from 2013 to 2015. Board member of the Russell Exchange Traded Fund Trust from 2011 to 2012. Director of Barclays Global Investors Holdings Deutschland GmbH from 2006 to 2009. Mr. Polisson is an attorney and has a retired status with the Massachusetts and District of Columbia Bar Associations. | | N/A |
| | | |
| Pamela Wheelock (Born 1959) | | Trustee, since January 2020; previously Trustee from January 2018 to July 2019 | | Board member of the Destination Medical Center Economic Development Agency, Rochester, Minnesota since 2019. Interim President of the McKnight Foundation from January to September 2020. Acting Commissioner, Minnesota Department of Human Services, July 2019 through September 2019. Human Services Manager (part-time), Minnesota Department of Human Services, October 2019 through December 2019. Chief Operating Officer, Twin Cities Habitat for Humanity from 2017 to 2019. Vice President of University Services, University of Minnesota from 2012 to 2016. Prior thereto, on the Board of Directors, Governance Committee and Finance Committee for the Minnesota Philanthropy Partners (Saint Paul Foundation) from 2012 to 2018, Interim Chief Executive Officer of Blue Cross Blue Shield of Minnesota from 2011 to 2012, Chairman of the Board from 2009 to 2012 and Board Director from 2003 to 2015. Vice President, Leadership and Community Engagement, Bush Foundation, Saint Paul, Minnesota (a private foundation) from 2009 to 2011. Executive Vice President and Chief Financial Officer, Minnesota Sports and Entertainment from 2004 to 2009 and Senior Vice President from 2002 to 2004. Executive Vice President of the Minnesota Wild Foundation from 2004 to 2008. Commissioner of Finance, State of Minnesota, from 1999 to 2002. Currently Board Chair of the Minnesota Wild Foundation since 2010. | | N/A |
| * | Length of service dates reflect the Trustee’s commencement of service with the Trust’s predecessor entities, where applicable. |
Wells Fargo Fundamental Small Cap Growth Fund | 29
Other information (unaudited)
Officers
| | | | |
Name and
year of birth | | Position held and
length of service | | Principal occupations during past five years or longer |
| | |
Andrew Owen
(Born 1960) | | President,
since 2017 | | Executive Vice President of Wells Fargo & Company and Head of Affiliated Managers, Wells Fargo Asset Management, since 2014. In addition, Mr. Owen is currently President, Chief Executive Officer and Director of Wells Fargo Funds Management, LLC since 2017. Prior thereto, Executive Vice President responsible for marketing, investments and product development for Wells Fargo Funds Management, LLC, from 2009 to 2014. |
| | |
Nancy Wiser1
(Born 1967) | | Treasurer,
since 2012 | | Executive Vice President of Wells Fargo Funds Management, LLC since 2011. Chief Operating Officer and Chief Compliance Officer at LightBox Capital Management LLC, from 2008 to 2011. |
| | |
Michelle Rhee
(Born 1966) | | Chief Legal Officer,
since 2019 | | Secretary of Wells Fargo Funds Management, LLC, Chief Legal Counsel of Wells Fargo Asset Management and Assistant General Counsel of Wells Fargo Bank, N.A. since 2018. Associate General Counsel and Managing Director of Bank of America Corporation from 2004 to 2018. |
| | |
| Catherine Kennedy (Born 1969) | | Secretary,
since 2019 | | Vice President of Wells Fargo Funds Management, LLC and Senior Counsel of the Wells Fargo Legal Department since 2010. Vice President and Senior Counsel of Evergreen Investment Management Company, LLC from 1998 to 2010. |
| | |
| Michael H. Whitaker (Born 1967) | | Chief Compliance Officer,
since 2016 | | Chief Compliance Officer of Wells Fargo Asset Management since 2016. Senior Vice President and Chief Compliance Officer for Fidelity Investments from 2007 to 2016. |
| | |
| Jeremy DePalma1 (Born 1974) | | Assistant Treasurer,
since 2009 | | Senior Vice President of Wells Fargo Funds Management, LLC since 2009. Senior Vice President of Evergreen Investment Management Company, LLC from 2008 to 2010 and head of the Fund Reporting and Control Team within Fund Administration from 2005 to 2010. |
| 1 | Nancy Wiser acts as Treasurer of 65 funds in the Fund Complex. Jeremy DePalma acts as the Treasurer of 77 funds and Assistant Treasurer of 65 funds in the Fund Complex. |
| 2 | The Statement of Additional Information includes additional information about the Trustees and is available, without charge, upon request, by calling 1-800-222-8222 or by visiting the website at wfam.com. |
30 | Wells Fargo Fundamental Small Cap Growth Fund
Other information (unaudited)
BOARD CONSIDERATION OF INVESTMENT MANAGEMENT AND SUB-ADVISORY AGREEMENTS:
Wells Fargo Fundamental Small Cap Growth Fund
Under the Investment Company Act of 1940 (the “1940 Act”), the Board of Trustees (the “Board”) of Wells Fargo Funds Trust (the “Trust”) must determine annually whether to approve the continuation of the Trust’s investment management and sub-advisory agreements. In this regard, at a Board meeting held on May 26, 2020 and May 28, 2020 (together, the “Meeting”), the Board, all the members of which have no direct or indirect interest in the investment management and sub-advisory agreements and are not “interested persons” of the Trust, as defined in the 1940 Act (the “Independent Trustees”), reviewed and approved for Wells Fargo Fundamental Small Cap Growth Fund (the “Fund”): (i) an investment management agreement (the “Management Agreement”) with Wells Fargo Funds Management, LLC (“Funds Management”); and (ii) an investment sub-advisory agreement (the “Sub-Advisory Agreement”) with Wells Capital Management Incorporated (the “Sub-Adviser”), an affiliate of Funds Management. The Management Agreement and the Sub-Advisory Agreement are collectively referred to as the “Advisory Agreements.”
At the Meeting, the Board considered the factors and reached the conclusions described below relating to the selection of Funds Management and the Sub-Adviser and the approval of the Advisory Agreements. Prior to the Meeting, including at a Board meeting held in April 2020, the Trustees conferred extensively among themselves and with representatives of Funds Management about these matters. Also, the Board has adopted a team-based approach, with each team consisting of a sub-set of Trustees, to assist the full Board in the discharge of its duties in reviewing investment performance and other matters throughout the year. The Independent Trustees were assisted in their evaluation of the Advisory Agreements by independent legal counsel, from whom they received separate legal advice and with whom they met separately.
In providing information to the Board, Funds Management and the Sub-Adviser were guided by a detailed set of requests for information submitted to them by independent legal counsel on behalf of the Independent Trustees at the start of the Board’s annual contract renewal process earlier in 2020. In considering and approving the Advisory Agreements, the Trustees considered the information they believed relevant, including but not limited to the information discussed below. The Board considered not only the specific information presented in connection with the Meeting, but also the knowledge gained over time through interaction with Funds Management and the Sub-Adviser about various topics. In this regard, the Board reviewed reports of Funds Management at each of its quarterly meetings, which included, among other things, portfolio reviews and investment performance reports. In addition, the Board and the teams mentioned above confer with portfolio managers at various times throughout the year. The Board did not identify any particular information or consideration that was all-important or controlling, and each individual Trustee may have attributed different weights to various factors.
After its deliberations, the Board unanimously approved the continuation of the Advisory Agreements for a one-year term and determined that the compensation payable to Funds Management and the Sub-Adviser under each of the Advisory Agreements was reasonable. The Board considered the approval of the Advisory Agreements for the Fund as part of its consideration of agreements for funds across the complex, but its approvals were made on a fund-by-fund basis. The following summarizes a number of important, but not necessarily all, factors considered by the Board in support of its approvals.
Nature, extent and quality of services
The Board received and considered various information regarding the nature, extent and quality of services provided to the Fund by Funds Management and the Sub-Adviser under the Advisory Agreements. This information included a description of the investment advisory services and Fund-level administrative services covered by the Management Agreement, as well as, among other things, a summary of the background and experience of senior management of Wells Fargo Asset Management (“WFAM”), of which Funds Management and the Sub-Adviser are a part, and a summary of investments made in the business of WFAM. The Board also received a description of Funds Management’s and the Sub-Adviser’s business continuity plans and of their approaches to data privacy and cybersecurity, and related testing. The Board also received and reviewed information about Funds Management’s role as administrator of the Fund’s liquidity risk management program, Funds Management’s approach to risk management, and Funds Management’s intermediary and vendor oversight program.
The Board also considered the qualifications, background, tenure and responsibilities of each of the portfolio managers primarily responsible for the day-to-day portfolio management of the Fund. The Board evaluated the ability of Funds Management and the Sub-Adviser to attract and retain qualified investment professionals, including research, advisory and supervisory personnel. The Board further considered the compliance programs and compliance records of Funds Management and the Sub-Adviser. In addition, the Board took into account the full range of services provided to the Fund by Funds Management and its affiliates.
Wells Fargo Fundamental Small Cap Growth Fund | 31
Other information (unaudited)
Fund investment performance and expenses
The Board considered the investment performance results for the Fund over various time periods ended December 31, 2019. The Board also considered more current results for various time periods ended March 31, 2020. The Board considered these results in comparison to the investment performance of funds in a universe that was determined by Broadridge Inc. (“Broadridge”) to be similar to the Fund (the “Universe”), and in comparison to the Fund’s benchmark index and to other comparative data. Broadridge is an independent provider of investment company data. The Board received a description of the methodology used by Broadridge to select the mutual funds in the performance Universe. The Board noted that the investment performance of the Fund (Class A) was higher than or in range of the average investment performance of the Universe for the one-, three-, five- and ten-year periods ended December 31, 2019. The Board also noted that the investment performance of the Fund (Administrator Class) was higher than the average investment performance of the Universe for all periods ended March 31, 2020. The Board also noted that the investment performance of the Fund was higher than or in range of its benchmark index, the Russell 2000® Growth Index, for all periods ended December 31, 2019. The Board also noted that the investment performance of the Fund was higher than its benchmark index, the Russell 2000® Growth Index, for all periods ended March 31, 2020.
The Board also received and considered information regarding the Fund’s net operating expense ratios and their various components, including actual management fees, custodian and other non-management fees, and Rule 12b-1 and non-Rule 12b-1 shareholder service fees. The Board considered these ratios in comparison to the median ratios of funds in class-specific expense groups that were determined by Broadridge to be similar to the Fund (the “Groups”). The Board received a description of the methodology used by Broadridge to select the mutual funds in the expense Groups and an explanation of how funds comprising expense groups and their expense ratios may vary from year-to-year. Based on the Broadridge reports, the Board noted that the net operating expense ratios of the Fund were lower than or in range of the median net operating expense ratios of the expense Groups for each share class.
The Board took into account the Fund’s investment performance and expense information provided to it among the factors considered in deciding to re-approve the Advisory Agreements.
Investment management and sub-advisory fee rates
The Board reviewed and considered the contractual fee rates payable by the Fund to Funds Management under the Management Agreement, as well as the contractual fee rates payable by the Fund to Funds Management for class-level administrative services under a Class-Level Administration Agreement, which include, among other things, class-level transfer agency and sub-transfer agency costs (collectively, the “Management Rates”). The Board also reviewed and considered the contractual investment sub-advisory fee rates that are payable by Funds Management to the Sub-Adviser for investment sub-advisory services.
Among other information reviewed by the Board was a comparison of the Fund’s Management Rates with the average contractual investment management fee rates of funds in the expense Groups at a common asset level as well as transfer agency costs of the funds in the expense Groups. The Board noted that the Management Rates of the Fund were in range of the sum of these average rates for the Fund’s expense Groups for all share classes, except the Administrator Class. The Board noted that the Management Rate of the Fund was higher than the sum of these average rates for the Fund’s expense Groups for the Administrator Class. The Board noted that the Fund’s expense ratio cap for the Administrator Class had been lowered in 2018. The Board also noted the Fund’s expense ratio caps would be maintained.
The Board also received and considered information about the portion of the total management fee that was retained by Funds Management after payment of the fee to the Sub-Adviser for sub-advisory services. In assessing the reasonableness of this amount, the Board received and evaluated information about the nature and extent of responsibilities retained and risks assumed by Funds Management and not delegated to or assumed by the Sub-Adviser, and about Funds Management’s on-going oversight services. Given the affiliation between Funds Management and the Sub-Adviser, the Board ascribed limited relevance to the allocation of fees between them.
The Board also received and considered information about the nature and extent of services offered and fee rates charged by Funds Management and the Sub-Adviser to other types of clients with investment strategies similar to those of the Fund. In this regard, the Board received information about the significantly greater scope of services, and compliance, reporting and other legal burdens and risks of managing proprietary mutual funds compared with those associated with managing assets of other types of clients, including third-party sub-advised fund clients and non-mutual fund clients such as institutional separate accounts.
Based on its consideration of the factors and information it deemed relevant, including those described here, the Board determined that the compensation payable to Funds Management under the Management Agreement and to the Sub-Adviser under the Sub-Advisory Agreement was reasonable.
32 | Wells Fargo Fundamental Small Cap Growth Fund
Other information (unaudited)
Profitability
The Board received and considered information concerning the profitability of Funds Management, as well as the profitability of both WFAM and Wells Fargo & Co. (“Wells Fargo”) from providing services to the fund family as a whole. The Board noted that the Sub-Adviser’s profitability information with respect to providing services to the Fund and other funds in the family was subsumed in the WFAM and Wells Fargo profitability analysis.
Funds Management reported on the methodologies and estimates used in calculating profitability, including a description of the methodology used to allocate certain expenses. Among other things, the Board noted that the levels of profitability reported on a fund-by-fund basis varied widely, depending on factors such as the size, type and age of fund.
Based on its review, the Board did not deem the profits reported by Funds Management, WFAM or Wells Fargo from services provided to the Fund to be at a level that would prevent it from approving the continuation of the Advisory Agreements.
Economies of scale
The Board received and considered information about the potential for Funds Management to experience economies of scale in the provision of management services to the Fund, the difficulties of calculating economies of scale at an individual fund level, and the extent to which potential scale benefits are shared with shareholders. The Board noted the existence of breakpoints in the Fund’s management fee structure, which operate generally to reduce the Fund’s expense ratios as the Fund grows in size, and the size of the Fund in relation to such breakpoints. The Board considered that in addition to management fee breakpoints, Funds Management shares potential economies of scale from its management business in a variety of ways, including through fee waiver and expense reimbursement arrangements, services that benefit shareholders, competitive management fee rates set at the outset without regard to breakpoints, and investments in the business intended to enhance services available to shareholders.
The Board concluded that Funds Management’s arrangements with respect to the Fund, including contractual breakpoints, constituted a reasonable approach to sharing potential economies of scale with the Fund and its shareholders.
Other benefits to Funds Management and the Sub-Adviser
The Board received and considered information regarding potential “fall-out” or ancillary benefits received by Funds Management and its affiliates, including the Sub-Adviser, as a result of their relationships with the Fund. Ancillary benefits could include, among others, benefits directly attributable to other relationships with the Fund and benefits potentially derived from an increase in Funds Management’s and the Sub-Adviser’s business as a result of their relationships with the Fund. The Board noted that various affiliates of Funds Management may receive distribution-related fees, shareholder servicing payments and sub-transfer agency fees in respect of shares sold or held through them and services provided.
The Board also reviewed information about soft dollar credits earned and utilized by the Sub-Adviser, fees earned by Funds Management and the Sub-Adviser from managing a private investment vehicle for the fund family’s securities lending collateral, and commissions earned by an affiliated broker from portfolio transactions.
Based on its consideration of the factors and information it deemed relevant, including those described here, the Board did not find that any ancillary benefits received by Funds Management and its affiliates, including the Sub-Adviser, were unreasonable.
Conclusion
At the Meeting, after considering the above-described factors and based on its deliberations and its evaluation of the information described above, the Board unanimously approved the continuation of the Advisory Agreements for a one-year term and determined that the compensation payable to Funds Management and the Sub-Adviser under each of the Advisory Agreements was reasonable.
Wells Fargo Fundamental Small Cap Growth Fund | 33
Other information (unaudited)
LIQUIDITY RISK MANAGEMENT PROGRAM
In accordance with Rule 22e-4 under the Investment Company Act of 1940, as amended (the “Liquidity Rule”), Wells Fargo Funds Trust (the “Trust”) has adopted and implemented a liquidity risk management program (the “Program”) on behalf of each of its series, including the Fund, which is reasonably designed to assess and manage the Fund’s liquidity risk. “Liquidity risk” is defined as the risk that the Fund is unable to meet redemption requests without significantly diluting remaining investors’ interests in the Fund. The Trust’s Board of Trustees (the “Board”) previously approved the designation of Wells Fargo Funds Management, LLC (“Funds Management”), the Fund’s investment manager, as the administrator of the Program, and Funds Management has established a Liquidity Risk Management Council composed of personnel from multiple departments within Funds Management and its affiliates to assist Funds Management in the implementation and on-going administration of the Program.
The Program is comprised of various components designed to support the assessment and/or management of liquidity risk, including: (1) the periodic assessment (no less frequently than annually) of certain factors that influence the Fund’s liquidity risk; (2) the periodic classification (no less frequently than monthly) of the Fund’s investments into one of four liquidity categories that reflect an estimate of their liquidity under current market conditions; (3) a 15% limit on the acquisition of “illiquid investments” (as defined under the Liquidity Rule); (4) to the extent the Fund does not invest primarily in “highly liquid investments” (as defined under the Liquidity Rule), the determination of a minimum percentage of the Fund’s assets that generally will be invested in highly liquid investments (an “HLIM”); (5) if the Fund has established an HLIM, the periodic review (no less frequently than annually) of the HLIM and the adoption of policies and procedures for responding to a shortfall of the Fund’s “highly liquid investments” below its HLIM; and (6) periodic reporting to the Board.
At a meeting of the Board held on May 26 and 28, 2020, the Board received a written report (the “Report”) from Funds Management that addressed the operation of the Program and assessed its adequacy and effectiveness of implementation. The Report covered the initial period from December 1, 2018 through December 31, 2019 (the “Reporting Period”). No significant liquidity events impacting the Fund were noted in the Report. There were no material changes to the Program during the Reporting Period. The Report concluded that the Program is operating effectively to assess and manage the Fund’s liquidity risk, and that the Program has been and continues to be adequately and effectively implemented to monitor and, as applicable, respond to the Fund’s liquidity developments.
There can be no assurance that the Program will achieve its objectives under all circumstances in the future. Please refer to the Fund’s prospectus for more information regarding the Fund’s exposure to liquidity risk and other risks to which an investment in the Fund may be subject.
34 | Wells Fargo Fundamental Small Cap Growth Fund
Appendix I (unaudited)
Effective June 1, 2020, shareholders purchasing Fund shares through an Oppenheimer & Co. Inc. (“Oppenheimer”) platform or account are eligible only for the following load waivers (front-end sales charge waivers and contingent deferred or back-end, sales charge waivers) and discounts, which may differ from those disclosed in the Fund’s Prospectus or SAI.
|
Front-end Sales Load Waivers on Class A Shares available at Oppenheimer |
|
| Employer-sponsored retirement, deferred compensation and employee benefit plans (including health savings accounts) and trusts used to fund those plans, provided that the shares are not held in a commission-based brokerage account and shares are held for the benefit of the plan. |
|
| Shares purchased by or through a 529 Plan. |
|
| Shares purchased through an Oppenheimer affiliated investment advisory program. |
|
| Shares purchased through reinvestment of capital gains distributions and dividend reinvestment when purchasing shares of the same fund (but not any other fund within the fund family). |
|
| Shares purchased from the proceeds of redemptions within the same fund family, provided (1) the repurchase occurs within 90 days following the redemption, (2) the redemption and purchase occur in the same account, and (3) redeemed shares were subject to a front-end or deferred sales load (known as Rights of Restatement). |
|
| A shareholder in the Fund’s Class C shares will have their shares exchanged at net asset value to Class A shares (or the appropriate share class) of the Fund if the shares are no longer subject to a CDSC and the exchange is in line with the policies and procedures of Oppenheimer. |
|
| Employees and registered representatives of Oppenheimer or its affiliates and their family members. |
|
Directors or Trustees of the Fund, and employees of the Fund’s investment adviser or any of its affiliates, as described in the Prospectus. |
| CDSC Waivers on A and C Shares available at Oppenheimer |
|
| Death or disability of the shareholder. |
|
| Shares sold as part of a systematic withdrawal plan as described in the Prospectus. |
|
| Return of excess contributions from an IRA Account. |
|
| Shares sold as part of a required minimum distribution for IRA and retirement accounts due to the shareholder reaching the qualified age based on applicable IRS regulations as described in the Prospectus. |
|
| Shares sold to pay Oppenheimer fees but only if the transaction is initiated by Oppenheimer. |
|
Shares acquired through a right of reinstatement. |
| Front-end load Discounts Available at Oppenheimer: Breakpoints, Rights of Accumulation & Letters of Intent |
|
| Breakpoints as described in the Prospectus. |
|
| Rights of Accumulation (ROA), which entitle shareholders to breakpoint discounts, will be automatically calculated based on the aggregated holding of fund family assets held by accounts within the purchaser’s household at Oppenheimer. Eligible fund family assets not held at Oppenheimer may be included in the ROA calculation only if the shareholder notifies his or her financial advisor about such assets. |
Wells Fargo Fundamental Small Cap Growth Fund | 35
Appendix II (unaudited)
Effective June 15, 2020, shareholders purchasing fund shares through a Robert W. Baird & Co. (“Baird”) platform or account will only be eligible for the following sales charge waivers (front-end sales charge waivers and CDSC waivers) and discounts, which may differ from those disclosed elsewhere in the Fund’s Prospectus or the SAI.
|
Front-end Sales Load Waivers on Class A Shares available at Baird |
|
| Shares purchased through reinvestment of capital gains distributions and dividend reinvestment when purchasing share of the same fund. |
|
| Share purchase by employees and registers representatives of Baird or its affiliate and their family members as designated by Baird. |
|
| Shares purchase from the proceeds of redemptions within the same fund family, provided (1) the repurchase occurs within 90 days following the redemption, (2) the redemption and purchase occur in the same accounts, and (3) redeemed shares were subject to a front-end or deferred sales charge (known as rights of reinstatement). |
|
| A shareholder in the Funds Investor C Shares will have their share exchanged at net asset value to Investor A shares of the fund if the shares are no longer subject to CDSC and the exchange is in line with the policies and procedures of Baird. |
|
Employer-sponsored retirement plans or charitable accounts in a transactional brokerage account at Baird, including 401(k)plans, 457 plans, employer-sponsored 403(b) plans, profit sharing and money purchase pension plans and defined benefit plans. For purposes of this provision, employer-sponsored retirement plans do not include SEP IRAs, Simple IRAs or SAR-SEPs. |
| CDSC Waivers on A and C Shares available at Baird |
|
| Shares sold due to death or disability of the shareholder. |
|
| Shares sold as part of a systematic withdrawal plan as described in the Fund’s Prospectus. |
|
| Shares bought due to returns of excess contributions from an IRA Account. |
|
| Shares sold as part of a required minimum distribution for IRA and retirement accounts due to the shareholder reaching age 72as described in the Fund’s Prospectus. |
|
| Shares sold to pay Baird fees but only if the transaction is initiated by Baird. |
|
Shares acquired through a right of reinstatement. |
| Front-end load Discounts Available at Baird: Breakpoint and/or Rights of Accumulation |
|
| Breakpoints as described in the Prospectus. |
|
| Rights of accumulations which entitles shareholders to breakpoint discounts will be automatically calculated based on the aggregated holding of fund family assets held by accounts within the purchaser’s household at Baird. Eligible fund family assets not held at Baird may be included in the rights of accumulations calculation only if the shareholder notifies his or her financial advisor about such assets. |
|
| Letters of Intent (LOI) allow for breakpoint discounts based on anticipated purchases within a fund family through Baird, over a13-month period of time. |
36 | Wells Fargo Fundamental Small Cap Growth Fund

For more information
More information about Wells Fargo Funds is available free upon request. To obtain literature, please write, visit the Fund’s website, or call:
Wells Fargo Funds
P.O. Box 219967
Kansas City, MO 64121-9967
Website: wfam.com
Individual investors: 1-800-222-8222
Retail investment professionals: 1-888-877-9275
Institutional investment professionals: 1-866-765-0778

This report and the financial statements contained herein are submitted for the general information of the shareholders of the Fund. If this report is used for promotional purposes, distribution of the report must be accompanied or preceded by a current prospectus. Before investing, please consider the investment objectives, risks, charges, and expenses of the investment. For a current prospectus and, if available, a summary prospectus, containing this information, call 1-800-222-8222 or visit the Fund’s website at wfam.com. Read the prospectus carefully before you invest or send money.
Wells Fargo Asset Management (WFAM) is the trade name for certain investment advisory/management firms owned by Wells Fargo & Company. These firms include but are not limited to Wells Capital Management Incorporated and Wells Fargo Funds Management, LLC. Certain products managed by WFAM entities are distributed by Wells Fargo Funds Distributor, LLC (a broker-dealer and Member FINRA).
This material is for general informational and educational purposes only and is NOT intended to provide investment advice or a recommendation of any kind—including a recommendation for any specific investment, strategy, or plan.
INVESTMENT PRODUCTS: NOT FDIC INSURED ◾ NO BANK GUARANTEE ◾ MAY LOSE VALUE
© 2020 Wells Fargo & Company. All rights reserved.
PAR-1020-00580 11-20
SA247/SAR247 09-20
Semi-Annual Report
September 30, 2020
Wells Fargo
Intrinsic Small Cap Value Fund
Beginning on January 1, 2021, as permitted by new regulations adopted by the Securities and Exchange Commission, paper copies of the Wells Fargo Funds’ annual and semi-annual shareholder reports issued after this date will no longer be sent by mail, unless you specifically request paper copies of the reports. Instead, the reports will be made available on the Funds’ website, and you will be notified by mail each time a report is posted and provided with a website address to access the report.
If you already elected to receive shareholder reports electronically, you will not be affected by this change and you need not take any action. You may elect to receive shareholder reports and other communications from the Fund electronically at any time by contacting your financial intermediary (such as a broker-dealer or bank) or, if you are a direct investor, by calling 1-800-222-8222 or by enrolling at wellsfargo.com/advantagedelivery.
You may elect to receive all future reports in paper free of charge. If you invest through a financial intermediary, you can contact your financial intermediary to request that you continue to receive paper copies of your shareholder reports; if you invest directly with the Fund, you can call 1-800-222-8222. Your election to receive reports in paper will apply to all Wells Fargo Funds held in your account with your financial intermediary or, if you are a direct investor, to all Wells Fargo Funds that you hold.
|
|
|
Reduce clutter. Save trees. |
Sign up for electronic delivery of prospectuses and shareholder reports at wellsfargo.com/
advantagedelivery |
The views expressed and any forward-looking statements are as of September 30, 2020, unless otherwise noted, and are those of the Fund’s portfolio managers and/or Wells Fargo Asset Management. Discussions of individual securities, or the markets generally, or any Wells Fargo Fund are not intended as individual recommendations. Future events or results may vary significantly from those expressed in any forward-looking statements. The views expressed are subject to change at any time in response to changing circumstances in the market. Wells Fargo Asset Management and the Fund disclaim any obligation to publicly update or revise any views expressed or forward-looking statements.
INVESTMENT PRODUCTS: NOT FDIC INSURED ◾ NO BANK GUARANTEE ◾ MAY LOSE VALUE
Wells Fargo Intrinsic Small Cap Value Fund | 1
Letter to shareholders (unaudited)

Andrew Owen
President
Wells Fargo Funds
“As the six-month period began in April, markets rebounded strongly from an earlier sharp sell-off, fueled by unprecedented government and central bank stimulus measures.”
Dear Shareholder:
We are pleased to offer you this semi-annual report for the Wells Fargo Intrinsic Small Cap Value Fund for the six-month period that ended September 30, 2020. Global stock markets experienced unprecedented volatility in response to drastic government measures to stop the spread of COVID-19 at the expense of short-term economic output. However, financial markets rebounded from April on to more than offset earlier losses as central banks bolstered capital markets and confidence. Stocks rallied broadly with U.S. equities leading the way while bonds had more modest returns for the six-month period.
For the period, U.S. stocks, based on the S&P 500 Index,1 returned 31.31% and international stocks, as measured by the MSCI ACWI ex USA Index (Net),2 gained 23.38%. The MSCI EM Index (Net)3 gained a robust 29.37%. Among bond investments, the Bloomberg Barclays U.S. Aggregate Bond Index4 added 3.53%, the Bloomberg Barclays Global Aggregate ex-USD Index5 returned 7.66%, the Bloomberg Barclays Municipal Bond Index6 had a 3.99% return, and the ICE BofA U.S. High Yield Index7 gained 14.76%.
Concerns about COVID-19 took over the market.
As the six-month period began in April, markets rebounded strongly from an earlier sharp sell-off, fueled by unprecedented government and central bank stimulus measures. The U.S. economy contracted by an annualized 5.0% pace in the first quarter, with 30 million new unemployment insurance claims in six weeks. In the eurozone, first-quarter real gross domestic product (GDP) shrank 3.8%, with the composite April Flash Purchasing Managers’ Index (PMI), a monthly survey of purchasing managers, falling to an all-time low of 13.5. The European Central Bank expanded its quantitative easing to include the purchase of additional government bonds of countries with the greatest virus-related need, including Italy and Spain. China’s first-quarter GDP fell by 6.8% year over year. However, retail sales, production, and investment showed signs of recovery. Extreme oil-price volatility continued as global supply far exceeded demand.
The equity market rebound continued in May, with widespread strong monthly gains. Investors regained confidence on reports of early signs of success in human trials of a COVID-19 vaccine. Growth stocks continued to outperform value stocks while returns on global government bonds were generally flat. In the U.S., a gap grew between the stock market rebound and devastating economic data points, including an April unemployment rate of 14.7%, the highest level since World War II. PMIs continued to reflect weakening activity in May in both the manufacturing and services sectors. U.S.
| 1 | The S&P 500 Index consists of 500 stocks chosen for market size, liquidity, and industry group representation. It is a market-value-weighted index with each stock’s weight in the index proportionate to its market value. You cannot invest directly in an index. |
| 2 | The Morgan Stanley Capital International (MSCI) All Country World Index (ACWI) ex USA Index (Net) is a free-float-adjusted market-capitalization-weighted index that is designed to measure the equity market performance of developed and emerging markets, excluding the United States. Source: MSCI. MSCI makes no express or implied warranties or representations and shall have no liability whatsoever with respect to any MSCI data contained herein. The MSCI data may not be further redistributed or used as a basis for other indices or any securities or financial products. This report is not approved, reviewed, or produced by MSCI. You cannot invest directly in an index. |
| 3 | The MSCI Emerging Markets (EM) Index (Net) is a free-float-adjusted market-capitalization-weighted index that is designed to measure equity market performance of emerging markets. You cannot invest directly in an index. |
| 4 | The Bloomberg Barclays U.S. Aggregate Bond Index is a broad-based benchmark that measures the investment-grade, U.S. dollar-denominated, fixed-rate taxable bond market, including Treasuries, government-related and corporate securities, mortgage-backed securities (agency fixed-rate and hybrid adjustable-rate mortgage pass-throughs), asset-backed securities, and commercial mortgage-backed securities. You cannot invest directly in an index. |
| 5 | The Bloomberg Barclays Global Aggregate ex-USD Index is an unmanaged index that provides a broad-based measure of the global investment-grade fixed-income markets excluding the U.S. dollar-denominated debt market. You cannot invest directly in an index. |
| 6 | The Bloomberg Barclays Municipal Bond Index is an unmanaged index composed of long-term tax-exempt bonds with a minimum credit rating of Baa. You cannot invest directly in an index. |
| 7 | The ICE BofA U.S. High Yield Index is a market-capitalization-weighted index of domestic and Yankee high-yield bonds. The index tracks the performance of high-yield securities traded in the U.S. bond market. You cannot invest directly in an index. Copyright 2020. ICE Data Indices, LLC. All rights reserved. |
2 | Wells Fargo Intrinsic Small Cap Value Fund
Letter to shareholders (unaudited)
corporate earnings reports indicated a 14% year-over-year contraction in earnings from the first quarter of 2019. However, high demand for technology, driven by remote activity, helped maintain robust information technology sector earnings, which helped drive leading technology stocks higher.
Financial markets posted widely positive returns in June despite ongoing economic weakness and high levels of uncertainty on the containment of COVID-19 and the timing of an effective vaccine. There were hopeful signs as economies reopened, with U.S. and U.K. retail sales rebounding sharply in May. However, year over year, sales remained depressed. Vitally important to market sentiment was the ongoing commitment by central banks globally to do all they could to provide economic support through liquidity and low borrowing costs. U.S. economic activity was aided by one-time $1,200 stimulus checks and $600 bonus weekly unemployment benefits that expired at the end of July. However, unemployment remained historically high but eased from 14.7% in April to 11.1% in June. At month-end, numerous states reported increases in COVID-19 cases. China’s economic recovery picked up momentum in June, though it remained far from a full recovery.
July was a broadly positive month for both global equities and fixed income. However, economic data and a resurgence of COVID-19 cases pointed to the vulnerability of the global economy and the ongoing imperative to regain control of the pandemic. Second-quarter GDP shrank from the previous quarter by 9.5% and 12.1% in the U.S. and the eurozone, respectively. In contrast, China reported a 3.2% year-over-year expansion in its second-quarter GDP. U.S. unemployment remained high despite adding 1.8 million jobs in July, with a double-digit jobless rate persisting. However, manufacturing activity grew in both the U.S. and the eurozone. In Asia, while China’s manufacturing sector continued to expand, activity in Japan and South Korea contracted. In July, a rising concern was the rapid and broad reemergence of COVID-19 infections.
The stock market continued to rally in August despite concerns over rising numbers of COVID-19 cases in the United States and several European countries, including France and Spain, as well as the expiration of the $600 weekly bonus unemployment benefit at the end of July. U.S. stocks had strong monthly gains, led by the FAANG stocks—Facebook, Apple, Amazon, Netflix, and Google (Alphabet)—which dominate these indices and continued to rally. U.S. stocks generally surpassed other broadly positive global equity performance while fixed-income market monthly returns were broadly flat. Generally stronger-than-expected second-quarter earnings boosted investor sentiment along with the U.S. Federal Reserve’s announcement of a policy shift that will likely lead to longer-term low interest rates and supportive monetary policy. The U.S. flash PMIs for both manufacturing and services beat expectations while U.S. housing market indicators were strong. In Europe, retail sales expanded and consumer confidence remained steady. Overall, developed markets performed better than emerging market equities for the month of August as people took comfort in better-known equities in perceived safer markets.
Stocks grew more volatile in September on mixed economic data. U.S. PMIs showed solid growth in economic activity in both manufacturing and services. However, six months after the bottom fell out of the labor market in the early spring, only half of the 22 million jobs lost had returned. The U.S. unemployment rate fell to 7.9% in September, the fifth straight month of improvement but far higher than the 3.5% pre-COVID-19 rate. Only 661,000 jobs were added for the month, down from 1.5 million in August. Meanwhile, a reported 2.3 million people have given up looking for work. With U.S. Congress failing to pass further fiscal relief and uncertainties surrounding a possible vaccine, doubts crept back into the financial markets. In the U.K., a lack of progress in Brexit talks with the European Union weighed on markets. China’s economy picked up steam, however, with growth fueled by increased global demand and China’s service sector had its strongest PMI reading in seven years.
“The stock market continued to rally in August despite concerns over rising numbers of COVID-19 cases in the United States and several European countries, including France and Spain, as well as the expiration of the $600 weekly bonus unemployment benefit at the end of July.”
Wells Fargo Intrinsic Small Cap Value Fund | 3
Letter to shareholders (unaudited)
|
|
|
For further information about your Fund, contact your investment professional, visit our website at wfam.com, or call us directly at 1-800-222-8222. |
Don’t let short-term uncertainty derail long-term investment goals.
Periods of investment uncertainty can present challenges, but experience has taught us that maintaining long-term investment goals can be an effective way to plan for the future. To help you create a sound strategy based on your personal goals and risk tolerance, Wells Fargo Funds offers more than 100 mutual funds spanning a wide range of asset classes and investment styles. Although diversification cannot guarantee an investment profit or prevent losses, we believe it can be an effective way to manage investment risk and potentially smooth out overall portfolio performance. We encourage investors to know their investments and to understand that appropriate levels of risk-taking may unlock opportunities.
Thank you for choosing to invest with Wells Fargo Funds. We appreciate your confidence in us and remain committed to helping you meet your financial needs.
Sincerely,

Andrew Owen
President
Wells Fargo Funds
Notice to Shareholders
At a meeting held on August 10-12, 2020, the Board of Trustees of the Fund approved a change to the Fund’s automatic conversion feature for Class C shares in order to shorten the required holding period from 10 to 8 years. As a result, on a monthly basis beginning November 5, 2020, Class C shares will convert automatically into Class A shares 8 years after the initial date of purchase or, if you acquired your Class C shares through an exchange or conversion from another share class, 8 years after the date you acquired your Class C shares. When Class C shares that you acquired through a purchase or exchange convert, any other Class C shares that you purchased with reinvested dividends and distributions also will convert into Class A shares on a pro rata basis.
Please note that a shorter holding period may apply depending on your intermediary. Please see “Appendix A—Sales Charge Reductions and Waivers for Certain Intermediaries” in the Fund’s prospectus for further information.
4 | Wells Fargo Intrinsic Small Cap Value Fund
This page is intentionally left blank.
Performance highlights (unaudited)
Investment objective
The Fund seeks long-term capital appreciation.
Manager
Wells Fargo Funds Management, LLC
Subadviser
Wells Capital Management Incorporated
Portfolio managers
Christopher G. Miller, CFA®‡
Theran Motl, CFA®‡
Average annual total returns (%) as of September 30, 2020
| | | | | | | | | | | | | | | | | | | | | | | | | | | | | | | | | | |
| | | | |
| | | | | Including sales charge | | | Excluding sales charge | | | Expense ratios1 (%) | |
| | | | | | | | | |
| | | Inception date | | 1 year | | | 5 year | | | 10 year | | | 1 year | | | 5 year | | | 10 year | | | Gross | | | Net2 | |
| | | | | | | | | | |
| Class A (WFSMX) | | 3-31-2008 | | | -12.91 | | | | 3.32 | | | | 7.54 | | | | -7.60 | | | | 4.55 | | | | 8.18 | | | | 1.60 | | | | 1.35 | |
| | | | | | | | | | |
| Class C (WSCDX) | | 3-31-2008 | | | -9.29 | | | | 3.77 | | | | 7.38 | | | | -8.29 | | | | 3.77 | | | | 7.38 | | | | 2.35 | | | | 2.10 | |
| | | | | | | | | | |
| Class R6 (WFSJX)3 | | 5-29-2020 | | | – | | | | – | | | | – | | | | -7.24 | | | | 4.92 | | | | 8.62 | | | | 1.17 | | | | 0.90 | |
| | | | | | | | | | |
| Administrator Class (WFSDX) | | 4-8-2005 | | | – | | | | – | | | | – | | | | -7.46 | | | | 4.71 | | | | 8.39 | | | | 1.52 | | | | 1.20 | |
| | | | | | | | | | |
| Institutional Class (WFSSX) | | 4-8-2005 | | | – | | | | – | | | | – | | | | -7.27 | | | | 4.91 | | | | 8.61 | | | | 1.27 | | | | 1.00 | |
| | | | | | | | | | |
| Russell 2000® Value Index4 | | – | | | – | | | | – | | | | – | | | | -14.88 | | | | 4.11 | | | | 7.09 | | | | – | | | | – | |
| | | | | | | | | | |
| Russell 2000® Index5 | | – | | | – | | | | – | | | | – | | | | 0.39 | | | | 8.00 | | | | 9.85 | | | | – | | | | – | |
Figures quoted represent past performance, which is no guarantee of future results, and do not reflect taxes that a shareholder may pay on an investment in a fund. Investment return and principal value of an investment will fluctuate so that an investor’s shares, when redeemed, may be worth more or less than their original cost. Performance shown without sales charges would be lower if sales charges were reflected. Current performance may be lower or higher than the performance data quoted, which assumes the reinvestment of dividends and capital gains. Current month-end performance is available on the Fund’s website, wfam.com.
Index returns do not include transaction costs associated with buying and selling securities, any mutual fund fees or expenses, or any taxes. It is not possible to invest directly in an index.
For Class A shares, the maximum front-end sales charge is 5.75%. For Class C shares, the maximum contingent deferred sales charge is 1.00%. Performance including a contingent deferred sales charge assumes the sales charge for the corresponding time period. Class R6, Administrator Class, and Institutional Class shares are sold without a front-end sales charge or contingent deferred sales charge.
Stock values fluctuate in response to the activities of individual companies and general market and economic conditions. Smaller-company stocks tend to be more volatile and less liquid than those of larger companies. Certain investment strategies tend to increase the total risk of an investment (relative to the broader market). Consult the Fund’s prospectus for additional information on these and other risks.
Please see footnotes on page 7.
6 | Wells Fargo Intrinsic Small Cap Value Fund
Performance highlights (unaudited)
| | | | |
| |
| Ten largest holdings (%) as of September 30, 20206 | | | |
| | |
Masonite International Corporation | | | 3.31 | |
| | |
SPX Corporation | | | 2.93 | |
| | |
CoreSite Realty Corporation | | | 2.62 | |
| | |
Bio-Rad Laboratories Incorporated Class A | | | 2.45 | |
| | |
Nomad Foods Limited | | | 2.43 | |
| | |
Four Corners Property Trust Incorporated | | | 2.35 | |
| | |
STAG Industrial Incorporated | | | 2.16 | |
| | |
Essent Group Limited | | | 2.13 | |
| | |
SYNNEX Corporation | | | 2.05 | |
| | |
CNO Financial Group Incorporated | | | 2.04 | |
|
|
| Sector allocation as of September 30, 20207 |
|
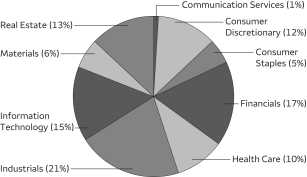
|
| ‡ | CFA® and Chartered Financial Analyst® are trademarks owned by CFA Institute. |
| 1 | Reflects the expense ratios as stated in the most recent prospectuses. The expense ratios shown are subject to change and may differ from the annualized expense ratios shown in the financial highlights of this report. |
| 2 | The manager has contractually committed through July 31, 2021, to waive fees and/or reimburse expenses to the extent necessary to cap total annual fund operating expenses after fee waivers at 1.35% for Class A, 2.10% for Class C, 0.90% for Class R6, 1.20% for Administrator Class, and 1.00% for Institutional Class. Brokerage commissions, stamp duty fees, interest, taxes, acquired fund fees and expenses (if any), and extraordinary expenses are excluded from the expense caps. Prior to or after the commitment expiration date, the caps may be increased or the commitment to maintain the caps may be terminated only with the approval of the Board of Trustees. Without these caps, the Fund’s returns would have been lower. The expense ratio paid by an investor is the net expense ratio (the total annual fund operating expenses after fee waivers) as stated in the prospectuses. |
| 3 | Historical performance shown for the Class R6 shares prior to their inception reflects the performance of the Institutional Class shares, and includes the higher expenses applicable to the Institutional Class shares. If these expenses had not been included, returns for the Class R6 shares would be higher. |
| 4 | The Russell 2000® Value Index measures the performance of those Russell 2000 companies with lower price/book ratios and lower forecasted growth values. You cannot invest directly in an index. |
| 5 | The Russell 2000® Index measures the performance of the 2,000 smallest companies in the Russell 3000® Index, which represents approximately 8% of the total market capitalization of the Russell 3000® Index. You cannot invest directly in an index. |
| 6 | The ten largest holdings, excluding cash, cash equivalents and any money market funds, are calculated based on the value of the investments divided by total net assets of the Fund. Holdings are subject to change and may have changed since the date specified. |
| 7 | Amounts are calculated based on the total long-term investments of the Fund. These amounts are subject to change and may have changed since the date specified. |
Wells Fargo Intrinsic Small Cap Value Fund | 7
Fund expenses (unaudited)
As a shareholder of the Fund, you incur two types of costs: (1) transaction costs, including sales charges (loads) on purchase payments and contingent deferred sales charges (if any) on redemptions and (2) ongoing costs, including management fees, distribution (12b-1) and/or shareholder servicing fees, and other Fund expenses. This example is intended to help you understand your ongoing costs (in dollars) of investing in the Fund and to compare these costs with the ongoing costs of investing in other mutual funds.
The example is based on an investment of $1,000 invested at the beginning of the six-month period and held for the entire period from April 1, 2020 to September 30, 2020.
Actual expenses
The “Actual” line of the table below provides information about actual account values and actual expenses. You may use the information in this line, together with the amount you invested, to estimate the expenses that you paid over the period. Simply divide your account value by $1,000 (for example, an $8,600 account value divided by $1,000 = 8.6), then multiply the result by the number in the “Actual” line under the heading entitled “Expenses paid during period” for your applicable class of shares to estimate the expenses you paid on your account during this period.
Hypothetical example for comparison purposes
The “Hypothetical” line of the table below provides information about hypothetical account values and hypothetical expenses based on the Fund’s actual expense ratio and an assumed rate of return of 5% per year before expenses, which is not the Fund’s actual return. The hypothetical account values and expenses may not be used to estimate the actual ending account balance or expenses you paid for the period. You may use this information to compare the ongoing costs of investing in the Fund and other funds. To do so, compare this 5% hypothetical example with the 5% hypothetical examples that appear in the shareholder reports of the other funds.
Please note that the expenses shown in the table are meant to highlight your ongoing costs only and do not reflect any transactional costs, such as sales charges (loads) and contingent deferred sales charges. Therefore, the “Hypothetical” line of the table is useful in comparing ongoing costs only and will not help you determine the relative total costs of owning different funds. In addition, if these transactional costs were included, your costs would have been higher.
| | | | | | | | | | | | | | | | |
| | | Beginning
account value
4-1-2020 | | | Ending
account value
9-30-2020 | | | Expenses
paid during
the period1 | | | Annualized net
expense ratio | |
| | | | | |
Class A | | | | | | | | | | | | | | | | |
| | | | |
Actual | | $ | 1,000.00 | | | $ | 1,342.94 | | | $ | 7.87 | | | | 1.34 | % |
| | | | |
Hypothetical (5% return before expenses) | | $ | 1,000.00 | | | $ | 1,018.35 | | | $ | 6.78 | | | | 1.34 | % |
| | | | | |
Class C | | | | | | | | | | | | | | | | |
| | | | |
Actual | | $ | 1,000.00 | | | $ | 1,337.77 | | | $ | 12.31 | | | | 2.10 | % |
| | | | |
Hypothetical (5% return before expenses) | | $ | 1,000.00 | | | $ | 1,014.54 | | | $ | 10.61 | | | | 2.10 | % |
| | | | | |
Class R6 | | | | | | | | | | | | | | | | |
| | | | |
Actual | | $ | 1,000.00 | | | $ | 1,345.97 | | | $ | 3.50 | | | | 0.90 | % |
| | | | |
Hypothetical (5% return before expenses) | | $ | 1,000.00 | | | $ | 1,013.59 | | | $ | 3.00 | | | | 0.90 | % |
| | | | | |
Administrator Class | | | | | | | | | | | | | | | | |
| | | | |
Actual | | $ | 1,000.00 | | | $ | 1,344.54 | | | $ | 7.05 | | | | 1.20 | % |
| | | | |
Hypothetical (5% return before expenses) | | $ | 1,000.00 | | | $ | 1,019.05 | | | $ | 6.07 | | | | 1.20 | % |
| | | | | |
Institutional Class | | | | | | | | | | | | | | | | |
| | | | |
Actual | | $ | 1,000.00 | | | $ | 1,345.48 | | | $ | 5.88 | | | | 1.00 | % |
| | | | |
Hypothetical (5% return before expenses) | | $ | 1,000.00 | | | $ | 1,020.05 | | | $ | 5.06 | | | | 1.00 | % |
| 1 | Expenses paid is equal to the annualized net expense ratio of each class multiplied by the average account value over the period, multiplied by the number of days in the most recent fiscal half-year divided by the number of days in the fiscal year (to reflect the one-half-year period). |
8 | Wells Fargo Intrinsic Small Cap Value Fund
Portfolio of investments—September 30, 2020 (unaudited)
| | | | | | | | | | | | | | | | |
| | | | | | | | | Shares | | | Value | |
| Common Stocks: 99.47% | |
|
Communication Services: 0.65% | |
|
| Interactive Media & Services: 0.65% | |
Eventbrite Incorporated Class A Ǡ | | | | | | | | | | | 26,760 | | | $ | 290,343 | |
| | | | | | | | | | | | | | | | |
|
Consumer Discretionary: 11.86% | |
|
| Auto Components: 2.45% | |
Dana Incorporated | | | | | | | | | | | 44,603 | | | | 549,509 | |
Gentherm Incorporated † | | | | | | | | | | | 13,375 | | | | 547,038 | |
| | | | |
| | | | | | | | | | | | | | | 1,096,547 | |
| | | | | | | | | | | | | | | | |
|
| Diversified Consumer Services: 1.31% | |
Houghton Mifflin Harcourt Company † | | | | | | | | | | | 60,357 | | | | 104,418 | |
Service Corporation International | | | | | | | | | | | 11,473 | | | | 483,931 | |
| | | | |
| | | | | | | | | | | | | | | 588,349 | |
| | | | | | | | | | | | | | | | |
|
| Hotels, Restaurants & Leisure: 3.21% | |
Jack in the Box Incorporated | | | | | | | | | | | 8,905 | | | | 706,256 | |
Planet Fitness Incorporated Class A † | | | | | | | | | | | 4,427 | | | | 272,792 | |
Playa Hotels & Resorts NV † | | | | | | | | | | | 35,457 | | | | 148,565 | |
Texas Roadhouse Incorporated | | | | | | | | | | | 5,109 | | | | 310,576 | |
| | | | |
| | | | | | | | | | | | | | | 1,438,189 | |
| | | | | | | | | | | | | | | | |
|
| Internet & Direct Marketing Retail: 1.56% | |
Revolve Group Incorporated Ǡ | | | | | | | | | | | 16,787 | | | | 275,810 | |
The RealReal Incorporated † | | | | | | | | | | | 29,194 | | | | 422,437 | |
| | | | |
| | | | | | | | | | | | | | | 698,247 | |
| | | | | | | | | | | | | | | | |
|
| Specialty Retail: 2.28% | |
National Vision Holdings Incorporated † | | | | | | | | | | | 22,163 | | | | 847,513 | |
Urban Outfitters Incorporated † | | | | | | | | | | | 8,289 | | | | 172,494 | |
| | | | |
| | | | | | | | | | | | | | | 1,020,007 | |
| | | | | | | | | | | | | | | | |
|
| Textiles, Apparel & Luxury Goods: 1.05% | |
Carter’s Incorporated | | | | | | | | | | | 5,412 | | | | 468,571 | |
| | | | | | | | | | | | | | | | |
|
Consumer Staples: 5.18% | |
|
| Food Products: 5.18% | |
Nomad Foods Limited † | | | | | | | | | | | 42,645 | | | | 1,086,595 | |
The Simply Good Foods Company † | | | | | | | | | | | 27,923 | | | | 615,702 | |
TreeHouse Foods Incorporated † | | | | | | | | | | | 15,224 | | | | 617,029 | |
| | | | |
| | | | | | | | | | | | | | | 2,319,326 | |
| | | | | | | | | | | | | | | | |
|
Financials: 17.19% | |
|
| Banks: 9.94% | |
Ameris Bancorp | | | | | | | | | | | 21,889 | | | | 498,631 | |
Pinnacle Financial Partners Incorporated | | | | | | | | | | | 13,690 | | | | 487,227 | |
Renasant Corporation | | | | | | | | | | | 15,525 | | | | 352,728 | |
Sterling Bancorp | | | | | | | | | | | 48,277 | | | | 507,874 | |
United Community Bank | | | | | | | | | | | 23,281 | | | | 394,147 | |
Veritex Holdings Incorporated | | | | | | | | | | | 23,834 | | | | 405,893 | |
Webster Financial Corporation | | | | | | | | | | | 23,538 | | | | 621,639 | |
The accompanying notes are an integral part of these financial statements.
Wells Fargo Intrinsic Small Cap Value Fund | 9
Portfolio of investments—September 30, 2020 (unaudited)
| | | | | | | | | | | | | | | | |
| | | | | | | | | Shares | | | Value | |
|
| Banks (continued) | |
Wintrust Financial Corporation | | | | | | | | | | | 15,038 | | | $ | 602,272 | |
Zions Bancorporation | | | | | | | | | | | 19,915 | | | | 581,916 | |
| | | | |
| | | | | | | | | | | | | | | 4,452,327 | |
| | | | | | | | | | | | | | | | |
|
| Insurance: 5.12% | |
Axis Capital Holdings Limited | | | | | | | | | | | 10,825 | | | | 476,733 | |
CNO Financial Group Incorporated | | | | | | | | | | | 57,035 | | | | 914,841 | |
First American Financial Corporation | | | | | | | | | | | 8,970 | | | | 456,663 | |
Reinsurance Group of America Incorporated | | | | | | | | | | | 4,659 | | | | 443,490 | |
| | | | |
| | | | | | | | | | | | | | | 2,291,727 | |
| | | | | | | | | | | | | | | | |
|
| Thrifts & Mortgage Finance: 2.13% | |
Essent Group Limited | | | | | | | | | | | 25,759 | | | | 953,341 | |
| | | | | | | | | | | | | | | | |
|
Health Care: 10.11% | |
|
| Health Care Equipment & Supplies: 6.37% | |
AngioDynamics Incorporated † | | | | | | | | | | | 58,134 | | | | 701,096 | |
Haemonetics Corporation † | | | | | | | | | | | 4,823 | | | | 420,807 | |
Integer Holdings Corporation † | | | | | | | | | | | 11,522 | | | | 679,913 | |
Mesa Laboratories Incorporated | | | | | | | | | | | 746 | | | | 190,051 | |
STERIS plc | | | | | | | | | | | 4,880 | | | | 859,807 | |
| | | | |
| | | | | | | | | | | | | | | 2,851,674 | |
| | | | | | | | | | | | | | | | |
|
| Life Sciences Tools & Services: 3.74% | |
Bio-Rad Laboratories Incorporated Class A † | | | | | | | | | | | 2,127 | | | | 1,096,383 | |
Bruker Corporation | | | | | | | | | | | 14,490 | | | | 575,978 | |
| | | | |
| | | | | | | | | | | | | | | 1,672,361 | |
| | | | | | | | | | | | | | | | |
|
Industrials: 20.81% | |
|
| Aerospace & Defense: 0.71% | |
Hexcel Corporation | | | | | | | | | | | 9,530 | | | | 319,732 | |
| | | | | | | | | | | | | | | | |
|
| Building Products: 3.31% | |
Masonite International Corporation † | | | | | | | | | | | 15,047 | | | | 1,480,625 | |
| | | | | | | | | | | | | | | | |
|
| Commercial Services & Supplies: 2.27% | |
Interface Incorporated | | | | | | | | | | | 47,927 | | | | 293,313 | |
Stericycle Incorporated † | | | | | | | | | | | 11,467 | | | | 723,109 | |
| | | | |
| | | | | | | | | | | | | | | 1,016,422 | |
| | | | | | | | | | | | | | | | |
|
| Construction & Engineering: 1.53% | |
API Group Corporation †144A | | | | | | | | | | | 47,971 | | | | 682,627 | |
| | | | | | | | | | | | | | | | |
|
| Machinery: 6.45% | |
Altra Industrial Motion Corporation | | | | | | | | | | | 20,632 | | | | 762,765 | |
ITT Incorporated | | | | | | | | | | | 13,711 | | | | 809,635 | |
SPX Corporation † | | | | | | | | | | | 28,326 | | | | 1,313,760 | |
| | | | |
| | | | | | | | | | | | | | | 2,886,160 | |
| | | | | | | | | | | | | | | | |
|
| Professional Services: 0.88% | |
ASGN Incorporated † | | | | | | | | | | | 6,224 | | | | 395,597 | |
| | | | | | | | | | | | | | | | |
The accompanying notes are an integral part of these financial statements.
10 | Wells Fargo Intrinsic Small Cap Value Fund
Portfolio of investments—September 30, 2020 (unaudited)
| | | | | | | | | | | | | | | | |
| | | | | | | | | Shares | | | Value | |
| Road & Rail: 2.22% | |
Ryder System Incorporated | | | | | | | | | | | 17,086 | | | $ | 721,713 | |
Saia Incorporated † | | | | | | | | | | | 2,169 | | | | 273,598 | |
| | | | |
| | | | | | | | | | | | | | | 995,311 | |
| | | | | | | | | | | | | | | | |
|
| Trading Companies & Distributors: 3.44% | |
Air Lease Corporation | | | | | | | | | | | 26,121 | | | | 768,480 | |
Herc Holdings Incorporated † | | | | | | | | | | | 19,431 | | | | 769,662 | |
| | | | |
| | | | | | | | | | | | | | | 1,538,142 | |
| | | | | | | | | | | | | | | | |
|
Information Technology: 15.16% | |
|
| Communications Equipment: 0.77% | |
Infinera Corporation † | | | | | | | | | | | 55,821 | | | | 343,857 | |
| | | | | | | | | | | | | | | | |
|
| Electronic Equipment, Instruments & Components: 6.19% | |
Avnet Incorporated | | | | | | | | | | | 18,526 | | | | 478,712 | |
Littelfuse Incorporated | | | | | | | | | | | 3,546 | | | | 628,848 | |
SYNNEX Corporation | | | | | | | | | | | 6,546 | | | | 916,833 | |
Zebra Technologies Corporation Class A † | | | | | | | | | | | 2,962 | | | | 747,787 | |
| | | | |
| | | | | | | | | | | | | | | 2,772,180 | |
| | | | | | | | | | | | | | | | |
|
| IT Services: 2.23% | |
EVO Payments Incorporated Class A † | | | | | | | | | | | 23,809 | | | | 591,654 | |
WNS Holdings Limited ADR † | | | | | | | | | | | 6,392 | | | | 408,832 | |
| | | | |
| | | | | | | | | | | | | | | 1,000,486 | |
| | | | | | | | | | | | | | | | |
|
| Semiconductors & Semiconductor Equipment: 1.97% | |
Brooks Automation Incorporated | | | | | | | | | | | 19,056 | | | | 881,531 | |
| | | | | | | | | | | | | | | | |
|
| Software: 4.00% | |
Medallia Incorporated † | | | | | | | | | | | 19,586 | | | | 537,048 | |
Mimecast Limited † | | | | | | | | | | | 18,952 | | | | 889,228 | |
Pagerduty Incorporated † | | | | | | | | | | | 13,406 | | | | 363,437 | |
| | | | |
| | | | | | | | | | | | | | | 1,789,713 | |
| | | | | | | | | | | | | | | | |
|
Materials: 6.02% | |
|
| Chemicals: 1.39% | |
Westlake Chemical Corporation | | | | | | | | | | | 9,856 | | | | 623,096 | |
| | | | | | | | | | | | | | | | |
|
| Containers & Packaging: 1.76% | |
Silgan Holdings Incorporated | | | | | | | | | | | 21,386 | | | | 786,363 | |
| | | | | | | | | | | | | | | | |
|
| Metals & Mining: 2.87% | |
Reliance Steel & Aluminum Company | | | | | | | | | | | 7,454 | | | | 760,606 | |
Royal Gold Incorporated | | | | | | | | | | | 4,367 | | | | 524,782 | |
| | | | |
| | | | | | | | | | | | | | | 1,285,388 | |
| | | | | | | | | | | | | | | | |
|
Real Estate: 12.49% | |
|
| Equity REITs: 11.54% | |
American Homes 4 Rent Class A | | | | | | | | | | | 19,431 | | | | 553,395 | |
CoreSite Realty Corporation | | | | | | | | | | | 9,881 | | | | 1,174,653 | |
Cousins Properties Incorporated | | | | | | | | | | | 7,813 | | | | 223,374 | |
Four Corners Property Trust Incorporated | | | | | | | | | | | 41,082 | | | | 1,051,288 | |
Healthcare Realty Trust Incorporated | | | | | | | | | | | 28,200 | | | | 849,384 | |
The accompanying notes are an integral part of these financial statements.
Wells Fargo Intrinsic Small Cap Value Fund | 11
Portfolio of investments—September 30, 2020 (unaudited)
| | | | | | | | | | | | | | | | |
| | | | | | | | | Shares | | | Value | |
|
| Equity REITs (continued) | |
Hudson Pacific Properties Incorporated | | | | | | | | 15,846 | | | $ | 347,503 | |
STAG Industrial Incorporated | | | | | | | | 31,679 | | | | 965,893 | |
| | | | |
| | | | | | | | | | | | | | | 5,165,490 | |
| | | | | | | | | | | | | | | | |
|
| Real Estate Management & Development: 0.95% | |
Jones Lang LaSalle Incorporated | | | | | | | | 4,474 | | | | 427,983 | |
| | | | | | | | | | | | | |
| |
Total Common Stocks (Cost $41,229,080) | | | | 44,531,712 | |
| | | | | |
| | | | |
| | | | | | | | | | | | | | | | |
| | | Yield | | | | | | | | | | |
| Short-Term Investments: 1.57% | |
|
| Investment Companies: 1.57% | |
Securities Lending Cash Investments LLC (l)(r)(u) | | | 0.12 | % | | | | | | | 554,460 | | | | 554,460 | |
Wells Fargo Government Money Market Fund Select Class (l)(u) | | | 0.05 | | | | | | | | 150,124 | | | | 150,124 | |
| |
Total Short-Term Investments (Cost $704,584) | | | | 704,584 | |
| | | | | |
| | | | | | | | |
| Total investments in securities (Cost $41,933,664) | | | 101.04 | % | | | 45,236,296 | |
| | |
Other assets and liabilities, net | | | (1.04 | ) | | | (465,511 | ) |
| | | | | | | | |
| Total net assets | | | 100.00 | % | | $ | 44,770,785 | |
| | | | | | | | |
| « | All or a portion of this security is on loan. |
| † | Non-income-earning security |
| 144A | The security may be resold in transactions exempt from registration, normally to qualified institutional buyers, pursuant to Rule 144A under the Securities Act of 1933. |
| (l) | The issuer of the security is an affiliated person of the Fund as defined in the Investment Company Act of 1940. |
| (r) | The investment is a non-registered investment company purchased with cash collateral received from securities on loan. |
| (u) | The rate represents the 7-day annualized yield at period end. |
Abbreviations:
| REIT | Real estate investment trust |
Investments in Affiliates
An affiliated investment is an investment in which the Fund owns at least 5% of the outstanding voting shares of the issuer or as a result of other relationships, such as the Fund and the issuer having the same investment manager. Transactions with issuers that were either affiliated persons of the Fund at the beginning of the period or the end of the period were as follows:
| | | | | | | | | | | | | | | | | | | | | | | | | | | | | | | | |
| | | Value,
beginning of
period | | | Purchases | | | Sales proceeds | | | Net
realized
gains
(losses) | | | Net
change in
unrealized
gains
(losses) | | | Income
from
affiliated
securities | | | Value, end of
period | | | % of
net
assets | |
| | | | | | | | |
| Short-Term Investments | | | | | | | | | | | | | | | | | | | | | | | | |
Investment Companies | | | | | | | | | | | | | | | | | | | | | | | | | | | | | | | | |
Securities Lending Cash Investments LLC | | $ | 0 | | | $ | 2,659,440 | | | $ | (2,104,980 | ) | | $ | 0 | | | $ | 0 | | | $ | 56 | # | | $ | 554,460 | | | | | |
Wells Fargo Government Money Market Fund Select Class | | | 632,764 | | | | 4,764,396 | | | | (5,247,036 | ) | | | 0 | | | | 0 | | | | 347 | | | | 150,124 | | | | | |
| | | | | | | | | | | | | | | | | | | | | | | | | | | | | | | | |
| | | | | | | | | | | | | | $ | 0 | | | $ | 0 | | | $ | 403 | | | $ | 704,584 | | | | 1.57 | % |
| | | | | | | | | | | | | | | | | | | | | | | | | | | | | | | | |
| # | Amount shown represents income before fees and rebates. |
The accompanying notes are an integral part of these financial statements.
12 | Wells Fargo Intrinsic Small Cap Value Fund
Statement of assets and liabilities—September 30, 2020 (unaudited)
| | | | |
| | | | |
| |
Assets | | | | |
Investments in unaffiliated securities (including $542,704 of securities loaned), at value (cost $41,229,080) | | $ | 44,531,712 | |
Investments in affiliated securities, at value (cost $704,584) | | | 704,584 | |
Receivable for investments sold | | | 88,370 | |
Receivable for Fund shares sold | | | 17,984 | |
Receivable for dividends | | | 42,659 | |
Receivable for securities lending income, net | | | 494 | |
Prepaid expenses and other assets | | | 39,746 | |
| | | | |
Total assets | | | 45,425,549 | |
| | | | |
| |
Liabilities | | | | |
Payable upon receipt of securities loaned | | | 554,460 | |
Payable for Fund shares redeemed | | | 46,624 | |
Management fee payable | | | 18,340 | |
Administration fees payable | | | 7,091 | |
Distribution fee payable | | | 67 | |
Trustees’ fees and expenses payable | | | 2,668 | |
Accrued expenses and other liabilities | | | 25,514 | |
| | | | |
Total liabilities | | | 654,764 | |
| | | | |
Total net assets | | $ | 44,770,785 | |
| | | | |
| |
Net assets consist of | | | | |
Paid-in capital | | $ | 42,013,719 | |
Total distributable earnings | | | 2,757,066 | |
| | | | |
Total net assets | | $ | 44,770,785 | |
| | | | |
| |
Computation of net asset value and offering price per share | | | | |
Net assets – Class A | | $ | 34,651,388 | |
Shares outstanding – Class A1 | | | 1,304,946 | |
Net asset value per share – Class A | | | $26.55 | |
Maximum offering price per share – Class A2 | | | $28.17 | |
Net assets – Class C | | $ | 96,205 | |
Shares outstanding – Class C1 | | | 3,988 | |
Net asset value per share – Class C | | | $24.12 | |
Net assets – Class R6 | | $ | 799,299 | |
Shares outstanding – Class R61 | | | 28,853 | |
Net asset value per share – Class R6 | | | $27.70 | |
Net assets – Administrator Class | | $ | 599,255 | |
Shares outstanding – Administrator Class1 | | | 22,035 | |
Net asset value per share – Administrator Class | | | $27.20 | |
Net assets – Institutional Class | | $ | 8,624,638 | |
Shares outstanding – Institutional Class1 | | | 311,448 | |
Net asset value per share – Institutional Class | | | $27.69 | |
| 1 | The Fund has an unlimited number of authorized shares. |
| 2 | Maximum offering price is computed as 100/94.25 of net asset value. On investments of $50,000 or more, the offering price is reduced. |
The accompanying notes are an integral part of these financial statements.
Wells Fargo Intrinsic Small Cap Value Fund | 13
Statement of operations—six months ended September 30, 2020 (unaudited)
| | | | |
| | | | |
| |
Investment income | | | | |
Dividends | | $ | 321,658 | |
Income from affiliated securities | | | 1,180 | |
| | | | |
Total investment income | | | 322,838 | |
| | | | |
| |
Expenses | | | | |
Management fee | | | 181,893 | |
Administration fees | | | | |
Class A | | | 34,685 | |
Class C | | | 161 | |
Class R6 | | | 38 | 1 |
Administrator Class | | | 361 | |
Institutional Class | | | 5,724 | |
Shareholder servicing fees | | | | |
Class A | | | 41,114 | |
Class C | | | 190 | |
Administrator Class | | | 688 | |
Distribution fee | | | | |
Class C | | | 569 | |
Custody and accounting fees | | | 8,116 | |
Professional fees | | | 19,799 | |
Registration fees | | | 32,867 | |
Shareholder report expenses | | | 12,828 | |
Trustees’ fees and expenses | | | 9,776 | |
Other fees and expenses | | | 5,810 | |
| | | | |
Total expenses | | | 354,619 | |
Less: Fee waivers and/or expense reimbursements | | | | |
Fund-level | | | (78,884 | ) |
Class A | | | (3,167 | ) |
Class C | | | (6 | ) |
Administrator Class | | | (212 | ) |
Institutional Class | | | (1,239 | ) |
| | | | |
Net expenses | | | 271,111 | |
| | | | |
Net investment income | | | 51,727 | |
| | | | |
| |
Realized and unrealized gains (losses) on investments | | | | |
Net realized losses on investments | | | (388,065 | ) |
Net change in unrealized gains (losses) on investments | | | 12,378,536 | |
| | | | |
Net realized and unrealized gains (losses) on investments | | | 11,990,471 | |
| | | | |
Net increase in net assets resulting from operations | | $ | 12,042,198 | |
| | | | |
| 1 | For the period from May 29, 2020 (commencement of class operations) to September 30, 2020 |
The accompanying notes are an integral part of these financial statements.
14 | Wells Fargo Intrinsic Small Cap Value Fund
Statement of changes in net assets
| | | | | | | | | | | | | | | | |
| | | Six months ended
September 30, 2020 (unaudited) | | | Year ended
March 31, 2020 | |
| |
Operations | | | | | |
Net investment income | | | | | | $ | 51,727 | | | | | | | $ | 93,835 | |
Net realized gains (losses) on investments | | | | | | | (388,065 | ) | | | | | | | 184,406 | |
Net change in unrealized gains (losses) on investments | | | | | | | 12,378,536 | | | | | | | | (16,937,972 | ) |
| | | | |
Net increase (decrease) in net assets resulting from operations | | | | | | | 12,042,198 | | | | | | | | (16,659,731 | ) |
| | | | |
| | | | |
Distributions to shareholders from net investment income and net realized gains | | | | | | | | | | | | | | | | |
Class A | | | | | | | 0 | | | | | | | | (2,809,650 | ) |
Class C | | | | | | | 0 | | | | | | | | (23,865 | ) |
Administrator Class | | | | | | | 0 | | | | | | | | (69,935 | ) |
Institutional Class | | | | | | | 0 | | | | | | | | (1,153,479 | ) |
| | | | |
Total distributions to shareholders | | | | | | | 0 | | | | | | | | (4,056,929 | ) |
| | | | |
| | | | |
Capital share transactions | | | Shares | | | | | | | | Shares | | | | | |
Proceeds from shares sold | |
Class A | | | 23,624 | | | | 591,754 | | | | 34,452 | | | | 998,637 | |
Class C | | | 95 | | | | 2,092 | | | | 1,060 | | | | 29,122 | |
Class R6 | | | 29,167 | 1 | | | 813,972 | 1 | | | N/A | | | | N/A | |
Administrator Class | | | 491 | | | | 12,577 | | | | 18,871 | | | | 596,345 | |
Institutional Class | | | 11,397 | | | | 303,277 | | | | 25,429 | | | | 745,734 | |
| | | | |
| | | | | | | 1,723,672 | | | | | | | | 2,369,838 | |
| | | | |
Reinvestment of distributions | |
Class A | | | 0 | | | | 0 | | | | 88,486 | | | | 2,713,873 | |
Class C | | | 0 | | | | 0 | | | | 780 | | | | 21,882 | |
Administrator Class | | | 0 | | | | 0 | | | | 2,048 | | | | 64,270 | |
Institutional Class | | | 0 | | | | 0 | | | | 15,704 | | | | 500,987 | |
| | | | |
| | | | | | | 0 | | | | | | | | 3,301,012 | |
| | | | |
Payment for shares redeemed | |
Class A | | | (90,336 | ) | | | (2,215,069 | ) | | | (205,793 | ) | | | (6,016,656 | ) |
Class C | | | (6,631 | ) | | | (143,837 | ) | | | (10,118 | ) | | | (284,633 | ) |
Class R6 | | | (314 | )1 | | | (9,000 | )1 | | | N/A | | | | N/A | |
Administrator Class | | | (697 | ) | | | (15,933 | ) | | | (36,385 | ) | | | (1,131,472 | ) |
Institutional Class | | | (249,292 | ) | | | (5,671,272 | ) | | | (174,691 | ) | | | (5,578,624 | ) |
| | | | |
| | | | | | | (8,055,111 | ) | | | | | | | (13,011,385 | ) |
| | | | |
Net decrease in net assets resulting from capital share transactions | | | | | | | (6,331,439 | ) | | | | | | | (7,340,535 | ) |
| | | | |
Total increase (decrease) in net assets | | | | | | | 5,710,759 | | | | | | | | (28,057,195 | ) |
| | | | |
| | |
Net assets | | | | | | | | |
Beginning of period | | | | | | | 39,060,026 | | | | | | | | 67,117,221 | |
| | | | |
End of period | | | | | | $ | 44,770,785 | | | | | | | $ | 39,060,026 | |
| | | | |
| 1 | For the period from May 29, 2020 (commencement of class operations) to September 30, 2020 |
The accompanying notes are an integral part of these financial statements.
Wells Fargo Intrinsic Small Cap Value Fund | 15
Financial highlights
(For a share outstanding throughout each period)
| | | | | | | | | | | | | | | | | | | | | | | | |
| | | Six months ended
September 30, 2020
(unaudited) | | | Year ended March 31 | |
| CLASS A | | 2020 | | | 2019 | | | 2018 | | | 2017 | | | 2016 | |
Net asset value, beginning of period | | | $19.77 | | | | $30.27 | | | | $31.46 | | | | $28.92 | | | | $23.49 | | | | $25.50 | |
Net investment income (loss) | | | 0.02 | 1 | | | 0.02 | 1 | | | (0.04 | )1 | | | (0.08 | )1 | | | (0.15 | )1 | | | 0.22 | 1 |
Net realized and unrealized gains (losses) on investments | | | 6.76 | | | | (8.43 | ) | | | (1.15 | ) | | | 2.62 | | | | 5.71 | | | | (2.09 | ) |
| | | | | | | | | | | | | | | | | | | | | | | | |
Total from investment operations | | | 6.78 | | | | (8.41 | ) | | | (1.19 | ) | | | 2.54 | | | | 5.56 | | | | (1.87 | ) |
Distributions to shareholders from | | | | | | | | | | | | | | | | | | | | | | | | |
Net investment income | | | 0.00 | | | | 0.00 | | | | 0.00 | | | | 0.00 | | | | (0.13 | ) | | | (0.14 | ) |
Net realized gains | | | 0.00 | | | | (2.09 | ) | | | 0.00 | | | | 0.00 | | | | 0.00 | | | | 0.00 | |
| | | | | | | | | | | | | | | | | | | | | | | | |
Total distributions to shareholders | | | 0.00 | | | | (2.09 | ) | | | 0.00 | | | | 0.00 | | | | (0.13 | ) | | | (0.14 | ) |
Net asset value, end of period | | | $26.55 | | | | $19.77 | | | | $30.27 | | | | $31.46 | | | | $28.92 | | | | $23.49 | |
Total return2 | | | 34.29 | % | | | (30.24 | )% | | | (3.78 | )% | | | 8.78 | % | | | 23.68 | % | | | (7.36 | )% |
Ratios to average net assets (annualized) | | | | | | | | | | | | | | | | | | | | | | | | |
Gross expenses | | | 1.73 | % | | | 1.60 | % | | | 1.54 | % | | | 1.54 | % | | | 1.48 | % | | | 1.47 | % |
Net expenses | | | 1.34 | % | | | 1.35 | % | | | 1.35 | % | | | 1.35 | % | | | 1.35 | % | | | 1.35 | % |
Net investment income (loss) | | | 0.17 | % | | | 0.05 | % | | | (0.11 | )% | | | (0.26 | )% | | | (0.57 | )% | | | 0.95 | % |
Supplemental data | | | | | | | | | | | | | | | | | | | | | | | | |
Portfolio turnover rate | | | 13 | % | | | 41 | % | | | 34 | % | | | 27 | % | | | 142 | % | | | 66 | % |
Net assets, end of period (000s omitted) | | | $34,651 | | | | $27,115 | | | | $44,028 | | | | $50,993 | | | | $52,817 | | | | $49,898 | |
| 1 | Calculated based upon average shares outstanding |
| 2 | Total return calculations do not include any sales charges. Returns for periods of less than one year are not annualized. |
The accompanying notes are an integral part of these financial statements.
16 | Wells Fargo Intrinsic Small Cap Value Fund
Financial highlights
(For a share outstanding throughout each period)
| | | | | | | | | | | | | | | | | | | | | | | | |
| | | Six months ended
September 30, 2020
(unaudited) | | | Year ended March 31 | |
| CLASS C | | 2020 | | | 2019 | | | 2018 | | | 2017 | | | 2016 | |
Net asset value, beginning of period | | | $18.03 | | | | $27.98 | | | | $29.30 | | | | $27.14 | | | | $22.11 | | | | $24.04 | |
Net investment loss | | | (0.07 | )1 | | | (0.20 | )1 | | | (0.25 | )1 | | | (0.28 | )1 | | | (0.39 | )1 | | | (0.00 | )1,2 |
Net realized and unrealized gains (losses) on investments | | | 6.16 | | | | (7.66 | ) | | | (1.07 | ) | | | 2.44 | | | | 5.42 | | | | (1.93 | ) |
| | | | | | | | | | | | | | | | | | | | | | | | |
Total from investment operations | | | 6.09 | | | | (7.86 | ) | | | (1.32 | ) | | | 2.16 | | | | 5.03 | | | | (1.93 | ) |
Distributions to shareholders from | | | | | | | | | | | | | | | | | | | | | | | | |
Net realized gains | | | 0.00 | | | | (2.09 | ) | | | 0.00 | | | | 0.00 | | | | 0.00 | | | | 0.00 | |
Net asset value, end of period | | | $24.12 | | | | $18.03 | | | | $27.98 | | | | $29.30 | | | | $27.14 | | | | $22.11 | |
Total return3 | | | 33.78 | % | | | (30.76 | )% | | | (4.51 | )% | | | 7.96 | % | | | 22.75 | % | | | (8.03 | )% |
Ratios to average net assets (annualized) | | | | | | | | | | | | | | | | | | | | | | | | |
Gross expenses | | | 2.48 | % | | | 2.34 | % | | | 2.29 | % | | | 2.29 | % | | | 2.22 | % | | | 2.22 | % |
Net expenses | | | 2.10 | % | | | 2.10 | % | | | 2.10 | % | | | 2.10 | % | | | 2.10 | % | | | 2.12 | % |
Net investment loss | | | (0.68 | )% | | | (0.73 | )% | | | (0.85 | )% | | | (1.02 | )% | | | (1.52 | )% | | | (0.00 | )% |
Supplemental data | | | | | | | | | | | | | | | | | | | | | | | | |
Portfolio turnover rate | | | 13 | % | | | 41 | % | | | 34 | % | | | 27 | % | | | 142 | % | | | 66 | % |
Net assets, end of period (000s omitted) | | | $96 | | | | $190 | | | | $526 | | | | $840 | | | | $989 | | | | $285 | |
| 1 | Calculated based upon average shares outstanding |
| 2 | Amount is more than $(0.005). |
| 3 | Total return calculations do not include any sales charges. Returns for periods of less than one year are not annualized. |
The accompanying notes are an integral part of these financial statements.
Wells Fargo Intrinsic Small Cap Value Fund | 17
Financial highlights
(For a share outstanding throughout the period)
| | | | |
| CLASS R6 | | Period ended
September 30, 20201
(unaudited) | |
Net asset value, beginning of period | | | $25.43 | |
Net investment income | | | 0.08 | 2 |
Net realized and unrealized gains (losses) on investments | | | 2.19 | |
| | | | |
Total from investment operations | | | 2.27 | |
Net asset value, end of period | | | $27.70 | |
Total return3 | | | 8.93 | % |
Ratios to average net assets (annualized) | | | | |
Gross expenses | | | 1.27 | % |
Net expenses | | | 0.90 | % |
Net investment income | | | 0.89 | % |
Supplemental data | | | | |
Portfolio turnover rate | | | 13 | % |
Net assets, end of period (000s omitted) | | | $799 | |
| 1 | For the period from May 29, 2020 (commencement of class operations) to September 30, 2020 |
| 2 | Calculated based upon average shares outstanding |
| 3 | Returns for periods of less than one year are not annualized. |
The accompanying notes are an integral part of these financial statements.
18 | Wells Fargo Intrinsic Small Cap Value Fund
Financial highlights
(For a share outstanding throughout each period)
| | | | | | | | | | | | | | | | | | | | | | | | |
| | | Six months ended
September 30, 2020
(unaudited) | | | Year ended March 31 | |
| ADMINISTRATOR CLASS | | 2020 | | | 2019 | | | 2018 | | | 2017 | | | 2016 | |
Net asset value, beginning of period | | | $20.23 | | | | $30.89 | | | | $32.06 | | | | $29.43 | | | | $23.89 | | | | $25.95 | |
Net investment income (loss) | | | 0.04 | 1 | | | 0.05 | 1 | | | 0.01 | 1 | | | (0.03 | )1 | | | (0.10 | )1 | | | 0.22 | 1 |
Net realized and unrealized gains (losses) on investments | | | 6.93 | | | | (8.62 | ) | | | (1.18 | ) | | | 2.66 | | | | 5.80 | | | | (2.08 | ) |
| | | | | | | | | | | | | | | | | | | | | | | | |
Total from investment operations | | | 6.97 | | | | (8.57 | ) | | | (1.17 | ) | | | 2.63 | | | | 5.70 | | | | (1.86 | ) |
Distributions to shareholders from | | | | | | | | | | | | | | | | | | | | | | | | |
Net investment income | | | 0.00 | | | | 0.00 | | | | 0.00 | | | | 0.00 | | | | (0.16 | ) | | | (0.20 | ) |
Net realized gains | | | 0.00 | | | | (2.09 | ) | | | 0.00 | | | | 0.00 | | | | 0.00 | | | | 0.00 | |
| | | | | | | | | | | | | | | | | | | | | | | | |
Total distributions to shareholders | | | 0.00 | | | | (2.09 | ) | | | 0.00 | | | | 0.00 | | | | (0.16 | ) | | | (0.20 | ) |
Net asset value, end of period | | | $27.20 | | | | $20.23 | | | | $30.89 | | | | $32.06 | | | | $29.43 | | | | $23.89 | |
Total return2 | | | 34.45 | % | | | (30.15 | )% | | | (3.65 | )% | | | 8.94 | % | | | 23.86 | % | | | (7.17 | )% |
Ratios to average net assets (annualized) | | | | | | | | | | | | | | | | | | | | | | | | |
Gross expenses | | | 1.65 | % | | | 1.51 | % | | | 1.46 | % | | | 1.46 | % | | | 1.40 | % | | | 1.37 | % |
Net expenses | | | 1.20 | % | | | 1.20 | % | | | 1.20 | % | | | 1.20 | % | | | 1.20 | % | | | 1.20 | % |
Net investment income (loss) | | | 0.31 | % | | | 0.17 | % | | | 0.05 | % | | | (0.10 | )% | | | (0.38 | )% | | | 0.91 | % |
Supplemental data | | | | | | | | | | | | | | | | | | | | | | | | |
Portfolio turnover rate | | | 13 | % | | | 41 | % | | | 34 | % | | | 27 | % | | | 142 | % | | | 66 | % |
Net assets, end of period (000s omitted) | | | $599 | | | | $450 | | | | $1,165 | | | | $1,347 | | | | $4,355 | | | | $4,893 | |
| 1 | Calculated based upon average shares outstanding |
| 2 | Returns for periods of less than one year are not annualized. |
The accompanying notes are an integral part of these financial statements.
Wells Fargo Intrinsic Small Cap Value Fund | 19
Financial highlights
(For a share outstanding throughout each period)
| | | | | | | | | | | | | | | | | | | | | | | | |
| | | Six months ended
September 30, 2020
(unaudited) | | | Year ended March 31 | |
| INSTITUTIONAL CLASS | | 2020 | | | 2019 | | | 2018 | | | 2017 | | | 2016 | |
Net asset value, beginning of period | | | $20.58 | | | | $31.33 | | | | $32.45 | | | | $29.73 | | | | $24.13 | | | | $26.22 | |
Net investment income (loss) | | | 0.06 | 1 | | | 0.12 | 1 | | | 0.08 | 1 | | | 0.03 | 1 | | | (0.07 | )1 | | | 0.33 | |
Net realized and unrealized gains (losses) on investments | | | 7.05 | | | | (8.78 | ) | | | (1.20 | ) | | | 2.69 | | | | 5.89 | | | | (2.17 | ) |
| | | | | | | | | | | | | | | | | | | | | | | | |
Total from investment operations | | | 7.11 | | | | (8.66 | ) | | | (1.12 | ) | | | 2.72 | | | | 5.82 | | | | (1.84 | ) |
Distributions to shareholders from | | | | | | | | | | | | | | | | | | | | | | | | |
Net investment income | | | 0.00 | | | | (0.00 | )2 | | | 0.00 | | | | 0.00 | | | | (0.22 | ) | | | (0.25 | ) |
Net realized gains | | | 0.00 | | | | (2.09 | ) | | | 0.00 | | | | 0.00 | | | | 0.00 | | | | 0.00 | |
| | | | | | | | | | | | | | | | | | | | | | | | |
Total distributions to shareholders | | | 0.00 | | | | (2.09 | ) | | | 0.00 | | | | 0.00 | | | | (0.22 | ) | | | (0.25 | ) |
Net asset value, end of period | | | $27.69 | | | | $20.58 | | | | $31.33 | | | | $32.45 | | | | $29.73 | | | | $24.13 | |
Total return3 | | | 34.55 | % | | | (30.00 | )% | | | (3.45 | )% | | | 9.15 | % | | | 24.14 | % | | | (7.02 | )% |
Ratios to average net assets (annualized) | | | | | | | | | | | | | | | | | | | | | | | | |
Gross expenses | | | 1.40 | % | | | 1.27 | % | | | 1.21 | % | | | 1.21 | % | | | 1.15 | % | | | 1.12 | % |
Net expenses | | | 1.00 | % | | | 1.00 | % | | | 1.00 | % | | | 1.00 | % | | | 1.00 | % | | | 1.00 | % |
Net investment income (loss) | | | 0.50 | % | | | 0.38 | % | | | 0.24 | % | | | 0.08 | % | | | (0.26 | )% | | | 1.10 | % |
Supplemental data | | | | | | | | | | | | | | | | | | | | | | | | |
Portfolio turnover rate | | | 13 | % | | | 41 | % | | | 34 | % | | | 27 | % | | | 142 | % | | | 66 | % |
Net assets, end of period (000s omitted) | | | $8,625 | | | | $11,305 | | | | $21,398 | | | | $28,032 | | | | $59,991 | | | | $71,072 | |
| 1 | Calculated based upon average shares outstanding |
| 2 | Amount is less than $0.005. |
| 3 | Returns for periods of less than one year are not annualized. |
The accompanying notes are an integral part of these financial statements.
20 | Wells Fargo Intrinsic Small Cap Value Fund
Notes to financial statements (unaudited)
1. ORGANIZATION
Wells Fargo Funds Trust (the “Trust”), a Delaware statutory trust organized on March 10, 1999, is an open-end management investment company registered under the Investment Company Act of 1940, as amended (the “1940 Act”). As an investment company, the Trust follows the accounting and reporting guidance in Financial Accounting Standards Board (“FASB”) Accounting Standards Codification Topic 946, Financial Services – Investment Companies. These financial statements report on the Wells Fargo Intrinsic Small Cap Value Fund (the “Fund”) which is a diversified series of the Trust.
2. SIGNIFICANT ACCOUNTING POLICIES
The following significant accounting policies, which are consistently followed in the preparation of the financial statements of the Fund, are in conformity with U.S. generally accepted accounting principles which require management to make estimates and assumptions that affect the reported amounts of assets and liabilities, disclosure of contingent assets and liabilities at the date of the financial statements, and the reported amounts of revenues and expenses during the reporting period. Actual results could differ from those estimates.
Securities valuation
All investments are valued each business day as of the close of regular trading on the New York Stock Exchange (generally 4 p.m. Eastern Time), although the Fund may deviate from this calculation time under unusual or unexpected circumstances.
Equity securities that are listed on a foreign or domestic exchange or market are valued at the official closing price or, if none, the last sales price. If no sale occurs on the principal exchange or market that day, a fair value price will be determined in accordance with the Fund’s Valuation Procedures.
Investments in registered open-end investment companies are valued at net asset value. Interests in non-registered investment companies that are redeemable at net asset value are fair valued normally at net asset value.
Investments which are not valued using any of the methods discussed above are valued at their fair value, as determined in good faith by the Board of Trustees of the Fund. The Board of Trustees has established a Valuation Committee comprised of the Trustees and has delegated to it the authority to take any actions regarding the valuation of portfolio securities that the Valuation Committee deems necessary or appropriate, including determining the fair value of portfolio securities, unless the determination has been delegated to the Wells Fargo Asset Management Pricing Committee at Wells Fargo Funds Management, LLC (“Funds Management”). The Board of Trustees retains the authority to make or ratify any valuation decisions or approve any changes to the Valuation Procedures as it deems appropriate. On a quarterly basis, the Board of Trustees receives reports on any valuation actions taken by the Valuation Committee or the Wells Fargo Asset Management Pricing Committee which may include items for ratification.
Securities lending
The Fund may lend its securities from time to time in order to earn additional income in the form of fees or interest on securities received as collateral or the investment of any cash received as collateral. When securities are on loan, the Fund receives interest or dividends on those securities. Cash collateral received in connection with its securities lending transactions is invested in Securities Lending Cash Investments, LLC (the “Securities Lending Fund”). Investments in Securities Lending Fund are valued at the evaluated bid price provided by an independent pricing service. Income earned from investment in the Securities Lending Fund (net of fees and rebates), if any, is included in income from affiliated securities on the Statement of Operations.
In a securities lending transaction, the net asset value of the Fund is affected by an increase or decrease in the value of the securities loaned and by an increase or decrease in the value of the instrument in which collateral is invested. The amount of securities lending activity undertaken by the Fund fluctuates from time to time. The Fund has the right under the lending agreement to recover the securities from the borrower on demand. In the event of default or bankruptcy by the borrower, the Fund may be prevented from recovering the loaned securities or gaining access to the collateral or may experience delays or costs in doing so. In such an event, the terms of the agreement allow the unaffiliated securities lending agent to use the collateral to purchase replacement securities on behalf of the Fund or pay the Fund the market value of the loaned securities. The Fund bears the risk of loss with respect to depreciation of its investment of the cash collateral.
Security transactions and income recognition
Securities transactions are recorded on a trade date basis. Realized gains or losses are recorded on the basis of identified cost.
Dividend income is recognized on the ex-dividend date.
Wells Fargo Intrinsic Small Cap Value Fund | 21
Notes to financial statements (unaudited)
Distributions to shareholders
Distributions to shareholders from net investment income and any net realized gains are recorded on the ex-dividend date and paid at least annually. Such distributions are determined in accordance with income tax regulations and may differ from U.S. generally accepted accounting principles. Dividend sources are estimated at the time of declaration. The tax character of distributions is determined as of the Fund’s fiscal year end. Therefore, a portion of the Fund’s distributions made prior to the Fund’s fiscal year end may be categorized as a tax return of capital at year end.
Federal and other taxes
The Fund intends to continue to qualify as a regulated investment company by distributing substantially all of its investment company taxable income and any net realized capital gains (after reduction for capital loss carryforwards) sufficient to relieve it from all, or substantially all, federal income taxes. Accordingly, no provision for federal income taxes was required.
The Fund’s income and federal excise tax returns and all financial records supporting those returns for the prior three fiscal years are subject to examination by the federal and Delaware revenue authorities. Management has analyzed the Fund’s tax positions taken on federal, state, and foreign tax returns for all open tax years and does not believe that there are any uncertain tax positions that require recognition of a tax liability.
As of September 30, 2020, the aggregate cost of all investments for federal income tax purposes was $39,239,204 and the unrealized gains (losses) consisted of:
| | | | |
| |
Gross unrealized gains | | $ | 9,012,520 | |
| |
Gross unrealized losses | | | (3,015,428 | ) |
| |
Net unrealized gains | | $ | 5,997,092 | |
As of March 31, 2020, capital loss carryforwards in the amount of $13,505 was available to offset future net realized capital gains.
Class allocations
The separate classes of shares offered by the Fund differ principally in applicable sales charges, distribution, shareholder servicing, and administration fees. Class specific expenses are charged directly to that share class. Investment income, common fund-level expenses, and realized and unrealized gains (losses) on investments are allocated daily to each class of shares based on the relative proportion of net assets of each class.
3. FAIR VALUATION MEASUREMENTS
Fair value measurements of investments are determined within a framework that has established a fair value hierarchy based upon the various data inputs utilized in determining the value of the Fund’s investments. The three-level hierarchy gives the highest priority to unadjusted quoted prices in active markets for identical assets or liabilities (Level 1) and the lowest priority to unobservable inputs (Level 3). The Fund’s investments are classified within the fair value hierarchy based on the lowest level of input that is significant to the fair value measurement. The inputs are summarized into three broad levels as follows:
| ∎ | | Level 1 – quoted prices in active markets for identical securities |
| ∎ | | Level 2 – other significant observable inputs (including quoted prices for similar securities, interest rates, prepayment speeds, credit risk, etc.) |
| ∎ | | Level 3 – significant unobservable inputs (including the Fund’s own assumptions in determining the fair value of investments) |
The inputs or methodologies used for valuing investments in securities are not necessarily an indication of the risk associated with investing in those securities.
22 | Wells Fargo Intrinsic Small Cap Value Fund
Notes to financial statements (unaudited)
The following is a summary of the inputs used in valuing the Fund’s assets and liabilities as of September 30, 2020:
| | | | | | | | | | | | | | | | |
| | | | |
| | | Quoted prices
(Level 1) | | | Other significant
observable inputs
(Level 2) | | | Significant
unobservable inputs (Level 3) | | | Total | |
| | | | |
Assets | | | | | | | | | | | | | | | | |
Investments in: | | | | | | | | | | | | | | | | |
| | | | |
Common stocks | | | | | | | | | | | | | | | | |
| | | | |
Communication services | | $ | 290,343 | | | $ | 0 | | | $ | 0 | | | $ | 290,343 | |
| | | | |
Consumer discretionary | | | 5,309,910 | | | | 0 | | | | 0 | | | | 5,309,910 | |
| | | | |
Consumer staples | | | 2,319,326 | | | | 0 | | | | 0 | | | | 2,319,326 | |
| | | | |
Financials | | | 7,697,395 | | | | 0 | | | | 0 | | | | 7,697,395 | |
| | | | |
Health care | | | 4,524,035 | | | | 0 | | | | 0 | | | | 4,524,035 | |
| | | | |
Industrials | | | 9,314,616 | | | | 0 | | | | 0 | | | | 9,314,616 | |
| | | | |
Information technology | | | 6,787,767 | | | | 0 | | | | 0 | | | | 6,787,767 | |
| | | | |
Materials | | | 2,694,847 | | | | 0 | | | | 0 | | | | 2,694,847 | |
| | | | |
Real estate | | | 5,593,473 | | | | 0 | | | | 0 | | | | 5,593,473 | |
| | | | |
Short-term investments | | | | | | | | | | | | | | | | |
| | | | |
Investment companies | | | 704,584 | | | | 0 | | | | 0 | | | | 704,584 | |
| | | | |
Total assets | | $ | 45,236,296 | | | $ | 0 | | | $ | 0 | | | $ | 45,236,296 | |
Additional sector, industry or geographic detail is included in the Portfolio of Investments.
For the six months ended September 30, 2020, the Fund did not have any transfers into/out of Level 3.
4. TRANSACTIONS WITH AFFILIATES
Management fee
Funds Management, an indirect wholly owned subsidiary of Wells Fargo & Company (“Wells Fargo”), is the manager of the Fund and provides advisory and fund-level administrative services under an investment management agreement. Under the investment management agreement, Funds Management is responsible for, among other services, implementing the investment objectives and strategies of the Fund, supervising the subadviser and providing fund-level administrative services in connection with the Fund’s operations. As compensation for its services under the investment management agreement, Funds Management is entitled to receive a management fee at the following annual rate based on the Fund’s average daily net assets:
| | | | |
| |
| Average daily net assets | | Management fee | |
| |
First $500 million | | | 0.850 | % |
| |
Next $500 million | | | 0.825 | |
| |
Next $1 billion | | | 0.800 | |
| |
Next $1 billion | | | 0.775 | |
| |
Next $1 billion | | | 0.750 | |
| |
Next $1 billion | | | 0.730 | |
| |
Next $5 billion | | | 0.720 | |
| |
Over $10 billion | | | 0.710 | |
For the six months ended September 30, 2020, the management fee was equivalent to an annual rate of 0.85% of the Fund’s average daily net assets.
Funds Management has retained the services of a subadviser to provide daily portfolio management to the Fund. The fee for subadvisory services is borne by Funds Management. Wells Capital Management Incorporated (“WellsCap”), an affiliate of Funds Management and an indirect wholly owned subsidiary of Wells Fargo, is the subadviser to the Fund and is entitled to receive a fee from Funds Management at an annual rate starting at 0.55% and declining to 0.40% as the average daily net assets of the Fund increase.
Wells Fargo Intrinsic Small Cap Value Fund | 23
Notes to financial statements (unaudited)
Administration fees
Under a class-level administration agreement, Funds Management provides class-level administrative services to the Fund, which includes paying fees and expenses for services provided by the transfer agent, sub-transfer agents, omnibus account servicers and record-keepers. As compensation for its services under the class-level administration agreement, Funds Management receives an annual fee which is calculated based on the average daily net assets of each class as follows:
| | | | |
| |
| | | Class-level
administration fee | |
| |
Class A, Class C | | | 0.21 | % |
| |
Class R6 | | | 0.03 | |
| |
Administrator Class, Institutional Class | | | 0.13 | |
Waivers and/or expense reimbursements
Funds Management has contractually waived and/or reimbursed management and administration fees to the extent necessary to maintain certain net operating expense ratios for the Fund. When each class of the Fund has exceeded its expense cap, Funds Management has waived fees and/or reimbursed expenses from fund-level expenses on a proportionate basis and then from class specific expenses. When only certain classes exceed their expense caps, waivers and/or reimbursements are applied against class specific expenses before fund-level expenses. Funds Management has committed through July 31, 2021 to waive fees and/or reimburse expenses to the extent necessary to cap the Fund’s expenses at 1.35% for Class A shares, 2.10% for Class C shares, 0.90% for Class R6 shares, 1.20% for Administrator Class shares, and 1.00% for Institutional Class shares. Prior to or after the commitment expiration date, the cap may be increased or the commitment to maintain the cap may be terminated only with the approval of the Board of Trustees.
Distribution fee
The Trust has adopted a distribution plan for Class C shares of the Fund pursuant to Rule 12b-1 under the 1940 Act. A distribution fee is charged to Class C shares and paid to Wells Fargo Funds Distributor, LLC (“Funds Distributor”), the principal underwriter, at an annual rate of 0.75% of the average daily net assets of Class C shares.
In addition, Funds Distributor is entitled to receive the front-end sales charge from the purchase of Class A shares and a contingent deferred sales charge on the redemption of certain Class A shares. Funds Distributor is also entitled to receive the contingent deferred sales charges from redemptions of Class C shares. For the six months ended September 30, 2020, Funds Distributor received $153 from the sale of Class A shares. No contingent deferred sales charges were incurred by Class A and Class C shares for the six months ended September 30, 2020.
Shareholder servicing fees
The Trust has entered into contracts with one or more shareholder servicing agents, whereby Class A, Class C, and Administrator Class of the Fund are charged a fee at an annual rate of 0.25% of the average daily net assets of each respective class. A portion of these total shareholder servicing fees were paid to affiliates of Wells Fargo.
Interfund transactions
The Fund may purchase or sell portfolio investment securities to certain other Wells Fargo affiliates pursuant to Rule 17a-7 under the 1940 Act and under procedures adopted by the Board of Trustees. The procedures have been designed to ensure that these interfund transactions, which do not incur broker commissions, are effected at current market prices.
5. INVESTMENT PORTFOLIO TRANSACTIONS
Purchases and sales of investments, excluding U.S. government obligations (if any) and short-term securities, for the six months ended September 30, 2020 were $5,593,919 and $11,507,729, respectively.
6. SECURITIES LENDING TRANSACTIONS
The Fund lends its securities through an unaffiliated securities lending agent and receives collateral in the form of cash or securities with a value at least equal to the value of the securities on loan. The value of the loaned securities is determined at the close of each business day and any increases or decreases in the required collateral are exchanged between the Fund and the counterparty on the next business day. Cash collateral received is invested in the Securities Lending Fund which seeks to provide a positive return compared to the daily Federal Funds Open Rate by investing in high-quality, U.S. dollar-denominated short-term money market instruments and is exempt from registration under Section 3(c)(7) of the 1940 Act. Securities Lending Fund is managed by Funds Management and is subadvised by WellsCap. Funds Management receives an advisory fee
24 | Wells Fargo Intrinsic Small Cap Value Fund
Notes to financial statements (unaudited)
starting at 0.05% and declining to 0.01% as the average daily net assets of the Securities Lending Fund increase. All of the fees received by Funds Management are paid to WellsCap for its services as subadviser.
In the event of counterparty default or the failure of a borrower to return a loaned security, the Fund has the right to use the collateral to offset any losses incurred. As of September 30, 2020, the Fund had securities lending transactions with the following counterparties which are subject to offset:
| | | | | | | | | | | | |
| | | |
| Counterparty | | Value of
securities on
loan | | | Collateral
received1 | | | Net amount | |
| | | |
Citigroup Global Markets Inc. | | $ | 279,400 | | | $ | (279,400 | ) | | $ | 0 | |
| | | |
National Financial Services LLC | | | 263,304 | | | | (263,304 | ) | | | 0 | |
| 1 | Collateral received within this table is limited to the collateral for the net transaction with the counterparty. |
7. BANK BORROWINGS
The Trust (excluding the money market funds), Wells Fargo Master Trust and Wells Fargo Variable Trust are parties to a $350,000,000 revolving credit agreement whereby the Fund is permitted to use bank borrowings for temporary or emergency purposes, such as to fund shareholder redemption requests. Interest under the credit agreement is charged to the Fund based on a borrowing rate equal to the higher of the Federal Funds rate in effect on that day plus 1.25% or the overnight LIBOR rate in effect on that day plus 1.25%. In addition, an annual commitment fee equal to 0.25% of the unused balance is allocated to each participating fund.
For the six months ended September 30, 2020, there were no borrowings by the Fund under the agreement.
8. INDEMNIFICATION
Under the Fund’s organizational documents, the officers and Trustees have been granted certain indemnification rights against certain liabilities that may arise out of performance of their duties to the Fund. The Fund has entered into a separate agreement with each Trustee that converts indemnification rights currently existing under the Fund’s organizational documents into contractual rights that cannot be changed in the future without the consent of the Trustee. Additionally, in the normal course of business, the Fund may enter into contracts with service providers that contain a variety of indemnification clauses. The Fund’s maximum exposure under these arrangements is dependent on future claims that may be made against the Fund and, therefore, cannot be estimated.
9. NEW ACCOUNTING PRONOUNCEMENT
In August 2018, FASB issued Accounting Standards Update (“ASU”) No. 2018-13, Fair Value Measurement (Topic 820) Disclosure Framework—Changes to the Disclosure Requirements for Fair Value Measurement. ASU 2018-13 updates the disclosure requirements on fair value measurements in Topic 820, Fair Value Measurements. The amendments are effective for fiscal years, and interim periods within those fiscal years, beginning after December 15, 2019. Management has adopted this guidance which did not have a material impact on the financial statements.
10. CORONAVIRUS (COVID-19) PANDEMIC
On March 11, 2020, the World Health Organization announced that it had made the assessment that coronavirus disease 2019 (“COVID-19”) is a pandemic. The impacts of COVID-19 are adversely affecting the entire global economy, individual companies and investment products, and the market in general. There is significant uncertainty around the extent and duration of business disruptions related to COVID-19 and the impacts may be short term or may last for an extended period of time. The risk of further spreading of COVID-19 has led to significant uncertainty and volatility in the financial markets.
Wells Fargo Intrinsic Small Cap Value Fund | 25
Other information (unaudited)
PROXY VOTING INFORMATION
A description of the policies and procedures used to determine how to vote proxies relating to portfolio securities is available, upon request, by calling 1-800-222-8222, visiting our website at wfam.com, or visiting the SEC website at sec.gov. Information regarding how the proxies related to portfolio securities were voted during the most recent 12-month period ended June 30 is available on the website at wfam.com or by visiting the SEC website at sec.gov.
QUARTERLY PORTFOLIO HOLDINGS INFORMATION
The Fund files its complete schedule of portfolio holdings with the SEC for the first and third quarters of each fiscal year as an exhibit to its reports on Form N-PORT. Shareholders may view the filed Form N-PORT by visiting the SEC website at sec.gov.
26 | Wells Fargo Intrinsic Small Cap Value Fund
Other information (unaudited)
BOARD OF TRUSTEES AND OFFICERS
Each of the Trustees and Officers1 listed in the table below acts in identical capacities for each fund in the Wells Fargo family of funds, which consists of 142 mutual funds comprising the Wells Fargo Funds Trust, Wells Fargo Variable Trust, Wells Fargo Master Trust and four closed-end funds (collectively the “Fund Complex”). This table should be read in conjunction with the Prospectus and the Statement of Additional Information2. The mailing address of each Trustee and Officer is 525 Market Street, 12th Floor, San Francisco, CA 94105. Each Trustee and Officer serves an indefinite term, however, each Trustee serves such term until reaching the mandatory retirement age established by the Trustees.
Independent Trustees
| | | | | | |
Name and
year of birth | | Position held and
length of service* | | Principal occupations during past five years or longer | | Current other
public company or
investment
company
directorships |
| | | |
| William R. Ebsworth (Born 1957) | | Trustee, since 2015 | | Retired. From 1984 to 2013, equities analyst, portfolio manager, research director and chief investment officer at Fidelity Management and Research Company in Boston, Tokyo, and Hong Kong, and retired in 2013 as Chief Investment Officer of Fidelity Strategic Advisers, Inc. where he led a team of investment professionals managing client assets. Prior thereto, Board member of Hong Kong Securities Clearing Co., Hong Kong Options Clearing Corp., the Thailand International Fund, Ltd., Fidelity Investments Life Insurance Company, and Empire Fidelity Investments Life Insurance Company. Audit Committee Chair and Investment Committee Chair of the Vincent Memorial Hospital Endowment (non-profit organization). Mr. Ebsworth is a CFA® charterholder. | | N/A |
| | | |
| Jane A. Freeman (Born 1953) | | Trustee, since 2015; Chair Liaison, since 2018 | | Retired. From 2012 to 2014 and 1999 to 2008, Chief Financial Officer of Scientific Learning Corporation. From 2008 to 2012, Ms. Freeman provided consulting services related to strategic business projects. Prior to 1999, Portfolio Manager at Rockefeller & Co. and Scudder, Stevens & Clark. Board member of the Harding Loevner Funds from 1996 to 2014, serving as both Lead Independent Director and chair of the Audit Committee. Board member of the Russell Exchange Traded Funds Trust from 2011 to 2012 and the chair of the Audit Committee. Ms. Freeman is also an inactive Chartered Financial Analyst. | | N/A |
| | | |
| Isaiah Harris, Jr. (Born 1952) | | Trustee, since 2009; Audit Committee Chairman, since 2019 | | Retired. Chairman of the Board of CIGNA Corporation since 2009, and Director since 2005. From 2003 to 2011, Director of Deluxe Corporation. Prior thereto, President and CEO of BellSouth Advertising and Publishing Corp. from 2005 to 2007, President and CEO of BellSouth Enterprises from 2004 to 2005 and President of BellSouth Consumer Services from 2000 to 2003. Emeritus member of the Iowa State University Foundation Board of Governors. Emeritus Member of the Advisory Board of Iowa State University School of Business. Advisory Board Member, Palm Harbor Academy (private school). Mr. Harris is a certified public accountant (inactive status). | | CIGNA Corporation |
| | | |
| Judith M. Johnson (Born 1949) | | Trustee, since 2008 | | Retired. Prior thereto, Chief Executive Officer and Chief Investment Officer of Minneapolis Employees Retirement Fund from 1996 to 2008. Ms. Johnson is an attorney, certified public accountant and a certified managerial accountant. | | N/A |
| | | |
| David F. Larcker (Born 1950) | | Trustee, since 2009 | | James Irvin Miller Professor of Accounting at the Graduate School of Business (Emeritus), Stanford University, Director of the Corporate Governance Research Initiative and Senior Faculty of The Rock Center for Corporate Governance since 2006. From 2005 to 2008, Professor of Accounting at the Graduate School of Business, Stanford University. Prior thereto, Ernst & Young Professor of Accounting at The Wharton School, University of Pennsylvania from 1985 to 2005. | | N/A |
Wells Fargo Intrinsic Small Cap Value Fund | 27
Other information (unaudited)
| | | | | | |
Name and
year of birth | | Position held and
length of service* | | Principal occupations during past five years or longer | | Current other
public company or
investment
company
directorships |
| | | |
| Olivia S. Mitchell (Born 1953) | | Trustee, since 2006; Nominating and Governance Committee Chair, since 2018 | | International Foundation of Employee Benefit Plans Professor, Wharton School of the University of Pennsylvania since 1993. Director of Wharton’s Pension Research Council and Boettner Center on Pensions & Retirement Research, and Research Associate at the National Bureau of Economic Research. Previously, Cornell University Professor from 1978 to 1993. | | N/A |
| | | |
| Timothy J. Penny (Born 1951) | | Trustee, since 1996; Chairman, since 2018 | | President and Chief Executive Officer of Southern Minnesota Initiative Foundation, a non-profit organization, since 2007. Member of the Board of Trustees of NorthStar Education Finance, Inc., a non-profit organization, since 2007. | | N/A |
| | | |
| James G. Polisson (Born 1959) | | Trustee, since 2018 | | Retired. Chief Marketing Officer, Source (ETF) UK Services, Ltd, from 2015 to 2017. From 2012 to 2015, Principal of The Polisson Group, LLC, a management consulting, corporate advisory and principal investing company. Chief Executive Officer and Managing Director at Russell Investments, Global Exchange Traded Funds from 2010 to 2012. Managing Director of Barclays Global Investors from 1998 to 2010 and Global Chief Marketing Officer for iShares and Barclays Global Investors from 2000 to 2010. Trustee of the San Francisco Mechanics’ Institute, a non-profit organization, from 2013 to 2015. Board member of the Russell Exchange Traded Fund Trust from 2011 to 2012. Director of Barclays Global Investors Holdings Deutschland GmbH from 2006 to 2009. Mr. Polisson is an attorney and has a retired status with the Massachusetts and District of Columbia Bar Associations. | | N/A |
| | | |
| Pamela Wheelock (Born 1959) | | Trustee, since January 2020; previously Trustee from January 2018 to July 2019 | | Board member of the Destination Medical Center Economic Development Agency, Rochester, Minnesota since 2019. Interim President of the McKnight Foundation from January to September 2020. Acting Commissioner, Minnesota Department of Human Services, July 2019 through September 2019. Human Services Manager (part-time), Minnesota Department of Human Services, October 2019 through December 2019. Chief Operating Officer, Twin Cities Habitat for Humanity from 2017 to 2019. Vice President of University Services, University of Minnesota from 2012 to 2016. Prior thereto, on the Board of Directors, Governance Committee and Finance Committee for the Minnesota Philanthropy Partners (Saint Paul Foundation) from 2012 to 2018, Interim Chief Executive Officer of Blue Cross Blue Shield of Minnesota from 2011 to 2012, Chairman of the Board from 2009 to 2012 and Board Director from 2003 to 2015. Vice President, Leadership and Community Engagement, Bush Foundation, Saint Paul, Minnesota (a private foundation) from 2009 to 2011. Executive Vice President and Chief Financial Officer, Minnesota Sports and Entertainment from 2004 to 2009 and Senior Vice President from 2002 to 2004. Executive Vice President of the Minnesota Wild Foundation from 2004 to 2008. Commissioner of Finance, State of Minnesota, from 1999 to 2002. Currently Board Chair of the Minnesota Wild Foundation since 2010. | | N/A |
| * | Length of service dates reflect the Trustee’s commencement of service with the Trust’s predecessor entities, where applicable. |
28 | Wells Fargo Intrinsic Small Cap Value Fund
Other information (unaudited)
Officers
| | | | |
Name and
year of birth | | Position held and
length of service | | Principal occupations during past five years or longer |
| | |
| Andrew Owen (Born 1960) | | President, since 2017 | | Executive Vice President of Wells Fargo & Company and Head of Affiliated Managers, Wells Fargo Asset Management, since 2014. In addition, Mr. Owen is currently President, Chief Executive Officer and Director of Wells Fargo Funds Management, LLC since 2017. Prior thereto, Executive Vice President responsible for marketing, investments and product development for Wells Fargo Funds Management, LLC, from 2009 to 2014. |
| | |
| Nancy Wiser1 (Born 1967) | | Treasurer, since 2012 | | Executive Vice President of Wells Fargo Funds Management, LLC since 2011. Chief Operating Officer and Chief Compliance Officer at LightBox Capital Management LLC, from 2008 to 2011. |
| | |
| Michelle Rhee (Born 1966) | | Chief Legal Officer, since 2019 | | Secretary of Wells Fargo Funds Management, LLC, Chief Legal Counsel of Wells Fargo Asset Management and Assistant General Counsel of Wells Fargo Bank, N.A. since 2018. Associate General Counsel and Managing Director of Bank of America Corporation from 2004 to 2018. |
| | |
| Catherine Kennedy (Born 1969) | | Secretary, since 2019 | | Vice President of Wells Fargo Funds Management, LLC and Senior Counsel of the Wells Fargo Legal Department since 2010. Vice President and Senior Counsel of Evergreen Investment Management Company, LLC from 1998 to 2010. |
| | |
| Michael H. Whitaker (Born 1967) | | Chief Compliance Officer, since 2016 | | Chief Compliance Officer of Wells Fargo Asset Management since 2016. Senior Vice President and Chief Compliance Officer for Fidelity Investments from 2007 to 2016. |
| | |
| Jeremy DePalma1 (Born 1974) | | Assistant Treasurer, since 2009 | | Senior Vice President of Wells Fargo Funds Management, LLC since 2009. Senior Vice President of Evergreen Investment Management Company, LLC from 2008 to 2010 and head of the Fund Reporting and Control Team within Fund Administration from 2005 to 2010. |
| 1 | Nancy Wiser acts as Treasurer of 65 funds in the Fund Complex. Jeremy DePalma acts as the Treasurer of 77 funds and Assistant Treasurer of 65 funds in the Fund Complex. |
| 2 | The Statement of Additional Information includes additional information about the Trustees and is available, without charge, upon request, by calling 1-800-222-8222 or by visiting the website at wfam.com. |
Wells Fargo Intrinsic Small Cap Value Fund | 29
Other information (unaudited)
BOARD CONSIDERATION OF INVESTMENT MANAGEMENT AND SUB-ADVISORY AGREEMENTS:
Wells Fargo Intrinsic Small Cap Value Fund
Under the Investment Company Act of 1940 (the “1940 Act”), the Board of Trustees (the “Board”) of Wells Fargo Funds Trust (the “Trust”) must determine annually whether to approve the continuation of the Trust’s investment management and sub-advisory agreements. In this regard, at a Board meeting held on May 26, 2020 and May 28, 2020 (together, the “Meeting”), the Board, all the members of which have no direct or indirect interest in the investment management and sub-advisory agreements and are not “interested persons” of the Trust, as defined in the 1940 Act (the “Independent Trustees”), reviewed and approved for Wells Fargo Intrinsic Small Cap Value Fund (the “Fund”): (i) an investment management agreement (the “Management Agreement”) with Wells Fargo Funds Management, LLC (“Funds Management”); and (ii) an investment sub-advisory agreement (the “Sub-Advisory Agreement”) with Wells Capital Management Incorporated (the “Sub-Adviser”), an affiliate of Funds Management. The Management Agreement and the Sub-Advisory Agreement are collectively referred to as the “Advisory Agreements.”
At the Meeting, the Board considered the factors and reached the conclusions described below relating to the selection of Funds Management and the Sub-Adviser and the approval of the Advisory Agreements. Prior to the Meeting, including at a Board meeting held in April 2020, the Trustees conferred extensively among themselves and with representatives of Funds Management about these matters. Also, the Board has adopted a team-based approach, with each team consisting of a sub-set of Trustees, to assist the full Board in the discharge of its duties in reviewing investment performance and other matters throughout the year. The Independent Trustees were assisted in their evaluation of the Advisory Agreements by independent legal counsel, from whom they received separate legal advice and with whom they met separately.
In providing information to the Board, Funds Management and the Sub-Adviser were guided by a detailed set of requests for information submitted to them by independent legal counsel on behalf of the Independent Trustees at the start of the Board’s annual contract renewal process earlier in 2020. In considering and approving the Advisory Agreements, the Trustees considered the information they believed relevant, including but not limited to the information discussed below. The Board considered not only the specific information presented in connection with the Meeting, but also the knowledge gained over time through interaction with Funds Management and the Sub-Adviser about various topics. In this regard, the Board reviewed reports of Funds Management at each of its quarterly meetings, which included, among other things, portfolio reviews and investment performance reports. In addition, the Board and the teams mentioned above confer with portfolio managers at various times throughout the year. The Board did not identify any particular information or consideration that was all-important or controlling, and each individual Trustee may have attributed different weights to various factors.
After its deliberations, the Board unanimously approved the continuation of the Advisory Agreements for a one-year term and determined that the compensation payable to Funds Management and the Sub-Adviser under each of the Advisory Agreements was reasonable. The Board considered the approval of the Advisory Agreements for the Fund as part of its consideration of agreements for funds across the complex, but its approvals were made on a fund-by-fund basis. The following summarizes a number of important, but not necessarily all, factors considered by the Board in support of its approvals.
Nature, extent and quality of services
The Board received and considered various information regarding the nature, extent and quality of services provided to the Fund by Funds Management and the Sub-Adviser under the Advisory Agreements. This information included a description of the investment advisory services and Fund-level administrative services covered by the Management Agreement, as well as, among other things, a summary of the background and experience of senior management of Wells Fargo Asset Management (“WFAM”), of which Funds Management and the Sub-Adviser are a part, and a summary of investments made in the business of WFAM. The Board also received a description of Funds Management’s and the Sub-Adviser’s business continuity plans and of their approaches to data privacy and cybersecurity, and related testing. The Board also received and reviewed information about Funds Management’s role as administrator of the Fund’s liquidity risk management program, Funds Management’s approach to risk management, and Funds Management’s intermediary and vendor oversight program.
The Board also considered the qualifications, background, tenure and responsibilities of each of the portfolio managers primarily responsible for the day-to-day portfolio management of the Fund. The Board evaluated the ability of Funds Management and the Sub-Adviser to attract and retain qualified investment professionals, including research, advisory and supervisory personnel. The Board further considered the compliance programs and compliance records of Funds Management and the Sub-Adviser. In addition, the Board took into account the full range of services provided to the Fund by Funds Management and its affiliates.
30 | Wells Fargo Intrinsic Small Cap Value Fund
Other information (unaudited)
Fund investment performance and expenses
The Board considered the investment performance results for the Fund over various time periods ended December 31, 2019. The Board also considered more current results for various time periods ended March 31, 2020. The Board considered these results in comparison to the investment performance of funds in a universe that was determined by Broadridge Inc. (“Broadridge”) to be similar to the Fund (the “Universe”), and in comparison to the Fund’s benchmark index and to other comparative data. Broadridge is an independent provider of investment company data. The Board received a description of the methodology used by Broadridge to select the mutual funds in the performance Universe. The Board noted that the investment performance of the Fund (Administrator Class) was higher than or in range of the average investment performance of the Universe for the one-, five- and ten-year periods ended December 31, 2019, but lower than the average investment performance of the Universe for the three-year period ended December 31, 2019. The Board also noted that the investment performance of the Fund (Administrator Class) was lower than the average investment performance of the Universe for all periods ended March 31, 2020. The Board also noted that the investment performance of the Fund was higher than or in range of its benchmark index, the Russell 2000® Value Index, for all periods ended December 31, 2019. The Board also noted that the investment performance of the Fund was lower than its benchmark index, the Russell 2000® Value Index, for the one- and five-year periods ended March 31, 2020, and in range of its benchmark index for the three- and ten-year periods ended March 31, 2020.
The Board received information concerning, and discussed factors contributing to, the underperformance of the Fund relative to the Universe and benchmark for the periods identified above. The Board took note of the explanations for the relative underperformance during these periods, including with respect to investment decisions and market factors that affected the Fund’s investment performance.
The Board also received and considered information regarding the Fund’s net operating expense ratios and their various components, including actual management fees, custodian and other non-management fees, and Rule 12b-1 and non-Rule 12b-1 shareholder service fees. The Board considered these ratios in comparison to the median ratios of funds in class-specific expense groups that were determined by Broadridge to be similar to the Fund (the “Groups”). The Board received a description of the methodology used by Broadridge to select the mutual funds in the expense Groups and an explanation of how funds comprising expense groups and their expense ratios may vary from year-to-year. Based on the Broadridge reports, the Board noted that the net operating expense ratios of the Fund were lower than, equal to or in range of the median net operating expense ratios of the expense Groups for each class share.
The Board took into account the Fund’s investment performance and expense information provided to it among the factors considered in deciding to re-approve the Advisory Agreements.
Investment management and sub-advisory fee rates
The Board reviewed and considered the contractual fee rates payable by the Fund to Funds Management under the Management Agreement, as well as the contractual fee rates payable by the Fund to Funds Management for class-level administrative services under a Class-Level Administration Agreement, which include, among other things, class-level transfer agency and sub-transfer agency costs (collectively, the “Management Rates”). The Board also reviewed and considered the contractual investment sub-advisory fee rates that are payable by Funds Management to the Sub-Adviser for investment sub-advisory services.
Among other information reviewed by the Board was a comparison of the Fund’s Management Rates with the average contractual investment management fee rates of funds in the expense Groups at a common asset level as well as transfer agency costs of the funds in the expense Groups. The Board noted that the Management Rates of the Fund were lower than or in range of the sum of these average rates for the Fund’s expense Groups for all share classes.
The Board also received and considered information about the portion of the total management fee that was retained by Funds Management after payment of the fee to the Sub-Adviser for sub-advisory services. In assessing the reasonableness of this amount, the Board received and evaluated information about the nature and extent of responsibilities retained and risks assumed by Funds Management and not delegated to or assumed by the Sub-Adviser, and about Funds Management’s on-going oversight services. Given the affiliation between Funds Management and the Sub-Adviser, the Board ascribed limited relevance to the allocation of fees between them.
The Board also received and considered information about the nature and extent of services offered and fee rates charged by Funds Management and the Sub-Adviser to other types of clients with investment strategies similar to those of the Fund. In this regard, the Board received information about the significantly greater scope of services, and compliance, reporting and other legal burdens and risks of managing proprietary mutual funds compared with those associated with managing assets of other types of clients, including third-party sub-advised fund clients and non-mutual fund clients such as institutional separate accounts.
Wells Fargo Intrinsic Small Cap Value Fund | 31
Other information (unaudited)
Based on its consideration of the factors and information it deemed relevant, including those described here, the Board determined that the compensation payable to Funds Management under the Management Agreement and to the Sub-Adviser under the Sub-Advisory Agreement was reasonable.
Profitability
The Board received and considered information concerning the profitability of Funds Management, as well as the profitability of both WFAM and Wells Fargo & Co. (“Wells Fargo”) from providing services to the fund family as a whole. The Board noted that the Sub-Adviser’s profitability information with respect to providing services to the Fund and other funds in the family was subsumed in the WFAM and Wells Fargo profitability analysis.
Funds Management reported on the methodologies and estimates used in calculating profitability, including a description of the methodology used to allocate certain expenses. Among other things, the Board noted that the levels of profitability reported on a fund-by-fund basis varied widely, depending on factors such as the size, type and age of fund.
Based on its review, the Board did not deem the profits reported by Funds Management, WFAM or Wells Fargo from services provided to the Fund to be at a level that would prevent it from approving the continuation of the Advisory Agreements.
Economies of scale
The Board received and considered information about the potential for Funds Management to experience economies of scale in the provision of management services to the Fund, the difficulties of calculating economies of scale at an individual fund level, and the extent to which potential scale benefits are shared with shareholders. The Board noted the existence of breakpoints in the Fund’s management fee structure, which operate generally to reduce the Fund’s expense ratios as the Fund grows in size, and the size of the Fund in relation to such breakpoints. The Board considered that in addition to management fee breakpoints, Funds Management shares potential economies of scale from its management business in a variety of ways, including through fee waiver and expense reimbursement arrangements, services that benefit shareholders, competitive management fee rates set at the outset without regard to breakpoints, and investments in the business intended to enhance services available to shareholders.
The Board concluded that Funds Management’s arrangements with respect to the Fund, including contractual breakpoints, constituted a reasonable approach to sharing potential economies of scale with the Fund and its shareholders.
Other benefits to Funds Management and the Sub-Adviser
The Board received and considered information regarding potential “fall-out” or ancillary benefits received by Funds Management and its affiliates, including the Sub-Adviser, as a result of their relationships with the Fund. Ancillary benefits could include, among others, benefits directly attributable to other relationships with the Fund and benefits potentially derived from an increase in Funds Management’s and the Sub-Adviser’s business as a result of their relationships with the Fund. The Board noted that various affiliates of Funds Management may receive distribution-related fees, shareholder servicing payments and sub-transfer agency fees in respect of shares sold or held through them and services provided.
The Board also reviewed information about soft dollar credits earned and utilized by the Sub-Adviser, fees earned by Funds Management and the Sub-Adviser from managing a private investment vehicle for the fund family’s securities lending collateral, and commissions earned by an affiliated broker from portfolio transactions.
Based on its consideration of the factors and information it deemed relevant, including those described here, the Board did not find that any ancillary benefits received by Funds Management and its affiliates, including the Sub-Adviser, were unreasonable.
Conclusion
At the Meeting, after considering the above-described factors and based on its deliberations and its evaluation of the information described above, the Board unanimously approved the continuation of the Advisory Agreements for a one-year term and determined that the compensation payable to Funds Management and the Sub-Adviser under each of the Advisory Agreements was reasonable.
32 | Wells Fargo Intrinsic Small Cap Value Fund
Other information (unaudited)
LIQUIDITY RISK MANAGEMENT PROGRAM
In accordance with Rule 22e-4 under the Investment Company Act of 1940, as amended (the “Liquidity Rule”), Wells Fargo Funds Trust (the “Trust”) has adopted and implemented a liquidity risk management program (the “Program”) on behalf of each of its series, including the Fund, which is reasonably designed to assess and manage the Fund’s liquidity risk. “Liquidity risk” is defined as the risk that the Fund is unable to meet redemption requests without significantly diluting remaining investors’ interests in the Fund. The Trust’s Board of Trustees (the “Board”) previously approved the designation of Wells Fargo Funds Management, LLC (“Funds Management”), the Fund’s investment manager, as the administrator of the Program, and Funds Management has established a Liquidity Risk Management Council composed of personnel from multiple departments within Funds Management and its affiliates to assist Funds Management in the implementation and on-going administration of the Program.
The Program is comprised of various components designed to support the assessment and/or management of liquidity risk, including: (1) the periodic assessment (no less frequently than annually) of certain factors that influence the Fund’s liquidity risk; (2) the periodic classification (no less frequently than monthly) of the Fund’s investments into one of four liquidity categories that reflect an estimate of their liquidity under current market conditions; (3) a 15% limit on the acquisition of “illiquid investments” (as defined under the Liquidity Rule); (4) to the extent the Fund does not invest primarily in “highly liquid investments” (as defined under the Liquidity Rule), the determination of a minimum percentage of the Fund’s assets that generally will be invested in highly liquid investments (an “HLIM”); (5) if the Fund has established an HLIM, the periodic review (no less frequently than annually) of the HLIM and the adoption of policies and procedures for responding to a shortfall of the Fund’s “highly liquid investments” below its HLIM; and (6) periodic reporting to the Board.
At a meeting of the Board held on May 26 and 28, 2020, the Board received a written report (the “Report”) from Funds Management that addressed the operation of the Program and assessed its adequacy and effectiveness of implementation. The Report covered the initial period from December 1, 2018 through December 31, 2019 (the “Reporting Period”). No significant liquidity events impacting the Fund were noted in the Report. There were no material changes to the Program during the Reporting Period. The Report concluded that the Program is operating effectively to assess and manage the Fund’s liquidity risk, and that the Program has been and continues to be adequately and effectively implemented to monitor and, as applicable, respond to the Fund’s liquidity developments.
There can be no assurance that the Program will achieve its objectives under all circumstances in the future. Please refer to the Fund’s prospectus for more information regarding the Fund’s exposure to liquidity risk and other risks to which an investment in the Fund may be subject.
Wells Fargo Intrinsic Small Cap Value Fund | 33
Appendix I (unaudited)
Effective June 1, 2020, shareholders purchasing Fund shares through an Oppenheimer & Co. Inc. (“Oppenheimer”) platform or account are eligible only for the following load waivers (front-end sales charge waivers and contingent deferred or back-end, sales charge waivers) and discounts, which may differ from those disclosed in the Fund’s Prospectus or SAI.
|
| Front-end Sales Load Waivers on Class A Shares available at Oppenheimer |
|
| Employer-sponsored retirement, deferred compensation and employee benefit plans (including health savings accounts) and trusts used to fund those plans, provided that the shares are not held in a commission-based brokerage account and shares are held for the benefit of the plan. |
|
| Shares purchased by or through a 529 Plan. |
|
| Shares purchased through an Oppenheimer affiliated investment advisory program. |
|
| Shares purchased through reinvestment of capital gains distributions and dividend reinvestment when purchasing shares of the same fund (but not any other fund within the fund family). |
|
| Shares purchased from the proceeds of redemptions within the same fund family, provided (1) the repurchase occurs within 90 days following the redemption, (2) the redemption and purchase occur in the same account, and (3) redeemed shares were subject to a front-end or deferred sales load (known as Rights of Restatement). |
|
| A shareholder in the Fund’s Class C shares will have their shares exchanged at net asset value to Class A shares (or the appropriate share class) of the Fund if the shares are no longer subject to a CDSC and the exchange is in line with the policies and procedures of Oppenheimer. |
|
| Employees and registered representatives of Oppenheimer or its affiliates and their family members. |
|
| Directors or Trustees of the Fund, and employees of the Fund’s investment adviser or any of its affiliates, as described in the Prospectus. |
| CDSC Waivers on A and C Shares available at Oppenheimer |
|
| Death or disability of the shareholder. |
|
| Shares sold as part of a systematic withdrawal plan as described in the Prospectus. |
|
| Return of excess contributions from an IRA Account. |
|
| Shares sold as part of a required minimum distribution for IRA and retirement accounts due to the shareholder reaching the qualified age based on applicable IRS regulations as described in the Prospectus. |
|
| Shares sold to pay Oppenheimer fees but only if the transaction is initiated by Oppenheimer. |
|
| Shares acquired through a right of reinstatement. |
| Front-end load Discounts Available at Oppenheimer: Breakpoints, Rights of Accumulation & Letters of Intent |
|
| Breakpoints as described in the Prospectus. |
|
| Rights of Accumulation (ROA), which entitle shareholders to breakpoint discounts, will be automatically calculated based on the aggregated holding of fund family assets held by accounts within the purchaser’s household at Oppenheimer. Eligible fund family assets not held at Oppenheimer may be included in the ROA calculation only if the shareholder notifies his or her financial advisor about such assets. |
34 | Wells Fargo Intrinsic Small Cap Value Fund
Appendix II (unaudited)
Effective June 15, 2020, shareholders purchasing fund shares through a Robert W. Baird & Co. (“Baird”) platform or account will only be eligible for the following sales charge waivers (front-end sales charge waivers and CDSC waivers) and discounts, which may differ from those disclosed elsewhere in the Fund’s Prospectus or the SAI.
|
| Front-end Sales Load Waivers on Class A Shares available at Baird |
|
| Shares purchased through reinvestment of capital gains distributions and dividend reinvestment when purchasing share of the same fund. |
|
| Share purchase by employees and registers representatives of Baird or its affiliate and their family members as designated by Baird. |
|
| Shares purchase from the proceeds of redemptions within the same fund family, provided (1) the repurchase occurs within 90 days following the redemption, (2) the redemption and purchase occur in the same accounts, and (3) redeemed shares were subject to a front-end or deferred sales charge (known as rights of reinstatement). |
|
| A shareholder in the Funds Investor C Shares will have their share exchanged at net asset value to Investor A shares of the fund if the shares are no longer subject to CDSC and the exchange is in line with the policies and procedures of Baird. |
|
| Employer-sponsored retirement plans or charitable accounts in a transactional brokerage account at Baird, including 401(k) plans, 457 plans, employer-sponsored 403(b) plans, profit sharing and money purchase pension plans and defined benefit plans. For purposes of this provision, employer-sponsored retirement plans do not include SEP IRAs, Simple IRAs or SAR-SEPs. |
| CDSC Waivers on A and C Shares available at Baird |
|
| Shares sold due to death or disability of the shareholder. |
|
| Shares sold as part of a systematic withdrawal plan as described in the Fund’s Prospectus. |
|
| Shares bought due to returns of excess contributions from an IRA Account. |
|
| Shares sold as part of a required minimum distribution for IRA and retirement accounts due to the shareholder reaching age 72 as described in the Fund’s Prospectus. |
|
| Shares sold to pay Baird fees but only if the transaction is initiated by Baird. |
|
| Shares acquired through a right of reinstatement. |
| Front-end load Discounts Available at Baird: Breakpoint and/or Rights of Accumulation |
|
| Breakpoints as described in the Prospectus. |
|
| Rights of accumulations which entitles shareholders to breakpoint discounts will be automatically calculated based on the aggregated holding of fund family assets held by accounts within the purchaser’s household at Baird. Eligible fund family assets not held at Baird may be included in the rights of accumulations calculation only if the shareholder notifies his or her financial advisor about such assets. |
|
| Letters of Intent (LOI) allow for breakpoint discounts based on anticipated purchases within a fund family through Baird, over a 13-month period of time. |
Wells Fargo Intrinsic Small Cap Value Fund | 35
This page is intentionally left blank.

For more information
More information about Wells Fargo Funds is available free upon request. To obtain literature, please write, visit the Fund’s website, or call:
Wells Fargo Funds
P.O. Box 219967
Kansas City, MO 64121-9967
Website: wfam.com
Individual investors: 1-800-222-8222
Retail investment professionals: 1-888-877-9275
Institutional investment professionals: 1-866-765-0778

This report and the financial statements contained herein are submitted for the general information of the shareholders of the Fund. If this report is used for promotional purposes, distribution of the report must be accompanied or preceded by a current prospectus. Before investing, please consider the investment objectives, risks, charges, and expenses of the investment. For a current prospectus and, if available, a summary prospectus, containing this information, call 1-800-222-8222 or visit the Fund’s website at wfam.com. Read the prospectus carefully before you invest or send money.
Wells Fargo Asset Management (WFAM) is the trade name for certain investment advisory/management firms owned by Wells Fargo & Company. These firms include but are not limited to Wells Capital Management Incorporated and Wells Fargo Funds Management, LLC. Certain products managed by WFAM entities are distributed by Wells Fargo Funds Distributor, LLC (a broker-dealer and Member FINRA).
This material is for general informational and educational purposes only and is NOT intended to provide investment advice or a recommendation of any kind—including a recommendation for any specific investment, strategy, or plan.
INVESTMENT PRODUCTS: NOT FDIC INSURED ◾ NO BANK GUARANTEE ◾ MAY LOSE VALUE
© 2020 Wells Fargo & Company. All rights reserved.
PAR-1020-00575 11-20
SA242/SAR242 09-20
Semi-Annual Report
September 30, 2020
Wells Fargo
Special Small Cap Value Fund
Beginning on January 1, 2021, as permitted by new regulations adopted by the Securities and Exchange Commission, paper copies of the Wells Fargo Funds’ annual and semi-annual shareholder reports issued after this date will no longer be sent by mail, unless you specifically request paper copies of the reports. Instead, the reports will be made available on the Funds’ website, and you will be notified by mail each time a report is posted and provided with a website address to access the report.
If you already elected to receive shareholder reports electronically, you will not be affected by this change and you need not take any action. You may elect to receive shareholder reports and other communications from the Fund electronically at any time by contacting your financial intermediary (such as a broker-dealer or bank) or, if you are a direct investor, by calling 1-800-222-8222 or by enrolling at wellsfargo.com/advantagedelivery.
You may elect to receive all future reports in paper free of charge. If you invest through a financial intermediary, you can contact your financial intermediary to request that you continue to receive paper copies of your shareholder reports; if you invest directly with the Fund, you can call 1-800-222-8222. Your election to receive reports in paper will apply to all Wells Fargo Funds held in your account with your financial intermediary or, if you are a direct investor, to all Wells Fargo Funds that you hold.
|
|
|
Reduce clutter. Save trees. |
Sign up for electronic delivery of prospectuses and shareholder reports at wellsfargo.com/
advantagedelivery |
The views expressed and any forward-looking statements are as of September 30, 2020, unless otherwise noted, and are those of the Fund’s portfolio managers and/or Wells Fargo Asset Management. Discussions of individual securities, or the markets generally, or any Wells Fargo Fund are not intended as individual recommendations. Future events or results may vary significantly from those expressed in any forward-looking statements. The views expressed are subject to change at any time in response to changing circumstances in the market. Wells Fargo Asset Management and the Fund disclaim any obligation to publicly update or revise any views expressed or forward-looking statements.
INVESTMENT PRODUCTS: NOT FDIC INSURED ◾ NO BANK GUARANTEE ◾ MAY LOSE VALUE
Wells Fargo Special Small Cap Value Fund | 1
Letter to shareholders (unaudited)

Andrew Owen
President
Wells Fargo Funds
“As the six-month period began in April, markets rebounded strongly from an earlier sharp sell-off, fueled by unprecedented government and central bank stimulus measures.”
Dear Shareholder:
We are pleased to offer you this semi-annual report for the Wells Fargo Special Small Cap Value Fund for the six-month period that ended September 30, 2020. Global stock markets experienced unprecedented volatility in response to drastic government measures to stop the spread of COVID-19 at the expense of short-term economic output. However, financial markets rebounded from April on to more than offset earlier losses as central banks bolstered capital markets and confidence. Stocks rallied broadly with U.S. equities leading the way while bonds had more modest returns for the six-month period.
For the period, U.S. stocks, based on the S&P 500 Index,1 returned 31.31% and international stocks, as measured by the MSCI ACWI ex USA Index (Net),2 gained 23.38%. The MSCI EM Index (Net)3 gained a robust 29.37%. Among bond investments, the Bloomberg Barclays U.S. Aggregate Bond Index4 added 3.53%, the Bloomberg Barclays Global Aggregate ex-USD Index5 returned 7.66%, the Bloomberg Barclays Municipal Bond Index6 had a 3.99% return, and the ICE BofA U.S. High Yield Index7 gained 14.76%.
Concerns about COVID-19 took over the market.
As the six-month period began in April, markets rebounded strongly from an earlier sharp sell-off, fueled by unprecedented government and central bank stimulus measures. The U.S. economy contracted by an annualized 5.0% pace in the first quarter, with 30 million new unemployment insurance claims in six weeks. In the eurozone, first-quarter real gross domestic product (GDP) shrank 3.8%, with the composite April Flash Purchasing Managers’ Index (PMI), a monthly survey of purchasing managers, falling to an all-time low of 13.5. The European Central Bank expanded its quantitative easing to include the purchase of additional government bonds of countries with the greatest virus-related need, including Italy and Spain. China’s first-quarter GDP fell by 6.8% year over year. However, retail sales, production, and investment showed signs of recovery. Extreme oil-price volatility continued as global supply far exceeded demand.
The equity market rebound continued in May, with widespread strong monthly gains. Investors regained confidence on reports of early signs of success in human trials of a COVID-19 vaccine. Growth stocks continued to outperform value stocks while returns on global government bonds were generally flat. In the U.S., a gap grew between the stock market rebound and devastating economic data points, including an April unemployment rate of 14.7%, the highest level since World War II. PMIs continued to reflect weakening activity in May in both the manufacturing and services sectors. U.S.
| 1 | The S&P 500 Index consists of 500 stocks chosen for market size, liquidity, and industry group representation. It is a market-value-weighted index with each stock’s weight in the index proportionate to its market value. You cannot invest directly in an index. |
| 2 | The Morgan Stanley Capital International (MSCI) All Country World Index (ACWI) ex USA Index (Net) is a free-float-adjusted market-capitalization-weighted index that is designed to measure the equity market performance of developed and emerging markets, excluding the United States. Source: MSCI. MSCI makes no express or implied warranties or representations and shall have no liability whatsoever with respect to any MSCI data contained herein. The MSCI data may not be further redistributed or used as a basis for other indices or any securities or financial products. This report is not approved, reviewed, or produced by MSCI. You cannot invest directly in an index. |
| 3 | The MSCI Emerging Markets (EM) Index (Net) is a free-float-adjusted market-capitalization-weighted index that is designed to measure equity market performance of emerging markets. You cannot invest directly in an index. |
| 4 | The Bloomberg Barclays U.S. Aggregate Bond Index is a broad-based benchmark that measures the investment-grade, U.S. dollar-denominated, fixed-rate taxable bond market, including Treasuries, government-related and corporate securities, mortgage-backed securities (agency fixed-rate and hybrid adjustable-rate mortgage pass-throughs), asset-backed securities, and commercial mortgage-backed securities. You cannot invest directly in an index. |
| 5 | The Bloomberg Barclays Global Aggregate ex-USD Index is an unmanaged index that provides a broad-based measure of the global investment-grade fixed-income markets excluding the U.S. dollar-denominated debt market. You cannot invest directly in an index. |
| 6 | The Bloomberg Barclays Municipal Bond Index is an unmanaged index composed of long-term tax-exempt bonds with a minimum credit rating of Baa. You cannot invest directly in an index. |
| 7 | The ICE BofA U.S. High Yield Index is a market-capitalization-weighted index of domestic and Yankee high-yield bonds. The index tracks the performance of high-yield securities traded in the U.S. bond market. You cannot invest directly in an index. Copyright 2020. ICE Data Indices, LLC. All rights reserved. |
2 | Wells Fargo Special Small Cap Value Fund
Letter to shareholders (unaudited)
corporate earnings reports indicated a 14% year-over-year contraction in earnings from the first quarter of 2019. However, high demand for technology, driven by remote activity, helped maintain robust information technology sector earnings, which helped drive leading technology stocks higher.
Financial markets posted widely positive returns in June despite ongoing economic weakness and high levels of uncertainty on the containment of COVID-19 and the timing of an effective vaccine. There were hopeful signs as economies reopened, with U.S. and U.K. retail sales rebounding sharply in May. However, year over year, sales remained depressed. Vitally important to market sentiment was the ongoing commitment by central banks globally to do all they could to provide economic support through liquidity and low borrowing costs. U.S. economic activity was aided by one-time $1,200 stimulus checks and $600 bonus weekly unemployment benefits that expired at the end of July. However, unemployment remained historically high but eased from 14.7% in April to 11.1% in June. At month-end, numerous states reported increases in COVID-19 cases. China’s economic recovery picked up momentum in June, though it remained far from a full recovery.
July was a broadly positive month for both global equities and fixed income. However, economic data and a resurgence of COVID-19 cases pointed to the vulnerability of the global economy and the ongoing imperative to regain control of the pandemic. Second-quarter GDP shrank from the previous quarter by 9.5% and 12.1% in the U.S. and the eurozone, respectively. In contrast, China reported a 3.2% year-over-year expansion in its second-quarter GDP. U.S. unemployment remained high despite adding 1.8 million jobs in July, with a double-digit jobless rate persisting. However, manufacturing activity grew in both the U.S. and the eurozone. In Asia, while China’s manufacturing sector continued to expand, activity in Japan and South Korea contracted. In July, a rising concern was the rapid and broad reemergence of COVID-19 infections.
The stock market continued to rally in August despite concerns over rising numbers of COVID-19 cases in the United States and several European countries, including France and Spain, as well as the expiration of the $600 weekly bonus unemployment benefit at the end of July. U.S. stocks had strong monthly gains, led by the FAANG stocks—Facebook, Apple, Amazon, Netflix, and Google (Alphabet)—which dominate these indices and continued to rally. U.S. stocks generally surpassed other broadly positive global equity performance while fixed-income market monthly returns were broadly flat. Generally stronger-than-expected second-quarter earnings boosted investor sentiment along with the U.S. Federal Reserve’s announcement of a policy shift that will likely lead to longer-term low interest rates and supportive monetary policy. The U.S. flash PMIs for both manufacturing and services beat expectations while U.S. housing market indicators were strong. In Europe, retail sales expanded and consumer confidence remained steady. Overall, developed markets performed better than emerging market equities for the month of August as people took comfort in better-known equities in perceived safer markets.
Stocks grew more volatile in September on mixed economic data. U.S. PMIs showed solid growth in economic activity in both manufacturing and services. However, six months after the bottom fell out of the labor market in the early spring, only half of the 22 million jobs lost had returned. The U.S. unemployment rate fell to 7.9% in September, the fifth straight month of improvement but far higher than the 3.5% pre-COVID-19 rate. Only 661,000 jobs were added for the month, down from 1.5 million in August. Meanwhile, a reported 2.3 million people have given up looking for work. With U.S. Congress failing to pass further fiscal relief and uncertainties surrounding a possible vaccine, doubts crept back into the financial markets. In the U.K., a lack of progress in Brexit talks with the European Union weighed on markets. China’s economy picked up steam, however, with growth fueled by increased global demand and China’s service sector had its strongest PMI reading in seven years.
“The stock market continued to rally in August despite concerns over rising numbers of COVID-19 cases in the United States and several European countries, including France and Spain, as well as the expiration of the $600 weekly bonus unemployment benefit at the end of July.”
Wells Fargo Special Small Cap Value Fund | 3
Letter to shareholders (unaudited)
|
|
|
For further information about your Fund, contact your investment professional, visit our website at wfam.com, or call us directly at 1-800-222-8222. |
Don’t let short-term uncertainty derail long-term investment goals.
Periods of investment uncertainty can present challenges, but experience has taught us that maintaining long-term investment goals can be an effective way to plan for the future. To help you create a sound strategy based on your personal goals and risk tolerance, Wells Fargo Funds offers more than 100 mutual funds spanning a wide range of asset classes and investment styles. Although diversification cannot guarantee an investment profit or prevent losses, we believe it can be an effective way to manage investment risk and potentially smooth out overall portfolio performance. We encourage investors to know their investments and to understand that appropriate levels of risk-taking may unlock opportunities.
Thank you for choosing to invest with Wells Fargo Funds. We appreciate your confidence in us and remain committed to helping you meet your financial needs.
Sincerely,

Andrew Owen
President
Wells Fargo Funds
Notice to Shareholders
At a meeting held on August 10-12, 2020, the Board of Trustees of the Fund approved a change to the Fund’s automatic conversion feature for Class C shares in order to shorten the required holding period from 10 to 8 years. As a result, on a monthly basis beginning November 5, 2020, Class C shares will convert automatically into Class A shares 8 years after the initial date of purchase or, if you acquired your Class C shares through an exchange or conversion from another share class, 8 years after the date you acquired your Class C shares. When Class C shares that you acquired through a purchase or exchange convert, any other Class C shares that you purchased with reinvested dividends and distributions also will convert into Class A shares on a pro rata basis.
Please note that a shorter holding period may apply depending on your intermediary. Please see “Appendix A—Sales Charge Reductions and Waivers for Certain Intermediaries” in the Fund’s prospectus for further information.
4 | Wells Fargo Special Small Cap Value Fund
This page is intentionally left blank.
Performance highlights (unaudited)
The Fund is currently closed to most new investors.1
Investment objective
The Fund seeks long-term capital appreciation.
Manager
Wells Fargo Funds Management, LLC
Subadviser
Wells Capital Management Incorporated
Portfolio managers
Brian Martin, CFA®‡
James M. Tringas, CFA®‡
Bryant VanCronkhite, CFA®‡ , CPA
Average annual total returns (%) as of September 30, 2020
| | | | | | | | | | | | | | | | | | | | | | | | | | | | | | | | | | |
| | | | |
| | | | | Including sales charge | | | Excluding sales charge | | | Expense ratios2 (%) | |
| | | | | | | | | |
| | | Inception date | | 1 year | | | 5 year | | | 10 year | | | 1 year | | | 5 year | | | 10 year | | | Gross | | | Net3 | |
| | | | | | | | | | |
| Class A (ESPAX) | | 5-7-1993 | | | -19.47 | | | | 3.90 | | | | 7.81 | | | | -14.55 | | | | 5.14 | | | | 8.45 | | | | 1.28 | | | | 1.28 | |
| | | | | | | | | | |
| Class C (ESPCX) | | 12-12-2000 | | | -16.11 | | | | 4.37 | | | | 7.65 | | | | -15.11 | | | | 4.37 | | | | 7.65 | | | | 2.03 | | | | 2.03 | |
| | | | | | | | | | |
| Class R (ESPHX)4 | | 9-30-2015 | | | – | | | | – | | | | – | | | | -14.76 | | | | 4.90 | | | | 8.19 | | | | 1.53 | | | | 1.53 | |
| | | | | | | | | | |
| Class R6 (ESPRX)5 | | 10-31-2014 | | | – | | | | – | | | | – | | | | -14.17 | | | | 5.59 | | | | 8.91 | | | | 0.85 | | | | 0.85 | |
| | | | | | | | | | |
| Administrator Class (ESPIX) | | 7-23-1996 | | | – | | | | – | | | | – | | | | -14.48 | | | | 5.25 | | | | 8.64 | | | | 1.20 | | | | 1.20 | |
| | | | | | | | | | |
| Institutional Class (ESPNX) | | 7-30-2010 | | | – | | | | – | | | | – | | | | -14.24 | | | | 5.53 | | | | 8.87 | | | | 0.95 | | | | 0.95 | |
| | | | | | | | | | |
| Russell 2000® Value Index6 | | – | | | – | | | | – | | | | – | | | | -14.88 | | | | 4.11 | | | | 7.09 | | | | – | | | | – | |
Figures quoted represent past performance, which is no guarantee of future results, and do not reflect taxes that a shareholder may pay on an investment in a fund. Investment return and principal value of an investment will fluctuate so that an investor’s shares, when redeemed, may be worth more or less than their original cost. Performance shown without sales charges would be lower if sales charges were reflected. Current performance may be lower or higher than the performance data quoted, which assumes the reinvestment of dividends and capital gains. Current month-end performance is available on the Fund’s website, wfam.com.
Index returns do not include transaction costs associated with buying and selling securities, any mutual fund fees or expenses, or any taxes. It is not possible to invest directly in an index.
For Class A shares, the maximum front-end sales charge is 5.75%. For Class C shares, the maximum contingent deferred sales charge is 1.00%. Performance including a contingent deferred sales charge assumes the sales charge for the corresponding time period. Class R, Class R6, Administrator Class, and Institutional Class shares are sold without a front-end sales charge or contingent deferred sales charge.
Stock values fluctuate in response to the activities of individual companies and general market and economic conditions. Smaller-company stocks tend to be more volatile and less liquid than those of larger companies. Consult the Fund’s prospectus for additional information on these and other risks.
Please see footnotes on page 7.
6 | Wells Fargo Special Small Cap Value Fund
Performance highlights (unaudited)
| | | | |
|
| Ten largest holdings (%) as of September 30, 20207 | |
| | |
Eagle Materials Incorporated | | | 3.24 | |
| | |
Nomad Foods Limited | | | 2.91 | |
| | |
J & J Snack Foods Corporation | | | 2.62 | |
| | |
Franklin Electric Company Incorporated | | | 2.47 | |
| | |
Mueller Industries Incorporated | | | 2.43 | |
| | |
Innospec Incorporated | | | 2.34 | |
| | |
UMB Financial Corporation | | | 2.19 | |
| | |
First Citizens BancShares Corporation Class A | | | 2.12 | |
| | |
Avient Corporation | | | 2.11 | |
| | |
CSW Industrials Incorporated | | | 2.05 | |
|
|
| Sector allocation as of September 30, 20208 |
|
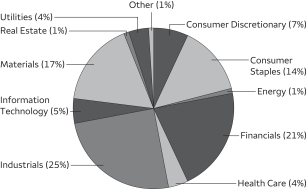 |
| ‡ | CFA® and Chartered Financial Analyst® are trademarks owned by CFA Institute. |
| 1 | Please see the Fund’s current Statement of Additional Information for further details. |
| 2 | Reflects the expense ratios as stated in the most recent prospectuses, which include the impact of 0.01% in acquired fund fees and expenses. The expense ratios shown are subject to change and may differ from the annualized expense ratio shown in the financial highlights of this report, which do not include acquired fund fees and expenses. |
| 3 | The manager has contractually committed through July 31, 2021, to waive fees and/or reimburse expenses to the extent necessary to cap total annual fund operating expenses after fee waivers at 1.31% for Class A, 2.06% for Class C, 1.56% for Class R, 0.89% for Class R6, 1.20% for Administrator Class, and 0.94% for Institutional Class. Brokerage commissions, stamp duty fees, interest, taxes, acquired fund fees and expenses (if any), and extraordinary expenses are excluded from the expense caps. Prior to or after the commitment expiration date, the caps may be increased or the commitment to maintain the caps may be terminated only with the approval of the Board of Trustees. Without these caps, the Fund’s returns would have been lower. The expense ratio paid by an investor is the net expense ratio (the total annual fund operating expenses after fee waivers) as stated in the prospectuses. |
| 5 | Historical performance shown for the Class R shares prior to their inception reflects the performance of the Institutional Class shares adjusted to reflect the higher expenses applicable to the Class R shares. |
| 6 | Historical performance shown for the Class R6 shares prior to their inception reflects the performance of the Institutional Class shares, and includes the higher expenses applicable to the Institutional Class shares. If these expenses had not been included, returns for the Class R6 shares would be higher. |
| 8 | The Russell 2000® Value Index measures the performance of those Russell 2000 companies with lower price/book ratios and lower forecasted growth values. You cannot invest directly in an index. |
| 9 | The ten largest holdings, excluding cash, cash equivalents and any money market funds, are calculated based on the value of the investments divided by total net assets of the Fund. Holdings are subject to change and may have changed since the date specified. |
| 10 | Amounts are calculated based on the total long-term investments of the Fund. These amounts are subject to change and may have changed since the date specified. |
Wells Fargo Special Small Cap Value Fund | 7
Fund expenses (unaudited)
As a shareholder of the Fund, you incur two types of costs: (1) transaction costs, including sales charges (loads) on purchase payments and contingent deferred sales charges (if any) on redemptions and (2) ongoing costs, including management fees, distribution (12b-1) and/or shareholder servicing fees, and other Fund expenses. This example is intended to help you understand your ongoing costs (in dollars) of investing in the Fund and to compare these costs with the ongoing costs of investing in other mutual funds.
The example is based on an investment of $1,000 invested at the beginning of the six-month period and held for the entire period from April 1, 2020 to September 30, 2020.
Actual expenses
The “Actual” line of the table below provides information about actual account values and actual expenses. You may use the information in this line, together with the amount you invested, to estimate the expenses that you paid over the period. Simply divide your account value by $1,000 (for example, an $8,600 account value divided by $1,000 = 8.6), then multiply the result by the number in the “Actual” line under the heading entitled “Expenses paid during period” for your applicable class of shares to estimate the expenses you paid on your account during this period.
Hypothetical example for comparison purposes
The “Hypothetical” line of the table below provides information about hypothetical account values and hypothetical expenses based on the Fund’s actual expense ratio and an assumed rate of return of 5% per year before expenses, which is not the Fund’s actual return. The hypothetical account values and expenses may not be used to estimate the actual ending account balance or expenses you paid for the period. You may use this information to compare the ongoing costs of investing in the Fund and other funds. To do so, compare this 5% hypothetical example with the 5% hypothetical examples that appear in the shareholder reports of the other funds.
Please note that the expenses shown in the table are meant to highlight your ongoing costs only and do not reflect any transactional costs, such as sales charges (loads) and contingent deferred sales charges. Therefore, the “Hypothetical” line of the table is useful in comparing ongoing costs only and will not help you determine the relative total costs of owning different funds. In addition, if these transactional costs were included, your costs would have been higher.
| | | | | | | | | | | | | | | | |
| | | Beginning account value 4-1-2020 | | | Ending account value 9-30-2020 | | | Expenses paid during the period1 | | | Annualized net expense ratio | |
| | | | | |
Class A | | | | | | | | | | | | | | | | |
| | | | |
Actual | | $ | 1,000.00 | | | $ | 1,189.05 | | | $ | 7.02 | | | | 1.28 | % |
| | | | |
Hypothetical (5% return before expenses) | | $ | 1,000.00 | | | $ | 1,018.65 | | | $ | 6.48 | | | | 1.28 | % |
| | | | | |
Class C | | | | | | | | | | | | | | | | |
| | | | |
Actual | | $ | 1,000.00 | | | $ | 1,185.41 | | | $ | 11.07 | | | | 2.02 | % |
| | | | |
Hypothetical (5% return before expenses) | | $ | 1,000.00 | | | $ | 1,014.94 | | | $ | 10.20 | | | | 2.02 | % |
| | | | | |
Class R | | | | | | | | | | | | | | | | |
| | | | |
Actual | | $ | 1,000.00 | | | $ | 1,187.61 | | | $ | 8.39 | | | | 1.53 | % |
| | | | |
Hypothetical (5% return before expenses) | | $ | 1,000.00 | | | $ | 1,017.40 | | | $ | 7.74 | | | | 1.53 | % |
| | | | | |
Class R6 | | | | | | | | | | | | | | | | |
| | | | |
Actual | | $ | 1,000.00 | | | $ | 1,191.83 | | | $ | 4.67 | | | | 0.85 | % |
| | | | |
Hypothetical (5% return before expenses) | | $ | 1,000.00 | | | $ | 1,020.81 | | | $ | 4.31 | | | | 0.85 | % |
| | | | | |
Administrator Class | | | | | | | | | | | | | | | | |
| | | | |
Actual | | $ | 1,000.00 | | | $ | 1,189.74 | | | $ | 6.59 | | | | 1.20 | % |
| | | | |
Hypothetical (5% return before expenses) | | $ | 1,000.00 | | | $ | 1,019.05 | | | $ | 6.07 | | | | 1.20 | % |
| | | | | |
Institutional Class | | | | | | | | | | | | | | | | |
| | | | |
Actual | | $ | 1,000.00 | | | $ | 1,191.33 | | | $ | 5.16 | | | | 0.94 | % |
| | | | |
Hypothetical (5% return before expenses) | | $ | 1,000.00 | | | $ | 1,020.36 | | | $ | 4.76 | | | | 0.94 | % |
| 1 | Expenses paid is equal to the annualized net expense ratio of each class multiplied by the average account value over the period, multiplied by the number of days in the most recent fiscal half-year divided by the number of days in the fiscal year (to reflect the one-half-year period). |
8 | Wells Fargo Special Small Cap Value Fund
Portfolio of investments—September 30, 2020 (unaudited)
| | | | | | | | | | | | | | | | |
| | | | | | | | | Shares | | | Value | |
| Common Stocks: 97.12% | |
|
Communication Services: 0.15% | |
|
| Media: 0.15% | |
A.H. Belo Corporation Class A (l) | | | | | | | | | | | 2,012,189 | | | $ | 2,837,186 | |
Gannett Company Incorporated « | | | | | | | | | | | 1,583,545 | | | | 2,058,609 | |
| |
| | | | 4,895,795 | |
| | | | | |
|
Consumer Discretionary: 7.20% | |
|
| Diversified Consumer Services: 0.49% | |
Franchise Group Incorporated | | | | | | | | | | | 629,743 | | | | 15,970,282 | |
| | | | | | | | | | | | | | | | |
|
| Hotels, Restaurants & Leisure: 3.46% | |
Denny’s Corporation †(l) | | | | | | | | | | | 4,374,368 | | | | 43,743,680 | |
Dine Brands Global Incorporated | | | | | | | | | | | 704,502 | | | | 38,458,764 | |
Jack in the Box Incorporated | | | | | | | | | | | 372,300 | | | | 29,527,113 | |
| |
| | | | 111,729,557 | |
| | | | | |
|
| Household Durables: 1.50% | |
Helen of Troy Limited † | | | | | | | | | | | 250,700 | | | | 48,515,464 | |
| | | | | | | | | | | | | | | | |
|
| Internet & Direct Marketing Retail: 0.15% | |
Groupon Incorporated † | | | | | | | | | | | 236,900 | | | | 4,832,760 | |
| | | | | | | | | | | | | | | | |
|
| Specialty Retail: 0.86% | |
American Eagle Outfitters Incorporated | | | | | | | | | | | 1,140,100 | | | | 16,884,881 | |
GameStop Corporation Class A † | | | | | | | | | | | 585,600 | | | | 5,973,120 | |
The ODP Corporation | | | | | | | | | | | 252,100 | | | | 4,903,345 | |
| |
| | | | 27,761,346 | |
| | | | | |
|
| Textiles, Apparel & Luxury Goods: 0.74% | |
Delta Apparel Incorporated †(l) | | | | | | | | | | | 559,902 | | | | 7,978,604 | |
Steven Madden Limited | | | | | | | | | | | 809,000 | | | | 15,775,500 | |
| |
| | | | 23,754,104 | |
| | | | | |
|
Consumer Staples: 13.47% | |
|
| Beverages: 1.03% | |
Primo Water Corporation | | | | | | | | | | | 2,337,400 | | | | 33,191,080 | |
| | | | | | | | | | | | | | | | |
|
| Food & Staples Retailing: 1.03% | |
BJ’s Wholesale Club Holdings Incorporated † | | | | | | | | | | | 805,981 | | | | 33,488,511 | |
| | | | | | | | | | | | | | | | |
|
| Food Products: 7.67% | |
Hostess Brands Incorporated † | | | | | | | | | | | 3,057,435 | | | | 37,698,174 | |
J & J Snack Foods Corporation | | | | | | | | | | | 650,362 | | | | 84,800,701 | |
Nomad Foods Limited † | | | | | | | | | | | 3,691,242 | | | | 94,052,846 | |
Tootsie Roll Industries Incorporated « | | | | | | | | | | | 314,821 | | | | 9,727,969 | |
TreeHouse Foods Incorporated † | | | | | | | | | | | 216,685 | | | | 8,782,243 | |
UTZ Brands Incorporated Class A « | | | | | | | | | | | 710,600 | | | | 12,719,740 | |
| |
| | | | 247,781,673 | |
| | | | | |
|
| Household Products: 3.34% | |
Central Garden & Pet Company †(l) | | | | | | | | | | | 772,322 | | | | 30,838,817 | |
Central Garden & Pet Company Class A † | | | | | | | | | | | 739,390 | | | | 26,721,555 | |
Spectrum Brands Holdings Incorporated | | | | | | | | | | | 879,369 | | | | 50,264,732 | |
| |
| | | | 107,825,104 | |
| | | | | |
The accompanying notes are an integral part of these financial statements.
Wells Fargo Special Small Cap Value Fund | 9
Portfolio of investments—September 30, 2020 (unaudited)
| | | | | | | | | | | | | | | | |
| | | | | | | | | Shares | | | Value | |
| Personal Products: 0.40% | |
Edgewell Personal Care Company † | | | | | | | | | | | 460,736 | | | $ | 12,845,320 | |
| | | | | | | | | | | | | | | | |
|
Energy: 1.40% | |
|
| Energy Equipment & Services: 0.36% | |
Forum Energy Technologies Incorporated Ǡ | | | | | | | | | | | 3,464,891 | | | | 1,903,958 | |
Patterson-UTI Energy Incorporated | | | | | | | | | | | 3,426,410 | | | | 9,765,269 | |
| |
| | | | 11,669,227 | |
| | | | | |
|
| Oil, Gas & Consumable Fuels: 1.04% | |
Berry Petroleum Corporation | | | | | | | | | | | 1,747,937 | | | | 5,540,960 | |
Magnolia Oil & Gas Corporation † | | | | | | | | | | | 2,217,816 | | | | 11,466,109 | |
Southwestern Energy Company † | | | | | | | | | | | 4,397,880 | | | | 10,335,018 | |
Whiting Petroleum Corporation † | | | | | | | | | | | 363,400 | | | | 6,283,186 | |
| |
| | | | 33,625,273 | |
| | | | | |
|
Financials: 20.45% | |
|
| Banks: 10.22% | |
Associated Banc Corporation | | | | | | | | | | | 2,876,056 | | | | 36,295,827 | |
CVB Financial Corporation | | | | | | | | | | | 1,534,800 | | | | 25,523,724 | |
First Citizens BancShares Corporation Class A | | | | | | | | | | | 214,751 | | | | 68,458,324 | |
First Hawaiian Incorporated | | | | | | | | | | | 1,766,690 | | | | 25,564,004 | |
First Horizon National Corporation | | | | | | | | | | | 1,988,048 | | | | 18,747,293 | |
Hancock Holding Company | | | | | | | | | | | 1,284,245 | | | | 24,156,648 | |
Renasant Corporation | | | | | | | | | | | 1,374,435 | | | | 31,227,163 | |
South State Corporation | | | | | | | | | | | 616,361 | | | | 29,677,782 | |
UMB Financial Corporation | | | | | | | | | | | 1,442,126 | | | | 70,678,595 | |
| |
| | | | 330,329,360 | |
| | | | | |
|
| Capital Markets: 2.41% | |
Apollo Investment Corporation | | | | | | | | | | | 1,645,986 | | | | 13,612,304 | |
Glassbridge Enterprises Incorporated †(l) | | | | | | | | | | | 1,527 | | | | 91,620 | |
New Mountain Finance Corporation | | | | | | | | | | | 2,362,750 | | | | 22,587,890 | |
Pershing Square Tontine Holdings Limited Class A † | | | | | | | | | | | 1,618,495 | | | | 36,723,652 | |
Westwood Holdings Group Incorporated (l) | | | | | | | | | | | 438,883 | | | | 4,889,157 | |
| |
| | | | 77,904,623 | |
| | | | | |
|
| Insurance: 5.78% | |
CNO Financial Group Incorporated | | | | | | | | | | | 1,277,230 | | | | 20,486,769 | |
Enstar Group Limited † | | | | | | | | | | | 229,787 | | | | 37,110,601 | |
National Western Life Group Class A | | | | | | | | | | | 51,746 | | | | 9,457,616 | |
ProAssurance Corporation | | | | | | | | | | | 1,190,159 | | | | 18,614,087 | |
Stewart Information Services Corporation | | | | | | | | | | | 1,065,206 | | | | 46,581,458 | |
The Hanover Insurance Group Incorporated | | | | | | | | | | | 496,332 | | | | 46,248,216 | |
White Mountains Insurance Group Limited | | | | | | | | | | | 10,352 | | | | 8,064,208 | |
| |
| | | | 186,562,955 | |
| | | | | |
|
| Mortgage REITs: 2.04% | |
Apollo Commercial Real Estate Finance Incorporated | | | | | | | | | | | 1,872,453 | | | | 16,870,802 | |
New York Mortgage Trust Incorporated | | | | | | | | | | | 6,275,281 | | | | 16,001,967 | |
Two Harbors Investment Corporation | | | | | | | | | | | 6,489,596 | | | | 33,032,044 | |
| |
| | | | 65,904,813 | |
| | | | | |
The accompanying notes are an integral part of these financial statements.
10 | Wells Fargo Special Small Cap Value Fund
Portfolio of investments—September 30, 2020 (unaudited)
| | | | | | | | | | | | | | | | |
| | | | | | | | | Shares | | | Value | |
| Health Care: 3.57% | |
|
| Health Care Equipment & Supplies: 0.77% | |
Natus Medical Incorporated † | | | | | | | | | | | 648,529 | | | $ | 11,109,302 | |
Varex Imaging Corporation † | | | | | | | | | | | 1,089,112 | | | | 13,853,505 | |
| |
| | | | 24,962,807 | |
| | | | | |
|
| Health Care Providers & Services: 1.71% | |
Owens & Minor Incorporated | | | | | | | | | | | 597,984 | | | | 15,015,378 | |
Patterson Companies Incorporated | | | | | | | | | | | 1,068,565 | | | | 25,757,759 | |
Premier Incorporated Class A | | | | | | | | | | | 436,000 | | | | 14,313,880 | |
| |
| | | | 55,087,017 | |
| | | | | |
|
| Pharmaceuticals: 1.09% | |
Bausch Health Companies Incorporated † | | | | | | | | | | | 315,200 | | | | 4,898,208 | |
Prestige Consumer Healthcare Incorporated † | | | | | | | | | | | 830,700 | | | | 30,254,094 | |
| |
| | | | 35,152,302 | |
| | | | | |
|
Industrials: 24.06% | |
|
| Aerospace & Defense: 1.02% | |
Parsons Corporation † | | | | | | | | | | | 988,398 | | | | 33,150,869 | |
| | | | | | | | | | | | | | | | |
|
| Building Products: 4.32% | |
CSW Industrials Incorporated (l) | | | | | | | | | | | 857,105 | | | | 66,211,361 | |
Griffon Corporation | | | | | | | | | | | 1,030,917 | | | | 20,144,118 | |
Quanex Building Products Corporation (l) | | | | | | | | | | | 1,957,636 | | | | 36,098,808 | |
Simpson Manufacturing Company Incorporated | | | | | | | | | | | 177,259 | | | | 17,222,484 | |
| |
| | | | 139,676,771 | |
| | | | | |
|
| Commercial Services & Supplies: 3.53% | |
ACCO Brands Corporation | | | | | | | | | | | 2,185,948 | | | | 12,678,498 | |
Deluxe Corporation | | | | | | | | | | | 1,070,181 | | | | 27,535,757 | |
Ennis Incorporated | | | | | | | | | | | 1,157,577 | | | | 20,188,143 | |
Healthcare Services Group Incorporated | | | | | | | | | | | 1,448,057 | | | | 31,176,667 | |
Viad Corporation (l) | | | | | | | | | | | 1,080,990 | | | | 22,517,022 | |
| |
| | | | 114,096,087 | |
| | | | | |
|
| Construction & Engineering: 0.73% | |
APi Group Corporation 144A† | | | | | | | | | | | 1,655,600 | | | | 23,559,188 | |
| | | | | | | | | | | | | | | | |
|
| Electrical Equipment: 1.36% | |
Atkore International Incorporated † | | | | | | | | | | | 1,757,608 | | | | 39,950,430 | |
nVent Electric plc | | | | | | | | | | | 220,500 | | | | 3,900,645 | |
| |
| | | | 43,851,075 | |
| | | | | |
|
| Machinery: 10.14% | |
Alamo Group Incorporated | | | | | | | | | | | 211,000 | | | | 22,794,330 | |
Crane Company | | | | | | | | | | | 141,200 | | | | 7,078,356 | |
Douglas Dynamics Incorporated (l) | | | | | | | | | | | 1,174,515 | | | | 40,168,413 | |
Franklin Electric Company Incorporated | | | | | | | | | | | 1,358,182 | | | | 79,901,847 | |
Harsco Corporation Harsco Corp† | | | | | | | | | | | 1,390,900 | | | | 19,347,419 | |
Kadant Incorporated | | | | | | | | | | | 306,970 | | | | 33,650,051 | |
Mayville Engineering Company Incorporated † | | | | | | | | | | | 632,262 | | | | 5,810,488 | |
Mueller Industries Incorporated (l) | | | | | | | | | | | 2,904,657 | | | | 78,600,018 | |
NN Incorporated | | | | | | | | | | | 1,309,215 | | | | 6,755,549 | |
Trimas Corporation † | | | | | | | | | | | 1,465,240 | | | | 33,407,472 | |
| |
| | | | 327,513,943 | |
| | | | | |
The accompanying notes are an integral part of these financial statements.
Wells Fargo Special Small Cap Value Fund | 11
Portfolio of investments—September 30, 2020 (unaudited)
| | | | | | | | | | | | | | | | |
| | | | | | | | | Shares | | | Value | |
| Marine: 0.18% | |
Nordic American Tanker Limited « | | | | | | | | | | | 1,678,900 | | | $ | 5,859,361 | |
| | | | | | | | | | | | | | | | |
|
| Professional Services: 1.65% | |
CBIZ Incorporated † | | | | | | | | | | | 911,191 | | | | 20,838,938 | |
Korn Ferry International | | | | | | | | | | | 1,115,842 | | | | 32,359,418 | |
| |
| | | | 53,198,356 | |
| | | | | |
|
| Road & Rail: 0.60% | |
Werner Enterprises Incorporated | | | | | | | | | | | 464,616 | | | | 19,509,226 | |
| | | | | | | | | | | | | | | | |
|
| Trading Companies & Distributors: 0.53% | |
Air Lease Corporation | | | | | | | | | | | 578,400 | | | | 17,016,528 | |
| | | | | | | | | | | | | | | | |
|
Information Technology: 4.83% | |
|
| Communications Equipment: 0.51% | |
NETGEAR Incorporated † | | | | | | | | | | | 537,935 | | | | 16,579,157 | |
| | | | | | | | | | | | | | | | |
|
| Electronic Equipment, Instruments & Components: 0.52% | |
Belden Incorporated | | | | | | | | | | | 542,768 | | | | 16,890,940 | |
| | | | | | | | | | | | | | | | |
|
| IT Services: 1.51% | |
MAXIMUS Incorporated | | | | | | | | | | | 378,900 | | | | 25,920,549 | |
Sabre Corporation | | | | | | | | | | | 1,177,743 | | | | 7,667,107 | |
Sykes Enterprises Incorporated † | | | | | | | | | | | 444,400 | | | | 15,202,924 | |
| |
| | | | 48,790,580 | |
| | | | | |
|
| Semiconductors & Semiconductor Equipment: 1.04% | |
Brooks Automation Incorporated | | | | | | | | | | | 523,166 | | | | 24,201,659 | |
DSP Group Incorporated † | | | | | | | | | | | 698,148 | | | | 9,201,591 | |
| |
| | | | 33,403,250 | |
| | | | | |
|
| Software: 1.25% | |
BlackBerry Limited NYSE † | | | | | | | | | | | 4,788,909 | | | | 21,981,092 | |
Verint Systems Incorporated † | | | | | | | | | | | 384,500 | | | | 18,525,210 | |
| |
| | | | 40,506,302 | |
| | | | | |
|
Materials: 16.39% | |
|
| Chemicals: 7.12% | |
Avient Corporation | | | | | | | | | | | 2,574,332 | | | | 68,116,825 | |
Element Solutions Incorporated † | | | | | | | | | | | 1,478,792 | | | | 15,542,104 | |
Ferro Corporation † | | | | | | | | | | | 810,900 | | | | 10,055,160 | |
Huntsman Corporation | | | | | | | | | | | 918,000 | | | | 20,388,780 | |
Ingevity Corporation † | | | | | | | | | | | 214,631 | | | | 10,611,357 | |
Innospec Incorporated | | | | | | | | | | | 1,193,941 | | | | 75,600,344 | |
NewMarket Corporation | | | | | | | | 54,279 | | | | 18,580,787 | |
PQ Group Holdings Incorporated † | | | | | | | | 1,101,327 | | | | 11,299,615 | |
| |
| | | | 230,194,972 | |
| | | | | | | | | | | | | | | | |
|
| Construction Materials: 3.24% | |
Eagle Materials Incorporated | | | | | | | | 1,212,108 | | | | 104,629,161 | |
| | | | | | | | | | | | | |
The accompanying notes are an integral part of these financial statements.
12 | Wells Fargo Special Small Cap Value Fund
Portfolio of investments—September 30, 2020 (unaudited)
| | | | | | | | | | | | | | | | |
| | | | | | | | | Shares | | | Value | |
| Containers & Packaging: 2.56% | |
Myers Industries Incorporated | | | | | | | | 1,481,332 | | | $ | 19,598,022 | |
Silgan Holdings Incorporated | | | | | | | | 1,716,390 | | | | 63,111,660 | |
| |
| | | | 82,709,682 | |
| | | | | | | | | | | | | | | | |
| Metals & Mining: 0.89% | |
Compass Minerals International Incorporated | | | | | | | | 483,300 | | | | 28,683,855 | |
| | | | | | | | | | | | | |
|
| Paper & Forest Products: 2.58% | |
Neenah Incorporated (l) | | | | | | | | 1,290,761 | | | | 48,364,815 | |
Schweitzer-Mauduit International Incorporated | | | | | | | | 1,149,128 | | | | 34,922,000 | |
| |
| | | | 83,286,815 | |
| | | | | | | | | | | | | | | | |
|
Real Estate: 1.30% | |
|
| Equity REITs: 1.30% | |
Acadia Realty Trust | | | | | | | | 1,099,567 | | | | 11,545,454 | |
Retail Value Incorporated | | | | | | | | 234,388 | | | | 2,946,257 | |
Washington REIT | | | | | | | | 1,360,210 | | | | 27,381,027 | |
| |
| | | | 41,872,738 | |
| | | | | | | | | | | | | | | | |
|
Utilities: 4.30% | |
|
| Electric Utilities: 4.30% | |
ALLETE Incorporated | | | | | | | | 578,300 | | | | 29,921,242 | |
Hawaiian Electric Industries Incorporated | | | | | | | | 1,627,306 | | | | 54,091,651 | |
IDACORP Incorporated | | | | | | | | 688,443 | | | | 55,006,596 | |
| |
| | | | 139,019,489 | |
| | | | | | | | | | | | | | | | |
| |
Total Common Stocks (Cost $3,379,668,101) | | | | 3,137,787,718 | |
| | | | | | | | | | | | | | | | |
|
| Exchange-Traded Funds: 0.18% | |
iShares Russell 2000 Index ETF | | | | | | | | 39,350 | | | | 5,894,237 | |
| | | | | | | | | | | | | |
| |
Total Exchange-Traded Funds (Cost $5,874,734) | | | | 5,894,237 | |
| | | | | | | | | | | | | | | | |
| | | | |
| | | | | | | | | | | | | | | | |
| | | Dividend yield | | | | | | | | | | |
| Preferred Stocks: 0.07% | |
|
Industrials: 0.07% | |
|
| Industrial Conglomerates: 0.07% | |
Steel Partners Holdings LP | | | 7.88 | % | | | | | | | 112,937 | | | | 2,150,320 | |
| | | | | | | | | | | | | | | | |
| |
Total Preferred Stocks (Cost $1,530,486) | | | | 2,150,320 | |
| | | | | | | | | | | | | | | | |
| | | | |
| | | | | | | | | | | | | | | | |
| | | | | | Expiration
date | | | | | | | |
| Warrants: 0.04% | |
|
Financials: 0.04% | |
|
| Capital Markets: 0.04% | |
Pershing Square Tontine Holdings Limited Class A † | | | | | | | 7-24-2025 | | | | 178,494 | | | | 1,279,802 | |
| | | | | | | | | | | | | | | | |
| |
Total Warrants (Cost $1,013,608) | | | | 1,279,802 | |
| | | | | |
The accompanying notes are an integral part of these financial statements.
Wells Fargo Special Small Cap Value Fund | 13
Portfolio of investments—September 30, 2020 (unaudited)
| | | | | | | | | | | | | | | | |
| | | Yield | | | | | | Shares | | | Value | |
| Short-Term Investments: 1.84% | |
|
| Investment Companies: 1.84% | |
Securities Lending Cash Investments LLC (l)(r)(u) | | | 0.12 | % | | | | | | | 17,670,027 | | | $ | 17,670,027 | |
Wells Fargo Government Money Market Fund Select Class (l)(u) | | | 0.05 | | | | | | | | 41,755,606 | | | | 41,755,606 | |
| | | | | | | | | | | | | | | | |
| |
Total Short-Term Investments (Cost $59,425,633) | | | | 59,425,633 | |
| | | | | |
| | | | | | | | |
| Total investments in securities (Cost $3,447,512,562) | | | 99.25 | % | | | 3,206,537,710 | |
| | |
Other assets and liabilities, net | | | 0.75 | | | | 24,351,836 | |
| | | | | | | | |
| Total net assets | | | 100.00 | % | | $ | 3,230,889,546 | |
| | | | | | | | |
| (l) | The issuer of the security is an affiliated person of the Fund as defined in the Investment Company Act of 1940. |
| « | All or a portion of this security is on loan. |
| † | Non-income-earning security |
| 144A | The security may be resold in transactions exempt from registration, normally to qualified institutional buyers, pursuant to Rule 144A under the Securities Act of 1933. |
| (r) | The investment is a non-registered investment company purchased with cash collateral received from securities on loan. |
| (u) | The rate represents the 7-day annualized yield at period end. |
Abbreviations:
| REIT | Real estate investment trust |
Written Options
| | | | | | | | | | | | | | | | | | | | | | | | |
| Description | | Counterparty | | | Number of
contracts | | | Notional
amount | | | Exercise
price | | | Expiration
date | | | Value | |
| | | | | | |
Call | | | | | | | | | | | | | | | | | | | | | | | | |
| | | | | | |
GameStop Corporation Class A | | | Bank of America | | | | (4,999) | | | $ | (3,499,300 | ) | | $ | 7.00 | | | | 10-16-2020 | | | $ | (1,624,675 | ) |
| | | | | | |
GameStop Corporation Class A | | | Bank of America | | | | (1,000) | | | | (1,000,000 | ) | | | 10.00 | | | | 10-16-2020 | | | | (99,500 | ) |
| | | | | | |
Owens & Minor Incorporated | | | Bank of America | | | | (996) | | | | (2,490,000 | ) | | | 25.00 | | | | 10-16-2020 | | | | (164,340 | ) |
| | | | | | |
Put | | | | | | | | | | | | | | | | | | | | | | | | |
| | | | | | |
Atkore International Incorporated | | | Bank of America | | | | 150 | | | | 337,500 | | | | 22.50 | | | | 10-16-2020 | | | | (19,125 | ) |
| | | | | | |
BJ’s Wholesale Club Holdings Incorporated | | | Bank of America | | | | 1,000 | | | | 4,000,000 | | | | 40.00 | | | | 10-16-2020 | | | | (67,500 | ) |
| | | | | | |
Brooks Automation Incorporated | | | Bank of America | | | | 500 | | | | 2,250,000 | | | | 45.00 | | | | 10-16-2020 | | | | (57,500 | ) |
| | | | | | |
Euronet Worldwide Incorporated | | | Bank of America | | | | 1,000 | | | | 8,500,000 | | | | 85.00 | | | | 10-16-2020 | | | | (157,500 | ) |
| | | | | | |
Innospec Incorporated | | | Bank of America | | | | 1,000 | | | | 6,500,000 | | | | 65.00 | | | | 10-16-2020 | | | | (290,000 | ) |
| | | | | | |
Neenah Incorporated | | | Bank of America | | | | 1,000 | | | | 4,000,000 | | | | 40.00 | | | | 10-16-2020 | | | | (492,500 | ) |
| | | | | | |
nVent Electric plc | | | Bank of America | | | | 1,000 | | | | 1,750,000 | | | | 17.50 | | | | 11-20-2020 | | | | (95,000 | ) |
| | | | | | |
Owens & Minor Incorporated | | | Bank of America | | | | 1,000 | | | | 2,000,000 | | | | 20.00 | | | | 10-16-2020 | | | | (25,000 | ) |
| | | | | | |
Premier Incorporated Class A | | | Bank of America | | | | 1,000 | | | | 3,000,000 | | | | 30.00 | | | | 10-16-2020 | | | | (52,500 | ) |
| | | | | | |
Progressive Software Corporation | | | Bank of America | | | | 2,000 | | | | 7,000,000 | | | | 35.00 | | | | 11-20-2020 | | | | (260,000 | ) |
| | | | | | |
Varex Imaging Corporation | | | Bank of America | | | | 500 | | | | 625,000 | | | | 12.50 | | | | 11-20-2020 | | | | (58,500 | ) |
| | | | | | | | | | | | | | | | | | | | | | | | |
| | | | | | |
| | | | | | | | | | | | | | | | | | | | | | $ | (3,463,640 | ) |
| | | | | | | | | | | | | | | | | | | | | | | | |
The accompanying notes are an integral part of these financial statements.
14 | Wells Fargo Special Small Cap Value Fund
Portfolio of investments—September 30, 2020 (unaudited)
Investments in Affiliates
An affiliated investment is an investment in which the Fund owns at least 5% of the outstanding voting shares of the issuer or as a result of other relationships, such as the Fund and the issuer having the same investment manager. Transactions with issuers that were either affiliated persons of the Fund at the beginning of the period or the end of the period were as follows:
| | | | | | | | | | | | | | | | | | | | | | | | | | | | | | | | |
| | | Value,
beginning of
period | | | Purchases | | | Sales
proceeds | | | Net
realized
gains
(losses) | | | Net
change in
unrealized
gains
(losses) | | | Income
from
affiliated
securities | | | Value,
end of
period | | | % of
net
assets | |
Common Stocks | | | | | | | | | | | | | | | | | | | | | | | | | | | | | | | | |
Communication Services | | | | | | | | | | | | | | | | | | | | | | | | | | | | | | | | |
Media | | | | | | | | | | | | | | | | | | | | | | | | | | | | | | | | |
A.H. Belo Corporation Class A | | $ | 3,460,965 | | | $ | 0 | | | $ | 0 | | | $ | 0 | | | $ | (623,779 | ) | | $ | 241,463 | | | $ | 2,837,186 | | | | | |
Consumer Discretionary | | | | | | | | | | | | | | | | | | | | | | | | | | | | | | | | |
Hotels, Restaurants & Leisure | | | | | | | | | | | | | | | | | | | | | | | | | | | | | | | | |
Denny’s Corporation † | | | 28,951,496 | | | | 9,217,264 | | | | (4,388,324 | ) | | | (3,298,210 | ) | | | 13,261,454 | | | | 0 | | | | 43,743,680 | | | | | |
Dine Brands Global Incorporated * | | | 27,527,121 | | | | 2,720,712 | | | | (14,751,536 | ) | | | (6,530,380 | ) | | | 29,492,847 | | | | 899,918 | | | | 38,458,764 | | | | | |
Textiles, Apparel & Luxury Goods | | | | | | | | | | | | | | | | | | | | | | | | | | | | | | | | |
Delta Apparel Incorporated † | | | 5,828,580 | | | | 0 | | | | 0 | | | | 0 | | | | 2,150,024 | | | | 0 | | | | 7,978,604 | | | | | |
Consumer Staples | | | | | | | | | | | | | | | | | | | | | | | | | | | | | | | | |
Household Products | | | | | | | | | | | | | | | | | | | | | | | | | | | | | | | | |
Central Garden & Pet Company † | | | 21,984,105 | | | | 0 | | | | (1,083,329 | ) | | | (86,784 | ) | | | 10,024,825 | | | | 0 | | | | 30,838,817 | | | | | |
Financials | | | | | | | | | | | | | | | | | | | | | | | | | | | | | | | | |
Capital Markets | | | | | | | | | | | | | | | | | | | | | | | | | | | | | | | | |
Glassbridge Enterprises Incorporated † | | | 76,365 | | | | 0 | | | | 0 | | | | 0 | | | | 15,255 | | | | 0 | | | | 91,620 | | | | | |
Westwood Holdings Group Incorporated | | | 7,999,328 | | | | 30,304 | | | | 0 | | | | 0 | | | | (3,140,475 | ) | | | 187,860 | | | | 4,889,157 | | | | | |
Industrials | | | | | | | | | | | | | | | | | | | | | | | | | | | | | | | | |
Building Products | | | | | | | | | | | | | | | | | | | | | | | | | | | | | | | | |
CSW Industrials Incorporated | | | 53,025,835 | | | | 5,241,928 | | | | (3,081,421 | ) | | | 402,183 | | | | 10,622,836 | | | | 234,037 | | | | 66,211,361 | | | | | |
Quanex Building Products Corporation | | | 17,678,576 | | | | 2,788,277 | | | | 0 | | | | 0 | | | | 15,631,955 | | | | 304,154 | | | | 36,098,808 | | | | | |
Commercial Services & Supplies | | | | | | | | | | | | | | | | | | | | | | | | | | | | | | | | |
Viad Corporation | | | 16,011,454 | | | | 5,907,321 | | | | 0 | | | | 0 | | | | 598,247 | | | | 71,409 | | | | 22,517,022 | | | | | |
Machinery | | | | | | | | | | | | | | | | | | | | | | | | | | | | | | | | |
Douglas Dynamics Incorporated | | | 29,170,293 | | | | 14,377,765 | | | | (2,143,909 | ) | | | (403,892 | ) | | | (831,844 | ) | | | 538,252 | | | | 40,168,413 | | | | | |
Mueller Industries Incorporated | | | 60,962,205 | | | | 9,017,662 | | | | 0 | | | | 0 | | | | 8,620,151 | | | | 554,664 | | | | 78,600,018 | | | | | |
Materials | | | | | | | | | | | | | | | | | | | | | | | | | | | | | | | | |
Paper and Forest Products | | | | | | | | | | | | | | | | | | | | | | | | | | | | | | | | |
Neenah Incorporated | | | 48,908,342 | | | | 7,144,776 | | | | 0 | | | | 0 | | | | (7,688,303 | ) | | | 1,165,916 | | | | 48,364,815 | | | | | |
| | | | | | | | |
| | | | | | | | | | | | | | | | | | | | | | | | | | | 420,798,265 | | | | 13.02 | % |
| | | | | | | | | | | | | | | | | | | | | | | | | | | | | | | | |
Short-Term Investments | | | | | | | | | | | | | | | | | | | | | | | | | | | | | | | | |
Investment Companies | | | | | | | | | | | | | | | | | | | | | | | | | | | | | | | | |
Securities Lending Cash Investments LLC | | | 6,657,880 | | | | 36,995,690 | | | | (25,983,960 | ) | | | 687 | | | | (270 | ) | | | 2,240 | ** | | | 17,670,027 | | | | | |
Wells Fargo Government Money Market Fund Select Class | | | 66,773,903 | | | | 440,381,599 | | | | (465,399,896 | ) | | | 0 | | | | 0 | | | | 44,146 | | | | 41,755,606 | | | | | |
| | | | | | | | |
| | | | | | | | | | | | | | | | | | | | | | | | | | | 59,425,633 | | | | 1.84 | |
| | | | | | | | | | | | | | | | | | | | | | | | | | | | | | | | |
| | | | | | | | | | | | | | $ | (9,916,396 | ) | | $ | 78,132,923 | # | | $ | 4,244,059 | | | $ | 480,223,898 | # | | | 14.86 | % |
| | | | | | | | | | | | | | | | | | | | | | | | | | | | | | | | |
| † | Non-income-earning security |
| * | No longer an affiliate of the Fund at the end of the period |
| ** | Amount shown represents income before fees and rebates. |
| # | Amount may differ from the value reported on the respective financial statement due to securities that were not deemed affiliates of the Fund either at the beginning or end of the period. |
The accompanying notes are an integral part of these financial statements.
Wells Fargo Special Small Cap Value Fund | 15
Statement of assets and liabilities—September 30, 2020 (unaudited)
| | | | |
| | | | |
| |
Assets | | | | |
Investments in unaffiliated securities (including $16,833,846 of securities loaned), at value (cost $2,958,327,013) | | $ | 2,764,772,576 | |
Investments in affiliated securities, at value (cost $489,185,549) | | | 441,765,134 | |
Cash segregated for written options | | | 39,962,500 | |
Receivable for investments sold | | | 22,181,444 | |
Receivable for Fund shares sold | | | 10,042,185 | |
Receivable for dividends | | | 5,466,472 | |
Receivable for securities lending income, net | | | 17,268 | |
Prepaid expenses and other assets | | | 181,974 | |
| | | | |
Total assets | | | 3,284,389,553 | |
| | | | |
| |
Liabilities | | | | |
Payable upon receipt of securities loaned | | | 17,670,027 | |
Payable for investments purchased | | | 20,200,474 | |
Payable for Fund shares redeemed | | | 5,241,807 | |
Overdraft due to custodian bank | | | 3,301,736 | |
Written options, at value (premiums received $1,891,577) | | | 3,463,640 | |
Management fee payable | | | 2,153,151 | |
Administration fees payable | | | 319,253 | |
Distribution fees payable | | | 8,436 | |
Trustees’ fees and expenses payable | | | 2,643 | |
Accrued expenses and other liabilities | | | 1,138,840 | |
| | | | |
Total liabilities | | | 53,500,007 | |
| | | | |
Total net assets | | $ | 3,230,889,546 | |
| | | | |
| |
Net assets consist of | | | | |
Paid-in capital | | $ | 3,517,931,928 | |
Total distributable loss | | | (287,042,382 | ) |
| | | | |
Total net assets | | $ | 3,230,889,546 | |
| | | | |
| |
Computation of net asset value and offering price per share | | | | |
Net assets – Class A | | $ | 501,052,876 | |
Shares outstanding – Class A1 | | | 18,022,353 | |
Net asset value per share – Class A | | | $27.80 | |
Maximum offering price per share – Class A2 | | | $29.50 | |
Net assets – Class C | | $ | 11,278,529 | |
Shares outstanding – Class C1 | | | 453,431 | |
Net asset value per share – Class C | | | $24.87 | |
Net assets – Class R | | $ | 5,278,547 | |
Shares outstanding – Class R1 | | | 187,369 | |
Net asset value per share – Class R | | | $28.17 | |
Net assets – Class R6 | | $ | 798,583,561 | |
Shares outstanding – Class R61 | | | 27,939,153 | |
Net asset value per share – Class R6 | | | $28.58 | |
Net assets – Administrator Class | | $ | 108,053,605 | |
Shares outstanding – Administrator Class1 | | | 3,787,023 | |
Net asset value per share – Administrator Class | | | $28.53 | |
Net assets – Institutional Class | | $ | 1,806,642,428 | |
Shares outstanding – Institutional Class1 | | | 63,215,954 | |
Net asset value per share – Institutional Class | | | $28.58 | |
| 1 | The Fund has an unlimited number of authorized shares. |
| 2 | Maximum offering price is computed as 100/94.25 of net asset value. On investments of $50,000 or more, the offering price is reduced. |
The accompanying notes are an integral part of these financial statements.
16 | Wells Fargo Special Small Cap Value Fund
Statement of operations—six months ended September 30, 2020 (unaudited)
| | | | |
| | | | |
| |
Investment income | | | | |
Dividends (net of foreign withholding taxes of $41,873) | | $ | 27,250,457 | |
Income from affiliated securities | | | 4,261,327 | |
| | | | |
Total investment income | | | 31,511,784 | |
| | | | |
| |
Expenses | | | | |
Management fee | | | 12,328,986 | |
Administration fees | | | | |
Class A | | | 472,417 | |
Class C | | | 12,667 | |
Class R | | | 6,024 | |
Class R6 | | | 107,316 | |
Administrator Class | | | 72,975 | |
Institutional Class | | | 1,155,731 | |
Shareholder servicing fees | | | | |
Class A | | | 560,015 | |
Class C | | | 14,966 | |
Class R | | | 7,144 | |
Administrator Class | | | 138,835 | |
Distribution fees | | | | |
Class C | | | 44,891 | |
Class R | | | 7,119 | |
Custody and accounting fees | | | 60,163 | |
Professional fees | | | 24,848 | |
Registration fees | | | 62,130 | |
Shareholder report expenses | | | 113,116 | |
Trustees’ fees and expenses | | | 9,776 | |
Other fees and expenses | | | 33,840 | |
| | | | |
Total expenses | | | 15,232,959 | |
Less: Fee waivers and/or expense reimbursements | | | | |
Fund-level | | | (52,898 | ) |
Class A | | | (631 | ) |
Class C | | | (1 | ) |
Administrator Class | | | (1,430 | ) |
Institutional Class | | | (52,898 | ) |
| | | | |
Net expenses | | | 15,125,101 | |
| | | | |
Net investment income | | | 16,386,683 | |
| | | | |
| |
Realized and unrealized gains (losses) on investments | | | | |
Net realized gains (losses) on | | | | |
Unaffiliated securities | | | 2,331,436 | |
Affiliated securities | | | (9,916,396 | ) |
Written options | | | 4,449,250 | |
| | | | |
Net realized losses on investments | | | (3,135,710 | ) |
| | | | |
| |
Net change in unrealized gains (losses) on | | | | |
Unaffiliated securities | | | 426,295,175 | |
Affiliated securities | | | 56,615,102 | |
Written options | | | (1,572,063 | ) |
| | | | |
Net change in unrealized gains (losses) on investments | | | 481,338,214 | |
| | | | |
Net realized and unrealized gains (losses) on investments | | | 478,202,504 | |
| | | | |
Net increase in net assets resulting from operations | | $ | 494,589,187 | |
| | | | |
The accompanying notes are an integral part of these financial statements.
Wells Fargo Special Small Cap Value Fund | 17
Statement of changes in net assets
| | | | | | | | | | | | | | | | |
| | | Six months ended
September 30, 2020 (unaudited) | | | Year ended
March 31, 2020 | |
| | | |
Operations | | | | | | | | | | | | |
Net investment income | | | | | | $ | 16,386,683 | | | | | | | $ | 33,294,686 | |
Net realized losses on investments | | | | | | | (3,135,710 | ) | | | | | | | (29,117,298 | ) |
Net change in unrealized gains (losses) on investments | | | | | | | 481,338,214 | | | | | | | | (864,980,003 | ) |
| | | | |
Net increase (decrease) in net assets resulting from operations | | | | | | | 494,589,187 | | | | | | | | (860,802,615 | ) |
| | | | |
| | | | |
Distributions to shareholders from net investment income and net realized gains | | | | | | | | | | | | | | | | |
Class A | | | | | | | 0 | | | | | | | | (9,432,361 | ) |
Class C | | | | | | | 0 | | | | | | | | (189,721 | ) |
Class R | | | | | | | 0 | | | | | | | | (105,231 | ) |
Class R6 | | | | | | | 0 | | | | | | | | (14,944,792 | ) |
Administrator Class | | | | | | | 0 | | | | | | | | (2,900,116 | ) |
Institutional Class | | | | | | | 0 | | | | | | | | (42,284,810 | ) |
| | | | |
Total distributions to shareholders | | | | | | | 0 | | | | | | | | (69,857,031 | ) |
| | | | |
| | | | |
Capital share transactions | | | Shares | | | | | | | | Shares | | | | | |
Proceeds from shares sold | | | | | | | | | | | | | | | | |
Class A | | | 3,879,676 | | | | 105,678,808 | | | | 3,993,891 | | | | 126,764,233 | |
Class C | | | 4,175 | | | | 99,611 | | | | 14,309 | | | | 410,897 | |
Class R | | | 35,895 | | | | 996,062 | | | | 105,504 | | | | 3,331,686 | |
Class R6 | | | 8,141,315 | | | | 228,517,300 | | | | 12,282,599 | | | | 409,146,441 | |
Administrator Class | | | 535,931 | | | | 14,546,568 | | | | 950,962 | | | | 30,825,292 | |
Institutional Class | | | 17,449,481 | | | | 475,393,937 | | | | 37,766,400 | | | | 1,218,872,323 | |
| | | | |
| | | | | | | 825,232,286 | | | | | | | | 1,789,350,872 | |
| | | | |
Reinvestment of distributions | | | | | | | | | | | | | | | | |
Class A | | | 0 | | | | 0 | | | | 245,514 | | | | 8,523,533 | |
Class C | | | 0 | | | | 0 | | | | 5,647 | | | | 174,030 | |
Class R | | | 0 | | | | 0 | | | | 2,978 | | | | 104,729 | |
Class R6 | | | 0 | | | | 0 | | | | 363,920 | | | | 12,981,573 | |
Administrator Class | | | 0 | | | | 0 | | | | 80,270 | | | | 2,859,904 | |
Institutional Class | | | 0 | | | | 0 | | | | 941,495 | | | | 33,591,380 | |
| | | | |
| | | | | | | 0 | | | | | | | | 58,235,149 | |
| | | | |
Payment for shares redeemed | | | | | | | | | | | | | | | | |
Class A | | | (2,146,461 | ) | | | (57,528,972 | ) | | | (4,543,391 | ) | | | (146,758,224 | ) |
Class C | | | (94,765 | ) | | | (2,266,907 | ) | | | (329,922 | ) | | | (9,451,149 | ) |
Class R | | | (67,988 | ) | | | (1,899,291 | ) | | | (95,708 | ) | | | (3,223,069 | ) |
Class R6 | | | (4,392,135 | ) | | | (120,224,524 | ) | | | (4,383,465 | ) | | | (144,270,795 | ) |
Administrator Class | | | (1,136,405 | ) | | | (30,741,350 | ) | | | (1,570,212 | ) | | | (51,008,335 | ) |
Institutional Class | | | (15,276,011 | ) | | | (425,176,676 | ) | | | (19,400,901 | ) | | | (608,738,214 | ) |
| | | | |
| | | | | | | (637,837,720 | ) | | | | | | | (963,449,786 | ) |
| | | | |
Net increase in net assets resulting from capital share transactions | | | | | | | 187,394,566 | | | | | | | | 884,136,235 | |
| | | | |
Total increase (decrease) in net assets | | | | | | | 681,983,753 | | | | | | | | (46,523,411 | ) |
| | | | |
| | |
Net assets | | | | | | | | |
Beginning of period | | | | | | | 2,548,905,793 | | | | | | | | 2,595,429,204 | |
| | | | |
End of period | | | | | | $ | 3,230,889,546 | | | | | | | $ | 2,548,905,793 | |
| | | | |
The accompanying notes are an integral part of these financial statements.
18 | Wells Fargo Special Small Cap Value Fund
Financial highlights
(For a share outstanding throughout each period)
| | | | | | | | | | | | | | | | | | | | | | | | |
| | | Six months ended
September 30, 2020
(unaudited) | | | Year ended March 31 | |
| CLASS A | | 2020 | | | 2019 | | | 2018 | | | 2017 | | | 2016 | |
Net asset value, beginning of period | | | $23.39 | | | | $31.74 | | | | $34.42 | | | | $33.15 | | | | $27.40 | | | | $29.27 | |
Net investment income | | | 0.11 | 1 | | | 0.25 | | | | 0.22 | | | | 0.24 | | | | 0.35 | 1 | | | 0.20 | |
Net realized and unrealized gains (losses) on investments | | | 4.30 | | | | (8.01 | ) | | | (0.69 | ) | | | 2.89 | | | | 6.15 | | | | (1.46 | ) |
| | | | | | | | | | | | | | | | | | | | | | | | |
Total from investment operations | | | 4.41 | | | | (7.76 | ) | | | (0.47 | ) | | | 3.13 | | | | 6.50 | | | | (1.26 | ) |
Distributions to shareholders from | | | | | | | | | | | | | | | | | | | | | | | | |
Net investment income | | | 0.00 | | | | (0.28 | ) | | | (0.15 | ) | | | (0.32 | ) | | | (0.18 | ) | | | (0.19 | ) |
Net realized gains | | | 0.00 | | | | (0.31 | ) | | | (2.06 | ) | | | (1.54 | ) | | | (0.57 | ) | | | (0.42 | ) |
| | | | | | | | | | | | | | | | | | | | | | | | |
Total distributions to shareholders | | | 0.00 | | | | (0.59 | ) | | | (2.21 | ) | | | (1.86 | ) | | | (0.75 | ) | | | (0.61 | ) |
Net asset value, end of period | | | $27.80 | | | | $23.39 | | | | $31.74 | | | | $34.42 | | | | $33.15 | | | | $27.40 | |
Total return2 | | | 18.91 | % | | | (25.08 | )% | | | (0.87 | )% | | | 9.42 | % | | | 23.69 | % | | | (4.21 | )% |
Ratios to average net assets (annualized) | | | | | | | | | | | | | | | | | | | | | | | | |
Gross expenses | | | 1.28 | % | | | 1.27 | % | | | 1.29 | % | | | 1.31 | % | | | 1.32 | % | | | 1.36 | % |
Net expenses | | | 1.28 | % | | | 1.27 | % | | | 1.29 | % | | | 1.31 | % | | | 1.32 | % | | | 1.34 | % |
Net investment income | | | 0.78 | % | | | 0.75 | % | | | 0.67 | % | | | 0.66 | % | | | 1.14 | % | | | 0.73 | % |
Supplemental data | | | | | | | | | | | | | | | | | | | | | | | | |
Portfolio turnover rate | | | 24 | % | | | 39 | % | | | 32 | % | | | 41 | % | | | 51 | % | | | 46 | % |
Net assets, end of period (000s omitted) | | | $501,053 | | | | $381,058 | | | | $526,656 | | | | $539,499 | | | | $575,269 | | | | $417,161 | |
| 1 | Calculated based upon average shares outstanding |
| 2 | Total return calculations do not include any sales charges. Returns for periods of less than one year are not annualized. |
The accompanying notes are an integral part of these financial statements.
Wells Fargo Special Small Cap Value Fund | 19
Financial highlights
(For a share outstanding throughout each period)
| | | | | | | | | | | | | | | | | | | | | | | | |
| | | Six months ended
September 30, 2020
(unaudited) | | | Year ended March 31 | |
| CLASS C | | 2020 | | | 2019 | | | 2018 | | | 2017 | | | 2016 | |
Net asset value, beginning of period | | | $20.99 | | | | $28.49 | | | | $31.21 | | | | $30.19 | | | | $25.05 | | | | $26.81 | |
Net investment income (loss) | | | (0.00 | )1,2 | | | (0.01 | )1 | | | (0.05 | )1 | | | (0.03 | )1 | | | 0.12 | 1 | | | (0.03 | )1 |
Net realized and unrealized gains (losses) on investments | | | 3.88 | | | | (7.18 | ) | | | (0.61 | ) | | | 2.64 | | | | 5.59 | | | | (1.31 | ) |
| | | | | | | | | | | | | | | | | | | | | | | | |
Total from investment operations | | | 3.88 | | | | (7.19 | ) | | | (0.66 | ) | | | 2.61 | | | | 5.71 | | | | (1.34 | ) |
Distributions to shareholders from | | | | | | | | | | | | | | | | | | | | | | | | |
Net investment income | | | 0.00 | | | | 0.00 | | | | 0.00 | | | | (0.05 | ) | | | 0.00 | | | | 0.00 | |
Net realized gains | | | 0.00 | | | | (0.31 | ) | | | (2.06 | ) | | | (1.54 | ) | | | (0.57 | ) | | | (0.42 | ) |
| | | | | | | | | | | | | | | | | | | | | | | | |
Total distributions to shareholders | | | 0.00 | | | | (0.31 | ) | | | (2.06 | ) | | | (1.59 | ) | | | (0.57 | ) | | | (0.42 | ) |
Net asset value, end of period | | | $24.87 | | | | $20.99 | | | | $28.49 | | | | $31.21 | | | | $30.19 | | | | $25.05 | |
Total return3 | | | 18.54 | % | | | (25.65 | )% | | | (1.63 | )% | | | 8.60 | % | | | 22.75 | % | | | (4.93 | )% |
Ratios to average net assets (annualized) | | | | | | | | | | | | | | | | | | | | | | | | |
Gross expenses | | | 2.02 | % | | | 2.02 | % | | | 2.04 | % | | | 2.06 | % | | | 2.07 | % | | | 2.11 | % |
Net expenses | | | 2.02 | % | | | 2.02 | % | | | 2.04 | % | | | 2.06 | % | | | 2.07 | % | | | 2.09 | % |
Net investment income (loss) | | | (0.00 | )% | | | (0.04 | )% | | | (0.13 | )% | | | (0.10 | )% | | | 0.42 | % | | | (0.02 | )% |
Supplemental data | | | | | | | | | | | | | | | | | | | | | | | | |
Portfolio turnover rate | | | 24 | % | | | 39 | % | | | 32 | % | | | 41 | % | | | 51 | % | | | 46 | % |
Net assets, end of period (000s omitted) | | | $11,279 | | | | $11,419 | | | | $24,334 | | | | $53,145 | | | | $60,309 | | | | $40,512 | |
| 1 | Calculated based upon average shares outstanding |
| 2 | Amount is more than $(0.005). |
| 3 | Total return calculations do not include any sales charges. Returns for periods of less than one year are not annualized. |
The accompanying notes are an integral part of these financial statements.
20 | Wells Fargo Special Small Cap Value Fund
Financial highlights
(For a share outstanding throughout each period)
| | | | | | | | | | | | | | | | | | | | | | | | |
| | | Six months ended
September 30, 2020
(unaudited) | | | Year ended March 31 | |
| CLASS R | | 2020 | | | 2019 | | | 2018 | | | 2017 | | | 20161 | |
Net asset value, beginning of period | | | $23.73 | | | | $32.20 | | | | $34.94 | | | | $33.73 | | | | $27.97 | | | | $26.72 | |
Net investment income | | | 0.07 | 2 | | | 0.16 | | | | 0.18 | | | | 0.17 | | | | 0.63 | 2 | | | 0.08 | 2 |
Net realized and unrealized gains (losses) on investments | | | 4.37 | | | | (8.12 | ) | | | (0.74 | ) | | | 2.92 | | | | 5.94 | | | | 1.87 | |
| | | | | | | | | | | | | | | | | | | | | | | | |
Total from investment operations | | | 4.44 | | | | (7.96 | ) | | | (0.56 | ) | | | 3.09 | | | | 6.57 | | | | 1.95 | |
Distributions to shareholders from | | | | | | | | | | | | | | | | | | | | | | | | |
Net investment income | | | 0.00 | | | | (0.20 | ) | | | (0.12 | ) | | | (0.34 | ) | | | (0.24 | ) | | | (0.28 | ) |
Net realized gains | | | 0.00 | | | | (0.31 | ) | | | (2.06 | ) | | | (1.54 | ) | | | (0.57 | ) | | | (0.42 | ) |
| | | | | | | | | | | | | | | | | | | | | | | | |
Total distributions to shareholders | | | 0.00 | | | | (0.51 | ) | | | (2.18 | ) | | | (1.88 | ) | | | (0.81 | ) | | | (0.70 | ) |
Net asset value, end of period | | | $28.17 | | | | $23.73 | | | | $32.20 | | | | $34.94 | | | | $33.73 | | | | $27.97 | |
Total return3 | | | 18.76 | % | | | (25.29 | )% | | | (1.11 | )% | | | 9.13 | % | | | 23.47 | % | | | 7.40 | % |
Ratios to average net assets (annualized) | | | | | | | | | | | | | | | | | | | | | | | | |
Gross expenses | | | 1.53 | % | | | 1.52 | % | | | 1.55 | % | | | 1.57 | % | | | 1.56 | % | | | 1.59 | % |
Net expenses | | | 1.53 | % | | | 1.52 | % | | | 1.55 | % | | | 1.56 | % | | | 1.56 | % | | | 1.58 | % |
Net investment income | | | 0.48 | % | | | 0.46 | % | | | 0.47 | % | | | 0.43 | % | | | 1.86 | % | | | 0.56 | % |
Supplemental data | | | | | | | | | | | | | | | | | | | | | | | | |
Portfolio turnover rate | | | 24 | % | | | 39 | % | | | 32 | % | | | 41 | % | | | 51 | % | | | 46 | % |
Net assets, end of period (000s omitted) | | | $5,279 | | | | $5,209 | | | | $6,656 | | | | $4,631 | | | | $785 | | | | $27 | |
| 1 | For the period from September 30, 2015 (commencement of class operations) to March 31, 2016. |
| 2 | Calculated based upon average shares outstanding |
| 3 | Returns for periods of less than one year are not annualized. |
The accompanying notes are an integral part of these financial statements.
Wells Fargo Special Small Cap Value Fund | 21
Financial highlights
(For a share outstanding throughout each period)
| | | | | | | | | | | | | | | | | | | | | | | | |
| | | Six months ended
September 30, 2020
(unaudited) | | | Year ended March 31 | |
| CLASS R6 | | 2020 | | | 2019 | | | 2018 | | | 2017 | | | 2016 | |
Net asset value, beginning of period | | | $24.00 | | | | $32.55 | | | | $35.25 | | | | $33.93 | | | | $28.01 | | | | $29.91 | |
Net investment income | | | 0.17 | 1 | | | 0.37 | | | | 0.38 | | | | 0.38 | 1 | | | 0.61 | 1 | | | 0.39 | |
Net realized and unrealized gains (losses) on investments | | | 4.41 | | | | (8.17 | ) | | | (0.72 | ) | | | 2.97 | | | | 6.18 | | | | (1.54 | ) |
| | | | | | | | | | | | | | | | | | | | | | | | |
Total from investment operations | | | 4.58 | | | | (7.80 | ) | | | (0.34 | ) | | | 3.35 | | | | 6.79 | | | | (1.15 | ) |
Distributions to shareholders from | | | | | | | | | | | | | | | | | | | | | | | | |
Net investment income | | | 0.00 | | | | (0.44 | ) | | | (0.30 | ) | | | (0.49 | ) | | | (0.30 | ) | | | (0.33 | ) |
Net realized gains | | | 0.00 | | | | (0.31 | ) | | | (2.06 | ) | | | (1.54 | ) | | | (0.57 | ) | | | (0.42 | ) |
| | | | | | | | | | | | | | | | | | | | | | | | |
Total distributions to shareholders | | | 0.00 | | | | (0.75 | ) | | | (2.36 | ) | | | (2.03 | ) | | | (0.87 | ) | | | (0.75 | ) |
Net asset value, end of period | | | $28.58 | | | | $24.00 | | | | $32.55 | | | | $35.25 | | | | $33.93 | | | | $28.01 | |
Total return2 | | | 19.18 | % | | | (24.78 | )% | | | (0.42 | )% | | | 9.85 | % | | | 24.22 | % | | | (3.74 | )% |
Ratios to average net assets (annualized) | | | | | | | | | | | | | | | | | | | | | | | | |
Gross expenses | | | 0.85 | % | | | 0.84 | % | | | 0.86 | % | | | 0.88 | % | | | 0.89 | % | | | 0.93 | % |
Net expenses | | | 0.85 | % | | | 0.84 | % | | | 0.86 | % | | | 0.88 | % | | | 0.89 | % | | | 0.89 | % |
Net investment income | | | 1.21 | % | | | 1.12 | % | | | 1.16 | % | | | 1.10 | % | | | 1.87 | % | | | 1.56 | % |
Supplemental data | | | | | | | | | | | | | | | | | | | | | | | | |
Portfolio turnover rate | | | 24 | % | | | 39 | % | | | 32 | % | | | 41 | % | | | 51 | % | | | 46 | % |
Net assets, end of period (000s omitted) | | | $798,584 | | | | $580,535 | | | | $518,377 | | | | $254,801 | | | | $176,362 | | | | $36,344 | |
| 1 | Calculated based upon average shares outstanding |
| 2 | Returns for periods of less than one year are not annualized. |
The accompanying notes are an integral part of these financial statements.
22 | Wells Fargo Special Small Cap Value Fund
Financial highlights
(For a share outstanding throughout each period)
| | | | | | | | | | | | | | | | | | | | | | | | |
| | | Six months ended
September 30, 2020
(unaudited) | | | Year ended March 31 | |
| ADMINISTRATOR CLASS | | 2020 | | | 2019 | | | 2018 | | | 2017 | | | 2016 | |
Net asset value, beginning of period | | | $24.00 | | | | $32.55 | | | | $35.22 | | | | $33.90 | | | | $28.02 | | | | $29.94 | |
Net investment income | | | 0.11 | 1 | | | 0.26 | 1 | | | 0.27 | 1 | | | 0.27 | 1 | | | 0.44 | 1 | | | 0.26 | 1 |
Net realized and unrealized gains (losses) on investments | | | 4.42 | | | | (8.18 | ) | | | (0.71 | ) | | | 2.97 | | | | 6.24 | | | | (1.49 | ) |
| | | | | | | | | | | | | | | | | | | | | | | | |
Total from investment operations | | | 4.53 | | | | (7.92 | ) | | | (0.44 | ) | | | 3.24 | | | | 6.68 | | | | (1.23 | ) |
Distributions to shareholders from | | | | | | | | | | | | | | | | | | | | | | | | |
Net investment income | | | 0.00 | | | | (0.32 | ) | | | (0.17 | ) | | | (0.38 | ) | | | (0.23 | ) | | | (0.27 | ) |
Net realized gains | | | 0.00 | | | | (0.31 | ) | | | (2.06 | ) | | | (1.54 | ) | | | (0.57 | ) | | | (0.42 | ) |
| | | | | | | | | | | | | | | | | | | | | | | | |
Total distributions to shareholders | | | 0.00 | | | | (0.63 | ) | | | (2.23 | ) | | | (1.92 | ) | | | (0.80 | ) | | | (0.69 | ) |
Net asset value, end of period | | | $28.53 | | | | $24.00 | | | | $32.55 | | | | $35.22 | | | | $33.90 | | | | $28.02 | |
Total return2 | | | 18.97 | % | | | (25.03 | )% | | | (0.77 | )% | | | 9.52 | % | | | 23.82 | % | | | (4.01 | )% |
Ratios to average net assets (annualized) | | | | | | | | | | | | | | | | | | | | | | | | |
Gross expenses | | | 1.20 | % | | | 1.19 | % | | | 1.21 | % | | | 1.23 | % | | | 1.24 | % | | | 1.26 | % |
Net expenses | | | 1.20 | % | | | 1.19 | % | | | 1.20 | % | | | 1.20 | % | | | 1.20 | % | | | 1.17 | % |
Net investment income | | | 0.83 | % | | | 0.79 | % | | | 0.74 | % | | | 0.76 | % | | | 1.36 | % | | | 0.95 | % |
Supplemental data | | | | | | | | | | | | | | | | | | | | | | | | |
Portfolio turnover rate | | | 24 | % | | | 39 | % | | | 32 | % | | | 41 | % | | | 51 | % | | | 46 | % |
Net assets, end of period (000s omitted) | | | $108,054 | | | | $105,286 | | | | $160,369 | | | | $229,992 | | | | $199,262 | | | | $95,030 | |
| 1 | Calculated based upon average shares outstanding |
| 2 | Returns for periods of less than one year are not annualized. |
The accompanying notes are an integral part of these financial statements.
Wells Fargo Special Small Cap Value Fund | 23
Financial highlights
(For a share outstanding throughout each period)
| | | | | | | | | | | | | | | | | | | | | | | | |
| | | Six months ended
September 30, 2020
(unaudited) | | | Year ended March 31 | |
| INSTITUTIONAL CLASS | | 2020 | | | 2019 | | | 2018 | | | 2017 | | | 2016 | |
Net asset value, beginning of period | | | $24.01 | | | | $32.56 | | | | $35.27 | | | | $33.94 | | | | $28.03 | | | | $29.93 | |
Net investment income | | | 0.15 | | | | 0.31 | | | | 0.33 | | | | 0.33 | | | | 0.60 | 1 | | | 0.30 | |
Net realized and unrealized gains (losses) on investments | | | 4.42 | | | | (8.14 | ) | | | (0.70 | ) | | | 3.01 | | | | 6.17 | | | | (1.46 | ) |
| | | | | | | | | | | | | | | | | | | | | | | | |
Total from investment operations | | | 4.57 | | | | (7.83 | ) | | | (0.37 | ) | | | 3.34 | | | | 6.77 | | | | (1.16 | ) |
Distributions to shareholders from | | | | | | | | | | | | | | | | | | | | | | | | |
Net investment income | | | 0.00 | | | | (0.41 | ) | | | (0.28 | ) | | | (0.47 | ) | | | (0.29 | ) | | | (0.32 | ) |
Net realized gains | | | 0.00 | | | | (0.31 | ) | | | (2.06 | ) | | | (1.54 | ) | | | (0.57 | ) | | | (0.42 | ) |
| | | | | | | | | | | | | | | | | | | | | | | | |
Total distributions to shareholders | | | 0.00 | | | | (0.72 | ) | | | (2.34 | ) | | | (2.01 | ) | | | (0.86 | ) | | | (0.74 | ) |
Net asset value, end of period | | | $28.58 | | | | $24.01 | | | | $32.56 | | | | $35.27 | | | | $33.94 | | | | $28.03 | |
Total return2 | | | 19.13 | % | | | (24.85 | )% | | | (0.53 | )% | | | 9.82 | % | | | 24.13 | % | | | (3.79 | )% |
Ratios to average net assets (annualized) | | | | | | | | | | | | | | | | | | | | | | | | |
Gross expenses | | | 0.95 | % | | | 0.94 | % | | | 0.96 | % | | | 0.98 | % | | | 0.99 | % | | | 1.01 | % |
Net expenses | | | 0.94 | % | | | 0.94 | % | | | 0.94 | % | | | 0.94 | % | | | 0.94 | % | | | 0.94 | % |
Net investment income | | | 1.10 | % | | | 1.07 | % | | | 1.04 | % | | | 1.02 | % | | | 1.86 | % | | | 1.17 | % |
Supplemental data | | | | | | | | | | | | | | | | | | | | | | | | |
Portfolio turnover rate | | | 24 | % | | | 39 | % | | | 32 | % | | | 41 | % | | | 51 | % | | | 46 | % |
Net assets, end of period (000s omitted) | | | $1,806,642 | | | | $1,465,398 | | | | $1,359,038 | | | | $1,196,501 | | | | $921,732 | | | | $256,190 | |
| 1 | Calculated based upon average shares outstanding |
| 2 | Returns for periods of less than one year are not annualized. |
The accompanying notes are an integral part of these financial statements.
24 | Wells Fargo Special Small Cap Value Fund
Notes to financial statements (unaudited)
1. ORGANIZATION
Wells Fargo Funds Trust (the “Trust”), a Delaware statutory trust organized on March 10, 1999, is an open-end management investment company registered under the Investment Company Act of 1940, as amended (the “1940 Act”). As an investment company, the Trust follows the accounting and reporting guidance in Financial Accounting Standards Board (“FASB”) Accounting Standards Codification Topic 946, Financial Services – Investment Companies. These financial statements report on the Wells Fargo Special Small Cap Value Fund (the “Fund”) which is a diversified series of the Trust.
2. SIGNIFICANT ACCOUNTING POLICIES
The following significant accounting policies, which are consistently followed in the preparation of the financial statements of the Fund, are in conformity with U.S. generally accepted accounting principles which require management to make estimates and assumptions that affect the reported amounts of assets and liabilities, disclosure of contingent assets and liabilities at the date of the financial statements, and the reported amounts of revenues and expenses during the reporting period. Actual results could differ from those estimates.
Securities valuation
All investments are valued each business day as of the close of regular trading on the New York Stock Exchange (generally 4 p.m. Eastern Time), although the Fund may deviate from this calculation time under unusual or unexpected circumstances.
Equity securities and options that are listed on a foreign or domestic exchange or market are valued at the official closing price or, if none, the last sales price. If no sale occurs on the principal exchange or market that day, a fair value price will be determined in accordance with the Fund’s Valuation Procedures.
Investments in registered open-end investment companies are valued at net asset value. Interests in non-registered investment companies that are redeemable at net asset value are fair valued normally at net asset value.
Investments which are not valued using any of the methods discussed above are valued at their fair value, as determined in good faith by the Board of Trustees of the Fund. The Board of Trustees has established a Valuation Committee comprised of the Trustees and has delegated to it the authority to take any actions regarding the valuation of portfolio securities that the Valuation Committee deems necessary or appropriate, including determining the fair value of portfolio securities, unless the determination has been delegated to the Wells Fargo Asset Management Pricing Committee at Wells Fargo Funds Management, LLC (“Funds Management”). The Board of Trustees retains the authority to make or ratify any valuation decisions or approve any changes to the Valuation Procedures as it deems appropriate. On a quarterly basis, the Board of Trustees receives reports on any valuation actions taken by the Valuation Committee or the Wells Fargo Asset Management Pricing Committee which may include items for ratification.
Securities lending
The Fund may lend its securities from time to time in order to earn additional income in the form of fees or interest on securities received as collateral or the investment of any cash received as collateral. When securities are on loan, the Fund receives interest or dividends on those securities. Cash collateral received in connection with its securities lending transactions is invested in Securities Lending Cash Investments, LLC (the “Securities Lending Fund”). Investments in Securities Lending Fund are valued at the evaluated bid price provided by an independent pricing service. Income earned from investment in the Securities Lending Fund (net of fees and rebates), if any, is included in income from affiliated securities on the Statement of Operations.
In a securities lending transaction, the net asset value of the Fund is affected by an increase or decrease in the value of the securities loaned and by an increase or decrease in the value of the instrument in which collateral is invested. The amount of securities lending activity undertaken by the Fund fluctuates from time to time. The Fund has the right under the lending agreement to recover the securities from the borrower on demand. In the event of default or bankruptcy by the borrower, the Fund may be prevented from recovering the loaned securities or gaining access to the collateral or may experience delays or costs in doing so. In such an event, the terms of the agreement allow the unaffiliated securities lending agent to use the collateral to purchase replacement securities on behalf of the Fund or pay the Fund the market value of the loaned securities. The Fund bears the risk of loss with respect to depreciation of its investment of the cash collateral.
Futures contracts
Futures contracts are agreements between the Fund and a counterparty to buy or sell a specific amount of a commodity, financial instrument or currency at a specified price and on a specified date. The Fund may buy and sell futures contracts in order to gain exposure to, or protect against, changes in security values and is subject to equity price risk. The primary risks associated with the use of futures contracts are the imperfect correlation between changes in market values of securities held by the Fund and the prices of futures contracts, and the possibility of an illiquid market. Futures contracts are generally entered into on a regulated futures exchange and cleared through a clearinghouse associated with the exchange. With futures contracts, there is minimal counterparty risk to the Fund since futures contracts are exchange traded and the exchange’s clearinghouse, as the counterparty to all exchange traded futures, guarantees the futures contracts against default.
Wells Fargo Special Small Cap Value Fund | 25
Notes to financial statements (unaudited)
Upon entering into a futures contracts, the Fund is required to deposit either cash or securities (initial margin) with the broker in an amount equal to a certain percentage of the contract value. Subsequent payments (variation margin) are paid to or from the broker each day equal to the daily changes in the contract value. Such payments are recorded as unrealized gains or losses and, if any, shown as variation margin receivable (payable) in the Statement of Assets and Liabilities. Should the Fund fail to make requested variation margin payments, the broker can gain access to the initial margin to satisfy the Fund’s payment obligations. When the contracts are closed, a realized gain or loss is recorded in the Statement of Operations.
Options
The Fund may write covered call options or secured put options on individual securities and/or indexes. When the Fund writes an option, an amount equal to the premium received is recorded as a liability and is subsequently adjusted to the current market value of the written option. Premiums received from written options that expire unexercised are recognized as realized gains on the expiration date. For exercised options, the difference between the premium received and the amount paid on effecting a closing purchase transaction, including brokerage commissions, is treated as a realized gain or loss. If a call option is exercised, the premium is added to the proceeds from the sale of the underlying security in calculating the realized gain or loss on the sale. If a put option is exercised, the premium reduces the cost of the security purchased. The Fund, as a writer of an option, bears the market risk of an unfavorable change in the price of the security and/or index underlying the written option.
The Fund may also purchase call or put options. Premiums paid are included in the Statement of Assets and Liabilities as investments, the values of which are subsequently adjusted based on the current market values of the options. Premiums paid for purchased options that expire are recognized as realized losses on the expiration date. Premiums paid for purchased options that are exercised or closed are added to the amount paid or offset against the proceeds received for the underlying security to determine the realized gain or loss. The risk of loss associated with purchased options is limited to the premium paid.
Options traded on an exchange are regulated and terms of the options are standardized. The Fund is subject to equity price risk. Purchased options traded over-the-counter expose the Fund to counterparty risk in the event the counterparty does not perform. This risk can be mitigated by having a master netting arrangement between the Fund and the counterparty and by having the counterparty post collateral to cover the Fund’s exposure to the counterparty.
Security transactions and income recognition
Securities transactions are recorded on a trade date basis. Realized gains or losses are recorded on the basis of identified cost.
Dividend income is recognized on the ex-dividend date. Dividend income is recorded net of foreign taxes withheld where recovery of such taxes is not assured.
Income dividends and capital gain distributions from investment companies are recorded on the ex-dividend date. Capital gain distributions from investment companies are treated as realized gains.
Distributions to shareholders
Distributions to shareholders from net investment income and any net realized gains are recorded on the ex-dividend date and paid at least annually. Such distributions are determined in accordance with income tax regulations and may differ from U.S. generally accepted accounting principles. Dividend sources are estimated at the time of declaration. The tax character of distributions is determined as of the Fund’s fiscal year end. Therefore, a portion of the Fund’s distributions made prior to the Fund’s fiscal year end may be categorized as a tax return of capital at year end.
Federal and other taxes
The Fund intends to continue to qualify as a regulated investment company by distributing substantially all of its investment company taxable income and any net realized capital gains (after reduction for capital loss carryforwards) sufficient to relieve it from all, or substantially all, federal income taxes. Accordingly, no provision for federal income taxes was required.
The Fund’s income and federal excise tax returns and all financial records supporting those returns for the prior three fiscal years are subject to examination by the federal and Delaware revenue authorities. Management has analyzed the Fund’s tax positions taken on federal, state, and foreign tax returns for all open tax years and does not believe that there are any uncertain tax positions that require recognition of a tax liability.
As of September 30, 2020, the aggregate cost of all investments for federal income tax purposes was $3,522,527,291 and the unrealized gains (losses) consisted of:
| | | | |
| |
Gross unrealized gains | | $ | 338,721,852 | |
| |
Gross unrealized losses | | | (654,711,433 | ) |
| |
Net unrealized losses | | $ | (315,989,581 | ) |
26 | Wells Fargo Special Small Cap Value Fund
Notes to financial statements (unaudited)
As of March 31, 2020, the Fund had current year net deferred post-October capital losses consisting of $18,930,438 in short-term losses which was recognized on the first day of the current fiscal year.
Class allocations
The separate classes of shares offered by the Fund differ principally in applicable sales charges, distribution, shareholder servicing, and administration fees. Class specific expenses are charged directly to that share class. Investment income, common fund-level expenses, and realized and unrealized gains (losses) on investments are allocated daily to each class of shares based on the relative proportion of net assets of each class.
3. FAIR VALUATION MEASUREMENTS
Fair value measurements of investments are determined within a framework that has established a fair value hierarchy based upon the various data inputs utilized in determining the value of the Fund’s investments. The three-level hierarchy gives the highest priority to unadjusted quoted prices in active markets for identical assets or liabilities (Level 1) and the lowest priority to unobservable inputs (Level 3). The Fund’s investments are classified within the fair value hierarchy based on the lowest level of input that is significant to the fair value measurement. The inputs are summarized into three broad levels as follows:
| ∎ | | Level 1 – quoted prices in active markets for identical securities |
| ∎ | | Level 2 – other significant observable inputs (including quoted prices for similar securities, interest rates, prepayment speeds, credit risk, etc.) |
| ∎ | | Level 3 – significant unobservable inputs (including the Fund’s own assumptions in determining the fair value of investments) |
The inputs or methodologies used for valuing investments in securities are not necessarily an indication of the risk associated with investing in those securities.
The following is a summary of the inputs used in valuing the Fund’s assets and liabilities as of September 30, 2020:
| | | | | | | | | | | | | | | | |
| | | | |
| | | Quoted prices
(Level 1) | | | Other significant
observable inputs
(Level 2) | | | Significant
unobservable inputs (Level 3) | | | Total | |
| | | | |
Assets | | | | | | | | | | | | | | | | |
Investments in: | | | | | | | | | | | | | | | | |
| | | | |
Common stocks | | | | | | | | | | | | | | | | |
| | | | |
Communication services | | $ | 4,895,795 | | | $ | 0 | | | $ | 0 | | | $ | 4,895,795 | |
| | | | |
Consumer discretionary | | | 232,563,513 | | | | 0 | | | | 0 | | | | 232,563,513 | |
| | | | |
Consumer staples | | | 435,131,688 | | | | 0 | | | | 0 | | | | 435,131,688 | |
| | | | |
Energy | | | 45,294,500 | | | | 0 | | | | 0 | | | | 45,294,500 | |
| | | | |
Financials | | | 660,610,131 | | | | 91,620 | | | | 0 | | | | 660,701,751 | |
| | | | |
Health care | | | 115,202,126 | | | | 0 | | | | 0 | | | | 115,202,126 | |
| | | | |
Industrials | | | 777,431,404 | | | | 0 | | | | 0 | | | | 777,431,404 | |
| | | | |
Information technology | | | 156,170,229 | | | | 0 | | | | 0 | | | | 156,170,229 | |
| | | | |
Materials | | | 529,504,485 | | | | 0 | | | | 0 | | | | 529,504,485 | |
| | | | |
Real estate | | | 41,872,738 | | | | 0 | | | | 0 | | | | 41,872,738 | |
| | | | |
Utilities | | | 139,019,489 | | | | 0 | | | | 0 | | | | 139,019,489 | |
| | | | |
Exchange-traded funds | | | 5,894,237 | | | | 0 | | | | 0 | | | | 5,894,237 | |
| | | | |
Preferred stocks | | | | | | | | | | | | | | | | |
| | | | |
Industrials | | | 2,150,320 | | | | 0 | | | | 0 | | | | 2,150,320 | |
| | | | |
Warrants | | | | | | | | | | | | | | | | |
| | | | |
Financials | | | 0 | | | | 1,279,802 | | | | 0 | | | | 1,279,802 | |
| | | | |
Short-term investments | | | | | | | | | | | | | | | | |
| | | | |
Investment companies | | | 59,425,633 | | | | 0 | | | | 0 | | | | 59,425,633 | |
| | | | |
Total assets | | $ | 3,205,166,288 | | | $ | 1,371,422 | | | $ | 0 | | | $ | 3,206,537,710 | |
| | | | |
Liabilities | | | | | | | | | | | | | | | | |
| | | | |
Written options | | $ | 0 | | | $ | 3,463,640 | | | $ | 0 | | | $ | 3,463,640 | |
| | | | |
Total liabilities | | $ | 0 | | | $ | 3,463,640 | | | $ | 0 | | | $ | 3,463,640 | |
Wells Fargo Special Small Cap Value Fund | 27
Notes to financial statements (unaudited)
Additional sector, industry or geographic detail is included in the Portfolio of Investments.
For the six months ended September 30, 2020, the Fund did not have any transfers into/out of Level 3.
4. TRANSACTIONS WITH AFFILIATES
Management fee
Funds Management, an indirect wholly owned subsidiary of Wells Fargo & Company (“Wells Fargo”), is the manager of the Fund and provides advisory and fund-level administrative services under an investment management agreement. Under the investment management agreement, Funds Management is responsible for, among other services, implementing the investment objectives and strategies of the Fund, supervising the subadviser and providing fund-level administrative services in connection with the Fund’s operations. As compensation for its services under the investment management agreement, Funds Management is entitled to receive a management fee at the following annual rate based on the Fund’s average daily net assets:
| | | | |
| |
| Average daily net assets | | Management fee | |
| |
First $500 million | | | 0.850 | % |
| |
Next $500 million | | | 0.825 | |
| |
Next $1 billion | | | 0.800 | |
| |
Next $1 billion | | | 0.775 | |
| |
Next $1 billion | | | 0.750 | |
| |
Next $1 billion | | | 0.730 | |
| |
Next $5 billion | | | 0.720 | |
| |
Over $10 billion | | | 0.710 | |
For the six months ended September 30, 2020, the management fee was equivalent to an annual rate of 0.80% of the Fund’s average daily net assets.
Funds Management has retained the services of a subadviser to provide daily portfolio management to the Fund. The fee for subadvisory services is borne by Funds Management. Wells Capital Management Incorporated (“WellsCap”), an affiliate of Funds Management and an indirect wholly owned subsidiary of Wells Fargo, is the subadviser to the Fund and is entitled to receive a fee from Funds Management at an annual rate starting at 0.55% and declining to 0.40% as the average daily net assets of the Fund increase.
Administration fees
Under a class-level administration agreement, Funds Management provides class-level administrative services to the Fund, which includes paying fees and expenses for services provided by the transfer agent, sub-transfer agents, omnibus account servicers and record-keepers. As compensation for its services under the class-level administration agreement, Funds Management receives an annual fee which is calculated based on the average daily net assets of each class as follows:
| | | | |
| |
| | | Class-level
administration fee | |
| |
Class A, Class C, Class R | | | 0.21 | % |
| |
Class R6 | | | 0.03 | |
| |
Administrator Class, Institutional Class | | | 0.13 | |
Waivers and/or expense reimbursements
Funds Management has contractually waived and/or reimbursed management and administration fees to the extent necessary to maintain certain net operating expense ratios for the Fund. When each class of the Fund has exceeded its expense cap, Funds Management has waived fees and/or reimbursed expenses from fund-level expenses on a proportionate basis and then from class specific expenses. When only certain classes exceed their expense caps, waivers and/or reimbursements are applied against class specific expenses before fund-level expenses. Funds Management has committed through July 31, 2021 to waive fees and/or reimburse expenses to the extent necessary to cap the Fund’s expenses at 1.31% for Class A shares, 2.06% for Class C shares, 1.56% for Class R shares, 0.89% for Class R6 shares, 1.20% for Administrator Class shares, and 0.94% for Institutional Class shares. Prior to or after the commitment expiration date, the cap may be increased or the commitment to maintain the cap may be terminated only with the approval of the Board of Trustees.
28 | Wells Fargo Special Small Cap Value Fund
Notes to financial statements (unaudited)
Distribution fees
The Trust has adopted a distribution plan for Class C and Class R shares of the Fund pursuant to Rule 12b-1 under the 1940 Act. Distribution fees are charged to Class C and Class R shares and paid to Wells Fargo Funds Distributor, LLC (“Funds Distributor”), the principal underwriter, at an annual rate of 0.75% of the average daily net assets of Class C shares and 0.25% of the average daily net assets of Class R shares.
In addition, Funds Distributor is entitled to receive the front-end sales charge from the purchase of Class A shares and a contingent deferred sales charge on the redemption of certain Class A shares. Funds Distributor is also entitled to receive the contingent deferred sales charges from redemptions of Class C shares. For the six months ended September 30, 2020, Funds Distributor received $1,078 from the sale of Class A shares. No contingent deferred sales charges were incurred by Class A and Class C shares for the six months ended September 30, 2020.
Shareholder servicing fees
The Trust has entered into contracts with one or more shareholder servicing agents, whereby Class A, Class C, Class R, and Administrator Class of the Fund are charged a fee at an annual rate of 0.25% of the average daily net assets of each respective class. A portion of these total shareholder servicing fees were paid to affiliates of Wells Fargo.
Interfund transactions
The Fund may purchase or sell portfolio investment securities to certain other Wells Fargo affiliates pursuant to Rule 17a-7 under the 1940 Act and under procedures adopted by the Board of Trustees. The procedures have been designed to ensure that these interfund transactions, which do not incur broker commissions, are effected at current market prices.
5. INVESTMENT PORTFOLIO TRANSACTIONS
Purchases and sales of investments, excluding U.S. government obligations (if any) and short-term securities, for the six months ended September 30, 2020 were $983,099,148 and $717,450,747, respectively.
6. SECURITIES LENDING TRANSACTIONS
The Fund lends its securities through an unaffiliated securities lending agent and receives collateral in the form of cash or securities with a value at least equal to the value of the securities on loan. The value of the loaned securities is determined at the close of each business day and any increases or decreases in the required collateral are exchanged between the Fund and the counterparty on the next business day. Cash collateral received is invested in the Securities Lending Fund which seeks to provide a positive return compared to the daily Federal Funds Open Rate by investing in high-quality, U.S. dollar-denominated short-term money market instruments and is exempt from registration under Section 3(c)(7) of the 1940 Act. Securities Lending Fund is managed by Funds Management and is subadvised by WellsCap. Funds Management receives an advisory fee starting at 0.05% and declining to 0.01% as the average daily net assets of the Securities Lending Fund increase. All of the fees received by Funds Management are paid to WellsCap for its services as subadviser.
In the event of counterparty default or the failure of a borrower to return a loaned security, the Fund has the right to use the collateral to offset any losses incurred. As of September 30, 2020, the Fund had securities lending transactions with the following counterparties which are subject to offset:
| | | | | | | | | | | | |
| | | |
| Counterparty | | Value of
securities on
loan | | | Collateral
received1 | | | Net amount | |
| | | |
Bank of America Securities Inc. | | $ | 1,954,700 | | | $ | (1,954,700 | ) | | $ | 0 | |
| | | |
Barclays Capital Inc. | | | 2,885,578 | | | | (2,885,578 | ) | | | 0 | |
| | | |
BNP Paribas Securities Corp. | | | 5,707,771 | | | | (5,707,771 | ) | | | 0 | |
| | | |
Citigroup Global Markets Inc. | | | 132,518 | | | | (132,518 | ) | | | 0 | |
| | | |
Deutsche Bank Securities Inc. | | | 131,480 | | | | (131,480 | ) | | | 0 | |
| | | |
JPMorgan Securities LLC | | | 3,067,102 | | | | (3,067,102 | ) | | | 0 | |
| | | |
Morgan Stanley & Co. LLC | | | 2,398,329 | | | | (2,398,329 | ) | | | 0 | |
| | | |
Scotia Capital (USA) Inc. | | | 556,368 | | | | (556,368 | ) | | | 0 | |
| 1 | Collateral received within this table is limited to the collateral for the net transaction with the counterparty. |
Wells Fargo Special Small Cap Value Fund | 29
Notes to financial statements (unaudited)
7. DERIVATIVE TRANSACTIONS
During the six months ended September 30, 2020, the Fund entered into written options for hedging purposes. The Fund had an average of 4,297 written option contracts during the six months ended September 30, 2020.
The fair value, realized gains or losses and change in unrealized gains or losses, if any, on derivative instruments are reflected in the corresponding financial statement captions.
8. BANK BORROWINGS
The Trust (excluding the money market funds), Wells Fargo Master Trust and Wells Fargo Variable Trust are parties to a $350,000,000 revolving credit agreement whereby the Fund is permitted to use bank borrowings for temporary or emergency purposes, such as to fund shareholder redemption requests. Interest under the credit agreement is charged to the Fund based on a borrowing rate equal to the higher of the Federal Funds rate in effect on that day plus 1.25% or the overnight LIBOR rate in effect on that day plus 1.25%. In addition, an annual commitment fee equal to 0.25% of the unused balance is allocated to each participating fund.
For the six months ended September 30, 2020, there were no borrowings by the Fund under the agreement.
9. CONCENTRATION RISK
Concentration risks result from exposure to a limited number of sectors. As of the end of the period, the Fund concentrated its portfolio in investments related to the industrial sector. A fund that invests a substantial portion of its assets in any sector may be more affected by changes in that sector than would be a fund whose investments are not heavily weighted in any sector.
10. INDEMNIFICATION
Under the Fund’s organizational documents, the officers and Trustees have been granted certain indemnification rights against certain liabilities that may arise out of performance of their duties to the Fund. The Fund has entered into a separate agreement with each Trustee that converts indemnification rights currently existing under the Fund’s organizational documents into contractual rights that cannot be changed in the future without the consent of the Trustee. Additionally, in the normal course of business, the Fund may enter into contracts with service providers that contain a variety of indemnification clauses. The Fund’s maximum exposure under these arrangements is dependent on future claims that may be made against the Fund and, therefore, cannot be estimated.
11. NEW ACCOUNTING PRONOUNCEMENT
In August 2018, FASB issued Accounting Standards Update (“ASU”) No. 2018-13, Fair Value Measurement (Topic 820) Disclosure Framework—Changes to the Disclosure Requirements for Fair Value Measurement. ASU 2018-13 updates the disclosure requirements on fair value measurements in Topic 820, Fair Value Measurements. The amendments are effective for fiscal years, and interim periods within those fiscal years, beginning after December 15, 2019. Management has adopted this guidance which did not have a material impact on the financial statements.
12. CORONAVIRUS (COVID-19) PANDEMIC
On March 11, 2020, the World Health Organization announced that it had made the assessment that coronavirus disease 2019 (“COVID-19”) is a pandemic. The impacts of COVID-19 are adversely affecting the entire global economy, individual companies and investment products, and the market in general. There is significant uncertainty around the extent and duration of business disruptions related to COVID-19 and the impacts may be short term or may last for an extended period of time. The risk of further spreading of COVID-19 has led to significant uncertainty and volatility in the financial markets.
30 | Wells Fargo Special Small Cap Value Fund
Other information (unaudited)
PROXY VOTING INFORMATION
A description of the policies and procedures used to determine how to vote proxies relating to portfolio securities is available, upon request, by calling 1-800-222-8222, visiting our website at wfam.com, or visiting the SEC website at sec.gov. Information regarding how the proxies related to portfolio securities were voted during the most recent 12-month period ended June 30 is available on the website at wfam.com or by visiting the SEC website at sec.gov.
QUARTERLY PORTFOLIO HOLDINGS INFORMATION
The Fund files its complete schedule of portfolio holdings with the SEC for the first and third quarters of each fiscal year as an exhibit to its reports on Form N-PORT. Shareholders may view the filed Form N-PORT by visiting the SEC website at sec.gov.
Wells Fargo Special Small Cap Value Fund | 31
Other information (unaudited)
BOARD OF TRUSTEES AND OFFICERS
Each of the Trustees and Officers1 listed in the table below acts in identical capacities for each fund in the Wells Fargo family of funds, which consists of 142 mutual funds comprising the Wells Fargo Funds Trust, Wells Fargo Variable Trust, Wells Fargo Master Trust and four closed-end funds (collectively the “Fund Complex”). This table should be read in conjunction with the Prospectus and the Statement of Additional Information2. The mailing address of each Trustee and Officer is 525 Market Street, 12th Floor, San Francisco, CA 94105. Each Trustee and Officer serves an indefinite term, however, each Trustee serves such term until reaching the mandatory retirement age established by the Trustees.
Independent Trustees
| | | | | | |
Name and
year of birth | | Position held and length of service* | | Principal occupations during past five years or longer | | Current other
public company or
investment
company
directorships |
| | | |
William R. Ebsworth (Born 1957) | | Trustee, since 2015 | | Retired. From 1984 to 2013, equities analyst, portfolio manager, research director and chief investment officer at Fidelity Management and Research Company in Boston, Tokyo, and Hong Kong, and retired in 2013 as Chief Investment Officer of Fidelity Strategic Advisers, Inc. where he led a team of investment professionals managing client assets. Prior thereto, Board member of Hong Kong Securities Clearing Co., Hong Kong Options Clearing Corp., the Thailand International Fund, Ltd., Fidelity Investments Life Insurance Company, and Empire Fidelity Investments Life Insurance Company. Audit Committee Chair and Investment Committee Chair of the Vincent Memorial Hospital Endowment (non-profit organization). Mr. Ebsworth is a CFA® charterholder. | | N/A |
| | | |
Jane A. Freeman (Born 1953) | | Trustee, since 2015; Chair Liaison, since 2018 | | Retired. From 2012 to 2014 and 1999 to 2008, Chief Financial Officer of Scientific Learning Corporation. From 2008 to 2012, Ms. Freeman provided consulting services related to strategic business projects. Prior to 1999, Portfolio Manager at Rockefeller & Co. and Scudder, Stevens & Clark. Board member of the Harding Loevner Funds from 1996 to 2014, serving as both Lead Independent Director and chair of the Audit Committee. Board member of the Russell Exchange Traded Funds Trust from 2011 to 2012 and the chair of the Audit Committee. Ms. Freeman is also an inactive Chartered Financial Analyst. | | N/A |
| | | |
Isaiah Harris, Jr. (Born 1952) | | Trustee, since 2009; Audit Committee Chairman, since 2019 | | Retired. Chairman of the Board of CIGNA Corporation since 2009, and Director since 2005. From 2003 to 2011, Director of Deluxe Corporation. Prior thereto, President and CEO of BellSouth Advertising and Publishing Corp. from 2005 to 2007, President and CEO of BellSouth Enterprises from 2004 to 2005 and President of BellSouth Consumer Services from 2000 to 2003. Emeritus member of the Iowa State University Foundation Board of Governors. Emeritus Member of the Advisory Board of Iowa State University School of Business. Advisory Board Member, Palm Harbor Academy (private school). Mr. Harris is a certified public accountant (inactive status). | | CIGNA Corporation |
| | | |
Judith M. Johnson (Born 1949) | | Trustee, since 2008 | | Retired. Prior thereto, Chief Executive Officer and Chief Investment Officer of Minneapolis Employees Retirement Fund from 1996 to 2008. Ms. Johnson is an attorney, certified public accountant and a certified managerial accountant. | | N/A |
| | | |
David F. Larcker (Born 1950) | | Trustee, since 2009 | | James Irvin Miller Professor of Accounting at the Graduate School of Business (Emeritus), Stanford University, Director of the Corporate Governance Research Initiative and Senior Faculty of The Rock Center for Corporate Governance since 2006. From 2005 to 2008, Professor of Accounting at the Graduate School of Business, Stanford University. Prior thereto, Ernst & Young Professor of Accounting at The Wharton School, University of Pennsylvania from 1985 to 2005. | | N/A |
32 | Wells Fargo Special Small Cap Value Fund
Other information (unaudited)
| | | | | | |
Name and
year of birth | | Position held and length of service* | | Principal occupations during past five years or longer | | Current other
public company or
investment
company
directorships |
| | | |
Olivia S. Mitchell (Born 1953) | | Trustee, since 2006; Nominating and Governance Committee Chair, since 2018 | | International Foundation of Employee Benefit Plans Professor, Wharton School of the University of Pennsylvania since 1993. Director of Wharton’s Pension Research Council and Boettner Center on Pensions & Retirement Research, and Research Associate at the National Bureau of Economic Research. Previously, Cornell University Professor from 1978 to 1993. | | N/A |
| | | |
Timothy J. Penny (Born 1951) | | Trustee, since 1996; Chairman, since 2018 | | President and Chief Executive Officer of Southern Minnesota Initiative Foundation, a non-profit organization, since 2007. Member of the Board of Trustees of NorthStar Education Finance, Inc., a non-profit organization, since 2007. | | N/A |
| | | |
James G. Polisson (Born 1959) | | Trustee, since 2018 | | Retired. Chief Marketing Officer, Source (ETF) UK Services, Ltd, from 2015 to 2017. From 2012 to 2015, Principal of The Polisson Group, LLC, a management consulting, corporate advisory and principal investing company. Chief Executive Officer and Managing Director at Russell Investments, Global Exchange Traded Funds from 2010 to 2012. Managing Director of Barclays Global Investors from 1998 to 2010 and Global Chief Marketing Officer for iShares and Barclays Global Investors from 2000 to 2010. Trustee of the San Francisco Mechanics’ Institute, a non-profit organization, from 2013 to 2015. Board member of the Russell Exchange Traded Fund Trust from 2011 to 2012. Director of Barclays Global Investors Holdings Deutschland GmbH from 2006 to 2009. Mr. Polisson is an attorney and has a retired status with the Massachusetts and District of Columbia Bar Associations. | | N/A |
| | | |
Pamela Wheelock (Born 1959) | | Trustee, since January 2020; previously Trustee from January 2018 to July 2019 | | Board member of the Destination Medical Center Economic Development Agency, Rochester, Minnesota since 2019. Interim President of the McKnight Foundation from January to September 2020. Acting Commissioner, Minnesota Department of Human Services, July 2019 through September 2019. Human Services Manager (part-time), Minnesota Department of Human Services, October 2019 through December 2019. Chief Operating Officer, Twin Cities Habitat for Humanity from 2017 to 2019. Vice President of University Services, University of Minnesota from 2012 to 2016. Prior thereto, on the Board of Directors, Governance Committee and Finance Committee for the Minnesota Philanthropy Partners (Saint Paul Foundation) from 2012 to 2018, Interim Chief Executive Officer of Blue Cross Blue Shield of Minnesota from 2011 to 2012, Chairman of the Board from 2009 to 2012 and Board Director from 2003 to 2015. Vice President, Leadership and Community Engagement, Bush Foundation, Saint Paul, Minnesota (a private foundation) from 2009 to 2011. Executive Vice President and Chief Financial Officer, Minnesota Sports and Entertainment from 2004 to 2009 and Senior Vice President from 2002 to 2004. Executive Vice President of the Minnesota Wild Foundation from 2004 to 2008. Commissioner of Finance, State of Minnesota, from 1999 to 2002. Currently Board Chair of the Minnesota Wild Foundation since 2010. | | N/A |
| * | Length of service dates reflect the Trustee’s commencement of service with the Trust’s predecessor entities, where applicable. |
Wells Fargo Special Small Cap Value Fund | 33
Other information (unaudited)
Officers
| | | | |
Name and year of birth | | Position held and length of service | | Principal occupations during past five years or longer |
| | |
Andrew Owen (Born 1960) | | President, since 2017 | | Executive Vice President of Wells Fargo & Company and Head of Affiliated Managers, Wells Fargo Asset Management, since 2014. In addition, Mr. Owen is currently President, Chief Executive Officer and Director of Wells Fargo Funds Management, LLC since 2017. Prior thereto, Executive Vice President responsible for marketing, investments and product development for Wells Fargo Funds Management, LLC, from 2009 to 2014. |
| | |
Nancy Wiser1 (Born 1967) | | Treasurer, since 2012 | | Executive Vice President of Wells Fargo Funds Management, LLC since 2011. Chief Operating Officer and Chief Compliance Officer at LightBox Capital Management LLC, from 2008 to 2011. |
| | |
Michelle Rhee (Born 1966) | | Chief Legal Officer, since 2019 | | Secretary of Wells Fargo Funds Management, LLC, Chief Legal Counsel of Wells Fargo Asset Management and Assistant General Counsel of Wells Fargo Bank, N.A. since 2018. Associate General Counsel and Managing Director of Bank of America Corporation from 2004 to 2018. |
| | |
Catherine Kennedy (Born 1969) | | Secretary, since 2019 | | Vice President of Wells Fargo Funds Management, LLC and Senior Counsel of the Wells Fargo Legal Department since 2010. Vice President and Senior Counsel of Evergreen Investment Management Company, LLC from 1998 to 2010. |
| | |
Michael H. Whitaker (Born 1967) | | Chief Compliance Officer, since 2016 | | Chief Compliance Officer of Wells Fargo Asset Management since 2016. Senior Vice President and Chief Compliance Officer for Fidelity Investments from 2007 to 2016. |
| | |
Jeremy DePalma1 (Born 1974) | | Assistant Treasurer, since 2009 | | Senior Vice President of Wells Fargo Funds Management, LLC since 2009. Senior Vice President of Evergreen Investment Management Company, LLC from 2008 to 2010 and head of the Fund Reporting and Control Team within Fund Administration from 2005 to 2010. |
| 1 | Nancy Wiser acts as Treasurer of 65 funds in the Fund Complex. Jeremy DePalma acts as the Treasurer of 77 funds and Assistant Treasurer of 65 funds in the Fund Complex. |
| 2 | The Statement of Additional Information includes additional information about the Trustees and is available, without charge, upon request, by calling 1-800-222-8222 or by visiting the website at wfam.com. |
34 | Wells Fargo Special Small Cap Value Fund
Other information (unaudited)
BOARD CONSIDERATION OF INVESTMENT MANAGEMENT AND SUB-ADVISORY AGREEMENTS:
Wells Fargo Special Small Cap Value Fund
Under the Investment Company Act of 1940 (the “1940 Act”), the Board of Trustees (the “Board”) of Wells Fargo Funds Trust (the “Trust”) must determine annually whether to approve the continuation of the Trust’s investment management and sub-advisory agreements. In this regard, at a Board meeting held on May 26, 2020 and May 28, 2020 (together, the “Meeting”), the Board, all the members of which have no direct or indirect interest in the investment management and sub-advisory agreements and are not “interested persons” of the Trust, as defined in the 1940 Act (the “Independent Trustees”), reviewed and approved for Wells Fargo Special Small Cap Value Fund (the “Fund”): (i) an investment management agreement (the “Management Agreement”) with Wells Fargo Funds Management, LLC (“Funds Management”); and (ii) an investment sub-advisory agreement (the “Sub-Advisory Agreement”) with Wells Capital Management Incorporated (the “Sub-Adviser”), an affiliate of Funds Management. The Management Agreement and the Sub-Advisory Agreement are collectively referred to as the “Advisory Agreements.”
At the Meeting, the Board considered the factors and reached the conclusions described below relating to the selection of Funds Management and the Sub-Adviser and the approval of the Advisory Agreements. Prior to the Meeting, including at a Board meeting held in April 2020, the Trustees conferred extensively among themselves and with representatives of Funds Management about these matters. Also, the Board has adopted a team-based approach, with each team consisting of a sub-set of Trustees, to assist the full Board in the discharge of its duties in reviewing investment performance and other matters throughout the year. The Independent Trustees were assisted in their evaluation of the Advisory Agreements by independent legal counsel, from whom they received separate legal advice and with whom they met separately.
In providing information to the Board, Funds Management and the Sub-Adviser were guided by a detailed set of requests for information submitted to them by independent legal counsel on behalf of the Independent Trustees at the start of the Board’s annual contract renewal process earlier in 2020. In considering and approving the Advisory Agreements, the Trustees considered the information they believed relevant, including but not limited to the information discussed below. The Board considered not only the specific information presented in connection with the Meeting, but also the knowledge gained over time through interaction with Funds Management and the Sub-Adviser about various topics. In this regard, the Board reviewed reports of Funds Management at each of its quarterly meetings, which included, among other things, portfolio reviews and investment performance reports. In addition, the Board and the teams mentioned above confer with portfolio managers at various times throughout the year. The Board did not identify any particular information or consideration that was all-important or controlling, and each individual Trustee may have attributed different weights to various factors.
After its deliberations, the Board unanimously approved the continuation of the Advisory Agreements for a one-year term and determined that the compensation payable to Funds Management and the Sub-Adviser under each of the Advisory Agreements was reasonable. The Board considered the approval of the Advisory Agreements for the Fund as part of its consideration of agreements for funds across the complex, but its approvals were made on a fund-by-fund basis. The following summarizes a number of important, but not necessarily all, factors considered by the Board in support of its approvals.
Nature, extent and quality of services
The Board received and considered various information regarding the nature, extent and quality of services provided to the Fund by Funds Management and the Sub-Adviser under the Advisory Agreements. This information included a description of the investment advisory services and Fund-level administrative services covered by the Management Agreement, as well as, among other things, a summary of the background and experience of senior management of Wells Fargo Asset Management (“WFAM”), of which Funds Management and the Sub-Adviser are a part, and a summary of investments made in the business of WFAM. The Board also received a description of Funds Management’s and the Sub-Adviser’s business continuity plans and of their approaches to data privacy and cybersecurity, and related testing. The Board also received and reviewed information about Funds Management’s role as administrator of the Fund’s liquidity risk management program, Funds Management’s approach to risk management, and Funds Management’s intermediary and vendor oversight program.
The Board also considered the qualifications, background, tenure and responsibilities of each of the portfolio managers primarily responsible for the day-to-day portfolio management of the Fund. The Board evaluated the ability of Funds Management and the Sub-Adviser to attract and retain qualified investment professionals, including research, advisory and supervisory personnel. The Board further considered the compliance programs and compliance records of Funds Management and the Sub-Adviser. In addition, the Board took into account the full range of services provided to the Fund by Funds Management and its affiliates.
Wells Fargo Special Small Cap Value Fund | 35
Other information (unaudited)
Fund investment performance and expenses
The Board considered the investment performance results for the Fund over various time periods ended December 31, 2019. The Board also considered more current results for various time periods ended March 31, 2020. The Board considered these results in comparison to the investment performance of funds in a universe that was determined by Broadridge Inc. (“Broadridge”) to be similar to the Fund (the “Universe”), and in comparison to the Fund’s benchmark index and to other comparative data. Broadridge is an independent provider of investment company data. The Board received a description of the methodology used by Broadridge to select the mutual funds in the performance Universe. The Board noted that the investment performance of the Fund (Administrator Class) was higher than the average investment performance of the Universe for the one-, three-, five- and ten-year periods ended December 31, 2019. The Board also noted that the investment performance of the Fund (Administrator Class) was higher than the average investment performance of the Universe for all periods ended March 31, 2020. The Board also noted that the investment performance of the Fund was higher than its benchmark index, the Russell 2000® Value Index, for all periods ended December 31, 2019. The Board also noted that the investment performance of the Fund was higher than its benchmark index, the Russell 2000® Value Index, for all periods ended March 31, 2020.
The Board also received and considered information regarding the Fund’s net operating expense ratios and their various components, including actual management fees, custodian and other non-management fees, and Rule 12b-1 and non-Rule 12b-1 shareholder service fees. The Board considered these ratios in comparison to the median ratios of funds in class-specific expense groups that were determined by Broadridge to be similar to the Fund (the “Groups”). The Board received a description of the methodology used by Broadridge to select the mutual funds in the expense Groups and an explanation of how funds comprising expense groups and their expense ratios may vary from year-to-year. Based on the Broadridge reports, the Board noted that the net operating expense ratios of the Fund were lower than or in range of the median net operating expense ratios of the expense Groups for each share class.
The Board took into account the Fund’s investment performance and expense information provided to it among the factors considered in deciding to re-approve the Advisory Agreements.
Investment management and sub-advisory fee rates
The Board reviewed and considered the contractual fee rates payable by the Fund to Funds Management under the Management Agreement, as well as the contractual fee rates payable by the Fund to Funds Management for class-level administrative services under a Class-Level Administration Agreement, which include, among other things, class-level transfer agency and sub-transfer agency costs (collectively, the “Management Rates”). The Board also reviewed and considered the contractual investment sub-advisory fee rates that are payable by Funds Management to the Sub-Adviser for investment sub-advisory services.
Among other information reviewed by the Board was a comparison of the Fund’s Management Rates with the average contractual investment management fee rates of funds in the expense Groups at a common asset level as well as transfer agency costs of the funds in the expense Groups. The Board noted that the Management Rates of the Fund were higher the sum of these average rates for the Fund’s expense Groups for Class R, Class A and the Administrator Class, and in range of the sum of these average rates for the Fund’s expense Groups for the Institutional Class and Class R6. The Board noted that the Fund’s expense ratio caps, including the expense ratio caps for Class R, Class A and the Administrator Class, would be maintained..
The Board also received and considered information about the portion of the total management fee that was retained by Funds Management after payment of the fee to the Sub-Adviser for sub-advisory services. In assessing the reasonableness of this amount, the Board received and evaluated information about the nature and extent of responsibilities retained and risks assumed by Funds Management and not delegated to or assumed by the Sub-Adviser, and about Funds Management’s on-going oversight services. Given the affiliation between Funds Management and the Sub-Adviser, the Board ascribed limited relevance to the allocation of fees between them.
The Board also received and considered information about the nature and extent of services offered and fee rates charged by Funds Management and the Sub-Adviser to other types of clients with investment strategies similar to those of the Fund. In this regard, the Board received information about the significantly greater scope of services, and compliance, reporting and other legal burdens and risks of managing proprietary mutual funds compared with those associated with managing assets of other types of clients, including third-party sub-advised fund clients and non-mutual fund clients such as institutional separate accounts.
Based on its consideration of the factors and information it deemed relevant, including those described here, the Board determined that the compensation payable to Funds Management under the Management Agreement and to the Sub-Adviser under the Sub-Advisory Agreement was reasonable.
36 | Wells Fargo Special Small Cap Value Fund
Other information (unaudited)
Profitability
The Board received and considered information concerning the profitability of Funds Management, as well as the profitability of both WFAM and Wells Fargo & Co. (“Wells Fargo”) from providing services to the fund family as a whole. The Board noted that the Sub-Adviser’s profitability information with respect to providing services to the Fund and other funds in the family was subsumed in the WFAM and Wells Fargo profitability analysis.
Funds Management reported on the methodologies and estimates used in calculating profitability, including a description of the methodology used to allocate certain expenses. Among other things, the Board noted that the levels of profitability reported on a fund-by-fund basis varied widely, depending on factors such as the size, type and age of fund.
Based on its review, the Board did not deem the profits reported by Funds Management, WFAM or Wells Fargo from services provided to the Fund to be at a level that would prevent it from approving the continuation of the Advisory Agreements.
Economies of scale
The Board received and considered information about the potential for Funds Management to experience economies of scale in the provision of management services to the Fund, the difficulties of calculating economies of scale at an individual fund level, and the extent to which potential scale benefits are shared with shareholders. The Board noted the existence of breakpoints in the Fund’s management fee structure, which operate generally to reduce the Fund’s expense ratios as the Fund grows in size, and the size of the Fund in relation to such breakpoints. The Board considered that in addition to management fee breakpoints, Funds Management shares potential economies of scale from its management business in a variety of ways, including through fee waiver and expense reimbursement arrangements, services that benefit shareholders, competitive management fee rates set at the outset without regard to breakpoints, and investments in the business intended to enhance services available to shareholders.
The Board concluded that Funds Management’s arrangements with respect to the Fund, including contractual breakpoints, constituted a reasonable approach to sharing potential economies of scale with the Fund and its shareholders.
Other benefits to Funds Management and the Sub-Adviser
The Board received and considered information regarding potential “fall-out” or ancillary benefits received by Funds Management and its affiliates, including the Sub-Adviser, as a result of their relationships with the Fund. Ancillary benefits could include, among others, benefits directly attributable to other relationships with the Fund and benefits potentially derived from an increase in Funds Management’s and the Sub-Adviser’s business as a result of their relationships with the Fund. The Board noted that various affiliates of Funds Management may receive distribution-related fees, shareholder servicing payments and sub-transfer agency fees in respect of shares sold or held through them and services provided.
Based on its consideration of the factors and information it deemed relevant, including those described here, the Board did not find that any ancillary benefits received by Funds Management and its affiliates, including the Sub-Adviser, were unreasonable.
Conclusion
At the Meeting, after considering the above-described factors and based on its deliberations and its evaluation of the information described above, the Board unanimously approved the continuation of the Advisory Agreements for a one-year term and determined that the compensation payable to Funds Management and the Sub-Adviser under each of the Advisory Agreements was reasonable.
Wells Fargo Special Small Cap Value Fund | 37
Other information (unaudited)
LIQUIDITY RISK MANAGEMENT PROGRAM
In accordance with Rule 22e-4 under the Investment Company Act of 1940, as amended (the “Liquidity Rule”), Wells Fargo Funds Trust (the “Trust”) has adopted and implemented a liquidity risk management program (the “Program”) on behalf of each of its series, including the Fund, which is reasonably designed to assess and manage the Fund’s liquidity risk. “Liquidity risk” is defined as the risk that the Fund is unable to meet redemption requests without significantly diluting remaining investors’ interests in the Fund. The Trust’s Board of Trustees (the “Board”) previously approved the designation of Wells Fargo Funds Management, LLC (“Funds Management”), the Fund’s investment manager, as the administrator of the Program, and Funds Management has established a Liquidity Risk Management Council composed of personnel from multiple departments within Funds Management and its affiliates to assist Funds Management in the implementation and on-going administration of the Program.
The Program is comprised of various components designed to support the assessment and/or management of liquidity risk, including: (1) the periodic assessment (no less frequently than annually) of certain factors that influence the Fund’s liquidity risk; (2) the periodic classification (no less frequently than monthly) of the Fund’s investments into one of four liquidity categories that reflect an estimate of their liquidity under current market conditions; (3) a 15% limit on the acquisition of “illiquid investments” (as defined under the Liquidity Rule); (4) to the extent the Fund does not invest primarily in “highly liquid investments” (as defined under the Liquidity Rule), the determination of a minimum percentage of the Fund’s assets that generally will be invested in highly liquid investments (an “HLIM”); (5) if the Fund has established an HLIM, the periodic review (no less frequently than annually) of the HLIM and the adoption of policies and procedures for responding to a shortfall of the Fund’s “highly liquid investments” below its HLIM; and (6) periodic reporting to the Board.
At a meeting of the Board held on May 26 and 28, 2020, the Board received a written report (the “Report”) from Funds Management that addressed the operation of the Program and assessed its adequacy and effectiveness of implementation. The Report covered the initial period from December 1, 2018 through December 31, 2019 (the “Reporting Period”). No significant liquidity events impacting the Fund were noted in the Report. There were no material changes to the Program during the Reporting Period. The Report concluded that the Program is operating effectively to assess and manage the Fund’s liquidity risk, and that the Program has been and continues to be adequately and effectively implemented to monitor and, as applicable, respond to the Fund’s liquidity developments.
There can be no assurance that the Program will achieve its objectives under all circumstances in the future. Please refer to the Fund’s prospectus for more information regarding the Fund’s exposure to liquidity risk and other risks to which an investment in the Fund may be subject.
38 | Wells Fargo Special Small Cap Value Fund
Appendix I (unaudited)
Effective June 1, 2020, shareholders purchasing Fund shares through an Oppenheimer & Co. Inc. (“Oppenheimer”) platform or account are eligible only for the following load waivers (front-end sales charge waivers and contingent deferred or back-end, sales charge waivers) and discounts, which may differ from those disclosed in the Fund’s Prospectus or SAI.
|
| Front-end Sales Load Waivers on Class A Shares available at Oppenheimer |
|
| Employer-sponsored retirement, deferred compensation and employee benefit plans (including health savings accounts) and trusts used to fund those plans, provided that the shares are not held in a commission-based brokerage account and shares are held for the benefit of the plan. |
|
| Shares purchased by or through a 529 Plan. |
|
| Shares purchased through an Oppenheimer affiliated investment advisory program. |
|
| Shares purchased through reinvestment of capital gains distributions and dividend reinvestment when purchasing shares of the same fund (but not any other fund within the fund family). |
|
| Shares purchased from the proceeds of redemptions within the same fund family, provided (1) the repurchase occurs within 90 days following the redemption, (2) the redemption and purchase occur in the same account, and (3) redeemed shares were subject to a front-end or deferred sales load (known as Rights of Restatement). |
|
| A shareholder in the Fund’s Class C shares will have their shares exchanged at net asset value to Class A shares (or the appropriate share class) of the Fund if the shares are no longer subject to a CDSC and the exchange is in line with the policies and procedures of Oppenheimer. |
|
| Employees and registered representatives of Oppenheimer or its affiliates and their family members. |
|
| Directors or Trustees of the Fund, and employees of the Fund’s investment adviser or any of its affiliates, as described in the Prospectus. |
| CDSC Waivers on A and C Shares available at Oppenheimer |
|
| Death or disability of the shareholder. |
|
| Shares sold as part of a systematic withdrawal plan as described in the Prospectus. |
|
| Return of excess contributions from an IRA Account. |
|
| Shares sold as part of a required minimum distribution for IRA and retirement accounts due to the shareholder reaching the qualified age based on applicable IRS regulations as described in the Prospectus. |
|
| Shares sold to pay Oppenheimer fees but only if the transaction is initiated by Oppenheimer. |
|
| Shares acquired through a right of reinstatement. |
| Front-end load Discounts Available at Oppenheimer: Breakpoints, Rights of Accumulation & Letters of Intent |
|
| Breakpoints as described in the Prospectus. |
|
| Rights of Accumulation (ROA), which entitle shareholders to breakpoint discounts, will be automatically calculated based on the aggregated holding of fund family assets held by accounts within the purchaser’s household at Oppenheimer. Eligible fund family assets not held at Oppenheimer may be included in the ROA calculation only if the shareholder notifies his or her financial advisor about such assets. |
Wells Fargo Special Small Cap Value Fund | 39
Appendix II (unaudited)
Effective June 15, 2020, shareholders purchasing fund shares through a Robert W. Baird & Co. (“Baird”) platform or account will only be eligible for the following sales charge waivers (front-end sales charge waivers and CDSC waivers) and discounts, which may differ from those disclosed elsewhere in the Fund’s Prospectus or the SAI.
|
| Front-end Sales Load Waivers on Class A Shares available at Baird |
|
| Shares purchased through reinvestment of capital gains distributions and dividend reinvestment when purchasing share of the same fund. |
|
| Share purchase by employees and registers representatives of Baird or its affiliate and their family members as designated by Baird. |
|
| Shares purchase from the proceeds of redemptions within the same fund family, provided (1) the repurchase occurs within 90 days following the redemption, (2) the redemption and purchase occur in the same accounts, and (3) redeemed shares were subject to a front-end or deferred sales charge (known as rights of reinstatement). |
|
| A shareholder in the Funds Investor C Shares will have their share exchanged at net asset value to Investor A shares of the fund if the shares are no longer subject to CDSC and the exchange is in line with the policies and procedures of Baird. |
|
| Employer-sponsored retirement plans or charitable accounts in a transactional brokerage account at Baird, including 401(k) plans, 457 plans, employer-sponsored 403(b) plans, profit sharing and money purchase pension plans and defined benefit plans. For purposes of this provision, employer-sponsored retirement plans do not include SEP IRAs, Simple IRAs or SAR-SEPs. |
| CDSC Waivers on A and C Shares available at Baird |
|
| Shares sold due to death or disability of the shareholder. |
|
| Shares sold as part of a systematic withdrawal plan as described in the Fund’s Prospectus. |
|
| Shares bought due to returns of excess contributions from an IRA Account. |
|
| Shares sold as part of a required minimum distribution for IRA and retirement accounts due to the shareholder reaching age 72 as described in the Fund’s Prospectus. |
|
| Shares sold to pay Baird fees but only if the transaction is initiated by Baird. |
|
| Shares acquired through a right of reinstatement. |
| Front-end load Discounts Available at Baird: Breakpoint and/or Rights of Accumulation |
|
| Breakpoints as described in the Prospectus. |
|
| Rights of accumulations which entitles shareholders to breakpoint discounts will be automatically calculated based on the aggregated holding of fund family assets held by accounts within the purchaser’s household at Baird. Eligible fund family assets not held at Baird may be included in the rights of accumulations calculation only if the shareholder notifies his or her financial advisor about such assets. |
|
| Letters of Intent (LOI) allow for breakpoint discounts based on anticipated purchases within a fund family through Baird, over a 13-month period of time. |
40 | Wells Fargo Special Small Cap Value Fund

For more information
More information about Wells Fargo Funds is available free upon request. To obtain literature, please write, visit the Fund’s website, or call:
Wells Fargo Funds
P.O. Box 219967
Kansas City, MO 64121-9967
Website: wfam.com
Individual investors: 1-800-222-8222
Retail investment professionals: 1-888-877-9275
Institutional investment professionals: 1-866-765-0778

This report and the financial statements contained herein are submitted for the general information of the shareholders of the Fund. If this report is used for promotional purposes, distribution of the report must be accompanied or preceded by a current prospectus. Before investing, please consider the investment objectives, risks, charges, and expenses of the investment. For a current prospectus and, if available, a summary prospectus, containing this information, call 1-800-222-8222 or visit the Fund’s website at wfam.com. Read the prospectus carefully before you invest or send money.
Wells Fargo Asset Management (WFAM) is the trade name for certain investment advisory/management firms owned by Wells Fargo & Company. These firms include but are not limited to Wells Capital Management Incorporated and Wells Fargo Funds Management, LLC. Certain products managed by WFAM entities are distributed by Wells Fargo Funds Distributor, LLC (a broker-dealer and Member FINRA).
This material is for general informational and educational purposes only and is NOT intended to provide investment advice or a recommendation of any kind—including a recommendation for any specific investment, strategy, or plan.
INVESTMENT PRODUCTS: NOT FDIC INSURED ◾ NO BANK GUARANTEE ◾ MAY LOSE VALUE
© 2020 Wells Fargo & Company. All rights reserved.
PAR-1120-00574 11-20
SA246/SAR246 09-20
Semi-Annual Report
September 30, 2020
Wells Fargo Precious Metals Fund
Beginning on January 1, 2021, as permitted by new regulations adopted by the Securities and Exchange Commission, paper copies of the Wells Fargo Funds’ annual and semi-annual shareholder reports issued after this date will no longer be sent by mail, unless you specifically request paper copies of the reports. Instead, the reports will be made available on the Funds’ website, and you will be notified by mail each time a report is posted and provided with a website address to access the report.
If you already elected to receive shareholder reports electronically, you will not be affected by this change and you need not take any action. You may elect to receive shareholder reports and other communications from the Fund electronically at any time by contacting your financial intermediary (such as a broker-dealer or bank) or, if you are a direct investor, by calling 1-800-222-8222 or by enrolling at wellsfargo.com/advantagedelivery.
You may elect to receive all future reports in paper free of charge. If you invest through a financial intermediary, you can contact your financial intermediary to request that you continue to receive paper copies of your shareholder reports; if you invest directly with the Fund, you can call 1-800-222-8222. Your election to receive reports in paper will apply to all Wells Fargo Funds held in your account with your financial intermediary or, if you are a direct investor, to all Wells Fargo Funds that you hold.
|
|
|
Reduce clutter. Save trees. |
Sign up for electronic delivery of prospectuses and shareholder reports at wellsfargo.com/
advantagedelivery |
The views expressed and any forward-looking statements are as of September 30, 2020, unless otherwise noted, and are those of the Fund’s portfolio managers and/or Wells Fargo Asset Management. Discussions of individual securities, or the markets generally, or any Wells Fargo Fund are not intended as individual recommendations. Future events or results may vary significantly from those expressed in any forward-looking statements. The views expressed are subject to change at any time in response to changing circumstances in the market. Wells Fargo Asset Management and the Fund disclaim any obligation to publicly update or revise any views expressed or forward-looking statements.
INVESTMENT PRODUCTS: NOT FDIC INSURED ◾ NO BANK GUARANTEE ◾ MAY LOSE VALUE
Wells Fargo Precious Metals Fund | 1
Letter to shareholders (unaudited)

Andrew Owen
President
Wells Fargo Funds
“As the six-month period began in April, markets rebounded strongly from an earlier sharp sell-off, fueled by unprecedented government and central bank stimulus measures.”
Dear Shareholder:
We are pleased to offer you this semi-annual report for the Wells Fargo Precious Metals Fund for the six-month period that ended September 30, 2020. Global stock markets experienced unprecedented volatility in response to drastic government measures to stop the spread of COVID-19 at the expense of short-term economic output. However, financial markets rebounded from April on to more than offset earlier losses as central banks bolstered capital markets and confidence. Stocks rallied broadly with U.S. equities leading the way while bonds had more modest returns for the six-month period.
For the period, U.S. stocks, based on the S&P 500 Index,1 returned 31.31% and international stocks, as measured by the MSCI ACWI ex USA Index (Net),2 gained 23.38%. The MSCI EM Index (Net)3 gained a robust 29.37%. Among bond investments, the Bloomberg Barclays U.S. Aggregate Bond Index4 added 3.53%, the Bloomberg Barclays Global Aggregate ex-USD Index5 returned 7.66%, the Bloomberg Barclays Municipal Bond Index6 had a 3.99% return, and the ICE BofA U.S. High Yield Index7 gained 14.76%.
Concerns about COVID-19 took over the market.
As the six-month period began in April, markets rebounded strongly from an earlier sharp sell-off, fueled by unprecedented government and central bank stimulus measures. The U.S. economy contracted by an annualized 5.0% pace in the first quarter, with 30 million new unemployment insurance claims in six weeks. In the eurozone, first-quarter real gross domestic product (GDP) shrank 3.8%, with the composite April Flash Purchasing Managers’ Index (PMI), a monthly survey of purchasing managers, falling to an all-time low of 13.5. The European Central Bank expanded its quantitative easing to include the purchase of additional government bonds of countries with the greatest virus-related need, including Italy and Spain. China’s first-quarter GDP fell by 6.8% year over year. However, retail sales, production, and investment showed signs of recovery. Extreme oil-price volatility continued as global supply far exceeded demand.
The equity market rebound continued in May, with widespread strong monthly gains. Investors regained confidence on reports of early signs of success in human trials of a COVID-19 vaccine. Growth stocks continued to outperform value stocks while returns on global government bonds were generally flat. In the U.S., a gap grew between the stock market rebound and devastating economic data points, including an April unemployment rate of 14.7%, the highest level since World War II. PMIs continued to reflect weakening activity in May in both the manufacturing and services sectors. U.S.
| 1 | The S&P 500 Index consists of 500 stocks chosen for market size, liquidity, and industry group representation. It is a market-value-weighted index with each stock’s weight in the index proportionate to its market value. You cannot invest directly in an index. |
| 2 | The Morgan Stanley Capital International (MSCI) All Country World Index (ACWI) ex USA Index (Net) is a free-float-adjusted market-capitalization-weighted index that is designed to measure the equity market performance of developed and emerging markets, excluding the United States. Source: MSCI. MSCI makes no express or implied warranties or representations and shall have no liability whatsoever with respect to any MSCI data contained herein. The MSCI data may not be further redistributed or used as a basis for other indices or any securities or financial products. This report is not approved, reviewed, or produced by MSCI. You cannot invest directly in an index. |
| 3 | The MSCI Emerging Markets (EM) Index (Net) is a free-float-adjusted market-capitalization-weighted index that is designed to measure equity market performance of emerging markets. You cannot invest directly in an index. |
| 4 | The Bloomberg Barclays U.S. Aggregate Bond Index is a broad-based benchmark that measures the investment-grade, U.S. dollar-denominated, fixed-rate taxable bond market, including Treasuries, government-related and corporate securities, mortgage-backed securities (agency fixed-rate and hybrid adjustable-rate mortgage pass-throughs), asset-backed securities, and commercial mortgage-backed securities. You cannot invest directly in an index. |
| 5 | The Bloomberg Barclays Global Aggregate ex-USD Index is an unmanaged index that provides a broad-based measure of the global investment-grade fixed-income markets excluding the U.S. dollar-denominated debt market. You cannot invest directly in an index. |
| 6 | The Bloomberg Barclays Municipal Bond Index is an unmanaged index composed of long-term tax-exempt bonds with a minimum credit rating of Baa. You cannot invest directly in an index. |
| 7 | The ICE BofA U.S. High Yield Index is a market-capitalization-weighted index of domestic and Yankee high-yield bonds. The index tracks the performance of high-yield securities traded in the U.S. bond market. You cannot invest directly in an index. Copyright 2020. ICE Data Indices, LLC. All rights reserved. |
2 | Wells Fargo Precious Metals Fund
Letter to shareholders (unaudited)
corporate earnings reports indicated a 14% year-over-year contraction in earnings from the first quarter of 2019. However, high demand for technology, driven by remote activity, helped maintain robust information technology sector earnings, which helped drive leading technology stocks higher.
Financial markets posted widely positive returns in June despite ongoing economic weakness and high levels of uncertainty on the containment of COVID-19 and the timing of an effective vaccine. There were hopeful signs as economies reopened, with U.S. and U.K. retail sales rebounding sharply in May. However, year over year, sales remained depressed. Vitally important to market sentiment was the ongoing commitment by central banks globally to do all they could to provide economic support through liquidity and low borrowing costs. U.S. economic activity was aided by one-time $1,200 stimulus checks and $600 bonus weekly unemployment benefits that expired at the end of July. However, unemployment remained historically high but eased from 14.7% in April to 11.1% in June. At month-end, numerous states reported increases in COVID-19 cases. China’s economic recovery picked up momentum in June, though it remained far from a full recovery.
July was a broadly positive month for both global equities and fixed income. However, economic data and a resurgence of COVID-19 cases pointed to the vulnerability of the global economy and the ongoing imperative to regain control of the pandemic. Second-quarter GDP shrank from the previous quarter by 9.5% and 12.1% in the U.S. and the eurozone, respectively. In contrast, China reported a 3.2% year-over-year expansion in its second-quarter GDP. U.S. unemployment remained high despite adding 1.8 million jobs in July, with a double-digit jobless rate persisting. However, manufacturing activity grew in both the U.S. and the eurozone. In Asia, while China’s manufacturing sector continued to expand, activity in Japan and South Korea contracted. In July, a rising concern was the rapid and broad reemergence of COVID-19 infections.
The stock market continued to rally in August despite concerns over rising numbers of COVID-19 cases in the United States and several European countries, including France and Spain, as well as the expiration of the $600 weekly bonus unemployment benefit at the end of July. U.S. stocks had strong monthly gains, led by the FAANG stocks—Facebook, Apple, Amazon, Netflix, and Google (Alphabet)—which dominate these indices and continued to rally. U.S. stocks generally surpassed other broadly positive global equity performance while fixed-income market monthly returns were broadly flat. Generally stronger-than-expected second-quarter earnings boosted investor sentiment along with the U.S. Federal Reserve’s announcement of a policy shift that will likely lead to longer-term low interest rates and supportive monetary policy. The U.S. flash PMIs for both manufacturing and services beat expectations while U.S. housing market indicators were strong. In Europe, retail sales expanded and consumer confidence remained steady. Overall, developed markets performed better than emerging market equities for the month of August as people took comfort in better-known equities in perceived safer markets.
Stocks grew more volatile in September on mixed economic data. U.S. PMIs showed solid growth in economic activity in both manufacturing and services. However, six months after the bottom fell out of the labor market in the early spring, only half of the 22 million jobs lost had returned. The U.S. unemployment rate fell to 7.9% in September, the fifth straight month of improvement but far higher than the 3.5% pre-COVID-19 rate. Only 661,000 jobs were added for the month, down from 1.5 million in August. Meanwhile, a reported 2.3 million people have given up looking for work. With U.S. Congress failing to pass further fiscal relief and uncertainties surrounding a possible vaccine, doubts crept back into the financial markets. In the U.K., a lack of progress in Brexit talks with the European Union weighed on markets. China’s economy picked up steam, however, with growth fueled by increased global demand and China’s service sector had its strongest PMI reading in seven years.
“The stock market continued to rally in August despite concerns over rising numbers of COVID-19 cases in the United States and several European countries, including France and Spain, as well as the expiration of the $600 weekly bonus unemployment benefit at the end of July.”
Wells Fargo Precious Metals Fund | 3
Letter to shareholders (unaudited)
|
|
|
For further information about your Fund, contact your investment professional, visit our website at wfam.com, or call us directly at 1-800-222-8222. |
Don’t let short-term uncertainty derail long-term investment goals.
Periods of investment uncertainty can present challenges, but experience has taught us that maintaining long-term investment goals can be an effective way to plan for the future. To help you create a sound strategy based on your personal goals and risk tolerance, Wells Fargo Funds offers more than 100 mutual funds spanning a wide range of asset classes and investment styles. Although diversification cannot guarantee an investment profit or prevent losses, we believe it can be an effective way to manage investment risk and potentially smooth out overall portfolio performance. We encourage investors to know their investments and to understand that appropriate levels of risk-taking may unlock opportunities.
Thank you for choosing to invest with Wells Fargo Funds. We appreciate your confidence in us and remain committed to helping you meet your financial needs.
Sincerely,

Andrew Owen
President
Wells Fargo Funds
Notice to Shareholders
At a meeting held on August 10-12, 2020, the Board of Trustees of the Fund approved a change to the Fund’s automatic conversion feature for Class C shares in order to shorten the required holding period from 10 to 8 years. As a result, on a monthly basis beginning November 5, 2020, Class C shares will convert automatically into Class A shares 8 years after the initial date of purchase or, if you acquired your Class C shares through an exchange or conversion from another share class, 8 years after the date you acquired your Class C shares. When Class C shares that you acquired through a purchase or exchange convert, any other Class C shares that you purchased with reinvested dividends and distributions also will convert into Class A shares on a pro rata basis.
Please note that a shorter holding period may apply depending on your intermediary. Please see “Appendix A—Sales Charge Reductions and Waivers for Certain Intermediaries” in the Fund’s prospectus for further information.
4 | Wells Fargo Precious Metals Fund
This page is intentionally left blank.
Performance highlights (unaudited)
Investment objective
The Fund seeks long-term capital appreciation.
Manager
Wells Fargo Funds Management, LLC
Subadviser
Wells Capital Management Incorporated
Portfolio managers
Michael Bradshaw, CFA®‡
Oleg Makhorine
Average annual total returns (%) as of September 30, 2020
| | | | | | | | | | | | | | | | | | | | | | | | | | | | | | | | | | |
| | | | |
| | | | | Including sales charge | | | Excluding sales charge | | | Expense ratios1 (%) | |
| | | | | | | | | |
| | | Inception date | | 1 year | | | 5 year | | | 10 year | | | 1 year | | | 5 year | | | 10 year | | | Gross | | | Net2 | |
| | | | | | | | | | |
| Class A (EKWAX) | | 1-20-1998 | | | 37.28 | | | | 19.48 | | | | -2.95 | | | | 45.65 | | | | 20.90 | | | | -2.38 | | | | 1.20 | | | | 1.09 | |
| | | | | | | | | | |
| Class C (EKWCX) | | 1-29-1998 | | | 43.57 | | | | 19.99 | | | | -3.10 | | | | 44.57 | | | | 19.99 | | | | -3.10 | | | | 1.95 | | | | 1.84 | |
| | | | | | | | | | |
| Administrator Class (EKWDX) | | 7-30-2010 | | | – | | | | – | | | | – | | | | 45.88 | | | | 21.07 | | | | -2.23 | | | | 1.12 | | | | 0.95 | |
| | | | | | | | | | |
| Institutional Class (EKWYX) | | 2-29-2000 | | | – | | | | – | | | | – | | | | 46.09 | | | | 21.24 | | | | -2.07 | | | | 0.87 | | | | 0.79 | |
| | | | | | | | | | |
| FTSE Gold Mines Index3 | | – | | | – | | | | – | | | | – | | | | 49.99 | | | | 26.52 | | | | -2.17 | | | | – | | | | – | |
| | | | | | | | | | |
| S&P 500 Index4 | | – | | | – | | | | – | | | | – | | | | 15.15 | | | | 14.15 | | | | 13.74 | | | | – | | | | – | |
Figures quoted represent past performance, which is no guarantee of future results, and do not reflect taxes that a shareholder may pay on an investment in a fund. Investment return and principal value of an investment will fluctuate so that an investor’s shares, when redeemed, may be worth more or less than their original cost. Performance shown without sales charges would be lower if sales charges were reflected. Current performance may be lower or higher than the performance data quoted, which assumes the reinvestment of dividends and capital gains. Current month-end performance is available on the Fund’s website, wfam.com.
Please keep in mind that high double-digit returns were primarily achieved during favorable market conditions. You should not expect that such favorable returns can be consistently achieved. A fund’s performance, especially for short time periods, should not be the sole factor in making your investment decision.
While the S&P 500 Index is comprised of U.S. equity securities of companies diversified across ten sectors, the Fund’s holdings are concentrated primarily in precious metals related stocks. Therefore, the performance of the S&P 500 Index is displayed only to show how the concentrated Fund performed compared with a diversified selection of U.S. equity securities.
Index returns do not include transaction costs associated with buying and selling securities, any mutual fund fees or expenses, or any taxes. It is not possible to invest directly in an index.
For Class A shares, the maximum front-end sales charge is 5.75%. For Class C shares, the maximum contingent deferred sales charge is 1.00%. Performance including a contingent deferred sales charge assumes the sales charge for the corresponding time period. Administrator Class and Institutional Class shares are sold without a front-end sales charge or contingent deferred sales charge.
Stock values fluctuate in response to the activities of individual companies and general market and economic conditions. Bond values fluctuate in response to the financial condition of individual issuers, general market and economic conditions, and changes in interest rates. Changes in market conditions and government policies may lead to periods of heightened volatility in the bond market and reduced liquidity for certain bonds held by the Fund. In general, when interest rates rise, bond values fall and investors may lose principal value. Interest rate changes and their impact on the Fund and its share price can be sudden and unpredictable. Funds that concentrate their investments in limited sectors, much as gold-related investments, are more vulnerable to adverse market, economic, regulatory, political, or other developments affecting those sectors. Certain investment strategies tend to increase the total risk of an investment (relative to the broader market). The Fund is exposed to foreign investment risk, geographic risk, non-diversification risk, smaller-company securities risk, and subsidiary risk. Consult the Fund’s prospectus for additional information on these and other risks.
Please see footnotes on page 7.
6 | Wells Fargo Precious Metals Fund
Performance highlights (unaudited)
| | | | |
|
| Ten largest holdings (%) as of September 30, 20207 | |
| | |
Barrick Gold Corporation | | | 7.95 | |
| | |
Kinross Gold Corporation | | | 7.50 | |
| | |
Newmont Corporation | | | 7.30 | |
| | |
Kirkland Lake Gold Limited | | | 6.58 | |
| | |
Wheaton Precious Metals Corporation - U.S. Exchange Traded Shares | | | 4.74 | |
| | |
Franco-Nevada Corporation - Legend Shares | | | 3.89 | |
| | |
Gold Fields Limited ADR | | | 3.79 | |
| | |
Newcrest Mining Limited | | | 3.38 | |
| | |
Northern Star Resources Limited | | | 3.15 | |
| | |
AngloGold Ashanti Limited ADR | | | 3.09 | |
|
|
| Country allocation as of September 30, 20208 |
|
|
| ‡ | CFA® and Chartered Financial Analyst® are trademarks owned by CFA Institute. |
| 1 | Reflects the expense ratios as stated in the most recent prospectuses. The expense ratios shown are subject to change and may differ from the annualized expense ratios shown in the financial highlights of this report. |
| 2 | The manager has contractually committed through July 31, 2021, to waive fees and/or reimburse expenses to the extent necessary to cap total annual fund operating expenses after fee waivers at 1.09% for Class A, 1.84% for Class C, 0.95% for Administrator Class, and 0.79% for Institutional Class. Brokerage commissions, stamp duty fees, interest, taxes, acquired fund fees and expenses (if any), and extraordinary expenses are excluded from the expense caps. Prior to or after the commitment expiration date, the caps may be increased or the commitment to maintain the caps may be terminated only with the approval of the Board of Trustees. Without these caps, the Fund’s returns would have been lower. The expense ratio paid by an investor is the net expense ratio (the total annual fund operating expenses after fee waivers) as stated in the prospectuses. |
| 3 | FTSE Gold Mines Index is an unmanaged, open-ended index designed to reflect the performance of the worldwide market in the shares of companies whose principal activity is the mining of gold. You cannot invest directly in an index. |
| 4 | The S&P 500 Index consists of 500 stocks chosen for market size, liquidity, and industry group representation. It is a market-value weighted index with each stock’s weight in the index proportionate to its market value. You cannot invest directly in an index. |
| 5 | The ten largest holdings, excluding cash, cash equivalents and any money market funds, are calculated based on the value of the investments divided by total net assets of the Fund. Holdings are subject to change and may have changed since the date specified. |
| 6 | Amounts are calculated based on the total long-term investments of the Fund. These amounts are subject to change and may have changed since the date specified. |
Wells Fargo Precious Metals Fund | 7
Fund expenses (unaudited)
As a shareholder of the Fund, you incur two types of costs: (1) transaction costs, including sales charges (loads) on purchase payments and contingent deferred sales charges (if any) on redemptions and (2) ongoing costs, including management fees, distribution (12b-1) and/or shareholder servicing fees, and other Fund expenses. This example is intended to help you understand your ongoing costs (in dollars) of investing in the Fund and to compare these costs with the ongoing costs of investing in other mutual funds.
The example is based on an investment of $1,000 invested at the beginning of the six-month period and held for the entire period from April 1, 2020 to September 30, 2020.
Actual expenses
The “Actual” line of the table below provides information about actual account values and actual expenses. You may use the information in this line, together with the amount you invested, to estimate the expenses that you paid over the period. Simply divide your account value by $1,000 (for example, an $8,600 account value divided by $1,000 = 8.6), then multiply the result by the number in the “Actual” line under the heading entitled “Expenses paid during period” for your applicable class of shares to estimate the expenses you paid on your account during this period.
Hypothetical example for comparison purposes
The “Hypothetical” line of the table below provides information about hypothetical account values and hypothetical expenses based on the Fund’s actual expense ratio and an assumed rate of return of 5% per year before expenses, which is not the Fund’s actual return. The hypothetical account values and expenses may not be used to estimate the actual ending account balance or expenses you paid for the period. You may use this information to compare the ongoing costs of investing in the Fund and other funds. To do so, compare this 5% hypothetical example with the 5% hypothetical examples that appear in the shareholder reports of the other funds.
Please note that the expenses shown in the table are meant to highlight your ongoing costs only and do not reflect any transactional costs, such as sales charges (loads) and contingent deferred sales charges. Therefore, the “Hypothetical” line of the table is useful in comparing ongoing costs only and will not help you determine the relative total costs of owning different funds. In addition, if these transactional costs were included, your costs would have been higher.
| | | | | | | | | | | | | | | | |
| | | Beginning
account value
4-1-2020 | | | Ending
account value
9-30-2020 | | | Expenses
paid during
the period1 | | | Annualized net
expense ratio | |
| | | | | |
Class A | | | | | | | | | | | | | | | | |
| | | | |
Actual | | $ | 1,000.00 | | | $ | 1,662.89 | | | $ | 7.28 | | | | 1.09 | % |
| | | | |
Hypothetical (5% return before expenses) | | $ | 1,000.00 | | | $ | 1,019.60 | | | $ | 5.52 | | | | 1.09 | % |
| | | | | |
Class C | | | | | | | | | | | | | | | | |
| | | | |
Actual | | $ | 1,000.00 | | | $ | 1,656.95 | | | $ | 12.26 | | | | 1.84 | % |
| | | | |
Hypothetical (5% return before expenses) | | $ | 1,000.00 | | | $ | 1,015.84 | | | $ | 9.30 | | | | 1.84 | % |
| | | | | |
Administrator Class | | | | | | | | | | | | | | | | |
| | | | |
Actual | | $ | 1,000.00 | | | $ | 1,664.33 | | | $ | 6.35 | | | | 0.95 | % |
| | | | |
Hypothetical (5% return before expenses) | | $ | 1,000.00 | | | $ | 1,020.31 | | | $ | 4.81 | | | | 0.95 | % |
| | | | | |
Institutional Class | | | | | | | | | | | | | | | | |
| | | | |
Actual | | $ | 1,000.00 | | | $ | 1,665.18 | | | $ | 5.28 | | | | 0.79 | % |
| | | | |
Hypothetical (5% return before expenses) | | $ | 1,000.00 | | | $ | 1,021.11 | | | $ | 4.00 | | | | 0.79 | % |
| 1 | Consolidated expenses paid is equal to the annualized net expense ratio of each class multiplied by the average account value over the period multiplied by the number of days in the most recent fiscal half-year divided by the number of days in the fiscal year (to reflect the one-half year period). |
8 | Wells Fargo Precious Metals Fund
Consolidated portfolio of investments—September 30, 2020 (unaudited)
| | | | | | | | | | | | | | | | |
| | | | | | | | | Shares | | | Value | |
| Common Stocks: 94.45% | |
|
Australia: 10.37% | |
Bellevue Gold Limited (Materials, Metals & Mining) † | | | | | | | | | | | 4,500,000 | | | $ | 3,327,009 | |
Evolution Mining Limited (Materials, Metals & Mining) | | | | | | | | | | | 2,350,000 | | | | 9,816,966 | |
Newcrest Mining Limited (Materials, Metals & Mining) | | | | | | | | | | | 702,294 | | | | 15,925,149 | |
Northern Star Resources Limited (Materials, Metals & Mining) | | | | | | | | | | | 1,497,222 | | | | 14,836,032 | |
Saracen Mineral Holdings Limited (Materials, Metals & Mining) † | | | | | | | | | | | 1,300,000 | | | | 4,887,042 | |
| | | | |
| | | | | | | | | | | | | | | 48,792,198 | |
| | | | | | | | | | | | | | | | |
|
| Canada: 65.50% | |
Agnico-Eagle Mines Limited (Materials, Metals & Mining) | | | | | | | | | | | 100,370 | | | | 7,996,886 | |
Agnico-Eagle Mines Limited-Legend Shares (Materials, Metals & Mining) | | | | | | | | | | | 35,000 | | | | 2,786,350 | |
Agnico-Eagle Mines Limited-U.S. Exchanged Traded Shares (Materials, Metals & Mining) | | | | | | | | | | | 156,164 | | | | 12,432,216 | |
Alamos Gold Incorporated Class A (Materials, Metals & Mining) | | | | | | | | | | | 1,173,980 | | | | 10,341,921 | |
B2Gold Corporation (Materials, Metals & Mining) | | | | | | | | | | | 3,550,000 | | | | 23,114,791 | |
Barrick Gold Corporation (Materials, Metals & Mining) | | | | | | | | | | | 1,331,723 | | | | 37,434,734 | |
Centerra Gold Incorporated (Materials, Metals & Mining) | | | | | | | | | | | 525,000 | | | | 6,107,356 | |
Centerra Gold Incorporated-Legend Shares (Materials, Metals & Mining) 144A | | | | | | | | | | | 250,000 | | | | 2,908,265 | |
Endeavour Mining Corporation (Materials, Metals & Mining) † | | | | | | | | | | | 425,000 | | | | 10,580,714 | |
Fortuna Silver Mines Incorporated (Materials, Metals & Mining) † | | | | | | | | | | | 750,000 | | | | 4,770,756 | |
Franco-Nevada Corporation-Legend Shares (Materials, Metals & Mining) 144A | | | | | | | | | | | 130,948 | | | | 18,298,595 | |
Kinross Gold Corporation (Materials, Metals & Mining) † | | | | | | | | | | | 4,000,553 | | | | 35,302,090 | |
Kirkland Lake Gold Limited (Materials, Metals & Mining) | | | | | | | | | | | 634,094 | | | | 30,953,483 | |
Lundin Gold Incorporated (Materials, Metals & Mining) † | | | | | | | | | | | 660,000 | | | | 5,997,522 | |
MAG Silver Corporation (Materials, Metals & Mining) † | | | | | | | | | | | 750,000 | | | | 12,194,435 | |
MAG Silver Corporation-Legend Shares (Materials, Metals & Mining) | | | | | | | | | | | 100,000 | | | | 1,625,925 | |
Orla Mining Limited (Materials, Metals & Mining) † | | | | | | | | | | | 400,000 | | | | 1,571,101 | |
Pan American Silver Corporation (Materials, Metals & Mining) | | | | | | | | | | | 420,000 | | | | 13,503,000 | |
Pretium Resources Incorporated (Materials, Metals & Mining) † | | | | | | | | | | | 250,000 | | | | 3,199,279 | |
SilverCrest Metals Incorporated (Materials, Metals & Mining) † | | | | | | | | | | | 600,000 | | | | 5,087,304 | |
SSR Mining Incorporated (Materials, Metals & Mining) † | | | | | | | | | | | 363,552 | | | | 6,784,775 | |
SSR Mining Incorporated-U.S. Exchange Traded Shares (Materials, Metals & Mining) † | | | | | | | | | | | 400,000 | | | | 7,468,000 | |
Teranga Gold Corporation (Materials, Metals & Mining) † | | | | | | | | | | | 400,000 | | | | 4,217,641 | |
Torex Gold Resources Incorporated (Materials, Metals & Mining) † | | | | | | | | | | | 445,000 | | | | 6,292,929 | |
Torex Gold Resources Incorporated-Legend Shares (Materials, Metals & Mining) | | | | | | | | | | | 185,000 | | | | 2,616,162 | |
Torex Gold Resources Incorporated-Legend Shares (Materials, Metals & Mining) 144A | | | | | | | | | | | 266,250 | | | | 3,765,152 | |
Wheaton Precious Metals Corporation (Materials, Metals & Mining) | | | | | | | | | | | 12,950 | | | | 635,367 | |
Wheaton Precious Metals Corporation-U.S. Exchange Traded Shares (Materials, Metals & Mining) | | | | | | | | | | | 455,000 | | | | 22,326,850 | |
Yamana Gold Incorporated (Materials, Metals & Mining) | | | | | | | | | | | 1,400,000 | | | | 7,959,145 | |
| | | | |
| | | | | | | | | | | | | | | 308,272,744 | |
| | | | | | | | | | | | | | | | |
|
| South Africa: 6.87% | |
AngloGold Ashanti Limited ADR (Materials, Metals & Mining) | | | | | | | | | | | 550,591 | | | | 14,524,591 | |
Gold Fields Limited ADR (Materials, Metals & Mining) | | | | | | | | | | | 1,450,000 | | | | 17,820,500 | |
| | | | |
| | | | | | | | | | | | | | | 32,345,091 | |
| | | | | | | | | | | | | | | | |
|
| United Kingdom: 0.82% | |
Fresnillo plc (Materials, Metals & Mining) | | | | | | | | | | | 250,000 | | | | 3,861,497 | |
| | | | | | | | | | | | | | | | |
|
| United States: 10.89% | |
Newmont Corporation (Materials, Metals & Mining) | | | | | | | | | | | 541,802 | | | | 34,377,337 | |
Newmont Goldcorp Corporation-Toronto Exchange Traded Shares (Materials, Metals & Mining) | | | | | | | | | | | 131,348 | | | | 8,378,731 | |
Royal Gold Incorporated (Materials, Metals & Mining) | | | | | | | | | | | 70,436 | | | | 8,464,294 | |
| | | | |
| | | | | | | | | | | | | | | 51,220,362 | |
| | | | | | | | | | | | | | | | |
| |
Total Common Stocks (Cost $211,921,217) | | | | 444,491,892 | |
| | | | | | | | | | | | | | | | |
The accompanying notes are an integral part of these financial statements.
Wells Fargo Precious Metals Fund | 9
Consolidated portfolio of investments—September 30, 2020 (unaudited)
| | | | | | | | | | | | | | | | |
| Security name | | | | | | | | Troy Ounces | | | Value | |
| Commodities: 3.08% | | | | | | | | | | | | | | | | |
Gold Bullion ** | | | | | | | | | | | 4,277 | | | $ | 14,508,165 | |
| | | | | | | | | | | | | | | | |
| | | | |
Total Commodities (Cost $4,532,552) | | | | | | | | | | | | | | | 14,508,165 | |
| | | | | | | | | | | | | | | | |
| | | | |
| | | | | | | | | | | | | | | | |
| | | Yield | | | | | | Shares | | | | |
| Short-Term Investments: 1.76% | | | | | | | | | | | | |
| | | | |
| Investment Companies: 1.76% | | | | | | | | | | | | |
Wells Fargo Government Money Market Fund Select Class (l)(u) | | | 0.05 | % | | | | | | | 8,283,968 | | | | 8,283,968 | |
| | | | | | | | | | | | | | | | |
| | | | |
Total Short-Term Investments (Cost $8,283,968) | | | | | | | | | | | | | | | 8,283,968 | |
| | | | | | | | | | | | | | | | |
| | | | | | | | |
| Total investments in securities (Cost $224,737,737) | | | 99.29 | % | | | 467,284,025 | |
| | |
Other assets and liabilities, net | | | 0.71 | | | | 3,348,627 | |
| | | | | | | | |
| Total net assets | | | 100.00 | % | | $ | 470,632,652 | |
| | | | | | | | |
| † | Non-income-earning security |
| 144A | The security may be resold in transactions exempt from registration, normally to qualified institutional buyers, pursuant to Rule 144A under the Securities Act of 1933. |
| ** | Represents an investment held in Special Investments (Cayman) SPC, the consolidated entity. |
| (l) | The issuer of the security is an affiliated person of the Fund as defined in the Investment Company Act of 1940. |
| (u) | The rate represents the 7-day annualized yield at period end. |
Investments in Affiliates
An affiliated investment is an investment in which the Fund owns at least 5% of the outstanding voting shares of the issuer or as a result of other relationships, such as the Fund and the issuer having the same investment manager. Transactions with issuers that were either affiliated persons of the Fund at the beginning of the period or the end of the period were as follows:
| | | | | | | | | | | | | | | | | | | | | | | | | | | | | | | | |
| | | Value,
beginning of
period | | | Purchases | | | Sales
proceeds | | | Net
realized
gains
(losses) | | | Net
change in
unrealized
gains
(losses) | | | Income
from
affiliated
securities | | | Value,
end of period | | | % of
net
assets | |
| | | | | | | | |
| Short-Term Investments | | | | | | | | | | | | | | | | | | | | | | | | |
Investment Companies | | | | | | | | | | | | | | | | | | | | | | | | | | | | | | | | |
Wells Fargo Government Money Market Fund Institutional Class | | $ | 8,534,060 | | | $ | 55,661,477 | | | $ | (55,911,569 | ) | | $ | 0 | | | $ | 0 | | | $ | 6,011 | | | $ | 8,283,968 | | | | 1.76 | % |
The accompanying notes are an integral part of these financial statements.
10 | Wells Fargo Precious Metals Fund
Consolidated statement of assets and liabilities—September 30, 2020 (unaudited)
| | | | |
| | | | |
| |
Assets | | | | |
Investments in unaffiliated securities, at value (cost $211,921,217) | | $ | 444,491,892 | |
Investments in commodities, at value (cost $4,532,552) | | | 14,508,165 | |
Investments in affiliated securities, at value (cost $8,283,968) | | | 8,283,968 | |
Cash | | | 103,677 | |
Foreign currency, at value (cost $784,862) | | | 785,593 | |
Receivable for investments sold | | | 4,954,109 | |
Receivable for Fund shares sold | | | 992,787 | |
Receivable for dividends | | | 102,221 | |
Prepaid expenses and other assets | | | 45,705 | |
| | | | |
Total assets | | | 474,268,117 | |
| | | | |
| |
Liabilities | | | | |
Payable for investments purchased | | | 2,397,030 | |
Payable for Fund shares redeemed | | | 692,215 | |
Management fee payable | | | 234,723 | |
Administration fees payable | | | 70,658 | |
Distribution fee payable | | | 10,980 | |
Trustees’ fees and expenses payable | | | 2,038 | |
Accrued expenses and other liabilities | | | 227,821 | |
| | | | |
Total liabilities | | | 3,635,465 | |
| | | | |
Total net assets | | $ | 470,632,652 | |
| | | | |
| |
Net assets consist of | | | | |
Paid-in capital | | $ | 392,641,134 | |
Total distributable earnings | | | 77,991,518 | |
| | | | |
Total net assets | | $ | 470,632,652 | |
| | | | |
| |
Computation of net asset value and offering price per share | | | | |
Net assets – Class A | | $ | 250,707,301 | |
Shares outstanding – Class A1 | | | 4,270,838 | |
Net asset value per share – Class A | | | $58.70 | |
Maximum offering price per share – Class A2 | | | $62.28 | |
Net assets – Class C | | $ | 17,120,057 | |
Shares outstanding – Class C1 | | | 334,723 | |
Net asset value per share – Class C | | | $51.15 | |
Net assets – Administrator Class | | $ | 14,755,044 | |
Shares outstanding – Administrator Class1 | | | 248,628 | |
Net asset value per share – Administrator Class | | | $59.35 | |
Net assets – Institutional Class | | $ | 188,050,250 | |
Shares outstanding – Institutional Class1 | | | 3,140,279 | |
Net asset value per share – Institutional Class | | | $59.88 | |
| 1 | The Fund has an unlimited number of authorized shares. |
| 2 | Maximum offering price is computed as 100/94.25 of net asset value. On investments of $50,000 or more, the offering price is reduced. |
The accompanying notes are an integral part of these financial statements.
Wells Fargo Precious Metals Fund | 11
Consolidated statement of operations—six months ended September 30, 2020 (unaudited)
| | | | |
| | | | |
| |
Investment income | | | | |
Dividends (net of foreign withholding taxes of $180,554) | | $ | 1,956,564 | |
Income from affiliated securities | | | 6,011 | |
| | | | |
Total investment income | | | 1,962,575 | |
| | | | |
| |
Expenses | | | | |
Management fee | | | 1,414,950 | |
Administration fees | |
Class A | | | 242,749 | |
Class C | | | 17,938 | |
Administrator Class | | | 8,866 | |
Institutional Class | | | 112,846 | |
Shareholder servicing fees | |
Class A | | | 287,979 | |
Class C | | | 21,266 | |
Administrator Class | | | 17,005 | |
Distribution fee | |
Class C | | | 63,740 | |
Custody and accounting fees | | | 18,642 | |
Professional fees | | | 29,033 | |
Registration fees | | | 34,847 | |
Shareholder report expenses | | | 31,156 | |
Trustees’ fees and expenses | | | 9,776 | |
Transfer agent fees | | | 4,987 | |
Other fees and expenses | | | 11,977 | |
| | | | |
Total expenses | | | 2,327,757 | |
Less: Fee waivers and/or expense reimbursements | |
Fund-level | | | (119,470 | ) |
Class A | | | (35,152 | ) |
Class C | | | (2,121 | ) |
Administrator Class | | | (4,896 | ) |
| | | | |
Net expenses | | | 2,166,118 | |
| | | | |
Net investment loss | | | (203,543 | ) |
| | | | |
| |
Realized and unrealized gains (losses) on investments | | | | |
Net realized gains on investments | | | 15,022,348 | |
| |
Net change in unrealized gains (losses) on | | | | |
Unaffiliated securities | | | 164,537,143 | |
Commodities | | | 2,380,911 | |
| | | | |
Net change in unrealized gains (losses) on investments | | | 166,918,054 | |
| | | | |
Net realized and unrealized gains (losses) on investments | | | 181,940,402 | |
| | | | |
Net increase in net assets resulting from operations | | $ | 181,736,859 | |
| | | | |
The accompanying notes are an integral part of these financial statements.
12 | Wells Fargo Precious Metals Fund
Consolidated statement of changes in net assets
| | | | | | | | | | | | | | | | |
| | | Six months ended
September 30, 2020
(unaudited) | | | Year ended
March 31, 2020 | |
| | | |
Operations | | | | | | | | | | | | |
Net investment loss | | | | | | $ | (203,543 | ) | | | | | | $ | (4,109 | ) |
Net realized gains on investments | | | | | | | 15,022,348 | | | | | | | | 19,751,558 | |
Net change in unrealized gains (losses) on investments | | | | | | | 166,918,054 | | | | | | | | (11,681,216 | ) |
| | | | |
Net increase in net assets resulting from operations | | | | | | | 181,736,859 | | | | | | | | 8,066,233 | |
| | | | |
| | | |
Distributions to shareholders from net investment income and net realized gains | | | | | | | | | | | | | |
Class A | | | | | | | 0 | | | | | | | | (201,509 | ) |
Administrator Class | | | | | | | 0 | | | | | | | | (21,782 | ) |
Institutional Class | | | | | | | 0 | | | | | | | | (467,271 | ) |
| | | | |
Total distributions to shareholders | | | | | | | 0 | | | | | | | | (690,562 | ) |
| | | | |
| | | | |
Capital share transactions | | | Shares | | | | | | | | Shares | | | | | |
Proceeds from shares sold | | | | | | | | | | | | | | | | |
Class A | | | 796,176 | | | | 45,388,680 | | | | 1,235,822 | | | | 50,200,605 | |
Class C | | | 60,713 | | | | 2,951,763 | | | | 74,680 | | | | 2,659,850 | |
Administrator Class | | | 44,070 | | | | 2,307,744 | | | | 38,004 | | | | 1,577,864 | |
Institutional Class | | | 807,461 | | | | 45,065,594 | | | | 1,902,844 | | | | 79,061,772 | |
| | | | |
| | | | | | | 95,713,781 | | | | | | | | 133,500,091 | |
| | | | |
Reinvestment of distributions | |
Class A | | | 0 | | | | 0 | | | | 4,658 | | | | 188,894 | |
Administrator Class | | | 0 | | | | 0 | | | | 518 | | | | 21,226 | |
Institutional Class | | | 0 | | | | 0 | | | | 8,995 | | | | 371,239 | |
| | | | |
| | | | | | | 0 | | | | | | | | 581,359 | |
| | | | |
Payment for shares redeemed | |
Class A | | | (689,965 | ) | | | (37,783,455 | ) | | | (1,873,744 | ) | | | (73,583,351 | ) |
Class C | | | (109,286 | ) | | | (5,370,279 | ) | | | (190,365 | ) | | | (6,607,315 | ) |
Administrator Class | | | (19,584 | ) | | | (1,078,543 | ) | | | (50,212 | ) | | | (1,989,528 | ) |
Institutional Class | | | (668,029 | ) | | | (37,340,207 | ) | | | (1,671,738 | ) | | | (65,806,860 | ) |
| | | | |
| | | | | | | (81,572,484 | ) | | | | | | | (147,987,054 | ) |
| | | | |
Net increase (decrease) in net assets resulting from capital share transactions | | | | | | | 14,141,297 | | | | | | | | (13,905,604 | ) |
| | | | |
Total increase (decrease) in net assets | | | | | | | 195,878,156 | | | | | | | | (6,529,933 | ) |
| | | | |
| | |
Net assets | | | | | | | | |
Beginning of period | | | | | | | 274,754,496 | | | | | | | | 281,284,429 | |
| | | | |
End of period | | | | | | $ | 470,632,652 | | | | | | | $ | 274,754,496 | |
| | | | |
The accompanying notes are an integral part of these financial statements.
Wells Fargo Precious Metals Fund | 13
Consolidated financial highlights
(For a share outstanding throughout each period)
| | | | | | | | | | | | | | | | | | | | | | | | |
| | | Six months ended
September 30, 2020
(unaudited) | | | Year ended March 31 | |
| CLASS A | | 2020 | | | 2019 | | | 2018 | | | 2017 | | | 2016 | |
Net asset value, beginning of period | | | $35.30 | | | | $33.94 | | | | $32.80 | | | | $35.99 | | | | $32.73 | | | | $28.99 | |
Net investment loss | | | (0.05 | )1 | | | (0.03 | )1 | | | (0.03 | )1 | | | (0.11 | )1 | | | (0.22 | )1 | | | (0.05 | ) |
Net realized and unrealized gains (losses) on investments | | | 23.45 | | | | 1.44 | | | | 1.17 | | | | (2.60 | ) | | | 3.85 | | | | 3.79 | |
| | | | | | | | | | | | | | | | | | | | | | | | |
Total from investment operations | | | 23.40 | | | | 1.41 | | | | 1.14 | | | | (2.71 | ) | | | 3.63 | | | | 3.74 | |
Distributions to shareholders from | | | | | | | | | | | | | | | | | | | | | | | | |
Net investment income | | | 0.00 | | | | (0.05 | ) | | | 0.00 | | | | (0.48 | ) | | | (0.37 | ) | | | 0.00 | |
Net asset value, end of period | | | $58.70 | | | | $35.30 | | | | $33.94 | | | | $32.80 | | | | $35.99 | | | | $32.73 | |
Total return2 | | | 66.29 | % | | | 4.13 | % | | | 3.48 | % | | | (7.56 | )% | | | 11.24 | % | | | 12.90 | % |
Ratios to average net assets (annualized) | | | | | | | | | | | | | | | | | | | | | | | | |
Gross expenses | | | 1.17 | % | | | 1.20 | % | | | 1.22 | % | | | 1.21 | % | | | 1.20 | % | | | 1.23 | % |
Net expenses | | | 1.09 | % | | | 1.09 | % | | | 1.09 | % | | | 1.04 | % | | | 1.09 | % | | | 1.10 | % |
Net investment loss | | | (0.19 | )% | | | (0.08 | )% | | | (0.11 | )% | | | (0.32 | )% | | | (0.57 | )% | | | (0.24 | )% |
Supplemental data | | | | | | | | | | | | | | | | | | | | | | | | |
Portfolio turnover rate3 | | | 12 | % | | | 25 | % | | | 19 | % | | | 27 | % | | | 21 | % | | | 18 | % |
Net assets, end of period (000s omitted) | | | $250,707 | | | | $147,020 | | | | $162,860 | | | | $177,859 | | | | $242,423 | | | | $236,310 | |
| 1 | Calculated based upon average shares outstanding |
| 2 | Total return calculations do not include any sales charges. Returns for periods of less than one year are not annualized. |
| 3 | Portfolio turnover rate includes the purchases and sales transactions of its wholly-owned subsidiary. |
The accompanying notes are an integral part of these financial statements.
14 | Wells Fargo Precious Metals Fund
Consolidated financial highlights
(For a share outstanding throughout each period)
| | | | | | | | | | | | | | | | | | | | | | | | |
| | | Six months ended
September 30, 2020
(unaudited) | | | Year ended March 31 | |
| CLASS C | | 2020 | | | 2019 | | | 2018 | | | 2017 | | | 2016 | |
Net asset value, beginning of period | | | $30.87 | | | | $29.88 | | | | $29.09 | | | | $32.07 | | | | $29.10 | | | | $25.97 | |
Net investment loss | | | (0.23 | )1 | | | (0.29 | )1 | | | (0.24 | )1 | | | (0.33 | )1 | | | (0.46 | )1 | | | (0.24 | )1 |
Net realized and unrealized gains (losses) on investments | | | 20.51 | | | | 1.28 | | | | 1.03 | | | | (2.30 | ) | | | 3.49 | | | | 3.37 | |
| | | | | | | | | | | | | | | | | | | | | | | | |
Total from investment operations | | | 20.28 | | | | 0.99 | | | | 0.79 | | | | (2.63 | ) | | | 3.03 | | | | 3.13 | |
Distributions to shareholders from | | | | | | | | | | | | | | | | | | | | | | | | |
Net investment income | | | 0.00 | | | | 0.00 | | | | 0.00 | | | | (0.35 | ) | | | (0.06 | ) | | | 0.00 | |
Net asset value, end of period | | | $51.15 | | | | $30.87 | | | | $29.88 | | | | $29.09 | | | | $32.07 | | | | $29.10 | |
Total return2 | | | 65.69 | % | | | 3.31 | % | | | 2.72 | % | | | (8.24 | )% | | | 10.42 | % | | | 12.05 | % |
Ratios to average net assets (annualized) | | | | | | | | | | | | | | | | | | | | | | | | |
Gross expenses | | | 1.92 | % | | | 1.95 | % | | | 1.97 | % | | | 1.96 | % | | | 1.95 | % | | | 1.99 | % |
Net expenses | | | 1.84 | % | | | 1.84 | % | | | 1.84 | % | | | 1.79 | % | | | 1.84 | % | | | 1.85 | % |
Net investment loss | | | (0.97 | )% | | | (0.83 | )% | | | (0.88 | )% | | | (1.07 | )% | | | (1.32 | )% | | | (0.99 | )% |
Supplemental data | | | | | | | | | | | | | | | | | | | | | | | | |
Portfolio turnover rate3 | | | 12 | % | | | 25 | % | | | 19 | % | | | 27 | % | | | 21 | % | | | 18 | % |
Net assets, end of period (000s omitted) | | | $17,120 | | | | $11,834 | | | | $14,908 | | | | $33,022 | | | | $48,710 | | | | $52,648 | |
| 1 | Calculated based upon average shares outstanding |
| 2 | Total return calculations do not include any sales charges. Returns for periods of less than one year are not annualized. |
| 3 | Portfolio turnover rate includes the purchases and sales transactions of its wholly-owned subsidiary. |
The accompanying notes are an integral part of these financial statements.
Wells Fargo Precious Metals Fund | 15
Consolidated financial highlights
(For a share outstanding throughout each period)
| | | | | | | | | | | | | | | | | | | | | | | | |
| | | Six months ended
September 30, 2020
(unaudited) | | | Year ended March 31 | |
| ADMINISTRATOR CLASS | | 2020 | | | 2019 | | | 2018 | | | 2017 | | | 2016 | |
Net asset value, beginning of period | | | $35.66 | | | | $34.29 | | | | $33.09 | | | | $36.27 | | | | $32.98 | | | | $29.17 | |
Net investment income (loss) | | | (0.01 | )1 | | | 0.02 | 1 | | | 0.01 | 1 | | | (0.09 | )1 | | | (0.17 | )1 | | | (0.03 | )1 |
Net realized and unrealized gains (losses) on investments | | | 23.70 | | | | 1.45 | | | | 1.19 | | | | (2.59 | ) | | | 3.87 | | | | 3.84 | |
| | | | | | | | | | | | | | | | | | | | | | | | |
Total from investment operations | | | 23.69 | | | | 1.47 | | | | 1.20 | | | | (2.68 | ) | | | 3.70 | | | | 3.81 | |
Distributions to shareholders from | | | | | | | | | | | | | | | | | | | | | | | | |
Net investment income | | | 0.00 | | | | (0.10 | ) | | | 0.00 | | | | (0.50 | ) | | | (0.41 | ) | | | 0.00 | |
Net asset value, end of period | | | $59.35 | | | | $35.66 | | | | $34.29 | | | | $33.09 | | | | $36.27 | | | | $32.98 | |
Total return2 | | | 66.43 | % | | | 4.24 | % | | | 3.63 | % | | | (7.40 | )% | | | 11.37 | % | | | 13.06 | % |
Ratios to average net assets (annualized) | | | | | | | | | | | | | | | | | | | | | | | | |
Gross expenses | | | 1.09 | % | | | 1.12 | % | | | 1.14 | % | | | 1.15 | % | | | 1.12 | % | | | 1.13 | % |
Net expenses | | | 0.95 | % | | | 0.95 | % | | | 0.95 | % | | | 0.91 | % | | | 0.95 | % | | | 0.96 | % |
Net investment income (loss) | | | (0.05 | )% | | | 0.06 | % | | | 0.04 | % | | | (0.25 | )% | | | (0.44 | )% | | | (0.10 | )% |
Supplemental data | | | | | | | | | | | | | | | | | | | | | | | | |
Portfolio turnover rate3 | | | 12 | % | | | 25 | % | | | 19 | % | | | 27 | % | | | 21 | % | | | 18 | % |
Net assets, end of period (000s omitted) | | | $14,755 | | | | $7,994 | | | | $8,086 | | | | $9,148 | | | | $15,325 | | | | $16,114 | |
| 1 | Calculated based upon average shares outstanding |
| 2 | Returns for periods of less than one year are not annualized. |
| 3 | Portfolio turnover rate includes purchases and sales transactions of its wholly-owned subsidiary. |
The accompanying notes are an integral part of these financial statements.
16 | Wells Fargo Precious Metals Fund
Consolidated financial highlights
(For a share outstanding throughout each period)
| | | | | | | | | | | | | | | | | | | | | | | | |
| | | Six months ended
September 30, 2020
(unaudited) | | | Year ended March 31 | |
| INSTITUTIONAL CLASS | | 2020 | | | 2019 | | | 2018 | | | 2017 | | | 2016 | |
Net asset value, beginning of period | | | $35.96 | | | | $34.57 | | | | $33.30 | | | | $36.47 | | | | $33.21 | | | | $29.33 | |
Net investment income (loss) | | | 0.01 | | | | 0.09 | 1 | | | 0.04 | | | | 0.02 | | | | (0.09 | )1 | | | 0.02 | 1 |
Net realized and unrealized gains (losses) on investments | | | 23.91 | | | | 1.46 | | | | 1.23 | | | | (2.67 | ) | | | 3.85 | | | | 3.86 | |
| | | | | | | | | | | | | | | | | | | | | | | | |
Total from investment operations | | | 23.92 | | | | 1.55 | | | | 1.27 | | | | (2.65 | ) | | | 3.76 | | | | 3.88 | |
Distributions to shareholders from | | | | | | | | | | | | | | | | | | | | | | | | |
Net investment income | | | 0.00 | | | | (0.16 | ) | | | 0.00 | | | | (0.52 | ) | | | (0.50 | ) | | | 0.00 | |
Net asset value, end of period | | | $59.88 | | | | $35.96 | | | | $34.57 | | | | $33.30 | | | | $36.47 | | | | $33.21 | |
Total return2 | | | 66.52 | % | | | 4.43 | % | | | 3.81 | % | | | (7.27 | )% | | | 11.49 | % | | | 13.23 | % |
Ratios to average net assets (annualized) | | | | | | | | | | | | | | | | | | | | | | | | |
Gross expenses | | | 0.84 | % | | | 0.87 | % | | | 0.89 | % | | | 0.88 | % | | | 0.88 | % | | | 0.88 | % |
Net expenses | | | 0.79 | % | | | 0.79 | % | | | 0.79 | % | | | 0.73 | % | | | 0.79 | % | | | 0.80 | % |
Net investment income (loss) | | | 0.11 | % | | | 0.22 | % | | | 0.21 | % | | | 0.01 | % | | | (0.24 | )% | | | 0.06 | % |
Supplemental data | | | | | | | | | | | | | | | | | | | | | | | | |
Portfolio turnover rate3 | | | 12 | % | | | 25 | % | | | 19 | % | | | 27 | % | | | 21 | % | | | 18 | % |
Net assets, end of period (000s omitted) | | | $188,050 | | | | $107,907 | | | | $95,431 | | | | $82,650 | | | | $89,680 | | | | $60,156 | |
| 1 | Calculated based upon average shares outstanding |
| 2 | Returns for periods of less than one year are not annualized. |
| 3 | Portfolio turnover rate includes purchases and sales transactions of its wholly-owned subsidiary. |
The accompanying notes are an integral part of these financial statements.
Wells Fargo Precious Metals Fund | 17
Consolidated notes to financial statements (unaudited)
1. ORGANIZATION
Wells Fargo Funds Trust (the “Trust”), a Delaware statutory trust organized on March 10, 1999, is an open-end management investment company registered under the Investment Company Act of 1940, as amended (the “1940 Act”). As an investment company, the Trust follows the accounting and reporting guidance in Financial Accounting Standards Board (“FASB”) Accounting Standards Codification Topic 946, Financial Services – Investment Companies. These financial statements report on the Wells Fargo Precious Metals Fund (the “Fund”) which is a non-diversified series of the Trust.
2. INVESTMENT IN SUBSIDIARY
The Fund invests in precious metals and minerals through Special Investments (Cayman) SPC (the “Subsidiary”), a wholly-owned subsidiary incorporated on May 3, 2005 under the laws of the Cayman Islands as an exempted segregated portfolio company with limited liability. As of September 30, 2020, the Subsidiary held $14,508,165 in gold bullion representing 99.60% of its net assets. The Fund is the sole shareholder of the Subsidiary. As of September 30, 2020, the Fund held $14,566,223 in the Subsidiary, representing 3.10% of the Fund’s net assets prior to consolidation.
The consolidated financial statements of the Fund include the financial results of the Subsidiary. The Consolidated Portfolio of
Investments includes positions of the Fund and the Subsidiary and the consolidated financial statements include the accounts
of the Fund and the Subsidiary. Accordingly, all interfund balances and transactions between the Fund and the Subsidiary have
been eliminated in consolidation.
3. SIGNIFICANT ACCOUNTING POLICIES
The following significant accounting policies, which are consistently followed in the preparation of the financial statements of the Fund, are in conformity with U.S. generally accepted accounting principles which require management to make estimates and assumptions that affect the reported amounts of assets and liabilities, disclosure of contingent assets and liabilities at the date of the financial statements, and the reported amounts of revenues and expenses during the reporting period. Actual results could differ from those estimates.
Securities valuation
All investments are valued each business day as of the close of regular trading on the New York Stock Exchange (generally 4 p.m. Eastern Time), although the Fund may deviate from this calculation time under unusual or unexpected circumstances.
Equity securities that are listed on a foreign or domestic exchange or market are valued at the official closing price or, if none, the last sales price. If no sale occurs on the principal exchange or market that day, a fair value price will be determined in accordance with the Fund’s Valuation Procedures.
Investments in commodities are valued at their last traded price.
The values of securities denominated in foreign currencies are translated into U.S. dollars at rates provided by an independent foreign currency pricing source at a time each business day specified by the Wells Fargo Asset Management Pricing Committee at Wells Fargo Funds Management, LLC (“Funds Management”).
Many securities markets and exchanges outside the U.S. close prior to the close of the New York Stock Exchange and therefore may not fully reflect trading or events that occur after the close of the principal exchange in which the foreign securities are traded, but before the close of the New York Stock Exchange. If such trading or events are expected to materially affect the value of such securities, then fair value pricing procedures approved by the Board of Trustees of the Fund are applied. These procedures take into account multiple factors including movements in U.S. securities markets after foreign exchanges close. Foreign securities that are fair valued under these procedures are categorized as Level 2 and the application of these procedures may result in transfers between Level 1 and Level 2. Depending on market activity, such fair valuations may be frequent. Such fair value pricing may result in net asset values that are higher or lower than net asset values based on the last reported sales price or latest quoted bid price. On September 30, 2020 such fair value pricing was used in pricing certain foreign securities.
Investments in registered open-end investment companies are valued at net asset value.
Investments which are not valued using any of the methods discussed above are valued at their fair value, as determined in good faith by the Board of Trustees. The Board of Trustees has established a Valuation Committee comprised of the Trustees and has delegated to it the authority to take any actions regarding the valuation of portfolio securities that the Valuation Committee deems necessary or appropriate, including determining the fair value of portfolio securities, unless the determination has been delegated to the Wells Fargo Asset Management Pricing Committee. The Board of Trustees retains the authority to make or ratify any valuation decisions or approve any changes to the Valuation Procedures as it deems appropriate. On a quarterly basis, the Board of Trustees receives reports on any valuation actions taken by the Valuation Committee or the Wells Fargo Asset Management Pricing Committee which may include items for ratification.
18 | Wells Fargo Precious Metals Fund
Consolidated notes to financial statements (unaudited)
Foreign currency translation
The accounting records of the Fund are maintained in U.S. dollars. The values of other assets and liabilities denominated in foreign currencies are translated into U.S. dollars at rates provided by an independent foreign currency pricing source at a time each business day specified by the Wells Fargo Asset Management Pricing Committee. Purchases and sales of securities, and income and expenses are converted at the rate of exchange on the respective dates of such transactions. Net realized foreign exchange gains or losses arise from sales of foreign currencies, currency gains or losses realized between the trade and settlement dates on securities transactions, and the difference between the amounts of dividends, interest and foreign withholding taxes recorded and the U.S. dollar equivalent of the amounts actually paid or received. Net unrealized foreign exchange gains and losses arise from changes in the fair value of assets and liabilities other than investments in securities resulting from changes in exchange rates. The changes in net assets arising from changes in exchange rates of securities and the changes in net assets resulting from changes in market prices of securities are not separately presented. Such changes are included in net realized and unrealized gains or losses from investments.
Security transactions and income recognition
Securities transactions are recorded on a trade date basis. Realized gains or losses are recorded on the basis of identified cost.
Dividend income is recognized on the ex-dividend date, except for certain dividends from foreign securities, which are recorded as soon as the custodian verifies the ex-dividend date. Dividend income from foreign securities is recorded net of foreign taxes withheld where recovery of such taxes is not assured.
Distributions to shareholders
Distributions to shareholders from net investment income and any net realized gains are recorded on the ex-dividend date and paid at least annually. Such distributions are determined in accordance with income tax regulations and may differ from U.S. generally accepted accounting principles. Dividend sources are estimated at the time of declaration. The tax character of distributions is determined as of the Fund’s fiscal year end. Therefore, a portion of the Fund’s distributions made prior to the Fund’s fiscal year end may be categorized as a tax return of capital at year end.
Federal and other taxes
The Fund intends to continue to qualify as a regulated investment company by distributing substantially all of its investment company taxable income and any net realized capital gains (after reduction for capital loss carryforwards) sufficient to relieve it from all, or substantially all, federal income taxes. Accordingly, no provision for federal income taxes was required.
The Subsidiary is classified as a controlled foreign corporation under Subchapter N of the Internal Revenue Code. Therefore, the
Fund is required to increase its taxable income by its share of the Subsidiary’s income. Net investment losses of the Subsidiary
cannot be deducted by the Fund in the current period nor carried forward to offset taxable income in future periods.
The Fund’s income and federal excise tax returns and all financial records supporting those returns for the prior three fiscal years are subject to examination by the federal and Delaware revenue authorities. Management has analyzed the Fund’s tax positions taken on federal, state, and foreign tax returns for all open tax years and does not believe that there are any uncertain tax positions that require recognition of a tax liability.
As of September 30, 2020, the aggregate cost of all investments for federal income tax purposes was $224,877,046 and the unrealized gains (losses) consisted of:
| | | | |
| |
Gross unrealized gains | | $ | 245,000,229 | |
| |
Gross unrealized losses | | | (2,593,250 | ) |
| |
Net unrealized gains | | $ | 242,406,979 | |
As of March 31, 2020, the Fund had capital loss carryforwards which consisted of $29,600,089 in short-term capital losses and $143,020,683 in long-term capital losses.
Class allocations
The separate classes of shares offered by the Fund differ principally in applicable sales charges, distribution, shareholder servicing, and administration fees. Class specific expenses are charged directly to that share class. Investment income, common fund-level expenses, and realized and unrealized gains (losses) on investments are allocated daily to each class of shares based on the relative proportion of net assets of each class.
Wells Fargo Precious Metals Fund | 19
Consolidated notes to financial statements (unaudited)
4. FAIR VALUATION MEASUREMENTS
Fair value measurements of investments are determined within a framework that has established a fair value hierarchy based upon the various data inputs utilized in determining the value of the Fund’s investments. The three-level hierarchy gives the highest priority to unadjusted quoted prices in active markets for identical assets or liabilities (Level 1) and the lowest priority to unobservable inputs (Level 3). The Fund’s investments are classified within the fair value hierarchy based on the lowest level of input that is significant to the fair value measurement. The inputs are summarized into three broad levels as follows:
| ∎ | | Level 1 – quoted prices in active markets for identical securities |
| ∎ | | Level 2 – other significant observable inputs (including quoted prices for similar securities, interest rates, prepayment speeds, credit risk, etc.) |
| ∎ | | Level 3 – significant unobservable inputs (including the Fund’s own assumptions in determining the fair value of investments) |
The inputs or methodologies used for valuing investments in securities are not necessarily an indication of the risk associated with investing in those securities.
The following is a summary of the inputs used in valuing the Fund’s assets and liabilities as of September 30, 2020:
| | | | | | | | | | | | | | | | |
| | | | |
| | | Quoted prices
(Level 1) | | | Other significant
observable inputs
(Level 2) | | | Significant
unobservable inputs (Level 3) | | | Total | |
| | | | |
Assets | | | | | | | | | | | | | | | | |
Investments in: | | | | | | | | | | | | | | | | |
| | | | |
Common stocks | | | | | | | | | | | | | | | | |
| | | | |
Australia | | $ | 0 | | | $ | 48,792,198 | | | $ | 0 | | | $ | 48,792,198 | |
| | | | |
Canada | | | 276,272,295 | | | | 32,000,449 | | | | 0 | | | | 308,272,744 | |
| | | | |
South Africa | | | 32,345,091 | | | | 0 | | | | 0 | | | | 32,345,091 | |
| | | | |
United Kingdom | | | 0 | | | | 3,861,497 | | | | 0 | | | | 3,861,497 | |
| | | | |
United States | | | 51,220,362 | | | | 0 | | | | 0 | | | | 51,220,362 | |
| | | | |
Commodities | | | 14,508,165 | | | | 0 | | | | 0 | | | | 14,508,165 | |
| | | | |
Short-term investments | | | | | | | | | | | | | | | | |
| | | | |
Investment companies | | | 8,283,968 | | | | 0 | | | | 0 | | | | 8,283,968 | |
| | | | |
Total assets | | $ | 382,629,881 | | | $ | 84,654,144 | | | $ | 0 | | | $ | 467,284,025 | |
Additional sector, industry or geographic detail is included in the Consolidated Portfolio of Investments.
For the six months ended September 30, 2020, the Fund did not have any transfers into/out of Level 3.
5. TRANSACTIONS WITH AFFILIATES
Management fee
Funds Management, an indirect wholly owned subsidiary of Wells Fargo & Company (“Wells Fargo”), is the manager of the Fund and provides advisory and fund-level administrative services under an investment management agreement. Under the investment management agreement, Funds Management is responsible for, among other services, implementing the investment objectives and strategies of the Fund, supervising the subadviser and providing fund-level administrative services in connection with the Fund’s operations. As compensation for its services under the investment management agreement, Funds Management is entitled to receive a management fee at the following annual rate based on the Fund’s average daily net assets:
| | | | |
| |
| Average daily net assets | | Management fee | |
| |
First $500 million | | | 0.650 | % |
| |
Next $500 million | | | 0.600 | |
| |
Next $1 billion | | | 0.550 | |
| |
Next $2 billion | | | 0.525 | |
| |
Next $1 billion | | | 0.500 | |
| |
Next $5 billion | | | 0.490 | |
| |
Over $10 billion | | | 0.480 | |
20 | Wells Fargo Precious Metals Fund
Consolidated notes to financial statements (unaudited)
For the six months ended September 30, 2020, the management fee was equivalent to an annual rate of 0.65% of the Fund’s average daily net assets.
The Subsidiary has entered into a separate advisory contract with Funds Management to manage the investment and reinvestment of its assets in conformity with its investment objectives and restrictions. Under this agreement, the Subsidiary does not pay Funds Management a fee for its services.
Funds Management has retained the services of a subadviser to provide daily portfolio management to the Fund. The fee for subadvisory services is borne by Funds Management. Wells Capital Management Incorporated, an affiliate of Funds Management and an indirect wholly owned subsidiary of Wells Fargo, is the subadviser to the Fund and is entitled to receive a fee from Funds Management at an annual rate starting at 0.40% and declining to 0.30% as the average daily net assets of the Fund increase
Administration fees
Under a class-level administration agreement, Funds Management provides class-level administrative services to the Fund, which includes paying fees and expenses for services provided by the transfer agent, sub-transfer agents, omnibus account servicers and record-keepers. As compensation for its services under the class-level administration agreement, Funds Management receives an annual fee which is calculated based on the average daily net assets of each class as follows:
| | | | |
| |
| | | Class-level
administration fee | |
| |
Class A, Class C | | | 0.21 | % |
| |
Administrator Class, Institutional Class | | | 0.13 | |
Waivers and/or expense reimbursements
Funds Management has contractually waived and/or reimbursed management and administration fees to the extent necessary to maintain certain net operating expense ratios for the Fund. When each class of the Fund has exceeded its expense cap, Funds Management has waived fees and/or reimbursed expenses from fund-level expenses on a proportionate basis and then from class specific expenses. When only certain classes exceed their expense caps, waivers and/or reimbursements are applied against class specific expenses before fund-level expenses. Funds Management has committed through July 31, 2021 to waive fees and/or reimburse expenses to the extent necessary to cap the Fund’s expenses at 1.09% for Class A shares, 1.84% for Class C shares, 0.95% for Administrator Class shares and 0.79% for Institutional Class shares. Prior to or after the commitment expiration date, the cap may be increased or the commitment to maintain the cap may be terminated only with the approval of the Board of Trustees.
Distribution fee
The Trust has adopted a distribution plan for Class C shares of the Fund pursuant to Rule 12b-1 under the 1940 Act. A distribution fee is charged to Class C shares and paid to Wells Fargo Funds Distributor, LLC (“Funds Distributor”), the principal underwriter, at an annual rate of 0.75% of the average daily net assets of Class C shares.
In addition, Funds Distributor is entitled to receive the front-end sales charge from the purchase of Class A shares and a contingent deferred sales charge on the redemption of certain Class A shares. Funds Distributor is also entitled to receive the contingent deferred sales charges from redemptions of Class C shares. For the six months ended September 30, 2020, Funds Distributor received $12,341 from the sale of Class A shares. No contingent deferred sales charges were incurred by Class A and Class C shares for the or six months ended September 30, 2020.
Shareholder servicing fees
The Trust has entered into contracts with one or more shareholder servicing agents, whereby Class A, Class C, and Administrator Class of the Fund are charged a fee at an annual rate of 0.25% of the average daily net assets of each respective class. A portion of these total shareholder servicing fees were paid to affiliates of Wells Fargo.
Interfund transactions
The Fund may purchase or sell portfolio investment securities to certain other Wells Fargo affiliates pursuant to Rule 17a-7 under the 1940 Act and under procedures adopted by the Board of Trustees. The procedures have been designed to ensure that these interfund transactions, which do not incur broker commissions, are effected at current market prices.
Wells Fargo Precious Metals Fund | 21
Consolidated notes to financial statements (unaudited)
6. INVESTMENT PORTFOLIO TRANSACTIONS
Purchases and sales of investments, excluding U.S. government obligations (if any) and short-term securities, for the six months ended September 30, 2020 were $60,058,416 and $48,007,041, respectively. These amounts include purchase and sales transactions of the Subsidiary.
7. BANK BORROWINGS
The Trust (excluding the money market funds), Wells Fargo Master Trust and Wells Fargo Variable Trust are parties to a $350,000,000 revolving credit agreement whereby the Fund is permitted to use bank borrowings for temporary or emergency purposes, such as to fund shareholder redemption requests. Interest under the credit agreement is charged to the Fund based on a borrowing rate equal to the higher of the Federal Funds rate in effect on that day plus 1.25% or the overnight LIBOR rate in effect on that day plus 1.25%. In addition, an annual commitment fee equal to 0.25% of the unused balance is allocated to each participating fund.
For the six months ended September 30, 2020, there were no borrowings by the Fund under the agreement.
8. CONCENTRATION RISKS
Concentration risks result from exposure to a limited number of sectors or geographic regions. As of the end of the period, the Fund concentrated its portfolio in investments related to precious metals and minerals with a geographic emphasis in Canada. A fund that invests a substantial portion of its assets in any sector or geographic region may be more affected by changes in that sector or geographic region than would be a fund whose investments are not heavily weighted in any sector or geographic region.
9. INDEMNIFICATION
Under the Fund’s organizational documents, the officers and Trustees have been granted certain indemnification rights against certain liabilities that may arise out of performance of their duties to the Fund. The Fund has entered into a separate agreement with each Trustee that converts indemnification rights currently existing under the Fund’s organizational documents into contractual rights that cannot be changed in the future without the consent of the Trustee. Additionally, in the normal course of business, the Fund may enter into contracts with service providers that contain a variety of indemnification clauses. The Fund’s maximum exposure under these arrangements is dependent on future claims that may be made against the Fund and, therefore, cannot be estimated.
10. NEW ACCOUNTING PRONOUNCEMENT
In August 2018, FASB issued Accounting Standards Update (“ASU”) No. 2018-13, Fair Value Measurement (Topic 820) Disclosure Framework—Changes to the Disclosure Requirements for Fair Value Measurement. ASU 2018-13 updates the disclosure requirements on fair value measurements in Topic 820, Fair Value Measurements. The amendments are effective for fiscal years, and interim periods within those fiscal years, beginning after December 15, 2019. Management has adopted this guidance which did not have a material impact on the financial statements.
11. CORONAVIRUS (COVID-19) PANDEMIC
On March 11, 2020, the World Health Organization announced that it had made the assessment that coronavirus disease 2019 (“COVID-19”) is a pandemic. The impacts of COVID-19 are adversely affecting the entire global economy, individual companies and investment products, and the market in general. There is significant uncertainty around the extent and duration of business disruptions related to COVID-19 and the impacts may be short term or may last for an extended period of time. The risk of further spreading of COVID-19 has led to significant uncertainty and volatility in the financial markets.
22 | Wells Fargo Precious Metals Fund
Other information (unaudited)
TAX INFORMATION
Pursuant to Section 853 of the Internal Revenue Code, the following amounts have been designated as foreign taxes paid for the fiscal year ended March 31, 2020. These amounts may be less than the actual foreign taxes paid for financial statement purposes. Foreign taxes paid or withheld should be included in taxable income with an offsetting deduction from gross income or as a credit for taxes paid to foreign governments. None of the income was derived from ineligible foreign sources as defined under Section 901(j) of the Internal Revenue Code.
| | | | |
Creditable foreign taxes paid | | Per share amount | | Foreign income as % of ordinary income distributions |
| | |
| $141,269 | | $0.0181 | | 60.56% |
PROXY VOTING INFORMATION
A description of the policies and procedures used to determine how to vote proxies relating to portfolio securities is available, upon request, by calling 1-800-222-8222, visiting our website at wfam.com, or visiting the SEC website at sec.gov. Information regarding how the proxies related to portfolio securities were voted during the most recent 12-month period ended June 30 is available on the website at wfam.com or by visiting the SEC website at sec.gov.
QUARTERLY PORTFOLIO HOLDINGS INFORMATION
The Fund files its complete schedule of portfolio holdings with the SEC for the first and third quarters of each fiscal year as an exhibit to its reports on Form N-PORT. Shareholders may view the filed Form N-PORT by visiting the SEC website at sec.gov.
Wells Fargo Precious Metals Fund | 23
Other information (unaudited)
BOARD OF TRUSTEES AND OFFICERS
Each of the Trustees and Officers1 listed in the table below acts in identical capacities for each fund in the Wells Fargo family of funds, which consists of 142 mutual funds comprising the Wells Fargo Funds Trust, Wells Fargo Variable Trust, Wells Fargo Master Trust and four closed-end funds (collectively the “Fund Complex”). This table should be read in conjunction with the Prospectus and the Statement of Additional Information2. The mailing address of each Trustee and Officer is 525 Market Street, 12th Floor, San Francisco, CA 94105. Each Trustee and Officer serves an indefinite term, however, each Trustee serves such term until reaching the mandatory retirement age established by the Trustees.
Independent Trustees
| | | | | | |
Name and year of birth | | Position held and
length of service* | | Principal occupations during past five years or longer | | Current other
public company or
investment
company
directorships |
| | | |
William R. Ebsworth (Born 1957) | | Trustee, since 2015 | | Retired. From 1984 to 2013, equities analyst, portfolio manager, research director and chief investment officer at Fidelity Management and Research Company in Boston, Tokyo, and Hong Kong, and retired in 2013 as Chief Investment Officer of Fidelity Strategic Advisers, Inc. where he led a team of investment professionals managing client assets. Prior thereto, Board member of Hong Kong Securities Clearing Co., Hong Kong Options Clearing Corp., the Thailand International Fund, Ltd., Fidelity Investments Life Insurance Company, and Empire Fidelity Investments Life Insurance Company. Audit Committee Chair and Investment Committee Chair of the Vincent Memorial Hospital Endowment (non-profit organization). Mr. Ebsworth is a CFA® charterholder. | | N/A |
| | | |
Jane A. Freeman (Born 1953) | | Trustee, since 2015; Chair Liaison, since 2018 | | Retired. From 2012 to 2014 and 1999 to 2008, Chief Financial Officer of Scientific Learning Corporation. From 2008 to 2012, Ms. Freeman provided consulting services related to strategic business projects. Prior to 1999, Portfolio Manager at Rockefeller & Co. and Scudder, Stevens & Clark. Board member of the Harding Loevner Funds from 1996 to 2014, serving as both Lead Independent Director and chair of the Audit Committee. Board member of the Russell Exchange Traded Funds Trust from 2011 to 2012 and the chair of the Audit Committee. Ms. Freeman is also an inactive Chartered Financial Analyst. | | N/A |
| | | |
Isaiah Harris, Jr. (Born 1952) | | Trustee, since 2009; Audit Committee Chairman, since 2019 | | Retired. Chairman of the Board of CIGNA Corporation since 2009, and Director since 2005. From 2003 to 2011, Director of Deluxe Corporation. Prior thereto, President and CEO of BellSouth Advertising and Publishing Corp. from 2005 to 2007, President and CEO of BellSouth Enterprises from 2004 to 2005 and President of BellSouth Consumer Services from 2000 to 2003. Emeritus member of the Iowa State University Foundation Board of Governors. Emeritus Member of the Advisory Board of Iowa State University School of Business. Advisory Board Member, Palm Harbor Academy (private school). Mr. Harris is a certified public accountant (inactive status). | | CIGNA Corporation |
| | | |
Judith M. Johnson (Born 1949) | | Trustee, since 2008 | | Retired. Prior thereto, Chief Executive Officer and Chief Investment Officer of Minneapolis Employees Retirement Fund from 1996 to 2008. Ms. Johnson is an attorney, certified public accountant and a certified managerial accountant. | | N/A |
| | | |
David F. Larcker (Born 1950) | | Trustee, since 2009 | | James Irvin Miller Professor of Accounting at the Graduate School of Business (Emeritus), Stanford University, Director of the Corporate Governance Research Initiative and Senior Faculty of The Rock Center for Corporate Governance since 2006. From 2005 to 2008, Professor of Accounting at the Graduate School of Business, Stanford University. Prior thereto, Ernst & Young Professor of Accounting at The Wharton School, University of Pennsylvania from 1985 to 2005. | | N/A |
24 | Wells Fargo Precious Metals Fund
Other information (unaudited)
| | | | | | |
Name and year of birth | | Position held and
length of service* | | Principal occupations during past five years or longer | | Current other
public company or
investment
company
directorships |
| | | |
Olivia S. Mitchell (Born 1953) | | Trustee, since 2006; Nominating and Governance Committee Chair, since 2018 | | International Foundation of Employee Benefit Plans Professor, Wharton School of the University of Pennsylvania since 1993. Director of Wharton’s Pension Research Council and Boettner Center on Pensions & Retirement Research, and Research Associate at the National Bureau of Economic Research. Previously, Cornell University Professor from 1978 to 1993. | | N/A |
| | | |
Timothy J. Penny (Born 1951) | | Trustee, since 1996; Chairman, since 2018 | | President and Chief Executive Officer of Southern Minnesota Initiative Foundation, a non-profit organization, since 2007. Member of the Board of Trustees of NorthStar Education Finance, Inc., a non-profit organization, since 2007. | | N/A |
| | | |
James G. Polisson (Born 1959) | | Trustee, since 2018 | | Retired. Chief Marketing Officer, Source (ETF) UK Services, Ltd, from 2015 to 2017. From 2012 to 2015, Principal of The Polisson Group, LLC, a management consulting, corporate advisory and principal investing company. Chief Executive Officer and Managing Director at Russell Investments, Global Exchange Traded Funds from 2010 to 2012. Managing Director of Barclays Global Investors from 1998 to 2010 and Global Chief Marketing Officer for iShares and Barclays Global Investors from 2000 to 2010. Trustee of the San Francisco Mechanics’ Institute, a non-profit organization, from 2013 to 2015. Board member of the Russell Exchange Traded Fund Trust from 2011 to 2012. Director of Barclays Global Investors Holdings Deutschland GmbH from 2006 to 2009. Mr. Polisson is an attorney and has a retired status with the Massachusetts and District of Columbia Bar Associations. | | N/A |
| | | |
Pamela Wheelock (Born 1959) | | Trustee, since January 2020; previously Trustee from January 2018 to July 2019 | | Board member of the Destination Medical Center Economic Development Agency, Rochester, Minnesota since 2019. Interim President of the McKnight Foundation from January to September 2020. Acting Commissioner, Minnesota Department of Human Services, July 2019 through September 2019. Human Services Manager (part-time), Minnesota Department of Human Services, October 2019 through December 2019. Chief Operating Officer, Twin Cities Habitat for Humanity from 2017 to 2019. Vice President of University Services, University of Minnesota from 2012 to 2016. Prior thereto, on the Board of Directors, Governance Committee and Finance Committee for the Minnesota Philanthropy Partners (Saint Paul Foundation) from 2012 to 2018, Interim Chief Executive Officer of Blue Cross Blue Shield of Minnesota from 2011 to 2012, Chairman of the Board from 2009 to 2012 and Board Director from 2003 to 2015. Vice President, Leadership and Community Engagement, Bush Foundation, Saint Paul, Minnesota (a private foundation) from 2009 to 2011. Executive Vice President and Chief Financial Officer, Minnesota Sports and Entertainment from 2004 to 2009 and Senior Vice President from 2002 to 2004. Executive Vice President of the Minnesota Wild Foundation from 2004 to 2008. Commissioner of Finance, State of Minnesota, from 1999 to 2002. Currently Board Chair of the Minnesota Wild Foundation since 2010. | | N/A |
| * | Length of service dates reflect the Trustee’s commencement of service with the Trust’s predecessor entities, where applicable. |
Wells Fargo Precious Metals Fund | 25
Other information (unaudited)
Officers
| | | | |
Name and year of birth | | Position held and
length of service | | Principal occupations during past five years or longer |
| | |
Andrew Owen (Born 1960) | | President, since 2017 | | Executive Vice President of Wells Fargo & Company and Head of Affiliated Managers, Wells Fargo Asset Management, since 2014. In addition, Mr. Owen is currently President, Chief Executive Officer and Director of Wells Fargo Funds Management, LLC since 2017. Prior thereto, Executive Vice President responsible for marketing, investments and product development for Wells Fargo Funds Management, LLC, from 2009 to 2014. |
| | |
Nancy Wiser1 (Born 1967) | | Treasurer, since 2012 | | Executive Vice President of Wells Fargo Funds Management, LLC since 2011. Chief Operating Officer and Chief Compliance Officer at LightBox Capital Management LLC, from 2008 to 2011. |
| | |
Michelle Rhee (Born 1966) | | Chief Legal Officer, since 2019 | | Secretary of Wells Fargo Funds Management, LLC, Chief Legal Counsel of Wells Fargo Asset Management and Assistant General Counsel of Wells Fargo Bank, N.A. since 2018. Associate General Counsel and Managing Director of Bank of America Corporation from 2004 to 2018. |
| | |
Catherine Kennedy (Born 1969) | | Secretary, since 2019 | | Vice President of Wells Fargo Funds Management, LLC and Senior Counsel of the Wells Fargo Legal Department since 2010. Vice President and Senior Counsel of Evergreen Investment Management Company, LLC from 1998 to 2010. |
| | |
Michael H. Whitaker (Born 1967) | | Chief Compliance Officer, since 2016 | | Chief Compliance Officer of Wells Fargo Asset Management since 2016. Senior Vice President and Chief Compliance Officer for Fidelity Investments from 2007 to 2016. |
| | |
Jeremy DePalma1 (Born 1974) | | Assistant Treasurer, since 2009 | | Senior Vice President of Wells Fargo Funds Management, LLC since 2009. Senior Vice President of Evergreen Investment Management Company, LLC from 2008 to 2010 and head of the Fund Reporting and Control Team within Fund Administration from 2005 to 2010. |
| 1 | Nancy Wiser acts as Treasurer of 65 funds in the Fund Complex. Jeremy DePalma acts as the Treasurer of 77 funds and Assistant Treasurer of 65 funds in the Fund Complex. |
| 2 | The Statement of Additional Information includes additional information about the Trustees and is available, without charge, upon request, by calling 1-800-222-8222 or by visiting the website at wfam.com. |
26 | Wells Fargo Precious Metals Fund
Other information (unaudited)
BOARD CONSIDERATION OF INVESTMENT MANAGEMENT AND SUB-ADVISORY AGREEMENTS:
Wells Fargo Precious Metals Fund
Under the Investment Company Act of 1940 (the “1940 Act”), the Board of Trustees (the “Board”) of Wells Fargo Funds Trust (the “Trust”) must determine annually whether to approve the continuation of the Trust’s investment management and sub-advisory agreements. In this regard, at a Board meeting held on May 26, 2020 and May 28, 2020 (together, the “Meeting”), the Board, all the members of which have no direct or indirect interest in the investment management and sub-advisory agreements and are not “interested persons” of the Trust, as defined in the 1940 Act (the “Independent Trustees”), reviewed and approved for Wells Fargo Precious Metals Fund (the “Fund”): (i) an investment management agreement (the “Management Agreement”) with Wells Fargo Funds Management, LLC (“Funds Management”); and (ii) an investment sub-advisory agreement (the “Sub-Advisory Agreement”) with Wells Capital Management Incorporated (the “Sub-Adviser”), an affiliate of Funds Management. The Management Agreement and the Sub-Advisory Agreement are collectively referred to as the “Advisory Agreements.”
At the Meeting, the Board considered the factors and reached the conclusions described below relating to the selection of Funds Management and the Sub-Adviser and the approval of the Advisory Agreements. Prior to the Meeting, including at a Board meeting held in April 2020, the Trustees conferred extensively among themselves and with representatives of Funds Management about these matters. Also, the Board has adopted a team-based approach, with each team consisting of a sub-set of Trustees, to assist the full Board in the discharge of its duties in reviewing investment performance and other matters throughout the year. The Independent Trustees were assisted in their evaluation of the Advisory Agreements by independent legal counsel, from whom they received separate legal advice and with whom they met separately.
In providing information to the Board, Funds Management and the Sub-Adviser were guided by a detailed set of requests for information submitted to them by independent legal counsel on behalf of the Independent Trustees at the start of the Board’s annual contract renewal process earlier in 2020. In considering and approving the Advisory Agreements, the Trustees considered the information they believed relevant, including but not limited to the information discussed below. The Board considered not only the specific information presented in connection with the Meeting, but also the knowledge gained over time through interaction with Funds Management and the Sub-Adviser about various topics. In this regard, the Board reviewed reports of Funds Management at each of its quarterly meetings, which included, among other things, portfolio reviews and investment performance reports. In addition, the Board and the teams mentioned above confer with portfolio managers at various times throughout the year. The Board did not identify any particular information or consideration that was all-important or controlling, and each individual Trustee may have attributed different weights to various factors.
After its deliberations, the Board unanimously approved the continuation of the Advisory Agreements for a one-year term and determined that the compensation payable to Funds Management and the Sub-Adviser under each of the Advisory Agreements was reasonable. The Board considered the approval of the Advisory Agreements for the Fund as part of its consideration of agreements for funds across the complex, but its approvals were made on a fund-by-fund basis. The following summarizes a number of important, but not necessarily all, factors considered by the Board in support of its approvals.
Nature, extent and quality of services
The Board received and considered various information regarding the nature, extent and quality of services provided to the Fund by Funds Management and the Sub-Adviser under the Advisory Agreements. This information included a description of the investment advisory services and Fund-level administrative services covered by the Management Agreement, as well as, among other things, a summary of the background and experience of senior management of Wells Fargo Asset Management (“WFAM”), of which Funds Management and the Sub-Adviser are a part, and a summary of investments made in the business of WFAM. The Board also received a description of Funds Management’s and the Sub-Adviser’s business continuity plans and of their approaches to data privacy and cybersecurity, and related testing. The Board also received and reviewed information about Funds Management’s role as administrator of the Fund’s liquidity risk management program, Funds Management’s approach to risk management, and Funds Management’s intermediary and vendor oversight program.
The Board also considered the qualifications, background, tenure and responsibilities of each of the portfolio managers primarily responsible for the day-to-day portfolio management of the Fund. The Board evaluated the ability of Funds Management and the Sub-Adviser to attract and retain qualified investment professionals, including research, advisory and supervisory personnel. The Board further considered the compliance programs and compliance records of Funds Management and the Sub-Adviser. In addition, the Board took into account the full range of services provided to the Fund by Funds Management and its affiliates.
Wells Fargo Precious Metals Fund | 27
Other information (unaudited)
Fund investment performance and expenses
The Board considered the investment performance results for the Fund over various time periods ended December 31, 2019. The Board also considered more current results for various time periods ended March 31, 2020. The Board considered these results in comparison to the investment performance of funds in a universe that was determined by Broadridge Inc. (“Broadridge”) to be similar to the Fund (the “Universe”), and in comparison to the Fund’s benchmark index and to other comparative data. Broadridge is an independent provider of investment company data. The Board received a description of the methodology used by Broadridge to select the mutual funds in the performance Universe. The Board noted that the investment performance of the Fund (Class A) was higher than the average investment performance of the Universe for the one-, three- and ten-year periods ended December 31, 2019, and lower than the average investment performance of the Universe for the five-year period ended December 31, 2019. The Board also noted that the investment performance of the Fund (Administrator Class) was higher than the average investment performance of the Universe for all periods ended March 31, 2020. The Board also noted that the investment performance of the Fund was lower than its benchmark index, the FTSE Gold Mines Index, for the one-, three- and five-year periods ended December 31, 2019, and higher than its benchmark for the ten-year period ended December 31, 2019. The Board also noted that the investment performance of the Fund was lower than its benchmark index, the FTSE Gold Mines Index, for the one-, three- and five-year periods ended March 31, 2020, and higher than the average investment performance of the Universe for the ten-year period ended March 31, 2020.
The Board also received and considered information regarding the Fund’s net operating expense ratios and their various components, including actual management fees, custodian and other non-management fees, and Rule 12b-1 and non-Rule 12b-1 shareholder service fees. The Board considered these ratios in comparison to the median ratios of funds in class-specific expense groups that were determined by Broadridge to be similar to the Fund (the “Groups”). The Board received a description of the methodology used by Broadridge to select the mutual funds in the expense Groups and an explanation of how funds comprising expense groups and their expense ratios may vary from year-to-year. Based on the Broadridge reports, the Board noted that the net operating expense ratios of the Fund were lower than the median net operating expense ratios of the expense Groups for each share class.
The Board took into account the Fund’s investment performance and expense information provided to it among the factors considered in deciding to re-approve the Advisory Agreements.
Investment management and sub-advisory fee rates
The Board reviewed and considered the contractual fee rates payable by the Fund to Funds Management under the Management Agreement, as well as the contractual fee rates payable by the Fund to Funds Management for class-level administrative services under a Class-Level Administration Agreement, which include, among other things, class-level transfer agency and sub-transfer agency costs (collectively, the “Management Rates”). The Board also reviewed and considered the contractual investment sub-advisory fee rates that are payable by Funds Management to the Sub-Adviser for investment sub-advisory services.
Among other information reviewed by the Board was a comparison of the Fund’s Management Rates with the average contractual investment management fee rates of funds in the expense Groups at a common asset level as well as transfer agency costs of the funds in the expense Groups. The Board noted that the Management Rates of the Fund were lower than the sum of these average rates for the Fund’s expense Groups for all share classes.
The Board also received and considered information about the portion of the total management fee that was retained by Funds Management after payment of the fee to the Sub-Adviser for sub-advisory services. In assessing the reasonableness of this amount, the Board received and evaluated information about the nature and extent of responsibilities retained and risks assumed by Funds Management and not delegated to or assumed by the Sub-Adviser, and about Funds Management’s on-going oversight services. Given the affiliation between Funds Management and the Sub-Adviser, the Board ascribed limited relevance to the allocation of fees between them.
The Board also received and considered information about the nature and extent of services offered and fee rates charged by Funds Management and the Sub-Adviser to other types of clients with investment strategies similar to those of the Fund. In this regard, the Board received information about the significantly greater scope of services, and compliance, reporting and other legal burdens and risks of managing proprietary mutual funds compared with those associated with managing assets of other types of clients, including third-party sub-advised fund clients and non-mutual fund clients such as institutional separate accounts.
Based on its consideration of the factors and information it deemed relevant, including those described here, the Board determined that the compensation payable to Funds Management under the Management Agreement and to the Sub-Adviser under the Sub-Advisory Agreement was reasonable.
28 | Wells Fargo Precious Metals Fund
Other information (unaudited)
Profitability
The Board received and considered information concerning the profitability of Funds Management, as well as the profitability of both WFAM and Wells Fargo & Co. (“Wells Fargo”) from providing services to the fund family as a whole. The Board noted that the Sub-Adviser’s profitability information with respect to providing services to the Fund and other funds in the family was subsumed in the WFAM and Wells Fargo profitability analysis.
Funds Management reported on the methodologies and estimates used in calculating profitability, including a description of the methodology used to allocate certain expenses. Among other things, the Board noted that the levels of profitability reported on a fund-by-fund basis varied widely, depending on factors such as the size, type and age of fund.
Based on its review, the Board did not deem the profits reported by Funds Management, WFAM or Wells Fargo from services provided to the Fund to be at a level that would prevent it from approving the continuation of the Advisory Agreements.
Economies of scale
The Board received and considered information about the potential for Funds Management to experience economies of scale in the provision of management services to the Fund, the difficulties of calculating economies of scale at an individual fund level, and the extent to which potential scale benefits are shared with shareholders. The Board noted the existence of breakpoints in the Fund’s management fee structure, which operate generally to reduce the Fund’s expense ratios as the Fund grows in size, and the size of the Fund in relation to such breakpoints. The Board considered that in addition to management fee breakpoints, Funds Management shares potential economies of scale from its management business in a variety of ways, including through fee waiver and expense reimbursement arrangements, services that benefit shareholders, competitive management fee rates set at the outset without regard to breakpoints, and investments in the business intended to enhance services available to shareholders.
The Board concluded that Funds Management’s arrangements with respect to the Fund, including contractual breakpoints, constituted a reasonable approach to sharing potential economies of scale with the Fund and its shareholders.
Other benefits to Funds Management and the Sub-Adviser
The Board received and considered information regarding potential “fall-out” or ancillary benefits received by Funds Management and its affiliates, including the Sub-Adviser, as a result of their relationships with the Fund. Ancillary benefits could include, among others, benefits directly attributable to other relationships with the Fund and benefits potentially derived from an increase in Funds Management’s and the Sub-Adviser’s business as a result of their relationships with the Fund. The Board noted that various affiliates of Funds Management may receive distribution-related fees, shareholder servicing payments and sub-transfer agency fees in respect of shares sold or held through them and services provided.
The Board also reviewed information about soft dollar credits earned and utilized by the Sub-Adviser, fees earned by Funds Management and the Sub-Adviser from managing a private investment vehicle for the fund family’s securities lending collateral, and commissions earned by an affiliated broker from portfolio transactions.
Based on its consideration of the factors and information it deemed relevant, including those described here, the Board did not find that any ancillary benefits received by Funds Management and its affiliates, including the Sub-Adviser, were unreasonable.
Conclusion
At the Meeting, after considering the above-described factors and based on its deliberations and its evaluation of the information described above, the Board unanimously approved the continuation of the Advisory Agreements for a one-year term and determined that the compensation payable to Funds Management and the Sub-Adviser under each of the Advisory Agreements was reasonable.
Wells Fargo Precious Metals Fund | 29
Other information (unaudited)
LIQUIDITY RISK MANAGEMENT PROGRAM
In accordance with Rule 22e-4 under the Investment Company Act of 1940, as amended (the “Liquidity Rule”), Wells Fargo Funds Trust (the “Trust”) has adopted and implemented a liquidity risk management program (the “Program”) on behalf of each of its series, including the Fund, which is reasonably designed to assess and manage the Fund’s liquidity risk. “Liquidity risk” is defined as the risk that the Fund is unable to meet redemption requests without significantly diluting remaining investors’ interests in the Fund. The Trust’s Board of Trustees (the “Board”) previously approved the designation of Wells Fargo Funds Management, LLC (“Funds Management”), the Fund’s investment manager, as the administrator of the Program, and Funds Management has established a Liquidity Risk Management Council composed of personnel from multiple departments within Funds Management and its affiliates to assist Funds Management in the implementation and on-going administration of the Program.
The Program is comprised of various components designed to support the assessment and/or management of liquidity risk, including: (1) the periodic assessment (no less frequently than annually) of certain factors that influence the Fund’s liquidity risk; (2) the periodic classification (no less frequently than monthly) of the Fund’s investments into one of four liquidity categories that reflect an estimate of their liquidity under current market conditions; (3) a 15% limit on the acquisition of “illiquid investments” (as defined under the Liquidity Rule); (4) to the extent the Fund does not invest primarily in “highly liquid investments” (as defined under the Liquidity Rule), the determination of a minimum percentage of the Fund’s assets that generally will be invested in highly liquid investments (an “HLIM”); (5) if the Fund has established an HLIM, the periodic review (no less frequently than annually) of the HLIM and the adoption of policies and procedures for responding to a shortfall of the Fund’s “highly liquid investments” below its HLIM; and (6) periodic reporting to the Board.
At a meeting of the Board held on May 26 and 28, 2020, the Board received a written report (the “Report”) from Funds Management that addressed the operation of the Program and assessed its adequacy and effectiveness of implementation. The Report covered the initial period from December 1, 2018 through December 31, 2019 (the “Reporting Period”). No significant liquidity events impacting the Fund were noted in the Report. There were no material changes to the Program during the Reporting Period. The Report concluded that the Program is operating effectively to assess and manage the Fund’s liquidity risk, and that the Program has been and continues to be adequately and effectively implemented to monitor and, as applicable, respond to the Fund’s liquidity developments.
There can be no assurance that the Program will achieve its objectives under all circumstances in the future. Please refer to the Fund’s prospectus for more information regarding the Fund’s exposure to liquidity risk and other risks to which an investment in the Fund may be subject.
30 | Wells Fargo Precious Metals Fund
Appendix I (unaudited)
Effective June 1, 2020, shareholders purchasing Fund shares through an Oppenheimer & Co. Inc. (“Oppenheimer”) platform or account are eligible only for the following load waivers (front-end sales charge waivers and contingent deferred or back-end, sales charge waivers) and discounts, which may differ from those disclosed in the Fund’s Prospectus or SAI.
|
|
| Front-end Sales Load Waivers on Class A Shares available at Oppenheimer |
|
| Employer-sponsored retirement, deferred compensation and employee benefit plans (including health savings accounts) and trusts used to fund those plans, provided that the shares are not held in a commission-based brokerage account and shares are held for the benefit of the plan. |
|
| Shares purchased by or through a 529 Plan. |
|
| Shares purchased through an Oppenheimer affiliated investment advisory program. |
|
| Shares purchased through reinvestment of capital gains distributions and dividend reinvestment when purchasing shares of the same fund (but not any other fund within the fund family). |
|
| Shares purchased from the proceeds of redemptions within the same fund family, provided (1) the repurchase occurs within 90 days following the redemption, (2) the redemption and purchase occur in the same account, and (3) redeemed shares were subject to a front-end or deferred sales load (known as Rights of Restatement). |
|
| A shareholder in the Fund’s Class C shares will have their shares exchanged at net asset value to Class A shares (or the appropriate share class) of the Fund if the shares are no longer subject to a CDSC and the exchange is in line with the policies and procedures of Oppenheimer. |
|
| Employees and registered representatives of Oppenheimer or its affiliates and their family members. |
|
| Directors or Trustees of the Fund, and employees of the Fund’s investment adviser or any of its affiliates, as described in the Prospectus. |
|
| CDSC Waivers on A and C Shares available at Oppenheimer |
|
| Death or disability of the shareholder. |
|
| Shares sold as part of a systematic withdrawal plan as described in the Prospectus. |
|
| Return of excess contributions from an IRA Account. |
|
| Shares sold as part of a required minimum distribution for IRA and retirement accounts due to the shareholder reaching the qualified age based on applicable IRS regulations as described in the Prospectus. |
|
| Shares sold to pay Oppenheimer fees but only if the transaction is initiated by Oppenheimer. |
|
| Shares acquired through a right of reinstatement. |
|
| Front-end load Discounts Available at Oppenheimer: Breakpoints, Rights of Accumulation & Letters of Intent |
|
| Breakpoints as described in the Prospectus. |
|
| Rights of Accumulation (ROA), which entitle shareholders to breakpoint discounts, will be automatically calculated based on the aggregated holding of fund family assets held by accounts within the purchaser’s household at Oppenheimer. Eligible fund family assets not held at Oppenheimer may be included in the ROA calculation only if the shareholder notifies his or her financial advisor about such assets. |
Wells Fargo Precious Metals Fund | 31
Appendix II (unaudited)
Effective June 15, 2020, shareholders purchasing fund shares through a Robert W. Baird & Co. (“Baird”) platform or account will only be eligible for the following sales charge waivers (front-end sales charge waivers and CDSC waivers) and discounts, which may differ from those disclosed elsewhere in the Fund’s Prospectus or the SAI.
|
|
| Front-end Sales Load Waivers on Class A Shares available at Baird |
|
| Shares purchased through reinvestment of capital gains distributions and dividend reinvestment when purchasing share of the same fund. |
|
| Share purchase by employees and registers representatives of Baird or its affiliate and their family members as designated by Baird. |
|
| Shares purchase from the proceeds of redemptions within the same fund family, provided (1) the repurchase occurs within 90 days following the redemption, (2) the redemption and purchase occur in the same accounts, and (3) redeemed shares were subject to a front-end or deferred sales charge (known as rights of reinstatement). |
|
| A shareholder in the Funds Investor C Shares will have their share exchanged at net asset value to Investor A shares of the fund if the shares are no longer subject to CDSC and the exchange is in line with the policies and procedures of Baird. |
|
| Employer-sponsored retirement plans or charitable accounts in a transactional brokerage account at Baird, including 401(k)plans, 457 plans, employer-sponsored 403(b) plans, profit sharing and money purchase pension plans and defined benefit plans. For purposes of this provision, employer-sponsored retirement plans do not include SEP IRAs, Simple IRAs or SAR-SEPs. |
|
| CDSC Waivers on A and C Shares available at Baird |
|
| Shares sold due to death or disability of the shareholder. |
|
| Shares sold as part of a systematic withdrawal plan as described in the Fund’s Prospectus. |
|
| Shares bought due to returns of excess contributions from an IRA Account. |
|
| Shares sold as part of a required minimum distribution for IRA and retirement accounts due to the shareholder reaching age 72 as described in the Fund’s Prospectus. |
|
| Shares sold to pay Baird fees but only if the transaction is initiated by Baird. |
|
| Shares acquired through a right of reinstatement. |
|
| Front-end load Discounts Available at Baird: Breakpoint and/or Rights of Accumulation |
|
| Breakpoints as described in the Prospectus. |
|
| Rights of accumulations which entitles shareholders to breakpoint discounts will be automatically calculated based on the aggregated holding of fund family assets held by accounts within the purchaser’s household at Baird. Eligible fund family assets not held at Baird may be included in the rights of accumulations calculation only if the shareholder notifies his or her financial advisor about such assets. |
|
| Letters of Intent (LOI) allow for breakpoint discounts based on anticipated purchases within a fund family through Baird, over a 13-month period of time. |
32 | Wells Fargo Precious Metals Fund

For more information
More information about Wells Fargo Funds is available free upon request. To obtain literature, please write, visit the Fund’s website, or call:
Wells Fargo Funds
P.O. Box 219967
Kansas City, MO 64121-9967
Website: wfam.com
Individual investors: 1-800-222-8222
Retail investment professionals: 1-888-877-9275
Institutional investment professionals: 1-866-765-0778

This report and the financial statements contained herein are submitted for the general information of the shareholders of the Fund. If this report is used for promotional purposes, distribution of the report must be accompanied or preceded by a current prospectus. Before investing, please consider the investment objectives, risks, charges, and expenses of the investment. For a current prospectus and, if available, a summary prospectus, containing this information, call 1-800-222-8222 or visit the Fund’s website at wfam.com. Read the prospectus carefully before you invest or send money.
Wells Fargo Asset Management (WFAM) is the trade name for certain investment advisory/management firms owned by Wells Fargo & Company. These firms include but are not limited to Wells Capital Management Incorporated and Wells Fargo Funds Management, LLC. Certain products managed by WFAM entities are distributed by Wells Fargo Funds Distributor, LLC (a broker-dealer and Member FINRA).
This material is for general informational and educational purposes only and is NOT intended to provide investment advice or a recommendation of any kind—including a recommendation for any specific investment, strategy, or plan.
INVESTMENT PRODUCTS: NOT FDIC INSURED ◾ NO BANK GUARANTEE ◾ MAY LOSE VALUE
© 2020 Wells Fargo & Company. All rights reserved.
PAR-1020-00581 11-20
SA316/SAR316 09-20
Semi-Annual Report
September 30, 2020
Wells Fargo
Utility and Telecommunications Fund
Beginning on January 1, 2021, as permitted by new regulations adopted by the Securities and Exchange Commission, paper copies of the Wells Fargo Funds’ annual and semi-annual shareholder reports issued after this date will no longer be sent by mail, unless you specifically request paper copies of the reports. Instead, the reports will be made available on the Funds’ website, and you will be notified by mail each time a report is posted and provided with a website address to access the report.
If you already elected to receive shareholder reports electronically, you will not be affected by this change and you need not take any action. You may elect to receive shareholder reports and other communications from the Fund electronically at any time by contacting your financial intermediary (such as a broker-dealer or bank) or, if you are a direct investor, by calling 1-800-222-8222 or by enrolling at wellsfargo.com/advantagedelivery.
You may elect to receive all future reports in paper free of charge. If you invest through a financial intermediary, you can contact your financial intermediary to request that you continue to receive paper copies of your shareholder reports; if you invest directly with the Fund, you can call 1-800-222-8222. Your election to receive reports in paper will apply to all Wells Fargo Funds held in your account with your financial intermediary or, if you are a direct investor, to all Wells Fargo Funds that you hold.
|
|
|
Reduce clutter. Save trees. |
Sign up for electronic delivery of prospectuses and shareholder reports at wellsfargo.com/
advantagedelivery |
The views expressed and any forward-looking statements are as of September 30, 2020, unless otherwise noted, and are those of the Fund’s portfolio managers and/or Wells Fargo Asset Management. Discussions of individual securities, or the markets generally, or any Wells Fargo Fund are not intended as individual recommendations. Future events or results may vary significantly from those expressed in any forward-looking statements. The views expressed are subject to change at any time in response to changing circumstances in the market. Wells Fargo Asset Management and the Fund disclaim any obligation to publicly update or revise any views expressed or forward-looking statements.
INVESTMENT PRODUCTS: NOT FDIC INSURED ◾ NO BANK GUARANTEE ◾ MAY LOSE VALUE
Wells Fargo Utility and Telecommunications Fund | 1
Letter to shareholders (unaudited)

Andrew Owen
President
Wells Fargo Funds
“As the six-month period began in April, markets rebounded strongly from an earlier sharp sell-off, fueled by unprecedented government and central bank stimulus measures.”
Dear Shareholder:
We are pleased to offer you this semi-annual report for the Wells Fargo Utility and Telecommunications Fund for the six-month period that ended September 30, 2020. Global stock markets experienced unprecedented volatility in response to drastic government measures to stop the spread of COVID-19 at the expense of short-term economic output. However, financial markets rebounded from April on to more than offset earlier losses as central banks bolstered capital markets and confidence. Stocks rallied broadly with U.S. equities leading the way while bonds had more modest returns for the six-month period.
For the period, U.S. stocks, based on the S&P 500 Index,1 returned 31.31% and international stocks, as measured by the MSCI ACWI ex USA Index (Net),2 gained 23.38%. The MSCI EM Index (Net)3 gained a robust 29.37%. Among bond investments, the Bloomberg Barclays U.S. Aggregate Bond Index4 added 3.53%, the Bloomberg Barclays Global Aggregate ex-USD Index5 returned 7.66%, the Bloomberg Barclays Municipal Bond Index6 had a 3.99% return, and the ICE BofA U.S. High Yield Index7 gained 14.76%.
Concerns about COVID-19 took over the market.
As the six-month period began in April, markets rebounded strongly from an earlier sharp sell-off, fueled by unprecedented government and central bank stimulus measures. The U.S. economy contracted by an annualized 5.0% pace in the first quarter, with 30 million new unemployment insurance claims in six weeks. In the eurozone, first-quarter real gross domestic product (GDP) shrank 3.8%, with the composite April Flash Purchasing Managers’ Index (PMI), a monthly survey of purchasing managers, falling to an all-time low of 13.5. The European Central Bank expanded its quantitative easing to include the purchase of additional government bonds of countries with the greatest virus-related need, including Italy and Spain. China’s first-quarter GDP fell by 6.8% year over year. However, retail sales, production, and investment showed signs of recovery. Extreme oil-price volatility continued as global supply far exceeded demand.
The equity market rebound continued in May, with widespread strong monthly gains. Investors regained confidence on reports of early signs of success in human trials of a COVID-19 vaccine. Growth stocks continued to outperform value stocks while returns on global government bonds were generally flat. In the U.S., a gap grew between the stock market rebound and devastating economic data points, including an April unemployment rate of 14.7%, the highest level since World War II. PMIs continued to reflect weakening activity in May in both the manufacturing and services sectors. U.S.
| 1 | The S&P 500 Index consists of 500 stocks chosen for market size, liquidity, and industry group representation. It is a market-value-weighted index with each stock’s weight in the index proportionate to its market value. You cannot invest directly in an index. |
| 2 | The Morgan Stanley Capital International (MSCI) All Country World Index (ACWI) ex USA Index (Net) is a free-float-adjusted market-capitalization-weighted index that is designed to measure the equity market performance of developed and emerging markets, excluding the United States. Source: MSCI. MSCI makes no express or implied warranties or representations and shall have no liability whatsoever with respect to any MSCI data contained herein. The MSCI data may not be further redistributed or used as a basis for other indices or any securities or financial products. This report is not approved, reviewed, or produced by MSCI. You cannot invest directly in an index. |
| 3 | The MSCI Emerging Markets (EM) Index (Net) is a free-float-adjusted market-capitalization-weighted index that is designed to measure equity market performance of emerging markets. You cannot invest directly in an index. |
| 4 | The Bloomberg Barclays U.S. Aggregate Bond Index is a broad-based benchmark that measures the investment-grade, U.S. dollar-denominated, fixed-rate taxable bond market, including Treasuries, government-related and corporate securities, mortgage-backed securities (agency fixed-rate and hybrid adjustable-rate mortgage pass-throughs), asset-backed securities, and commercial mortgage-backed securities. You cannot invest directly in an index. |
| 5 | The Bloomberg Barclays Global Aggregate ex-USD Index is an unmanaged index that provides a broad-based measure of the global investment-grade fixed-income markets excluding the U.S. dollar-denominated debt market. You cannot invest directly in an index. |
| 6 | The Bloomberg Barclays Municipal Bond Index is an unmanaged index composed of long-term tax-exempt bonds with a minimum credit rating of Baa. You cannot invest directly in an index. |
| 7 | The ICE BofA U.S. High Yield Index is a market-capitalization-weighted index of domestic and Yankee high-yield bonds. The index tracks the performance of high-yield securities traded in the U.S. bond market. You cannot invest directly in an index. Copyright 2020. ICE Data Indices, LLC. All rights reserved. |
2 | Wells Fargo Utility and Telecommunications Fund
Letter to shareholders (unaudited)
corporate earnings reports indicated a 14% year-over-year contraction in earnings from the first quarter of 2019. However, high demand for technology, driven by remote activity, helped maintain robust information technology sector earnings, which helped drive leading technology stocks higher.
Financial markets posted widely positive returns in June despite ongoing economic weakness and high levels of uncertainty on the containment of COVID-19 and the timing of an effective vaccine. There were hopeful signs as economies reopened, with U.S. and U.K. retail sales rebounding sharply in May. However, year over year, sales remained depressed. Vitally important to market sentiment was the ongoing commitment by central banks globally to do all they could to provide economic support through liquidity and low borrowing costs. U.S. economic activity was aided by one-time $1,200 stimulus checks and $600 bonus weekly unemployment benefits that expired at the end of July. However, unemployment remained historically high but eased from 14.7% in April to 11.1% in June. At month-end, numerous states reported increases in COVID-19 cases. China’s economic recovery picked up momentum in June, though it remained far from a full recovery.
July was a broadly positive month for both global equities and fixed income. However, economic data and a resurgence of COVID-19 cases pointed to the vulnerability of the global economy and the ongoing imperative to regain control of the pandemic. Second-quarter GDP shrank from the previous quarter by 9.5% and 12.1% in the U.S. and the eurozone, respectively. In contrast, China reported a 3.2% year-over-year expansion in its second-quarter GDP. U.S. unemployment remained high despite adding 1.8 million jobs in July, with a double-digit jobless rate persisting. However, manufacturing activity grew in both the U.S. and the eurozone. In Asia, while China’s manufacturing sector continued to expand, activity in Japan and South Korea contracted. In July, a rising concern was the rapid and broad reemergence of COVID-19 infections.
The stock market continued to rally in August despite concerns over rising numbers of COVID-19 cases in the United States and several European countries, including France and Spain, as well as the expiration of the $600 weekly bonus unemployment benefit at the end of July. U.S. stocks had strong monthly gains, led by the FAANG stocks—Facebook, Apple, Amazon, Netflix, and Google (Alphabet)—which dominate these indices and continued to rally. U.S. stocks generally surpassed other broadly positive global equity performance while fixed-income market monthly returns were broadly flat. Generally stronger-than-expected second-quarter earnings boosted investor sentiment along with the U.S. Federal Reserve’s announcement of a policy shift that will likely lead to longer-term low interest rates and supportive monetary policy. The U.S. flash PMIs for both manufacturing and services beat expectations while U.S. housing market indicators were strong. In Europe, retail sales expanded and consumer confidence remained steady. Overall, developed markets performed better than emerging market equities for the month of August as people took comfort in better-known equities in perceived safer markets.
Stocks grew more volatile in September on mixed economic data. U.S. PMIs showed solid growth in economic activity in both manufacturing and services. However, six months after the bottom fell out of the labor market in the early spring, only half of the 22 million jobs lost had returned. The U.S. unemployment rate fell to 7.9% in September, the fifth straight month of improvement but far higher than the 3.5% pre-COVID-19 rate. Only 661,000 jobs were added for the month, down from 1.5 million in August. Meanwhile, a reported 2.3 million people have given up looking for work. With U.S. Congress failing to pass further fiscal relief and uncertainties surrounding a possible vaccine, doubts crept back into the financial markets. In the U.K., a lack of progress in Brexit talks with the European Union weighed on markets. China’s economy picked up steam, however, with growth fueled by increased global demand and China’s service sector had its strongest PMI reading in seven years.
“The stock market continued to rally in August despite concerns over rising numbers of COVID-19 cases in the United States and several European countries, including France and Spain, as well as the expiration of the $600 weekly bonus unemployment benefit at the end of July.”
Wells Fargo Utility and Telecommunications Fund | 3
Letter to shareholders (unaudited)
|
|
|
For further information about your Fund, contact your investment professional, visit our website at wfam.com, or call us directly at 1-800-222-8222. |
Don’t let short-term uncertainty derail long-term investment goals.
Periods of investment uncertainty can present challenges, but experience has taught us that maintaining long-term investment goals can be an effective way to plan for the future. To help you create a sound strategy based on your personal goals and risk tolerance, Wells Fargo Funds offers more than 100 mutual funds spanning a wide range of asset classes and investment styles. Although diversification cannot guarantee an investment profit or prevent losses, we believe it can be an effective way to manage investment risk and potentially smooth out overall portfolio performance. We encourage investors to know their investments and to understand that appropriate levels of risk-taking may unlock opportunities.
Thank you for choosing to invest with Wells Fargo Funds. We appreciate your confidence in us and remain committed to helping you meet your financial needs.
Sincerely,

Andrew Owen
President
Wells Fargo Funds
Notice to Shareholders
At a meeting held on August 10-12, 2020, the Board of Trustees of the Fund approved a change to the Fund’s automatic conversion feature for Class C shares in order to shorten the required holding period from 10 to 8 years. As a result, on a monthly basis beginning November 5, 2020, Class C shares will convert automatically into Class A shares 8 years after the initial date of purchase or, if you acquired your Class C shares through an exchange or conversion from another share class, 8 years after the date you acquired your Class C shares. When Class C shares that you acquired through a purchase or exchange convert, any other Class C shares that you purchased with reinvested dividends and distributions also will convert into Class A shares on a pro rata basis.
Please note that a shorter holding period may apply depending on your intermediary. Please see “Appendix A—Sales Charge Reductions and Waivers for Certain Intermediaries” in the Fund’s prospectus for further information.
4 | Wells Fargo Utility and Telecommunications Fund
This page is intentionally left blank.
Performance highlights (unaudited)
Investment objective
The Fund seeks total return, consisting of current income and capital appreciation.
Manager
Wells Fargo Funds Management, LLC
Subadviser
Wells Capital Management Incorporated
Portfolio managers
Kent Newcomb, CFA®‡
Jack Spudich, CFA®‡
Average annual total returns (%) as of September 30, 2020
| | | | | | | | | | | | | | | | | | | | | | | | | | | | | | | | | | |
| | | | |
| | | | | Including sales charge | | | Excluding sales charge | | | Expense ratios1 (%) | |
| | | | | | | | | |
| | | Inception date | | 1 year | | | 5 year | | | 10 year | | | 1 year | | | 5 year | | | 10 year | | | Gross | | | Net2 | |
| | | | | | | | | | |
| Class A (EVUAX) | | 1-4-1994 | | | -5.57 | | | | 9.43 | | | | 10.03 | | | | 0.19 | | | | 10.74 | | | | 10.68 | | | | 1.17 | | | | 1.05 | |
| | | | | | | | | | |
| Class C (EVUCX) | | 9-2-1994 | | | -1.57 | | | | 9.90 | | | | 9.86 | | | | -0.57 | | | | 9.90 | | | | 9.86 | | | | 1.92 | | | | 1.80 | |
| | | | | | | | | | |
| Administrator Class (EVUDX) | | 7-30-2010 | | | – | | | | – | | | | – | | | | 0.32 | | | | 10.94 | | | | 10.90 | | | | 1.09 | | | | 0.92 | |
| | | | | | | | | | |
| Institutional Class (EVUYX) | | 2-28-1994 | | | – | | | | – | | | | – | | | | 0.52 | | | | 11.13 | | | | 11.06 | | | | 0.84 | | | | 0.72 | |
| | | | | | | | | | |
| S&P 500 Utilities Index3 | | – | | | – | | | | – | | | | – | | | | -4.97 | | | | 10.33 | | | | 10.68 | | | | – | | | | – | |
| | | | | | | | | | |
| S&P 500 Index4 | | – | | | – | | | | – | | | | – | | | | 15.15 | | | | 14.15 | | | | 13.74 | | | | – | | | | – | |
Figures quoted represent past performance, which is no guarantee of future results, and do not reflect taxes that a shareholder may pay on an investment in a fund. Investment return and principal value of an investment will fluctuate so that an investor’s shares, when redeemed, may be worth more or less than their original cost. Performance shown without sales charges would be lower if sales charges were reflected. Current performance may be lower or higher than the performance data quoted, which assumes the reinvestment of dividends and capital gains. Current month-end performance is available on the Fund’s website, wfam.com.
While the S&P 500 Index is comprised of U.S. equity securities of companies diversified across ten sectors, the Fund’s holdings are concentrated primarily in utilities and telecommunication services stocks. Therefore, the performance of the S&P 500 Index is displayed only to show how the concentrated Fund performed compared with a diversified selection of U.S. equity securities.
Index returns do not include transaction costs associated with buying and selling securities, any mutual fund fees or expenses, or any taxes. It is not possible to invest directly in an index.
For Class A shares, the maximum front-end sales charge is 5.75%. For Class C shares, the maximum contingent deferred sales charge is 1.00%. Performance including a contingent deferred sales charge assumes the sales charge for the corresponding time period. Administrator Class and Institutional Class shares are sold without a front-end sales charge or contingent deferred sales charge.
Stock values fluctuate in response to the activities of individual companies and general market and economic conditions. Bond values fluctuate in response to the financial condition of individual issuers, general market and economic conditions, and changes in interest rates. Changes in market conditions and government policies may lead to periods of heightened volatility in the bond market and reduced liquidity for certain bonds held by the Fund. In general, when interest rates rise, bond values fall and investors may lose principal value. Interest rate changes and their impact on the Fund and its share price can be sudden and unpredictable. The use of derivatives may reduce returns and/or increase volatility. Funds that concentrate their investments in limited sectors, such as utilities and telecommunication services, are more vulnerable to adverse market, economic, regulatory, political, or other developments affecting those sectors. Certain investment strategies tend to increase the total risk of an investment (relative to the broader market). The Fund is exposed to convertible securities risk, foreign investment risk, highyield securities risk, smaller-company securities risk, and non-diversification risk. Consult the Fund’s prospectus for additional information on these and other risks.
Please see footnotes on page 7.
6 | Wells Fargo Utility and Telecommunications Fund
Performance highlights (unaudited)
| | | | |
|
| Ten largest holdings (%) as of September 30, 20205 | |
| | |
NextEra Energy Incorporated | | | 11.35 | |
| | |
Visa Incorporated Class A | | | 5.90 | |
| | |
Eversource Energy | | | 5.77 | |
| | |
American Water Works Company Incorporated | | | 5.01 | |
| | |
Comcast Corporation Class A | | | 4.91 | |
| | |
Dominion Energy Incorporated | | | 4.42 | |
| | |
Sempra Energy | | | 4.08 | |
| | |
American Electric Power Company Incorporated | | | 4.01 | |
| | |
CMS Energy Corporation | | | 3.87 | |
| | |
Alliant Energy Corporation | | | 3.31 | |
|
|
| Industry allocation as of September 30, 20206 |
|
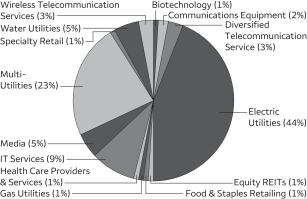 |
| ‡ | CFA® and Chartered Financial Analyst® are trademarks owned by CFA Institute. |
| 1 | Reflects the expense ratios as stated in the most recent prospectuses. The expense ratios shown are subject to change and may differ from the annualized expense ratios shown in the financial highlights of this report. |
| 2 | The manager has contractually committed through July 31, 2021, to waive fees and/or reimburse expenses to the extent necessary to cap total annual fund operating expenses after fee waivers at 1.05% for Class A, 1.80% for Class C, 0.92% for Administrator Class, and 0.72% for Institutional Class. Brokerage commissions, stamp duty fees, interest, taxes, acquired fund fees and expenses (if any), and extraordinary expenses are excluded from the expense caps. Prior to or after the commitment expiration date, the caps may be increased or the commitment to maintain the caps may be terminated only with the approval of the Board of Trustees. Without these caps, the Fund’s returns would have been lower. The expense ratio paid by an investor is the net expense ratio (the total annual fund operating expenses after fee waivers) as stated in the prospectuses. |
| 3 | The S&P 500 Utilities Index is a market-value-weighted index that measures the performance of all stocks within the utilities sector of the S&P 500 Index. You cannot invest directly in an index. |
| 4 | The S&P 500 Index consists of 500 stocks chosen for market size, liquidity, and industry group representation. It is a market-value-weighted index with each stock’s weight in the index proportionate to its market value. You cannot invest directly in an index. |
| 5 | The ten largest holdings, excluding cash, cash equivalents and any money market funds, are calculated based on the value of the investments divided by total net assets of the Fund. Holdings are subject to change and may have changed since the date specified. |
| 6 | Amounts are calculated based on the total long-term investments of the Fund. These amounts are subject to change and may have changed since the date specified. |
Wells Fargo Utility and Telecommunications Fund | 7
Fund expenses (unaudited)
As a shareholder of the Fund, you incur two types of costs: (1) transaction costs, including sales charges (loads) on purchase payments and contingent deferred sales charges (if any) on redemptions and (2) ongoing costs, including management fees, distribution (12b-1) and/or shareholder servicing fees, and other Fund expenses. This example is intended to help you understand your ongoing costs (in dollars) of investing in the Fund and to compare these costs with the ongoing costs of investing in other mutual funds.
The example is based on an investment of $1,000 invested at the beginning of the six-month period and held for the entire period from April 1, 2020 to September 30, 2020.
Actual expenses
The “Actual” line of the table below provides information about actual account values and actual expenses. You may use the information in this line, together with the amount you invested, to estimate the expenses that you paid over the period. Simply divide your account value by $1,000 (for example, an $8,600 account value divided by $1,000 = 8.6), then multiply the result by the number in the “Actual” line under the heading entitled “Expenses paid during period” for your applicable class of shares to estimate the expenses you paid on your account during this period.
Hypothetical example for comparison purposes
The “Hypothetical” line of the table below provides information about hypothetical account values and hypothetical expenses based on the Fund’s actual expense ratio and an assumed rate of return of 5% per year before expenses, which is not the Fund’s actual return. The hypothetical account values and expenses may not be used to estimate the actual ending account balance or expenses you paid for the period. You may use this information to compare the ongoing costs of investing in the Fund and other funds. To do so, compare this 5% hypothetical example with the 5% hypothetical examples that appear in the shareholder reports of the other funds.
Please note that the expenses shown in the table are meant to highlight your ongoing costs only and do not reflect any transactional costs, such as sales charges (loads) and contingent deferred sales charges. Therefore, the “Hypothetical” line of the table is useful in comparing ongoing costs only and will not help you determine the relative total costs of owning different funds. In addition, if these transactional costs were included, your costs would have been higher.
| | | | | | | | | | | | | | | | |
| | | Beginning
account value
4-1-2020 | | | Ending
account value
9-30-2020 | | | Expenses
paid during
the period1 | | | Annualized net
expense ratio | |
| | | | | |
Class A | | | | | | | | | | | | | | | | |
| | | | |
Actual | | $ | 1,000.00 | | | $ | 1,113.27 | | | $ | 5.51 | | | | 1.04 | % |
| | | | |
Hypothetical (5% return before expenses) | | $ | 1,000.00 | | | $ | 1,019.85 | | | $ | 5.27 | | | | 1.04 | % |
| | | | | |
Class C | | | | | | | | | | | | | | | | |
| | | | |
Actual | | $ | 1,000.00 | | | $ | 1,109.43 | | | $ | 9.52 | | | | 1.80 | % |
| | | | |
Hypothetical (5% return before expenses) | | $ | 1,000.00 | | | $ | 1,016.04 | | | $ | 9.10 | | | | 1.80 | % |
| | | | | |
Administrator Class | | | | | | | | | | | | | | | | |
| | | | |
Actual | | $ | 1,000.00 | | | $ | 1,114.31 | | | $ | 4.88 | | | | 0.92 | % |
| | | | |
Hypothetical (5% return before expenses) | | $ | 1,000.00 | | | $ | 1,020.46 | | | $ | 4.66 | | | | 0.92 | % |
| | | | | |
Institutional Class | | | | | | | | | | | | | | | | |
| | | | |
Actual | | $ | 1,000.00 | | | $ | 1,115.16 | | | $ | 3.82 | | | | 0.72 | % |
| | | | |
Hypothetical (5% return before expenses) | | $ | 1,000.00 | | | $ | 1,021.46 | | | $ | 3.65 | | | | 0.72 | % |
| 1 | Expenses paid is equal to the annualized net expense ratio of each class multiplied by the average account value over the period, multiplied by the number of days in the most recent fiscal half-year divided by the number of days in the fiscal year (to reflect the one-half-year period). |
8 | Wells Fargo Utility and Telecommunications Fund
Portfolio of investments—September 30, 2020 (unaudited)
| | | | | | | | | | | | | | | | |
| | | | | | | | | Shares | | | Value | |
| Common Stocks: 95.86% | |
|
Communication Services: 10.86% | |
|
| Diversified Telecommunication Services: 3.31% | |
Verizon Communications Incorporated | | | | | | | | | | | 235,998 | | | $ | 14,039,521 | |
| | | | | | | | | | | | | | | | |
|
| Media: 4.92% | |
Comcast Corporation Class A | | | | | | | | | | | 450,200 | | | | 20,826,252 | |
| | | | | | | | | | | | | | | | |
|
| Wireless Telecommunication Services: 2.63% | |
Shenandoah Telecommunications Company | | | | | | | | | | | 250,810 | | | | 11,144,742 | |
| | | | | | | | | | | | | | | | |
|
Consumer Discretionary: 0.62% | |
|
| Specialty Retail: 0.62% | |
The Home Depot Incorporated | | | | | | | | | | | 9,418 | | | | 2,615,473 | |
| | | | | | | | | | | | | | | | |
|
Consumer Staples: 0.54% | |
|
| Food & Staples Retailing: 0.54% | |
Walmart Incorporated | | | | | | | | | | | 16,335 | | | | 2,285,430 | |
| | | | | | | | | | | | | | | | |
|
Energy: 0.44% | |
|
| Oil, Gas & Consumable Fuels: 0.44% | |
Phillips 66 | | | | | | | | | | | 35,880 | | | | 1,860,019 | |
| | | | | | | | | | | | | | | | |
|
Financials: 0.46% | |
|
| Banks: 0.46% | |
JPMorgan Chase & Company | | | | | | | | | | | 20,461 | | | | 1,969,780 | |
| | | | | | | | | | | | | | | | |
|
Health Care: 1.15% | |
|
| Biotechnology: 0.57% | |
Amgen Incorporated | | | | | | | | | | | 9,458 | | | | 2,403,845 | |
| | | | | | | | | | | | | | | | |
|
| Health Care Providers & Services: 0.58% | |
UnitedHealth Group Incorporated | | | | | | | | | | | 7,915 | | | | 2,467,660 | |
| | | | | | | | | | | | | | | | |
|
Information Technology: 10.96% | |
|
| Communications Equipment: 2.22% | |
Cisco Systems Incorporated | | | | | | | | | | | 238,967 | | | | 9,412,910 | |
| | | | | | | | | | | | | | | | |
|
| IT Services: 8.74% | |
MasterCard Incorporated Class A | | | | | | | | | | | 35,630 | | | | 12,048,997 | |
Visa Incorporated Class A | | | | | | | | | | | 125,000 | | | | 24,996,250 | |
| | | | |
| | | | | | | | | | | | | | | 37,045,247 | |
| | | | | | | | | | | | | | | | |
|
Real Estate: 0.51% | |
|
| Equity REITs: 0.51% | |
American Tower Corporation | | | | | | | | | | | 8,961 | | | | 2,166,143 | |
| | | | | | | | | | | | | | | | |
|
Utilities: 70.32% | |
|
| Electric Utilities: 41.82% | |
Alliant Energy Corporation | | | | | | | | | | | 271,976 | | | | 14,047,559 | |
American Electric Power Company | | | | | | | | | | | 207,758 | | | | 16,980,061 | |
Duke Energy Corporation | | | | | | | | | | | 134,571 | | | | 11,917,608 | |
Edison International | | | | | | | | | | | 77,358 | | | | 3,932,881 | |
Entergy Corporation | | | | | | | | | | | 75,950 | | | | 7,483,354 | |
Eversource Energy | | | | | | | | | | | 292,607 | | | | 24,447,315 | |
Exelon Corporation | | | | | | | | | | | 298,694 | | | | 10,681,297 | |
NextEra Energy Incorporated | | | | | | | | | | | 173,353 | | | | 48,115,859 | |
The accompanying notes are an integral part of these financial statements.
Wells Fargo Utility and Telecommunications Fund | 9
Portfolio of investments—September 30, 2020 (unaudited)
| | | | | | | | | | | | | | | | |
| | | | | | | | | Shares | | | Value | |
|
| Electric Utilities (continued) | |
Pinnacle West Capital Corporation | | | | | | | | | | | 58,794 | | | $ | 4,383,093 | |
PNM Resources Incorporated | | | | | | | | | | | 296,027 | | | | 12,234,796 | |
The Southern Company | | | | | | | | | | | 197,857 | | | | 10,727,807 | |
Xcel Energy Incorporated | | | | | | | | | | | 177,798 | | | | 12,269,840 | |
| | | | |
| | | | | | | | | | | | | | | 177,221,470 | |
| | | | | | | | | | | | | | | | |
|
| Gas Utilities: 1.29% | |
Atmos Energy Corporation | | | | | | | | | | | 57,041 | | | | 5,452,549 | |
| | | | | | | | | | | | | | | | |
|
| Multi-Utilities: 22.20% | |
Ameren Corporation | | | | | | | | | | | 81,627 | | | | 6,455,063 | |
CenterPoint Energy Incorporated | | | | | | | | | | | 93,050 | | | | 1,800,518 | |
CMS Energy Corporation | | | | | | | | | | | 266,915 | | | | 16,391,250 | |
Dominion Energy Incorporated | | | | | | | | | | | 237,235 | | | | 18,724,959 | |
DTE Energy Company | | | | | | | | | | | 104,421 | | | | 12,012,592 | |
Public Service Enterprise Group Incorporated | | | | | | | | | | | 200,000 | | | | 10,982,000 | |
Sempra Energy | | | | | | | | | | | 145,950 | | | | 17,274,642 | |
WEC Energy Group Incorporated | | | | | | | | | | | 107,691 | | | | 10,435,258 | |
| | | | |
| | | | | | | | | | | | | | | 94,076,282 | |
| | | | | | | | | | | | | | | | |
|
Water Utilities: 5.01% | |
American Water Works Company Incorporated | | | | | | | | | | | 146,614 | | | | 21,241,436 | |
| | | | | | | | | | | | | | | | |
| |
Total Common Stocks (Cost $229,207,788) | | | | 406,228,759 | |
| | | | | |
| | | | |
| | | | | | | | | | | | | | | | |
| | | Yield | | | | | | | | | | |
| Short-Term Investments: 4.15% | |
|
| Investment Companies: 4.15% | |
Wells Fargo Government Money Market Fund Select Class (I)(u) | | | 0.05 | % | | | | | | | 17,592,946 | | | | 17,592,946 | |
| | | | | | | | | | | | | | | | |
| |
Total Short-Term Investments (Cost $17,592,946) | | | | 17,592,946 | |
| | | | | |
| | | | | | | | |
| Total investments in securities (Cost $246,800,734) | | | 100.01 | % | | | 423,821,705 | |
| | |
Other assets and liabilities, net | | | (0.01 | ) | | | (34,844 | ) |
| | | | | | | | |
| Total net assets | | | 100.00 | % | | $ | 423,786,861 | |
| | | | | | | | |
| (l) | The issuer of the security is an affiliated person of the Fund as defined in the Investment Company Act of 1940. |
| (u) | The rate represents the 7-day annualized yield at period end. |
Abbreviations:
| REIT | Real estate investment trust |
Investments in Affiliates
An affiliated investment is an investment in which the Fund owns at least 5% of the outstanding voting shares of the issuer or as a result of other relationships, such as the Fund and the issuer having the same investment manager. Transactions with issuers that were either affiliated persons of the Fund at the beginning of the period or the end of the period were as follows:
| | | | | | | | | | | | | | | | | | | | | | | | | | | | | | | | |
| | | Value,
beginning of
period | | |
Purchases | | | Sales
proceeds | | | Net
realized
gains
(losses) | | | Net
change in
unrealized
gains
(losses) | | | Income
from
affiliated
securities | | | Value, end of period | | | % of
net
assets | |
| | | | | | | | |
| Short-Term Investments | | | | | | | | | | | | | | | | | | | | | | | | |
Investment Companies | | | | | | | | | | | | | | | | | | | | | | | | | | | | | | | | |
Wells Fargo Government Money Market Fund Select Class | | $ | 9,586,236 | | | $ | 40,119,527 | | | $ | (32,112,817 | ) | | $ | 0 | | | $ | 0 | | | $ | 9,173 | | | $ | 17,592,946 | | | | 4.15 | % |
The accompanying notes are an integral part of these financial statements.
10 | Wells Fargo Utility and Telecommunications Fund
Statement of assets and liabilities—September 30, 2020 (unaudited)
| | | | |
| | | | |
| |
Assets | | | | |
Investments in unaffiliated securities, at value (cost $229,207,788) | | $ | 406,228,759 | |
Investments in affiliated securities, at value (cost $17,592,946) | | | 17,592,946 | |
Receivable for Fund shares sold | | | 172,000 | |
Receivable for dividends | | | 397,612 | |
Prepaid expenses and other assets | | | 31,566 | |
| | | | |
Total assets | | | 424,422,883 | |
| | | | |
| |
Liabilities | | | | |
Payable for Fund shares redeemed | | | 197,137 | |
Management fee payable | | | 185,044 | |
Administration fees payable | | | 68,766 | |
Distribution fee payable | | | 6,149 | |
Shareholder report expenses payable | | | 32,635 | |
Shareholder servicing fees payable | | | 74,138 | |
Trustees’ fees and expenses payable | | | 2,283 | |
Accrued expenses and other liabilities | | | 69,870 | |
| | | | |
Total liabilities | | | 636,022 | |
| | | | |
Total net assets | | $ | 423,786,861 | |
| | | | |
| |
Net assets consist of | | | | |
Paid-in capital | | $ | 200,552,426 | |
Total distributable earnings | | | 223,234,435 | |
| | | | |
Total net assets | | $ | 423,786,861 | |
| | | | |
| |
Computation of net asset value and offering price per share | | | | |
Net assets – Class A | | $ | 347,933,629 | |
Shares outstanding – Class A1 | | | 15,601,697 | |
Net asset value per share – Class A | | | $22.30 | |
Maximum offering price per share – Class A2 | | | $23.66 | |
Net assets – Class C | | $ | 9,910,703 | |
Shares outstanding – Class C1 | | | 442,823 | |
Net asset value per share – Class C | | | $22.38 | |
Net assets – Administrator Class | | $ | 2,651,108 | |
Shares outstanding – Administrator Class1 | | | 118,683 | |
Net asset value per share – Administrator Class | | | $22.34 | |
Net assets – Institutional Class | | $ | 63,291,421 | |
Shares outstanding – Institutional Class1 | | | 2,839,553 | |
Net asset value per share – Institutional Class | | | $22.29 | |
| 1 | The Fund has an unlimited number of authorized shares. |
| 2 | Maximum offering price is computed as 100/94.25 of net asset value. On investments of $50,000 or more, the offering price is reduced. |
The accompanying notes are an integral part of these financial statements.
Wells Fargo Utility and Telecommunications Fund | 11
Statement of operations—six months ended September 30, 2020 (unaudited)
| | | | |
| | | | |
| |
Investment income | | | | |
Dividends | | $ | 5,576,284 | |
Income from affiliated securities | | | 9,173 | |
| | | | |
Total investment income | | | 5,585,457 | |
| | | | |
| |
Expenses | | | | |
Management fee | | | 1,350,206 | |
Administration fees | |
Class A | | | 360,985 | |
Class C | | | 10,878 | |
Administrator Class | | | 1,766 | |
Institutional Class | | | 38,074 | |
Shareholder servicing fees | |
Class A | | | 428,797 | |
Class C | | | 12,895 | |
Administrator Class | | | 3,396 | |
Distribution fee | |
Class C | | | 38,556 | |
Custody and accounting fees | | | 11,900 | |
Professional fees | | | 27,518 | |
Registration fees | | | 31,751 | |
Shareholder report expenses | | | 30,158 | |
Trustees’ fees and expenses | | | 9,776 | |
Other fees and expenses | | | 11,404 | |
| | | | |
Total expenses | | | 2,368,060 | |
Less: Fee waivers and/or expense reimbursements | |
Fund-level | | | (231,426 | ) |
Class A | | | (23,620 | ) |
Class C | | | (4 | ) |
Administrator Class | | | (780 | ) |
Institutional Class | | | (2,490 | ) |
| | | | |
Net expenses | | | 2,109,740 | |
| | | | |
Net investment income | | | 3,475,717 | |
| | | | |
| |
Realized and unrealized gains (losses) on investments | | | | |
Net realized losses on investments | | | (1,883,697 | ) |
Net change in unrealized gains (losses) on investments | | | 41,780,638 | |
| | | | |
Net realized and unrealized gains (losses) on investments | | | 39,896,941 | |
| | | | |
Net increase in net assets resulting from operations | | $ | 43,372,658 | |
| | | | |
The accompanying notes are an integral part of these financial statements.
12 | Wells Fargo Utility and Telecommunications Fund
Statement of changes in net assets
| | | | | | | | | | | | | | | | |
| | | Six months ended
September 30, 2020
(unaudited) | | | Year ended
March 31, 2020 | |
| | | |
Operations | | | | | | | | | | | | |
Net investment income | | | | | | $ | 3,475,717 | | | | | | | $ | 6,079,299 | |
Net realized gains (losses) on investments | | | | | | | (1,883,697 | ) | | | | | | | 107,932,321 | |
Net change in unrealized gains (losses) on investments | | | | | | | 41,780,638 | | | | | | | | (112,272,968 | ) |
| | | | |
Net increase in net assets resulting from operations | | | | | | | 43,372,658 | | | | | | | | 1,738,652 | |
| | | | |
| | | | |
Distributions to shareholders from net investment income and net realized gains | | | | | | | | | | | | | | | | |
Class A | | | | | | | (2,660,725 | ) | | | | | | | (59,011,968 | ) |
Class C | | | | | | | (37,513 | ) | | | | | | | (2,071,360 | ) |
Administrator Class | | | | | | | (22,642 | ) | | | | | | | (410,715 | ) |
Institutional Class | | | | | | | (576,534 | ) | | | | | | | (7,898,292 | ) |
| | | | |
Total distributions to shareholders | | | | | | | (3,297,414 | ) | | | | | | | (69,392,335 | ) |
| | | | |
| | | | |
Capital share transactions | | | Shares | | | | | | | | Shares | | | | | |
Proceeds from shares sold | |
Class A | | | 601,165 | | | | 13,128,464 | | | | 1,235,048 | | | | 30,602,718 | |
Class C | | | 39,460 | | | | 858,752 | | | | 93,556 | | | | 2,314,593 | |
Administrator Class | | | 22,053 | | | | 473,785 | | | | 71,896 | | | | 1,729,978 | |
Institutional Class | | | 1,439,506 | | | | 31,223,783 | | | | 1,042,340 | | | | 25,254,377 | |
| | | | |
| | | | | | | 45,684,784 | | | | | | | | 59,901,666 | |
| | | | |
Reinvestment of distributions | |
Class A | | | 116,821 | | | | 2,509,934 | | | | 2,496,180 | | | | 55,793,949 | |
Class C | | | 1,693 | | | | 36,582 | | | | 87,166 | | | | 1,946,331 | |
Administrator Class | | | 1,040 | | | | 22,363 | | | | 17,987 | | | | 404,412 | |
Institutional Class | | | 26,497 | | | | 568,966 | | | | 348,289 | | | | 7,791,650 | |
| | | | |
| | | | | | | 3,137,845 | | | | | | | | 65,936,342 | |
| | | | |
Payment for shares redeemed | |
Class A | | | (927,602 | ) | | | (20,302,687 | ) | | | (1,981,491 | ) | | | (47,385,438 | ) |
Class C | | | (105,574 | ) | | | (2,300,847 | ) | | | (488,785 | ) | | | (12,192,401 | ) |
Administrator Class | | | (25,493 | ) | | | (564,476 | ) | | | (188,987 | ) | | | (4,741,722 | ) |
Institutional Class | | | (900,666 | ) | | | (19,753,553 | ) | | | (883,133 | ) | | | (21,243,556 | ) |
| | | | |
| | | | | | | (42,921,563 | ) | | | | | | | (85,563,117 | ) |
| | | | |
Net increase in net assets resulting from capital share transactions | | | | | | | 5,901,066 | | | | | | | | 40,274,891 | |
| | | | |
Total increase (decrease) in net assets | | | | | | | 45,976,310 | | | | | | | | (27,378,792 | ) |
| | | | |
| | |
Net assets | | | | | | | | |
Beginning of period | | | | | | | 377,810,551 | | | | | | | | 405,189,343 | |
| | | | |
End of period | | | | | | $ | 423,786,861 | | | | | | | $ | 377,810,551 | |
| | | | |
The accompanying notes are an integral part of these financial statements.
Wells Fargo Utility and Telecommunications Fund | 13
Financial highlights
(For a share outstanding throughout each period)
| | | | | | | | | | | | | | | | | | | | | | | | |
| | | Six months ended
September 30, 2020
(unaudited) | | | Year ended March 31 | |
| CLASS A | | 2020 | | | 2019 | | | 2018 | | | 2017 | | | 2016 | |
Net asset value, beginning of period | | | $20.19 | | | | $24.03 | | | | $20.46 | | | | $20.01 | | | | $18.70 | | | | $18.23 | |
Net investment income | | | 0.18 | | | | 0.34 | | | | 0.32 | | | | 0.34 | | | | 0.35 | | | | 0.31 | |
Net realized and unrealized gains (losses) on investments | | | 2.10 | | | | 0.02 | | | | 3.65 | | | | 0.47 | | | | 1.30 | | | | 0.45 | |
| | | | | | | | | | | | | | | | | | | | | | | | |
Total from investment operations | | | 2.28 | | | | 0.36 | | | | 3.97 | | | | 0.81 | | | | 1.65 | | | | 0.76 | |
Distributions to shareholders from | | | | | | | | | | | | | | | | | | | | | | | | |
Net investment income | | | (0.17 | ) | | | (0.34 | ) | | | (0.34 | ) | | | (0.36 | ) | | | (0.34 | ) | | | (0.29 | ) |
Net realized gains | | | 0.00 | | | | (3.86 | ) | | | (0.06 | ) | | | 0.00 | | | | 0.00 | | | | 0.00 | |
| | | | | | | | | | | | | | | | | | | | | | | | |
Total distributions to shareholders | | | (0.17 | ) | | | (4.20 | ) | | | (0.40 | ) | | | (0.36 | ) | | | (0.34 | ) | | | (0.29 | ) |
Net asset value, end of period | | | $22.30 | | | | $20.19 | | | | $24.03 | | | | $20.46 | | | | $20.01 | | | | $18.70 | |
Total return1 | | | 11.33 | % | | | 0.04 | % | | | 19.59 | % | | | 4.00 | % | | | 8.87 | % | | | 4.30 | % |
Ratios to average net assets (annualized) | | | | | | | | | | | | | | | | | | | | | | | | |
Gross expenses | | | 1.17 | % | | | 1.17 | % | | | 1.19 | % | | | 1.17 | % | | | 1.18 | % | | | 1.20 | % |
Net expenses | | | 1.04 | % | | | 1.09 | % | | | 1.14 | % | | | 1.14 | % | | | 1.14 | % | | | 1.14 | % |
Net investment income | | | 1.64 | % | | | 1.42 | % | | | 1.47 | % | | | 1.60 | % | | | 1.79 | % | | | 1.73 | % |
Supplemental data | | | | | | | | | | | | | | | | | | | | | | | | |
Portfolio turnover rate | | | 3 | % | | | 49 | % | | | 10 | % | | | 7 | % | | | 22 | % | | | 15 | % |
Net assets, end of period (000s omitted) | | | $347,934 | | | | $319,200 | | | | $337,848 | | | | $287,047 | | | | $308,152 | | | | $315,238 | |
| 1 | Total return calculations do not include any sales charges. Returns for periods of less than one year are not annualized. |
The accompanying notes are an integral part of these financial statements.
14 | Wells Fargo Utility and Telecommunications Fund
Financial highlights
(For a share outstanding throughout each period)
| | | | | | | | | | | | | | | | | | | | | | | | |
| | | Six months ended
September 30, 2020
(unaudited) | | | Year ended March 31 | |
| CLASS C | | 2020 | | | 2019 | | | 2018 | | | 2017 | | | 2016 | |
Net asset value, beginning of period | | | $20.25 | | | | $24.06 | | | | $20.47 | | | | $20.01 | | | | $18.70 | | | | $18.25 | |
Net investment income | | | 0.09 | 1 | | | 0.16 | 1 | | | 0.16 | 1 | | | 0.13 | | | | 0.16 | | | | 0.17 | 1 |
Net realized and unrealized gains (losses) on investments | | | 2.12 | | | | 0.01 | | | | 3.63 | | | | 0.52 | | | | 1.34 | | | | 0.45 | |
| | | | | | | | | | | | | | | | | | | | | | | | |
Total from investment operations | | | 2.21 | | | | 0.17 | | | | 3.79 | | | | 0.65 | | | | 1.50 | | | | 0.62 | |
Distributions to shareholders from | | | | | | | | | | | | | | | | | | | | | | | | |
Net investment income | | | (0.08 | ) | | | (0.12 | ) | | | (0.14 | ) | | | (0.19 | ) | | | (0.19 | ) | | | (0.17 | ) |
Net realized gains | | | 0.00 | | | | (3.86 | ) | | | (0.06 | ) | | | 0.00 | | | | 0.00 | | | | 0.00 | |
| | | | | | | | | | | | | | | | | | | | | | | | |
Total distributions to shareholders | | | (0.08 | ) | | | (3.98 | ) | | | (0.20 | ) | | | (0.19 | ) | | | (0.19 | ) | | | (0.17 | ) |
Net asset value, end of period | | | $22.38 | | | | $20.25 | | | | $24.06 | | | | $20.47 | | | | $20.01 | | | | $18.70 | |
Total return2 | | | 10.94 | % | | | (0.73 | )% | | | 18.65 | % | | | 3.24 | % | | | 8.04 | % | | | 3.49 | % |
Ratios to average net assets (annualized) | | | | | | | | | | | | | | | | | | | | | | | | |
Gross expenses | | | 1.91 | % | | | 1.92 | % | | | 1.94 | % | | | 1.92 | % | | | 1.93 | % | | | 1.95 | % |
Net expenses | | | 1.80 | % | | | 1.86 | % | | | 1.89 | % | | | 1.89 | % | | | 1.89 | % | | | 1.89 | % |
Net investment income | | | 0.87 | % | | | 0.63 | % | | | 0.74 | % | | | 0.85 | % | | | 1.02 | % | | | 0.99 | % |
Supplemental data | | | | | | | | | | | | | | | | | | | | | | | | |
Portfolio turnover rate | | | 3 | % | | | 49 | % | | | 10 | % | | | 7 | % | | | 22 | % | | | 15 | % |
Net assets, end of period (000s omitted) | | | $9,911 | | | | $10,274 | | | | $19,618 | | | | $41,729 | | | | $51,123 | | | | $57,431 | |
| 1 | Calculated based upon average shares outstanding |
| 2 | Total return calculations do not include any sales charges. Returns for periods of less than one year are not annualized. |
The accompanying notes are an integral part of these financial statements.
Wells Fargo Utility and Telecommunications Fund | 15
Financial highlights
(For a share outstanding throughout each period)
| | | | | | | | | | | | | | | | | | | | | | | | |
| | | Six months ended
September 30, 2020
(unaudited) | | | Year ended March 31 | |
| ADMINISTRATOR CLASS | | 2020 | | | 2019 | | | 2018 | | | 2017 | | | 2016 | |
Net asset value, beginning of period | | | $20.22 | | | | $24.05 | | | | $20.48 | | | | $20.03 | | | | $18.72 | | | | $18.25 | |
Net investment income | | | 0.19 | | | | 0.36 | | | | 0.36 | | | | 0.37 | | | | 0.38 | | | | 0.34 | |
Net realized and unrealized gains (losses) on investments | | | 2.11 | | | | 0.04 | | | | 3.65 | | | | 0.48 | | | | 1.30 | | | | 0.45 | |
| | | | | | | | | | | | | | | | | | | | | | | | |
Total from investment operations | | | 2.30 | | | | 0.40 | | | | 4.01 | | | | 0.85 | | | | 1.68 | | | | 0.79 | |
Distributions to shareholders from | | | | | | | | | | | | | | | | | | | | | | | | |
Net investment income | | | (0.18 | ) | | | (0.37 | ) | | | (0.38 | ) | | | (0.40 | ) | | | (0.37 | ) | | | (0.32 | ) |
Net realized gains | | | 0.00 | | | | (3.86 | ) | | | (0.06 | ) | | | 0.00 | | | | 0.00 | | | | 0.00 | |
| | | | | | | | | | | | | | | | | | | | | | | | |
Total distributions to shareholders | | | (0.18 | ) | | | (4.23 | ) | | | (0.44 | ) | | | (0.40 | ) | | | (0.37 | ) | | | (0.32 | ) |
Net asset value, end of period | | | $22.34 | | | | $20.22 | | | | $24.05 | | | | $20.48 | | | | $20.03 | | | | $18.72 | |
Total return1 | | | 11.43 | % | | | 0.20 | % | | | 19.80 | % | | | 4.21 | % | | | 9.04 | % | | | 4.49 | % |
Ratios to average net assets (annualized) | | | | | | | | | | | | | | | | | | | | | | | | |
Gross expenses | | | 1.09 | % | | | 1.09 | % | | | 1.11 | % | | | 1.09 | % | | | 1.10 | % | | | 1.09 | % |
Net expenses | | | 0.92 | % | | | 0.94 | % | | | 0.95 | % | | | 0.95 | % | | | 0.95 | % | | | 0.95 | % |
Net investment income | | | 1.76 | % | | | 1.49 | % | | | 1.66 | % | | | 1.80 | % | | | 1.93 | % | | | 1.93 | % |
Supplemental data | | | | | | | | | | | | | | | | | | | | | | | | |
Portfolio turnover rate | | | 3 | % | | | 49 | % | | | 10 | % | | | 7 | % | | | 22 | % | | | 15 | % |
Net assets, end of period (000s omitted) | | | $2,651 | | | | $2,449 | | | | $5,296 | | | | $4,702 | | | | $5,168 | | | | $6,740 | |
| 1 | Returns for periods of less than one year are not annualized. |
The accompanying notes are an integral part of these financial statements.
16 | Wells Fargo Utility and Telecommunications Fund
Financial highlights
(For a share outstanding throughout each period)
| | | | | | | | | | | | | | | | | | | | | | | | |
| | | Six months ended
September 30, 2020
(unaudited) | | | Year ended March 31 | |
| INSTITUTIONAL CLASS | | 2020 | | | 2019 | | | 2018 | | | 2017 | | | 2016 | |
Net asset value, beginning of period | | | $20.18 | | | | $24.01 | | | | $20.45 | | | | $20.00 | | | | $18.69 | | | | $18.23 | |
Net investment income | | | 0.23 | | | | 0.44 | | | | 0.41 | | | | 0.41 | | | | 0.42 | | | | 0.36 | 1 |
Net realized and unrealized gains (losses) on investments | | | 2.09 | | | | 0.01 | | | | 3.62 | | | | 0.47 | | | | 1.30 | | | | 0.45 | |
| | | | | | | | | | | | | | | | | | | | | | | | |
Total from investment operations | | | 2.32 | | | | 0.45 | | | | 4.03 | | | | 0.88 | | | | 1.72 | | | | 0.81 | |
Distributions to shareholders from | | | | | | | | | | | | | | | | | | | | | | | | |
Net investment income | | | (0.21 | ) | | | (0.42 | ) | | | (0.41 | ) | | | (0.43 | ) | | | (0.41 | ) | | | (0.35 | ) |
Net realized gains | | | 0.00 | | | | (3.86 | ) | | | (0.06 | ) | | | 0.00 | | | | 0.00 | | | | 0.00 | |
| | | | | | | | | | | | | | | | | | | | | | | | |
Total distributions to shareholders | | | (0.21 | ) | | | (4.28 | ) | | | (0.47 | ) | | | (0.43 | ) | | | (0.41 | ) | | | (0.35 | ) |
Net asset value, end of period | | | $22.29 | | | | $20.18 | | | | $24.01 | | | | $20.45 | | | | $20.00 | | | | $18.69 | |
Total return2 | | | 11.52 | % | | | 0.42 | % | | | 20.03 | % | | | 4.38 | % | | | 9.26 | % | | | 4.63 | % |
Ratios to average net assets (annualized) | | | | | | | | | | | | | | | | | | | | | | | | |
Gross expenses | | | 0.84 | % | | | 0.84 | % | | | 0.86 | % | | | 0.84 | % | | | 0.85 | % | | | 0.84 | % |
Net expenses | | | 0.72 | % | | | 0.75 | % | | | 0.78 | % | | | 0.78 | % | | | 0.78 | % | | | 0.78 | % |
Net investment income | | | 1.99 | % | | | 1.76 | % | | | 1.83 | % | | | 1.95 | % | | | 2.18 | % | | | 2.03 | % |
Supplemental data | | | | | | | | | | | | | | | | | | | | | | | | |
Portfolio turnover rate | | | 3 | % | | | 49 | % | | | 10 | % | | | 7 | % | | | 22 | % | | | 15 | % |
Net assets, end of period (000s omitted) | | | $63,291 | | | | $45,888 | | | | $42,427 | | | | $31,548 | | | | $24,575 | | | | $15,295 | |
| 1 | Calculated based upon average shares outstanding |
| 2 | Returns for periods of less than one year are not annualized. |
The accompanying notes are an integral part of these financial statements.
Wells Fargo Utility and Telecommunications Fund | 17
Notes to financial statements (unaudited)
1. ORGANIZATION
Wells Fargo Funds Trust (the “Trust”), a Delaware statutory trust organized on March 10, 1999, is an open-end management investment company registered under the Investment Company Act of 1940, as amended (the “1940 Act”). As an investment company, the Trust follows the accounting and reporting guidance in Financial Accounting Standards Board (“FASB”) Accounting Standards Codification Topic 946, Financial Services – Investment Companies. These financial statements report on the Wells Fargo Utility and Telecommunications Fund (the “Fund”) which is a non-diversified series of the Trust.
2. SIGNIFICANT ACCOUNTING POLICIES
The following significant accounting policies, which are consistently followed in the preparation of the financial statements of the Fund, are in conformity with U.S. generally accepted accounting principles which require management to make estimates and assumptions that affect the reported amounts of assets and liabilities, disclosure of contingent assets and liabilities at the date of the financial statements, and the reported amounts of revenues and expenses during the reporting period. Actual results could differ from those estimates.
Securities valuation
All investments are valued each business day as of the close of regular trading on the New York Stock Exchange (generally 4 p.m. Eastern Time), although the Fund may deviate from this calculation time under unusual or unexpected circumstances.
Equity securities that are listed on a foreign or domestic exchange or market are valued at the official closing price or, if none, the last sales price. If no sale occurs on the principal exchange or market that day, a fair value price will be determined in accordance with the Fund’s Valuation Procedures.
The values of securities denominated in foreign currencies are translated into U.S. dollars at rates provided by an independent foreign currency pricing source at a time each business day specified by the Wells Fargo Asset Management Pricing Committee at Wells Fargo Funds Management, LLC (“Funds Management”).
Investments in registered open-end investment companies are valued at net asset value. Interests in non-registered investment companies that are redeemable at net asset value are fair valued normally at net asset value.
Many securities markets and exchanges outside the U.S. close prior to the close of the New York Stock Exchange and therefore may not fully reflect trading or events that occur after the close of the principal exchange in which the foreign securities are traded, but before the close of the New York Stock Exchange. If such trading or events are expected to materially affect the value of such securities, then fair value pricing procedures approved by the Board of Trustees of the Fund are applied. These procedures take into account multiple factors including movements in U.S. securities markets after foreign exchanges close. Foreign securities that are fair valued under these procedures are categorized as Level 2 and the application of these procedures may result in transfers between Level 1 and Level 2. Depending on market activity, such fair valuations may be frequent. Such fair value pricing may result in net asset values that are higher or lower than net asset values based on the last reported sales price or latest quoted bid price. On September 30, 2020, such fair value pricing was not used in pricing foreign securities.
Investments which are not valued using any of the methods discussed above are valued at their fair value, as determined in good faith by the Board of Trustees. The Board of Trustees has established a Valuation Committee comprised of the Trustees and has delegated to it the authority to take any actions regarding the valuation of portfolio securities that the Valuation Committee deems necessary or appropriate, including determining the fair value of portfolio securities, unless the determination has been delegated to the Wells Fargo Asset Management Pricing Committee. The Board of Trustees retains the authority to make or ratify any valuation decisions or approve any changes to the Valuation Procedures as it deems appropriate. On a quarterly basis, the Board of Trustees receives reports on any valuation actions taken by the Valuation Committee or the Wells Fargo Asset Management Pricing Committee which may include items for ratification.
Foreign currency translation
The accounting records of the Fund are maintained in U.S. dollars. The values of other assets and liabilities denominated in foreign currencies are translated into U.S. dollars at rates provided by an independent foreign currency pricing source at a time each business day specified by the Wells Fargo Asset Management Pricing Committee. Purchases and sales of securities, and income and expenses are converted at the rate of exchange on the respective dates of such transactions. Net realized foreign exchange gains or losses arise from sales of foreign currencies, currency gains or losses realized between the trade and settlement dates on securities transactions, and the difference between the amounts of dividends, interest and foreign withholding taxes recorded and the U.S. dollar equivalent of the amounts actually paid or received. Net unrealized foreign exchange gains and losses arise from changes in the fair value of assets and liabilities other than investments in securities resulting from changes in exchange rates. The changes in net
18 | Wells Fargo Utility and Telecommunications Fund
Notes to financial statements (unaudited)
assets arising from changes in exchange rates of securities and the changes in net assets resulting from changes in market prices of securities are not separately presented. Such changes are included in net realized and unrealized gains or losses from investments.
Securities lending
The Fund may lend its securities from time to time in order to earn additional income in the form of fees or interest on securities received as collateral or the investment of any cash received as collateral. When securities are on loan, the Fund receives interest or dividends on those securities. Cash collateral received in connection with its securities lending transactions is invested in Securities Lending Cash Investments, LLC (the “Securities Lending Fund”). Investments in Securities Lending Fund are valued at the evaluated bid price provided by an independent pricing service. Income earned from investment in the Securities Lending Fund (net of fees and rebates), if any, is included in income from affiliated securities on the Statement of Operations.
In a securities lending transaction, the net asset value of the Fund is affected by an increase or decrease in the value of the securities loaned and by an increase or decrease in the value of the instrument in which collateral is invested. The amount of securities lending activity undertaken by the Fund fluctuates from time to time. The Fund has the right under the lending agreement to recover the securities from the borrower on demand. In the event of default or bankruptcy by the borrower, the Fund may be prevented from recovering the loaned securities or gaining access to the collateral or may experience delays or costs in doing so. In such an event, the terms of the agreement allow the unaffiliated securities lending agent to use the collateral to purchase replacement securities on behalf of the Fund or pay the Fund the market value of the loaned securities. The Fund bears the risk of loss with respect to depreciation of its investment of the cash collateral.
Security transactions and income recognition
Securities transactions are recorded on a trade date basis. Realized gains or losses are recorded on the basis of identified cost.
Dividend income is recognized on the ex-dividend date.
Distributions to shareholders
Distributions to shareholders are recorded on the ex-dividend date and paid from net investment income quarterly and any net realized gains are paid at least annually. Such distributions are determined in accordance with income tax regulations and may differ from U.S. generally accepted accounting principles. Dividend sources are estimated at the time of declaration. The tax character of distributions is determined as of the Fund’s fiscal year end. Therefore, a portion of the Fund’s distributions made prior to the Fund’s fiscal year end may be categorized as a tax return of capital at year end.
Federal and other taxes
The Fund intends to continue to qualify as a regulated investment company by distributing substantially all of its investment company taxable income and any net realized capital gains (after reduction for capital loss carryforwards) sufficient to relieve it from all, or substantially all, federal income taxes. Accordingly, no provision for federal income taxes was required.
The Fund’s income and federal excise tax returns and all financial records supporting those returns for the prior three fiscal years are subject to examination by the federal and Delaware revenue authorities. Management has analyzed the Fund’s tax positions taken on federal, state, and foreign tax returns for all open tax years and does not believe that there are any uncertain tax positions that require recognition of a tax liability.
As of September 30, 2020, the aggregate cost of all investments for federal income tax purposes was $246,800,734 amount and the unrealized gains (losses) consisted of:
| | | | |
| |
Gross unrealized gains | | $ | 189,007,809 | |
| |
Gross unrealized losses | | | (11,986,838 | ) |
| |
Net unrealized gains | | $ | 177,020,971 | |
Class allocations
The separate classes of shares offered by the Fund differ principally in applicable sales charges, distribution, shareholder servicing, and administration fees. Class specific expenses are charged directly to that share class. Investment income, common fund-level expenses, and realized and unrealized gains (losses) on investments are allocated daily to each class of shares based on the relative proportion of net assets of each class.
3. FAIR VALUATION MEASUREMENTS
Fair value measurements of investments are determined within a framework that has established a fair value hierarchy based upon the various data inputs utilized in determining the value of the Fund’s investments. The three-level hierarchy gives the
Wells Fargo Utility and Telecommunications Fund | 19
Notes to financial statements (unaudited)
highest priority to unadjusted quoted prices in active markets for identical assets or liabilities (Level 1) and the lowest priority to unobservable inputs (Level 3). The Fund’s investments are classified within the fair value hierarchy based on the lowest level of input that is significant to the fair value measurement. The inputs are summarized into three broad levels as follows:
| ∎ | | Level 1 – quoted prices in active markets for identical securities |
| ∎ | | Level 2 – other significant observable inputs (including quoted prices for similar securities, interest rates, prepayment speeds, credit risk, etc.) |
| ∎ | | Level 3 – significant unobservable inputs (including the Fund’s own assumptions in determining the fair value of investments) |
The inputs or methodologies used for valuing investments in securities are not necessarily an indication of the risk associated with investing in those securities.
The following is a summary of the inputs used in valuing the Fund’s assets and liabilities as of September 30, 2020:
| | | | | | | | | | | | | | | | |
| | | | |
| | | Quoted prices
(Level 1) | | | Other significant
observable inputs
(Level 2) | | | Significant
unobservable inputs (Level 3) | | | Total | |
| | | | |
Assets | | | | | | | | | | | | | | | | |
Investments in: | | | | | | | | | | | | | | | | |
| | | | |
Common stocks | | | | | | | | | | | | | | | | |
| | | | |
Communication services | | $ | 46,010,515 | | | $ | 0 | | | $ | 0 | | | $ | 46,010,515 | |
| | | | |
Consumer discretionary | | | 2,615,473 | | | | 0 | | | | 0 | | | | 2,615,473 | |
| | | | |
Consumer staples | | | 2,285,430 | | | | 0 | | | | 0 | | | | 2,285,430 | |
| | | | |
Energy | | | 1,860,019 | | | | 0 | | | | 0 | | | | 1,860,019 | |
| | | | |
Financials | | | 1,969,780 | | | | 0 | | | | 0 | | | | 1,969,780 | |
| | | | |
Health care | | | 4,871,505 | | | | 0 | | | | 0 | | | | 4,871,505 | |
| | | | |
Information technology | | | 46,458,157 | | | | 0 | | | | 0 | | | | 46,458,157 | |
| | | | |
Real estate | | | 2,166,143 | | | | 0 | | | | 0 | | | | 2,166,143 | |
| | | | |
Utilities | | | 297,991,737 | | | | 0 | | | | 0 | | | | 297,991,737 | |
| | | | |
Short-term investments | | | | | | | | | | | | | | | | |
| | | | |
Investment companies | | | 17,592,946 | | | | 0 | | | | 0 | | | | 17,592,946 | |
| | | | |
Total assets | | $ | 423,821,705 | | | $ | 0 | | | $ | 0 | | | $ | 423,821,705 | |
Additional sector, industry or geographic detail is included in the Portfolio of Investments.
For the six months ended September 30, 2020, the Fund did not have any transfers into/out of Level 3.
4. TRANSACTIONS WITH AFFILIATES
Management fee
Funds Management, an indirect wholly owned subsidiary of Wells Fargo & Company (“Wells Fargo”), is the manager of the Fund and provides advisory and fund-level administrative services under an investment management agreement. Under the investment management agreement, Funds Management is responsible for, among other services, implementing the investment objectives and strategies of the Fund, supervising the subadviser and providing fund-level administrative services in connection with the Fund’s operations. As compensation for its services under the investment management agreement, Funds Management is entitled to receive a management fee at the following annual rate based on the Fund’s average daily net assets:
| | | | |
| |
| Average daily net assets | | Management fee | |
| |
First $500 million | | | 0.650 | % |
| |
Next $500 million | | | 0.600 | |
| |
Next $1 billion | | | 0.550 | |
| |
Next $2 billion | | | 0.525 | |
| |
Next $1 billion | | | 0.500 | |
| |
Next $5 billion | | | 0.490 | |
| |
Over $10 billion | | | 0.480 | |
20 | Wells Fargo Utility and Telecommunications Fund
Notes to financial statements (unaudited)
For the six months ended September 30, 2020, the management fee was equivalent to an annual rate of 0.65% of the Fund’s average daily net assets.
Funds Management has retained the services of a subadviser to provide daily portfolio management to the Fund. The fee for subadvisory services is borne by Funds Management. Wells Capital Management Incorporated (“WellsCap”), an affiliate of Funds Management and an indirect wholly owned subsidiary of Wells Fargo, is the subadviser to the Fund and is entitled to receive a fee from Funds Management at an annual rate starting at 0.30% and declining to 0.20% as the average daily net assets of the Fund increase.
Administration fees
Under a class-level administration agreement, Funds Management provides class-level administrative services to the Fund, which includes paying fees and expenses for services provided by the transfer agent, sub-transfer agents, omnibus account servicers and record-keepers. As compensation for its services under the class-level administration agreement, Funds Management receives an annual fee which is calculated based on the average daily net assets of each class as follows:
| | | | |
| |
| | | Class-level
administration fee | |
| |
Class A, Class C | | | 0.21 | % |
| |
Administrator Class, Institutional Class | | | 0.13 | |
Waivers and/or expense reimbursements
Funds Management has contractually waived and/or reimbursed management and administration fees to the extent necessary to maintain certain net operating expense ratios for the Fund. When each class of the Fund has exceeded its expense cap, Funds Management has waived fees and/or reimbursed expenses from fund-level expenses on a proportionate basis and then from class specific expenses. When only certain classes exceed their expense caps, waivers and/or reimbursements are applied against class specific expenses before fund-level expenses. Funds Management has committed through July 31, 2021 to waive fees and/or reimburse expenses to the extent necessary to cap the Fund’s expenses at 1.05% for Class A shares, 1.80% for Class C shares, 0.92% for Administrator Class shares, and 0.72% for Institutional Class shares. Prior to or after the commitment expiration date, the cap may be increased or the commitment to maintain the cap may be terminated only with the approval of the Board of Trustees.
Distribution fee
The Trust has adopted a distribution plan for Class C shares of the Fund pursuant to Rule 12b-1 under the 1940 Act. A distribution fee is charged to Class C shares and paid to Wells Fargo Funds Distributor, LLC (“Funds Distributor”), the principal underwriter, at an annual rate of 0.75% of the average daily net assets of Class C shares.
In addition, Funds Distributor is entitled to receive the front-end sales charge from the purchase of Class A shares and a contingent deferred sales charge on the redemption of certain Class A shares. Funds Distributor is also entitled to receive the contingent deferred sales charges from redemptions of Class C shares. For the six months ended September 30, 2020, Funds Distributor received $14,780 from the sale of Class A shares and $15 in contingent deferred sales charges from redemptions of Class C shares. No contingent deferred sales charges were incurred by Class A shares for the six months ended September 30, 2020.
Shareholder servicing fees
The Trust has entered into contracts with one or more shareholder servicing agents, whereby Class A, Class C, and Administrator Class of the Fund are charged a fee at an annual rate of 0.25% of the average daily net assets of each respective class. A portion of these total shareholder servicing fees were paid to affiliates of Wells Fargo.
Interfund transactions
The Fund may purchase or sell portfolio investment securities to certain other Wells Fargo affiliates pursuant to Rule 17a-7 under the 1940 Act and under procedures adopted by the Board of Trustees. The procedures have been designed to ensure that these interfund transactions, which do not incur broker commissions, are effected at current market prices. Pursuant to these procedures, the Fund had $0 and $156,119 in interfund purchases and sales, respectively, during the six months ended September 30, 2020.
5. INVESTMENT PORTFOLIO TRANSACTIONS
Purchases and sales of investments, excluding U.S. government obligations (if any) and short-term securities, for the six months ended September 30, 2020 were $11,513,937 and $13,351,563, respectively.
Wells Fargo Utility and Telecommunications Fund | 21
Notes to financial statements (unaudited)
6. SECURITIES LENDING TRANSACTIONS
The Fund lends its securities through an unaffiliated securities lending agent and receives collateral in the form of cash or securities with a value at least equal to the value of the securities on loan. The value of the loaned securities is determined at the close of each business day and any increases or decreases in the required collateral are exchanged between the Fund and the counterparty on the next business day. Cash collateral received is invested in the Securities Lending Fund which seeks to provide a positive return compared to the daily Federal Funds Open Rate by investing in high-quality, U.S. dollar-denominated short-term money market instruments and is exempt from registration under Section 3(c)(7) of the 1940 Act. Securities Lending Fund is managed by Funds Management and is subadvised by WellsCap. Funds Management receives an advisory fee starting at 0.05% and declining to 0.01% as the average daily net assets of the Securities Lending Fund increase. All of the fees received by Funds Management are paid to WellsCap for its services as subadviser.
In the event of counterparty default or the failure of a borrower to return a loaned security, the Fund has the right to use the collateral to offset any losses incurred. As of September 30, 2020, the Fund did not have any securities on loan.
7. BANK BORROWINGS
The Trust (excluding the money market funds), Wells Fargo Master Trust and Wells Fargo Variable Trust are parties to a $350,000,000 revolving credit agreement whereby the Fund is permitted to use bank borrowings for temporary or emergency purposes, such as to fund shareholder redemption requests. Interest under the credit agreement is charged to the Fund based on a borrowing rate equal to the higher of the Federal Funds rate in effect on that day plus 1.25% or the overnight LIBOR rate in effect on that day plus 1.25%. In addition, an annual commitment fee equal to 0.25% of the unused balance is allocated to each participating fund.
For the six months ended September 30, 2020, there were no borrowings by the Fund under the agreement.
8. CONCENTRATION RISK
The Fund invests a substantial portion of its assets in utility and telecommunications companies and, therefore, may be more affected by changes in the utility and telecommunications sectors than would be a fund whose investments are not heavily weighted in any sector.
9. INDEMNIFICATION
Under the Fund’s organizational documents, the officers and Trustees have been granted certain indemnification rights against certain liabilities that may arise out of performance of their duties to the Fund. The Fund has entered into a separate agreement with each Trustee that converts indemnification rights currently existing under the Fund’s organizational documents into contractual rights that cannot be changed in the future without the consent of the Trustee. Additionally, in the normal course of business, the Fund may enter into contracts with service providers that contain a variety of indemnification clauses. The Fund’s maximum exposure under these arrangements is dependent on future claims that may be made against the Fund and, therefore, cannot be estimated.
10. NEW ACCOUNTING PRONOUNCEMENT
In August 2018, FASB issued Accounting Standards Update (“ASU”) No. 2018-13, Fair Value Measurement (Topic 820) Disclosure Framework—Changes to the Disclosure Requirements for Fair Value Measurement. ASU 2018-13 updates the disclosure requirements on fair value measurements in Topic 820, Fair Value Measurements. The amendments are effective for fiscal years, and interim periods within those fiscal years, beginning after December 15, 2019. Management has adopted this guidance which did not have a material impact on the financial statements.
11. CORONAVIRUS (COVID-19) PANDEMIC
On March 11, 2020, the World Health Organization announced that it had made the assessment that coronavirus disease 2019 (“COVID-19”) is a pandemic. The impacts of COVID-19 are adversely affecting the entire global economy, individual companies and investment products, and the market in general. There is significant uncertainty around the extent and duration of business disruptions related to COVID-19 and the impacts may be short term or may last for an extended period of time. The risk of further spreading of COVID-19 has led to significant uncertainty and volatility in the financial markets.
22 | Wells Fargo Utility and Telecommunications Fund
Other information (unaudited)
PROXY VOTING INFORMATION
A description of the policies and procedures used to determine how to vote proxies relating to portfolio securities is available, upon request, by calling 1-800-222-8222, visiting our website at wfam.com, or visiting the SEC website at sec.gov. Information regarding how the proxies related to portfolio securities were voted during the most recent 12-month period ended June 30 is available on the website at wfam.com or by visiting the SEC website at sec.gov.
QUARTERLY PORTFOLIO HOLDINGS INFORMATION
The Portfolio files its complete schedule of portfolio holdings with the SEC for the first and third quarters of each fiscal year as an exhibit to its reports on Form N-PORT. Shareholders may view the filed Form N-PORT by visiting the SEC website at sec.gov.
Wells Fargo Utility and Telecommunications Fund | 23
Other information (unaudited)
BOARD OF TRUSTEES AND OFFICERS
Each of the Trustees and Officers1 listed in the table below acts in identical capacities for each fund in the Wells Fargo family of funds, which consists of 142 mutual funds comprising the Wells Fargo Funds Trust, Wells Fargo Variable Trust, Wells Fargo Master Trust and four closed-end funds (collectively the “Fund Complex”). This table should be read in conjunction with the Prospectus and the Statement of Additional Information2. The mailing address of each Trustee and Officer is 525 Market Street, 12th Floor, San Francisco, CA 94105. Each Trustee and Officer serves an indefinite term, however, each Trustee serves such term until reaching the mandatory retirement age established by the Trustees.
Independent Trustees
| | | | | | |
Name and year of birth | | Position held and
length of service* | | Principal occupations during past five years or longer | | Current other
public company or
investment
company
directorships |
| | | |
William R. Ebsworth (Born 1957) | | Trustee, since 2015 | | Retired. From 1984 to 2013, equities analyst, portfolio manager, research director and chief investment officer at Fidelity Management and Research Company in Boston, Tokyo, and Hong Kong, and retired in 2013 as Chief Investment Officer of Fidelity Strategic Advisers, Inc. where he led a team of investment professionals managing client assets. Prior thereto, Board member of Hong Kong Securities Clearing Co., Hong Kong Options Clearing Corp., the Thailand International Fund, Ltd., Fidelity Investments Life Insurance Company, and Empire Fidelity Investments Life Insurance Company. Audit Committee Chair and Investment Committee Chair of the Vincent Memorial Hospital Endowment (non-profit organization). Mr. Ebsworth is a CFA® charterholder. | | N/A |
| | | |
Jane A. Freeman (Born 1953) | | Trustee, since 2015; Chair Liaison, since 2018 | | Retired. From 2012 to 2014 and 1999 to 2008, Chief Financial Officer of Scientific Learning Corporation. From 2008 to 2012, Ms. Freeman provided consulting services related to strategic business projects. Prior to 1999, Portfolio Manager at Rockefeller & Co. and Scudder, Stevens & Clark. Board member of the Harding Loevner Funds from 1996 to 2014, serving as both Lead Independent Director and chair of the Audit Committee. Board member of the Russell Exchange Traded Funds Trust from 2011 to 2012 and the chair of the Audit Committee. Ms. Freeman is also an inactive Chartered Financial Analyst. | | N/A |
| | | |
| Isaiah Harris, Jr. (Born 1952) | | Trustee, since 2009; Audit Committee Chairman, since 2019 | | Retired. Chairman of the Board of CIGNA Corporation since 2009, and Director since 2005. From 2003 to 2011, Director of Deluxe Corporation. Prior thereto, President and CEO of BellSouth Advertising and Publishing Corp. from 2005 to 2007, President and CEO of BellSouth Enterprises from 2004 to 2005 and President of BellSouth Consumer Services from 2000 to 2003. Emeritus member of the Iowa State University Foundation Board of Governors. Emeritus Member of the Advisory Board of Iowa State University School of Business. Advisory Board Member, Palm Harbor Academy (private school). Mr. Harris is a certified public accountant (inactive status). | | CIGNA Corporation |
| | | |
Judith M. Johnson (Born 1949) | | Trustee, since 2008 | | Retired. Prior thereto, Chief Executive Officer and Chief Investment Officer of Minneapolis Employees Retirement Fund from 1996 to 2008. Ms. Johnson is an attorney, certified public accountant and a certified managerial accountant. | | N/A |
| | | |
David F. Larcker (Born 1950) | | Trustee, since 2009 | | James Irvin Miller Professor of Accounting at the Graduate School of Business (Emeritus), Stanford University, Director of the Corporate Governance Research Initiative and Senior Faculty of The Rock Center for Corporate Governance since 2006. From 2005 to 2008, Professor of Accounting at the Graduate School of Business, Stanford University. Prior thereto, Ernst & Young Professor of Accounting at The Wharton School, University of Pennsylvania from 1985 to 2005. | | N/A |
24 | Wells Fargo Utility and Telecommunications Fund
Other information (unaudited)
| | | | | | |
Name and year of birth | | Position held and
length of service* | | Principal occupations during past five years or longer | | Current other
public company or
investment
company
directorships |
| | | |
Olivia S. Mitchell (Born 1953) | | Trustee, since 2006; Nominating and Governance Committee Chair, since 2018 | | International Foundation of Employee Benefit Plans Professor, Wharton School of the University of Pennsylvania since 1993. Director of Wharton’s Pension Research Council and Boettner Center on Pensions & Retirement Research, and Research Associate at the National Bureau of Economic Research. Previously, Cornell University Professor from 1978 to 1993. | | N/A |
| | | |
Timothy J. Penny (Born 1951) | | Trustee, since 1996; Chairman, since 2018 | | President and Chief Executive Officer of Southern Minnesota Initiative Foundation, a non-profit organization, since 2007. Member of the Board of Trustees of NorthStar Education Finance, Inc., a non-profit organization, since 2007. | | N/A |
| | | |
James G. Polisson (Born 1959) | | Trustee, since 2018 | | Retired. Chief Marketing Officer, Source (ETF) UK Services, Ltd, from 2015 to 2017. From 2012 to 2015, Principal of The Polisson Group, LLC, a management consulting, corporate advisory and principal investing company. Chief Executive Officer and Managing Director at Russell Investments, Global Exchange Traded Funds from 2010 to 2012. Managing Director of Barclays Global Investors from 1998 to 2010 and Global Chief Marketing Officer for iShares and Barclays Global Investors from 2000 to 2010. Trustee of the San Francisco Mechanics’ Institute, a non-profit organization, from 2013 to 2015. Board member of the Russell Exchange Traded Fund Trust from 2011 to 2012. Director of Barclays Global Investors Holdings Deutschland GmbH from 2006 to 2009. Mr. Polisson is an attorney and has a retired status with the Massachusetts and District of Columbia Bar Associations. | | N/A |
| | | |
Pamela Wheelock (Born 1959) | | Trustee, since January 2020; previously Trustee from January 2018 to July 2019 | | Board member of the Destination Medical Center Economic Development Agency, Rochester, Minnesota since 2019. Interim President of the McKnight Foundation from January to September 2020. Acting Commissioner, Minnesota Department of Human Services, July 2019 through September 2019. Human Services Manager (part-time), Minnesota Department of Human Services, October 2019 through December 2019. Chief Operating Officer, Twin Cities Habitat for Humanity from 2017 to 2019. Vice President of University Services, University of Minnesota from 2012 to 2016. Prior thereto, on the Board of Directors, Governance Committee and Finance Committee for the Minnesota Philanthropy Partners (Saint Paul Foundation) from 2012 to 2018, Interim Chief Executive Officer of Blue Cross Blue Shield of Minnesota from 2011 to 2012, Chairman of the Board from 2009 to 2012 and Board Director from 2003 to 2015. Vice President, Leadership and Community Engagement, Bush Foundation, Saint Paul, Minnesota (a private foundation) from 2009 to 2011. Executive Vice President and Chief Financial Officer, Minnesota Sports and Entertainment from 2004 to 2009 and Senior Vice President from 2002 to 2004. Executive Vice President of the Minnesota Wild Foundation from 2004 to 2008. Commissioner of Finance, State of Minnesota, from 1999 to 2002. Currently Board Chair of the Minnesota Wild Foundation since 2010. | | N/A |
| * | Length of service dates reflect the Trustee’s commencement of service with the Trust’s predecessor entities, where applicable. |
Wells Fargo Utility and Telecommunications Fund | 25
Other information (unaudited)
Officers
| | | | |
Name and year of birth | | Position held and
length of service | | Principal occupations during past five years or longer |
| | |
Andrew Owen (Born 1960) | | President, since 2017 | | Executive Vice President of Wells Fargo & Company and Head of Affiliated Managers, Wells Fargo Asset Management, since 2014. In addition, Mr. Owen is currently President, Chief Executive Officer and Director of Wells Fargo Funds Management, LLC since 2017. Prior thereto, Executive Vice President responsible for marketing, investments and product development for Wells Fargo Funds Management, LLC, from 2009 to 2014. |
| | |
Nancy Wiser1 (Born 1967) | | Treasurer, since 2012 | | Executive Vice President of Wells Fargo Funds Management, LLC since 2011. Chief Operating Officer and Chief Compliance Officer at LightBox Capital Management LLC, from 2008 to 2011. |
| | |
Michelle Rhee (Born 1966) | | Chief Legal Officer, since 2019 | | Secretary of Wells Fargo Funds Management, LLC, Chief Legal Counsel of Wells Fargo Asset Management and Assistant General Counsel of Wells Fargo Bank, N.A. since 2018. Associate General Counsel and Managing Director of Bank of America Corporation from 2004 to 2018. |
| | |
Catherine Kennedy (Born 1969) | | Secretary, since 2019 | | Vice President of Wells Fargo Funds Management, LLC and Senior Counsel of the Wells Fargo Legal Department since 2010. Vice President and Senior Counsel of Evergreen Investment Management Company, LLC from 1998 to 2010. |
| | |
Michael H. Whitaker (Born 1967) | | Chief Compliance Officer, since 2016 | | Chief Compliance Officer of Wells Fargo Asset Management since 2016. Senior Vice President and Chief Compliance Officer for Fidelity Investments from 2007 to 2016. |
| | |
Jeremy DePalma1 (Born 1974) | | Assistant Treasurer, since 2009 | | Senior Vice President of Wells Fargo Funds Management, LLC since 2009. Senior Vice President of Evergreen Investment Management Company, LLC from 2008 to 2010 and head of the Fund Reporting and Control Team within Fund Administration from 2005 to 2010. |
| 1 | Nancy Wiser acts as Treasurer of 65 funds in the Fund Complex. Jeremy DePalma acts as the Treasurer of 77 funds and Assistant Treasurer of 65 funds in the Fund Complex. |
| 2 | The Statement of Additional Information includes additional information about the Trustees and is available, without charge, upon request, by calling 1-800-222-8222 or by visiting the website at wfam.com. |
26 | Wells Fargo Utility and Telecommunications Fund
Other information (unaudited)
BOARD CONSIDERATION OF INVESTMENT MANAGEMENT AND SUB-ADVISORY AGREEMENTS:
Wells Fargo Utility and Telecommunications Fund
Under the Investment Company Act of 1940 (the “1940 Act”), the Board of Trustees (the “Board”) of Wells Fargo Funds Trust (the “Trust”) must determine annually whether to approve the continuation of the Trust’s investment management and sub-advisory agreements. In this regard, at a Board meeting held on May 26, 2020 and May 28, 2020 (together, the “Meeting”), the Board, all the members of which have no direct or indirect interest in the investment management and sub-advisory agreements and are not “interested persons” of the Trust, as defined in the 1940 Act (the “Independent Trustees”), reviewed and approved for Wells Fargo Utility and Telecommunications Fund (the “Fund”): (i) an investment management agreement (the “Management Agreement”) with Wells Fargo Funds Management, LLC (“Funds Management”); and (ii) an investment sub-advisory agreement (the “Sub-Advisory Agreement”) with Wells Capital Management Incorporated (the “Sub-Adviser”), an affiliate of Funds Management. The Management Agreement and the Sub-Advisory Agreement are collectively referred to as the “Advisory Agreements.”
At the Meeting, the Board considered the factors and reached the conclusions described below relating to the selection of Funds Management and the Sub-Adviser and the approval of the Advisory Agreements. Prior to the Meeting, including at a Board meeting held in April 2020, the Trustees conferred extensively among themselves and with representatives of Funds Management about these matters. Also, the Board has adopted a team-based approach, with each team consisting of a sub-set of Trustees, to assist the full Board in the discharge of its duties in reviewing investment performance and other matters throughout the year. The Independent Trustees were assisted in their evaluation of the Advisory Agreements by independent legal counsel, from whom they received separate legal advice and with whom they met separately.
In providing information to the Board, Funds Management and the Sub-Adviser were guided by a detailed set of requests for information submitted to them by independent legal counsel on behalf of the Independent Trustees at the start of the Board’s annual contract renewal process earlier in 2020. In considering and approving the Advisory Agreements, the Trustees considered the information they believed relevant, including but not limited to the information discussed below. The Board considered not only the specific information presented in connection with the Meeting, but also the knowledge gained over time through interaction with Funds Management and the Sub-Adviser about various topics. In this regard, the Board reviewed reports of Funds Management at each of its quarterly meetings, which included, among other things, portfolio reviews and investment performance reports. In addition, the Board and the teams mentioned above confer with portfolio managers at various times throughout the year. The Board did not identify any particular information or consideration that was all-important or controlling, and each individual Trustee may have attributed different weights to various factors.
After its deliberations, the Board unanimously approved the continuation of the Advisory Agreements for a one-year term and determined that the compensation payable to Funds Management and the Sub-Adviser under each of the Advisory Agreements was reasonable. The Board considered the approval of the Advisory Agreements for the Fund as part of its consideration of agreements for funds across the complex, but its approvals were made on a fund-by-fund basis. The following summarizes a number of important, but not necessarily all, factors considered by the Board in support of its approvals.
Nature, extent and quality of services
The Board received and considered various information regarding the nature, extent and quality of services provided to the Fund by Funds Management and the Sub-Adviser under the Advisory Agreements. This information included a description of the investment advisory services and Fund-level administrative services covered by the Management Agreement, as well as, among other things, a summary of the background and experience of senior management of Wells Fargo Asset Management (“WFAM”), of which Funds Management and the Sub-Adviser are a part, and a summary of investments made in the business of WFAM. The Board also received a description of Funds Management’s and the Sub-Adviser’s business continuity plans and of their approaches to data privacy and cybersecurity, and related testing. The Board also received and reviewed information about Funds Management’s role as administrator of the Fund’s liquidity risk management program, Funds Management’s approach to risk management, and Funds Management’s intermediary and vendor oversight program.
The Board also considered the qualifications, background, tenure and responsibilities of each of the portfolio managers primarily responsible for the day-to-day portfolio management of the Fund. The Board evaluated the ability of Funds Management and the Sub-Adviser to attract and retain qualified investment professionals, including research, advisory and supervisory personnel. The Board further considered the compliance programs and compliance records of Funds Management and the Sub-Adviser. In addition, the Board took into account the full range of services provided to the Fund by Funds Management and its affiliates.
Wells Fargo Utility and Telecommunications Fund | 27
Other information (unaudited)
Fund investment performance and expenses
The Board considered the investment performance results for the Fund over various time periods ended December 31, 2019. The Board also considered more current results for various time periods ended March 31, 2020. The Board considered these results in comparison to the investment performance of funds in a universe that was determined by Broadridge Inc. (“Broadridge”) to be similar to the Fund (the “Universe”), and in comparison to the Fund’s benchmark index and to other comparative data. Broadridge is an independent provider of investment company data. The Board received a description of the methodology used by Broadridge to select the mutual funds in the performance Universe. The Board noted that the investment performance of the Fund (Class A) was higher than the average investment performance of the Universe for the one-, three-, five- and ten-year periods ended December 31, 2019. The Board also noted that the investment performance of the Fund (Administrator Class) was higher than the average investment performance of the Universe for all periods ended March 31, 2020. The Board also noted that the investment performance of the Fund was higher than its benchmark index, the S&P 500 Utilities Index, for the one- and three-year periods ended December 31, 2019, and lower than its benchmark index for the five-and ten-year periods ended December 31, 2019. The Board also noted that the investment performance of the Fund was higher than its benchmark index, the S&P 500 Utilities Index, for the one- and three-year periods ended March 31, 2020, and lower than its benchmark index for the five- and ten-year periods ended March 31, 2020.
The Board received information concerning, and discussed factors contributing to, the underperformance of the Fund relative to the benchmark index for the periods identified above. The Board took note of the explanations for the relative underperformance during these periods, including with respect to investment decisions and market factors that affected the Fund’s investment performance.
The Board also received and considered information regarding the Fund’s net operating expense ratios and their various components, including actual management fees, custodian and other non-management fees, and Rule 12b-1 and non-Rule 12b-1 shareholder service fees. The Board considered these ratios in comparison to the median ratios of funds in class-specific expense groups that were determined by Broadridge to be similar to the Fund (the “Groups”). The Board received a description of the methodology used by Broadridge to select the mutual funds in the expense Groups and an explanation of how funds comprising expense groups and their expense ratios may vary from year-to-year. Based on the Broadridge reports, the Board noted that the net operating expense ratios of the Fund were lower than the median net operating expense ratios of the expense Groups for each share class.
The Board took into account the Fund’s investment performance and expense information provided to it among the factors considered in deciding to re-approve the Advisory Agreements.
Investment management and sub-advisory fee rates
The Board reviewed and considered the contractual fee rates payable by the Fund to Funds Management under the Management Agreement, as well as the contractual fee rates payable by the Fund to Funds Management for class-level administrative services under a Class-Level Administration Agreement, which include, among other things, class-level transfer agency and sub-transfer agency costs (collectively, the “Management Rates”). The Board also reviewed and considered the contractual investment sub-advisory fee rates that are payable by Funds Management to the Sub-Adviser for investment sub-advisory services.
Among other information reviewed by the Board was a comparison of the Fund’s Management Rates with the average contractual investment management fee rates of funds in the expense Groups at a common asset level as well as transfer agency costs of the funds in the expense Groups. The Board noted that the Management Rates of the Fund were lower than, in range of or equal to the sum of these average rates for the Fund’s expense Groups for all share classes.
The Board also received and considered information about the portion of the total management fee that was retained by Funds Management after payment of the fee to the Sub-Adviser for sub-advisory services. In assessing the reasonableness of this amount, the Board received and evaluated information about the nature and extent of responsibilities retained and risks assumed by Funds Management and not delegated to or assumed by the Sub-Adviser, and about Funds Management’s on-going oversight services. Given the affiliation between Funds Management and the Sub-Adviser, the Board ascribed limited relevance to the allocation of fees between them.
Based on its consideration of the factors and information it deemed relevant, including those described here, the Board determined that the compensation payable to Funds Management under the Management Agreement and to the Sub-Adviser under the Sub-Advisory Agreement was reasonable.
28 | Wells Fargo Utility and Telecommunications Fund
Other information (unaudited)
Profitability
The Board received and considered information concerning the profitability of Funds Management, as well as the profitability of both WFAM and Wells Fargo & Co. (“Wells Fargo”) from providing services to the fund family as a whole. The Board noted that the Sub-Adviser’s profitability information with respect to providing services to the Fund and other funds in the family was subsumed in the WFAM and Wells Fargo profitability analysis.
Funds Management reported on the methodologies and estimates used in calculating profitability, including a description of the methodology used to allocate certain expenses. Among other things, the Board noted that the levels of profitability reported on a fund-by-fund basis varied widely, depending on factors such as the size, type and age of fund.
Based on its review, the Board did not deem the profits reported by Funds Management, WFAM or Wells Fargo from services provided to the Fund to be at a level that would prevent it from approving the continuation of the Advisory Agreements.
Economies of scale
The Board received and considered information about the potential for Funds Management to experience economies of scale in the provision of management services to the Fund, the difficulties of calculating economies of scale at an individual fund level, and the extent to which potential scale benefits are shared with shareholders. The Board noted the existence of breakpoints in the Fund’s management fee structure, which operate generally to reduce the Fund’s expense ratios as the Fund grows in size, and the size of the Fund in relation to such breakpoints. The Board considered that in addition to management fee breakpoints, Funds Management shares potential economies of scale from its management business in a variety of ways, including through fee waiver and expense reimbursement arrangements, services that benefit shareholders, competitive management fee rates set at the outset without regard to breakpoints, and investments in the business intended to enhance services available to shareholders.
The Board concluded that Funds Management’s arrangements with respect to the Fund, including contractual breakpoints, constituted a reasonable approach to sharing potential economies of scale with the Fund and its shareholders.
Other benefits to Funds Management and the Sub-Adviser
The Board received and considered information regarding potential “fall-out” or ancillary benefits received by Funds Management and its affiliates, including the Sub-Adviser, as a result of their relationships with the Fund. Ancillary benefits could include, among others, benefits directly attributable to other relationships with the Fund and benefits potentially derived from an increase in Funds Management’s and the Sub-Adviser’s business as a result of their relationships with the Fund. The Board noted that various affiliates of Funds Management may receive distribution-related fees, shareholder servicing payments and sub-transfer agency fees in respect of shares sold or held through them and services provided.
The Board also reviewed information about soft dollar credits earned and utilized by the Sub-Adviser, fees earned by Funds Management and the Sub-Adviser from managing a private investment vehicle for the fund family’s securities lending collateral, and commissions earned by an affiliated broker from portfolio transactions.
Based on its consideration of the factors and information it deemed relevant, including those described here, the Board did not find that any ancillary benefits received by Funds Management and its affiliates, including the Sub-Adviser, were unreasonable.
Conclusion
At the Meeting, after considering the above-described factors and based on its deliberations and its evaluation of the information described above, the Board unanimously approved the continuation of the Advisory Agreements for a one-year term and determined that the compensation payable to Funds Management and the Sub-Adviser under each of the Advisory Agreements was reasonable.
Wells Fargo Utility and Telecommunications Fund | 29
Other information (unaudited)
LIQUIDITY RISK MANAGEMENT PROGRAM
In accordance with Rule 22e-4 under the Investment Company Act of 1940, as amended (the “Liquidity Rule”), Wells Fargo Funds Trust (the “Trust”) has adopted and implemented a liquidity risk management program (the “Program”) on behalf of each of its series, including the Fund, which is reasonably designed to assess and manage the Fund’s liquidity risk. “Liquidity risk” is defined as the risk that the Fund is unable to meet redemption requests without significantly diluting remaining investors’ interests in the Fund. The Trust’s Board of Trustees (the “Board”) previously approved the designation of Wells Fargo Funds Management, LLC (“Funds Management”), the Fund’s investment manager, as the administrator of the Program, and Funds Management has established a Liquidity Risk Management Council composed of personnel from multiple departments within Funds Management and its affiliates to assist Funds Management in the implementation and on-going administration of the Program.
The Program is comprised of various components designed to support the assessment and/or management of liquidity risk, including: (1) the periodic assessment (no less frequently than annually) of certain factors that influence the Fund’s liquidity risk; (2) the periodic classification (no less frequently than monthly) of the Fund’s investments into one of four liquidity categories that reflect an estimate of their liquidity under current market conditions; (3) a 15% limit on the acquisition of “illiquid investments” (as defined under the Liquidity Rule); (4) to the extent the Fund does not invest primarily in “highly liquid investments” (as defined under the Liquidity Rule), the determination of a minimum percentage of the Fund’s assets that generally will be invested in highly liquid investments (an “HLIM”); (5) if the Fund has established an HLIM, the periodic review (no less frequently than annually) of the HLIM and the adoption of policies and procedures for responding to a shortfall of the Fund’s “highly liquid investments” below its HLIM; and (6) periodic reporting to the Board.
At a meeting of the Board held on May 26 and 28, 2020, the Board received a written report (the “Report”) from Funds Management that addressed the operation of the Program and assessed its adequacy and effectiveness of implementation. The Report covered the initial period from December 1, 2018 through December 31, 2019 (the “Reporting Period”). No significant liquidity events impacting the Fund were noted in the Report. There were no material changes to the Program during the Reporting Period. The Report concluded that the Program is operating effectively to assess and manage the Fund’s liquidity risk, and that the Program has been and continues to be adequately and effectively implemented to monitor and, as applicable, respond to the Fund’s liquidity developments.
There can be no assurance that the Program will achieve its objectives under all circumstances in the future. Please refer to the Fund’s prospectus for more information regarding the Fund’s exposure to liquidity risk and other risks to which an investment in the Fund may be subject.
30 | Wells Fargo Utility and Telecommunications Fund
Appendix I (unaudited)
Effective June 1, 2020, shareholders purchasing Fund shares through an Oppenheimer & Co. Inc. (“Oppenheimer”) platform or account are eligible only for the following load waivers (front-end sales charge waivers and contingent deferred or back-end, sales charge waivers) and discounts, which may differ from those disclosed in the Fund’s Prospectus or SAI.
|
|
| Front-end Sales Load Waivers on Class A Shares available at Oppenheimer |
|
| Employer-sponsored retirement, deferred compensation and employee benefit plans (including health savings accounts) and trusts used to fund those plans, provided that the shares are not held in a commission-based brokerage account and shares are held for the benefit of the plan. |
|
| Shares purchased by or through a 529 Plan. |
|
| Shares purchased through an Oppenheimer affiliated investment advisory program. |
|
| Shares purchased through reinvestment of capital gains distributions and dividend reinvestment when purchasing shares of the same fund (but not any other fund within the fund family). |
|
| Shares purchased from the proceeds of redemptions within the same fund family, provided (1) the repurchase occurs within 90 days following the redemption, (2) the redemption and purchase occur in the same account, and (3) redeemed shares were subject to a front-end or deferred sales load (known as Rights of Restatement). |
|
| A shareholder in the Fund’s Class C shares will have their shares exchanged at net asset value to Class A shares (or the appropriate share class) of the Fund if the shares are no longer subject to a CDSC and the exchange is in line with the policies and procedures of Oppenheimer. |
|
| Employees and registered representatives of Oppenheimer or its affiliates and their family members. |
|
| Directors or Trustees of the Fund, and employees of the Fund’s investment adviser or any of its affiliates, as described in the Prospectus. |
|
| CDSC Waivers on A and C Shares available at Oppenheimer |
|
| Death or disability of the shareholder. |
|
| Shares sold as part of a systematic withdrawal plan as described in the Prospectus. |
|
| Return of excess contributions from an IRA Account. |
|
| Shares sold as part of a required minimum distribution for IRA and retirement accounts due to the shareholder reaching the qualified age based on applicable IRS regulations as described in the Prospectus. |
|
| Shares sold to pay Oppenheimer fees but only if the transaction is initiated by Oppenheimer. |
|
| Shares acquired through a right of reinstatement. |
|
| Front-end load Discounts Available at Oppenheimer: Breakpoints, Rights of Accumulation & Letters of Intent |
|
| Breakpoints as described in the Prospectus. |
|
| Rights of Accumulation (ROA), which entitle shareholders to breakpoint discounts, will be automatically calculated based on the aggregated holding of fund family assets held by accounts within the purchaser’s household at Oppenheimer. Eligible fund family assets not held at Oppenheimer may be included in the ROA calculation only if the shareholder notifies his or her financial advisor about such assets. |
Wells Fargo Utility and Telecommunications Fund | 31
Appendix II (unaudited)
Effective June 15, 2020, shareholders purchasing fund shares through a Robert W. Baird & Co. (“Baird”) platform or account will only be eligible for the following sales charge waivers (front-end sales charge waivers and CDSC waivers) and discounts, which may differ from those disclosed elsewhere in the Fund’s Prospectus or the SAI.
|
|
| Front-end Sales Load Waivers on Class A Shares available at Baird |
|
| Shares purchased through reinvestment of capital gains distributions and dividend reinvestment when purchasing share of the same fund. |
|
| Share purchase by employees and registers representatives of Baird or its affiliate and their family members as designated by Baird. |
|
| Shares purchase from the proceeds of redemptions within the same fund family, provided (1) the repurchase occurs within 90 days following the redemption, (2) the redemption and purchase occur in the same accounts, and (3) redeemed shares were subject to a front-end or deferred sales charge (known as rights of reinstatement). |
|
| A shareholder in the Funds Investor C Shares will have their share exchanged at net asset value to Investor A shares of the fund if the shares are no longer subject to CDSC and the exchange is in line with the policies and procedures of Baird. |
|
| Employer-sponsored retirement plans or charitable accounts in a transactional brokerage account at Baird, including 401(k) plans, 457 plans, employer-sponsored 403(b) plans, profit sharing and money purchase pension plans and defined benefit plans. For purposes of this provision, employer-sponsored retirement plans do not include SEP IRAs, Simple IRAs or SAR-SEPs. |
|
| CDSC Waivers on A and C Shares available at Baird |
|
| Shares sold due to death or disability of the shareholder. |
|
| Shares sold as part of a systematic withdrawal plan as described in the Fund’s Prospectus. |
|
| Shares bought due to returns of excess contributions from an IRA Account. |
|
| Shares sold as part of a required minimum distribution for IRA and retirement accounts due to the shareholder reaching age 72 as described in the Fund’s Prospectus. |
|
| Shares sold to pay Baird fees but only if the transaction is initiated by Baird. |
|
| Shares acquired through a right of reinstatement. |
|
| Front-end load Discounts Available at Baird: Breakpoint and/or Rights of Accumulation |
|
| Breakpoints as described in the Prospectus. |
|
| Rights of accumulations which entitles shareholders to breakpoint discounts will be automatically calculated based on the aggregated holding of fund family assets held by accounts within the purchaser’s household at Baird. Eligible fund family assets not held at Baird may be included in the rights of accumulations calculation only if the shareholder notifies his or her financial advisor about such assets. |
|
| Letters of Intent (LOI) allow for breakpoint discounts based on anticipated purchases within a fund family through Baird, over a 13-month period of time. |
32 | Wells Fargo Utility and Telecommunications Fund

For more information
More information about Wells Fargo Funds is available free upon request. To obtain literature, please write, visit the Fund’s website, or call:
Wells Fargo Funds
P.O. Box 219967
Kansas City, MO 64121-9967
Website: wfam.com
Individual investors: 1-800-222-8222
Retail investment professionals: 1-888-877-9275
Institutional investment professionals: 1-866-765-0778

This report and the financial statements contained herein are submitted for the general information of the shareholders of the Fund. If this report is used for promotional purposes, distribution of the report must be accompanied or preceded by a current prospectus. Before investing, please consider the investment objectives, risks, charges, and expenses of the investment. For a current prospectus and, if available, a summary prospectus, containing this information, call 1-800-222-8222 or visit the Fund’s website at wfam.com. Read the prospectus carefully before you invest or send money.
Wells Fargo Asset Management (WFAM) is the trade name for certain investment advisory/management firms owned by Wells Fargo & Company. These firms include but are not limited to Wells Capital Management Incorporated and Wells Fargo Funds Management, LLC. Certain products managed by WFAM entities are distributed by Wells Fargo Funds Distributor, LLC (a broker-dealer and Member FINRA).
This material is for general informational and educational purposes only and is NOT intended to provide investment advice or a recommendation of any kind—including a recommendation for any specific investment, strategy, or plan.
INVESTMENT PRODUCTS: NOT FDIC INSURED ◾ NO BANK GUARANTEE ◾ MAY LOSE VALUE
© 2020 Wells Fargo & Company. All rights reserved.
PAR-1020-00768 11-20
SA318/SAR318 09-20
ITEM 2. CODE OF ETHICS
Not applicable.
ITEM 3. AUDIT COMMITTEE FINANCIAL EXPERT
Not applicable.
ITEM 4. PRINCIPAL ACCOUNTANT FEES AND SERVICES
Not applicable.
ITEM 5. AUDIT COMMITTEE OF LISTED REGISTRANTS
Not applicable.
ITEM 6. INVESTMENTS
A Portfolio of Investments for each series of Wells Fargo Funds Trust is included as part of the report to shareholders filed under Item 1 of this Form.
ITEM 7. DISCLOSURE OF PROXY VOTING POLICIES AND PROCEDURES FOR CLOSED-END MANAGEMENT INVESTMENT COMPANIES
Not applicable.
ITEM 8. PORTFOLIO MANAGERS OF CLOSED-END MANAGEMENT INVESTMENT COMPANIES
Not applicable.
ITEM 9. PURCHASES OF EQUITY SECURITIES BY CLOSED-END MANAGEMEENT INVESTMENT COMPANY AND AFFILIATED PURCHASERS
Not applicable.
ITEM 10. SUBMISSION OF MATTERS TO A VOTE OF SECURITY HOLDERS
There have been no material changes to the procedures by which shareholders may recommend nominees to the registrant’s Board of Trustees that have been implemented since the registrant’s last provided disclosure in response to the requirements of this Item.
ITEM 11. CONTROLS AND PROCEDURES
(a) The President and Treasurer have concluded that the Wells Fargo Funds Trust disclosure controls and procedures (as defined in Rule 30a-3(c) under the Investment Company Act of 1940) provide reasonable assurances that material information relating to the registrant is made known to them by the appropriate persons, based on their evaluation of these controls and procedures as of a date within 90 days of the filing of this report.
(b) There were no significant changes in the registrant’s internal controls over financial reporting (as defined in Rule 30a-3(d) under the Investment Company Act of 1940) that occurred during the most recent fiscal half-year of the period covered by this report that materially affected, or is reasonably likely to materially affect, the registrant’s internal control over financial reporting.
ITEM 12. DISCLOSURES OF SECURITIES LENDING ACTIVITES FOR CLOSED-END MANAGEMENT INVESTMENT COMPANIES
Not applicable.
ITEM 13. EXHIBITS
(a)(1) Not applicable.
(a)(2) Certifications pursuant to Section 302 of the Sarbanes-Oxley Act of 2002.
(b) Certifications pursuant to Section 906 of the Sarbanes-Oxley Act of 2002.
SIGNATURES
Pursuant to the requirements of the Securities Exchange Act of 1934 and the Investment Company Act of 1940, the registrant has duly caused this report to be signed on its behalf by the undersigned, thereunto duly authorized.
| | |
Wells Fargo Funds Trust |
| |
| By: | | /s/Andrew Owen |
| | Andrew Owen |
| | President |
| |
| Date: | | November 24, 2020 |
Pursuant to the requirements of the Securities Exchange Act of 1934 and the Investment Company Act of 1940, this report has been signed below by the following persons on behalf of the registrant and in the capacities and on the date indicated.
| | |
Wells Fargo Funds Trust |
| |
| By: | | /s/Andrew Owen |
| | Andrew Owen |
| | President |
| |
| Date: | | November 24, 2020 |
| | |
| |
| By: | | /s/Nancy Wiser |
| | Nancy Wiser |
| | Treasurer |
| |
| Date: | | November 24, 2020 |