
UNITED STATES
SECURITIES AND EXCHANGE COMMISSION
Washington, D.C. 20549
FORM N-CSRS
CERTIFIED SHAREHOLDER REPORT OF REGISTERED
MANAGEMENT INVESTMENT COMPANIES
Investment Company Act file number: 811-09253
Wells Fargo Funds Trust
(Exact name of registrant as specified in charter)
525 Market St., San Francisco, CA 94105
(Address of principal executive offices) (Zip code)
Catherine Kennedy
Wells Fargo Funds Management, LLC
525 Market St., San Francisco, CA 94105
(Name and address of agent for service)
Registrant’s telephone number, including area code: 800-222-8222
Date of fiscal year end: February 28
Registrant is making a filing for 23 of its series:
Wells Fargo Dynamic Target Today Fund, Wells Fargo Dynamic Target 2015 Fund, Wells Fargo Dynamic Target 2020 Fund, Wells Fargo Dynamic Target 2025 Fund, Wells Fargo Dynamic Target 2030 Fund, Wells Fargo Dynamic Target 2035 Fund, Wells Fargo Dynamic Target 2040 Fund, Wells Fargo Dynamic Target 2045 Fund, Wells Fargo Dynamic Target 2050 Fund, Wells Fargo Dynamic Target 2055 Fund, Wells Fargo Dynamic Target 2060 Fund, Wells Fargo Target Today Fund, Wells Fargo Target 2010 Fund, Wells Fargo Target 2015 Fund, Wells Fargo Target 2020 Fund, Wells Fargo Target 2025 Fund, Wells Fargo Target 2030 Fund, Wells Fargo Target 2035 Fund, Wells Fargo Target 2040 Fund, Wells Fargo Target 2045 Fund, Wells Fargo Target 2050 Fund, Wells Fargo Target 2055 Fund, and Wells Fargo Target 2060 Fund.
Date of reporting period: August 31, 2020
ITEM 1. REPORT TO STOCKHOLDERS
Semi-Annual Report
August 31, 2020
Target Date Retirement Funds
| ∎ | | Wells Fargo Target Today Fund |
| ∎ | | Wells Fargo Target 2010 Fund |
| ∎ | | Wells Fargo Target 2015 Fund |
| ∎ | | Wells Fargo Target 2020 Fund |
| ∎ | | Wells Fargo Target 2025 Fund |
| ∎ | | Wells Fargo Target 2030 Fund |
| ∎ | | Wells Fargo Target 2035 Fund |
| ∎ | | Wells Fargo Target 2040 Fund |
| ∎ | | Wells Fargo Target 2045 Fund |
| ∎ | | Wells Fargo Target 2050 Fund |
| ∎ | | Wells Fargo Target 2055 Fund |
| ∎ | | Wells Fargo Target 2060 Fund |
Beginning on January 1, 2021, as permitted by new regulations adopted by the Securities and Exchange Commission, paper copies of the Wells Fargo Funds’ annual and semi-annual shareholder reports issued after this date will no longer be sent by mail, unless you specifically request paper copies of the reports. Instead, the reports will be made available on the Funds’ website, and you will be notified by mail each time a report is posted and provided with a website address to access the report.
If you already elected to receive shareholder reports electronically, you will not be affected by this change and you need not take any action. You may elect to receive shareholder reports and other communications from the Fund electronically at any time by contacting your financial intermediary (such as a broker-dealer or bank) or, if you are a direct investor, by calling 1-800-222-8222 or by enrolling at wellsfargo.com/advantagedelivery.
You may elect to receive all future reports in paper free of charge. If you invest through a financial intermediary, you can contact your financial intermediary to request that you continue to receive paper copies of your shareholder reports; if you invest directly with the Fund, you can call 1-800-222-8222. Your election to receive reports in paper will apply to all Wells Fargo Funds held in your account with your financial intermediary or, if you are a direct investor, to all Wells Fargo Funds that you hold.
|
|
|
Reduce clutter. Save trees. |
Sign up for electronic delivery of prospectuses and shareholder reports at wellsfargo.com/ advantagedelivery |
The views expressed and any forward-looking statements are as of August 31, 2020, unless otherwise noted, and are those of the Fund managers and/or Wells Fargo Asset Management. Discussions of individual securities, or the markets generally, or any Wells Fargo Fund are not intended as individual recommendations. Future events or results may vary significantly from those expressed in any forward-looking statements. The views expressed are subject to change at any time in response to changing circumstances in the market. Wells Fargo Asset Management and the Fund disclaim any obligation to publicly update or revise any views expressed or forward-looking statements.
INVESTMENT PRODUCTS: NOT FDIC INSURED ◾ NO BANK GUARANTEE ◾ MAY LOSE VALUE
Wells Fargo Target Date Retirement Funds | 1
Letter to shareholders (unaudited)

Andrew Owen
President
Wells Fargo Funds
Dear Shareholder:
We are pleased to offer you this semi-annual report for the Wells Fargo Target Date Funds for the six-month period that ended August 31, 2020. Global stock markets tumbled in March as governments took unprecedented measures to stop the spread of the coronavirus at the expense of short-term economic output. However, most markets rebounded from April on to more than offset losses as central banks bolstered capital markets and confidence. U.S. equities easily outperformed other assets, though stocks broadly performed well while bonds had more modest returns for the six-month period.
For the period, U.S. stocks, based on the S&P 500 Index,1 returned 19.63% and international stocks, as measured by the MSCI ACWI ex USA Index (Net),2 gained 8.17%. The MSCI Emerging Markets Index (Net)3 gained 11.23%. For bond investors, the Bloomberg Barclays U.S. Aggregate Bond Index4 added 2.98%, the Bloomberg Barclays Global Aggregate ex-USD Index5 returned 4.80%, the Bloomberg Barclays Municipal Bond Index6 had a more modest 0.19% return, and the ICE BofA U.S. High Yield Index7 gained 2.34%.
Concerns about the coronavirus took over the market.
As the six-month period began, the global spread of the coronavirus led many countries to clamp down on social and business-related activity in March in order to contain the virus from causing even greater devastation and overwhelming the health care system. This abrupt stoppage of economic activity led to the sharp deceleration of global output, sending economies into a deep contraction. Central bank responses were swift, as they slashed interest rates and expanded quantitative easing programs to restore liquidity and confidence to the markets. In the U.S., the Federal Reserve (Fed) launched several lending programs, funding investment-grade bonds, money market mutual funds, and commercial paper while purchasing Treasuries, mortgage-backed securities, and overnight repurchase agreements. Meanwhile, stock markets tumbled quickly into a bear market, ending the longest bull stock market in U.S. history.
Markets rebounded strongly in April, fueled by unprecedented government and central bank stimulus measures. The U.S. economy contracted by an annualized 5.0% pace in the first quarter, with 30 million new unemployment insurance claims in six weeks. In the eurozone, first-quarter real gross domestic product (GDP) shrank 3.8%, with the composite April Flash Purchasing Managers’ Index falling to an all-time low of 13.5. The European Central Bank expanded its quantitative easing to include the purchase of additional government bonds of countries with the greatest virus-related need,
| 1 | The S&P 500 Index consists of 500 stocks chosen for market size, liquidity, and industry group representation. It is a market-value-weighted index with each stock’s weight in the index proportionate to its market value. You cannot invest directly in an index. |
| 2 | The Morgan Stanley Capital International (MSCI) All Country World Index (ACWI) ex USA Index (Net) is a free-float-adjusted market-capitalization-weighted index that is designed to measure the equity market performance of developed and emerging markets, excluding the United States. Source: MSCI. MSCI makes no express or implied warranties or representations and shall have no liability whatsoever with respect to any MSCI data contained herein. The MSCI data may not be further redistributed or used as a basis for other indices or any securities or financial products. This report is not approved, reviewed, or produced by MSCI. You cannot invest directly in an index. |
| 3 | The MSCI Emerging Markets (EM) Index (Net) is a free-float-adjusted market-capitalization-weighted index that is designed to measure equity market performance of emerging markets. You cannot invest directly in an index. |
| 4 | The Bloomberg Barclays U.S. Aggregate Bond Index is a broad-based benchmark that measures the investment-grade, U.S. dollar-denominated, fixed-rate taxable bond market, including Treasuries, government-related and corporate securities, mortgage-backed securities (agency fixed-rate and hybrid adjustable-rate mortgage pass-throughs), asset-backed securities, and commercial mortgage-backed securities. You cannot invest directly in an index. |
| 5 | The Bloomberg Barclays Global Aggregate ex-USD Index is an unmanaged index that provides a broad-based measure of the global investment-grade fixed-income markets excluding the U.S. dollar-denominated debt market. You cannot invest directly in an index. |
| 6 | The Bloomberg Barclays Municipal Bond Index is an unmanaged index composed of long-term tax-exempt bonds with a minimum credit rating of Baa. You cannot invest directly in an index. |
| 7 | The ICE BofA U.S. High Yield Index is a market-capitalization-weighted index of domestic and Yankee high-yield bonds. The index tracks the performance of high-yield securities traded in the U.S. bond market. You cannot invest directly in an index. Copyright 2020. ICE Data Indices, LLC. All rights reserved. |
2 | Wells Fargo Target Date Retirement Funds
Letter to shareholders (unaudited)
including Italy and Spain. China’s first-quarter GDP fell by 6.8% year over year. However, retail sales, production, and investment showed signs of recovery. Extreme oil-price volatility continued as global supply far exceeded demand.
The equity market rebound continued in May, with widespread strong monthly gains. Investors regained confidence on reports of early signs of success in human trials of a coronavirus vaccine. Growth stocks continued to outperform value stocks while returns on global government bonds were generally flat. In the U.S., a gap grew between the stock market rebound and devastating economic data points, including an April unemployment rate of 14.7%, the highest level since World War II. Purchasing managers’ indices continued to reflect weakening activity in May in both the manufacturing and services sectors. U.S. corporate earnings reports indicated a 14% year-over-year contraction in earnings from the first quarter of 2019. However, high demand for technology, driven by remote activity, helped maintain robust information technology sector earnings, which helped drive leading technology stocks higher.
Financial markets posted widely positive returns in June despite ongoing economic weakness and high levels of uncertainty on the containment of the coronavirus and the timing of an effective vaccine. There were hopeful signs as economies reopened, with U.S. and U.K. retail sales rebounding sharply in May. However, year over year, sales remained depressed. Vitally important to market sentiment was the ongoing commitment by central banks globally to do all they could to provide economic support through liquidity and low borrowing costs. U.S. economic activity was aided by one-time $1,200 stimulus checks and $600 bonus weekly unemployment benefits due to expire at the end of July. However, unemployment remained historically high but eased from 14.7% in April to 11.1% in June. During June, numerous states reported increases in coronavirus cases. China’s economic recovery picked up momentum in June, though it remained far from a full recovery.
July was a broadly positive month for both global equities and fixed income. However, economic data and a resurgence of coronavirus cases pointed to the vulnerability of the global economy and the ongoing imperative to regain control of the pandemic. Second-quarter GDP shrank from the previous quarter by 9.5% and 12.1% in the U.S. and eurozone, respectively. In contrast, China reported a 3.2% year-over-year expansion in its second-quarter GDP. U.S. unemployment remained high despite adding 1.8 million jobs in July, with a double-digit jobless rate persisting. However, manufacturing activity grew in both the U.S. and eurozone. In Asia, while China’s manufacturing sector continued to expand, activity in Japan and South Korea contracted. In July, a rising concern was the rapid and broad reemergence of coronavirus infections.
The stock market continued to rally in August despite concerns over rising numbers of COVID-19 cases in the United States and several European countries, including France and Spain, as well as the expiration of the $600 weekly bonus unemployment benefit at the end of July. U.S. stocks had strong monthly gains, led by the so-called FAANG stocks—Facebook, Apple, Amazon, Netflix, and Google (Alphabet)—which dominate these indices and continued to rally. U.S. stocks generally surpassed other broadly positive global equity performance while fixed-income market monthly returns were broadly flat. Generally stronger-than-expected second-quarter earnings boosted investor sentiment along with the Fed’s announcement of a policy shift that will likely lead to longer-term low interest rates and supportive monetary policy. The U.S. flash purchasing managers’ indices for both manufacturing and services beat expectations while U.S. housing market indicators were strong. In Europe, retail sales expanded and consumer confidence remained steady. China’s economy continued its fairly steady expansion. Overall, developed markets performed better than emerging market equities for the month of August as people took comfort in better-known equities in perceived safer markets.
“The stock market continued to rally in August despite concerns over rising numbers of COVID-19 cases in the United States and several European countries, including France and Spain, as well as the expiration of the $600 weekly bonus unemployment benefit at the end of July.”
Wells Fargo Target Date Retirement Funds | 3
Letter to shareholders (unaudited)
|
|
|
For further information about your Fund, contact your investment professional, visit our website at wfam.com, or call us directly at 1-800-222-8222. |
Don’t let short-term uncertainty derail long-term investment goals.
Periods of investment uncertainty can present challenges, but experience has taught us that maintaining long-term investment goals can be an effective way to plan for the future. To help you create a sound strategy based on your personal goals and risk tolerance, Wells Fargo Funds offers more than 100 mutual funds spanning a wide range of asset classes and investment styles. Although diversification cannot guarantee an investment profit or prevent losses, we believe it can be an effective way to manage investment risk and potentially smooth out overall portfolio performance. We encourage investors to know their investments and to understand that appropriate levels of risk-taking may unlock opportunities.
Thank you for choosing to invest with Wells Fargo Funds. We appreciate your confidence in us and remain committed to helping you meet your financial needs.
Sincerely,

Andrew Owen
President
Wells Fargo Funds
Notice to Shareholders
At a meeting held on August 10-12, 2020, the Board of Trustees of the Funds approved a change to the Funds’ automatic conversion feature for Class C shares in order to shorten the required holding period from 10 to 8 years. As a result, on a monthly basis beginning November 5, 2020, Class C shares will convert automatically into Class A shares 8 years after the initial date of purchase or, if you acquired your Class C shares through an exchange or conversion from another share class, 8 years after the date you acquired your Class C shares. When Class C shares that you acquired through a purchase or exchange convert, any other Class C shares that you purchased with reinvested dividends and distributions also will convert into Class A shares on a pro rata basis.
Please note that a shorter holding period may apply depending on your intermediary. Please see “Appendix A—Sales Charge Reductions and Waivers for Certain Intermediaries” in the Funds’ prospectus for further information.
4 | Wells Fargo Target Date Retirement Funds
This page is intentionally left blank.
Performance highlights (unaudited)
Wells Fargo Target Date Funds
Investment objective
Each Fund seeks total return over time, consistent with its strategic target asset allocation.
Manager
Wells Fargo Funds Management, LLC
Subadviser
Wells Fargo Capital Management Incorporated
Portfolio managers
Kandarp R. Acharya, CFA®‡, FRM
Petros N. Bocray, CFA®‡, FRM
Christian L. Chan, CFA®‡
The target date represents the year in which investors may likely begin withdrawing assets. The Funds gradually seek to reduce market risk as the target date approaches and after it arrives by decreasing equity exposure and increasing fixed income exposure. The principal value is not guaranteed at any time, including at the target date. The Funds will indirectly be exposed to all of the risks of an investment in the affiliated master portfolios and will bear expenses of the underlying affiliated master portfolios.
Stock values fluctuate in response to the activities of individual companies and general market and economic conditions. Bond values fluctuate in response to the financial condition of individual issuers, general market and economic conditions, and changes in interest rates. Changes in market conditions and government policies may lead to periods of heightened volatility in the bond market and reduced liquidity for certain bonds held by the Funds. In general, when interest rates rise, bond values fall and investors may lose principal value. Interest rate changes and their impact on the Funds and its share price can be sudden and unpredictable. High-yield securities have a greater risk of default and tend to be more volatile than higher-rated debt securities. The use of derivatives may reduce returns and/or increase volatility. Securities issued by U.S. government agencies or government sponsored entities may not be guaranteed by the U.S. Treasury. Certain investment strategies tend to increase the total risk of an investment (relative to the broader market). The Funds are exposed to foreign investment risk, mortgage-and asset-backed securities risk, and smaller-company investment risk. Consult the Funds’ prospectus for additional information on these and other risks.
| ‡ | CFA® and Chartered Financial Analyst® are trademarks owned by CFA Institute. |
6 | Wells Fargo Target Date Retirement Funds
Performance highlights (unaudited)
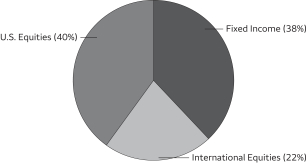
Target Today Fund
Average annual total returns (%) as of August 31, 2020
| | | | | | | | | | | | | | | | | | | | | | | | | | | | | | | | | | |
| | | | |
| | | | | Including sales charge | | | Excluding sales charge | | | Expense ratios1 (%) | |
| | | | | | | | | |
| | | Inception date | | 1 year | | | 5 year | | | 10 year | | | 1 year | | | 5 year | | | 10 year | | | Gross | | | Net2 | |
| | | | | | | | | | |
| Class A (STWRX) | | 3-1-1994 | | | -0.16 | | | | 2.98 | | | | 2.84 | | | | 5.89 | | | | 4.22 | | | | 3.45 | | | | 0.98 | | | | 0.60 | |
| | | | | | | | | | |
| Class C (WFODX) | | 12-1-1998 | | | 4.03 | | | | 3.43 | | | | 2.67 | | | | 5.03 | | | | 3.43 | | | | 2.67 | | | | 1.73 | | | | 1.35 | |
| | | | | | | | | | |
| Class R (WFRRX)3 | | 6-28-2013 | | | – | | | | – | | | | – | | | | 6.38 | | | | 4.08 | | | | 3.31 | | | | 1.23 | | | | 0.85 | |
| | | | | | | | | | |
| Class R4 (WOTRX)4 | | 11-30-2012 | | | – | | | | – | | | | – | | | | 6.15 | | | | 4.44 | | | | 3.79 | | | | 0.70 | | | | 0.29 | |
| | | | | | | | | | |
| Class R6 (WOTDX) | | 6-30-2004 | | | – | | | | – | | | | – | | | | 6.43 | | | | 4.68 | | | | 3.95 | | | | 0.55 | | | | 0.14 | |
| | | | | | | | | | |
| Administrator Class (WFLOX) | | 11-8-1999 | | | – | | | | – | | | | – | | | | 6.05 | | | | 4.31 | | | | 3.59 | | | | 0.90 | | | | 0.49 | |
| | | | | | | | | | |
| S&P Target Date Retirement Income Index5 | | – | | | – | | | | – | | | | – | | | | 8.35 | | | | 5.75 | | | | 5.68 | | | | – | | | | – | |
| | | | | | | | | | |
| Wells Fargo Target Today Blended Index6 | | – | | | – | | | | – | | | | – | | | | 6.80 | | | | – | | | | – | | | | – | | | | – | |
Figures quoted represent past performance, which is no guarantee of future results, and do not reflect taxes that a shareholder may pay on an investment in a fund. Investment return and principal value of an investment will fluctuate so that an investor’s shares, when redeemed, may be worth more or less than their original cost. Performance shown without sales charges would be lower if sales charges were reflected. Current performance may be lower or higher than the performance data quoted and assumes the reinvestment of dividends and capital gains. Current month-end performance is available on the Fund’s website, wfam.com.
Index returns do not include transaction costs associated with buying and selling securities, any mutual fund fees or expenses, or any taxes. It is not possible to invest directly in an index.
For Class A shares, the maximum front-end sales charge is 5.75%. For Class C shares, the maximum contingent deferred sales charge is 1.00%. Performance including a contingent deferred sales charge assumes the sales charge for the corresponding time period. Class R, Class R4, Class R6, and Administrator Class shares are sold without a front-end sales charge or contingent deferred sales charge.
| | | | |
|
| Holdings (%) as of August 31, 20207 | |
| | |
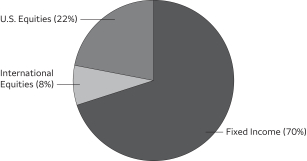
Wells Fargo Bloomberg Barclays US Aggregate ex-Corporate Portfolio | | | 34.56 | |
| | |
Wells Fargo Factor Enhanced International Equity Portfolio | | | 18.02 | |
| | |
Wells Fargo Factor Enhanced U.S. Large Cap Equity Portfolio | | | 11.75 | |
| | |
Wells Fargo Factor Enhanced Emerging Markets Equity Portfolio | | | 11.71 | |
| | |
Wells Fargo Factor Enhanced U.S. Small Cap Equity Portfolio | | | 6.06 | |
| | |
Wells Fargo Strategic Retirement Bond Portfolio | | | 5.02 | |
| | |
Wells Fargo Emerging Markets Bond Portfolio | | | 2.95 | |
| | |
Wells Fargo Investment Grade Corporate Bond Portfolio | | | 2.94 | |
| | |
Wells Fargo U.S. REIT Portfolio | | | 2.91 | |
| | |
Wells Fargo Factor Enhanced U.S. Low Volatility Equity Portfolio | | | 2.49 | |
| | |
Wells Fargo High Yield Corporate Bond Portfolio | | | 1.80 | |
|
|
| Portfolio allocation as of August 31, 20208 |
|
 |
Please see footnotes on page 8.
Wells Fargo Target Date Retirement Funds | 7
Performance highlights (unaudited)
Target Today Fund (continued)
| | | | | | | | | | | | |
|
| Volatility metrics as of August 31, 20209 | |
| | | |
| | | Beta10 | | | Standard
deviation11 | | | R-squared12 | |
| | | | |
Class A | | | 0.98 | | | | 6.04 | % | | | 0.95 | |
| | | | |
Class C | | | 0.99 | | | | 6.09 | | | | 0.95 | |
| | | | |
Class R | | | 0.99 | | | | 6.07 | | | | 0.95 | |
| | | | |
Class R4 | | | 0.98 | | | | 6.05 | | | | 0.95 | |
| | | | |
Class R6 | | | 0.99 | | | | 6.10 | | | | 0.95 | |
| | | | |
Administrator Class | | | 0.98 | | | | 6.06 | | | | 0.95 | |
| 1 | Reflects the expense ratios as stated in the most recent prospectuses, which include the impact of 0.12% of acquired fund fees and expenses representing the net expenses from the affiliated master portfolios. The expense ratios shown are subject to change and may differ from the annualized expense ratios shown in the financial highlights of this report. |
| 2 | The manager has committed through June 30, 2021, to waive fees and/or reimburse expenses to the extent necessary to cap the expenses of each class after fee waivers at 0.60% for Class A, 1.35% for Class C, 0.85% for Class R, 0.29% for Class R4, 0.14% for Class R6, and 0.49% for Administrator Class. Brokerage commissions, stamp duty fees, interest, taxes, acquired fund fees and expenses (if any) from funds in which the affiliated master portfolios invest and from money market funds, and extraordinary expenses are excluded from the expense caps. All other acquired fund fees and expenses from the affiliated master portfolios are included in the expense caps. Prior to or after the commitment expiration date, the caps may be increased or the commitment to maintain the caps may be terminated only with the approval of the Board of Trustees. Without these caps, the Fund’s returns would have been lower. The expense ratio paid by an investor is the net expense ratio (the total annual fund operating expenses after fee waivers) as stated in the prospectuses. |
| 3 | Historical performance shown for the Class R shares prior to their inception reflects the performance of the Class A shares and has been adjusted to reflect the higher expenses applicable to the Class R shares. |
| 4 | Historical performance shown for the Class R4 shares prior to their inception reflects the performance of the Class R6 shares and has been adjusted to reflect the higher expenses applicable to the Class R4 shares. |
| 5 | The S&P Target Date Index is designed as a benchmark for multi-asset class portfolios with risk profiles that become more conservative over time, corresponding to the target retirement date. This index is representative of the investment opportunity available to investors for the target date horizon, with asset class exposures driven by a survey of available target date funds for that horizon. You cannot invest directly in an index. |
| 6 | Source: Wells Fargo Funds Management, LLC. The Wells Fargo Target Blended Index is designed as a benchmark for multi-asset class portfolios with risk profiles that become more conservative over time, each corresponding to the target retirement date. The index weightings among the major asset classes are adjusted annually. The inception date of the index is July 14, 2017. See Appendix I for additional information. You cannot invest directly in an index. |
| 7 | Holdings, excluding cash, cash equivalents and any money market funds, are calculated based on the value of the investments divided by total net assets of the Fund. Holdings are subject to change and may have changed since the date specified. |
| 8 | Amounts are calculated based on the total long-term investments of the Fund. These amounts are subject to change and may have changed since the date specified. |
| 9 | These metrics show the degree and timing of the Fund’s fluctuations compared to S&P Target Date Retirement Income Index over 36 months. |
| 10 | Beta measures fund volatility relative to general market movements. It is a standardized measure of systematic risk in comparison with a specified index. The benchmark beta is 1.00 by definition. Beta is based on historical performance and does not represent future results. |
| 11 | Standard deviation is the square root of the sum of squared deviations from the mean. It is often used as a measure of volatility, variability, or risk. Standard deviation is based on historical performance and does not represent future results. |
| 12 | R-squared (R2) is a statistical measure that reflects the percentage of a fund’s movements that can be explained by movements in its benchmark index. The measure ranges from 0.0, which means that the fund’s performance bears no relationship to the performance of the index, to 1.0, which means that the fund’s performance was perfectly synchronized with the performance of the benchmark. R2 is based on historical performance and does not represent future results. |
8 | Wells Fargo Target Date Retirement Funds
Performance highlights (unaudited)
Target 2010 Fund
Average annual total returns (%) as of August 31, 2020
| | | | | | | | | | | | | | | | | | | | | | | | | | | | | | | | | | |
| | | | |
| | | | | Including sales charge | | | Excluding sales charge | | | Expense ratios1 (%) | |
| | | | | | | | | |
| | | Inception date | | 1 year | | | 5 year | | | 10 year | | | 1 year | | | 5 year | | | 10 year | | | Gross | | | Net2 | |
| | | | | | | | | | |
| Class A (STNRX) | | 3-1-1994 | | | 0.01 | | | | 3.17 | | | | 3.30 | | | | 6.14 | | | | 4.40 | | | | 3.91 | | | | 1.00 | | | | 0.60 | |
| | | | | | | | | | |
| Class C (WFOCX) | | 12-1-1998 | | | 4.34 | | | | 3.62 | | | | 3.14 | | | | 5.34 | | | | 3.62 | | | | 3.14 | | | | 1.75 | | | | 1.35 | |
| | | | | | | | | | |
| Class R (WFARX)3 | | 6-28-2013 | | | – | | | | – | | | | – | | | | 6.91 | | | | 4.35 | | | | 3.80 | | | | 1.25 | | | | 0.85 | |
| | | | | | | | | | |
| Class R4 (WFORX)4 | | 11-30-2012 | | | – | | | | – | | | | – | | | | 6.49 | | | | 4.73 | | | | 4.30 | | | | 0.72 | | | | 0.29 | |
| | | | | | | | | | |
| Class R6 (WFLGX) | | 6-30-2004 | | | – | | | | – | | | | – | | | | 6.64 | | | | 4.89 | | | | 4.41 | | | | 0.57 | | | | 0.14 | |
| | | | | | | | | | |
| Administrator Class (WFLGX) | | 11-8-1999 | | | – | | | | – | | | | – | | | | 6.25 | | | | 4.51 | | | | 4.05 | | | | 0.92 | | | | 0.49 | |
| | | | | | | | | | |
| S&P Target Date 2010 Index5 | | – | | | – | | | | – | | | | – | | | | 9.16 | | | | 6.34 | | | | 6.55 | | | | – | | | | – | |
| | | | | | | | | | |
| Wells Fargo Target 2010 Blended Index6 | | – | | | – | | | | – | | | | – | | | | 6.88 | | | | – | | | | – | | | | – | | | | – | |
Figures quoted represent past performance, which is no guarantee of future results, and do not reflect taxes that a shareholder may pay on an investment in a fund. Investment return and principal value of an investment will fluctuate so that an investor’s shares, when redeemed, may be worth more or less than their original cost. Performance shown without sales charges would be lower if sales charges were reflected. Current performance may be lower or higher than the performance data quoted and assumes the reinvestment of dividends and capital gains. Current month-end performance is available on the Fund’s website, wfam.com.
Index returns do not include transaction costs associated with buying and selling securities, any mutual fund fees or expenses, or any taxes. It is not possible to invest directly in an index.
For Class A shares, the maximum front-end sales charge is 5.75%. For Class C shares, the maximum contingent deferred sales charge is 1.00%. Performance including a contingent deferred sales charge assumes the sales charge for the corresponding time period. Class R, Class R4, Class R6, and Administrator Class shares are sold without a front-end sales charge or contingent deferred sales charge.
| | | | |
|
| Holdings (%) as of August 31, 20207 | |
| | |
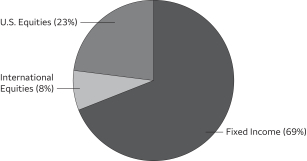
Wells Fargo Bloomberg Barclays US Aggregate ex-Corporate Portfolio | | | 34.02 | |
| | |
Wells Fargo Investment Grade Corporate Bond Portfolio | | | 17.76 | |
| | |
Wells Fargo Factor Enhanced U.S. Large Cap Equity Portfolio | | | 12.32 | |
| | |
Wells Fargo Strategic Retirement Bond Portfolio | | | 11.52 | |
| | |
Wells Fargo Factor Enhanced International Equity Portfolio | | | 6.36 | |
| | |
Wells Fargo Factor Enhanced U.S. Low Volatility Equity Portfolio | | | 4.81 | |
| | |
Wells Fargo Factor Enhanced U.S. Small Cap Equity Portfolio | | | 3.06 | |
| | |
Wells Fargo High Yield Corporate Bond Portfolio | | | 2.90 | |
| | |
Wells Fargo Emerging Markets Bond Portfolio | | | 2.90 | |
| | |
Wells Fargo U.S. REIT Portfolio | | | 2.57 | |
| | |
Wells Fargo Factor Enhanced Emerging Markets Equity Portfolio | | | 1.89 | |
|
|
| Portfolio allocation as of August 31, 20208 |
|
 |
Please see footnotes on page 10.
Wells Fargo Target Date Retirement Funds | 9
Performance highlights (unaudited)
Target 2010 Fund (continued)
| | | | | | | | | | | | |
|
| Volatility metrics as of August 31, 20209 | |
| | | |
| | | Beta10 | | | Standard
deviation11 | | | R-squared12 | |
| | | | |
Class A | | | 0.90 | | | | 6.24 | % | | | 0.94 | |
| | | | |
Class C | | | 0.89 | | | | 6.24 | | | | 0.94 | |
| | | | |
Class R | | | 0.90 | | | | 6.26 | | | | 0.95 | |
| | | | |
Class R4 | | | 0.89 | | | | 6.24 | | | | 0.94 | |
| | | | |
Class R6 | | | 0.89 | | | | 6.24 | | | | 0.94 | |
| | | | |
Administrator Class | | | 0.89 | | | | 6.23 | | | | 0.94 | |
| 1 | Reflects the expense ratios as stated in the most recent prospectuses, which include the impact of 0.12% of acquired fund fees and expenses representing the net expenses from the affiliated master portfolios. The expense ratios shown are subject to change and may differ from the annualized expense ratios shown in the financial highlights of this report. |
| 2 | The manager has committed through June 30, 2021, to waive fees and/or reimburse expenses to the extent necessary to cap the expenses of each class after fee waivers at 0.60% for Class A, 1.35% for Class C, 0.85% for Class R, 0.29% for Class R4, 0.14% for Class R6, and 0.49% for Administrator Class. Brokerage commissions, stamp duty fees, interest, taxes, acquired fund fees and expenses (if any) from funds in which the affiliated master portfolios invest and from money market funds, and extraordinary expenses are excluded from the expense caps. All other acquired fund fees and expenses from the affiliated master portfolios are included in the expense caps. Prior to or after the commitment expiration date, the caps may be increased or the commitment to maintain the caps may be terminated only with the approval of the Board of Trustees. Without these caps, the Fund’s returns would have been lower. The expense ratio paid by an investor is the net expense ratio (the total annual fund operating expenses after fee waivers) as stated in the prospectuses. |
| 3 | Historical performance shown for the Class R shares prior to their inception reflects the performance of the Class A shares and has been adjusted to reflect the higher expenses applicable to the Class R shares. |
| 4 | Historical performance shown for the Class R4 shares prior to their inception reflects the performance of the Class R6 shares and has been adjusted to reflect the higher expenses applicable to the Class R4 shares. |
| 5 | The S&P Target Date Index is designed as a benchmark for multi-asset class portfolios with risk profiles that become more conservative over time, corresponding to the target retirement date. This index is representative of the investment opportunity available to investors for the target date horizon, with asset class exposures driven by a survey of available target date funds for that horizon. You cannot invest directly in an index. |
| 6 | Source: Wells Fargo Funds Management, LLC. The Wells Fargo Target Blended Index is designed as a benchmark for multi-asset class portfolios with risk profiles that become more conservative over time, each corresponding to the target retirement date. The index weightings among the major asset classes are adjusted annually. The inception date of the index is July 14, 2017. See Appendix I for additional information. You cannot invest directly in an index. |
| 7 | Holdings, excluding cash, cash equivalents and any money market funds, are calculated based on the value of the investments divided by total net assets of the Fund. Holdings are subject to change and may have changed since the date specified. |
| 8 | Amounts are calculated based on the total long-term investments of the Fund. These amounts are subject to change and may have changed since the date specified. |
| 9 | These metrics show the degree and timing of the Fund’s fluctuations compared to S&P Target Date 2010 Index over 36 months. |
| 10 | Beta measures fund volatility relative to general market movements. It is a standardized measure of systematic risk in comparison with a specified index. The benchmark beta is 1.00 by definition. Beta is based on historical performance and does not represent future results. |
| 11 | Standard deviation is the square root of the sum of squared deviations from the mean. It is often used as a measure of volatility, variability, or risk. Standard deviation is based on historical performance and does not represent future results. |
| 12 | R-squared (R2) is a statistical measure that reflects the percentage of a fund’s movements that can be explained by movements in its benchmark index. The measure ranges from 0.0, which means that the fund’s performance bears no relationship to the performance of the index, to 1.0, which means that the fund’s performance was perfectly synchronized with the performance of the benchmark. R2 is based on historical performance and does not represent future results. |
10 | Wells Fargo Target Date Retirement Funds
Performance highlights (unaudited)
Target 2015 Fund
Average annual total returns (%) as of August 31, 2020
| | | | | | | | | | | | | | | | | | | | | | | | | | | | | | | | | | |
| | | | |
| | | | | Including sales charge | | | Excluding sales charge | | | Expense ratios1 (%) | |
| | | | | | | | | |
| | | Inception date | | 1 year | | | 5 year | | | 10 year | | | 1 year | | | 5 year | | | 10 year | | | Gross | | | Net2 | |
| | | | | | | | | | |
| Class A (WFACX)3 | | 11-30-2012 | | | 0.11 | | | | 3.63 | | | | 4.04 | | | | 6.23 | | | | 4.86 | | | | 4.65 | | | | 0.95 | | | | 0.60 | |
| | | | | | | | | | |
| Class R (WFBRX)4 | | 6-28-2013 | | | – | | | | – | | | | – | | | | 7.11 | | | | 4.86 | | | | 4.51 | | | | 1.20 | | | | 0.85 | |
| | | | | | | | | | |
| Class R4 (WFSRX)5 | | 11-30-2012 | | | – | | | | – | | | | – | | | | 6.55 | | | | 5.19 | | | | 5.01 | | | | 0.67 | | | | 0.29 | |
| | | | | | | | | | |
| Class R6 (WFSCX) | | 6-29-2007 | | | – | | | | – | | | | – | | | | 6.65 | | | | 5.35 | | | | 5.11 | | | | 0.52 | | | | 0.14 | |
| | | | | | | | | | |
| Administrator Class (WFFFX) | | 6-29-2007 | | | – | | | | – | | | | – | | | | 6.42 | | | | 5.02 | | | | 4.77 | | | | 0.87 | | | | 0.49 | |
| | | | | | | | | | |
| S&P Target Date 2015 Index6 | | – | | | – | | | | – | | | | – | | | | 9.38 | | | | 6.84 | | | | 7.34 | | | | – | | | | – | |
| | | | | | | | | | |
| Wells Fargo Target 2015 Blended Index7 | | – | | | – | | | | – | | | | – | | | | 6.98 | | | | – | | | | – | | | | – | | | | – | |
Figures quoted represent past performance, which is no guarantee of future results, and do not reflect taxes that a shareholder may pay on an investment in a fund. Investment return and principal value of an investment will fluctuate so that an investor’s shares, when redeemed, may be worth more or less than their original cost. Performance shown without sales charges would be lower if sales charges were reflected. Current performance may be lower or higher than the performance data quoted and assumes the reinvestment of dividends and capital gains. Current month-end performance is available on the Fund’s website, wfam.com.
Index returns do not include transaction costs associated with buying and selling securities, any mutual fund fees or expenses, or any taxes. It is not possible to invest directly in an index.
For Class A shares, the maximum front-end sales charge is 5.75%. Class R, Class R4, Class R6, and Administrator Class shares are sold without a front-end sales charge or contingent deferred sales charge.
| | | | |
|
| Holdings (%) as of August 31, 20208 | |
| | |
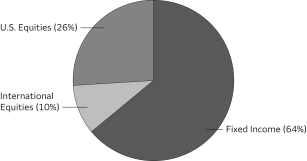
Wells Fargo Bloomberg Barclays US Aggregate ex-Corporate Portfolio | | | 31.60 | |
| | |
Wells Fargo Investment Grade Corporate Bond Portfolio | | | 16.47 | |
| | |
Wells Fargo Factor Enhanced U.S. Large Cap Equity Portfolio | | | 15.25 | |
| | |
Wells Fargo Strategic Retirement Bond Portfolio | | | 10.70 | |
| | |
Wells Fargo Factor Enhanced International Equity Portfolio | | | 7.88 | |
| | |
Wells Fargo Factor Enhanced U.S. Low Volatility Equity Portfolio | | | 3.81 | |
| | |
Wells Fargo Factor Enhanced U.S. Small Cap Equity Portfolio | | | 3.78 | |
| | |
Wells Fargo U.S. REIT Portfolio | | | 2.98 | |
| | |
Wells Fargo High Yield Corporate Bond Portfolio | | | 2.69 | |
| | |
Wells Fargo Emerging Markets Bond Portfolio | | | 2.69 | |
| | |
Wells Fargo Factor Enhanced Emerging Markets Equity Portfolio | | | 2.33 | |
| | |
|
| Portfolio allocation as of August 31, 20209 |
|
 |
Please see footnotes on page 12.
Wells Fargo Target Date Retirement Funds | 11
Performance highlights (unaudited)
Target 2015 Fund (continued)
| | | | | | | | | | | | |
|
| Volatility metrics as of August 31, 202010 | |
| | | |
| | | Beta11 | | | Standard
deviation12 | | | R-squared13 | |
| | | | |
Class A | | | 0.88 | | | | 6.98 | % | | | 0.95 | |
| | | | |
Class R | | | 0.88 | | | | 6.98 | | | | 0.95 | |
| | | | |
Class R4 | | | 0.88 | | | | 6.97 | | | | 0.95 | |
| | | | |
Class R6 | | | 0.87 | | | | 6.93 | | | | 0.95 | |
| | | | |
Administrator Class | | | 0.87 | | | | 6.91 | | | | 0.95 | |
| 1 | Reflects the expense ratios as stated in the most recent prospectuses, which include the impact of 0.12% of acquired fund fees and expenses representing the net expenses from the affiliated master portfolios. The expense ratios shown are subject to change and may differ from the annualized expense ratios shown in the financial highlights of this report. |
| 2 | The manager has committed through June 30, 2021, to waive fees and/or reimburse expenses to the extent necessary to cap the expenses of each class after fee waivers at 0.60% for Class A, 0.85% for Class R, 0.29% for Class R4, 0.14% for Class R6, and 0.49% for Administrator Class. Brokerage commissions, stamp duty fees, interest, taxes, acquired fund fees and expenses (if any) from funds in which the affiliated master portfolios invest and from money market funds, and extraordinary expenses are excluded from the expense caps. All other acquired fund fees and expenses from the affiliated master portfolios are included in the expense caps. Prior to or after the commitment expiration date, the caps may be increased or the commitment to maintain the caps may be terminated only with the approval of the Board of Trustees. Without these caps, the Fund’s returns would have been lower. The expense ratio paid by an investor is the net expense ratio (the total annual fund operating expenses after fee waivers) as stated in the prospectuses. |
| 3 | Historical performance shown for the Class A shares prior to their inception reflects the performance of the Class R6 shares and has been adjusted to reflect the higher expenses applicable to the Class A shares. |
| 4 | Historical performance shown for the Class R shares prior to their inception reflects the performance of the Class A shares and has been adjusted to reflect the higher expenses applicable to the Class R shares. |
| 5 | Historical performance shown for the Class R4 shares prior to their inception reflects the performance of the Class R6 shares and has been adjusted to reflect the higher expenses applicable to the Class R4 shares. |
| 6 | The S&P Target Date Index is designed as a benchmark for multi-asset class portfolios with risk profiles that become more conservative over time, corresponding to the target retirement date. This index is representative of the investment opportunity available to investors for the target date horizon, with asset class exposures driven by a survey of available target date funds for that horizon. You cannot invest directly in an index. |
| 7 | Source: Wells Fargo Funds Management, LLC. The Wells Fargo Target Blended Index is designed as a benchmark for multi-asset class portfolios with risk profiles that become more conservative over time, each corresponding to the target retirement date. The index weightings among the major asset classes are adjusted annually. The inception date of the index is July 14, 2017. See Appendix I for additional information. You cannot invest directly in an index. |
| 8 | Holdings, excluding cash, cash equivalents and any money market funds, are calculated based on the value of the investments divided by total net assets of the Fund. Holdings are subject to change and may have changed since the date specified. |
| 9 | Amounts are calculated based on the total long-term investments of the Fund. These amounts are subject to change and may have changed since the date specified. |
| 10 | These metrics show the degree and timing of the Fund’s fluctuations compared to S&P Target Date 2015 Index over 36 months. |
| 11 | Beta measures fund volatility relative to general market movements. It is a standardized measure of systematic risk in comparison with a specified index. The benchmark beta is 1.00 by definition. Beta is based on historical performance and does not represent future results. |
| 12 | Standard deviation is the square root of the sum of squared deviations from the mean. It is often used as a measure of volatility, variability, or risk. Standard deviation is based on historical performance and does not represent future results. |
| 13 | R-squared (R2) is a statistical measure that reflects the percentage of a fund’s movements that can be explained by movements in its benchmark index. The measure ranges from 0.0, which means that the fund’s performance bears no relationship to the performance of the index, to 1.0, which means that the fund’s performance was perfectly synchronized with the performance of the benchmark. R2 is based on historical performance and does not represent future results. |
12 | Wells Fargo Target Date Retirement Funds
Performance highlights (unaudited)
Target 2020 Fund
Average annual total returns (%) as of August 31, 2020
| | | | | | | | | | | | | | | | | | | | | | | | | | | | | | | | | | |
| | | | |
| | | | | Including sales charge | | | Excluding sales charge | | | Expense ratios1 (%) | |
| | | | | | | | | |
| | | Inception date | | 1 year | | | 5 year | | | 10 year | | | 1 year | | | 5 year | | | 10 year | | | Gross | | | Net2 | |
| | | | | | | | | | |
| Class A (STTRX) | | 3-1-1994 | | | 0.24 | | | | 4.16 | | | | 4.88 | | | | 6.38 | | | | 5.41 | | | | 5.50 | | | | 0.76 | | | | 0.60 | |
| | | | | | | | | | |
| Class C (WFLAX) | | 12-1-1998 | | | 4.56 | | | | 4.61 | | | | 4.71 | | | | 5.56 | | | | 4.61 | | | | 4.71 | | | | 1.51 | | | | 1.35 | |
| | | | | | | | | | |
| Class R (WFURX)3 | | 6-28-2013 | | | – | | | | – | | | | – | | | | 6.35 | | | | 5.22 | | | | 5.33 | | | | 1.01 | | | | 0.85 | |
| | | | | | | | | | |
| Class R4 (WFLRX)4 | | 11-30-2012 | | | – | | | | – | | | | – | | | | 6.66 | | | | 5.73 | | | | 5.89 | | | | 0.48 | | | | 0.29 | |
| | | | | | | | | | |
| Class R6 (WFOBX) | | 6-30-2004 | | | – | | | | – | | | | – | | | | 6.90 | | | | 5.91 | | | | 6.02 | | | | 0.33 | | | | 0.14 | |
| | | | | | | | | | |
| Administrator Class (WFLPX) | | 11-8-1999 | | | – | | | | – | | | | – | | | | 6.49 | | | | 5.52 | | | | 5.65 | | | | 0.68 | | | | 0.49 | |
| | | | | | | | | | |
| S&P Target Date 2020 Index5 | | – | | | – | | | | – | | | | – | | | | 9.50 | | | | 7.27 | | | | 8.02 | | | | – | | | | – | |
| | | | | | | | | | |
| Wells Fargo Target 2020 Blended Index6 | | – | | | – | | | | – | | | | – | | | | 7.23 | | | | – | | | | – | | | | – | | | | – | |
Figures quoted represent past performance, which is no guarantee of future results, and do not reflect taxes that a shareholder may pay on an investment in a fund. Investment return and principal value of an investment will fluctuate so that an investor’s shares, when redeemed, may be worth more or less than their original cost. Performance shown without sales charges would be lower if sales charges were reflected. Current performance may be lower or higher than the performance data quoted and assumes the reinvestment of dividends and capital gains. Current month-end performance is available on the Fund’s website, wfam.com.
Index returns do not include transaction costs associated with buying and selling securities, any mutual fund fees or expenses, or any taxes. It is not possible to invest directly in an index.
For Class A shares, the maximum front-end sales charge is 5.75%. For Class C shares, the maximum contingent deferred sales charge is 1.00%. Performance including a contingent deferred sales charge assumes the sales charge for the corresponding time period. Class R, Class R4, Class R6, and Administrator Class shares are sold without a front-end sales charge or contingent deferred sales charge.
| | | | |
|
| Holdings (%) as of August 31, 20207 | |
| | |
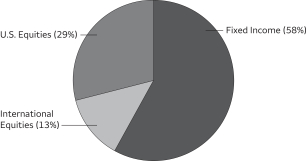
Wells Fargo Bloomberg Barclays US Aggregate ex-Corporate Portfolio | | | 29.25 | |
| | |
Wells Fargo Factor Enhanced U.S. Large Cap Equity Portfolio | | | 18.80 | |
| | |
Wells Fargo Investment Grade Corporate Bond Portfolio | | | 15.24 | |
| | |
Wells Fargo Factor Enhanced International Equity Portfolio | | | 9.85 | |
| | |
Wells Fargo Strategic Retirement Bond Portfolio | | | 9.10 | |
| | |
Wells Fargo Factor Enhanced U.S. Small Cap Equity Portfolio | | | 4.69 | |
| | |
Wells Fargo U.S. REIT Portfolio | | | 3.17 | |
| | |
Wells Fargo Factor Enhanced Emerging Markets Equity Portfolio | | | 2.92 | |
| | |
Wells Fargo Factor Enhanced U.S. Low Volatility Equity Portfolio | | | 2.82 | |
| | |
Wells Fargo High Yield Corporate Bond Portfolio | | | 2.49 | |
| | |
Wells Fargo Emerging Markets Bond Portfolio | | | 2.49 | |
|
|
| Portfolio allocation as of August 31, 20208 |
|
 |
Please see footnotes on page 14.
Wells Fargo Target Date Retirement Funds | 13
Performance highlights (unaudited)
Target 2020 Fund (continued)
| | | | | | | | | | | | |
|
| Volatility metrics as of August 31, 20209 | |
| | | |
| | | Beta10 | | | Standard
deviation11 | | | R-squared12 | |
| | | | |
Class A | | | 0.90 | | | | 7.85 | % | | | 0.97 | |
| | | | |
Class C | | | 0.90 | | | | 7.85 | | | | 0.97 | |
| | | | |
Class R | | | 0.90 | | | | 7.86 | | | | 0.97 | |
| | | | |
Class R4 | | | 0.90 | | | | 7.88 | | | | 0.97 | |
| | | | |
Class R6 | | | 0.90 | | | | 7.86 | | | | 0.97 | |
| | | | |
Administrator Class | | | 0.90 | | | | 7.88 | | | | 0.97 | |
| 1 | Reflects the expense ratios as stated in the most recent prospectuses, which include the impact of 0.13% of acquired fund fees and expenses representing the net expenses from the affiliated master portfolios. The expense ratios shown are subject to change and may differ from the annualized expense ratios shown in the financial highlights of this report. |
| 2 | The manager has committed through June 30, 2021, to waive fees and/or reimburse expenses to the extent necessary to cap the expenses of each class after fee waivers at 0.60% for Class A, 1.35% for Class C, 0.85% for Class R, 0.29% for Class R4, 0.14% for Class R6, and 0.49% for Administrator Class. Brokerage commissions, stamp duty fees, interest, taxes, acquired fund fees and expenses (if any) from funds in which the affiliated master portfolios invest and from money market funds, and extraordinary expenses are excluded from the expense caps. All other acquired fund fees and expenses from the affiliated master portfolios are included in the expense caps. Prior to or after the commitment expiration date, the caps may be increased or the commitment to maintain the caps may be terminated only with the approval of the Board of Trustees. Without these caps, the Fund’s returns would have been lower. The expense ratio paid by an investor is the net expense ratio (the total annual fund operating expenses after fee waivers) as stated in the prospectuses. |
| 3 | Historical performance shown for the Class R shares prior to their inception reflects the performance of the Class A shares and has been adjusted to reflect the higher expenses applicable to the Class R shares. |
| 4 | Historical performance shown for the Class R4 shares prior to their inception reflects the performance of the Class R6 shares and has been adjusted to reflect the higher expenses applicable to the Class R4 shares. |
| 5 | The S&P Target Date Index is designed as a benchmark for multi-asset class portfolios with risk profiles that become more conservative over time, corresponding to the target retirement date. This index is representative of the investment opportunity available to investors for the target date horizon, with asset class exposures driven by a survey of available target date funds for that horizon. You cannot invest directly in an index. |
| 6 | Source: Wells Fargo Funds Management, LLC. The Wells Fargo Target Blended Index is designed as a benchmark for multi-asset class portfolios with risk profiles that become more conservative over time, each corresponding to the target retirement date. The index weightings among the major asset classes are adjusted annually. The inception date of the index is July 14, 2017. See Appendix I for additional information. You cannot invest directly in an index. |
| 7 | Holdings, excluding cash, cash equivalents and any money market funds, are calculated based on the value of the investments divided by total net assets of the Fund. Holdings are subject to change and may have changed since the date specified. |
| 8 | Amounts are calculated based on the total long-term investments of the Fund. These amounts are subject to change and may have changed since the date specified. |
| 9 | These metrics show the degree and timing of the Fund’s fluctuations compared to S&P Target Date 2020 Index over 36 months. |
| 10 | Beta measures fund volatility relative to general market movements. It is a standardized measure of systematic risk in comparison with a specified index. The benchmark beta is 1.00 by definition. Beta is based on historical performance and does not represent future results. |
| 11 | Standard deviation is the square root of the sum of squared deviations from the mean. It is often used as a measure of volatility, variability, or risk. Standard deviation is based on historical performance and does not represent future results. |
| 12 | R-squared (R2) is a statistical measure that reflects the percentage of a fund’s movements that can be explained by movements in its benchmark index. The measure ranges from 0.0, which means that the fund’s performance bears no relationship to the performance of the index, to 1.0, which means that the fund’s performance was perfectly synchronized with the performance of the benchmark. R2 is based on historical performance and does not represent future results. |
14 | Wells Fargo Target Date Retirement Funds
Performance highlights (unaudited)
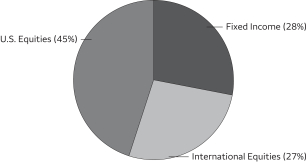
Target 2025 Fund
Average annual total returns (%) as of August 31, 2020
| | | | | | | | | | | | | | | | | | | | | | | | | | | | | | | | | | |
| | | | |
| | | | | Including sales charge | | | Excluding sales charge | | | Expense ratios1 (%) | |
| | | | | | | | | |
| | | Inception date | | 1 year | | | 5 year | | | 10 year | | | 1 year | | | 5 year | | | 10 year | | | Gross | | | Net2 | |
| | | | | | | | | | |
| Class A (WFAYX)3 | | 11-30-2012 | | | 0.76 | | | | 4.82 | | | | 5.94 | | | | 6.98 | | | | 6.06 | | | | 6.57 | | | | 0.77 | | | | 0.60 | |
| | | | | | | | | | |
| Class R (WFJRX)4 | | 6-28-2013 | | | – | | | | – | | | | – | | | | 7.22 | | | | 5.74 | | | | 6.27 | | | | 1.02 | | | | 0.85 | |
| | | | | | | | | | |
| Class R4 (WFGRX)5 | | 11-30-2012 | | | – | | | | – | | | | – | | | | 7.41 | | | | 6.36 | | | | 6.92 | | | | 0.49 | | | | 0.29 | |
| | | | | | | | | | |
| Class R6 (WTHRX) | | 6-29-2007 | | | – | | | | – | | | | – | | | | 7.41 | | | | 6.53 | | | | 7.04 | | | | 0.34 | | | | 0.14 | |
| | | | | | | | | | |
| Administrator Class (WFTRX) | | 6-29-2007 | | | – | | | | – | | | | – | | | | 6.94 | | | | 6.18 | | | | 6.66 | | | | 0.69 | | | | 0.49 | |
| | | | | | | | | | |
| S&P Target Date 2025 Index6 | | – | | | – | | | | – | | | | – | | | | 10.28 | | | | 7.83 | | | | 8.66 | | | | – | | | | – | |
| | | | | | | | | | |
| Wells Fargo Target 2025 Blended Index7 | | – | | | – | | | | – | | | | – | | | | 7.77 | | | | – | | | | – | | | | – | | | | – | |
Figures quoted represent past performance, which is no guarantee of future results, and do not reflect taxes that a shareholder may pay on an investment in a fund. Investment return and principal value of an investment will fluctuate so that an investor’s shares, when redeemed, may be worth more or less than their original cost. Performance shown without sales charges would be lower if sales charges were reflected. Current performance may be lower or higher than the performance data quoted and assumes the reinvestment of dividends and capital gains. Current month-end performance is available on the Fund’s website, wfam.com.
Index returns do not include transaction costs associated with buying and selling securities, any mutual fund fees or expenses, or any taxes. It is not possible to invest directly in an index.
For Class A shares, the maximum front-end sales charge is 5.75%. Class R, Class R4, Class R6, and Administrator Class shares are sold without a front-end sales charge or contingent deferred sales charge.
| | | | |
|
| Holdings (%) as of August 31, 20208 | |
| | |
Wells Fargo Bloomberg Barclays US Aggregate ex-Corporate Portfolio | | | 25.93 | |
| | |
Wells Fargo Factor Enhanced U.S. Large Cap Equity Portfolio | | | 24.55 | |
| | |
Wells Fargo Investment Grade Corporate Bond Portfolio | | | 13.52 | |
| | |
Wells Fargo Factor Enhanced International Equity Portfolio | | | 13.38 | |
| | |
Wells Fargo Factor Enhanced U.S. Small Cap Equity Portfolio | | | 6.12 | |
| | |
Wells Fargo Strategic Retirement Bond Portfolio | | | 4.28 | |
| | |
Wells Fargo Factor Enhanced Emerging Markets Equity Portfolio | | | 3.97 | |
| | |
Wells Fargo High Yield Corporate Bond Portfolio | | | 2.19 | |
| | |
Wells Fargo U.S. REIT Portfolio | | | 2.19 | |
| | |
Wells Fargo Emerging Markets Bond Portfolio | | | 2.19 | |
| | |
Wells Fargo Factor Enhanced U.S. Low Volatility Equity Portfolio | | | 1.81 | |
|
|
| Portfolio allocation as of August 31, 20209 |
|
 |
Please see footnotes on page 16.
Wells Fargo Target Date Retirement Funds | 15
Performance highlights (unaudited)
Target 2025 Fund (continued)
| | | | | | | | | | | | |
|
| Volatility metrics as of August 31, 202010 | |
| | | |
| | | Beta11 | | | Standard
deviation12 | | | R-squared13 | |
| | | | |
Class A | | | 0.90 | | | | 9.25 | % | | | 0.98 | |
| | | | |
Class R | | | 0.92 | | | | 9.43 | | | | 0.98 | |
| | | | |
Class R4 | | | 0.90 | | | | 9.30 | | | | 0.98 | |
| | | | |
Class R6 | | | 0.92 | | | | 9.42 | | | | 0.98 | |
| | | | |
Administrator Class | | | 0.91 | | | | 9.36 | | | | 0.97 | |
| 1 | Reflects the expense ratios as stated in the most recent prospectuses, which include the impact of 0.13% of acquired fund fees and expenses representing the net expenses from the affiliated master portfolios. The expense ratios shown are subject to change and may differ from the annualized expense ratios shown in the financial highlights of this report. |
| 2 | The manager has committed through June 30, 2021, to waive fees and/or reimburse expenses to the extent necessary to cap the expenses of each class after fee waivers at 0.60% for Class A, 0.85% for Class R, 0.29% for Class R4, 0.14% for Class R6, and 0.49% for Administrator Class. Brokerage commissions, stamp duty fees, interest, taxes, acquired fund fees and expenses (if any) from funds in which the affiliated master portfolios invest and from money market funds, and extraordinary expenses are excluded from the expense caps. All other acquired fund fees and expenses from the affiliated master portfolios are included in the expense caps. Prior to or after the commitment expiration date, the caps may be increased or the commitment to maintain the caps may be terminated only with the approval of the Board of Trustees. Without these caps, the Fund’s returns would have been lower. The expense ratio paid by an investor is the net expense ratio (the total annual fund operating expenses after fee waivers) as stated in the prospectuses. |
| 3 | Historical performance shown for the Class A shares prior to their inception reflects the performance of the Class R6 shares and has been adjusted to reflect the higher expenses applicable to the Class A shares. |
| 4 | Historical performance shown for the Class R shares prior to their inception reflects the performance of the Class A shares and has been adjusted to reflect the higher expenses applicable to the Class R shares |
| 5 | Historical performance shown for the Class R4 shares prior to their inception reflects the performance of the Class R6 shares and has been adjusted to reflect the higher expenses applicable to the Class R4 shares. |
| 6 | The S&P Target Date Index is designed as a benchmark for multi-asset class portfolios with risk profiles that become more conservative over time, corresponding to the target retirement date. This index is representative of the investment opportunity available to investors for the target date horizon, with asset class exposures driven by a survey of available target date funds for that horizon. You cannot invest directly in an index. |
| 7 | Source: Wells Fargo Funds Management, LLC. The Wells Fargo Target Blended Index is designed as a benchmark for multi-asset class portfolios with risk profiles that become more conservative over time, each corresponding to the target retirement date. The index weightings among the major asset classes are adjusted annually. The inception date of the index is July 14, 2017. See Appendix I for additional information. You cannot invest directly in an index. |
| 8 | Holdings, excluding cash, cash equivalents and any money market funds, are calculated based on the value of the investments divided by total net assets of the Fund. Holdings are subject to change and may have changed since the date specified. |
| 9 | Amounts are calculated based on the total long-term investments of the Fund. These amounts are subject to change and may have changed since the date specified. |
| 10 | These metrics show the degree and timing of the Fund’s fluctuations compared to S&P Target Date 2025 Index over 36 months. |
| 11 | Beta measures fund volatility relative to general market movements. It is a standardized measure of systematic risk in comparison with a specified index. The benchmark beta is 1.00 by definition. Beta is based on historical performance and does not represent future results. |
| 12 | Standard deviation is the square root of the sum of squared deviations from the mean. It is often used as a measure of volatility, variability, or risk. Standard deviation is based on historical performance and does not represent future results. |
| 13 | R-squared (R2) is a statistical measure that reflects the percentage of a fund’s movements that can be explained by movements in its benchmark index. The measure ranges from 0.0, which means that the fund’s performance bears no relationship to the performance of the index, to 1.0, which means that the fund’s performance was perfectly synchronized with the performance of the benchmark. R2 is based on historical performance and does not represent future results. |
16 | Wells Fargo Target Date Retirement Funds
Performance highlights (unaudited)
Target 2030 Fund
Average annual total returns (%) as of August 31, 2020
| | | | | | | | | | | | | | | | | | | | | | | | | | | | | | | | | | |
| | | | |
| | | | | Including sales charge | | | Excluding sales charge | | | Expense ratios1 (%) | |
| | | | | | | | | |
| | | Inception date | | 1 year | | | 5 year | | | 10 year | | | 1 year | | | 5 year | | | 10 year | | | Gross | | | Net2 | |
| | | | | | | | | | |
| Class A (STHRX) | | 3-1-1994 | | | 1.12 | | | | 5.42 | | | | 6.81 | | | | 7.25 | | | | 6.67 | | | | 7.45 | | | | 0.75 | | | | 0.60 | |
| | | | | | | | | | |
| Class C (WFDMX) | | 12-1-1998 | | | 5.48 | | | | 5.87 | | | | 6.65 | | | | 6.48 | | | | 5.87 | | | | 6.65 | | | | 1.50 | | | | 1.35 | |
| | | | | | | | | | |
| Class R (WFJRX)3 | | 6-28-2013 | | | – | | | | – | | | | – | | | | 7.75 | | | | 6.52 | | | | 7.29 | | | | 1.00 | | | | 0.85 | |
| | | | | | | | | | |
| Class R4 (WTHRX)4 | | 11-30-2012 | | | – | | | | – | | | | – | | | | 7.62 | | | | 7.00 | | | | 7.86 | | | | 0.47 | | | | 0.29 | |
| | | | | | | | | | |
| Class R6 (WFOOX) | | 6-30-2004 | | | – | | | | – | | | | – | | | | 7.79 | | | | 7.16 | | | | 7.97 | | | | 0.32 | | | | 0.14 | |
| | | | | | | | | | |
| Administrator Class (WFLIX) | | 11-8-1999 | | | – | | | | – | | | | – | | | | 7.33 | | | | 6.78 | | | | 7.59 | | | | 0.67 | | | | 0.49 | |
| | | | | | | | | | |
| S&P Target Date 2030 Index5 | | – | | | – | | | | – | | | | – | | | | 10.98 | | | | 8.30 | | | | 9.21 | | | | – | | | | – | |
| | | | | | | | | | |
| Wells Fargo Target 2030 Blended Index6 | | – | | | – | | | | – | | | | – | | | | 8.36 | | | | – | | | | – | | | | – | | | | – | |
Figures quoted represent past performance, which is no guarantee of future results, and do not reflect taxes that a shareholder may pay on an investment in a fund. Investment return and principal value of an investment will fluctuate so that an investor’s shares, when redeemed, may be worth more or less than their original cost. Performance shown without sales charges would be lower if sales charges were reflected. Current performance may be lower or higher than the performance data quoted and assumes the reinvestment of dividends and capital gains. Current month-end performance is available on the Fund’s website, wfam.com.
Index returns do not include transaction costs associated with buying and selling securities, any mutual fund fees or expenses, or any taxes. It is not possible to invest directly in an index.
For Class A shares, the maximum front-end sales charge is 5.75%. For Class C shares, the maximum contingent deferred sales charge is 1.00%. Performance including a contingent deferred sales charge assumes the sales charge for the corresponding time period. Class R, Class R4, Class R6, and Administrator Class shares are sold without a front-end sales charge or contingent deferred sales charge.
| | | | |
|
| Holdings (%) as of August 31, 20207 | |
| | |
Wells Fargo Factor Enhanced U.S. Large Cap Equity Portfolio | | | 30.45 | |
| | |
Wells Fargo Bloomberg Barclays US Aggregate ex-Corporate Portfolio | | | 21.98 | |
| | |
Wells Fargo Factor Enhanced International Equity Portfolio | | | 17.39 | |
| | |
Wells Fargo Investment Grade Corporate Bond Portfolio | | | 11.47 | |
| | |
Wells Fargo Factor Enhanced U.S. Small Cap Equity Portfolio | | | 7.59 | |
| | |
Wells Fargo Factor Enhanced Emerging Markets Equity Portfolio | | | 5.14 | |
| | |
Wells Fargo High Yield Corporate Bond Portfolio | | | 1.85 | |
| | |
Wells Fargo Emerging Markets Bond Portfolio | | | 1.84 | |
| | |
Wells Fargo Strategic Retirement Bond Portfolio | | | 1.07 | |
| | |
Wells Fargo Factor Enhanced U.S. Low Volatility Equity Portfolio | | | 0.81 | |
| | |
Wells Fargo U.S. REIT Portfolio | | | 0.80 | |
|
|
| Portfolio allocation as of August 31, 20208 |
|
 |
Please see footnotes on page 18.
Wells Fargo Target Date Retirement Funds | 17
Performance highlights (unaudited)
Target 2030 Fund (continued)
| | | | | | | | | | | | |
|
| Volatility metrics as of August 31, 20209 | |
| | | |
| | | Beta10 | | | Standard
deviation11 | | | R-squared12 | |
| | | | |
Class A | | | 0.91 | | | | 10.85 | % | | | 0.98 | |
| | | | |
Class C | | | 0.91 | | | | 10.83 | | | | 0.98 | |
| | | | |
Class R | | | 0.92 | | | | 10.93 | | | | 0.98 | |
| | | | |
Class R4 | | | 0.91 | | | | 10.86 | | | | 0.98 | |
| | | | |
Class R6 | | | 0.91 | | | | 10.88 | | | | 0.98 | |
| | | | |
Administrator Class | | | 0.91 | | | | 10.88 | | | | 0.98 | |
| 1 | Reflects the expense ratios as stated in the most recent prospectuses, which include the impact of 0.14% of acquired fund fees and expenses representing the net expenses from the affiliated master portfolios. The expense ratios shown are subject to change and may differ from the annualized expense ratios shown in the financial highlights of this report. |
| 2 | The manager has committed through June 30, 2021, to waive fees and/or reimburse expenses to the extent necessary to cap the expenses of each class after fee waivers at 0.60% for Class A, 1.35% for Class C, 0.85% for Class R, 0.29% for Class R4, 0.14% for Class R6, and 0.49% for Administrator Class. Brokerage commissions, stamp duty fees, interest, taxes, acquired fund fees and expenses (if any) from funds in which the affiliated master portfolios invest and from money market funds, and extraordinary expenses are excluded from the expense caps. All other acquired fund fees and expenses from the affiliated master portfolios are included in the expense caps. Prior to or after the commitment expiration date, the caps may be increased or the commitment to maintain the caps may be terminated only with the approval of the Board of Trustees. Without these caps, the Fund’s returns would have been lower. The expense ratio paid by an investor is the net expense ratio (the total annual fund operating expenses after fee waivers) as stated in the prospectuses. |
| 3 | Historical performance shown for the Class R shares prior to their inception reflects the performance of the Class A shares and has been adjusted to reflect the higher expenses applicable to the Class R shares. |
| 4 | Historical performance shown for the Class R4 shares prior to their inception reflects the performance of the Class R6 shares and has been adjusted to reflect the higher expenses applicable to the Class R4 shares. |
| 5 | The S&P Target Date Index is designed as a benchmark for multi-asset class portfolios with risk profiles that become more conservative over time, corresponding to the target retirement date. This index is representative of the investment opportunity available to investors for the target date horizon, with asset class exposures driven by a survey of available target date funds for that horizon. You cannot invest directly in an index. |
| 6 | Source: Wells Fargo Funds Management, LLC. The Wells Fargo Target Blended Index is designed as a benchmark for multi-asset class portfolios with risk profiles that become more conservative over time, each corresponding to the target retirement date. The index weightings among the major asset classes are adjusted annually. The inception date of the index is July 14, 2017. See Appendix I for additional information. You cannot invest directly in an index. |
| 7 | Holdings, excluding cash, cash equivalents and any money market funds, are calculated based on the value of the investments divided by total net assets of the Fund. Holdings are subject to change and may have changed since the date specified. |
| 8 | Amounts are calculated based on the total long-term investments of the Fund. These amounts are subject to change and may have changed since the date specified. |
| 9 | These metrics show the degree and timing of the Fund’s fluctuations compared to S&P Target Date 2030 Index over 36 months. |
| 10 | Beta measures fund volatility relative to general market movements. It is a standardized measure of systematic risk in comparison with a specified index. The benchmark beta is 1.00 by definition. Beta is based on historical performance and does not represent future results. |
| 11 | Standard deviation is the square root of the sum of squared deviations from the mean. It is often used as a measure of volatility, variability, or risk. Standard deviation is based on historical performance and does not represent future results. |
| 12 | R-squared (R2) is a statistical measure that reflects the percentage of a fund’s movements that can be explained by movements in its benchmark index. The measure ranges from 0.0, which means that the fund’s performance bears no relationship to the performance of the index, to 1.0, which means that the fund’s performance was perfectly synchronized with the performance of the benchmark. R2 is based on historical performance and does not represent future results. |
18 | Wells Fargo Target Date Retirement Funds
Performance highlights (unaudited)
Target 2035 Fund
Average annual total returns (%) as of August 31, 2020
| | | | | | | | | | | | | | | | | | | | | | | | | | | | | | | | | | |
| | | | |
| | | | | Including sales charge | | | Excluding sales charge | | | Expense ratios1 (%) | |
| | | | | | | | | |
| | | Inception date | | 1 year | | | 5 year | | | 10 year | | | 1 year | | | 5 year | | | 10 year | | | Gross | | | Net2 | |
| | | | | | | | | | |
| Class A (WFQBX)3 | | 11-30-2012 | | | 1.27 | | | | 5.90 | | | | 7.60 | | | | 7.50 | | | | 7.16 | | | | 8.24 | | | | 0.80 | | | | 0.60 | |
| | | | | | | | | | |
| Class R (WFKRX)4 | | 6-28-2013 | | | – | | | | – | | | | – | | | | 7.37 | | | | 6.93 | | | | 7.97 | | | | 1.05 | | | | 0.85 | |
| | | | | | | | | | |
| Class R4 (WTTRX)5 | | 11-30-2012 | | | – | | | | – | | | | – | | | | 7.93 | | | | 7.50 | | | | 8.60 | | | | 0.52 | | | | 0.29 | |
| | | | | | | | | | |
| Class R6 (WFQRX) | | 6-29-2007 | | | – | | | | – | | | | – | | | | 8.10 | | | | 7.67 | | | | 8.72 | | | | 0.37 | | | | 0.14 | |
| | | | | | | | | | |
| Administrator Class (WFQWX) | | 6-29-2007 | | | – | | | | – | | | | – | | | | 7.64 | | | | 7.29 | | | | 8.34 | | | | 0.72 | | | | 0.49 | |
| | | | | | | | | | |
| S&P Target Date 2035 Index6 | | – | | | – | | | | – | | | | – | | | | 11.69 | | | | 8.76 | | | | 9.70 | | | | – | | | | – | |
| | | | | | | | | | |
| Wells Fargo Target 2035 Blended Index7 | | – | | | – | | | | – | | | | – | | | | 8.72 | | | | – | | | | – | | | | – | | | | – | |
Figures quoted represent past performance, which is no guarantee of future results, and do not reflect taxes that a shareholder may pay on an investment in a fund. Investment return and principal value of an investment will fluctuate so that an investor’s shares, when redeemed, may be worth more or less than their original cost. Performance shown without sales charges would be lower if sales charges were reflected. Current performance may be lower or higher than the performance data quoted and assumes the reinvestment of dividends and capital gains. Current month-end performance is available on the Fund’s website, wfam.com.
Index returns do not include transaction costs associated with buying and selling securities, any mutual fund fees or expenses, or any taxes. It is not possible to invest directly in an index.
For Class A shares, the maximum front-end sales charge is 5.75%. Class R, Class R4, Class R6, and Administrator Class shares are sold without a front-end sales charge or contingent deferred sales charge.
| | | | |
|
| Holdings (%) as of August 31, 20208 | |
| | |
Wells Fargo Factor Enhanced U.S. Large Cap Equity Portfolio | | | 35.62 | |
| | |
Wells Fargo Factor Enhanced International Equity Portfolio | | | 21.21 | |
| | |
Wells Fargo Bloomberg Barclays US Aggregate ex-Corporate Portfolio | | | 16.59 | |
| | |
Wells Fargo Factor Enhanced U.S. Small Cap Equity Portfolio | | | 8.86 | |
| �� | |
Wells Fargo Investment Grade Corporate Bond Portfolio | | | 8.68 | |
| | |
Wells Fargo Factor Enhanced Emerging Markets Equity Portfolio | | | 6.24 | |
| | |
Wells Fargo High Yield Corporate Bond Portfolio | | | 1.40 | |
| | |
Wells Fargo Emerging Markets Bond Portfolio | | | 1.40 | |
| | |
|
| Portfolio allocation as of August 31, 20209 |
|
 |
Please see footnotes on page 20.
Wells Fargo Target Date Retirement Funds | 19
Performance highlights (unaudited)
Target 2035 Fund (continued)
| | | | | | | | | | | | |
|
| Volatility metrics as of August 31, 202010 | |
| | | |
| | | Beta11 | | | Standard
deviation12 | | | R-squared13 | |
| | | | |
Class A | | | 0.91 | | | | 12.34 | % | | | 0.98 | |
| | | | |
Class R | | | 0.92 | | | | 12.36 | | | | 0.99 | |
| | | | |
Class R4 | | | 0.92 | | | | 12.41 | | | | 0.98 | |
| | | | |
Class R6 | | | 0.91 | | | | 12.31 | | | | 0.99 | |
| | | | |
Administrator Class | | | 0.92 | | | | 12.39 | | | | 0.99 | |
| 1 | Reflects the expense ratios as stated in the most recent prospectuses, which include the impact of 0.15% of acquired fund fees and expenses representing the net expenses from the affiliated master portfolios. The expense ratios shown are subject to change and may differ from the annualized expense ratios shown in the financial highlights of this report. |
| 2 | The manager has committed through June 30, 2021, to waive fees and/or reimburse expenses to the extent necessary to cap the expenses of each class after fee waivers at 0.60% for Class A, 0.85% for Class R, 0.29% for Class R4, 0.14% for Class R6, and 0.49% for Administrator Class. Brokerage commissions, stamp duty fees, interest, taxes, acquired fund fees and expenses (if any) from funds in which the affiliated master portfolios invest and from money market funds, and extraordinary expenses are excluded from the expense caps. All other acquired fund fees and expenses from the affiliated master portfolio are included in the expense caps. Prior to or after the commitment expiration date, the caps may be increased or the commitment to maintain the caps may be terminated only with the approval of the Board of Trustees. Without these caps, the Fund’s returns would have been lower. The expense ratio paid by an investor is the net expense ratio (the total annual fund operating expenses after fee waivers) as stated in the prospectuses. |
| 3 | Historical performance shown for the Class A shares prior to their inception reflects the performance of the Class R6 shares and has been adjusted to reflect the higher expenses applicable to the Class A shares. |
| 4 | Historical performance shown for the Class R shares prior to their inception reflects the performance of the Class A shares and has been adjusted to reflect the higher expenses applicable to the Class R shares. |
| 5 | Historical performance shown for the Class R4 shares prior to their inception reflects the performance of the Class R6 shares and has been adjusted to reflect the higher expenses applicable to the Class R4 shares. |
| 6 | The S&P Target Date Index is designed as a benchmark for multi-asset class portfolios with risk profiles that become more conservative over time, corresponding to the target retirement date. This index is representative of the investment opportunity available to investors for the target date horizon, with asset class exposures driven by a survey of available target date funds for that horizon. You cannot invest directly in an index. |
| 7 | Source: Wells Fargo Funds Management, LLC. The Wells Fargo Target Blended Index is designed as a benchmark for multi-asset class portfolios with risk profiles that become more conservative over time, each corresponding to the target retirement date. The index weightings among the major asset classes are adjusted annually. The inception date of the index is July 14, 2017. See Appendix I for additional information. You cannot invest directly in an index. |
| 8 | Holdings, excluding cash, cash equivalents and any money market funds, are calculated based on the value of the investments divided by total net assets of the Fund. Holdings are subject to change and may have changed since the date specified. |
| 9 | Amounts are calculated based on the total long-term investments of the Fund. These amounts are subject to change and may have changed since the date specified. |
| 10 | These metrics show the degree and timing of the Fund’s fluctuations compared to S&P Target Date 2035 Index over 36 months. |
| 11 | Beta measures fund volatility relative to general market movements. It is a standardized measure of systematic risk in comparison with a specified index. The benchmark beta is 1.00 by definition. Beta is based on historical performance and does not represent future results. |
| 12 | Standard deviation is the square root of the sum of squared deviations from the mean. It is often used as a measure of volatility, variability, or risk. Standard deviation is based on historical performance and does not represent future results. |
| 13 | R-squared (R2) is a statistical measure that reflects the percentage of a fund’s movements that can be explained by movements in its benchmark index. The measure ranges from 0.0, which means that the fund’s performance bears no relationship to the performance of the index, to 1.0, which means that the fund’s performance was perfectly synchronized with the performance of the benchmark. R2 is based on historical performance and does not represent future results. |
20 | Wells Fargo Target Date Retirement Funds
Performance highlights (unaudited)
Target 2040 Fund
Average annual total returns (%) as of August 31, 2020
| | | | | | | | | | | | | | | | | | | | | | | | | | | | | | | | | | |
| | | | |
| | | | | Including sales charge | | | Excluding sales charge | | | Expense ratios1 (%) | |
| | | | | | | | | |
| | | Inception date | | 1 year | | | 5 year | | | 10 year | | | 1 year | | | 5 year | | | 10 year | | | Gross | | | Net2 | |
| | | | | | | | | | |
| Class A (STFRX) | | 3-1-1994 | | | 1.31 | | | | 6.22 | | | | 8.04 | | | | 7.47 | | | | 7.48 | | | | 8.69 | | | | 0.76 | | | | 0.60 | |
| | | | | | | | | | |
| Class C (WFOFX) | | 7-1-1998 | | | 5.56 | | | | 6.67 | | | | 7.87 | | | | 6.56 | | | | 6.67 | | | | 7.87 | | | | 1.51 | | | | 1.35 | |
| | | | | | | | | | |
| Class R (WFMRX)3 | | 6-28-2013 | | | – | | | | – | | | | – | | | | 7.65 | | | | 7.33 | | | | 8.53 | | | | 1.01 | | | | 0.85 | |
| | | | | | | | | | |
| Class R4 (WTFRX)4 | | 11-30-2012 | | | – | | | | – | | | | – | | | | 7.77 | | | | 7.82 | | | | 9.09 | | | | 0.48 | | | | 0.29 | |
| | | | | | | | | | |
| Class R6 (WFOSX) | | 6-30-2004 | | | – | | | | – | | | | – | | | | 7.93 | | | | 7.97 | | | | 9.21 | | | | 0.33 | | | | 0.14 | |
| | | | | | | | | | |
| Administrator Class (WFWX) | | 11-8-1999 | | | – | | | | – | | | | – | | | | 7.51 | | | | 7.60 | | | | 8.83 | | | | 0.68 | | | | 0.49 | |
| | | | | | | | | | |
| S&P Target Date 2040 Index5 | | – | | | – | | | | – | | | | – | | | | 12.14 | | | | 9.07 | | | | 10.03 | | | | – | | | | – | |
| | | | | | | | | | |
| Wells Fargo Target 2040 Blended Index6 | | – | | | – | | | | – | | | | – | | | | 8.74 | | | | – | | | | – | | | | – | | | | – | |
Figures quoted represent past performance, which is no guarantee of future results, and do not reflect taxes that a shareholder may pay on an investment in a fund. Investment return and principal value of an investment will fluctuate so that an investor’s shares, when redeemed, may be worth more or less than their original cost. Performance shown without sales charges would be lower if sales charges were reflected. Current performance may be lower or higher than the performance data quoted and assumes the reinvestment of dividends and capital gains. Current month-end performance is available on the Fund’s website, wfam.com.
Index returns do not include transaction costs associated with buying and selling securities, any mutual fund fees or expenses, or any taxes. It is not possible to invest directly in an index.
For Class A shares, the maximum front-end sales charge is 5.75%. For Class C shares, the maximum contingent deferred sales charge is 1.00%. Performance including a contingent deferred sales charge assumes the sales charge for the corresponding time period. Class R, Class R4, Class R6, and Administrator Class shares are sold without a front-end sales charge or contingent deferred sales charge.
| | | | |
|
| Holdings (%) as of August 31, 20207 | |
| | |
Wells Fargo Factor Enhanced U.S. Large Cap Equity Portfolio | | | 39.55 | |
| | |
Wells Fargo Factor Enhanced International Equity Portfolio | | | 24.36 | |
| | |
Wells Fargo Bloomberg Barclays US Aggregate ex-Corporate Portfolio | | | 11.26 | |
| | |
Wells Fargo Factor Enhanced U.S. Small Cap Equity Portfolio | | | 9.82 | |
| | |
Wells Fargo Factor Enhanced Emerging Markets Equity Portfolio | | | 7.22 | |
| | |
Wells Fargo Investment Grade Corporate Bond Portfolio | | | 5.89 | |
| | |
Wells Fargo High Yield Corporate Bond Portfolio | | | 0.95 | |
| | |
Wells Fargo Emerging Markets Bond Portfolio | | | 0.95 | |
| | |
|
| Portfolio allocation as of August 31, 20208 |
|
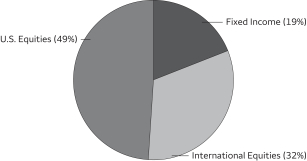 |
Please see footnotes on page 22.
Wells Fargo Target Date Retirement Funds | 21
Performance highlights (unaudited)
Target 2040 Fund (continued)
| | | | | | | | | | | | |
|
| Volatility metrics as of August 31, 20209 | |
| | | |
| | | Beta10 | | | Standard
deviation11 | | | R-squared12 | |
| | | | |
Class A | | | 0.94 | | | | 13.59 | % | | | 0.99 | |
| | | | |
Class C | | | 0.94 | | | | 13.59 | | | | 0.99 | |
| | | | |
Class R | | | 0.94 | | | | 13.63 | | | | 0.99 | |
| | | | |
Class R4 | | | 0.94 | | | | 13.58 | | | | 0.99 | |
| | | | |
Class R6 | | | 0.93 | | | | 13.55 | | | | 0.99 | |
| | | | |
Administrator Class | | | 0.94 | | | | 13.56 | | | | 0.99 | |
| 1 | Reflects the expense ratios as stated in the most recent prospectuses, which include the impact of 0.15% of acquired fund fees and expenses representing the net expenses from the affiliated master portfolios. The expense ratios shown are subject to change and may differ from the annualized expense ratios shown in the financial highlights of this report. |
| 2 | The manager has committed through June 30, 2021, to waive fees and/or reimburse expenses to the extent necessary to cap the expenses of each class after fee waivers at 0.60% for Class A, 1.35% for Class C, 0.85% for Class R, 0.29% for Class R4, 0.14% for Class R6, and 0.49% for Administrator Class. Brokerage commissions, stamp duty fees, interest, taxes, acquired fund fees and expenses (if any) from funds in which the affiliated master portfolios invest and from money market funds, and extraordinary expenses are excluded from the expense caps. All other acquired fund fees and expenses from the affiliated master portfolios are included in the expense caps. Prior to or after the commitment expiration date, the caps may be increased or the commitment to maintain the caps may be terminated only with the approval of the Board of Trustees. Without these caps, the Fund’s returns would have been lower. The expense ratio paid by an investor is the net expense ratio (the total annual fund operating expenses after fee waivers) as stated in the prospectuses. |
| 3 | Historical performance shown for the Class R shares prior to their inception reflects the performance of the Class A shares and has been adjusted to reflect the higher expenses applicable to the Class R shares. |
| 4 | Historical performance shown for the Class R4 shares prior to their inception reflects the performance of the Class R6 shares and has been adjusted to reflect the higher expenses applicable to the Class R4 shares. |
| 5 | The S&P Target Date Index is designed as a benchmark for multi-asset class portfolios with risk profiles that become more conservative over time, corresponding to the target retirement date. This index is representative of the investment opportunity available to investors for the target date horizon, with asset class exposures driven by a survey of available target date funds for that horizon. You cannot invest directly in an index. |
| 6 | Source: Wells Fargo Funds Management, LLC. The Wells Fargo Target Blended Index is designed as a benchmark for multi-asset class portfolios with risk profiles that become more conservative over time, each corresponding to the target retirement date. The index weightings among the major asset classes are adjusted annually. The inception date of the index is July 14, 2017. See Appendix I for additional information. You cannot invest directly in an index. |
| 7 | Holdings, excluding cash, cash equivalents and any money market funds, are calculated based on the value of the investments divided by total net assets of the Fund. Holdings are subject to change and may have changed since the date specified. |
| 8 | Amounts are calculated based on the total long-term investments of the Fund. These amounts are subject to change and may have changed since the date specified. |
| 9 | These metrics show the degree and timing of the Fund’s fluctuations compared to S&P Target Date 2040 Index over 36 months. |
| 10 | Beta measures fund volatility relative to general market movements. It is a standardized measure of systematic risk in comparison with a specified index. The benchmark beta is 1.00 by definition. Beta is based on historical performance and does not represent future results. |
| 11 | Standard deviation is the square root of the sum of squared deviations from the mean. It is often used as a measure of volatility, variability, or risk. Standard deviation is based on historical performance and does not represent future results. |
| 12 | R-squared (R2) is a statistical measure that reflects the percentage of a fund’s movements that can be explained by movements in its benchmark index. The measure ranges from 0.0, which means that the fund’s performance bears no relationship to the performance of the index, to 1.0, which means that the fund’s performance was perfectly synchronized with the performance of the benchmark. R2 is based on historical performance and does not represent future results. |
22 | Wells Fargo Target Date Retirement Funds
Performance highlights (unaudited)
Target 2045 Fund
Average annual total returns (%) as of August 31, 2020
| | | | | | | | | | | | | | | | | | | | | | | | | | | | | | | | | | |
| | | | |
| | | | | Including sales charge | | | Excluding sales charge | | | Expense ratios1 (%) | |
| | | | | | | | | |
| | | Inception date | | 1 year | | | 5 year | | | 10 year | | | 1 year | | | 5 year | | | 10 year | | | Gross | | | Net2 | |
| | | | | | | | | | |
| Class A (WFQVX)3 | | 11-30-2012 | | | 1.27 | | | | 6.47 | | | | 8.38 | | | | 7.46 | | | | 7.74 | | | | 9.02 | | | | 0.88 | | | | 0.60 | |
| | | | | | | | | | |
| Class R (WFNRX)4 | | 6-28-2013 | | | – | | | | – | | | | – | | | | 7.76 | | | | 7.59 | | | | 8.80 | | | | 1.13 | | | | 0.85 | |
| | | | | | | | | | |
| Class R4 (WFFRX)5 | | 11-30-2012 | | | – | | | | – | | | | – | | | | 7.76 | | | | 8.06 | | | | 9.39 | | | | 0.60 | | | | 0.29 | |
| | | | | | | | | | |
| Class R6 (WFQPX) | | 6-29-2007 | | | – | | | | – | | | | – | | | | 7.85 | | | | 8.21 | | | | 9.48 | | | | 0.45 | | | | 0.14 | |
| | | | | | | | | | |
| Administrator Class (WFQYX) | | 6-29-2007 | | | – | | | | – | | | | – | | | | 7.45 | | | | 7.80 | | | | 9.08 | | | | 0.80 | | | | 0.49 | |
| | | | | | | | | | |
| S&P Target Date 2045 Index6 | | – | | | – | | | | – | | | | – | | | | 12.39 | | | | 9.26 | | | | 10.25 | | | | – | | | | – | |
| | | | | | | | | | |
| Wells Fargo Target 2045 Blended Index7 | | – | | | – | | | | – | | | | – | | | | 8.77 | | | | – | | | | – | | | | – | | | | – | |
Figures quoted represent past performance, which is no guarantee of future results, and do not reflect taxes that a shareholder may pay on an investment in a fund. Investment return and principal value of an investment will fluctuate so that an investor’s shares, when redeemed, may be worth more or less than their original cost. Performance shown without sales charges would be lower if sales charges were reflected. Current performance may be lower or higher than the performance data quoted and assumes the reinvestment of dividends and capital gains. Current month-end performance is available on the Fund’s website, wfam.com.
Index returns do not include transaction costs associated with buying and selling securities, any mutual fund fees or expenses, or any taxes. It is not possible to invest directly in an index.
For Class A shares, the maximum front-end sales charge is 5.75%. Class R, Class R4, Class R6, and Administrator Class shares are sold without a front-end sales charge or contingent deferred sales charge.
| | | | |
|
| Holdings (%) as of August 31, 20208 | |
| | |
Wells Fargo Factor Enhanced U.S. Large Cap Equity Portfolio | | | 41.65 | |
| | |
Wells Fargo Factor Enhanced International Equity Portfolio | | | 26.21 | |
| | |
Wells Fargo Factor Enhanced U.S. Small Cap Equity Portfolio | | | 10.34 | |
| | |
Wells Fargo Bloomberg Barclays US Aggregate ex-Corporate Portfolio | | | 8.30 | |
| | |
Wells Fargo Factor Enhanced Emerging Markets Equity Portfolio | | | 7.75 | |
| | |
Wells Fargo Investment Grade Corporate Bond Portfolio | | | 4.34 | |
| | |
Wells Fargo High Yield Corporate Bond Portfolio | | | 0.70 | |
| | |
Wells Fargo Emerging Markets Bond Portfolio | | | 0.70 | |
| | |
|
| Portfolio allocation as of August 31, 20209 |
|
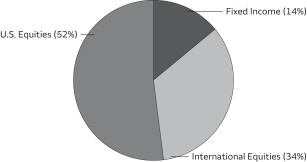 |
Please see footnotes on page 24.
Wells Fargo Target Date Retirement Funds | 23
Performance highlights (unaudited)
Target 2045 Fund (continued)
| | | | | | | | | | | | |
|
| Volatility metrics as of August 31, 202010 | |
| | | |
| | | Beta11 | | | Standard
deviation12 | | | R-squared13 | |
| | | | |
Class A | | | 0.95 | | | | 14.36 | % | | | 0.99 | |
| | | | |
Class R | | | 0.96 | | | | 14.43 | | | | 0.99 | |
| | | | |
Class R4 | | | 0.95 | | | | 14.38 | | | | 0.99 | |
| | | | |
Class R6 | | | 0.95 | | | | 14.39 | | | | 0.99 | |
| | | | |
Administrator Class | | | 0.95 | | | | 14.32 | | | | 0.99 | |
| 1 | Reflects the expense ratios as stated in the most recent prospectuses, which include the impact of 0.16% of acquired fund fees and expenses representing the net expenses from the affiliated master portfolios. The expense ratios shown are subject to change and may differ from the annualized expense ratios shown in the financial highlights of this report. |
| 2 | The manager has committed through June 30, 2021, to waive fees and/or reimburse expenses to the extent necessary to cap the expenses of each class after fee waivers at 0.60% for Class A, 0.85% for Class R, 0.29% for Class R4, 0.14% for Class R6, and 0.49% for Administrator Class. Brokerage commissions, stamp duty fees, interest, taxes, acquired fund fees and expenses (if any) from funds in which the affiliated master portfolios invest and from money market funds, and extraordinary expenses are excluded from the expense caps. All other acquired fund fees and expenses from the affiliated master portfolios are included in the expense caps. Prior to or after the commitment expiration date, the caps may be increased or the commitment to maintain the caps may be terminated only with the approval of the Board of Trustees. Without these caps, the Fund’s returns would have been lower. The expense ratio paid by an investor is the net expense ratio (the total annual fund operating expenses after fee waivers) as stated in the prospectuses. |
| 3 | Historical performance shown for the Class A shares prior to their inception reflects the performance of the Class R6 shares and has been adjusted to reflect the higher expenses applicable to the Class A shares. |
| 4 | Historical performance shown for the Class R shares prior to their inception reflects the performance of the Class A shares and has been adjusted to reflect the higher expenses applicable to the Class R shares. |
| 5 | Historical performance shown for the Class R4 shares prior to their inception reflects the performance of the Class R6 shares and has been adjusted to reflect the higher expenses applicable to the Class R4 shares. |
| 6 | The S&P Target Date Index is designed as a benchmark for multi-asset class portfolios with risk profiles that become more conservative over time, corresponding to the target retirement date. This index is representative of the investment opportunity available to investors for the target date horizon, with asset class exposures driven by a survey of available target date funds for that horizon. You cannot invest directly in an index. |
| 7 | Source: Wells Fargo Funds Management, LLC. The Wells Fargo Target Blended Index is designed as a benchmark for multi-asset class portfolios with risk profiles that become more conservative over time, each corresponding to the target retirement date. The index weightings among the major asset classes are adjusted annually. The inception date of the index is July 14, 2017. See Appendix I for additional information. You cannot invest directly in an index. |
| 8 | Holdings, excluding cash, cash equivalents and any money market funds, are calculated based on the value of the investments divided by total net assets of the Fund. Holdings are subject to change and may have changed since the date specified. |
| 9 | Amounts are calculated based on the total long-term investments of the Fund. These amounts are subject to change and may have changed since the date specified. |
| 10 | These metrics show the degree and timing of the Fund’s fluctuations compared to S&P Target Date 2045 Index over 36 months. |
| 11 | Beta measures fund volatility relative to general market movements. It is a standardized measure of systematic risk in comparison with a specified index. The benchmark beta is 1.00 by definition. Beta is based on historical performance and does not represent future results. |
| 12 | Standard deviation is the square root of the sum of squared deviations from the mean. It is often used as a measure of volatility, variability, or risk. Standard deviation is based on historical performance and does not represent future results. |
| 13 | R-squared (R2) is a statistical measure that reflects the percentage of a fund’s movements that can be explained by movements in its benchmark index. The measure ranges from 0.0, which means that the fund’s performance bears no relationship to the performance of the index, to 1.0, which means that the fund’s performance was perfectly synchronized with the performance of the benchmark. R2 is based on historical performance and does not represent future results. |
24 | Wells Fargo Target Date Retirement Funds
Performance highlights (unaudited)
Target 2050 Fund
Average annual total returns (%) as of August 31, 2020
| | | | | | | | | | | | | | | | | | | | | | | | | | | | | | | | | | |
| | | | |
| | | | | Including sales charge | | | Excluding sales charge | | | Expense ratios1 (%) | |
| | | | | | | | | |
| | | Inception date | | 1 year | | | 5 year | | | 10 year | | | 1 year | | | 5 year | | | 10 year | | | Gross | | | Net2 | |
| | | | | | | | | | |
| Class A (WFQAX)3 | | 11-30-2012 | | | 1.01 | | | | 6.49 | | | | 8.39 | | | | 7.24 | | | | 7.75 | | | | 9.04 | | | | 0.83 | | | | 0.60 | |
| | | | | | | | | | |
| Class C (WFQCX)4 | | 11-30-2012 | | | 5.51 | | | | 6.97 | | | | 8.23 | | | | 6.51 | | | | 6.97 | | | | 8.23 | | | | 1.58 | | | | 1.35 | |
| | | | | | | | | | |
| Class R (WFWRX)5 | | 6-28-2013 | | | – | | | | – | | | | – | | | | 7.99 | | | | 7.68 | | | | 8.87 | | | | 1.08 | | | | 0.85 | |
| | | | | | | | | | |
| Class R4 (WQFRX)6 | | 11-30-2012 | | | – | | | | – | | | | – | | | | 7.49 | | | | 8.09 | | | | 9.40 | | | | 0.55 | | | | 0.29 | |
| | | | | | | | | | |
| Class R6 (WFQFX) | | 6-29-2007 | | | – | | | | – | | | | – | | | | 7.80 | | | | 8.26 | | | | 9.53 | | | | 0.40 | | | | 0.14 | |
| | | | | | | | | | |
| Administrator Class (WFQDX) | | 6-29-2007 | | | – | | | | – | | | | – | | | | 7.46 | | | | 7.89 | | | | 9.15 | | | | 0.75 | | | | 0.49 | |
| | | | | | | | | | |
| S&P Target Date 2045 Index7 | | – | | | – | | | | – | | | | – | | | | 12.39 | | | | 9.26 | | | | 10.25 | | | | – | | | | – | |
| | | | | | | | | | |
| S&P Target Date 2050 Index7* | | – | | | – | | | | – | | | | – | | | | 12.52 | | | | 9.43 | | | | – | | | | – | | | | – | |
| | | | | | | | | | |
| Wells Fargo Target 2050 Blended Index8 | | – | | | – | | | | – | | | | – | | | | 8.72 | | | | – | | | | – | | | | – | | | | – | |
| * | | The inception date of the index is June 1, 2012. |
Figures quoted represent past performance, which is no guarantee of future results, and do not reflect taxes that a shareholder may pay on an investment in a fund. Investment return and principal value of an investment will fluctuate so that an investor’s shares, when redeemed, may be worth more or less than their original cost. Performance shown without sales charges would be lower if sales charges were reflected. Current performance may be lower or higher than the performance data quoted and assumes the reinvestment of dividends and capital gains. Current month-end performance is available on the Fund’s website, wfam.com.
Index returns do not include transaction costs associated with buying and selling securities, any mutual fund fees or expenses, or any taxes. It is not possible to invest directly in an index.
For Class A shares, the maximum front-end sales charge is 5.75%. For Class C shares, the maximum contingent deferred sales charge is 1.00%. Performance including a contingent deferred sales charge assumes the sales charge for the corresponding time period. Class R, Class R4, Class R6, and Administrator Class shares are sold without a front-end sales charge or contingent deferred sales charge.
| | | | |
|
| Holdings (%) as of August 31, 20209 | |
| | |
Wells Fargo Factor Enhanced Large Cap Equity Portfolio | | | 43.26 | |
| | |
Wells Fargo Factor Enhanced International Equity Portfolio | | | 27.69 | |
| | |
Wells Fargo Factor Enhanced Small Cap Equity Portfolio | | | 10.74 | |
| | |
Wells Fargo Factor Enhanced Emerging Markets Equity Portfolio | | | 8.17 | |
| | |
Wells Fargo Bloomberg Barclays US Aggregate ex-Corporate Portfolio | | | 5.99 | |
| | |
Wells Fargo Investment Grade Corporate Bond Portfolio | | | 3.14 | |
| | |
Wells Fargo High Yield Corporate Bond Portfolio | | | 0.51 | |
| | |
Wells Fargo Emerging Markets Bond Portfolio | | | 0.50 | |
| | |
|
| Portfolio allocation as of August 31, 202010 |
|
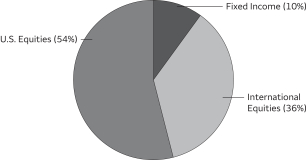 |
Please see footnotes on page 26.
Wells Fargo Target Date Retirement Funds | 25
Performance highlights (unaudited)
Target 2050 Fund (continued)
| | | | | | | | | | | | |
|
| Volatility metrics as of August 31, 202011 | |
| | | |
| | | Beta12 | | | Standard
deviation13 | | | R-squared14 | |
| | | | |
Class A | | | 0.96 | | | | 14.83 | % | | | 0.99 | |
| | | | |
Class C | | | 0.96 | | | | 14.83 | | | | 0.99 | |
| | | | |
Class R | | | 0.97 | | | | 14.95 | | | | 0.99 | |
| | | | |
Class R4 | | | 0.96 | | | | 14.86 | | | | 0.99 | |
| | | | |
Class R6 | | | 0.96 | | | | 14.87 | | | | 0.99 | |
| | | | |
Administrator Class | | | 0.96 | | | | 14.79 | | | | 0.99 | |
| 1 | Reflects the expense ratios as stated in the most recent prospectuses, which include the impact of 0.16% of acquired fund fees and expenses representing the net expenses from the affiliated master portfolios. The expense ratios shown are subject to change and may differ from the annualized expense ratios shown in the financial highlights of this report. |
| 2 | The manager has committed through June 30, 2021, to waive fees and/or reimburse expenses to the extent necessary to cap the expenses of each class after fee waivers at 0.60% for Class A, 1.35% for Class C, 0.85% for Class R, 0.29% for Class R4, 0.14% for Class R6, and 0.49% for Administrator Class. Brokerage commissions, stamp duty fees, interest, taxes, acquired fund fees and expenses (if any) from funds in which the affiliated master portfolios invest and from money market funds, and extraordinary expenses are excluded from the expense caps. All other acquired fund fees and expenses from the affiliated master portfolios are included in the expense caps. Prior to or after the commitment expiration date, the caps may be increased or the commitment to maintain the caps may be terminated only with the approval of the Board of Trustees. Without these caps, the Fund’s returns would have been lower. The expense ratio paid by an investor is the net expense ratio (the total annual fund operating expenses after fee waivers) as stated in the prospectuses. |
| 3 | Historical performance shown for the Class A shares prior to their inception reflects the performance of the Class R6 shares and has been adjusted to reflect the higher expenses applicable to the Class A shares. |
| 4 | Historical performance shown for the Class C shares prior to their inception reflects the performance of the Class R6 shares and has been adjusted to reflect the higher expenses applicable to the Class C shares. |
| 5 | Historical performance shown for the Class R shares prior to their inception reflects the performance of the Class A shares and has been adjusted to reflect the higher expenses applicable to the Class R shares. |
| 6 | Historical performance shown for the Class R4 shares prior to their inception reflects the performance of the Class R6 shares and has been adjusted to reflect the higher expenses applicable to the Class R4 shares. |
| 7 | The S&P Target Date Index is designed as a benchmark for multi-asset class portfolios with risk profiles that become more conservative over time, corresponding to the target retirement date. This index is representative of the investment opportunity available to investors for the target date horizon, with asset class exposures driven by a survey of available target date funds for that horizon. You cannot invest directly in an index. |
| 8 | Source: Wells Fargo Funds Management, LLC. The Wells Fargo Target Blended Index is designed as a benchmark for multi-asset class portfolios with risk profiles that become more conservative over time, each corresponding to the target retirement date. The index weightings among the major asset classes are adjusted annually. The inception date of the index is July 14, 2017. See Appendix I for additional information. You cannot invest directly in an index. |
| 9 | Holdings, excluding cash, cash equivalents and any money market funds, are calculated based on the value of the investments divided by total net assets of the Fund. Holdings are subject to change and may have changed since the date specified. |
| 10 | Amounts are calculated based on the total long-term investments of the Fund. These amounts are subject to change and may have changed since the date specified. |
| 11 | These metrics show the degree and timing of the Fund’s fluctuations compared to S&P Target Date 2050 Index over 36 months. |
| 12 | Beta measures fund volatility relative to general market movements. It is a standardized measure of systematic risk in comparison with a specified index. The benchmark beta is 1.00 by definition. Beta is based on historical performance and does not represent future results. |
| 13 | Standard deviation is the square root of the sum of squared deviations from the mean. It is often used as a measure of volatility, variability, or risk. Standard deviation is based on historical performance and does not represent future results. |
| 14 | R-squared (R2) is a statistical measure that reflects the percentage of a fund’s movements that can be explained by movements in its benchmark index. The measure ranges from 0.0, which means that the fund’s performance bears no relationship to the performance of the index, to 1.0, which means that the fund’s performance was perfectly synchronized with the performance of the benchmark. R2 is based on historical performance and does not represent future results. |
26 | Wells Fargo Target Date Retirement Funds
Performance highlights (unaudited)
Target 2055 Fund
Average annual total returns (%) as of August 31, 2020
| | | | | | | | | | | | | | | | | | | | | | | | | | | | | | | | | | |
| | | | |
| | | | | Including sales charge | | | Excluding sales charge | | | Expense ratios1 (%) | |
| | | | | | | | | |
| | | Inception date | | 1 year | | | 5 year | | | Since
inception | | | 1 year | | | 5 year | | | Since
inception | | | Gross | | | Net2 | |
| | | | | | | | | | |
| Class A (WFQZX)3 | | 11-30-2012 | | | 1.07 | | | | 6.48 | | | | 6.60 | | | | 7.22 | | | | 7.75 | | | | 7.29 | | | | 1.21 | | | | 0.60 | |
| | | | | | | | | | |
| Class R (WFYRX)4 | | 6-28-2013 | | | – | | | | – | | | | – | | | | 7.74 | | | | 7.61 | | | | 7.03 | | | | 1.46 | | | | 0.85 | |
| | | | | | | | | | |
| Class R4 (WFVRX)5 | | 11-30-2012 | | | – | | | | – | | | | – | | | | 7.57 | | | | 8.07 | | | | 7.64 | | | | 0.93 | | | | 0.29 | |
| | | | | | | | | | |
| Class R6 (WFQUX) | | 6-30-2011 | | | – | | | | – | | | | – | | | | 7.70 | | | | 8.23 | | | | 7.77 | | | | 0.78 | | | | 0.14 | |
| | | | | | | | | | |
| Administrator Class (WFLHX) | | 6-30-2011 | | | – | | | | – | | | | – | | | | 7.37 | | | | 7.87 | | | | 7.89 | | | | 1.13 | | | | 0.49 | |
| | | | | | | | | | |
| S&P Target Date 2055 Index6 | | – | | | – | | | | – | | | | – | | | | 12.52 | | | | 9.52 | | | | 8.83 | * | | | – | | | | – | |
| | | | | | | | | | |
| Wells Fargo Target 2055 Blended Index7 | | – | | | – | | | | – | | | | – | | | | 8.72 | | | | – | | | | – | | | | – | | | | – | |
| * | | Based on the inception date of the oldest Fund class. |
Figures quoted represent past performance, which is no guarantee of future results, and do not reflect taxes that a shareholder may pay on an investment in a fund. Investment return and principal value of an investment will fluctuate so that an investor’s shares, when redeemed, may be worth more or less than their original cost. Performance shown without sales charges would be lower if sales charges were reflected. Current performance may be lower or higher than the performance data quoted and assumes the reinvestment of dividends and capital gains. Current month-end performance is available on the Fund’s website, wfam.com.
Index returns do not include transaction costs associated with buying and selling securities, any mutual fund fees or expenses, or any taxes. It is not possible to invest directly in an index.
For Class A shares, the maximum front-end sales charge is 5.75%. Class R, Class R4, Class R6, and Administrator Class shares are sold without a front-end sales charge or contingent deferred sales charge.
| | | | |
|
| Holdings (%) as of August 31, 20208 | |
| | |
Wells Fargo Factor Enhanced Large Cap Equity Portfolio | | | 43.18 | |
| | |
Wells Fargo Factor Enhanced International Equity Portfolio | | | 27.72 | |
| | |
Wells Fargo Factor Enhanced Small Cap Equity Portfolio | | | 10.76 | |
| | |
Wells Fargo Factor Enhanced Emerging Markets Equity Portfolio | | | 8.16 | |
| | |
Wells Fargo Bloomberg Barclays US Aggregate ex-Corporate Portfolio | | | 6.02 | |
| | |
Wells Fargo Investment Grade Corporate Bond Portfolio | | | 3.15 | |
| | |
Wells Fargo High Yield Corporate Bond Portfolio | | | 0.51 | |
| | |
Wells Fargo Emerging Markets Bond Portfolio | | | 0.50 | |
| | |
|
| Portfolio allocation as of August 31, 20209 |
|
 |
Please see footnotes on page 28.
Wells Fargo Target Date Retirement Funds | 27
Performance highlights (unaudited)
Target 2055 Fund (continued)
| | | | | | | | | | | | |
|
| Volatility metrics as of August 31, 202010 | |
| | | |
| | | Beta11 | | | Standard
deviation12 | | | R-squared13 | |
| | | | |
Class A | | | 0.96 | | | | 14.88 | % | | | 0.99 | |
| | | | |
Class R | | | 0.96 | | | | 14.98 | | | | 0.99 | |
| | | | |
Class R4 | | | 0.96 | | | | 14.93 | | | | 0.99 | |
| | | | |
Class R6 | | | 0.96 | | | | 14.90 | | | | 0.99 | |
| | | | |
Administrator Class | | | 0.96 | | | | 14.90 | | | | 0.99 | |
| 1 | Reflects the expense ratios as stated in the most recent prospectuses, which include the impact of 0.16% of acquired fund fees and expenses representing the net expenses from the affiliated master portfolios. The expense ratios shown are subject to change and may differ from the annualized expense ratios shown in the financial highlights of this report. |
| 2 | The manager has committed through June 30, 2021, to waive fees and/or reimburse expenses to the extent necessary to cap the expenses of each class after fee waivers at 0.60% for Class A, 0.85% for Class R, 0.29% for Class R4, 0.14% for Class R6, and 0.49% for Administrator Class. Brokerage commissions, stamp duty fees, interest, taxes, acquired fund fees and expenses (if any) from funds in which the affiliated master portfolios invest and from money market funds, and extraordinary expenses are excluded from the expense caps. All other acquired fund fees and expenses from the affiliated master portfolios are included in the expense caps. Prior to or after the commitment expiration date, the caps may be increased or the commitment to maintain the caps may be terminated only with the approval of the Board of Trustees. Without these caps, the Fund’s returns would have been lower. The expense ratio paid by an investor is the net expense ratio (the total annual fund operating expenses after fee waivers) as stated in the prospectuses. |
| 3 | Historical performance shown for the Class A shares prior to their inception reflects the performance of the Class R6 shares and has been adjusted to reflect the higher expenses applicable to the Class A shares. |
| 4 | Historical performance shown for the Class R shares prior to their inception reflects the performance of the Class A shares and has been adjusted to reflect the higher expenses applicable to the Class R shares. |
| 5 | Historical performance shown for the Class R4 shares prior to their inception reflects the performance of the Class R6 shares and has been adjusted to reflect the higher expenses applicable to the Class R4 shares. |
| 6 | The S&P Target Date Index is designed as a benchmark for multi-asset class portfolios with risk profiles that become more conservative over time, corresponding to the target retirement date. This index is representative of the investment opportunity available to investors for the target date horizon, with asset class exposures driven by a survey of available target date funds for that horizon. You cannot invest directly in an index. |
| 7 | Source: Wells Fargo Funds Management, LLC. The Wells Fargo Target Blended Index is designed as a benchmark for multi-asset class portfolios with risk profiles that become more conservative over time, each corresponding to the target retirement date. The index weightings among the major asset classes are adjusted annually. The inception date of the index is July 14, 2017. See Appendix I for additional information. You cannot invest directly in an index. |
| 8 | Holdings, excluding cash, cash equivalents and any money market funds, are calculated based on the value of the investments divided by total net assets of the Fund. Holdings are subject to change and may have changed since the date specified. |
| 9 | Amounts are calculated based on the total long-term investments of the Fund. These amounts are subject to change and may have changed since the date specified. |
| 10 | These metrics show the degree and timing of the Fund’s fluctuations compared to S&P Target Date 2055 Index over 36 months. |
| 11 | Beta measures fund volatility relative to general market movements. It is a standardized measure of systematic risk in comparison with a specified index. The benchmark beta is 1.00 by definition. Beta is based on historical performance and does not represent future results. |
| 12 | Standard deviation is the square root of the sum of squared deviations from the mean. It is often used as a measure of volatility, variability, or risk. Standard deviation is based on historical performance and does not represent future results. |
| 13 | R-squared (R2) is a statistical measure that reflects the percentage of a fund’s movements that can be explained by movements in its benchmark index. The measure ranges from 0.0, which means that the fund’s performance bears no relationship to the performance of the index, to 1.0, which means that the fund’s performance was perfectly synchronized with the performance of the benchmark. R2 is based on historical performance and does not represent future results. |
28 | Wells Fargo Target Date Retirement Funds
Performance highlights (unaudited)
Target 2060 Fund
Average annual total returns (%) as of August 31, 2020
| | | | | | | | | | | | | | | | | | | | | | | | | | | | | | | | | | |
| | | | |
| | | | | Including sales charge | | | Excluding sales charge | | | Expense ratios1 (%) | |
| | | | | | | |
| | | Inception date | | 1 year | | | Since
Inception | | | 1 year | | | Since
Inception | | | Gross | | | Net2 | |
| | | | | | | | | | |
| Class A (WFAFX) | | 6-30-2015 | | | 1.26 | | | | 6.48 | | | | 5.18 | | | | 7.40 | | | | 7.76 | | | | 6.39 | | | | 1.61 | | | | 0.60 | |
| | | | | | | | | | |
| Class C (WFCFX) | | 6-30-2015 | | | 6.43 | | | | 7.14 | | | | 5.76 | | | | 7.43 | | | | 7.14 | | | | 5.76 | | | | 2.36 | | | | 1.35 | |
| | | | | | | | | | |
| Class R (WFRFX) | | 6-30-2015 | | | – | | | | | | | | – | | | | 8.23 | | | | 7.70 | | | | 6.31 | | | | 1.86 | | | | 0.85 | |
| | | | | | | | | | |
| Class R4 (WFSFX) | | 6-30-2015 | | | – | | | | | | | | – | | | | 7.65 | | | | 8.10 | | | | 6.72 | | | | 1.33 | | | | 0.29 | |
| | | | | | | | | | |
| Class R6 (WFUFX) | | 6-30-2015 | | | – | | | | | | | | – | | | | 7.81 | | | | 8.25 | | | | 6.86 | | | | 1.18 | | | | 0.14 | |
| | | | | | | | | | |
| Administrator Class (WFDFX) | | 6-30-2015 | | | – | | | | | | | | – | | | | 7.50 | | | | 7.89 | | | | 6.51 | | | | 1.53 | | | | 0.49 | |
| | | | | | | | | | |
| S&P Target Date 2055 Index3 | | – | | | – | | | | | | | | – | | | | 12.52 | | | | 9.52 | | | | 8.16 | * | | | – | | | | – | |
| | | | | | | | | | |
| S&P Target Date 2060+ Index3** | | – | | | – | | | | | | | | – | | | | 12.72 | | | | – | | | | – | | | | – | | | | – | |
| | | | | | | | | | |
| Wells Fargo Target 2060 Blended Index4 | | – | | | – | | | | | | | | – | | | | 8.72 | | | | – | | | | – | | | | – | | | | – | |
| * | | Based on the inception date of the oldest Fund class. |
| ** | | The inception date of the index is May 31, 2016. |
Figures quoted represent past performance, which is no guarantee of future results, and do not reflect taxes that a shareholder may pay on an investment in a fund. Investment return and principal value of an investment will fluctuate so that an investor’s shares, when redeemed, may be worth more or less than their original cost. Performance shown without sales charges would be lower if sales charges were reflected. Current performance may be lower or higher than the performance data quoted and assumes the reinvestment of dividends and capital gains. Current month-end performance is available on the Fund’s website, wfam.com.
Index returns do not include transaction costs associated with buying and selling securities, any mutual fund fees or expenses, or any taxes. It is not possible to invest directly in an index.
For Class A shares, the maximum front-end sales charge is 5.75%. For Class C shares, the maximum contingent deferred sales charge is 1.00%. Performance including a contingent deferred sales charge assumes the sales charge for the corresponding time period. Class R, Class R4, Class R6, and Administrator Class shares are sold without a front-end sales charge or contingent deferred sales charge.
| | | | |
|
| Holdings (%) as of August 31, 20205 | |
| | |
Wells Fargo Factor Enhanced Large Cap Equity Portfolio | | | 43.10 | |
| | |
Wells Fargo Factor Enhanced International Equity Portfolio | | | 27.82 | |
| | |
Wells Fargo Factor Enhanced Small Cap Equity Portfolio | | | 10.80 | |
| | |
Wells Fargo Factor Enhanced Emerging Markets Equity Portfolio | | | 8.14 | |
| | |
Wells Fargo Bloomberg Barclays US Aggregate ex-Corporate Portfolio | | | 5.99 | |
| | |
Wells Fargo Investment Grade Corporate Bond Portfolio | | | 3.13 | |
| | |
Wells Fargo High Yield Corporate Bond Portfolio | | | 0.51 | |
| | |
Wells Fargo Emerging Markets Bond Portfolio | | | 0.51 | |
| | |
|
| Portfolio allocation as of August 31, 20206 |
|
 |
Please see footnotes on page 30.
Wells Fargo Target Date Retirement Funds | 29
Performance highlights (unaudited)
Target 2060 Fund (continued)
| | | | | | | | | | | | |
|
| Volatility metrics as of August 31, 20207 | |
| | | |
| | | Beta8 | | | Standard
deviation9 | | | R-squared10 | |
| | | | |
Class A | | | 0.96 | | | | 14.95 | % | | | 0.99 | |
| | | | |
Class C | | | 0.96 | | | | 15.06 | | | | 0.99 | |
| | | | |
Class R | | | 0.96 | | | | 15.05 | | | | 0.99 | |
| | | | |
Class R4 | | | 0.95 | | | | 14.93 | | | | 0.99 | |
| | | | |
Class R6 | | | 0.95 | | | | 14.94 | | | | 0.99 | |
| | | | |
Administrator Class | | | 0.95 | | | | 14.95 | | | | 0.99 | |
| 1 | Reflects the expense ratios as stated in the most recent prospectuses, which include the impact of 0.16% of acquired fund fees and expenses representing the net expenses from the affiliated master portfolios. The expense ratios shown are subject to change and may differ from the annualized expense ratios shown in the financial highlights of this report. |
| 2 | The manager has committed through June 30, 2021, to waive fees and/or reimburse expenses to the extent necessary to cap the expenses of each class after fee waivers at 0.60% for Class A, 1.35% for Class C, 0.85% for Class R, 0.29% for Class R4, 0.14% for Class R6, and 0.49% for Administrator Class. Brokerage commissions, stamp duty fees, interest, taxes, acquired fund fees and expenses (if any) from funds in which the affiliated master portfolios invest and from money market funds, and extraordinary expenses are excluded from the expense caps. All other acquired fund fees and expenses from the affiliated master portfolios are included in the expense caps. Prior to or after the commitment expiration date, the caps may be increased or the commitment to maintain the caps may be terminated only with the approval of the Board of Trustees. Without these caps, the Fund’s returns would have been lower. The expense ratio paid by an investor is the net expense ratio (the total annual fund operating expenses after fee waivers) as stated in the prospectuses. |
| 3 | The S&P Target Date Index is designed as a benchmark for multi-asset class portfolios with risk profiles that become more conservative over time, corresponding to the target retirement date. This index is representative of the investment opportunity available to investors for the target date horizon, with asset class exposures driven by a survey of available target date funds for that horizon. You cannot invest directly in an index. |
| 4 | Source: Wells Fargo Funds Management, LLC. The Wells Fargo Target Blended Index is designed as a benchmark for multi-asset class portfolios with risk profiles that become more conservative over time, each corresponding to the target retirement date. The index weightings among the major asset classes are adjusted annually. The inception date of the index is July 14, 2017. See Appendix I for additional information. You cannot invest directly in an index. |
| 5 | Holdings, excluding cash, cash equivalents and any money market funds, are calculated based on the value of the investments divided by total net assets of the Fund. Holdings are subject to change and may have changed since the date specified. |
| 6 | Amounts are calculated based on the total long-term investments of the Fund. These amounts are subject to change and may have changed since the date specified. |
| 7 | These metrics show the degree and timing of the Fund’s fluctuations compared to S&P Target Date 2060+ Index over 36 months. |
| 8 | Beta measures fund volatility relative to general market movements. It is a standardized measure of systematic risk in comparison with a specified index. The benchmark beta is 1.00 by definition. Beta is based on historical performance and does not represent future results. |
| 9 | Standard deviation is the square root of the sum of squared deviations from the mean. It is often used as a measure of volatility, variability, or risk. Standard deviation is based on historical performance and does not represent future results. |
| 10 | R-squared (R2) is a statistical measure that reflects the percentage of a fund’s movements that can be explained by movements in its benchmark index. The measure ranges from 0.0, which means that the fund’s performance bears no relationship to the performance of the index, to 1.0, which means that the fund’s performance was perfectly synchronized with the performance of the benchmark. R2 is based on historical performance and does not represent future results. |
30 | Wells Fargo Target Date Retirement Funds
Fund expenses (unaudited)
As a shareholder of the Fund, you incur two types of costs: (1) transaction costs, including sales charges (loads) on purchase payments and contingent deferred sales charges (if any) on redemptions and (2) ongoing costs, including management fees, distribution (12b-1) and/or shareholder servicing fees, and other Fund expenses. This example is intended to help you understand your ongoing costs (in dollars) of investing in the Fund and to compare these costs with the ongoing costs of investing in other mutual funds.
The example is based on an investment of $1,000 invested at the beginning of the six-month period and held for the entire period from March 1, 2020 to August 31, 2020.
Actual expenses
The “Actual” line of the table below provides information about actual account values and actual expenses. You may use the information in this line, together with the amount you invested, to estimate the expenses that you paid over the period. Simply divide your account value by $1,000 (for example, an $8,600 account value divided by $1,000 = 8.6), then multiply the result by the number in the “Actual” line under the heading entitled “Expenses paid during period” for your applicable class of shares to estimate the expenses you paid on your account during this period.
Hypothetical example for comparison purposes
The “Hypothetical” line of the table below provides information about hypothetical account values and hypothetical expenses based on the Fund’s actual expense ratio and an assumed rate of return of 5% per year before expenses, which is not the Fund’s actual return. The hypothetical account values and expenses may not be used to estimate the actual ending account balance or expenses you paid for the period. You may use this information to compare the ongoing costs of investing in the Fund and other funds. To do so, compare this 5% hypothetical example with the 5% hypothetical examples that appear in the shareholder reports of the other funds.
Please note that the expenses shown in the table are meant to highlight your ongoing costs only and do not reflect any transactional costs, such as sales charges (loads) and contingent deferred sales charges. Therefore, the “Hypothetical” line of the table is useful in comparing ongoing costs only and will not help you determine the relative total costs of owning different funds. In addition, if these transactional costs were included, your costs would have been higher.
| | | | | | | | | | | | | | | | |
| Target Today Fund | | Beginning
account value
3-1-2020 | | | Ending
account value
8-31-2020 | | | Expenses
paid during
the period1 | | | Annualized net
expense ratio | |
| | | | | |
Class A | | | | | | | | | | | | | | | | |
| | | | |
Actual | | $ | 1,000.00 | | | $ | 1,041.91 | | | $ | 3.19 | | | | 0.62 | % |
| | | | |
Hypothetical (5% return before expenses) | | $ | 1,000.00 | | | $ | 1,022.08 | | | $ | 3.16 | | | | 0.62 | % |
| | | | | |
Class C | | | | | | | | | | | | | | | | |
| | | | |
Actual | | $ | 1,000.00 | | | $ | 1,038.01 | | | $ | 7.04 | | | | 1.37 | % |
| | | | |
Hypothetical (5% return before expenses) | | $ | 1,000.00 | | | $ | 1,018.30 | | | $ | 6.97 | | | | 1.37 | % |
| | | | | |
Class R | | | | | | | | | | | | | | | | |
| | | | |
Actual | | $ | 1,000.00 | | | $ | 1,048.52 | | | $ | 4.49 | | | | 0.87 | % |
| | | | |
Hypothetical (5% return before expenses) | | $ | 1,000.00 | | | $ | 1,020.82 | | | $ | 4.43 | | | | 0.87 | % |
| | | | | |
Class R4 | | | | | | | | | | | | | | | | |
| | | | |
Actual | | $ | 1,000.00 | | | $ | 1,043.42 | | | $ | 1.60 | | | | 0.31 | % |
| | | | |
Hypothetical (5% return before expenses) | | $ | 1,000.00 | | | $ | 1,023.64 | | | $ | 1.58 | | | | 0.31 | % |
| | | | | |
Class R6 | | | | | | | | | | | | | | | | |
| | | | |
Actual | | $ | 1,000.00 | | | $ | 1,044.16 | | | $ | 0.82 | | | | 0.16 | % |
| | | | |
Hypothetical (5% return before expenses) | | $ | 1,000.00 | | | $ | 1,024.40 | | | $ | 0.82 | | | | 0.16 | % |
| | | | | |
Administrator Class | | | | | | | | | | | | | | | | |
| | | | |
Actual | | $ | 1,000.00 | | | $ | 1,042.36 | | | $ | 2.63 | | | | 0.51 | % |
| | | | |
Hypothetical (5% return before expenses) | | $ | 1,000.00 | | | $ | 1,022.63 | | | $ | 2.60 | | | | 0.51 | % |
| 1 | Expenses paid is equal to the annualized net expense ratio of each class multiplied by the average account value over the period, multiplied by the number of days in the most recent fiscal half-year divided by the number of days in the fiscal year (to reflect the one-half-year period). |
Wells Fargo Target Date Retirement Funds | 31
Fund expenses (unaudited)
| | | | | | | | | | | | | | | | |
| Target 2010 Fund | | Beginning
account value
3-1-2020 | | | Ending
account value
8-31-2020 | | | Expenses
paid during
the period1 | | | Annualized net
expense ratio | |
| | | | | |
Class A | | | | | | | | | | | | | | | | |
| | | | |
Actual | | $ | 1,000.00 | | | $ | 1,043.76 | | | $ | 3.14 | | | | 0.61 | % |
| | | | |
Hypothetical (5% return before expenses) | | $ | 1,000.00 | | | $ | 1,022.13 | | | $ | 3.11 | | | | 0.61 | % |
| | | | | |
Class C | | | | | | | | | | | | | | | | |
| | | | |
Actual | | $ | 1,000.00 | | | $ | 1,040.59 | | | $ | 7.05 | | | | 1.37 | % |
| | | | |
Hypothetical (5% return before expenses) | | $ | 1,000.00 | | | $ | 1,018.30 | | | $ | 6.97 | | | | 1.37 | % |
| | | | | |
Class R | | | | | | | | | | | | | | | | |
| | | | |
Actual | | $ | 1,000.00 | | | $ | 1,053.22 | | | $ | 4.50 | | | | 0.87 | % |
| | | | |
Hypothetical (5% return before expenses) | | $ | 1,000.00 | | | $ | 1,020.82 | | | $ | 4.43 | | | | 0.87 | % |
| | | | | |
Class R4 | | | | | | | | | | | | | | | | |
| | | | |
Actual | | $ | 1,000.00 | | | $ | 1,045.75 | | | $ | 1.60 | | | | 0.31 | % |
| | | | |
Hypothetical (5% return before expenses) | | $ | 1,000.00 | | | $ | 1,023.64 | | | $ | 1.58 | | | | 0.31 | % |
| | | | | |
Class R6 | | | | | | | | | | | | | | | | |
| | | | |
Actual | | $ | 1,000.00 | | | $ | 1,046.44 | | | $ | 0.83 | | | | 0.16 | % |
| | | | |
Hypothetical (5% return before expenses) | | $ | 1,000.00 | | | $ | 1,024.40 | | | $ | 0.82 | | | | 0.16 | % |
| | | | | |
Administrator Class | | | | | | | | | | | | | | | | |
| | | | |
Actual | | $ | 1,000.00 | | | $ | 1,044.58 | | | $ | 2.63 | | | | 0.51 | % |
| | | | |
Hypothetical (5% return before expenses) | | $ | 1,000.00 | | | $ | 1,022.63 | | | $ | 2.60 | | | | 0.51 | % |
| Target 2015 Fund | |
| | | | | |
Class A | | | | | | | | | | | | | | | | |
| | | | |
Actual | | $ | 1,000.00 | | | $ | 1,046.42 | | | $ | 3.20 | | | | 0.62 | % |
| | | | |
Hypothetical (5% return before expenses) | | $ | 1,000.00 | | | $ | 1,022.08 | | | $ | 3.16 | | | | 0.62 | % |
| | | | | |
Class R | | | | | | | | | | | | | | | | |
| | | | |
Actual | | $ | 1,000.00 | | | $ | 1,057.57 | | | $ | 4.51 | | | | 0.87 | % |
| | | | |
Hypothetical (5% return before expenses) | | $ | 1,000.00 | | | $ | 1,020.82 | | | $ | 4.43 | | | | 0.87 | % |
| | | | | |
Class R4 | | | | | | | | | | | | | | | | |
| | | | |
Actual | | $ | 1,000.00 | | | $ | 1,048.19 | | | $ | 1.60 | | | | 0.31 | % |
| | | | |
Hypothetical (5% return before expenses) | | $ | 1,000.00 | | | $ | 1,023.64 | | | $ | 1.58 | | | | 0.31 | % |
| | | | | |
Class R6 | | | | | | | | | | | | | | | | |
| | | | |
Actual | | $ | 1,000.00 | | | $ | 1,048.29 | | | $ | 0.83 | | | | 0.16 | % |
| | | | |
Hypothetical (5% return before expenses) | | $ | 1,000.00 | | | $ | 1,024.40 | | | $ | 0.82 | | | | 0.16 | % |
| | | | | |
Administrator Class | | | | | | | | | | | | | | | | |
| | | | |
Actual | | $ | 1,000.00 | | | $ | 1,048.36 | | | $ | 2.63 | | | | 0.51 | % |
| | | | |
Hypothetical (5% return before expenses) | | $ | 1,000.00 | | | $ | 1,022.63 | | | $ | 2.60 | | | | 0.51 | % |
| Target 2020 Fund | |
| | | | | |
Class A | | | | | | | | | | | | | | | | |
| | | | |
Actual | | $ | 1,000.00 | | | $ | 1,050.08 | | | $ | 3.20 | | | | 0.62 | % |
| | | | |
Hypothetical (5% return before expenses) | | $ | 1,000.00 | | | $ | 1,022.08 | | | $ | 3.16 | | | | 0.62 | % |
| | | | | |
Class C | | | | | | | | | | | | | | | | |
| | | | |
Actual | | $ | 1,000.00 | | | $ | 1,045.96 | | | $ | 7.07 | | | | 1.37 | % |
| | | | |
Hypothetical (5% return before expenses) | | $ | 1,000.00 | | | $ | 1,018.30 | | | $ | 6.97 | | | | 1.37 | % |
| | | | | |
Class R | | | | | | | | | | | | | | | | |
| | | | |
Actual | | $ | 1,000.00 | | | $ | 1,051.43 | | | $ | 4.50 | | | | 0.87 | % |
| | | | |
Hypothetical (5% return before expenses) | | $ | 1,000.00 | | | $ | 1,020.82 | | | $ | 4.43 | | | | 0.87 | % |
| | | | | |
Class R4 | | | | | | | | | | | | | | | | |
| | | | |
Actual | | $ | 1,000.00 | | | $ | 1,050.97 | | | $ | 1.60 | | | | 0.31 | % |
| | | | |
Hypothetical (5% return before expenses) | | $ | 1,000.00 | | | $ | 1,023.64 | | | $ | 1.58 | | | | 0.31 | % |
| | | | | |
Class R6 | | | | | | | | | | | | | | | | |
| | | | |
Actual | | $ | 1,000.00 | | | $ | 1,052.63 | | | $ | 0.83 | | | | 0.16 | % |
| | | | |
Hypothetical (5% return before expenses) | | $ | 1,000.00 | | | $ | 1,024.40 | | | $ | 0.82 | | | | 0.16 | % |
| | | | | |
Administrator Class | | | | | | | | | | | | | | | | |
| | | | |
Actual | | $ | 1,000.00 | | | $ | 1,050.53 | | | $ | 2.64 | | | | 0.51 | % |
| | | | |
Hypothetical (5% return before expenses) | | $ | 1,000.00 | | | $ | 1,022.63 | | | $ | 2.60 | | | | 0.51 | % |
| 1 | Expenses paid is equal to the annualized net expense ratio of each class multiplied by the average account value over the period, multiplied by the number of days in the most recent fiscal half-year divided by the number of days in the fiscal year (to reflect the one-half-year period). |
32 | Wells Fargo Target Date Retirement Funds
Fund expenses (unaudited)
| | | | | | | | | | | | | | | | |
| Target 2025 Fund | | Beginning
account value
3-1-2020 | | | Ending
account value
8-31-2020 | | | Expenses
paid during
the period1 | | | Annualized net
expense ratio | |
| | | | | |
Class A | | | | | | | | | | | | | | | | |
| | | | |
Actual | | $ | 1,000.00 | | | $ | 1,059.25 | | | $ | 3.22 | | | | 0.62 | % |
| | | | |
Hypothetical (5% return before expenses) | | $ | 1,000.00 | | | $ | 1,022.08 | | | $ | 3.16 | | | | 0.62 | % |
| | | | | |
Class R | | | | | | | | | | | | | | | | |
| | | | |
Actual | | $ | 1,000.00 | | | $ | 1,063.75 | | | $ | 4.53 | | | | 0.87 | % |
| | | | |
Hypothetical (5% return before expenses) | | $ | 1,000.00 | | | $ | 1,020.82 | | | $ | 4.43 | | | | 0.87 | % |
| | | | | |
Class R4 | | | | | | | | | | | | | | | | |
| | | | |
Actual | | $ | 1,000.00 | | | $ | 1,060.50 | | | $ | 1.61 | | | | 0.31 | % |
| | | | |
Hypothetical (5% return before expenses) | | $ | 1,000.00 | | | $ | 1,023.64 | | | $ | 1.58 | | | | 0.31 | % |
| | | | | |
Class R6 | | | | | | | | | | | | | | | | |
| | | | |
Actual | | $ | 1,000.00 | | | $ | 1,060.61 | | | $ | 0.83 | | | | 0.16 | % |
| | | | |
Hypothetical (5% return before expenses) | | $ | 1,000.00 | | | $ | 1,024.40 | | | $ | 0.82 | | | | 0.16 | % |
| | | | | |
Administrator Class | | | | | | | | | | | | | | | | |
| | | | |
Actual | | $ | 1,000.00 | | | $ | 1,058.20 | | | $ | 2.65 | | | | 0.51 | % |
| | | | |
Hypothetical (5% return before expenses) | | $ | 1,000.00 | | | $ | 1,022.63 | | | $ | 2.60 | | | | 0.51 | % |
| Target 2030 Fund | |
| | | | | |
Class A | | | | | | | | | | | | | | | | |
| | | | |
Actual | | $ | 1,000.00 | | | $ | 1,065.90 | | | $ | 3.23 | | | | 0.62 | % |
| | | | |
Hypothetical (5% return before expenses) | | $ | 1,000.00 | | | $ | 1,022.08 | | | $ | 3.16 | | | | 0.62 | % |
| | | | | |
Class C | | | | | | | | | | | | | | | | |
| | | | |
Actual | | $ | 1,000.00 | | | $ | 1,062.07 | | | $ | 7.12 | | | | 1.37 | % |
| | | | |
Hypothetical (5% return before expenses) | | $ | 1,000.00 | | | $ | 1,018.30 | | | $ | 6.97 | | | | 1.37 | % |
| | | | | |
Class R | | | | | | | | | | | | | | | | |
| | | | |
Actual | | $ | 1,000.00 | | | $ | 1,071.55 | | | $ | 4.39 | | | | 0.84 | % |
| | | | |
Hypothetical (5% return before expenses) | | $ | 1,000.00 | | | $ | 1,020.97 | | | $ | 4.28 | | | | 0.84 | % |
| | | | | |
Class R4 | | | | | | | | | | | | | | | | |
| | | | |
Actual | | $ | 1,000.00 | | | $ | 1,067.47 | | | $ | 1.62 | | | | 0.31 | % |
| | | | |
Hypothetical (5% return before expenses) | | $ | 1,000.00 | | | $ | 1,023.64 | | | $ | 1.58 | | | | 0.31 | % |
| | | | | |
Class R6 | | | | | | | | | | | | | | | | |
| | | | |
Actual | | $ | 1,000.00 | | | $ | 1,068.44 | | | $ | 0.83 | | | | 0.16 | % |
| | | | |
Hypothetical (5% return before expenses) | | $ | 1,000.00 | | | $ | 1,024.40 | | | $ | 0.82 | | | | 0.16 | % |
| | | | | |
Administrator Class | | | | | | | | | | | | | | | | |
| | | | |
Actual | | $ | 1,000.00 | | | $ | 1,065.86 | | | $ | 2.66 | | | | 0.51 | % |
| | | | |
Hypothetical (5% return before expenses) | | $ | 1,000.00 | | | $ | 1,022.63 | | | $ | 2.60 | | | | 0.51 | % |
| Target 2035 Fund | |
| | | | | |
Class A | | | | | | | | | | | | | | | | |
| | | | |
Actual | | $ | 1,000.00 | | | $ | 1,071.82 | | | $ | 3.24 | | | | 0.62 | % |
| | | | |
Hypothetical (5% return before expenses) | | $ | 1,000.00 | | | $ | 1,022.08 | | | $ | 3.16 | | | | 0.62 | % |
| | | | | |
Class R | | | | | | | | | | | | | | | | |
| | | | |
Actual | | $ | 1,000.00 | | | $ | 1,072.58 | | | $ | 4.49 | | | | 0.86 | % |
| | | | |
Hypothetical (5% return before expenses) | | $ | 1,000.00 | | | $ | 1,020.87 | | | $ | 4.38 | | | | 0.86 | % |
| | | | | |
Class R4 | | | | | | | | | | | | | | | | |
| | | | |
Actual | | $ | 1,000.00 | | | $ | 1,074.32 | | | $ | 1.67 | | | | 0.32 | % |
| | | | |
Hypothetical (5% return before expenses) | | $ | 1,000.00 | | | $ | 1,023.59 | | | $ | 1.63 | | | | 0.32 | % |
| | | | | |
Class R6 | | | | | | | | | | | | | | | | |
| | | | |
Actual | | $ | 1,000.00 | | | $ | 1,075.78 | | | $ | 0.84 | | | | 0.16 | % |
| | | | |
Hypothetical (5% return before expenses) | | $ | 1,000.00 | | | $ | 1,024.40 | | | $ | 0.82 | | | | 0.16 | % |
| | | | | |
Administrator Class | | | | | | | | | | | | | | | | |
| | | | |
Actual | | $ | 1,000.00 | | | $ | 1,073.63 | | | $ | 2.67 | | | | 0.51 | % |
| | | | |
Hypothetical (5% return before expenses) | | $ | 1,000.00 | | | $ | 1,022.63 | | | $ | 2.60 | | | | 0.51 | % |
| 1 | Expenses paid is equal to the annualized net expense ratio of each class multiplied by the average account value over the period, multiplied by the number of days in the most recent fiscal half-year divided by the number of days in the fiscal year (to reflect the one-half-year period). |
Wells Fargo Target Date Retirement Funds | 33
Fund expenses (unaudited)
| | | | | | | | | | | | | | | | |
| Target 2040 Fund | | Beginning
account value
3-1-2020 | | | Ending
account value
8-31-2020 | | | Expenses
paid during
the period1 | | | Annualized net
expense ratio | |
| | | | | |
Class A | | | | | | | | | | | | | | | | |
| | | | |
Actual | | $ | 1,000.00 | | | $ | 1,076.32 | | | $ | 3.24 | | | | 0.62 | % |
| | | | |
Hypothetical (5% return before expenses) | | $ | 1,000.00 | | | $ | 1,022.08 | | | $ | 3.16 | | | | 0.62 | % |
| | | | | |
Class C | | | | | | | | | | | | | | | | |
| | | | |
Actual | | $ | 1,000.00 | | | $ | 1,072.45 | | | $ | 7.16 | | | | 1.37 | % |
| | | | |
Hypothetical (5% return before expenses) | | $ | 1,000.00 | | | $ | 1,018.30 | | | $ | 6.97 | | | | 1.37 | % |
| | | | | |
Class R | | | | | | | | | | | | | | | | |
| | | | |
Actual | | $ | 1,000.00 | | | $ | 1,079.94 | | | $ | 4.51 | | | | 0.86 | % |
| | | | |
Hypothetical (5% return before expenses) | | $ | 1,000.00 | | | $ | 1,020.87 | | | $ | 4.38 | | | | 0.86 | % |
| | | | | |
Class R4 | | | | | | | | | | | | | | | | |
| | | | |
Actual | | $ | 1,000.00 | | | $ | 1,078.40 | | | $ | 1.62 | | | | 0.31 | % |
| | | | |
Hypothetical (5% return before expenses) | | $ | 1,000.00 | | | $ | 1,023.64 | | | $ | 1.58 | | | | 0.31 | % |
| | | | | |
Class R6 | | | | | | | | | | | | | | | | |
| | | | |
Actual | | $ | 1,000.00 | | | $ | 1,079.20 | | | $ | 0.84 | | | | 0.16 | % |
| | | | |
Hypothetical (5% return before expenses) | | $ | 1,000.00 | | | $ | 1,024.40 | | | $ | 0.82 | | | | 0.16 | % |
| | | | | |
Administrator Class | | | | | | | | | | | | | | | | |
| | | | |
Actual | | $ | 1,000.00 | | | $ | 1,076.50 | | | $ | 2.67 | | | | 0.51 | % |
| | | | |
Hypothetical (5% return before expenses) | | $ | 1,000.00 | | | $ | 1,022.63 | | | $ | 2.60 | | | | 0.51 | % |
| Target 2045 Fund | |
| | | | | |
Class A | | | | | | | | | | | | | | | | |
| | | | |
Actual | | $ | 1,000.00 | | | $ | 1,079.31 | | | $ | 3.25 | | | | 0.62 | % |
| | | | |
Hypothetical (5% return before expenses) | | $ | 1,000.00 | | | $ | 1,022.08 | | | $ | 3.16 | | | | 0.62 | % |
| | | | | |
Class R | | | | | | | | | | | | | | | | |
| | | | |
Actual | | $ | 1,000.00 | | | $ | 1,083.94 | | | $ | 4.52 | | | | 0.86 | % |
| | | | |
Hypothetical (5% return before expenses) | | $ | 1,000.00 | | | $ | 1,020.87 | | | $ | 4.38 | | | | 0.86 | % |
| | | | | |
Class R4 | | | | | | | | | | | | | | | | |
| | | | |
Actual | | $ | 1,000.00 | | | $ | 1,081.28 | | | $ | 1.68 | | | | 0.32 | % |
| | | | |
Hypothetical (5% return before expenses) | | $ | 1,000.00 | | | $ | 1,023.59 | | | $ | 1.63 | | | | 0.32 | % |
| | | | | |
Class R6 | | | | | | | | | | | | | | | | |
| | | | |
Actual | | $ | 1,000.00 | | | $ | 1,080.35 | | | $ | 0.84 | | | | 0.16 | % |
| | | | |
Hypothetical (5% return before expenses) | | $ | 1,000.00 | | | $ | 1,024.40 | | | $ | 0.82 | | | | 0.16 | % |
| | | | | |
Administrator Class | | | | | | | | | | | | | | | | |
| | | | |
Actual | | $ | 1,000.00 | | | $ | 1,079.17 | | | $ | 2.67 | | | | 0.51 | % |
| | | | |
Hypothetical (5% return before expenses) | | $ | 1,000.00 | | | $ | 1,022.63 | | | $ | 2.60 | | | | 0.51 | % |
| Target 2050 Fund | |
| | | | | |
Class A | | | | | | | | | | | | | | | | |
| | | | |
Actual | | $ | 1,000.00 | | | $ | 1,079.14 | | | $ | 3.25 | | | | 0.62 | % |
| | | | |
Hypothetical (5% return before expenses) | | $ | 1,000.00 | | | $ | 1,022.08 | | | $ | 3.16 | | | | 0.62 | % |
| | | | | |
Class C | | | | | | | | | | | | | | | | |
| | | | |
Actual | | $ | 1,000.00 | | | $ | 1,076.70 | | | $ | 7.17 | | | | 1.37 | % |
| | | | |
Hypothetical (5% return before expenses) | | $ | 1,000.00 | | | $ | 1,018.30 | | | $ | 6.97 | | | | 1.37 | % |
| | | | | |
Class R | | | | | | | | | | | | | | | | |
| | | | |
Actual | | $ | 1,000.00 | | | $ | 1,089.08 | | | $ | 4.42 | | | | 0.84 | % |
| | | | |
Hypothetical (5% return before expenses) | | $ | 1,000.00 | | | $ | 1,020.97 | | | $ | 4.28 | | | | 0.84 | % |
| | | | | |
Class R4 | | | | | | | | | | | | | | | | |
| | | | |
Actual | | $ | 1,000.00 | | | $ | 1,081.43 | | | $ | 1.63 | | | | 0.31 | % |
| | | | |
Hypothetical (5% return before expenses) | | $ | 1,000.00 | | | $ | 1,023.64 | | | $ | 1.58 | | | | 0.31 | % |
| | | | | |
Class R6 | | | | | | | | | | | | | | | | |
| | | | |
Actual | | $ | 1,000.00 | | | $ | 1,082.98 | | | $ | 0.84 | | | | 0.16 | % |
| | | | |
Hypothetical (5% return before expenses) | | $ | 1,000.00 | | | $ | 1,024.40 | | | $ | 0.82 | | | | 0.16 | % |
| | | | | |
Administrator Class | | | | | | | | | | | | | | | | |
| | | | |
Actual | | $ | 1,000.00 | | | $ | 1,081.78 | | | $ | 2.68 | | | | 0.51 | % |
| | | | |
Hypothetical (5% return before expenses) | | $ | 1,000.00 | | | $ | 1,022.63 | | | $ | 2.60 | | | | 0.51 | % |
| 1 | Expenses paid is equal to the annualized net expense ratio of each class multiplied by the average account value over the period, multiplied by the number of days in the most recent fiscal half-year divided by the number of days in the fiscal year (to reflect the one-half-year period). |
34 | Wells Fargo Target Date Retirement Funds
Fund expenses (unaudited)
| | | | | | | | | | | | | | | | |
| Target 2055 Fund | | Beginning
account value
3-1-2020 | | | Ending
account value
8-31-2020 | | | Expenses
paid during
the period1 | | | Annualized net
expense ratio | |
| | | | | |
Class A | | | | | | | | | | | | | | | | |
| | | | |
Actual | | $ | 1,000.00 | | | $ | 1,079.72 | | | $ | 3.25 | | | | 0.62 | % |
| | | | |
Hypothetical (5% return before expenses) | | $ | 1,000.00 | | | $ | 1,022.08 | | | $ | 3.16 | | | | 0.62 | % |
| | | | | |
Class R | | | | | | | | | | | | | | | | |
| | | | |
Actual | | $ | 1,000.00 | | | $ | 1,085.46 | | | $ | 4.52 | | | | 0.86 | % |
| | | | |
Hypothetical (5% return before expenses) | | $ | 1,000.00 | | | $ | 1,020.87 | | | $ | 4.38 | | | | 0.86 | % |
| | | | | |
Class R4 | | | | | | | | | | | | | | | | |
| | | | |
Actual | | $ | 1,000.00 | | | $ | 1,081.17 | | | $ | 1.68 | | | | 0.32 | % |
| | | | |
Hypothetical (5% return before expenses) | | $ | 1,000.00 | | | $ | 1,023.59 | | | $ | 1.63 | | | | 0.32 | % |
| | | | | |
Class R6 | | | | | | | | | | | | | | | | |
| | | | |
Actual | | $ | 1,000.00 | | | $ | 1,082.25 | | | $ | 0.84 | | | | 0.16 | % |
| | | | |
Hypothetical (5% return before expenses) | | $ | 1,000.00 | | | $ | 1,024.40 | | | $ | 0.82 | | | | 0.16 | % |
| | | | | |
Administrator Class | | | | | | | | | | | | | | | | |
| | | | |
Actual | | $ | 1,000.00 | | | $ | 1,079.97 | | | $ | 2.62 | | | | 0.50 | % |
| | | | |
Hypothetical (5% return before expenses) | | $ | 1,000.00 | | | $ | 1,022.68 | | | $ | 2.55 | | | | 0.50 | % |
| Target 2060 Fund | |
| | | | | |
Class A | | | | | | | | | | | | | | | | |
| | | | |
Actual | | $ | 1,000.00 | | | $ | 1,081.29 | | | $ | 3.25 | | | | 0.62 | % |
| | | | |
Hypothetical (5% return before expenses) | | $ | 1,000.00 | | | $ | 1,022.08 | | | $ | 3.16 | | | | 0.62 | % |
| | | | | |
Class C | | | | | | | | | | | | | | | | |
| | | | |
Actual | | $ | 1,000.00 | | | $ | 1,085.74 | | | $ | 7.15 | | | | 1.36 | % |
| | | | |
Hypothetical (5% return before expenses) | | $ | 1,000.00 | | | $ | 1,018.35 | | | $ | 6.92 | | | | 1.36 | % |
| | | | | |
Class R | | | | | | | | | | | | | | | | |
| | | | |
Actual | | $ | 1,000.00 | | | $ | 1,090.99 | | | $ | 4.53 | | | | 0.86 | % |
| | | | |
Hypothetical (5% return before expenses) | | $ | 1,000.00 | | | $ | 1,020.87 | | | $ | 4.38 | | | | 0.86 | % |
| | | | | |
Class R4 | | | | | | | | | | | | | | | | |
| | | | |
Actual | | $ | 1,000.00 | | | $ | 1,082.26 | | | $ | 1.63 | | | | 0.31 | % |
| | | | |
Hypothetical (5% return before expenses) | | $ | 1,000.00 | | | $ | 1,023.64 | | | $ | 1.58 | | | | 0.31 | % |
| | | | | |
Class R6 | | | | | | | | | | | | | | | | |
| | | | |
Actual | | $ | 1,000.00 | | | $ | 1,083.48 | | | $ | 0.79 | | | | 0.15 | % |
| | | | |
Hypothetical (5% return before expenses) | | $ | 1,000.00 | | | $ | 1,024.45 | | | $ | 0.77 | | | | 0.15 | % |
| | | | | |
Administrator Class | | | | | | | | | | | | | | | | |
| | | | |
Actual | | $ | 1,000.00 | | | $ | 1,081.81 | | | $ | 2.68 | | | | 0.51 | % |
| | | | |
Hypothetical (5% return before expenses) | | $ | 1,000.00 | | | $ | 1,022.63 | | | $ | 2.60 | | | | 0.51 | % |
| 1 | Expenses paid is equal to the annualized net expense ratio of each class multiplied by the average account value over the period, multiplied by the number of days in the most recent fiscal half-year divided by the number of days in the fiscal year (to reflect the one-half-year period). |
Wells Fargo Target Date Retirement Funds | 35
Portfolio of investments—August 31, 2020 (unaudited)
TARGET TODAY FUND
| | | | | | | | | | | | | | | | |
| | | | | | | | | | | | Value | |
| Investment Companies: 100.20% | |
|
| Affiliated Master Portfolios: 100.20% | |
Wells Fargo Bloomberg Barclays US Aggregate ex-Corporate Portfolio | | | | | | | | | | | | | | $ | 21,416,477 | |
Wells Fargo Emerging Markets Bond Portfolio | | | | | | | | | | | | | | | 1,822,857 | |
Wells Fargo Factor Enhanced Emerging Markets Equity Portfolio | | | | | | | | | | | | | | | 1,115,251 | |
Wells Fargo Factor Enhanced International Equity Portfolio | | | | | | | | | | | | | | | 3,758,370 | |
Wells Fargo Factor Enhanced U.S. Large Cap Equity Portfolio | | | | | | | | | | | | | | | 7,280,622 | |
Wells Fargo Factor Enhanced U.S. Low Volatility Equity Portfolio | | | | | | | | | | | | | | | 3,109,146 | |
Wells Fargo Factor Enhanced U.S. Small Cap Equity Portfolio | | | | | | | | | | | | | | | 1,803,333 | |
Wells Fargo High Yield Corporate Bond Portfolio | | | | | | | | | | | | | | | 1,825,463 | |
Wells Fargo Investment Grade Corporate Bond Portfolio | | | | | | | | | | | | | | | 11,168,847 | |
Wells Fargo Strategic Retirement Bond Portfolio | | | | | | | | | | | | | | | 7,254,041 | |
Wells Fargo U.S. REIT Portfolio | | | | | | | | | | | | | | | 1,540,826 | |
| | | | |
Total Investment Companies (Cost $53,128,539) | | | | | | | | | | | | | | | 62,095,233 | |
| | | | | | | | | | | | | | | | |
| | | | | | | | |
| Total investments in securities (Cost $53,128,539) | | | 100.20 | % | | | 62,095,233 | |
| | |
Other assets and liabilities, net | | | (0.20 | ) | | | (123,701 | ) |
| | | | | | | | |
| Total net assets | | | 100.00 | % | | $ | 61,971,532 | |
| | | | | | | | |
Transactions with the affiliated Master Portfolios were as follows:
| | | | | | | | | | | | | | | | | | | | | | | | | | | | | | | | | | | | |
| | | % of
ownership,
beginning
of period | | | % of
ownership,
end of
period | | | Net realized
gains
(losses) on
securities
transactions
allocated
from
affiliated
Master
Portfolios | | | Net
change in
unrealized
gains
(losses) on
securities
transactions
allocated
from
affiliated
Master
Portfolios | | | Interest
allocated
from
affiliated
Master
Portfolios | | | Dividends
allocated
from
affiliated
Master
Portfolios | | | Affiliated
income
allocated
from
affiliated
Master
Portfolios | | | Value,
end
of period | | | % of
net
assets | |
Affiliated Master Portfolios | | | | | | | | | | | | | | | | | | | | | | | | | | | | | | | | | | | | |
Wells Fargo Bloomberg Barclays US Aggregate ex-Corporate Portfolio | | | 3.44 | % | | | 3.69 | % | | $ | 396,207 | | | $ | (78,682 | ) | | $ | 190,573 | | | $ | 0 | | | $ | 534 | | | $ | 21,416,477 | | | | | |
Wells Fargo Emerging Markets Bond Portfolio | | | 4.45 | | | | 5.07 | | | | 2,945 | | | | (34,422 | ) | | | 45,471 | | | | 0 | | | | 19 | | | | 1,822,857 | | | | | |
Wells Fargo Factor Enhanced Emerging Markets Equity Portfolio | | | 0.61 | | | | 0.53 | | | | (117,524 | ) | | | 61,491 | | | | 12 | | | | 21,959 | | | | 51 | | | | 1,115,251 | | | | | |
Wells Fargo Factor Enhanced International Equity Portfolio | | | 0.76 | | | | 0.59 | | | | (135,086 | ) | | | 401,340 | | | | 0 | | | | 71,745 | | | | 205 | | | | 3,758,370 | | | | | |
Wells Fargo Factor Enhanced U.S. Large Cap Equity Portfolio | | | 0.87 | | | | 0.82 | | | | 304,761 | | | | 421,309 | | | | 58 | | | | 90,522 | | | | 423 | | | | 7,280,622 | | | | | |
Wells Fargo Factor Enhanced U.S. Low Volatility Equity Portfolio | | | 0.00 | | | | 12.68 | | | | 1,890 | | | | 288,287 | | | | 0 | | | | 8,082 | | | | 41 | | | | 3,109,146 | | | | | |
Wells Fargo Factor Enhanced U.S. Small Cap Equity Portfolio | | | 0.90 | | | | 0.81 | | | | (174,874 | ) | | | 244,300 | | | | 19 | | | | 17,913 | | | | 128 | | | | 1,803,333 | | | | | |
Wells Fargo High Yield Corporate Bond Portfolio | | | 3.46 | | | | 1.00 | | | | (77,777 | ) | | | 46,453 | | | | 54,462 | | | | 0 | | | | 57 | | | | 1,825,463 | | | | | |
Wells Fargo Investment Grade Corporate Bond Portfolio | | | 4.53 | | | | 5.03 | | | | 88,051 | | | | 25,069 | | | | 188,378 | | | | 0 | | | | 82 | | | | 11,168,847 | | | | | |
Wells Fargo Strategic Retirement Bond Portfolio | | | 10.17 | | | | 11.19 | | | | 85,280 | | | | 127,577 | | | | 47,699 | | | | 0 | | | | 33 | | | | 7,254,041 | | | | | |
Wells Fargo U.S. REIT Portfolio | | | 5.66 | | | | 6.36 | | | | (112,109 | ) | | | 66,160 | | | | 0 | | | | 29,562 | | | | 19 | | | | 1,540,826 | | | | | |
| | | | | | | | | | | | | | | | | | | | | | | | | | | | | | | | | | | | |
| | | | | | | | | |
| | | | | | | | | | $ | 261,764 | | | $ | 1,568,882 | | | $ | 526,672 | | | $ | 239,783 | | | $ | 1,592 | | | $ | 62,095,233 | | | | 100.20 | % |
| | | | | | | | | | | | | | | | | | | | | | | | | | | | | | | | | | | | |
The accompanying notes are an integral part of these financial statements.
36 | Wells Fargo Target Date Retirement Funds
Portfolio of investments—August 31, 2020 (unaudited)
TARGET 2010 FUND
| | | | | | | | | | | | | | | | |
| | | | | | | | | | | | Value | |
| Investment Companies: 100.10% | |
|
| Affiliated Master Portfolios: 100.10% | |
Wells Fargo Bloomberg Barclays US Aggregate ex-Corporate Portfolio | | | | | | | | | | | | | | $ | 18,873,391 | |
Wells Fargo Emerging Markets Bond Portfolio | | | | | | | | | | | | | | | 1,606,495 | |
Wells Fargo Factor Enhanced Emerging Markets Equity Portfolio | | | | | | | | | | | | | | | 1,046,405 | |
Wells Fargo Factor Enhanced International Equity Portfolio | | | | | | | | | | | | | | | 3,526,632 | |
Wells Fargo Factor Enhanced U.S. Large Cap Equity Portfolio | | | | | | | | | | | | | | | 6,832,038 | |
Wells Fargo Factor Enhanced U.S. Low Volatility Equity Portfolio | | | | | | | | | | | | | | | 2,668,649 | |
Wells Fargo Factor Enhanced U.S. Small Cap Equity Portfolio | | | | | | | | | | | | | | | 1,695,185 | |
Wells Fargo High Yield Corporate Bond Portfolio | | | | | | | | | | | | | | | 1,608,814 | |
Wells Fargo Investment Grade Corporate Bond Portfolio | | | | | | | | | | | | | | | 9,853,038 | |
Wells Fargo Strategic Retirement Bond Portfolio | | | | | | | | | | | | | | | 6,393,160 | |
Wells Fargo U.S. REIT Portfolio | | | | | | | | | | | | | | | 1,423,649 | |
| | | | |
Total Investment Companies (Cost $34,039,381) | | | | | | | | | | | | | | | 55,527,456 | |
| | | | | | | | | | | | | | | | |
| | | | | | | | |
| Total investments in securities (Cost $34,039,381) | | | 100.10 | % | | | 55,527,456 | |
| | |
Other assets and liabilities, net | | | (0.10 | ) | | | (52,880 | ) |
| | | | | | | | |
| Total net assets | | | 100.00 | % | | $ | 55,474,576 | |
| | | | | | | | |
Transactions with the affiliated Master Portfolios were as follows:
| | | | | | | | | | | | | | | | | | | | | | | | | | | | | | | | | | | | |
| | | % of
ownership,
beginning
of period | | | % of
ownership,
end of
period | | | Net realized
gains
(losses) on
securities
transactions
allocated
from
affiliated
Master
Portfolios | | | Net
change in
unrealized
gains
(losses) on
securities
transactions
allocated
from
affiliated
Master
Portfolios | | | Interest
allocated
from
affiliated
Master
Portfolios | | | Dividends
allocated
from
affiliated
Master
Portfolios | | | Affiliated
income
allocated
from
affiliated
Master
Portfolios | | | Value,
end
of period | | | % of
net
assets | |
Affiliated Master Portfolios | | | | | | | | | | | | | | | | | | | | | | | | | | | | | | | | | | | | |
Wells Fargo Bloomberg Barclays US Aggregate ex-Corporate Portfolio | | | 3.06 | % | | | 3.25 | % | | $ | 350,149 | | | $ | (32,624 | ) | | $ | 168,482 | | | $ | 0 | | | $ | 469 | | | $ | 18,873,391 | | | | | |
Wells Fargo Emerging Markets Bond Portfolio | | | 3.95 | | | | 4.47 | | | | 2,519 | | | | (29,169 | ) | | | 40,108 | | | | 0 | | | | 17 | | | | 1,606,495 | | | | | |
Wells Fargo Factor Enhanced Emerging Markets Equity Portfolio | | | 0.59 | | | | 0.50 | | | | (106,242 | ) | | | 138,608 | | | | 11 | | | | 20,143 | | | | 47 | | | | 1,046,405 | | | | | |
Wells Fargo Factor Enhanced International Equity Portfolio | | | 0.72 | | | | 0.56 | | | | (122,736 | ) | | | 413,489 | | | | 0 | | | | 66,415 | | | | 188 | | | | 3,526,632 | | | | | |
Wells Fargo Factor Enhanced U.S. Large Cap Equity Portfolio | | | 0.82 | | | | 0.77 | | | | 284,712 | | | | 467,926 | | | | 51 | | | | 83,460 | | | | 385 | | | | 6,832,038 | | | | | |
Wells Fargo Factor Enhanced U.S. Low Volatility Equity Portfolio | | | 0.00 | | | | 10.89 | | | | 1,621 | | | | 161,978 | | | | 0 | | | | 6,871 | | | | 35 | | | | 2,668,649 | | | | | |
Wells Fargo Factor Enhanced U.S. Small Cap Equity Portfolio | | | 0.85 | | | | 0.76 | | | | (159,411 | ) | | | 262,544 | | | | 17 | | | | 16,406 | | | | 116 | | | | 1,695,185 | | | | | |
Wells Fargo High Yield Corporate Bond Portfolio | | | 3.05 | | | | 0.88 | | | | (68,468 | ) | | | 45,321 | | | | 48,016 | | | | 0 | | | | 50 | | | | 1,608,814 | | | | | |
Wells Fargo Investment Grade Corporate Bond Portfolio | | | 4.01 | | | | 4.43 | | | | 76,473 | | | | 52,814 | | | | 165,846 | | | | 0 | | | | 73 | | | | 9,853,038 | | | | | |
Wells Fargo Strategic Retirement Bond Portfolio | | | 9.04 | | | | 9.86 | | | | 75,365 | | | | 120,187 | | | | 42,473 | | | | 0 | | | | 30 | | | | 6,393,160 | | | | | |
Wells Fargo U.S. REIT Portfolio | | | 5.34 | | | | 5.87 | | | | (103,939 | ) | | | 6,500 | | | | 0 | | | | 27,307 | | | | 18 | | | | 1,423,649 | | | | | |
| | | | | | | | | | | | | | | | | | | | | | | | | | | | | | | | | | | | |
| | | | | | | | | |
| | | | | | | | | | $ | 230,043 | | | $ | 1,607,574 | | | $ | 465,004 | | | $ | 220,602 | | | $ | 1,428 | | | $ | 55,527,456 | | | | 100.10 | % |
| | | | | | | | | | | | | | | | | | | | | | | | | | | | | | | | | | | | |
The accompanying notes are an integral part of these financial statements.
Wells Fargo Target Date Retirement Funds | 37
Portfolio of investments—August 31, 2020 (unaudited)
TARGET 2015 FUND
| | | | | | | | | | | | | | | | |
| | | | | | | | | | | | Value | |
| Investment Companies: 100.19% | |
|
Affiliated Master Portfolios: 100.19% | |
Wells Fargo Bloomberg Barclays US Aggregate ex-Corporate Portfolio | | | | | | | | | | | | | | $ | 18,197,373 | |
Wells Fargo Emerging Markets Bond Portfolio | | | | | | | | | | | | | | | 1,549,057 | |
Wells Fargo Factor Enhanced Emerging Markets Equity Portfolio | | | | | | | | | | | | | | | 1,344,101 | |
Wells Fargo Factor Enhanced International Equity Portfolio | | | | | | | | | | | | | | | 4,536,464 | |
Wells Fargo Factor Enhanced U.S. Large Cap Equity Portfolio | | | | | | | | | | | | | | | 8,779,019 | |
Wells Fargo Factor Enhanced U.S. Low Volatility Equity Portfolio | | | | | | | | | | | | | | | 2,196,198 | |
Wells Fargo Factor Enhanced U.S. Small Cap Equity Portfolio | | | | | | | | | | | | | | | 2,175,506 | |
Wells Fargo High Yield Corporate Bond Portfolio | | | | | | | | | | | | | | | 1,551,211 | |
Wells Fargo Investment Grade Corporate Bond Portfolio | | | | | | | | | | | | | | | 9,485,240 | |
Wells Fargo Strategic Retirement Bond Portfolio | | | | | | | | | | | | | | | 6,164,278 | |
Wells Fargo U.S. REIT Portfolio | | | | | | | | | | | | | | | 1,718,563 | |
| | | | |
Total Investment Companies (Cost $43,761,063) | | | | | | | | | | | | | | | 57,697,010 | |
| | | | | | | | | | | | | | | | |
| | | | | | | | |
| Total investments in securities (Cost $43,761,063) | | | 100.19 | % | | | 57,697,010 | |
| | |
Other assets and liabilities, net | | | (0.19 | ) | | | (111,556 | ) |
| | | | | | | | |
| Total net assets | | | 100.00 | % | | $ | 57,585,454 | |
| | | | | | | | |
Transactions with the affiliated Master Portfolios were as follows:
| | | | | | | | | | | | | | | | | | | | | | | | | | | | | | | | | | | | |
| | | % of
ownership,
beginning
of period | | | % of
ownership,
end of
period | | | Net realized
gains
(losses) on
securities
transactions
allocated
from
affiliated
Master
Portfolios | | | Net
change in
unrealized
gains
(losses) on
securities
transactions
allocated
from
affiliated
Master
Portfolios | | | Interest
allocated
from
affiliated
Master
Portfolios | | | Dividends
allocated
from
affiliated
Master
Portfolios | | | Affiliated
income
allocated
from
affiliated
Master
Portfolios | | | Value,
end
of period | | | % of
net
assets | |
Affiliated Master Portfolios | | | | | | | | | | | | | | | | | | | | | | | | | | | | | | | | | | | | |
Wells Fargo Bloomberg Barclays US Aggregate ex-Corporate Portfolio | | | 3.13 | % | | | 3.13 | % | | $ | 349,758 | | | $ | (63,894 | ) | | $ | 165,348 | | | $ | 0 | | | $ | 460 | | | $ | 18,197,373 | | | | | |
Wells Fargo Emerging Markets Bond Portfolio | | | 4.04 | | | | 4.31 | | | | 2,265 | | | | (38,348 | ) | | | 39,053 | | | | 0 | | | | 17 | | | | 1,549,057 | | | | | |
Wells Fargo Factor Enhanced Emerging Markets Equity Portfolio | | | 0.74 | | | | 0.64 | | | | (136,833 | ) | | | 161,402 | | | | 14 | | | | 25,212 | | | | 59 | | | | 1,344,101 | | | | | |
Wells Fargo Factor Enhanced International Equity Portfolio | | | 0.90 | | | | 0.72 | | | | (158,430 | ) | | | 474,785 | | | | 0 | | | | 83,714 | | | | 237 | | | | 4,536,464 | | | | | |
Wells Fargo Factor Enhanced U.S. Large Cap Equity Portfolio | | | 1.03 | | | | 0.99 | | | | 362,314 | | | | 525,897 | | | | 65 | | | | 104,946 | | | | 484 | | | | 8,779,019 | | | | | |
Wells Fargo Factor Enhanced U.S. Low Volatility Equity Portfolio | | | 0.00 | | | | 8.96 | | | | 1,325 | | | | 235,230 | | | | 0 | | | | 5,672 | | | | 29 | | | | 2,196,198 | | | | | |
Wells Fargo Factor Enhanced U.S. Small Cap Equity Portfolio | | | 1.07 | | | | 0.98 | | | | (206,898 | ) | | | 314,094 | | | | 21 | | | | 20,589 | | | | 146 | | | | 2,175,506 | | | | | |
Wells Fargo High Yield Corporate Bond Portfolio | | | 3.12 | | | | 0.85 | | | | (66,890 | ) | | | 34,591 | | | | 46,893 | | | | 0 | | | | 50 | | | | 1,551,211 | | | | | |
Wells Fargo Investment Grade Corporate Bond Portfolio | | | 4.10 | | | | 4.27 | | | | 77,504 | | | | (9,479 | ) | | | 162,301 | | | | 0 | | | | 72 | | | | 9,485,240 | | | | | |
Wells Fargo Strategic Retirement Bond Portfolio | | | 9.24 | | | | 9.51 | | | | 74,885 | | | | 109,073 | | | | 42,122 | | | | 0 | | | | 29 | | | | 6,164,278 | | | | | |
Wells Fargo U.S. REIT Portfolio | | | 6.84 | | | | 7.09 | | | | (131,111 | ) | | | (5,208 | ) | | | 0 | | | | 33,809 | | | | 22 | | | | 1,718,563 | | | | | |
| | | | | | | | | | | | | | | | | | | | | | | | | | | | | | | | | | | | |
| | | | | | | | | |
| | | | | | | | | | $ | 167,889 | | | $ | 1,738,143 | | | $ | 455,817 | | | $ | 273,942 | | | $ | 1,605 | | | $ | 57,697,010 | | | | 100.19 | % |
| | | | | | | | | | | | | | | | | | | | | | | | | | | | | | | | | | | | |
The accompanying notes are an integral part of these financial statements.
38 | Wells Fargo Target Date Retirement Funds
Portfolio of investments—August 31, 2020 (unaudited)
TARGET 2020 FUND
| | | | | | | | | | | | | | | | |
| | | | | | | | | | | | Value | |
| Investment Companies: 100.82% | |
|
| Affiliated Master Portfolios: 100.82% | |
Wells Fargo Bloomberg Barclays US Aggregate ex-Corporate Portfolio | | | | | | | | | | | | | | $ | 94,596,492 | |
Wells Fargo Emerging Markets Bond Portfolio | | | | | | | | | | | | | | | 8,039,113 | |
Wells Fargo Factor Enhanced Emerging Markets Equity Portfolio | | | | | | | | | | | | | | | 9,440,110 | |
Wells Fargo Factor Enhanced International Equity Portfolio | | | | | | | | | | | | | | | 31,859,076 | |
Wells Fargo Factor Enhanced U.S. Large Cap Equity Portfolio | | | | | | | | | | | | | | | 60,818,002 | |
Wells Fargo Factor Enhanced U.S. Low Volatility Equity Portfolio | | | | | | | | | | | | | | | 9,129,937 | |
Wells Fargo Factor Enhanced U.S. Small Cap Equity Portfolio | | | | | | | | | | | | | | | 15,165,323 | |
Wells Fargo High Yield Corporate Bond Portfolio | | | | | | | | | | | | | | | 8,050,698 | |
Wells Fargo Investment Grade Corporate Bond Portfolio | | | | | | | | | | | | | | | 49,300,933 | |
Wells Fargo Strategic Retirement Bond Portfolio | | | | | | | | | | | | | | | 29,423,436 | |
Wells Fargo U.S. REIT Portfolio | | | | | | | | | | | | | | | 10,262,426 | |
| | | | |
Total Investment Companies (Cost $271,372,766) | | | | | | | | | | | | | | | 326,085,546 | |
| | | | | | | | | | | | | | | | |
| | | | | | | | |
| Total investments in securities (Cost $271,372,766) | | | 100.82 | % | | | 326,085,546 | |
| | |
Other assets and liabilities, net | | | (0.82 | ) | | | (2,638,299 | ) |
| | | | | | | | |
| Total net assets | | | 100.00 | % | | $ | 323,447,247 | |
| | | | | | | | |
Transactions with the affiliated Master Portfolios were as follows:
| | | | | | | | | | | | | | | | | | | | | | | | | | | | | | | | | | | | |
| | | % of
ownership,
beginning
of period | | | % of
ownership,
end of
period | | | Net realized
gains
(losses) on
securities
transactions
allocated
from
affiliated
Master
Portfolios | | | Net
change in
unrealized
gains
(losses) on
securities
transactions
allocated
from
affiliated
Master
Portfolios | | | Interest
allocated
from
affiliated
Master
Portfolios | | | Dividends
allocated
from
affiliated
Master
Portfolios | | | Affiliated
income
allocated
from
affiliated
Master
Portfolios | | | Value,
end
of period | | | % of
net
assets | |
Affiliated Master Portfolios | | | | | | | | | | | | | | | | | | | | | | | | | | | | | | | | | | | | |
Wells Fargo Bloomberg Barclays US Aggregate ex-Corporate Portfolio | | | 16.98 | % | | | 16.28 | % | | $ | 1,828,744 | | | $ | (86,355 | ) | | $ | 858,443 | | | $ | 0 | | | $ | 2,392 | | | $ | 94,596,492 | | | | | |
Wells Fargo Emerging Markets Bond Portfolio | | | 21.86 | | | | 22.35 | | | | 11,214 | | | | (197,731 | ) | | | 203,644 | | | | 0 | | | | 89 | | | | 8,039,113 | | | | | |
Wells Fargo Factor Enhanced Emerging Markets Equity Portfolio | | | 5.16 | | | | 4.50 | | | | (888,336 | ) | | | 1,035,775 | | | | 97 | | | | 170,260 | | | | 398 | | | | 9,440,110 | | | | | |
Wells Fargo Factor Enhanced International Equity Portfolio | | | 6.30 | | | | 5.04 | | | | (1,045,010 | ) | | | 3,224,908 | | | | 0 | | | | 563,521 | | | | 1,608 | | | | 31,859,076 | | | | | |
Wells Fargo Factor Enhanced U.S. Large Cap Equity Portfolio | | | 7.17 | | | | 6.83 | | | | 2,499,028 | | | | 3,414,838 | | | | 446 | | | | 699,729 | | | | 3,006 | | | | 60,818,002 | | | | | |
Wells Fargo Factor Enhanced U.S. Low Volatility Equity Portfolio | | | 0.00 | | | | 37.24 | | | | 5,566 | | | | 566,641 | | | | 0 | | | | 23,592 | | | | 120 | | | | 9,129,937 | | | | | |
Wells Fargo Factor Enhanced U.S. Small Cap Equity Portfolio | | | 7.54 | | | | 6.81 | | | | (1,405,518 | ) | | | 2,046,035 | | | | 148 | | | | 137,654 | | | | 982 | | | | 15,165,323 | | | | | |
Wells Fargo High Yield Corporate Bond Portfolio | | | 16.95 | | | | 4.42 | | | | (348,987 | ) | | | 182,507 | | | | 245,037 | | | | 0 | | | | 262 | | | | 8,050,698 | | | | | |
Wells Fargo Investment Grade Corporate Bond Portfolio | | | 22.25 | | | | 22.18 | | | | 405,156 | | | | 112,584 | | | | 847,607 | | | | 0 | | | | 376 | | | | 49,300,933 | | | | | |
Wells Fargo Strategic Retirement Bond Portfolio | | | 46.07 | | | | 45.37 | | | | 361,031 | | | | 582,872 | | | | 200,418 | | | | 0 | | | | 141 | | | | 29,423,436 | | | | | |
Wells Fargo U.S. REIT Portfolio | | | 42.17 | | | | 42.33 | | | | (744,656 | ) | | | (280,329 | ) | | | 0 | | | | 196,902 | | | | 133 | | | | 10,262,426 | | | | | |
| | | | | | | | | | | | | | | | | | | | | | | | | | | | | | | | | | | | |
| | | | | | | | | |
| | | | | | | | | | $ | 678,232 | | | $ | 10,601,745 | | | $ | 2,355,840 | | | $ | 1,791,658 | | | $ | 9,507 | | | $ | 326,085,546 | | | | 100.82 | % |
| | | | | | | | | | | | | | | | | | | | | | | | | | | | | | | | | | | | |
The accompanying notes are an integral part of these financial statements.
Wells Fargo Target Date Retirement Funds | 39
Portfolio of investments—August 31, 2020 (unaudited)
TARGET 2025 FUND
| | | | | | | | | | | | | | | | |
| | | | | | | | | | | | Value | |
| Investment Companies: 100.12% | | | | | | | | | | | | |
| | | | |
| Affiliated Master Portfolios: 100.12% | | | | | | | | | | | | |
Wells Fargo Bloomberg Barclays US Aggregate ex-Corporate Portfolio | | | | | | | | | | | | | | $ | 50,721,580 | |
Wells Fargo Emerging Markets Bond Portfolio | | | | | | | | | | | | | | | 4,273,671 | |
Wells Fargo Factor Enhanced Emerging Markets Equity Portfolio | | | | | | | | | | | | | | | 7,773,472 | |
Wells Fargo Factor Enhanced International Equity Portfolio | | | | | | | | | | | | | | | 26,177,006 | |
Wells Fargo Factor Enhanced U.S. Large Cap Equity Portfolio | | | | | | | | | | | | | | | 48,008,212 | |
Wells Fargo Factor Enhanced U.S. Low Volatility Equity Portfolio | | | | | | | | | | | | | | | 3,532,083 | |
Wells Fargo Factor Enhanced U.S. Small Cap Equity Portfolio | | | | | | | | | | | | | | | 11,965,685 | |
Wells Fargo High Yield Corporate Bond Portfolio | | | | | | | | | | | | | | | 4,279,205 | |
Wells Fargo Investment Grade Corporate Bond Portfolio | | | | | | | | | | | | | | | 26,450,152 | |
Wells Fargo Strategic Retirement Bond Portfolio | | | | | | | | | | | | | | | 8,371,563 | |
Wells Fargo U.S. REIT Portfolio | | | | | | | | | | | | | | | 4,278,730 | |
| | | | |
Total Investment Companies (Cost $165,631,642) | | | | | | | | | | | | | | | 195,831,359 | |
| | | | | | | | | | | | | | | | |
| | | | | | | | |
| Total investments in securities (Cost $165,631,642) | | | 100.12 | % | | | 195,831,359 | |
| | |
Other assets and liabilities, net | | | (0.12 | ) | | | (240,301 | ) |
| | | | | | | | |
| Total net assets | | | 100.00 | % | | $ | 195,591,058 | |
| | | | | | | | |
Transactions with the affiliated Master Portfolios were as follows:
| | | | | | | | | | | | | | | | | | | | | | | | | | | | | | | | | | | | |
| | | % of
ownership,
beginning
of period | | | % of
ownership,
end of
period | | | Net realized
gains
(losses) on
securities
transactions
allocated
from
affiliated
Master
Portfolios | | | Net
change in
unrealized
gains
(losses) on
securities
transactions
allocated
from
affiliated
Master
Portfolios | | | Interest
allocated
from
affiliated
Master
Portfolios | | | Dividends
allocated
from
affiliated
Master
Portfolios | | | Affiliated
income
allocated
from
affiliated
Master
Portfolios | | | Value,
end
of period | | | % of
net
assets | |
Affiliated Master Portfolios | | | | | | | | | | | | | | | | | | | | | | | | | | | | | | | | | | | | |
Wells Fargo Bloomberg Barclays US Aggregate ex-Corporate Portfolio | | | 10.24 | % | | | 8.73 | % | | $ | 1,028,964 | | | $ | (88,058 | ) | | $ | 469,438 | | | $ | 0 | | | $ | 1,307 | | | $ | 50,721,580 | | | | | |
Wells Fargo Emerging Markets Bond Portfolio | | | 13.18 | | | | 11.88 | | | | 4,698 | | | | (160,906 | ) | | | 110,696 | | | | 0 | | | | 49 | | | | 4,273,671 | | | | | |
Wells Fargo Factor Enhanced Emerging Markets Equity Portfolio | | | 4.66 | | | | 3.71 | | | | (744,218 | ) | | | 715,723 | | | | 86 | | | | 139,582 | | | | 338 | | | | 7,773,472 | | | | | |
Wells Fargo Factor Enhanced International Equity Portfolio | | | 5.67 | | | | 4.14 | | | | (886,039 | ) | | | 2,263,273 | | | | 0 | | | | 464,665 | | | | 1,366 | | | | 26,177,006 | | | | | |
Wells Fargo Factor Enhanced U.S. Large Cap Equity Portfolio | | | 6.15 | | | | 5.39 | | | | 1,916,241 | | | | 2,329,654 | | | | 378 | | | | 551,847 | | | | 2,451 | | | | 48,008,212 | | | | | |
Wells Fargo Factor Enhanced U.S. Low Volatility Equity Portfolio | | | 0.00 | | | | 14.41 | | | | 2,141 | | | | 219,553 | | | | 0 | | | | 9,127 | | | | 47 | | | | 3,532,083 | | | | | |
Wells Fargo Factor Enhanced U.S. Small Cap Equity Portfolio | | | 6.44 | | | | 5.37 | | | | (1,133,354 | ) | | | 1,409,446 | | | | 125 | | | | 109,550 | | | | 803 | | | | 11,965,685 | | | | | |
Wells Fargo High Yield Corporate Bond Portfolio | | | 10.21 | | | | 2.35 | | | | (184,011 | ) | | | 24,805 | | | | 132,277 | | | | 0 | | | | 145 | | | | 4,279,205 | | | | | |
Wells Fargo Investment Grade Corporate Bond Portfolio | | | 13.49 | | | | 11.90 | | | | 241,322 | | | | (190,931 | ) | | | 462,700 | | | | 0 | | | | 207 | | | | 26,450,152 | | | | | |
Wells Fargo Strategic Retirement Bond Portfolio | | | 14.75 | | | | 12.91 | | | | 108,797 | | | | 146,362 | | | | 59,113 | | | | 0 | | | | 42 | | | | 8,371,563 | | | | | |
Wells Fargo U.S. REIT Portfolio | | | 20.24 | | | | 17.65 | | | | (323,537 | ) | | | (240,315 | ) | | | 0 | | | | 85,251 | | | | 59 | | | | 4,278,730 | | | | | |
| | | | | | | | | | | | | | | | | | | | | | | | | | | | | | | | | | | | |
| | | | | | | | | |
| | | | | | | | | | $ | 31,004 | | | $ | 6,428,606 | | | $ | 1,234,813 | | | $ | 1,360,022 | | | $ | 6,814 | | | $ | 195,831,359 | | | | 100.12 | % |
| | | | | | | | | | | | | | | | | | | | | | | | | | | | | | | | | | | | |
The accompanying notes are an integral part of these financial statements.
40 | Wells Fargo Target Date Retirement Funds
Portfolio of investments—August 31, 2020 (unaudited)
TARGET 2030 FUND
| | | | | | | | | | | | | | | | |
| | | | | | | | | | | | Value | |
| Investment Companies: 100.40% | | | | | | | | | | | | |
| | | | |
| Affiliated Master Portfolios: 100.40% | | | | | | | | | | | | |
Wells Fargo Bloomberg Barclays US Aggregate ex-Corporate Portfolio | | | | | | | | | | | | | | $ | 105,830,894 | |
Wells Fargo Emerging Markets Bond Portfolio | | | | | | | | | | | | | | | 8,877,784 | |
Wells Fargo Factor Enhanced Emerging Markets Equity Portfolio | | | | | | | | | | | | | | | 24,754,306 | |
Wells Fargo Factor Enhanced International Equity Portfolio | | | | | | | | | | | | | | | 83,729,832 | |
Wells Fargo Factor Enhanced U.S. Large Cap Equity Portfolio | | | | | | | | | | | | | | | 146,613,204 | |
Wells Fargo Factor Enhanced U.S. Low Volatility Equity Portfolio | | | | | | | | | | | | | | | 3,879,605 | |
Wells Fargo Factor Enhanced U.S. Small Cap Equity Portfolio | | | | | | | | | | | | | | | 36,556,227 | |
Wells Fargo High Yield Corporate Bond Portfolio | | | | | | | | | | | | | | | 8,890,399 | |
Wells Fargo Investment Grade Corporate Bond Portfolio | | | | | | | | | | | | | | | 55,198,955 | |
Wells Fargo Strategic Retirement Bond Portfolio | | | | | | | | | | | | | | | 5,172,300 | |
Wells Fargo U.S. REIT Portfolio | | | | | | | | | | | | | | | 3,845,381 | |
| | | | |
Total Investment Companies (Cost $416,582,629) | | | | | | | | | | | | | | | 483,348,887 | |
| | | | | | | | | | | | | | | | |
| | | | | | | | |
| Total investments in securities (Cost $416,582,629) | | | 100.40 | % | | | 483,348,887 | |
| | |
Other assets and liabilities, net | | | (0.40 | ) | | | (1,920,392 | ) |
| | | | | | | | |
| Total net assets | | | 100.00 | % | | $ | 481,428,495 | |
| | | | | | | | |
Transactions with the affiliated Master Portfolios were as follows:
| | | | | | | | | | | | | | | | | | | | | | | | | | | | | | | | | | | | |
| | | % of
ownership,
beginning
of period | | | % of
ownership,
end of
period | | | Net realized
gains
(losses) on
securities
transactions
allocated
from
affiliated
Master
Portfolios | | | Net
change in
unrealized
gains
(losses) on
securities
transactions
allocated
from
affiliated
Master
Portfolios | | | Interest
allocated
from
affiliated
Master
Portfolios | | | Dividends
allocated
from
affiliated
Master
Portfolios | | | Affiliated
income
allocated
from
affiliated
Master
Portfolios | | | Value,
end
of period | | | % of
net
assets | |
Affiliated Master Portfolios | | | | | | | | | | | | | | | | | | | | | | | | | | | | | | | | | | | | |
Wells Fargo Bloomberg Barclays US Aggregate ex-Corporate Portfolio | | | 18.76 | % | | | 21.90 | % | | $ | 1,963,823 | | | $ | (284,316 | ) | | $ | 933,673 | | | $ | 0 | | | $ | 2,616 | | | $ | 105,830,894 | | | | | |
Wells Fargo Emerging Markets Bond Portfolio | | | 23.91 | | | | 1.84 | | | | 13,814 | | | | (209,183 | ) | | | 218,674 | | | | 0 | | | | 96 | | | | 8,877,784 | | | | | |
Wells Fargo Factor Enhanced Emerging Markets Equity Portfolio | | | 12.59 | | | | 5.12 | | | | (2,092,111 | ) | | | 2,510,982 | | | | 233 | | | | 422,011 | | | | 948 | | | | 24,754,306 | | | | | |
Wells Fargo Factor Enhanced International Equity Portfolio | | | 15.39 | | | | 17.32 | | | | (2,447,429 | ) | | | 8,137,210 | | | | 0 | | | | 1,370,875 | | | | 3,875 | | | | 83,729,832 | | | | | |
Wells Fargo Factor Enhanced U.S. Large Cap Equity Portfolio | | | 16.00 | | | | 30.33 | | | | 6,039,950 | | | | 8,216,113 | | | | 990 | | | | 1,574,283 | | | | 7,155 | | | | 146,613,204 | | | | | |
Wells Fargo Factor Enhanced U.S. Low Volatility Equity Portfolio | | | 0.00 | | | | 0.80 | | | | 2,356 | | | | 236,871 | | | | 0 | | | | 9,911 | | | | 50 | | | | 3,879,605 | | | | | |
Wells Fargo Factor Enhanced U.S. Small Cap Equity Portfolio | | | 16.72 | | | | 7.56 | | | | (3,234,785 | ) | | | 4,834,167 | | | | 331 | | | | 307,490 | | | | 2,159 | | | | 36,556,227 | | | | | |
Wells Fargo High Yield Corporate Bond Portfolio | | | 18.60 | | | | 1.84 | | | | (369,915 | ) | | | 182,315 | | | | 262,449 | | | | 0 | | | | 280 | | | | 8,890,399 | | | | | |
Wells Fargo Investment Grade Corporate Bond Portfolio | | | 24.69 | | | | 11.42 | | | | 443,482 | | | | 39,841 | | | | 921,513 | | | | 0 | | | | 407 | | | | 55,198,955 | | | | | |
Wells Fargo Strategic Retirement Bond Portfolio | | | 8.00 | | | | 1.07 | | | | 61,309 | | | | 90,232 | | | | 34,080 | | | | 0 | | | | 24 | | | | 5,172,300 | | | | | |
Wells Fargo U.S. REIT Portfolio | | | 15.61 | | | | 0.80 | | | | (265,584 | ) | | | (133,909 | ) | | | 0 | | | | 71,803 | | | | 48 | | | | 3,845,381 | | | | | |
| | | | | | | | | | | | | | | | | | | | | | | | | | | | | | | | | | | | |
| | | | | | | | | |
| | | | | | | | | | $ | 114,910 | | | $ | 23,620,323 | | | $ | 2,371,943 | | | $ | 3,756,373 | | | $ | 17,658 | | | $ | 483,348,887 | | | | 100.40 | % |
| | | | | | | | | | | | | | | | | | | | | | | | | | | | | | | | | | | | |
The accompanying notes are an integral part of these financial statements.
Wells Fargo Target Date Retirement Funds | 41
Portfolio of investments—August 31, 2020 (unaudited)
TARGET 2035 FUND
| | | | | | | | | | | | | | | | |
| | | | | | | | | | | | Value | |
| Investment Companies: 100.09% | |
|
| Affiliated Master Portfolios: 100.09% | |
Wells Fargo Bloomberg Barclays US Aggregate ex-Corporate Portfolio | | | | | | | | | | | | | | $ | 31,536,955 | |
Wells Fargo Emerging Markets Bond Portfolio | | | | | | | | | | | | | | | 2,662,297 | |
Wells Fargo Factor Enhanced Emerging Markets Equity Portfolio | | | | | | | | | | | | | | | 11,851,954 | |
Wells Fargo Factor Enhanced International Equity Portfolio | | | | | | | | | | | | | | | 40,305,015 | |
Wells Fargo Factor Enhanced U.S. Large Cap Equity Portfolio | | | | | | | | | | | | | | | 67,696,324 | |
Wells Fargo Factor Enhanced U.S. Small Cap Equity Portfolio | | | | | | | | | | | | | | | 16,834,623 | |
Wells Fargo High Yield Corporate Bond Portfolio | | | | | | | | | | | | | | | 2,663,711 | |
Wells Fargo Investment Grade Corporate Bond Portfolio | | | | | | | | | | | | | | | 16,497,185 | |
| | | | |
Total Investment Companies (Cost $165,139,486) | | | | | | | | | | | | | | | 190,048,064 | |
| | | | | | | | | | | | | | | | |
| | | | | | | | |
| Total investments in securities (Cost $165,139,486) | | | 100.09 | % | | | 190,048,064 | |
| | |
Other assets and liabilities, net | | | (0.09 | ) | | | (177,403 | ) |
| | | | | | | | |
| Total net assets | | | 100.00 | % | | $ | 189,870,661 | |
| | | | | | | | |
Transactions with the affiliated Master Portfolios were as follows:
| | | | | | | | | | | | | | | | | | | | | | | | | | | | | | | | | | | | |
| | | % of
ownership,
beginning
of period | | | % of
ownership,
end of
period | | | Net realized
gains
(losses) on
securities
transactions
allocated
from
affiliated
Master
Portfolios | | | Net
change in
unrealized
gains
(losses) on
securities
transactions
allocated
from
affiliated
Master
Portfolios | | | Interest
allocated
from
affiliated
Master
Portfolios | | | Dividends
allocated
from
affiliated
Master
Portfolios | | | Affiliated
income
allocated
from
affiliated
Master
Portfolios | | | Value,
end
of period | | | % of
net
assets | |
Affiliated Master Portfolios | | | | | | | | | | | | | | | | | | | | | | | | | | | | | | | | | | | | |
Wells Fargo Bloomberg Barclays US Aggregate ex-Corporate Portfolio | | | 5.92 | % | | | 5.43 | % | | $ | 588,644 | | | $ | (71,765 | ) | | $ | 270,248 | | | $ | 0 | | | $ | 781 | | | $ | 31,536,955 | | | | | |
Wells Fargo Emerging Markets Bond Portfolio | | | 7.62 | | | | 7.40 | | | | 3,834 | | | | (74,871 | ) | | | 65,774 | | | | 0 | | | | 29 | | | | 2,662,297 | | | | | |
Wells Fargo Factor Enhanced Emerging Markets Equity Portfolio | | | 6.31 | | | | 5.66 | | | | (1,012,417 | ) | | | 1,105,427 | | | | 7 | | | | 200,182 | | | | 568 | | | | 11,851,954 | | | | | |
Wells Fargo Factor Enhanced International Equity Portfolio | | | 7.78 | | | | 6.37 | | | | (1,188,172 | ) | | | 3,456,235 | | | | 0 | | | | 654,762 | | | | 2,139 | | | | 40,305,015 | | | | | |
Wells Fargo Factor Enhanced U.S. Large Cap Equity Portfolio | | | 7.75 | | | | 7.61 | | | | 2,723,181 | | | | 3,392,231 | | | | 477 | | | | 722,319 | | | | 2,347 | | | | 67,696,324 | | | | | |
Wells Fargo Factor Enhanced U.S. Small Cap Equity Portfolio | | | 8.11 | | | | 7.56 | | | | (1,499,534 | ) | | | 2,002,142 | | | | 159 | | | | 141,940 | | | | 1,011 | | | | 16,834,623 | | | | | |
Wells Fargo High Yield Corporate Bond Portfolio | | | 5.90 | | | | 1.46 | | | | (108,740 | ) | | | 35,540 | | | | 78,834 | | | | 0 | | | | 85 | | | | 2,663,711 | | | | | |
Wells Fargo Investment Grade Corporate Bond Portfolio | | | 7.79 | | | | 7.42 | | | | 139,526 | | | | (71,441 | ) | | | 282,684 | | | | 0 | | | | 121 | | | | 16,497,185 | | | | | |
| | | | | | | | | | | | | | | | | | | | | | | | | | | | | | | | | | | | |
| | | | | | | | | |
| | | | | | | | | | $ | (353,678 | ) | | $ | 9,773,498 | | | $ | 698,183 | | | $ | 1,719,203 | | | $ | 7,081 | | | $ | 190,048,064 | | | | 100.09 | % |
| | | | | | | | | | | | | | | | | | | | | | | | | | | | | | | | | | | | |
The accompanying notes are an integral part of these financial statements.
42 | Wells Fargo Target Date Retirement Funds
Portfolio of investments—August 31, 2020 (unaudited)
TARGET 2040 FUND
| | | | | | | | | | | | | | | | |
| | | | | | | | | | | | Value | |
| Investment Companies: 100.53% | | | | | | | | | | | | |
| | | | |
| Affiliated Master Portfolios: 100.53% | | | | | | | | | | | | |
Wells Fargo Bloomberg Barclays US Aggregate ex-Corporate Portfolio | | | | | | | | | | | | | | $ | 50,486,180 | |
Wells Fargo Emerging Markets Bond Portfolio | | | | | | | | | | | | | | | 4,259,023 | |
Wells Fargo Factor Enhanced Emerging Markets Equity Portfolio | | | | | | | | | | | | | | | 32,367,344 | |
Wells Fargo Factor Enhanced International Equity Portfolio | | | | | | | | | | | | | | | 109,253,809 | |
Wells Fargo Factor Enhanced U.S. Large Cap Equity Portfolio | | | | | | | | | | | | | | | 177,328,824 | |
Wells Fargo Factor Enhanced U.S. Small Cap Equity Portfolio | | | | | | | | | | | | | | | 44,041,097 | |
Wells Fargo High Yield Corporate Bond Portfolio | | | | | | | | | | | | | | | 4,264,211 | |
Wells Fargo Investment Grade Corporate Bond Portfolio | | | | | | | | | | | | | | | 26,404,700 | |
| | | | |
Total Investment Companies (Cost $393,598,019) | | | | | | | | | | | | | | | 448,405,188 | |
| | | | | | | | | | | | | | | | |
| | | | | | | | |
| Total investments in securities (Cost $393,598,019) | | | 100.53 | % | | | 448,405,188 | |
| | |
Other assets and liabilities, net | | | (0.53 | ) | | | (2,368,658 | ) |
| | | | | | | | |
| Total net assets | | | 100.00 | % | | $ | 446,036,530 | |
| | | | | | | | |
Transactions with the affiliated Master Portfolios were as follows:
| | | | | | | | | | | | | | | | | | | | | | | | | | | | | | | | | | | | |
| | | % of
ownership,
beginning
of period | | | % of
ownership,
end of
period | | | Net realized
gains
(losses) on
securities
transactions
allocated
from
affiliated
Master
Portfolios | | | Net
change in
unrealized
gains
(losses) on
securities
transactions
allocated
from
affiliated
Master
Portfolios | | | Interest
allocated
from
affiliated
Master
Portfolios | | | Dividends
allocated
from
affiliated
Master
Portfolios | | | Affiliated
income
allocated
from
affiliated
Master
Portfolios | | | Value,
end
of period | | | % of
net
assets | |
Affiliated Master Portfolios | | | | | | | | | | | | | | | | | | | | | | | | | | | | | | | | | | | | |
Wells Fargo Bloomberg Barclays US Aggregate ex-Corporate Portfolio | | | 8.68 | % | | | 8.69 | % | | $ | 894,011 | | | $ | (130,117 | ) | | $ | 433,349 | | | $ | 0 | | | $ | 1,217 | | | $ | 50,486,180 | | | | | |
Wells Fargo Emerging Markets Bond Portfolio | | | 11.16 | | | | 11.84 | | | | 7,294 | | | | (95,882 | ) | | | 101,707 | | | | 0 | | | | 44 | | | | 4,259,023 | | | | | |
Wells Fargo Factor Enhanced Emerging Markets Equity Portfolio | | | 15.84 | | | | 15.44 | | | | (2,546,523 | ) | | | 3,063,535 | | | | 12 | | | | 535,824 | | | | 1,448 | | | | 32,367,344 | | | | | |
Wells Fargo Factor Enhanced International Equity Portfolio | | | 19.34 | | | | 17.28 | | | | (2,968,736 | ) | | | 9,884,161 | | | | 0 | | | | 1,708,164 | | | | 5,450 | | | | 109,253,809 | | | | | |
Wells Fargo Factor Enhanced U.S. Large Cap Equity Portfolio | | | 18.63 | | | | 19.93 | | | | 7,199,390 | | | | 9,081,335 | | | | 1,149 | | | | 1,823,133 | | | | 5,767 | | | | 177,328,824 | | | | | |
Wells Fargo Factor Enhanced U.S. Small Cap Equity Portfolio | | | 19.43 | | | | 19.77 | | | | (3,755,122 | ) | | | 5,530,927 | | | | 384 | | | | 355,992 | | | | 2,462 | | | | 44,041,097 | | | | | |
Wells Fargo High Yield Corporate Bond Portfolio | | | 8.66 | | | | 2.34 | | | | (170,633 | ) | | | 84,616 | | | | 122,039 | | | | 0 | | | | 130 | | | | 4,264,211 | | | | | |
Wells Fargo Investment Grade Corporate Bond Portfolio | | | 11.42 | | | | 11.88 | | | | 205,018 | | | | 29,879 | | | | 425,870 | | | | 0 | | | | 187 | | | | 26,404,700 | | | | | |
| | | | | | | | | | | | | | | | | | | | | | | | | | | | | | | | | | | | |
| | | | | | | | | |
| | | | | | | | | | $ | (1,135,301 | ) | | $ | 27,448,454 | | | $ | 1,084,510 | | | $ | 4,423,113 | | | $ | 16,705 | | | $ | 448,405,188 | | | | 100.53 | % |
| | | | | | | | | | | | | | | | | | | | | | | | | | | | | | | | | | | | |
The accompanying notes are an integral part of these financial statements.
Wells Fargo Target Date Retirement Funds | 43
Portfolio of investments—August 31, 2020 (unaudited)
TARGET 2045 FUND
| | | | | | | | | | | | | | | | |
| | | | | | | | | | | | Value | |
| Investment Companies: 100.14% | | | | | | | | | | | | |
| | | | |
| Affiliated Master Portfolios: 100.14% | | | | | | | | | | | | |
Wells Fargo Bloomberg Barclays US Aggregate ex-Corporate Portfolio | | | | | | | | | | | | | | $ | 7,551,892 | |
Wells Fargo Emerging Markets Bond Portfolio | | | | | | | | | | | | | | | 637,462 | |
Wells Fargo Factor Enhanced Emerging Markets Equity Portfolio | | | | | | | | | | | | | | | 7,050,701 | |
Wells Fargo Factor Enhanced International Equity Portfolio | | | | | | | | | | | | | | | 23,851,660 | |
Wells Fargo Factor Enhanced U.S. Large Cap Equity Portfolio | | | | | | | | | | | | | | | 37,900,209 | |
Wells Fargo Factor Enhanced U.S. Small Cap Equity Portfolio | | | | | | | | | | | | | | | 9,410,986 | |
Wells Fargo High Yield Corporate Bond Portfolio | | | | | | | | | | | | | | | 637,857 | |
Wells Fargo Investment Grade Corporate Bond Portfolio | | | | | | | | | | | | | | | 3,953,007 | |
| | | | |
Total Investment Companies (Cost $79,482,766) | | | | | | | | | | | | | | | 90,993,774 | |
| | | | | | | | | | | | | | | | |
| | | | | | | | |
| Total investments in securities (Cost $79,482,766) | | | 100.14 | % | | | 90,993,774 | |
| | |
Other assets and liabilities, net | | | (0.14 | ) | | | (123,590 | ) |
| | | | | | | | |
| Total net assets | | | 100.00 | % | | $ | 90,870,184 | |
| | | | | | | | |
Transactions with the affiliated Master Portfolios were as follows:
| | | | | | | | | | | | | | | | | | | | | | | | | | | | | | | | | | | | |
| | | % of
ownership,
beginning
of period | | | % of
ownership,
end of
period | | | Net realized
gains
(losses) on
securities
transactions
allocated
from
affiliated
Master
Portfolios | | | Net
change in
unrealized
gains
(losses) on
securities
transactions
allocated
from
affiliated
Master
Portfolios | | | Interest
allocated
from
affiliated
Master
Portfolios | | | Dividends
allocated
from
affiliated
Master
Portfolios | | | Affiliated
Income
allocated
from
affiliated
Master
Portfolios | | | Value,
end
of period | | | % of
net
assets | |
Affiliated Master Portfolios | | | | | | | | | | | | | | | | | | | | | | | | | | | | | | | | | | | | |
Wells Fargo Bloomberg Barclays US Aggregate ex-Corporate Portfolio | | | 1.53 | % | | | 1.30 | % | | $ | 144,634 | | | $ | (9,711 | ) | | $ | 67,766 | | | $ | 0 | | | $ | 189 | | | $ | 7,551,892 | | | | | |
Wells Fargo Emerging Markets Bond Portfolio | | | 1.96 | | | | 1.77 | | | | 864 | | | | (19,274 | ) | | | 15,857 | | | | 0 | | | | 7 | | | | 637,462 | | | | | |
Wells Fargo Factor Enhanced Emerging Markets Equity Portfolio | | | 4.02 | | | | 3.36 | | | | (607,404 | ) | | | 637,909 | | | | 4 | | | | 119,939 | | | | 348 | | | | 7,050,701 | | | | | |
Wells Fargo Factor Enhanced International Equity Portfolio | | | 4.92 | | | | 3.77 | | | | (708,842 | ) | | | 1,891,042 | | | | 0 | | | | 390,989 | | | | 1,301 | | | | 23,851,660 | | | | | |
Wells Fargo Factor Enhanced U.S. Large Cap Equity Portfolio | | | 4.65 | | | | 4.26 | | | | 1,509,526 | | | | 1,772,967 | | | | 284 | | | | 406,717 | | | | 1,308 | | | | 37,900,209 | | | | | |
Wells Fargo Factor Enhanced U.S. Small Cap Equity Portfolio | | | 4.90 | | | | 4.22 | | | | (845,411 | ) | | | 1,097,560 | | | | 95 | | | | 80,097 | | | | 577 | | | | 9,410,986 | | | | | |
Wells Fargo High Yield Corporate Bond Portfolio | | | 1.52 | | | | 0.35 | | | | (26,045 | ) | | | 6,270 | | | | 18,941 | | | | 0 | | | | 21 | | | | 637,857 | | | | | |
Wells Fargo Investment Grade Corporate Bond Portfolio | | | 2.01 | | | | 1.78 | | | | 34,375 | | | | (19,706 | ) | | | 66,003 | | | | 0 | | | | 29 | | | | 3,953,007 | | | | | |
| | | | | | | | | | | | | | | | | | | | | | | | | | | | | | | | | | | | |
| | | | | | | | | |
| | | | | | | | | | $ | (498,303 | ) | | $ | 5,357,057 | | | $ | 168,950 | | | $ | 997,742 | | | $ | 3,780 | | | $ | 90,993,774 | | | | 100.14 | % |
| | | | | | | | | | | | | | | | | | | | | | | | | | | | | | | | | | | | |
The accompanying notes are an integral part of these financial statements.
44 | Wells Fargo Target Date Retirement Funds
Portfolio of investments—August 31, 2020 (unaudited)
TARGET 2050 FUND
| | | | | | | | | | | | | | | | |
| | | | | | | | | | | | Value | |
| Investment Companies: 100.29% | |
|
| Affiliated Master Portfolios: 100.29% | |
Wells Fargo Bloomberg Barclays US Aggregate ex-Corporate Portfolio | | | | | | | | | | | | | | $ | 12,453,448 | |
Wells Fargo Emerging Markets Bond Portfolio | | | | | | | | | | | | | | | 1,050,403 | |
Wells Fargo Factor Enhanced Emerging Markets Equity Portfolio | | | | | | | | | | | | | | | 16,990,310 | |
Wells Fargo Factor Enhanced International Equity Portfolio | | | | | | | | | | | | | | | 57,572,159 | |
Wells Fargo Factor Enhanced U.S. Large Cap Equity Portfolio | | | | | | | | | | | | | | | 89,936,452 | |
Wells Fargo Factor Enhanced U.S. Small Cap Equity Portfolio | | | | | | | | | | | | | | | 22,335,389 | |
Wells Fargo High Yield Corporate Bond Portfolio | | | | | | | | | | | | | | | 1,051,853 | |
Wells Fargo Investment Grade Corporate Bond Portfolio | | | | | | | | | | | | | | | 6,525,735 | |
| | | | |
Total Investment Companies (Cost $180,896,340) | | | | | | | | | | | | | | | 207,915,749 | |
| | | | | | | | | | | | | | | | |
| | | | | | | | |
| Total investments in securities (Cost $180,896,340) | | | 100.29 | % | | | 207,915,749 | |
| | |
Other assets and liabilities, net | | | (0.29 | ) | | | (607,838 | ) |
| | | | | | | | |
| Total net assets | | | 100.00 | % | | $ | 207,307,911 | |
| | | | | | | | |
Transactions with the affiliated Master Portfolios were as follows:
| | | | | | | | | | | | | | | | | | | | | | | | | | | | | | | | | | | | |
| | | % of
ownership,
beginning
of period | | | % of
ownership,
end of
period | | | Net realized
gains
(losses) on
securities
transactions
allocated
from
affiliated
Master
Portfolios | | | Net
change in
unrealized
gains
(losses) on
securities
transactions
allocated
from
affiliated
Master
Portfolios | | | Interest
allocated
from
affiliated
Master
Portfolios | | | Dividends
allocated
from
affiliated
Master
Portfolios | | | Affiliated
Income
allocated
from
affiliated
Master
Portfolios | | | Value,
end
of period | | | % of
net
assets | |
Affiliated Master Portfolios | | | | | | | | | | | | | | | | | | | | | | | | | | | | | | | | | | | | |
Wells Fargo Bloomberg Barclays US Aggregate ex-Corporate Portfolio | | | 2.08 | % | | | 2.14 | % | | $ | 210,585 | | | $ | (42,743 | ) | | $ | 103,433 | | | $ | 0 | | | $ | 293 | | | $ | 12,453,448 | | | | | |
Wells Fargo Emerging Markets Bond Portfolio | | | 2.67 | | | | 2.92 | | | | 1,845 | | | | (21,985 | ) | | | 24,431 | | | | 0 | | | | 10 | | | | 1,050,403 | | | | | |
Wells Fargo Factor Enhanced Emerging Markets Equity Portfolio | | | 8.24 | | | | 8.11 | | | | (1,318,973 | ) | | | 1,623,643 | | | | 142 | | | | 277,057 | | | | 605 | | | | 16,990,310 | | | | | |
Wells Fargo Factor Enhanced International Equity Portfolio | | | 10.11 | | | | 9.10 | | | | (1,481,746 | ) | | | 4,902,871 | | | | 0 | | | | 872,185 | | | | 2,463 | | | | 57,572,159 | | | | | |
Wells Fargo Factor Enhanced U.S. Large Cap Equity Portfolio | | | 9.36 | | | | 10.11 | | | | 3,615,453 | | | | 4,584,674 | | | | 475 | | | | 901,734 | | | | 4,058 | | | | 89,936,452 | | | | | |
Wells Fargo Factor Enhanced U.S. Small Cap Equity Portfolio | | | 9.79 | | | | 10.03 | | | | (1,865,573 | ) | | | 2,793,069 | | | | 176 | | | | 176,760 | | | | 1,223 | | | | 22,335,389 | | | | | |
Wells Fargo High Yield Corporate Bond Portfolio | | | 2.08 | | | | 0.58 | | | | (40,110 | ) | | | 21,262 | | | | 29,175 | | | | 0 | | | | 31 | | | | 1,051,853 | | | | | |
Wells Fargo Investment Grade Corporate Bond Portfolio | | | 2.74 | | | | 2.94 | | | | 49,826 | | | | 4,800 | | | | 101,876 | | | | 0 | | | | 44 | | | | 6,525,735 | | | | | |
| | | | | | | | | | | | | | | | | | | | | | | | | | | | | | | | | | | | |
| | | | | | | | | | $ | (828,693 | ) | | $ | 13,865,591 | | | $ | 259,708 | | | $ | 2,227,736 | | | $ | 8,727 | | | $ | 207,915,749 | | | | 100.29 | % |
| | | | | | | | | | | | | | | | | | | | | | | | | | | | | | | | | | | | |
The accompanying notes are an integral part of these financial statements.
Wells Fargo Target Date Retirement Funds | 45
Portfolio of investments—August 31, 2020 (unaudited)
TARGET 2055 FUND
| | | | | | | | | | | | | | | | |
| | | | | | | | | | | | Value | |
| Investment Companies: 100.42% | | | | | | | | | | | | |
| | | | |
| Affiliated Master Portfolios: 100.42% | | | | | | | | | | | | |
Wells Fargo Bloomberg Barclays US Aggregate ex-Corporate Portfolio | | | | | | | | | | | | | | $ | 1,675,152 | |
Wells Fargo Emerging Markets Bond Portfolio | | | | | | | | | | | | | | | 141,419 | |
Wells Fargo Factor Enhanced Emerging Markets Equity Portfolio | | | | | | | | | | | | | | | 2,269,199 | |
Wells Fargo Factor Enhanced International Equity Portfolio | | | | | | | | | | | | | | | 7,713,498 | |
Wells Fargo Factor Enhanced U.S. Large Cap Equity Portfolio | | | | | | | | | | | | | | | 12,012,851 | |
Wells Fargo Factor Enhanced U.S. Small Cap Equity Portfolio | | | | | | | | | | | | | | | 2,993,248 | |
Wells Fargo High Yield Corporate Bond Portfolio | | | | | | | | | | | | | | | 141,487 | |
Wells Fargo Investment Grade Corporate Bond Portfolio | | | | | | | | | | | | | | | 876,648 | |
| | | | |
Total Investment Companies (Cost $26,558,109) | | | | | | | | | | | | | | | 27,823,502 | |
| | | | | | | | | | | | | | | | |
| | | | | | | | |
| Total investments in securities (Cost $26,558,109) | | | 100.42 | % | | | 27,823,502 | |
| | |
Other assets and liabilities, net | | | (0.42 | ) | | | (116,109 | ) |
| | | | | | | | |
| Total net assets | | | 100.00 | % | | $ | 27,707,393 | |
| | | | | | | | |
Transactions with the affiliated Master Portfolios were as follows:
| | | | | | | | | | | | | | | | | | | | | | | | | | | | | | | | | | | | |
| | | % of
ownership,
beginning
of period | | | % of
ownership,
end of
period | | | Net realized
gains
(losses) on
securities
transactions
allocated
from
affiliated
Master
Portfolios | | | Net
change in
unrealized
gains
(losses) on
securities
transactions
allocated
from
affiliated
Master
Portfolios | | | Interest
allocated
from
affiliated
Master
Portfolios | | | Dividends
allocated
from
affiliated
Master
Portfolios | | | Affiliated
Income
allocated
from
affiliated
Master
Portfolios | | | Value,
end
of period | | | % of
net
assets | |
Affiliated Master Portfolios | | | | | | | | | | | | | | | | | | | | | | | | | | | | | | | | | | | | |
Wells Fargo Bloomberg Barclays US Aggregate ex-Corporate Portfolio | | | 0.34 | % | | | 0.29 | % | | $ | 30,896 | | | $ | (491 | ) | | $ | 14,865 | | | $ | 0 | | | $ | 42 | | | $ | 1,675,152 | | | | | |
Wells Fargo Emerging Markets Bond Portfolio | | | 0.44 | | | | 0.39 | | | | 172 | | | | (3,842 | ) | | | 3,518 | | | | 0 | | | | 2 | | | | 141,419 | | | | | |
Wells Fargo Factor Enhanced Emerging Markets Equity Portfolio | | | 1.36 | | | | 1.08 | | | | (205,022 | ) | | | 197,181 | | | | 32 | | | | 38,574 | | | | 92 | | | | 2,269,199 | | | | | |
Wells Fargo Factor Enhanced International Equity Portfolio | | | 1.67 | | | | 1.22 | | | | (240,330 | ) | | | 586,875 | | | | 0 | | | | 127,716 | | | | 377 | | | | 7,713,498 | | | | | |
Wells Fargo Factor Enhanced U.S. Large Cap Equity Portfolio | | | 1.53 | | | | 1.35 | | | | 466,632 | | | | 533,180 | | | | 130 | | | | 130,204 | | | | 620 | | | | 12,012,851 | | | | | |
Wells Fargo Factor Enhanced U.S. Small Cap Equity Portfolio | | | 1.60 | | | | 1.34 | | | | (272,327 | ) | | | 290,576 | | | | 41 | | | | 25,701 | | | | 189 | | | | 2,993,248 | | | | | |
Wells Fargo High Yield Corporate Bond Portfolio | | | 0.34 | | | | 0.08 | | | | (5,654 | ) | | | 1,567 | | | | 4,184 | | | | 0 | | | | 5 | | | | 141,487 | | | | | |
Wells Fargo Investment Grade Corporate Bond Portfolio | | | 0.45 | | | | 0.39 | | | | 7,476 | | | | (317 | ) | | | 14,597 | | | | 0 | | | | 7 | | | | 876,648 | | | | | |
| | | | | | | | | | | | | | | | | | | | | | | | | | | | | | | | | | | | |
| | | | | | | | | |
| | | | | | | | | | $ | (218,157 | ) | | $ | 1,604,729 | | | $ | 37,367 | | | $ | 322,195 | | | $ | 1,334 | | | $ | 27,823,502 | | | | 100.42 | % |
| | | | | | | | | | | | | | | | | | | | | | | | | | | | | | | | | | | | |
The accompanying notes are an integral part of these financial statements.
46 | Wells Fargo Target Date Retirement Funds
Portfolio of investments—August 31, 2020 (unaudited)
TARGET 2060 FUND
| | | | | | | | | | | | | | | | |
| | | | | | | | | | | | Value | |
| Investment Companies: 101.24% | | | | | | | | | | | | |
| | | | |
| Affiliated Master Portfolios: 101.24% | | | | | | | | | | | | |
Wells Fargo Bloomberg Barclays US Aggregate ex-Corporate Portfolio | | | | | | | | | | | | | | $ | 1,531,954 | |
Wells Fargo Emerging Markets Bond Portfolio | | | | | | | | | | | | | | | 129,214 | |
Wells Fargo Factor Enhanced Emerging Markets Equity Portfolio | | | | | | | | | | | | | | | 2,083,154 | |
Wells Fargo Factor Enhanced International Equity Portfolio | | | | | | | | | | | | | | | 7,117,436 | |
Wells Fargo Factor Enhanced U.S. Large Cap Equity Portfolio | | | | | | | | | | | | | | | 11,026,075 | |
Wells Fargo Factor Enhanced U.S. Small Cap Equity Portfolio | | | | | | | | | | | | | | | 2,762,291 | |
Wells Fargo High Yield Corporate Bond Portfolio | | | | | | | | | | | | | | | 129,292 | |
Wells Fargo Investment Grade Corporate Bond Portfolio | | | | | | | | | | | | | | | 800,849 | |
| | | | |
Total Investment Companies (Cost $23,407,319) | | | | | | | | | | | | | | | 25,580,265 | |
| | | | | | | | | | | | | | | | |
| | | | | | | | |
| Total investments in securities (Cost $23,407,319) | | | 101.24 | % | | | 25,580,265 | |
| | |
Other assets and liabilities, net | | | (1.24 | ) | | | (313,736 | ) |
| | | | | | | | |
| Total net assets | | | 100.00 | % | | $ | 25,266,529 | |
| | | | | | | | |
Transactions with the affiliated Master Portfolios were as follows:
| | | | | | | | | | | | | | | | | | | | | | | | | | | | | | | | | | | | |
| | | % of
ownership,
beginning
of period | | | % of
ownership,
end of
period | | | Net realized
gains
(losses) on
securities
transactions
allocated
from
affiliated
Master
Portfolios | | | Net
change in
unrealized
gains
(losses) on
securities
transactions
allocated
from
affiliated
Master
Portfolios | | | Interest
allocated
from
affiliated
Master
Portfolios | | | Dividends
allocated
from
affiliated
Master
Portfolios | | | Affiliated
Income
allocated
from
affiliated
Master
Portfolios | | | Value,
end
of period | | | % of
net
assets | |
Affiliated Master Portfolios | | | | | | | | | | | | | | | | | | | | | | | | | | | | | | | | | | | | |
Wells Fargo Bloomberg Barclays US Aggregate ex-Corporate Portfolio | | | 0.22 | % | | | 0.26 | % | | $ | 23,199 | | | $ | 3,764 | | | $ | 12,162 | | | $ | 0 | | | $ | 35 | | | $ | 1,531,954 | | | | | |
Wells Fargo Emerging Markets Bond Portfolio | | | 0.28 | | | | 0.36 | | | | 272 | | | | (325 | ) | | | 2,879 | | | | 0 | | | | 1 | | | | 129,214 | | | | | |
Wells Fargo Factor Enhanced Emerging Markets Equity Portfolio | | | 0.88 | | | | 0.99 | | | | (150,243 | ) | | | 247,837 | | | | 14 | | | | 32,680 | | | | 67 | | | | 2,083,154 | | | | | |
Wells Fargo Factor Enhanced International Equity Portfolio | | | 1.09 | | | | 1.13 | | | | (160,031 | ) | | | 678,966 | | | | 0 | | | | 100,369 | | | | 272 | | | | 7,117,436 | | | | | |
Wells Fargo Factor Enhanced U.S. Large Cap Equity Portfolio | | | 1.00 | | | | 1.24 | | | | 458,045 | | | | 676,772 | | | | 40 | | | | 104,904 | | | | 447 | | | | 11,026,075 | | | | | |
Wells Fargo Factor Enhanced U.S. Small Cap Equity Portfolio | | | 1.05 | | | | 1.24 | | | | (214,361 | ) | | | 390,665 | | | | 16 | | | | 20,569 | | | | 135 | | | | 2,762,291 | | | | | |
Wells Fargo High Yield Corporate Bond Portfolio | | | 0.22 | | | | 0.07 | | | | (4,817 | ) | | | 4,716 | | | | 3,444 | | | | 0 | | | | 4 | | | | 129,292 | | | | | |
Wells Fargo Investment Grade Corporate Bond Portfolio | | | 0.28 | | | | 0.36 | | | | 5,202 | | | | 12,627 | | | | 11,994 | | | | 0 | | | | 5 | | | | 800,849 | | | | | |
| | | | | | | | | | | | | | | | | | | | | | | | | | | | | | | | | | | | |
| | | | | | | | | |
| | | | | | | | | | $ | (42,734 | ) | | $ | 2,015,022 | | | $ | 30,549 | | | $ | 258,522 | | | $ | 966 | | | $ | 25,580,265 | | | | 101.24 | % |
| | | | | | | | | | | | | | | | | | | | | | | | | | | | | | | | | | | | |
The accompanying notes are an integral part of these financial statements.
Wells Fargo Target Date Retirement Funds | 47
Statements of assets and liabilities—August 31, 2020 (unaudited)
| | | | | | | | |
| | | Target Today Fund | | | Target 2010 Fund | |
| | |
Assets | | | | | | | | |
Investments in affiliated Master Portfolios, at value (see cost below) | | $ | 62,095,233 | | | $ | 55,527,456 | |
Receivable for Fund shares sold | | | 6,798 | | | | 7,166 | |
Receivable from manager | | | 16,261 | | | | 16,455 | |
Prepaid expenses and other assets | | | 40,201 | | | | 56,242 | |
| | | | |
Total assets | | | 62,158,493 | | | | 55,607,319 | |
| | | | |
| | |
Liabilities | | | | | | | | |
Payable for Fund shares redeemed | | | 64,280 | | | | 40,173 | |
Administration fees payable | | | 7,736 | | | | 7,100 | |
Distribution fees payable | | | 327 | | | | 238 | |
Shareholder report expenses payable | | | 33,116 | | | | 22,789 | |
Custody and accounting fees payable | | | 33,639 | | | | 17,296 | |
Shareholder servicing fees payable | | | 9,243 | | | | 8,622 | |
Professional fees payable | | | 20,954 | | | | 18,752 | |
Trustees’ fees and expenses payable | | | 4,821 | | | | 4,813 | |
Accrued expenses and other liabilities | | | 12,845 | | | | 12,960 | |
| | | | |
Total liabilities | | | 186,961 | | | | 132,743 | |
| | | | |
Total net assets | | $ | 61,971,532 | | | $ | 55,474,576 | |
| | | | |
| | |
Net assets consist of | | | | | | | | |
Paid-in capital | | $ | 52,255,408 | | | $ | 33,306,392 | |
Total distributable earnings | | | 9,716,124 | | | | 22,168,184 | |
| | | | |
Total net assets | | $ | 61,971,532 | | | $ | 55,474,576 | |
| | | | |
| | |
Computation of net asset value and offering price per share | | | | | | | | |
Net assets – Class A | | $ | 35,476,175 | | | $ | 32,318,435 | |
Shares outstanding – Class A1 | | | 3,798,830 | | | | 2,958,319 | |
Net asset value per share – Class A | | | $9.34 | | | | $10.92 | |
Maximum offering price per share – Class A2 | | | $9.91 | | | | $11.59 | |
Net assets – Class C | | $ | 514,622 | | | $ | 393,122 | |
Shares outstanding – Class C1 | | | 53,527 | | | | 35,551 | |
Net asset value per share – Class C | | | $9.61 | | | | $11.06 | |
Net assets – Class R | | $ | 32,731 | | | $ | 24,074 | |
Shares outstanding – Class R1 | | | 3,493 | | | | 2,201 | |
Net asset value per share – Class R | | | $9.37 | | | | $10.94 | |
Net assets – Class R4 | | $ | 957,850 | | | $ | 855,192 | |
Share outstanding – Class R41 | | | 99,775 | | | | 77,178 | |
Net asset value per share – Class R4 | | | $9.60 | | | | $11.08 | |
Net assets – Class R6 | | $ | 17,904,277 | | | $ | 14,413,846 | |
Shares outstanding – Class R61 | | | 1,866,987 | | | | 1,303,194 | |
Net asset value per share – Class R6 | | | $9.59 | | | | $11.06 | |
Net assets – Administrator Class | | $ | 7,085,877 | | | $ | 7,469,907 | |
Shares outstanding – Administrator Class1 | | | 737,378 | | | | 673,796 | |
Net asset value per share – Administrator Class | | | $9.61 | | | | $11.09 | |
| | |
Investments in affiliated Master Portfolios, at cost | | $ | 53,128,539 | | | $ | 34,039,381 | |
| | | | |
| 1 | Each Fund has an unlimited number of authorized shares. |
| 2 | Maximum offering price is computed as 100/94.25 of net asset value. On investment of $50,000 or more, the offering price is reduced. |
The accompanying notes are an integral part of these financial statements.
48 | Wells Fargo Target Date Retirement Funds
Statements of assets and liabilities—August 31, 2020 (unaudited)
| | | | | | | | | | | | | | | | | | | | | | | | | | |
Target 2015 Fund | | | Target 2020 Fund | | | Target 2025 Fund | | | Target 2030 Fund | | | Target 2035 Fund | | | Target 2040 Fund | | | Target 2045 Fund | |
| | | | | | |
| | | | | | | | | | | | | | | | | | | | | | | | | | |
| $ | 57,697,010 | | | $ | 326,085,546 | | | $ | 195,831,359 | | | $ | 483,348,887 | | | $ | 190,048,064 | | | $ | 448,405,188 | | | $ | 90,993,774 | |
| | 7,280 | | | | 55,946 | | | | 113,640 | | | | 171,178 | | | | 89,008 | | | | 224,348 | | | | 62,720 | |
| | 15,500 | | | | 15,076 | | | | 16,449 | | | | 19,546 | | | | 17,279 | | | | 22,688 | | | | 18,431 | |
| | 1,904 | | | | 2,573 | | | | 98,975 | | | | 25,640 | | | | 0 | | | | 46,061 | | | | 0 | |
| | |
| | 57,721,694 | | | | 326,159,141 | | | | 196,060,423 | | | | 483,565,251 | | | | 190,154,351 | | | | 448,698,285 | | | | 91,074,925 | |
| | |
| | | | | | |
| | | | | | | | | | | | | | | | | | | | | | | | | | |
| | 8,727 | | | | 2,358,262 | | | | 203,497 | | | | 1,715,846 | | | | 30,081 | | | | 2,309,002 | | | | 62,483 | |
| | 6,951 | | | | 32,976 | | | | 19,952 | | | | 44,758 | | | | 20,363 | | | | 44,183 | | | | 9,101 | |
| | 1 | | | | 1,702 | | | | 12 | | | | 1,101 | | | | 76 | | | | 1,099 | | | | 8 | |
| | 46,769 | | | | 110,161 | | | | 103,564 | | | | 143,772 | | | | 102,477 | | | | 107,897 | | | | 44,142 | |
| | 24,978 | | | | 112,758 | | | | 68,079 | | | | 118,846 | | | | 51,719 | | | | 98,010 | | | | 36,045 | |
| | 8,170 | | | | 39,441 | | | | 22,118 | | | | 52,999 | | | | 22,422 | | | | 51,941 | | | | 9,950 | |
| | 23,414 | | | | 24,652 | | | | 13,236 | | | | 24,791 | | | | 22,392 | | | | 21,927 | | | | 22,670 | |
| | 4,822 | | | | 4,926 | | | | 4,926 | | | | 4,911 | | | | 4,920 | | | | 4,998 | | | | 5,168 | |
| | 12,408 | | | | 27,016 | | | | 33,981 | | | | 29,732 | | | | 29,240 | | | | 22,698 | | | | 15,174 | |
| | |
| | 136,240 | | | | 2,711,894 | | | | 469,365 | | | | 2,136,756 | | | | 283,690 | | | | 2,661,755 | | | | 204,741 | |
| | |
| $ | 57,585,454 | | | $ | 323,447,247 | | | $ | 195,591,058 | | | $ | 481,428,495 | | | $ | 189,870,661 | | | $ | 446,036,530 | | | $ | 90,870,184 | |
| | |
| | | | | | |
| | | | | | | | | | | | | | | | | | | | | | | | | | |
| $ | 43,192,522 | | | $ | 261,851,259 | | | $ | 161,636,777 | | | $ | 403,663,408 | | | $ | 160,728,120 | | | $ | 381,940,453 | | | $ | 77,770,005 | |
| | 14,392,932 | | | | 61,595,988 | | | | 33,954,281 | | | | 77,765,087 | | | | 29,142,541 | | | | 64,096,077 | | | | 13,100,179 | |
| | |
| $ | 57,585,454 | | | $ | 323,447,247 | | | $ | 195,591,058 | | | $ | 481,428,495 | | | $ | 189,870,661 | | | $ | 446,036,530 | | | $ | 90,870,184 | |
| | |
| | | | | | |
| | | | | | | | | | | | | | | | | | | | | | | | | | |
| $ | 32,211,575 | | | $ | 125,632,502 | | | $ | 88,599,841 | | | $ | 160,075,536 | | | $ | 95,394,496 | | | $ | 174,295,226 | | | $ | 40,943,595 | |
| | 4,327,055 | | | | 9,985,598 | | | | 15,027,565 | | | | 12,369,783 | | | | 12,054,350 | | | | 11,553,575 | | | | 4,703,317 | |
| | $7.44 | | | | $12.58 | | | | $5.90 | | | | $12.94 | | | | $7.91 | | | | $15.09 | | | | $8.71 | |
| | $7.90 | | | | $13.35 | | | | $6.26 | | | | $13.73 | | | | $8.39 | | | | $16.01 | | | | $9.24 | |
| | N/A | | | $ | 2,660,167 | | | | N/A | | | $ | 1,753,449 | | | | N/A | | | $ | 1,745,540 | | | | N/A | |
| | N/A | | | | 216,426 | | | | N/A | | | | 142,328 | | | | N/A | | | | 129,561 | | | | N/A | |
| | N/A | | | | $12.29 | | | | N/A | | | | $12.32 | | | | N/A | | | | $13.47 | | | | N/A | |
| $ | 20,919 | | | $ | 123,948 | | | $ | 69,241 | | | $ | 50,466 | | | $ | 379,364 | | | $ | 73,849 | | | $ | 59,060 | |
| | 2,716 | | | | 9,936 | | | | 11,859 | | | | 3,875 | | | | 47,569 | | | | 4,882 | | | | 6,629 | |
| | $7.70 | | | | $12.47 | | | | $5.84 | | | | $13.02 | | | | $7.98 | | | | $15.13 | | | | $8.91 | |
| $ | 2,449,864 | | | $ | 16,234,060 | | | $ | 12,341,001 | | | $ | 27,633,277 | | | $ | 7,962,564 | | | $ | 22,850,618 | | | $ | 4,284,543 | |
| | 326,321 | | | | 1,249,287 | | | | 2,071,085 | | | | 2,079,987 | | | | 1,001,088 | | | | 1,457,626 | | | | 488,122 | |
| | $7.51 | | | | $12.99 | | | | $5.96 | | | | $13.29 | | | | $7.95 | | | | $15.68 | | | | $8.78 | |
| $ | 17,738,478 | | | $ | 130,779,292 | | | $ | 83,982,790 | | | $ | 216,957,356 | | | $ | 79,367,404 | | | $ | 188,236,127 | | | $ | 41,425,989 | |
| | 2,360,966 | | | | 10,062,554 | | | | 14,125,338 | | | | 16,350,418 | | | | 9,989,236 | | | | 12,013,131 | | | | 4,739,688 | |
| | $7.51 | | | | $13.00 | | | | $5.95 | | | | $13.27 | | | | $7.95 | | | | $15.67 | | | | $8.74 | |
| $ | 5,164,618 | | | $ | 48,017,275 | | | $ | 10,598,185 | | | $ | 74,958,411 | | | $ | 6,766,833 | | | $ | 58,835,170 | | | $ | 4,156,997 | |
| | 673,759 | | | | 3,725,051 | | | | 1,766,802 | | | | 5,647,096 | | | | 844,106 | | | | 3,765,934 | | | | 469,055 | |
| | $7.67 | | | | $12.89 | | | | $6.00 | | | | $13.27 | | | | $8.02 | | | | $15.62 | | | | $8.86 | |
| | | | | | |
| $ | 46,761,063 | | | $ | 271,372,766 | | | $ | 165,631,642 | | | $ | 416,582,629 | | | $ | 165,139,486 | | | $ | 393,598,019 | | | $ | 79,482,766 | |
| | |
The accompanying notes are an integral part of these financial statements.
Wells Fargo Target Date Retirement Funds | 49
Statements of assets and liabilities—August 31, 2020 (unaudited)
| | | | | | | | | | | | |
| | | Target 2050 Fund | | | Target 2055 Fund | | | Target 2060 Fund | |
| | | |
Assets | | | | | | | | | | | | |
Investments in affiliated Master Portfolios, at value (see cost below) | | $ | 207,915,749 | | | $ | 27,823,502 | | | $ | 25,580,265 | |
Receivable for Fund shares sold | | | 143,478 | | | | 71,842 | | | | 32,418 | |
Receivable from manager | | | 20,977 | | | | 17,343 | | | | 17,274 | |
Prepaid expenses and other assets | | | 21,304 | | | | 30 | | | | 708 | |
| | | | |
Total assets | | | 208,101,508 | | | | 27,912,717 | | | | 25,630,665 | |
| | | | |
| | | |
Liabilities | | | | | | | | | | | | |
Payable for Fund shares redeemed | | | 598,481 | | | | 6,429 | | | | 180,876 | |
Administration fees payable | | | 15,786 | | | | 1,899 | | | | 1,174 | |
Distribution fees payable | | | 312 | | | | 5 | | | | 98 | |
Shareholder report expenses payable | | | 69,188 | | | | 103,825 | | | | 116,282 | |
Custody and accounting fees payable | | | 51,610 | | | | 20,325 | | | | 3,881 | |
Shareholder servicing fees payable | | | 18,414 | | | | 1,808 | | | | 1,090 | |
Professional fees payable | | | 26,249 | | | | 29,219 | | | | 38,736 | |
Trustees’ fees and expenses payable | | | 4,423 | | | | 3,494 | | | | 3,907 | |
Accrued expenses and other liabilities | | | 9,134 | | | | 38,320 | | | | 18,092 | |
| | | | |
Total liabilities | | | 793,597 | | | | 205,324 | | | | 364,136 | |
| | | | |
Total net assets | | $ | 207,307,911 | | | $ | 27,707,393 | | | $ | 25,266,529 | |
| | | | |
| | | |
Net assets consist of | | | | | | | | | | | | |
Paid-in capital | | $ | 176,318,585 | | | $ | 26,697,927 | | | $ | 22,828,303 | |
Total distributable earnings | | | 30,989,326 | | | | 1,009,466 | | | | 2,438,226 | |
| | | | |
Total net assets | | $ | 207,307,911 | | | $ | 27,707,393 | | | $ | 25,266,529 | |
| | | | |
| | | |
Computation of net asset value and offering price per share | | | | | | | | | | | | |
Net assets – Class A | | $ | 45,145,976 | | | $ | 6,875,151 | | | $ | 1,052,550 | |
Shares outstanding – Class A1 | | | 6,016,948 | | | | 551,796 | | | | 85,113 | |
Net asset value per share – Class A | | | $7.50 | | | | $12.46 | | | | $12.37 | |
Maximum offering price per share – Class A2 | | | $7.96 | | | | $13.22 | | | | $13.12 | |
Net assets – Class C | | $ | 521,596 | | | | N/A | | | $ | 156,710 | |
Shares outstanding – Class C1 | | | 70,107 | | | | N/A | | | | 12,626 | |
Net asset value per share – Class C | | | $7.44 | | | | N/A | | | | $12.41 | |
Net assets – Class R | | $ | 48,061 | | | $ | 45,798 | | | $ | 84,435 | |
Shares outstanding – Class R1 | | | 6,343 | | | | 3,718 | | | | 6,902 | |
Net asset value per share – Class R | | | $7.58 | | | | $12.32 | | | | $12.23 | |
Net assets – Class R4 | | $ | 11,680,767 | | | $ | 1,954,155 | | | $ | 2,158,490 | |
Share outstanding – Class R41 | | | 1,542,210 | | | | 156,055 | | | | 170,853 | |
Net asset value per share – Class R4 | | | $7.57 | | | | $12.52 | | | | $12.63 | |
Net assets – Class R6 | | $ | 113,404,154 | | | $ | 17,915,255 | | | $ | 18,953,739 | |
Shares outstanding – Class R61 | | | 14,989,067 | | | | 1,433,061 | | | | 1,505,237 | |
Net asset value per share – Class R6 | | | $7.57 | | | | $12.50 | | | | $12.59 | |
Net assets – Administrator Class | | $ | 36,507,357 | | | $ | 917,034 | | | $ | 2,860,605 | |
Shares outstanding – Administrator Class1 | | | 4,844,160 | | | | 73,014 | | | | 230,230 | |
Net asset value per share – Administrator Class | | | $7.54 | | | | $12.56 | | | | $12.42 | |
| | | |
Investments in affiliated Master Portfolios, at cost | | $ | 180,896,340 | | | $ | 26,558,109 | | | $ | 23,407,319 | |
| | | | |
| 1 | Each Fund has an unlimited number of authorized shares. |
| 2 | Maximum offering price is computed as 100/94.25 of net asset value. On investment of $50,000 or more, the offering price is reduced. |
The accompanying notes are an integral part of these financial statements.
50 | Wells Fargo Target Date Retirement Funds
This page is intentionally left blank.
Statements of operations—six months ended August 31, 2020 (unaudited)
| | | | | | | | |
| | | Target
Today Fund | | | Target
2010 Fund | |
| | |
Investment income | | | | | | | | |
Interest allocated from affiliated Master Portfolios* | | $ | 526,672 | | | $ | 465,004 | |
Dividends allocated from affiliated Master Portfolios** | | | 239,783 | | | | 220,602 | |
Affiliated income allocated from affiliated Master Portfolios | | | 1,592 | | | | 1,428 | |
Expenses allocated from affiliated Master Portfolios | | | (50,645 | ) | | | (45,283 | ) |
Waivers allocated from affiliated Master Portfolios | | | 20,316 | | | | 18,064 | |
| | | | |
Total investment income | | | 737,718 | | | | 659,815 | |
| | | | |
| | |
Expenses | | | | | | | | |
Management fee | | | 30,598 | | | | 27,233 | |
Administration fees | |
Class A | | | 36,499 | | | | 33,166 | |
Class C | | | 540 | | | | 414 | |
Class R | | | 32 | | | | 24 | |
Class R4 | | | 814 | | | | 385 | |
Class R6 | | | 2,550 | | | | 2,076 | |
Administrator Class | | | 4,455 | | | | 4,981 | |
Shareholder servicing fees | |
Class A | | | 43,386 | | | | 39,459 | |
Class C | | | 636 | | | | 490 | |
Class R | | | 39 | | | | 28 | |
Class R4 | | | 1,016 | | | | 481 | |
Administrator Class | | | 8,540 | | | | 9,553 | |
Distribution fees | |
Class C | | | 1,910 | | | | 1,433 | |
Class R | | | 11 | | | | 1 | |
Custody and accounting fees | | | 2,452 | | | | 2,864 | |
Professional fees | | | 19,888 | | | | 19,888 | |
Registration fees | | | 43,470 | | | | 43,325 | |
Shareholder report expenses | | | 20,875 | | | | 21,014 | |
Trustees’ fees and expenses | | | 11,053 | | | | 11,053 | |
Other fees and expenses | | | 7,736 | | | | 7,551 | |
| | | | |
Total expenses | | | 236,500 | | | | 225,419 | |
Less: Fee waivers and/or expense reimbursements | |
Fund-level | | | (56,453 | ) | | | (50,974 | ) |
Class A | | | (49,954 | ) | | | (52,545 | ) |
Class C | | | (710 | ) | | | (601 | ) |
Class R | | | (10 | ) | | | (4 | ) |
Class R4 | | | (1,830 | ) | | | (866 | ) |
Class R6 | | | (2,550 | ) | | | (2,076 | ) |
Administrator Class | | | (10,880 | ) | | | (13,760 | ) |
| | | | |
Net expenses | | | 114,113 | | | | 104,593 | |
| | | | |
Net investment income | | | 623,605 | | | | 555,222 | |
| | | | |
Payment from affiliate | | | 232 | | | | 230 | |
| | | | |
| | |
Realized and unrealized gains (losses) on investments | | | | | | | | |
Net realized gains (losses) on securities transactions allocated from affiliated Master Portfolios | | | 261,764 | | | | 230,043 | |
Net change in unrealized gains (losses) on securities transactions allocated from affiliated Master Portfolios | | | 1,568,882 | | | | 1,607,574 | |
| | | | |
Net realized and unrealized gains (losses) on investments | | | 1,830,646 | | | | 1,837,617 | |
| | | | |
Net increase in net assets resulting from operations | | $ | 2,454,483 | | | $ | 2,393,069 | |
| | | | |
| | |
* Net of foreign interest withholding taxes allocated from affiliated Master Portfolios in the amount of | | | $ 12,539 | | | | $ 11,622 | |
**Net of foreign dividends withholding taxes allocated from affiliated Master Portfolios in the amount of | | | $ 72 | | | | $ 64 | |
The accompanying notes are an integral part of these financial statements.
52 | Wells Fargo Target Date Retirement Funds
Statements of operations—six months ended August 31, 2020 (unaudited)
| | | | | | | | | | | | | | | | | | | | | | | | | | |
Target
2015 Fund | | | Target
2020 Fund | | | Target
2025 Fund | | | Target
2030 Fund | | | Target
2035 Fund | | | Target
2040 Fund | | | Target
2045 Fund | |
| | | | | | |
| | | | | | | | | | | | | | | | | | | | | | | | | | |
| $ | 455,817 | | | $ | 2,355,840 | | | $ | 1,234,813 | | | $ | 2,371,943 | | | $ | 698,183 | | | $ | 1,084,510 | | | $ | 168,950 | |
| | 273,942 | | | | 1,791,658 | | | | 1,360,022 | | | | 3,756,373 | | | | 1,719,203 | | | | 4,423,113 | | | | 997,742 | |
| | 1,605 | | | | 9,507 | | | | 6,814 | | | | 17,658 | | | | 7,081 | | | | 16,705 | | | | 3,780 | |
| | (48,890 | ) | | | (279,625 | ) | | | (172,994 | ) | | | (409,335 | ) | | | (166,088 | ) | | | (397,254 | ) | | | (86,117 | ) |
| | 19,074 | | | | 105,470 | | | | 59,060 | | | | 126,694 | | | | 48,199 | | | | 115,317 | | | | 24,804 | |
| | |
| | 701,548 | | | | 3,982,850 | | | | 2,487,715 | | | | 5,863,333 | | | | 2,306,578 | | | | 5,242,391 | | | | 1,109,159 | |
| | |
| | | | | | |
| | | | | | | | | | | | | | | | | | | | | | | | | | |
| | 28,907 | | | | 163,392 | | | | 100,528 | | | | 237,099 | | | | 93,518 | | | | 213,936 | | | | 45,168 | |
| | | | | | | | | | | | | | | | | | | | | | | | | | |
| | 33,141 | | | | 129,584 | | | | 91,384 | | | | 161,717 | | | | 95,000 | | | | 172,226 | | | | 41,316 | |
| | N/A | | | | 2,778 | | | | N/A | | | | 1,872 | | | | N/A | | | | 1,749 | | | | N/A | |
| | 21 | | | | 120 | | | | 63 | | | | 47 | | | | 348 | | | | 69 | | | | 53 | |
| | 1,543 | | | | 8,830 | | | | 9,268 | | | | 14,627 | | | | 6,115 | | | | 11,993 | | | | 3,417 | |
| | 2,580 | | | | 19,237 | | | | 12,140 | | | | 31,160 | | | | 11,140 | | | | 26,123 | | | | 5,724 | |
| | 3,366 | | | | 32,687 | | | | 6,407 | | | | 48,136 | | | | 4,338 | | | | 37,688 | | | | 2,751 | |
| | | | | | | | | | | | | | | | | | | | | | | | | | |
| | 39,429 | | | | 154,035 | | | | 108,664 | | | | 192,345 | | | | 112,862 | | | | 204,741 | | | | 49,042 | |
| | N/A | | | | 3,301 | | | | N/A | | | | 2,223 | | | | N/A | | | | 2,078 | | | | N/A | |
| | 25 | | | | 143 | | | | 75 | | | | 56 | | | | 414 | | | | 82 | | | | 63 | |
| | 1,923 | | | | 11,022 | | | | 11,550 | | | | 18,274 | | | | 7,625 | | | | 14,964 | | | | 4,230 | |
| | 6,471 | | | | 62,755 | | | | 12,278 | | | | 92,402 | | | | 8,322 | | | | 72,321 | | | | 5,277 | |
| | | | | | | | | | | | | | | | | | | | | | | | | | |
| | N/A | | | | 9,904 | | | | N/A | | | | 6,666 | | | | N/A | | | | 6,233 | | | | N/A | |
| | 1 | | | | 116 | | | | 56 | | | | 29 | | | | 390 | | | | 53 | | | | 35 | |
| | 3,285 | | | | 14,951 | | | | 8,310 | | | | 17,205 | | | | 7,723 | | | | 14,898 | | | | 5,133 | |
| | 19,888 | | | | 19,888 | | | | 19,888 | | | | 19,887 | | | | 19,887 | | | | 19,887 | | | | 19,887 | |
| | 36,953 | | | | 45,604 | | | | 39,423 | | | | 46,387 | | | | 39,715 | | | | 45,439 | | | | 40,016 | |
| | 20,767 | | | | 25,230 | | | | 24,257 | | | | 26,630 | | | | 23,980 | | | | 28,259 | | | | 23,481 | |
| | 11,053 | | | | 11,053 | | | | 11,053 | | | | 11,053 | | | | 11,053 | | | | 11,053 | | | | 11,053 | |
| | 7,560 | | | | 14,496 | | | | 10,895 | | | | 15,320 | | | | 10,279 | | | | 13,960 | | | | 8,608 | |
| | |
| | 216,913 | | | | 729,126 | | | | 466,239 | | | | 943,135 | | | | 452,709 | | | | 897,752 | | | | 265,254 | |
| | | | | | | | | | | | | | | | | | | | | | | | | | |
| | (56,549 | ) | | | (182,931 | ) | | | (128,735 | ) | | | (82,331 | ) | | | (127,054 | ) | | | (193,305 | ) | | | (89,679 | ) |
| | (45,934 | ) | | | (18,616 | ) | | | (30,434 | ) | | | (117,713 | ) | | | (40,710 | ) | | | (66,104 | ) | | | (42,989 | ) |
| | N/A | | | | 0 | | | | N/A | | | | (1,334 | ) | | | N/A | | | | (650 | ) | | | N/A | |
| | 0 | | | | (379 | ) | | | 0 | | | | (4 | ) | | | (120 | ) | | | 0 | | | | (22 | ) |
| | (3,466 | ) | | | (6,256 | ) | | | (11,003 | ) | | | (32,901 | ) | | | (8,817 | ) | | | (16,385 | ) | | | (7,647 | ) |
| | (2,580 | ) | | | (19,237 | ) | | | (12,140 | ) | | | (31,160 | ) | | | (11,140 | ) | | | (26,123 | ) | | | (5,724 | ) |
| | (8,309 | ) | | | (15,086 | ) | | | (4,899 | ) | | | (67,577 | ) | | | (3,985 | ) | | | (31,978 | ) | | | (5,261 | ) |
| | |
| | 100,075 | | | | 486,621 | | | | 279,028 | | | | 610,115 | | | | 260,883 | | | | 563,207 | | | | 113,932 | |
| | |
| | 601,473 | | | | 3,496,229 | | | | 2,208,687 | | | | 5,253,218 | | | | 2,045,695 | | | | 4,679,184 | | | | 995,227 | |
| | |
| | 235 | | | | 1,288 | | | | 944 | | | | 3,159 | | | | 0 | | | | 2,629 | | | | 1,213 | |
| | |
| | | | | | |
| | | | | | | | | | | | | | | | | | | | | | | | | | |
| | 167,889 | | | | 678,232 | | | | 31,004 | | | | 114,910 | | | | (353,678 | ) | | | (1,135,301 | ) | | | (498,303 | ) |
| | 1,738,143 | | | | 10,601,745 | | | | 6,428,606 | | | | 23,620,323 | | | | 9,773,498 | | | | 27,448,454 | | | | 5,357,057 | |
| | |
| | 1,906,032 | | | | 11,279,977 | | | | 6,459,610 | | | | 23,735,233 | | | | 9,419,820 | | | | 26,313,153 | | | | 4,858,754 | |
| | |
| $ | 2,507,740 | | | $ | 14,777,494 | | | $ | 8,669,241 | | | $ | 28,991,610 | | | $ | 11,465,515 | | | $ | 30,994,966 | | | $ | 5,855,194 | |
| | |
| | | | | | |
| | $ 14,613 | | | | $ 97,788 | | | | $ 80,233 | | | | $ 235,416 | | | | $ 111,800 | | | | $ 291,462 | | | | $ 66,520 | |
| | $ 62 | | | | $ 317 | | | | $ 162 | | | | $ 337 | | | | $ 99 | | | | $ 159 | | | | $ 24 | |
The accompanying notes are an integral part of these financial statements.
Wells Fargo Target Date Retirement Funds | 53
Statements of operations—six months ended August 31, 2020 (unaudited)
| | | | | | | | | | | | |
| | | Target
2050 Fund | | | Target
2055 Fund | | | Target
2060 Fund | |
| | | |
Investment income | | | | | | | | | | | | |
Interest allocated from affiliated Master Portfolios* | | $ | 259,708 | | | $ | 37,367 | | | $ | 30,549 | |
Dividends allocated from affiliated Master Portfolios** | | | 2,227,736 | | | | 322,195 | | | | 258,522 | |
Affiliated income allocated from affiliated Master Portfolios | | | 8,727 | | | | 1,334 | | | | 966 | |
Expenses allocated from affiliated Master Portfolios | | | (188,375 | ) | | | (27,039 | ) | | | (22,015 | ) |
Waivers allocated from affiliated Master Portfolios | | | 54,641 | | | | 7,759 | | | | 6,423 | |
| | | | |
Total investment income | | | 2,362,437 | | | | 341,616 | | | | 274,445 | |
| | | | |
| | | |
Expenses | | | | | | | | | | | | |
Management fee | | | 96,915 | | | | 13,814 | | | | 11,245 | |
Administration fees | | | | | | | | | | | | |
Class A | | | 44,369 | | | | 6,675 | | | | 979 | |
Class C | | | 502 | | | | N/A | | | | 146 | |
Class R | | | 41 | | | | 43 | | | | 73 | |
Class R4 | | | 5,461 | | | | 1,621 | | | | 923 | |
Class R6 | | | 15,264 | | | | 2,459 | | | | 2,414 | |
Administrator Class | | | 23,168 | | | | 508 | | | | 1,915 | |
Shareholder servicing fees | | | | | | | | | | | | |
Class A | | | 52,761 | | | | 7,927 | | | | 1,166 | |
Class C | | | 568 | | | | N/A | | | | 172 | |
Class R | | | 43 | | | | 51 | | | | 87 | |
Class R4 | | | 6,816 | | | | 2,017 | | | | 1,150 | |
Administrator Class | | | 44,510 | | | | 974 | | | | 3,680 | |
Distribution fees | | | | | | | | | | | | |
Class C | | | 1,686 | | | | N/A | | | | 457 | |
Class R | | | 24 | | | | 17 | | | | 58 | |
Custody and accounting fees | | | 8,237 | | | | 1,852 | | | | 820 | |
Professional fees | | | 19,887 | | | | 19,887 | | | | 19,887 | |
Registration fees | | | 45,657 | | | | 38,221 | | | | 42,756 | |
Shareholder report expenses | | | 24,107 | | | | 23,049 | | | | 18,840 | |
Trustees’ fees and expenses | | | 11,053 | | | | 11,053 | | | | 11,053 | |
Other fees and expenses | | | 10,454 | | | | 6,866 | | | | 6,607 | |
| | | | |
Total expenses | | | 411,523 | | | | 137,034 | | | | 124,428 | |
Less: Fee waivers and/or expense reimbursements | | | | | | | | | | | | |
Fund-level | | | (150,354 | ) | | | (93,173 | ) | | | (99,789 | ) |
Class A | | | (22,329 | ) | | | (14,602 | ) | | | (2,145 | ) |
Class C | | | (113 | ) | | | N/A | | | | (318 | ) |
Class R | | | 0 | | | | (94 | ) | | | (161 | ) |
Class R4 | | | (9,246 | ) | | | (3,638 | ) | | | (2,072 | ) |
Class R6 | | | (15,264 | ) | | | (2,459 | ) | | | (2,414 | ) |
Administrator Class | | | (24,168 | ) | | | (1,481 | ) | | | (5,595 | ) |
| | | | |
Net expenses | | | 190,049 | | | | 21,587 | | | | 11,934 | |
| | | | |
Net investment income | | | 2,172,388 | | | | 320,029 | | | | 262,511 | |
| | | | |
Payment from affiliate | | | 1,129 | | | | 293 | | | | 2,213 | |
| | | | |
| | | |
Realized and unrealized gains (losses) on investments | | | | | | | | | | | | |
Net realized gains (losses) on securities transactions allocated from affiliated Master Portfolios | | | (828,693 | ) | | | (218,157 | ) | | | (42,734 | ) |
Net change in unrealized gains (losses) on securities transactions allocated from affiliated Master Portfolios | | | 13,865,591 | | | | 1,604,729 | | | | 2,015,022 | |
| | | | |
Net realized and unrealized gains (losses) on investments | | | 13,036,898 | | | | 1,386,572 | | | | 1,972,288 | |
| | | | |
Net increase in net assets resulting from operations | | $ | 15,210,415 | | | $ | 1,706,894 | | | $ | 2,237,012 | |
| | | | |
| | | |
* Net of foreign interest withholding taxes allocated from affiliated Master Portfolios in the amount of | | | $ 148,392 | | | | $ 21,678 | | | | $ 17,074 | |
**Net of foreign dividends withholding taxes allocated from affiliated Master Portfolios in the amount of | | | $ 37 | | | | $ 6 | | | | $ 5 | |
The accompanying notes are an integral part of these financial statements.
54 | Wells Fargo Target Date Retirement Funds
Statements of changes in net assets
| | | | | | | | | | | | | | | | |
| | | Target Today Fund | |
| | | Six months ended
August 31, 2020 (unaudited) | | | Year ended
February 29, 2020 | |
| |
Operations | | | | | |
Net investment income | | | | | | $ | 623,605 | | | | | | | $ | 1,575,244 | |
Payment from affiliate | | | | | | | 232 | | | | | | | | 0 | |
Net realized gains on investments | | | | | | | 261,764 | | | | | | | | 1,296,199 | |
Net change in unrealized gains (losses) on investments | | | | | | | 1,568,882 | | | | | | | | 2,338,654 | |
| | | | |
Net increase in net assets resulting from operations | | | | | | | 2,454,483 | | | | | | | | 5,210,097 | |
| | | | |
| | | | |
Distributions to shareholders from net investment income and net realized gains | | | | | | | | | | | | | | | | |
Class A | | | | | | | (283,552 | ) | | | | | | | (1,169,652 | ) |
Class C | | | | | | | (2,242 | ) | | | | | | | (14,676 | ) |
Class R | | | | | | | (209 | ) | | | | | | | (830 | ) |
Class R4 | | | | | | | (20,966 | ) | | | | | | | (87,043 | ) |
Class R6 | | | | | | | (169,874 | ) | | | | | | | (609,311 | ) |
Administrator Class | | | | | | | (58,318 | ) | | | | | | | (276,829 | ) |
| | | | |
Total distributions to shareholders | | | | | | | (535,161 | ) | | | | | | | (2,158,341 | ) |
| | | | |
| | | | |
Capital share transactions | | | Shares | | | | | | | | Shares | | | | | |
Proceeds from shares sold | |
Class A | | | 54,772 | | | | 493,644 | | | | 149,359 | | | | 1,345,551 | |
Class C | | | 1,712 | | | | 14,811 | | | | 2,571 | | | | 24,041 | |
Class R | | | 183 | | | | 1,627 | | | | 200 | | | | 1,806 | |
Class R4 | | | 13,942 | | | | 128,890 | | | | 40,010 | | | | 368,117 | |
Class R6 | | | 450,051 | | | | 4,112,502 | | | | 399,954 | | | | 3,688,490 | |
Administrator Class | | | 82,720 | | | | 758,679 | | | | 209,192 | | | | 1,938,421 | |
| | | | |
| | | | | | | 5,510,153 | | | | | | | | 7,366,426 | |
| | | | |
Reinvestment of distributions | |
Class A | | | 32,480 | | | | 281,416 | | | | 129,020 | | | | 1,161,402 | |
Class C | | | 244 | | | | 2,184 | | | | 1,560 | | | | 14,465 | |
Class R | | | 6 | | | | 52 | | | | 21 | | | | 191 | |
Class R4 | | | 2,359 | | | | 20,966 | | | | 9,416 | | | | 87,032 | |
Class R6 | | | 19,119 | | | | 169,874 | | | | 66,048 | | | | 609,311 | |
Administrator Class | | | 6,542 | | | | 58,318 | | | | 29,930 | | | | 276,829 | |
| | | | |
| | | | | | | 532,810 | | | | | | | | 2,149,230 | |
| | | | |
Payment for shares redeemed | |
Class A | | | (368,868 | ) | | | (3,253,645 | ) | | | (571,838 | ) | | | (5,149,559 | ) |
Class C | | | (5,257 | ) | | | (49,063 | ) | | | (51,100 | ) | | | (475,980 | ) |
Class R | | | (99 | ) | | | (899 | ) | | | (32 | ) | | | (291 | ) |
Class R4 | | | (178,704 | ) | | | (1,680,952 | ) | | | (104,841 | ) | | | (966,970 | ) |
Class R6 | | | (463,104 | ) | | | (4,196,453 | ) | | | (521,023 | ) | | | (4,824,708 | ) |
Administrator Class | | | (107,928 | ) | | | (976,454 | ) | | | (561,652 | ) | | | (5,233,763 | ) |
| | | | |
| | | | | | | (10,157,466 | ) | | | | | | | (16,651,271 | ) |
| | | | |
Net decrease in net assets resulting from capital share transactions | | | | | | | (4,114,503 | ) | | | | | | | (7,135,615 | ) |
| | | | |
Total decrease in net assets | | | | | | | (2,195,181 | ) | | | | | | | (4,083,859 | ) |
| | | | |
| | |
Net assets | | | | | | | | |
Beginning of period | | | | | | | 64,166,713 | | | | | | | | 68,250,572 | |
| | | | |
End of period | | | | | | $ | 61,971,532 | | | | | | | $ | 64,166,713 | |
| | | | |
The accompanying notes are an integral part of these financial statements.
Wells Fargo Target Date Retirement Funds | 55
Statements of changes in net assets
| | | | | | | | | | | | | | | | |
| | | Target 2010 Fund | |
| | | Six months ended
August 31, 2020
(unaudited) | | | Year ended
February 29, 2020 | |
| |
Operations | | | | | |
Net investment income | | | | | | $ | 555,222 | | | | | | | $ | 1,455,582 | |
Payment from affiliate | | | | | | | 230 | | | | | | | | 0 | |
Net realized gains on investments | | | | | | | 230,043 | | | | | | | | 1,269,677 | |
Net change in unrealized gains (losses) on investments | | | | | | | 1,607,574 | | | | | | | | 2,145,231 | |
| | | | |
Net increase in net assets resulting from operations | | | | | | | 2,393,069 | | | | | | | | 4,870,490 | |
| | | | |
| | | | |
Distributions to shareholders from net investment income and net realized gains | | | | | | | | | | | | | | | | |
Class A | | | | | | | (259,036 | ) | | | | | | | (1,123,354 | ) |
Class C | | | | | | | (1,471 | ) | | | | | | | (14,364 | ) |
Class R | | | | | | | (155 | ) | | | | | | | (679 | ) |
Class R4 | | | | | | | (9,165 | ) | | | | | | | (49,133 | ) |
Class R6 | | | | | | | (141,107 | ) | | | | | | | (566,122 | ) |
Administrator Class | | | | | | | (66,206 | ) | | | | | | | (336,532 | ) |
| | | | |
Total distributions to shareholders | | | | | | | (477,140 | ) | | | | | | | (2,090,184 | ) |
| | | | |
| | | | |
Capital share transactions | | | Shares | | | | | | | | Shares | | | | | |
Proceeds from shares sold | |
Class A | | | 14,226 | | | | 147,961 | | | | 119,861 | | | | 1,269,307 | |
Class C | | | 0 | | | | 0 | | | | 1,188 | | | | 12,639 | |
Class R4 | | | 7,956 | | | | 84,072 | | | | 32,005 | | | | 346,187 | |
Class R6 | | | 286,354 | | | | 2,913,517 | | | | 342,017 | | | | 3,639,221 | |
Administrator Class | | | 56,758 | | | | 601,675 | | | | 161,826 | | | | 1,741,823 | |
| | | | |
| | | | | | | 3,747,225 | | | | | | | | 7,009,177 | |
| | | | |
Reinvestment of distributions | |
Class A | | | 25,417 | | | | 257,530 | | | | 106,000 | | | | 1,116,451 | |
Class C | | | 141 | | | | 1,471 | | | | 1,345 | | | | 14,364 | |
Class R4 | | | 898 | | | | 9,165 | | | | 4,613 | | | | 49,133 | |
Class R6 | | | 13,763 | | | | 141,023 | | | | 53,171 | | | | 565,811 | |
Administrator Class | | | 6,449 | | | | 66,206 | | | | 31,544 | | | | 336,532 | |
| | | | |
| | | | | | | 475,395 | | | | | | | | 2,082,291 | |
| | | | |
Payment for shares redeemed | |
Class A | | | (256,931 | ) | | | (2,643,682 | ) | | | (581,970 | ) | | | (6,128,210 | ) |
Class C | | | (18,562 | ) | | | (185,001 | ) | | | (20,313 | ) | | | (213,841 | ) |
Class R4 | | | (39,639 | ) | | | (412,106 | ) | | | (106,342 | ) | | | (1,137,025 | ) |
Class R6 | | | (319,814 | ) | | | (3,370,065 | ) | | | (710,084 | ) | | | (7,580,672 | ) |
Administrator Class | | | (167,709 | ) | | | (1,772,916 | ) | | | (620,178 | ) | | | (6,621,402 | ) |
| | | | |
| | | | | | | (8,383,770 | ) | | | | | | | (21,681,150 | ) |
| | | | |
Net decrease in net assets resulting from capital share transactions | | | | | | | (4,161,150 | ) | | | | | | | (12,589,682 | ) |
| | | | |
Total decrease in net assets | | | | | | | (2,245,221 | ) | | | | | | | (9,809,376 | ) |
| | | | |
| | |
Net assets | | | | | | | | |
Beginning of period | | | | | | | 57,719,797 | | | | | | | | 67,529,173 | |
| | | | |
End of period | | | | | | $ | 55,474,576 | | | | | | | $ | 57,719,797 | |
| | | | |
The accompanying notes are an integral part of these financial statements.
56 | Wells Fargo Target Date Retirement Funds
Statements of changes in net assets
| | | | | | | | | | | | | | | | |
| | | Target 2015 Fund | |
| | | Six months ended
August 31, 2020
(unaudited) | | | Year ended
February 29, 2020 | |
| |
Operations | | | | | |
Net investment income | | | | | | $ | 601,473 | | | | | | | $ | 1,720,520 | |
Payment from affiliate | | | | | | | 235 | | | | | | | | 0 | |
Net realized gains on investments | | | | | | | 167,889 | | | | | | | | 2,051,769 | |
Net change in unrealized gains (losses) on investments | | | | | | | 1,738,143 | | | | | | | | 1,756,842 | |
| | | | |
Net increase in net assets resulting from operations | | | | | | | 2,507,740 | | | | | | | | 5,529,131 | |
| | | | |
| | | | |
Distributions to shareholders from net investment income and net realized gains | | | | | | | | | | | | | | | | |
Class A | | | | | | | (259,056 | ) | | | | | | | (1,744,646 | ) |
Class R | | | | | | | (129 | ) | | | | | | | (947 | ) |
Class R4 | | | | | | | (37,269 | ) | | | | | | | (361,340 | ) |
Class R6 | | | | | | | (177,890 | ) | | | | | | | (1,303,361 | ) |
Administrator Class | | | | | | | (44,183 | ) | | | | | | | (301,496 | ) |
| | | | |
Total distributions to shareholders | | | | | | | (518,527 | ) | | | | | | | (3,711,790 | ) |
| | | | |
| | | | |
Capital share transactions | | | Shares | | | | | | | | Shares | | | | | |
Proceeds from shares sold | |
Class A | | | 49,536 | | | | 348,745 | | | | 147,058 | | | | 1,081,348 | |
Class R4 | | | 20,751 | | | | 145,934 | | | | 72,085 | | | | 529,173 | |
Class R6 | | | 193,582 | | | | 1,305,398 | | | | 629,700 | | | | 4,615,080 | |
Administrator Class | | | 15,264 | | | | 112,451 | | | | 59,225 | | | | 443,896 | |
| | | | |
| | | | | | | 1,912,528 | | | | | | | | 6,669,497 | |
| | | | |
Reinvestment of distributions | |
Class A | | | 37,544 | | | | 258,119 | | | | 239,738 | | | | 1,740,335 | |
Class R4 | | | 5,480 | | | | 37,269 | | | | 49,330 | | | | 361,340 | |
Class R6 | | | 25,737 | | | | 177,890 | | | | 178,070 | | | | 1,303,361 | |
Administrator Class | | | 6,247 | | | | 44,183 | | | | 40,639 | | | | 301,484 | |
| | | | |
| | | | | | | 517,461 | | | | | | | | 3,706,520 | |
| | | | |
Payment for shares redeemed | |
Class A | | | (313,121 | ) | | | (2,222,852 | ) | | | (979,311 | ) | | | (7,123,522 | ) |
Class R4 | | | (508,610 | ) | | | (3,563,990 | ) | | | (347,613 | ) | | | (2,542,630 | ) |
Class R6 | | | (446,044 | ) | | | (3,105,234 | ) | | | (2,609,415 | ) | | | (19,141,227 | ) |
Administrator Class | | | (71,796 | ) | | | (534,106 | ) | | | (317,780 | ) | | | (2,395,510 | ) |
| | | | |
| | | | | | | (9,426,182 | ) | | | | | | | (31,202,889 | ) |
| | | | |
Net decrease in net assets resulting from capital share transactions | | | | | | | (6,996,193 | ) | | | | | | | (20,826,872 | ) |
| | | | |
Total decrease in net assets | | | | | | | (5,006,980 | ) | | | | | | | (19,009,531 | ) |
| | | | |
| | |
Net assets | | | | | | | | |
Beginning of period | | | | | | | 62,592,434 | | | | | | | | 81,601,965 | |
| | | | |
End of period | | | | | | $ | 57,585,454 | | | | | | | $ | 62,592,434 | |
| | | | |
The accompanying notes are an integral part of these financial statements.
Wells Fargo Target Date Retirement Funds | 57
Statements of changes in net assets
| | | | | | | | | | | | | | | | |
| | | Target 2020 Fund | |
| | | Six months ended
August 31, 2020
(unaudited) | | | Year ended
February 29, 2020 | |
| |
Operations | | | | | |
Net investment income | | | | | | $ | 3,496,229 | | | | | | | $ | 9,229,546 | |
Payment from affiliate | | | | | | | 1,288 | | | | | | | | 0 | |
Net realized gains on investments | | | | | | | 678,232 | | | | | | | | 9,409,883 | |
Net change in unrealized gains (losses) on investments | | | | | | | 10,601,745 | | | | | | | | 8,805,358 | |
| | | | |
Net increase in net assets resulting from operations | | | | | | | 14,777,494 | | | | | | | | 27,444,787 | |
| | | | |
| | | | |
Distributions to shareholders from net investment income and realized gains | | | | | | | | | | | | | | | | |
Class A | | | | | | | 0 | | | | | | | | (4,792,200 | ) |
Class C | | | | | | | 0 | | | | | | | | (80,283 | ) |
Class R | | | | | | | 0 | | | | | | | | (3,847 | ) |
Class R4 | | | | | | | 0 | | | | | | | | (1,208,604 | ) |
Class R6 | | | | | | | 0 | | | | | | | | (5,927,221 | ) |
Administrator Class | | | | | | | 0 | | | | | | | | (1,999,953 | ) |
| | | | |
Total distributions to shareholders | | | | | | | 0 | | | | | | | | (14,012,108 | ) |
| | | | |
| | | | |
Capital share transactions | | | Shares | | | | | | | | Shares | | | | | |
Proceeds from shares sold | |
Class A | | | 155,839 | | | | 1,837,018 | | | | 321,410 | | | | 3,909,959 | |
Class C | | | 8,935 | | | | 102,706 | | | | 36,987 | | | | 437,245 | |
Class R | | | 1,114 | | | | 12,940 | | | | 2,393 | | | | 28,833 | |
Class R4 | | | 127,056 | | | | 1,512,806 | | | | 386,925 | | | | 4,825,572 | |
Class R6 | | | 1,118,781 | | | | 13,270,110 | | | | 2,376,361 | | | | 29,697,307 | |
Administrator Class | | | 315,584 | | | | 3,823,846 | | | | 748,329 | | | | 9,345,037 | |
| | | | |
| | | | | | | 20,559,426 | | | | | | | | 48,243,953 | |
| | | | |
Reinvestment of distributions | |
Class A | | | 0 | | | | 0 | | | | 384,564 | | | | 4,723,271 | |
Class C | | | 0 | | | | 0 | | | | 6,244 | | | | 75,187 | |
Class R | | | 0 | | | | 0 | | | | 252 | | | | 3,058 | |
Class R4 | | | 0 | | | | 0 | | | | 95,454 | | | | 1,208,604 | |
Class R6 | | | 0 | | | | 0 | | | | 468,154 | | | | 5,924,470 | |
Administrator Class | | | 0 | | | | 0 | | | | 159,038 | | | | 1,999,004 | |
| | | | |
| | | | | | | 0 | | | | | | | | 13,933,594 | |
| | | | |
Payment for shares redeemed | |
Class A | | | (1,247,928 | ) | | | (14,455,584 | ) | | | (2,279,102 | ) | | | (27,764,232 | ) |
Class C | | | (29,465 | ) | | | (338,024 | ) | | | (102,178 | ) | | | (1,214,362 | ) |
Class R | | | (1,234 | ) | | | (14,300 | ) | | | (71 | ) | | | (852 | ) |
Class R4 | | | (1,397,626 | ) | | | (16,716,577 | ) | | | (1,178,150 | ) | | | (14,819,303 | ) |
Class R6 | | | (3,005,388 | ) | | | (36,693,005 | ) | | | (3,758,077 | ) | | | (47,286,332 | ) |
Administrator Class | | | (1,026,444 | ) | | | (12,494,519 | ) | | | (1,821,031 | ) | | | (22,673,905 | ) |
| | | | |
| | | | | | | (80,712,009 | ) | | | | | | | (113,758,986 | ) |
| | | | |
Net decrease in net assets resulting from capital share transactions | | | | | | | (60,152,583 | ) | | | | | | | (51,581,439 | ) |
| | | | |
Total decrease in net assets | | | | | | | (45,375,089 | ) | | | | | | | (38,148,760 | ) |
| | | | |
| | |
Net assets | | | | | | | | |
Beginning of period | | | | | | | 368,822,336 | | | | | | | | 406,971,096 | |
| | | | |
End of period | | | | | | $ | 323,447,247 | | | | | | | $ | 368,822,336 | |
| | | | |
The accompanying notes are an integral part of these financial statements.
58 | Wells Fargo Target Date Retirement Funds
Statements of changes in net assets
| | | | | | | | | | | | | | | | |
| | | Target 2025 Fund | |
| | | Six months ended
August 31, 2020
(unaudited) | | | Year ended
February 29, 2020 | |
| |
Operations | | | | | |
Net investment income | | | | | | $ | 2,208,687 | | | | | | | $ | 6,534,712 | |
Payment from affiliate | | | | | | | 944 | | | | | | | | 0 | |
Net realized gains on investments | | | | | | | 31,004 | | | | | | | | 9,543,081 | |
Net change in unrealized gains (losses) on investments | | | | | | | 6,428,606 | | | | | | | | 2,021,557 | |
| | | | |
Net increase in net assets resulting from operations | | | | | | | 8,669,241 | | | | | | | | 18,099,350 | |
| | | | |
| | | | |
Distributions to shareholders from net investment income and net realized gains | | | | | | | | | | | | | | | | |
Class A | | | | | | | 0 | | | | | | | | (5,548,280 | ) |
Class R | | | | | | | 0 | | | | | | | | (2,895 | ) |
Class R4 | | | | | | | 0 | | | | | | | | (2,288,579 | ) |
Class R6 | | | | | | | 0 | | | | | | | | (7,333,390 | ) |
Administrator Class | | | | | | | 0 | | | | | | | | (717,546 | ) |
| | | | |
Total distributions to shareholders | | | | | | | 0 | | | | | | | | (15,890,690 | ) |
| | | | |
| | | | |
Capital share transactions | | | Shares | | | | | | | | Shares | | | | | |
Proceeds from shares sold | |
Class A | | | 428,269 | | | | 2,347,696 | | | | 1,087,121 | | | | 6,287,403 | |
Class R | | | 1,566 | | | | 8,446 | | | | 2,498 | | | | 14,335 | |
Class R4 | | | 317,319 | | | | 1,733,487 | | | | 989,423 | | | | 5,756,100 | |
Class R6 | | | 1,156,724 | | | | 6,334,581 | | | | 4,761,176 | | | | 27,698,312 | |
Administrator Class | | | 130,095 | | | | 731,353 | | | | 217,491 | | | | 1,275,211 | |
| | | | |
| | | | | | | 11,155,563 | | | | | | | | 41,031,361 | |
| | | | |
Reinvestment of distributions | |
Class A | | | 0 | | | | 0 | | | | 950,220 | | | | 5,515,105 | |
Class R | | | 0 | | | | 0 | | | | 349 | | | | 2,001 | |
Class R4 | | | 0 | | | | 0 | | | | 390,756 | | | | 2,288,579 | |
Class R6 | | | 0 | | | | 0 | | | | 1,255,125 | | | | 7,330,906 | |
Administrator Class | | | 0 | | | | 0 | | | | 121,550 | | | | 717,546 | |
| | | | |
| | | | | | | 0 | | | | | | | | 15,854,137 | |
| | | | |
Payment for shares redeemed | |
Class A | | | (2,357,880 | ) | | | (12,706,937 | ) | | | (4,190,988 | ) | | | (24,369,316 | ) |
Class R | | | (16 | ) | | | (85 | ) | | | (526 | ) | | | (3,085 | ) |
Class R4 | | | (4,658,847 | ) | | | (25,310,646 | ) | | | (2,457,717 | ) | | | (14,208,062 | ) |
Class R6 | | | (6,069,464 | ) | | | (32,895,510 | ) | | | (10,404,250 | ) | | | (60,864,548 | ) |
Administrator Class | | | (242,532 | ) | | | (1,310,822 | ) | | | (1,173,695 | ) | | | (6,909,384 | ) |
| | | | |
| | | | | | | (72,224,000 | ) | | | | | | | (106,354,395 | ) |
| | | | |
Net decrease in net assets resulting from capital share transactions | | | | | | | (61,068,437 | ) | | | | | | | (49,468,897 | ) |
| | | | |
Total decrease in net assets | | | | | | | (52,399,196 | ) | | | | | | | (47,260,237 | ) |
| | | | |
| | |
Net assets | | | | | | | | |
Beginning of period | | | | | | | 247,990,254 | | | | | | | | 295,250,491 | |
| | | | |
End of period | | | | | | $ | 195,591,058 | | | | | | | $ | 247,990,254 | |
| | | | |
The accompanying notes are an integral part of these financial statements.
Wells Fargo Target Date Retirement Funds | 59
Statements of changes in net assets
| | | | | | | | | | | | | | | | |
| | | Target 2030 Fund | |
| | | Six months ended
August 31, 2020
(unaudited) | | | Year ended
February 28, 2020 | |
| |
Operations | | | | | |
Net investment income | | | | | | $ | 5,253,218 | | | | | | | $ | 12,576,081 | |
Payment from affiliate | | | | | | | 3,159 | | | | | | | | 0 | |
Net realized gains on investments | | | | | | | 114,910 | | | | | | | | 15,982,387 | |
Net change in unrealized gains (losses) on investments | | | | | | | 23,620,323 | | | | | | | | 397,507 | |
| | | | |
Net increase in net assets resulting from operations | | | | | | | 28,991,610 | | | | | | | | 28,955,975 | |
| | | | |
| | | | |
Distributions to shareholders from net investment income and net realized gains | | | | | | | | | | | | | | | | |
Class A | | | | | | | 0 | | | | | | | | (6,430,044 | ) |
Class C | | | | | | | 0 | | | | | | | | (67,659 | ) |
Class R | | | | | | | 0 | | | | | | | | (1,549 | ) |
Class R4 | | | | | | | 0 | | | | | | | | (2,104,186 | ) |
Class R6 | | | | | | | 0 | | | | | | | | (10,088,137 | ) |
Administrator Class | | | | | | | 0 | | | | | | | | (3,230,154 | ) |
| | | | |
Total distributions to shareholders | | | | | | | 0 | | | | | | | | (21,921,729 | ) |
| | | | |
| | | | |
Capital share transactions | | | Shares | | | | | | | | Shares | | | | | |
Proceeds from shares sold | |
Class A | | | 320,559 | | | | 3,683,919 | | | | 486,798 | | | | 6,107,933 | |
Class C | | | 854 | | | | 8,963 | | | | 18,025 | | | | 217,663 | |
Class R | | | 256 | | | | 3,033 | | | | 487 | | | | 6,135 | |
Class R4 | | | 264,311 | | | | 3,112,784 | | | | 677,292 | | | | 8,716,604 | |
Class R6 | | | 1,579,313 | | | | 18,833,154 | | | | 4,054,583 | | | | 51,911,578 | |
Administrator Class | | | 455,993 | | | | 5,531,837 | | | | 1,226,067 | | | | 15,794,715 | |
| | | | |
| | | | | | | 31,173,690 | | | | | | | | 82,754,628 | |
| | | | |
Reinvestment of distributions | |
Class A | | | 0 | | | | 0 | | | | 494,750 | | | | 6,317,784 | |
Class C | | | 0 | | | | 0 | | | | 5,313 | | | | 64,760 | |
Class R | | | 0 | | | | 0 | | | | 56 | | | | 715 | |
Class R4 | | | 0 | | | | 0 | | | | 160,801 | | | | 2,104,186 | |
Class R6 | | | 0 | | | | 0 | | | | 771,741 | | | | 10,079,787 | |
Administrator Class | | | 0 | | | | 0 | | | | 246,692 | | | | 3,228,681 | |
| | | | |
| | | | | | | 0 | | | | | | | | 21,795,913 | |
| | | | |
Payment for shares redeemed | |
Class A | | | (1,437,053 | ) | | | (16,949,081 | ) | | | (2,256,546 | ) | | | (28,367,579 | ) |
Class C | | | (35,998 | ) | | | (399,808 | ) | | | (93,773 | ) | | | (1,117,920 | ) |
Class R | | | (9 | ) | | | (102 | ) | | | (238 | ) | | | (2,947 | ) |
Class R4 | | | (2,329,444 | ) | | | (27,676,125 | ) | | | (1,349,153 | ) | | | (17,323,715 | ) |
Class R6 | | | (3,874,651 | ) | | | (47,651,104 | ) | | | (4,960,799 | ) | | | (64,120,631 | ) |
Administrator Class | | | (1,198,864 | ) | | | (14,729,861 | ) | | | (2,306,946 | ) | | | (29,822,957 | ) |
| | | | |
| | | | | | | (107,406,081 | ) | | | | | | | (140,755,749 | ) |
| | | | |
Net decrease in net assets resulting from capital share transactions | | | | | | | (76,232,391 | ) | | | | | | | (36,205,208 | ) |
| | | | |
Total decrease in net assets | | | | | | | (47,240,781 | ) | | | | | | | (29,170,962 | ) |
| | | | |
| | |
Net assets | | | | | | | | |
Beginning of period | | | | | | | 528,669,276 | | | | | | | | 557,840,238 | |
| | | | |
End of period | | | | | | $ | 481,428,495 | | | | | | | $ | 528,669,276 | |
| | | | |
The accompanying notes are an integral part of these financial statements.
60 | Wells Fargo Target Date Retirement Funds
Statements of changes in net assets
| | | | | | | | | | | | | | | | |
| | | Target 2035 Fund | |
| | | Six months ended
August 31, 2020
(unaudited) | | | Year ended
February 29, 2020 | |
| |
Operations | | | | | |
Net investment income | | | | | | $ | 2,045,695 | | | | | | | $ | 5,447,000 | |
Net realized gains (losses) on investments | | | | | | | (353,678 | ) | | | | | | | 7,459,035 | |
Net change in unrealized gains (losses) on investments | | | | | | | 9,773,498 | | | | | | | | (1,227,747 | ) |
| | | | |
Net increase in net assets resulting from operations | | | | | | | 11,465,515 | | | | | | | | 11,678,288 | |
| | | | |
| | | | |
Distributions to shareholders from net investment income and net realized gains | | | | | | | | | | | | | | | | |
Class A | | | | | | | 0 | | | | | | | | (3,717,098 | ) |
Class R | | | | | | | 0 | | | | | | | | (10,348 | ) |
Class R4 | | | | | | | 0 | | | | | | | | (1,141,365 | ) |
Class R6 | | | | | | | 0 | | | | | | | | (4,226,161 | ) |
Administrator Class | | | | | | | 0 | | | | | | | | (329,081 | ) |
| | | | |
Total distributions to shareholders | | | | | | | 0 | | | | | | | | (9,424,053 | ) |
| | | | |
| | | | |
Capital share transactions | | | Shares | | | | | | | | Shares | | | | | |
Proceeds from shares sold | |
Class A | | | 273,306 | | | | 1,918,792 | | | | 1,003,096 | | | | 7,678,231 | |
Class R | | | 4,802 | | | | 34,237 | | | | 8,162 | | | | 63,766 | |
Class R4 | | | 192,672 | | | | 1,330,334 | | | | 733,952 | | | | 5,655,205 | |
Class R6 | | | 864,166 | | | | 6,144,318 | | | | 2,932,915 | | | | 22,487,188 | |
Administrator Class | | | 135,365 | | | | 950,098 | | | | 218,809 | | | | 1,711,018 | |
| | | | |
| | | | | | | 10,377,779 | | | | | | | | 37,595,408 | |
| | | | |
Reinvestment of distributions | |
Class A | | | 0 | | | | 0 | | | | 471,566 | | | | 3,705,773 | |
Class R | | | 0 | | | | 0 | | | | 1,209 | | | | 9,577 | |
Class R4 | | | 0 | | | | 0 | | | | 144,784 | | | | 1,141,365 | |
Class R6 | | | 0 | | | | 0 | | | | 536,623 | | | | 4,226,161 | |
Administrator Class | | | 0 | | | | 0 | | | | 41,355 | | | | 329,081 | |
| | | | |
| | | | | | | 0 | | | | | | | | 9,411,957 | |
| | | | |
Payment for shares redeemed | |
Class A | | | (1,132,307 | ) | | | (8,229,216 | ) | | | (3,249,331 | ) | | | (25,183,350 | ) |
Class R | | | (1 | ) | | | (8 | ) | | | (124 | ) | | | (966 | ) |
Class R4 | | | (2,807,175 | ) | | | (19,593,120 | ) | | | (1,910,906 | ) | | | (14,506,476 | ) |
Class R6 | | | (2,930,989 | ) | | | (20,934,525 | ) | | | (6,568,616 | ) | | | (51,007,636 | ) |
Administrator Class | | | (213,226 | ) | | | (1,562,164 | ) | | | (624,558 | ) | | | (4,872,916 | ) |
| | | | |
| | | | | | | (50,319,033 | ) | | | | | | | (95,571,344 | ) |
| | | | |
Net decrease in net assets resulting from capital share transactions | | | | | | | (39,941,254 | ) | | | | | | | (48,563,979 | ) |
| | | | |
Total decrease in net assets | | | | | | | (28,475,739 | ) | | | | | | | (46,309,744 | ) |
| | | | |
| | |
Net assets | | | | | | | | |
Beginning of period | | | | | | | 218,346,400 | | | | | | | | 264,656,144 | |
| | | | |
End of period | | | | | | $ | 189,870,661 | | | | | | | $ | 218,346,400 | |
| | | | |
The accompanying notes are an integral part of these financial statements.
Wells Fargo Target Date Retirement Funds | 61
Statements of changes in net assets
| | | | | | | | | | | | | | | | |
| | | Target 2040 Fund | |
| | | Six months ended
August 31, 2020
(unaudited) | | | Year ended
February 29, 2020 | |
| |
Operations | | | | | |
Net investment income | | | | | | $ | 4,679,184 | | | | | | | $ | 10,388,342 | |
Payment from affiliate | | | | | | | 2,629 | | | | | | | | 0 | |
Net realized gains (losses) on investments | | | | | | | (1,135,301 | ) | | | | | | | 14,719,390 | |
Net change in unrealized gains (losses) on investments | | | | | | | 27,448,454 | | | | | | | | (9,362,255 | ) |
| | | | |
Net increase in net assets resulting from operations | | | | | | | 30,994,966 | | | | | | | | 15,745,477 | |
| | | | |
| | | | |
Distributions to shareholders from net investment income and net realized gains | | | | | | | | | | | | | | | | |
Class A | | | | | | | 0 | | | | | | | | (5,969,824 | ) |
Class C | | | | | | | 0 | | | | | | | | (54,085 | ) |
Class R | | | | | | | 0 | | | | | | | | (2,012 | ) |
Class R4 | | | | | | | 0 | | | | | | | | (1,494,907 | ) |
Class R6 | | | | | | | 0 | | | | | | | | (6,885,470 | ) |
Administrator Class | | | | | | | 0 | | | | | | | | (2,236,336 | ) |
| | | | |
Total distributions to shareholders | | | | | | | 0 | | | | | | | | (16,642,634 | ) |
| | | | |
| | | | |
Capital share transactions | | | Shares | | | | | | | | Shares | | | | | |
Proceeds from shares sold | |
Class A | | | 155,959 | | | | 2,090,472 | | | | 435,086 | | | | 6,386,306 | |
Class C | | | 3,883 | | | | 44,027 | | | | 5,156 | | | | 66,943 | |
Class R | | | 180 | | | | 2,501 | | | | 361 | | | | 5,289 | |
Class R4 | | | 198,008 | | | | 2,737,851 | | | | 539,927 | | | | 8,201,151 | |
Class R6 | | | 1,391,268 | | | | 18,941,894 | | | | 2,897,179 | | | | 43,953,952 | |
Administrator Class | | | 311,784 | | | | 4,303,103 | | | | 801,012 | | | | 12,206,638 | |
| | | | |
| | | | | | | 28,119,848 | | | | | | | | 70,820,279 | |
| | | | |
Reinvestment of distributions | |
Class A | | | 0 | | | | 0 | | | | 392,281 | | | | 5,915,396 | |
Class C | | | 0 | | | | 0 | | | | 3,965 | | | | 53,572 | |
Class R | | | 0 | | | | 0 | | | | 84 | | | | 1,267 | |
Class R4 | | | 0 | | | | 0 | | | | 95,568 | | | | 1,494,907 | |
Class R6 | | | 0 | | | | 0 | | | | 438,966 | | | | 6,859,433 | |
Administrator Class | | | 0 | | | | 0 | | | | 143,305 | | | | 2,236,336 | |
| | | | |
| | | | | | | 0 | | | | | | | | 16,560,911 | |
| | | | |
Payment for shares redeemed | |
Class A | | | (1,155,588 | ) | | | (15,640,165 | ) | | | (1,759,927 | ) | | | (25,918,147 | ) |
Class C | | | (26,009 | ) | | | (319,163 | ) | | | (74,926 | ) | | | (968,759 | ) |
Class R | | | (7 | ) | | | (93 | ) | | | (146 | ) | | | (2,122 | ) |
Class R4 | | | (1,619,526 | ) | | | (22,289,520 | ) | | | (851,440 | ) | | | (12,910,537 | ) |
Class R6 | | | (2,135,409 | ) | | | (30,284,350 | ) | | | (3,239,228 | ) | | | (49,632,121 | ) |
Administrator Class | | | (904,612 | ) | | | (12,845,338 | ) | | | (1,488,491 | ) | | | (22,741,073 | ) |
| | | | |
| | | | | | | (81,378,629 | ) | | | | | | | (112,172,759 | ) |
| | | | |
Net decrease in net assets resulting from capital share transactions | | | | | | | (53,258,781 | ) | | | | | | | (24,791,569 | ) |
| | | | |
Total decrease in net assets | | | | | | | (22,263,815 | ) | | | | | | | (25,688,726 | ) |
| | | | |
| | |
Net assets | | | | | | | | |
Beginning of period | | | | | | | 468,300,345 | | | | | | | | 493,989,071 | |
| | | | |
End of period | | | | | | $ | 446,036,530 | | | | | | | $ | 468,300,345 | |
| | | | |
The accompanying notes are an integral part of these financial statements.
62 | Wells Fargo Target Date Retirement Funds
Statements of changes in net assets
| | | | | | | | | | | | | | | | |
| | | Target 2045 Fund | |
| | | Six months ended
August 31, 2020
(unaudited) | | | Year ended
February 29, 2020 | |
| |
Operations | | | | | |
Net investment income | | | | | | $ | 995,227 | | | | | | | $ | 2,913,035 | |
Payment from affiliate | | | | | | | 1,213 | | | | | | | | 0 | |
Net realized gains (losses) on investments | | | | | | | (498,303 | ) | | | | | | | 3,980,983 | |
Net change in unrealized gains (losses) on investments | | | | | | | 5,357,057 | | | | | | | | (1,715,162 | ) |
| | | | |
Net increase in net assets resulting from operations | | | | | | | 5,855,194 | | | | | | | | 5,178,856 | |
| | | | |
| | | | |
Distributions to shareholders from net investment income and net realized gains | | | | | | | | | | | | | | | | |
Class A | | | | | | | 0 | | | | | | | | (1,321,523 | ) |
Class R | | | | | | | 0 | | | | | | | | (1,378 | ) |
Class R4 | | | | | | | 0 | | | | | | | | (576,633 | ) |
Class R6 | | | | | | | 0 | | | | | | | | (1,865,727 | ) |
Administrator Class | | | | | | | 0 | | | | | | | | (168,990 | ) |
| | | | |
Total distributions to shareholders | | | | | | | 0 | | | | | | | | (3,934,251 | ) |
| | | | |
| | | | |
Capital share transactions | | | Shares | | | | | | | | Shares | | | | | |
Proceeds from shares sold | |
Class A | | | 224,966 | | | | 1,726,974 | | | | 789,569 | | | | 6,621,798 | |
Class R | | | 696 | | | | 5,600 | | | | 1,634 | | | | 14,129 | |
Class R4 | | | 103,020 | | | | 773,774 | | | | 473,522 | | | | 4,020,747 | |
Class R6 | | | 448,733 | | | | 3,471,915 | | | | 1,565,972 | | | | 13,262,234 | |
Administrator Class | | | 50,776 | | | | 395,319 | | | | 149,633 | | | | 1,286,485 | |
| | | | |
| | | | | | | 6,373,582 | | | | | | | | 25,205,393 | |
| | | | |
Reinvestment of distributions | |
Class A | | | 0 | | | | 0 | | | | 151,196 | | | | 1,320,351 | |
Class R | | | 0 | | | | 0 | | | | 81 | | | | 724 | |
Class R4 | | | 0 | | | | 0 | | | | 65,625 | | | | 576,633 | |
Class R6 | | | 0 | | | | 0 | | | | 213,282 | | | | 1,865,727 | |
Administrator Class | | | 0 | | | | 0 | | | | 19,022 | | | | 168,990 | |
| | | | |
| | | | | | | 0 | | | | | | | | 3,932,425 | |
| | | | |
Payment for shares redeemed | |
Class A | | | (822,978 | ) | | | (6,677,152 | ) | | | (2,587,303 | ) | | | (22,123,618 | ) |
Class R | | | (38 | ) | | | (290 | ) | | | (151 | ) | | | (1,260 | ) |
Class R4 | | | (1,517,815 | ) | | | (11,522,674 | ) | | | (1,333,356 | ) | | | (11,263,976 | ) |
Class R6 | | | (1,604,334 | ) | | | (12,576,439 | ) | | | (4,403,251 | ) | | | (37,539,591 | ) |
Administrator Class | | | (134,996 | ) | | | (1,099,171 | ) | | | (487,259 | ) | | | (4,188,921 | ) |
| | | | |
| | | | | | | (31,875,726 | ) | | | | | | | (75,117,366 | ) |
| | | | |
Net decrease in net assets resulting from capital share transactions | | | | | | | (25,502,144 | ) | | | | | | | (45,979,548 | ) |
| | | | |
Total decrease in net assets | | | | | | | (19,646,950 | ) | | | | | | | (44,734,943 | ) |
| | | | |
| | |
Net assets | | | | | | | | |
Beginning of period | | | | | | | 110,517,134 | | | | | | | | 155,252,077 | |
| | | | |
End of period | | | | | | $ | 90,870,184 | | | | | | | $ | 110,517,134 | |
| | | | |
The accompanying notes are an integral part of these financial statements.
Wells Fargo Target Date Retirement Funds | 63
Statements of changes in net assets
| | | | | | | | | | | | | | | | |
| | | Target 2050 Fund | |
| | | Six months ended
August 31, 2020
(unaudited) | | | Year ended
February 29, 2020 | |
| |
Operations | | | | | |
Net investment income | | | | | | $ | 2,172,388 | | | | | | | $ | 4,729,460 | |
Payment from affiliate | | | | | | | 1,129 | | | | | | | | 0 | |
Net realized gains (losses) on investments | | | | | | | (828,693 | ) | | | | | | | 8,522,429 | |
Net change in unrealized gains (losses) on investments | | | | | | | 13,865,591 | | | | | | | | (8,234,532 | ) |
| | | | |
Net increase in net assets resulting from operations | | | | | | | 15,210,415 | | | | | | | | 5,017,357 | |
| | | | |
| | | | |
Distributions to shareholders from net investment income and net realized gains | | | | | | | | | | | | | | | | |
Class A | | | | | | | 0 | | | | | | | | (2,142,046 | ) |
Class C | | | | | | | 0 | | | | | | | | (22,272 | ) |
Class R | | | | | | | 0 | | | | | | | | (1,574 | ) |
Class R4 | | | | | | | 0 | | | | | | | | (891,969 | ) |
Class R6 | | | | | | | 0 | | | | | | | | (5,471,850 | ) |
Administrator Class | | | | | | | 0 | | | | | | | | (1,843,022 | ) |
| | | | |
Total distributions to shareholders | | | | | | | 0 | | | | | | | | (10,372,733 | ) |
| | | | |
| | | | |
Capital share transactions | | | Shares | | | | | | | | Shares | | | | | |
Proceeds from shares sold | |
Class A | | | 306,660 | | | | 1,977,688 | | | | 777,411 | | | | 5,706,122 | |
Class C | | | 2,245 | | | | 14,965 | | | | 5,495 | | | | 40,328 | |
Class R | | | 1,004 | | | | 6,858 | | | | 832 | | | | 6,201 | |
Class R4 | | | 277,447 | | | | 1,850,789 | | | | 674,678 | | | | 5,020,086 | |
Class R6 | | | 2,112,086 | | | | 13,782,393 | | | | 4,116,817 | | | | 30,609,669 | |
Administrator Class | | | 648,385 | | | | 4,231,148 | | | | 1,300,441 | | | | 9,682,291 | |
| | | | |
| | | | | | | 21,863,841 | | | | | | | | 51,064,697 | |
| | | | |
Reinvestment of distributions | |
Class A | | | 0 | | | | 0 | | | | 282,055 | | | | 2,134,628 | |
Class C | | | 0 | | | | 0 | | | | 2,734 | | | | 20,489 | |
Class R | | | 0 | | | | 0 | | | | 88 | | | | 665 | |
Class R4 | | | 0 | | | | 0 | | | | 116,874 | | | | 891,969 | |
Class R6 | | | 0 | | | | 0 | | | | 717,883 | | | | 5,470,712 | |
Administrator Class | | | 0 | | | | 0 | | | | 242,411 | | | | 1,843,022 | |
| | | | |
| | | | | | | 0 | | | | | | | | 10,361,485 | |
| | | | |
Payment for shares redeemed | |
Class A | | | (1,064,327 | ) | | | (6,957,101 | ) | | | (1,721,275 | ) | | | (12,792,520 | ) |
Class C | | | (7,267 | ) | | | (44,194 | ) | | | (76,091 | ) | | | (558,912 | ) |
Class R | | | (15 | ) | | | (101 | ) | | | (26 | ) | | | (191 | ) |
Class R4 | | | (1,303,771 | ) | | | (8,553,118 | ) | | | (942,718 | ) | | | (7,031,823 | ) |
Class R6 | | | (2,557,959 | ) | | | (17,375,470 | ) | | | (4,423,086 | ) | | | (33,198,589 | ) |
Administrator Class | | | (1,467,976 | ) | | | (9,807,525 | ) | | | (1,498,842 | ) | | | (11,155,991 | ) |
| | | | |
| | | | | | | (42,737,509 | ) | | | | | | | (64,738,026 | ) |
| | | | |
Net decrease in net assets resulting from capital share transactions | | | | | | | (20,873,668 | ) | | | | | | | (3,311,844 | ) |
| | | | |
Total decrease in net assets | | | | | | | (5,663,253 | ) | | | | | | | (8,667,220 | ) |
| | | | |
| | |
Net assets | | | | | | | | |
Beginning of period | | | | | | | 212,971,164 | | | | | | | | 221,638,384 | |
| | | | |
End of period | | | | | | $ | 207,307,911 | | | | | | | $ | 212,971,164 | |
| | | | |
The accompanying notes are an integral part of these financial statements.
64 | Wells Fargo Target Date Retirement Funds
Statements of changes in net assets
| | | | | | | | | | | | | | | | |
| | | Target 2055 Fund | |
| | | Six months ended
August 31, 2020
(unaudited) | | | Year ended
February 29, 2020 | |
| |
Operations | | | | | |
Net investment income | | | | | | $ | 320,029 | | | | | | | $ | 815,393 | |
Payment from affiliate | | | | | | | 293 | | | | | | | | 0 | |
Net realized gains (losses) on investments | | | | | | | (218,157 | ) | | | | | | | 764,463 | |
Net change in unrealized gains (losses) on investments | | | | | | | 1,604,729 | | | | | | | | (573,421 | ) |
| | | | |
Net increase in net assets resulting from operations | | | | | | | 1,706,894 | | | | | | | | 1,006,435 | |
| | | | |
| | | | |
Distributions to shareholders from net investment income and net realized gains | | | | | | | | | | | | | | | | |
Class A | | | | | | | 0 | | | | | | | | (142,934 | ) |
Class R | | | | | | | 0 | | | | | | | | (779 | ) |
Class R4 | | | | | | | 0 | | | | | | | | (177,218 | ) |
Class R6 | | | | | | | 0 | | | | | | | | (505,416 | ) |
Administrator Class | | | | | | | 0 | | | | | | | | (12,907 | ) |
| | | | |
Total distributions to shareholders | | | | | | | 0 | | | | | | | | (839,254 | ) |
| | | | |
| | | | |
Capital share transactions | | | Shares | | | | | | | | Shares | | | | | |
Proceeds from shares sold | |
Class A | | | 47,526 | | | | 522,624 | | | | 249,844 | | | | 2,989,458 | |
Class R | | | 279 | | | | 3,105 | | | | 498 | | | | 5,843 | |
Class R4 | | | 84,905 | | | | 892,346 | | | | 329,687 | | | | 3,988,255 | |
Class R6 | | | 226,484 | | | | 2,490,921 | | | | 638,993 | | | | 7,729,212 | |
Administrator Class | | | 12,967 | | | | 147,039 | | | | 29,947 | | | | 360,117 | |
| | | | |
| | | | | | | 4,056,035 | | | | | | | | 15,072,885 | |
| | | | |
Reinvestment of distributions | |
Class A | | | 0 | | | | 0 | | | | 11,368 | | | | 142,357 | |
Class R | | | 0 | | | | 0 | | | | 20 | | | | 245 | |
Class R4 | | | 0 | | | | 0 | | | | 14,106 | | | | 177,218 | |
Class R6 | | | 0 | | | | 0 | | | | 40,325 | | | | 505,416 | |
Administrator Class | | | 0 | | | | 0 | | | | 1,023 | | | | 12,907 | |
| | | | |
| | | | | | | 0 | | | | | | | | 838,143 | |
| | | | |
Payment for shares redeemed | |
Class A | | | (134,860 | ) | | | (1,529,964 | ) | | | (537,744 | ) | | | (6,501,930 | ) |
Class R | | | (189 | ) | | | (2,283 | ) | | | (657 | ) | | | (7,725 | ) |
Class R4 | | | (553,702 | ) | | | (5,930,028 | ) | | | (372,361 | ) | | | (4,499,286 | ) |
Class R6 | | | (467,149 | ) | | | (5,279,561 | ) | | | (603,431 | ) | | | (7,381,450 | ) |
Administrator Class | | | (5,220 | ) | | | (59,570 | ) | | | (68,444 | ) | | | (823,710 | ) |
| | | | |
| | | | | | | (12,801,406 | ) | | | | | | | (19,214,101 | ) |
| | | | |
Net decrease in net assets resulting from capital share transactions | | | | | | | (8,745,371 | ) | | | | | | | (3,303,073 | ) |
| | | | |
Total decrease in net assets | | | | | | | (7,038,477 | ) | | | | | | | (3,135,892 | ) |
| | | | |
| | |
Net assets | | | | | | | | |
Beginning of period | | | | | | | 34,745,870 | | | | | | | | 37,881,762 | |
| | | | |
End of period | | | | | | $ | 27,707,393 | | | | | | | $ | 34,745,870 | |
| | | | |
The accompanying notes are an integral part of these financial statements.
Wells Fargo Target Date Retirement Funds | 65
Statements of changes in net assets
| | | | | | | | | | | | | | | | |
| | | Target 2060 Fund | |
| | | Six months ended
August 31, 2020
(unaudited) | | | Year ended
February 29, 2020 | |
| |
Operations | | | | | |
Net investment income | | | | | | $ | 262,511 | | | | | | | $ | 446,705 | |
Payment from affiliate | | | | | | | 2,213 | | | | | | | | 0 | |
Net realized gains (losses) on investments | | | | | | | (42,734 | ) | | | | | | | 420,384 | |
Net change in unrealized gains (losses) on investments | | | | | | | 2,015,022 | | | | | | | | (603,197 | ) |
| | | | |
Net increase in net assets resulting from operations | | | | | | | 2,237,012 | | | | | | | | 263,892 | |
| | | | |
| | | | |
Distributions to shareholders from net investment income and net realized gains | | | | | | | | | | | | | | | | |
Class A | | | | | | | 0 | | | | | | | | (15,694 | ) |
Class C | | | | | | | 0 | | | | | | | | (1,689 | ) |
Class R | | | | | | | 0 | | | | | | | | (1,057 | ) |
Class R4 | | | | | | | 0 | | | | | | | | (53,088 | ) |
Class R6 | | | | | | | 0 | | | | | | | | (310,399 | ) |
Administrator Class | | | | | | | 0 | | | | | | | | (63,995 | ) |
| | | | |
Total distributions to shareholders | | | | | | | 0 | | | | | | | | (445,922 | ) |
| | | | |
| | | | |
Capital share transactions | | | Shares | | | | | | | | Shares | | | | | |
Proceeds from shares sold | |
Class A | | | 37,073 | | | | 384,577 | | | | 59,651 | | | | 719,273 | |
Class C | | | 231 | | | | 2,534 | | | | 1,122 | | | | 13,049 | |
Class R | | | 1,035 | | | | 11,337 | | | | 1,141 | | | | 13,327 | |
Class R4 | | | 36,411 | | | | 403,072 | | | | 108,478 | | | | 1,308,060 | |
Class R6 | | | 444,247 | | | | 4,816,264 | | | | 748,398 | | | | 9,084,784 | |
Administrator Class | | | 81,774 | | | | 900,142 | | | | 141,839 | | | | 1,711,085 | |
| | | | |
| | | | | | | 6,517,926 | | | | | | | | 12,849,578 | |
| | | | |
Reinvestment of distributions | |
Class A | | | 0 | | | | 0 | | | | 1,250 | | | | 15,523 | |
Class C | | | 0 | | | | 0 | | | | 118 | | | | 1,471 | |
Class R | | | 0 | | | | 0 | | | | 55 | | | | 674 | |
Class R4 | | | 0 | | | | 0 | | | | 4,178 | | | | 52,899 | |
Class R6 | | | 0 | | | | 0 | | | | 24,598 | | | | 310,197 | |
Administrator Class | | | 0 | | | | 0 | | | | 5,118 | | | | 63,822 | |
| | | | |
| | | | | | | 0 | | | | | | | | 444,586 | |
| | | | |
Payment for shares redeemed | |
Class A | | | (37,084 | ) | | | (398,335 | ) | | | (33,471 | ) | | | (403,008 | ) |
Class C | | | 0 | | | | 0 | | | | (8,193 | ) | | | (99,186 | ) |
Class R | | | (115 | ) | | | (1,291 | ) | | | (27 | ) | | | (314 | ) |
Class R4 | | | (62,413 | ) | | | (741,843 | ) | | | (90,634 | ) | | | (1,118,012 | ) |
Class R6 | | | (276,459 | ) | | | (3,187,809 | ) | | | (339,934 | ) | | | (4,197,518 | ) |
Administrator Class | | | (166,993 | ) | | | (1,801,840 | ) | | | (98,703 | ) | | | (1,189,286 | ) |
| | | | |
| | | | | | | (6,131,118 | ) | | | | | | | (7,007,324 | ) |
| | | | |
Net increase in net assets resulting from capital share transactions | | | | | | | 386,808 | | | | | | | | 6,286,840 | |
| | | | |
Total increase in net assets | | | | | | | 2,623,820 | | | | | | | | 6,104,810 | |
| | | | |
| | |
Net assets | | | | | | | | |
Beginning of period | | | | | | | 22,642,709 | | | | | | | | 16,537,899 | |
| | | | |
End of period | | | | | | $ | 25,266,529 | | | | | | | $ | 22,642,709 | |
| | | | |
The accompanying notes are an integral part of these financial statements.
66 | Wells Fargo Target Date Retirement Funds
This page is intentionally left blank.
Financial highlights
| | | | | | | | | | | | | | | | | | | | | | | | | | | | |
| | | Beginning
net asset
value per
share | | | Net
investment
income | | | Payment
from
affiliate | | | Net realized
and unrealized
gains (losses)
on investments | | | Distributions
from net
investment
income | | | Distributions
from net
realized gains | | | Ending
net asset
value per
share | |
| | | | | | | |
Target Today Fund | | | | | | | | | | | | | | | | | | | | | | | | | | | | |
| | | | | | | |
Class A | | | | | | | | | | | | | | | | | | | | | | | | | | | | |
Six months ended August 31, 2020 (unaudited) | | $ | 9.04 | | | | 0.08 | | | | 0.00 | | | | 0.29 | | | | (0.07 | ) | | | 0.00 | | | $ | 9.34 | |
Year ended February 29, 2020 | | $ | 8.66 | | | | 0.19 | | | | 0.00 | | | | 0.47 | | | | (0.20 | ) | | | (0.08 | ) | | $ | 9.04 | |
Year ended February 28, 2019 | | $ | 8.97 | | | | 0.19 | | | | 0.00 | | | | 0.07 | | | | (0.21 | ) | | | (0.36 | ) | | $ | 8.66 | |
Year ended February 28, 2018 | | $ | 10.56 | | | | 0.17 | | | | 0.00 | | | | 0.13 | | | | (0.08 | ) | | | (1.81 | ) | | $ | 8.97 | |
Year ended February 28, 2017 | | $ | 10.41 | | | | 0.12 | | | | 0.00 | | | | 0.23 | | | | (0.11 | ) | | | (0.09 | ) | | $ | 10.56 | |
Year ended February 29, 2016 | | $ | 10.81 | | | | 0.10 | 4 | | | 0.00 | | | | (0.29 | ) | | | (0.03 | ) | | | (0.18 | ) | | $ | 10.41 | |
| | | | | | | |
Class C | | | | | | | | | | | | | | | | | | | | | | | | | | | | |
Six months ended August 31, 2020 (unaudited) | | $ | 9.30 | | | | 0.05 | 4 | | | 0.00 | | | | 0.30 | | | | (0.04 | ) | | | 0.00 | | | $ | 9.61 | |
Year ended February 29, 2020 | | $ | 8.89 | | | | 0.14 | 4 | | | 0.00 | | | | 0.47 | | | | (0.12 | ) | | | (0.08 | ) | | $ | 9.30 | |
Year ended February 28, 2019 | | $ | 9.18 | | | | 0.14 | 4 | | | 0.00 | | | | 0.06 | | | | (0.13 | ) | | | (0.36 | ) | | $ | 8.89 | |
Year ended February 28, 2018 | | $ | 10.77 | | | | 0.10 | | | | 0.00 | | | | 0.13 | | | | (0.01 | ) | | | (1.81 | ) | | $ | 9.18 | |
Year ended February 28, 2017 | | $ | 10.63 | | | | 0.03 | | | | 0.00 | | | | 0.24 | | | | (0.04 | ) | | | (0.09 | ) | | $ | 10.77 | |
Year ended February 29, 2016 | | $ | 11.08 | | | | 0.02 | 4 | | | 0.00 | | | | (0.29 | ) | | | 0.00 | | | | (0.18 | ) | | $ | 10.63 | |
| | | | | | | |
Class R | | | | | | | | | | | | | | | | | | | | | | | | | | | | |
Six months ended August 31, 2020 (unaudited) | | $ | 9.00 | | | | 0.07 | 4 | | | 0.07 | | | | 0.29 | | | | (0.06 | ) | | | 0.00 | | | $ | 9.37 | |
Year ended February 29, 2020 | | $ | 8.62 | | | | 0.17 | | | | 0.00 | | | | 0.46 | | | | (0.17 | ) | | | (0.08 | ) | | $ | 9.00 | |
Year ended February 28, 2019 | | $ | 8.94 | | | | 0.17 | | | | 0.00 | | | | 0.06 | | | | (0.19 | ) | | | (0.36 | ) | | $ | 8.62 | |
Year ended February 28, 2018 | | $ | 10.53 | | | | 0.14 | | | | 0.00 | | | | 0.14 | | | | (0.06 | ) | | | (1.81 | ) | | $ | 8.94 | |
Year ended February 28, 2017 | | $ | 10.39 | | | | 0.09 | | | | 0.00 | | | | 0.23 | | | | (0.09 | ) | | | (0.09 | ) | | $ | 10.53 | |
Year ended February 29, 2016 | | $ | 10.80 | | | | 0.07 | | | | 0.00 | | | | (0.29 | ) | | | (0.01 | ) | | | (0.18 | ) | | $ | 10.39 | |
| | | | | | | |
Class R4 | | | | | | | | | | | | | | | | | | | | | | | | | | | | |
Six months ended August 31, 2020 (unaudited) | | $ | 9.29 | | | | 0.10 | 4 | | | 0.00 | | | | 0.30 | | | | (0.09 | ) | | | 0.00 | | | $ | 9.60 | |
Year ended February 29, 2020 | | $ | 8.89 | | | | 0.23 | 4 | | | 0.00 | | | | 0.48 | | | | (0.23 | ) | | | (0.08 | ) | | $ | 9.29 | |
Year ended February 28, 2019 | | $ | 9.20 | | | | 0.24 | 4 | | | 0.00 | | | | 0.05 | | | | (0.24 | ) | | | (0.36 | ) | | $ | 8.89 | |
Year ended February 28, 2018 | | $ | 10.81 | | | | 0.17 | 4 | | | 0.00 | | | | 0.13 | | | | (0.10 | ) | | | (1.81 | ) | | $ | 9.20 | |
Year ended February 28, 2017 | | $ | 10.65 | | | | 0.14 | | | | 0.00 | | | | 0.25 | | | | (0.14 | ) | | | (0.09 | ) | | $ | 10.81 | |
Year ended February 29, 2016 | | $ | 11.06 | | | | 0.14 | | | | 0.00 | | | | (0.30 | ) | | | (0.07 | ) | | | (0.18 | ) | | $ | 10.65 | |
| | | | | | | |
Class R6 | | | | | | | | | | | | | | | | | | | | | | | | | | | | |
Six months ended August 31, 2020 (unaudited) | | $ | 9.28 | | | | 0.11 | 4 | | | 0.00 | | | | 0.29 | | | | (0.09 | ) | | | 0.00 | | | $ | 9.59 | |
Year ended February 29, 2020 | | $ | 8.88 | | | | 0.24 | 4 | | | 0.00 | | | | 0.48 | | | | (0.24 | ) | | | (0.08 | ) | | $ | 9.28 | |
Year ended February 28, 2019 | | $ | 9.19 | | | | 0.25 | 4 | | | 0.00 | | | | 0.06 | | | | (0.26 | ) | | | (0.36 | ) | | $ | 8.88 | |
Year ended February 28, 2018 | | $ | 10.78 | | | | 0.21 | 4 | | | 0.00 | | | | 0.15 | | | | (0.14 | ) | | | (1.81 | ) | | $ | 9.19 | |
Year ended February 28, 2017 | | $ | 10.64 | | | | 0.17 | 4 | | | 0.00 | | | | 0.23 | | | | (0.17 | ) | | | (0.09 | ) | | $ | 10.78 | |
Year ended February 29, 2016 | | $ | 11.05 | | | | 0.15 | | | | 0.00 | | | | (0.29 | ) | | | (0.09 | ) | | | (0.18 | ) | | $ | 10.64 | |
| | | | | | | |
Administrator Class | | | | | | | | | | | | | | | | | | | | | | | | | | | | |
Six months ended August 31, 2020 (unaudited) | | $ | 9.30 | | | | 0.09 | | | | 0.00 | | | | 0.30 | | | | (0.08 | ) | | | 0.00 | | | $ | 9.61 | |
Year ended February 29, 2020 | | $ | 8.90 | | | | 0.21 | 4 | | | 0.00 | | | | 0.48 | | | | (0.21 | ) | | | (0.08 | ) | | $ | 9.30 | |
Year ended February 28, 2019 | | $ | 9.21 | | | | 0.22 | 4 | | | 0.00 | | | | 0.05 | | | | (0.22 | ) | | | (0.36 | ) | | $ | 8.90 | |
Year ended February 28, 2018 | | $ | 10.78 | | | | 0.18 | | | | 0.00 | | | | 0.15 | | | | (0.09 | ) | | | (1.81 | ) | | $ | 9.21 | |
Year ended February 28, 2017 | | $ | 10.63 | | | | 0.13 | 4 | | | 0.00 | | | | 0.23 | | | | (0.12 | ) | | | (0.09 | ) | | $ | 10.78 | |
Year ended February 29, 2016 | | $ | 11.03 | | | | 0.12 | 4 | | | 0.00 | | | | (0.29 | ) | | | (0.05 | ) | | | (0.18 | ) | | $ | 10.63 | |
| 1 | Ratios include net expenses allocated from the affiliated Master Portfolios which were as follows: |
| | | | | | | | | | | | | | | | | | | | | | | | |
| | | Six months ended August 31, 2020 (unaudited) | | | Year ended February 29, 2020 | | | Year ended February 28 | | | Year ended February 29, 2016 | |
| | | 2019 | | | 2018 | | | 2017 | |
Class A | | | 0.10 | % | | | 0.12 | % | | | 0.13 | % | | | 0.15 | % | | | 0.15 | % | | | 0.15 | % |
Class C | | | 0.10 | | | | 0.12 | | | | 0.13 | | | | 0.15 | | | | 0.15 | | | | 0.15 | |
Class R | | | 0.06 | | | | 0.17 | | | | 0.11 | | | | 0.16 | | | | 0.16 | | | | 0.14 | |
Class R4 | | | 0.10 | | | | 0.12 | | | | 0.13 | | | | 0.16 | | | | 0.15 | | | | 0.15 | |
Class R6 | | | 0.10 | | | | 0.12 | | | | 0.13 | | | | 0.15 | | | | 0.15 | | | | 0.15 | |
Administrator Class | | | 0.10 | | | | 0.12 | | | | 0.13 | | | | 0.15 | | | | 0.15 | | | | 0.15 | |
| 2 | Total return calculations do not include any sales charges. Returns for periods of less than one year are not annualized. |
| 3 | Portfolio turnover rate is calculated by multiplying the Fund’s ownership percentage in each respective affiliated Master Portfolio by the corresponding affiliated Master Portfolio’s purchases and sales. |
| 4 | Calculated based upon average shares outstanding |
| 5 | During the six months ended August 31, 2020, the Fund received a payment from an affiliate which had an impact of 0.78% on the total return. See Note 4 in the Notes to Financial Statements for additional information. |
The accompanying notes are an integral part of these financial statements.
68 | Wells Fargo Target Date Retirement Funds
Financial highlights
| | | | | | | | | | | | | | | | | | | | | | |
| Ratio to average net assets (annualized) | | | Total
return2 | | | Portfolio
turnover
rate3 | | | Net assets at
end of period
(000s omitted) | |
Net investment
income1 | | | Gross
expenses1 | | | Net
expenses1 | |
| | | | | |
| | | | | | | | | | | | | | | | | | | | | | | |
| | | | | |
| | | | | | | | | | | | | | | | | | | | | | |
| | 1.90 | % | | | 1.00 | % | | | 0.62 | % | | | 4.19 | % | | | 34 | % | | $ | 35,476 | |
| | 2.16 | % | | | 0.98 | % | | | 0.63 | % | | | 7.64 | % | | | 37 | % | | $ | 36,878 | |
| | 2.21 | % | | | 0.93 | % | | | 0.65 | % | | | 3.09 | % | | | 45 | % | | $ | 37,865 | |
| | 1.59 | % | | | 0.87 | % | | | 0.69 | % | | | 2.54 | % | | | 80 | % | | $ | 47,030 | |
| | 1.06 | % | | | 0.85 | % | | | 0.76 | % | | | 3.39 | % | | | 41 | % | | $ | 55,965 | |
| | 0.98 | % | | | 0.86 | % | | | 0.77 | % | | | (1.74 | )% | | | 36 | % | | $ | 66,656 | |
| | | | | |
| | | | | | | | | | | | | | | | | | | | | | |
| | 1.15 | % | | | 1.74 | % | | | 1.37 | % | | | 3.80 | % | | | 34 | % | | $ | 515 | |
| | 1.46 | % | | | 1.73 | % | | | 1.39 | % | | | 6.80 | % | | | 37 | % | | $ | 529 | |
| | 1.50 | % | | | 1.68 | % | | | 1.40 | % | | | 2.31 | % | | | 45 | % | | $ | 923 | |
| | 0.83 | % | | | 1.62 | % | | | 1.44 | % | | | 1.76 | % | | | 80 | % | | $ | 2,250 | |
| | 0.31 | % | | | 1.61 | % | | | 1.51 | % | | | 2.57 | % | | | 41 | % | | $ | 2,822 | |
| | 0.19 | % | | | 1.63 | % | | | 1.53 | % | | | (2.44 | )% | | | 36 | % | | $ | 2,763 | |
| | | | | |
| | | | | | | | | | | | | | | | | | | | | | |
| | 1.64 | % | | | 1.04 | % | | | 0.87 | % | | | 4.85 | %5 | | | 34 | % | | $ | 33 | |
| | 1.88 | % | | | 1.23 | % | | | 0.90 | % | | | 7.35 | % | | | 37 | % | | $ | 31 | |
| | 1.96 | % | | | 1.16 | % | | | 0.89 | % | | | 2.72 | % | | | 45 | % | | $ | 28 | |
| | 1.36 | % | | | 1.13 | % | | | 0.94 | % | | | 2.31 | % | | | 80 | % | | $ | 29 | |
| | 0.79 | % | | | 1.12 | % | | | 1.01 | % | | | 3.13 | % | | | 41 | % | | $ | 32 | |
| | 0.69 | % | | | 1.12 | % | | | 1.02 | % | | | (2.00 | )% | | | 36 | % | | $ | 29 | |
| | | | | |
| | | | | | | | | | | | | | | | | | | | | | |
| | 2.21 | % | | | 0.73 | % | | | 0.31 | % | | | 4.34 | % | | | 34 | % | | $ | 958 | |
| | 2.46 | % | | | 0.70 | % | | | 0.34 | % | | | 7.98 | % | | | 37 | % | | $ | 2,437 | |
| | 2.62 | % | | | 0.67 | % | | | 0.34 | % | | | 3.35 | % | | | 45 | % | | $ | 2,825 | |
| | 1.54 | % | | | 0.60 | % | | | 0.44 | % | | | 2.46 | % | | | 80 | % | | $ | 12,858 | |
| | 1.37 | % | | | 0.58 | % | | | 0.45 | % | | | 3.71 | % | | | 41 | % | | $ | 248,734 | |
| | 1.27 | % | | | 0.59 | % | | | 0.45 | % | | | (1.40 | )% | | | 36 | % | | $ | 271,674 | |
| | | | | |
| | | | | | | | | | | | | | | | | | | | | | |
| | 2.35 | % | | | 0.57 | % | | | 0.16 | % | | | 4.42 | % | | | 34 | % | | $ | 17,904 | |
| | 2.60 | % | | | 0.55 | % | | | 0.19 | % | | | 8.16 | % | | | 37 | % | | $ | 17,264 | |
| | 2.72 | % | | | 0.51 | % | | | 0.19 | % | | | 3.52 | % | | | 45 | % | | $ | 17,013 | |
| | 1.99 | % | | | 0.44 | % | | | 0.24 | % | | | 2.99 | % | | | 80 | % | | $ | 40,511 | |
| | 1.53 | % | | | 0.42 | % | | | 0.30 | % | | | 3.81 | % | | | 41 | % | | $ | 72,643 | |
| | 1.42 | % | | | 0.43 | % | | | 0.30 | % | | | (1.25 | )% | | | 36 | % | | $ | 243,820 | |
| | | | | |
| | | | | | | | | | | | | | | | | | | | | | |
| | 2.01 | % | | | 0.92 | % | | | 0.51 | % | | | 4.24 | % | | | 34 | % | | $ | 7,086 | |
| | 2.29 | % | | | 0.90 | % | | | 0.53 | % | | | 7.76 | % | | | 37 | % | | $ | 7,029 | |
| | 2.38 | % | | | 0.86 | % | | | 0.54 | % | | | 3.11 | % | | | 45 | % | | $ | 9,597 | |
| | 1.66 | % | | | 0.79 | % | | | 0.59 | % | | | 2.77 | % | | | 80 | % | | $ | 24,351 | |
| | 1.17 | % | | | 0.77 | % | | | 0.65 | % | | | 3.41 | % | | | 41 | % | | $ | 39,234 | |
| | 1.07 | % | | | 0.78 | % | | | 0.65 | % | | | (1.56 | )% | | | 36 | % | | $ | 61,887 | |
The accompanying notes are an integral part of these financial statements.
Wells Fargo Target Date Retirement Funds | 69
Financial highlights
| | | | | | | | | | | | | | | | | | | | | | | | | | | | |
| | | Beginning
net asset
value per
share | | | Net
investment
income | | | Payment
from
affiliate | | | Net realized
and unrealized
gains (losses)
on investments | | | Distributions
from net
investment
income | | | Distributions
from net
realized gains | | | Ending
net asset
value per
share | |
| | | | | | | |
Target 2010 Fund | | | | | | | | | | | | | | | | | | | | | | | | | | | | |
| | | | | | | |
Class A | | | | | | | | | | | | | | | | | | | | | | | | | | | | |
Six months ended August 31, 2020 (unaudited) | | $ | 10.55 | | | | 0.10 | 4 | | | 0.00 | | | | 0.35 | | | | (0.08 | ) | | | 0.00 | | | $ | 10.92 | |
Year ended February 29, 2020 | | $ | 10.13 | | | | 0.23 | 4 | | | 0.00 | | | | 0.53 | | | | (0.23 | ) | | | (0.11 | ) | | $ | 10.55 | |
Year ended February 28, 2019 | | $ | 10.72 | | | | 0.23 | 4 | | | 0.00 | | | | 0.07 | | | | (0.27 | ) | | | (0.62 | ) | | $ | 10.13 | |
Year ended February 28, 2018 | | $ | 12.41 | | | | 0.19 | | | | 0.00 | | | | 0.22 | | | | (0.04 | ) | | | (2.06 | ) | | $ | 10.72 | |
Year ended February 28, 2017 | | $ | 12.26 | | | | 0.15 | | | | 0.00 | | | | 0.30 | | | | (0.09 | ) | | | (0.21 | ) | | $ | 12.41 | |
Year ended February 29, 2016 | | $ | 13.16 | | | | 0.14 | 4 | | | 0.00 | | | | (0.40 | ) | | | (0.06 | ) | | | (0.58 | ) | | $ | 12.26 | |
| | | | | | | |
Class C | | | | | | | | | | | | | | | | | | | | | | | | | | | | |
Six months ended August 31, 2020 (unaudited) | | $ | 10.67 | | | | 0.06 | 4 | | | 0.00 | | | | 0.37 | | | | (0.04 | ) | | | 0.00 | | | $ | 11.06 | |
Year ended February 29, 2020 | | $ | 10.24 | | | | 0.15 | 4 | | | 0.00 | | | | 0.54 | | | | (0.15 | ) | | | (0.11 | ) | | $ | 10.67 | |
Year ended February 28, 2019 | | $ | 10.82 | | | | 0.16 | 4 | | | 0.00 | | | | 0.06 | | | | (0.18 | ) | | | (0.62 | ) | | $ | 10.24 | |
Year ended February 28, 2018 | | $ | 12.56 | | | | 0.13 | | | | 0.00 | | | | 0.19 | | | | 0.00 | | | | (2.06 | ) | | $ | 10.82 | |
Year ended February 28, 2017 | | $ | 12.42 | | | | 0.07 | | | | 0.00 | | | | 0.30 | | | | (0.02 | ) | | | (0.21 | ) | | $ | 12.56 | |
Year ended February 29, 2016 | | $ | 13.36 | | | | 0.04 | 4 | | | 0.00 | | | | (0.40 | ) | | | 0.00 | | | | (0.58 | ) | | $ | 12.42 | |
| | | | | | | |
Class R | | | | | | | | | | | | | | | | | | | | | | | | | | | | |
Six months ended August 31, 2020 (unaudited) | | $ | 10.46 | | | | 0.08 | | | | 0.10 | | | | 0.37 | | | | (0.07 | ) | | | 0.00 | | | $ | 10.94 | |
Year ended February 29, 2020 | | $ | 10.04 | | | | 0.20 | | | | 0.00 | | | | 0.53 | | | | (0.20 | ) | | | (0.11 | ) | | $ | 10.46 | |
Year ended February 28, 2019 | | $ | 10.63 | | | | 0.20 | | | | 0.00 | | | | 0.07 | | | | (0.24 | ) | | | (0.62 | ) | | $ | 10.04 | |
Year ended February 28, 2018 | | $ | 12.33 | | | | 0.16 | | | | 0.00 | | | | 0.22 | | | | (0.02 | ) | | | (2.06 | ) | | $ | 10.63 | |
Year ended February 28, 2017 | | $ | 12.19 | | | | 0.11 | | | | 0.00 | | | | 0.31 | | | | (0.07 | ) | | | (0.21 | ) | | $ | 12.33 | |
Year ended February 29, 2016 | | $ | 13.11 | | | | 0.11 | 4 | | | 0.00 | | | | (0.41 | ) | | | (0.04 | ) | | | (0.58 | ) | | $ | 12.19 | |
| | | | | | | |
Class R4 | | | | | | | | | | | | | | | | | | | | | | | | | | | | |
Six months ended August 31, 2020 (unaudited) | | $ | 10.70 | | | | 0.12 | 4 | | | 0.00 | | | | 0.36 | | | | (0.10 | ) | | | 0.00 | | | $ | 11.08 | |
Year ended February 29, 2020 | | $ | 10.27 | | | | 0.27 | 4 | | | 0.00 | | | | 0.54 | | | | (0.27 | ) | | | (0.11 | ) | | $ | 10.70 | |
Year ended February 28, 2019 | | $ | 10.86 | | | | 0.29 | 4 | | | 0.00 | | | | 0.04 | | | | (0.30 | ) | | | (0.62 | ) | | $ | 10.27 | |
Year ended February 28, 2018 | | $ | 12.55 | | | | 0.23 | 4 | | | 0.00 | | | | 0.22 | | | | (0.08 | ) | | | (2.06 | ) | | $ | 10.86 | |
Year ended February 28, 2017 | | $ | 12.38 | | | | 0.19 | 4 | | | 0.00 | | | | 0.32 | | | | (0.13 | ) | | | (0.21 | ) | | $ | 12.55 | |
Year ended February 29, 2016 | | $ | 13.30 | | | | 0.18 | 4 | | | 0.00 | | | | (0.41 | ) | | | (0.11 | ) | | | (0.58 | ) | | $ | 12.38 | |
| | | | | | | |
Class R6 | | | | | | | | | | | | | | | | | | | | | | | | | | | | |
Six months ended August 31, 2020 (unaudited) | | $ | 10.68 | | | | 0.13 | | | | 0.00 | | | | 0.36 | | | | (0.11 | ) | | | 0.00 | | | $ | 11.06 | |
Year ended February 29, 2020 | | $ | 10.25 | | | | 0.28 | 4 | | | 0.00 | | | | 0.54 | | | | (0.28 | ) | | | (0.11 | ) | | $ | 10.68 | |
Year ended February 28, 2019 | | $ | 10.84 | | | | 0.29 | 4 | | | 0.00 | | | | 0.06 | | | | (0.32 | ) | | | (0.62 | ) | | $ | 10.25 | |
Year ended February 28, 2018 | | $ | 12.54 | | | | 0.25 | 4 | | | 0.00 | | | | 0.22 | | | | (0.11 | ) | | | (2.06 | ) | | $ | 10.84 | |
Year ended February 28, 2017 | | $ | 12.37 | | | | 0.21 | 4 | | | 0.00 | | | | 0.32 | | | | (0.15 | ) | | | (0.21 | ) | | $ | 12.54 | |
Year ended February 29, 2016 | | $ | 13.29 | | | | 0.19 | | | | 0.00 | | | | (0.40 | ) | | | (0.13 | ) | | | (0.58 | ) | | $ | 12.37 | |
| | | | | | | |
Administrator Class | | | | | | | | | | | | | | | | | | | | | | | | | | | | |
Six months ended August 31, 2020 (unaudited) | | $ | 10.71 | | | | 0.11 | 4 | | | 0.00 | | | | 0.36 | | | | (0.09 | ) | | | 0.00 | | | $ | 11.09 | |
Year ended February 29, 2020 | | $ | 10.27 | | | | 0.24 | 4 | | | 0.00 | | | | 0.55 | | | | (0.24 | ) | | | (0.11 | ) | | $ | 10.71 | |
Year ended February 28, 2019 | | $ | 10.86 | | | | 0.26 | 4 | | | 0.00 | | | | 0.05 | | | | (0.28 | ) | | | (0.62 | ) | | $ | 10.27 | |
Year ended February 28, 2018 | | $ | 12.55 | | | | 0.21 | 4 | | | 0.00 | | | | 0.21 | | | | (0.05 | ) | | | (2.06 | ) | | $ | 10.86 | |
Year ended February 28, 2017 | | $ | 12.39 | | | | 0.16 | | | | 0.00 | | | | 0.31 | | | | (0.10 | ) | | | (0.21 | ) | | $ | 12.55 | |
Year ended February 29, 2016 | | $ | 13.29 | | | | 0.16 | 4 | | | 0.00 | | | | (0.41 | ) | | | (0.07 | ) | | | (0.58 | ) | | $ | 12.39 | |
| 1 | Ratios include net expenses allocated from the affiliated Master Portfolios which were as follows: |
| | | | | | | | | | | | | | | | | | | | | | | | |
| | | Six months ended August 31, 2020 (unaudited) | | | Year ended February 29, 2020 | | | Year ended February 28 | | | Year ended February 29, 2016 | |
| | | 2019 | | | 2018 | | | 2017 | |
Class A | | | 0.10 | % | | | 0.12 | % | | | 0.13 | % | | | 0.15 | % | | | 0.16 | % | | | 0.15 | % |
Class C | | | 0.10 | | | | 0.12 | | | | 0.13 | | | | 0.15 | | | | 0.16 | | | | 0.15 | |
Class R | | | 0.04 | | | | 0.20 | | | | 0.13 | | | | 0.16 | | | | 0.16 | | | | 0.15 | |
Class R4 | | | 0.10 | | | | 0.12 | | | | 0.13 | | | | 0.15 | | | | 0.16 | | | | 0.15 | |
Class R6 | | | 0.10 | | | | 0.12 | | | | 0.13 | | | | 0.15 | | | | 0.16 | | | | 0.15 | |
Administrator Class | | | 0.10 | | | | 0.12 | | | | 0.13 | | | | 0.15 | | | | 0.16 | | | | 0.15 | |
| 2 | Total return calculations do not include any sales charges. Returns for periods of less than one year are not annualized. |
| 3 | Portfolio turnover rate is calculated by multiplying the Fund’s ownership percentage in each respective affiliated Master Portfolio by the corresponding affiliated Master Portfolio’s purchases and sales. |
| 4 | Calculated based upon average shares outstanding |
| 5 | During the six months ended August 31, 2020, the Fund received a payment from an affiliate which had an impact of 0.96% on the total return. See Note 4 in the Notes to Financial Statements for additional information. |
The accompanying notes are an integral part of these financial statements.
70 | Wells Fargo Target Date Retirement Funds
Financial highlights
| | | | | | | | | | | | | | | | | | | | | | |
| Ratio to average net assets (annualized) | | | Total
return2 | | | Portfolio
turnover
rate3 | | | Net assets at
end of period
(000s omitted) | |
Net investment
income1 | | | Gross
expenses1 | | | Net
expenses1 | |
| | | | | |
| | | | | | | | | | | | | | | | | | | | | | | |
| | | | | |
| | | | | | | | | | | | | | | | | | | | | | |
| | 1.90 | % | | | 1.04 | % | | | 0.61 | % | | | 4.38 | % | | | 35 | % | | $ | 32,318 | |
| | 2.15 | % | | | 1.00 | % | | | 0.63 | % | | | 7.57 | % | | | 37 | % | | $ | 33,505 | |
| | 2.20 | % | | | 0.91 | % | | | 0.65 | % | | | 3.03 | % | | | 45 | % | | $ | 35,777 | |
| | 1.58 | % | | | 0.87 | % | | | 0.70 | % | | | 3.04 | % | | | 79 | % | | $ | 51,677 | |
| | 1.14 | % | | | 0.87 | % | | | 0.78 | % | | | 3.71 | % | | | 41 | % | | $ | 60,237 | |
| | 1.11 | % | | | 0.88 | % | | | 0.79 | % | | | (1.99 | )% | | | 36 | % | | $ | 67,826 | |
| | | | | |
| | | | | | | | | | | | | | | | | | | | | | |
| | 1.16 | % | | | 1.77 | % | | | 1.37 | % | | | 4.06 | % | | | 35 | % | | $ | 393 | |
| | 1.40 | % | | | 1.75 | % | | | 1.39 | % | | | 6.70 | % | | | 37 | % | | $ | 576 | |
| | 1.47 | % | | | 1.65 | % | | | 1.40 | % | | | 2.25 | % | | | 45 | % | | $ | 735 | |
| | 0.83 | % | | | 1.62 | % | | | 1.45 | % | | | 2.25 | % | | | 79 | % | | $ | 1,323 | |
| | 0.39 | % | | | 1.62 | % | | | 1.53 | % | | | 2.96 | % | | | 41 | % | | $ | 1,761 | |
| | 0.34 | % | | | 1.65 | % | | | 1.55 | % | | | (2.69 | )% | | | 36 | % | | $ | 1,984 | |
| | | | | |
| | | | | | | | | | | | | | | | | | | | | | |
| | 1.64 | % | | | 1.01 | % | | | 0.87 | % | | | 5.32 | %5 | | | 35 | % | | $ | 24 | |
| | 1.87 | % | | | 1.24 | % | | | 0.90 | % | | | 7.29 | % | | | 37 | % | | $ | 23 | |
| | 1.94 | % | | | 1.14 | % | | | 0.90 | % | | | 2.82 | % | | | 45 | % | | $ | 22 | |
| | 1.32 | % | | | 1.13 | % | | | 0.96 | % | | | 2.75 | % | | | 79 | % | | $ | 23 | |
| | 0.88 | % | | | 1.14 | % | | | 1.03 | % | | | 3.45 | % | | | 41 | % | | $ | 53 | |
| | 0.84 | % | | | 1.16 | % | | | 1.05 | % | | | (2.27 | )% | | | 36 | % | | $ | 52 | |
| | | | | |
| | | | | | | | | | | | | | | | | | | | | | |
| | 2.25 | % | | | 0.77 | % | | | 0.31 | % | | | 4.58 | % | | | 35 | % | | $ | 855 | |
| | 2.50 | % | | | 0.72 | % | | | 0.34 | % | | | 7.90 | % | | | 37 | % | | $ | 1,155 | |
| | 2.65 | % | | | 0.66 | % | | | 0.34 | % | | | 3.35 | % | | | 45 | % | | $ | 1,825 | |
| | 1.83 | % | | | 0.59 | % | | | 0.41 | % | | | 3.30 | % | | | 79 | % | | $ | 17,218 | |
| | 1.45 | % | | | 0.59 | % | | | 0.47 | % | | | 4.11 | % | | | 41 | % | | $ | 48,885 | |
| | 1.42 | % | | | 0.61 | % | | | 0.47 | % | | | (1.73 | )% | | | 36 | % | | $ | 70,528 | |
| | | | | |
| | | | | | | | | | | | | | | | | | | | | | |
| | 2.35 | % | | | 0.62 | % | | | 0.16 | % | | | 4.64 | % | | | 35 | % | | $ | 14,414 | |
| | 2.61 | % | | | 0.57 | % | | | 0.19 | % | | | 8.07 | % | | | 37 | % | | $ | 14,128 | |
| | 2.71 | % | | | 0.48 | % | | | 0.19 | % | | | 3.53 | % | | | 45 | % | | $ | 16,789 | |
| | 2.00 | % | | | 0.44 | % | | | 0.25 | % | | | 3.42 | % | | | 79 | % | | $ | 40,332 | |
| | 1.61 | % | | | 0.44 | % | | | 0.32 | % | | | 4.27 | % | | | 41 | % | | $ | 82,474 | |
| | 1.57 | % | | | 0.45 | % | | | 0.32 | % | | | (1.59 | )% | | | 36 | % | | $ | 200,168 | |
| | | | | |
| | | | | | | | | | | | | | | | | | | | | | |
| | 2.02 | % | | | 0.97 | % | | | 0.51 | % | | | 4.46 | % | | | 35 | % | | $ | 7,470 | |
| | 2.29 | % | | | 0.92 | % | | | 0.54 | % | | | 7.77 | % | | | 37 | % | | $ | 8,332 | |
| | 2.37 | % | | | 0.83 | % | | | 0.54 | % | | | 3.08 | % | | | 45 | % | | $ | 12,382 | |
| | 1.68 | % | | | 0.79 | % | | | 0.59 | % | | | 3.09 | % | | | 79 | % | | $ | 32,634 | |
| | 1.26 | % | | | 0.79 | % | | | 0.67 | % | | | 3.84 | % | | | 41 | % | | $ | 49,565 | |
| | 1.22 | % | | | 0.80 | % | | | 0.67 | % | | | (1.83 | )% | | | 36 | % | | $ | 91,381 | |
The accompanying notes are an integral part of these financial statements.
Wells Fargo Target Date Retirement Funds | 71
Financial highlights
| | | | | | | | | | | | | | | | | | | | | | | | | | | | |
| | | Beginning
net asset
value per
share | | | Net
investment
income | | | Payment
from
affiliate | | | Net realized
and unrealized
gains (losses)
on investments | | | Distributions
from net
investment
income | | | Distributions
from net
realized gains | | | Ending
net asset
value per
share | |
| | | | | | | |
Target 2015 Fund | | | | | | | | | | | | | | | | | | | | | | | | | | | | |
| | | | | | | |
Class A | | | | | | | | | | | | | | | | | | | | | | | | | | | | |
Six months ended August 31, 2020 (unaudited) | | $ | 7.17 | | | | 0.06 | | | | 0.00 | | | | 0.27 | | | | (0.06 | ) | | | 0.00 | | | $ | 7.44 | |
Year ended February 29, 2020 | | $ | 7.04 | | | | 0.16 | 4 | | | 0.00 | | | | 0.34 | | | | (0.16 | ) | | | (0.21 | ) | | $ | 7.17 | |
Year ended February 28, 2019 | | $ | 7.88 | | | | 0.16 | | | | 0.00 | | | | 0.06 | | | | (0.17 | ) | | | (0.89 | ) | | $ | 7.04 | |
Year ended February 28, 2018 | | $ | 10.12 | | | | 0.15 | | | | 0.00 | | | | 0.27 | | | | (0.02 | ) | | | (2.64 | ) | | $ | 7.88 | |
Year ended February 28, 2017 | | $ | 9.87 | | | | 0.15 | 4 | | | 0.00 | | | | 0.37 | | | | (0.10 | ) | | | (0.17 | ) | | $ | 10.12 | |
Year ended February 29, 2016 | | $ | 10.40 | | | | 0.15 | | | | 0.00 | | | | (0.41 | ) | | | (0.09 | ) | | | (0.18 | ) | | $ | 9.87 | |
| | | | | | | |
Class R | | | | | | | | | | | | | | | | | | | | | | | | | | | | |
Six months ended August 31, 2020 (unaudited) | | $ | 7.33 | | | | 0.06 | | | | 0.09 | | | | 0.27 | | | | (0.05 | ) | | | 0.00 | | | $ | 7.70 | |
Year ended February 29, 2020 | | $ | 7.19 | | | | 0.14 | | | | 0.00 | | | | 0.35 | | | | (0.14 | ) | | | (0.21 | ) | | $ | 7.33 | |
Year ended February 28, 2019 | | $ | 8.02 | | | | 0.15 | | | | 0.00 | | | | 0.05 | | | | (0.14 | ) | | | (0.89 | ) | | $ | 7.19 | |
Year ended February 28, 2018 | | $ | 10.26 | | | | 0.13 | | | | 0.00 | | | | 0.27 | | | | (0.00 | )6 | | | (2.64 | ) | | $ | 8.02 | |
Year ended February 28, 2017 | | $ | 10.01 | | | | 0.13 | | | | 0.00 | | | | 0.37 | | | | (0.08 | ) | | | (0.17 | ) | | $ | 10.26 | |
Year ended February 29, 2016 | | $ | 10.55 | | | | 0.13 | | | | 0.00 | | | | (0.42 | ) | | | (0.07 | ) | | | (0.18 | ) | | $ | 10.01 | |
| | | | | | | |
Class R4 | | | | | | | | | | | | | | | | | | | | | | | | | | | | |
Six months ended August 31, 2020 (unaudited) | | $ | 7.24 | | | | 0.08 | 4 | | | 0.00 | | | | 0.26 | | | | (0.07 | ) | | | 0.00 | | | $ | 7.51 | |
Year ended February 29, 2020 | | $ | 7.10 | | | | 0.18 | 4 | | | 0.00 | | | | 0.35 | | | | (0.18 | ) | | | (0.21 | ) | | $ | 7.24 | |
Year ended February 28, 2019 | | $ | 7.94 | | | | 0.21 | 4 | | | 0.00 | | | | 0.03 | | | | (0.19 | ) | | | (0.89 | ) | | $ | 7.10 | |
Year ended February 28, 2018 | | $ | 10.16 | | | | 0.19 | 4 | | | 0.00 | | | | 0.26 | | | | (0.03 | ) | | | (2.64 | ) | | $ | 7.94 | |
Year ended February 28, 2017 | | $ | 9.91 | | | | 0.18 | 4 | | | 0.00 | | | | 0.37 | | | | (0.13 | ) | | | (0.17 | ) | | $ | 10.16 | |
Year ended February 29, 2016 | | $ | 10.43 | | | | 0.18 | | | | 0.00 | | | | (0.41 | ) | | | (0.11 | ) | | | (0.18 | ) | | $ | 9.91 | |
| | | | | | | |
Class R6 | | | | | | | | | | | | | | | | | | | | | | | | | | | | |
Six months ended August 31, 2020 (unaudited) | | $ | 7.24 | | | | 0.08 | 4 | | | 0.00 | | | | 0.26 | | | | (0.07 | ) | | | 0.00 | | | $ | 7.51 | |
Year ended February 29, 2020 | | $ | 7.10 | | | | 0.19 | 4 | | | 0.00 | | | | 0.35 | | | | (0.19 | ) | | | (0.21 | ) | | $ | 7.24 | |
Year ended February 28, 2019 | | $ | 7.94 | | | | 0.21 | 4 | | | 0.00 | | | | 0.04 | | | | (0.20 | ) | | | (0.89 | ) | | $ | 7.10 | |
Year ended February 28, 2018 | | $ | 10.15 | | | | 0.25 | | | | 0.00 | | | | 0.22 | | | | (0.04 | ) | | | (2.64 | ) | | $ | 7.94 | |
Year ended February 28, 2017 | | $ | 9.90 | | | | 0.20 | 4 | | | 0.00 | | | | 0.37 | | | | (0.15 | ) | | | (0.17 | ) | | $ | 10.15 | |
Year ended February 29, 2016 | | $ | 10.42 | | | | 0.20 | | | | 0.00 | | | | (0.42 | ) | | | (0.12 | ) | | | (0.18 | ) | | $ | 9.90 | |
| | | | | | | |
Administrator Class | | | | | | | | | | | | | | | | | | | | | | | | | | | | |
Six months ended August 31, 2020 (unaudited) | | $ | 7.38 | | | | 0.07 | 4 | | | 0.00 | | | | 0.28 | | | | (0.06 | ) | | | 0.00 | | | $ | 7.67 | |
Year ended February 29, 2020 | | $ | 7.24 | | | | 0.17 | 4 | | | 0.00 | | | | 0.35 | | | | (0.17 | ) | | | (0.21 | ) | | $ | 7.38 | |
Year ended February 28, 2019 | | $ | 8.07 | | | | 0.19 | 4 | | | 0.00 | | | | 0.04 | | | | (0.17 | ) | | | (0.89 | ) | | $ | 7.24 | |
Year ended February 28, 2018 | | $ | 10.29 | | | | 0.18 | 4 | | | 0.00 | | | | 0.26 | | | | (0.02 | ) | | | (2.64 | ) | | $ | 8.07 | |
Year ended February 28, 2017 | | $ | 10.02 | | | | 0.17 | 4 | | | 0.00 | | | | 0.38 | | | | (0.11 | ) | | | (0.17 | ) | | $ | 10.29 | |
Year ended February 29, 2016 | | $ | 10.55 | | | | 0.17 | | | | 0.00 | | | | (0.43 | ) | | | (0.09 | ) | | | (0.18 | ) | | $ | 10.02 | |
| 1 | Ratios include net expenses allocated from the affiliated Master Portfolios which were as follows: |
| | | | | | | | | | | | | | | | | | | | | | | | |
| | | Six months ended August 31, 2020 (unaudited) | | | Year ended
February 29, 2020 | | | Year ended February 28 | | | Year ended February 29, 2016 | |
| | | 2019 | | | 2018 | | | 2017 | |
Class A | | | 0.10 | % | | | 0.12 | % | | | 0.14 | % | | | 0.16 | % | | | 0.16 | % | | | 0.16 | % |
Class R | | | 0.05 | | | | 0.19 | | | | 0.12 | | | | 0.17 | | | | 0.16 | | | | 0.16 | |
Class R4 | | | 0.11 | | | | 0.12 | | | | 0.14 | | | | 0.16 | | | | 0.16 | | | | 0.16 | |
Class R6 | | | 0.10 | | | | 0.12 | | | | 0.14 | | | | 0.16 | | | | 0.16 | | | | 0.16 | |
Administrator Class | | | 0.10 | | | | 0.12 | | | | 0.14 | | | | 0.16 | | | | 0.16 | | | | 0.16 | |
| 2 | Total return calculations do not include any sales charges. Returns for periods of less than one year are not annualized. |
| 3 | Portfolio turnover rate is calculated by multiplying the Fund’s ownership percentage in each respective affiliated Master Portfolio by the corresponding affiliated Master Portfolio’s purchases and sales. |
| 4 | Calculated based upon average shares outstanding |
| 5 | During the six months ended August 31, 2020, the Fund received a payment from an affiliate which had an impact of 1.24% on the total return. See Note 4 in the Notes to Financial Statements for additional information. |
| 6 | Amount is less than $0.005. |
The accompanying notes are an integral part of these financial statements.
72 | Wells Fargo Target Date Retirement Funds
Financial highlights
| | | | | | | | | | | | | | | | | | | | | | |
| Ratio to average net assets (annualized) | | | Total
return2 | | | Portfolio
turnover
rate3 | | | Net assets at
end of period
(000s omitted) | |
Net investment
income1 | | | Gross
expenses1 | | | Net
expenses1 | |
| | | | | |
| | | | | | | | | | | | | | | | | | | | | | | |
| | | | | |
| | | | | | | | | | | | | | | | | | | | | | |
| | 1.90 | % | | | 1.01 | % | | | 0.62 | % | | | 4.64 | % | | | 37 | % | | $ | 32,212 | |
| | 2.13 | % | | | 0.96 | % | | | 0.62 | % | | | 7.18 | % | | | 36 | % | | $ | 32,650 | |
| | 2.16 | % | | | 0.90 | % | | | 0.65 | % | | | 3.17 | % | | | 44 | % | | $ | 36,236 | |
| | 1.65 | % | | | 0.86 | % | | | 0.71 | % | | | 3.72 | % | | | 76 | % | | $ | 42,542 | |
| | 1.43 | % | | | 0.87 | % | | | 0.79 | % | | | 5.30 | % | | | 41 | % | | $ | 54,770 | |
| | 1.55 | % | | | 0.85 | % | | | 0.79 | % | | | (2.54 | )% | | | 36 | % | | $ | 74,807 | |
| | | | | |
| | | | | | | | | | | | | | | | | | | | | | |
| | 1.65 | % | | | 0.97 | % | | | 0.87 | % | | | 5.76 | %5 | | | 37 | % | | $ | 21 | |
| | 1.83 | % | | | 1.19 | % | | | 0.90 | % | | | 6.80 | % | | | 36 | % | | $ | 20 | |
| | 1.91 | % | | | 1.14 | % | | | 0.90 | % | | | 2.98 | % | | | 44 | % | | $ | 20 | |
| | 1.41 | % | | | 1.12 | % | | | 0.96 | % | | | 3.52 | % | | | 76 | % | | $ | 22 | |
| | 1.18 | % | | | 1.12 | % | | | 1.04 | % | | | 4.99 | % | | | 41 | % | | $ | 37 | |
| | 1.25 | % | | | 1.14 | % | | | 1.06 | % | | | (2.78 | )% | | | 36 | % | | $ | 42 | |
| | | | | |
| | | | | | | | | | | | | | | | | | | | | | |
| | 2.34 | % | | | 0.73 | % | | | 0.31 | % | | | 4.82 | % | | | 37 | % | | $ | 2,450 | |
| | 2.42 | % | | | 0.67 | % | | | 0.34 | % | | | 7.57 | % | | | 36 | % | | $ | 5,853 | |
| | 2.62 | % | | | 0.60 | % | | | 0.34 | % | | | 3.50 | % | | | 44 | % | | $ | 7,352 | |
| | 1.91 | % | | | 0.59 | % | | | 0.41 | % | | | 4.05 | % | | | 76 | % | | $ | 43,346 | |
| | 1.73 | % | | | 0.59 | % | | | 0.48 | % | | | 5.57 | % | | | 41 | % | | $ | 105,773 | |
| | 1.83 | % | | | 0.59 | % | | | 0.48 | % | | | (2.22 | )% | | | 36 | % | | $ | 127,503 | |
| | | | | |
| | | | | | | | | | | | | | | | | | | | | | |
| | 2.37 | % | | | 0.58 | % | | | 0.16 | % | | | 4.83 | % | | | 37 | % | | $ | 17,738 | |
| | 2.62 | % | | | 0.52 | % | | | 0.19 | % | | | 7.74 | % | | | 36 | % | | $ | 18,725 | |
| | 2.67 | % | | | 0.46 | % | | | 0.19 | % | | | 3.65 | % | | | 44 | % | | $ | 31,174 | |
| | 2.08 | % | | | 0.44 | % | | | 0.26 | % | | | 4.27 | % | | | 76 | % | | $ | 61,265 | |
| | 1.92 | % | | | 0.43 | % | | | 0.33 | % | | | 5.74 | % | | | 41 | % | | $ | 125,438 | |
| | 1.97 | % | | | 0.44 | % | | | 0.33 | % | | | (2.12 | )% | | | 36 | % | | $ | 367,041 | |
| | | | | |
| | | | | | | | | | | | | | | | | | | | | | |
| | 2.01 | % | | | 0.93 | % | | | 0.51 | % | | | 4.84 | % | | | 37 | % | | $ | 5,165 | |
| | 2.24 | % | | | 0.87 | % | | | 0.54 | % | | | 7.20 | % | | | 36 | % | | $ | 5,345 | |
| | 2.33 | % | | | 0.81 | % | | | 0.54 | % | | | 3.33 | % | | | 44 | % | | $ | 6,821 | |
| | 1.76 | % | | | 0.77 | % | | | 0.60 | % | | | 3.89 | % | | | 76 | % | | $ | 15,886 | |
| | 1.59 | % | | | 0.78 | % | | | 0.68 | % | | | 5.52 | % | | | 41 | % | | $ | 21,910 | |
| | 1.62 | % | | | 0.78 | % | | | 0.68 | % | | | (2.45 | )% | | | 36 | % | | $ | 122,329 | |
The accompanying notes are an integral part of these financial statements.
Wells Fargo Target Date Retirement Funds | 73
Financial highlights
| | | | | | | | | | | | | | | | | | | | | | | | | | | | |
| | | Beginning
net asset
value per
share | | | Net
investment
income | | | Payment
from
affiliate | | | Net realized
and unrealized
gains (losses)
on investments | | | Distributions
from net
investment
income | | | Distributions
from net
realized gains | | | Ending
net asset
value per
share | |
| | | | | | | |
Target 2020 Fund | | | | | | | | | | | | | | | | | | | | | | | | | | | | |
| | | | | | | |
Class A | | | | | | | | | | | | | | | | | | | | | | | | | | | | |
Six months ended August 31, 2020 (unaudited) | | $ | 11.98 | | | | 0.11 | 4 | | | 0.00 | 5 | | | 0.49 | | | | 0.00 | | | | 0.00 | | | $ | 12.58 | |
Year ended February 29, 2020 | | $ | 11.64 | | | | 0.25 | 4 | | | 0.00 | | | | 0.51 | | | | (0.27 | ) | | | (0.15 | ) | | $ | 11.98 | |
Year ended February 28, 2019 | | $ | 12.55 | | | | 0.26 | | | | 0.00 | | | | 0.06 | | | | (0.41 | ) | | | (0.82 | ) | | $ | 11.64 | |
Year ended February 28, 2018 | | $ | 14.87 | | | | 0.24 | | | | 0.00 | | | | 0.61 | | | | 0.00 | | | | (3.17 | ) | | $ | 12.55 | |
Year ended February 28, 2017 | | $ | 14.19 | | | | 0.21 | | | | 0.00 | | | | 0.85 | | | | (0.17 | ) | | | (0.21 | ) | | $ | 14.87 | |
Year ended February 29, 2016 | | $ | 15.24 | | | | 0.22 | 4 | | | 0.00 | | | | (0.81 | ) | | | (0.10 | ) | | | (0.36 | ) | | $ | 14.19 | |
| | | | | | | |
Class C | | | | | | | | | | | | | | | | | | | | | | | | | | | | |
Six months ended August 31, 2020 (unaudited) | | $ | 11.75 | | | | 0.07 | 4 | | | 0.00 | | | | 0.47 | | | | 0.00 | | | | 0.00 | | | $ | 12.29 | |
Year ended February 29, 2020 | | $ | 11.41 | | | | 0.16 | 4 | | | 0.00 | | | | 0.50 | | | | (0.17 | ) | | | (0.15 | ) | | $ | 11.75 | |
Year ended February 28, 2019 | | $ | 12.31 | | | | 0.17 | 4 | | | 0.00 | | | | 0.06 | | | | (0.31 | ) | | | (0.82 | ) | | $ | 11.41 | |
Year ended February 28, 2018 | | $ | 14.75 | | | | 0.13 | | | | 0.00 | | | | 0.60 | | | | 0.00 | | | | (3.17 | ) | | $ | 12.31 | |
Year ended February 28, 2017 | | $ | 14.10 | | | | 0.10 | | | | 0.00 | | | | 0.84 | | | | (0.08 | ) | | | (0.21 | ) | | $ | 14.75 | |
Year ended February 29, 2016 | | $ | 15.16 | | | | 0.11 | 4 | | | 0.00 | | | | (0.79 | ) | | | (0.02 | ) | | | (0.36 | ) | | $ | 14.10 | |
| | | | | | | |
Class R | | | | | | | | | | | | | | | | | | | | | | | | | | | | |
Six months ended August 31, 2020 (unaudited) | | $ | 11.86 | | | | 0.10 | 4 | | | 0.04 | | | | 0.47 | | | | 0.00 | | | | 0.00 | | | $ | 12.47 | |
Year ended February 29, 2020 | | $ | 11.53 | | | | 0.21 | 4 | | | 0.00 | | | | 0.52 | | | | (0.25 | ) | | | (0.15 | ) | | $ | 11.86 | |
Year ended February 28, 2019 | | $ | 12.46 | | | | 0.22 | 4 | | | 0.00 | | | | 0.08 | | | | (0.41 | ) | | | (0.82 | ) | | $ | 11.53 | |
Year ended February 28, 2018 | | $ | 14.81 | | | | 0.22 | 4 | | | 0.00 | | | | 0.60 | | | | 0.00 | | | | (3.17 | ) | | $ | 12.46 | |
Year ended February 28, 2017 | | $ | 14.14 | | | | 0.18 | | | | 0.00 | | | | 0.84 | | | | (0.14 | ) | | | (0.21 | ) | | $ | 14.81 | |
Year ended February 29, 2016 | | $ | 15.18 | | | | 0.17 | 4 | | | 0.00 | | | | (0.79 | ) | | | (0.06 | ) | | | (0.36 | ) | | $ | 14.14 | |
| | | | | | | |
Class R4 | | | | | | | | | | | | | | | | | | | | | | | | | | | | |
Six months ended August 31, 2020 (unaudited) | | $ | 12.36 | | | | 0.14 | 4 | | | 0.00 | | | | 0.49 | | | | 0.00 | | | | 0.00 | | | $ | 12.99 | |
Year ended February 29, 2020 | | $ | 11.98 | | | | 0.30 | 4 | | | 0.00 | | | | 0.54 | | | | (0.31 | ) | | | (0.15 | ) | | $ | 12.36 | |
Year ended February 28, 2019 | | $ | 12.89 | | | | 0.33 | 4 | | | 0.00 | | | | 0.04 | | | | (0.46 | ) | | | (0.82 | ) | | $ | 11.98 | |
Year ended February 28, 2018 | | $ | 15.15 | | | | 0.31 | 4 | | | 0.00 | | | | 0.60 | | | | 0.00 | | | | (3.17 | ) | | $ | 12.89 | |
Year ended February 28, 2017 | | $ | 14.44 | | | | 0.27 | 4 | | | 0.00 | | | | 0.86 | | | | (0.21 | ) | | | (0.21 | ) | | $ | 15.15 | |
Year ended February 29, 2016 | | $ | 15.50 | | | | 0.26 | | | | 0.00 | | | | (0.81 | ) | | | (0.15 | ) | | | (0.36 | ) | | $ | 14.44 | |
| | | | | | | |
Class R6 | | | | | | | | | | | | | | | | | | | | | | | | | | | | |
Six months ended August 31, 2020 (unaudited) | | $ | 12.35 | | | | 0.15 | 4 | | | 0.00 | | | | 0.50 | | | | 0.00 | | | | 0.00 | | | $ | 13.00 | |
Year ended February 29, 2020 | | $ | 11.98 | | | | 0.32 | 4 | | | 0.00 | | | | 0.53 | | | | (0.33 | ) | | | (0.15 | ) | | $ | 12.35 | |
Year ended February 28, 2019 | | $ | 12.90 | | | | 0.34 | 4 | | | 0.00 | | | | 0.06 | | | | (0.50 | ) | | | (0.82 | ) | | $ | 11.98 | |
Year ended February 28, 2018 | | $ | 15.14 | | | | 0.33 | 4 | | | 0.00 | | | | 0.61 | | | | (0.01 | ) | | | (3.17 | ) | | $ | 12.90 | |
Year ended February 28, 2017 | | $ | 14.43 | | | | 0.29 | 4 | | | 0.00 | | | | 0.86 | | | | (0.23 | ) | | | (0.21 | ) | | $ | 15.14 | |
Year ended February 29, 2016 | | $ | 15.50 | | | | 0.27 | | | | 0.00 | | | | (0.80 | ) | | | (0.18 | ) | | | (0.36 | ) | | $ | 14.43 | |
| | | | | | | |
Administrator Class | | | | | | | | | | | | | | | | | | | | | | | | | | | | |
Six months ended August 31, 2020 (unaudited) | | $ | 12.27 | | | | 0.12 | 4 | | | 0.00 | | | | 0.50 | | | | 0.00 | | | | 0.00 | | | $ | 12.89 | |
Year ended February 29, 2020 | | $ | 11.90 | | | | 0.27 | 4 | | | 0.00 | | | | 0.53 | | | | (0.28 | ) | | | (0.15 | ) | | $ | 12.27 | |
Year ended February 28, 2019 | | $ | 12.80 | | | | 0.31 | | | | 0.00 | | | | 0.04 | | | | (0.43 | ) | | | (0.82 | ) | | $ | 11.90 | |
Year ended February 28, 2018 | | $ | 15.09 | | | | 0.29 | | | | 0.00 | | | | 0.59 | | | | 0.00 | | | | (3.17 | ) | | $ | 12.80 | |
Year ended February 28, 2017 | | $ | 14.40 | | | | 0.24 | 4 | | | 0.00 | | | | 0.84 | | | | (0.18 | ) | | | (0.21 | ) | | $ | 15.09 | |
Year ended February 29, 2016 | | $ | 15.46 | | | | 0.23 | | | | 0.00 | | | | (0.81 | ) | | | (0.12 | ) | | | (0.36 | ) | | $ | 14.40 | |
| 1 | Ratios include net expenses allocated from the affiliated Master Portfolios which were as follows: |
| | | | | | | | | | | | | | | | | | | | | | | | |
| | | Six months ended August 31, 2020
(unaudited) | | | Year ended February 29, 2020 | | | Year ended February 28 | | | Year ended February 29, 2016 | |
| | | 2019 | | | 2018 | | | 2017 | |
Class A | | | 0.11 | % | | | 0.13 | % | | | 0.14 | % | | | 0.16 | % | | | 0.17 | % | | | 0.16 | % |
Class C | | | 0.11 | | | | 0.13 | | | | 0.14 | | | | 0.16 | | | | 0.17 | | | | 0.16 | |
Class R | | | 0.09 | | | | 0.14 | | | | 0.13 | | | | 0.17 | | | | 0.17 | | | | 0.16 | |
Class R4 | | | 0.11 | | | | 0.13 | | | | 0.14 | | | | 0.17 | | | | 0.17 | | | | 0.16 | |
Class R6 | | | 0.11 | | | | 0.13 | | | | 0.14 | | | | 0.17 | | | | 0.17 | | | | 0.16 | |
Administrator Class | | | 0.11 | | | | 0.13 | | | | 0.14 | | | | 0.17 | | | | 0.17 | | | | 0.16 | |
| 2 | Total return calculations do not include any sales charges. Returns for periods of less than one year are not annualized. |
| 3 | Portfolio turnover rate is calculated by multiplying the Fund’s ownership percentage in each respective affiliated Master Portfolio by the corresponding affiliated Master Portfolio’s purchases and sales. |
| 4 | Calculated based upon average shares outstanding |
| 5 | Amount is less than $0.005 |
| 6 | During the six months ended August 31, 2020, the Fund received a payment from an affiliate that had an impact of less than 0.005% on total return. See Note 4 in the Notes to Financial Statements for additional information. |
| 7 | During the six months ended August 31, 2020, the Fund received a payment from an affiliate which had an impact of 0.33% on the total return. See Note 4 in the Notes to Financial Statements for additional information. |
The accompanying notes are an integral part of these financial statements.
74 | Wells Fargo Target Date Retirement Funds
Financial highlights
| | | | | | | | | | | | | | | | | | | | | | |
| Ratio to average net assets (annualized) | | | Total
return2 | | | Portfolio
turnover
rate3 | | | Net assets at
end of period
(000s omitted) | |
Net investment
income1 | | | Gross
expenses1 | | | Net
expenses1 | |
| | | | | |
| | | | | | | | | | | | | | | | | | | | | | | |
| | | | | |
| | | | | | | | | | | | | | | | | | | | | | |
| | 1.92 | % | | | 0.75 | % | | | 0.62 | % | | | 5.01 | %6 | | | 39 | % | | $ | 125,633 | |
| | 2.08 | % | | | 0.75 | % | | | 0.63 | % | | | 6.53 | % | | | 36 | % | | $ | 132,755 | |
| | 2.14 | % | | | 0.75 | % | | | 0.65 | % | | | 3.12 | % | | | 43 | % | | $ | 147,196 | |
| | 1.74 | % | | | 0.79 | % | | | 0.71 | % | | | 5.40 | % | | | 73 | % | | $ | 199,069 | |
| | 1.44 | % | | | 0.85 | % | | | 0.81 | % | | | 7.53 | % | | | 39 | % | | $ | 218,652 | |
| | 1.49 | % | | | 0.86 | % | | | 0.82 | % | | | (3.86 | )% | | | 34 | % | | $ | 230,667 | |
| | | | | |
| | | | | | | | | | | | | | | | | | | | | | |
| | 1.17 | % | | | 1.49 | % | | | 1.37 | % | | | 4.60 | % | | | 39 | % | | $ | 2,660 | |
| | 1.33 | % | | | 1.50 | % | | | 1.39 | % | | | 5.79 | % | | | 36 | % | | $ | 2,785 | |
| | 1.41 | % | | | 1.50 | % | | | 1.40 | % | | | 2.28 | % | | | 43 | % | | $ | 3,377 | |
| | 0.99 | % | | | 1.54 | % | | | 1.46 | % | | | 4.60 | % | | | 73 | % | | $ | 6,219 | |
| | 0.69 | % | | | 1.60 | % | | | 1.56 | % | | | 6.71 | % | | | 39 | % | | $ | 6,713 | |
| | 0.74 | % | | | 1.62 | % | | | 1.58 | % | | | (4.50 | )% | | | 34 | % | | $ | 6,355 | |
| | | | | |
| | | | | | | | | | | | | | | | | | | | | | |
| | 1.66 | % | | | 0.93 | % | | | 0.87 | % | | | 5.14 | %7 | | | 39 | % | | $ | 124 | |
| | 1.76 | % | | | 0.99 | % | | | 0.90 | % | | | 6.32 | % | | | 36 | % | | $ | 119 | |
| | 1.84 | % | | | 1.00 | % | | | 0.90 | % | | | 2.84 | % | | | 43 | % | | $ | 86 | |
| | 1.51 | % | | | 1.06 | % | | | 0.98 | % | | | 5.20 | % | | | 73 | % | | $ | 66 | |
| | 1.21 | % | | | 1.10 | % | | | 1.06 | % | | | 7.27 | % | | | 39 | % | | $ | 321 | |
| | 1.25 | % | | | 1.14 | % | | | 1.08 | % | | | (4.08 | )% | | | 34 | % | | $ | 409 | |
| | | | | |
| | | | | | | | | | | | | | | | | | | | | | |
| | 2.32 | % | | | 0.47 | % | | | 0.31 | % | | | 5.10 | % | | | 39 | % | | $ | 16,234 | |
| | 2.39 | % | | | 0.47 | % | | | 0.34 | % | | | 6.99 | % | | | 36 | % | | $ | 31,139 | |
| | 2.54 | % | | | 0.47 | % | | | 0.34 | % | | | 3.36 | % | | | 43 | % | | $ | 38,539 | |
| | 2.05 | % | | | 0.53 | % | | | 0.42 | % | | | 5.70 | % | | | 73 | % | | $ | 130,172 | |
| | 1.76 | % | | | 0.56 | % | | | 0.50 | % | | | 7.89 | % | | | 39 | % | | $ | 357,823 | |
| | 1.82 | % | | | 0.58 | % | | | 0.50 | % | | | (3.52 | )% | | | 34 | % | | $ | 408,501 | |
| | | | | |
| | | | | | | | | | | | | | | | | | | | | | |
| | 2.38 | % | | | 0.32 | % | | | 0.16 | % | | | 5.26 | % | | | 39 | % | | $ | 130,779 | |
| | 2.52 | % | | | 0.32 | % | | | 0.19 | % | | | 7.06 | % | | | 36 | % | | $ | 147,590 | |
| | 2.66 | % | | | 0.32 | % | | | 0.19 | % | | | 3.58 | % | | | 43 | % | | $ | 154,089 | |
| | 2.20 | % | | | 0.37 | % | | | 0.26 | % | | | 5.89 | % | | | 73 | % | | $ | 400,206 | |
| | 1.92 | % | | | 0.41 | % | | | 0.35 | % | | | 8.04 | % | | | 39 | % | | $ | 645,237 | |
| | 1.97 | % | | | 0.43 | % | | | 0.35 | % | | | (3.42 | )% | | | 34 | % | | $ | 1,116,419 | |
| | | | | |
| | | | | | | | | | | | | | | | | | | | | | |
| | 2.03 | % | | | 0.67 | % | | | 0.51 | % | | | 5.05 | % | | | 39 | % | | $ | 48,017 | |
| | 2.18 | % | | | 0.67 | % | | | 0.54 | % | | | 6.73 | % | | | 36 | % | | $ | 54,435 | |
| | 2.28 | % | | | 0.67 | % | | | 0.54 | % | | | 3.18 | % | | | 43 | % | | $ | 63,684 | |
| | 1.85 | % | | | 0.72 | % | | | 0.61 | % | | | 5.51 | % | | | 73 | % | | $ | 111,716 | |
| | 1.60 | % | | | 0.76 | % | | | 0.70 | % | | | 7.58 | % | | | 39 | % | | $ | 197,835 | |
| | 1.62 | % | | | 0.77 | % | | | 0.70 | % | | | (3.72 | )% | | | 34 | % | | $ | 526,327 | |
The accompanying notes are an integral part of these financial statements.
Wells Fargo Target Date Retirement Funds | 75
Financial highlights
| | | | | | | | | | | | | | | | | | | | | | | | | | | | |
| | | Beginning
net asset
value per
share | | | Net
investment
income | | | Payment
from
affiliate | | | Net realized
and unrealized
gains (losses)
on investments | | | Distributions
from net
investment
income | | | Distributions
from net
realized gains | | | Ending
net asset
value per
share | |
| | | | | | | |
Target 2025 Fund | | | | | | | | | | | | | | | | | | | | | | | | | | | | |
| | | | | | | |
Class A | | | | | | | | | | | | | | | | | | | | | | | | | | | | |
Six months ended August 31, 2020 (unaudited) | | $ | 5.57 | | | | 0.05 | | | | 0.00 | 4 | | | 0.28 | | | | 0.00 | | | | 0.00 | | | $ | 5.90 | |
Year ended February 29, 2020 | | $ | 5.57 | | | | 0.12 | | | | 0.00 | | | | 0.21 | | | | (0.13 | ) | | | (0.20 | ) | | $ | 5.57 | |
Year ended February 28, 2019 | | $ | 6.41 | | | | 0.13 | 6 | | | 0.00 | | | | (0.00 | )7 | | | (0.14 | ) | | | (0.83 | ) | | $ | 5.57 | |
Year ended February 28, 2018 | | $ | 10.48 | | | | 0.17 | 6 | | | 0.00 | | | | 0.63 | | | | (0.03 | ) | | | (4.84 | ) | | $ | 6.41 | |
Year ended February 28, 2017 | | $ | 9.77 | | | | 0.13 | | | | 0.00 | | | | 0.90 | | | | (0.15 | ) | | | (0.17 | ) | | $ | 10.48 | |
Year ended February 29, 2016 | | $ | 10.69 | | | | 0.14 | 6 | | | 0.00 | | | | (0.73 | ) | | | (0.08 | ) | | | (0.25 | ) | | $ | 9.77 | |
| | | | | | | |
Class R | | | | | | | | | | | | | | | | | | | | | | | | | | | | |
Six months ended August 31, 2020 (unaudited) | | $ | 5.49 | | | | 0.05 | 6 | | | 0.03 | | | | 0.27 | | | | 0.00 | | | | 0.00 | | | $ | 5.84 | |
Year ended February 29, 2020 | | $ | 5.50 | | | | 0.10 | 6 | | | 0.00 | | | | 0.20 | | | | (0.11 | ) | | | (0.20 | ) | | $ | 5.49 | |
Year ended February 28, 2019 | | $ | 6.34 | | | | 0.11 | 6 | | | 0.00 | | | | 0.02 | | | | (0.14 | ) | | | (0.83 | ) | | $ | 5.50 | |
Year ended February 28, 2018 | | $ | 10.49 | | | | 0.16 | 6 | | | 0.00 | | | | 0.53 | | | | 0.00 | | | | (4.84 | ) | | $ | 6.34 | |
Year ended February 28, 2017 | | $ | 9.79 | | | | 0.12 | | | | 0.00 | | | | 0.88 | | | | (0.13 | ) | | | (0.17 | ) | | $ | 10.49 | |
Year ended February 29, 2016 | | $ | 10.71 | | | | 0.13 | | | | 0.00 | | | | (0.73 | ) | | | (0.07 | ) | | | (0.25 | ) | | $ | 9.79 | |
| | | | | | | |
Class R4 | | | | | | | | | | | | | | | | | | | | | | | | | | | | |
Six months ended August 31, 2020 (unaudited) | | $ | 5.62 | | | | 0.06 | 6 | | | 0.00 | | | | 0.28 | | | | 0.00 | | | | 0.00 | | | $ | 5.96 | |
Year ended February 29, 2020 | | $ | 5.61 | | | | 0.14 | 6 | | | 0.00 | | | | 0.21 | | | | (0.14 | ) | | | (0.20 | ) | | $ | 5.62 | |
Year ended February 28, 2019 | | $ | 6.45 | | | | 0.16 | 6 | | | 0.00 | | | | (0.01 | ) | | | (0.16 | ) | | | (0.83 | ) | | $ | 5.61 | |
Year ended February 28, 2018 | | $ | 10.52 | | | | 0.20 | | | | 0.00 | | | | 0.63 | | | | (0.06 | ) | | | (4.84 | ) | | $ | 6.45 | |
Year ended February 28, 2017 | | $ | 9.80 | | | | 0.17 | | | | 0.00 | | | | 0.90 | | | | (0.18 | ) | | | (0.17 | ) | | $ | 10.52 | |
Year ended February 29, 2016 | | $ | 10.72 | | | | 0.18 | | | | 0.00 | | | | (0.73 | ) | | | (0.12 | ) | | | (0.25 | ) | | $ | 9.80 | |
| | | | | | | |
Class R6 | | | | | | | | | | | | | | | | | | | | | | | | | | | | |
Six months ended August 31, 2020 (unaudited) | | $ | 5.61 | | | | 0.07 | 6 | | | 0.00 | | | | 0.27 | | | | 0.00 | | | | 0.00 | | | $ | 5.95 | |
Year ended February 29, 2020 | | $ | 5.61 | | | | 0.15 | 6 | | | 0.00 | | | | 0.20 | | | | (0.15 | ) | | | (0.20 | ) | | $ | 5.61 | |
Year ended February 28, 2019 | | $ | 6.44 | | | | 0.16 | 6 | | | 0.00 | | | | 0.01 | | | | (0.17 | ) | | | (0.83 | ) | | $ | 5.61 | |
Year ended February 28, 2018 | | $ | 10.51 | | | | 0.25 | | | | 0.00 | | | | 0.60 | | | | (0.08 | ) | | | (4.84 | ) | | $ | 6.44 | |
Year ended February 28, 2017 | | $ | 9.80 | | | | 0.20 | 6 | | | 0.00 | | | | 0.87 | | | | (0.19 | ) | | | (0.17 | ) | | $ | 10.51 | |
Year ended February 29, 2016 | | $ | 10.71 | | | | 0.20 | | | | 0.00 | | | | (0.73 | ) | | | (0.13 | ) | | | (0.25 | ) | | $ | 9.80 | |
| | | | | | | |
Administrator Class | | | | | | | | | | | | | | | | | | | | | | | | | | | | |
Six months ended August 31, 2020 (unaudited) | | $ | 5.67 | | | | 0.06 | 6 | | | 0.00 | | | | 0.27 | | | | 0.00 | | | | 0.00 | | | $ | 6.00 | |
Year ended February 29, 2020 | | $ | 5.66 | | | | 0.13 | 6 | | | 0.00 | | | | 0.21 | | | | (0.13 | ) | | | (0.20 | ) | | $ | 5.67 | |
Year ended February 28, 2019 | | $ | 6.48 | | | | 0.15 | 6 | | | 0.00 | | | | (0.00 | )7 | | | (0.14 | ) | | | (0.83 | ) | | $ | 5.66 | |
Year ended February 28, 2018 | | $ | 10.55 | | | | 0.19 | | | | 0.00 | | | | 0.62 | | | | (0.04 | ) | | | (4.84 | ) | | $ | 6.48 | |
Year ended February 28, 2017 | | $ | 9.82 | | | | 0.17 | 6 | | | 0.00 | | | | 0.89 | | | | (0.16 | ) | | | (0.17 | ) | | $ | 10.55 | |
Year ended February 29, 2016 | | $ | 10.74 | | | | 0.16 | | | | 0.00 | | | | (0.74 | ) | | | (0.09 | ) | | | (0.25 | ) | | $ | 9.82 | |
| 1 | Ratios include net expenses allocated from the affiliated Master Portfolios which were as follows: |
| | | | | | | | | | | | | | | | | | | | | | | | |
| | | Six months ended February 29, 2020
(unaudited) | | | Year ended February 29, 2020 | | | Year ended February 28 | | | Year ended February 29, 2016 | |
| | | 2019 | | | 2018 | | | 2017 | |
Class A | | | 0.11 | % | | | 0.13 | % | | | 0.15 | % | | | 0.17 | % | | | 0.17 | % | | | 0.16 | % |
Class R | | | 0.07 | | | | 0.15 | | | | 0.13 | | | | 0.18 | | | | 0.17 | | | | 0.16 | |
Class R4 | | | 0.12 | | | | 0.13 | | | | 0.15 | | | | 0.17 | | | | 0.17 | | | | 0.16 | |
Class R6 | | | 0.11 | | | | 0.13 | | | | 0.15 | | | | 0.17 | | | | 0.16 | | | | 0.16 | |
Administrator Class | | | 0.11 | | | | 0.13 | | | | 0.15 | | | | 0.17 | | | | 0.16 | | | | 0.16 | |
| 2 | Total return calculations do not include any sales charges. Returns for periods of less than one year are not annualized. |
| 3 | Portfolio turnover rate is calculated by multiplying the Fund’s ownership percentage in each respective affiliated Master Portfolio by the corresponding affiliated Master Portfolio’s purchases and sales. |
| 4 | Amount is less than $0.005 |
| 5 | During the six months ended August 31, 2020, the Fund received a payment from an affiliate that had an impact of less than 0.005% on total return. See Note 4 in the Notes to Financial Statements for additional information. |
| 6 | Calculated based upon average shares outstanding |
| 7 | Amount is more than $(0.005). |
| 8 | During the six months ended August 31, 2020, the Fund received a payment from an affiliate which had an impact of 0.55% on the total return. See Note 4 in the Notes to Financial Statements for additional information. |
The accompanying notes are an integral part of these financial statements.
76 | Wells Fargo Target Date Retirement Funds
Financial highlights
| | | | | | | | | | | | | | | | | | | | | | |
| Ratio to average net assets (annualized) | | | Total
return2 | | | Portfolio
turnover
rate3 | | | Net assets at
end of period
(000s omitted) | |
Net investment
income1 | | | Gross
expenses1 | | | Net
expenses1 | |
| | | | | |
| | | | | | | | | | | | | | | | | | | | | | | |
| | | | | |
| | | | | | | | | | | | | | | | | | | | | | |
| | 1.95 | % | | | 0.79 | % | | | 0.62 | % | | | 5.92 | %5 | | | 43 | % | | $ | 88,600 | |
| | 2.04 | % | | | 0.77 | % | | | 0.62 | % | | | 5.71 | % | | | 36 | % | | $ | 94,505 | |
| | 2.08 | % | | | 0.78 | % | | | 0.65 | % | | | 2.78 | % | | | 43 | % | | $ | 106,485 | |
| | 1.70 | % | | | 0.81 | % | | | 0.71 | % | | | 7.09 | % | | | 67 | % | | $ | 117,382 | |
| | 1.37 | % | | | 0.84 | % | | | 0.81 | % | | | 10.61 | % | | | 36 | % | | $ | 140,428 | |
| | 1.40 | % | | | 0.84 | % | | | 0.81 | % | | | (5.56 | )% | | | 32 | % | | $ | 175,373 | |
| | | | | |
| | | | | | | | | | | | | | | | | | | | | | |
| | 1.69 | % | | | 0.93 | % | | | 0.87 | % | | | 6.38 | %8 | | | 43 | % | | $ | 69 | |
| | 1.73 | % | | | 1.01 | % | | | 0.89 | % | | | 5.37 | % | | | 36 | % | | $ | 57 | |
| | 1.78 | % | | | 1.02 | % | | | 0.90 | % | | | 2.67 | % | | | 43 | % | | $ | 44 | |
| | 1.53 | % | | | 1.10 | % | | | 1.02 | % | | | 5.94 | % | | | 67 | % | | $ | 29 | |
| | 1.12 | % | | | 1.10 | % | | | 1.06 | % | | | 10.22 | % | | | 36 | % | | $ | 610 | |
| | 1.20 | % | | | 1.13 | % | | | 1.08 | % | | | (5.72 | )% | | | 32 | % | | $ | 830 | |
| | | | | |
| | | | | | | | | | | | | | | | | | | | | | |
| | 2.37 | % | | | 0.51 | % | | | 0.31 | % | | | 6.05 | % | | | 43 | % | | $ | 12,341 | |
| | 2.31 | % | | | 0.49 | % | | | 0.34 | % | | | 6.16 | % | | | 36 | % | | $ | 36,023 | |
| | 2.45 | % | | | 0.50 | % | | | 0.34 | % | | | 3.05 | % | | | 43 | % | | $ | 42,046 | |
| | 2.01 | % | | | 0.55 | % | | | 0.43 | % | | | 7.33 | % | | | 67 | % | | $ | 87,607 | |
| | 1.65 | % | | | 0.57 | % | | | 0.50 | % | | | 10.98 | % | | | 36 | % | | $ | 274,639 | |
| | 1.78 | % | | | 0.58 | % | | | 0.50 | % | | | (5.26 | )% | | | 32 | % | | $ | 279,663 | |
| | | | | |
| | | | | | | | | | | | | | | | | | | | | | |
| | 2.43 | % | | | 0.36 | % | | | 0.16 | % | | | 6.06 | % | | | 43 | % | | $ | 83,983 | |
| | 2.49 | % | | | 0.34 | % | | | 0.19 | % | | | 6.15 | % | | | 36 | % | | $ | 106,756 | |
| | 2.57 | % | | | 0.35 | % | | | 0.19 | % | | | 3.41 | % | | | 43 | % | | $ | 131,314 | |
| | 2.16 | % | | | 0.39 | % | | | 0.26 | % | | | 7.54 | % | | | 67 | % | | $ | 201,812 | |
| | 1.92 | % | | | 0.41 | % | | | 0.35 | % | | | 11.04 | % | | | 36 | % | | $ | 372,101 | |
| | 1.92 | % | | | 0.43 | % | | | 0.35 | % | | | (5.02 | )% | | | 32 | % | | $ | 1,416,984 | |
| | | | | |
| | | | | | | | | | | | | | | | | | | | | | |
| | 2.06 | % | | | 0.71 | % | | | 0.51 | % | | | 5.82 | % | | | 43 | % | | $ | 10,598 | |
| | 2.16 | % | | | 0.69 | % | | | 0.54 | % | | | 5.88 | % | | | 36 | % | | $ | 10,650 | |
| | 2.27 | % | | | 0.70 | % | | | 0.54 | % | | | 2.94 | % | | | 43 | % | | $ | 15,362 | |
| | 1.81 | % | | | 0.73 | % | | | 0.61 | % | | | 7.12 | % | | | 67 | % | | $ | 43,559 | |
| | 1.59 | % | | | 0.76 | % | | | 0.70 | % | | | 10.87 | % | | | 36 | % | | $ | 65,620 | |
| | 1.58 | % | | | 0.77 | % | | | 0.70 | % | | | (5.45 | )% | | | 32 | % | | $ | 298,492 | |
The accompanying notes are an integral part of these financial statements.
Wells Fargo Target Date Retirement Funds | 77
Financial highlights
| | | | | | | | | | | | | | | | | | | | | | | | | | | | |
| | | Beginning
net asset
value per
share | | | Net
investment
income | | | Payment
from
affiliate | | | Net realized
and unrealized
gains (losses)
on investments | | | Distributions
from net
investment
income | | | Distributions
from net
realized gains | | | Ending net asset value per
share | |
| | | | | | | |
Target 2030 Fund | | | | | | | | | | | | | | | | | | | | | | | | | | | | |
| | | | | | | |
Class A | | | | | | | | | | | | | | | | | | | | | | | | | | | | |
Six months ended August 31, 2020 (unaudited) | | $ | 12.14 | | | | 0.12 | 4 | | | 0.00 | 5 | | | 0.68 | | | | 0.00 | | | | 0.00 | | | $ | 12.94 | |
Year ended February 29, 2020 | | $ | 12.03 | | | | 0.25 | | | | 0.00 | | | | 0.34 | | | | (0.27 | ) | | | (0.21 | ) | | $ | 12.14 | |
Year ended February 28, 2019 | | $ | 13.53 | | | | 0.26 | | | | 0.00 | | | | (0.00 | )7 | | | (0.33 | ) | | | (1.43 | ) | | $ | 12.03 | |
Year ended February 28, 2018 | | $ | 16.70 | | | | 0.27 | | | | 0.00 | | | | 1.25 | | | | (0.15 | ) | | | (4.54 | ) | | $ | 13.53 | |
Year ended February 28, 2017 | | $ | 15.17 | | | | 0.23 | | | | 0.00 | | | | 1.90 | | | | (0.31 | ) | | | (0.29 | ) | | $ | 16.70 | |
Year ended February 29, 2016 | | $ | 16.97 | | | | 0.21 | 4 | | | 0.00 | | | | (1.44 | ) | | | (0.14 | ) | | | (0.43 | ) | | $ | 15.17 | |
| | | | | | | |
Class C | | | | | | | | | | | | | | | | | | | | | | | | | | | | |
Six months ended August 31, 2020 (unaudited) | | $ | 11.60 | | | | 0.07 | 4 | | | 0.00 | | | | 0.65 | | | | 0.00 | | | | 0.00 | | | $ | 12.32 | |
Year ended February 29, 2020 | | $ | 11.50 | | | | 0.15 | 4 | | | 0.00 | | | | 0.32 | | | | (0.16 | ) | | | (0.21 | ) | | $ | 11.60 | |
Year ended February 28, 2019 | | $ | 13.01 | | | | 0.16 | 4 | | | 0.00 | | | | (0.00 | )7 | | | (0.24 | ) | | | (1.43 | ) | | $ | 11.50 | |
Year ended February 28, 2018 | | $ | 16.24 | | | | 0.18 | | | | 0.00 | | | | 1.17 | | | | (0.04 | ) | | | (4.54 | ) | | $ | 13.01 | |
Year ended February 28, 2017 | | $ | 14.79 | | | | 0.07 | | | | 0.00 | | | | 1.88 | | | | (0.21 | ) | | | (0.29 | ) | | $ | 16.24 | |
Year ended February 29, 2016 | | $ | 16.58 | | | | 0.10 | | | | 0.00 | | | | (1.41 | ) | | | (0.05 | ) | | | (0.43 | ) | | $ | 14.79 | |
| | | | | | | |
Class R | | | | | | | | | | | | | | | | | | | | | | | | | | | | |
Six months ended August 31, 2020 (unaudited) | | $ | 12.16 | | | | 0.10 | 4 | | | 0.08 | | | | 0.68 | | | | 0.00 | | | | 0.00 | | | $ | 13.02 | |
Year ended February 29, 2020 | | $ | 12.05 | | | | 0.22 | 4 | | | 0.00 | | | | 0.34 | | | | (0.24 | ) | | | (0.21 | ) | | $ | 12.16 | |
Year ended February 28, 2019 | | $ | 13.55 | | | | 0.23 | 4 | | | 0.00 | | | | (0.00 | )7 | | | (0.30 | ) | | | (1.43 | ) | | $ | 12.05 | |
Year ended February 28, 2018 | | $ | 16.66 | | | | 0.26 | 4 | | | 0.00 | | | | 1.17 | | | | 0.00 | | | | (4.54 | ) | | $ | 13.55 | |
Year ended February 28, 2017 | | $ | 15.14 | | | | 0.18 | | | | 0.00 | | | | 1.90 | | | | (0.27 | ) | | | (0.29 | ) | | $ | 16.66 | |
Year ended February 29, 2016 | | $ | 16.95 | | | | 0.18 | | | | 0.00 | | | | (1.44 | ) | | | (0.12 | ) | | | (0.43 | ) | | $ | 15.14 | |
| | | | | | | |
Class R4 | | | | | | | | | | | | | | | | | | | | | | | | | | | | |
Six months ended August 31, 2020 (unaudited) | | $ | 12.45 | | | | 0.14 | 4 | | | 0.00 | | | | 0.70 | | | | 0.00 | | | | 0.00 | | | $ | 13.29 | |
Year ended February 29, 2020 | | $ | 12.32 | | | | 0.29 | 4 | | | 0.00 | | | | 0.36 | | | | (0.31 | ) | | | (0.21 | ) | | $ | 12.45 | |
Year ended February 28, 2019 | | $ | 13.81 | | | | 0.34 | 4 | | | 0.00 | | | | (0.03 | ) | | | (0.37 | ) | | | (1.43 | ) | | $ | 12.32 | |
Year ended February 28, 2018 | | $ | 16.95 | | | | 0.34 | 4 | | | 0.00 | | | | 1.25 | | | | (0.19 | ) | | | (4.54 | ) | | $ | 13.81 | |
Year ended February 28, 2017 | | $ | 15.38 | | | | 0.27 | | | | 0.00 | | | | 1.94 | | | | (0.35 | ) | | | (0.29 | ) | | $ | 16.95 | |
Year ended February 29, 2016 | | $ | 17.20 | | | | 0.28 | | | | 0.00 | | | | (1.47 | ) | | | (0.20 | ) | | | (0.43 | ) | | $ | 15.38 | |
| | | | | | | |
Class R6 | | | | | | | | | | | | | | | | | | | | | | | | | | | | |
Six months ended August 31, 2020 (unaudited) | | $ | 12.42 | | | | 0.15 | 4 | | | 0.00 | | | | 0.70 | | | | 0.00 | | | | 0.00 | | | $ | 13.27 | |
Year ended February 29, 2020 | | $ | 12.30 | | | | 0.32 | | | | 0.00 | | | | 0.33 | | | | (0.32 | ) | | | (0.21 | ) | | $ | 12.42 | |
Year ended February 28, 2019 | | $ | 13.79 | | | | 0.34 | 4 | | | 0.00 | | | | (0.01 | ) | | | (0.39 | ) | | | (1.43 | ) | | $ | 12.30 | |
Year ended February 28, 2018 | | $ | 16.93 | | | | 0.36 | 4 | | | 0.00 | | | | 1.26 | | | | (0.22 | ) | | | (4.54 | ) | | $ | 13.79 | |
Year ended February 28, 2017 | | $ | 15.37 | | | | 0.31 | 4 | | | 0.00 | | | | 1.92 | | | | (0.38 | ) | | | (0.29 | ) | | $ | 16.93 | |
Year ended February 29, 2016 | | $ | 17.19 | | | | 0.30 | | | | 0.00 | | | | (1.46 | ) | | | (0.23 | ) | | | (0.43 | ) | | $ | 15.37 | |
| | | | | | | |
Administrator Class | | | | | | | | | | | | | | | | | | | | | | | | | | | | |
Six months ended August 31, 2020 (unaudited) | | $ | 12.45 | | | | 0.13 | 4 | | | 0.00 | | | | 0.69 | | | | 0.00 | | | | 0.00 | | | $ | 13.27 | |
Year ended February 29, 2020 | | $ | 12.32 | | | | 0.27 | 4 | | | 0.00 | | | | 0.35 | | | | (0.28 | ) | | | (0.21 | ) | | $ | 12.45 | |
Year ended February 28, 2019 | | $ | 13.80 | | | | 0.30 | 4 | | | 0.00 | | | | (0.02 | ) | | | (0.33 | ) | | | (1.43 | ) | | $ | 12.32 | |
Year ended February 28, 2018 | | $ | 16.94 | | | | 0.28 | | | | 0.00 | | | | 1.27 | | | | (0.15 | ) | | | (4.54 | ) | | $ | 13.80 | |
Year ended February 28, 2017 | | $ | 15.37 | | | | 0.25 | 4 | | | 0.00 | | | | 1.93 | | | | (0.32 | ) | | | (0.29 | ) | | $ | 16.94 | |
Year ended February 29, 2016 | | $ | 17.19 | | | | 0.25 | | | | 0.00 | | | | (1.47 | ) | | | (0.17 | ) | | | (0.43 | ) | | $ | 15.37 | |
| 1 | Ratios include net expenses allocated from the affiliated Master Portfolios which were as follows: |
| | | | | | | | | | | | | | | | | | | | | | | | |
| | | Six months ended
August 31, 2020
(unaudited) | | | Year ended
February 29, 2020 | | | Year ended February 28 | | | Year ended
February 29, 2016 | |
| | | 2019 | | | 2018 | | | 2017 | |
Class A | | | 0.12 | % | | | 0.14 | % | | | 0.15 | % | | | 0.17 | % | | | 0.17 | % | | | 0.16 | % |
Class C | | | 0.12 | | | | 0.14 | | | | 0.15 | | | | 0.17 | | | | 0.17 | | | | 0.16 | |
Class R | | | 0.08 | | | | 0.16 | | | | 0.15 | | | | 0.19 | | | | 0.17 | | | | 0.16 | |
Class R4 | | | 0.12 | | | | 0.14 | | | | 0.15 | | | | 0.17 | | | | 0.17 | | | | 0.16 | |
Class R6 | | | 0.12 | | | | 0.14 | | | | 0.15 | | | | 0.17 | | | | 0.16 | | | | 0.16 | |
Administrator Class | | | 0.12 | | | | 0.14 | | | | 0.15 | | | | 0.17 | | | | 0.17 | | | | 0.16 | |
| 2 | Total return calculations do not include any sales charges. Returns for periods of less than one year are not annualized. |
| 3 | Portfolio turnover rate is calculated by multiplying the Fund’s ownership percentage in each respective affiliated Master Portfolio by the corresponding affiliated Master Portfolio’s purchases and sales. |
| 4 | Calculated based upon average shares outstanding |
| 5 | Amount is less than $0.005 |
| 6 | During the six months ended August 31, 2020, the Fund received a payment from an affiliate that had an impact of less than 0.005% on total return. See Note 4 in the Notes to Financial Statements for additional information. |
| 7 | Amount is more than $(0.005). |
| 8 | During the six months ended August 31, 2020, the Fund received a payment from an affiliate which had an impact of 0.65% on the total return. See Note 4 in the Notes to Financial Statements for additional information. |
The accompanying notes are an integral part of these financial statements.
78 | Wells Fargo Target Date Retirement Funds
Financial highlights
| | | | | | | | | | | | | | | | | | | | | | |
| Ratio to average net assets (annualized) | | | Total
return2 | | |
Portfolio
turnover
rate3 | | |
Net assets at
end of period
(000s omitted) | |
Net investment
income1 | | | Gross
expenses1 | | | Net
expenses1 | |
| | | | | |
| | | | | | | | | | | | | | | | | | | | | | | |
| | | | | |
| | | | | | | | | | | | | | | | | | | | | | |
| | 1.97 | % | | | 0.74 | % | | | 0.62 | % | | | 6.59 | %6 | | | 46 | % | | $ | 160.076 | |
| | 1.98 | % | | | 0.75 | % | | | 0.63 | % | | | 4.72 | % | | | 36 | % | | $ | 163,774 | |
| | 2.04 | % | | | 0.76 | % | | | 0.65 | % | | | 2.55 | % | | | 43 | % | | $ | 177,608 | |
| | 1.63 | % | | | 0.80 | % | | | 0.71 | % | | | 8.79 | % | | | 61 | % | | $ | 228,015 | |
| | 1.32 | % | | | 0.84 | % | | | 0.82 | % | | | 14.15 | % | | | 31 | % | | $ | 230,044 | |
| | 1.32 | % | | | 0.86 | % | | | 0.83 | % | | | (7.37 | )% | | | 30 | % | | $ | 227,928 | |
| | | | | |
| | | | | | | | | | | | | | | | | | | | | | |
| | 1.23 | % | | | 1.48 | % | | | 1.37 | % | | | 6.21 | % | | | 46 | % | | $ | 1,753 | |
| | 1.24 | % | | | 1.50 | % | | | 1.39 | % | | | 3.92 | % | | | 36 | % | | $ | 2,060 | |
| | 1.30 | % | | | 1.51 | % | | | 1.40 | % | | | 1.82 | % | | | 43 | % | | $ | 2,851 | |
| | 0.88 | % | | | 1.55 | % | | | 1.46 | % | | | 7.95 | % | | | 61 | % | | $ | 4,748 | |
| | 0.57 | % | | | 1.59 | % | | | 1.57 | % | | | 13.28 | % | | | 31 | % | | $ | 4,630 | |
| | 0.63 | % | | | 1.63 | % | | | 1.59 | % | | | (8.05 | )% | | | 30 | % | | $ | 4,662 | |
| | | | | |
| | | | | | | | | | | | | | | | | | | | | | |
| | 1.73 | % | | | 0.83 | % | | | 0.84 | % | | | 7.15 | %8 | | | 46 | % | | $ | 50 | |
| | 1.72 | % | | | 0.97 | % | | | 0.87 | % | | | 4.48 | % | | | 36 | % | | $ | 44 | |
| | 1.76 | % | | | 1.01 | % | | | 0.89 | % | | | 2.37 | % | | | 43 | % | | $ | 40 | |
| | 1.54 | % | | | 1.10 | % | | | 1.04 | % | | | 8.28 | % | | | 61 | % | | $ | 34 | |
| | 1.06 | % | | | 1.10 | % | | | 1.07 | % | | | 13.88 | % | | | 31 | % | | $ | 904 | |
| | 1.11 | % | | | 1.12 | % | | | 1.08 | % | | | (7.57 | )% | | | 30 | % | | $ | 853 | |
| | | | | |
| | | | | | | | | | | | | | | | | | | | | | |
| | 2.36 | % | | | 0.46 | % | | | 0.31 | % | | | 6.75 | % | | | 46 | % | | $ | 27,633 | |
| | 2.28 | % | | | 0.47 | % | | | 0.34 | % | | | 5.07 | % | | | 36 | % | | $ | 51,595 | |
| | 2.45 | % | | | 0.48 | % | | | 0.34 | % | | | 2.88 | % | | | 43 | % | | $ | 57,366 | |
| | 1.95 | % | | | 0.53 | % | | | 0.42 | % | | | 9.09 | % | | | 61 | % | | $ | 219,799 | |
| | 1.64 | % | | | 0.56 | % | | | 0.51 | % | | | 14.52 | % | | | 31 | % | | $ | 507,587 | |
| | 1.73 | % | | | 0.58 | % | | | 0.51 | % | | | (7.07 | )% | | | 30 | % | | $ | 513,864 | |
| | | | | |
| | | | | | | | | | | | | | | | | | | | | | |
| | 2.43 | % | | | 0.31 | % | | | 0.16 | % | | | 6.84 | % | | | 46 | % | | $ | 216,957 | |
| | 2.41 | % | | | 0.32 | % | | | 0.19 | % | | | 5.15 | % | | | 36 | % | | $ | 231,645 | |
| | 2.51 | % | | | 0.33 | % | | | 0.19 | % | | | 3.08 | % | | | 43 | % | | $ | 230,953 | |
| | 2.10 | % | | | 0.38 | % | | | 0.26 | % | | | 9.28 | % | | | 61 | % | | $ | 353,891 | |
| | 1.87 | % | | | 0.41 | % | | | 0.36 | % | | | 14.63 | % | | | 31 | % | | $ | 618,551 | |
| | 1.85 | % | | | 0.43 | % | | | 0.36 | % | | | (6.93 | )% | | | 30 | % | | $ | 1,284,324 | |
| | | | | |
| | | | | | | | | | | | | | | | | | | | | | |
| | 2.08 | % | | | 0.66 | % | | | 0.51 | % | | | 6.59 | % | | | 46 | % | | $ | 74,958 | |
| | 2.08 | % | | | 0.67 | % | | | 0.54 | % | | | 4.86 | % | | | 36 | % | | $ | 79,552 | |
| | 2.18 | % | | | 0.68 | % | | | 0.54 | % | | | 2.69 | % | | | 43 | % | | $ | 89,022 | |
| | 1.75 | % | | | 0.72 | % | | | 0.61 | % | | | 8.86 | % | | | 61 | % | | $ | 161,583 | |
| | 1.51 | % | | | 0.76 | % | | | 0.71 | % | | | 14.32 | % | | | 31 | % | | $ | 262,336 | |
| | 1.52 | % | | | 0.77 | % | | | 0.71 | % | | | (7.27 | )% | | | 30 | % | | $ | 498,554 | |
The accompanying notes are an integral part of these financial statements.
Wells Fargo Target Date Retirement Funds | 79
Financial highlights
| | | | | | | | | | | | | | | | | | | | | | | | |
| | | Beginning
net asset
value per
share | | | Net
investment
income | | | Net realized
and unrealized
gains (losses)
on investments | | | Distributions
from net
investment
income | | | Distributions
from net
realized gains | | | Ending
net asset
value per
share | |
| | | | | | |
Target 2035 Fund | | | | | | | | | | | | | | | | | | | | | | | | |
| | | | | | |
Class A | | | | | | | | | | | | | | | | | | | | | | | | |
Six months ended August 31, 2020 (unaudited) | | $ | 7.38 | | | | 0.07 | | | | 0.46 | | | | 0.00 | | | | 0.00 | | | $ | 7.91 | |
Year ended February 29, 2020 | | $ | 7.38 | | | | 0.15 | | | | 0.14 | | | | (0.16 | ) | | | (0.13 | ) | | $ | 7.38 | |
Year ended February 28, 2019 | | $ | 8.35 | | | | 0.15 | | | | (0.00 | )4 | | | (0.18 | ) | | | (0.94 | ) | | $ | 7.38 | |
Year ended February 28, 2018 | | $ | 11.25 | | | | 0.18 | | | | 1.01 | | | | (0.12 | ) | | | (3.97 | ) | | $ | 8.35 | |
Year ended February 28, 2017 | | $ | 9.89 | | | | 0.13 | | | | 1.56 | | | | (0.15 | ) | | | (0.18 | ) | | $ | 11.25 | |
Year ended February 29, 2016 | | $ | 11.32 | | | | 0.15 | | | | (1.18 | ) | | | (0.11 | ) | | | (0.29 | ) | | $ | 9.89 | |
| | | | | | |
Class R | | | | | | | | | | | | | | | | | | | | | | | | |
Six months ended August 31, 2020 (unaudited) | | $ | 7.44 | | | | 0.06 | 5 | | | 0.48 | | | | 0.00 | | | | 0.00 | | | $ | 7.98 | |
Year ended February 29, 2020 | | $ | 7.44 | | | | 0.13 | | | | 0.15 | | | | (0.15 | ) | | | (0.13 | ) | | $ | 7.44 | |
Year ended February 28, 2019 | | $ | 8.42 | | | | 0.12 | | | | 0.01 | | | | (0.17 | ) | | | (0.94 | ) | | $ | 7.44 | |
Year ended February 28, 2018 | | $ | 11.32 | | | | 0.15 | | | | 1.01 | | | | (0.09 | ) | | | (3.97 | ) | | $ | 8.42 | |
Year ended February 28, 2017 | | $ | 9.95 | | | | 0.11 | | | | 1.57 | | | | (0.13 | ) | | | (0.18 | ) | | $ | 11.32 | |
Year ended February 29, 2016 | | $ | 11.39 | | | | 0.11 | | | | (1.17 | ) | | | (0.09 | ) | | | (0.29 | ) | | $ | 9.95 | |
| | | | | | |
Class R4 | | | | | | | | | | | | | | | | | | | | | | | | |
Six months ended August 31, 2020 (unaudited) | | $ | 7.40 | | | | 0.08 | 5 | | | 0.47 | | | | 0.00 | | | | 0.00 | | | $ | 7.95 | |
Year ended February 29, 2020 | | $ | 7.40 | | | | 0.17 | 5 | | | 0.15 | | | | (0.19 | ) | | | (0.13 | ) | | $ | 7.40 | |
Year ended February 28, 2019 | | $ | 8.37 | | | | 0.20 | 5 | | | (0.03 | ) | | | (0.20 | ) | | | (0.94 | ) | | $ | 7.40 | |
Year ended February 28, 2018 | | $ | 11.27 | | | | 0.21 | 5 | | | 1.02 | | | | (0.16 | ) | | | (3.97 | ) | | $ | 8.37 | |
Year ended February 28, 2017 | | $ | 9.91 | | | | 0.17 | 5 | | | 1.56 | | | | (0.19 | ) | | | (0.18 | ) | | $ | 11.27 | |
Year ended February 29, 2016 | | $ | 11.33 | | | | 0.18 | | | | (1.17 | ) | | | (0.14 | ) | | | (0.29 | ) | | $ | 9.91 | |
| | | | | | |
Class R6 | | | | | | | | | | | | | | | | | | | | | | | | |
Six months ended August 31, 2020 (unaudited) | | $ | 7.39 | | | | 0.13 | | | | 0.43 | | | | 0.00 | | | | 0.00 | | | $ | 7.95 | |
Year ended February 29, 2020 | | $ | 7.39 | | | | 0.18 | 5 | | | 0.15 | | | | (0.20 | ) | | | (0.13 | ) | | $ | 7.39 | |
Year ended February 28, 2019 | | $ | 8.37 | | | | 0.25 | | | | (0.07 | ) | | | (0.22 | ) | | | (0.94 | ) | | $ | 7.39 | |
Year ended February 28, 2018 | | $ | 11.27 | | | | 0.27 | | | | 0.98 | | | | (0.18 | ) | | | (3.97 | ) | | $ | 8.37 | |
Year ended February 28, 2017 | | $ | 9.91 | | | | 0.20 | 5 | | | 1.55 | | | | (0.21 | ) | | | (0.18 | ) | | $ | 11.27 | |
Year ended February 29, 2016 | | $ | 11.33 | | | | 0.19 | | | | (1.16 | ) | | | (0.16 | ) | | | (0.29 | ) | | $ | 9.91 | |
| | | | | | |
Administrator Class | | | | | | | | | | | | | | | | | | | | | | | | |
Six months ended August 31, 2020 (unaudited) | | $ | 7.47 | | | | 0.07 | | | | 0.48 | | | | 0.00 | | | | 0.00 | | | $ | 8.02 | |
Year ended February 29, 2020 | | $ | 7.47 | | | | 0.16 | 5 | | | 0.14 | | | | (0.17 | ) | | | (0.13 | ) | | $ | 7.47 | |
Year ended February 28, 2019 | | $ | 8.41 | | | | 0.18 | | | | (0.01 | ) | | | (0.17 | ) | | | (0.94 | ) | | $ | 7.47 | |
Year ended February 28, 2018 | | $ | 11.30 | | | | 0.19 | | | | 1.02 | | | | (0.13 | ) | | | (3.97 | ) | | $ | 8.41 | |
Year ended February 28, 2017 | | $ | 9.94 | | | | 0.16 | 5 | | | 1.55 | | | | (0.17 | ) | | | (0.18 | ) | | $ | 11.30 | |
Year ended February 29, 2016 | | $ | 11.37 | | | | 0.16 | | | | (1.18 | ) | | | (0.12 | ) | | | (0.29 | ) | | $ | 9.94 | |
| 1 | Ratios include net expenses allocated from the affiliated Master Portfolios which were as follows: |
| | | | | | | | | | | | | | | | | | | | | | | | |
| | | Six months ended
August 31, 2020
(unaudited) | | | Year ended
February 29, 2020 | | | Year ended February 28 | | | Year ended
February 29, 2016 | |
| | | 2019 | | | 2018 | | | 2017 | |
Class A | | | 0.13 | % | | | 0.15 | % | | | 0.16 | % | | | 0.18 | % | | | 0.17 | % | | | 0.17 | % |
Class R | | | 0.12 | | | | 0.15 | | | | 0.16 | | | | 0.18 | | | | 0.17 | | | | 0.17 | |
Class R4 | | | 0.13 | | | | 0.15 | | | | 0.16 | | | | 0.18 | | | | 0.17 | | | | 0.16 | |
Class R6 | | | 0.13 | | | | 0.15 | | | | 0.16 | | | | 0.18 | | | | 0.16 | | | | 0.16 | |
Administrator Class | | | 0.13 | | | | 0.15 | | | | 0.16 | | | | 0.18 | | | | 0.16 | | | | 0.16 | |
| 2 | Total return calculations do not include any sales charges. Returns for periods of less than one year are not annualized. |
| 3 | Portfolio turnover rate is calculated by multiplying the Fund’s ownership percentage in each respective affiliated Master Portfolio by the corresponding affiliated Master Portfolio’s purchases and sales. |
| 4 | Amount is more than $(0.005). |
| 5 | Calculated based upon average shares outstanding |
The accompanying notes are an integral part of these financial statements.
80 | Wells Fargo Target Date Retirement Funds
Financial highlights
| | | | | | | | | | | | | | | | | | | | | | |
| Ratio to average net assets (annualized) | | | Total
return2 | | | Portfolio
turnover
rate3 | | |
Net assets at
end of period
(000s omitted) | |
Net investment
income1 | | | Gross
expenses1 | | | Net
expenses1 | |
| | | | | |
| | | | | | | | | | | | | | | | | | | | | | | |
| | | | | |
| | | | | | | | | | | | | | | | | | | | | | |
| | 1.96 | % | | | 0.81 | % | | | 0.62 | % | | | 7.18 | % | | | 49 | % | | $ | 95,394 | |
| | 1.92 | % | | | 0.80 | % | | | 0.63 | % | | | 3.70 | % | | | 36 | % | | $ | 95,284 | |
| | 1.97 | % | | | 0.81 | % | | | 0.65 | % | | | 2.48 | % | | | 41 | % | | $ | 108,389 | |
| | 1.56 | % | | | 0.83 | % | | | 0.72 | % | | | 10.21 | % | | | 55 | % | | $ | 118,000 | |
| | 1.28 | % | | | 0.85 | % | | | 0.83 | % | | | 17.33 | % | | | 27 | % | | $ | 127,294 | |
| | 1.19 | % | | | 0.84 | % | | | 0.83 | % | | | (9.28 | )% | | | 28 | % | | $ | 142,817 | |
| | | | | |
| | | | | | | | | | | | | | | | | | | | | | |
| | 1.70 | % | | | 1.04 | % | | | 0.86 | % | | | 7.26 | % | | | 49 | % | | $ | 379 | |
| | 1.60 | % | | | 1.04 | % | | | 0.90 | % | | | 3.46 | % | | | 36 | % | | $ | 318 | |
| | 1.68 | % | | | 1.06 | % | | | 0.90 | % | | | 2.16 | % | | | 41 | % | | $ | 250 | |
| | 1.32 | % | | | 1.08 | % | | | 0.97 | % | | | 9.87 | % | | | 55 | % | | $ | 192 | |
| | 0.89 | % | | | 1.11 | % | | | 1.08 | % | | | 17.09 | % | | | 27 | % | | $ | 171 | |
| | 1.02 | % | | | 1.13 | % | | | 1.09 | % | | | (9.48 | )% | | | 28 | % | | $ | 73 | |
| | | | | |
| | | | | | | | | | | | | | | | | | | | | | |
| | 2.42 | % | | | 0.53 | % | | | 0.32 | % | | | 7.43 | % | | | 49 | % | | $ | 7,963 | |
| | 2.20 | % | | | 0.52 | % | | | 0.34 | % | | | 3.99 | % | | | 36 | % | | $ | 26,748 | |
| | 2.37 | % | | | 0.53 | % | | | 0.34 | % | | | 2.80 | % | | | 41 | % | | $ | 34,388 | |
| | 1.90 | % | | | 0.56 | % | | | 0.43 | % | | | 10.53 | % | | | 55 | % | | $ | 82,617 | |
| | 1.54 | % | | | 0.57 | % | | | 0.52 | % | | | 17.68 | % | | | 27 | % | | $ | 240,025 | |
| | 1.66 | % | | | 0.59 | % | | | 0.52 | % | | | (8.92 | )% | | | 28 | % | | $ | 228,810 | |
| | | | | |
| | | | | | | | | | | | | | | | | | | | | | |
| | 2.43 | % | | | 0.38 | % | | | 0.16 | % | | | 7.58 | % | | | 49 | % | | $ | 79,367 | |
| | 2.38 | % | | | 0.37 | % | | | 0.19 | % | | | 4.16 | % | | | 36 | % | | $ | 89,108 | |
| | 2.48 | % | | | 0.38 | % | | | 0.19 | % | | | 2.86 | % | | | 41 | % | | $ | 112,021 | |
| | 2.04 | % | | | 0.41 | % | | | 0.27 | % | | | 10.76 | % | | | 55 | % | | $ | 185,889 | |
| | 1.83 | % | | | 0.42 | % | | | 0.37 | % | | | 17.86 | % | | | 27 | % | | $ | 317,594 | |
| | 1.80 | % | | | 0.44 | % | | | 0.37 | % | | | (8.78 | )% | | | 28 | % | | $ | 714,884 | |
| | | | | |
| | | | | | | | | | | | | | | | | | | | | | |
| | 2.07 | % | | | 0.72 | % | | | 0.51 | % | | | 7.36 | % | | | 49 | % | | $ | 6,767 | |
| | 2.04 | % | | | 0.72 | % | | | 0.54 | % | | | 3.75 | % | | | 36 | % | | $ | 6,888 | |
| | 2.20 | % | | | 0.72 | % | | | 0.54 | % | | | 2.64 | % | | | 41 | % | | $ | 9,608 | |
| | 1.67 | % | | | 0.74 | % | | | 0.61 | % | | | 10.33 | % | | | 55 | % | | $ | 35,678 | |
| | 1.52 | % | | | 0.77 | % | | | 0.72 | % | | | 17.38 | % | | | 27 | % | | $ | 50,898 | |
| | 1.46 | % | | | 0.78 | % | | | 0.72 | % | | | (9.17 | )% | | | 28 | % | | $ | 182,599 | |
The accompanying notes are an integral part of these financial statements.
Wells Fargo Target Date Retirement Funds | 81
Financial highlights
| | | | | | | | | | | | | | | | | | | | | | | | | | | | |
| | | Beginning
net asset
value per
share | | | Net
investment
income | | | Payment
from
affiliate | | | Net realized
and unrealized
gains (losses)
on investments | | | Distributions
from net
investment
income | | | Distributions
from net
realized gains | | | Ending
net asset
value per
share | |
| | | | | | | |
Target 2040 Fund | | | | | | | | | | | | | | | | | | | | | | | | | | | | |
| | | | | | | |
Class A | | | | | | | | | | | | | | | | | | | | | | | | | | | | |
Six months ended August 31, 2020 (unaudited) | | $ | 14.02 | | | | 0.14 | | | | 0.00 | 4 | | | 0.93 | | | | 0.00 | | | | 0.00 | | | $ | 15.09 | |
Year ended February 29, 2020 | | $ | 14.09 | | | | 0.28 | | | | 0.00 | | | | 0.12 | | | | (0.29 | ) | | | (0.18 | ) | | $ | 14.02 | |
Year ended February 28, 2019 | | $ | 16.02 | | | | 0.29 | | | | 0.00 | | | | (0.05 | ) | | | (0.36 | ) | | | (1.81 | ) | | $ | 14.09 | |
Year ended February 28, 2018 | | $ | 19.43 | | | | 0.31 | | | | 0.00 | | | | 1.93 | | | | (0.31 | ) | | | (5.34 | ) | | $ | 16.02 | |
Year ended February 28, 2017 | | $ | 16.74 | | | | 0.23 | | | | 0.00 | | | | 3.08 | | | | (0.27 | ) | | | (0.35 | ) | | $ | 19.43 | |
Year ended February 29, 2016 | | $ | 19.53 | | | | 0.22 | 6 | | | 0.00 | | | | (2.27 | ) | | | (0.20 | ) | | | (0.54 | ) | | $ | 16.74 | |
| | | | | | | |
Class C | | | | | | | | | | | | | | | | | | | | | | | | | | | | |
Six months ended August 31, 2020 (unaudited) | | $ | 12.56 | | | | 0.07 | 6 | | | 0.00 | | | | 0.84 | | | | 0.00 | | | | 0.00 | | | $ | 13.47 | |
Year ended February 29, 2020 | | $ | 12.66 | | | | 0.15 | 6 | | | 0.00 | | | | 0.11 | | | | (0.18 | ) | | | (0.18 | ) | | $ | 12.56 | |
Year ended February 28, 2019 | | $ | 14.61 | | | | 0.17 | 6 | | | 0.00 | | | | (0.06 | ) | | | (0.25 | ) | | | (1.81 | ) | | $ | 12.66 | |
Year ended February 28, 2018 | | $ | 18.19 | | | | 0.14 | 6 | | | 0.00 | | | | 1.81 | | | | (0.19 | ) | | | (5.34 | ) | | $ | 14.61 | |
Year ended February 28, 2017 | | $ | 15.71 | | | | 0.04 | 6 | | | 0.00 | | | | 2.94 | | | | (0.15 | ) | | | (0.35 | ) | | $ | 18.19 | |
Year ended February 29, 2016 | | $ | 18.38 | | | | 0.09 | 6 | | | 0.00 | | | | (2.15 | ) | | | (0.07 | ) | | | (0.54 | ) | | $ | 15.71 | |
| | | | | | | |
Class R | | | | | | | | | | | | | | | | | | | | | | | | | | | | |
Six months ended August 31, 2020 (unaudited) | | $ | 14.01 | | | | 0.13 | | | | 0.07 | | | | 0.92 | | | | 0.00 | | | | 0.00 | | | $ | 15.13 | |
Year ended February 29, 2020 | | $ | 14.08 | | | | 0.25 | | | | 0.00 | | | | 0.12 | | | | (0.26 | ) | | | (0.18 | ) | | $ | 14.01 | |
Year ended February 28, 2019 | | $ | 16.02 | | | | 0.25 | 6 | | | 0.00 | | | | (0.05 | ) | | | (0.33 | ) | | | (1.81 | ) | | $ | 14.08 | |
Year ended February 28, 2018 | | $ | 19.36 | | | | 0.27 | 6 | | | 0.00 | | | | 1.93 | | | | (0.20 | ) | | | (5.34 | ) | | $ | 16.02 | |
Year ended February 28, 2017 | | $ | 16.69 | | | | 0.18 | | | | 0.00 | | | | 3.07 | | | | (0.23 | ) | | | (0.35 | ) | | $ | 19.36 | |
Year ended February 29, 2016 | | $ | 19.51 | | | | 0.18 | | | | 0.00 | | | | (2.28 | ) | | | (0.18 | ) | | | (0.54 | ) | | $ | 16.69 | |
| | | | | | | |
Class R4 | | | | | | | | | | | | | | | | | | | | | | | | | | | | |
Six months ended August 31, 2020 (unaudited) | | $ | 14.54 | | | | 0.16 | 6 | | | 0.00 | | | | 0.98 | | | | 0.00 | | | | 0.00 | | | $ | 15.68 | |
Year ended February 29, 2020 | | $ | 14.60 | | | | 0.33 | 6 | | | 0.00 | | | | 0.13 | | | | (0.34 | ) | | | (0.18 | ) | | $ | 14.54 | |
Year ended February 28, 2019 | | $ | 16.51 | | | | 0.39 | 6 | | | 0.00 | | | | (0.08 | ) | | | (0.41 | ) | | | (1.81 | ) | | $ | 14.60 | |
Year ended February 28, 2018 | | $ | 19.86 | | | | 0.36 | | | | 0.00 | | | | 1.99 | | | | (0.36 | ) | | | (5.34 | ) | | $ | 16.51 | |
Year ended February 28, 2017 | | $ | 17.09 | | | | 0.27 | | | | 0.00 | | | | 3.18 | | | | (0.33 | ) | | | (0.35 | ) | | $ | 19.86 | |
Year ended February 29, 2016 | | $ | 19.93 | | | | 0.28 | | | | 0.00 | | | | (2.32 | ) | | | (0.26 | ) | | | (0.54 | ) | | $ | 17.09 | |
| | | | | | | |
Class R6 | | | | | | | | | | | | | | | | | | | | | | | | | | | | |
Six months ended August 31, 2020 (unaudited) | | $ | 14.52 | | | | 0.19 | | | | 0.00 | | | | 0.96 | | | | 0.00 | | | | 0.00 | | | $ | 15.67 | |
Year ended February 29, 2020 | | $ | 14.58 | | | | 0.35 | | | | 0.00 | | | | 0.13 | | | | (0.36 | ) | | | (0.18 | ) | | $ | 14.52 | |
Year ended February 28, 2019 | | $ | 16.50 | | | | 0.39 | 6 | | | 0.00 | | | | (0.06 | ) | | | (0.44 | ) | | | (1.81 | ) | | $ | 14.58 | |
Year ended February 28, 2018 | | $ | 19.85 | | | | 0.40 | 6 | | | 0.00 | | | | 1.98 | | | | (0.39 | ) | | | (5.34 | ) | | $ | 16.50 | |
Year ended February 28, 2017 | | $ | 17.09 | | | | 0.41 | | | | 0.00 | | | | 3.06 | | | | (0.36 | ) | | | (0.35 | ) | | $ | 19.85 | |
Year ended February 29, 2016 | | $ | 19.93 | | | | 0.32 | | | | 0.00 | | | | (2.33 | ) | | | (0.29 | ) | | | (0.54 | ) | | $ | 17.09 | |
| | | | | | | |
Administrator Class | | | | | | | | | | | | | | | | | | | | | | | | | | | | |
Six months ended August 31, 2020 (unaudited) | | $ | 14.51 | | | | 0.15 | 6 | | | 0.00 | | | | 0.96 | | | | 0.00 | | | | 0.00 | | | $ | 15.62 | |
Year ended February 29, 2020 | | $ | 14.56 | | | | 0.32 | | | | 0.00 | | | | 0.12 | | | | (0.31 | ) | | | (0.18 | ) | | $ | 14.51 | |
Year ended February 28, 2019 | | $ | 16.47 | | | | 0.34 | 6 | | | 0.00 | | | | (0.07 | ) | | | (0.37 | ) | | | (1.81 | ) | | $ | 14.56 | |
Year ended February 28, 2018 | | $ | 19.82 | | | | 0.33 | 6 | | | 0.00 | | | | 1.98 | | | | (0.32 | ) | | | (5.34 | ) | | $ | 16.47 | |
Year ended February 28, 2017 | | $ | 17.07 | | | | 0.25 | | | | 0.00 | | | | 3.14 | | | | (0.29 | ) | | | (0.35 | ) | | $ | 19.82 | |
Year ended February 29, 2016 | | $ | 19.89 | | | | 0.27 | | | | 0.00 | | | | (2.33 | ) | | | (0.22 | ) | | | (0.54 | ) | | $ | 17.07 | |
| 1 | Ratios include net expenses allocated from the affiliated Master Portfolios which were as follows: |
| | | | | | | | | | | | | | | | | | | | | | | | |
| | | Six months ended
August 31 2020
(unaudited) | | | Year ended
February 29, 2020 | | | Year ended February 28 | | | Year ended
February 29, 2016 | |
| | | 2019 | | | 2018 | | | 2017 | |
Class A | | | 0.13 | % | | | 0.15 | % | | | 0.17 | % | | | 0.18 | % | | | 0.17 | % | | | 0.16 | % |
Class C | | | 0.13 | | | | 0.15 | | | | 0.17 | | | | 0.18 | | | | 0.17 | | | | 0.16 | |
Class R | | | 0.11 | | | | 0.18 | | | | 0.16 | | | | 0.18 | | | | 0.17 | | | | 0.17 | |
Class R4 | | | 0.13 | | | | 0.15 | | | | 0.17 | | | | 0.18 | | | | 0.17 | | | | 0.16 | |
Class R6 | | | 0.13 | | | | 0.15 | | | | 0.17 | | | | 0.18 | | | | 0.16 | | | | 0.16 | |
Administrator Class | | | 0.13 | | | | 0.15 | | | | 0.17 | | | | 0.18 | | | | 0.17 | | | | 0.16 | |
| 2 | Total return calculations do not include any sales charges. Returns for periods of less than one year are not annualized. |
| 3 | Portfolio turnover rate is calculated by multiplying the Fund’s ownership percentage in each respective affiliated Master Portfolio by the corresponding affiliated Master Portfolio’s purchases and sales. |
| 4 | Amount is less than $0.005. |
| 5 | During the six months ended August 31, 2020, the Fund received a payment from an affiliate that had an impact of less than 0.005% on total return. See Note 4 in the Notes to Financial Statements for additional information. |
| 6 | Calculated based upon average shares outstanding |
| 7 | During the six months ended August 31, 2020, the Fund received a payment from an affiliate which had an impact of 0.50% on the total return. See Note 4 in the Notes to Financial Statements for additional information. |
The accompanying notes are an integral part of these financial statements.
82 | Wells Fargo Target Date Retirement Funds
Financial highlights
| | | | | | | | | | | | | | | | | | | | | | |
| Ratio to average net assets (annualized) | | | Total
return2 | | | Portfolio
turnover
rate3 | | |
Net assets at
end of period
(000s omitted) | |
Net investment
income1 | | | Gross
expenses1 | | | Net
expenses1 | |
| | | | | |
| | | | | | | | | | | | | | | | | | | | | | | |
| | | | | |
| | | | | | | | | | | | | | | | | | | | | | |
| | 1.96 | % | | | 0.75 | % | | | 0.62 | % | | | 7.63 | %5 | | | 52 | % | | $ | 174,295 | |
| | 1.85 | % | | | 0.77 | % | | | 0.64 | % | | | 2.68 | % | | | 36 | % | | $ | 175,942 | |
| | 1.91 | % | | | 0.78 | % | | | 0.65 | % | | | 2.32 | % | | | 40 | % | | $ | 189,990 | |
| | 1.51 | % | | | 0.81 | % | | | 0.72 | % | | | 11.24 | % | | | 51 | % | | $ | 223,769 | |
| | 1.21 | % | | | 0.85 | % | | | 0.83 | % | | | 20.01 | % | | | 24 | % | | $ | 218,689 | |
| | 1.23 | % | | | 0.87 | % | | | 0.84 | % | | | (10.72 | )% | | | 27 | % | | $ | 202,038 | |
| | | | | |
| | | | | | | | | | | | | | | | | | | | | | |
| | 1.22 | % | | | 1.50 | % | | | 1.37 | % | | | 7.25 | % | | | 52 | % | | $ | 1,746 | |
| | 1.12 | % | | | 1.52 | % | | | 1.39 | % | | | 1.87 | % | | | 36 | % | | $ | 1,906 | |
| | 1.21 | % | | | 1.53 | % | | | 1.40 | % | | | 1.55 | % | | | 40 | % | | $ | 2,754 | |
| | 0.76 | % | | | 1.56 | % | | | 1.46 | % | | | 10.41 | % | | | 51 | % | | $ | 5,292 | |
| | 0.47 | % | | | 1.60 | % | | | 1.58 | % | | | 19.11 | % | | | 24 | % | | $ | 4,782 | |
| | 0.54 | % | | | 1.63 | % | | | 1.60 | % | | | (11.39 | )% | | | 27 | % | | $ | 4,621 | |
| | | | | |
| | | | | | | | | | | | | | | | | | | | | | |
| | 1.70 | % | | | 0.89 | % | | | 0.86 | % | | | 7.99 | %7 | | | 52 | % | | $ | 74 | |
| | 1.57 | % | | | 1.02 | % | | | 0.89 | % | | | 2.44 | % | | | 36 | % | | $ | 66 | |
| | 1.63 | % | | | 1.02 | % | | | 0.90 | % | | | 2.04 | % | | | 40 | % | | $ | 62 | |
| | 1.40 | % | | | 1.08 | % | | | 1.01 | % | | | 11.07 | % | | | 51 | % | | $ | 56 | |
| | 0.94 | % | | | 1.10 | % | | | 1.08 | % | | | 19.68 | % | | | 24 | % | | $ | 394 | |
| | 0.97 | % | | | 1.12 | % | | | 1.09 | % | | | (10.96 | )% | | | 27 | % | | $ | 289 | |
| | | | | |
| | | | | | | | | | | | | | | | | | | | | | |
| | 2.34 | % | | | 0.48 | % | | | 0.31 | % | | | 7.84 | % | | | 52 | % | | $ | 22,851 | |
| | 2.14 | % | | | 0.49 | % | | | 0.34 | % | | | 2.94 | % | | | 36 | % | | $ | 41,864 | |
| | 2.38 | % | | | 0.50 | % | | | 0.34 | % | | | 2.69 | % | | | 40 | % | | $ | 45,177 | |
| | 1.85 | % | | | 0.54 | % | | | 0.42 | % | | | 11.56 | % | | | 51 | % | | $ | 189,896 | |
| | 1.54 | % | | | 0.57 | % | | | 0.52 | % | | | 20.43 | % | | | 24 | % | | $ | 388,622 | |
| | 1.64 | % | | | 0.59 | % | | | 0.52 | % | | | (10.45 | )% | | | 27 | % | | $ | 385,259 | |
| | | | | |
| | | | | | | | | | | | | | | | | | | | | | |
| | 2.42 | % | | | 0.32 | % | | | 0.16 | % | | | 7.92 | % | | | 52 | % | | $ | 188,236 | |
| | 2.29 | % | | | 0.34 | % | | | 0.19 | % | | | 3.09 | % | | | 36 | % | | $ | 185,291 | |
| | 2.40 | % | | | 0.35 | % | | | 0.19 | % | | | 2.81 | % | | | 40 | % | | $ | 184,594 | |
| | 2.00 | % | | | 0.39 | % | | | 0.27 | % | | | 11.74 | % | | | 51 | % | | $ | 283,562 | |
| | 1.80 | % | | | 0.41 | % | | | 0.37 | % | | | 20.56 | % | | | 24 | % | | $ | 489,693 | |
| | 1.75 | % | | | 0.43 | % | | | 0.37 | % | | | (10.32 | )% | | | 27 | % | | $ | 929,672 | |
| | | | | |
| | | | | | | | | | | | | | | | | | | | | | |
| | 2.08 | % | | | 0.67 | % | | | 0.51 | % | | | 7.65 | % | | | 52 | % | | $ | 58,835 | |
| | 1.95 | % | | | 0.69 | % | | | 0.54 | % | | | 2.82 | % | | | 36 | % | | $ | 63,232 | |
| | 2.09 | % | | | 0.70 | % | | | 0.54 | % | | | 2.40 | % | | | 40 | % | | $ | 71,411 | |
| | 1.63 | % | | | 0.73 | % | | | 0.61 | % | | | 11.38 | % | | | 51 | % | | $ | 132,365 | |
| | 1.43 | % | | | 0.76 | % | | | 0.72 | % | | | 20.09 | % | | | 24 | % | | $ | 197,272 | |
| | 1.42 | % | | | 0.78 | % | | | 0.72 | % | | | (10.56 | )% | | | 27 | % | | $ | 320,415 | |
The accompanying notes are an integral part of these financial statements.
Wells Fargo Target Date Retirement Funds | 83
Financial highlights
| | | | | | | | | | | | | | | | | | | | | | | | | | | | |
| | | Beginning
net asset
value per
share | | | Net
investment
income | | | Payment
from
affiliate | | | Net realized
and unrealized
gains (losses)
on investments | | | Distributions
from net
investment
income | | | Distributions
from net
realized gains | | | Ending
net asset
value per
share | |
| | | | | | | |
Target 2045 Fund | | | | | | | | | | | | | | | | | | | | | | | | | | | | |
| | | | | | | |
Class A | | | | | | | | | | | | | | | | | | | | | | | | | | | | |
Six months ended August 31, 2020 (unaudited) | | $ | 8.07 | | | | 0.07 | | | | 0.00 | 4 | | | 0.57 | | | | 0.00 | | | | 0.00 | | | $ | 8.71 | |
Year ended February 29, 2020 | | $ | 8.13 | | | | 0.16 | 6 | | | 0.00 | | | | 0.03 | | | | (0.19 | ) | | | (0.06 | ) | | $ | 8.07 | |
Year ended February 28, 2019 | | $ | 9.18 | | | | 0.16 | | | | 0.00 | | | | (0.03 | ) | | | (0.19 | ) | | | (0.99 | ) | | $ | 8.13 | |
Year ended February 28, 2018 | | $ | 11.91 | | | | 0.18 | 6 | | | 0.00 | | | | 1.28 | | | | (0.20 | ) | | | (3.99 | ) | | $ | 9.18 | |
Year ended February 28, 2017 | | $ | 10.07 | | | | 0.13 | | | | 0.00 | | | | 2.05 | | | | (0.17 | ) | | | (0.17 | ) | | $ | 11.91 | |
Year ended February 29, 2016 | | $ | 11.85 | | | | 0.16 | | | | 0.00 | | | | (1.52 | ) | | | (0.13 | ) | | | (0.29 | ) | | $ | 10.07 | |
| | | | | | | |
Class R | | | | | | | | | | | | | | | | | | | | | | | | | | | | |
Six months ended August 31, 2020 (unaudited) | | $ | 8.22 | | | | 0.07 | | | | 0.05 | | | | 0.57 | | | | 0.00 | | | | 0.00 | | | $ | 8.91 | |
Year ended February 29, 2020 | | $ | 8.29 | | | | 0.13 | | | | 0.00 | | | | 0.03 | | | | (0.17 | ) | | | (0.06 | ) | | $ | 8.22 | |
Year ended February 28, 2019 | | $ | 9.33 | | | | 0.14 | | | | 0.00 | | | | (0.02 | ) | | | (0.17 | ) | | | (0.99 | ) | | $ | 8.29 | |
Year ended February 28, 2018 | | $ | 12.04 | | | | 0.16 | | | | 0.00 | | | | 1.29 | | | | (0.17 | ) | | | (3.99 | ) | | $ | 9.33 | |
Year ended February 28, 2017 | | $ | 10.19 | | | | 0.11 | | | | 0.00 | | | | 2.05 | | | | (0.14 | ) | | | (0.17 | ) | | $ | 12.04 | |
Year ended February 29, 2016 | | $ | 11.97 | | | | 0.11 | | | | 0.00 | | | | (1.51 | ) | | | (0.09 | ) | | | (0.29 | ) | | $ | 10.19 | |
| | | | | | | |
Class R4 | | | | | | | | | | | | | | | | | | | | | | | | | | | | |
Six months ended August 31, 2020 (unaudited) | | $ | 8.12 | | | | 0.09 | 6 | | | 0.00 | | | | 0.57 | | | | 0.00 | | | | 0.00 | | | $ | 8.78 | |
Year ended February 29, 2020 | | $ | 8.19 | | | | 0.18 | 6 | | | 0.00 | | | | 0.03 | | | | (0.22 | ) | | | (0.06 | ) | | $ | 8.12 | |
Year ended February 28, 2019 | | $ | 9.24 | | | | 0.20 | 6 | | | 0.00 | | | | (0.04 | ) | | | (0.22 | ) | | | (0.99 | ) | | $ | 8.19 | |
Year ended February 28, 2018 | | $ | 11.96 | | | | 0.22 | 6 | | | 0.00 | | | | 1.28 | | | | (0.23 | ) | | | (3.99 | ) | | $ | 9.24 | |
Year ended February 28, 2017 | | $ | 10.11 | | | | 0.16 | | | | 0.00 | | | | 2.06 | | | | (0.20 | ) | | | (0.17 | ) | | $ | 11.96 | |
Year ended February 29, 2016 | | $ | 11.89 | | | | 0.18 | | | | 0.00 | | | | (1.51 | ) | | | (0.16 | ) | | | (0.29 | ) | | $ | 10.11 | |
| | | | | | | |
Class R6 | | | | | | | | | | | | | | | | | | | | | | | | | | | | |
Six months ended August 31, 2020 (unaudited) | | $ | 8.09 | | | | 0.14 | | | | 0.00 | | | | 0.51 | | | | 0.00 | | | | 0.00 | | | $ | 8.74 | |
Year ended February 29, 2020 | | $ | 8.15 | | | | 0.20 | 6 | | | 0.00 | | | | 0.03 | | | | (0.23 | ) | | | (0.06 | ) | | $ | 8.09 | |
Year ended February 28, 2019 | | $ | 9.21 | | | | 0.22 | 6 | | | 0.00 | | | | (0.05 | ) | | | (0.24 | ) | | | (0.99 | ) | | $ | 8.15 | |
Year ended February 28, 2018 | | $ | 11.93 | | | | 0.29 | | | | 0.00 | | | | 1.24 | | | | (0.26 | ) | | | (3.99 | ) | | $ | 9.21 | |
Year ended February 28, 2017 | | $ | 10.10 | | | | 0.23 | | | | 0.00 | | | | 1.99 | | | | (0.22 | ) | | | (0.17 | ) | | $ | 11.93 | |
Year ended February 29, 2016 | | $ | 11.87 | | | | 0.19 | | | | 0.00 | | | | (1.49 | ) | | | (0.18 | ) | | | (0.29 | ) | | $ | 10.10 | |
| | | | | | | |
Administrator Class | | | | | | | | | | | | | | | | | | | | | | | | | | | | |
Six months ended August 31, 2020 (unaudited) | | $ | 8.21 | | | | 0.08 | 6 | | | 0.00 | | | | 0.57 | | | | 0.00 | | | | 0.00 | | | $ | 8.86 | |
Year ended February 29, 2020 | | $ | 8.27 | | | | 0.17 | 6 | | | 0.00 | | | | 0.03 | | | | (0.20 | ) | | | (0.06 | ) | | $ | 8.21 | |
Year ended February 28, 2019 | | $ | 9.29 | | | | 0.20 | 6 | | | 0.00 | | | | (0.05 | ) | | | (0.18 | ) | | | (0.99 | ) | | $ | 8.27 | |
Year ended February 28, 2018 | | $ | 12.01 | | | | 0.19 | 6 | | | 0.00 | | | | 1.28 | | | | (0.20 | ) | | | (3.99 | ) | | $ | 9.29 | |
Year ended February 28, 2017 | | $ | 10.16 | | | | 0.16 | 6 | | | 0.00 | | | | 2.04 | | | | (0.18 | ) | | | (0.17 | ) | | $ | 12.01 | |
Year ended February 29, 2016 | | $ | 11.94 | | | | 0.16 | | | | 0.00 | | | | (1.51 | ) | | | (0.14 | ) | | | (0.29 | ) | | $ | 10.16 | |
| 1 | Ratios include net expenses allocated from the affiliated Master Portfolios which were as follows: |
| | | | | | | | | | | | | | | | | | | | | | | | |
| | | Six months ended
August 31, 2020
(unaudited) | | | Year ended
February 29, 2020 | | | Year ended February 28 | | | Year ended
February 29, 2016 | |
| | | 2019 | | | 2018 | | | 2017 | |
Class A | | | 0.14 | % | | | 0.16 | % | | | 0.17 | % | | | 0.19 | % | | | 0.17 | % | | | 0.17 | % |
Class R | | | 0.11 | | | | 0.20 | | | | 0.16 | | | | 0.18 | | | | 0.16 | | | | 0.16 | |
Class R4 | | | 0.14 | | | | 0.16 | | | | 0.17 | | | | 0.19 | | | | 0.17 | | | | 0.16 | |
Class R6 | | | 0.14 | | | | 0.16 | | | | 0.17 | | | | 0.19 | | | | 0.16 | | | | 0.16 | |
Administrator Class | | | 0.14 | | | | 0.16 | | | | 0.17 | | | | 0.19 | | | | 0.17 | | | | 0.16 | |
| 2 | Total return calculations do not include any sales charges. Returns for periods of less than one year are not annualized. |
| 3 | Portfolio turnover rate is calculated by multiplying the Fund’s ownership percentage each respective affiliated Master Portfolio by the corresponding affiliated Master Portfolio’s purchases and sales. |
| 4 | Amount is less than $0.005 |
| 5 | During the six months ended August 31, 2020, the Fund received a payment from an affiliate that had an impact of less than 0.005% on total return. See Note 4 in the Notes to Financial Statements for additional information. |
| 6 | Calculated based upon average shares outstanding |
| 7 | During the six months ended August 31, 2020, the Fund received a payment from an affiliate which had an impact of 0.60% on the total return. See Note 4 in the Notes to Financial Statements for additional information. |
The accompanying notes are an integral part of these financial statements.
84 | Wells Fargo Target Date Retirement Funds
Financial highlights
| | | | | | | | | | | | | | | | | | | | | | |
| Ratio to average net assets (annualized) | | | Total
return2 | | | Portfolio
turnover
rate3 | | | Net assets at
end of period
(000s omitted) | |
Net investment
income1 | | | Gross
expenses1 | | | Net
expenses1 | |
| | | | | |
| | | | | | | | | | | | | | | | | | | | | | | |
| | | | | |
| | | | | | | | | | | | | | | | | | | | | | |
| | 1.95 | % | | | 0.93 | % | | | 0.62 | % | | | 7.93 | %5 | | | 53 | % | | $ | 40,944 | |
| | 1.85 | % | | | 0.88 | % | | | 0.63 | % | | | 2.14 | % | | | 36 | % | | $ | 42,792 | |
| | 1.88 | % | | | 0.85 | % | | | 0.65 | % | | | 2.21 | % | | | 39 | % | | $ | 56,491 | |
| | 1.48 | % | | | 0.86 | % | | | 0.72 | % | | | 11.98 | % | | | 48 | % | | $ | 61,914 | |
| | 1.22 | % | | | 0.86 | % | | | 0.83 | % | | | 21.85 | % | | | 22 | % | | $ | 70,570 | |
| | 1.09 | % | | | 0.86 | % | | | 0.83 | % | | | (11.70 | )% | | | 26 | % | | $ | 77,062 | |
| | | | | |
| | | | | | | | | | | | | | | | | | | | | | |
| | 1.69 | % | | | 1.05 | % | | | 0.86 | % | | | 8.39 | %7 | | | 53 | % | | $ | 59 | |
| | 1.47 | % | | | 1.13 | % | | | 0.90 | % | | | 1.81 | % | | | 36 | % | | $ | 49 | |
| | 1.62 | % | | | 1.09 | % | | | 0.90 | % | | | 2.03 | % | | | 39 | % | | $ | 37 | |
| | 1.25 | % | | | 1.10 | % | | | 0.97 | % | | | 11.77 | % | | | 48 | % | | $ | 36 | |
| | 0.88 | % | | | 1.11 | % | | | 1.08 | % | | | 21.41 | % | | | 22 | % | | $ | 42 | |
| | 1.01 | % | | | 1.14 | % | | | 1.09 | % | | | (11.84 | )% | | | 26 | % | | $ | 30 | |
| | | | | |
| | | | | | | | | | | | | | | | | | | | | | |
| | 2.43 | % | | | 0.66 | % | | | 0.32 | % | | | 8.13 | % | | | 53 | % | | $ | 4,285 | |
| | 2.12 | % | | | 0.60 | % | | | 0.34 | % | | | 2.34 | % | | | 36 | % | | $ | 15,460 | |
| | 2.26 | % | | | 0.57 | % | | | 0.34 | % | | | 2.53 | % | | | 39 | % | | $ | 22,076 | |
| | 1.84 | % | | | 0.59 | % | | | 0.44 | % | | | 12.39 | % | | | 48 | % | | $ | 46,811 | |
| | 1.46 | % | | | 0.59 | % | | | 0.52 | % | | | 22.25 | % | | | 22 | % | | $ | 151,999 | |
| | 1.61 | % | | | 0.60 | % | | | 0.52 | % | | | (11.41 | )% | | | 26 | % | | $ | 131,789 | |
| | | | | |
| | | | | | | | | | | | | | | | | | | | | | |
| | 2.43 | % | | | 0.50 | % | | | 0.16 | % | | | 8.03 | % | | | 53 | % | | $ | 41,426 | |
| | 2.32 | % | | | 0.45 | % | | | 0.19 | % | | | 2.64 | % | | | 36 | % | | $ | 47,672 | |
| | 2.41 | % | | | 0.42 | % | | | 0.19 | % | | | 2.61 | % | | | 39 | % | | $ | 69,435 | |
| | 1.97 | % | | | 0.43 | % | | | 0.27 | % | | | 12.61 | % | | | 48 | % | | $ | 133,524 | |
| | 1.77 | % | | | 0.43 | % | | | 0.37 | % | | | 22.26 | % | | | 22 | % | | $ | 219,922 | |
| | 1.73 | % | | | 0.45 | % | | | 0.37 | % | | | (11.21 | )% | | | 26 | % | | $ | 407,094 | |
| | | | | |
| | | | | | | | | | | | | | | | | | | | | | |
| | 2.09 | % | | | 0.85 | % | | | 0.51 | % | | | 7.92 | % | | | 53 | % | | $ | 4,157 | |
| | 1.98 | % | | | 0.80 | % | | | 0.54 | % | | | 2.21 | % | | | 36 | % | | $ | 4,545 | |
| | 2.14 | % | | | 0.76 | % | | | 0.54 | % | | | 2.32 | % | | | 39 | % | | $ | 7,213 | |
| | 1.60 | % | | | 0.77 | % | | | 0.61 | % | | | 12.05 | % | | | 48 | % | | $ | 30,255 | |
| | 1.46 | % | | | 0.78 | % | | | 0.72 | % | | | 21.89 | % | | | 22 | % | | $ | 41,504 | |
| | 1.39 | % | | | 0.79 | % | | | 0.72 | % | | | (11.55 | )% | | | 26 | % | | $ | 108,091 | |
The accompanying notes are an integral part of these financial statements.
Wells Fargo Target Date Retirement Funds | 85
Financial highlights
| | | | | | | | | | | | | | | | | | | | | | | | | | | | |
| | | Beginning
net asset
value per
share | | | Net
investment
income | | | Payment
from
affiliate | | | Net realized
and unrealized
gains (losses)
on investments | | | Distributions
from net
investment
income | | | Distributions
from net
realized gains | | | Ending
net asset
value per
share | |
| | | | | | | |
Target 2050 Fund | | | | | | | | | | | | | | | | | | | | | | | | | | | | |
| | | | | | | |
Class A | | | | | | | | | | | | | | | | | | | | | | | | | | | | |
Six months ended August 31, 2020 (unaudited) | | $ | 6.95 | | | | 0.07 | 4 | | | 0.00 | 5 | | | 0.48 | | | | 0.00 | | | | 0.00 | | | $ | 7.50 | |
Year ended February 29, 2020 | | $ | 7.13 | | | | 0.13 | 4 | | | 0.00 | | | | 0.02 | | | | (0.14 | ) | | | (0.19 | ) | | $ | 6.95 | |
Year ended February 28, 2019 | | $ | 8.61 | | | | 0.14 | | | | 0.00 | | | | (0.05 | ) | | | (0.20 | ) | | | (1.37 | ) | | $ | 7.13 | |
Year ended February 28, 2018 | | $ | 11.40 | | | | 0.20 | | | | 0.00 | | | | 1.23 | | | | (0.19 | ) | | | (4.03 | ) | | $ | 8.61 | |
Year ended February 28, 2017 | | $ | 9.61 | | | | 0.12 | | | | 0.00 | | | | 2.02 | | | | (0.18 | ) | | | (0.17 | ) | | $ | 11.40 | |
Year ended February 29, 2016 | | $ | 11.34 | | | | 0.11 | 4 | | | 0.00 | | | | (1.44 | ) | | | (0.12 | ) | | | (0.28 | ) | | $ | 9.61 | |
| | | | | | | |
Class C | | | | | | | | | | | | | | | | | | | | | | | | | | | | |
Six months ended August 31, 2020 (unaudited) | | $ | 6.91 | | | | 0.03 | | | | 0.00 | 5 | | | 0.50 | | | | 0.00 | | | | 0.00 | | | $ | 7.44 | |
Year ended February 29, 2020 | | $ | 7.08 | | | | 0.08 | 4 | | | 0.00 | | | | 0.00 | 5 | | | (0.06 | ) | | | (0.19 | ) | | $ | 6.91 | |
Year ended February 28, 2019 | | $ | 8.56 | | | | 0.06 | | | | 0.00 | | | | (0.03 | ) | | | (0.14 | ) | | | (1.37 | ) | | $ | 7.08 | |
Year ended February 28, 2018 | | $ | 11.36 | | | | 0.11 | | | | 0.00 | | | | 1.22 | | | | (0.10 | ) | | | (4.03 | ) | | $ | 8.56 | |
Year ended February 28, 2017 | | $ | 9.58 | | | | 0.04 | | | | 0.00 | | | | 2.02 | | | | (0.11 | ) | | | (0.17 | ) | | $ | 11.36 | |
Year ended February 29, 2016 | | $ | 11.30 | | | | 0.06 | | | | 0.00 | | | | (1.46 | ) | | | (0.04 | ) | | | (0.28 | ) | | $ | 9.58 | |
| | | | | | | |
Class R | | | | | | | | | | | | | | | | | | | | | | | | | | | | |
Six months ended August 31, 2020 (unaudited) | | $ | 6.96 | | | | 0.06 | 4 | | | 0.06 | | | | 0.50 | | | | 0.00 | | | | 0.00 | | | $ | 7.58 | |
Year ended February 29, 2020 | | $ | 7.15 | | | | 0.12 | | | | 0.00 | | | | 0.00 | 5 | | | (0.12 | ) | | | (0.19 | ) | | $ | 6.96 | |
Year ended February 28, 2019 | | $ | 8.63 | | | | 0.13 | | | | 0.00 | | | | (0.05 | ) | | | (0.19 | ) | | | (1.37 | ) | | $ | 7.15 | |
Year ended February 28, 2018 | | $ | 11.43 | | | | 0.15 | | | | 0.00 | | | | 1.24 | | | | (0.16 | ) | | | (4.03 | ) | | $ | 8.63 | |
Year ended February 28, 2017 | | $ | 9.63 | | | | 0.09 | | | | 0.00 | | | | 2.04 | | | | (0.16 | ) | | | (0.17 | ) | | $ | 11.43 | |
Year ended February 29, 2016 | | $ | 11.37 | | | | 0.11 | | | | 0.00 | | | | (1.47 | ) | | | (0.10 | ) | | | (0.28 | ) | | $ | 9.63 | |
| | | | | | | |
Class R4 | | | | | | | | | | | | | | | | | | | | | | | | | | | | |
Six months ended August 31, 2020 (unaudited) | | $ | 7.00 | | | | 0.08 | 4 | | | 0.00 | | | | 0.49 | | | | 0.00 | | | | 0.00 | | | $ | 7.57 | |
Year ended February 29, 2020 | | $ | 7.19 | | | | 0.16 | 4 | | | 0.00 | | | | 0.00 | 5 | | | (0.16 | ) | | | (0.19 | ) | | $ | 7.00 | |
Year ended February 28, 2019 | | $ | 8.66 | | | | 0.20 | 4 | | | 0.00 | | | | (0.07 | ) | | | (0.23 | ) | | | (1.37 | ) | | $ | 7.19 | |
Year ended February 28, 2018 | | $ | 11.45 | | | | 0.21 | 4 | | | 0.00 | | | | 1.25 | | | | (0.22 | ) | | | (4.03 | ) | | $ | 8.66 | |
Year ended February 28, 2017 | | $ | 9.64 | | | | 0.16 | 4 | | | 0.00 | | | | 2.03 | | | | (0.21 | ) | | | (0.17 | ) | | $ | 11.45 | |
Year ended February 29, 2016 | | $ | 11.38 | | | | 0.17 | | | | 0.00 | | | | (1.48 | ) | | | (0.15 | ) | | | (0.28 | ) | | $ | 9.64 | |
| | | | | | | |
Class R6 | | | | | | | | | | | | | | | | | | | | | | | | | | | | |
Six months ended August 31, 2020 (unaudited) | | $ | 6.99 | | | | 0.09 | | | | 0.00 | | | | 0.49 | | | | 0.00 | | | | 0.00 | | | $ | 7.57 | |
Year ended February 29, 2020 | | $ | 7.17 | | | | 0.17 | | | | 0.00 | | | | 0.02 | | | | (0.18 | ) | | | (0.19 | ) | | $ | 6.99 | |
Year ended February 28, 2019 | | $ | 8.65 | | | | 0.25 | | | | 0.00 | | | | (0.12 | ) | | | (0.24 | ) | | | (1.37 | ) | | $ | 7.17 | |
Year ended February 28, 2018 | | $ | 11.44 | | | | 0.26 | | | | 0.00 | | | | 1.22 | | | | (0.24 | ) | | | (4.03 | ) | | $ | 8.65 | |
Year ended February 28, 2017 | | $ | 9.64 | | | | 0.19 | 4 | | | 0.00 | | | | 2.01 | | | | (0.23 | ) | | | (0.17 | ) | | $ | 11.44 | |
Year ended February 29, 2016 | | $ | 11.37 | | | | 0.18 | | | | 0.00 | | | | (1.46 | ) | | | (0.17 | ) | | | (0.28 | ) | | $ | 9.64 | |
| | | | | | | |
Administrator Class | | | | | | | | | | | | | | | | | | | | | | | | | | | | |
Six months ended August 31, 2020 (unaudited) | | $ | 6.97 | | | | 0.07 | 4 | | | 0.00 | | | | 0.50 | | | | 0.00 | | | | 0.00 | | | $ | 7.54 | |
Year ended February 29, 2020 | | $ | 7.16 | | | | 0.14 | | | | 0.00 | | | | 0.01 | | | | (0.15 | ) | | | (0.19 | ) | | $ | 6.97 | |
Year ended February 28, 2019 | | $ | 8.62 | | | | 0.18 | | | | 0.00 | | | | (0.07 | ) | | | (0.20 | ) | | | (1.37 | ) | | $ | 7.16 | |
Year ended February 28, 2018 | | $ | 11.41 | | | | 0.20 | | | | 0.00 | | | | 1.24 | | | | (0.20 | ) | | | (4.03 | ) | | $ | 8.62 | |
Year ended February 28, 2017 | | $ | 9.61 | | | | 0.15 | 4 | | | 0.00 | | | | 2.01 | | | | (0.19 | ) | | | (0.17 | ) | | $ | 11.41 | |
Year ended February 29, 2016 | | $ | 11.34 | | | | 0.15 | | | | 0.00 | | | | (1.47 | ) | | | (0.13 | ) | | | (0.28 | ) | | $ | 9.61 | |
| 1 | Ratios include net expenses allocated from the affiliated Master Portfolios which were as follows: |
| | | | | | | | | | | | | | | | | | | | | | | | |
| | | Six months ended August 31, 2020 (unaudited) | | | Year ended February 29, 2020 | | | Year ended February 28 | | | Year ended February 29, 2016 | |
| | | 2019 | | | 2018 | | | 2017 | |
Class A | | | 0.14 | % | | | 0.16 | % | | | 0.17 | % | | | 0.19 | % | | | 0.17 | % | | | 0.17 | % |
Class C | | | 0.14 | | | | 0.16 | | | | 0.17 | | | | 0.18 | | | | 0.17 | | | | 0.16 | |
Class R | | | 0.12 | | | | 0.21 | | | | 0.18 | | | | 0.23 | | | | 0.19 | | | | 0.19 | |
Class R4 | | | 0.14 | | | | 0.16 | | | | 0.18 | | | | 0.19 | | | | 0.17 | | | | 0.16 | |
Class R6 | | | 0.14 | | | | 0.16 | | | | 0.17 | | | | 0.19 | | | | 0.16 | | | | 0.16 | |
Administrator Class | | | 0.14 | | | | 0.16 | | | | 0.17 | | | | 0.19 | | | | 0.17 | | | | 0.16 | |
| 2 | Total return calculations do not include any sales charges. Returns for periods of less than one year are not annualized. |
| 3 | Portfolio turnover rate is calculated by multiplying the Fund’s ownership percentage in each respective affiliated Master Portfolio by the corresponding affiliated Master Portfolio’s purchase and sales. |
| 4 | Calculated based upon average shares outstanding |
| 5 | Amount is less than $0.005. |
| 6 | During the six months ended August 31, 2020, the Fund received a payment from an affiliate that had an impact of less than 0.005% on total return. See Note 4 in the Notes to Financial Statements for additional information. |
| 7 | During the six months ended August 31, 2020, the Fund received a payment from an affiliate which had an impact of 0.86% on the total return. See Note 4 in the Notes to Financial Statements for additional information. |
The accompanying notes are an integral part of these financial statements.
86 | Wells Fargo Target Date Retirement Funds
Financial highlights
| | | | | | | | | | | | | | | | | | | | | | |
| Ratio to average net assets (annualized) | | | Total
return2 | | | Portfolio
turnover
rate3 | | | Net assets at
end of period
(000s omitted) | |
Net investment
income1 | | | Gross
expenses1 | | | Net
expenses1 | |
| | | | | |
| | | | | | | | | | | | | | | | | | | | | | | |
| | | | | |
| | | | | | | | | | | | | | | | | | | | | | |
| | 1.96 | % | | | 0.82 | % | | | 0.62 | % | | | 7.91 | %6 | | | 54 | % | | $ | 45,146 | |
| | 1.81 | % | | | 0.83 | % | | | 0.63 | % | | | 1.74 | % | | | 36 | % | | $ | 47,060 | |
| | 1.88 | % | | | 0.82 | % | | | 0.65 | % | | | 2.10 | % | | | 39 | % | | $ | 53,038 | |
| | 1.47 | % | | | 0.83 | % | | | 0.72 | % | | | 12.26 | % | | | 46 | % | | $ | 67,360 | |
| | 1.13 | % | | | 0.85 | % | | | 0.83 | % | | | 22.48 | % | | | 21 | % | | $ | 64,356 | |
| | 1.05 | % | | | 0.86 | % | | | 0.83 | % | | | (11.93 | )% | | | 26 | % | | $ | 58,749 | |
| | | | | |
| | | | | | | | | | | | | | | | | | | | | | |
| | 1.21 | % | | | 1.51 | % | | | 1.37 | % | | | 7.67 | %6 | | | 54 | % | | $ | 522 | |
| | 1.12 | % | | | 1.57 | % | | | 1.39 | % | | | 0.88 | % | | | 36 | % | | $ | 519 | |
| | 1.13 | % | | | 1.57 | % | | | 1.40 | % | | | 1.38 | % | | | 39 | % | | $ | 1,013 | |
| | 0.72 | % | | | 1.58 | % | | | 1.46 | % | | | 11.38 | % | | | 46 | % | | $ | 1,376 | |
| | 0.33 | % | | | 1.61 | % | | | 1.58 | % | | | 21.58 | % | | | 21 | % | | $ | 1,218 | |
| | 0.49 | % | | | 1.64 | % | | | 1.60 | % | | | (12.56 | )% | | | 26 | % | | $ | 894 | |
| | | | | |
| | | | | | | | | | | | | | | | | | | | | | |
| | 1.71 | % | | | 0.89 | % | | | 0.84 | % | | | 8.91 | %7 | | | 54 | % | | $ | 48 | |
| | 1.50 | % | | | 1.07 | % | | | 0.89 | % | | | 1.38 | % | | | 36 | % | | $ | 37 | |
| | 1.58 | % | | | 1.08 | % | | | 0.90 | % | | | 1.93 | % | | | 39 | % | | $ | 32 | |
| | 1.24 | % | | | 1.12 | % | | | 0.97 | % | | | 11.88 | % | | | 46 | % | | $ | 28 | |
| | 0.94 | % | | | 1.13 | % | | | 1.08 | % | | | 22.29 | % | | | 21 | % | | $ | 34 | |
| | 1.00 | % | | | 1.17 | % | | | 1.10 | % | | | (12.21 | )% | | | 26 | % | | $ | 32 | |
| | | | | |
| | | | | | | | | | | | | | | | | | | | | | |
| | 2.32 | % | | | 0.54 | % | | | 0.31 | % | | | 8.14 | % | | | 54 | % | | $ | 11,681 | |
| | 2.08 | % | | | 0.55 | % | | | 0.34 | % | | | 1.89 | % | | | 36 | % | | $ | 17,989 | |
| | 2.40 | % | | | 0.53 | % | | | 0.34 | % | | | 2.57 | % | | | 39 | % | | $ | 19,551 | |
| | 1.82 | % | | | 0.56 | % | | | 0.42 | % | | | 12.54 | % | | | 46 | % | | $ | 122,118 | |
| | 1.45 | % | | | 0.57 | % | | | 0.52 | % | | | 23.00 | % | | | 21 | % | | $ | 243,339 | |
| | 1.61 | % | | | 0.59 | % | | | 0.52 | % | | | (11.72 | )% | | | 26 | % | | $ | 219,157 | |
| | | | | |
| | | | | | | | | | | | | | | | | | | | | | |
| | 2.41 | % | | | 0.39 | % | | | 0.16 | % | | | 8.30 | % | | | 54 | % | | $ | 113,404 | |
| | 2.23 | % | | | 0.40 | % | | | 0.19 | % | | | 2.18 | % | | | 36 | % | | $ | 107,869 | |
| | 2.37 | % | | | 0.39 | % | | | 0.19 | % | | | 2.61 | % | | | 39 | % | | $ | 107,769 | |
| | 1.95 | % | | | 0.41 | % | | | 0.27 | % | | | 12.73 | % | | | 46 | % | | $ | 180,036 | |
| | 1.81 | % | | | 0.42 | % | | | 0.37 | % | | | 23.09 | % | | | 21 | % | | $ | 287,423 | |
| | 1.72 | % | | | 0.44 | % | | | 0.37 | % | | | (11.51 | )% | | | 26 | % | | $ | 806,152 | |
| | | | | |
| | | | | | | | | | | | | | | | | | | | | | |
| | 2.08 | % | | | 0.74 | % | | | 0.51 | % | | | 8.18 | % | | | 54 | % | | $ | 36,507 | |
| | 1.88 | % | | | 0.75 | % | | | 0.54 | % | | | 1.70 | % | | | 36 | % | | $ | 39,498 | |
| | 2.07 | % | | | 0.74 | % | | | 0.54 | % | | | 2.37 | % | | | 39 | % | | $ | 40,236 | |
| | 1.59 | % | | | 0.75 | % | | | 0.61 | % | | | 12.29 | % | | | 46 | % | | $ | 82,574 | |
| | 1.37 | % | | | 0.76 | % | | | 0.72 | % | | | 22.72 | % | | | 21 | % | | $ | 121,028 | |
| | 1.39 | % | | | 0.78 | % | | | 0.72 | % | | | (11.86 | )% | | | 26 | % | | $ | 185,008 | |
The accompanying notes are an integral part of these financial statements.
Wells Fargo Target Date Retirement Funds | 87
Financial highlights
| | | | | | | | | | | | | | | | | | | | | | | | | | | | |
| | | Beginning
net asset
value per
share | | | Net
investment
income | | | Payment
from
affiliate | | | Net realized
and unrealized
gains (losses)
on investments | | | Distributions
from net
investment
income | | | Distributions
from net
realized gains | | | Ending
net asset
value per
share | |
| | | | | | | |
Target 2055 Fund | | | | | | | | | | | | | | | | | | | | | | | | | | | | |
| | | | | | | |
Class A | | | | | | | | | | | | | | | | | | | | | | | | | | | | |
Six months ended August 31, 2020 (unaudited) | | $ | 11.54 | | | | 0.11 | 4 | | | 0.00 | | | | 0.81 | | | | 0.00 | | | | 0.00 | | | $ | 12.46 | |
Year ended February 29, 2020 | | $ | 11.56 | | | | 0.22 | 4 | | | 0.00 | | | | (0.01 | ) | | | (0.22 | ) | | | (0.01 | ) | | $ | 11.54 | |
Year ended February 28, 2019 | | $ | 12.72 | | | | 0.22 | | | | 0.00 | | | | (0.02 | ) | | | (0.30 | ) | | | (1.06 | ) | | $ | 11.56 | |
Year ended February 28, 2018 | | $ | 13.91 | | | | 0.21 | 4 | | | 0.00 | | | | 1.50 | | | | (0.23 | ) | | | (2.67 | ) | | $ | 12.72 | |
Year ended February 28, 2017 | | $ | 11.56 | | | | 0.14 | | | | 0.00 | | | | 2.44 | | | | (0.23 | ) | | | 0.00 | | | $ | 13.91 | |
Year ended February 29, 2016 | | $ | 13.28 | | | | 0.14 | 4 | | | 0.00 | | | | (1.71 | ) | | | (0.12 | ) | | | (0.03 | ) | | $ | 11.56 | |
| | | | | | | |
Class R | | | | | | | | | | | | | | | | | | | | | | | | | | | | |
Six months ended August 31, 2020 (unaudited) | | $ | 11.35 | | | | 0.10 | | | | 0.08 | | | | 0.79 | | | | 0.00 | | | | 0.00 | | | $ | 12.32 | |
Year ended February 29, 2020 | | $ | 11.39 | | | | 0.18 | | | | 0.00 | | | | 0.00 | 6 | | | (0.21 | ) | | | (0.01 | ) | | $ | 11.35 | |
Year ended February 28, 2019 | | $ | 12.56 | | | | 0.19 | | | | 0.00 | | | | (0.03 | ) | | | (0.27 | ) | | | (1.06 | ) | | $ | 11.39 | |
Year ended February 28, 2018 | | $ | 13.76 | | | | 0.18 | | | | 0.00 | | | | 1.49 | | | | (0.20 | ) | | | (2.67 | ) | | $ | 12.56 | |
Year ended February 28, 2017 | | $ | 11.45 | | | | 0.10 | | | | 0.00 | | | | 2.41 | | | | (0.20 | ) | | | 0.00 | | | $ | 13.76 | |
Year ended February 29, 2016 | | $ | 13.16 | | | | 0.12 | | | | 0.00 | | | | (1.71 | ) | | | (0.09 | ) | | | (0.03 | ) | | $ | 11.45 | |
| | | | | | | |
Class R4 | | | | | | | | | | | | | | | | | | | | | | | | | | | | |
Six months ended August 31, 2020 (unaudited) | | $ | 11.58 | | | | 0.13 | 4 | | | 0.00 | | | | 0.81 | | | | 0.00 | | | | 0.00 | | | $ | 12.52 | |
Year ended February 29, 2020 | | $ | 11.60 | | | | 0.25 | 4 | | | 0.00 | | | | 0.00 | 6 | | | (0.26 | ) | | | (0.01 | ) | | $ | 11.58 | |
Year ended February 28, 2019 | | $ | 12.76 | | | | 0.28 | 4 | | | 0.00 | | | | (0.05 | ) | | | (0.33 | ) | | | (1.06 | ) | | $ | 11.60 | |
Year ended February 28, 2018 | | $ | 13.94 | | | | 0.27 | 4 | | | 0.00 | | | | 1.50 | | | | (0.28 | ) | | | (2.67 | ) | | $ | 12.76 | |
Year ended February 28, 2017 | | $ | 11.59 | | | | 0.18 | | | | 0.00 | | | | 2.44 | | | | (0.27 | ) | | | 0.00 | | | $ | 13.94 | |
Year ended February 29, 2016 | | $ | 13.32 | | | | 0.20 | | | | 0.00 | | | | (1.74 | ) | | | (0.16 | ) | | | (0.03 | ) | | $ | 11.59 | |
| | | | | | | |
Class R6 | | | | | | | | | | | | | | | | | | | | | | | | | | | | |
Six months ended August 31, 2020 (unaudited) | | $ | 11.55 | | | | 0.14 | 4 | | | 0.00 | | | | 0.81 | | | | 0.00 | | | | 0.00 | | | $ | 12.50 | |
Year ended February 29, 2020 | | $ | 11.57 | | | | 0.27 | 4 | | | 0.00 | | | | 0.00 | 6 | | | (0.28 | ) | | | (0.01 | ) | | $ | 11.55 | |
Year ended February 28, 2019 | | $ | 12.73 | | | | 0.31 | 4 | | | 0.00 | | | | (0.06 | ) | | | (0.35 | ) | | | (1.06 | ) | | $ | 11.57 | |
Year ended February 28, 2018 | | $ | 13.91 | | | | 0.31 | | | | 0.00 | | | | 1.48 | | | | (0.30 | ) | | | (2.67 | ) | | $ | 12.73 | |
Year ended February 28, 2017 | | $ | 11.57 | | | | 0.23 | 4 | | | 0.00 | | | | 2.40 | | | | (0.29 | ) | | | 0.00 | | | $ | 13.91 | |
Year ended February 29, 20165 | | $ | 13.29 | | | | 0.21 | | | | 0.00 | | | | (1.72 | ) | | | (0.18 | ) | | | (0.03 | ) | | $ | 11.57 | |
| | | | | | | |
Administrator Class | | | | | | | | | | | | | | | | | | | | | | | | | | | | |
Six months ended August 31, 2020 (unaudited) | | $ | 11.63 | | | | 0.12 | 4 | | | 0.00 | | | | 0.81 | | | | 0.00 | | | | 0.00 | | | $ | 12.56 | |
Year ended February 29, 2020 | | $ | 11.57 | | | | 0.24 | 4 | | | 0.00 | | | | (0.03 | ) | | | (0.14 | ) | | | (0.01 | ) | | $ | 11.63 | |
Year ended February 28, 2019 | | $ | 12.73 | | | | 0.28 | 4 | | | 0.00 | | | | (0.07 | ) | | | (0.31 | ) | | | (1.06 | ) | | $ | 11.57 | |
Year ended February 28, 2018 | | $ | 13.91 | | | | 0.23 | 4 | | | 0.00 | | | | 1.50 | | | | (0.24 | ) | | | (2.67 | ) | | $ | 12.73 | |
Year ended February 28, 2017 | | $ | 11.57 | | | | 0.17 | 4 | | | 0.00 | | | | 2.41 | | | | (0.24 | ) | | | 0.00 | | | $ | 13.91 | |
Year ended February 29, 2016 | | $ | 13.28 | | | | 0.17 | | | | 0.00 | | | | (1.71 | ) | | | (0.14 | ) | | | (0.03 | ) | | $ | 11.57 | |
| 1 | Ratios include net expenses allocated from the affiliated Master Portfolios which were as follows: |
| | | | | | | | | | | | | | | | | | | | | | | | |
| | | Six months ended August 31, 2020 (unaudited) | | | Year ended
February 29, 2020 | | | Year ended February 28 | | | Year ended February 29, 2016 | |
| | | 2019 | | | 2018 | | | 2017 | |
Class A | | | 0.14 | % | | | 0.16 | % | | | 0.17 | % | | | 0.19 | % | | | 0.17 | % | | | 0.17 | % |
Class R | | | 0.12 | | | | 0.21 | | | | 0.17 | | | | 0.19 | | | | 0.17 | | | | 0.20 | |
Class R4 | | | 0.15 | | | | 0.16 | | | | 0.18 | | | | 0.19 | | | | 0.17 | | | | 0.16 | |
Class R6 | | | 0.14 | | | | 0.16 | | | | 0.18 | | | | 0.19 | | | | 0.16 | | | | 0.16 | |
Administrator Class | | | 0.14 | | | | 0.16 | | | | 0.18 | | | | 0.19 | | | | 0.17 | | | | 0.16 | |
| 2 | Total return calculations do not include any sales charges. Returns for periods of less than one year are not annualized. |
| 3 | Portfolio turnover rate is calculated by multiplying the Fund’s ownership percentage in each respective affiliated Master Portfolio by the corresponding affiliated Master Portfolio’s purchase and sales. |
| 4 | Calculated based upon average shares outstanding |
| 5 | During the six months ended August 31, 2020, the Fund received a payment from an affiliate which had an impact of 0.71% on the total return. See Note 4 in the Notes to Financial Statements for additional information. |
| 6 | Amount is less than $0.005. |
The accompanying notes are an integral part of these financial statements.
88 | Wells Fargo Target Date Retirement Funds
Financial highlights
| | | | | | | | | | | | | | | | | | | | | | |
| Ratio to average net assets (annualized) | | | Total
return2 | | | Portfolio
turnover
rate3 | | |
Net assets at
end of period
(000s omitted) | |
Net investment
income1 | | | Gross
expenses1 | | | Net
expenses1 | |
| | | | | |
| | | | | | | | | | | | | | | | | | | | | | | |
| | | | | |
| | | | | | | | | | | | | | | | | | | | | | |
| | 1.97 | % | | | 1.43 | % | | | 0.62 | % | | | 7.97 | % | | | 54 | % | | $ | 6,875 | |
| | 1.87 | % | | | 1.21 | % | | | 0.63 | % | | | 1.62 | % | | | 36 | % | | $ | 7,374 | |
| | 1.86 | % | | | 1.17 | % | | | 0.65 | % | | | 2.29 | % | | | 39 | % | | $ | 10,582 | |
| | 1.47 | % | | | 1.04 | % | | | 0.71 | % | | | 12.15 | % | | | 46 | % | | $ | 10,352 | |
| | 1.13 | % | | | 0.91 | % | | | 0.83 | % | | | 22.45 | % | | | 21 | % | | $ | 9,270 | |
| | 1.15 | % | | | 0.94 | % | | | 0.84 | % | | | (11.93 | )% | | | 26 | % | | $ | 8,940 | |
| | | | | |
| | | | | | | | | | | | | | | | | | | | | | |
| | | | | |
| | 1.71 | % | | | 1.49 | % | | | 0.86 | % | | | 8.55 | %5 | | | 54 | % | | $ | 46 | |
| | 1.52 | % | | | 1.45 | % | | | 0.89 | % | | | 1.43 | % | | | 36 | % | | $ | 41 | |
| | 1.60 | % | | | 1.39 | % | | | 0.89 | % | | | 1.96 | % | | | 39 | % | | $ | 43 | |
| | 1.22 | % | | | 1.29 | % | | | 0.96 | % | | | 11.99 | % | | | 46 | % | | $ | 42 | |
| | 0.98 | % | | | 1.16 | % | | | 1.08 | % | | | 22.04 | % | | | 21 | % | | $ | 40 | |
| | 0.98 | % | | | 1.24 | % | | | 1.09 | % | | | (12.16 | )% | | | 26 | % | | $ | 42 | |
| | | | | |
| | | | | | | | | | | | | | | | | | | | | | |
| | | | | |
| | 2.45 | % | | | 1.14 | % | | | 0.32 | % | | | 8.12 | % | | | 54 | % | | $ | 1,954 | |
| | 2.08 | % | | | 0.93 | % | | | 0.34 | % | | | 1.98 | % | | | 36 | % | | $ | 7,233 | |
| | 2.24 | % | | | 0.93 | % | | | 0.34 | % | | | 2.57 | % | | | 39 | % | | $ | 7,578 | |
| | 1.85 | % | | | 0.73 | % | | | 0.44 | % | | | 12.56 | % | | | 46 | % | | $ | 15,764 | |
| | 1.32 | % | | | 0.64 | % | | | 0.52 | % | | | 22.78 | % | | | 21 | % | | $ | 43,147 | |
| | 1.61 | % | | | 0.66 | % | | | 0.52 | % | | | (11.70 | )% | | | 26 | % | | $ | 27,193 | |
| | | | | |
| | | | | | | | | | | | | | | | | | | | | | |
| | 2.43 | % | | | 1.00 | % | | | 0.16 | % | | | 8.23 | % | | | 54 | % | | $ | 17,915 | |
| | 2.23 | % | | | 0.78 | % | | | 0.19 | % | | | 2.10 | % | | | 36 | % | | $ | 19,338 | |
| | 2.46 | % | | | 0.87 | % | | | 0.19 | % | | | 2.71 | % | | | 39 | % | | $ | 18,491 | |
| | 1.94 | % | | | 0.60 | % | | | 0.26 | % | | | 12.76 | % | | | 46 | % | | $ | 56,563 | |
| | 1.79 | % | | | 0.47 | % | | | 0.37 | % | | | 22.97 | % | | | 21 | % | | $ | 65,516 | |
| | 1.72 | % | | | 0.51 | % | | | 0.37 | % | | | (11.52 | )% | | | 26 | % | | $ | 161,764 | |
| | | | | |
| | | | | | | | | | | | | | | | | | | | | | |
| | 2.07 | % | | | 1.35 | % | | | 0.50 | % | | | 8.00 | % | | | 54 | % | | $ | 917 | |
| | 1.97 | % | | | 1.13 | % | | | 0.54 | % | | | 1.74 | % | | | 36 | % | | $ | 759 | |
| | 2.22 | % | | | 1.37 | % | | | 0.54 | % | | | 2.37 | % | | | 39 | % | | $ | 1,188 | |
| | 1.62 | % | | | 0.94 | % | | | 0.62 | % | | | 12.32 | % | | | 46 | % | | $ | 5,662 | |
| | 1.34 | % | | | 0.83 | % | | | 0.72 | % | | | 22.50 | % | | | 21 | % | | $ | 9,700 | |
| | 1.37 | % | | | 0.85 | % | | | 0.72 | % | | | (11.75 | )% | | | 26 | % | | $ | 14,747 | |
The accompanying notes are an integral part of these financial statements.
Wells Fargo Target Date Retirement Funds | 89
Financial highlights
| | | | | | | | | | | | | | | | | | | | | | | | | | | | |
| | | Beginning
net asset
value per
share | | | Net
investment
income | | | Payment from affiliate | | | Net realized
and unrealized
gains (losses)
on investments | | | Distributions
from net
investment
income | | | Distributions
from net
realized gains | | | Ending
net asset
value per
share | |
| | | | | | | |
Target 2060 Fund | | | | | | | | | | | | | | | | | | | | | | | | | | | | |
| | | | | | | |
Class A | | | | | | | | | | | | | | | | | | | | | | | | | | | | |
Six months ended August 31, 2020 (unaudited) | | $ | 11.44 | | | | 0.11 | | | | 0.00 | | | | 0.82 | | | | 0.00 | | | | 0.00 | | | $ | 12.37 | |
Year ended February 29, 2020 | | $ | 11.44 | | | | 0.19 | | | | 0.00 | | | | 0.02 | | | | (0.21 | ) | | | 0.00 | | | $ | 11.44 | |
Year ended February 28, 2019 | | $ | 11.83 | | | | 0.22 | 4 | | | 0.00 | | | | (0.01 | ) | | | (0.25 | ) | | | (0.35 | ) | | $ | 11.44 | |
Year ended February 28, 2018 | | $ | 10.69 | | | | 0.15 | | | | 0.00 | | | | 1.15 | | | | (0.16 | ) | | | 0.00 | | | $ | 11.83 | |
Year ended February 28, 2017 | | $ | 8.84 | | | | 0.09 | 4 | | | 0.00 | | | | 1.86 | | | | (0.10 | ) | | | 0.00 | | | $ | 10.69 | |
Year ended February 29, 20165 | | $ | 10.00 | | | | 0.06 | | | | 0.00 | | | | (1.11 | ) | | | (0.11 | ) | | | 0.00 | | | $ | 8.84 | |
| | | | | | | |
Class C | | | | | | | | | | | | | | | | | | | | | | | | | | | | |
Six months ended August 31, 2020 (unaudited) | | $ | 11.43 | | | | 0.07 | | | | 0.10 | | | | 0.81 | | | | 0.00 | | | | 0.00 | | | $ | 12.41 | |
Year ended February 29, 2020 | | $ | 11.42 | | | | 0.08 | | | | 0.00 | | | | 0.04 | | | | (0.11 | ) | | | 0.00 | | | $ | 11.43 | |
Year ended February 28, 2019 | | $ | 11.85 | | | | 0.13 | | | | 0.00 | | | | (0.00 | )7 | | | (0.21 | ) | | | (0.35 | ) | | $ | 11.42 | |
Year ended February 28, 2018 | | $ | 10.71 | | | | 0.07 | | | | 0.00 | | | | 1.15 | | | | (0.08 | ) | | | 0.00 | | | $ | 11.85 | |
Year ended February 28, 2017 | | $ | 8.90 | | | | 0.04 | | | | 0.00 | | | | 1.84 | | | | (0.07 | ) | | | 0.00 | | | $ | 10.71 | |
Year ended February 29, 20165 | | $ | 10.00 | | | | 0.01 | | | | 0.00 | | | | (1.11 | ) | | | 0.00 | | | | 0.00 | | | $ | 8.90 | |
| | | | | | | |
Class R | | | | | | | | | | | | | | | | | | | | | | | | | | | | |
Six months ended August 31, 2020 (unaudited) | | $ | 11.21 | | | | 0.09 | 4 | | | 0.13 | | | | 0.80 | | | | 0.00 | | | | 0.00 | | | $ | 12.23 | |
Year ended February 29, 2020 | | $ | 11.22 | | | | 0.18 | 4 | | | 0.00 | | | | (0.01 | ) | | | (0.18 | ) | | | 0.00 | | | $ | 11.21 | |
Year ended February 28, 2019 | | $ | 11.65 | | | | 0.19 | | | | 0.00 | | | | (0.01 | ) | | | (0.26 | ) | | | (0.35 | ) | | $ | 11.22 | |
Year ended February 28, 2018 | | $ | 10.53 | | | | 0.14 | | | | 0.00 | | | | 1.11 | | | | (0.13 | ) | | | 0.00 | | | $ | 11.65 | |
Year ended February 28, 2017 | | $ | 8.84 | | | | 0.09 | 4 | | | 0.00 | | | | 1.80 | | | | (0.20 | ) | | | 0.00 | | | $ | 10.53 | |
Year ended February 29, 20165 | | $ | 10.00 | | | | 0.05 | | | | 0.00 | | | | (1.11 | ) | | | (0.10 | ) | | | 0.00 | | | $ | 8.84 | |
| | | | | | | |
Class R4 | | | | | | | | | | | | | | | | | | | | | | | | | | | | |
Six months ended August 31, 2020 (unaudited) | | $ | 11.67 | | | | 0.13 | 4 | | | 0.00 | | | | 0.83 | | | | 0.00 | | | | 0.00 | | | $ | 12.63 | |
Year ended February 29, 2020 | | $ | 11.66 | | | | 0.22 | | | | 0.00 | | | | 0.02 | | | | (0.23 | ) | | | 0.00 | | | $ | 11.67 | |
Year ended February 28, 2019 | | $ | 12.06 | | | | 0.28 | 4 | | | 0.00 | | | | (0.02 | ) | | | (0.31 | ) | | | (0.35 | ) | | $ | 11.66 | |
Year ended February 28, 2018 | | $ | 10.88 | | | | 0.21 | | | | 0.00 | | | | 1.16 | | | | (0.19 | ) | | | 0.00 | | | $ | 12.06 | |
Year ended February 28, 2017 | | $ | 8.97 | | | | 0.12 | 4 | | | 0.00 | | | | 1.89 | | | | (0.10 | ) | | | 0.00 | | | $ | 10.88 | |
Year ended February 29, 20165 | | $ | 10.00 | | | | 0.08 | 4 | | | 0.00 | | | | (1.11 | ) | | | 0.00 | | | | 0.00 | | | $ | 8.97 | |
| | | | | | | |
Class R6 | | | | | | | | | | | | | | | | | | | | | | | | | | | | |
Six months ended August 31, 2020 (unaudited) | | $ | 11.62 | | | | 0.14 | 4 | | | 0.00 | | | | 0.83 | | | | 0.00 | | | | 0.00 | | | $ | 12.59 | |
Year ended February 29, 2020 | | $ | 11.61 | | | | 0.25 | | | | 0.00 | | | | 0.01 | | | | (0.25 | ) | | | 0.00 | | | $ | 11.62 | |
Year ended February 28, 2019 | | $ | 12.03 | | | | 0.28 | 4 | | | 0.00 | | | | (0.01 | ) | | | (0.34 | ) | | | (0.35 | ) | | $ | 11.61 | |
Year ended February 28, 2018 | | $ | 10.86 | | | | 0.24 | | | | 0.00 | | | | 1.14 | | | | (0.21 | ) | | | 0.00 | | | $ | 12.03 | |
Year ended February 28, 2017 | | $ | 8.95 | | | | 0.13 | 4 | | | 0.00 | | | | 1.90 | | | | (0.12 | ) | | | 0.00 | | | $ | 10.86 | |
Year ended February 29, 20165 | | $ | 10.00 | | | | 0.09 | 4 | | | 0.00 | | | | (1.12 | ) | | | (0.02 | ) | | | 0.00 | | | $ | 8.95 | |
| | | | | | | |
Administrator Class | | | | | | | | | | | | | | | | | | | | | | | | | | | | |
Six months ended August 31, 2020 (unaudited) | | $ | 11.49 | | | | 0.12 | 4 | | | 0.00 | | | | 0.81 | | | | 0.00 | | | | 0.00 | | | $ | 12.42 | |
Year ended February 29, 2020 | | $ | 11.48 | | | | 0.21 | | | | 0.00 | | | | 0.01 | | | | (0.21 | ) | | | 0.00 | | | $ | 11.49 | |
Year ended February 28, 2019 | | $ | 11.89 | | | | 0.24 | 4 | | | 0.00 | | | | (0.01 | ) | | | (0.29 | ) | | | (0.35 | ) | | $ | 11.48 | |
Year ended February 28, 2018 | | $ | 10.74 | | | | 0.19 | | | | 0.00 | | | | 1.13 | | | | (0.17 | ) | | | 0.00 | | | $ | 11.89 | |
Year ended February 28, 2017 | | $ | 8.89 | | | | 0.10 | 4 | | | 0.00 | | | | 1.88 | | | | (0.13 | ) | | | 0.00 | | | $ | 10.74 | |
Year ended February 29, 20165 | | $ | 10.00 | | | | 0.07 | | | | 0.00 | | | | (1.12 | ) | | | (0.06 | ) | | | 0.00 | | | $ | 8.89 | |
| 1 | Ratios include net expenses allocated from the affiliated Master Portfolios which were as follows: |
| | | | | | | | | | | | | | | | | | | | | | | | |
| | | Six months ended August 31, 2020 (unaudited) | | | Year ended February 29, 2020 | | | Year ended February 28 | | | Year ended February 29, 20165 | |
| | | 2019 | | | 2018 | | | 2017 | |
Class A | | | 0.14 | % | | | 0.16 | % | | | 0.17 | % | | | 0.18 | % | | | 0.17 | % | | | 0.15 | % |
Class C | | | 0.19 | | | | 0.18 | | | | 0.17 | | | | 0.18 | | | | 0.16 | | | | 0.16 | |
Class R | | | 0.20 | | | | 0.19 | | | | 0.18 | | | | 0.20 | | | | 0.19 | | | | 0.17 | |
Class R4 | | | 0.14 | | | | 0.16 | | | | 0.18 | | | | 0.19 | | | | 0.17 | | | | 0.16 | |
Class R6 | | | 0.14 | | | | 0.16 | | | | 0.18 | | | | 0.19 | | | | 0.17 | | | | 0.16 | |
Administrator Class | | | 0.14 | | | | 0.16 | | | | 0.18 | | | | 0.19 | | | | 0.17 | | | | 0.16 | |
| 2 | Total return calculations do not include any sales charges. Returns for periods of less than one year are not annualized. |
| 3 | Portfolio turnover rate is calculated by multiplying the Fund’s ownership percentage in each respective affiliated Master Portfolio by the corresponding affiliated Master Portfolio’s purchase and sales. |
| 4 | Calculated based upon average shares outstanding |
| 5 | For the period from June 30, 2015 (commencement of class operations) to February 29, 2016 |
| 6 | During the six months ended August 31, 2020, the Fund received a payment from an affiliate which had an impact of 0.87% on the total return. See Note 4 in the Notes to Financial Statements for additional information. |
| 7 | Amount is more than $(0.005). |
| 8 | During the six months ended August 31, 2020, the Fund received a payment from an affiliate which had an impact of 1.16% on the total return. See Note 4 in the Notes to Financial Statements for additional information. |
The accompanying notes are an integral part of these financial statements.
90 | Wells Fargo Target Date Retirement Funds
Financial highlights
| | | | | | | | | | | | | | | | | | | | | | |
| Ratio to average net assets (annualized) | | | Total
return2 | | | Portfolio
turnover
rate3 | | |
Net assets at
end of period
(000s omitted) | |
Net investment
income1 | | | Gross
expenses1 | | | Net
expenses1 | |
| | | | | |
| | | | | | | | | | | | | | | | | | | | | | | |
| | | | | |
| | | | | | | | | | | | | | | | | | | | | | |
| | 2.00 | % | | | 1.59 | % | | | 0.62 | % | | | 8.13 | % | | | 54 | % | | $ | 1,053 | |
| | 1.74 | % | | | 1.61 | % | | | 0.64 | % | | | 1.67 | % | | | 36 | % | | $ | 973 | |
| | 1.88 | % | | | 2.69 | % | | | 0.65 | % | | | 2.18 | % | | | 39 | % | | $ | 660 | |
| | 1.45 | % | | | 1.79 | % | | | 0.71 | % | | | 12.20 | % | | | 46 | % | | $ | 907 | |
| | 0.90 | % | | | 3.21 | % | | | 0.83 | % | | | 22.23 | % | | | 21 | % | | $ | 671 | |
| | 0.97 | % | | | 14.47 | % | | | 0.83 | % | | | (10.59 | )% | | | 26 | % | | $ | 100 | |
| | | | | |
| | | | | | | | | | | | | | | | | | | | | | |
| | 1.22 | % | | | 2.30 | % | | | 1.36 | % | | | 8.57 | %6 | | | 54 | % | | $ | 157 | |
| | 1.09 | % | | | 2.35 | % | | | 1.39 | % | | | 0.94 | % | | | 36 | % | | $ | 142 | |
| | 1.10 | % | | | 3.06 | % | | | 1.40 | % | | | 1.42 | % | | | 39 | % | | $ | 221 | |
| | 0.73 | % | | | 2.41 | % | | | 1.47 | % | | | 11.37 | % | | | 46 | % | | $ | 196 | |
| | 0.39 | % | | | 5.30 | % | | | 1.58 | % | | | 21.22 | % | | | 21 | % | | $ | 252 | |
| | 0.21 | % | | | 15.14 | % | | | 1.58 | % | | | (11.00 | )% | | | 26 | % | | $ | 173 | |
| | | | | |
| | | | | | | | | | | | | | | | | | | | | | |
| | 1.71 | % | | | 1.81 | % | | | 0.86 | % | | | 9.10 | %8 | | | 54 | % | | $ | 84 | |
| | 1.50 | % | | | 1.85 | % | | | 0.90 | % | | | 1.42 | % | | | 36 | % | | $ | 67 | |
| | 1.62 | % | | | 2.59 | % | | | 0.90 | % | | | 1.91 | % | | | 39 | % | | $ | 54 | |
| | 1.24 | % | | | 1.81 | % | | | 0.97 | % | | | 11.90 | % | | | 46 | % | | $ | 50 | |
| | 0.89 | % | | | 4.69 | % | | | 1.08 | % | | | 21.73 | % | | | 21 | % | | $ | 127 | |
| | 0.72 | % | | | 14.73 | % | | | 1.08 | % | | | (10.66 | )% | | | 26 | % | | $ | 89 | |
| | | | | |
| | | | | | | | | | | | | | | | | | | | | | |
| | 2.28 | % | | | 1.31 | % | | | 0.31 | % | | | 8.23 | % | | | 54 | % | | $ | 2,158 | |
| | 2.07 | % | | | 1.33 | % | | | 0.34 | % | | | 1.94 | % | | | 36 | % | | $ | 2,297 | |
| | 2.34 | % | | | 3.01 | % | | | 0.34 | % | | | 2.56 | % | | | 39 | % | | $ | 2,038 | |
| | 1.81 | % | | | 1.38 | % | | | 0.41 | % | | | 12.61 | % | | | 46 | % | | $ | 5,119 | |
| | 1.14 | % | | | 1.88 | % | | | 0.52 | % | | | 22.45 | % | | | 21 | % | | $ | 6,443 | |
| | 1.29 | % | | | 14.19 | % | | | 0.52 | % | | | (10.30 | )% | | | 26 | % | | $ | 195 | |
| | | | | |
| | | | | | | | | | | | | | | | | | | | | | |
| | 2.42 | % | | | 1.15 | % | | | 0.15 | % | | | 8.35 | % | | | 54 | % | | $ | 18,954 | |
| | 2.20 | % | | | 1.18 | % | | | 0.19 | % | | | 2.07 | % | | | 36 | % | | $ | 15,541 | |
| | 2.36 | % | | | 1.88 | % | | | 0.19 | % | | | 2.68 | % | | | 39 | % | | $ | 10,497 | |
| | 1.95 | % | | | 1.29 | % | | | 0.26 | % | | | 12.70 | % | | | 46 | % | | $ | 12,115 | |
| | 1.31 | % | | | 1.82 | % | | | 0.37 | % | | | 22.75 | % | | | 21 | % | | $ | 12,518 | |
| | 1.41 | % | | | 14.05 | % | | | 0.37 | % | | | (10.30 | )% | | | 26 | % | | $ | 573 | |
| | | | | |
| | | | | | | | | | | | | | | | | | | | | | |
| | 2.11 | % | | | 1.51 | % | | | 0.51 | % | | | 8.18 | % | | | 54 | % | | $ | 2,861 | |
| | 1.87 | % | | | 1.53 | % | | | 0.54 | % | | | 1.79 | % | | | 36 | % | | $ | 3,623 | |
| | 2.06 | % | | | 2.42 | % | | | 0.54 | % | | | 2.32 | % | | | 39 | % | | $ | 3,068 | |
| | 1.58 | % | | | 1.61 | % | | | 0.61 | % | | | 12.27 | % | | | 46 | % | | $ | 4,267 | |
| | 0.98 | % | | | 2.31 | % | | | 0.72 | % | | | 22.38 | % | | | 21 | % | | $ | 4,427 | |
| | 1.10 | % | | | 14.35 | % | | | 0.72 | % | | | (10.50 | )% | | | 26 | % | | $ | 359 | |
The accompanying notes are an integral part of these financial statements.
Wells Fargo Target Date Retirement Funds | 91
Notes to financial statements (unaudited)
1. ORGANIZATION
Wells Fargo Funds Trust (the “Trust”), a Delaware statutory trust organized on March 10, 1999, is an open-end management investment company registered under the Investment Company Act of 1940, as amended (the “1940 Act”). As an investment company, the Trust follows the accounting and reporting guidance in Financial Accounting Standards Board Accounting Standards Codification Topic 946, Financial Services – Investment Companies. These financial statements report on the following funds: Wells Fargo Target Today Fund (“Target Today Fund”), Wells Fargo Target 2010 Fund (“Target 2010 Fund”), Wells Fargo Target 2015 Fund (“Target 2015 Fund”), Wells Fargo Target 2020 Fund (“Target 2020 Fund”), Wells Fargo Target 2025 Fund (“Target 2025 Fund”), Wells Fargo Target 2030 Fund (“Target 2030 Fund”), Wells Fargo Target 2035 Fund (“Target 2035 Fund”), Wells Fargo Target 2040 Fund (“Target 2040 Fund”), Wells Fargo Target 2045 Fund (“Target 2045 Fund”), Wells Fargo Target 2050 Fund (“Target 2050 Fund”), Wells Fargo Target 2055 Fund (“Target 2055 Fund”), and Wells Fargo Target 2060 Fund (“Target 2060 Fund”) (each, a “Fund”, collectively, the “Funds”). Each Fund is a diversified series of the Trust.
Each Fund is a fund-of-funds which seeks to achieve its investment objective by investing in multiple diversified portfolios (collectively, the “affiliated Master Portfolios”) of Wells Fargo Master Trust, a registered open-end management investment company. Each affiliated Master Portfolio directly acquires portfolio securities, and a Fund investing in an affiliated Master Portfolio acquires an indirect interest in those securities. Each Fund accounts for its investment in the affiliated Master Portfolios as partnership investments and records on a daily basis its share of the affiliated Master Portfolio’s income, expense and realized and unrealized gains and losses. The financial statements of each affiliated Master Portfolios are presented in separate financial statements and may be obtained free of charge by contacting Investor Services or by visiting the SEC website at sec.gov. The financial statements of the affiliated Master Portfolios are filed with the SEC under Wells Fargo Master Trust.
2. SIGNIFICANT ACCOUNTING POLICIES
The following significant accounting policies, which are consistently followed in the preparation of the financial statements of each Fund, are in conformity with U.S. generally accepted accounting principles which require management to make estimates and assumptions that affect the reported amounts of assets and liabilities, disclosure of contingent assets and liabilities at the date of the financial statements, and the reported amounts of revenues and expenses during the reporting period. Actual results could differ from those estimates.
Securities valuation
All investments are valued each business day as of the close of regular trading on the New York Stock Exchange (generally 4 p.m. Eastern Time), although the Funds may deviate from this calculation time under unusual or unexpected circumstances.
Investments in the affiliated Master Portfolios are valued daily based on each Fund’s proportionate share of each affiliated Master Portfolio’s net assets, which are also valued daily.
Investments which are not valued using the methods discussed above are valued at their fair value, as determined in good faith by the Board of Trustees of the Funds. The Board of Trustees has established a Valuation Committee comprised of the Trustees and has delegated to it the authority to take any actions regarding the valuation of portfolio securities that the Valuation Committee deems necessary or appropriate, including determining the fair value of portfolio securities, unless the determination has been delegated to the Wells Fargo Asset Management Pricing Committee at Wells Fargo Funds Management, LLC (“Funds Management”). The Board of Trustees retains the authority to make or ratify any valuation decisions or approve any changes to the Valuation Procedures as it deems appropriate. On a quarterly basis, the Board of Trustees receives reports on any valuation actions taken by the Valuation Committee or the Wells Fargo Asset Management Pricing Committee which may include items for ratification.
Investment transactions, income and expenses
Investments in affiliated Master Portfolios are recorded on a trade date basis.
Each Fund records daily its proportionate share of each affiliated Master Portfolio’s income, expenses and realized and unrealized gains or losses. Each Fund also accrues its own expenses. Income from foreign securities in each affiliated Master Portfolio is recorded net of foreign taxes withheld where recovery of such taxes is not assured.
Distributions to shareholders
For each Fund (except Target Today Fund, Target 2010 Fund and Target 2015 Fund), distributions to shareholders from net investment income and any net realized gains are recorded on the ex-dividend date and paid at least annually. For Target Today Fund, Target 2010 Fund and Target 2015 Fund, distributions to shareholders are recorded on the ex-dividend date and paid from net investment income quarterly and any net realized gains are paid at least annually. Such distributions are determined in accordance with income tax regulations and may differ from U.S. generally accepted accounting principles. Dividend sources are
92 | Wells Fargo Target Date Retirement Funds
Notes to financial statements (unaudited)
estimated at the time of declaration. The tax character of distributions is determined as of each Fund’s fiscal year end. Therefore, a portion of each Fund’s distributions made prior the Fund’s fiscal year end may be categorized as a tax return of capital at year end.
Federal and other taxes
Each Fund is treated as a separate entity for federal income tax purposes. Each Fund intends to continue to qualify as a regulated investment company by distributing substantially all of its investment company taxable income and any net realized capital gains (after reduction for capital loss carryforwards) sufficient to relieve it from all, or substantially all, federal income taxes. Accordingly, no provision for federal income taxes was required.
Each Fund’s income and federal excise tax returns and all financial records supporting those returns for the prior three fiscal years are subject to examination by the federal and Delaware revenue authorities. Management has analyzed each Fund’s tax positions taken on federal, state, and foreign tax returns for all open tax years and does not believe that there are any uncertain tax positions that require recognition of a tax liability.
As of August 31, 2020, the aggregate cost of all investments for federal income tax purposes and the unrealized gains (losses) were as follows:
| | | | | | | | | | | | | | | | |
| | | | |
| | | Tax cost | | | Gross
unrealized
gains | | | Gross
unrealized
losses | | | Net unrealized
gains | |
| | | | |
Target Today Fund | | $ | 52,759,204 | | | $ | 9,336,029 | | | $ | 0 | | | $ | 9,336,029 | |
| | | | |
Target 2010 Fund | | | 33,696,763 | | | | 21,830,693 | | | | 0 | | | | 21,830,693 | |
| | | | |
Target 2015 Fund | | | 43,333,997 | | | | 14,363,013 | | | | 0 | | | | 14,363,013 | |
| | | | |
Target 2020 Fund | | | 274,394,808 | | | | 51,690,738 | | | | 0 | | | | 51,690,738 | |
| | | | |
Target 2025 Fund | | | 171,598,234 | | | | 24,233,125 | | | | 0 | | | | 24,233,125 | |
| | | | |
Target 2030 Fund | | | 421,387,009 | | | | 61,961,878 | | | | 0 | | | | 61,961,878 | |
| | | | |
Target 2035 Fund | | | 167,730,292 | | | | 22,317,772 | | | | 0 | | | | 22,317,772 | |
| | | | |
Target 2040 Fund | | | 396,838,847 | | | | 51,566,341 | | | | 0 | | | | 51,566,341 | |
| | | | |
Target 2045 Fund | | | 81,440,729 | | | | 9,553,045 | | | | 0 | | | | 9,553,045 | |
| | | | |
Target 2050 Fund | | | 178,999,091 | | | | 28,916,658 | | | | 0 | | | | 28,916,658 | |
| | | | |
Target 2055 Fund | | | 26,170,368 | | | | 1,653,134 | | | | 0 | | | | 1,653,134 | |
| | | | |
Target 2060 Fund | | | 23,082,524 | | | | 2,497,741 | | | | 0 | | | | 2,497,741 | |
As of February 29, 2020, Target 2055 Fund had capital loss carryforwards, which consisted of $56,604 in short-term capital losses.
Class allocations
The separate classes of shares offered by each Fund differ principally in applicable sales charges, distribution, shareholder servicing, and administration fees. Class specific expenses are charged directly to that share class. Investment income, common fund-level expenses, and realized and unrealized gains (losses) on investments are allocated daily to each class of shares based on the relative proportion of net assets of each class.
Wells Fargo Target Date Retirement Funds | 93
Notes to financial statements (unaudited)
3. FAIR VALUATION MEASUREMENTS
At August 31, 2020, each Fund’s investment in an affiliated Master Portfolio was measured at fair value using the net asset value per share (or its equivalent) as a practical expedient. The aggregate fair value of affiliated Master Portfolios held in each Fund was as follows:
| | | | |
| |
| | | Aggregate fair value of affiliated
Master Portfolios | |
| |
Target Today Fund | | $ | 62,095,233 | |
| |
Target 2010 Fund | | | 55,527,456 | |
| |
Target 2015 Fund | | | 57,697,010 | |
| |
Target 2020 Fund | | | 326,085,546 | |
| |
Target 2025 Fund | | | 195,831,359 | |
| |
Target 2030 Fund | | | 483,348,887 | |
| |
Target 2035 Fund | | | 190,048,064 | |
| |
Target 2040 Fund | | | 448,405,188 | |
| |
Target 2045 Fund | | | 90,993,774 | |
| |
Target 2050 Fund | | | 207,915,749 | |
| |
Target 2055 Fund | | | 27,823,502 | |
| |
Target 2060 Fund | | | 25,580,265 | |
The investment objective of each affiliated Master Portfolio is as follows:
| | |
| |
| Affiliated Master Portfolio | | Investment objective |
| |
Wells Fargo Bloomberg Barclays US Aggregate ex-Corporate Portfolio | | Seeks to replicate the total return of the Bloomberg Barclays U.S. Aggregate ex-Corporate Index, before fees and expenses |
| |
Wells Fargo Emerging Markets Bond Portfolio | | Seeks to replicate the total return of the JP Morgan EMBI Global Diversified Index, before fees and expenses |
| |
Wells Fargo Factor Enhanced Emerging Markets Equity Portfolio | | Seeks long-term capital appreciation |
| |
Wells Fargo Factor Enhanced International Equity Portfolio | | Seeks long-term capital appreciation |
| |
Wells Fargo Factor Enhanced U.S. Large Cap Equity Portfolio | | Seeks long-term capital appreciation |
| |
Wells Fargo Factor Enhanced U.S. Low Volatility Equity Portfolio | | Seeks long-term capital appreciation |
| |
Wells Fargo Factor Enhanced U.S. Small Cap Equity Portfolio | | Seeks long-term capital appreciation |
| |
Wells Fargo High Yield Corporate Bond Portfolio | | Seeks to replicate the total return of the Wells Fargo U.S. High Yield Bond Index, before fees and expenses |
| |
Wells Fargo Investment Grade Corporate Bond Portfolio | | Seeks to replicate the total return of the Wells Fargo U.S. Investment Grade Corporate Bond Index, before fees and expenses |
| |
Wells Fargo Strategic Retirement Bond Portfolio | | Seeks to replicate the total return of a blended index that is weighted 50% to the Bloomberg Barclays U.S. Treasury Inflation Notes: 1-10 Year Index and 50% to the Bloomberg Barclays U.S. Government Intermediate Bond Index, before fees and expenses |
| |
Wells Fargo U.S. REIT Portfolio | | Seeks to replicate the total return of the Wells Fargo U.S. REIT Index, before fees and expenses |
Each affiliated Master Portfolio does not have a redemption period notice, can be redeemed daily and does not have any unfunded commitments.
4. TRANSACTIONS WITH AFFILIATES
Management fee
Wells Fargo Funds Management, LLC (“Funds Management”), an indirect wholly owned subsidiary of Wells Fargo & Company (“Wells Fargo”), is the manager of each Fund and provides advisory and fund-level administrative services under an investment
94 | Wells Fargo Target Date Retirement Funds
Notes to financial statements (unaudited)
management agreement. Under the investment management agreement, Funds Management is responsible for, among other services, implementing the investment objectives and strategies of each Fund, supervising the subadviser and providing fund-level administrative services in connection with each Fund’s operations. As compensation for its services under the investment management agreement, Funds Management is entitled to receive a management fee at the following annual rate based on each Fund’s average daily net assets:
| | | | |
| |
| Average daily net assets | | Management fee | |
| |
First $5 billion | | | 0.10 | % |
| |
Next $5 billion | | | 0.09 | |
| |
Over $10 billion | | | 0.08 | |
For the six months ended August 31, 2020, the management fee was equivalent to an annual rate of 0.10% of each Fund’s average daily net assets.
Funds Management has retained the services of a subadviser to provide daily portfolio management to the Funds. The fees for subadvisory services is borne by Funds Management. Wells Capital Management Incorporated, an affiliate of Funds Management and an indirect wholly owned subsidiary of Wells Fargo, is the subadviser to each Fund and is entitled to receive a fee from Funds Management at an annual rate starting at 0.05% and declining to 0.03% as the average daily net assets of each Fund increase.
Funds Management also serves as the adviser to each affiliated Master Portfolio and is entitled to receive a fee from each affiliated Master Portfolio for those services.
Administration fees
Under a class-level administration agreement, Funds Management provides class-level administrative services to each Fund, which includes paying fees and expenses for services provided by the transfer agent, sub-transfer agents, omnibus account servicers and record-keepers. As compensation for its services under the class-level administration agreement, Funds Management receives an annual fee which is calculated based on the average daily net assets of each class as follows:
| | | | |
| |
| | | Class-level
administration fee | |
| |
Class A, Class C, Class R | | | 0.21 | % |
| |
Class R4 | | | 0.08 | |
| |
Class R6 | | | 0.03 | |
| |
Administrator Class | | | 0.13 | |
Waivers and/or expense reimbursements
Funds Management has contractually waived and/or reimbursed management and administration fees to the extent necessary to maintain certain net operating expense ratios for the Fund. When each class of the Fund has exceeded its expense cap, Funds Management has waived fees and/or reimbursed expenses from fund-level expenses on a proportionate basis and then from class specific expenses. When only certain classes exceed their expense caps, waivers and/or reimbursements are applied against class specific expenses before fund-level expenses. Funds Management has committed through June 30, 2021 to waive fees and/or reimburse expenses to the extent necessary to cap the Fund’s expenses at 0.60% for Class A shares, 1.35% for Class C shares, 0.85% for Class R shares, 0.29% for Class R4 shares, 0.14% for Class R6 shares, and 0.49% for Administrator Class shares. Prior to or after the commitment expiration date, the cap may be increased or the commitment to maintain the cap may be terminated only with the approval of the Board of Trustees. Prior to May 1, 2020, the Fund’s expenses were capped at 0.65% for Class A shares, 1.40% for Class C shares, 0.90% for Class R shares, 0.34% for Class R4 shares, 0.19% for Class R6 shares, and 0.54% for Administrator Class shares.
Distribution fees
The Trust has adopted a Distribution Plan for Class C and Class R shares of the Funds pursuant to Rule 12b-1 under the 1940 Act. Distribution fees are charged to Class C and Class R shares and paid to Wells Fargo Funds Distributor, LLC (“Funds Distributor”), the principal underwriter of each Fund, at an annual rate of 0.75% of the average daily net assets of Class C shares and 0.25% of the average daily net assets of Class R shares.
Wells Fargo Target Date Retirement Funds | 95
Notes to financial statements (unaudited)
In addition, Funds Distributor is entitled to receive the front-end sales charge from the purchase of Class A shares and a contingent deferred sales charge on the redemption of certain Class A shares. Funds Distributor is also entitled to receive the contingent deferred sales charges from redemptions of Class C shares. For the six months ended August 31, 2020, Funds Distributor received front-end sales charges and contingent deferred sales charges from the following Funds:
| | | | | | | | |
| | | Front-end sales charges | | | Contingent deferred sales charges | |
| | |
| | | Class A | | | Class C | |
| | |
Target Today Fund | | $ | 23 | | | $ | 0 | |
| | |
Target 2010 Fund | | | 14 | | | | 0 | |
| | |
Target 2015 Fund | | | 39 | | | | N/A | |
| | |
Target 2020 Fund | | | 520 | | | | 0 | |
| | |
Target 2025 Fund | | | 48 | | | | N/A | |
| | |
Target 2030 Fund | | | 755 | | | | 9 | |
| | |
Target 2035 Fund | | | 293 | | | | N/A | |
| | |
Target 2040 Fund | | | 620 | | | | 0 | |
| | |
Target 2045 Fund | | | 99 | | | | N/A | |
| | |
Target 2050 Fund | | | 119 | | | | 0 | |
| | |
Target 2055 Fund | | | 24 | | | | N/A | |
| | |
Target 2060 Fund | | | 8 | | | | 0 | |
For the six months ended August 31, 2020, the Funds did not received any contingent deferred sales charges on Class A shares.
Shareholder servicing fees
The Trust has entered into contracts with one or more shareholder servicing agents, whereby Class A, Class C, Class R, and Administrator Class of each Fund are charged a fee at an annual rate of 0.25% of the average daily net assets of each respective class. Class R4 is charged a fee at an annual rate of 0.10% of its average daily net assets. A portion of these total shareholder servicing fees were paid to affiliates of Wells Fargo.
Other transactions
On August 14, 2020, the following Funds received a payment from Funds Management in connection with resolving certain fee reimbursements.
| | | | | | | | | | | | |
| | | Reimbursement amount | |
| | | |
| | | Class A | | | Class C | | | Class R | |
| | | |
Target Today Fund | | $ | 0 | | | $ | 0 | | | $ | 232 | |
| | | |
Target 2010 Fund | | | 0 | | | | 0 | | | | 230 | |
| | | |
Target 2015 Fund | | | 0 | | | | N/A | | | | 235 | |
| | | |
Target 2020 Fund | | | 916 | | | | 0 | | | | 372 | |
| | | |
Target 2025 Fund | | | 547 | | | | N/A | | | | 397 | |
| | | |
Target 2030 Fund | | | 2,838 | | | | 0 | | | | 321 | |
| | | |
Target 2040 Fund | | | 2,292 | | | | 0 | | | | 337 | |
| | | |
Target 2045 Fund | | | 850 | | | | N/A | | | | 363 | |
| | | |
Target 2050 Fund | | | 716 | | | | 17 | | | | 396 | |
| | | |
Target 2055 Fund | | | 0 | | | | N/A | | | | 293 | |
| | | |
Target 2060 Fund | | | 0 | | | | 1,316 | | | | 897 | |
5. INVESTMENT PORTFOLIO TRANSACTIONS
The Funds seek to achieve their investment objectives by investing substantially all of their investable assets in affiliated Master Portfolios. Purchases and sales related to these investments have been calculated by aggregating the results of
96 | Wells Fargo Target Date Retirement Funds
Notes to financial statements (unaudited)
multiplying each Fund’s ownership percentage in the respective affiliated Master Portfolio by the corresponding affiliated Master Portfolio’s purchases and sales. Purchases and sales of investments, excluding short-term securities, for the six months ended August 31, 2020 were as follows:
| | | | | | | | | | | | | | | | |
| | | Purchases at cost | | | Sales proceeds | |
| | | | |
| | | U.S.
government | | | Non-U.S.
government | | | U.S.
government | | | Non-U.S.
government | |
| | | | |
Target Today Fund | | $ | 10,241,214 | | | $ | 14,560,358 | | | $ | 13,772,301 | | | $ | 14,091,597 | |
| | | | |
Target 2010 Fund | | | 9,025,205 | | | | 13,213,392 | | | | 12,137,096 | | | | 12,919,239 | |
| | | | |
Target 2015 Fund | | | 8,701,953 | | | | 14,737,018 | | | | 11,702,402 | | | | 15,066,622 | |
| | | | |
Target 2020 Fund | | | 44,821,126 | | | | 90,650,956 | | | | 59,892,215 | | | | 96,377,688 | |
| | | | |
Target 2025 Fund | | | 22,860,660 | | | | 63,070,895 | | | | 29,454,438 | | | | 69,428,044 | |
| | | | |
Target 2030 Fund | | | 45,753,070 | | | | 176,555,880 | | | | 57,041,762 | | | | 199,093,852 | |
| | | | |
Target 2035 Fund | | | 13,390,202 | | | | 77,430,532 | | | | 16,444,612 | | | | 88,236,325 | |
| | | | |
Target 2040 Fund | | | 21,435,808 | | | | 200,783,568 | | | | 26,325,486 | | | | 226,535,475 | |
| | | | |
Target 2045 Fund | | | 3,206.440 | | | | 42,787,933 | | | | 3,937,854 | | | | 48,030,281 | |
| | | | |
Target 2050 Fund | | | 5,287,581 | | | | 101,431,587 | | | | 6,493,719 | | | | 113,425,714 | |
| | | | |
Target 2055 Fund | | | 711,249 | | | | 13,569,842 | | | | 873,490 | | | | 15,172,076 | |
| | | | |
Target 2060 Fund | | | 650,449 | | | | 12,485,588 | | | | 798,821 | | | | 13,954,824 | |
6. BANK BORROWINGS
The Trust (excluding the money market funds), Wells Fargo Master Trust and Wells Fargo Variable Trust are parties to a $350,000,000 revolving credit agreement whereby each Fund is permitted to use bank borrowings for temporary or emergency purposes, such as to fund shareholder redemption requests. Interest under the credit agreement is charged to each Fund based on a borrowing rate equal to the higher of the Federal Funds rate in effect on that day plus 1.25% or the overnight LIBOR rate in effect on that day plus 1.25%. In addition, an annual commitment fee equal to 0.25% of the unused balance is allocated to each participating fund.
For the six months ended August 31, 2020, there were no borrowings by the Funds under the agreement.
7. INDEMNIFICATION
Under the Funds’ organizational documents, the officers and Trustees have been granted certain indemnification rights against certain liabilities that may arise out of performance of their duties to each Fund. Each Fund has entered into a separate agreement with each Trustee that converts indemnification rights currently existing under the Fund’s organizational documents into contractual rights that cannot be changed in the future without the consent of the Trustee. Additionally, in the normal course of business, each Fund may enter into contracts with service providers that contain a variety of indemnification clauses. Each Fund’s maximum exposure under these arrangements is dependent on future claims that may be made against the Fund and, therefore, cannot be estimated.
8. NEW ACCOUNTING PRONOUNCEMENT
In August 2018, FASB issued Accounting Standards Update (“ASU”) No. 2018-13, Fair Value Measurement (Topic 820) Disclosure Framework—Changes to the Disclosure Requirements for Fair Value Measurement. ASU 2018-13 updates the disclosure requirements on fair value measurements in Topic 820, Fair Value Measurements. The amendments are effective for fiscal years, and interim periods within those fiscal years, beginning after December 15, 2019. Management has adopted this guidance which did not have a material impact on the financial statements.
9. CORONAVIRUS (COVID-19) PANDEMIC
On March 11, 2020, the World Health Organization announced that it had made the assessment that coronavirus disease 2019 (“COVID-19”) is a pandemic. The impacts of COVID-19 are adversely affecting the entire global economy, individual companies and investment products, and the market in general. There is significant uncertainty around the extent and duration of business disruptions related to COVID-19 and the impacts may be short term or may last for an extended period of time. The risk of further spreading of COVID-19 has led to significant uncertainty and volatility in the financial markets.
Wells Fargo Target Date Retirement Funds | 97
Other information (unaudited)
PROXY VOTING INFORMATION
A description of the policies and procedures used to determine how to vote proxies relating to portfolio securities is available, upon request, by calling 1-800-222-8222, visiting our website at wfam.com, or visiting the SEC website at sec.gov. Information regarding how the proxies related to portfolio securities were voted during the most recent 12-month period ended June 30 is available on the website at wfam.com or by visiting the SEC website at sec.gov.
QUARTERLY PORTFOLIO HOLDINGS INFORMATION
The Funds file their complete schedule of portfolio holdings with the SEC for the first and third quarters of each fiscal year as an exhibit to their reports on Form N-PORT. Shareholders may view the filed Form N-PORT by visiting the SEC website at sec.gov.
98 | Wells Fargo Target Date Retirement Funds
Other information (unaudited)
BOARD OF TRUSTEES AND OFFICERS
Each of the Trustees and Officers1 listed in the table below acts in identical capacities for each fund in the Wells Fargo family of funds, which consists of 142 mutual funds comprising the Wells Fargo Funds Trust, Wells Fargo Variable Trust, Wells Fargo Master Trust and four closed-end funds (collectively the “Fund Complex”). This table should be read in conjunction with the Prospectus and the Statement of Additional Information2. The mailing address of each Trustee and Officer is 525 Market Street, 12th Floor, San Francisco, CA 94105. Each Trustee and Officer serves an indefinite term, however, each Trustee serves such term until reaching the mandatory retirement age established by the Trustees.
Independent Trustees
| | | | | | |
Name and year of birth | | Position held and
length of service* | | Principal occupations during past five years or longer | | Current other
public company or
investment
company
directorships |
| | | |
| William R. Ebsworth (Born 1957) | | Trustee, since 2015 | | Retired. From 1984 to 2013, equities analyst, portfolio manager, research director and chief investment officer at Fidelity Management and Research Company in Boston, Tokyo, and Hong Kong, and retired in 2013 as Chief Investment Officer of Fidelity Strategic Advisers, Inc. where he led a team of investment professionals managing client assets. Prior thereto, Board member of Hong Kong Securities Clearing Co., Hong Kong Options Clearing Corp., the Thailand International Fund, Ltd., Fidelity Investments Life Insurance Company, and Empire Fidelity Investments Life Insurance Company. Audit Committee Chair and Investment Committee Chair of the Vincent Memorial Hospital Endowment (non-profit organization). Mr. Ebsworth is a CFA® charterholder. | | N/A |
| | | |
| Jane A. Freeman (Born 1953) | | Trustee, since 2015; Chair Liaison, since 2018 | | Retired. From 2012 to 2014 and 1999 to 2008, Chief Financial Officer of Scientific Learning Corporation. From 2008 to 2012, Ms. Freeman provided consulting services related to strategic business projects. Prior to 1999, Portfolio Manager at Rockefeller & Co. and Scudder, Stevens & Clark. Board member of the Harding Loevner Funds from 1996 to 2014, serving as both Lead Independent Director and chair of the Audit Committee. Board member of the Russell Exchange Traded Funds Trust from 2011 to 2012 and the chair of the Audit Committee. Ms. Freeman is also an inactive Chartered Financial Analyst. | | N/A |
| | | |
| Isaiah Harris, Jr. (Born 1952) | | Trustee, since 2009; Audit Committee Chairman, since 2019 | | Retired. Chairman of the Board of CIGNA Corporation since 2009, and Director since 2005. From 2003 to 2011, Director of Deluxe Corporation. Prior thereto, President and CEO of BellSouth Advertising and Publishing Corp. from 2005 to 2007, President and CEO of BellSouth Enterprises from 2004 to 2005 and President of BellSouth Consumer Services from 2000 to 2003. Emeritus member of the Iowa State University Foundation Board of Governors. Emeritus Member of the Advisory Board of Iowa State University School of Business. Advisory Board Member, Palm Harbor Academy (private school).Mr. Harris is a certified public accountant (inactive status). | | CIGNA Corporation |
| | | |
| Judith M. Johnson (Born 1949) | | Trustee, since 2008 | | Retired. Prior thereto, Chief Executive Officer and Chief Investment Officer of Minneapolis Employees Retirement Fund from 1996 to 2008. Ms. Johnson is an attorney, certified public accountant and a certified managerial accountant. | | N/A |
Wells Fargo Target Date Retirement Funds | 99
Other information (unaudited)
| | | | | | |
Name and year of birth | | Position held and
length of service* | | Principal occupations during past five years or longer | | Current other
public company or
investment
company
directorships |
| | | |
| David F. Larcker (Born 1950) | | Trustee, since 2009 | | James Irvin Miller Professor of Accounting at the Graduate School of Business (Emeritus), Stanford University, Director of the Corporate Governance Research Initiative and Senior Faculty of The Rock Center for Corporate Governance since 2006. From 2005 to 2008, Professor of Accounting at the Graduate School of Business, Stanford University. Prior thereto, Ernst & Young Professor of Accounting at The Wharton School, University of Pennsylvania from 1985 to 2005. | | N/A |
| | | |
| Olivia S. Mitchell (Born 1953) | | Trustee, since 2006; Nominating and Governance Committee Chair, since 2018 | | International Foundation of Employee Benefit Plans Professor, Wharton School of the University of Pennsylvania since 1993. Director of Wharton’s Pension Research Council and Boettner Center on Pensions & Retirement Research, and Research Associate at the National Bureau of Economic Research. Previously, Cornell University Professor from 1978 to 1993. | | N/A |
| | | |
| Timothy J. Penny (Born 1951) | | Trustee, since 1996; Chairman, since 2018 | | President and Chief Executive Officer of Southern Minnesota Initiative Foundation, a non-profit organization, since 2007. Member of the Board of Trustees of NorthStar Education Finance, Inc., a non-profit organization, since 2007. | | N/A |
| | | |
| James G. Polisson (Born 1959) | | Trustee, since 2018 | | Retired. Chief Marketing Officer, Source (ETF) UK Services, Ltd, from 2015 to 2017. From 2012 to 2015, Principal of The Polisson Group, LLC, a management consulting, corporate advisory and principal investing company. Chief Executive Officer and Managing Director at Russell Investments, Global Exchange Traded Funds from 2010 to 2012. Managing Director of Barclays Global Investors from 1998 to 2010 and Global Chief Marketing Officer for iShares and Barclays Global Investors from 2000 to 2010. Trustee of the San Francisco Mechanics’ Institute, a non-profit organization, from 2013 to 2015. Board member of the Russell Exchange Traded Fund Trust from 2011 to 2012. Director of Barclays Global Investors Holdings Deutschland GmbH from 2006 to 2009. Mr. Polisson is an attorney and has a retired status with the Massachusetts and District of Columbia Bar Associations. | | N/A |
| | | |
| Pamela Wheelock (Born 1959) | | Trustee, since January 2020; previously Trustee from January 2018 to July 2019 | | Board member of the Destination Medical Center Economic Development Agency, Rochester, Minnesota since 2019. Interim President of the McKnight Foundation from January to September 2020. Acting Commissioner, Minnesota Department of Human Services, July 2019 through September 2019. Human Services Manager (part-time), Minnesota Department of Human Services, October 2019 through December 2019. Chief Operating Officer, Twin Cities Habitat for Humanity from 2017 to 2019. Vice President of University Services, University of Minnesota from 2012 to 2016. Prior thereto, on the Board of Directors, Governance Committee and Finance Committee for the Minnesota Philanthropy Partners (Saint Paul Foundation) from 2012 to 2018, Interim Chief Executive Officer of Blue Cross Blue Shield of Minnesota from 2011 to 2012, Chairman of the Board from 2009 to 2012 and Board Director from 2003 to 2015. Vice President, Leadership and Community Engagement, Bush Foundation, Saint Paul, Minnesota (a private foundation) from 2009 to 2011. Executive Vice President and Chief Financial Officer, Minnesota Sports and Entertainment from 2004 to 2009 and Senior Vice President from 2002 to 2004. Executive Vice President of the Minnesota Wild Foundation from 2004 to 2008. Commissioner of Finance, State of Minnesota, from 1999 to 2002. Currently Board Chair of the Minnesota Wild Foundation since 2010. | | N/A |
| * | Length of service dates reflect the Trustee’s commencement of service with the Trust’s predecessor entities, where applicable. |
100 | Wells Fargo Target Date Retirement Funds
Other information (unaudited)
Officers
| | | | |
Name and year of birth | | Position held and
length of service | | Principal occupations during past five years or longer |
| | |
| Andrew Owen (Born 1960) | | President, since 2017 | | Executive Vice President of Wells Fargo & Company and Head of Affiliated Managers, Wells Fargo Asset Management, since 2014. In addition, Mr. Owen is currently President, Chief Executive Officer and Director of Wells Fargo Funds Management, LLC since 2017. Prior thereto, Executive Vice President responsible for marketing, investments and product development for Wells Fargo Funds Management, LLC, from 2009 to 2014. |
| | |
| Jeremy DePalma1 (Born 1974) | | Treasurer, since 2012 | | Senior Vice President of Wells Fargo Funds Management, LLC since 2009. Senior Vice President of Evergreen Investment Management Company, LLC from 2008 to 2010 and head of the Fund Reporting and Control Team within Fund Administration from 2005 to 2010. |
| | |
| Michelle Rhee (Born 1966) | | Chief Legal Officer, since 2019 | | Secretary of Wells Fargo Funds Management, LLC, Chief Legal Counsel of Wells Fargo Asset Management and Assistant General Counsel of Wells Fargo Bank, N.A. since 2018. Associate General Counsel and Managing Director of Bank of America Corporation from 2004 to 2018. |
| | |
| Catherine Kennedy (Born 1969) | | Secretary, since 2019 | | Vice President of Wells Fargo Funds Management, LLC and Senior Counsel of the Wells Fargo Legal Department since 2010. Vice President and Senior Counsel of Evergreen Investment Management Company, LLC from 1998 to 2010. |
| | |
| Michael H. Whitaker (Born 1967) | | Chief Compliance Officer, since 2016 | | Chief Compliance Officer of Wells Fargo Asset Management since 2016. Senior Vice President and Chief Compliance Officer for Fidelity Investments from 2007 to 2016. |
| | |
| David Berardi (Born 1975) | | Assistant Treasurer, since 2009 | | Vice President of Wells Fargo Funds Management, LLC since 2009. Vice President of Evergreen Investment Management Company, LLC from 2008 to 2010. Manager of Fund Reporting and Control for Evergreen Investment Management Company, LLC from 2004 to 2010. |
| 1 | Jeremy DePalma acts as Treasurer of 77 funds and Assistant Treasurer of 65 funds in the Fund Complex. |
| 2 | The Statement of Additional Information includes additional information about the Trustees and is available, without charge, upon request, by calling 1-800-222-8222 or by visiting the website at wfam.com. |
Wells Fargo Target Date Retirement Funds | 101
Other information (unaudited)
BOARD CONSIDERATION OF INVESTMENT MANAGEMENT AND SUB-ADVISORY AGREEMENTS:
Wells Fargo Target Today Fund, Wells Fargo Target 2010 Fund, Wells Fargo Target 2015 Fund, Wells Fargo Target 2020 Fund, Wells Fargo Target 2025 Fund, Wells Fargo Target 2030 Fund, Wells Fargo Target 2035 Fund, Wells Fargo Target 2040 Fund, Wells Fargo Target 2045 Fund, Wells Fargo Target 2050 Fund, Wells Fargo Target 2055 Fund, and Wells Fargo Target 2060 Fund
Under the Investment Company Act of 1940 (the “1940 Act”), the Board of Trustees (the “Board”) of Wells Fargo Funds Trust (the “Trust”) must determine annually whether to approve the continuation of the Trust’s investment management and sub-advisory agreements. In this regard, at a Board meeting held on May 26, 2020 and May 28, 2020 (together, the “Meeting”), the Board, all the members of which have no direct or indirect interest in the investment management and sub-advisory agreements and are not “interested persons” of the Trust, as defined in the 1940 Act (the “Independent Trustees”), reviewed and approved for each of the funds of the Trust identified above (each, a “Fund” and collectively, the “Funds”): (i) an investment management agreement (the “Management Agreement”) with Wells Fargo Funds Management, LLC (“Funds Management”); and (ii) an investment sub-advisory agreement (the “Sub-Advisory Agreement”) with Wells Capital Management Incorporated (the “Sub-Adviser”), an affiliate of Funds Management. The Management Agreement and the Sub-Advisory Agreement are collectively referred to as the “Advisory Agreements.”
At the Meeting, the Board considered the factors and reached the conclusions described below relating to the selection of Funds Management and the Sub-Adviser and the approval of the Advisory Agreements. Prior to the Meeting, including at a Board meeting held in April 2020, the Trustees conferred extensively among themselves and with representatives of Funds Management about these matters. Also, the Board has adopted a team-based approach, with each team consisting of a sub-set of Trustees, to assist the full Board in the discharge of its duties in reviewing investment performance and other matters throughout the year. The Independent Trustees were assisted in their evaluation of the Advisory Agreements by independent legal counsel, from whom they received separate legal advice and with whom they met separately.
In providing information to the Board, Funds Management and the Sub-Adviser were guided by a detailed set of requests for information submitted to them by independent legal counsel on behalf of the Independent Trustees at the start of the Board’s annual contract renewal process earlier in 2020. In considering and approving the Advisory Agreements, the Trustees considered the information they believed relevant, including but not limited to the information discussed below. The Board considered not only the specific information presented in connection with the Meeting, but also the knowledge gained over time through interaction with Funds Management and the Sub-Adviser about various topics. In this regard, the Board reviewed reports of Funds Management at each of its quarterly meetings, which included, among other things, portfolio reviews and investment performance reports. In addition, the Board and the teams mentioned above confer with portfolio managers at various times throughout the year. The Board did not identify any particular information or consideration that was all-important or controlling, and each individual Trustee may have attributed different weights to various factors.
After its deliberations, the Board unanimously approved the continuation of the Advisory Agreements for a one-year term and determined that the compensation payable to Funds Management and the Sub-Adviser under each of the Advisory Agreements was reasonable. The Board considered the approval of the Advisory Agreements for the Funds as part of its consideration of agreements for funds across the complex, but its approvals were made on a fund-by-fund basis. The following summarizes a number of important, but not necessarily all, factors considered by the Board in support of its approvals.
Nature, extent and quality of services
The Board received and considered various information regarding the nature, extent and quality of services provided to the Funds by Funds Management and the Sub-Adviser under the Advisory Agreements. This information included a description of the investment advisory services and Fund-level administrative services covered by the Management Agreement, as well as, among other things, a summary of the background and experience of senior management of Wells Fargo Asset Management (“WFAM”), of which Funds Management and the Sub-Adviser are a part, and a summary of investments made in the business of WFAM. The Board also received a description of Funds Management’s and the Sub-Adviser’s business continuity plans and of their approaches to data privacy and cybersecurity, and related testing. The Board also received and reviewed information about Funds Management’s role as administrator of the Funds’ liquidity risk management program, Funds Management’s approach to risk management, and Funds Management’s intermediary and vendor oversight program.
The Board also considered the qualifications, background, tenure and responsibilities of each of the portfolio managers primarily responsible for the day-to-day portfolio management of the Funds. The Board evaluated the ability of Funds
102 | Wells Fargo Target Date Retirement Funds
Other information (unaudited)
Management and the Sub-Adviser to attract and retain qualified investment professionals, including research, advisory and supervisory personnel. The Board further considered the compliance programs and compliance records of Funds Management and the Sub-Adviser. In addition, the Board took into account the full range of services provided to the Funds by Funds Management and its affiliates.
Fund investment performance and expenses
The Board considered the investment performance results for each of the Funds over various time periods ended December 31, 2019. The Board also considered more current results for various time periods ended March 31, 2020. The Board considered these results in comparison to the investment performance of funds in a universe that was determined by Broadridge Inc. (“Broadridge”) to be similar to each respective Fund (each, a “Universe”), and in comparison to each Fund’s benchmark index and to other comparative data. Broadridge is an independent provider of investment company data. The Board received a description of the methodology used by Broadridge to select the mutual funds in each performance Universe.
With respect to the investment performance of each Fund (Administrator Class) relative to its respective Universe, the Board noted the following: the investment performance of the Wells Fargo Target Today Fund was in range of the average investment performance of its Universe for the one-year period ended December 31, 2019; the investment performance of the Wells Fargo Target 2020 Fund was in range of the average investment performance of such Fund’s respective Universe for the three-year period ended December 31, 2019; the investment performance of the Wells Fargo Target 2040 Fund was in range of the average investment performance of its Universe for the five- and ten-year periods ended December 31, 2019; the investment performance of the Wells Fargo Target 2045 Fund was in range of the average investment performance of its Universe for the ten-year period ended December 31, 2019; and the investment performance of the Wells Fargo Target 2050 Fund was in range of the average investment performance of its Universe for the five- and ten-year periods ended December 31, 2019. For all other periods under review ended December 31, 2019, the investment performance of each of the Funds was lower than the average investment performance of each Fund’s respective Universe.
The Board also noted that the investment performance of each Fund (Administrator Class) relative to its respective Universe was as follows: the investment performance of each of the Wells Fargo Target Today Fund and the Wells Fargo Target 2020 Fund was higher than or in range of the average investment performance of each Fund’s respective Universe for the one-, three- and five-year periods ended March 31, 2020; the investment performance of each of the Wells Fargo Target 2010 Fund and the Wells Fargo Target 2015 Fund was higher than or in range of the average investment performance of each Fund’s respective Universe for the one- and three-year periods ended March 31, 2020; the investment performance of each of the Wells Fargo Target 2040 Fund, the Wells Fargo Target 2045 Fund and the Wells Fargo Target 2050 Fund was in range of the average investment performance of each Fund’s respective Universe for the ten-year period ended March 31, 2020. For all other periods under review ended March 31, 2020, the investment performance of each of the Funds was lower than the average investment performance of each Fund’s respective Universe.
With respect to the investment performance of each Fund (Administrator Class) relative to its respective benchmark index, the Board noted that the investment performance of each of the Funds was lower than such Fund’s respective benchmark index for all periods under review ended December 31, 2019.
The Board also noted that the investment performance of each Fund (Administrator Class) relative to its respective benchmark index was as follows: the investment performance of each of the Wells Fargo Target Today Fund, the Wells Fargo Target 2040 Fund, the Wells Fargo Target 2045 Fund and the Wells Fargo Target 2050 Fund was higher than or in range of each Fund’s respective benchmark index for the one-year period ended March 31, 2020; the investment performance of each of the Wells Fargo Target 2010 Fund and the Wells Fargo Target 2035 Fund was higher than or in range of each Fund’s respective benchmark index for the one- and three-year periods ended March 31, 2020; the investment performance of each of the Wells Fargo Target 2015 Fund, the Wells Fargo Target 2020 Fund, the Wells Fargo Target 2025 Fund and the Wells Fargo Target 2030 Fund was higher than or in range of each Fund’s respective benchmark index for the one-, three- and five-year periods ended March 31, 2020. For all other periods under review ended March 31, 2020, the investment performance of each of the Funds was lower than the average investment performance of each Fund’s respective benchmark index.
The Board received information concerning, and discussed factors contributing to, the underperformance of the Funds for the periods identified above. The Board took note of the explanations for the mixed performance relative to each Fund’s Universe and benchmark index for the periods identified above, including with respect to investment decisions and market factors that affected each Fund’s investment performance. The Board also took note of the changes to such Funds’ investment strategies that were implemented in February 2020 to improve the Funds’ performance.
The Board also received and considered information regarding each Fund’s net operating expense ratios and their various components, including actual management fees, custodian and other non-management fees, and Rule 12b-1 and non-Rule 12b-1
Wells Fargo Target Date Retirement Funds | 103
Other information (unaudited)
shareholder service fees. The Board considered these ratios in comparison to the median ratios of funds in class-specific expense groups that were determined by Broadridge to be similar to each Fund (the “Groups”). The Board received a description of the methodology used by Broadridge to select the mutual funds in the expense Groups and an explanation of how funds comprising expense groups and their expense ratios may vary from year-to-year. Based on the Broadridge reports, the Board noted that the net operating expense ratios of each Fund were lower than or equal to the median net operating expense ratios of its expense Groups for all share classes.
The Board took into account each Fund’s investment performance and expense information provided to it among the factors considered in deciding to re-approve the Advisory Agreements.
Investment management and sub-advisory fee rates
The Board reviewed and considered the contractual fee rates payable by each Fund to Funds Management under the Management Agreement, as well as the contractual fee rates payable by each Fund to Funds Management for class-level administrative services under a Class-Level Administration Agreement, which include, among other things, class-level transfer agency and sub-transfer agency costs (collectively, the “Management Rates”). The Board also reviewed and considered the contractual investment sub-advisory fee rates that are payable by Funds Management to the Sub-Adviser for investment sub-advisory services.
Among other information reviewed by the Board was a comparison of each Fund’s Management Rates with the average contractual investment management fee rates of funds in the expense Groups at a common asset level, as well as transfer agency costs of the funds in the expense Groups. The Board noted that the Management Rates of each Fund were lower than or in range of the sum of these average rates for the Fund’s expense Groups for all share classes, except the Administrator Class shares of the Wells Fargo Target Today Fund, which were higher. The Board noted that the net operating expense ratio cap for the Wells Fargo Target Today Fund’s Administrator Class would be reduced.
The Board also received and considered information about the portion of the total management fee that was retained by Funds Management after payment of the fee to the Sub-Adviser for sub-advisory services. In assessing the reasonableness of this amount, the Board received and evaluated information about the nature and extent of responsibilities retained and risks assumed by Funds Management and not delegated to or assumed by the Sub-Adviser, and about Funds Management’s on-going oversight services. Given the affiliation between Funds Management and the Sub-Adviser, the Board ascribed limited relevance to the allocation of fees between them.
Based on its consideration of the factors and information it deemed relevant, including those described here, the Board determined that the compensation payable to Funds Management under the Management Agreement and to the Sub-Adviser under the Sub-Advisory Agreement was reasonable.
Profitability
The Board received and considered information concerning the profitability of Funds Management, as well as the profitability of both WFAM and Wells Fargo & Co. (“Wells Fargo”) from providing services to the fund family as a whole. The Board noted that the Sub-Adviser’s profitability information with respect to providing services to the Funds and other funds in the family was subsumed in the WFAM and Wells Fargo profitability analysis.
Funds Management reported on the methodologies and estimates used in calculating profitability, including a description of the methodology used to allocate certain expenses. Among other things, the Board noted that the levels of profitability reported on a fund-by-fund basis varied widely, depending on factors such as the size, type and age of fund.
Based on its review, the Board did not deem the profits reported by Funds Management, WFAM or Wells Fargo from services provided to the Funds to be at a level that would prevent it from approving the continuation of the Advisory Agreements.
Economies of scale
The Board received and considered information about the potential for Funds Management to experience economies of scale in the provision of management services to the Funds, the difficulties of calculating economies of scale at an individual fund level, and the extent to which potential scale benefits are shared with shareholders. The Board noted the existence of breakpoints in each Fund’s management fee structure, which operate generally to reduce the Fund’s expense ratios as the Fund grows in size, and the size of the Funds in relation to such breakpoints. The Board considered that in addition to management fee breakpoints, Funds Management shares potential economies of scale from its management business in a variety of ways, including through fee waiver and expense reimbursement arrangements, services that benefit shareholders, competitive management fee rates set at the outset without regard to breakpoints, and investments in the business intended to enhance services available to shareholders.
104 | Wells Fargo Target Date Retirement Funds
Other information (unaudited)
The Board concluded that Funds Management’s arrangements with respect to the Funds, including contractual breakpoints, constituted a reasonable approach to sharing potential economies of scale with the Funds and their shareholders.
Other benefits to Funds Management and the Sub-Adviser
The Board received and considered information regarding potential “fall-out” or ancillary benefits received by Funds Management and its affiliates, including the Sub-Adviser, as a result of their relationships with the Funds. Ancillary benefits could include, among others, benefits directly attributable to other relationships with the Funds and benefits potentially derived from an increase in Funds Management’s and the Sub-Adviser’s business as a result of their relationships with the Funds. The Board noted that various affiliates of Funds Management may receive distribution-related fees, shareholder servicing payments and sub-transfer agency fees in respect of shares sold or held through them and services provided.
The Board also reviewed information about soft dollar credits earned and utilized by the Sub-Adviser, fees earned by Funds Management and the Sub-Adviser from managing a private investment vehicle for the fund family’s securities lending collateral, and commissions earned by an affiliated broker from portfolio transactions.
Based on its consideration of the factors and information it deemed relevant, including those described here, the Board did not find that any ancillary benefits received by Funds Management and its affiliates, including the Sub-Adviser, were unreasonable.
Conclusion
At the Meeting, after considering the above-described factors and based on its deliberations and its evaluation of the information described above, the Board unanimously approved the continuation of the Advisory Agreements for a one-year term and determined that the compensation payable to Funds Management and the Sub-Adviser under each of the Advisory Agreements was reasonable.
Wells Fargo Target Date Retirement Funds | 105
Other information (unaudited)
LIQUIDITY RISK MANAGEMENT PROGRAM
In accordance with Rule 22e-4 under the Investment Company Act of 1940, as amended (the “Liquidity Rule”), Wells Fargo Funds Trust (the “Trust”) has adopted and implemented a liquidity risk management program (the “Program”) on behalf of each of its series, including each Fund, which is reasonably designed to assess and manage the Fund’s liquidity risk. “Liquidity risk” is defined as the risk that a Fund is unable to meet redemption requests without significantly diluting remaining investors’ interests in the Fund. The Trust’s Board of Trustees (the “Board”) previously approved the designation of Wells Fargo Funds Management, LLC (“Funds Management”), each Fund’s investment manager, as the administrator of the Program, and Funds Management has established a Liquidity Risk Management Council composed of personnel from multiple departments within Funds Management and its affiliates to assist Funds Management in the implementation and on-going administration of the Program.
The Program is comprised of various components designed to support the assessment and/or management of liquidity risk, including: (1) the periodic assessment (no less frequently than annually) of certain factors that influence a Fund’s liquidity risk; (2) the periodic classification (no less frequently than monthly) of a Fund’s investments into one of four liquidity categories that reflect an estimate of their liquidity under current market conditions; (3) a 15% limit on the acquisition of “illiquid investments” (as defined under the Liquidity Rule); (4) to the extent a Fund does not invest primarily in “highly liquid investments” (as defined under the Liquidity Rule), the determination of a minimum percentage of the Fund’s assets that generally will be invested in highly liquid investments (an “HLIM”); (5) if a Fund has established an HLIM, the periodic review (no less frequently than annually) of the HLIM and the adoption of policies and procedures for responding to a shortfall of the Fund’s “highly liquid investments” below its HLIM; and (6) periodic reporting to the Board.
At a meeting of the Board held on May 26 and 28, 2020, the Board received a written report (the “Report”) from Funds Management that addressed the operation of the Program and assessed its adequacy and effectiveness of implementation. The Report covered the initial period from December 1, 2018 through December 31, 2019 (the “Reporting Period”). No significant liquidity events impacting any Fund were noted in the Report. There were no material changes to the Program during the Reporting Period. The Report concluded that the Program is operating effectively to assess and manage each Fund’s liquidity risk, and that the Program has been and continues to be adequately and effectively implemented to monitor and, as applicable, respond to the Fund’s liquidity developments.
There can be no assurance that the Program will achieve its objectives under all circumstances in the future. Please refer to a Fund’s prospectus for more information regarding the Fund’s exposure to liquidity risk and other risks to which an investment in the Fund may be subject.
106 | Wells Fargo Target Date Retirement Funds
This page is intentionally left blank.
Appendix I (unaudited)
On August 31, 2020, the Wells Fargo Target Blended Indexes were composed of the following indexes:
| | | | | | | | | | | | |
| | | |
| | | Wells Fargo
Target
Today
Blended
Index | | | Wells Fargo
Target
2010
Blended
Index | | | Wells Fargo
Target
2015
Blended
Index | |
| | | |
Bloomberg Barclays U.S. Aggregate ex-Corporate Index | | | 34.50 | % | | | 34.00 | % | | | 31.53 | % |
| | | |
Bloomberg Barclays U.S. Government Intermediate Bond Index | | | 5.83 | % | | | 5.75 | % | | | 5.33 | % |
| | | |
Bloomberg Barclays U.S. Treasury Inflation Notes: 1-10 Year Index | | | 5.83 | % | | | 5.75 | % | | | 5.33 | % |
| | | |
J.P. Morgan EMBI Global Diversified Index | | | 2.94 | % | | | 2.90 | % | | | 2.69 | % |
| | | |
MSCI EM Index (Net) | | | 1.82 | % | | | 1.91 | % | | | 2.36 | % |
| | | |
MSCI USA Minimum Volatility Net Index (USA) | | | 5.00 | % | | | 4.80 | % | | | 3.80 | % |
| | | |
MSCI World ex USA Index (Net) | | | 6.06 | % | | | 6.36 | % | | | 7.87 | % |
| | | |
Russell 1000® Index | | | 11.71 | % | | | 12.29 | % | | | 15.20 | % |
| | | |
Russell 2000® Index | | | 2.92 | % | | | 3.07 | % | | | 3.79 | % |
| | | |
Wells Fargo U.S. High Yield Bond Index | | | 2.94 | % | | | 2.90 | % | | | 2.69 | % |
| | | |
Wells Fargo U.S. Investment Grade Corporate Bond Index | | | 17.95 | % | | | 17.69 | % | | | 16.41 | % |
| | | |
Wells Fargo U.S. REIT Index | | | 2.50 | % | | | 2.58 | % | | | 3.00 | % |
Average annual total returns (%) as of August 31, 2020
| | | | | | | | | | | | |
| | | |
| | | 1 year | | | 5 year | | | 10 year | |
| | | |
Bloomberg Barclays U.S. Aggregate ex-Corporate Index1* | | | 5.92 | | | | – | | | | – | |
| | | |
Bloomberg Barclays U.S. Government Intermediate Bond Index2 | | | 5.44 | | | | 2.90 | | | | 2.34 | |
| | | |
Bloomberg Barclays U.S. Treasury Inflation Notes: 1-10 Year Index3 | | | 7.24 | | | | 3.68 | | | | 2.86 | |
| | | |
J.P. Morgan EMBI Global Diversified Index4 | | | 2.73 | | | | 6.27 | | | | 5.80 | |
| | | |
MSCI EM Index (Net)5 | | | 14.49 | | | | 8.66 | | | | 3.76 | |
| | | |
MSCI USA Minimum Volatility Net Index (USA)6 | | | 3.87 | | | | 11.97 | | | | 13.57 | |
| | | |
MSCI World ex USA Index (Net)7 | | | 5.96 | | | | 4.83 | | | | 5.63 | |
| | | |
Russell 1000® Index8 | | | 22.50 | | | | 14.31 | | | | 15.19 | |
| | | |
Russell 2000® Index9 | | | 6.02 | | | | 7.65 | | | | 11.53 | |
| | | |
Wells Fargo U.S. High Yield Bond Index10** | | | 4.82 | | | | – | | | | – | |
| | | |
Wells Fargo U.S. Investment Grade Corporate Bond Index11** | | | 7.24 | | | | – | | | | – | |
| | | |
Wells Fargo U.S. REIT Index12*** | | | (14.77 | ) | | | – | | | | – | |
| * | The inception date of the index is December 2015. |
| ** | The inception date of the index is April 2017. |
| *** | The inception date of the index is March 2017 |
| 1 | The Bloomberg Barclays U.S. Aggregate ex-Corporate Index is a broad-based benchmark that includes Treasuries, government-related securities, mortgage-backed securities (agency fixed-rate and hybrid adjustable-rate mortgage pass-throughs), asset-backed securities and commercial mortgage-backed securities (agency and non-agency). You cannot invest directly in an index. |
| 2 | The Bloomberg Barclays U.S. Government Intermediate Bond Index is an unmanaged index composed of U.S. government securities with maturities in the 1- to 10-year range, including securities issued by the U.S. Treasury and U.S. government agencies. You cannot invest directly in an index. |
| 3 | Bloomberg Barclays U.S. Treasury Inflation Notes: 1-10 Year Index measures the performance of the U.S. Treasury Inflation Protected Securities (TIPS) market with maturities more than 1 year and less than 10 years. Federal Reserve holdings of U.S. TIPS are not index eligible and are excluded from the face amount outstanding of each bond in the index. You cannot invest directly in an index. |
| 4 | The J.P. Morgan Emerging Markets Bond Index (“EMBI”) Global Diversified Index is a composite index representing an unleveraged investment in emerging market bonds that is broadly based across the spectrum of emerging market bonds and includes reinvestment of income (to represent real assets). You cannot invest directly in an index. |
108 | Wells Fargo Target Date Retirement Funds
Appendix I (unaudited)
| | | | | | | | | | | | | | | | | | | | | | | | | | | | | | | | | | | | | | | | | | | |
| | | | | | | | |
Wells Fargo
Target
2020
Blended
Index | | Wells Fargo
Target
2025
Blended
Index | | Wells Fargo
Target
2030
Blended
Index | | Wells Fargo
Target
2035
Blended
Index | | Wells Fargo
Target
2040
Blended
Index | | Wells Fargo
Target
2045
Blended
Index | | Wells Fargo
Target
2050
Blended
Index | | Wells Fargo
Target
2055
Blended
Index | | Wells Fargo
Target
2060
Blended
Index |
| | | | | | | | |
| | | 28.97% | | | | | 25.89 | % | | | | 21.86 | % | | | | 16.58 | % | | | | 11.24 | % | | | | 8.29 | % | | | | 5.92 | % | | | | 5.92 | % | | | | 5.92 | % |
| | | | | | | | |
| | | 4.50% | | | | | 2.13 | % | | | | 0.53 | % | | | | 0.00 | % | | | | 0.00 | % | | | | 0.00 | % | | | | 0.00 | % | | | | 0.00 | % | | | | 0.00 | % |
| | | | | | | | |
| | | 4.50% | | | | | 2.13 | % | | | | 0.53 | % | | | | 0.00 | % | | | | 0.00 | % | | | | 0.00 | % | | | | 0.00 | % | | | | 0.00 | % | | | | 0.00 | % |
| | | | | | | | |
| | | 2.47% | | | | | 2.18 | % | | | | 1.84 | % | | | | 1.40 | % | | | | 0.95 | % | | | | 0.70 | % | | | | 0.50 | % | | | | 0.50 | % | | | | 0.50 | % |
| | | | | | | | |
| | | 2.93% | | | | | 4.02 | % | | | | 5.18 | % | | | | 6.31 | % | | | | 7.31 | % | | | | 7.84 | % | | | | 8.28 | % | | | | 8.28 | % | | | | 8.28 | % |
| | | | | | | | |
| | | 2.80% | | | | | 1.80 | % | | | | 0.80 | % | | | | 0.00 | % | | | | 0.00 | % | | | | 0.00 | % | | | | 0.00 | % | | | | 0.00 | % | | | | 0.00 | % |
| | | | | | | | |
| | | 9.77% | | | | | 13.38 | % | | | | 17.31 | % | | | | 21.21 | % | | | | 24.37 | % | | | | 26.22 | % | | | | 27.72 | % | | | | 27.72 | % | | | | 27.72 | % |
| | | | | | | | |
| | | 18.67% | | | | | 24.48 | % | | | | 30.34 | % | | | | 35.58 | % | | | | 39.46 | % | | | | 41.55 | % | | | | 43.20 | % | | | | 43.20 | % | | | | 43.20 | % |
| | | | | | | | |
| | | 4.67% | | | | | 6.14 | % | | | | 7.59 | % | | | | 8.90 | % | | | | 9.87 | % | | | | 10.39 | % | | | | 10.80 | % | | | | 10.80 | % | | | | 10.80 | % |
| | | | | | | | |
| | | 2.47% | | | | | 2.18 | % | | | | 1.84 | % | | | | 1.40 | % | | | | 0.95 | % | | | | 0.70 | % | | | | 0.50 | % | | | | 0.50 | % | | | | 0.50 | % |
| | | | | | | | |
| | | 15.08% | | | | | 13.47 | % | | | | 11.38 | % | | | | 8.62 | % | | | | 5.85 | % | | | | 4.31 | % | | | | 3.08 | % | | | | 3.08 | % | | | | 3.08 | % |
| | | | | | | | |
| | | 3.17% | | | | | 2.20 | % | | | | 0.80 | % | | | | 0.00 | % | | | | 0.00 | % | | | | 0.00 | % | | | | 0.00 | % | | | | 0.00 | % | | | | 0.00 | % |
| 5 | The MSCI Emerging Markets (EM) Index (Net) is a free-float-adjusted market-capitalization-weighted index that is designed to measure the equity market performance of emerging markets. You cannot invest directly in an index. |
| 6 | The MSCI USA Minimum Volatility (USD) Index aims to reflect the performance characteristics of a minimum variance strategy applied to the large and mid cap USA equity universe. The index is calculated by optimizing the MSCI USA Index, its parent index, in USD for the lowest absolute risk (within a given set of constraints). You cannot invest directly in an index. |
| 7 | The MSCI All Country World Index (ACWI) ex USA Index (Net) is a free-float-adjusted market-capitalizationweighted index that is designed to measure the equity market performance of developed and emerging markets, excluding the United States. |
| 8 | The Russell 1000® Index measures the performance of the 1,000 largest companies in the Russell 3000® Index, which represents approximately 92% of the total market capitalization of the Russell 3000® Index. You cannot invest directly in an index. |
| 9 | The Russell 2000® Index measures the performance of the 2,000 smallest companies in the Russell 3000® Index, which represents approximately 8% of the total market capitalization of the Russell 3000® Index. You cannot invest directly in an index. |
| 10 | The Wells Fargo U.S. High Yield Bond Index is a rules-based index designed to measure the performance of U.S. dollar denominated below investment-grade corporate debt issued by U.S. or foreign issuers that have a remaining maturity of at least one year, regardless of optionality; it is constructed to provide increased diversification and liquidity versus traditional passive high yield bond indexes. You cannot invest directly in an index. |
| 11 | The Wells Fargo U.S. Investment Grade Corporate Bond Index is a rules-based index designed to measure the performance of publicly issued U.S. dollar denominated investment grade, fixed rate corporate bonds issued by U.S. or foreign issuers that have a remaining maturity of at least one year, regardless of optionality; it is constructed to provide increased diversification and liquidity versus traditional passive corporate credit indexes. You cannot invest directly in an index. |
| 12 | The Wells Fargo U.S. REIT Index is a float-adjusted, capitalization-weighted index of all applicable NYSE MKT or NASDAQ-listed classes of REIT stock that satisfy specified market capitalization and other eligibility requirements. You cannot invest directly in an index. |
Wells Fargo Target Date Retirement Funds | 109
Appendix II (unaudited)
Effective June 1, 2020, shareholders purchasing Fund shares through an Oppenheimer & Co. Inc. (“Oppenheimer”) platform or account are eligible only for the following load waivers (front-end sales charge waivers and contingent deferred or back-end, sales charge waivers) and discounts, which may differ from those disclosed in the Fund’s Prospectus or SAI.
|
| Front-end Sales Load Waivers on Class A Shares available at Oppenheimer |
|
| Employer-sponsored retirement, deferred compensation and employee benefit plans (including health savings accounts) and trusts used to fund those plans, provided that the shares are not held in a commission-based brokerage account and shares are held for the benefit of the plan. |
|
| Shares purchased by or through a 529 Plan. |
|
| Shares purchased through an Oppenheimer affiliated investment advisory program. |
|
| Shares purchased through reinvestment of capital gains distributions and dividend reinvestment when purchasing shares of the same fund (but not any other fund within the fund family). |
|
| Shares purchased from the proceeds of redemptions within the same fund family, provided (1) the repurchase occurs within 90 days following the redemption, (2) the redemption and purchase occur in the same account, and (3) redeemed shares were subject to a front-end or deferred sales load (known as Rights of Restatement). |
|
| A shareholder in the Fund’s Class C shares will have their shares exchanged at net asset value to Class A shares (or the appropriate share class) of the Fund if the shares are no longer subject to a CDSC and the exchange is in line with the policies and procedures of Oppenheimer. |
|
| Employees and registered representatives of Oppenheimer or its affiliates and their family members. |
|
| Directors or Trustees of the Fund, and employees of the Fund’s investment adviser or any of its affiliates, as described in the Prospectus. |
| CDSC Waivers on A and C Shares available at Oppenheimer |
|
| Death or disability of the shareholder. |
|
| Shares sold as part of a systematic withdrawal plan as described in the Prospectus. |
|
| Return of excess contributions from an IRA Account. |
|
| Shares sold as part of a required minimum distribution for IRA and retirement accounts due to the shareholder reaching the qualified age based on applicable IRS regulations as described in the Prospectus. |
|
| Shares sold to pay Oppenheimer fees but only if the transaction is initiated by Oppenheimer. |
|
| Shares acquired through a right of reinstatement. |
| Front-end load Discounts Available at Oppenheimer: Breakpoints, Rights of Accumulation & Letters of Intent |
|
| Breakpoints as described in the Prospectus. |
|
| Rights of Accumulation (ROA), which entitle shareholders to breakpoint discounts, will be automatically calculated based on the aggregated holding of fund family assets held by accounts within the purchaser’s household at Oppenheimer. Eligible fund family assets not held at Oppenheimer may be included in the ROA calculation only if the shareholder notifies his or her financial advisor about such assets. |
110 | Wells Fargo Target Date Retirement Funds
Appendix III (unaudited)
Effective June 15, 2020, shareholders purchasing fund shares through a Robert W. Baird & Co. (“Baird”) platform or account will only be eligible for the following sales charge waivers (front-end sales charge waivers and CDSC waivers) and discounts, which may differ from those disclosed elsewhere in the Fund’s Prospectus or the SAI.
|
| Front-end Sales Load Waivers on Class A Shares available at Baird |
|
| Shares purchased through reinvestment of capital gains distributions and dividend reinvestment when purchasing share of the same fund. |
|
| Share purchase by employees and registers representatives of Baird or its affiliate and their family members as designated by Baird. |
|
| Shares purchase from the proceeds of redemptions within the same fund family, provided (1) the repurchase occurs within 90 days following the redemption, (2) the redemption and purchase occur in the same accounts, and (3) redeemed shares were subject to a front-end or deferred sales charge (known as rights of reinstatement). |
|
| A shareholder in the Funds Investor C Shares will have their share exchanged at net asset value to Investor A shares of the fund if the shares are no longer subject to CDSC and the exchange is in line with the policies and procedures of Baird. |
|
| Employer-sponsored retirement plans or charitable accounts in a transactional brokerage account at Baird, including 401(k) plans, 457 plans, employer-sponsored 403(b) plans, profit sharing and money purchase pension plans and defined benefit plans. For purposes of this provision, employer-sponsored retirement plans do not include SEP IRAs, Simple IRAs or SAR-SEPs. |
| CDSC Waivers on A and C Shares available at Baird |
|
| Shares sold due to death or disability of the shareholder. |
|
| Shares sold as part of a systematic withdrawal plan as described in the Fund’s Prospectus. |
|
| Shares bought due to returns of excess contributions from an IRA Account. |
|
| Shares sold as part of a required minimum distribution for IRA and retirement accounts due to the shareholder reaching age 72 as described in the Fund’s Prospectus. |
|
| Shares sold to pay Baird fees but only if the transaction is initiated by Baird. |
|
| Shares acquired through a right of reinstatement. |
| Front-end load Discounts Available at Baird: Breakpoint and/or Rights of Accumulation |
|
| Breakpoints as described in the Prospectus. |
|
| Rights of accumulations which entitles shareholders to breakpoint discounts will be automatically calculated based on the aggregated holding of fund family assets held by accounts within the purchaser’s household at Baird. Eligible fund family assets not held at Baird may be included in the rights of accumulations calculation only if the shareholder notifies his or her financial advisor about such assets. |
|
| Letters of Intent (LOI) allow for breakpoint discounts based on anticipated purchases within a fund family through Baird, over a 13-month period of time. |
Wells Fargo Target Date Retirement Funds | 111
This page is intentionally left blank.

For more information
More information about Wells Fargo Funds is available free upon request. To obtain literature, please write, visit the Funds’ website, or call:
Wells Fargo Funds
P.O. Box 219967
Kansas City, MO 64121-9967
Website: wfam.com
Individual investors: 1-800-222-8222
Retail investment professionals: 1-888-877-9275
Institutional investment professionals: 1-866-765-0778

This report and the financial statements contained herein are submitted for the general information of the shareholders of Wells Fargo Funds. If this report is used for promotional purposes, distribution of the report must be accompanied or preceded by a current prospectus. Before investing, please consider the investment objectives, risks, charges, and expenses of the investment. For a current prospectus and, if available, a summary prospectus, containing this information, call 1-800-222-8222 or visit the Funds’ website at wfam.com. Read the prospectus carefully before you invest or send money.
Wells Fargo Asset Management (WFAM) is the trade name for certain investment advisory/management firms owned by Wells Fargo & Company. These firms include but are not limited to Wells Capital Management Incorporated and Wells Fargo Funds Management, LLC. Certain products managed by WFAM entities are distributed by Wells Fargo Funds Distributor, LLC (a broker-dealer and Member FINRA).
This material is for general informational and educational purposes only and is NOT intended to provide investment advice or a recommendation of any kind—including a recommendation for any specific investment, strategy, or plan.
INVESTMENT PRODUCTS: NOT FDIC INSURED ◾ NO BANK GUARANTEE ◾ MAY LOSE VALUE
© 2020 Wells Fargo & Company. All rights reserved
PAR-0920-00417 10-20
SOFLD/SAR101 08-20
Semi-Annual Report
August 31, 2020
Target Date Retirement Funds
| ∎ | | Wells Fargo Dynamic Target Today Fund |
| ∎ | | Wells Fargo Dynamic Target 2015 Fund |
| ∎ | | Wells Fargo Dynamic Target 2020 Fund |
| ∎ | | Wells Fargo Dynamic Target 2025 Fund |
| ∎ | | Wells Fargo Dynamic Target 2030 Fund |
| ∎ | | Wells Fargo Dynamic Target 2035 Fund |
| ∎ | | Wells Fargo Dynamic Target 2040 Fund |
| ∎ | | Wells Fargo Dynamic Target 2045 Fund |
| ∎ | | Wells Fargo Dynamic Target 2050 Fund |
| ∎ | | Wells Fargo Dynamic Target 2055 Fund |
| ∎ | | Wells Fargo Dynamic Target 2060 Fund |
Beginning on January 1, 2021, as permitted by new regulations adopted by the Securities and Exchange Commission, paper copies of the Wells Fargo Funds’ annual and semi-annual shareholder reports issued after this date will no longer be sent by mail, unless you specifically request paper copies of the reports. Instead, the reports will be made available on the Funds’ website, and you will be notified by mail each time a report is posted and provided with a website address to access the report.
If you already elected to receive shareholder reports electronically, you will not be affected by this change and you need not take any action. You may elect to receive shareholder reports and other communications from the Fund electronically at any time by contacting your financial intermediary (such as a broker-dealer or bank) or, if you are a direct investor, by calling 1-800-222-8222 or by enrolling at wellsfargo.com/advantagedelivery.
You may elect to receive all future reports in paper free of charge. If you invest through a financial intermediary, you can contact your financial intermediary to request that you continue to receive paper copies of your shareholder reports; if you invest directly with the Fund, you can call 1-800-222-8222. Your election to receive reports in paper will apply to all Wells Fargo Funds held in your account with your financial intermediary or, if you are a direct investor, to all Wells Fargo Funds that you hold.
|
|
|
Reduce clutter. Save trees. |
Sign up for electronic delivery of prospectuses and shareholder reports at wellsfargo.com/ advantagedelivery |
The views expressed and any forward-looking statements are as of August 31, 2020, unless otherwise noted, and are those of the Fund’s portfolio managers and/or Wells Fargo Asset Management. Discussions of individual securities, or the markets generally, or any Wells Fargo Fund are not intended as individual recommendations. Future events or results may vary significantly from those expressed in any forward-looking statements. The views expressed are subject to change at any time in response to changing circumstances in the market. Wells Fargo Asset Management and the Fund disclaim any obligation to publicly update or revise any views expressed or forward-looking statements.
INVESTMENT PRODUCTS: NOT FDIC INSURED ◾ NO BANK GUARANTEE ◾ MAY LOSE VALUE
Target Date Retirement Funds | 1
Letter to shareholders (unaudited)

Andrew Owen
President
Wells Fargo Funds
Dear Shareholder:
We are pleased to offer you this semi-annual report for the Wells Fargo Dynamic Target Date Funds for the six-month period that ended August 31, 2020. Global stock markets tumbled in March as governments took unprecedented measures to stop the spread of the coronavirus at the expense of short-term economic output. However, most markets rebounded from April on to more than offset losses as central banks bolstered capital markets and confidence. U.S. equities easily outperformed other assets, though stocks broadly performed well while bonds had more modest returns for the six-month period.
For the period, U.S. stocks, based on the S&P 500 Index,1 returned 19.63% and international stocks, as measured by the MSCI ACWI ex USA Index (Net),2 gained 8.17%. The MSCI EM Index (Net)3 gained 11.23%. For bond investors, the Bloomberg Barclays U.S. Aggregate Bond Index4 added 2.98%, the Bloomberg Barclays Global Aggregate ex-USD Index5 returned 4.80%, the Bloomberg Barclays Municipal Bond Index6 had a more modest 0.19% return, and the ICE BofA U.S. High Yield Index7 gained 2.34%.
Concerns about the coronavirus took over the market.
As the six-month period began, the global spread of the coronavirus led many countries to clamp down on social and business-related activity in March in order to contain the virus from causing even greater devastation and overwhelming the health care system. This abrupt stoppage of economic activity led to the sharp deceleration of global output, sending economies into a deep contraction. Central bank responses were swift, as they slashed interest rates and expanded quantitative easing programs to restore liquidity and confidence to the markets. In the U.S., the Federal Reserve (Fed) launched several lending programs, funding investment-grade bonds, money market mutual funds, and commercial paper while purchasing Treasuries, mortgage-backed securities, and overnight repurchase agreements. Meanwhile, stock markets tumbled quickly into a bear market, ending the longest bull stock market in U.S. history.
Markets rebounded strongly in April, fueled by unprecedented government and central bank stimulus measures. The U.S. economy contracted by an annualized 5.0% pace in the first quarter, with 30 million new unemployment insurance claims in six weeks. In the eurozone, first-quarter real gross domestic product (GDP) shrank 3.8%, with the composite April flash purchasing managers’ index falling to an all-time low of 13.5. The European Central Bank expanded its quantitative easing to include the purchase of additional government bonds of countries with the greatest virus-related need,
| 1 | The S&P 500 Index consists of 500 stocks chosen for market size, liquidity, and industry group representation. It is a market-value-weighted index with each stock’s weight in the index proportionate to its market value. You cannot invest directly in an index. |
| 2 | The Morgan Stanley Capital International (MSCI) All Country World Index (ACWI) ex USA Index (Net) is a free-float-adjusted market-capitalization-weighted index that is designed to measure the equity market performance of developed and emerging markets, excluding the United States. Source: MSCI. MSCI makes no express or implied warranties or representations and shall have no liability whatsoever with respect to any MSCI data contained herein. The MSCI data may not be further redistributed or used as a basis for other indices or any securities or financial products. This report is not approved, reviewed, or produced by MSCI. You cannot invest directly in an index. |
| 3 | The MSCI Emerging Markets (EM) Index (Net) is a free-float-adjusted market-capitalization-weighted index that is designed to measure equity market performance of emerging markets. You cannot invest directly in an index. |
| 4 | The Bloomberg Barclays U.S. Aggregate Bond Index is a broad-based benchmark that measures the investment-grade, U.S. dollar-denominated, fixed-rate taxable bond market, including Treasuries, government-related and corporate securities, mortgage-backed securities (agency fixed-rate and hybrid adjustable-rate mortgage pass-throughs), asset-backed securities, and commercial mortgage-backed securities. You cannot invest directly in an index. |
| 5 | The Bloomberg Barclays Global Aggregate ex-USD Index is an unmanaged index that provides a broad-based measure of the global investment-grade fixed-income markets excluding the U.S. dollar-denominated debt market. You cannot invest directly in an index. |
| 6 | The Bloomberg Barclays Municipal Bond Index is an unmanaged index composed of long-term tax-exempt bonds with a minimum credit rating of Baa. You cannot invest directly in an index. |
| 7 | The ICE BofA U.S. High Yield Index is a market-capitalization-weighted index of domestic and Yankee high-yield bonds. The index tracks the performance of high-yield securities traded in the U.S. bond market. You cannot invest directly in an index. Copyright 2020. ICE Data Indices, LLC. All rights reserved. |
2 | Target Date Retirement Funds
Letter to shareholders (unaudited)
including Italy and Spain. China’s first-quarter GDP fell by 6.8% year over year. However, retail sales, production, and investment showed signs of recovery. Extreme oil-price volatility continued as global supply far exceeded demand.
The equity market rebound continued in May, with widespread strong monthly gains. Investors regained confidence on reports of early signs of success in human trials of a coronavirus vaccine. Growth stocks continued to outperform value stocks while returns on global government bonds were generally flat. In the U.S., a gap grew between the stock market rebound and devastating economic data points, including an April unemployment rate of 14.7%, the highest level since World War II. Purchasing managers’ indices continued to reflect weakening activity in May in both the manufacturing and services sectors. U.S. corporate earnings reports indicated a 14% year-over-year contraction in earnings from the first quarter of 2019. However, high demand for technology, driven by remote activity, helped maintain robust information technology sector earnings, which helped drive leading technology stocks higher.
Financial markets posted widely positive returns in June despite ongoing economic weakness and high levels of uncertainty on the containment of the coronavirus and the timing of an effective vaccine. There were hopeful signs as economies reopened, with U.S. and U.K. retail sales rebounding sharply in May. However, year over year, sales remained depressed. Vitally important to market sentiment was the ongoing commitment by central banks globally to do all they could to provide economic support through liquidity and low borrowing costs. U.S. economic activity was aided by one-time $1,200 stimulus checks and $600 bonus weekly unemployment benefits that expired at the end of July. However, unemployment remained historically high but eased from 14.7% in April to 11.1% in June. During June, numerous states reported increases in coronavirus cases. China’s economic recovery picked up momentum in June, though it remained far from a full recovery.
July was a broadly positive month for both global equities and fixed income. However, economic data and a resurgence of coronavirus cases pointed to the vulnerability of the global economy and the ongoing imperative to regain control of the pandemic. Second-quarter GDP shrank from the previous quarter by 9.5% and 12.1% in the U.S. and eurozone, respectively. In contrast, China reported a 3.2% year-over-year expansion in its second-quarter GDP. U.S. unemployment remained high despite adding 1.8 million jobs in July, with a double-digit jobless rate persisting. However, manufacturing activity grew in both the U.S. and eurozone. In Asia, while China’s manufacturing sector continued to expand, activity in Japan and South Korea contracted. In July, a rising concern was the rapid and broad reemergence of coronavirus infections.
The stock market continued to rally in August despite concerns over rising numbers of COVID-19 cases in the United States and several European countries, including France and Spain, as well as the expiration of the $600 weekly bonus unemployment benefit at the end of July. U.S. stocks had strong monthly gains, led by the so-called FAANG stocks—Facebook, Apple, Amazon, Netflix, and Google (Alphabet)—which dominate these indices and continued to rally. U.S. stocks generally surpassed other broadly positive global equity performance while fixed-income market monthly returns were broadly flat. Generally stronger-than-expected second-quarter earnings boosted investor sentiment along with the Fed’s announcement of a policy shift that will likely lead to longer-term low interest rates and supportive monetary policy. The U.S. flash purchasing managers’ indices for both manufacturing and services beat expectations while U.S. housing market indicators were strong. In Europe, retail sales expanded and consumer confidence remained steady. China’s economy continued its fairly steady expansion. Overall, developed markets performed better than emerging market equities for the month of August as people took comfort in better-known equities in perceived safer markets.
“The stock market continued to rally in August despite concerns over rising numbers of COVID-19 cases in the United States and several European countries, including France and Spain, as well as the expiration of the $600 weekly bonus unemployment benefit at the end of July.”
Target Date Retirement Funds | 3
Letter to shareholders (unaudited)
|
|
|
For further information about your Fund, contact your investment professional, visit our website at wfam.com, or call us directly at 1-800-222-8222. |
Don’t let short-term uncertainty derail long-term investment goals.
Periods of investment uncertainty can present challenges, but experience has taught us that maintaining long-term investment goals can be an effective way to plan for the future. To help you create a sound strategy based on your personal goals and risk tolerance, Wells Fargo Funds offers more than 100 mutual funds spanning a wide range of asset classes and investment styles. Although diversification cannot guarantee an investment profit or prevent losses, we believe it can be an effective way to manage investment risk and potentially smooth out overall portfolio performance. We encourage investors to know their investments and to understand that appropriate levels of risk-taking may unlock opportunities.
Thank you for choosing to invest with Wells Fargo Funds. We appreciate your confidence in us and remain committed to helping you meet your financial needs.
Sincerely,

Andrew Owen
President
Wells Fargo Funds
Notice to Shareholders
At a meeting held on August 10-12, 2020, the Board of Trustees of the Funds approved a change to the Funds’ automatic conversion feature for Class C shares in order to shorten the required holding period from 10 to 8 years. As a result, on a monthly basis beginning November 5, 2020, Class C shares will convert automatically into Class A shares 8 years after the initial date of purchase or, if you acquired your Class C shares through an exchange or conversion from another share class, 8 years after the date you acquired your Class C shares. When Class C shares that you acquired through a purchase or exchange convert, any other Class C shares that you purchased with reinvested dividends and distributions also will convert into Class A shares on a pro rata basis.
Please note that a shorter holding period may apply depending on your intermediary. Please see “Appendix A—Sales Charge Reductions and Waivers for Certain Intermediaries” in the Funds’ prospectus for further information.
4 | Target Date Retirement Funds
This page is intentionally left blank.
Performance highlights (unaudited)
Wells Fargo Dynamic Target Date Funds
Investment objective
Each Fund seeks total return over time, consistent with its strategic target allocation.
Manager
Wells Fargo Funds Management, LLC
Subadviser
Wells Capital Management Incorporated
Portfolio managers
Kandarp R. Acharya, CFA®‡, FRM
Petros N. Bocray, CFA®‡, FRM
Christian L. Chan, CFA®‡
The target date represents the year in which investors may likely begin withdrawing assets. The Funds gradually seek to reduce market risk as the target date approaches and after it arrives by decreasing equity exposure and increasing fixed income exposure. The principal value is not guaranteed at any time, including at the target date.
Stock values fluctuate in response to the activities of individual companies and general market and economic conditions. Bond values fluctuate in response to the financial condition of individual issuers, general market and economic conditions, and changes in interest rates. Changes in market conditions and government policies may lead to periods of heightened volatility in the bond market and reduced liquidity for certain bonds held by each Fund. In general, when interest rates rise, bond values fall and investors may lose principal value. Interest rate changes and their impact on each Fund and its share price can be sudden and unpredictable. High-yield securities have a greater risk of default and tend to be more volatile than higher-rated debt securities. The use of derivatives may reduce returns and/or increase volatility. Securities issued by U.S. government agencies or government-sponsored entities may not be guaranteed by the U.S. Treasury. The Funds will indirectly be exposed to all of the risks of an investment in the underlying funds and will indirectly bear expenses of the underlying funds. Certain investment strategies tend to increase the total risk of an investment (relative to the broader market). The Funds are exposed to foreign investment risk, mortgage- and asset-backed securities risk, regulatory risk, and smaller-company investment risk. Consult the Funds’ prospectus for additional information on these and other risks.
| ‡ | CFA® and Chartered Financial Analyst® are trademarks owned by CFA Institute. |
6 | Target Date Retirement Funds
Performance highlights (unaudited)
Dynamic Target Today Fund
Average annual total returns (%) as of August 31, 2020
| | | | | | | | | | | | | | | | | | | | | | | | | | |
| | | | |
| | | | | Including sales charge | | | Excluding sales charge | | | Expense ratios1 (%) | |
| | | | | | | |
| | | Inception date | | 1 year | | | Since
Inception | | | 1 year | | | Since
Inception | | | Gross | | | Net2 | |
| | | | | | | | |
| Class A (WDYAX) | | 11-30-2015 | | | 1.55 | | | | 5.00 | | | | 7.75 | | | | 6.32 | | | | 3.44 | | | | 0.68 | |
| | | | | | | | |
| Class C (WDYCX) | | 11-30-2015 | | | 7.46 | | | | 5.86 | | | | 8.46 | | | | 5.86 | | | | 4.19 | | | | 1.43 | |
| | | | | | | | |
| Class R4 (WDYYX) | | 11-30-2015 | | | – | | | | – | | | | 8.01 | | | | 6.64 | | | | 3.16 | | | | 0.37 | |
| | | | | | | | |
| Class R6 (WDYZX) | | 11-30-2015 | | | – | | | | – | | | | 8.15 | | | | 6.80 | | | | 3.01 | | | | 0.22 | |
| | | | | | | | |
| S&P Target Date Retirement Income Index3 | | – | | | – | | | | – | | | | 8.35 | | | | 5.76 | * | | | – | | | | – | |
| | | | | | | | |
| Wells Fargo Dynamic Target Date Today Blended Index4 | | – | | | – | | | | – | | | | 7.11 | | | | – | | | | – | | | | – | |
| * | Based on the inception date of the oldest Fund class. |
Figures quoted represent past performance, which is no guarantee of future results, and do not reflect taxes that a shareholder may pay on an investment in a fund. Investment return and principal value of an investment will fluctuate so that an investor’s shares, when redeemed, may be worth more or less than their original cost. Performance shown without sales charges would be lower if sales charges were reflected. Current performance may be lower or higher than the performance data quoted and assumes the reinvestment of dividends and capital gains. Current month-end performance is available on the Fund’s website, wfam.com.
Index returns do not include transaction costs associated with buying and selling securities, any mutual fund fees or expenses, or any taxes. It is not possible to invest directly in an index.
For Class A shares, the maximum front-end sales charge is 5.75%. For Class C shares, the maximum contingent deferred sales charge is 1.00%. Performance including a contingent deferred sales charge assumes the sales charge for the corresponding time period. Class R4 and Class R6 shares are sold without a front-end sales charge or contingent deferred sales charge.
| | | | |
|
| Holdings (%) as of August 31, 20205 | |
| | |
Wells Fargo Bloomberg Barclays US Aggregate
ex-Corporate Portfolio | | | 29.64 | |
| | |
Wells Fargo Factor Enhanced U.S. Large Cap Equity Portfolio | | | 19.01 | |
| | |
Wells Fargo Investment Grade Corporate Bond Portfolio | | | 15.46 | |
| | |
Wells Fargo Strategic Retirement Bond Portfolio | | | 10.04 | |
| | |
Wells Fargo Factor Enhanced International Equity Portfolio | | | 9.89 | |
| | |
Wells Fargo Factor Enhanced U.S. Small Cap Equity Portfolio | | | 4.74 | |
| | |
Wells Fargo U.S. REIT Portfolio | | | 3.32 | |
| | |
Wells Fargo Factor Enhanced Emerging Markets Equity Portfolio | | | 2.93 | |
| | |
Wells Fargo High Yield Corporate Bond Portfolio | | | 2.53 | |
| | |
Wells Fargo Emerging Markets Bond Portfolio | | | 2.52 | |
| | | | | | | | |
|
| Allocations (%) as of August 31, 2020 | |
| | |
| | | Neutral
Allocation | | | Effective
Allocation6 | |
| | | |
Equity | | | 40 | | | | 42 | |
| | | |
Fixed Income | | | 60 | | | | 60 | |
| | | |
Effective Cash | | | 0 | | | | -2 | |
Please see footnotes on page 8.
Target Date Retirement Funds | 7
Performance highlights (unaudited)
Dynamic Target Today Fund (continued)
| | | | | | | | | | | | |
|
| Volatility metrics as of August 31, 20207 | |
| | | |
| | | Beta8 | | | Standard
deviation9 | | | R-squared10 | |
| | | | |
Class A | | | 1.06 | | | | 6.43 | % | | | 0.97 | |
| | | | |
Class C | | | 1.07 | | | | 6.57 | % | | | 0.95 | |
| | | | |
Class R4 | | | 1.06 | | | | 6.44 | % | | | 0.97 | |
| | | | |
Class R6 | | | 1.06 | | | | 6.44 | % | | | 0.97 | |
| 1 | Reflects the expense ratios as stated in the most recent prospectuses, which include the impact of 0.12% of acquired fund fees and expenses representing the net expenses from the affiliated master portfolios. The expense ratios shown are subject to change and may differ from the annualized expense ratios shown in the financial highlights of this report. |
| 2 | The manager has committed through June 30, 2021, to waive fees and/or reimburse expenses to the extent necessary to cap the expenses of each class after fee waivers at 0.68% for Class A, 1.43% for Class C, 0.37% for Class R4, and 0.22% for Class R6. Brokerage commissions, stamp duty fees, interest, taxes, acquired fund fees and expenses (if any) from funds in which the affiliated master portfolios invest and from money market funds, and extraordinary expenses are excluded from the expense caps. All other acquired fund fees and expenses from the affiliated master portfolios are included in the expense caps. Prior to or after the commitment expiration date, the caps may be increased or the commitment to maintain the caps may be terminated only with the approval of the Board of Trustees. Without these caps, the Fund’s returns would have been lower. The expense ratio paid by an investor is the net expense ratio (the total annual fund operating expenses after fee waivers) as stated in the prospectuses. |
| 3 | The S&P Target Date Index is designed as a benchmark for multi-asset class portfolios with risk profiles that become more conservative over time, corresponding to the target retirement date. This index is representative of the investment opportunity available to investors for the target date horizon, with asset class exposures driven by a survey of available target date funds for that horizon. You cannot invest directly in an index. |
| 4 | Source: Wells Fargo Funds Management, LLC. The Wells Fargo Dynamic Target Blended Index is designed as a benchmark for multi-asset class portfolios with risk profiles that become more conservative over time, corresponding to the target retirement date. The index weightings among the major asset classes are adjusted annually. The inception date of the index is September 21, 2018. See Appendix I for additional information. You cannot invest directly in an index. |
| 5 | Holdings, excluding cash, cash equivalents and any money market funds, are calculated based on the value of the investments divided by total net assets of the Fund. Holdings are subject to change and may have changed since the date specified. |
| 6 | The effective allocation includes the effect of any tactical futures overlay that may be in place. Effective cash, if any, represents the net offset to such future positions. The effective allocation does not reflect futures positions held in dynamic risk hedging strategies. Effective allocations are subject to change and may have changed since the date specified. |
| 7 | These metrics show the degree and timing of the Fund’s fluctuations compared to S&P Target Date Retirement Income Index over 36 months. |
| 8 | Beta measures fund volatility relative to general market movements. It is a standardized measure of systematic risk in comparison with a specified index. The benchmark beta is 1.00 by definition. Beta is based on historical performance and does not represent future results. |
| 9 | Standard deviation is the square root of the sum of squared deviations from the mean. It is often used as a measure of volatility, variability, or risk. Standard deviation is based on historical performance and does not represent future results. |
| 10 | R-squared (R2) is a statistical measure that reflects the percentage of a fund’s movements that can be explained by movements in its benchmark index. The measure ranges from 0.0, which means that the fund’s performance bears no relationship to the performance of the index, to 1.0, which means that the fund’s performance was perfectly synchronized with the performance of the benchmark. R2 is based on historical performance and does not represent future results. |
8 | Target Date Retirement Funds
Performance highlights (unaudited)
Dynamic Target 2015 Fund
Average annual total returns (%) as of August 31, 2020
| | | | | | | | | | | | | | | | | | | | | | | | | | |
| | | | |
| | | | | Including sales charge | | | Excluding sales charge | | | Expense ratios1 (%) | |
| | | | | | | |
| | | Inception date | | 1 year | | | Since
Inception | | | 1 year | | | Since
Inception | | | Gross | | | Net2 | |
| | | | | | | | |
| Class A (WDTAX) | | 11-30-2015 | | | 1.48 | | | | 5.50 | | | | 7.68 | | | | 6.82 | | | | 3.63 | | | | 0.68 | |
| | | | | | | | |
| Class C (WDTCX) | | 11-30-2015 | | | 7.54 | | | | 6.36 | | | | 8.54 | | | | 6.36 | | | | 4.38 | | | | 1.43 | |
| | | | | | | | |
| Class R4 (WDTYX) | | 11-30-2015 | | | – | | | | – | | | | 7.87 | | | | 7.13 | | | | 3.35 | | | | 0.37 | |
| | | | | | | | |
| Class R6 (WDTZX) | | 11-30-2015 | | | – | | | | – | | | | 8.11 | | | | 7.31 | | | | 3.20 | | | | 0.22 | |
| | | | | | | | |
| S&P Target Date 2015 Index3 | | – | | | – | | | | – | | | | 9.38 | | | | 6.72 | * | | | – | | | | – | |
| | | | | | | | |
| Wells Fargo Dynamic Target 2015 Blended Index4 | | – | | | – | | | | – | | | | 7.26 | | | | – | | | | – | | | | – | |
| * | Based on the inception date of the oldest Fund class. |
Figures quoted represent past performance, which is no guarantee of future results, and do not reflect taxes that a shareholder may pay on an investment in a fund. Investment return and principal value of an investment will fluctuate so that an investor’s shares, when redeemed, may be worth more or less than their original cost. Performance shown without sales charges would be lower if sales charges were reflected. Current performance may be lower or higher than the performance data quoted and assumes the reinvestment of dividends and capital gains. Current month-end performance is available on the Fund’s website, wfam.com.
Index returns do not include transaction costs associated with buying and selling securities, any mutual fund fees or expenses, or any taxes. It is not possible to invest directly in an index.
For Class A shares, the maximum front-end sales charge is 5.75%. For Class C shares, the maximum contingent deferred sales charge is 1.00%. Performance including a contingent deferred sales charge assumes the sales charge for the corresponding time period. Class R4 and Class R6 shares are sold without a front-end sales charge or contingent deferred sales charge.
| | | | |
|
| Holdings (%) as of August 31, 20205 | |
| | |
Wells Fargo Bloomberg Barclays US Aggregate
ex-Corporate Portfolio | | | 25.26 | |
| | |
Wells Fargo Factor Enhanced U.S. Large Cap Equity Portfolio | | | 23.39 | |
| | |
Wells Fargo Investment Grade Corporate Bond Portfolio | | | 13.17 | |
| | |
Wells Fargo Factor Enhanced International Equity Portfolio | | | 12.14 | |
| | |
Wells Fargo Strategic Retirement Bond Portfolio | | | 8.56 | |
| | |
Wells Fargo Factor Enhanced U.S. Small Cap Equity Portfolio | | | 5.83 | |
| | |
Wells Fargo U.S. REIT Portfolio | | | 4.07 | |
| | |
Wells Fargo Factor Enhanced Emerging Markets Equity Portfolio | | | 3.59 | |
| | |
Wells Fargo High Yield Corporate Bond Portfolio | | | 2.15 | |
| | |
Wells Fargo Emerging Markets Bond Portfolio | | | 2.15 | |
| | | | | | | | |
|
| Allocations (%) as of August 31, 2020 | |
| | |
| | | Neutral
Allocation | | | Effective
Allocation6 | |
| | | |
Equity | | | 49 | | | | 51 | |
| | | |
Fixed Income | | | 51 | | | | 51 | |
| | | |
Effective Cash | | | 0 | | | | -2 | |
Please see footnotes on page 10.
Target Date Retirement Funds | 9
Performance highlights (unaudited)
Dynamic Target 2015 Fund (continued)
| | | | | | | | | | | | |
|
| Volatility metrics as of August 31, 20207 | |
| | | |
| | | Beta8 | | | Standard
deviation9 | | | R-squared10 | |
| | | | |
Class A | | | 1.00 | | | | 7.83 | % | | | 0.97 | |
| | | | |
Class C | | | 1.01 | | | | 7.93 | % | | | 0.96 | |
| | | | |
Class R4 | | | 0.99 | | | | 7.77 | % | | | 0.97 | |
| | | | |
Class R6 | | | 1.00 | | | | 7.84 | % | | | 0.97 | |
| 1 | Reflects the expense ratios as stated in the most recent prospectuses, which include the impact of 0.13% of acquired fund fees and expenses representing the net expenses from the affiliated master portfolios. The expense ratios shown are subject to change and may differ from the annualized expense ratios shown in the financial highlights of this report. |
| 2 | The manager has committed through June 30, 2021, to waive fees and/or reimburse expenses to the extent necessary to cap the expenses of each class after fee waivers at 0.68% for Class A, 1.43% for Class C, 0.37% for Class R4, and 0.22% for Class R6. Brokerage commissions, stamp duty fees, interest, taxes, acquired fund fees and expenses (if any) from funds in which the affiliated master portfolios invest and from money market funds, and extraordinary expenses are excluded from the expense caps. All other acquired fund fees and expenses from the affiliated master portfolios are included in the expense caps. Prior to or after the commitment expiration date, the caps may be increased or the commitment to maintain the caps may be terminated only with the approval of the Board of Trustees. Without these caps, the Fund’s returns would have been lower. The expense ratio paid by an investor is the net expense ratio (the total annual fund operating expenses after fee waivers) as stated in the prospectuses. |
| 3 | The S&P Target Date Index is designed as a benchmark for multi-asset class portfolios with risk profiles that become more conservative over time, corresponding to the target retirement date. This index is representative of the investment opportunity available to investors for the target date horizon, with asset class exposures driven by a survey of available target date funds for that horizon. You cannot invest directly in an index. |
| 4 | Source: Wells Fargo Funds Management, LLC. The Wells Fargo Dynamic Target Blended Index is designed as a benchmark for multi-asset class portfolios with risk profiles that become more conservative over time, corresponding to the target retirement date. The index weightings among the major asset classes are adjusted annually. The inception date of the index is September 21, 2018. See Appendix I for additional information. You cannot invest directly in an index. |
| 5 | Holdings, excluding cash, cash equivalents and any money market funds, are calculated based on the value of the investments divided by total net assets of the Fund. Holdings are subject to change and may have changed since the date specified. |
| 6 | The effective allocation includes the effect of any tactical futures overlay that may be in place. Effective cash, if any, represents the net offset to such future positions. The effective allocation does not reflect futures positions held in dynamic risk hedging strategies. Effective allocations are subject to change and may have changed since the date specified. |
| 7 | These metrics show the degree and timing of the Fund’s fluctuations compared to S&P Target Date 2015 Index over 36 months. |
| 8 | Beta measures fund volatility relative to general market movements. It is a standardized measure of systematic risk in comparison with a specified index. The benchmark beta is 1.00 by definition. Beta is based on historical performance and does not represent future results. |
| 9 | Standard deviation is the square root of the sum of squared deviations from the mean. It is often used as a measure of volatility, variability, or risk. Standard deviation is based on historical performance and does not represent future results. |
| 10 | R-squared (R2) is a statistical measure that reflects the percentage of a fund’s movements that can be explained by movements in its benchmark index. The measure ranges from 0.0, which means that the fund’s performance bears no relationship to the performance of the index, to 1.0, which means that the fund’s performance was perfectly synchronized with the performance of the benchmark. R2 is based on historical performance and does not represent future results. |
10 | Target Date Retirement Funds
Performance highlights (unaudited)
Dynamic Target 2020 Fund
Average annual total returns (%) as of August 31, 2020
| | | | | | | | | | | | | | | | | | | | | | | | | | |
| | | | |
| | | | | Including sales charge | | | Excluding sales charge | | | Expense ratios1 (%) | |
| | | | | | | |
| | | Inception date | | 1 year | | | Since
Inception | | | 1 year | | | Since
Inception | | | Gross | | | Net2 | |
| | | | | | | | |
| Class A (WDTDX) | | 11-30-2015 | | | 1.65 | | | | 5.97 | | | | 7.82 | | | | 7.30 | | | | 3.32 | | | | 0.68 | |
| | | | | | | | |
| Class C (WDTEX) | | 11-30-2015 | | | 7.39 | | | | 6.77 | | | | 8.39 | | | | 6.77 | | | | 4.07 | | | | 1.43 | |
| | | | | | | | |
| Class R4 (WDTGX) | | 11-30-2015 | | | – | | | | – | | | | 8.20 | | | | 7.62 | | | | 3.04 | | | | 0.37 | |
| | | | | | | | |
| Class R6 (WDTHX) | | 11-30-2015 | | | – | | | | – | | | | 8.24 | | | | 7.78 | | | | 2.89 | | | | 0.22 | |
| | | | | | | | |
| S&P Target Date 2020 Index3 | | – | | | – | | | | – | | | | 9.50 | | | | 7.10 | * | | | – | | | | – | |
| | | | | | | | |
| Wells Fargo Dynamic Target 2020 Blended Index4 | | – | | | – | | | | – | | | | 7.44 | | | | – | | | | – | | | | – | |
| * | Based on the inception date of the oldest Fund class. |
Figures quoted represent past performance, which is no guarantee of future results, and do not reflect taxes that a shareholder may pay on an investment in a fund. Investment return and principal value of an investment will fluctuate so that an investor’s shares, when redeemed, may be worth more or less than their original cost. Performance shown without sales charges would be lower if sales charges were reflected. Current performance may be lower or higher than the performance data quoted and assumes the reinvestment of dividends and capital gains. Current month-end performance is available on the Fund’s website, wfam.com.
Index returns do not include transaction costs associated with buying and selling securities, any mutual fund fees or expenses, or any taxes. It is not possible to invest directly in an index.
For Class A shares, the maximum front-end sales charge is 5.75%. For Class C shares, the maximum contingent deferred sales charge is 1.00%. Performance including a contingent deferred sales charge assumes the sales charge for the corresponding time period. Class R4 and Class R6 shares are sold without a front-end sales charge or contingent deferred sales charge.
| | | | |
| |
| Holdings (%) as of August 31, 20205 | | | |
| | |
Wells Fargo Factor Enhanced U.S. Large Cap Equity Portfolio | | | 27.30 | |
| | |
Wells Fargo Bloomberg Barclays US Aggregate
ex-Corporate Portfolio | | | 21.54 | |
| | |
Wells Fargo Factor Enhanced International Equity Portfolio | | | 14.31 | |
| | |
Wells Fargo Investment Grade Corporate Bond Portfolio | | | 11.23 | |
| | |
Wells Fargo Factor Enhanced U.S. Small Cap Equity Portfolio | | | 6.80 | |
| | |
Wells Fargo Strategic Retirement Bond Portfolio | | | 6.70 | |
| | |
Wells Fargo U.S. REIT Portfolio | | | 4.27 | |
| | |
Wells Fargo Factor Enhanced Emerging Markets Equity Portfolio | | | 4.24 | |
| | |
Wells Fargo High Yield Corporate Bond Portfolio | | | 1.83 | |
| | |
Wells Fargo Emerging Markets Bond Portfolio | | | 1.83 | |
| | | | | | | | |
|
| Allocations (%) as of August 31, 2020 | |
| | |
| | | Neutral
Allocation | | | Effective
Allocation6 | |
| | | |
Equity | | | 57 | | | | 59 | |
| | | |
Fixed Income | | | 43 | | | | 43 | |
| | | |
Effective Cash | | | 0 | | | | -2 | |
Please see footnotes on page 12.
Target Date Retirement Funds | 11
Performance highlights (unaudited)
Dynamic Target 2020 Fund (continued)
| | | | | | | | | | | | |
|
| Volatility metrics as of August 31, 20207 | |
| | | |
| | | Beta8 | | | Standard
deviation9 | | | R-squared10 | |
| | | | |
Class A | | | 1.00 | | | | 8.69 | % | | | 0.97 | |
| | | | |
Class C | | | 1.00 | | | | 8.80 | % | | | 0.96 | |
| | | | |
Class R4 | | | 1.00 | | | | 8.72 | % | | | 0.97 | |
| | | | |
Class R6 | | | 1.00 | | | | 8.71 | % | | | 0.97 | |
| 1 | Reflects the expense ratios as stated in the most recent prospectuses, which include the impact of 0.14% of acquired fund fees and expenses representing the net expenses from the affiliated master portfolios. The expense ratios shown are subject to change and may differ from the annualized expense ratios shown in the financial highlights of this report. |
| 2 | The manager has committed through June 30, 2021, to waive fees and/or reimburse expenses to the extent necessary to cap the expenses of each class after fee waivers at 0.68% for Class A, 1.43% for Class C, 0.37% for Class R4, and 0.22% for Class R6. Brokerage commissions, stamp duty fees, interest, taxes, acquired fund fees and expenses (if any) from funds in which the affiliated master portfolios invest and from money market funds, and extraordinary expenses are excluded from the expense caps. All other acquired fund fees and expenses from the affiliated master portfolios are included in the expense caps. Prior to or after the commitment expiration date, the caps may be increased or the commitment to maintain the caps may be terminated only with the approval of the Board of Trustees. Without these caps, the Fund’s returns would have been lower. The expense ratio paid by an investor is the net expense ratio (the total annual fund operating expenses after fee waivers) as stated in the prospectuses. |
| 3 | The S&P Target Date Index is designed as a benchmark for multi-asset class portfolios with risk profiles that become more conservative over time, corresponding to the target retirement date. This index is representative of the investment opportunity available to investors for the target date horizon, with asset class exposures driven by a survey of available target date funds for that horizon. You cannot invest directly in an index. |
| 4 | Source: Wells Fargo Funds Management, LLC. The Wells Fargo Dynamic Target Blended Index is designed as a benchmark for multi-asset class portfolios with risk profiles that become more conservative over time, corresponding to the target retirement date. The index weightings among the major asset classes are adjusted annually. The inception date of the index is September 21, 2018. See Appendix I for additional information. You cannot invest directly in an index. |
| 5 | Holdings, excluding cash, cash equivalents and any money market funds, are calculated based on the value of the investments divided by total net assets of the Fund. Holdings are subject to change and may have changed since the date specified. |
| 6 | The effective allocation includes the effect of any tactical futures overlay that may be in place. Effective cash, if any, represents the net offset to such future positions. The effective allocation does not reflect futures positions held in dynamic risk hedging strategies. Effective allocations are subject to change and may have changed since the date specified. |
| 7 | These metrics show the degree and timing of the Fund’s fluctuations compared to S&P Target Date 2020 Index over 36 months. |
| 8 | Beta measures fund volatility relative to general market movements. It is a standardized measure of systematic risk in comparison with a specified index. The benchmark beta is 1.00 by definition. Beta is based on historical performance and does not represent future results. |
| 9 | Standard deviation is the square root of the sum of squared deviations from the mean. It is often used as a measure of volatility, variability, or risk. Standard deviation is based on historical performance and does not represent future results. |
| 10 | R-squared (R2) is a statistical measure that reflects the percentage of a fund’s movements that can be explained by movements in its benchmark index. The measure ranges from 0.0, which means that the fund’s performance bears no relationship to the performance of the index, to 1.0, which means that the fund’s performance was perfectly synchronized with the performance of the benchmark. R2 is based on historical performance and does not represent future results. |
12 | Target Date Retirement Funds
Performance highlights (unaudited)
Dynamic Target 2025 Fund
Average annual total returns (%) as of August 31, 2020
| | | | | | | | | | | | | | | | | | | | | | | | | | |
| | | | |
| | | | | Including sales charge | | | Excluding sales charge | | | Expense ratios1 (%) | |
| | | | | | | |
| | | Inception date | | 1 year | | | Since
Inception | | | 1 year | | | Since
Inception | | | Gross | | | Net2 | |
| | | | | | | | |
| Class A (WDTIX) | | 11-30-2015 | | | 3.41 | | | | 6.51 | | | | 9.73 | | | | 7.85 | | | | 2.71 | | | | 0.68 | |
| | | | | | | | |
| Class C (WDTJX) | | 11-30-2015 | | | 9.45 | | | | 7.35 | | | | 10.45 | | | | 7.35 | | | | 3.46 | | | | 1.43 | |
| | | | | | | | |
| Class R4 (WDTLX) | | 11-30-2015 | | | – | | | | – | | | | 9.99 | | | | 8.15 | | | | 2.43 | | | | 0.37 | |
| | | | | | | | |
| Class R6 (WDTMX) | | 11-30-2015 | | | – | | | | – | | | | 10.24 | | | | 8.33 | | | | 2.28 | | | | 0.22 | |
| | | | | | | | |
| S&P Target Date 2025 Index3 | | – | | | – | | | | – | | | | 10.28 | | | | 7.62 | * | | | – | | | | – | |
| | | | | | | | |
| Wells Fargo Dynamic Target 2025 Blended Index4 | | – | | | – | | | | – | | | | 7.99 | | | | – | | | | – | | | | – | |
| * | Based on the inception date of the oldest Fund class. |
Figures quoted represent past performance, which is no guarantee of future results, and do not reflect taxes that a shareholder may pay on an investment in a fund. Investment return and principal value of an investment will fluctuate so that an investor’s shares, when redeemed, may be worth more or less than their original cost. Performance shown without sales charges would be lower if sales charges were reflected. Current performance may be lower or higher than the performance data quoted and assumes the reinvestment of dividends and capital gains. Current month-end performance is available on the Fund’s website, wfam.com.
Index returns do not include transaction costs associated with buying and selling securities, any mutual fund fees or expenses, or any taxes. It is not possible to invest directly in an index.
For Class A shares, the maximum front-end sales charge is 5.75%. For Class C shares, the maximum contingent deferred sales charge is 1.00%. Performance including a contingent deferred sales charge assumes the sales charge for the corresponding time period. Class R4 and Class R6 shares are sold without a front-end sales charge or contingent deferred sales charge.
| | | | |
|
| Holdings (%) as of August 31, 20205 | |
| | |
Wells Fargo Factor Enhanced U.S. Large Cap Equity Portfolio | | | 32.98 | |
| | |
Wells Fargo Factor Enhanced International Equity Portfolio | | | 18.03 | |
| | |
Wells Fargo Bloomberg Barclays US Aggregate
ex-Corporate Portfolio | | | 17.96 | |
| | |
Wells Fargo Investment Grade Corporate Bond Portfolio | | | 9.36 | |
| | |
Wells Fargo Factor Enhanced U.S. Small Cap Equity Portfolio | | | 8.24 | |
| | |
Wells Fargo Factor Enhanced Emerging Markets Equity Portfolio | | | 5.35 | |
| | |
Wells Fargo Strategic Retirement Bond Portfolio | | | 2.97 | |
| | |
Wells Fargo U.S. REIT Portfolio | | | 2.84 | |
| | |
Wells Fargo High Yield Corporate Bond Portfolio | | | 1.52 | |
| | |
Wells Fargo Emerging Markets Bond Portfolio | | | 1.51 | |
| | | | | | | | |
|
| Allocations (%) as of August 31, 2020 | |
| | |
| | | Neutral
Allocation | | | Effective
Allocation6 | |
| | | |
Equity | | | 67 | | | | 69 | |
| | | |
Fixed Income | | | 33 | | | | 33 | |
| | | |
Effective Cash | | | 0 | | | | -2 | |
Please see footnotes on page 14.
Target Date Retirement Funds | 13
Performance highlights (unaudited)
Dynamic Target 2025 Fund (continued)
| | | | | | | | | | | | |
|
| Volatility metrics as of August 31, 20207 | |
| | | |
| | | Beta8 | | | Standard
deviation9 | | | R-squared10 | |
| | | | |
Class A | | | 0.97 | | | | 10.02% | | | | 0.97 | |
| | | | |
Class C | | | 0.98 | | | | 10.16% | | | | 0.96 | |
| | | | |
Class R4 | | | 0.97 | | | | 9.98% | | | | 0.97 | |
| | | | |
Class R6 | | | 0.97 | | | | 9.98% | | | | 0.97 | |
| 1 | Reflects the expense ratios as stated in the most recent prospectuses, which include the impact of 0.14% of acquired fund fees and expenses representing the net expenses from the affiliated master portfolios. The expense ratios shown are subject to change and may differ from the annualized expense ratios shown in the financial highlights of this report. |
| 2 | The manager has committed through June 30, 2021, to waive fees and/or reimburse expenses to the extent necessary to cap the expenses of each class after fee waivers at 0.68% for Class A, 1.43% for Class C, 0.37% for Class R4, and 0.22% for Class R6. Brokerage commissions, stamp duty fees, interest, taxes, acquired fund fees and expenses (if any) from funds in which the affiliated master portfolios invest and from money market funds, and extraordinary expenses are excluded from the expense caps. All other acquired fund fees and expenses from the affiliated master portfolios are included in the expense caps. Prior to or after the commitment expiration date, the caps may be increased or the commitment to maintain the caps may be terminated only with the approval of the Board of Trustees. Without these caps, the Fund’s returns would have been lower. The expense ratio paid by an investor is the net expense ratio (the total annual fund operating expenses after fee waivers) as stated in the prospectuses. |
| 3 | The S&P Target Date Index is designed as a benchmark for multi-asset class portfolios with risk profiles that become more conservative over time, corresponding to the target retirement date. This index is representative of the investment opportunity available to investors for the target date horizon, with asset class exposures driven by a survey of available target date funds for that horizon. You cannot invest directly in an index. |
| 4 | Source: Wells Fargo Funds Management, LLC. The Wells Fargo Dynamic Target Blended Index is designed as a benchmark for multi-asset class portfolios with risk profiles that become more conservative over time, corresponding to the target retirement date. The index weightings among the major asset classes are adjusted annually. The inception date of the index is September 21, 2018. See Appendix I for additional information. You cannot invest directly in an index. |
| 5 | Holdings, excluding cash, cash equivalents and any money market funds, are calculated based on the value of the investments divided by total net assets of the Fund. Holdings are subject to change and may have changed since the date specified. |
| 6 | The effective allocation includes the effect of any tactical futures overlay that may be in place. Effective cash, if any, represents the net offset to such future positions. The effective allocation does not reflect futures positions held in dynamic risk hedging strategies. Effective allocations are subject to change and may have changed since the date specified. |
| 7 | These metrics show the degree and timing of the Fund’s fluctuations compared to S&P Target Date 2025 Index over 36 months. |
| 8 | Beta measures fund volatility relative to general market movements. It is a standardized measure of systematic risk in comparison with a specified index. The benchmark beta is 1.00 by definition. Beta is based on historical performance and does not represent future results. |
| 9 | Standard deviation is the square root of the sum of squared deviations from the mean. It is often used as a measure of volatility, variability, or risk. Standard deviation is based on historical performance and does not represent future results. |
| 10 | R-squared (R2) is a statistical measure that reflects the percentage of a fund’s movements that can be explained by movements in its benchmark index. The measure ranges from 0.0, which means that the fund’s performance bears no relationship to the performance of the index, to 1.0, which means that the fund’s performance was perfectly synchronized with the performance of the benchmark. R2 is based on historical performance and does not represent future results. |
14 | Target Date Retirement Funds
Performance highlights (unaudited)
Dynamic Target 2030 Fund
Average annual total returns (%) as of August 31, 2020
| | | | | | | | | | | | | | | | | | | | | | | | | | |
| | | | |
| | | | | Including sales charge | | | Excluding sales charge | | | Expense ratios1 (%) | |
| | | | | | | |
| | | Inception date | | 1 year | | | Since
Inception | | | 1 year | | | Since
Inception | | | Gross | | | Net2 | |
| | | | | | | | |
| Class A (WDTNX) | | 11-30-2015 | | | 4.66 | | | | 7.09 | | | | 11.00 | | | | 8.43 | | | | 2.96 | | | | 0.68 | |
| | | | | | | | |
| Class C (WDTOX) | | 11-30-2015 | | | 10.49 | | | | 7.88 | | | | 11.49 | | | | 7.88 | | | | 3.71 | | | | 1.43 | |
| | | | | | | | |
| Class R4 (WDTQX) | | 11-30-2015 | | | – | | | | – | | | | 11.39 | | | | 8.75 | | | | 2.68 | | | | 0.37 | |
| | | | | | | | |
| Class R6 (WDTSX) | | 11-30-2015 | | | – | | | | – | | | | 11.52 | | | | 8.93 | | | | 2.53 | | | | 0.22 | |
| | | | | | | | |
| S&P Target Date 2030 Index3 | | – | | | – | | | | – | | | | 10.98 | | | | 8.07 | * | | | – | | | | – | |
| | | | | | | | |
| Wells Fargo Dynamic Target 2030 Blended Index4 | | – | | | – | | | | – | | | | 8.51 | | | | – | | | | – | | | | – | |
| * | Based on the inception date of the oldest Fund class. |
Figures quoted represent past performance, which is no guarantee of future results, and do not reflect taxes that a shareholder may pay on an investment in a fund. Investment return and principal value of an investment will fluctuate so that an investor’s shares, when redeemed, may be worth more or less than their original cost. Performance shown without sales charges would be lower if sales charges were reflected. Current performance may be lower or higher than the performance data quoted and assumes the reinvestment of dividends and capital gains. Current month-end performance is available on the Fund’s website, wfam.com.
Index returns do not include transaction costs associated with buying and selling securities, any mutual fund fees or expenses, or any taxes. It is not possible to invest directly in an index.
For Class A shares, the maximum front-end sales charge is 5.75%. For Class C shares, the maximum contingent deferred sales charge is 1.00%. Performance including a contingent deferred sales charge assumes the sales charge for the corresponding time period. Class R4 and Class R6 shares are sold without a front-end sales charge or contingent deferred sales charge.
| | | | |
|
| Holdings (%) as of August 31, 20205 | |
| | |
Wells Fargo Factor Enhanced U.S. Large Cap Equity Portfolio | | | 37.95 | |
| | |
Wells Fargo Factor Enhanced International Equity Portfolio | | | 21.65 | |
| | |
Wells Fargo Bloomberg Barclays US Aggregate
ex-Corporate Portfolio | | | 13.93 | |
| | |
Wells Fargo Factor Enhanced U.S. Small Cap Equity Portfolio | | | 9.45 | |
| | |
Wells Fargo Investment Grade Corporate Bond Portfolio | | | 7.27 | |
| | |
Wells Fargo Factor Enhanced Emerging Markets Equity Portfolio | | | 6.40 | |
| | |
Wells Fargo High Yield Corporate Bond Portfolio | | | 1.17 | |
| | |
Wells Fargo Emerging Markets Bond Portfolio | | | 1.17 | |
| | |
Wells Fargo U.S. REIT Portfolio | | | 0.98 | |
| | |
Wells Fargo Strategic Retirement Bond Portfolio | | | 0.68 | |
| | | | | | | | |
|
| Allocations (%) as of August 31, 2020 | |
| | |
| | | Neutral
Allocation | | | Effective
Allocation6 | |
| | | |
Equity | | | 76 | | | | 78 | |
| | | |
Fixed Income | | | 24 | | | | 24 | |
| | | |
Effective Cash | | | 0 | | | | -2 | |
Please see footnotes on page 16.
Target Date Retirement Funds | 15
Performance highlights (unaudited)
Dynamic Target 2030 Fund (continued)
| | | | | | | | | | | | |
|
| Volatility metrics as of August 31, 20207 | |
| | | |
| | | Beta8 | | | Standard
deviation9 | | | R-squared10 | |
| | | | |
Class A | | | 0.92 | | | | 11.02 | % | | | 0.97 | |
| | | | |
Class C | | | 0.92 | | | | 11.14 | % | | | 0.96 | |
| | | | |
Class R4 | | | 0.92 | | | | 11.05 | % | | | 0.97 | |
| | | | |
Class R6 | | | 0.92 | | | | 11.03 | % | | | 0.97 | |
| 1 | Reflects the expense ratios as stated in the most recent prospectuses, which include the impact of 0.15% of acquired fund fees and expenses representing the net expenses from the affiliated master portfolios. The expense ratios shown are subject to change and may differ from the annualized expense ratios shown in the financial highlights of this report. |
| 2 | The manager has committed through June 30, 2021, to waive fees and/or reimburse expenses to the extent necessary to cap the expenses of each class after fee waivers at 0.68% for Class A, 1.43% for Class C, 0.37% for Class R4, and 0.22% for Class R6. Brokerage commissions, stamp duty fees, interest, taxes, acquired fund fees and expenses (if any) from funds in which the affiliated master portfolios invest and from money market funds, and extraordinary expenses are excluded from the expense caps. All other acquired fund fees and expenses from the affiliated master portfolios are included in the expense caps. Prior to or after the commitment expiration date, the caps may be increased or the commitment to maintain the caps may be terminated only with the approval of the Board of Trustees. Without these caps, the Fund’s returns would have been lower. The expense ratio paid by an investor is the net expense ratio (the total annual fund operating expenses after fee waivers) as stated in the prospectuses. |
| 3 | The S&P Target Date Index is designed as a benchmark for multi-asset class portfolios with risk profiles that become more conservative over time, corresponding to the target retirement date. This index is representative of the investment opportunity available to investors for the target date horizon, with asset class exposures driven by a survey of available target date funds for that horizon. You cannot invest directly in an index. |
| 4 | Source: Wells Fargo Funds Management, LLC. The Wells Fargo Dynamic Target Blended Index is designed as a benchmark for multi-asset class portfolios with risk profiles that become more conservative over time, corresponding to the target retirement date. The index weightings among the major asset classes are adjusted annually. The inception date of the index is September 21, 2018. See Appendix I for additional information. You cannot invest directly in an index. |
| 5 | Holdings, excluding cash, cash equivalents and any money market funds, are calculated based on the value of the investments divided by total net assets of the Fund. Holdings are subject to change and may have changed since the date specified. |
| 6 | The effective allocation includes the effect of any tactical futures overlay that may be in place. Effective cash, if any, represents the net offset to such future positions. The effective allocation does not reflect futures positions held in dynamic risk hedging strategies. Effective allocations are subject to change and may have changed since the date specified. |
| 7 | These metrics show the degree and timing of the Fund’s fluctuations compared to S&P Target Date 2030 Index over 36 months. |
| 8 | Beta measures fund volatility relative to general market movements. It is a standardized measure of systematic risk in comparison with a specified index. The benchmark beta is 1.00 by definition. Beta is based on historical performance and does not represent future results. |
| 9 | Standard deviation is the square root of the sum of squared deviations from the mean. It is often used as a measure of volatility, variability, or risk. Standard deviation is based on historical performance and does not represent future results. |
| 10 | R-squared (R2) is a statistical measure that reflects the percentage of a fund’s movements that can be explained by movements in its benchmark index. The measure ranges from 0.0, which means that the fund’s performance bears no relationship to the performance of the index, to 1.0, which means that the fund’s performance was perfectly synchronized with the performance of the benchmark. R2 is based on historical performance and does not represent future results. |
16 | Target Date Retirement Funds
Performance highlights (unaudited)
Dynamic Target 2035 Fund
Average annual total returns (%) as of August 31, 2020
| | | | | | | | | | | | | | | | | | | | | | | | | | |
| | | | |
| | | | | Including sales charge | | | Excluding sales charge | | | Expense ratios1 (%) | |
| | | | | | | |
| | | Inception date | | 1 year | | | Since
Inception | | | 1 year | | | Since
Inception | | | Gross | | | Net2 | |
| | | | | | | | |
| Class A (WDTTX) | | 11-30-2015 | | | 5.41 | | | | 7.52 | | | | 11.88 | | | | 8.87 | | | | 3.09 | | | | 0.68 | |
| | | | | | | | |
| Class C (WDCTX) | | 11-30-2015 | | | 11.61 | | | | 8.38 | | | | 12.61 | | | | 8.38 | | | | 3.84 | | | | 1.43 | |
| | | | | | | | |
| Class R4 (WDTVX) | | 11-30-2015 | | | – | | | | – | | | | 12.22 | | | | 9.19 | | | | 2.81 | | | | 0.37 | |
| | | | | | | | |
| Class R6 (WDTWX) | | 11-30-2015 | | | – | | | | – | | | | 12.37 | | | | 9.35 | | | | 2.66 | | | | 0.22 | |
| | | | | | | | |
| S&P Target Date 2035 Index3 | | – | | | – | | | | – | | | | 11.69 | | | | 8.49 | * | | | – | | | | – | |
| | | | | | | | |
| Wells Fargo Dynamic Target 2035 Blended Index4 | | – | | | – | | | | – | | | | 8.76 | | | | – | | | | – | | | | – | |
| * | Based on the inception date of the oldest Fund class. |
Figures quoted represent past performance, which is no guarantee of future results, and do not reflect taxes that a shareholder may pay on an investment in a fund. Investment return and principal value of an investment will fluctuate so that an investor’s shares, when redeemed, may be worth more or less than their original cost. Performance shown without sales charges would be lower if sales charges were reflected. Current performance may be lower or higher than the performance data quoted and assumes the reinvestment of dividends and capital gains. Current month-end performance is available on the Fund’s website, wfam.com.
Index returns do not include transaction costs associated with buying and selling securities, any mutual fund fees or expenses, or any taxes. It is not possible to invest directly in an index.
For Class A shares, the maximum front-end sales charge is 5.75%. For Class C shares, the maximum contingent deferred sales charge is 1.00%. Performance including a contingent deferred sales charge assumes the sales charge for the corresponding time period. Class R4 and Class R6 shares are sold without a front-end sales charge or contingent deferred sales charge.
| | | | |
|
| Holdings (%) as of August 31, 20205 | |
| | |
Wells Fargo Factor Enhanced U.S. Large Cap Equity Portfolio | | | 40.32 | |
| | |
Wells Fargo Factor Enhanced International Equity Portfolio | | | 24.05 | |
| | |
Wells Fargo Bloomberg Barclays US Aggregate
ex-Corporate Portfolio | | | 11.35 | |
| | |
Wells Fargo Factor Enhanced U.S. Small Cap Equity Portfolio | | | 10.04 | |
| | |
Wells Fargo Factor Enhanced Emerging Markets Equity Portfolio | | | 7.07 | |
| | |
Wells Fargo Investment Grade Corporate Bond Portfolio | | | 5.91 | |
| | |
Wells Fargo High Yield Corporate Bond Portfolio | | | 0.96 | |
| | |
Wells Fargo Emerging Markets Bond Portfolio | | | 0.96 | |
| | | | | | | | |
|
| Allocations (%) as of August 31, 2020 | |
| | |
| | | Neutral
Allocation | | | Effective
Allocation6 | |
| | | |
Equity | | | 81 | | | | 83 | |
| | | |
Fixed Income | | | 19 | | | | 19 | |
| | | |
Effective Cash | | | 0 | | | | -2 | |
Please see footnotes on page 18.
Target Date Retirement Funds | 17
Performance highlights (unaudited)
Dynamic Target 2035 Fund (continued)
| | | | | | | | | | | | |
|
| Volatility metrics as of August 31, 20207 | |
| | | |
| | | Beta8 | | | Standard
deviation9 | | | R-squared10 | |
| | | | |
Class A | | | 0.86 | | | | 11.68 | % | | | 0.96 | |
| | | | |
Class C | | | 0.86 | | | | 11.81 | % | | | 0.96 | |
| | | | |
Class R4 | | | 0.86 | | | | 11.66 | % | | | 0.96 | |
| | | | |
Class R6 | | | 0.85 | | | | 11.60 | % | | | 0.96 | |
| 1 | Reflects the expense ratios as stated in the most recent prospectuses, which include the impact of 0.16% of acquired fund fees and expenses representing the net expenses from the affiliated master portfolios. The expense ratios shown are subject to change and may differ from the annualized expense ratios shown in the financial highlights of this report. |
| 2 | The manager has committed through June 30, 2021, to waive fees and/or reimburse expenses to the extent necessary to cap the expenses of each class after fee waivers at 0.68% for Class A, 1.43% for Class C, 0.37% for Class R4, and 0.22% for Class R6. Brokerage commissions, stamp duty fees, interest, taxes, acquired fund fees and expenses (if any) from funds in which the affiliated master portfolios invest and from money market funds, and extraordinary expenses are excluded from the expense caps. All other acquired fund fees and expenses from the affiliated master portfolios are included in the expense caps. Prior to or after the commitment expiration date, the caps may be increased or the commitment to maintain the caps may be terminated only with the approval of the Board of Trustees. Without these caps, the Fund’s returns would have been lower. The expense ratio paid by an investor is the net expense ratio (the total annual fund operating expenses after fee waivers) as stated in the prospectuses. |
| 3 | The S&P Target Date Index is designed as a benchmark for multi-asset class portfolios with risk profiles that become more conservative over time, corresponding to the target retirement date. This index is representative of the investment opportunity available to investors for the target date horizon, with asset class exposures driven by a survey of available target date funds for that horizon. You cannot invest directly in an index. |
| 4 | Source: Wells Fargo Funds Management, LLC. The Wells Fargo Dynamic Target Blended Index is designed as a benchmark for multi-asset class portfolios with risk profiles that become more conservative over time, corresponding to the target retirement date. The index weightings among the major asset classes are adjusted annually. The inception date of the index is September 21, 2018. See Appendix I for additional information. You cannot invest directly in an index. |
| 5 | Holdings, excluding cash, cash equivalents and any money market funds, are calculated based on the value of the investments divided by total net assets of the Fund. Holdings are subject to change and may have changed since the date specified. |
| 6 | The effective allocation includes the effect of any tactical futures overlay that may be in place. Effective cash, if any, represents the net offset to such future positions. The effective allocation does not reflect futures positions held in dynamic risk hedging strategies. Effective allocations are subject to change and may have changed since the date specified. |
| 7 | These metrics show the degree and timing of the Fund’s fluctuations compared to S&P Target Date 2035 Index over 36 months. |
| 8 | Beta measures fund volatility relative to general market movements. It is a standardized measure of systematic risk in comparison with a specified index. The benchmark beta is 1.00 by definition. Beta is based on historical performance and does not represent future results. |
| 9 | Standard deviation is the square root of the sum of squared deviations from the mean. It is often used as a measure of volatility, variability, or risk. Standard deviation is based on historical performance and does not represent future results. |
| 10 | R-squared (R2) is a statistical measure that reflects the percentage of a fund’s movements that can be explained by movements in its benchmark index. The measure ranges from 0.0, which means that the fund’s performance bears no relationship to the performance of the index, to 1.0, which means that the fund’s performance was perfectly synchronized with the performance of the benchmark. R2 is based on historical performance and does not represent future results. |
18 | Target Date Retirement Funds
Performance highlights (unaudited)
Dynamic Target 2040 Fund
Average annual total returns (%) as of August 31, 2020
| | | | | | | | | | | | | | | | | | | | | | | | | | |
| | | | |
| | | | | Including sales charge | | | Excluding sales charge | | | Expense ratios1 (%) | |
| | | | | | | |
| | | Inception date | | 1 year | | | Since
Inception | | | 1 year | | | Since
Inception | | | Gross | | | Net2 | |
| | | | | | | | |
| Class A (WTDAX) | | 11-30-2015 | | | 4.78 | | | | 7.41 | | | | 11.18 | | | | 8.75 | | | | 3.59 | | | | 0.68 | |
| | | | | | | | |
| Class C (WTDCX) | | 11-30-2015 | | | 10.87 | | | | 8.29 | | | | 11.87 | | | | 8.29 | | | | 4.34 | | | | 1.43 | |
| | | | | | | | |
| Class R4 (WTDEX) | | 11-30-2015 | | | – | | | | – | | | | 11.48 | | | | 9.09 | | | | 3.31 | | | | 0.37 | |
| | | | | | | | |
| Class R6 (WTDFX) | | 11-30-2015 | | | – | | | | – | | | | 11.73 | | | | 9.27 | | | | 3.16 | | | | 0.22 | |
| | | | | | | | |
| S&P Target Date 2040 Index3 | | – | | | – | | | | – | | | | 12.14 | | | | 8.79 | * | | | – | | | | – | |
| | | | | | | | |
| Wells Fargo Dynamic Target 2040 Blended Index4 | | – | | | – | | | | – | | | | 8.78 | | | | – | | | | – | | | | – | |
| * | Based on the inception date of the oldest Fund class. |
Figures quoted represent past performance, which is no guarantee of future results, and do not reflect taxes that a shareholder may pay on an investment in a fund. Investment return and principal value of an investment will fluctuate so that an investor’s shares, when redeemed, may be worth more or less than their original cost. Performance shown without sales charges would be lower if sales charges were reflected. Current performance may be lower or higher than the performance data quoted and assumes the reinvestment of dividends and capital gains. Current month-end performance is available on the Fund’s website, wfam.com.
Index returns do not include transaction costs associated with buying and selling securities, any mutual fund fees or expenses, or any taxes. It is not possible to invest directly in an index.
For Class A shares, the maximum front-end sales charge is 5.75%. For Class C shares, the maximum contingent deferred sales charge is 1.00%. Performance including a contingent deferred sales charge assumes the sales charge for the corresponding time period. Class R4 and Class R6 shares are sold without a front-end sales charge or contingent deferred sales charge.
| | | | |
| |
| Holdings (%) as of August 31, 20205 | | | |
| | |
Wells Fargo Factor Enhanced U.S. Large Cap Equity Portfolio | | | 42.06 | |
| | |
Wells Fargo Factor Enhanced International Equity Portfolio | | | 26.02 | |
| | |
Wells Fargo Factor Enhanced U.S. Small Cap Equity Portfolio | | | 10.49 | |
| | |
Wells Fargo Bloomberg Barclays US Aggregate
ex-Corporate Portfolio | | | 8.35 | |
| | |
Wells Fargo Factor Enhanced Emerging Markets Equity Portfolio | | | 7.71 | |
| | |
Wells Fargo Investment Grade Corporate Bond Portfolio | | | 4.35 | |
| | |
Wells Fargo High Yield Corporate Bond Portfolio | | | 0.70 | |
| | |
Wells Fargo Emerging Markets Bond Portfolio | | | 0.70 | |
| | | | | | | | |
|
| Allocations (%) as of August 31, 2020 | |
| | |
| | | Neutral
Allocation | | | Effective
Allocation6 | |
| | | |
Equity | | | 86 | | | | 88 | |
| | | |
Fixed Income | | | 14 | | | | 14 | |
| | | |
Effective Cash | | | 0 | | | | -2 | |
Please see footnotes on page 20.
Target Date Retirement Funds | 19
Performance highlights (unaudited)
Dynamic Target 2040 Fund (continued)
| | | | | | | | | | | | |
|
| Volatility metrics as of August 31, 20207 | |
| | | |
| | | Beta8 | | | Standard
deviation9 | | | R-squared10 | |
| | | | |
Class A | | | 0.84 | | | | 12.31 | % | | | 0.97 | |
| | | | |
Class C | | | 0.85 | | | | 12.49 | % | | | 0.96 | |
| | | | |
Class R4 | | | 0.84 | | | | 12.32 | % | | | 0.97 | |
| | | | |
Class R6 | | | 0.84 | | | | 12.34 | % | | | 0.97 | |
| 1 | Reflects the expense ratios as stated in the most recent prospectuses, which include the impact of 0.16% of acquired fund fees and expenses representing the net expenses from the affiliated master portfolios. The expense ratios shown are subject to change and may differ from the annualized expense ratios shown in the financial highlights of this report. |
| 2 | The manager has committed through June 30, 2021, to waive fees and/or reimburse expenses to the extent necessary to cap the expenses of each class after fee waivers at 0.68% for Class A, 1.43% for Class C, 0.37% for Class R4, and 0.22% for Class R6. Brokerage commissions, stamp duty fees, interest, taxes, acquired fund fees and expenses (if any) from funds in which the affiliated master portfolios invest and from money market funds, and extraordinary expenses are excluded from the expense caps. All other acquired fund fees and expenses from the affiliated master portfolios are included in the expense caps. Prior to or after the commitment expiration date, the caps may be increased or the commitment to maintain the caps may be terminated only with the approval of the Board of Trustees. Without these caps, the Fund’s returns would have been lower. The expense ratio paid by an investor is the net expense ratio (the total annual fund operating expenses after fee waivers) as stated in the prospectuses. |
| 3 | The S&P Target Date Index is designed as a benchmark for multi-asset class portfolios with risk profiles that become more conservative over time, corresponding to the target retirement date. This index is representative of the investment opportunity available to investors for the target date horizon, with asset class exposures driven by a survey of available target date funds for that horizon. You cannot invest directly in an index. |
| 4 | Source: Wells Fargo Funds Management, LLC. The Wells Fargo Dynamic Target Blended Index is designed as a benchmark for multi-asset class portfolios with risk profiles that become more conservative over time, corresponding to the target retirement date. The index weightings among the major asset classes are adjusted annually. The inception date of the index is September 21, 2018. See Appendix I for additional information. You cannot invest directly in an index. |
| 5 | Holdings, excluding cash, cash equivalents and any money market funds, are calculated based on the value of the investments divided by total net assets of the Fund. Holdings are subject to change and may have changed since the date specified. |
| 6 | The effective allocation includes the effect of any tactical futures overlay that may be in place. Effective cash, if any, represents the net offset to such future positions. The effective allocation does not reflect futures positions held in dynamic risk hedging strategies. Effective allocations are subject to change and may have changed since the date specified. |
| 7 | These metrics show the degree and timing of the Fund’s fluctuations compared to S&P Target Date 2040 Index over 36 months. |
| 8 | Beta measures fund volatility relative to general market movements. It is a standardized measure of systematic risk in comparison with a specified index. The benchmark beta is 1.00 by definition. Beta is based on historical performance and does not represent future results. |
| 9 | Standard deviation is the square root of the sum of squared deviations from the mean. It is often used as a measure of volatility, variability, or risk. Standard deviation is based on historical performance and does not represent future results. |
| 10 | R-squared (R2) is a statistical measure that reflects the percentage of a fund’s movements that can be explained by movements in its benchmark index. The measure ranges from 0.0, which means that the fund’s performance bears no relationship to the performance of the index, to 1.0, which means that the fund’s performance was perfectly synchronized with the performance of the benchmark. R2 is based on historical performance and does not represent future results. |
20 | Target Date Retirement Funds
Performance highlights (unaudited)
Dynamic Target 2045 Fund
Average annual total returns (%) as of August 31, 2019
| | | | | | | | | | | | | | | | | | | | | | | | | | |
| | | | |
| | | | | Including sales charge | | | Excluding sales charge | | | Expense ratios1 (%) | |
| | | | | | | |
| | | Inception date | | 1 year | | | Since
Inception | | | 1 year | | | Since
Inception | | | Gross | | | Net2 | |
| | | | | | | | |
| Class A (WTDGX) | | 11-30-2015 | | | 5.21 | | | | 7.50 | | | | 11.58 | | | | 8.85 | | | | 3.61 | | | | 0.68 | |
| | | | | | | | |
| Class C (WTDHX) | | 11-30-2015 | | | 11.27 | | | | 8.35 | | | | 12.27 | | | | 8.35 | | | | 4.36 | | | | 1.43 | |
| | | | | | | | |
| Class R4 (WTDJX) | | 11-30-2015 | | | – | | | | – | | | | 11.82 | | | | 9.17 | | | | 3.33 | | | | 0.37 | |
| | | | | | | | |
| Class R6 (WTDKX) | | 11-30-2015 | | | – | | | | – | | | | 12.06 | | | | 9.34 | | | | 3.18 | | | | 0.22 | |
| | | | | | | | |
| S&P Target Date 2045 Index3 | | – | | | – | | | | – | | | | 12.39 | | | | 8.96 | * | | | – | | | | – | |
| | | | | | | | |
| Wells Fargo Dynamic Target 2045 Blended Index4 | | – | | | – | | | | – | | | | 8.80 | | | | – | | | | – | | | | – | |
| * | Based on the inception date of the oldest Fund class. |
Figures quoted represent past performance, which is no guarantee of future results, and do not reflect taxes that a shareholder may pay on an investment in a fund. Investment return and principal value of an investment will fluctuate so that an investor’s shares, when redeemed, may be worth more or less than their original cost. Performance shown without sales charges would be lower if sales charges were reflected. Current performance may be lower or higher than the performance data quoted and assumes the reinvestment of dividends and capital gains. Current month-end performance is available on the Fund’s website, wfam.com.
Index returns do not include transaction costs associated with buying and selling securities, any mutual fund fees or expenses, or any taxes. It is not possible to invest directly in an index.
For Class A shares, the maximum front-end sales charge is 5.75%. For Class C shares, the maximum contingent deferred sales charge is 1.00%. Performance including a contingent deferred sales charge assumes the sales charge for the corresponding time period. Class R4 and Class R6 shares are sold without a front-end sales charge or contingent deferred sales charge.
| | | | |
| |
| Holdings (%) as of August 31, 20205 | | | |
| | |
Wells Fargo Factor Enhanced U.S. Large Cap Equity Portfolio | | | 44.20 | |
| | |
Wells Fargo Factor Enhanced International Equity Portfolio | | | 27.87 | |
| | |
Wells Fargo Factor Enhanced U.S. Small Cap Equity Portfolio | | | 11.00 | |
| | |
Wells Fargo Factor Enhanced Emerging Markets Equity Portfolio | | | 8.24 | |
| | |
Wells Fargo Bloomberg Barclays US Aggregate
ex-Corporate Portfolio | | | 5.36 | |
| | |
Wells Fargo Investment Grade Corporate Bond Portfolio | | | 2.80 | |
| | |
Wells Fargo Emerging Markets Bond Portfolio | | | 0.45 | |
| | |
Wells Fargo High Yield Corporate Bond Portfolio | | | 0.45 | |
| | | | | | | | |
|
| Allocations (%) as of August 31, 2020 | |
| | |
| | | Neutral
Allocation | | | Effective
Allocation6 | |
| | | |
Equity | | | 91 | | | | 93 | |
| | | |
Fixed Income | | | 9 | | | | 9 | |
| | | |
Effective Cash | | | 0 | | | | -2 | |
Please see footnotes on page 22.
Target Date Retirement Funds | 21
Performance highlights (unaudited)
Dynamic Target 2045 Fund (continued)
| | | | | | | | | | | | |
|
| Volatility metrics as of August 31, 20207 | |
| | | |
| | | Beta8 | | | Standard
deviation9 | | | R-squared10 | |
| | | | |
Class A | | | 0.86 | | | | 13.12 | % | | | 0.97 | |
| | | | |
Class C | | | 0.87 | | | | 13.30 | % | | | 0.96 | |
| | | | |
Class R4 | | | 0.86 | | | | 13.11 | % | | | 0.97 | |
| | | | |
Class R6 | | | 0.86 | | | | 13.09 | % | | | 0.97 | |
| 1 | Reflects the expense ratios as stated in the most recent prospectuses, which include the impact of 0.16% of acquired fund fees and expenses representing the net expenses from the affiliated master portfolios. The expense ratios shown are subject to change and may differ from the annualized expense ratios shown in the financial highlights of this report. |
| 2 | The manager has committed through June 30, 2021, to waive fees and/or reimburse expenses to the extent necessary to cap the expenses of each class after fee waivers at 0.68% for Class A, 1.43% for Class C, 0.37% for Class R4, and 0.22% for Class R6. Brokerage commissions, stamp duty fees, interest, taxes, acquired fund fees and expenses (if any) from funds in which the affiliated master portfolios invest and from money market funds, and extraordinary expenses are excluded from the expense caps. All other acquired fund fees and expenses from the affiliated master portfolios are included in the expense caps. Prior to or after the commitment expiration date, the caps may be increased or the commitment to maintain the caps may be terminated only with the approval of the Board of Trustees. Without these caps, the Fund’s returns would have been lower. The expense ratio paid by an investor is the net expense ratio (the total annual fund operating expenses after fee waivers) as stated in the prospectuses. |
| 3 | The S&P Target Date Index is designed as a benchmark for multi-asset class portfolios with risk profiles that become more conservative over time, corresponding to the target retirement date. This index is representative of the investment opportunity available to investors for the target date horizon, with asset class exposures driven by a survey of available target date funds for that horizon. You cannot invest directly in an index. |
| 4 | Source: Wells Fargo Funds Management, LLC. The Wells Fargo Dynamic Target Blended Index is designed as a benchmark for multi-asset class portfolios with risk profiles that become more conservative over time, corresponding to the target retirement date. The index weightings among the major asset classes are adjusted annually. The inception date of the index is September 21, 2018. See Appendix I for additional information. You cannot invest directly in an index. |
| 5 | Holdings, excluding cash, cash equivalents and any money market funds, are calculated based on the value of the investments divided by total net assets of the Fund. Holdings are subject to change and may have changed since the date specified. |
| 6 | The effective allocation includes the effect of any tactical futures overlay that may be in place. Effective cash, if any, represents the net offset to such future positions. The effective allocation does not reflect futures positions held in dynamic risk hedging strategies. Effective allocations are subject to change and may have changed since the date specified. |
| 7 | These metrics show the degree and timing of the Fund’s fluctuations compared to S&P Target Date 2045 Index over 36 months. |
| 8 | Beta measures fund volatility relative to general market movements. It is a standardized measure of systematic risk in comparison with a specified index. The benchmark beta is 1.00 by definition. Beta is based on historical performance and does not represent future results. |
| 9 | Standard deviation is the square root of the sum of squared deviations from the mean. It is often used as a measure of volatility, variability, or risk. Standard deviation is based on historical performance and does not represent future results. |
| 10 | R-squared (R2) is a statistical measure that reflects the percentage of a fund’s movements that can be explained by movements in its benchmark index. The measure ranges from 0.0, which means that the fund’s performance bears no relationship to the performance of the index, to 1.0, which means that the fund’s performance was perfectly synchronized with the performance of the benchmark. R2 is based on historical performance and does not represent future results. |
22 | Target Date Retirement Funds
Performance highlights (unaudited)
Dynamic Target 2050 Fund
Average annual total returns (%) as of August 31, 2020
| | | | | | | | | | | | | | | | | | | | | | | | | | |
| | | | |
| | | | | Including sales charge | | | Excluding sales charge | | | Expense ratios1 (%) | |
| | | | | | | |
| | | Inception date | | 1 year | | | Since
Inception | | | 1 year | | | Since
Inception | | | Gross | | | Net2 | |
| | | | | | | | |
| Class A (WTDLX) | | 11-30-2015 | | | 4.55 | | | | 7.30 | | | | 10.88 | | | | 8.65 | | | | 3.68 | | | | 0.68 | |
| | | | | | | | |
| Class C (WTDMX) | | 11-30-2015 | | | 10.61 | | | | 8.17 | | | | 11.61 | | | | 8.17 | | | | 4.43 | | | | 1.43 | |
| | | | | | | | |
| Class R4 (WTDOX) | | 11-30-2015 | | | – | | | | – | | | | 11.29 | | | | 8.98 | | | | 3.40 | | | | 0.37 | |
| | | | | | | | |
| Class R6 (WTDPX) | | 11-30-2015 | | | – | | | | – | | | | 11.42 | | | | 9.15 | | | | 3.25 | | | | 0.22 | |
| | | | | | | | |
| S&P Target Date 2050 Index3 | | – | | | – | | | | – | | | | 12.52 | | | | 9.10 | * | | | – | | | | – | |
| | | | | | | | |
| Wells Fargo Dynamic Target 2050 Blended Index4 | | – | | | – | | | | – | | | | 8.74 | | | | – | | | | – | | | | – | |
| * | Based on the inception date of the oldest Fund class. |
Figures quoted represent past performance, which is no guarantee of future results, and do not reflect taxes that a shareholder may pay on an investment in a fund. Investment return and principal value of an investment will fluctuate so that an investor’s shares, when redeemed, may be worth more or less than their original cost. Performance shown without sales charges would be lower if sales charges were reflected. Current performance may be lower or higher than the performance data quoted and assumes the reinvestment of dividends and capital gains. Current month-end performance is available on the Fund’s website, wfam.com.
Index returns do not include transaction costs associated with buying and selling securities, any mutual fund fees or expenses, or any taxes. It is not possible to invest directly in an index.
For Class A shares, the maximum front-end sales charge is 5.75%. For Class C shares, the maximum contingent deferred sales charge is 1.00%. Performance including a contingent deferred sales charge assumes the sales charge for the corresponding time period. Class R4 and Class R6 shares are sold without a front-end sales charge or contingent deferred sales charge.
| | | | |
| |
| Holdings (%) as of August 31, 20205 | | | |
| | |
Wells Fargo Factor Enhanced U.S. Large Cap Equity Portfolio | | | 45.82 | |
| | |
Wells Fargo Factor Enhanced International Equity Portfolio | | | 29.39 | |
| | |
Wells Fargo Factor Enhanced U.S. Small Cap Equity Portfolio | | | 11.40 | |
| | |
Wells Fargo Factor Enhanced Emerging Markets Equity Portfolio | | | 8.67 | |
| | |
Wells Fargo Bloomberg Barclays US Aggregate
ex-Corporate Portfolio | | | 2.98 | |
| | |
Wells Fargo Investment Grade Corporate Bond Portfolio | | | 1.56 | |
| | |
Wells Fargo Emerging Markets Bond Portfolio | | | 0.25 | |
| | |
Wells Fargo High Yield Corporate Bond Portfolio | | | 0.25 | |
| | | | | | | | |
|
| Allocations (%) as of August 31, 2020 | |
| | |
| | | Neutral
Allocation | | | Effective
Allocation6 | |
| | | |
Equity | | | 95 | | | | 97 | |
| | | |
Fixed Income | | | 5 | | | | 5 | |
| | | |
Effective Cash | | | 0 | | | | -2 | |
Please see footnotes on page 24.
Target Date Retirement Funds | 23
Performance highlights (unaudited)
Dynamic Target 2050 Fund (continued)
| | | | | | | | | | | | |
|
| Volatility metrics as of August 31, 20207 | |
| | | |
| | | Beta8 | | | Standard
deviation9 | | | R-squared10 | |
| | | | |
Class A | | | 0.87 | | | | 13.46 | % | | | 0.97 | |
| | | | |
Class C | | | 0.87 | | | | 13.63 | % | | | 0.97 | |
| | | | |
Class R4 | | | 0.87 | | | | 13.45 | % | | | 0.97 | |
| | | | |
Class R6 | | | 0.87 | | | | 13.45 | % | | | 0.97 | |
| 1 | Reflects the expense ratios as stated in the most recent prospectuses, which include the impact of 0.17% of acquired fund fees and expenses representing the net expenses from the affiliated master portfolios. The expense ratios shown are subject to change and may differ from the annualized expense ratios shown in the financial highlights of this report. |
| 2 | The manager has committed through June 30, 2021, to waive fees and/or reimburse expenses to the extent necessary to cap the expenses of each class after fee waivers at 0.68% for Class A, 1.43% for Class C, 0.37% for Class R4, and 0.22% for Class R6. Brokerage commissions, stamp duty fees, interest, taxes, acquired fund fees and expenses (if any) from funds in which the affiliated master portfolios invest and from money market funds, and extraordinary expenses are excluded from the expense caps. All other acquired fund fees and expenses from the affiliated master portfolios are included in the expense caps. Prior to or after the commitment expiration date, the caps may be increased or the commitment to maintain the caps may be terminated only with the approval of the Board of Trustees. Without these caps, the Fund’s returns would have been lower. The expense ratio paid by an investor is the net expense ratio (the total annual fund operating expenses after fee waivers) as stated in the prospectuses. |
| 3 | The S&P Target Date Index is designed as a benchmark for multi-asset class portfolios with risk profiles that become more conservative over time, corresponding to the target retirement date. This index is representative of the investment opportunity available to investors for the target date horizon, with asset class exposures driven by a survey of available target date funds for that horizon. You cannot invest directly in an index. |
| 4 | Source: Wells Fargo Funds Management, LLC. The Wells Fargo Dynamic Target Blended Index is designed as a benchmark for multi-asset class portfolios with risk profiles that become more conservative over time, corresponding to the target retirement date. The index weightings among the major asset classes are adjusted annually. The inception date of the index is September 21, 2018. See Appendix I for additional information. You cannot invest directly in an index. |
| 5 | Holdings, excluding cash, cash equivalents and any money market funds, are calculated based on the value of the investments divided by total net assets of the Fund. Holdings are subject to change and may have changed since the date specified. |
| 6 | The effective allocation includes the effect of any tactical futures overlay that may be in place. Effective cash, if any, represents the net offset to such future positions. The effective allocation does not reflect futures positions held in dynamic risk hedging strategies. Effective allocations are subject to change and may have changed since the date specified. |
| 7 | These metrics show the degree and timing of the Fund’s fluctuations compared to S&P Target Date 2050 Index over 36 months. |
| 8 | Beta measures fund volatility relative to general market movements. It is a standardized measure of systematic risk in comparison with a specified index. The benchmark beta is 1.00 by definition. Beta is based on historical performance and does not represent future results. |
| 9 | Standard deviation is the square root of the sum of squared deviations from the mean. It is often used as a measure of volatility, variability, or risk. Standard deviation is based on historical performance and does not represent future results. |
| 10 | R-squared (R2) is a statistical measure that reflects the percentage of a fund’s movements that can be explained by movements in its benchmark index. The measure ranges from 0.0, which means that the fund’s performance bears no relationship to the performance of the index, to 1.0, which means that the fund’s performance was perfectly synchronized with the performance of the benchmark. R2 is based on historical performance and does not represent future results. |
24 | Target Date Retirement Funds
Performance highlights (unaudited)
Dynamic Target 2055 Fund
Average annual total returns (%) as of August 31, 2020
| | | | | | | | | | | | | | | | | | | | | | | | | | |
| | | | |
| | | | | Including sales charge | | | Excluding sales charge | | | Expense ratios1 (%) | |
| | | | | | | |
| | | Inception date | | 1 year | | | Since
Inception | | | 1 year | | | Since
Inception | | | Gross | | | Net2 | |
| | | | | | | | |
| Class A (WTDQX) | | 11-30-2015 | | | 4.98 | | | | 7.39 | | | | 11.34 | | | | 8.74 | | | | 3.84 | | | | 0.68 | |
| | | | | | | | |
| Class C (WTDRX) | | 11-30-2015 | | | 11.24 | | | | 8.27 | | | | 12.24 | | | | 8.27 | | | | 4.59 | | | | 1.43 | |
| | | | | | | | |
| Class R4 (WTDTX) | | 11-30-2015 | | | – | | | | – | | | | 11.82 | | | | 9.08 | | | | 3.56 | | | | 0.37 | |
| | | | | | | | |
| Class R6 (WTDUX) | | 11-30-2015 | | | – | | | | – | | | | 11.96 | | | | 9.24 | | | | 3.41 | | | | 0.22 | |
| | | | | | | | |
| S&P Target Date 2055 Index3 | | – | | | – | | | | – | | | | 12.52 | | | | 9.18 | * | | | – | | | | – | |
| | | | | | | | |
| Wells Fargo Dynamic Target 2055 Blended Index4 | | – | | | – | | | | – | | | | 8.74 | | | | – | | | | – | | | | – | |
| * | Based on the inception date of the oldest Fund class. |
Figures quoted represent past performance, which is no guarantee of future results, and do not reflect taxes that a shareholder may pay on an investment in a fund. Investment return and principal value of an investment will fluctuate so that an investor’s shares, when redeemed, may be worth more or less than their original cost. Performance shown without sales charges would be lower if sales charges were reflected. Current performance may be lower or higher than the performance data quoted and assumes the reinvestment of dividends and capital gains. Current month-end performance is available on the Fund’s website, wfam.com.
Index returns do not include transaction costs associated with buying and selling securities, any mutual fund fees or expenses, or any taxes. It is not possible to invest directly in an index.
For Class A shares, the maximum front-end sales charge is 5.75%. For Class C shares, the maximum contingent deferred sales charge is 1.00%. Performance including a contingent deferred sales charge assumes the sales charge for the corresponding time period. Class R4 and Class R6 shares are sold without a front-end sales charge or contingent deferred sales charge.
| | | | |
| |
| Holdings (%) as of August 31, 20205 | | | |
| | |
Wells Fargo Factor Enhanced U.S. Large Cap Equity Portfolio | | | 45.77 | |
| | |
Wells Fargo Factor Enhanced International Equity Portfolio | | | 29.35 | |
| | |
Wells Fargo Factor Enhanced U.S. Small Cap Equity Portfolio | | | 11.39 | |
| | |
Wells Fargo Factor Enhanced Emerging Markets Equity Portfolio | | | 8.66 | |
| | |
Wells Fargo Bloomberg Barclays US Aggregate
ex-Corporate Portfolio | | | 2.98 | |
| | |
Wells Fargo Investment Grade Corporate Bond Portfolio | | | 1.56 | |
| | |
Wells Fargo Emerging Markets Bond Portfolio | | | 0.25 | |
| | |
Wells Fargo High Yield Corporate Bond Portfolio | | | 0.25 | |
| | | | | | | | |
|
| Allocations (%) as of August 31, 2020 | |
| | |
| | | Neutral
Allocation | | | Effective
Allocation6 | |
| | | |
Equity | | | 95 | | | | 97 | |
| | | |
Fixed Income | | | 5 | | | | 5 | |
| | | |
Effective Cash | | | 0 | | | | -2 | |
Please see footnotes on page 26.
Target Date Retirement Funds | 25
Performance highlights (unaudited)
Dynamic Target 2055 Fund (continued)
| | | | | | | | | | | | |
|
| Volatility metrics as of August 31, 20207 | |
| | | |
| | | Beta8 | | | Standard
deviation9 | | | R-squared10 | |
| | | | |
Class A | | | 0.86 | | | | 13.47 | % | | | 0.97 | |
| | | | |
Class C | | | 0.87 | | | | 13.67 | % | | | 0.97 | |
| | | | |
Class R4 | | | 0.85 | | | | 13.42 | % | | | 0.97 | |
| | | | |
Class R6 | | | 0.86 | | | | 13.45 | % | | | 0.97 | |
| 1 | Reflects the expense ratios as stated in the most recent prospectuses, which include the impact of 0.17% of acquired fund fees and expenses representing the net expenses from the affiliated master portfolios. The expense ratios shown are subject to change and may differ from the annualized expense ratios shown in the financial highlights of this report. |
| 2 | The manager has committed through June 30, 2021, to waive fees and/or reimburse expenses to the extent necessary to cap the expenses of each class after fee waivers at 0.68% for Class A, 1.43% for Class C, 0.37% for Class R4, and 0.22% for Class R6. Brokerage commissions, stamp duty fees, interest, taxes, acquired fund fees and expenses (if any) from funds in which the affiliated master portfolios invest and from money market funds, and extraordinary expenses are excluded from the expense caps. All other acquired fund fees and expenses from the affiliated master portfolios are included in the expense caps. Prior to or after the commitment expiration date, the caps may be increased or the commitment to maintain the caps may be terminated only with the approval of the Board of Trustees. Without these caps, the Fund’s returns would have been lower. The expense ratio paid by an investor is the net expense ratio (the total annual fund operating expenses after fee waivers) as stated in the prospectuses. |
| 3 | The S&P Target Date Index is designed as a benchmark for multi-asset class portfolios with risk profiles that become more conservative over time, corresponding to the target retirement date. This index is representative of the investment opportunity available to investors for the target date horizon, with asset class exposures driven by a survey of available target date funds for that horizon. You cannot invest directly in an index. |
| 4 | Source: Wells Fargo Funds Management, LLC. The Wells Fargo Dynamic Target Blended Index is designed as a benchmark for multi-asset class portfolios with risk profiles that become more conservative over time, corresponding to the target retirement date. The index weightings among the major asset classes are adjusted annually. The inception date of the index is September 21, 2018. See Appendix I for additional information. You cannot invest directly in an index. |
| 5 | Holdings, excluding cash, cash equivalents and any money market funds, are calculated based on the value of the investments divided by total net assets of the Fund. Holdings are subject to change and may have changed since the date specified. |
| 6 | The effective allocation includes the effect of any tactical futures overlay that may be in place. Effective cash, if any, represents the net offset to such future positions. The effective allocation does not reflect futures positions held in dynamic risk hedging strategies. Effective allocations are subject to change and may have changed since the date specified. |
| 7 | These metrics show the degree and timing of the Fund’s fluctuations compared to S&P Target Date 2055 Index over 36 months. |
| 8 | Beta measures fund volatility relative to general market movements. It is a standardized measure of systematic risk in comparison with a specified index. The benchmark beta is 1.00 by definition. Beta is based on historical performance and does not represent future results. |
| 9 | Standard deviation is the square root of the sum of squared deviations from the mean. It is often used as a measure of volatility, variability, or risk. Standard deviation is based on historical performance and does not represent future results. |
| 10 | R-squared (R2) is a statistical measure that reflects the percentage of a fund’s movements that can be explained by movements in its benchmark index. The measure ranges from 0.0, which means that the fund’s performance bears no relationship to the performance of the index, to 1.0, which means that the fund’s performance was perfectly synchronized with the performance of the benchmark. R2 is based on historical performance and does not represent future results. |
26 | Target Date Retirement Funds
Performance highlights (unaudited)
Dynamic Target 2060 Fund
Average annual total returns (%) as of August 31, 2020
| | | | | | | | | | | | | | | | | | | | | | | | | | |
| | | | |
| | | | | Including sales charge | | | Excluding sales charge | | | Expense ratios1 (%) | |
| | | | | | | |
| | | Inception date | | 1 year | | | Since
Inception | | | 1 year | | | Since
Inception | | | Gross | | | Net2 | |
| | | | | | | | |
| Class A (WTDVX) | | 11-30-2015 | | | 4.56 | | | | 7.33 | | | | 10.89 | | | | 8.68 | | | | 3.67 | | | | 0.68 | |
| | | | | | | | |
| Class C (WTDWX) | | 11-30-2015 | | | 10.68 | | | | 8.20 | | | | 11.68 | | | | 8.20 | | | | 4.42 | | | | 1.43 | |
| | | | | | | | |
| Class R4 (WTDZX) | | 11-30-2015 | | | – | | | | – | | | | 11.16 | | | | 9.00 | | | | 3.39 | | | | 0.37 | |
| | | | | | | | |
| Class R6 (WTSZX) | | 11-30-2015 | | | – | | | | – | | | | 11.41 | | | | 9.17 | | | | 3.24 | | | | 0.22 | |
| | | | | | | | |
| S&P Target Date 2055 Index3 | | – | | | – | | | | – | | | | 12.52 | | | | 9.18 | * | | | – | | | | – | |
| | | | | | | | |
| S&P Target Date 2060+ Index3** | | – | | | – | | | | – | | | | 12.72 | | | | – | | | | – | | | | – | |
| | | | | | | | |
| Wells Fargo Dynamic Target 2060 Blended Index4 | | – | | | – | | | | – | | | | 8.74 | | | | – | | | | – | | | | – | |
| * | Based on the inception date of the oldest Fund class. |
| ** | The inception date of the index is May 31, 2016. |
Figures quoted represent past performance, which is no guarantee of future results, and do not reflect taxes that a shareholder may pay on an investment in a fund. Investment return and principal value of an investment will fluctuate so that an investor’s shares, when redeemed, may be worth more or less than their original cost. Performance shown without sales charges would be lower if sales charges were reflected. Current performance may be lower or higher than the performance data quoted and assumes the reinvestment of dividends and capital gains. Current month-end performance is available on the Fund’s website, wfam.com.
Index returns do not include transaction costs associated with buying and selling securities, any mutual fund fees or expenses, or any taxes. It is not possible to invest directly in an index.
For Class A shares, the maximum front-end sales charge is 5.75%. For Class C shares, the maximum contingent deferred sales charge is 1.00%. Performance including a contingent deferred sales charge assumes the sales charge for the corresponding time period. Class R4 and Class R6 shares are sold without a front-end sales charge or contingent deferred sales charge.
| | | | |
| |
| Holdings (%) as of August 31, 20205 | | | |
| | |
Wells Fargo Factor Enhanced U.S. Large Cap Equity Portfolio | | | 45.87 | |
| | |
Wells Fargo Factor Enhanced International Equity Portfolio | | | 29.44 | |
| | |
Wells Fargo Factor Enhanced U.S. Small Cap Equity Portfolio | | | 11.42 | |
| | |
Wells Fargo Factor Enhanced Emerging Markets Equity Portfolio | | | 8.69 | |
| | |
Wells Fargo Bloomberg Barclays US Aggregate
ex-Corporate Portfolio | | | 2.98 | |
| | |
Wells Fargo Investment Grade Corporate Bond Portfolio | | | 1.56 | |
| | |
Wells Fargo Emerging Markets Bond Portfolio | | | 0.25 | |
| | |
Wells Fargo High Yield Corporate Bond Portfolio | | | 0.25 | |
| | |
Wells Fargo U.S. REIT Portfolio | | | 0.10 | |
| | | | | | | | |
|
| Allocations (%) as of August 31, 2020 | |
| | |
| | | Neutral
Allocation | | | Effective
Allocation6 | |
| | | |
Equity | | | 95 | | | | 97 | |
| | | |
Fixed Income | | | 5 | | | | 5 | |
| | | |
Effective Cash | | | 0 | | | | -2 | |
Please see footnotes on page 28.
Target Date Retirement Funds | 27
Performance highlights (unaudited)
Dynamic Target 2060 Fund (continued)
| | | | | | | | | | | | |
|
| Volatility metrics as of August 31, 20207 | |
| | | |
| | | Beta8 | | | Standard
deviation9 | | | R-squared10 | |
| | | | |
Class A | | | 0.85 | | | | 13.45 | % | | | 0.97 | |
| | | | |
Class C | | | 0.86 | | | | 13.62 | % | | | 0.97 | |
| | | | |
Class R4 | | | 0.85 | | | | 13.46 | % | | | 0.97 | |
| | | | |
Class R6 | | | 0.85 | | | | 13.46 | % | | | 0.97 | |
| 1 | Reflects the expense ratios as stated in the most recent prospectuses, which include the impact of 0.17% of acquired fund fees and expenses representing the net expenses from the affiliated master portfolios. The expense ratios shown are subject to change and may differ from the annualized expense ratios shown in the financial highlights of this report. |
| 2 | The manager has committed through June 30, 2021, to waive fees and/or reimburse expenses to the extent necessary to cap the expenses of each class after fee waivers at 0.68% for Class A, 1.43% for Class C, 0.37% for Class R4, and 0.22% for Class R6. Brokerage commissions, stamp duty fees, interest, taxes, acquired fund fees and expenses (if any) from funds in which the affiliated master portfolios invest and from money market funds, and extraordinary expenses are excluded from the expense caps. All other acquired fund fees and expenses from the affiliated master portfolios are included in the expense caps. Prior to or after the commitment expiration date, the caps may be increased or the commitment to maintain the caps may be terminated only with the approval of the Board of Trustees. Without these caps, the Fund’s returns would have been lower. The expense ratio paid by an investor is the net expense ratio (the total annual fund operating expenses after fee waivers) as stated in the prospectuses. |
| 3 | The S&P Target Date Index is designed as a benchmark for multi-asset class portfolios with risk profiles that become more conservative over time, corresponding to the target retirement date. This index is representative of the investment opportunity available to investors for the target date horizon, with asset class exposures driven by a survey of available target date funds for that horizon. You cannot invest directly in an index. |
| 4 | Source: Wells Fargo Funds Management, LLC. The Wells Fargo Dynamic Target Blended Index is designed as a benchmark for multi-asset class portfolios with risk profiles that become more conservative over time, corresponding to the target retirement date. The index weightings among the major asset classes are adjusted annually. The inception date of the index is September 21, 2018. See Appendix I for additional information. You cannot invest directly in an index. |
| 5 | Holdings, excluding cash, cash equivalents and any money market funds, are calculated based on the value of the investments divided by total net assets of the Fund. Holdings are subject to change and may have changed since the date specified. |
| 6 | The effective allocation includes the effect of any tactical futures overlay that may be in place. Effective cash, if any, represents the net offset to such future positions. The effective allocation does not reflect futures positions held in dynamic risk hedging strategies. Effective allocations are subject to change and may have changed since the date specified. |
| 7 | These metrics show the degree and timing of the Fund’s fluctuations compared to S&P Target Date 2060+ Index over 36 months |
| 8 | Beta measures fund volatility relative to general market movements. It is a standardized measure of systematic risk in comparison with a specified index. The benchmark beta is 1.00 by definition. Beta is based on historical performance and does not represent future results. |
| 9 | Standard deviation is the square root of the sum of squared deviations from the mean. It is often used as a measure of volatility, variability, or risk. Standard deviation is based on historical performance and does not represent future results. |
| 10 | R-squared (R2) is a statistical measure that reflects the percentage of a fund’s movements that can be explained by movements in its benchmark index. The measure ranges from 0.0, which means that the fund’s performance bears no relationship to the performance of the index, to 1.0, which means that the fund’s performance was perfectly synchronized with the performance of the benchmark. R2 is based on historical performance and does not represent future results. |
28 | Target Date Retirement Funds
Fund expenses (unaudited)
As a shareholder of the Fund, you incur two types of costs: (1) transaction costs, including sales charges (loads) on purchase payments and contingent deferred sales charges (if any) on redemptions and (2) ongoing costs, including management fees, distribution (12b-1) and/or shareholder servicing fees, and other Fund expenses. This example is intended to help you understand your ongoing costs (in dollars) of investing in the Fund and to compare these costs with the ongoing costs of investing in other mutual funds.
The example is based on an investment of $1,000 invested at the beginning of the six-month period and held for the entire period from March 1, 2020 to August 31, 2020.
Actual expenses
The “Actual” line of the table below provides information about actual account values and actual expenses. You may use the information in this line, together with the amount you invested, to estimate the expenses that you paid over the period. Simply divide your account value by $1,000 (for example, an $8,600 account value divided by $1,000 = 8.6), then multiply the result by the number in the “Actual” line under the heading entitled “Expenses paid during period” for your applicable class of shares to estimate the expenses you paid on your account during this period.
Hypothetical example for comparison purposes
The “Hypothetical” line of the table below provides information about hypothetical account values and hypothetical expenses based on the Fund’s actual expense ratio and an assumed rate of return of 5% per year before expenses, which is not the Fund’s actual return. The hypothetical account values and expenses may not be used to estimate the actual ending account balance or expenses you paid for the period. You may use this information to compare the ongoing costs of investing in the Fund and other funds. To do so, compare this 5% hypothetical example with the 5% hypothetical examples that appear in the shareholder reports of the other funds.
Please note that the expenses shown in the table are meant to highlight your ongoing costs only and do not reflect any transactional costs, such as sales charges (loads) and contingent deferred sales charges. Therefore, the “Hypothetical” line of the table is useful in comparing ongoing costs only and will not help you determine the relative total costs of owning different funds. In addition, if these transactional costs were included, your costs would have been higher.
| | | | | | | | | | | | | | | | |
| Dynamic Target Today Fund | | Beginning
account value
3-1-2020 | | | Ending
account value
8-31-2020 | | | Expenses
paid during
the period1 | | | Annualized net
expense ratio | |
| | | | | |
Class A | | | | | | | | | | | | | | | | |
| | | | |
Actual | | $ | 1,000.00 | | | $ | 1,062.26 | | | $ | 3.53 | | | | 0.68 | % |
| | | | |
Hypothetical (5% return before expenses) | | $ | 1,000.00 | | | $ | 1,021.78 | | | $ | 3.47 | | | | 0.68 | % |
| | | | | |
Class C | | | | | | | | | | | | | | | | |
| | | | |
Actual | | $ | 1,000.00 | | | $ | 1,073.86 | | | $ | 7.47 | | | | 1.43 | % |
| | | | |
Hypothetical (5% return before expenses) | | $ | 1,000.00 | | | $ | 1,018.00 | | | $ | 7.27 | | | | 1.43 | % |
| | | | | |
Class R4 | | | | | | | | | | | | | | | | |
| | | | |
Actual | | $ | 1,000.00 | | | $ | 1,063.09 | | | $ | 1.92 | | | | 0.37 | % |
| | | | |
Hypothetical (5% return before expenses) | | $ | 1,000.00 | | | $ | 1,023.34 | | | $ | 1.89 | | | | 0.37 | % |
| | | | | |
Class R6 | | | | | | | | | | | | | | | | |
| | | | |
Actual | | $ | 1,000.00 | | | $ | 1,064.03 | | | $ | 1.14 | | | | 0.22 | % |
| | | | |
Hypothetical (5% return before expenses) | | $ | 1,000.00 | | | $ | 1,024.10 | | | $ | 1.12 | | | | 0.22 | % |
| Dynamic Target 2015 Fund | | | | | | | | | | | | |
| | | | | |
Class A | | | | | | | | | | | | | | | | |
| | | | |
Actual | | $ | 1,000.00 | | | $ | 1,063.46 | | | $ | 3.54 | | | | 0.68 | % |
| | | | |
Hypothetical (5% return before expenses) | | $ | 1,000.00 | | | $ | 1,021.78 | | | $ | 3.47 | | | | 0.68 | % |
| | | | | |
Class C | | | | | | | | | | | | | | | | |
| | | | |
Actual | | $ | 1,000.00 | | | $ | 1,075.36 | | | $ | 7.48 | | | | 1.43 | % |
| | | | |
Hypothetical (5% return before expenses) | | $ | 1,000.00 | | | $ | 1,018.00 | | | $ | 7.27 | | | | 1.43 | % |
| | | | | |
Class R4 | | | | | | | | | | | | | | | | |
| | | | |
Actual | | $ | 1,000.00 | | | $ | 1,064.42 | | | $ | 1.93 | | | | 0.37 | % |
| | | | |
Hypothetical (5% return before expenses) | | $ | 1,000.00 | | | $ | 1,023.34 | | | $ | 1.89 | | | | 0.37 | % |
| | | | | |
Class R6 | | | | | | | | | | | | | | | | |
| | | | |
Actual | | $ | 1,000.00 | | | $ | 1,065.32 | | | $ | 1.15 | | | | 0.22 | % |
| | | | |
Hypothetical (5% return before expenses) | | $ | 1,000.00 | | | $ | 1,024.10 | | | $ | 1.12 | | | | 0.22 | % |
| 1 | Expenses paid is equal to the annualized net expense ratio of each class multiplied by the average account value over the period, multiplied by the number of days in the most recent fiscal half-year divided by the number of days in the fiscal year (to reflect the one-half-year period). |
Target Date Retirement Funds | 29
Fund expenses (unaudited)
| | | | | | | | | | | | | | | | |
| Dynamic Target 2020 Fund | | Beginning
account value
3-1-2020 | | | Ending
account value
8-31-2020 | | | Expenses
paid during
the period1 | | | Annualized net
expense ratio | |
| | | | | |
Class A | | | | | | | | | | | | | | | | |
| | | | |
Actual | | $ | 1,000.00 | | | $ | 1,069.07 | | | $ | 3.55 | | | | 0.68 | % |
| | | | |
Hypothetical (5% return before expenses) | | $ | 1,000.00 | | | $ | 1,021.78 | | | $ | 3.47 | | | | 0.68 | % |
| | | | | |
Class C | | | | | | | | | | | | | | | | |
| | | | |
Actual | | $ | 1,000.00 | | | $ | 1,077.82 | | | $ | 7.49 | | | | 1.43 | % |
| | | | |
Hypothetical (5% return before expenses) | | $ | 1,000.00 | | | $ | 1,018.00 | | | $ | 7.27 | | | | 1.43 | % |
| | | | | |
Class R4 | | | | | | | | | | | | | | | | |
| | | | |
Actual | | $ | 1,000.00 | | | $ | 1,070.60 | | | $ | 1.93 | | | | 0.37 | % |
| | | | |
Hypothetical (5% return before expenses) | | $ | 1,000.00 | | | $ | 1,023.34 | | | $ | 1.89 | | | | 0.37 | % |
| | | | | |
Class R6 | | | | | | | | | | | | | | | | |
| | | | |
Actual | | $ | 1,000.00 | | | $ | 1,071.57 | | | $ | 1.15 | | | | 0.22 | % |
| | | | |
Hypothetical (5% return before expenses) | | $ | 1,000.00 | | | $ | 1,024.10 | | | $ | 1.12 | | | | 0.22 | % |
| Dynamic Target 2025 Fund | | | | | | | | | | | | |
| | | | | |
Class A | | | | | | | | | | | | | | | | |
| | | | |
Actual | | $ | 1,000.00 | | | $ | 1,090.73 | | | $ | 3.58 | | | | 0.68 | % |
| | | | |
Hypothetical (5% return before expenses) | | $ | 1,000.00 | | | $ | 1,021.78 | | | $ | 3.47 | | | | 0.68 | % |
| | | | | |
Class C | | | | | | | | | | | | | | | | |
| | | | |
Actual | | $ | 1,000.00 | | | $ | 1,101.45 | | | $ | 7.57 | | | | 1.43 | % |
| | | | |
Hypothetical (5% return before expenses) | | $ | 1,000.00 | | | $ | 1,018.00 | | | $ | 7.27 | | | | 1.43 | % |
| | | | | |
Class R4 | | | | | | | | | | | | | | | | |
| | | | |
Actual | | $ | 1,000.00 | | | $ | 1,092.13 | | | $ | 1.95 | | | | 0.37 | % |
| | | | |
Hypothetical (5% return before expenses) | | $ | 1,000.00 | | | $ | 1,023.34 | | | $ | 1.89 | | | | 0.37 | % |
| | | | | |
Class R6 | | | | | | | | | | | | | | | | |
| | | | |
Actual | | $ | 1,000.00 | | | $ | 1,093.00 | | | $ | 1.16 | | | | 0.22 | % |
| | | | |
Hypothetical (5% return before expenses) | | $ | 1,000.00 | | | $ | 1,024.10 | | | $ | 1.12 | | | | 0.22 | % |
| Dynamic Target 2030 Fund | | | | | | | | | | | | |
| | | | | |
Class A | | | | | | | | | | | | | | | | |
| | | | |
Actual | | $ | 1,000.00 | | | $ | 1,105.84 | | | $ | 3.61 | | | | 0.68 | % |
| | | | |
Hypothetical (5% return before expenses) | | $ | 1,000.00 | | | $ | 1,021.78 | | | $ | 3.47 | | | | 0.68 | % |
| | | | | |
Class C | | | | | | | | | | | | | | | | |
| | | | |
Actual | | $ | 1,000.00 | | | $ | 1,115.96 | | | $ | 7.63 | | | | 1.43 | % |
| | | | |
Hypothetical (5% return before expenses) | | $ | 1,000.00 | | | $ | 1,018.00 | | | $ | 7.27 | | | | 1.43 | % |
| | | | | |
Class R4 | | | | | | | | | | | | | | | | |
| | | | |
Actual | | $ | 1,000.00 | | | $ | 1,108.06 | | | $ | 1.97 | | | | 0.37 | % |
| | | | |
Hypothetical (5% return before expenses) | | $ | 1,000.00 | | | $ | 1,023.34 | | | $ | 1.89 | | | | 0.37 | % |
| | | | | |
Class R6 | | | | | | | | | | | | | | | | |
| | | | |
Actual | | $ | 1,000.00 | | | $ | 1,108.93 | | | $ | 1.17 | | | | 0.22 | % |
| | | | |
Hypothetical (5% return before expenses) | | $ | 1,000.00 | | | $ | 1,024.10 | | | $ | 1.12 | | | | 0.22 | % |
| Dynamic Target 2035 Fund | | | | | | | | | | | | |
| | | | | |
Class A | | | | | | | | | | | | | | | | |
| | | | |
Actual | | $ | 1,000.00 | | | $ | 1,116.47 | | | $ | 3.63 | | | | 0.68 | % |
| | | | |
Hypothetical (5% return before expenses) | | $ | 1,000.00 | | | $ | 1,021.78 | | | $ | 3.47 | | | | 0.68 | % |
| | | | | |
Class C | | | | | | | | | | | | | | | | |
| | | | |
Actual | | $ | 1,000.00 | | | $ | 1,128.90 | | | $ | 7.67 | | | | 1.43 | % |
| | | | |
Hypothetical (5% return before expenses) | | $ | 1,000.00 | | | $ | 1,018.00 | | | $ | 7.27 | | | | 1.43 | % |
| | | | | |
Class R4 | | | | | | | | | | | | | | | | |
| | | | |
Actual | | $ | 1,000.00 | | | $ | 1,118.76 | | | $ | 1.98 | | | | 0.37 | % |
| | | | |
Hypothetical (5% return before expenses) | | $ | 1,000.00 | | | $ | 1,023.34 | | | $ | 1.89 | | | | 0.37 | % |
| | | | | |
Class R6 | | | | | | | | | | | | | | | | |
| | | | |
Actual | | $ | 1,000.00 | | | $ | 1,119.76 | | | $ | 1.18 | | | | 0.22 | % |
| | | | |
Hypothetical (5% return before expenses) | | $ | 1,000.00 | | | $ | 1,024.10 | | | $ | 1.12 | | | | 0.22 | % |
| 1 | Expenses paid is equal to the annualized net expense ratio of each class multiplied by the average account value over the period, multiplied by the number of days in the most recent fiscal half-year divided by the number of days in the fiscal year (to reflect the one-half-year period). |
30 | Target Date Retirement Funds
Fund expenses (unaudited)
| | | | | | | | | | | | | | | | |
| Dynamic Target 2040 Fund | | Beginning
account value
3-1-2020 | | | Ending
account value
8-31-2020 | | | Expenses
paid during
the period1 | | | Annualized net
expense ratio | |
| | | | | |
Class A | | | | | | | | | | | | | | | | |
| | | | |
Actual | | $ | 1,000.00 | | | $ | 1,110.89 | | | $ | 3.62 | | | | 0.68 | % |
| | | | |
Hypothetical (5% return before expenses) | | $ | 1,000.00 | | | $ | 1,021.78 | | | $ | 3.47 | | | | 0.68 | % |
| | | | | |
Class C | | | | | | | | | | | | | | | | |
| | | | |
Actual | | $ | 1,000.00 | | | $ | 1,123.34 | | | $ | 7.65 | | | | 1.43 | % |
| | | | |
Hypothetical (5% return before expenses) | | $ | 1,000.00 | | | $ | 1,018.00 | | | $ | 7.27 | | | | 1.43 | % |
| | | | | |
Class R4 | | | | | | | | | | | | | | | | |
| | | | |
Actual | | $ | 1,000.00 | | | $ | 1,113.02 | | | $ | 1.97 | | | | 0.37 | % |
| | | | |
Hypothetical (5% return before expenses) | | $ | 1,000.00 | | | $ | 1,023.34 | | | $ | 1.89 | | | | 0.37 | % |
| | | | | |
Class R6 | | | | | | | | | | | | | | | | |
| | | | |
Actual | | $ | 1,000.00 | | | $ | 1,113.91 | | | $ | 1.17 | | | | 0.22 | % |
| | | | |
Hypothetical (5% return before expenses) | | $ | 1,000.00 | | | $ | 1,024.10 | | | $ | 1.12 | | | | 0.22 | % |
| Dynamic Target 2045 Fund | | | | | | | | | | | | |
| | | | | |
Class A | | | | | | | | | | | | | | | | |
| | | | |
Actual | | $ | 1,000.00 | | | $ | 1,119.34 | | | $ | 3.63 | | | | 0.68 | % |
| | | | |
Hypothetical (5% return before expenses) | | $ | 1,000.00 | | | $ | 1,021.78 | | | $ | 3.47 | | | | 0.68 | % |
| | | | | |
Class C | | | | | | | | | | | | | | | | |
| | | | |
Actual | | $ | 1,000.00 | | | $ | 1,131.20 | | | $ | 7.68 | | | | 1.43 | % |
| | | | |
Hypothetical (5% return before expenses) | | $ | 1,000.00 | | | $ | 1,018.00 | | | $ | 7.27 | | | | 1.43 | % |
| | | | | |
Class R4 | | | | | | | | | | | | | | | | |
| | | | |
Actual | | $ | 1,000.00 | | | $ | 1,121.68 | | | $ | 1.98 | | | | 0.37 | % |
| | | | |
Hypothetical (5% return before expenses) | | $ | 1,000.00 | | | $ | 1,023.34 | | | $ | 1.89 | | | | 0.37 | % |
| | | | | |
Class R6 | | | | | | | | | | | | | | | | |
| | | | |
Actual | | $ | 1,000.00 | | | $ | 1,122.57 | | | $ | 1.18 | | | | 0.22 | % |
| | | | |
Hypothetical (5% return before expenses) | | $ | 1,000.00 | | | $ | 1,024.10 | | | $ | 1.12 | | | | 0.22 | % |
| Dynamic Target 2050 Fund | | | | | | | | | | | | |
| | | | | |
Class A | | | | | | | | | | | | | | | | |
| | | | |
Actual | | $ | 1,000.00 | | | $ | 1,118.13 | | | $ | 3.63 | | | | 0.68 | % |
| | | | |
Hypothetical (5% return before expenses) | | $ | 1,000.00 | | | $ | 1,021.78 | | | $ | 3.47 | | | | 0.68 | % |
| | | | | |
Class C | | | | | | | | | | | | | | | | |
| | | | |
Actual | | $ | 1,000.00 | | | $ | 1,129.30 | | | $ | 7.67 | | | | 1.43 | % |
| | | | |
Hypothetical (5% return before expenses) | | $ | 1,000.00 | | | $ | 1,018.00 | | | $ | 7.27 | | | | 1.43 | % |
| | | | | |
Class R4 | | | | | | | | | | | | | | | | |
| | | | |
Actual | | $ | 1,000.00 | | | $ | 1,119.71 | | | $ | 1.98 | | | | 0.37 | % |
| | | | |
Hypothetical (5% return before expenses) | | $ | 1,000.00 | | | $ | 1,023.34 | | | $ | 1.89 | | | | 0.37 | % |
| | | | | |
Class R6 | | | | | | | | | | | | | | | | |
| | | | |
Actual | | $ | 1,000.00 | | | $ | 1,120.62 | | | $ | 1.18 | | | | 0.22 | % |
| | | | |
Hypothetical (5% return before expenses) | | $ | 1,000.00 | | | $ | 1,024.10 | | | $ | 1.12 | | | | 0.22 | % |
| Dynamic Target 2055 Fund | | | | | | | | | | | | |
| | | | | |
Class A | | | | | | | | | | | | | | | | |
| | | | |
Actual | | $ | 1,000.00 | | | $ | 1,122.15 | | | $ | 3.64 | | | | 0.68 | % |
| | | | |
Hypothetical (5% return before expenses) | | $ | 1,000.00 | | | $ | 1,021.78 | | | $ | 3.47 | | | | 0.68 | % |
| | | | | |
Class C | | | | | | | | | | | | | | | | |
| | | | |
Actual | | $ | 1,000.00 | | | $ | 1,134.52 | | | $ | 7.69 | | | | 1.43 | % |
| | | | |
Hypothetical (5% return before expenses) | | $ | 1,000.00 | | | $ | 1,018.00 | | | $ | 7.27 | | | | 1.43 | % |
| | | | | |
Class R4 | | | | | | | | | | | | | | | | |
| | | | |
Actual | | $ | 1,000.00 | | | $ | 1,124.87 | | | $ | 1.98 | | | | 0.37 | % |
| | | | |
Hypothetical (5% return before expenses) | | $ | 1,000.00 | | | $ | 1,023.34 | | | $ | 1.89 | | | | 0.37 | % |
| | | | | |
Class R6 | | | | | | | | | | | | | | | | |
| | | | |
Actual | | $ | 1,000.00 | | | $ | 1,125.90 | | | $ | 1.18 | | | | 0.22 | % |
| | | | |
Hypothetical (5% return before expenses) | | $ | 1,000.00 | | | $ | 1,024.10 | | | $ | 1.12 | | | | 0.22 | % |
| 1 | Expenses paid is equal to the annualized net expense ratio of each class multiplied by the average account value over the period, multiplied by the number of days in the most recent fiscal half-year divided by the number of days in the fiscal year (to reflect the one-half-year period). |
Target Date Retirement Funds | 31
Fund expenses (unaudited)
| | | | | | | | | | | | | | | | |
| Dynamic Target 2060 Fund | | Beginning
account value
3-1-2020 | | | Ending
account value
8-31-2020 | | | Expenses
paid during
the period1 | | | Annualized net
expense ratio | |
| | | | | |
Class A | | | | | | | | | | | | | | | | |
| | | | |
Actual | | $ | 1,000.00 | | | $ | 1,116.98 | | | $ | 3.63 | | | | 0.68 | % |
| | | | |
Hypothetical (5% return before expenses) | | $ | 1,000.00 | | | $ | 1,021.78 | | | $ | 3.47 | | | | 0.68 | % |
| | | | | |
Class C | | | | | | | | | | | | | | | | |
| | | | |
Actual | | $ | 1,000.00 | | | $ | 1,129.94 | | | $ | 7.68 | | | | 1.43 | % |
| | | | |
Hypothetical (5% return before expenses) | | $ | 1,000.00 | | | $ | 1,018.00 | | | $ | 7.27 | | | | 1.43 | % |
| | | | | |
Class R4 | | | | | | | | | | | | | | | | |
| | | | |
Actual | | $ | 1,000.00 | | | $ | 1,118.19 | | | $ | 1.98 | | | | 0.37 | % |
| | | | |
Hypothetical (5% return before expenses) | | $ | 1,000.00 | | | $ | 1,023.34 | | | $ | 1.89 | | | | 0.37 | % |
| | | | | |
Class R6 | | | | | | | | | | | | | | | | |
| | | | |
Actual | | $ | 1,000.00 | | | $ | 1,120.25 | | | $ | 1.18 | | | | 0.22 | % |
| | | | |
Hypothetical (5% return before expenses) | | $ | 1,000.00 | | | $ | 1,024.10 | | | $ | 1.12 | | | | 0.22 | % |
| 1 | Expenses paid is equal to the annualized net expense ratio of each class multiplied by the average account value over the period, multiplied by the number of days in the most recent fiscal half-year divided by the number of days in the fiscal year (to reflect the one-half-year period). |
32 | Target Date Retirement Funds
Portfolio of investments—August 31, 2020 (unaudited)
DYNAMIC TARGET TODAY FUND
| | | | |
| | | Value | |
| Investment Companies: 100.08% | | | |
| |
| Affiliated Master Portfolios: 100.08% | | | |
Wells Fargo Bloomberg Barclays US Aggregate ex-Corporate Portfolio | | $ | 2,126,671 | |
Wells Fargo Emerging Markets Bond Portfolio | | | 180,991 | |
Wells Fargo Factor Enhanced Emerging Markets Equity Portfolio | | | 210,018 | |
Wells Fargo Factor Enhanced International Equity Portfolio | | | 709,514 | |
Wells Fargo Factor Enhanced U.S. Large Cap Equity Portfolio | | | 1,363,445 | |
Wells Fargo Factor Enhanced U.S. Small Cap Equity Portfolio | | | 340,337 | |
Wells Fargo High Yield Corporate Bond Portfolio | | | 181,235 | |
Wells Fargo Investment Grade Corporate Bond Portfolio | | | 1,108,694 | |
Wells Fargo Strategic Retirement Bond Portfolio | | | 720,257 | |
Wells Fargo U.S. REIT Portfolio | | | 237,862 | |
| |
Total Investment Companies (Cost $6,615,650) | | | 7,179,024 | |
| | | | |
| | | | | | | | |
| Total investments in securities (Cost $6,615,650) | | | 100.08 | % | | | 7,179,024 | |
| | |
Other assets and liabilities, net | | | (0.08 | ) | | | (6,056 | ) |
| | | | | | | | |
| Total net assets | | | 100.00 | % | | $ | 7,172,968 | |
| | | | | | | | |
Futures Contracts
| | | | | | | | | | | | | | | | | | | | | | | | |
| Description | | Number of
contracts | | | Expiration
date | | | Notional
cost | | | Notional
value | | | Unrealized
gains | | | Unrealized
losses | |
| | | | | | |
Long | | | | | | | | | | | | | | | | | | | | | | | | |
| | | | | | |
NASDAQ 100 E-Mini Index | | | 1 | | | | 9-18-2020 | | | $ | 220,981 | | | $ | 242,280 | | | $ | 21,299 | | | $ | 0 | |
The accompanying notes are an integral part of these financial statements.
Target Date Retirement Funds | 33
Portfolio of investments—August 31, 2020 (unaudited)
DYNAMIC TARGET TODAY FUND
Transactions with the affiliated Master Portfolios were as follows:
| | | | | | | | | | | | | | | | | | | | | | | | | | | | | | | | | | | | |
| | | % of
ownership,
beginning
of period | | | % of
ownership,
end of
period | | | Net realized
gains
(losses) on
securities
transactions
allocated
from
affiliated
Master
Portfolios | | | Net
change in
unrealized
gains
(losses) on
securities
transactions
allocated
from
affiliated
Master
Portfolios | | | Interest
allocated
from
affiliated
Master
Portfolios | | | Dividends
allocated
from
affiliated
Master
Portfolios | | | Affiliated
income
allocated
from
affiliated
Master
Portfolios | | | Value,
end
of period | | | % of
net
assets | |
Affiliated Master Portfolios | | | | | | | | | | | | | | | | | | | | | | | | | | | | | | | | | | | | |
Wells Fargo Bloomberg Barclays US Aggregate ex-Corporate Portfolio | | | 0.32 | % | | | 0.37 | % | | $ | 35,398 | | | $ | (6,911 | ) | | $ | 18,243 | | | $ | 0 | | | $ | 51 | | | $ | 2,126,671 | | | | | |
Wells Fargo Emerging Markets Bond Portfolio | | | 0.42 | | | | 0.50 | | | | 287 | | | | (2,113 | ) | | | 4,368 | | | | 0 | | | | 2 | | | | 180,991 | | | | | |
Wells Fargo Factor Enhanced Emerging Markets Equity Portfolio | | | 0.09 | | | | 0.10 | | | | (18,747 | ) | | | 24,541 | | | | 3 | | | | 3,492 | | | | 8 | | | | 210,018 | | | | | |
Wells Fargo Factor Enhanced International Equity Portfolio | | | 0.11 | | | | 0.11 | | | | (19,032 | ) | | | 75,316 | | | | 4 | | | | 11,075 | | | | 26 | | | | 709,514 | | | | | |
Wells Fargo Factor Enhanced U.S. Large Cap Equity Portfolio | | | 0.13 | | | | 0.16 | | | | 59,398 | | | | 92,541 | | | | 8 | | | | 14,193 | | | | 62 | | | | 1,363,445 | | | | | |
Wells Fargo Factor Enhanced U.S. Small Cap Equity Portfolio | | | 0.13 | | | | 0.15 | | | | (28,194 | ) | | | 50,742 | | | | 3 | | | | 2,779 | | | | 19 | | | | 340,337 | | | | | |
Wells Fargo High Yield Corporate Bond Portfolio | | | 0.32 | | | | 0.10 | | | | (7,467 | ) | | | 5,537 | | | | 5,210 | | | | 0 | | | | 5 | | | | 181,235 | | | | | |
Wells Fargo Investment Grade Corporate Bond Portfolio | | | 0.42 | | | | 0.50 | | | | 7,870 | | | | 5,956 | | | | 18,082 | | | | 0 | | | | 8 | | | | 1,108,694 | | | | | |
Wells Fargo Strategic Retirement Bond Portfolio | | | 0.94 | | | | 1.11 | | | | 7,794 | | | | 12,512 | | | | 4,537 | | | | 0 | | | | 3 | | | | 720,257 | | | | | |
Wells Fargo U.S. REIT Portfolio | | | 0.84 | | | | 0.98 | | | | (16,807 | ) | | | 240 | | | | 0 | | | | 4,429 | | | | 3 | | | | 237,862 | | | | | |
| | | | | | | | | | | | | | | | | | | | | | | | | | | | | | | | | | | | |
| | | | | | | | | | $ | 20,500 | | | $ | 258,361 | | | $ | 50,458 | | | $ | 35,968 | | | $ | 187 | | | $ | 7,179,024 | | | | 100.08 | % |
| | | | | | | | | | | | | | | | | | | | | | | | | | | | | | | | | | | | |
The accompanying notes are an integral part of these financial statements.
34 | Target Date Retirement Funds
Portfolio of investments—August 31, 2020 (unaudited)
DYNAMIC TARGET 2015 FUND
| | | | |
| | | Value | |
| Investment Companies: 100.31% | | | |
| |
| Affiliated Master Portfolios: 100.31% | | | |
Wells Fargo Bloomberg Barclays US Aggregate ex-Corporate Portfolio | | $ | 1,507,129 | |
Wells Fargo Emerging Markets Bond Portfolio | | | 128,289 | |
Wells Fargo Factor Enhanced Emerging Markets Equity Portfolio | | | 214,516 | |
Wells Fargo Factor Enhanced International Equity Portfolio | | | 724,691 | |
Wells Fargo Factor Enhanced U.S. Large Cap Equity Portfolio | | | 1,395,739 | |
Wells Fargo Factor Enhanced U.S. Small Cap Equity Portfolio | | | 347,620 | |
Wells Fargo High Yield Corporate Bond Portfolio | | | 128,444 | |
Wells Fargo Investment Grade Corporate Bond Portfolio | | | 786,083 | |
Wells Fargo Strategic Retirement Bond Portfolio | | | 510,522 | |
Wells Fargo U.S. REIT Portfolio | | | 242,953 | |
| |
Total Investment Companies (Cost $5,433,648) | | | 5,985,986 | |
| | | | |
| | | | | | | | |
| Total investments in securities (Cost $5,433,648) | | | 100.31 | % | | | 5,985,986 | |
| | |
Other assets and liabilities, net | | | (0.31 | ) | | | (18,494 | ) |
| | | | | | | | |
| Total net assets | | | 100.00 | % | | $ | 5,967,492 | |
| | | | | | | | |
Futures Contracts
| | | | | | | | | | | | | | | | | | | | | | | | |
| Description | | Number of
contracts | | | Expiration
date | | | Notional
cost | | | Notional
value | | | Unrealized
gains | | | Unrealized
losses | |
| | | | | | |
Long | | | | | | | | | | | | | | | | | | | | | | | | |
| | | | | | |
NASDAQ 100 E-Mini Index | | | 1 | | | | 9-18-2020 | | | $ | 220,981 | | | $ | 242,280 | | | $ | 21,299 | | | $ | 0 | |
The accompanying notes are an integral part of these financial statements.
Target Date Retirement Funds | 35
Portfolio of investments—August 31, 2020 (unaudited)
DYNAMIC TARGET 2015 FUND
Transactions with the affiliated Master Portfolios were as follows:
| | | | | | | | | | | | | | | | | | | | | | | | | | | | | | | | | | | | |
| | | % of
ownership,
beginning
of period | | | % of
ownership,
end of
period | | | Net realized
gains
(losses) on
securities
transactions
allocated
from
affiliated
Master
Portfolios | | | Net
change in
unrealized
gains
(losses) on
securities
transactions
allocated
from
affiliated
Master
Portfolios | | | Interest
allocated
from
affiliated
Master
Portfolios | | | Dividends
allocated
from
affiliated
Master
Portfolios | | | Affiliated
income
allocated
from
affiliated
Master
Portfolios | | | Value,
end
of period | | | % of
net
assets | |
Affiliated Master Portfolios | | | | | | | | | | | | | | | | | | | | | | | | | | | | | | | | | | | | |
Wells Fargo Bloomberg Barclays US Aggregate ex-Corporate Portfolio | | | 0.23 | % | | | 0.26 | % | | $ | 25,345 | | | $ | 6,111 | | | $ | 12,646 | | | $ | 0 | | | $ | 36 | | | $ | 1,507,129 | | | | | |
Wells Fargo Emerging Markets Bond Portfolio | | | 0.29 | | | | 0.36 | | | | 199 | | | | (1,831 | ) | | | 3,023 | | | | 0 | | | | 1 | | | | 128,289 | | | | | |
Wells Fargo Factor Enhanced Emerging Markets Equity Portfolio | | | 0.09 | | | | 0.10 | | | | (18,300 | ) | | | 23,573 | | | | 3 | | | | 3,474 | | | | 8 | | | | 214,516 | | | | | |
Wells Fargo Factor Enhanced International Equity Portfolio | | | 0.11 | | | | 0.11 | | | | (18,751 | ) | | | 72,301 | | | | 4 | | | | 11,083 | | | | 26 | | | | 724,691 | | | | | |
Wells Fargo Factor Enhanced U.S. Large Cap Equity Portfolio | | | 0.13 | | | | 0.16 | | | | 56,914 | | | | 79,725 | | | | 8 | | | | 14,174 | | | | 62 | | | | 1,395,739 | | | | | |
Wells Fargo Factor Enhanced U.S. Small Cap Equity Portfolio | | | 0.13 | | | | 0.16 | | | | (28,020 | ) | | | 48,605 | | | | 3 | | | | 2,779 | | | | 19 | | | | 347,620 | | | | | |
Wells Fargo High Yield Corporate Bond Portfolio | | | 0.23 | | | | 0.07 | | | | (5,118 | ) | | | 3,513 | | | | 3,612 | | | | 0 | | | | 4 | | | | 128,444 | | | | | |
Wells Fargo Investment Grade Corporate Bond Portfolio | | | 0.30 | | | | 0.35 | | | | 5,458 | | | | 3,030 | | | | 12,529 | | | | 0 | | | | 5 | | | | 786,083 | | | | | |
Wells Fargo Strategic Retirement Bond Portfolio | | | 0.67 | | | | 0.79 | | | | 5,434 | | | | 8,586 | | | | 3,216 | | | | 0 | | | | 2 | | | | 510,522 | | | | | |
Wells Fargo U.S. REIT Portfolio | | | 0.85 | | | | 1.00 | | | | (16,751 | ) | | | (765 | ) | | | 0 | | | | 4,427 | | | | 3 | | | | 242,953 | | | | | |
| | | | | | | | | | | | | | | | | | | | | | | | | | | | | | | | | | | | |
| | | | | | | | | | $ | 6,410 | | | $ | 242,848 | | | $ | 35,044 | | | $ | 35,937 | | | $ | 166 | | | $ | 5,985,986 | | | | 100.31 | % |
| | | | | | | | | | | | | | | | | | | | | | | | | | | | | | | | | | | | |
The accompanying notes are an integral part of these financial statements.
36 | Target Date Retirement Funds
Portfolio of investments—August 31, 2020 (unaudited)
DYNAMIC TARGET 2020 FUND
| | | | |
| | | Value | |
| Investment Companies: 100.05% | | | |
| |
| Affiliated Master Portfolios: 100.05% | | | |
Wells Fargo Bloomberg Barclays US Aggregate ex-Corporate Portfolio | | $ | 1,524,079 | |
Wells Fargo Emerging Markets Bond Portfolio | | | 129,510 | |
Wells Fargo Factor Enhanced Emerging Markets Equity Portfolio | | | 299,943 | |
Wells Fargo Factor Enhanced International Equity Portfolio | | | 1,012,619 | |
Wells Fargo Factor Enhanced U.S. Large Cap Equity Portfolio | | | 1,931,996 | |
Wells Fargo Factor Enhanced U.S. Small Cap Equity Portfolio | | | 481,240 | |
Wells Fargo High Yield Corporate Bond Portfolio | | | 129,699 | |
Wells Fargo Investment Grade Corporate Bond Portfolio | | | 795,050 | |
Wells Fargo Strategic Retirement Bond Portfolio | | | 474,054 | |
Wells Fargo U.S. REIT Portfolio | | | 302,485 | |
| |
Total Investment Companies (Cost $6,499,710) | | | 7,080,675 | |
| | | | |
| | | | | | | | |
| Total investments in securities (Cost $6,499,710) | | | 100.05 | % | | | 7,080,675 | |
| | |
Other assets and liabilities, net | | | (0.05 | ) | | | (3,791 | ) |
| | | | | | | | |
| Total net assets | | | 100.00 | % | | $ | 7,076,884 | |
| | | | | | | | |
Futures Contracts
| | | | | | | | | | | | | | | | | | | | | | | | |
| Description | | Number of
contracts | | | Expiration
date | | | Notional
cost | | | Notional
value | | | Unrealized
gains | | | Unrealized
losses | |
| | | | | | |
Long | | | | | | | | | | | | | | | | | | | | | | | | |
| | | | | | |
NASDAQ 100 E-Mini Index | | | 1 | | | | 9-18-2020 | | | $ | 220,981 | | | $ | 242,280 | | | $ | 21,299 | | | $ | 0 | |
The accompanying notes are an integral part of these financial statements.
Target Date Retirement Funds | 37
Portfolio of investments—August 31, 2020 (unaudited)
DYNAMIC TARGET 2020 FUND
Transactions with the affiliated Master Portfolios were as follows:
| | | | | | | | | | | | | | | | | | | | | | | | | | | | | | | | | | | | |
| | | % of
ownership,
beginning
of period | | | % of
ownership,
end of
period | | | Net realized
gains
(losses) on
securities
transactions
allocated
from
affiliated
Master
Portfolios | | | Net change in
unrealized
gains
(losses) on
securities
transactions
allocated
from
affiliated
Master
Portfolios | | | Interest
allocated
from
affiliated
Master
Portfolios | | | Dividends
allocated
from
affiliated
Master
Portfolios | | | Affiliated
income
allocated
from
affiliated
Master
Portfolios | | | Value,
end of
period | | | % of net
assets | |
Affiliated Master Portfolios | | | | | | | | | | | | | | | | | | | | | | | | | | | | | | | | | | | | |
Wells Fargo Bloomberg Barclays US Aggregate ex-Corporate Portfolio | | | 0.23 | % | | | 0.26 | % | | $ | 26,204 | | | $ | (82,096 | ) | | $ | 12,719 | | | $ | 0 | | | $ | 36 | | | $ | 1,524,079 | | | | | |
Wells Fargo Emerging Markets Bond Portfolio | | | 0.30 | | | | 0.36 | | | | 230 | | | | (10,529 | ) | | | 3,033 | | | | 0 | | | | 1 | | | | 129,510 | | | | | |
Wells Fargo Factor Enhanced Emerging Markets Equity Portfolio | | | 0.13 | | | | 0.14 | | | | (23,489 | ) | | | 8,043 | | | | 2 | | | | 5,813 | | | | 11 | | | | 299,943 | | | | | |
Wells Fargo Factor Enhanced International Equity Portfolio | | | 0.16 | | | | 0.16 | | | | (26,848 | ) | | | 114,516 | | | | 5 | | | | 17,591 | | | | 37 | | | | 1,012,619 | | | | | |
Wells Fargo Factor Enhanced U.S. Large Cap Equity Portfolio | | | 0.18 | | | | 0.22 | | | | 76,275 | | | | 231,787 | | | | 12 | | | | 17,251 | | | | 93 | | | | 1,931,996 | | | | | |
Wells Fargo Factor Enhanced U.S. Small Cap Equity Portfolio | | | 0.19 | | | | 0.22 | | | | (40,256 | ) | | | 95,233 | | | | 4 | | | | 3,198 | | | | 27 | | | | 481,240 | | | | | |
Wells Fargo High Yield Corporate Bond Portfolio | | | 0.23 | | | | 0.07 | | | | (5,056 | ) | | | (3,579 | ) | | | 3,644 | | | | 0 | | | | 4 | | | | 129,699 | | | | | |
Wells Fargo Investment Grade Corporate Bond Portfolio | | | 0.30 | | | | 0.36 | | | | 5,816 | | | | (34,569 | ) | | | 12,500 | | | | 0 | | | | 5 | | | | 795,050 | | | | | |
Wells Fargo Strategic Retirement Bond Portfolio | | | 0.63 | | | | 0.73 | | | | 5,212 | | | | (14,070 | ) | | | 3,020 | | | | 0 | | | | 2 | | | | 474,054 | | | | | |
Wells Fargo U.S. REIT Portfolio | | | 1.09 | | | | 1.25 | | | | (20,693 | ) | | | (11,990 | ) | | | 0 | | | | 5,075 | | | | 4 | | | | 302,485 | | | | | |
| | | | | | | | | | | | | | | | | | | | | | | | | | | | | | | | | | | | |
| | | | | | | | | | $ | (2,605 | ) | | $ | 292,746 | | | $ | 34,939 | | | $ | 48,928 | | | $ | 220 | | | $ | 7,080,675 | | | | 100.05 | % |
| | | | | | | | | | | | | | | | | | | | | | | | | | | | | | | | | | | | |
The accompanying notes are an integral part of these financial statements.
38 | Target Date Retirement Funds
Portfolio of investments—August 31, 2020 (unaudited)
DYNAMIC TARGET 2025 FUND
| | | | | | | | | | | | | | | | |
| | | | | | | | | | | | Value | |
| Investment Companies: 100.76% | | | | | | | | | | | | |
| | | | |
| Affiliated Master Portfolios: 100.76% | | | | | | | | | | | | |
Wells Fargo Bloomberg Barclays US Aggregate ex-Corporate Portfolio | | | | | | | | | | | | | | $ | 1,837,498 | |
Wells Fargo Emerging Markets Bond Portfolio | | | | | | | | | | | | | | | 154,847 | |
Wells Fargo Factor Enhanced Emerging Markets Equity Portfolio | | | | | | | | | | | | | | | 547,118 | |
Wells Fargo Factor Enhanced International Equity Portfolio | | | | | | | | | | | | | | | 1,844,015 | |
Wells Fargo Factor Enhanced U.S. Large Cap Equity Portfolio | | | | | | | | | | | | | | | 3,374,521 | |
Wells Fargo Factor Enhanced U.S. Small Cap Equity Portfolio | | | | | | | | | | | | | | | 842,402 | |
Wells Fargo High Yield Corporate Bond Portfolio | | | | | | | | | | | | | | | 155,067 | |
Wells Fargo Investment Grade Corporate Bond Portfolio | | | | | | | | | | | | | | | 957,922 | |
Wells Fargo Strategic Retirement Bond Portfolio | | | | | | | | | | | | | | | 303,331 | |
Wells Fargo U.S. REIT Portfolio | | | | | | | | | | | | | | | 290,414 | |
| | | | |
Total Investment Companies (Cost $9,452,581) | | | | | | | | | | | | | | | 10,307,135 | |
| | | | | | | | | | | | | | | | |
| | | | | | | | |
| Total investments in securities (Cost $9,452,581) | | | 100.76 | % | | | 10,307,135 | |
| | |
Other assets and liabilities, net | | | (0.76 | ) | | | (78,249 | ) |
| | | | | | | | |
| Total net assets | | | 100.00 | % | | $ | 10,228,886 | |
| | | | | | | | |
Futures Contracts
| | | | | | | | | | | | | | | | | | | | | | | | |
| Description | | Number of
contracts | | | Expiration
date | | | Notional
cost | | | Notional
value | | | Unrealized
gains | | | Unrealized
losses | |
| | | | | | |
Long | | | | | | | | | | | | | | | | | | | | | | | | |
| | | | | | |
NASDAQ 100 E-Mini Index | | | 1 | | | | 9-18-2020 | | | $ | 220,981 | | | $ | 242,280 | | | $ | 21,299 | | | $ | 0 | |
The accompanying notes are an integral part of these financial statements.
Target Date Retirement Funds | 39
Portfolio of investments—August 31, 2020 (unaudited)
DYNAMIC TARGET 2025 FUND
Transactions with the affiliated Master Portfolios were as follows:
| | | | | | | | | | | | | | | | | | | | | | | | | | | | | | | | | | | | |
| | | % of
ownership,
beginning
of period | | | % of
ownership,
end of
period | | | Net realized
gains
(losses) on
securities
transactions
allocated
from
affiliated
Master
Portfolios | | | Net
change in
unrealized
gains
(losses) on
securities
transactions
allocated
from
affiliated
Master
Portfolios | | | Interest
allocated
from
affiliated
Master
Portfolios | | | Dividends
allocated
from
affiliated
Master
Portfolios | | | Affiliated
income
allocated
from
affiliated
Master
Portfolios | | | Value,
end
of period | | | % of
net
assets | |
Affiliated Master Portfolios | | | | | | | | | | | | | | | | | | | | | | | | | | | | | | | | | | | | |
Wells Fargo Bloomberg Barclays US Aggregate ex-Corporate Portfolio | | | 0.23 | % | | | 0.26 | % | | $ | 30,854 | | | $ | (93,414 | ) | | $ | 15,208 | | | $ | 0 | | | $ | 43 | | | $ | 1,837,498 | | | | | |
Wells Fargo Emerging Markets Bond Portfolio | | | 0.30 | | | | 0.36 | | | | 281 | | | | (11,803 | ) | | | 3,617 | | | | 0 | | | | 2 | | | | 154,847 | | | | | |
Wells Fargo Factor Enhanced Emerging Markets Equity Portfolio | | | 0.13 | | | | 0.14 | | | | (42,690 | ) | | | 18,364 | | | | 4 | | | | 10,608 | | | | 19 | | | | 547,118 | | | | | |
Wells Fargo Factor Enhanced International Equity Portfolio | | | 0.16 | | | | 0.16 | | | | (48,480 | ) | | | 194,693 | | | | 10 | | | | 31,468 | | | | 66 | | | | 1,844,015 | | | | | |
Wells Fargo Factor Enhanced U.S. Large Cap Equity Portfolio | | | 0.18 | | | | 0.22 | | | | 135,943 | | | | 348,701 | | | | 20 | | | | 29,651 | | | | 161 | | | | 3,374,521 | | | | | |
Wells Fargo Factor Enhanced U.S. Small Cap Equity Portfolio | | | 0.19 | | | | 0.22 | | | | (70,547 | ) | | | 152,456 | | | | 7 | | | | 5,470 | | | | 46 | | | | 842,402 | | | | | |
Wells Fargo High Yield Corporate Bond Portfolio | | | 0.23 | | | | 0.07 | | | | (6,128 | ) | | | (3,920 | ) | | | 4,335 | | | | 0 | | | | 5 | | | | 155,067 | | | | | |
Wells Fargo Investment Grade Corporate Bond Portfolio | | | 0.30 | | | | 0.36 | | | | 6,926 | | | | (42,733 | ) | | | 14,801 | | | | 0 | | | | 7 | | | | 957,922 | | | | | |
Wells Fargo Strategic Retirement Bond Portfolio | | | 0.63 | | | | 0.73 | | | | 3,285 | | | | (9,402 | ) | | | 1,872 | | | | 0 | | | | 1 | | | | 303,331 | | | | | |
Wells Fargo U.S. REIT Portfolio | | | 1.09 | | | | 1.25 | | | | (19,441 | ) | | | (12,929 | ) | | | 0 | | | | 5,244 | | | | 3 | | | | 290,414 | | | | | |
| | | | | | | | | | | | | | | | | | | | | | | | | | | | | | | | | | | | |
| | | | | | | | | | $ | (9,997 | ) | | $ | 540,013 | | | $ | 39,874 | | | $ | 82,441 | | | $ | 353 | | | $ | 10,307,135 | | | | 100.76 | % |
| | | | | | | | | | | | | | | | | | | | | | | | | | | | | | | | | | | | |
The accompanying notes are an integral part of these financial statements.
40 | Target Date Retirement Funds
Portfolio of investments—August 31, 2020 (unaudited)
DYNAMIC TARGET 2030 FUND
| | | | | | | | | | | | | | | | |
| | | | | | | | | | | | Value | |
| Investment Companies: 100.65% | | | | | | | | | | | | |
| | | | |
| Affiliated Master Portfolios: 100.65% | | | | | | | | | | | | |
Wells Fargo Bloomberg Barclays US Aggregate ex-Corporate Portfolio | | | | | | | | | | | | | | $ | 1,318,930 | |
Wells Fargo Emerging Markets Bond Portfolio | | | | | | | | | | | | | | | 110,617 | |
Wells Fargo Factor Enhanced Emerging Markets Equity Portfolio | | | | | | | | | | | | | | | 606,229 | |
Wells Fargo Factor Enhanced International Equity Portfolio | | | | | | | | | | | | | | | 2,049,502 | |
Wells Fargo Factor Enhanced U.S. Large Cap Equity Portfolio | | | | | | | | | | | | | | | 3,591,655 | |
Wells Fargo Factor Enhanced U.S. Small Cap Equity Portfolio | | | | | | | | | | | | | | | 894,811 | |
Wells Fargo High Yield Corporate Bond Portfolio | | | | | | | | | | | | | | | 110,777 | |
Wells Fargo Investment Grade Corporate Bond Portfolio | | | | | | | | | | | | | | | 687,965 | |
Wells Fargo Strategic Retirement Bond Portfolio | | | | | | | | | | | | | | | 64,455 | |
Wells Fargo U.S. REIT Portfolio | | | | | | | | | | | | | | | 92,893 | |
| | | | |
Total Investment Companies (Cost $8,618,972) | | | | | | | | | | | | | | | 9,527,834 | |
| | | | | | | | | | | | | | | | |
| | | | | | | | |
| Total investments in securities (Cost $8,618,972) | | | 100.65 | % | | | 9,527,834 | |
| | |
Other assets and liabilities, net | | | (0.65 | ) | | | (61,083 | ) |
| | | | | | | | |
| Total net assets | | | 100.00 | % | | $ | 9,466,751 | |
| | | | | | | | |
Futures Contracts
| | | | | | | | | | | | | | | | | | | | | | | | |
| Description | | Number of
contracts | | | Expiration
date | | | Notional
cost | | | Notional
value | | | Unrealized
gains | | | Unrealized
losses | |
| | | | | | |
Long | | | | | | | | | | | | | | | | | | | | | | | | |
| | | | | | |
NASDAQ 100 E-Mini Index | | | 1 | | | | 9-18-2020 | | | $ | 220,981 | | | $ | 242,280 | | | $ | 21,299 | | | $ | 0 | |
The accompanying notes are an integral part of these financial statements.
Target Date Retirement Funds | 41
Portfolio of investments—August 31, 2020 (unaudited)
DYNAMIC TARGET 2030 FUND
Transactions with the affiliated Master Portfolios were as follows:
| | | | | | | | | | | | | | | | | | | | | | | | | | | | | | | | | | | | |
| | | % of
ownership,
beginning
of period | | | % of
ownership,
end of
period | | | Net realized
gains
(losses) on
securities
transactions
allocated
from
affiliated
Master
Portfolios | | | Net
change in
unrealized
gains
(losses) on
securities
transactions
allocated
from
affiliated
Master
Portfolios | | | Interest
allocated
from
affiliated
Master
Portfolios | | | Dividends
allocated
from
affiliated
Master
Portfolios | | | Affiliated
income
allocated
from
affiliated
Master
Portfolios | | | Value,
end
of period | | | % of
net
assets | |
Affiliated Master Portfolios | | | | | | | | | | | | | | | | | | | | | | | | | | | | | | | | | | | | |
Wells Fargo Bloomberg Barclays US Aggregate ex-Corporate Portfolio | | | 0.23 | % | | | 0.26 | % | | $ | 19,943 | | | $ | 8,487 | | | $ | 10,192 | | | $ | 0 | | | $ | 29 | | | $ | 1,318,930 | | | | | |
Wells Fargo Emerging Markets Bond Portfolio | | | 0.30 | | | | 0.36 | | | | 230 | | | | (1,583 | ) | | | 2,419 | | | | 0 | | | | 1 | | | | 110,617 | | | | | |
Wells Fargo Factor Enhanced Emerging Markets Equity Portfolio | | | 0.13 | | | | 0.14 | | | | (42,935 | ) | | | 62,423 | | | | 4 | | | | 11,171 | | | | 19 | | | | 606,229 | | | | | |
Wells Fargo Factor Enhanced International Equity Portfolio | | | 0.16 | | | | 0.16 | | | | (47,468 | ) | | | 188,493 | | | | 10 | | | | 32,418 | | | | 66 | | | | 2,049,502 | | | | | |
Wells Fargo Factor Enhanced U.S. Large Cap Equity Portfolio | | | 0.18 | | | | 0.22 | | | | 142,838 | | | | 223,747 | | | | 19 | | | | 29,370 | | | | 158 | | | | 3,591,655 | | | | | |
Wells Fargo Factor Enhanced U.S. Small Cap Equity Portfolio | | | 0.19 | | | | 0.22 | | | | (69,758 | ) | | | 119,026 | | | | 7 | | | | 5,388 | | | | 44 | | | | 894,811 | | | | | |
Wells Fargo High Yield Corporate Bond Portfolio | | | 0.23 | | | | 0.07 | | | | (3,996 | ) | | | 2,531 | | | | 2,905 | | | | 0 | | | | 3 | | | | 110,777 | | | | | |
Wells Fargo Investment Grade Corporate Bond Portfolio | | | 0.30 | | | | 0.36 | | | | 4,553 | | | | 1,365 | | | | 9,830 | | | | 0 | | | | 4 | | | | 687,965 | | | | | |
Wells Fargo Strategic Retirement Bond Portfolio | | | 0.63 | | | | 0.73 | | | | 635 | | | | 871 | | | | 372 | | | | 0 | | | | 0 | | | | 64,455 | | | | | |
Wells Fargo U.S. REIT Portfolio | | | 1.09 | | | | 1.25 | | | | (5,616 | ) | | | (202 | ) | | | 0 | | | | 1,426 | | | | 1 | | | | 92,893 | | | | | |
| | | | | | | | | | | | | | | | | | | | | | | | | | | | | | | | | | | | |
| | | | | | | | | | $ | (1,574 | ) | | $ | 605,158 | | | $ | 25,758 | | | $ | 79,773 | | | $ | 325 | | | $ | 9,527,834 | | | | 100.65 | % |
| | | | | | | | | | | | | | | | | | | | | | | | | | | | | | | | | | | | |
The accompanying notes are an integral part of these financial statements.
42 | Target Date Retirement Funds
Portfolio of investments—August 31, 2020 (unaudited)
DYNAMIC TARGET 2035 FUND
| | | | | | | | |
| | | | | | Value | |
| Investment Companies: 100.66% | | | | | | |
| | |
| Affiliated Master Portfolios: 100.66% | | | | | | |
Wells Fargo Bloomberg Barclays US Aggregate ex-Corporate Portfolio | | | | | | $ | 1,012,052 | |
Wells Fargo Emerging Markets Bond Portfolio | | | | | | | 85,359 | |
Wells Fargo Factor Enhanced Emerging Markets Equity Portfolio | | | | | | | 630,497 | |
Wells Fargo Factor Enhanced International Equity Portfolio | | | | | | | 2,144,341 | |
Wells Fargo Factor Enhanced U.S. Large Cap Equity Portfolio | | | | | | | 3,595,621 | |
Wells Fargo Factor Enhanced U.S. Small Cap Equity Portfolio | | | | | | | 895,596 | |
Wells Fargo High Yield Corporate Bond Portfolio | | | | | | | 85,482 | |
Wells Fargo Investment Grade Corporate Bond Portfolio | | | | | | | 527,306 | |
| | |
Total Investment Companies (Cost $8,101,828) | | | | | | | 8,976,254 | |
| | | | | | | | |
| | | | | | | | |
| Total investments in securities (Cost $8,101,828) | | | 100.66 | % | | | 8,976,254 | |
| | |
Other assets and liabilities, net | | | (0.66 | ) | | | (59,228 | ) |
| | | | | | | | |
| Total net assets | | | 100.00 | % | | $ | 8,917,026 | |
| | | | | | | | |
Futures Contracts
| | | | | | | | | | | | | | | | | | | | | | | | |
| Description | | Number of
contracts | | | Expiration
date | | | Notional
cost | | | Notional
value | | | Unrealized
gains | | | Unrealized
losses | |
| | | | | | |
Long | | | | | | | | | | | | | | | | | | | | | | | | |
| | | | | | |
NASDAQ 100 E-Mini Index | | | 1 | | | | 9-18-2020 | | | $ | 220,981 | | | $ | 242,280 | | | $ | 21,299 | | | $ | 0 | |
The accompanying notes are an integral part of these financial statements.
Target Date Retirement Funds | 43
Portfolio of investments—August 31, 2020 (unaudited)
DYNAMIC TARGET 2035 FUND
Transactions with the affiliated Master Portfolios were as follows:
| | | | | | | | | | | | | | | | | | | | | | | | | | | | | | | | | | | | |
| | | % of
ownership,
beginning
of period | | | % of
ownership,
end of
period | | | Net realized
gains
(losses) on
securities
transactions
allocated
from
affiliated
Master
Portfolios | | | Net
change in
unrealized
gains
(losses) on
securities
transactions
allocated
from
affiliated
Master
Portfolios | | | Interest
allocated
from
affiliated
Master
Portfolios | | | Dividends
allocated
from
affiliated
Master
Portfolios | | | Affiliated
income
allocated
from
affiliated
Master
Portfolios | | | Value,
end
of period | | | % of
net
assets | |
Affiliated Master Portfolios | | | | | | | | | | | | | | | | | | | | | | | | | | | | | | | | | | | | |
Wells Fargo Bloomberg Barclays US Aggregate ex-Corporate Portfolio | | | 0.15 | % | | | 0.17 | % | | $ | 15,314 | | | $ | 1,134 | | | $ | 7,563 | | | $ | 0 | | | $ | 23 | | | $ | 1,012,052 | | | | | |
Wells Fargo Emerging Markets Bond Portfolio | | | 0.19 | | | | 0.24 | | | | 163 | | | | (1,140 | ) | | | 1,893 | | | | 0 | | | | 2 | | | | 85,359 | | | | | |
Wells Fargo Factor Enhanced Emerging Markets Equity Portfolio | | | 0.26 | | | | 0.30 | | | | (52,815 | ) | | | 65,698 | | | | 8 | | | | 9,685 | | | | 20 | | | | 630,497 | | | | | |
Wells Fargo Factor Enhanced International Equity Portfolio | | | 0.32 | | | | 0.34 | | | | (50,502 | ) | | | 202,146 | | | | 10 | | | | 30,348 | | | | 70 | | | | 2,144,341 | | | | | |
Wells Fargo Factor Enhanced U.S Large Cap Equity Portfolio | | | 0.32 | | | | 0.40 | | | | 147,898 | | | | 227,170 | | | | 20 | | | | 33,986 | | | | 146 | | | | 3,595,621 | | | | | |
Wells Fargo Factor Enhanced U.S. Small Cap Equity Portfolio | | | 0.33 | | | | 0.40 | | | | (67,730 | ) | | | 121,615 | | | | 7 | | | | 6,679 | | | | 45 | | | | 895,596 | | | | | |
Wells Fargo High Yield Corporate Bond Portfolio | | | 0.14 | | | | 0.05 | | | | (3,141 | ) | | | 2,125 | | | | 2,264 | | | | 0 | | | | 2 | | | | 85,482 | | | | | |
Wells Fargo Investment Grade Corporate Bond Portfolio | | | 0.19 | | | | 0.24 | | | | 3,411 | | | | 2,873 | | | | 7,908 | | | | 0 | | | | 3 | | | | 527,306 | | | | | |
| | | | | | | | | | | | | | | | | | | | | | | | | | | | | | | | | | | | |
| | | | | | | | | | $ | (7,402 | ) | | $ | 621,621 | | | $ | 19,673 | | | $ | 80,698 | | | $ | 311 | | | $ | 8,976,254 | | | | 100.66 | % |
| | | | | | | | | | | | | | | | | | | | | | | | | | | | | | | | | | | | |
The accompanying notes are an integral part of these financial statements.
44 | Target Date Retirement Funds
Portfolio of investments—August 31, 2020 (unaudited)
DYNAMIC TARGET 2040 FUND
| | | | | | | | |
| | | | | | Value | |
| Investment Companies: 100.38% | | | | | | |
| | |
| Affiliated Master Portfolios: 100.38% | | | | | | |
Wells Fargo Bloomberg Barclays US Aggregate ex-Corporate Portfolio | | | | | | $ | 717,177 | |
Wells Fargo Emerging Markets Bond Portfolio | | | | | | | 60,486 | |
Wells Fargo Factor Enhanced Emerging Markets Equity Portfolio | | | | | | | 662,476 | |
Wells Fargo Factor Enhanced International Equity Portfolio | | | | | | | 2,236,252 | |
Wells Fargo Factor Enhanced U.S. Large Cap Equity Portfolio | | | | | | | 3,614,321 | |
Wells Fargo Factor Enhanced U.S. Small Cap Equity Portfolio | | | | | | | 901,482 | |
Wells Fargo High Yield Corporate Bond Portfolio | | | | | | | 60,558 | |
Wells Fargo Investment Grade Corporate Bond Portfolio | | | | | | | 373,673 | |
| | |
Total Investment Companies (Cost $7,743,253) | | | | | | | 8,626,425 | |
| | | | | | | | |
| | | | | | | | |
| Total investments in securities (Cost $7,743,253) | | | 100.38 | % | | | 8,626,425 | |
| | |
Other assets and liabilities, net | | | (0.38 | ) | | | (32,499 | ) |
| | | | | | | | |
| Total net assets | | | 100.00 | % | | $ | 8,593,926 | |
| | | | | | | | |
Futures Contracts
| | | | | | | | | | | | | | | | | | | | | | | | |
| Description | | Number of
contracts | | | Expiration
date | | | Notional
cost | | | Notional
value | | | Unrealized
gains | | | Unrealized
losses | |
| | | | | | |
Long | | | | | | | | | | | | | | | | | | | | | | | | |
| | | | | | |
NASDAQ 100 E-Mini Index | | | 1 | | | | 9-18-2020 | | | $ | 220,981 | | | $ | 242,280 | | | $ | 21,299 | | | $ | 0 | |
The accompanying notes are an integral part of these financial statements.
Target Date Retirement Funds | 45
Portfolio of investments—August 31, 2020 (unaudited)
DYNAMIC TARGET 2040 FUND
Transactions with the affiliated Master Portfolios were as follows:
| | | | | | | | | | | | | | | | | | | | | | | | | | | | | | | | | | | | |
| | | % of
ownership,
beginning
of period | | | % of
ownership,
end of
period | | | Net realized
gains
(losses) on
securities
transactions
allocated
from
affiliated
Master
Portfolios | | | Net
change in
unrealized
gains
(losses) on
securities
transactions
allocated
from
affiliated
Master
Portfolios | | | Interest
allocated
from
affiliated
Master
Portfolios | | | Dividends
allocated
from
affiliated
Master
Portfolios | | | Affiliated
income
allocated
from
affiliated
Master
Portfolios | | | Value,
end of period | | | % of net
assets | |
Affiliated Master Portfolios | | | | | | | | | | | | | | | | | | | | | | | | | | | | | | | | | | | | |
Wells Fargo Bloomberg Barclays US Aggregate ex-Corporate Portfolio | | | 0.10 | % | | | 0.12 | % | | $ | 10,491 | | | $ | (977 | ) | | $ | 5,026 | | | $ | 0 | | | $ | 16 | | | $ | 717,177 | | | | | |
Wells Fargo Emerging Markets Bond Portfolio | | | 0.12 | | | | 0.17 | | | | 131 | | | | (546 | ) | | | 1,293 | | | | 0 | | | | 0 | | | | 60,486 | | | | | |
Wells Fargo Factor Enhanced Emerging Markets Equity Portfolio | | | 0.25 | | | | 0.32 | | | | (45,379 | ) | | | 54,511 | | | | 5 | | | | 9,786 | | | | 21 | | | | 662,476 | | | | | |
Wells Fargo Factor Enhanced International Equity Portfolio | | | 0.31 | | | | 0.35 | | | | (49,949 | ) | | | 219,213 | | | | 10 | | | | 30,554 | | | | 69 | | | | 2,236,252 | | | | | |
Wells Fargo Factor Enhanced U.S. Large Cap Equity Portfolio | | | 0.30 | | | | 0.41 | | | | 141,241 | | | | 253,793 | | | | 19 | | | | 32,991 | | | | 149 | | | | 3,614,321 | | | | | |
Wells Fargo Factor Enhanced U.S. Small Cap Equity Portfolio | | | 0.31 | | | | 0.40 | | | | (67,530 | ) | | | 130,296 | | | | 6 | | | | 6,464 | | | | 43 | | | | 901,482 | | | | | |
Wells Fargo High Yield Corporate Bond Portfolio | | | 0.10 | | | | 0.03 | | | | (2,106 | ) | | | 1,748 | | | | 1,552 | | | | 0 | | | | 1 | | | | 60,558 | | | | | |
Wells Fargo Investment Grade Corporate Bond Portfolio | | | 0.13 | | | | 0.17 | | | | 2,330 | | | | 2,525 | | | | 5,401 | | | | 0 | | | | 2 | | | | 373,673 | | | | | |
| | | | | | | | | | | | | | | | | | | | | | | | | | | | | | | | | | | | |
| | | | | | | | | | $ | (10,771 | ) | | $ | 660,563 | | | $ | 13,312 | | | $ | 79,795 | | | $ | 301 | | | $ | 8,626,425 | | | | 100.38 | % |
| | | | | | | | | | | | | | | | | | | | | | | | | | | | | | | | | | | | |
The accompanying notes are an integral part of these financial statements.
46 | Target Date Retirement Funds
Portfolio of investments—August 31, 2020 (unaudited)
DYNAMIC TARGET 2045 FUND
| | | | | | | | | | | | |
| | | | | | | | | | Value | |
| Investment Companies: 100.37% | | | | | | | | | | |
| | | | |
| Affiliated Master Portfolios: 100.37% | | | | | | | | | | |
Wells Fargo Bloomberg Barclays US Aggregate ex-Corporate Portfolio | | | | | | | | | | $ | 370,655 | |
Wells Fargo Emerging Markets Bond Portfolio | | | | | | | | | | | 31,235 | |
Wells Fargo Factor Enhanced Emerging Markets Equity Portfolio | | | | | | | | | | | 569,836 | |
Wells Fargo Factor Enhanced International Equity Portfolio | | | | | | | | | | | 1,927,602 | |
Wells Fargo Factor Enhanced U.S. Large Cap Equity Portfolio | | | | | | | | | | | 3,056,448 | |
Wells Fargo Factor Enhanced U.S. Small Cap Equity Portfolio | | | | | | | | | | | 760,644 | |
Wells Fargo High Yield Corporate Bond Portfolio | | | | | | | | | | | 31,151 | |
Wells Fargo Investment Grade Corporate Bond Portfolio | | | | | | | | | | | 193,807 | |
| |
Total Investment Companies (Cost $6,181,364) | | | | 6,941,378 | |
| | | | | | | | | | | | |
| | | | | | | | |
| Total investments in securities (Cost $6,181,364) | | | 100.37 | % | | | 6,941,378 | |
| | |
Other assets and liabilities, net | | | (0.37 | ) | | | (25,696 | ) |
| | | | | | | | |
| Total net assets | | | 100.00 | % | | $ | 6,915,682 | |
| | | | | | | | |
Futures Contracts
| | | | | | | | | | | | | | | | | | | | | | | | |
| Description | | Number of
contracts | | | Expiration
date | | | Notional
cost | | | Notional
value | | | Unrealized
gains | | | Unrealized
losses | |
| | | | | | |
Long | | | | | | | | | | | | | | | | | | | | | | | | |
| | | | | | |
NASDAQ 100 E-Mini Index | | | 1 | | | | 9-18-2020 | | | $ | 220,981 | | | $ | 242,280 | | | $ | 21,299 | | | $ | 0 | |
The accompanying notes are an integral part of these financial statements.
Target Date Retirement Funds | 47
Portfolio of investments—August 31, 2020 (unaudited)
DYNAMIC TARGET 2045 FUND
Transactions with the affiliated Master Portfolios were as follows:
| | | | | | | | | | | | | | | | | | | | | | | | | | | | | | | | | | | | |
| | | % of
ownership,
beginning
of period | | | % of
ownership,
end of
period | | | Net realized
gains
(losses) on
securities
transactions
allocated
from
affiliated
Master
Portfolios | | | Net
change in
unrealized
gains
(losses) on
securities
transactions
allocated
from
affiliated
Master
Portfolios | | | Interest
allocated
from
affiliated
Master
Portfolios | | | Dividends
allocated
from
affiliated
Master
Portfolios | | | Affiliated
income
allocated
from
affiliated
Master
Portfolios | | | Value,
end of period | | | % of net
assets | |
Affiliated Master Portfolios | | | | | | | | | | | | | | | | | | | | | | | | | | | | | | | | | | | | |
Wells Fargo Bloomberg Barclays US Aggregate ex-Corporate Portfolio | | | 0.05 | % | | | 0.06 | % | | $ | 6,283 | | | $ | (17,529 | ) | | $ | 2,600 | | | $ | 0 | | | $ | 8 | | | $ | 370,655 | | | | | |
Wells Fargo Emerging Markets Bond Portfolio | | | 0.07 | | | | 0.09 | | | | 115 | | | | (784 | ) | | | 690 | | | | 0 | | | | 0 | | | | 31,235 | | | | | |
Wells Fargo Factor Enhanced Emerging Markets Equity Portfolio | | | 0.24 | | | | 0.27 | | | | (40,003 | ) | | | 558,820 | | | | 4 | | | | 8,723 | | | | 19 | | | | 569,836 | | | | | |
Wells Fargo Factor Enhanced International Equity Portfolio | | | 0.29 | | | | 0.30 | | | | (42,318 | ) | | | (74,327 | ) | | | 10 | | | | 27,140 | | | | 63 | | | | 1,927,602 | | | | | |
Wells Fargo Factor Enhanced U.S. Large Cap Equity Portfolio | | | 0.28 | | | | 0.34 | | | | 124,686 | | | | 2,303 | | | | 17 | | | | 28,686 | | | | 119 | | | | 3,056,448 | | | | | |
Wells Fargo Factor Enhanced U.S. Small Cap Equity Portfolio | | | 0.29 | | | | 0.34 | | | | (58,714 | ) | | | 58,391 | | | | 6 | | | | 5,632 | | | | 39 | | | | 760,644 | | | | | |
Wells Fargo High Yield Corporate Bond Portfolio | | | 0.05 | | | | 0.02 | | | | (1,080 | ) | | | 291 | | | | 826 | | | | 0 | | | | 1 | | | | 31,151 | | | | | |
Wells Fargo Investment Grade Corporate Bond Portfolio | | | 0.07 | | | | 0.09 | | | | 1,622 | | | | (15,073 | ) | | | 2,880 | | | | 0 | | | | 1 | | | | 193,807 | | | | | |
| | | | | | | | | | | | | | | | | | | | | | | | | | | | | | | | | | | | |
| | | | | | | | | | $ | (9,409 | ) | | $ | 512,092 | | | $ | 7,033 | | | $ | 70,181 | | | $ | 250 | | | $ | 6,941,378 | | | | 100.37 | % |
| | | | | | | | | | | | | | | | | | | | | | | | | | | | | | | | | | | | |
The accompanying notes are an integral part of these financial statements.
48 | Target Date Retirement Funds
Portfolio of investments—August 31, 2020 (unaudited)
DYNAMIC TARGET 2050 FUND
| | | | | | | | | | | | | | | | |
| | | | | | | | | | | | Value | |
| Investment Companies: 100.32% | | | | | | | | | | | | |
| | | | |
| Affiliated Master Portfolios: 100.32% | | | | | | | | | | | | |
Wells Fargo Bloomberg Barclays US Aggregate ex-Corporate Portfolio | | | | | | | | | | | | | | $ | 180,855 | |
Wells Fargo Emerging Markets Bond Portfolio | | | | | | | | | | | | | | | 15,249 | |
Wells Fargo Factor Enhanced Emerging Markets Equity Portfolio | | | | | | | | | | | | | | | 526,194 | |
Wells Fargo Factor Enhanced International Equity Portfolio | | | | | | | | | | | | | | | 1,783,066 | |
Wells Fargo Factor Enhanced U.S. Large Cap Equity Portfolio | | | | | | | | | | | | | | | 2,778,777 | |
Wells Fargo Factor Enhanced U.S. Small Cap Equity Portfolio | | | | | | | | | | | | | | | 691,801 | |
Wells Fargo High Yield Corporate Bond Portfolio | | | | | | | | | | | | | | | 15,173 | |
Wells Fargo Investment Grade Corporate Bond Portfolio | | | | | | | | | | | | | | | 94,474 | |
| |
Total Investment Companies (Cost $5,379,345) | | | | 6,085,589 | |
| | | | | | | | | | | | | | | | |
| | | | | | | | |
| Total investments in securities (Cost $5,379,345) | | | 100.32 | % | | | 6,085,589 | |
| | |
Other assets and liabilities, net | | | (0.32 | ) | | | (19,587 | ) |
| | | | | | | | |
| Total net assets | | | 100.00 | % | | $ | 6,066,002 | |
| | | | | | | | |
Futures Contracts
| | | | | | | | | | | | | | | | | | | | | | | | |
| Description | | Number of
contracts | | | Expiration
date | | | Notional
cost | | | Notional
value | | | Unrealized
gains | | | Unrealized
losses | |
| | | | | | |
Short | | | | | | | | | | | | | | | | | | | | | | | | |
| | | | | | |
NASDAQ 100 E-Mini Index | | | 1 | | | | 9-18-2020 | | | $ | 220,981 | | | $ | 242,280 | | | $ | 21,299 | | | $ | 0 | |
The accompanying notes are an integral part of these financial statements.
Target Date Retirement Funds | 49
Portfolio of investments—August 31, 2020 (unaudited)
DYNAMIC TARGET 2050 FUND
Transactions with the affiliated Master Portfolios were as follows:
| | | | | | | | | | | | | | | | | | | | | | | | | | | | | | | | | | | | |
| | | % of
ownership,
beginning
of period | | | % of
ownership,
end of
period | | | Net realized
gains
(losses) on
securities
transactions
allocated
from
affiliated
Master
Portfolios | | | Net
change in
unrealized
gains
(losses) on
securities
transactions
allocated
from
affiliated
Master
Portfolios | | | Interest
allocated
from
affiliated
Master
Portfolios | | | Dividends
allocated
from
affiliated
Master
Portfolios | | | Affiliated
income
allocated
from
affiliated
Master
Portfolios | | | Value,
end of period | | | % of net
assets | |
Affiliated Master Portfolios | | | | | | | | | | | | | | | | | | | | | | | | | | | | | | | | | | | | |
Wells Fargo Bloomberg Barclays US Aggregate ex-Corporate Portfolio | | | 0.03 | % | | | 0.03 | % | | $ | 2,778 | | | $ | 5,145 | | | $ | 1,294 | | | $ | 0 | | | $ | 4 | | | $ | 180,855 | | | | | |
Wells Fargo Emerging Markets Bond Portfolio | | | 0.03 | | | | 0.04 | | | | 32 | | | | (237 | ) | | | 337 | | | | 0 | | | | 0 | | | | 15,249 | | | | | |
Wells Fargo Factor Enhanced Emerging Markets Equity Portfolio | | | 0.22 | | | | 0.25 | | | | (37,773 | ) | | | 52,317 | | | | 4 | | | | 8,086 | | | | 18 | | | | 526,194 | | | | | |
Wells Fargo Factor Enhanced International Equity Portfolio | | | 0.27 | | | | 0.28 | | | | (41,769 | ) | | | 149,948 | | | | 9 | | | | 25,150 | | | | 62 | | | | 1,783,066 | | | | | |
Wells Fargo Factor Enhanced U.S. Large Cap Equity Portfolio | | | 0.25 | | | | 0.31 | | | | 108,859 | | | | 165,548 | | | | 16 | | | | 26,113 | | | | 120 | | | | 2,778,777 | | | | | |
Wells Fargo Factor Enhanced U.S. Small Cap Equity Portfolio | | | 0.27 | | | | 0.31 | | | | (54,480 | ) | | | 91,110 | | | | 5 | | | | 5,126 | | | | 36 | | | | 691,801 | | | | | |
Wells Fargo High Yield Corporate Bond Portfolio | | | 0.03 | | | | 0.01 | | | | (558 | ) | | | 358 | | | | 404 | | | | 0 | | | | 0 | | | | 15,173 | | | | | |
Wells Fargo Investment Grade Corporate Bond Portfolio | | | 0.04 | | | | 0.04 | | | | 646 | | | | 180 | | | | 1,306 | | | | 0 | | | | 1 | | | | 94,474 | | | | | |
| | | | | | | | | | | | | | | | | | | | | | | | | | | | | | | | | | | | |
| | | | | | | | | | $ | (22,265 | ) | | $ | 464,369 | | | $ | 3,375 | | | $ | 64,475 | | | $ | 241 | | | $ | 6,085,589 | | | | 100.32 | % |
| | | | | | | | | | | | | | | | | | | | | | | | | | | | | | | | | | | | |
The accompanying notes are an integral part of these financial statements.
50 | Target Date Retirement Funds
Portfolio of investments—August 31, 2020 (unaudited)
DYNAMIC TARGET 2055 FUND
| | | | | | | | | | | | | | | | |
| | | | | | | | | | | | Value | |
Investment Companies: 100.21% | | | | | | | | | | | | | | | | |
| | | | |
| Affiliated Master Portfolios: 100.21% | | | | | | | | | | | | |
Wells Fargo Bloomberg Barclays US Aggregate ex-Corporate Portfolio | | | | | | | | | | | | | | $ | 187,368 | |
Wells Fargo Emerging Markets Bond Portfolio | | | | | | | | | | | | | | | 15,791 | |
Wells Fargo Factor Enhanced Emerging Markets Equity Portfolio | | | | | | | | | | | | | | | 543,831 | |
Wells Fargo Factor Enhanced International Equity Portfolio | | | | | | | | | | | | | | | 1,842,810 | |
Wells Fargo Factor Enhanced U.S. Large Cap Equity Portfolio | | | | | | | | | | | | | | | 2,872,748 | |
Wells Fargo Factor Enhanced U.S. Small Cap Equity Portfolio | | | | | | | | | | | | | | | 714,991 | |
Wells Fargo High Yield Corporate Bond Portfolio | | | | | | | | | | | | | | | 15,726 | |
Wells Fargo Investment Grade Corporate Bond Portfolio | | | | | | | | | | | | | | | 97,876 | |
| | | | |
Total Investment Companies (Cost $ 5,572,842) | | | | | | | | | | | | | | | 6,291,141 | |
| | | | | | | | | | | | | | | | |
| | | | | | | | |
| Total investments in securities (Cost $5,572,842) | | | 100.21 | % | | | 6,291,141 | |
| | |
Other assets and liabilities, net | | | (0.21 | ) | | | (13,457 | ) |
| | | | | | | | |
| Total net assets | | | 100.00 | % | | $ | 6,277,684 | |
| | | | | | | | |
Futures Contracts
| | | | | | | | | | | | | | | | | | | | | | | | |
| Description | | Number of
contracts | | | Expiration
date | | | Notional
cost | | | Notional
value | | | Unrealized
gains | | | Unrealized
losses | |
| | | | | | |
Long | | | | | | | | | | | | | | | | | | | | | | | | |
| | | | | | |
NASDAQ 100 E-Mini Index | | | 1 | | | | 9-18-2020 | | | $ | 220,981 | | | $ | 242,280 | | | $ | 21,299 | | | $ | 0 | |
The accompanying notes are an integral part of these financial statements.
Target Date Retirement Funds | 51
Portfolio of investments—August 31, 2020 (unaudited)
DYNAMIC TARGET 2055 FUND
Transactions with the affiliated Master Portfolios were as follows:
| | | | | | | | | | | | | | | | | | | | | | | | | | | | | | | | | | | | |
| | | % of
ownership,
beginning
of period | | | % of
ownership,
end of
period | | | Net realized
gains
(losses) on
securities
transactions
allocated
from
affiliated
Master
Portfolios | | | Net change in
unrealized
gains
(losses) on
securities
transactions
allocated
from
affiliated
Master
Portfolios | | | Interest
allocated
from
affiliated
Master
Portfolios | | | Dividends
allocated
from
affiliated
Master
Portfolios | | | Affiliated
income
allocated
from
affiliated
Master
Portfolios | | | Value,
end of period | | | % of
net
assets | |
Affiliated Master Portfolios | | | | | | | | | | | | | | | | | | | | | | | | | | | | | | | | | | | | |
Wells Fargo Bloomberg Barclays US Aggregate ex-Corporate Portfolio | | | 0.03 | % | | | 0.03 | % | | $ | 2,844 | | | $ | 5,175 | | | $ | 1,351 | | | $ | 0 | | | $ | 4 | | | $ | 187,368 | | | | | |
Wells Fargo Emerging Markets Bond Portfolio | | | 0.04 | | | | 0.04 | | | | 33 | | | | (235 | ) | | | 347 | | | | 0 | | | | 0 | | | | 15,791 | | | | | |
Wells Fargo Factor Enhanced Emerging Markets Equity Portfolio | | | 0.23 | | | | 0.26 | | | | (38,825 | ) | | | 54,412 | | | | 4 | | | | 8,312 | | | | 18 | | | | 543,831 | | | | | |
Wells Fargo Factor Enhanced International Equity Portfolio | | | 0.28 | | | | 0.29 | | | | (43,042 | ) | | | 156,485 | | | | 9 | | | | 25,888 | | | | 60 | | | | 1,842,810 | | | | | |
Wells Fargo Factor Enhanced U.S. Large Cap Equity Portfolio | | | 0.26 | | | | 0.32 | | | | 112,497 | | | | 170,487 | | | | 16 | | | | 26,901 | | | | 128 | | | | 2,872,748 | | | | | |
Wells Fargo Factor Enhanced U.S. Small Cap Equity Portfolio | | | 0.27 | | | | 0.32 | | | | (56,225 | ) | | | 95,897 | | | | 5 | | | | 5,281 | | | | 36 | | | | 714,991 | | | | | |
Wells Fargo High Yield Corporate Bond Portfolio | | | 0.03 | | | | 0.01 | | | | (574 | ) | | | 367 | | | | 417 | | | | 0 | | | | 1 | | | | 15,726 | | | | | |
Wells Fargo Investment Grade Corporate Bond Portfolio | | | 0.04 | | | | 0.04 | | | | 657 | | | | 253 | | | | 1,339 | | | | 0 | | | | 1 | | | | 97,876 | | | | | |
| | | | | | | | | | | | | | | | | | | | | | | | | | | | | | | | | | | | |
| | | | | | | | | | $ | (22,635 | ) | | $ | 482,841 | | | $ | 3,488 | | | $ | 66,382 | | | $ | 248 | | | $ | 6,291,141 | | | | 100.21 | % |
| | | | | | | | | | | | | | | | | | | | | | | | | | | | | | | | | | | | |
The accompanying notes are an integral part of these financial statements.
52 | Target Date Retirement Funds
Portfolio of investments—August 31, 2020 (unaudited)
DYNAMIC TARGET 2060 FUND
| | | | | | | | | | | | | | | | |
| | | | | | | | | | | | Value | |
Investment Companies: 100.56% | | | | | | | | | | | | | | | | |
| | | | |
| Affiliated Master Portfolios: 100.56% | | | | | | | | | | | | |
Wells Fargo Bloomberg Barclays US Aggregate ex-Corporate Portfolio | | | | | | | | | | | | | | $ | 172,450 | |
Wells Fargo Emerging Markets Bond Portfolio | | | | | | | | | | | | | | | 14,541 | |
Wells Fargo Factor Enhanced Emerging Markets Equity Portfolio | | | | | | | | | | | | | | | 502,041 | |
Wells Fargo Factor Enhanced International Equity Portfolio | | | | | | | | | | | | | | | 1,701,195 | |
Wells Fargo Factor Enhanced U.S. Large Cap Equity Portfolio | | | | | | | | | | | | | | | 2,650,850 | |
Wells Fargo Factor Enhanced U.S. Small Cap Equity Portfolio | | | | | | | | | | | | | | | 660,047 | |
Wells Fargo High Yield Corporate Bond Portfolio | | | | | | | | | | | | | | | 14,534 | |
Wells Fargo Investment Grade Corporate Bond Portfolio | | | | | | | | | | | | | | | 90,164 | |
Wells Fargo U.S. REIT Portfolio | | | | | | | | | | | | | | | 5,569 | |
| | | | |
Total Investment Companies (Cost $5,126,280) | | | | | | | | | | | | | | | 5,811,391 | |
| | | | | | | | | | | | | | | | |
| | | | | | | | |
| Total investments in securities (Cost $5,126,280) | | | 100.56 | % | | | 5,811,391 | |
| | |
Other assets and liabilities, net | | | (0.56 | ) | | | (32,088 | ) |
| | | | | | | | |
| Total net assets | | | 100.00 | % | | $ | 5,779,303 | |
| | | | | | | | |
Futures Contracts
| | | | | | | | | | | | | | | | | | | | | | | | |
| Description | | Number of
contracts | | | Expiration
date | | | Notional
cost | | | Notional
value | | | Unrealized
gains | | | Unrealized
losses | |
| | | | | | |
Short | | | | | | | | | | | | | | | | | | | | | | | | |
| | | | | | |
NASDAQ 100 E-Mini Index | | | 1 | | | | 9-18-2020 | | | $ | 220,981 | | | $ | 242,280 | | | $ | 21,299 | | | $ | 0 | |
The accompanying notes are an integral part of these financial statements.
Target Date Retirement Funds | 53
Portfolio of investments—August 31, 2020 (unaudited)
DYNAMIC TARGET 2060 FUND
Transactions with the affiliated Master Portfolios were as follows:
| | | | | | | | | | | | | | | | | | | | | | | | | | | | | | | | | | | | |
| | | % of
ownership,
beginning
of period | | | % of
ownership,
end of
period | | | Net realized
gains
(losses) on
securities
transactions
allocated
from
affiliated
Master
Portfolios | | | Net change in
unrealized
gains
(losses) on
securities
transactions
allocated
from
affiliated
Master
Portfolios | | | Interest
allocated
from
affiliated
Master
Portfolios | | | Dividends
allocated
from
affiliated
Master
Portfolios | | | Affiliated
income
allocated
from
affiliated
Master
Portfolios | | | Value,
end
of period | | | % of
net
assets | |
Affiliated Master Portfolios | | | | | | | | | | | | | | | | | | | | | | | | | | | | | | | | | | | | |
Wells Fargo Bloomberg Barclays US Aggregate ex-Corporate Portfolio | | | 0.03 | % | | | 0.03 | % | | $ | 2,671 | | | $ | (487 | ) | | $ | 1,250 | | | $ | 0 | | | $ | 4 | | | $ | 172,450 | | | | | |
Wells Fargo Emerging Markets Bond Portfolio | | | 0.03 | | | | 0.04 | | | | 31 | | | | (236 | ) | | | 323 | | | | 0 | | | | 0 | | | | 14,541 | | | | | |
Wells Fargo Factor Enhanced Emerging Markets Equity Portfolio | | | 0.22 | | | | 0.24 | | | | (36,309 | ) | | | 48,835 | | | | 4 | | | | 7,736 | | | | 17 | | | | 502,041 | | | | | |
Wells Fargo Factor Enhanced International Equity Portfolio | | | 0.27 | | | | 0.27 | | | | (40,311 | ) | | | 144,862 | | | | 9 | | | | 24,143 | | | | 57 | | | | 1,701,195 | | | | | |
Wells Fargo Factor Enhanced U.S Large Cap Equity Portfolio | | | 0.25 | | | | 0.30 | | | | 103,659 | | | | 154,666 | | | | 15 | | | | 25,020 | | | | 121 | | | | 2,650,850 | | | | | |
Wells Fargo Factor Enhanced U.S. Small Cap Equity Portfolio | | | 0.26 | | | | 0.30 | | | | (52,173 | ) | | | 84,215 | | | | 5 | | | | 4,919 | | | | 34 | | | | 660,047 | | | | | |
Wells Fargo High Yield Corporate Bond Portfolio | | | 0.03 | | | | 0.01 | | | | (534 | ) | | | 331 | | | | 388 | | | | 103 | | | | 0 | | | | 14,534 | | | | | |
Wells Fargo Investment Grade Corporate Bond Portfolio | | | 0.03 | | | | 0.04 | | | | 626 | | | | 184 | | | | 1,238 | | | | 0 | | | | 1 | | | | 90,164 | | | | | |
Wells Fargo U.S. REIT Portfolio | | | 0.02 | | | | 0.02 | | | | (369 | ) | | | (389 | ) | | | 0 | | | | 0 | | | | 0 | | | | 5,569 | | | | | |
| | | | | | | | | | | | | | | | | | | | | | | | | | | | | | | | | | | | |
| | | | | | | | | | $ | (22,709 | ) | | $ | 431,981 | | | $ | 3,232 | | | $ | 61,921 | | | $ | 234 | | | $ | 5,811,391 | | | | 100.56 | % |
| | | | | | | | | | | | | | | | | | | | | | | | | | | | | | | | | | | | |
The accompanying notes are an integral part of these financial statements.
54 | Target Date Retirement Funds
This page is intentionally left blank.
Statements of assets and liabilities—August 31, 2020 (unaudited)
| | | | | | | | |
| | | Dynamic Target
Today Fund | | | Dynamic Target
2015 Fund | |
| | |
Assets | | | | | | | | |
Investments in affiliated Master Portfolios, at value (see cost below) | | $ | 7,179,024 | | | $ | 5,985,986 | |
Cash | | | 10,000 | | | | 10,000 | |
Segregated cash for futures contracts | | | 23,996 | | | | 23,996 | |
Receivable for Fund shares sold | | | 2,445 | | | | 0 | |
Receivable for daily variation margin on open futures contracts | | | 2,507 | | | | 2,442 | |
Prepaid expenses and other assets | | | 75,398 | | | | 59,555 | |
| | | | |
Total assets | | | 7,293,370 | | | | 6,081,979 | |
| | | | |
| | |
Liabilities | | | | | | | | |
Management fee payable | | | 40,381 | | | | 39,650 | |
Administration fees payable | | | 349 | | | | 245 | |
Distribution fee payable | | | 12 | | | | 11 | |
Shareholder report expenses payable | | | 47,212 | | | | 42,066 | |
Custody and accounting fees payable | | | 4,758 | | | | 4,573 | |
Professional fees payable | | | 23,002 | | | | 23,253 | |
Trustees’ fees and expenses payable | | | 4,399 | | | | 4,459 | |
Accrued expenses and other liabilities | | | 289 | | | | 230 | |
| | | | |
Total liabilities | | | 120,402 | | | | 114,487 | |
| | | | |
Total net assets | | $ | 7,172,968 | | | $ | 5,967,492 | |
| | | | |
| | |
Net assets consist of | | | | | | | | |
Paid-in capital | | $ | 6,370,939 | | | $ | 5,293,230 | |
Total distributable earnings | | | 802,029 | | | | 674,262 | |
| | | | |
Total net assets | | $ | 7,172,968 | | | $ | 5,967,492 | |
| | | | |
| | |
Computation of net asset value and offering price per share | | | | | | | | |
Net assets – Class A | | $ | 941,134 | | | $ | 480,310 | |
Shares outstanding – Class A1 | | | 83,572 | | | | 43,432 | |
Net asset value per share – Class A | | | $11.26 | | | | $11.06 | |
Maximum offering price per share – Class A2 | | | $11.95 | | | | $11.73 | |
Net assets – Class C | | $ | 115,258 | | | $ | 113,281 | |
Shares outstanding – Class C1 | | | 10,163 | | | | 10,180 | |
Net asset value per share – Class C | | | $11.34 | | | | $11.13 | |
Net assets – Class R4 | | $ | 116,075 | | | $ | 114,022 | |
Share outstanding – Class R41 | | | 10,279 | | | | 10,296 | |
Net asset value per share – Class R4 | | | $11.29 | | | | $11.07 | |
Net assets – Class R6 | | $ | 6,000,501 | | | $ | 5,259,879 | |
Shares outstanding – Class R61 | | | 530,809 | | | | 474,416 | |
Net asset value per share – Class R6 | | | $11.30 | | | | $11.09 | |
| | |
Investments in affiliated Master Portfolios, at cost | | $ | 6,615,650 | | | $ | 5,433,648 | |
| | | | |
| 1 | Each Fund has an unlimited number of authorized shares. |
| 2 | Maximum offering price is computed as 100/94.25 of net asset value. On investments of $50,000 or more, the offering price is reduced. |
The accompanying notes are an integral part of these financial statements.
56 | Target Date Retirement Funds
Statements of assets and liabilities—August 31, 2020 (unaudited)
| | | | | | | | | | | | | | | | | | | | | | | | | | |
Dynamic Target
2020 Fund | | | Dynamic Target
2025 Fund | | | Dynamic Target
2030 Fund | | | Dynamic Target
2035 Fund | | | Dynamic Target
2040 Fund | | | Dynamic Target
2045 Fund | | | Dynamic Target
2050 Fund | |
| | | | | | |
| | | | | | | | | | | | | | | | | | | | | | | | | | |
| $ | 7,080,675 | | | $ | 10,307,135 | | | $ | 9,527,834 | | | $ | 8,976,254 | | | $ | 8,626,425 | | | $ | 6,941,378 | | | $ | 6,085,589 | |
| | 10,000 | | | | 10,000 | | | | 10,000 | | | | 10,000 | | | | 10,000 | | | | 10,000 | | | | 10,000 | |
| | 18,996 | | | | 17,992 | | | | 21,992 | | | | 21,992 | | | | 27,992 | | | | 20,994 | | | | 31,993 | |
| | 1,413 | | | | 5,063 | | | | 5,319 | | | | 6,484 | | | | 3,081 | | | | 4,412 | | | | 3,953 | |
| | 2,449 | | | | 2,786 | | | | 3,212 | | | | 3,201 | | | | 3,380 | | | | 2,451 | | | | 2,447 | |
| | 69,750 | | | | 5,993 | | | | 21,605 | | | | 21,739 | | | | 18,921 | | | | 46,155 | | | | 33,958 | |
| | |
| | 7,183,283 | | | | 10,348,969 | | | | 9,589,962 | | | | 9,039,670 | | | | 8,689,799 | | | | 7,025,390 | | | | 6,167,940 | |
| | |
| | | | | | |
| | | | | | | | | | | | | | | | | | | | | | | | | | |
| | 38,923 | | | | 34,074 | | | | 35,655 | | | | 35,539 | | | | 32,649 | | | | 32,256 | | | | 33,576 | |
| | 404 | | | | 760 | | | | 705 | | | | 395 | | | | 673 | | | | 277 | | | | 219 | |
| | 32 | | | | 23 | | | | 14 | | | | 18 | | | | 16 | | | | 24 | | | | 21 | |
| | 42,582 | | | | 44,515 | | | | 45,342 | | | | 45,745 | | | | 31,145 | | | | 45,370 | | | | 49,924 | |
| | 4,010 | | | | 4,450 | | | | 4,446 | | | | 4,265 | | | | 4,946 | | | | 4,029 | | | | 4,824 | |
| | 15,524 | | | | 31,651 | | | | 31,608 | | | | 31,772 | | | | 20,948 | | | | 23,091 | | | | 8,004 | |
| | 4,459 | | | | 4,500 | | | | 4,570 | | | | 4,570 | | | | 4,753 | | | | 4,459 | | | | 4,437 | |
| | 465 | | | | 110 | | | | 871 | | | | 340 | | | | 743 | | | | 202 | | | | 933 | |
| | |
| | 106,399 | | | | 120,083 | | | | 123,211 | | | | 122,644 | | | | 95,873 | | | | 109,708 | | | | 101,938 | |
| | |
| $ | 7,076,884 | | | $ | 10,228,886 | | | $ | 9,466,751 | | | $ | 8,917,026 | | | $ | 8,593,926 | | | $ | 6,915,682 | | | $ | 6,066,002 | |
| | |
| | | | | | |
| | | | | | | | | | | | | | | | | | | | | | | | | | |
| $ | 6,346,149 | | | $ | 9,123,833 | | | $ | 8,382,863 | | | $ | 7,860,257 | | | $ | 7,666,813 | | | $ | 6,137,000 | | | $ | 5,418,837 | |
| | 730,735 | | | | 1,105,053 | | | | 1,083,888 | | | | 1,056,769 | | | | 927,113 | | | | 778,682 | | | | 647,165 | |
| | |
| $ | 7,076,884 | | | $ | 10,228,886 | | | $ | 9,466,751 | | | $ | 8,917,026 | | | $ | 8,593,926 | | | $ | 6,915,682 | | | $ | 6,066,002 | |
| | |
| | | | | | |
| | | | | | | | | | | | | | | | | | | | | | | | | | |
| $ | 1,310,584 | | | $ | 3,072,646 | | | $ | 2,998,445 | | | $ | 983,066 | | | $ | 2,899,338 | | | $ | 533,837 | | | $ | 296,436 | |
| | 119,279 | | | | 271,889 | | | | 268,130 | | | | 88,416 | | | | 265,466 | | | | 49,074 | | | | 27,466 | |
| | $10.99 | | | | $11.30 | | | | $11.18 | | | | $11.12 | | | | $10.92 | | | | $10.88 | | | | $10.79 | |
| | $11.66 | | | | $11.99 | | | | $11.86 | | | | $11.80 | | | | $11.59 | | | | $11.54 | | | | $11.45 | |
| $ | 145,937 | | | $ | 132,381 | | | $ | 115,981 | | | $ | 121,587 | | | $ | 116,214 | | | $ | 127,777 | | | $ | 121,934 | |
| | 13,174 | | | | 11,617 | | | | 10,303 | | | | 10,843 | | | | 10,544 | | | | 11,667 | | | | 11,255 | |
| | $11.08 | | | | $11.40 | | | | $11.26 | | | | $11.21 | | | | $11.02 | | | | $10.95 | | | | $10.83 | |
| $ | 114,610 | | | $ | 117,765 | | | $ | 116,965 | | | $ | 116,393 | | | $ | 114,559 | | | $ | 114,166 | | | $ | 112,961 | |
| | 10,356 | | | | 10,347 | | | | 10,369 | | | | 10,388 | | | | 10,387 | | | | 10,408 | | | | 10,410 | |
| | $11.07 | | | | $11.38 | | | | $11.28 | | | | $11.20 | | | | $11.03 | | | | $10.97 | | | | $10.85 | |
| $ | 5,505,753 | | | $ | 6,906,094 | | | $ | 6,235,360 | | | $ | 7,695,980 | | | $ | 5,463,815 | | | $ | 6,139,902 | | | $ | 5,534,671 | |
| | 496,851 | | | | 606,060 | | | | 552,004 | | | | 685,899 | | | | 494,718 | | | | 558,810 | | | | 509,343 | |
| | $11.08 | | | | $11.40 | | | | $11.30 | | | | $11.22 | | | | $11.04 | | | | $10.99 | | | | $10.87 | |
| | | | | | |
| $ | 6,499,710 | | | $ | 9,452,581 | | | $ | 8,618,972 | | | $ | 8,101,828 | | | $ | 7,743,253 | | | $ | 6,181,364 | | | $ | 5,379,345 | |
| | |
The accompanying notes are an integral part of these financial statements.
Target Date Retirement Funds | 57
Statements of assets and liabilities—August 31, 2020 (unaudited)
| | | | | | | | |
| | | Dynamic Target
2055 Fund | | | Dynamic Target
2060 Fund | |
| | |
Assets | | | | | | | | |
Investments in affiliated Master Portfolios, at value (see cost below) | | $ | 6,291,141 | | | $ | 5,811,391 | |
Cash | | | 10,000 | | | | 10,000 | |
Segregated cash for futures contracts | | | 33,995 | | | | 19,994 | |
Receivable for Fund shares sold | | | 5,720 | | | | 1,601 | |
Receivable for daily variation margin on open futures contracts | | | 2,446 | | | | 2,447 | |
Prepaid expenses and other assets | | | 36,699 | | | | 34,563 | |
| | | | |
Total assets | | | 6,380,001 | | | | 5,879,996 | |
| | | | |
| | |
Liabilities | | | | | | | | |
Management fee payable | | | 34,094 | | | | 31,608 | |
Administration fees payable | | | 225 | | | | 209 | |
Distribution fee payable | | | 18 | | | | 15 | |
Shareholder report expenses payable | | | 49,947 | | | | 50,913 | |
Custody and accounting fees payable | | | 4,450 | | | | 4,461 | |
Professional fees payable | | | 7,976 | | | | 7,976 | |
Trustees’ fees and expenses payable | | | 4,454 | | | | 4,454 | |
Accrued expenses and other liabilities | | | 1,153 | | | | 1,057 | |
| | | | |
Total liabilities | | | 102,317 | | | | 100,693 | |
| | | | |
Total net assets | | $ | 6,277,684 | | | $ | 5,779,303 | |
| | | | |
| | |
Net assets consist of | | | | | | | | |
Paid-in capital | | $ | 5,589,801 | | | $ | 5,165,145 | |
Total distributable earnings | | | 687,883 | | | | 614,158 | |
| | | | |
Total net assets | | $ | 6,277,684 | | | $ | 5,779,303 | |
| | | | |
| | |
Computation of net asset value and offering price per share | | | | | | | | |
Net assets – Class A | | $ | 309,462 | | | $ | 289,681 | |
Shares outstanding – Class A1 | | | 28,546 | | | | 26,855 | |
Net asset value per share – Class A | | | $10.84 | | | | $10.79 | |
Maximum offering price per share – Class A2 | | | $11.50 | | | | $11.45 | |
Net assets – Class C | | $ | 117,573 | | | $ | 112,153 | |
Shares outstanding – Class C1 | | | 10,806 | | | | 10,319 | |
Net asset value per share – Class C | | | $10.88 | | | | $10.87 | |
Net assets – Class R4 | | $ | 113,453 | | | $ | 113,460 | |
Share outstanding – Class R41 | | | 10,413 | | | | 10,424 | |
Net asset value per share – Class R4 | | | $10.90 | | | | $10.88 | |
Net assets – Class R6 | | $ | 5,737,196 | | | $ | 5,264,009 | |
Shares outstanding – Class R61 | | | 526,057 | | | | 482,977 | |
Net asset value per share – Class R6 | | | $10.91 | | | | $10.90 | |
| | |
Investments in affiliated Master Portfolios, at cost | | $ | 5,572,842 | | | $ | 5,126,280 | |
| | | | |
| 1 | Each Fund has an unlimited number of authorized shares. |
| 2 | Maximum offering price is computed as 100/94.25 of net asset value. On investments of $50,000 or more, the offering price is reduced. |
The accompanying notes are an integral part of these financial statements.
58 | Target Date Retirement Funds
This page is intentionally left blank.
Statements of operations—six months ended August 31, 2020 (unaudited)
| | | | | | | | |
| | | Dynamic Target
Today Fund | | | Dynamic Target
2015 Fund | |
| | |
Investment income | | | | | | | | |
Interest allocated from affiliated Master Portfolios | | $ | 50,458 | | | $ | 35,044 | |
Dividends allocated from affiliated Master Portfolios* | | | 35,968 | | | | 35,937 | |
Affiliated income allocated from affiliated Master Portfolios | | | 187 | | | | 166 | |
Interest | | | 44 | | | | 45 | |
Expenses allocated from affiliated Master Portfolios | | | (5,730 | ) | | | (4,899 | ) |
Waivers allocated from affiliated Master Portfolios | | | 2,132 | | | | 1,802 | |
| | | | |
Total investment income | | | 83,059 | | | | 68,095 | |
| | | | |
| | |
Expenses | | | | | | | | |
Management fee | | | 5,164 | | | | 4,221 | |
Administration fees | |
Class A | | | 1,035 | | | | 484 | |
Class C | | | 114 | | | | 111 | |
Class R4 | | | 44 | | | | 43 | |
Class R6 | | | 852 | | | | 743 | |
Shareholder servicing fees | |
Class A | | | 1,232 | | | | 576 | |
Class C | | | 133 | | | | 132 | |
Class R4 | | | 55 | | | | 54 | |
Distribution fee | |
Class C | | | 133 | | | | 133 | |
Custody and accounting fees | | | 13,002 | | | | 13,008 | |
Professional fees | | | 16,243 | | | | 16,243 | |
Registration fees | | | 34,651 | | | | 32,435 | |
Shareholder report expenses | | | 6,015 | | | | 6,015 | |
Trustees’ fees and expenses | | | 11,029 | | | | 11,029 | |
Other fees and expenses | | | 3,550 | | | | 3,382 | |
| | | | |
Total expenses | | | 93,252 | | | | 88,609 | |
Less: Fee waivers and/or expense reimbursements | |
Fund-level | | | (82,803 | ) | | | (81,590 | ) |
Class A | | | (2,267 | ) | | | (1,060 | ) |
Class C | | | (247 | ) | | | (243 | ) |
Class R4 | | | (99 | ) | | | (97 | ) |
Class R6 | | | (852 | ) | | | (743 | ) |
| | | | |
Net expenses | | | 6,984 | | | | 4,876 | |
| | | | |
Net investment income | | | 76,075 | | | | 63,219 | |
| | | | |
Payment from affiliate | | | 1,648 | | | | 1,699 | |
| | | | |
| | |
Realized and unrealized gains (losses) on investments | | | | | | | | |
Net realized gains (losses) on | | | | | | | | |
Securities transactions allocated from affiliated Master Portfolios | | | 20,500 | | | | 6,410 | |
Unaffiliated securities | | | 26 | | | | 25 | |
Futures contracts | | | 89,715 | | | | 57,745 | |
| | | | |
Net realized gains on investments | | | 110,241 | | | | 64,180 | |
| | | | |
| | |
Net change in unrealized gains (losses) on | | | | | | | | |
Securities transactions allocated from affiliated Master Portfolios | | | 258,361 | | | | 242,848 | |
Futures contracts | | | (5,559 | ) | | | (5,559 | ) |
| | | | |
Net change in unrealized gains (losses) on investments | | | 252,802 | | | | 237,289 | |
| | | | |
Net realized and unrealized gains (losses) on investments | | | 363,043 | | | | 301,469 | |
| | | | |
Net increase in net assets resulting from operations | | $ | 440,766 | | | $ | 366,387 | |
| | | | |
| | |
* Net of foreign dividend withholding taxes allocated from affiliated Master Portfolios in the amount of | | | $1,924 | | | | $1,920 | |
The accompanying notes are an integral part of these financial statements.
60 | Target Date Retirement Funds
Statements of operations—six months ended August 31, 2020 (unaudited)
| | | | | | | | | | | | | | | | | | | | | | | | | | |
Dynamic Target
2020 Fund | | | Dynamic Target
2025 Fund | | | Dynamic Target
2030 Fund | | | Dynamic Target
2035 Fund | | | Dynamic Target
2040 Fund | | | Dynamic Target
2045 Fund | | | Dynamic Target
2050 Fund | |
| | | | | | |
| | | | | | | | | | | | | | | | | | | | | | | | | | |
| $ | 34,939 | | | $ | 39,874 | | | $ | 25,758 | | | $ | 19,673 | | | $ | 13,312 | | | $ | 7,033 | | | $ | 3,375 | |
| | 48,928 | | | | 82,441 | | | | 79,773 | | | | 80,698 | | | | 79,795 | | | | 70,181 | | | | 64,475 | |
| | 220 | | | | 353 | | | | 325 | | | | 311 | | | | 301 | | | | 250 | | | | 241 | |
| | 106 | | | | 160 | | | | 171 | | | | 109 | | | | 99 | | | | 92 | | | | 87 | |
| | (5,941 | ) | | | (8,711 | ) | | | (7,593 | ) | | | (7,297 | ) | | | (6,980 | ) | | | (5,921 | ) | | | (5,303 | ) |
| | 2,132 | | | | 2,878 | | | | 2,303 | | | | 2,117 | | | | 2,030 | | | | 1,719 | | | | 1,538 | |
| | |
| | 80,384 | | | | 116,995 | | | | 100,737 | | | | 95,611 | | | | 88,557 | | | | 73,354 | | | | 64,413 | |
| | |
| | | | | | |
| | | | | | | | | | | | | | | | | | | | | | | | | | |
| | 5,013 | | | | 7,251 | | | | 6,283 | | | | 5,990 | | | | 5,589 | | | | 4,630 | | | | 4,079 | |
| | | | | | | | | | | | | | | | | | | | | | | | | | |
| | 1,388 | | | | 3,054 | | | | 2,617 | | | | 833 | | | | 2,397 | | | | 469 | | | | 280 | |
| | 123 | | | | 130 | | | | 111 | | | | 114 | | | | 109 | | | | 118 | | | | 113 | |
| | 43 | | | | 44 | | | | 43 | | | | 42 | | | | 42 | | | | 41 | | | | 41 | |
| | 771 | | | | 979 | | | | 851 | | | | 1,047 | | | | 744 | | | | 827 | | | | 744 | |
| | | | | | | | | | | | | | | | | | | | | | | | | | |
| | 1,653 | | | | 3,634 | | | | 3,114 | | | | 992 | | | | 2,853 | | | | 557 | | | | 333 | |
| | 146 | | | | 154 | | | | 131 | | | | 136 | | | | 130 | | | | 141 | | | | 134 | |
| | 54 | | | | 54 | | | | 54 | | | | 53 | | | | 52 | | | | 51 | | | | 51 | |
| | | | | | | | | | | | | | | | | | | | | | | | | | |
| | 175 | | | | 195 | | | | 129 | | | | 145 | | | | 130 | | | | 164 | | | | 147 | |
| | 13,008 | | | | 13,011 | | | | 13,011 | | | | 13,008 | | | | 13,008 | | | | 13,006 | | | | 13,304 | |
| | 16,243 | | | | 16,243 | | | | 16,243 | | | | 16,244 | | | | 16,243 | | | | 16,243 | | | | 16,243 | |
| | 31,782 | | | | 34,651 | | | | 29,161 | | | | 29,161 | | | | 41,094 | | | | 34,120 | | | | 29,161 | |
| | 6,015 | | | | 6,015 | | | | 6,015 | | | | 6,015 | | | | 6,015 | | | | 6,015 | | | | 6,015 | |
| | 11,029 | | | | 11,029 | | | | 11,029 | | | | 11,029 | | | | 11,029 | | | | 11,029 | | | | 11,029 | |
| | 3,550 | | | | 4,207 | | | | 4,205 | | | | 4,205 | | | | 3,550 | | | | 3,550 | | | | 3,550 | |
| | |
| | 90,993 | | | | 100,651 | | | | 92,997 | | | | 89,014 | | | | 102,985 | | | | 90,961 | | | | 85,224 | |
| | | | | | | | | | | | | | | | | | | | | | | | | | |
| | (79,436 | ) | | | (80,273 | ) | | | (75,707 | ) | | | (79,624 | ) | | | (87,451 | ) | | | (84,381 | ) | | | (79,965 | ) |
| | (3,041 | ) | | | (6,688 | ) | | | (5,731 | ) | | | (1,825 | ) | | | (5,250 | ) | | | (1,026 | ) | | | (614 | ) |
| | (270 | ) | | | (285 | ) | | | (242 | ) | | | (250 | ) | | | (239 | ) | | | (259 | ) | | | (247 | ) |
| | (97 | ) | | | (98 | ) | | | (87 | ) | | | (95 | ) | | | (94 | ) | | | (92 | ) | | | (92 | ) |
| | (771 | ) | | | (979 | ) | | | (851 | ) | | | (1,047 | ) | | | (744 | ) | | | (827 | ) | | | (744 | ) |
| | |
| | 7,378 | | | | 12,328 | | | | 10,379 | | | | 6,173 | | | | 9,207 | | | | 4,376 | | | | 3,562 | |
| | |
| | 73,006 | | | | 104,667 | | | | 90,358 | | | | 89,438 | | | | 79,350 | | | | 68,978 | | | | 60,851 | |
| | |
| | 1,768 | | | | 1,794 | | | | 1,378 | | | | 1,801 | | | | 1,690 | | | | 1,821 | | | | 1,735 | |
| | |
| | | | | | |
| | | | | | | | | | | | | | | | | | | | | | | | | | |
| | | | | | | | | | | | | | | | | | | | | | | | | | |
| | (2,605 | ) | | | (9,997 | ) | | | (1,574 | ) | | | (7,402 | ) | | | (10,771 | ) | | | (9,409 | ) | | | (22,265 | ) |
| | 47 | | | | 76 | | | | 70 | | | | 65 | | | | 58 | | | | 57 | | | | 58 | |
| | 96,710 | | | | 249,104 | | | | 233,661 | | | | 261,011 | | | | 174,606 | | | | 181,443 | | | | 140,480 | |
| | |
| | 94,152 | | | | 239,183 | | | | 232,157 | | | | 253,674 | | | | 163,893 | | | | 172,091 | | | | 118,273 | |
| | |
| | | | | | |
| | | | | | | | | | | | | | | | | | | | | | | | | | |
| | 292,746 | | | | 540,013 | | | | 605,158 | | | | 621,621 | | | | 660,563 | | | | 512,092 | | | | 464,369 | |
| | (7,667 | ) | | | (27,621 | ) | | | (23,122 | ) | | | (21,067 | ) | | | (23,122 | ) | | | (5,464 | ) | | | 7,173 | |
| | |
| | 285,079 | | | | 512,392 | | | | 582,036 | | | | 600,554 | | | | 637,441 | | | | 506,628 | | | | 471,542 | |
| | |
| | 379,231 | | | | 751,575 | | | | 814,193 | | | | 854,228 | | | | 801,334 | | | | 678,719 | | | | 589,815 | |
| | |
| $ | 454,005 | | | $ | 858,036 | | | $ | 905,929 | | | $ | 945,467 | | | $ | 882,374 | | | $ | 749,518 | | | $ | 652,401 | |
| | |
| | | | | | |
| | $2,664 | | | | $4,798 | | | | $4,931 | | | | $5,184 | | | | $5,205 | | | | $4,619 | | | | $4,273 | |
The accompanying notes are an integral part of these financial statements.
Target Date Retirement Funds | 61
Statements of operations—six months ended August 31, 2020 (unaudited)
| | | | | | | | |
| | | Dynamic Target
2055 Fund | | | Dynamic Target
2060 Fund | |
| | |
Investment income | | | | | | | | |
Interest allocated from affiliated Master Portfolios | | $ | 3,488 | | | $ | 3,232 | |
Dividends allocated from affiliated Master Portfolios* | | | 66,382 | | | | 61,921 | |
Affiliated income allocated from affiliated Master Portfolios | | | 248 | | | | 234 | |
Interest | | | 79 | | | | 87 | |
Expenses allocated from affiliated Master Portfolios | | | (5,463 | ) | | | (5,094 | ) |
Waivers allocated from affiliated Master Portfolios | | | 1,584 | | | | 1,482 | |
| | | | |
Total investment income | | | 66,318 | | | | 61,862 | |
| | | | |
| | |
Expenses | | | | | | | | |
Management fee | | | 4,201 | | | | 3,899 | |
Administration fees | |
Class A | | | 277 | | | | 281 | |
Class C | | | 108 | | | | 105 | |
Class R4 | | | 41 | | | | 41 | |
Class R6 | | | 770 | | | | 709 | |
Shareholder servicing fees | |
Class A | | | 329 | | | | 333 | |
Class C | | | 129 | | | | 125 | |
Class R4 | | | 51 | | | | 51 | |
Distribution fee | |
Class C | | | 127 | | | | 116 | |
Custody and accounting fees | | | 13,306 | | | | 13,006 | |
Professional fees | | | 16,243 | | | | 16,243 | |
Registration fees | | | 34,318 | | | | 29,161 | |
Shareholder report expenses | | | 6,015 | | | | 6,015 | |
Trustees’ fees and expenses | | | 11,029 | | | | 11,029 | |
Other fees and expenses | | | 3,578 | | | | 3,578 | |
| | | | |
Total expenses | | | 90,522 | | | | 84,692 | |
Less: Fee waivers and/or expense reimbursements | |
Fund-level | | | (85,225 | ) | | | (79,640 | ) |
Class A | | | (606 | ) | | | (614 | ) |
Class C | | | (237 | ) | | | (230 | ) |
Class R4 | | | (92 | ) | | | (92 | ) |
Class R6 | | | (770 | ) | | | (709 | ) |
| | | | |
Net expenses | | | 3,592 | | | | 3,407 | |
| | | | |
Net investment income | | | 62,726 | | | | 58,455 | |
| | | | |
Payment from affiliate | | | 1,693 | | | | 1,632 | |
| | | | |
| | |
Realized and unrealized gains (losses) on investments | | | | | | | | |
Net realized gains (losses) on | | | | | | | | |
Securities transactions allocated from affiliated Master Portfolios | | | (22,635 | ) | | | (22,709 | ) |
Unaffiliated securities | | | 52 | | | | 58 | |
Futures contracts | | | 164,662 | | | | 134,890 | |
| | | | |
Net realized gains on investments | | | 142,079 | | | | 112,239 | |
| | | | |
| | |
Net change in unrealized gains (losses) on | | | | | | | | |
Securities transactions allocated from affiliated Master Portfolios | | | 482,841 | | | | 431,981 | |
Futures contracts | | | 7,173 | | | | 7,173 | |
| | | | |
Net change in unrealized gains (losses) on investments | | | 490,014 | | | | 439,154 | |
| | | | |
Net realized and unrealized gains (losses) on investments | | | 632,093 | | | | 551,393 | |
| | | | |
Net increase in net assets resulting from operations | | $ | 696,512 | | | $ | 611,480 | |
| | | | |
| | |
* Net of foreign dividend withholding taxes allocated from affiliated Master Portfolios in the amount of | | | $4,396 | | | | $4,099 | |
The accompanying notes are an integral part of these financial statements.
62 | Target Date Retirement Funds
Statements of changes in net assets
| | | | | | | | | | | | | | | | |
| | | Dynamic Target Today Fund | |
| | | Six months ended
August 31, 2020
(unaudited) | | | Year ended
February 29, 2020 | |
| | |
Operations | | | | | | | | | |
Net investment income | | | | | | $ | 76,075 | | | | | | | $ | 151,322 | |
Payment from affiliate | | | | | | | 1,648 | | | | | | | | 0 | |
Net realized gains on investments | | | | | | | 110,241 | | | | | | | | 108,776 | |
Net change in unrealized gains (losses) on investments | | | | | | | 252,802 | | | | | | | | 158,255 | |
| | | | |
Net increase in net assets resulting from operations | | | | | | | 440,766 | | | | | | | | 418,353 | |
| | | | |
| | |
Distributions to shareholders from net income and net realized gains | | | | | | | | | |
Class A | | | | | | | 0 | | | | | | | | (21,015 | ) |
Class C | | | | | | | 0 | | | | | | | | (1,480 | ) |
Class R4 | | | | | | | 0 | | | | | | | | (2,302 | ) |
Class R6 | | | | | | | 0 | | | | | | | | (126,076 | ) |
| | | | |
Total distributions to shareholders | | | | | | | 0 | | | | | | | | (150,873 | ) |
| | | | |
| | | | |
Capital share transactions | | | Shares | | | | | | | | Shares | | | | | |
Proceeds from shares sold | |
Class A | | | 7,556 | | | | 81,000 | | | | 64,419 | | | | 692,848 | |
Class C | | | 49 | | | | 500 | | | | 566 | | | | 5,800 | |
Class R6 | | | 14,421 | | | | 152,266 | | | | 53,955 | | | | 572,915 | |
| | | | |
| | | | | | | 233,766 | | | | | | | | 1,271,563 | |
| | | | |
Reinvestment of distributions | |
Class A | | | 0 | | | | 0 | | | | 1,743 | | | | 18,807 | |
Class C | | | 0 | | | | 0 | | | | 7 | | | | 78 | |
Class R6 | | | 0 | | | | 0 | | | | 1,162 | | | | 12,544 | |
| | | | |
| | | | | | | 0 | | | | | | | | 31,429 | |
| | | | |
Payment for shares redeemed | |
Class A | | | (20,367 | ) | | | (220,104 | ) | | | (9,330 | ) | | | (100,493 | ) |
Class C | | | (49 | ) | | | (538 | ) | | | (573 | ) | | | (6,241 | ) |
Class R6 | | | (5,759 | ) | | | (63,875 | ) | | | (6,593 | ) | | | (71,668 | ) |
| | | | |
| | | | | | | (284,517 | ) | | | | | | | (178,402 | ) |
| | | | |
Net increase (decrease) in net assets resulting from capital share transactions | | | | | | | (50,751 | ) | | | | | | | 1,124,590 | |
| | | | |
Total increase in net assets | | | | | | | 390,015 | | | | | | | | 1,392,070 | |
| | | | |
| | |
Net assets | | | | | | | | |
Beginning of period | | | | | | | 6,782,953 | | | | | | | | 5,390,883 | |
| | | | |
End of period | | | | | | $ | 7,172,968 | | | | | | | $ | 6,782,953 | |
| | | | |
The accompanying notes are an integral part of these financial statements.
Target Date Retirement Funds | 63
Statements of changes in net assets
| | | | | | | | | | | | | | | | |
| | | Dynamic Target 2015 Fund | |
| | | Six months ended
August 31, 2020
(unaudited) | | | Year ended
February 29, 2020 | |
| | |
Operations | | | | | | | | | |
Net investment income | | | | | | $ | 63,219 | | | | | | | $ | 136,159 | |
Payment from affiliate | | | | | | | 1,699 | | | | | | | | 0 | |
Net realized gains on investments | | | | | | | 64,180 | | | | | | | | 113,540 | |
Net change in unrealized gains (losses) on investments | | | | | | | 237,289 | | | | | | | | 112,702 | |
| | | | |
Net increase in net assets resulting from operations | | | | | | | 366,387 | | | | | | | | 362,401 | |
| | | | |
| | |
Distributions to shareholders from net investment income and net realized gains | | | | | | | | | |
Class A | | | | | | | 0 | | | | | | | | (9,562 | ) |
Class C | | | | | | | 0 | | | | | | | | (1,643 | ) |
Class R4 | | | | | | | 0 | | | | | | | | (2,549 | ) |
Class R6 | | | | | | | 0 | | | | | | | | (124,757 | ) |
| | | | |
Total distributions to shareholders | | | | | | | 0 | | | | | | | | (138,511 | ) |
| | | | |
| | | | |
Capital share transactions | | | Shares | | | | | | | | Shares | | | | | |
Proceeds from shares sold | |
Class A | | | 1,990 | | | | 20,000 | | | | 18,133 | | | | 187,636 | |
Reinvestment of distributions | |
Class A | | | 0 | | | | 0 | | | | 685 | | | | 7,332 | |
Payment for shares redeemed | |
Class A | | | (2,793 | ) | | | (28,357 | ) | | | (13,627 | ) | | | (143,495 | ) |
| | | | |
Net increase (decrease) in net assets resulting from capital share transactions | | | | | | | (8,357 | ) | | | | | | | 51,473 | |
| | | | |
Total increase in net assets | | | | | | | 358,030 | | | | | | | | 275,363 | |
| | | | |
| | |
Net assets | | | | | | | | |
Beginning of period | | | | | | | 5,609,462 | | | | | | | | 5,334,099 | |
| | | | |
End of period | | | | | | $ | 5,967,492 | | | | | | | $ | 5,609,462 | |
| | | �� | |
The accompanying notes are an integral part of these financial statements.
64 | Target Date Retirement Funds
Statements of changes in net assets
| | | | | | | | | | | | | | | | |
| | | Dynamic Target 2020 Fund | |
| | | Six months ended
August 31, 2020
(unaudited) | | | Year ended
February 29, 2020 | |
| | |
Operations | | | | | | | | | |
Net investment income | | | | | | $ | 73,006 | | | | | | | $ | 144,942 | |
Payment from affiliate | | | | | | | 1,768 | | | | | | | | 0 | |
Net realized gains on investments | | | | | | | 94,152 | | | | | | | | 123,878 | |
Net change in unrealized gains (losses) on investments | | | | | | | 285,079 | | | | | | | | 49,649 | |
| | | | |
Net increase in net assets resulting from operations | | | | | | | 454,005 | | | | | | | | 318,469 | |
| | | | |
| | |
Distributions to shareholders from net investment income and net realized gains | | | | | | | | | |
Class A | | | | | | | 0 | | | | | | | | (25,690 | ) |
Class C | | | | | | | 0 | | | | | | | | (1,373 | ) |
Class R4 | | | | | | | 0 | | | | | | | | (2,277 | ) |
Class R6 | | | | | | | 0 | | | | | | | | (116,241 | ) |
| | | | |
Total distributions to shareholders | | | | | | | 0 | | | | | | | | (145,581 | ) |
| | | | |
| | | | |
Capital share transactions | | | Shares | | | | | | | | Shares | | | | | |
Proceeds from shares sold | |
Class A | | | 38,644 | | | | 390,933 | | | | 107,841 | | | | 1,133,041 | |
Class C | | | 2,924 | | | | 30,529 | | | | 0 | | | | 0 | |
Class R6 | | | 2,087 | | | | 21,657 | | | | 17,310 | | | | 180,246 | |
| | | | |
| | | | | | | 443,119 | | | | | | | | 1,313,287 | |
| | | | |
Reinvestment of distributions | |
Class A | | | 0 | | | | 0 | | | | 2,193 | | | | 23,471 | |
Class R6 | | | 0 | | | | 0 | | | | 367 | | | | 3,947 | |
| | | | |
| | | | | | | 0 | | | | | | | | 27,418 | |
| | | | |
Payment for shares redeemed | |
Class A | | | (58,971 | ) | | | (585,497 | ) | | | (32,999 | ) | | | (343,229 | ) |
Class R6 | | | (15 | ) | | | (153 | ) | | | (13 | ) | | | (142 | ) |
| | | | |
| | | | | | | (585,650 | ) | | | | | | | (343,371 | ) |
| | | | |
Net increase (decrease) in net assets resulting from capital share transactions | | | | | | | (142,531 | ) | | | | | | | 997,334 | |
| | | | |
Total increase in net assets | | | | | | | 311,474 | | | | | | | | 1,170,222 | |
| | | | |
| | |
Net assets | | | | | | | | |
Beginning of period | | | | | | | 6,765,410 | | | | | | | | 5,595,188 | |
| | | | |
End of period | | | | | | $ | 7,076,884 | | | | | | | $ | 6,765,410 | |
| | | | |
The accompanying notes are an integral part of these financial statements.
Target Date Retirement Funds | 65
Statements of changes in net assets
| | | | | | | | | | | | | | | | |
| | | Dynamic Target 2025 Fund | |
| | | Six months ended
August 31, 2020
(unaudited) | | | Year ended
February 29, 2020 | |
| | |
Operations | | | | | | | | | |
Net investment income | | | | | | $ | 104,667 | | | | | | | $ | 188,039 | |
Payment from affiliate | | | | | | | 1,794 | | | | | | | | 0 | |
Net realized gains on investments | | | | | | | 239,183 | | | | | | | | 156,683 | |
Net change in unrealized gains (losses) on investments | | | | | | | 512,392 | | | | | | | | 112 | |
| | | | |
Net increase in net assets resulting from operations | | | | | | | 858,036 | | | | | | | | 344,834 | |
| | | | |
| | |
Distributions to shareholders from net investment income and net realized gains | | | | | | | | | |
Class A | | | | | | | 0 | | | | | | | | (47,670 | ) |
Class C | | | | | | | 0 | | | | | | | | (1,476 | ) |
Class R4 | | | | | | | 0 | | | | | | | | (2,127 | ) |
Class R6 | | | | | | | 0 | | | | | | | | (134,882 | ) |
| | | | |
Total distributions to shareholders | | | | | | | 0 | | | | | | | | (186,155 | ) |
| | | | |
| | | | |
Capital share transactions | | | Shares | | | | | | | | Shares | | | | | |
Proceeds from shares sold | |
Class A | | | 31,390 | | | | 320,936 | | | | 124,386 | | | | 1,302,775 | |
Class C | | | 44 | | | | 450 | | | | 268 | | | | 2,900 | |
Class R6 | | | 8,901 | | | | 93,146 | | | | 163,537 | | | | 1,735,695 | |
| | | | |
| | | | | | | 414,532 | | | | | | | | 3,041,370 | |
| | | | |
Reinvestment of distributions | |
Class A | | | 0 | | | | 0 | | | | 4,188 | | | | 45,780 | |
Class C | | | 0 | | | | 0 | | | | 28 | | | | 301 | |
Class R6 | | | 0 | | | | 0 | | | | 2,659 | | | | 29,225 | |
| | | | |
| | | | | | | 0 | | | | | | | | 75,306 | |
| | | | |
Payment for shares redeemed | |
Class A | | | (35,040 | ) | | | (360,207 | ) | | | (44,031 | ) | | | (469,581 | ) |
Class C | | | (522 | ) | | | (5,489 | ) | | | (1,039 | ) | | | (11,500 | ) |
Class R6 | | | (39,188 | ) | | | (402,121 | ) | | | (6,576 | ) | | | (71,845 | ) |
| | | | |
| | | | | | | (767,817 | ) | | | | | | | (552,926 | ) |
| | | | |
Net increase (decrease) in net assets resulting from capital share transactions | | | | | | | (353,285 | ) | | | | | | | 2,563,750 | |
| | | | |
Total increase in net assets | | | | | | | 504,751 | | | | | | | | 2,722,429 | |
| | | | |
| | |
Net assets | | | | | | | | |
Beginning of period | | | | | | | 9,724,135 | | | | | | | | 7,001,706 | |
| | | | |
End of period | | | | | | $ | 10,228,886 | | | | | | | $ | 9,724,135 | |
| | | | |
The accompanying notes are an integral part of these financial statements.
66 | Target Date Retirement Funds
Statements of changes in net assets
| | | | | | | | | | | | | | | | |
| | | Dynamic Target 2030 Fund | |
| | | Six months ended
August 31, 2020
(unaudited) | | | Year ended
February 29, 2020 | |
| | |
Operations | | | | | | | | | |
Net investment income | | | | | | $ | 90,358 | | | | | | | $ | 156,690 | |
Payment from affiliate | | | | | | | 1,378 | | | | | | | | 0 | |
Net realized gains on investments | | | | | | | 232,157 | | | | | | | | 125,100 | |
Net change in unrealized gains (losses) on investments | | | | | | | 582,036 | | | | | | | | (28,427 | ) |
| | | | |
Net increase in net assets resulting from operations | | | | | | | 905,929 | | | | | | | | 253,363 | |
| | | | |
| | |
Distributions to shareholders from net investment income and net realized gains | | | | | | | | | |
Class A | | | | | | | 0 | | | | | | | | (29,569 | ) |
Class C | | | | | | | 0 | | | | | | | | (558 | ) |
Class R4 | | | | | | | 0 | | | | | | | | (2,035 | ) |
Class R6 | | | | | | | 0 | | | | | | | | (125,609 | ) |
| | | | |
Total distributions to shareholders | | | | | | | 0 | | | | | | | | (157,771 | ) |
| | | | |
| | | | |
Capital share transactions | | | Shares | | | | | | | | Shares | | | | | |
Proceeds from shares sold | |
Class A | | | 62,354 | | | | 645,576 | | | | 144,551 | | | | 1,511,865 | |
Class R6 | | | 8,168 | | | | 84,490 | | | | 119,094 | | | | 1,224,410 | |
| | | | |
| | | | | | | 730,066 | | | | | | | | 2,736,275 | |
| | | | |
Reinvestment of distributions | |
Class A | | | 0 | | | | 0 | | | | 2,428 | | | | 26,197 | |
Class R6 | | | 0 | | | | 0 | | | | 2,241 | | | | 24,358 | |
| | | | |
| | | | | | | 0 | | | | | | | | 50,555 | |
| | | | |
Payment for shares redeemed | |
Class A | | | (23,348 | ) | | | (238,010 | ) | | | (19,512 | ) | | | (201,894 | ) |
Class C | | | 0 | | | | 0 | | | | (5,192 | ) | | | (55,089 | ) |
Class R6 | | | (60 | ) | | | (611 | ) | | | (55,148 | ) | | | (597,605 | ) |
| | | | |
| | | | | | | (238,621 | ) | | | | | | | (854,588 | ) |
| | | | |
Net increase in net assets resulting from capital share transactions | | | | | | | 491,445 | | | | | | | | 1,932,242 | |
| | | | |
Total increase in net assets | | | | | | | 1,397,374 | | | | | | | | 2,027,834 | |
| | | | |
| | |
Net assets | | | | | | | | |
Beginning of period | | | | | | | 8,069,377 | | | | | | | | 6,041,543 | |
| | | | |
End of period | | | | | | $ | 9,466,751 | | | | | | | $ | 8,069,377 | |
| | | | |
The accompanying notes are an integral part of these financial statements.
Target Date Retirement Funds | 67
Statements of changes in net assets
| | | | | | | | | | | | | | | | |
| | | Dynamic Target 2035 Fund | |
| | | Six months ended
August 31, 2020
(unaudited) | | | Year ended
February 29, 2020 | |
| | |
Operations | | | | | | | | | |
Net investment income | | | | | | $ | 89,438 | | | | | | | $ | 148,730 | |
Payment from affiliate | | | | | | | 1,801 | | | | | | | | 0 | |
Net realized gains on investments | | | | | | | 253,674 | | | | | | | | 112,442 | |
Net change in unrealized gains (losses) on investments | | | | | | | 600,554 | | | | | | | | (77,311 | ) |
| | | | |
Net increase in net assets resulting from operations | | | | | | | 945,467 | | | | | | | | 183,861 | |
| | | | |
| | |
Distributions to shareholders from net investment income and net realized gains | | | | | | | | | |
Class A | | | | | | | 0 | | | | | | | | (10,587 | ) |
Class C | | | | | | | 0 | | | | | | | | (1,100 | ) |
Class R4 | | | | | | | 0 | | | | | | | | (1,911 | ) |
Class R6 | | | | | | | 0 | | | | | | | | (133,706 | ) |
| | | | |
Total distributions to shareholders | | | | | | | 0 | | | | | | | | (147,304 | ) |
| | | | |
| | | | |
Capital share transactions | | | Shares | | | | | | | | Shares | | | | | |
Proceeds from shares sold | |
Class A | | | 29,129 | | | | 298,008 | | | | 26,199 | | | | 273,961 | |
Class C | | | 103 | | | | 1,076 | | | | 948 | | | | 10,002 | |
Class R6 | | | 17,331 | | | | 174,549 | | | | 199,224 | | | | 2,018,216 | |
| | | | |
| | | | | | | 473,633 | | | | | | | | 2,302,179 | |
| | | | |
Reinvestment of distributions | |
Class A | | | 0 | | | | 0 | | | | 831 | | | | 8,898 | |
Class C | | | 0 | | | | 0 | | | | 4 | | | | 47 | |
Class R6 | | | 0 | | | | 0 | | | | 3,543 | | | | 38,157 | |
| | | | |
| | | | | | | 0 | | | | | | | | 47,102 | |
| | | | |
Payment for shares redeemed | |
Class A | | | (14,351 | ) | | | (143,161 | ) | | | (6,312 | ) | | | (63,239 | ) |
Class C | | | 0 | | | | 0 | | | | (561 | ) | | | (6,055 | ) |
Class R6 | | | (7,943 | ) | | | (82,953 | ) | | | (4,838 | ) | | | (51,447 | ) |
| | | | |
| | | | | | | (226,114 | ) | | | | | | | (120,741 | ) |
| | | | |
Net increase in net assets resulting from capital share transactions | | | | | | | 247,519 | | | | | | | | 2,228,540 | |
| | | | |
Total increase in net assets | | | | | | | 1,192,986 | | | | | | | | 2,265,097 | |
| | | | |
| | |
Net assets | | | | | | | | |
Beginning of period | | | | | | | 7,724,040 | | | | | | | | 5,458,943 | |
| | | | |
End of period | | | | | | $ | 8,917,026 | | | | | | | $ | 7,724,040 | |
| | | | |
The accompanying notes are an integral part of these financial statements.
68 | Target Date Retirement Funds
Statements of changes in net assets
| | | | | | | | | | | | | | | | |
| | | Dynamic Target 2040 Fund | |
| | | Six months ended
August 31, 2020 (unaudited) | | | Year ended
February 29, 2020 | |
| | | | |
Operations | | | | | | | | | | | | | | | | |
Net investment income | | | | | | $ | 79,350 | | | | | | | $ | 135,774 | |
Payment from affiliate | | | | | | | 1,690 | | | | | | | | 0 | |
Net realized gains on investments | | | | | | | 163,893 | | | | | | | | 97,466 | |
Net change in unrealized gains (losses) on investments | | | | | | | 637,441 | | | | | | | | (118,440 | ) |
| | | | |
Net increase in net assets resulting from operations | | | | | | | 882,374 | | | | | | | | 114,800 | |
| | | | |
| | | | |
Distributions to shareholders from net investment income and net realized gains | | | | | | | | | | | | | | | | |
Class A | | | | | | | 0 | | | | | | | | (30,165 | ) |
Class C | | | | | | | 0 | | | | | | | | (1,101 | ) |
Class R4 | | | | | | | 0 | | | | | | | | (1,982 | ) |
Class R6 | | | | | | | 0 | | | | | | | | (101,722 | ) |
| | | | |
Total distributions to shareholders | | | | | | | 0 | | | | | | | | (134,970 | ) |
| | | | |
| | | | |
Capital share transactions | | | Shares | | | | | | | | Shares | | | | | |
Proceeds from shares sold | | | | | | | | | | | | | | | | |
Class A | | | 81,163 | | | | 785,570 | | | | 143,696 | | | | 1,472,631 | |
Class C | | | 213 | | | | 2,091 | | | | 53 | | | | 548 | |
Class R6 | | | 4,780 | | | | 47,991 | | | | 18,839 | | | | 189,983 | |
| | | | |
| | | | | | | 835,652 | | | | | | | | 1,663,162 | |
| | | | |
Reinvestment of distributions | | | | | | | | | | | | | | | | |
Class A | | | 0 | | | | 0 | | | | 2,661 | | | | 28,283 | |
Class R6 | | | 0 | | | | 0 | | | | 299 | | | | 3,204 | |
| | | | |
| | | | | | | 0 | | | | | | | | 31,487 | |
| | | | |
Payment for shares redeemed | | | | | | | | | | | | | | | | |
Class A | | | (4,827 | ) | | | (47,090 | ) | | | (3,647 | ) | | | (37,457 | ) |
Class R6 | | | (3,804 | ) | | | (37,114 | ) | | | (3,916 | ) | | | (40,282 | ) |
| | | | |
| | | | | | | (84,204 | ) | | | | | | | (77,739 | ) |
| | | | |
Net increase in net assets resulting from capital share transactions | | | | | | | 751,448 | | | | | | | | 1,616,910 | |
| | | | |
Total increase in net assets | | | | | | | 1,633,822 | | | | | | | | 1,596,740 | |
| | | | |
| | | | |
Net assets | | | | | | | | | | | | | | | | |
Beginning of period | | | | | | | 6,960,104 | | | | | | | | 5,363,364 | |
| | | | |
End of period | | | | | | $ | 8,593,926 | | | | | | | $ | 6,960,104 | |
| | | | |
The accompanying notes are an integral part of these financial statements.
Target Date Retirement Funds | 69
Statements of changes in net assets
| | | | | | | | | | | | | | | | |
| | | Dynamic Target 2045 Fund | |
| | | Six months ended
August 31, 2020 (unaudited) | | | Year ended
February 29, 2020 | |
| | | | |
Operations | | | | | | | | | | | | | | | | |
Net investment income | | | | | | $ | 68,978 | | | | | | | $ | 125,715 | |
Payment from affiliate | | | | | | | 1,821 | | | | | | | | 0 | |
Net realized gains on investments | | | | | | | 172,091 | | | | | | | | 99,642 | |
Net change in unrealized gains (losses) on investments | | | | | | | 506,628 | | | | | | | | (119,109 | ) |
| | | | |
Net increase in net assets resulting from operations | | | | | | | 749,518 | | | | | | | | 106,248 | |
| | | | |
| | | | |
Distributions to shareholders from net investment income and net realized gains | | | | | | | | | | | | | | | | |
Class A | | | | | | | 0 | | | | | | | | (7,258 | ) |
Class C | | | | | | | 0 | | | | | | | | (1,297 | ) |
Class R4 | | | | | | | 0 | | | | | | | | (2,030 | ) |
Class R6 | | | | | | | 0 | | | | | | | | (115,733 | ) |
| | | | |
Total distributions to shareholders | | | | | | | 0 | | | | | | | | (126,318 | ) |
| | | | |
| | | | |
Capital share transactions | | | Shares | | | | | | | | Shares | | | | | |
Proceeds from shares sold | | | | | | | | | | | | | | | | |
Class A | | | 9,514 | | | | 95,043 | | | | 14,979 | | | | 152,471 | |
Class C | | | 356 | | | | 3,504 | | | | 792 | | | | 7,984 | |
Class R6 | | | 9,188 | | | | 89,970 | | | | 74,309 | | | | 741,092 | |
| | | | |
| | | | | | | 188,517 | | | | | | | | 901,547 | |
| | | | |
Reinvestment of distributions | | | | | | | | | | | | | | | | |
Class A | | | 0 | | | | 0 | | | | 515 | | | | 5,458 | |
Class C | | | 0 | | | | 0 | | | | 10 | | | | 108 | |
Class R6 | | | 0 | | | | 0 | | | | 1,399 | | | | 14,937 | |
| | | | |
| | | | | | | 0 | | | | | | | | 20,503 | |
| | | | |
Payment for shares redeemed | | | | | | | | | | | | | | | | |
Class A | | | (3,003 | ) | | | (30,203 | ) | | | (6,739 | ) | | | (67,305 | ) |
Class C | | | 0 | | | | 0 | | | | (4 | ) | | | (40 | ) |
Class R6 | | | (3,815 | ) | | | (36,014 | ) | | | (1,775 | ) | | | (18,548 | ) |
| | | | |
| | | | | | | (66,217 | ) | | | | | | | (85,893 | ) |
| | | | |
Net increase in net assets resulting from capital share transactions | | | | | | | 122,300 | | | | | | | | 836,157 | |
| | | | |
Total increase in net assets | | | | | | | 871,818 | | | | | | | | 816,087 | |
| | | | |
| | | | |
Net assets | | | | | | | | | | | | | | | | |
Beginning of period | | | | | | | 6,043,864 | | | | | | | | 5,227,777 | |
| | | | |
End of period | | | | | | $ | 6,915,682 | | | | | | | $ | 6,043,864 | |
| | | | |
The accompanying notes are an integral part of these financial statements.
70 | Target Date Retirement Funds
Statements of changes in net assets
| | | | | | | | | | | | | | | | |
| | | Dynamic Target 2050 Fund | |
| | | Six months ended
August 31, 2020
(unaudited) | | | Year ended
February 29, 2020 | |
| | | | |
Operations | | | | | | | | | | | | | | | | |
Net investment income | | | | | | $ | 60,851 | | | | | | | $ | 117,222 | |
Payment from affiliate | | | | | | | 1,735 | | | | | | | | 0 | |
Net realized gains on investments | | | | | | | 118,273 | | | | | | | | 96,629 | |
Net change in unrealized gains (losses) on investments | | | | | | | 471,542 | | | | | | | | (136,262 | ) |
| | | | |
Net increase in net assets resulting from operations | | | | | | | 652,401 | | | | | | | | 77,589 | |
| | | | |
| | | | |
Distributions to shareholders from net investment income and net realized gains | | | | | | | | | | | | | | | | |
Class A | | | | | | | 0 | | | | | | | | (4,640 | ) |
Class C | | | | | | | 0 | | | | | | | | (1,391 | ) |
Class R4 | | | | | | | 0 | | | | | | | | (2,164 | ) |
Class R6 | | | | | | | 0 | | | | | | | | (111,777 | ) |
| | | | |
Total distributions to shareholders | | | | | | | 0 | | | | | | | | (119,972 | ) |
| | | | |
| | | | |
Capital share transactions | | | Shares | | | | | | | | Shares | | | | | |
Proceeds from shares sold | | | | | | | | | | | | | | | | |
Class A | | | 3,304 | | | | 31,822 | | | | 6,271 | | | | 62,921 | |
Class C | | | 235 | | | | 2,300 | | | | 650 | | | | 6,474 | |
Class R6 | | | 6,552 | | | | 64,218 | | | | 23,548 | | | | 234,939 | |
| | | | |
| | | | | | | 98,340 | | | | | | | | 304,334 | |
| | | | |
Reinvestment of distributions | | | | | | | | | | | | | | | | |
Class A | | | 0 | | | | 0 | | | | 257 | | | | 2,728 | |
Class C | | | 0 | | | | 0 | | | | 8 | | | | 86 | |
Class R6 | | | 0 | | | | 0 | | | | 460 | | | | 4,893 | |
| | | | |
| | | | | | | 0 | | | | | | | | 7,707 | |
| | | | |
Payment for shares redeemed | | | | | | | | | | | | | | | | |
Class A | | | (2,154 | ) | | | (21,824 | ) | | | (555 | ) | | | (5,520 | ) |
Class C | | | 0 | | | | 0 | | | | (176 | ) | | | (1,772 | ) |
Class R6 | | | (707 | ) | | | (7,535 | ) | | | (110 | ) | | | (1,112 | ) |
| | | | |
| | | | | | | (29,359 | ) | | | | | | | (8,404 | ) |
| | | | |
Net increase in net assets resulting from capital share transactions | | | | | | | 68,981 | | | | | | | | 303,637 | |
| | | | |
Total increase in net assets | | | | | | | 721,382 | | | | | | | | 261,254 | |
| | | | |
| | | | |
Net assets | | | | | | | | | | | | | | | | |
Beginning of period | | | | | | | 5,344,620 | | | | | | | | 5,083,366 | |
| | | | |
End of period | | | | | | $ | 6,066,002 | | | | | | | $ | 5,344,620 | |
| | | | |
The accompanying notes are an integral part of these financial statements.
Target Date Retirement Funds | 71
Statements of changes in net assets
| | | | | | | | | | | | | | | | |
| | | Dynamic Target 2055 Fund | |
| | | Six months ended
August 31, 2020
(unaudited) | | | Year ended
February 29, 2020 | |
| | | | |
Operations | | | | | | | | | | | | | | | | |
Net investment income | | | | | | $ | 62,726 | | | | | | | $ | 117,603 | |
Payment from affiliate | | | | | | | 1,693 | | | | | | | | 0 | |
Net realized gains on investments | | | | | | | 142,079 | | | | | | | | 97,143 | |
Net change in unrealized gains (losses) on investments | | | | | | | 490,014 | | | | | | | | (139,662 | ) |
| | | | |
Net increase in net assets resulting from operations | | | | | | | 696,512 | | | | | | | | 75,084 | |
| | | | |
| | | | |
Distributions to shareholders from net investment income and net realized gains | | | | | | | | | | | | | | | | |
Class A | | | | | | | 0 | | | | | | | | (4,235 | ) |
Class C | | | | | | | 0 | | | | | | | | (1,208 | ) |
Class R4 | | | | | | | 0 | | | | | | | | (2,066 | ) |
Class R6 | | | | | | | 0 | | | | | | | | (110,175 | ) |
| | | | |
Total distributions to shareholders | | | | | | | 0 | | | | | | | | (117,684 | ) |
| | | | |
| | | | |
Capital share transactions | | | Shares | | | | | | | | Shares | | | | | |
Proceeds from shares sold | | | | | | | | | | | | | | | | |
Class A | | | 4,723 | | | | 45,369 | | | | 8,776 | | | | 87,647 | |
Class C | | | 387 | | | | 3,780 | | | | 114 | | | | 1,104 | |
Class R6 | | | 10,370 | | | | 101,174 | | | | 39,081 | | | | 388,425 | |
| | | | |
| | | | | | | 150,323 | | | | | | | | 477,176 | |
| | | | |
Reinvestment of distributions | | | | | | | | | | | | | | | | |
Class A | | | 0 | | | | 0 | | | | 225 | | | | 2,380 | |
Class C | | | 0 | | | | 0 | | | | 1 | | | | 13 | |
Class R6 | | | 0 | | | | 0 | | | | 732 | | | | 7,780 | |
| | | | |
| | | | | | | 0 | | | | | | | | 10,173 | |
| | | | |
Payment for shares redeemed | | | | | | | | | | | | | | | | |
Class A | | | (894 | ) | | | (8,607 | ) | | | (802 | ) | | | (8,231 | ) |
Class C | | | 0 | | | | 0 | | | | (1 | ) | | | (10 | ) |
Class R6 | | | (3,218 | ) | | | (30,642 | ) | | | (644 | ) | | | (6,738 | ) |
| | | | |
| | | | | | | (39,249 | ) | | | | | | | (14,979 | ) |
| | | | |
Net increase in net assets resulting from capital share transactions | | | | | | | 111,074 | | | | | | | | 472,370 | |
| | | | |
Total increase in net assets | | | | | | | 807,586 | | | | | | | | 429,770 | |
| | | | |
| | | | |
Net assets | | | | | | | | | | | | | | | | |
Beginning of period | | | | | | | 5,470,098 | | | | | | | | 5,040,328 | |
| | | | |
End of period | | | | | | $ | 6,277,684 | | | | | | | $ | 5,470,098 | |
| | | | |
The accompanying notes are an integral part of these financial statements.
72 | Target Date Retirement Funds
Statements of changes in net assets
| | | | | | | | | | | | | | | | |
| | | Dynamic Target 2060 Fund | |
| | | Six months ended
August 31, 2020
(unaudited) | | | Year ended
February 29, 2020 | |
| | | | |
Operations | | | | | | | | | | | | | | | | |
Net investment income | | | | | | $ | 58,455 | | | | | | | $ | 117,194 | |
Payment from affiliate | | | | | | | 1,632 | | | | | | | | 0 | |
Net realized gains on investments | | | | | | | 112,239 | | | | | | | | 96,819 | |
Net change in unrealized gains (losses) on investments | | | | | | | 439,154 | | | | | | | | (131,404 | ) |
| | | | |
Net increase in net assets resulting from operations | | | | | | | 611,480 | | | | | | | | 82,609 | |
| | | | |
| | | | |
Distributions to shareholders from net investment income and net realized gains | | | | | | | | | | | | | | | | |
Class A | | | | | | | 0 | | | | | | | | (8,688 | ) |
Class C | | | | | | | 0 | | | | | | | | (1,309 | ) |
Class R4 | | | | | | | 0 | | | | | | | | (2,188 | ) |
Class R6 | | | | | | | 0 | | | | | | | | (108,103 | ) |
| | | | |
Total distributions to shareholders | | | | | | | 0 | | | | | | | | (120,288 | ) |
| | | | |
| | | | |
Capital share transactions | | | Shares | | | | | | | | Shares | | | | | |
Proceeds from shares sold | | | | | | | | | | | | | | | | |
Class A | | | 5,930 | | | | 51,902 | | | | 16,240 | | | | 169,838 | |
Class R6 | | | 1,986 | | | | 19,523 | | | | 876 | | | | 9,231 | |
| | | | |
| | | | | | | 71,425 | | | | | | | | 179,069 | |
| | | | |
Reinvestment of distributions | | | | | | | | | | | | | | | | |
Class A | | | 0 | | | | 0 | | | | 628 | | | | 6,654 | |
Class R6 | | | 0 | | | | 0 | | | | 10 | | | | 102 | |
| | | | |
| | | | | | | 0 | | | | | | | | 6,756 | |
| | | | |
Payment for shares redeemed | | | | | | | | | | | | | | | | |
Class A | | | (14,753 | ) | | | (131,908 | ) | | | (10,916 | ) | | | (115,961 | ) |
Class C | | | 0 | | | | 0 | | | | (1 | ) | | | (10 | ) |
Class R6 | | | (156 | ) | | | (1,562 | ) | | | 0 | | | | 0 | |
| | | | |
| | | | | | | (133,470 | ) | | | | | | | (115,971 | ) |
| | | | |
Net increase (decrease) in net assets resulting from capital share transactions | | | | | | | (62,045 | ) | | | | | | | 69,854 | |
| | | | |
Total increase in net assets | | | | | | | 549,435 | | | | | | | | 32,175 | |
| | | | |
| | | | |
Net assets | | | | | | | | | | | | | | | | |
Beginning of period | | | | | | | 5,229,868 | | | | | | | | 5,197,693 | |
| | | | |
End of period | | | | | | $ | 5,779,303 | | | | | | | $ | 5,229,868 | |
| | | | |
The accompanying notes are an integral part of these financial statements.
Target Date Retirement Funds | 73
Financial highlights
| | | | | | | | | | | | | | | | | | | | | | | | | | | | |
| | | Beginning
net asset
value per
share | | | Net
investment
income | | | Payment from affiliate | | | Net realized
and unrealized
gains (losses)
on investments | | | Distributions
from net
investment
income | | | Distributions
from net
realized gains | | | Ending
net asset
value per
share | |
| | | | | | | |
Dynamic Target Today Fund | | | | | | | | | | | | | | | | | | | | | | | | | | | | |
| | | | | | | |
Class A | | | | | | | | | | | | | | | | | | | | | | | | | | | | |
Six months ended August 31, 2020 (unaudited) | | $ | 10.60 | | | | 0.10 | | | | 0.00 | | | | 0.56 | | | | 0.00 | | | | 0.00 | | | $ | 11.26 | |
Year ended February 29, 2020 | | $ | 10.11 | | | | 0.21 | 4 | | | 0.00 | | | | 0.50 | | | | (0.22 | ) | | | 0.00 | | | $ | 10.60 | |
Year ended February 28, 20195 | | $ | 10.82 | | | | 0.13 | | | | 0.00 | | | | 0.16 | | | | (0.15 | ) | | | (0.85) | | | $ | 10.11 | |
Year ended May 31, 2018 | | $ | 10.65 | | | | 0.15 | | | | 0.00 | | | | 0.38 | | | | (0.19 | ) | | | (0.17) | | | $ | 10.82 | |
Year ended May 31, 2017 | | $ | 10.06 | | | | 0.12 | 4 | | | 0.00 | | | | 0.65 | | | | (0.09 | ) | | | (0.09) | | | $ | 10.65 | |
Year ended May 31, 20167 | | $ | 10.00 | | | | 0.06 | | | | 0.00 | | | | 0.03 | | | | (0.03 | ) | | | 0.00 | | | $ | 10.06 | |
| | | | | | | |
Class C | | | | | | | | | | | | | | | | | | | | | | | | | | | | |
Six months ended August 31, 2020 (unaudited) | | $ | 10.56 | | | | 0.06 | | | | 0.16 | | | | 0.56 | | | | 0.00 | | | | 0.00 | | | $ | 11.34 | |
Year ended February 29, 2020 | | $ | 10.08 | | | | 0.14 | | | | 0.00 | | | | 0.48 | | | | (0.14 | ) | | | 0.00 | | | $ | 10.56 | |
Year ended February 28, 20195 | | $ | 10.76 | | | | 0.08 | | | | 0.00 | | | | 0.15 | | | | (0.06 | ) | | | (0.85) | | | $ | 10.08 | |
Year ended May 31, 2018 | | $ | 10.58 | | | | 0.07 | | | | 0.00 | | | | 0.38 | | | | (0.10 | ) | | | (0.17) | | | $ | 10.76 | |
Year ended May 31, 2017 | | $ | 10.03 | | | | 0.05 | | | | 0.00 | | | | 0.64 | | | | (0.05 | ) | | | (0.09) | | | $ | 10.58 | |
Year ended May 31, 20167 | | $ | 10.00 | | | | 0.03 | | | | 0.00 | | | | 0.03 | | | | (0.03 | ) | | | 0.00 | | | $ | 10.03 | |
| | | | | | | |
Class R4 | | | | | | | | | | | | | | | | | | | | | | | | | | | | |
Six months ended August 31, 2020 (unaudited) | | $ | 10.62 | | | | 0.12 | | | | 0.00 | | | | 0.55 | | | | 0.00 | | | | 0.00 | | | $ | 11.29 | |
Year ended February 29, 2020 | | $ | 10.10 | | | | 0.25 | | | | 0.00 | | | | 0.49 | | | | (0.22 | ) | | | 0.00 | | | $ | 10.62 | |
Year ended February 28, 20195 | | $ | 10.81 | | | | 0.16 | | | | 0.00 | | | | 0.16 | | | | (0.18 | ) | | | (0.85) | | | $ | 10.10 | |
Year ended May 31, 2018 | | $ | 10.63 | | | | 0.18 | | | | 0.00 | | | | 0.38 | | | | (0.21 | ) | | | (0.17) | | | $ | 10.81 | |
Year ended May 31, 2017 | | $ | 10.07 | | | | 0.16 | | | | 0.00 | | | | 0.64 | | | | (0.15 | ) | | | (0.09) | | | $ | 10.63 | |
Year ended May 31, 20167 | | $ | 10.00 | | | | 0.08 | | | | 0.00 | | | | 0.03 | | | | (0.04 | ) | | | 0.00 | | | $ | 10.07 | |
| | | | | | | |
Class R6 | | | | | | | | | | | | | | | | | | | | | | | | | | | | |
Six months ended August 31, 2020 (unaudited) | | $ | 10.62 | | | | 0.12 | | | | 0.00 | | | | 0.56 | | | | 0.00 | | | | 0.00 | | | $ | 11.30 | |
Year ended February 29, 2020 | | $ | 10.10 | | | | 0.27 | 4 | | | 0.00 | | | | 0.49 | | | | (0.24 | ) | | | 0.00 | | | $ | 10.62 | |
Year ended February 28, 20195 | | $ | 10.82 | | | | 0.17 | | | | 0.00 | | | | 0.15 | | | | (0.19 | ) | | | (0.85) | | | $ | 10.10 | |
Year ended May 31, 2018 | | $ | 10.64 | | | | 0.20 | | | | 0.00 | | | | 0.38 | | | | (0.23 | ) | | | (0.17) | | | $ | 10.82 | |
Year ended May 31, 2017 | | $ | 10.08 | | | | 0.17 | | | | 0.00 | | | | 0.65 | | | | (0.17 | ) | | | (0.09) | | | $ | 10.64 | |
Year ended May 31, 20167 | | $ | 10.00 | | | | 0.09 | | | | 0.00 | | | | 0.03 | | | | (0.04 | ) | | | 0.00 | | | $ | 10.08 | |
| 1 | Total return calculations do not include any sales charges. Returns for periods of less than one year are not annualized. |
| 2 | Portfolio turnover rate is calculated by multiplying the Fund’s ownership percentage in each respective affiliated Master Portfolio by the corresponding affiliated Master Portfolio’s purchases and sales. These purchase and sale amounts are aggregated with any direct purchases and sales in affiliated and unaffiliated mutual funds, exchange-traded funds and unaffiliated securities and included in the portfolio turnover calculation. |
| 3 | Ratios reflect net expenses allocated from the affiliated Master Portfolios which were as follows: |
| | | | | | | | | | | | |
| | | Six months ended
August 31, 2020
(unaudited) | | | Year ended
February 29, 2020 | | | Year ended
February 28, 20195 | |
Class A | | | 0.10 | % | | | 0.12 | % | | | 0.12 | % |
Class C | | | 0.09 | | | | 0.11 | | | | 0.11 | |
Class R4 | | | 0.09 | | | | 0.11 | | | | 0.11 | |
Class R6 | | | 0.11 | | | | 0.12 | | | | 0.12 | |
| 4 | Calculated based upon average shares outstanding |
| 5 | For the nine months ended February 28, 2019. The Fund changed its fiscal year end from May 31 to February 28, effective February 28, 2019. |
| 6 | Ratios do not reflect net expenses allocated from the affiliated Master Portfolios. Including annualized net expenses allocated from the affiliated Master Portfolios, the expense ratios would be increased by the following amounts: |
| | | | | | | | | | | | |
| | | Year ended May 31 | |
| | | 2018 | | | 2017 | | | 20167 | |
Class A | | | 0.10 | % | | | 0.10 | % | | | 0.11 | % |
Class C | | | 0.10 | | | | 0.10 | | | | 0.10 | |
Class R4 | | | 0.10 | | | | 0.10 | | | | 0.11 | |
Class R6 | | | 0.10 | | | | 0.11 | | | | 0.11 | |
| 7 | For the period from November 30, 2015 (commencement of class operations) to May 31, 2016 |
| 8 | During the six months ended August 31, 2020, the Fund received a payment from an affiliate which had an impact of 1.52% on the total return. See Note 4 in the Notes to Financial Statements for additional information. |
The accompanying notes are an integral part of these financial statements.
74 | Target Date Retirement Funds
Financial highlights
| | | | | | | | | | | | | | | | | | | | | | |
| Ratio to average net assets (annualized) | | | | | | Portfolio
turnover
rate2 | | |
Net assets at
end of period
(000s omitted) | |
Net investment
income | | | Gross
expenses | | | Net
expenses | | | Total
return1 | |
| | | | | |
| | | | | | | | | | | | | | | | | | | | | | | |
| | | | | |
| | | | | | | | | | | | | | | | | | | | | | |
| | 1.84 | %3 | | | 3.17 | %3 | | | 0.68 | %3 | | | 6.23 | % | | | 43 | % | | $ | 941 | |
| | 1.95 | %3 | | | 3.37 | %3 | | | 0.66 | %3 | | | 6.95 | % | | | 39 | % | | $ | 1,022 | |
| | 1.75 | %3 | | | 4.39 | %3 | | | 0.59 | %3 | | | 3.16 | % | | | 48 | % | | $ | 400 | |
| | 1.37 | % | | | 4.39 | %6 | | | 0.48 | %6 | | | 4.96 | % | | | 94 | % | | $ | 384 | |
| | 1.16 | % | | | 4.67 | %6 | | | 0.53 | %6 | | | 7.97 | % | | | 97 | % | | $ | 238 | |
| | 1.31 | % | | | 5.22 | %6 | | | 0.53 | %6 | | | 0.95 | % | | | 66 | % | | $ | 101 | |
| | | | | |
| | | | | | | | | | | | | | | | | | | | | | |
| | 1.09 | %3 | | | 3.39 | %3 | | | 1.43 | %3 | | | 7.39 | %8 | | | 43 | % | | $ | 115 | |
| | 1.33 | %3 | | | 4.02 | %3 | | | 1.41 | %3 | | | 6.11 | % | | | 39 | % | | $ | 107 | |
| | 0.99 | %3 | | | 5.14 | %3 | | | 1.34 | %3 | | | 2.60 | % | | | 48 | % | | $ | 102 | |
| | 0.65 | % | | | 5.14 | %6 | | | 1.24 | %6 | | | 4.25 | % | | | 94 | % | | $ | 109 | |
| | 0.45 | % | | | 5.45 | %6 | | | 1.28 | %6 | | | 7.12 | % | | | 97 | % | | $ | 108 | |
| | 0.56 | % | | | 5.97 | %6 | | | 1.28 | %6 | | | 0.58 | % | | | 66 | % | | $ | 101 | |
| | | | | |
| | | | | | | | | | | | | | | | | | | | | | |
| | 2.15 | %3 | | | 2.87 | %3 | | | 0.37 | %3 | | | 6.31 | % | | | 43 | % | | $ | 116 | |
| | 2.38 | %3 | | | 3.17 | %3 | | | 0.36 | %3 | | | 7.33 | % | | | 39 | % | | $ | 109 | |
| | 2.02 | %3 | | | 4.11 | %3 | | | 0.31 | %3 | | | 3.42 | % | | | 48 | % | | $ | 104 | |
| | 1.67 | % | | | 4.11 | %6 | | | 0.22 | %6 | | | 5.27 | % | | | 94 | % | | $ | 111 | |
| | 1.51 | % | | | 4.42 | %6 | | | 0.22 | %6 | | | 8.21 | % | | | 97 | % | | $ | 109 | |
| | 1.62 | % | | | 4.94 | %6 | | | 0.22 | %6 | | | 1.08 | % | | | 66 | % | | $ | 101 | |
| | | | | |
| | | | | | | | | | | | | | | | | | | | | | |
| | 2.30 | %3 | | | 2.74 | %3 | | | 0.22 | %3 | | | 6.40 | % | | | 43 | % | | $ | 6,001 | |
| | 2.51 | %3 | | | 3.02 | %3 | | | 0.21 | %3 | | | 7.48 | % | | | 39 | % | | $ | 5,545 | |
| | 2.17 | %3 | | | 3.97 | %3 | | | 0.16 | %3 | | | 3.49 | % | | | 48 | % | | $ | 4,785 | |
| | 1.82 | % | | | 3.96 | %6 | | | 0.07 | %6 | | | 5.42 | % | | | 94 | % | | $ | 5,123 | |
| | 1.67 | % | | | 4.27 | %6 | | | 0.06 | %6 | | | 8.48 | % | | | 97 | % | | $ | 5,037 | |
| | 1.77 | % | | | 4.79 | %6 | | | 0.07 | %6 | | | 1.19 | % | | | 66 | % | | $ | 4,654 | |
The accompanying notes are an integral part of these financial statements.
Target Date Retirement Funds | 75
Financial highlights
| | | | | | | | | | | | | | | | | | | | | | | | | | | | |
| | | Beginning
net asset
value per
share | | | Net
investment
income | | | Payment from affiliate | | | Net realized
and unrealized
gains (losses)
on investments | | | Distributions
from net
investment
income | | | Distributions
from net
realized gains | | | Ending
net asset
value per
share | |
| | | | | | | |
Dynamic Target 2015 Fund | | | | | | | | | | | | | | | | | | | | | | | | | | | | |
| | | | | | | |
Class A | | | | | | | | | | | | | | | | | | | | | | | | | | | | |
Six months ended August 31, 2020 (unaudited) | | $ | 10.40 | | | | 0.10 | | | | 0.00 | | | | 0.56 | | | | 0.00 | | | | 0.00 | | | $ | 11.06 | |
Year ended February 29, 2020 | | $ | 9.99 | | | | 0.22 | | | | 0.00 | | | | 0.41 | | | | (0.22 | ) | | | 0.00 | | | $ | 10.40 | |
Year ended February 28, 20194 | | $ | 11.06 | | | | 0.12 | | | | 0.00 | | | | 0.15 | | | | (0.13 | ) | | | (1.21) | | | $ | 9.99 | |
Year ended May 31, 2018 | | $ | 10.76 | | | | 0.15 | 5 | | | 0.00 | | | | 0.56 | | | | (0.19 | ) | | | (0.22) | | | $ | 11.06 | |
Year ended May 31, 2017 | | $ | 9.99 | | | | 0.11 | | | | 0.00 | | | | 0.86 | | | | (0.09 | ) | | | (0.11) | | | $ | 10.76 | |
Year ended May 31, 20167 | | $ | 10.00 | | | | 0.07 | | | | 0.00 | | | | (0.04 | ) | | | (0.04 | ) | | | 0.00 | | | $ | 9.99 | |
| | | | | | | |
Class C | | | | | | | | | | | | | | | | | | | | | | | | | | | | |
Six months ended August 31, 2020 (unaudited) | | $ | 10.35 | | | | 0.06 | | | | 0.17 | | | | 0.55 | | | | 0.00 | | | | 0.00 | | | $ | 11.13 | |
Year ended February 29, 2020 | | $ | 9.96 | | | | 0.13 | | | | 0.00 | | | | 0.42 | | | | (0.16 | ) | | | 0.00 | | | $ | 10.35 | |
Year ended February 28, 20194 | | $ | 11.01 | | | | 0.06 | | | | 0.00 | | | | 0.15 | | | | (0.05 | ) | | | (1.21) | | | $ | 9.96 | |
Year ended May 31, 2018 | | $ | 10.71 | | | | 0.06 | | | | 0.00 | | | | 0.56 | | | | (0.10 | ) | | | (0.22) | | | $ | 11.01 | |
Year ended May 31, 2017 | | $ | 9.97 | | | | 0.04 | | | | 0.00 | | | | 0.85 | | | | (0.04 | ) | | | (0.11) | | | $ | 10.71 | |
Year ended May 31, 20167 | | $ | 10.00 | | | | 0.03 | | | | 0.00 | | | | (0.02 | ) | | | (0.04 | ) | | | 0.00 | | | $ | 9.97 | |
| | | | | | | |
Class R4 | | | | | | | | | | | | | | | | | | | | | | | | | | | | |
Six months ended August 31, 2020 (unaudited) | | $ | 10.40 | | | | 0.11 | | | | 0.00 | | | | 0.56 | | | | 0.00 | | | | 0.00 | | | $ | 11.07 | |
Year ended February 29, 2020 | | $ | 9.99 | | | | 0.24 | | | | 0.00 | | | | 0.42 | | | | (0.25 | ) | | | 0.00 | | | $ | 10.40 | |
Year ended February 28, 20194 | | $ | 11.07 | | | | 0.15 | | | | 0.00 | | | | 0.14 | | | | (0.16 | ) | | | (1.21) | | | $ | 9.99 | |
Year ended May 31, 2018 | | $ | 10.75 | | | | 0.17 | | | | 0.00 | | | | 0.58 | | | | (0.21 | ) | | | (0.22) | | | $ | 11.07 | |
Year ended May 31, 2017 | | $ | 10.01 | | | | 0.15 | | | | 0.00 | | | | 0.84 | | | | (0.14 | ) | | | (0.11) | | | $ | 10.75 | |
Year ended May 31, 20167 | | $ | 10.00 | | | | 0.08 | | | | 0.00 | | | | (0.02 | ) | | | (0.05 | ) | | | 0.00 | | | $ | 10.01 | |
| | | | | | | |
Class R6 | | | | | | | | | | | | | | | | | | | | | | | | | | | | |
Six months ended August 31, 2020 (unaudited) | | $ | 10.41 | | | | 0.12 | | | | 0.00 | | | | 0.56 | | | | 0.00 | | | | 0.00 | | | $ | 11.09 | |
Year ended February 29, 2020 | | $ | 9.99 | | | | 0.26 | | | | 0.00 | | | | 0.42 | | | | (0.26 | ) | | | 0.00 | | | $ | 10.41 | |
Year ended February 28, 20194 | | $ | 11.07 | | | | 0.16 | | | | 0.00 | | | | 0.15 | | | | (0.18 | ) | | | (1.21) | | | $ | 9.99 | |
Year ended May 31, 2018 | | $ | 10.76 | | | | 0.19 | | | | 0.00 | | | | 0.57 | | | | (0.23 | ) | | | (0.22) | | | $ | 11.07 | |
Year ended May 31, 2017 | | $ | 10.01 | | | | 0.16 | | | | 0.00 | | | | 0.86 | | | | (0.16 | ) | | | (0.11) | | | $ | 10.76 | |
Year ended May 31, 20167 | | $ | 10.00 | | | | 0.09 | | | | 0.00 | | | | (0.03 | ) | | | (0.05 | ) | | | 0.00 | | | $ | 10.01 | |
| 1 | Total return calculations do not include any sales charges. Returns for periods of less than one year are not annualized. |
| 2 | Portfolio turnover rate is calculated by multiplying the Fund’s ownership percentage in each respective affiliated Master Portfolio by the corresponding affiliated Master Portfolio’s purchases and sales. These purchase and sale amounts are aggregated with any direct purchases and sales in affiliated and unaffiliated mutual funds, exchange-traded funds and unaffiliated securities and included in the portfolio turnover calculation. |
| 3 | Ratios reflect net expenses allocated from the affiliated Master Portfolios which were as follows: |
| | | | | | | | | | | | |
| | | Six months ended
August 31, 2020
(unaudited) | | | Year ended
February 29, 2020 | | | Year ended
February 28, 20194 | |
Class A | | | 0.11 | % | | | 0.13 | % | | | 0.12 | % |
Class C | | | 0.09 | | | | 0.12 | | | | 0.11 | |
Class R4 | | | 0.09 | | | | 0.12 | | | | 0.11 | |
Class R6 | | | 0.11 | | | | 0.13 | | | | 0.12 | |
| 4 | For the nine months ended February 28, 2019. The Fund changed its fiscal year end from May 31 to February 28, effective February 28, 2019. |
| 5 | Calculated based upon average shares outstanding |
| 6 | Ratios do not reflect net expenses allocated from the affiliated Master Portfolios. Including annualized net expenses allocated from the affiliated Master Portfolios, the expense ratios would be increased by the following amounts: |
| | | | | | | | | | | | |
| | | Year ended May 31 | |
| | | 2018 | | | 2017 | | | 20167 | |
Class A | | | 0.10 | % | | | 0.11 | % | | | 0.10 | % |
Class C | | | 0.09 | | | | 0.10 | | | | 0.10 | |
Class R4 | | | 0.09 | | | | 0.10 | | | | 0.10 | |
Class R6 | | | 0.10 | | | | 0.11 | | | | 0.11 | |
| 7 | For the period from November 30, 2015 (commencement of class operations) to May 31, 2016 |
| 8 | During the six months ended August 31, 2020, the Fund received a payment from an affiliate which had an impact of 1.65% on the total return. See Note 4 in the Notes to Financial Statements for additional information. |
The accompanying notes are an integral part of these financial statements.
76 | Target Date Retirement Funds
Financial highlights
| | | | | | | | | | | | | | | | | | | | | | |
| Ratio to average net assets (annualized) | | | | | | Portfolio
turnover
rate2 | | |
Net assets at
end of period
(000s omitted) | |
Net investment
income | | | Gross
expenses | | | Net
expenses | | | Total
return1 | |
| | | | | |
| | | | | | | | | | | | | | | | | | | | | | | |
| | | | | |
| | | | | | | | | | | | | | | | | | | | | | |
| | 1.86 | %3 | | | 3.64 | %3 | | | 0.68 | %3 | | | 6.35 | % | | | 45 | % | | $ | 480 | |
| | 2.00 | %3 | | | 3.63 | %3 | | | 0.65 | %3 | | | 6.22 | % | | | 38 | % | | $ | 460 | |
| | 1.50 | %3 | | | 4.23 | %3 | | | 0.61 | %3 | | | 3.09 | % | | | 45 | % | | $ | 390 | |
| | 1.33 | % | | | 4.14 | %6 | | | 0.51 | %6 | | | 6.62 | % | | | 82 | % | | $ | 456 | |
| | 1.14 | % | | | 4.42 | %6 | | | 0.51 | %6 | | | 9.95 | % | | | 81 | % | | $ | 363 | |
| | 1.16 | % | | | 5.21 | %6 | | | 0.45 | %6 | | | 0.34 | % | | | 38 | % | | $ | 199 | |
| | | | | |
| | | | | | | | | | | | | | | | | | | | | | |
| | 1.10 | %3 | | | 3.87 | %3 | | | 1.43 | %3 | | | 7.54 | %8 | | | 45 | % | | $ | 113 | |
| | 1.26 | %3 | | | 4.19 | %3 | | | 1.42 | %3 | | | 5.49 | % | | | 38 | % | | $ | 105 | |
| | 0.76 | %3 | | | 4.97 | %3 | | | 1.36 | %3 | | | 2.46 | % | | | 45 | % | | $ | 101 | |
| | 0.52 | % | | | 4.89 | %6 | | | 1.27 | %6 | | | 5.80 | % | | | 82 | % | | $ | 112 | |
| | 0.40 | % | | | 5.18 | %6 | | | 1.27 | %6 | | | 9.18 | % | | | 81 | % | | $ | 109 | |
| | 0.56 | % | | | 5.96 | %6 | | | 1.28 | %6 | | | 0.07 | % | | | 38 | % | | $ | 100 | |
| | | | | |
| | | | | | | | | | | | | | | | | | | | | | |
| | 2.16 | %3 | | | 3.34 | %3 | | | 0.37 | %3 | | | 6.44 | % | | | 45 | % | | $ | 114 | |
| | 2.31 | %3 | | | 3.34 | %3 | | | 0.36 | %3 | | | 6.51 | % | | | 38 | % | | $ | 107 | |
| | 1.77 | %3 | | | 3.94 | %3 | | | 0.31 | %3 | | | 3.30 | % | | | 45 | % | | $ | 103 | |
| | 1.56 | % | | | 3.86 | %6 | | | 0.23 | %6 | | | 7.01 | % | | | 82 | % | | $ | 114 | |
| | 1.45 | % | | | 4.15 | %6 | | | 0.22 | %6 | | | 10.28 | % | | | 81 | % | | $ | 111 | |
| | 1.61 | % | | | 4.93 | %6 | | | 0.22 | %6 | | | 0.57 | % | | | 38 | % | | $ | 101 | |
| | | | | |
| | | | | | | | | | | | | | | | | | | | | | |
| | 2.31 | %3 | | | 3.21 | %3 | | | 0.22 | %3 | | | 6.53 | % | | | 45 | % | | $ | 5,260 | |
| | 2.46 | %3 | | | 3.20 | %3 | | | 0.21 | %3 | | | 6.77 | % | | | 38 | % | | $ | 4,937 | |
| | 1.91 | %3 | | | 3.80 | %3 | | | 0.16 | %3 | | | 3.47 | % | | | 45 | % | | $ | 4,740 | |
| | 1.72 | % | | | 3.71 | %6 | | | 0.07 | %6 | | | 7.06 | % | | | 82 | % | | $ | 5,253 | |
| | 1.60 | % | | | 4.00 | %6 | | | 0.06 | %6 | | | 10.44 | % | | | 81 | % | | $ | 5,105 | |
| | 1.77 | % | | | 4.78 | %6 | | | 0.06 | %6 | | | 0.58 | % | | | 38 | % | | $ | 4,629 | |
The accompanying notes are an integral part of these financial statements.
Target Date Retirement Funds | 77
Financial highlights
| | | | | | | | | | | | | | | | | | | | | | | | | | | | |
| | | Beginning
net asset
value per
share | | | Net
investment
income | | | Payment from affiliate | | | Net realized
and unrealized
gains (losses)
on investments | | | Distributions
from net
investment
income | | | Distributions
from net
realized gains | | | Ending
net asset
value per
share | |
| | | | | | | |
Dynamic Target 2020 Fund | | | | | | | | | | | | | | | | | | | | | | | | | | | | |
| | | | | | | |
Class A | | | | | | | | | | | | | | | | | | | | | | | | | | | | |
Six months ended August 31, 2020 (unaudited) | | $ | 10.28 | | | | 0.09 | | | | 0.00 | | | | 0.62 | | | | 0.00 | | | | 0.00 | | | $ | 10.99 | |
Year ended February 29, 2020 | | $ | 9.95 | | | | 0.19 | 4 | | | 0.00 | | | | 0.35 | | | | (0.21 | ) | | | 0.00 | | | $ | 10.28 | |
Year ended February 28, 20195 | | $ | 11.18 | | | | 0.11 | | | | 0.00 | | | | 0.18 | | | | (0.12 | ) | | | (1.40) | | | $ | 9.95 | |
Year ended May 31, 2018 | | $ | 10.78 | | | | 0.14 | | | | 0.00 | | | | 0.70 | | | | (0.19 | ) | | | (0.25) | | | $ | 11.18 | |
Year ended May 31, 2017 | | $ | 9.99 | | | | 0.11 | 4 | | | 0.00 | | | | 0.97 | | | | (0.12 | ) | | | (0.17) | | | $ | 10.78 | |
Year ended May 31, 20167 | | $ | 10.00 | | | | 0.06 | | | | 0.00 | | | | (0.03 | ) | | | (0.04 | ) | | | 0.00 | | | $ | 9.99 | |
| | | | | | | |
Class C | | | | | | | | | | | | | | | | | | | | | | | | | | | | |
Six months ended August 31, 2020 (unaudited) | | $ | 10.28 | | | | 0.05 | | | | 0.13 | | | | 0.62 | | | | 0.00 | | | | 0.00 | | | $ | 11.08 | |
Year ended February 29, 2020 | | $ | 9.95 | | | | 0.13 | | | | 0.00 | | | | 0.33 | | | | (0.13 | ) | | | 0.00 | | | $ | 10.28 | |
Year ended February 28, 20195 | | $ | 11.15 | | | | 0.06 | | | | 0.00 | | | | 0.17 | | | | (0.03 | ) | | | (1.40) | | | $ | 9.95 | |
Year ended May 31, 2018 | | $ | 10.76 | | | | 0.05 | | | | 0.00 | | | | 0.69 | | | | (0.10 | ) | | | (0.25) | | | $ | 11.15 | |
Year ended May 31, 2017 | | $ | 9.96 | | | | 0.03 | | | | 0.00 | | | | 0.98 | | | | (0.04 | ) | | | (0.17) | | | $ | 10.76 | |
Year ended May 31, 20167 | | $ | 10.00 | | | | 0.03 | | | | 0.00 | | | | (0.03 | ) | | | (0.04 | ) | | | 0.00 | | | $ | 9.96 | |
| | | | | | | |
Class R4 | | | | | | | | | | | | | | | | | | | | | | | | | | | | |
Six months ended August 31, 2020 (unaudited) | | $ | 10.34 | | | | 0.11 | | | | 0.00 | | | | 0.62 | | | | 0.00 | | | | 0.00 | | | $ | 11.07 | |
Year ended February 29, 2020 | | $ | 9.99 | | | | 0.24 | | | | 0.00 | | | | 0.33 | | | | (0.22 | ) | | | 0.00 | | | $ | 10.34 | |
Year ended February 28, 20195 | | $ | 11.22 | | | | 0.14 | | | | 0.00 | | | | 0.17 | | | | (0.14 | ) | | | (1.40) | | | $ | 9.99 | |
Year ended May 31, 2018 | | $ | 10.82 | | | | 0.17 | | | | 0.00 | | | | 0.69 | | | | (0.21 | ) | | | (0.25) | | | $ | 11.22 | |
Year ended May 31, 2017 | | $ | 10.01 | | | | 0.14 | | | | 0.00 | | | | 0.97 | | | | (0.13 | ) | | | (0.17) | | | $ | 10.82 | |
Year ended May 31, 20167 | | $ | 10.00 | | | | 0.08 | | | | 0.00 | | | | (0.02 | ) | | | (0.05 | ) | | | 0.00 | | | $ | 10.01 | |
| | | | | | | |
Class R6 | | | | | | | | | | | | | | | | | | | | | | | | | | | | |
Six months ended August 31, 2020 (unaudited) | | $ | 10.34 | | | | 0.12 | | | | 0.00 | | | | 0.62 | | | | 0.00 | | | | 0.00 | | | $ | 11.08 | |
Year ended February 29, 2020 | | $ | 9.99 | | | | 0.25 | | | | 0.00 | | | | 0.34 | | | | (0.24 | ) | | | 0.00 | | | $ | 10.34 | |
Year ended February 28, 20195 | | $ | 11.23 | | | | 0.15 | | | | 0.00 | | | | 0.17 | | | | (0.16 | ) | | | (1.40) | | | $ | 9.99 | |
Year ended May 31, 2018 | | $ | 10.82 | | | | 0.18 | | | | 0.00 | | | | 0.71 | | | | (0.23 | ) | | | (0.25) | | | $ | 11.23 | |
Year ended May 31, 2017 | | $ | 10.01 | | | | 0.16 | | | | 0.00 | | | | 0.97 | | | | (0.15 | ) | | | (0.17) | | | $ | 10.82 | |
Year ended May 31, 20167 | | $ | 10.00 | | | | 0.08 | | | | 0.00 | | | | (0.02 | ) | | | (0.05 | ) | | | 0.00 | | | $ | 10.01 | |
| 1 | Total return calculations do not include any sales charges. Returns for periods of less than one year are not annualized. |
| 2 | Portfolio turnover rate is calculated by multiplying the Fund’s ownership percentage in the respective affiliated Master Portfolio by the corresponding affiliated Master Portfolio’s purchases and sales. These purchase and sale amounts are aggregated with any direct purchases and sales in affiliated and unaffiliated mutual funds, exchange-traded funds and unaffiliated securities and included in the portfolio turnover calculation. |
| 3 | Ratios reflect net expenses allocated from the affiliated Master Portfolios which were as follows: |
| | | | | | | | | | | | |
| | | Six months ended
August 31, 2020
(unaudited) | | | Year ended
February 29, 2020 | | | Year ended
February 28, 20195 | |
Class A | | | 0.11 | % | | | 0.14 | % | | | 0.12 | % |
Class C | | | 0.10 | | | | 0.12 | | | | 0.11 | |
Class R4 | | | 0.10 | | | | 0.12 | | | | 0.11 | |
Class R6 | | | 0.11 | | | | 0.14 | | | | 0.13 | |
| 4 | Calculated based upon average shares outstanding |
| 5 | For the nine months ended February 28, 2019. The Fund changed its fiscal year end from May 31 to February 28, effective February 28, 2019. |
| 6 | Ratios do not reflect net expenses allocated from the affiliated Master Portfolios. Including annualized net expenses allocated from the affiliated Master Portfolios, the expense ratios would be increased by the following amounts: |
| | | | | | | | | | | | |
| | | Year ended May 31 | |
| | | 2018 | | | 2017 | | | 20167 | |
Class A | | | 0.10 | % | | | 0.10 | % | | | 0.10 | % |
Class C | | | 0.09 | | | | 0.10 | | | | 0.10 | |
Class R4 | | | 0.09 | | | | 0.10 | | | | 0.10 | |
Class R6 | | | 0.10 | | | | 0.11 | | | | 0.11 | |
| 7 | For the period from November 30, 2015 (commencement of class operations) to May 31, 2016 |
| 8 | During the six months ended August 31, 2020, the Fund received a payment from an affiliate which had an impact of 1.26% on the total return. See Note 4 in the Notes to Financial Statements for additional information. |
The accompanying notes are an integral part of these financial statements.
78 | Target Date Retirement Funds
Financial highlights
| | | | | | | | | | | | | | | | | | | | | | |
| Ratio to average net assets (annualized) | | | | | | Portfolio
turnover
rate2 | | |
Net assets at
end of period
(000s omitted) | |
Net investment
income | | | Gross
expenses | | | Net
expenses | | | Total
return1 | |
| | | | | |
| | | | | | | | | | | | | | | | | | | | | | | |
| | | | | |
| | | | | | | | | | | | | | | | | | | | | | |
| | 1.87 | %3 | | | 3.17 | %3 | | | 0.68 | %3 | | | 6.91 | % | | | 47 | % | | $ | 1,311 | |
| | 1.81 | %3 | | | 3.27 | %3 | | | 0.67 | %3 | | | 5.31 | % | | | 38 | % | | $ | 1,435 | |
| | 1.38 | %3 | | | 4.04 | %3 | | | 0.61 | %3 | | | 3.33 | % | | | 42 | % | | $ | 623 | |
| | 1.15 | % | | | 3.96 | %6 | | | 0.52 | %6 | | | 7.80 | % | | | 72 | % | | $ | 540 | |
| | 1.09 | % | | | 4.32 | %6 | | | 0.51 | %6 | | | 11.18 | % | | | 69 | % | | $ | 380 | |
| | 1.33 | % | | | 5.21 | %6 | | | 0.54 | %6 | | | 0.35 | % | | | 38 | % | | $ | 119 | |
| | | | | |
| | | | | | | | | | | | | | | | | | | | | | |
| | 1.06 | %3 | | | 3.44 | %3 | | | 1.43 | %3 | | | 7.78 | %8 | | | 47 | % | | $ | 146 | |
| | 1.21 | %3 | | | 3.88 | %3 | | | 1.42 | %3 | | | 4.61 | % | | | 38 | % | | $ | 105 | |
| | 0.66 | %3 | | | 4.79 | %3 | | | 1.37 | %3 | | | 2.72 | % | | | 42 | % | | $ | 102 | |
| | 0.43 | % | | | 4.71 | %6 | | | 1.28 | %6 | | | 6.89 | % | | | 72 | % | | $ | 114 | |
| | 0.33 | % | | | 5.09 | %6 | | | 1.28 | %6 | | | 10.39 | % | | | 69 | % | | $ | 110 | |
| | 0.53 | % | | | 5.97 | %6 | | | 1.29 | %6 | | | 0.01 | % | | | 38 | % | | $ | 100 | |
| | | | | |
| | | | | | | | | | | | | | | | | | | | | | |
| | 2.14 | %3 | | | 2.87 | %3 | | | 0.37 | %3 | | | 7.06 | % | | | 47 | % | | $ | 115 | |
| | 2.26 | %3 | | | 3.03 | %3 | | | 0.36 | %3 | | | 5.62 | % | | | 38 | % | | $ | 107 | |
| | 1.71 | %3 | | | 3.77 | %3 | | | 0.32 | %3 | | | 3.59 | % | | | 42 | % | | $ | 103 | |
| | 1.47 | % | | | 3.68 | %6 | | | 0.24 | %6 | | | 8.03 | % | | | 72 | % | | $ | 116 | |
| | 1.39 | % | | | 4.06 | %6 | | | 0.23 | %6 | | | 11.60 | % | | | 69 | % | | $ | 112 | |
| | 1.59 | % | | | 4.94 | %6 | | | 0.23 | %6 | | | 0.61 | % | | | 38 | % | | $ | 101 | |
| | | | | |
| | | | | | | | | | | | | | | | | | | | | | |
| | 2.29 | %3 | | | 2.74 | %3 | | | 0.22 | %3 | | | 7.16 | % | | | 47 | % | | $ | 5,506 | |
| | 2.40 | %3 | | | 2.90 | %3 | | | 0.21 | %3 | | | 5.77 | % | | | 38 | % | | $ | 5,118 | |
| | 1.86 | %3 | | | 3.63 | %3 | | | 0.17 | %3 | | | 3.65 | % | | | 42 | % | | $ | 4,767 | |
| | 1.63 | % | | | 3.53 | %6 | | | 0.08 | %6 | | | 8.28 | % | | | 72 | % | | $ | 5,359 | |
| | 1.54 | % | | | 3.91 | %6 | | | 0.07 | %6 | | | 11.64 | % | | | 69 | % | | $ | 5,165 | |
| | 1.74 | % | | | 4.79 | %6 | | | 0.07 | %6 | | | 0.62 | % | | | 38 | % | | $ | 4,631 | |
The accompanying notes are an integral part of these financial statements.
Target Date Retirement Funds | 79
Financial highlights
| | | | | | | | | | | | | | | | | | | | | | | | | | | | |
| | | Beginning
net asset
value per
share | | | Net
investment
income | | | Payment from affiliate | | | Net realized
and unrealized
gains (losses)
on investments | | | Distributions
from net
investment
income | | | Distributions
from net
realized gains | | | Ending
net asset
value per
share | |
| | | | | | | |
Dynamic Target 2025 Fund | | | | | | | | | | | | | | | | | | | | | | | | | | | | |
| | | | | | | |
Class A | | | | | | | | | | | | | | | | | | | | | | | | | | | | |
Six months ended August 31, 2020 (unaudited) | | $ | 10.36 | | | | 0.10 | | | | 0.00 | | | | 0.84 | | | | 0.00 | | | | 0.00 | | | $ | 11.30 | |
Year ended February 29, 2020 | | $ | 10.10 | | | | 0.19 | | | | 0.00 | | | | 0.25 | | | | (0.18 | ) | | | 0.00 | | | $ | 10.36 | |
Year ended February 28, 20194 | | $ | 11.38 | | | | 0.10 | | | | 0.00 | | | | 0.12 | | | | (0.10 | ) | | | (1.40 | ) | | $ | 10.10 | |
Year ended May 31, 2018 | | $ | 10.87 | | | | 0.11 | 5 | | | 0.00 | | | | 0.87 | | | | (0.19 | ) | | | (0.28 | ) | | $ | 11.38 | |
Year ended May 31, 2017 | | $ | 9.94 | | | | 0.09 | | | | 0.00 | | | | 1.13 | | | | (0.12 | ) | | | (0.17 | ) | | $ | 10.87 | |
Year ended May 31, 20167 | | $ | 10.00 | | | | 0.07 | | | | 0.00 | | | | (0.08 | ) | | | (0.05 | ) | | | 0.00 | | | $ | 9.94 | |
| | | | | | | |
Class C | | | | | | | | | | | | | | | | | | | | | | | | | | | | |
Six months ended August 31, 2020 (unaudited) | | $ | 10.35 | | | | 0.06 | | | | 0.15 | | | | 0.84 | | | | 0.00 | | | | 0.00 | | | $ | 11.40 | |
Year ended February 29, 2020 | | $ | 10.10 | | | | 0.12 | | | | 0.00 | | | | 0.24 | | | | (0.11 | ) | | | 0.00 | | | $ | 10.35 | |
Year ended February 28, 20194 | | $ | 11.35 | | | | 0.05 | | | | 0.00 | | | | 0.12 | | | | (0.02 | ) | | | (1.40 | ) | | $ | 10.10 | |
Year ended May 31, 2018 | | $ | 10.84 | | | | 0.04 | | | | 0.00 | | | | 0.85 | | | | (0.10 | ) | | | (0.28 | ) | | $ | 11.35 | |
Year ended May 31, 2017 | | $ | 9.91 | | | | 0.03 | | | | 0.00 | | | | 1.10 | | | | (0.03 | ) | | | (0.17 | ) | | $ | 10.84 | |
Year ended May 31, 20167 | | $ | 10.00 | | | | 0.02 | | | | 0.00 | | | | (0.06 | ) | | | (0.05 | ) | | | 0.00 | | | $ | 9.91 | |
| | | | | | | |
Class R4 | | | | | | | | | | | | | | | | | | | | | | | | | | | | |
Six months ended August 31, 2020 (unaudited) | | $ | 10.42 | | | | 0.11 | | | | 0.00 | | | | 0.85 | | | | 0.00 | | | | 0.00 | | | $ | 11.38 | |
Year ended February 29, 2020 | | $ | 10.14 | | | | 0.24 | | | | 0.00 | | | | 0.25 | | | | (0.21 | ) | | | 0.00 | | | $ | 10.42 | |
Year ended February 28, 20194 | | $ | 11.42 | | | | 0.14 | | | | 0.00 | | | | 0.11 | | | | (0.13 | ) | | | (1.40 | ) | | $ | 10.14 | |
Year ended May 31, 2018 | | $ | 10.90 | | | | 0.16 | | | | 0.00 | | | | 0.85 | | | | (0.21 | ) | | | (0.28 | ) | | $ | 11.42 | |
Year ended May 31, 2017 | | $ | 9.96 | | | | 0.14 | | | | 0.00 | | | | 1.10 | | | | (0.13 | ) | | | (0.17 | ) | | $ | 10.90 | |
Year ended May 31, 20167 | | $ | 10.00 | | | | 0.08 | | | | 0.00 | | | | (0.07 | ) | | | (0.05 | ) | | | 0.00 | | | $ | 9.96 | |
| | | | | | | |
Class R6 | | | | | | | | | | | | | | | | | | | | | | | | | | | | |
Six months ended August 31, 2020 (unaudited) | | $ | 10.43 | | | | 0.13 | | | | 0.00 | | | | 0.84 | | | | 0.00 | | | | 0.00 | | | $ | 11.40 | |
Year ended February 29, 2020 | | $ | 10.15 | | | | 0.25 | 5 | | | 0.00 | | | | 0.25 | | | | (0.22 | ) | | | 0.00 | | | $ | 10.43 | |
Year ended February 28, 20194 | | $ | 11.43 | | | | 0.15 | | | | 0.00 | | | | 0.11 | | | | (0.14 | ) | | | (1.40 | ) | | $ | 10.15 | |
Year ended May 31, 2018 | | $ | 10.91 | | | | 0.18 | | | | 0.00 | | | | 0.85 | | | | (0.23 | ) | | | (0.28 | ) | | $ | 11.43 | |
Year ended May 31, 2017 | | $ | 9.96 | | | | 0.15 | | | | 0.00 | | | | 1.11 | | | | (0.14 | ) | | | (0.17 | ) | | $ | 10.91 | |
Year ended May 31, 20167 | | $ | 10.00 | | | | 0.08 | | | | 0.00 | | | | (0.06 | ) | | | (0.06 | ) | | | 0.00 | | | $ | 9.96 | |
| 1 | Total return calculations do not include any sales charges. Returns for periods of less than one year are not annualized. |
| 2 | Portfolio turnover rate is calculated by multiplying the Fund’s ownership percentage in the respective affiliated Master Portfolio by the corresponding affiliated Master Portfolio’s purchases and sales. These purchase and sale amounts are aggregated with any direct purchases and sales in affiliated and unaffiliated mutual funds, exchange-traded funds and unaffiliated securities and included in the portfolio turnover calculation. |
| 3 | Ratios reflect net expenses allocated from the affiliated Master Portfolios which were as follows: |
| | | | | | | | | | | | |
| | | Six months ended
August 31, 2020
(unaudited) | | | Year ended
February 29, 2020 | | | Year ended
February 28, 20194 | |
Class A | | | 0.12 | % | | | 0.14 | % | | | 0.13 | % |
Class C | | | 0.10 | | | | 0.13 | | | | 0.12 | |
Class R4 | | | 0.10 | | | | 0.12 | | | | 0.12 | |
Class R6 | | | 0.12 | | | | 0.15 | | | | 0.13 | |
| 4 | For the nine months ended February 28, 2019. The Fund changed its fiscal year end from May 31 to February 28, effective February 28, 2019. |
| 5 | Calculated based upon average shares outstanding |
| 6 | Ratios do not reflect net expenses allocated from the affiliated Master Portfolios. Including annualized net expenses allocated from the affiliated Master Portfolios, the expense ratios would be increased by the following amounts: |
| | | | | | | | | | | | |
| | | Year ended May 31 | |
| | | 2018 | | | 2017 | | | 20167 | |
Class A | | | 0.10 | % | | | 0.10 | % | | | 0.10 | % |
Class C | | | 0.09 | | | | 0.10 | | | | 0.10 | |
Class R4 | | | 0.09 | | | | 0.10 | | | | 0.11 | |
Class R6 | | | 0.10 | | | | 0.11 | | | | 0.11 | |
| 7 | For the period from November 30, 2015 (commencement of class operations) to May 31, 2016 |
| 8 | During the six months ended August 31, 2020, the Fund received a payment from an affiliate which had an impact of 1.44% on the total return. See Note 4 in the Notes to Financial Statements for additional information. |
The accompanying notes are an integral part of these financial statements.
80 | Target Date Retirement Funds
Financial highlights
| | | | | | | | | | | | | | | | | | | | | | |
| Ratio to average net assets (annualized) | | | | | | Portfolio
turnover
rate2 | | |
Net assets at
end of period
(000s omitted) | |
Net investment
income | | | Gross
expenses | | | Net
expenses | | | Total
return1 | |
| | | | | |
| | | | | | | | | | | | | | | | | | | | | | | |
| | | | | |
| | | | | | | | | | | | | | | | | | | | | | |
| | 1.86 | %3 | | | 2.49 | %3 | | | 0.68 | %3 | | | 9.07 | % | | | 50 | % | | $ | 3,073 | |
| | 1.88 | %3 | | | 2.72 | %3 | | | 0.66 | %3 | | | 4.29 | % | | | 37 | % | | $ | 2,856 | |
| | 1.31 | %3 | | | 3.81 | %3 | | | 0.60 | %3 | | | 2.76 | % | | | 41 | % | | $ | 1,929 | |
| | 1.00 | % | | | 4.06 | %6 | | | 0.52 | %6 | | | 9.07 | % | | | 62 | % | | $ | 1,497 | |
| | 1.07 | % | | | 4.75 | %6 | | | 0.49 | %6 | | | 12.62 | % | | | 58 | % | | $ | 510 | |
| | 1.09 | % | | | 5.25 | %6 | | | 0.46 | %6 | | | (0.07 | )% | | | 38 | % | | $ | 188 | |
| | | | | |
| | | | | | | | | | | | | | | | | | | | | | |
| | 1.11 | %3 | | | 2.79 | %3 | | | 1.43 | %3 | | | 10.14 | %8 | | | 50 | % | | $ | 132 | |
| | 1.17 | %3 | | | 3.34 | %3 | | | 1.42 | %3 | | | 3.55 | % | | | 37 | % | | $ | 125 | |
| | 0.56 | %3 | | | 4.56 | %3 | | | 1.36 | %3 | | | 2.17 | % | | | 41 | % | | $ | 130 | |
| | 0.36 | % | | | 4.88 | %6 | | | 1.28 | %6 | | | 8.24 | % | | | 62 | % | | $ | 130 | |
| | 0.29 | % | | | 5.55 | %6 | | | 1.29 | %6 | | | 11.77 | % | | | 58 | % | | $ | 124 | |
| | 0.52 | % | | | 6.00 | %6 | | | 1.30 | %6 | | | (0.44 | )% | | | 38 | % | | $ | 100 | |
| | | | | |
| | | | | | | | | | | | | | | | | | | | | | |
| | 2.17 | %3 | | | 2.19 | %3 | | | 0.37 | %3 | | | 9.21 | % | | | 50 | % | | $ | 118 | |
| | 2.22 | %3 | | | 2.45 | %3 | | | 0.36 | %3 | | | 4.68 | % | | | 37 | % | | $ | 108 | |
| | 1.62 | %3 | | | 3.53 | %3 | | | 0.31 | %3 | | | 2.96 | % | | | 41 | % | | $ | 105 | |
| | 1.41 | % | | | 3.85 | %6 | | | 0.24 | %6 | | | 9.33 | % | | | 62 | % | | $ | 118 | |
| | 1.35 | % | | | 4.52 | %6 | | | 0.23 | %6 | | | 12.84 | % | | | 58 | % | | $ | 113 | |
| | 1.58 | % | | | 4.97 | %6 | | | 0.23 | %6 | | | 0.16 | % | | | 38 | % | | $ | 100 | |
| | | | | |
| | | | | | | | | | | | | | | | | | | | | | |
| | 2.32 | %3 | | | 2.06 | %3 | | | 0.22 | %3 | | | 9.30 | % | | | 50 | % | | $ | 6,906 | |
| | 2.31 | %3 | | | 2.29 | %3 | | | 0.22 | %3 | | | 4.83 | % | | | 37 | % | | $ | 6,635 | |
| | 1.77 | %3 | | | 3.39 | %3 | | | 0.16 | %3 | | | 3.13 | % | | | 41 | % | | $ | 4,838 | |
| | 1.56 | % | | | 3.70 | %6 | | | 0.09 | %6 | | | 9.48 | % | | | 62 | % | | $ | 5,451 | |
| | 1.50 | % | | | 4.37 | %6 | | | 0.08 | %6 | | | 13.10 | % | | | 58 | % | | $ | 5,201 | |
| | 1.73 | % | | | 4.82 | %6 | | | 0.08 | %6 | | | 0.17 | % | | | 38 | % | | $ | 4,609 | |
The accompanying notes are an integral part of these financial statements.
Target Date Retirement Funds | 81
Financial highlights
| | | | | | | | | | | | | | | | | | | | | | | | | | | | |
| | | Beginning
net asset
value per
share | | | Net
investment
income | | | Payment from affiliate | | | Net realized
and unrealized
gains (losses)
on investments | | | Distributions
from net
investment
income | | | Distributions
from net
realized gains | | | Ending
net asset
value per
share | |
| | | | | | | |
Dynamic Target 2030 Fund | | | | | | | | | | | | | | | | | | | | | | | | | | | | |
| | | | | | | |
Class A | | | | | | | | | | | | | | | | | | | | | | | | | | | | |
Six months ended August 31, 2020 (unaudited) | | $ | 10.11 | | | | 0.09 | | | | 0.00 | | | | 0.98 | | | | 0.00 | | | | 0.00 | | | $ | 11.18 | |
Year ended February 29, 2020 | | $ | 9.94 | | | | 0.18 | | | | 0.00 | | | | 0.17 | | | | (0.18 | ) | | | 0.00 | | | $ | 10.11 | |
Year ended February 28, 20194 | | $ | 11.54 | | | | 0.11 | | | | 0.00 | | | | 0.12 | | | | (0.09 | ) | | | (1.74 | ) | | $ | 9.94 | |
Year ended May 31, 2018 | | $ | 10.92 | | | | 0.13 | | | | 0.00 | | | | 0.98 | | | | (0.19 | ) | | | (0.30 | ) | | $ | 11.54 | |
Year ended May 31, 2017 | | $ | 9.91 | | | | 0.09 | | | | 0.00 | | | | 1.22 | | | | (0.11 | ) | | | (0.19 | ) | | $ | 10.92 | |
Year ended May 31, 20166 | | $ | 10.00 | | | | 0.06 | | | | 0.00 | | | | (0.10 | ) | | | (0.05 | ) | | | 0.00 | | | $ | 9.91 | |
| | | | | | | |
Class C | | | | | | | | | | | | | | | | | | | | | | | | | | | | |
Six months ended August 31, 2020 (unaudited) | | $ | 10.10 | | | | 0.06 | | | | 0.13 | | | | 0.97 | | | | 0.00 | | | | 0.00 | | | $ | 11.26 | |
Year ended February 29, 2020 | | $ | 9.88 | | | | 0.12 | 8 | | | 0.00 | | | | 0.15 | | | | (0.05 | ) | | | 0.00 | | | $ | 10.10 | |
Year ended February 28, 20194 | | $ | 11.52 | | | | 0.05 | | | | 0.00 | | | | 0.11 | | | | (0.06 | ) | | | (1.74 | ) | | $ | 9.88 | |
Year ended May 31, 2018 | | $ | 10.90 | | | | 0.03 | | | | 0.00 | | | | 0.99 | | | | (0.10 | ) | | | (0.30 | ) | | $ | 11.52 | |
Year ended May 31, 2017 | | $ | 9.88 | | | | 0.02 | | | | 0.00 | | | | 1.21 | | | | (0.02 | ) | | | (0.19 | ) | | $ | 10.90 | |
Year ended May 31, 20166 | | $ | 10.00 | | | | 0.02 | | | | 0.00 | | | | (0.09 | ) | | | (0.05 | ) | | | 0.00 | | | $ | 9.88 | |
| | | | | | | |
Class R4 | | | | | | | | | | | | | | | | | | | | | | | | | | | | |
Six months ended August 31, 2020 (unaudited) | | $ | 10.18 | | | | 0.11 | | | | 0.00 | | | | 0.99 | | | | 0.00 | | | | 0.00 | | | $ | 11.28 | |
Year ended February 29, 2020 | | $ | 9.99 | | | | 0.23 | | | | 0.00 | | | | 0.16 | | | | (0.20 | ) | | | 0.00 | | | $ | 10.18 | |
Year ended February 28, 20194 | | $ | 11.59 | | | | 0.13 | | | | 0.00 | | | | 0.12 | | | | (0.11 | ) | | | (1.74 | ) | | $ | 9.99 | |
Year ended May 31, 2018 | | $ | 10.96 | | | | 0.15 | | | | 0.00 | | | | 0.99 | | | | (0.21 | ) | | | (0.30 | ) | | $ | 11.59 | |
Year ended May 31, 2017 | | $ | 9.93 | | | | 0.13 | | | | 0.00 | | | | 1.21 | | | | (0.12 | ) | | | (0.19 | ) | | $ | 10.96 | |
Year ended May 31, 20166 | | $ | 10.00 | | | | 0.07 | | | | 0.00 | | | | (0.08 | ) | | | (0.06 | ) | | | 0.00 | | | $ | 9.93 | |
| | | | | | | |
Class R6 | | | | | | | | | | | | | | | | | | | | | | | | | | | | |
Six months ended August 31, 2020 (unaudited) | | $ | 10.19 | | | | 0.12 | 8 | | | 0.00 | | | | 0.99 | | | | 0.00 | | | | 0.00 | | | $ | 11.30 | |
Year ended February 29, 2020 | | $ | 9.99 | | | | 0.24 | 8 | | | 0.00 | | | | 0.17 | | | | (0.21 | ) | | | 0.00 | | | $ | 10.19 | |
Year ended February 28, 20194 | | $ | 11.60 | | | | 0.14 | | | | 0.00 | | | | 0.12 | | | | (0.13 | ) | | | (1.74 | ) | | $ | 9.99 | |
Year ended May 31, 2018 | | $ | 10.96 | | | | 0.17 | | | | 0.00 | | | | 1.00 | | | | (0.23 | ) | | | (0.30 | ) | | $ | 11.60 | |
Year ended May 31, 2017 | | $ | 9.93 | | | | 0.14 | | | | 0.00 | | | | 1.22 | | | | (0.14 | ) | | | (0.19 | ) | | $ | 10.96 | |
Year ended May 31, 20166 | | $ | 10.00 | | | | 0.08 | | | | 0.00 | | | | (0.09 | ) | | | (0.06 | ) | | | 0.00 | | | $ | 9.93 | |
| 1 | Total return calculations do not include any sales charges. Returns for periods of less than one year are not annualized. |
| 2 | Portfolio turnover rate is calculated by multiplying the Fund’s ownership percentage in the respective affiliated Master Portfolio by the corresponding affiliated Master Portfolio’s purchases and sales. These purchase and sale amounts are aggregated with any direct purchases and sales in affiliated and unaffiliated mutual funds, exchange-traded funds and unaffiliated securities and included in the portfolio turnover calculation. |
| 3 | Ratios reflect net expenses allocated from the affiliated Master Portfolios which were as follows: |
| | | | | | | | | | | | |
| | | Six months ended
August 31, 2020
(unaudited) | | | Year ended
February 29, 2020 | | | Year ended
February 28, 20194 | |
Class A | | | 0.13 | % | | | 0.15 | % | | | 0.13 | % |
Class C | | | 0.10 | | | | 0.14 | | | | 0.12 | |
Class R4 | | | 0.10 | | | | 0.13 | | | | 0.12 | |
Class R6 | | | 0.13 | | | | 0.15 | | | | 0.13 | |
| 4 | For the nine months ended February 28, 2019. The Fund changed its fiscal year end from May 31 to February 28, effective February 28, 2019. |
| 5 | Ratios do not reflect net expenses allocated from the affiliated Master Portfolios. Including annualized net expenses allocated from the affiliated Master Portfolios, the expense ratios would be increased by the following amounts: |
| | | | | | | | | | | | |
| | | Year ended May 31 | |
| | | 2018 | | | 2017 | | | 20166 | |
Class A | | | 0.10 | % | | | 0.10 | % | | | 0.10 | % |
Class C | | | 0.09 | | | | 0.10 | | | | 0.10 | |
Class R4 | | | 0.09 | | | | 0.10 | | | | 0.10 | |
Class R6 | | | 0.10 | | | | 0.11 | | | | 0.11 | |
| 6 | For the period from November 30, 2015 (commencement of class operations) to May 31, 2016 |
| 7 | During the six months ended August 31, 2020, the Fund received a payment from an affiliate which had an impact of 1.29% on the total return. See Note 4 in the Notes to Financial Statements for additional information. |
| 8 | Calculated based upon average shares outstanding |
The accompanying notes are an integral part of these financial statements.
82 | Target Date Retirement Funds
Financial highlights
| | | | | | | | | | | | | | | | | | | | | | |
| Ratio to average net assets (annualized) | | | | | | Portfolio
turnover
rate2 | | |
Net assets at
end of period
(000s omitted) | |
Net investment
income | | | Gross
expenses | | | Net
expenses | | | Total
return1 | |
| | | | | |
| | | | | | | | | | | | | | | | | | | | | | | |
| | | | | |
| | | | | | | | | | | | | | | | | | | | | | |
| | 1.84 | %3 | | | 2.63 | %3 | | | 0.68 | %3 | | | 10.58 | % | | | 54 | % | | $ | 2,998 | |
| | 1.77 | %3 | | | 2.94 | %3 | | | 0.66 | %3 | | | 3.40 | % | | | 36 | % | | $ | 2,317 | |
| | 1.23 | %3 | | | 4.08 | %3 | | | 0.60 | %3 | | | 2.99 | % | | | 37 | % | | $ | 1,010 | |
| | 1.08 | % | | | 4.20 | %5 | | | 0.53 | %5 | | | 10.30 | % | | | 53 | % | | $ | 917 | |
| | 1.04 | % | | | 4.76 | %5 | | | 0.48 | %5 | | | 13.72 | % | | | 46 | % | | $ | 543 | |
| | 1.19 | % | | | 5.29 | %5 | | | 0.45 | %5 | | | (0.34 | )% | | | 22 | % | | $ | 173 | |
| | | | | |
| | | | | | | | | | | | | | | | | | | | | | |
| | 1.10 | %3 | | | 2.86 | %3 | | | 1.43 | %3 | | | 11.60 | %7 | | | 54 | % | | $ | 116 | |
| | 1.17 | %3 | | | 3.62 | %3 | | | 1.42 | %3 | | | 2.74 | % | | | 36 | % | | $ | 104 | |
| | 0.49 | %3 | | | 4.81 | %3 | | | 1.35 | %3 | | | 2.32 | % | | | 37 | % | | $ | 153 | |
| | 0.27 | % | | | 4.95 | %5 | | | 1.29 | %5 | | | 9.43 | % | | | 53 | % | | $ | 119 | |
| | 0.24 | % | | | 5.59 | %5 | | | 1.29 | %5 | | | 12.86 | % | | | 46 | % | | $ | 112 | |
| | 0.49 | % | | | 6.03 | %5 | | | 1.30 | %5 | | | (0.70 | )% | | | 22 | % | | $ | 99 | |
| | | | | |
| | | | | | | | | | | | | | | | | | | | | | |
| | 2.16 | %3 | | | 2.34 | %3 | | | 0.37 | %3 | | | 10.81 | % | | | 54 | % | | $ | 117 | |
| | 2.17 | %3 | | | 2.70 | %3 | | | 0.36 | %3 | | | 3.74 | % | | | 36 | % | | $ | 106 | |
| | 1.51 | %3 | | | 3.80 | %3 | | | 0.31 | %3 | | | 3.19 | % | | | 37 | % | | $ | 104 | |
| | 1.32 | % | | | 3.92 | %5 | | | 0.25 | %5 | | | 10.53 | % | | | 53 | % | | $ | 120 | |
| | 1.29 | % | | | 4.56 | %5 | | | 0.24 | %5 | | | 13.99 | % | | | 46 | % | | $ | 114 | |
| | 1.55 | % | | | 5.00 | %5 | | | 0.24 | %5 | | | (0.10 | )% | | | 22 | % | | $ | 100 | |
| | | | | |
| | | | | | | | | | | | | | | | | | | | | | |
| | 2.31 | %3 | | | 2.21 | %3 | | | 0.22 | %3 | | | 10.89 | % | | | 54 | % | | $ | 6,235 | |
| | 2.29 | %3 | | | 2.54 | %3 | | | 0.22 | %3 | | | 3.99 | % | | | 36 | % | | $ | 5,543 | |
| | 1.66 | %3 | | | 3.66 | %3 | | | 0.16 | %3 | | | 3.26 | % | | | 37 | % | | $ | 4,775 | |
| | 1.47 | % | | | 3.77 | %5 | | | 0.09 | %5 | | | 10.77 | % | | | 53 | % | | $ | 5,544 | |
| | 1.44 | % | | | 4.41 | %5 | | | 0.08 | %5 | | | 14.15 | % | | | 46 | % | | $ | 5,238 | |
| | 1.70 | % | | | 4.85 | %5 | | | 0.09 | %5 | | | (0.09 | )% | | | 22 | % | | $ | 4,597 | |
The accompanying notes are an integral part of these financial statements.
Target Date Retirement Funds | 83
Financial highlights
| | | | | | | | | | | | | | | | | | | | | | | | | | | | |
| | | Beginning
net asset
value per
share | | | Net
investment
income | | | Payment
from
affiliate | | | Net realized
and unrealized
gains (losses)
on investments | | | Distributions
from net
investment
income | | | Distributions
from net
realized gains | | | Ending
net asset
value per
share | |
| | | | | | | |
Dynamic Target 2035 Fund | | | | | | | | | | | | | | | | | | | | | | | | | | | | |
| | | | | | | |
Class A | | | | | | | | | | | | | | | | | | | | | | | | | | | | |
Six months ended August 31, 2020 (unaudited) | | $ | 9.95 | | | | 0.08 | | | | 0.00 | | | | 1.09 | | | | 0.00 | | | | 0.00 | | | $ | 11.12 | |
Year ended February 29, 2020 | | $ | 9.84 | | | | 0.18 | | | | 0.00 | | | | 0.09 | | | | (0.16 | ) | | | 0.00 | | | $ | 9.95 | |
Year ended February 28, 20194 | | $ | 11.66 | | | | 0.09 | | | | 0.00 | | | | 0.14 | | | | (0.08 | ) | | | (1.97 | ) | | $ | 9.84 | |
Year ended May 31, 2018 | | $ | 10.97 | | | | 0.11 | | | | 0.00 | | | | 1.11 | | | | (0.19 | ) | | | (0.34 | ) | | $ | 11.66 | |
Year ended May 31, 2017 | | $ | 9.88 | | | | 0.09 | | | | 0.00 | | | | 1.32 | | | | (0.11 | ) | | | (0.21 | ) | | $ | 10.97 | |
Year ended May 31, 20167 | | $ | 10.00 | | | | 0.06 | | | | 0.00 | | | | (0.12 | ) | | | (0.06 | ) | | | 0.00 | | | $ | 9.88 | |
| | | | | | | |
Class C | | | | | | | | | | | | | | | | | | | | | | | | | | | | |
Six months ended August 31, 2020 (unaudited) | | $ | 9.93 | | | | 0.06 | | | | 0.17 | | | | 1.05 | | | | 0.00 | | | | 0.00 | | | $ | 11.21 | |
Year ended February 29, 2020 | | $ | 9.83 | | | | 0.11 | | | | 0.00 | | | | 0.09 | | | | (0.10 | ) | | | 0.00 | | | $ | 9.93 | |
Year ended February 28, 20194 | | $ | 11.63 | | | | 0.03 | | | | 0.00 | | | | 0.14 | | | | 0.00 | | | | (1.97 | ) | | $ | 9.83 | |
Year ended May 31, 2018 | | $ | 10.95 | | | | 0.02 | | | | 0.00 | | | | 1.10 | | | | (0.10 | ) | | | (0.34 | ) | | $ | 11.63 | |
Year ended May 31, 2017 | | $ | 9.84 | | | | 0.02 | | | | 0.00 | | | | 1.32 | | | | (0.02 | ) | | | (0.21 | ) | | $ | 10.95 | |
Year ended May 31, 20167 | | $ | 10.00 | | | | 0.02 | | | | 0.00 | | | | (0.13 | ) | | | (0.05 | ) | | | 0.00 | | | $ | 9.84 | |
| | | | | | | |
Class R4 | | | | | | | | | | | | | | | | | | | | | | | | | | | | |
Six months ended August 31, 2020 (unaudited) | | $ | 10.02 | | | | 0.11 | | | | 0.00 | | | | 1.07 | | | | 0.00 | | | | 0.00 | | | $ | 11.20 | |
Year ended February 29, 2020 | | $ | 9.89 | | | | 0.22 | | | | 0.00 | | | | 0.09 | | | | (0.18 | ) | | | 0.00 | | | $ | 10.02 | |
Year ended February 28, 20194 | | $ | 11.71 | | | | 0.12 | | | | 0.00 | | | | 0.13 | | | | (0.10 | ) | | | (1.97 | ) | | $ | 9.89 | |
Year ended May 31, 2018 | | $ | 11.00 | | | | 0.15 | | | | 0.00 | | | | 1.11 | | | | (0.21 | ) | | | (0.34 | ) | | $ | 11.71 | |
Year ended May 31, 2017 | | $ | 9.89 | | | | 0.13 | | | | 0.00 | | | | 1.31 | | | | (0.12 | ) | | | (0.21 | ) | | $ | 11.00 | |
Year ended May 31, 20167 | | $ | 10.00 | | | | 0.07 | | | | 0.00 | | | | (0.12 | ) | | | (0.06 | ) | | | 0.00 | | | $ | 9.89 | |
| | | | | | | |
Class R6 | | | | | | | | | | | | | | | | | | | | | | | | | | | | |
Six months ended August 31, 2020 (unaudited) | | $ | 10.02 | | | | 0.12 | | | | 0.00 | | | | 1.08 | | | | 0.00 | | | | 0.00 | | | $ | 11.22 | |
Year ended February 29, 2020 | | $ | 9.89 | | | | 0.23 | 6 | | | 0.00 | | | | 0.10 | | | | (0.20 | ) | | | 0.00 | | | $ | 10.02 | |
Year ended February 28, 20194 | | $ | 11.72 | | | | 0.13 | | | | 0.00 | | | | 0.13 | | | | (0.12 | ) | | | (1.97 | ) | | $ | 9.89 | |
Year ended May 31, 2018 | | $ | 11.01 | | | | 0.16 | | | | 0.00 | | | | 1.12 | | | | (0.23 | ) | | | (0.34 | ) | | $ | 11.72 | |
Year ended May 31, 2017 | | $ | 9.89 | | | | 0.14 | | | | 0.00 | | | | 1.33 | | | | (0.14 | ) | | | (0.21 | ) | | $ | 11.01 | |
Year ended May 31, 20167 | | $ | 10.00 | | | | 0.08 | | | | 0.00 | | | | (0.13 | ) | | | (0.06 | ) | | | 0.00 | | | $ | 9.89 | |
| 1 | Total return calculations do not include any sales charges. Returns for periods of less than one year are not annualized. |
| 2 | Portfolio turnover rate is calculated by multiplying the Fund’s ownership percentage in each respective affiliated Master Portfolio by the corresponding affiliated Master Portfolio’s purchases and sales. These purchase and sale amounts are aggregated with any direct purchases and sales in affiliated and unaffiliated mutual funds, exchange-traded funds and unaffiliated securities and included in the portfolio turnover calculation. |
| 3 | Ratios reflect net expenses allocated from the affiliated Master Portfolios which were as follows: |
| | | | | | | | | | | | |
| | | Six months ended
August 31, 2020
(unaudited) | | | Year ended
February 29, 2020 | | | Year ended
February 28, 20194 | |
Class A | | | 0.13 | % | | | 0.15 | % | | | 0.13 | % |
Class C | | | 0.11 | | | | 0.14 | | | | 0.13 | |
Class R4 | | | 0.11 | | | | 0.14 | | | | 0.13 | |
Class R6 | | | 0.13 | | | | 0.16 | | | | 0.13 | |
| 4 | For the nine months ended February 28, 2019. The Fund changed its fiscal year end from May 31 to February 28, effective February 28, 2019. |
| 5 | Ratios do not reflect net expenses allocated from the affiliated Master Portfolios. Including annualized net expenses allocated from the affiliated Master Portfolios, the expense ratios would be increased by the following amounts: |
| | | | | | | | | | | | |
| | | Year ended May 31 | |
| | | 2018 | | | 2017 | | | 20167 | |
Class A | | | 0.09 | % | | | 0.10 | % | | | 0.10 | % |
Class C | | | 0.09 | | | | 0.10 | | | | 0.10 | |
Class R4 | | | 0.09 | | | | 0.10 | | | | 0.10 | |
Class R6 | | | 0.10 | | | | 0.11 | | | | 0.11 | |
| 6 | Calculated based upon average shares outstanding |
| 7 | For the period from November 30, 2015 (commencement of class operations) to May 31, 2016 |
| 8 | During the six months ended August 31, 2020, the Fund received a payment from an affiliate which had an impact of 1.71% on the total return. See Note 4 in the Notes to Financial Statements for additional information. |
The accompanying notes are an integral part of these financial statements.
84 | Target Date Retirement Funds
Financial highlights
| | | | | | | | | | | | | | | | | | | | | | |
| Ratio to average net assets (annualized) | | | Total
return1 | | | Portfolio
turnover
rate2 | | | Net assets at
end of period
(000s omitted) | |
Net investment
income | | | Gross
expenses | | | Net
expenses | |
| | | | | |
| | | | | | | | | | | | | | | | | | | | | | | |
| | | | | |
| | | | | | | | | | | | | | | | | | | | | | |
| | 1.82 | %3 | | | 2.73 | %3 | | | 0.68 | %3 | | | 11.65 | % | | | 55 | % | | $ | 983 | |
| | 1.81 | %3 | | | 3.12 | %3 | | | 0.66 | %3 | | | 2.65 | % | | | 36 | % | | $ | 733 | |
| | 1.16 | %3 | | | 4.34 | %3 | | | 0.60 | %3 | | | 3.13 | % | | | 34 | % | | $ | 521 | |
| | 0.99 | % | | | 4.32 | %5 | | | 0.53 | %5 | | | 11.24 | % | | | 44 | % | | $ | 453 | |
| | 1.05 | % | | | 4.86 | %5 | | | 0.49 | %5 | | | 14.74 | % | | | 39 | % | | $ | 338 | |
| | 1.24 | % | | | 5.32 | %5 | | | 0.55 | %5 | | | (0.62 | )% | | | 19 | % | | $ | 119 | |
| | | | | |
| | | | | | | | | | | | | | | | | | | | | | |
| | 1.10 | %3 | | | 2.99 | %3 | | | 1.43 | %3 | | | 12.89 | %8 | | | 55 | % | | $ | 122 | |
| | 1.09 | %3 | | | 3.71 | %3 | | | 1.42 | %3 | | | 1.99 | % | | | 36 | % | | $ | 107 | |
| | 0.37 | %3 | | | 5.08 | %3 | | | 1.36 | %3 | | | 2.55 | % | | | 34 | % | | $ | 102 | |
| | 0.21 | % | | | 5.07 | %5 | | | 1.29 | %5 | | | 10.30 | % | | | 44 | % | | $ | 120 | |
| | 0.21 | % | | | 5.67 | %5 | | | 1.29 | %5 | | | 14.02 | % | | | 39 | % | | $ | 113 | |
| | 0.48 | % | | | 6.06 | %5 | | | 1.30 | %5 | | | (1.08 | )% | | | 19 | % | | $ | 99 | |
| | | | | |
| | | | | | | | | | | | | | | | | | | | | | |
| | 2.16 | %3 | | | 2.44 | %3 | | | 0.37 | %3 | | | 11.88 | % | | | 55 | % | | $ | 116 | |
| | 2.15 | %3 | | | 2.86 | %3 | | | 0.36 | %3 | | | 3.05 | % | | | 36 | % | | $ | 104 | |
| | 1.42 | %3 | | | 4.06 | %3 | | | 0.31 | %3 | | | 3.34 | % | | | 34 | % | | $ | 103 | |
| | 1.26 | % | | | 4.04 | %5 | | | 0.25 | %5 | | | 11.59 | % | | | 44 | % | | $ | 122 | |
| | 1.26 | % | | | 4.64 | %5 | | | 0.24 | %5 | | | 15.05 | % | | | 39 | % | | $ | 114 | |
| | 1.54 | % | | | 5.03 | %5 | | | 0.24 | %5 | | | (0.48 | )% | | | 19 | % | | $ | 99 | |
| | | | | |
| | | | | | | | | | | | | | | | | | | | | | |
| | 2.31 | %3 | | | 2.31 | %3 | | | 0.22 | %3 | | | 11.98 | % | | | 55 | % | | $ | 7,696 | |
| | 2.22 | %3 | | | 2.66 | %3 | | | 0.22 | %3 | | | 3.19 | % | | | 36 | % | | $ | 6,780 | |
| | 1.57 | %3 | | | 3.91 | %3 | | | 0.16 | %3 | | | 3.41 | % | | | 34 | % | | $ | 4,734 | |
| | 1.41 | % | | | 3.89 | %5 | | | 0.09 | %5 | | | 11.73 | % | | | 44 | % | | $ | 5,608 | |
| | 1.41 | % | | | 4.49 | %5 | | | 0.08 | %5 | | | 15.31 | % | | | 39 | % | | $ | 5,270 | |
| | 1.69 | % | | | 4.88 | %5 | | | 0.08 | %5 | | | (0.46 | )% | | | 19 | % | | $ | 4,580 | |
The accompanying notes are an integral part of these financial statements.
Target Date Retirement Funds | 85
Financial highlights
| | | | | | | | | | | | | | | | | | | | | | | | | | | | |
| | | Beginning
net asset
value per
share | | | Net
investment
income | | | Payment
from
affiliate | | | Net realized
and unrealized
gains (losses)
on investments | | | Distributions
from net
investment
income | | | Distributions
from net
realized gains | | | Ending
net asset
value per
share | |
| | | | | | | |
Dynamic Target 2040 Fund | | | | | | | | | | | | | | | | | | | | | | | | | | | | |
| | | | | | | |
Class A | | | | | | | | | | | | | | | | | | | | | | | | | | | | |
Six months ended August 31, 2020 (unaudited) | | $ | 9.83 | | | | 0.10 | | | | 0.00 | | | | 0.99 | | | | 0.00 | | | | 0.00 | | | $ | 10.92 | |
Year ended February 29, 2020 | | $ | 9.77 | | | | 0.16 | | | | 0.00 | | | | 0.08 | | | | (0.18 | ) | | | 0.00 | | | $ | 9.83 | |
Year ended February 28, 20194 | | $ | 11.74 | | | | 0.08 | | | | 0.00 | | | | 0.11 | | | | (0.06 | ) | | | (2.10 | ) | | $ | 9.77 | |
Year ended May 31, 2018 | | $ | 11.00 | | | | 0.09 | | | | 0.00 | | | | 1.20 | | | | (0.20 | ) | | | (0.35 | ) | | $ | 11.74 | |
Year ended May 31, 2017 | | $ | 9.85 | | | | 0.09 | | | | 0.00 | | | | 1.37 | | | | (0.11 | ) | | | (0.20 | ) | | $ | 11.00 | |
Year ended May 31, 20166 | | $ | 10.00 | | | | 0.06 | | | | 0.00 | | | | (0.15 | ) | | | (0.06 | ) | | | 0.00 | | | $ | 9.85 | |
| | | | | | | |
Class C | | | | | | | | | | | | | | | | | | | | | | | | | | | | |
Six months ended August 31, 2020 (unaudited) | | $ | 9.81 | | | | 0.05 | | | | 0.16 | | | | 1.00 | | | | 0.00 | | | | 0.00 | | | $ | 11.02 | |
Year ended February 29, 2020 | | $ | 9.76 | | | | 0.11 | | | | 0.00 | | | | 0.05 | | | | (0.11 | ) | | | 0.00 | | | $ | 9.81 | |
Year ended February 28, 20194 | | $ | 11.72 | | | | 0.02 | | | | 0.00 | | | | 0.12 | | | | 0.00 | | | | (2.10 | ) | | $ | 9.76 | |
Year ended May 31, 2018 | | $ | 10.98 | | | | 0.02 | | | | 0.00 | | | | 1.17 | | | | (0.10 | ) | | | (0.35 | ) | | $ | 11.72 | |
Year ended May 31, 2017 | | $ | 9.82 | | | | 0.02 | | | | 0.00 | | | | 1.36 | | | | (0.02 | ) | | | (0.20 | ) | | $ | 10.98 | |
Year ended May 31, 20166 | | $ | 10.00 | | | | 0.02 | | | | 0.00 | | | | (0.15 | ) | | | (0.05 | ) | | | 0.00 | | | $ | 9.82 | |
| | | | | | | |
Class R4 | | | | | | | | | | | | | | | | | | | | | | | | | | | | |
Six months ended August 31, 2020 (unaudited) | | $ | 9.91 | | | | 0.11 | | | | 0.00 | | | | 1.01 | | | | 0.00 | | | | 0.00 | | | $ | 11.03 | |
Year ended February 29, 2020 | | $ | 9.83 | | | | 0.22 | | | | 0.00 | | | | 0.05 | | | | (0.19 | ) | | | 0.00 | | | $ | 9.91 | |
Year ended February 28, 20194 | | $ | 11.80 | | | | 0.11 | | | | 0.00 | | | | 0.11 | | | | (0.09 | ) | | | (2.10 | ) | | $ | 9.83 | |
Year ended May 31, 2018 | | $ | 11.04 | | | | 0.14 | | | | 0.00 | | | | 1.18 | | | | (0.21 | ) | | | (0.35 | ) | | $ | 11.80 | |
Year ended May 31, 2017 | | $ | 9.86 | | | | 0.13 | | | | 0.00 | | | | 1.37 | | | | (0.12 | ) | | | (0.20 | ) | | $ | 11.04 | |
Year ended May 31, 20166 | | $ | 10.00 | | | | 0.07 | | | | 0.00 | | | | (0.15 | ) | | | (0.06 | ) | | | 0.00 | | | $ | 9.86 | |
| | | | | | | |
Class R6 | | | | | | | | | | | | | | | | | | | | | | | | | | | | |
Six months ended August 31, 2020 (unaudited) | | $ | 9.92 | | | | 0.12 | | | | 0.00 | | | | 1.00 | | | | 0.00 | | | | 0.00 | | | $ | 11.04 | |
Year ended February 29, 2020 | | $ | 9.84 | | | | 0.23 | | | | 0.00 | | | | 0.06 | | | | (0.21 | ) | | | 0.00 | | | $ | 9.92 | |
Year ended February 28, 20194 | | $ | 11.81 | | | | 0.12 | | | | 0.00 | | | | 0.12 | | | | (0.11 | ) | | | (2.10 | ) | | $ | 9.84 | |
Year ended May 31, 2018 | | $ | 11.04 | | | | 0.16 | | | | 0.00 | | | | 1.19 | | | | (0.23 | ) | | | (0.35 | ) | | $ | 11.81 | |
Year ended May 31, 2017 | | $ | 9.87 | | | | 0.14 | | | | 0.00 | | | | 1.36 | | | | (0.13 | ) | | | (0.20 | ) | | $ | 11.04 | |
Year ended May 31, 20166 | | $ | 10.00 | | | | 0.08 | | | | 0.00 | | | | (0.14 | ) | | | (0.07 | ) | | | 0.00 | | | $ | 9.87 | |
| 1 | Total return calculations do not include any sales charges. Returns for periods of less than one year are not annualized. |
| 2 | Portfolio turnover rate is calculated by multiplying the Fund’s ownership percentage in each respective affiliated Master Portfolio by the corresponding affiliated Master Portfolio’s purchases and sales. These purchase and sale amounts are aggregated with any direct purchases and sales in affiliated and unaffiliated mutual funds, exchange-traded funds and unaffiliated securities and included in the portfolio turnover calculation. |
| 3 | Ratios reflect net expenses allocated from the affiliated Master Portfolios which were as follows: |
| | | | | | | | | | | | |
| | | Six months ended
August 31, 2020
(unaudited) | | | Year ended
February 29, 2020 | | | Year ended
February 28, 20194 | |
Class A | | | 0.13 | % | | | 0.16 | % | | | 0.13 | % |
Class C | | | 0.12 | | | | 0.14 | | | | 0.13 | |
Class R4 | | | 0.12 | | | | 0.14 | | | | 0.13 | |
Class R6 | | | 0.13 | | | | 0.16 | | | | 0.13 | |
| 4 | For the nine months ended February 28, 2019. The Fund changed its fiscal year end from May 31 to February 28, effective February 28, 2019. |
| 5 | Ratios do not reflect net expenses allocated from the affiliated Master Portfolios. Including annualized net expenses allocated from the affiliated Master Portfolios, the expense ratios would be increased by the following amounts: |
| | | | | | | | | | | | |
| | | Year ended May 31 | |
| | | 2018 | | | 2017 | | | 20166 | |
Class A | | | 0.09 | % | | | 0.10 | % | | | 0.10 | % |
Class C | | | 0.09 | | | | 0.10 | | | | 0.10 | |
Class R4 | | | 0.09 | | | | 0.10 | | | | 0.10 | |
Class R6 | | | 0.10 | | | | 0.11 | | | | 0.11 | |
| 6 | For the period from November 30, 2015 (commencement of class operations) to May 31, 2016 |
| 7 | During the six months ended August 31, 2020, the Fund received a payment from an affiliate which had an impact of 1.63% on the total return. See Note 4 in the Notes to Financial Statements for additional information. |
The accompanying notes are an integral part of these financial statements.
86 | Target Date Retirement Funds
Financial highlights
| | | | | | | | | | | | | | | | | | | | | | |
| Ratio to average net assets (annualized) | | | | | | Portfolio
turnover
rate2 | | | Net assets at
end of period
(000s omitted) | |
Net investment
income | | | Gross
expenses | | | Net
expenses | | | Total
return1 | |
| | | | | |
| | | | | | | | | | | | | | | | | | | | | | | |
| | | | | |
| | | | | | | | | | | | | | | | | | | | | | |
| | 1.81 | %3 | | | 3.17 | %3 | | | 0.68 | %3 | | | 11.09 | % | | | 58 | % | | $ | 2,899 | |
| | 1.62 | %3 | | | 3.57 | %3 | | | 0.67 | %3 | | | 2.33 | % | | | 36 | % | | $ | 1,858 | |
| | 0.99 | %3 | | | 4.11 | %3 | | | 0.63 | %3 | | | 2.80 | % | | | 32 | % | | $ | 454 | |
| | 1.02 | % | | | 3.93 | %5 | | | 0.54 | %5 | | | 11.79 | % | | | 40 | % | | $ | 472 | |
| | 1.01 | % | | | 4.46 | %5 | | | 0.51 | %5 | | | 15.34 | % | | | 33 | % | | $ | 307 | |
| | 1.22 | % | | | 5.33 | %5 | | | 0.53 | %5 | | | (0.90 | )% | | | 15 | % | | $ | 157 | |
| | | | | |
| | | | | | | | | | | | | | | | | | | | | | |
| | 1.09 | %3 | | | 3.42 | %3 | | | 1.43 | %3 | | | 12.33 | %7 | | | 58 | % | | $ | 116 | |
| | 1.05 | %3 | | | 4.35 | %3 | | | 1.42 | %3 | | | 1.53 | % | | | 36 | % | | $ | 101 | |
| | 0.25 | %3 | | | 4.85 | %3 | | | 1.38 | %3 | | | 2.30 | % | | | 32 | % | | $ | 100 | |
| | 0.16 | % | | | 4.70 | %5 | | | 1.29 | %5 | | | 10.88 | % | | | 40 | % | | $ | 120 | |
| | 0.18 | % | | | 5.25 | %5 | | | 1.30 | %5 | | | 14.52 | % | | | 33 | % | | $ | 113 | |
| | 0.47 | % | | | 6.07 | %5 | | | 1.30 | %5 | | | (1.25 | )% | | | 15 | % | | $ | 99 | |
| | | | | |
| | | | | | | | | | | | | | | | | | | | | | |
| | 2.15 | %3 | | | 2.89 | %3 | | | 0.37 | %3 | | | 11.30 | % | | | 58 | % | | $ | 115 | |
| | 2.10 | %3 | | | 3.31 | %3 | | | 0.36 | %3 | | | 2.61 | % | | | 36 | % | | $ | 103 | |
| | 1.29 | %3 | | | 3.82 | %3 | | | 0.34 | %3 | | | 3.06 | % | | | 32 | % | | $ | 102 | |
| | 1.21 | % | | | 3.67 | %5 | | | 0.25 | %5 | | | 12.07 | % | | | 40 | % | | $ | 123 | |
| | 1.24 | % | | | 4.22 | %5 | | | 0.24 | %5 | | | 15.78 | % | | | 33 | % | | $ | 115 | |
| | 1.53 | % | | | 5.04 | %5 | | | 0.24 | %5 | | | (0.76 | )% | | | 15 | % | | $ | 99 | |
| | | | | |
| | | | | | | | | | | | | | | | | | | | | | |
| | 2.30 | %3 | | | 2.76 | %3 | | | 0.22 | %3 | | | 11.39 | % | | | 58 | % | | $ | 5,464 | |
| | 2.24 | %3 | | | 3.15 | %3 | | | 0.21 | %3 | | | 2.75 | % | | | 36 | % | | $ | 4,897 | |
| | 1.44 | %3 | | | 3.67 | %3 | | | 0.19 | %3 | | | 3.24 | % | | | 32 | % | | $ | 4,707 | |
| | 1.36 | % | | | 3.52 | %5 | | | 0.10 | %5 | | | 12.31 | % | | | 40 | % | | $ | 5,651 | |
| | 1.39 | % | | | 4.07 | %5 | | | 0.09 | %5 | | | 15.82 | % | | | 33 | % | | $ | 5,285 | |
| | 1.69 | % | | | 4.90 | %5 | | | 0.09 | %5 | | | (0.64 | )% | | | 15 | % | | $ | 4,571 | |
The accompanying notes are an integral part of these financial statements.
Target Date Retirement Funds | 87
Financial highlights
| | | | | | | | | | | | | | | | | | | | | | | | | | | | |
| | | Beginning
net asset
value per
share | | | Net
investment
income | | | Payment
from
affiliate | | | Net realized
and unrealized
gains (losses)
on investments | | | Distributions
from net
investment
income | | | Distributions
from net
realized gains | | | Ending
net asset
value per
share | |
| | | | | | | |
Dynamic Target 2045 Fund | | | | | | | | | | | | | | | | | | | | | | | | | | | | |
| | | | | | | |
Class A | | | | | | | | | | | | | | | | | | | | | | | | | | | | |
Six months ended August 31, 2020 (unaudited) | | $ | 9.72 | | | | 0.09 | | | | 0.00 | | | | 1.07 | | | | 0.00 | | | | 0.00 | | | $ | 10.88 | |
Year ended February 29, 2020 | | $ | 9.73 | | | | 0.16 | | | | 0.00 | | | | 0.00 | 4 | | | (0.17 | ) | | | 0.00 | | | $ | 9.72 | |
Year ended February 28, 20195 | | $ | 11.79 | | | | 0.08 | | | | 0.00 | | | | 0.08 | | | | (0.07 | ) | | | (2.15 | ) | | $ | 9.73 | |
Year ended May 31, 2018 | | $ | 11.02 | | | | 0.12 | | | | 0.00 | | | | 1.20 | | | | (0.19 | ) | | | (0.36 | ) | | $ | 11.79 | |
Year ended May 31, 2017 | | $ | 9.86 | | | | 0.08 | | | | 0.00 | | | | 1.41 | | | | (0.10 | ) | | | (0.23 | ) | | $ | 11.02 | |
Year ended May 31, 20167 | | $ | 10.00 | | | | 0.06 | | | | 0.00 | | | | (0.14 | ) | | | (0.06 | ) | | | 0.00 | | | $ | 9.86 | |
| | | | | | | |
Class C | | | | | | | | | | | | | | | | | | | | | | | | | | | | |
Six months ended August 31, 2020 (unaudited) | | $ | 9.68 | | | | 0.05 | | | | 0.16 | | | | 1.06 | | | | 0.00 | | | | 0.00 | | | $ | 10.95 | |
Year ended February 29, 2020 | | $ | 9.71 | | | | 0.10 | | | | 0.00 | | | | (0.01 | ) | | | (0.12 | ) | | | 0.00 | | | $ | 9.68 | |
Year ended February 28, 20195 | | $ | 11.75 | | | | 0.02 | | | | 0.00 | | | | 0.09 | | | | 0.00 | | | | (2.15 | ) | | $ | 9.71 | |
Year ended May 31, 2018 | | $ | 10.99 | | | | 0.02 | | | | 0.00 | | | | 1.20 | | | | (0.10 | ) | | | (0.36 | ) | | $ | 11.75 | |
Year ended May 31, 2017 | | $ | 9.83 | | | | 0.02 | | | | 0.00 | | | | 1.39 | | | | (0.02 | ) | | | (0.23 | ) | | $ | 10.99 | |
Year ended May 31, 20167 | | $ | 10.00 | | | | 0.02 | | | | 0.00 | | | | (0.14 | ) | | | (0.05 | ) | | | 0.00 | | | $ | 9.83 | |
| | | | | | | |
Class R4 | | | | | | | | | | | | | | | | | | | | | | | | | | | | |
Six months ended August 31, 2020 (unaudited) | | $ | 9.78 | | | | 0.11 | | | | 0.00 | | | | 1.08 | | | | 0.00 | | | | 0.00 | | | $ | 10.97 | |
Year ended February 29, 2020 | | $ | 9.78 | | | | 0.21 | | | | 0.00 | | | | (0.01 | ) | | | (0.20 | ) | | | 0.00 | | | $ | 9.78 | |
Year ended February 28, 20195 | | $ | 11.83 | | | | 0.11 | | | | 0.00 | | | | 0.08 | | | | (0.09 | ) | | | (2.15 | ) | | $ | 9.78 | |
Year ended May 31, 2018 | | $ | 11.05 | | | | 0.14 | | | | 0.00 | | | | 1.22 | | | | (0.22 | ) | | | (0.36 | ) | | $ | 11.83 | |
Year ended May 31, 2017 | | $ | 9.88 | | | | 0.13 | | | | 0.00 | | | | 1.39 | | | | (0.12 | ) | | | (0.23 | ) | | $ | 11.05 | |
Year ended May 31, 20167 | | $ | 10.00 | | | | 0.07 | | | | 0.00 | | | | (0.13 | ) | | | (0.06 | ) | | | 0.00 | | | $ | 9.88 | |
| | | | | | | |
Class R6 | | | | | | | | | | | | | | | | | | | | | | | | | | | | |
Six months ended August 31, 2020 (unaudited) | | $ | 9.79 | | | | 0.11 | | | | 0.00 | | | | 1.09 | | | | 0.00 | | | | 0.00 | | | $ | 10.99 | |
Year ended February 29, 2020 | | $ | 9.79 | | | | 0.22 | 9 | | | 0.00 | | | | (0.01 | ) | | | (0.21 | ) | | | 0.00 | | | $ | 9.79 | |
Year ended February 28, 20195 | | $ | 11.84 | | | | 0.12 | | | | 0.00 | | | | 0.08 | | | | (0.10 | ) | | | (2.15 | ) | | $ | 9.79 | |
Year ended May 31, 2018 | | $ | 11.06 | | | | 0.16 | | | | 0.00 | | | | 1.21 | | | | (0.23 | ) | | | (0.36 | ) | | $ | 11.84 | |
Year ended May 31, 2017 | | $ | 9.88 | | | | 0.14 | | | | 0.00 | | | | 1.40 | | | | (0.13 | ) | | | (0.23 | ) | | $ | 11.06 | |
Year ended May 31, 20167 | | $ | 10.00 | | | | 0.08 | | | | 0.00 | | | | (0.13 | ) | | | (0.07 | ) | | | 0.00 | | | $ | 9.88 | |
| 1 | Total return calculations do not include any sales charges. Returns for periods of less than one year are not annualized. |
| 2 | Portfolio turnover rate is calculated by multiplying the Fund’s ownership percentage in each respective affiliated Master Portfolio by the corresponding affiliated Master Portfolio’s purchases and sales. These purchase and sale amounts are aggregated with any direct purchases and sales in affiliated and unaffiliated mutual funds, exchange-traded funds and unaffiliated securities and included in the portfolio turnover calculation. |
| 3 | Ratios reflect net expenses allocated from the affiliated Master Portfolios which were as follows: |
| | | | | | | | | | | | |
| | | Six months ended
August 31, 2020
(unaudited) | | | Year ended
February 29, 2020 | | | Year ended
February 28, 20195 | |
Class A | | | 0.13 | % | | | 0.16 | % | | | 0.14 | % |
Class C | | | 0.13 | | | | 0.15 | | | | 0.13 | |
Class R4 | | | 0.12 | | | | 0.15 | | | | 0.13 | |
Class R6 | | | 0.14 | | | | 0.16 | | | | 0.14 | |
| 4 | Amount is less than $0.005. |
| 5 | For the nine months ended February 28, 2019. The Fund changed its fiscal year end from May 31 to February 28, effective February 28, 2019. |
| 6 | Ratios do not reflect net expenses allocated from the affiliated Master Portfolios. Including annualized net expenses allocated from the affiliated Master Portfolios, the expense ratios would be increased by the following amounts: |
| | | | | | | | | | | | |
| | | Year ended May 31 | |
| | | 2018 | | | 2017 | | | 20167 | |
Class A | | | 0.09 | % | | | 0.10 | % | | | 0.10 | % |
Class C | | | 0.09 | | | | 0.10 | | | | 0.10 | |
Class R4 | | | 0.09 | | | | 0.10 | | | | 0.10 | |
Class R6 | | | 0.10 | | | | 0.11 | | | | 0.11 | |
| 7 | For the period from November 30, 2015 (commencement of class operations) to May 31, 2016 |
| 8 | During the six months ended August 31, 2020, the Fund received a payment from an affiliate which had an impact of 1.65% on the total return. See Note 4 in the Notes to Financial Statements for additional information. |
| 9 | Calculated based upon average shares outstanding |
The accompanying notes are an integral part of these financial statements.
88 | Target Date Retirement Funds
Financial highlights
| | | | | | | | | | | | | | | | | | | | | | |
| Ratio to average net assets (annualized) | | | | | | Portfolio
turnover
rate2 | | | Net assets at
end of period
(000s omitted) | |
Net investment
income | | | Gross
expenses | | | Net
expenses | | | Total
return1 | |
| | | | | |
| | | | | | | | | | | | | | | | | | | | | | | |
| | | | | |
| | | | | | | | | | | | | | | | | | | | | | |
| | 1.82 | %3 | | | 3.46 | %3 | | | 0.68 | %3 | | | 11.93 | % | | | 58 | % | | $ | 534 | |
| | 1.72 | %3 | | | 3.61 | %3 | | | 0.66 | %3 | | | 1.53 | % | | | 36 | % | | $ | 414 | |
| | 0.97 | %3 | | | 4.18 | %3 | | | 0.61 | %3 | | | 2.62 | % | | | 31 | % | | $ | 329 | |
| | 0.90 | % | | | 4.09 | %6 | | | 0.54 | %6 | | | 12.06 | % | | | 35 | % | | $ | 327 | |
| | 0.98 | % | | | 4.58 | %6 | | | 0.51 | %6 | | | 15.64 | % | | | 31 | % | | $ | 221 | |
| | 1.23 | % | | | 5.36 | %6 | | | 0.53 | %6 | | | (0.79 | )% | | | 14 | % | | $ | 121 | |
| | | | | |
| | | | | | | | | | | | | | | | | | | | | | |
| | 1.08 | %3 | | | 3.75 | %3 | | | 1.43 | %3 | | | 13.12 | %8 | | | 58 | % | | $ | 128 | |
| | 1.00 | %3 | | | 4.19 | %3 | | | 1.42 | %3 | | | 0.78 | % | | | 36 | % | | $ | 109 | |
| | 0.21 | %3 | | | 4.92 | %3 | | | 1.36 | %3 | | | 2.06 | % | | | 31 | % | | $ | 102 | |
| | 0.15 | % | | | 4.84 | %6 | | | 1.29 | %6 | | | 11.18 | % | | | 35 | % | | $ | 121 | |
| | 0.17 | % | | | 5.37 | %6 | | | 1.30 | %6 | | | 14.74 | % | | | 31 | % | | $ | 113 | |
| | 0.48 | % | | | 6.10 | %6 | | | 1.30 | %6 | | | (1.15 | )% | | | 14 | % | | $ | 99 | |
| | | | | |
| | | | | | | | | | | | | | | | | | | | | | |
| | 2.14 | %3 | | | 3.18 | %3 | | | 0.37 | %3 | | | 12.17 | % | | | 58 | % | | $ | 114 | |
| | 2.06 | %3 | | | 3.34 | %3 | | | 0.36 | %3 | | | 1.83 | % | | | 36 | % | | $ | 102 | |
| | 1.25 | %3 | | | 3.89 | %3 | | | 0.32 | %3 | | | 2.81 | % | | | 31 | % | | $ | 102 | |
| | 1.19 | % | | | 3.81 | %6 | | | 0.25 | %6 | | | 12.36 | % | | | 35 | % | | $ | 123 | |
| | 1.23 | % | | | 4.34 | %6 | | | 0.24 | %6 | | | 15.88 | % | | | 31 | % | | $ | 115 | |
| | 1.54 | % | | | 5.07 | %6 | | | 0.24 | %6 | | | (0.55 | )% | | | 14 | % | | $ | 99 | |
| | | | | |
| | | | | | | | | | | | | | | | | | | | | | |
| | 2.29 | %3 | | | 3.04 | %3 | | | 0.22 | %3 | | | 12.26 | % | | | 58 | % | | $ | 6,140 | |
| | 2.18 | %3 | | | 3.18 | %3 | | | 0.21 | %3 | | | 1.97 | % | | | 36 | % | | $ | 5,419 | |
| | 1.40 | %3 | | | 3.75 | %3 | | | 0.17 | %3 | | | 2.97 | % | | | 31 | % | | $ | 4,695 | |
| | 1.35 | % | | | 3.66 | %6 | | | 0.10 | %6 | | | 12.51 | % | | | 35 | % | | $ | 5.679 | |
| | 1.38 | % | | | 4.19 | %6 | | | 0.09 | %6 | | | 16.14 | % | | | 31 | % | | $ | 5,303 | |
| | 1.69 | % | | | 4.92 | %6 | | | 0.09 | %6 | | | (0.53 | )% | | | 14 | % | | $ | 4,576 | |
The accompanying notes are an integral part of these financial statements.
Target Date Retirement Funds | 89
Financial highlights
| | | | | | | | | | | | | | | | | | | | | | | | | | | | |
| | | Beginning
net asset
value per
share | | | Net
investment
income | | | Payment
from
affiliate | | | Net realized
and unrealized
gains (losses)
on investments | | | Distributions
from net
investment
income | | | Distributions
from net
realized gains | | | Ending
net asset
value per
share | |
| | | | | | | |
Dynamic Target 2050 Fund | | | | | | | | | | | | | | | | | | | | | | | | | | | | |
| | | | | | | |
Class A | | | | | | | | | | | | | | | | | | | | | | | | | | | | |
Six months ended August 31, 2020 (unaudited) | | $ | 9.66 | | | | 0.09 | | | | 0.00 | | | | 1.04 | | | | 0.00 | | | | 0.00 | | | $ | 10.79 | |
Year ended February 29, 2020 | | $ | 9.73 | | | | 0.17 | | | | 0.00 | | | | (0.06 | ) | | | (0.18 | ) | | | 0.00 | | | $ | 9.66 | |
Year ended February 28, 20194 | | $ | 11.80 | | | | 0.07 | | | | 0.00 | | | | 0.06 | | | | (0.05 | ) | | | (2.15 | ) | | $ | 9.73 | |
Year ended May 31, 2018 | | $ | 11.03 | | | | 0.11 | | | | 0.00 | | | | 1.22 | | | | (0.20 | ) | | | (0.36 | ) | | $ | 11.80 | |
Year ended May 31, 2017 | | $ | 9.86 | | | | 0.09 | | | | 0.00 | | | | 1.40 | | | | (0.09 | ) | | | (0.23 | ) | | $ | 11.03 | |
Year ended May 31, 20166 | | $ | 10.00 | | | | 0.06 | | | | 0.00 | | | | (0.14 | ) | | | (0.06 | ) | | | 0.00 | | | $ | 9.86 | |
| | | | | | | |
Class C | | | | | | | | | | | | | | | | | | | | | | | | | | | | |
Six months ended August 31, 2020 (unaudited) | | $ | 9.59 | | | | 0.05 | | | | 0.15 | | | | 1.04 | | | | 0.00 | | | | 0.00 | | | $ | 10.83 | |
Year ended February 29, 2020 | | $ | 9.68 | | | | 0.10 | | | | 0.00 | | | | (0.06 | ) | | | (0.13 | ) | | | 0.00 | | | $ | 9.59 | |
Year ended February 28, 20194 | | $ | 11.76 | | | | 0.02 | | | | 0.00 | | | | 0.05 | | | | 0.00 | | | | (2.15 | ) | | $ | 9.68 | |
Year ended May 31, 2018 | | $ | 10.99 | | | | 0.02 | | | | 0.00 | | | | 1.21 | | | | (0.10 | ) | | | (0.36 | ) | | $ | 11.76 | |
Year ended May 31, 2017 | | $ | 9.83 | | | | 0.02 | | | | 0.00 | | | | 1.39 | | | | (0.02 | ) | | | (0.23 | ) | | $ | 10.99 | |
Year ended May 31, 20166 | | $ | 10.00 | | | | 0.02 | | | | 0.00 | | | | (0.14 | ) | | | (0.05 | ) | | | 0.00 | | | $ | 9.83 | |
| | | | | | | |
Class R4 | | | | | | | | | | | | | | | | | | | | | | | | | | | | |
Six months ended August 31, 2020 (unaudited) | | $ | 9.69 | | | | 0.10 | | | | 0.00 | | | | 1.06 | | | | 0.00 | | | | 0.00 | | | $ | 10.85 | |
Year ended February 29, 2020 | | $ | 9.76 | | | | 0.21 | | | | 0.00 | | | | (0.07 | ) | | | (0.21 | ) | | | 0.00 | | | $ | 9.69 | |
Year ended February 28, 20194 | | $ | 11.83 | | | | 0.10 | | | | 0.00 | | | | 0.06 | | | | (0.08 | ) | | | (2.15 | ) | | $ | 9.76 | |
Year ended May 31, 2018 | | $ | 11.05 | | | | 0.14 | | | | 0.00 | | | | 1.22 | | | | (0.22 | ) | | | (0.36 | ) | | $ | 11.83 | |
Year ended May 31, 2017 | | $ | 9.88 | | | | 0.13 | | | | 0.00 | | | | 1.39 | | | | (0.12 | ) | | | (0.23 | ) | | $ | 11.05 | |
Year ended May 31, 20166 | | $ | 10.00 | | | | 0.07 | | | | 0.00 | | | | (0.13 | ) | | | (0.06 | ) | | | 0.00 | | | $ | 9.88 | |
| | | | | | | |
Class R6 | | | | | | | | | | | | | | | | | | | | | | | | | | | | |
Six months ended August 31, 2020 (unaudited) | | $ | 9.70 | | | | 0.11 | | | | 0.00 | | | | 1.06 | | | | 0.00 | | | | 0.00 | | | $ | 10.87 | |
Year ended February 29, 2020 | | $ | 9.76 | | | | 0.22 | | | | 0.00 | | | | (0.06 | ) | | | (0.22 | ) | | | 0.00 | | | $ | 9.70 | |
Year ended February 28, 20194 | | $ | 11.84 | | | | 0.12 | | | | 0.00 | | | | 0.05 | | | | (0.10 | ) | | | (2.15 | ) | | $ | 9.76 | |
Year ended May 31, 2018 | | $ | 11.06 | | | | 0.16 | | | | 0.00 | | | | 1.21 | | | | (0.23 | ) | | | (0.36 | ) | | $ | 11.84 | |
Year ended May 31, 2017 | | $ | 9.88 | | | | 0.14 | | | | 0.00 | | | | 1.40 | | | | (0.13 | ) | | | (0.23 | ) | | $ | 11.06 | |
Year ended May 31, 20166 | | $ | 10.00 | | | | 0.08 | | | | 0.00 | | | | (0.13 | ) | | | (0.07 | ) | | | 0.00 | | | $ | 9.88 | |
| 1 | Total return calculations do not include any sales charges. Returns for periods of less than one year are not annualized. |
| 2 | Portfolio turnover rate is calculated by multiplying the Fund’s ownership percentage in each respective affiliated Master Portfolio by the corresponding affiliated Master Portfolio’s purchases and sales. These purchase and sale amounts are aggregated with any direct purchases and sales in affiliated and unaffiliated mutual funds, exchange-traded funds and unaffiliated securities and included in the portfolio turnover calculation. |
| 3 | Ratios reflect net expenses allocated from the affiliated Master Portfolios which were as follows: |
| | | | | | | | | | | | |
| | | Six months ended
August 31, 2020
(unaudited) | | | Year ended
February 29, 2020 | | | Year ended
February 28, 20194 | |
Class A | | | 0.13 | % | | | 0.16 | % | | | 0.13 | % |
Class C | | | 0.13 | | | | 0.16 | | | | 0.13 | |
Class R4 | | | 0.13 | | | | 0.15 | | | | 0.13 | |
Class R6 | | | 0.14 | | | | 0.17 | | | | 0.14 | |
| 4 | For the nine months ended February 28, 2019. The Fund changed its fiscal year end from May 31 to February 28, effective February 28, 2019. |
| 5 | Ratios do not reflect net expenses allocated from the affiliated Master Portfolios. Including annualized net expenses allocated from the affiliated Master Portfolios, the expense ratios would be increased by the following amounts: |
| | | | | | | | | | | | |
| | | Year ended May 31 | |
| | | 2018 | | | 2017 | | | 20166 | |
Class A | | | 0.09 | % | | | 0.10 | % | | | 0.10 | % |
Class C | | | 0.09 | | | | 0.10 | | | | 0.10 | |
Class R4 | | | 0.09 | | | | 0.10 | | | | 0.10 | |
Class R6 | | | 0.10 | | | | 0.11 | | | | 0.11 | |
| 6 | For the period from November 30, 2015 (commencement of class operations) to May 31, 2016 |
| 7 | During the six months ended August 31, 2020, the Fund received a payment from an affiliate which had an impact of 1.56% on the total return. See Note 4 in the Notes to Financial Statements for additional information. |
The accompanying notes are an integral part of these financial statements.
90 | Target Date Retirement Funds
Financial highlights
| | | | | | | | | | | | | | | | | | | | | | |
| Ratio to average net assets (annualized) | | | | | | Portfolio
turnover
rate2 | | |
Net assets at
end of period
(000s omitted) | |
Net investment
income | | | Gross
expenses | | | Net
expenses | | | Total
return1 | |
| | | | | |
| | | | | | | | | | | | | | | | | | | | | | | |
| | | | | |
| | | | | | | | | | | | | | | | | | | | | | |
| | 1.82 | %3 | | | 3.66 | %3 | | | 0.68 | %3 | | | 11.81 | % | | | 59 | % | | $ | 296 | |
| | 1.72 | %3 | | | 3.67 | %3 | | | 0.66 | %3 | | | 1.01 | % | | | 36 | % | | $ | 254 | |
| | 0.96 | %3 | | | 4.34 | %3 | | | 0.60 | %3 | | | 2.37 | % | | | 31 | % | | $ | 198 | |
| | 0.83 | % | | | 4.26 | %5 | | | 0.54 | %5 | | | 12.16 | % | | | 35 | % | | $ | 256 | |
| | 0.91 | % | | | 4.80 | %5 | | | 0.53 | %5 | | | 15.65 | % | | | 31 | % | | $ | 134 | |
| | 1.22 | % | | | 5.25 | %5 | | | 0.53 | %5 | | | (0.78 | )% | | | 14 | % | | $ | 108 | |
| | | | | |
| | | | | | | | | | | | | | | | | | | | | | |
| | 1.08 | %3 | | | 3.93 | %3 | | | 1.43 | %3 | | | 12.93 | %7 | | | 59 | % | | $ | 122 | |
| | 0.99 | %3 | | | 4.42 | %3 | | | 1.42 | %3 | | | 0.26 | % | | | 36 | % | | $ | 106 | |
| | 0.21 | %3 | | | 5.09 | %3 | | | 1.35 | %3 | | | 1.77 | % | | | 31 | % | | $ | 102 | |
| | 0.15 | % | | | 5.02 | %5 | | | 1.29 | %5 | | | 11.33 | % | | | 35 | % | | $ | 121 | |
| | 0.18 | % | | | 5.56 | %5 | | | 1.29 | %5 | | | 14.77 | % | | | 31 | % | | $ | 113 | |
| | 0.48 | % | | | 6.00 | %5 | | | 1.30 | %5 | | | (1.15 | )% | | | 14 | % | | $ | 99 | |
| | | | | |
| | | | | | | | | | | | | | | | | | | | | | |
| | 2.14 | %3 | | | 3.38 | %3 | | | 0.37 | %3 | | | 11.97 | % | | | 59 | % | | $ | 113 | |
| | 2.05 | %3 | | | 3.39 | %3 | | | 0.36 | %3 | | | 1.22 | % | | | 36 | % | | $ | 101 | |
| | 1.25 | %3 | | | 4.06 | %3 | | | 0.30 | %3 | | | 2.67 | % | | | 31 | % | | $ | 102 | |
| | 1.19 | % | | | 3.99 | %5 | | | 0.25 | %5 | | | 12.42 | % | | | 35 | % | | $ | 123 | |
| | 1.23 | % | | | 4.53 | %5 | | | 0.24 | %5 | | | 15.90 | % | | | 31 | % | | $ | 115 | |
| | 1.53 | % | | | 4.97 | %5 | | | 0.24 | %5 | | | (0.55 | )% | | | 14 | % | | $ | 99 | |
| | | | | |
| | | | | | | | | | | | | | | | | | | | | | |
| | 2.29 | %3 | | | 3.24 | %3 | | | 0.22 | %3 | | | 12.06 | % | | | 59 | % | | $ | 5,535 | |
| | 2.19 | %3 | | | 3.25 | %3 | | | 0.21 | %3 | | | 1.47 | % | | | 36 | % | | $ | 4,884 | |
| | 1.40 | %3 | | | 3.92 | %3 | | | 0.15 | %3 | | | 2.75 | % | | | 31 | % | | $ | 4,682 | |
| | 1.35 | % | | | 3.84 | %5 | | | 0.10 | %5 | | | 12.56 | % | | | 35 | % | | $ | 5,681 | |
| | 1.39 | % | | | 4.38 | %5 | | | 0.09 | %5 | | | 16.17 | % | | | 31 | % | | $ | 5,304 | |
| | 1.69 | % | | | 4.82 | %5 | | | 0.09 | %5 | | | (0.53 | )% | | | 14 | % | | $ | 4,576 | |
The accompanying notes are an integral part of these financial statements.
Target Date Retirement Funds | 91
Financial highlights
| | | | | | | | | | | | | | | | | | | | | | | | | | | | |
| | | Beginning
net asset
value per
share | | | Net
investment
income | | | Payment
from
affiliate | | | Net realized
and unrealized
gains (losses)
on investments | | | Distributions
from net
investment
income | | | Distributions
from net
realized gains | | | Ending
net asset
value per
share | |
| | | | | | | |
Dynamic Target 2055 Fund | | | | | | | | | | | | | | | | | | | | | | | | | | | | |
| | | | | | | |
Class A | | | | | | | | | | | | | | | | | | | | | | | | | | | | |
Six months ended August 31, 2020 (unaudited) | | $ | 9.66 | | | | 0.09 | | | | 0.00 | | | | 1.09 | | | | 0.00 | | | | 0.00 | | | $ | 10.84 | |
Year ended February 29, 2020 | | $ | 9.73 | | | | 0.15 | | | | 0.00 | | | | (0.04 | ) | | | (0.18 | ) | | | 0.00 | | | $ | 9.66 | |
Year ended February 28, 20194 | | $ | 11.80 | | | | 0.08 | | | | 0.00 | | | | 0.05 | | | | (0.05 | ) | | | (2.15 | ) | | $ | 9.73 | |
Year ended May 31, 2018 | | $ | 11.03 | | | | 0.11 | | | | 0.00 | | | | 1.22 | | | | (0.19 | ) | | | (0.37 | ) | | $ | 11.80 | |
Year ended May 31, 2017 | | $ | 9.87 | | | | 0.09 | | | | 0.00 | | | | 1.39 | | | | (0.09 | ) | | | (0.23 | ) | | $ | 11.03 | |
Year ended May 31, 20166 | | $ | 10.00 | | | | 0.06 | | | | 0.00 | | | | (0.13 | ) | | | (0.06 | ) | | | 0.00 | | | $ | 9.87 | |
| | | | | | | |
Class C | | | | | | | | | | | | | | | | | | | | | | | | | | | | |
Six months ended August 31, 2020 (unaudited) | | $ | 9.59 | | | | 0.05 | | | | 0.16 | | | | 1.08 | | | | 0.00 | | | | 0.00 | | | $ | 10.88 | |
Year ended February 29, 2020 | | $ | 9.67 | | | | 0.10 | | | | 0.00 | | | | (0.06 | ) | | | (0.12 | ) | | | 0.00 | | | $ | 9.59 | |
Year ended February 28, 20194 | | $ | 11.75 | | | | 0.02 | | | | 0.00 | | | | 0.05 | | | | 0.00 | | | | (2.15 | ) | | $ | 9.67 | |
Year ended May 31, 2018 | | $ | 10.99 | | | | 0.02 | | | | 0.00 | | | | 1.21 | | | | (0.10 | ) | | | (0.37 | ) | | $ | 11.75 | |
Year ended May 31, 2017 | | $ | 9.84 | | | | 0.02 | | | | 0.00 | | | | 1.38 | | | | (0.02 | ) | | | (0.23 | ) | | $ | 10.99 | |
Year ended May 31, 20166 | | $ | 10.00 | | | | 0.02 | | | | 0.00 | | | | (0.13 | ) | | | (0.05 | ) | | | 0.00 | | | $ | 9.84 | |
| | | | | | | |
Class R4 | | | | | | | | | | | | | | | | | | | | | | | | | | | | |
Six months ended August 31, 2020 (unaudited) | | $ | 9.69 | | | | 0.10 | | | | 0.00 | | | | 1.11 | | | | 0.00 | | | | 0.00 | | | $ | 10.90 | |
Year ended February 29, 2020 | | $ | 9.75 | | | | 0.21 | | | | 0.00 | | | | (0.07 | ) | | | (0.20 | ) | | | 0.00 | | | $ | 9.69 | |
Year ended February 28, 20194 | | $ | 11.83 | | | | 0.10 | | | | 0.00 | | | | 0.05 | | | | (0.08 | ) | | | (2.15 | ) | | $ | 9.75 | |
Year ended May 31, 2018 | | $ | 11.05 | | | | 0.14 | | | | 0.00 | | | | 1.23 | | | | (0.22 | ) | | | (0.37 | ) | | $ | 11.83 | |
Year ended May 31, 2017 | | $ | 9.88 | | | | 0.13 | | | | 0.00 | | | | 1.39 | | | | (0.12 | ) | | | (0.23 | ) | | $ | 11.05 | |
Year ended May 31, 20166 | | $ | 10.00 | | | | 0.07 | | | | 0.00 | | | | (0.13 | ) | | | (0.06 | ) | | | 0.00 | | | $ | 9.88 | |
| | | | | | | |
Class R6 | | | | | | | | | | | | | | | | | | | | | | | | | | | | |
Six months ended August 31, 2020 (unaudited) | | $ | 9.69 | | | | 0.11 | | | | 0.00 | | | | 1.11 | | | | 0.00 | | | | 0.00 | | | $ | 10.91 | |
Year ended February 29, 2020 | | $ | 9.75 | | | | 0.22 | 8 | | | 0.00 | | | | (0.07 | ) | | | (0.21 | ) | | | 0.00 | | | $ | 9.69 | |
Year ended February 28, 20194 | | $ | 11.84 | | | | 0.12 | | | | 0.00 | | | | 0.04 | | | | (0.10 | ) | | | (2.15 | ) | | $ | 9.75 | |
Year ended May 31, 2018 | | $ | 11.06 | | | | 0.16 | | | | 0.00 | | | | 1.22 | | | | (0.23 | ) | | | (0.37 | ) | | $ | 11.84 | |
Year ended May 31, 2017 | | $ | 9.89 | | | | 0.14 | | | | 0.00 | | | | 1.39 | | | | (0.13 | ) | | | (0.23 | ) | | $ | 11.06 | |
Year ended May 31, 20166 | | $ | 10.00 | | | | 0.08 | | | | 0.00 | | | | (0.12 | ) | | | (0.07 | ) | | | 0.00 | | | $ | 9.89 | |
| 1 | Total return calculations do not include any sales charges. Returns for periods of less than one year are not annualized. |
| 2 | Portfolio turnover rate is calculated by multiplying the Fund’s ownership percentage in each respective affiliated Master Portfolio by the corresponding affiliated Master Portfolio’s purchases and sales. These purchase and sale amounts are aggregated with any direct purchases and sales in affiliated and unaffiliated mutual funds, exchange-traded funds and unaffiliated securities and included in the portfolio turnover calculation. |
| 3 | Ratios reflect net expenses allocated from the affiliated Master Portfolios which were as follows: |
| | | | | | | | | | | | |
| | | Six months ended
August 31, 2020
(unaudited) | | | Year ended
February 29, 2020 | | | Year ended
February 28, 20194 | |
Class A | | | 0.13 | % | | | 0.16 | % | | | 0.13 | % |
Class C | | | 0.13 | | | | 0.15 | | | | 0.13 | |
Class R4 | | | 0.13 | | | | 0.15 | | | | 0.13 | |
Class R6 | | | 0.14 | | | | 0.17 | | | | 0.14 | |
| 4 | For the nine months ended February 28, 2019. The Fund changed its fiscal year end from May 31 to February 28, effective February 28, 2019. |
| 5 | Ratios do not reflect net expenses allocated from the affiliated Master Portfolios. Including annualized net expenses allocated from the affiliated Master Portfolios, the expense ratios would be increased by the following amounts: |
| | | | | | | | | | | | |
| | | Year ended May 31 | |
| | | 2018 | | | 2017 | | | 20166 | |
Class A | | | 0.09 | % | | | 0.10 | % | | | 0.10 | % |
Class C | | | 0.09 | | | | 0.10 | | | | 0.10 | |
Class R4 | | | 0.09 | | | | 0.10 | | | | 0.10 | |
Class R6 | | | 0.10 | | | | 0.11 | | | | 0.11 | |
| 6 | For the period from November 30, 2015 (commencement of class operations) to May 31, 2016 |
| 7 | During the six months ended August 31, 2020, the Fund received a payment from an affiliate which had an impact of 1.67% on the total return. See Note 4 in the Notes to Financial Statements for additional information. |
| 8 | Calculated based upon average shares outstanding |
The accompanying notes are an integral part of these financial statements.
92 | Target Date Retirement Funds
Financial highlights
| | | | | | | | | | | | | | | | | | | | | | |
| Ratio to average net assets (annualized) | | | | | | Portfolio
turnover
rate2 | | |
Net assets at
end of period
(000s omitted) | |
Net investment
income | | | Gross
expenses | | | Net
expenses | | | Total
return1 | |
| | | | | |
| | | | | | | | | | | | | | | | | | | | | | | |
| | | | | |
| | | | | | | | | | | | | | | | | | | | | | |
| | 1.81 | %3 | | | 3.75 | %3 | | | 0.68 | %3 | | | 12.22 | % | | | 59 | % | | $ | 309 | |
| | 1.68 | %3 | | | 3.82 | %3 | | | 0.67 | %3 | | | 0.95 | % | | | 36 | % | | $ | 239 | |
| | 0.95 | %3 | | | 4.31 | %3 | | | 0.61 | %3 | | | 2.37 | % | | | 31 | % | | $ | 161 | |
| | 0.89 | % | | | 4.18 | %5 | | | 0.54 | %5 | | | 12.10 | % | | | 34 | % | | $ | 170 | |
| | 0.90 | % | | | 4.67 | %5 | | | 0.54 | %5 | | | 15.56 | % | | | 31 | % | | $ | 134 | |
| | 1.21 | % | | | 5.23 | %5 | | | 0.54 | %5 | | | (0.68 | )% | | | 14 | % | | $ | 103 | |
| | | | | |
| | | | | | | | | | | | | | | | | | | | | | |
| | 1.08 | %3 | | | 4.00 | %3 | | | 1.43 | %3 | | | 13.45 | %7 | | | 59 | % | | $ | 118 | |
| | 0.99 | %3 | | | 4.40 | %3 | | | 1.42 | %3 | | | 0.26 | % | | | 36 | % | | $ | 100 | |
| | 0.18 | %3 | | | 5.04 | %3 | | | 1.36 | %3 | | | 1.77 | % | | | 31 | % | | $ | 100 | |
| | 0.15 | % | | | 4.93 | %5 | | | 1.29 | %5 | | | 11.25 | % | | | 34 | % | | $ | 121 | |
| | 0.17 | % | | | 5.42 | %5 | | | 1.30 | %5 | | | 14.68 | % | | | 31 | % | | $ | 113 | |
| | 0.47 | % | | | 5.98 | %5 | | | 1.30 | %5 | | | (1.05 | )% | | | 14 | % | | $ | 99 | |
| | | | | |
| | | | | | | | | | | | | | | | | | | | | | |
| | 2.14 | %3 | | | 3.48 | %3 | | | 0.37 | %3 | | | 12.49 | % | | | 59 | % | | $ | 113 | |
| | 2.04 | %3 | | | 3.55 | %3 | | | 0.36 | %3 | | | 1.24 | % | | | 36 | % | | $ | 101 | |
| | 1.23 | %3 | | | 4.02 | %3 | | | 0.32 | %3 | | | 2.58 | % | | | 31 | % | | $ | 102 | |
| | 1.19 | % | | | 3.90 | %5 | | | 0.25 | %5 | | | 12.44 | % | | | 34 | % | | $ | 123 | |
| | 1.23 | % | | | 4.39 | %5 | | | 0.24 | %5 | | | 15.94 | % | | | 31 | % | | $ | 115 | |
| | 1.53 | % | | | 4.95 | %5 | | | 0.24 | %5 | | | (0.55 | )% | | | 14 | % | | $ | 99 | |
| | | | | |
| | | | | | | | | | | | | | | | | | | | | | |
| | 2.29 | %3 | | | 3.34 | %3 | | | 0.22 | %3 | | | 12.59 | % | | | 59 | % | | $ | 5,737 | |
| | 2.18 | %3 | | | 3.41 | %3 | | | 0.21 | %3 | | | 1.38 | % | | | 36 | % | | $ | 5,031 | |
| | 1.38 | %3 | | | 3.87 | %3 | | | 0.17 | %3 | | | 2.70 | % | | | 31 | % | | $ | 4,678 | |
| | 1.34 | % | | | 3.75 | %5 | | | 0.10 | %5 | | | 12.58 | % | | | 34 | % | | $ | 5,679 | |
| | 1.38 | % | | | 4.25 | %5 | | | 0.09 | %5 | | | 16.08 | % | | | 31 | % | | $ | 5,305 | |
| | 1.69 | % | | | 4.80 | %5 | | | 0.09 | %5 | | | (0.43 | )% | | | 14 | % | | $ | 4,579 | |
The accompanying notes are an integral part of these financial statements.
Target Date Retirement Funds | 93
Financial highlights
| | | | | | | | | | | | | | | | | | | | | | | | | | | | |
| | | Beginning
net asset
value per
share | | | Net
investment
income | | | Payment
from
affiliate | | | Net realized
and unrealized
gains (losses)
on investments | | | Distributions
from net
investment
income | | | Distributions
from net
realized gains | | | Ending
net asset
value per
share | |
| | | | | | | |
Dynamic Target 2060 Fund | | | | | | | | | | | | | | | | | | | | | | | | | | | | |
| | | | | | | |
Class A | | | | | | | | | | | | | | | | | | | | | | | | | | | | |
Six months ended August 31, 2020 (unaudited) | | $ | 9.66 | | | | 0.07 | | | | 0.00 | | | | 1.06 | | | | 0.00 | | | | 0.00 | | | $ | 10.79 | |
Year ended February 29, 2020 | | $ | 9.74 | | | | 0.17 | 3 | | | 0.00 | | | | (0.05 | ) | | | (0.20 | ) | | | 0.00 | | | $ | 9.66 | |
Year ended February 28, 20195 | | $ | 11.79 | | | | 0.08 | | | | 0.00 | | | | 0.06 | | | | (0.06 | ) | | | (2.13 | ) | | $ | 9.74 | |
Year ended May 31, 2018 | | $ | 11.03 | | | | 0.09 | | | | 0.00 | | | | 1.23 | | | | (0.20 | ) | | | (0.36 | ) | | $ | 11.79 | |
Year ended May 31, 2017 | | $ | 9.88 | | | | 0.09 | | | | 0.00 | | | | 1.39 | | | | (0.09 | ) | | | (0.24 | ) | | $ | 11.03 | |
Year ended May 31, 20167 | | $ | 10.00 | | | | 0.06 | | | | 0.00 | | | | (0.12 | ) | | | (0.06 | ) | | | 0.00 | | | $ | 9.88 | |
| | | | | | | |
Class C | | | | | | | | | | | | | | | | | | | | | | | | | | | | |
Six months ended August 31, 2020 (unaudited) | | $ | 9.62 | | | | 0.05 | | | | 0.16 | | | | 1.04 | | | | 0.00 | | | | 0.00 | | | $ | 10.87 | |
Year ended February 29, 2020 | | $ | 9.72 | | | | 0.10 | | | | 0.00 | | | | (0.07 | ) | | | (0.13 | ) | | | 0.00 | | | $ | 9.62 | |
Year ended February 28, 20195 | | $ | 11.76 | | | | 0.02 | | | | 0.00 | | | | 0.07 | | | | 0.00 | | | | (2.13 | ) | | $ | 9.72 | |
Year ended May 31, 2018 | | $ | 10.99 | | | | 0.02 | | | | 0.00 | | | | 1.21 | | | | (0.10 | ) | | | (0.36 | ) | | $ | 11.76 | |
Year ended May 31, 2017 | | $ | 9.85 | | | | 0.02 | | | | 0.00 | | | | 1.38 | | | | (0.02 | ) | | | (0.24 | ) | | $ | 10.99 | |
Year ended May 31, 20167 | | $ | 10.00 | | | | 0.02 | | | | 0.00 | | | | (0.12 | ) | | | (0.05 | ) | | | 0.00 | | | $ | 9.85 | |
| | | | | | | |
Class R4 | | | | | | | | | | | | | | | | | | | | | | | | | | | | |
Six months ended August 31, 2020 (unaudited) | | $ | 9.73 | | | | 0.11 | | | | 0.00 | | | | 1.04 | | | | 0.00 | | | | 0.00 | | | $ | 10.88 | |
Year ended February 29, 2020 | | $ | 9.79 | | | | 0.21 | | | | 0.00 | | | | (0.06 | ) | | | (0.21 | ) | | | 0.00 | | | $ | 9.73 | |
Year ended February 28, 20195 | | $ | 11.84 | | | | 0.10 | | | | 0.00 | | | | 0.06 | | | | (0.08 | ) | | | (2.13 | ) | | $ | 9.79 | |
Year ended May 31, 2018 | | $ | 11.05 | | | | 0.14 | | | | 0.00 | | | | 1.22 | | | | (0.21 | ) | | | (0.36 | ) | | $ | 11.84 | |
Year ended May 31, 2017 | | $ | 9.89 | | | | 0.13 | | | | 0.00 | | | | 1.39 | | | | (0.12 | ) | | | (0.24 | ) | | $ | 11.05 | |
Year ended May 31, 20167 | | $ | 10.00 | | | | 0.07 | | | | 0.00 | | | | (0.12 | ) | | | (0.06 | ) | | | 0.00 | | | $ | 9.89 | |
| | | | | | | |
Class R6 | | | | | | | | | | | | | | | | | | | | | | | | | | | | |
Six months ended August 31, 2020 (unaudited) | | $ | 9.74 | | | | 0.11 | | | | 0.00 | | | | 1.05 | | | | 0.00 | | | | 0.00 | | | $ | 10.90 | |
Year ended February 29, 2020 | | $ | 9.80 | | | | 0.23 | | | | 0.00 | | | | (0.06 | ) | | | (0.23 | ) | | | 0.00 | | | $ | 9.74 | |
Year ended February 28, 20195 | | $ | 11.85 | | | | 0.12 | | | | 0.00 | | | | 0.06 | | | | (0.10 | ) | | | (2.13 | ) | | $ | 9.80 | |
Year ended May 31, 2018 | | $ | 11.06 | | | | 0.16 | | | | 0.00 | | | | 1.22 | | | | (0.23 | ) | | | (0.36 | ) | | $ | 11.85 | |
Year ended May 31, 2017 | | $ | 9.90 | | | | 0.14 | | | | 0.00 | | | | 1.39 | | | | (0.13 | ) | | | (0.24 | ) | | $ | 11.06 | |
Year ended May 31, 20167 | | $ | 10.00 | | | | 0.08 | | | | 0.00 | | | | (0.11 | ) | | | (0.07 | ) | | | 0.00 | | | $ | 9.90 | |
| 1 | Total return calculations do not include any sales charges. Returns for periods of less than one year are not annualized. |
| 2 | Portfolio turnover rate is calculated by multiplying the Fund’s ownership percentage in each respective affiliated Master Portfolio by the corresponding affiliated Master Portfolio’s purchases and sales. These purchase and sale amounts are aggregated with any direct purchases and sales in affiliated and unaffiliated mutual funds, exchange-traded funds and unaffiliated securities and included in the portfolio turnover calculation. |
| 3 | Calculated based upon average shares outstanding |
| 4 | Ratios reflect net expenses allocated from the affiliated Master Portfolios which were as follows: |
| | | | | | | | | | | | |
| | | Six months ended
August 31, 2020
(unaudited) | | | Year ended
February 29, 2020 | | | Year ended
February 28, 20195 | |
Class A | | | 0.13 | % | | | 0.16 | % | | | 0.14 | % |
Class C | | | 0.13 | | | | 0.15 | | | | 0.13 | |
Class R4 | | | 0.13 | | | | 0.15 | | | | 0.13 | |
Class R6 | | | 0.14 | | | | 0.17 | | | | 0.14 | |
| 5 | For the nine months ended February 28, 2019. The Fund changed its fiscal year end from May 31 to February 28, effective February 28, 2019. |
| 6 | Ratios do not reflect net expenses allocated from the affiliated Master Portfolios. Including annualized net expenses allocated from the affiliated Master Portfolios, the expense ratios would be increased by the following amounts: |
| | | | | | | | | | | | |
| | | Year ended May 31 | |
| | | 2018 | | | 2017 | | | 20167 | |
Class A | | | 0.09 | % | | | 0.10 | % | | | 0.10 | % |
Class C | | | 0.09 | | | | 0.10 | | | | 0.10 | |
Class R4 | | | 0.09 | | | | 0.10 | | | | 0.10 | |
Class R6 | | | 0.10 | | | | 0.11 | | | | 0.11 | |
| 7 | For the period from November 30, 2015 (commencement of class operations) to May 31, 2016 |
| 8 | During the six months ended August 31, 2020, the Fund received a payment from an affiliate which had an impact of 1.66% on the total return. See Note 4 in the Notes to Financial Statements for additional information. |
The accompanying notes are an integral part of these financial statements.
94 | Target Date Retirement Funds
Financial highlights
| | | | | | | | | | | | | | | | | | | | | | |
| Ratio to average net assets (annualized) | | | | | | Portfolio
turnover
rate2 | | |
Net assets at
end of period
(000s omitted) | |
Net investment
income | | | Gross
expenses | | | Net
expenses | | | Total
return1 | |
| | | | | |
| | | | | | | | | | | | | | | | | | | | | | | |
| | | | | |
| | | | | | | | | | | | | | | | | | | | | | |
| | 1.86 | %4 | | | 3.79 | %4 | | | 0.68 | %4 | | | 11.70 | % | | | 58 | % | | $ | 290 | |
| | 1.67 | %4 | | | 3.64 | %4 | | | 0.66 | %4 | | | 1.01 | % | | | 36 | % | | $ | 345 | |
| | 0.97 | %4 | | | 4.30 | %4 | | | 0.59 | %4 | | | 2.40 | % | | | 31 | % | | $ | 290 | |
| | 1.03 | % | | | 4.22 | %6 | | | 0.53 | %6 | | | 12.12 | % | | | 36 | % | | $ | 261 | |
| | 0.92 | % | | | 4.80 | %6 | | | 0.55 | %6 | | | 15.57 | % | | | 30 | % | | $ | 127 | |
| | 1.22 | % | | | 5.24 | %6 | | | 0.55 | %6 | | | (0.58 | )% | | | 14 | % | | $ | 101 | |
| | | | | |
| | | | | | | | | | | | | | | | | | | | | | |
| | 1.09 | %4 | | | 4.01 | %4 | | | 1.43 | %4 | | | 12.99 | %8 | | | 58 | % | | $ | 112 | |
| | 0.99 | %4 | | | 4.22 | %4 | | | 1.42 | %4 | | | 0.16 | % | | | 36 | % | | $ | 99 | |
| | 0.20 | %4 | | | 5.04 | %4 | | | 1.35 | %4 | | | 1.89 | % | | | 31 | % | | $ | 100 | |
| | 0.15 | % | | | 4.99 | %6 | | | 1.29 | %6 | | | 11.28 | % | | | 36 | % | | $ | 121 | |
| | 0.17 | % | | | 5.55 | %6 | | | 1.30 | %6 | | | 14.69 | % | | | 30 | % | | $ | 113 | |
| | 0.48 | % | | | 5.99 | %6 | | | 1.30 | %6 | | | (0.94 | )% | | | 14 | % | | $ | 99 | |
| | | | | |
| | | | | | | | | | | | | | | | | | | | | | |
| | 2.15 | %4 | | | 3.50 | %4 | | | 0.37 | %4 | | | 11.82 | % | | | 58 | % | | $ | 113 | |
| | 2.05 | %4 | | | 3.37 | %4 | | | 0.36 | %4 | | | 1.34 | % | | | 36 | % | | $ | 101 | |
| | 1.25 | %4 | | | 4.01 | %4 | | | 0.30 | %4 | | | 2.60 | % | | | 31 | % | | $ | 102 | |
| | 1.19 | % | | | 3.96 | %6 | | | 0.25 | %6 | | | 12.46 | % | | | 36 | % | | $ | 123 | |
| | 1.23 | % | | | 4.52 | %6 | | | 0.24 | %6 | | | 15.94 | % | | | 30 | % | | $ | 115 | |
| | 1.53 | % | | | 4.96 | %6 | | | 0.24 | %6 | | | (0.45 | )% | | | 14 | % | | $ | 100 | |
| | | | | |
| | | | | | | | | | | | | | | | | | | | | | |
| | 2.30 | %4 | | | 3.36 | %4 | | | 0.22 | %4 | | | 12.02 | % | | | 58 | % | | $ | 5,264 | |
| | 2.20 | %4 | | | 3.23 | %4 | | | 0.21 | %4 | | | 1.48 | % | | | 36 | % | | $ | 4,685 | |
| | 1.40 | %4 | | | 3.87 | %4 | | | 0.15 | %4 | | | 2.78 | % | | | 31 | % | | $ | 4,706 | |
| | 1.35 | % | | | 3.81 | %6 | | | 0.10 | %6 | | | 12.60 | % | | | 36 | % | | $ | 5,692 | |
| | 1.39 | % | | | 4.37 | %6 | | | 0.09 | %6 | | | 16.09 | % | | | 30 | % | | $ | 5,312 | |
| | 1.69 | % | | | 4.81 | %6 | | | 0.09 | %6 | | | (0.33 | )% | | | 14 | % | | $ | 4,584 | |
The accompanying notes are an integral part of these financial statements.
Target Date Retirement Funds | 95
Notes to financial statements (unaudited)
1. ORGANIZATION
Wells Fargo Funds Trust (the “Trust”), a Delaware statutory trust organized on March 10, 1999, is an open-end management investment company registered under the Investment Company Act of 1940, as amended (the “1940 Act”). As an investment company, the Trust follows the accounting and reporting guidance in Financial Accounting Standards Board Accounting Standards Codification Topic 946, Financial Services – Investment Companies. These financial statements report on the following funds: Wells Fargo Dynamic Target Today Fund (“Dynamic Target Today Fund”), Wells Fargo Dynamic Target 2015 Fund (“Dynamic Target 2015 Fund”), Wells Fargo Dynamic Target 2020 Fund (“Dynamic Target 2020 Fund”), Wells Fargo Dynamic Target 2025 Fund (“Dynamic Target 2025 Fund”), Wells Fargo Dynamic Target 2030 Fund (“Dynamic Target 2030 Fund”), Wells Fargo Dynamic Target 2035 Fund (“Dynamic Target 2035 Fund”), Wells Fargo Dynamic Target 2040 Fund (“Dynamic Target 2040 Fund”), Wells Fargo Dynamic Target 2045 Fund (“Dynamic Target 2045 Fund”), Wells Fargo Dynamic Target 2050 Fund (“Dynamic Target 2050 Fund”), Wells Fargo Dynamic Target 2055 Fund (“Dynamic Target 2055 Fund”), and Wells Fargo Dynamic Target 2060 Fund (“Dynamic Target 2060 Fund”) (each, a “Fund”, collectively, the “Funds”). Each Fund is a diversified series of the Trust.
Each Fund is a fund-of-funds which seeks to achieve its investment objective by investing in multiple diversified portfolios (collectively, the “affiliated Master Portfolios”) of Wells Fargo Master Trust, a registered open-end management investment company. Each affiliated Master Portfolio directly acquires portfolio securities, and a Fund investing in an affiliated Master Portfolio acquires an indirect interest in those securities. Each Fund accounts for its investment in the affiliated Master Portfolios as partnership investments and records on a daily basis its share of each affiliated Master Portfolio’s income, expense and realized and unrealized gains and losses. The financial statements of the affiliated Master Portfolios are presented in separate financial statements and may be obtained free of charge by contacting Investor Services or by visiting the SEC website at sec.gov. The financial statements of the affiliated Master Portfolios are filed with the SEC under Wells Fargo Master Trust.
2. SIGNIFICANT ACCOUNTING POLICIES
The following significant accounting policies, which are consistently followed in the preparation of the financial statements of each Fund, are in conformity with U.S. generally accepted accounting principles which require management to make estimates and assumptions that affect the reported amounts of assets and liabilities, disclosure of contingent assets and liabilities at the date of the financial statements, and the reported amounts of revenues and expenses during the reporting period. Actual results could differ from those estimates.
Securities valuation
All investments are valued each business day as of the close of regular trading on the New York Stock Exchange (generally 4 p.m. Eastern Time), although the Funds may deviate from this calculation time under unusual or unexpected circumstances.
Investments in the affiliated Master Portfolios are valued daily based on each Fund’s proportionate share of each affiliated Master Portfolio’s net assets, which are also valued daily.
Futures contracts that are listed on a foreign or domestic exchange or market are valued at the official closing price or, if none, the last sales price.
Debt securities are valued at the evaluated bid price provided by an independent pricing service (e.g. taking into account various factors, including yields, maturities, or credit ratings) or, if a reliable price is not available, the quoted bid price from an independent broker-dealer.
Investments which are not valued using the methods discussed above are valued at their fair value, as determined in good faith by the Board of Trustees of the Funds. The Board of Trustees has established a Valuation Committee comprised of the Trustees and has delegated to it the authority to take any actions regarding the valuation of portfolio securities that the Valuation Committee deems necessary or appropriate, including determining the fair value of portfolio securities, unless the determination has been delegated to the Wells Fargo Asset Management Pricing Committee at Wells Fargo Funds Management, LLC (“Funds Management”). The Board of Trustees retains the authority to make or ratify any valuation decisions or approve any changes to the Valuation Procedures as it deems appropriate. On a quarterly basis, the Board of Trustees receives reports on any valuation actions taken by the Valuation Committee or the Wells Fargo Asset Management Pricing Committee which may include items for ratification.
Futures contracts
Futures contracts are agreements between each Fund and a counterparty to buy or sell a specific amount of a commodity, financial instrument or currency at a specified price and on a specified date. Each Fund may buy and sell futures contracts in order to gain exposure to, or protect against, changes in interest rates, security values, and foreign exchange rates and is subject to interest rate risk, equity price risk, and foreign currency risk. The primary risks associated with the use of futures
96 | Target Date Retirement Funds
Notes to financial statements (unaudited)
contracts are the imperfect correlation between changes in market values of securities held by the Fund and the prices of futures contracts, and the possibility of an illiquid market. Futures contracts are generally entered into on a regulated futures exchange and cleared through a clearinghouse associated with the exchange. With futures contracts, there is minimal counterparty risk to the Fund since futures contracts are exchange traded and the exchange’s clearinghouse, as the counterparty to all exchange traded futures, guarantees the futures contracts against default.
Upon entering into a futures contracts, the Fund is required to deposit either cash or securities (initial margin) with the broker in an amount equal to a certain percentage of the contract value. Subsequent payments (variation margin) are paid to or from the broker each day equal to the daily changes in the contract value. Such payments are recorded as unrealized gains or losses and, if any, shown as variation margin receivable (payable) in the Statements of Assets and Liabilities. Should the Fund fail to make requested variation margin payments, the broker can gain access to the initial margin to satisfy the Fund’s payment obligations. When the contracts are closed, a realized gain or loss is recorded in the Statements of Operations.
Security transactions and income recognition
Securities transactions are recorded on a trade date basis. Realized gains or losses are recorded on the basis of identified cost.
Each Fund records on a daily basis its proportionate share of each affiliated Master Portfolio’s interest and dividend income, in addition to expenses and realized and unrealized gains and losses. Each Fund also accrues its own expenses. Income from foreign securities in each affiliated Master Portfolio is recorded net of foreign taxes withheld where recovery of such taxes is not assured.
Interest income is accrued daily and bond discounts are accreted and premiums are amortized daily. To the extent debt obligations are placed on non-accrual status, any related interest income may be reduced by writing off interest receivables when the collection of all or a portion of interest has been determined to be doubtful based on consistently applied procedures and the fair value has decreased. If the issuer subsequently resumes interest payments or when the collectability of interest is reasonably assured, the debt obligation is removed from non-accrual status.
Distributions to shareholders
Distributions to shareholders from net investment income and any net realized gains are recorded on the ex-dividend date and paid at least annually. Such distributions are determined in accordance with income tax regulations and may differ from U.S. generally accepted accounting principles. Dividend sources are estimated at the time of declaration. The tax character of distributions is determined as of each Fund’s fiscal year end. Therefore, a portion of each Fund’s distributions made prior to the Fund’s fiscal year end may be categorized as a tax return of capital at year end.
Federal and other taxes
Each Fund is treated as a separate entity for federal income tax purposes. Each Fund intends to continue to qualify as a regulated investment company by distributing substantially all of its investment company taxable income and any net realized capital gains (after reduction for capital loss carryforwards) sufficient to relieve it from all, or substantially all, federal income taxes. Accordingly, no provision for federal income taxes was required.
Each Fund’s income and federal excise tax returns and all financial records supporting those returns for the prior three fiscal years are subject to examination by the federal and Delaware revenue authorities. Management has analyzed each Fund’s tax positions taken on federal, state, and foreign tax returns for all open tax years and does not believe that there are any uncertain tax positions that require recognition of a tax liability.
Target Date Retirement Funds | 97
Notes to financial statements (unaudited)
As of August 31, 2020, the aggregate cost of all investments for federal income tax purposes and the unrealized gains (losses) were as follows:
| | | | | | | | | | | | | | | | |
| | | | |
| | | Tax cost | | | Gross
unrealized
gains | | | Gross
unrealized
losses | | | Net
unrealized
gains | |
| | | | |
Dynamic Target Today Fund | | $ | 6,580,916 | | | $ | 619,407 | | | $ | 0 | | | $ | 619,407 | |
| | | | |
Dynamic Target 2015 Fund | | | 5,397,648 | | | | 609,637 | | | | 0 | | | | 609,637 | |
| | | | |
Dynamic Target 2020 Fund | | | 6,460,567 | | | | 641,407 | | | | 0 | | | | 641,407 | |
| | | | |
Dynamic Target 2025 Fund | | | 9,390,656 | | | | 937,778 | | | | 0 | | | | 937,778 | |
| | | | |
Dynamic Target 2030 Fund | | | 8,581,525 | | | | 967,608 | | | | 0 | | | | 967,608 | |
| | | | |
Dynamic Target 2035 Fund | | | 8,042,989 | | | | 954,564 | | | | 0 | | | | 954,564 | |
| | | | |
Dynamic Target 2040 Fund | | | 7,710,801 | | | | 936,923 | | | | 0 | | | | 936,923 | |
| | | | |
Dynamic Target 2045 Fund | | | 6,147,437 | | | | 815,240 | | | | 0 | | | | 815,240 | |
| | | | |
Dynamic Target 2050 Fund | | | 5,324,521 | | | | 782,367 | | | | 0 | | | | 782,367 | |
| | | | |
Dynamic Target 2055 Fund | | | 5,516,689 | | | | 795,751 | | | | 0 | | | | 795,751 | |
| | | | |
Dynamic Target 2060 Fund | | | 5,073,955 | | | | 758,735 | | | | 0 | | | | 758,735 | |
As of February 29, 2020, capital loss carryforwards available to offset future net realized capital gains were as follows for the following Funds:
| | | | | | | | |
| | | No expiration | |
| | |
| | | Short-term | | | Long-term | |
| | |
Dynamic Target 2015 Fund | | $ | 12,393 | | | $ | 4,477 | |
| | |
Dynamic Target 2020 Fund | | | 26,761 | | | | 6,147 | |
| | |
Dynamic Target 2025 Fund | | | 67,479 | | | | 42,970 | |
| | |
Dynamic Target 2030 Fund | | | 81,442 | | | | 76,233 | |
| | |
Dynamic Target 2035 Fund | | | 91,331 | | | | 86,512 | |
| | |
Dynamic Target 2040 Fund | | | 103,861 | | | | 104,885 | |
| | |
Dynamic Target 2045 Fund | | | 121,634 | | | | 122,217 | |
| | |
Dynamic Target 2050 Fund | | | 131,673 | | | | 137,647 | |
| | |
Dynamic Target 2055 Fund | | | 130,423 | | | | 135,536 | |
| | |
Dynamic Target 2060 Fund | | | 133,023 | | | | 138,979 | |
Class allocations
The separate classes of shares offered by each Fund differ principally in applicable sales charges, distribution, shareholder servicing, and administration fees. Class specific expenses are charged directly to that share class. Investment income, common fund-level expenses, and realized and unrealized gains (losses) on investments are allocated daily to each class of shares based on the relative proportion of net assets of each class.
3. FAIR VALUATION MEASUREMENTS
Fair value measurements of investments are determined within a framework that has established a fair value hierarchy based upon the various data inputs utilized in determining the value of each Fund’s investments. The three-level hierarchy gives the highest priority to unadjusted quoted prices in active markets for identical assets or liabilities (Level 1) and the lowest priority to unobservable inputs (Level 3). Each Fund’s investments are classified within the fair value hierarchy based on the lowest level of input that is significant to the fair value measurement. The inputs are summarized into three broad levels as follows:
98 | Target Date Retirement Funds
Notes to financial statements (unaudited)
| ∎ | | Level 1 – quoted prices in active markets for identical securities |
| ∎ | | Level 2 – other significant observable inputs (including quoted prices for similar securities, interest rates, prepayment speeds, credit risk, etc.) |
| ∎ | | Level 3 – significant unobservable inputs (including the Fund’s own assumptions in determining the fair value of investments) |
The inputs or methodologies used for valuing investments in securities are not necessarily an indication of the risk associated with investing in those securities.
The following is a summary of the inputs used in valuing each Fund’s assets and liabilities as of August 31, 2020:
| | | | | | | | | | | | | | | | |
| | | | |
| Dynamic Target Today Fund | | Quoted prices
(Level 1) | | | Other significant
observable inputs
(Level 2) | | | Significant
unobservable inputs (Level 3) | | | Total | |
| | | | |
Assets | | | | | | | | | | | | | | | | |
Investments measured at net asset value* | | | | | | | | | | | | | | $ | 7,179,024 | |
| | | | |
Futures contracts | | $ | 21,299 | | | $ | 0 | | | $ | 0 | | | | 21,299 | |
| | | | |
Total assets | | $ | 21,299 | | | $ | 0 | | | $ | 0 | | | $ | 7,200,323 | |
| * | Investments that are measured at fair value using the net asset value per share (or its equivalent) as a practical expedient have not been categorized in the fair value hierarchy. The fair value amount presented in the table is intended to permit reconciliation of the fair value hierarchy to the amounts presented in the Statements of Assets and Liabilities. The Fund’s investments in the affiliated Master Portfolios are valued at $7,179,024. Each affiliated Master Portfolio does not have a redemption period notice, can be redeemed daily and does not have any unfunded commitments. |
| | | | | | | | | | | | | | | | |
| | | | |
| Dynamic Target 2015 Fund | | Quoted prices
(Level 1) | | | Other significant
observable inputs
(Level 2) | | | Significant
unobservable inputs (Level 3) | | | Total | |
| | | | |
Assets | | | | | | | | | | | | | | | | |
Investments measured at net asset value* | | | | | | | | | | | | | | $ | 5,985,986 | |
| | | | |
Futures contracts | | $ | 21,299 | | | $ | 0 | | | $ | 0 | | | | 21,299 | |
| | | | |
Total assets | | $ | 21,299 | | | $ | 0 | | | $ | 0 | | | $ | 6,007,285 | |
| * | Investments that are measured at fair value using the net asset value per share (or its equivalent) as a practical expedient have not been categorized in the fair value hierarchy. The fair value amount presented in the table is intended to permit reconciliation of the fair value hierarchy to the amounts presented in the Statements of Assets and Liabilities. The Fund’s investments in the affiliated Master Portfolios are valued at $5,985,986. Each affiliated Master Portfolio does not have a redemption period notice, can be redeemed daily and does not have any unfunded commitments. |
| | | | | | | | | | | | | | | | |
| | | | |
| Dynamic Target 2020 Fund | | Quoted prices
(Level 1) | | | Other significant
observable inputs
(Level 2) | | | Significant
unobservable inputs (Level 3) | | | Total | |
| | | | |
Assets | | | | | | | | | | | | | | | | |
Investments measured at net asset value* | | | | | | | | | | | | | | $ | 7,080,675 | |
| | | | |
Futures contracts | | $ | 21,299 | | | $ | 0 | | | $ | 0 | | | | 21,299 | |
| | | | |
Total assets | | $ | 21,299 | | | $ | 0 | | | $ | 0 | | | $ | 7,101,974 | |
| * | Investments that are measured at fair value using the net asset value per share (or its equivalent) as a practical expedient have not been categorized in the fair value hierarchy. The fair value amount presented in the table is intended to permit reconciliation of the fair value hierarchy to the amounts presented in the Statements of Assets and Liabilities. The Fund’s investments in the affiliated Master Portfolios are valued at $7,080,675. Each affiliated Master Portfolio does not have a redemption period notice, can be redeemed daily and does not have any unfunded commitments. |
| | | | | | | | | | | | | | | | |
| | | | |
| Dynamic Target 2025 Fund | | Quoted prices
(Level 1) | | | Other significant
observable inputs
(Level 2) | | | Significant
unobservable inputs (Level 3) | | | Total | |
| | | | |
Assets | | | | | | | | | | | | | | | | |
Investments measured at net asset value* | | | | | | | | | | | | | | $ | 10,307,135 | |
| | | | |
Futures contracts | | $ | 21,299 | | | $ | 0 | | | $ | 0 | | | | 21,299 | |
| | | | |
Total assets | | $ | 21,299 | | | $ | 0 | | | $ | 0 | | | $ | 10,328,434 | |
| * | Investments that are measured at fair value using the net asset value per share (or its equivalent) as a practical expedient have not been categorized in the fair value hierarchy. The fair value amount presented in the table is intended to permit reconciliation of the fair value |
Target Date Retirement Funds | 99
Notes to financial statements (unaudited)
| | hierarchy to the amounts presented in the Statements of Assets and Liabilities. The Fund’s investments in the affiliated Master Portfolios are valued at $10,307,135. Each affiliated Master Portfolio does not have a redemption period notice, can be redeemed daily and does not have any unfunded commitments. |
| | | | | | | | | | | | | | | | |
| | | | |
| Dynamic Target 2030 Fund | | Quoted prices
(Level 1) | | | Other significant
observable inputs
(Level 2) | | | Significant
unobservable inputs (Level 3) | | | Total | |
| | | | |
Assets | | | | | | | | | | | | | | | | |
Investments measured at net asset value* | | | | | | | | | | | | | | $ | 9,527,834 | |
| | | | |
Futures contracts | | $ | 21,299 | | | $ | 0 | | | $ | 0 | | | | 21,299 | |
| | | | |
Total assets | | $ | 21,299 | | | $ | 0 | | | $ | 0 | | | $ | 9,549,133 | |
| * | Investments that are measured at fair value using the net asset value per share (or its equivalent) as a practical expedient have not been categorized in the fair value hierarchy. The fair value amount presented in the table is intended to permit reconciliation of the fair value hierarchy to the amounts presented in the Statements of Assets and Liabilities. The Fund’s investments in the affiliated Master Portfolios are valued at $9,527,834. Each affiliated Master Portfolio does not have a redemption period notice, can be redeemed daily and does not have any unfunded commitments. |
| | | | | | | | | | | | | | | | |
| | | | |
| Dynamic Target 2035 Fund | | Quoted prices
(Level 1) | | | Other significant
observable inputs
(Level 2) | | | Significant
unobservable inputs (Level 3) | | | Total | |
| | | | |
Assets | | | | | | | | | | | | | | | | |
Investments measured at net asset value* | | | | | | | | | | | | | | $ | 8,976,254 | |
| | | | |
Futures contracts | | $ | 21,299 | | | $ | 0 | | | $ | 0 | | | | 21,299 | |
| | | | |
Total assets | | $ | 21,299 | | | $ | 0 | | | $ | 0 | | | $ | 8,997,553 | |
| * | Investments that are measured at fair value using the net asset value per share (or its equivalent) as a practical expedient have not been categorized in the fair value hierarchy. The fair value amount presented in the table is intended to permit reconciliation of the fair value hierarchy to the amounts presented in the Statements of Assets and Liabilities. The Fund’s investments in the affiliated Master Portfolios are valued at $8,976,254. Each affiliated Master Portfolio does not have a redemption period notice, can be redeemed daily and does not have any unfunded commitments. |
| | | | | | | | | | | | | | | | |
| | | | |
| Dynamic Target 2040 Fund | | Quoted prices
(Level 1) | | | Other significant
observable inputs
(Level 2) | | | Significant
unobservable inputs (Level 3) | | | Total | |
| | | | |
Assets | | | | | | | | | | | | | | | | |
Investments measured at net asset value* | | | | | | | | | | | | | | $ | 8,626,425 | |
| | | | |
Futures contracts | | $ | 21,299 | | | $ | 0 | | | $ | 0 | | | | 21,299 | |
| | | | |
Total assets | | $ | 21,299 | | | $ | 0 | | | $ | 0 | | | $ | 8,647,724 | |
| * | Investments that are measured at fair value using the net asset value per share (or its equivalent) as a practical expedient have not been categorized in the fair value hierarchy. The fair value amount presented in the table is intended to permit reconciliation of the fair value hierarchy to the amounts presented in the Statements of Assets and Liabilities. The Fund’s investments in the affiliated Master Portfolios are valued at $8,626,425. Each affiliated Master Portfolio does not have a redemption period notice, can be redeemed daily and does not have any unfunded commitments. |
| | | | | | | | | | | | | | | | |
| | | | |
| Dynamic Target 2045 Fund | | Quoted prices
(Level 1) | | | Other significant
observable inputs
(Level 2) | | | Significant
unobservable inputs (Level 3) | | | Total | |
| | | | |
Assets | | | | | | | | | | | | | | | | |
Investments measured at net asset value* | | | | | | | | | | | | | | $ | 6,941,378 | |
| | | | |
Futures contracts | | $ | 21,299 | | | $ | 0 | | | $ | 0 | | | | 21,299 | |
| | | | |
Total assets | | $ | 21,299 | | | $ | 0 | | | $ | 0 | | | $ | 6,962,677 | |
| * | Investments that are measured at fair value using the net asset value per share (or its equivalent) as a practical expedient have not been categorized in the fair value hierarchy. The fair value amount presented in the table is intended to permit reconciliation of the fair value hierarchy to the amounts presented in the Statements of Assets and Liabilities. The Fund’s investments in the affiliated Master Portfolios are valued at $6,941,378. Each affiliated Master Portfolio does not have a redemption period notice, can be redeemed daily and does not have any unfunded commitments. |
100 | Target Date Retirement Funds
Notes to financial statements (unaudited)
| | | | | | | | | | | | | | | | |
| | | | |
| Dynamic Target 2050 Fund | | Quoted prices
(Level 1) | | | Other significant
observable inputs
(Level 2) | | | Significant
unobservable inputs (Level 3) | | | Total | |
| | | | |
Assets | | | | | | | | | | | | | | | | |
Investments measured at net asset value* | | | | | | | | | | | | | | $ | 6,085,589 | |
| | | | |
Futures contracts | | $ | 21,299 | | | $ | 0 | | | $ | 0 | | | | 21,299 | |
| | | | |
Total assets | | $ | 21,299 | | | $ | 0 | | | $ | 0 | | | $ | 6,106,888 | |
| * | Investments that are measured at fair value using the net asset value per share (or its equivalent) as a practical expedient have not been categorized in the fair value hierarchy. The fair value amount presented in the table is intended to permit reconciliation of the fair value hierarchy to the amounts presented in the Statements of Assets and Liabilities. The Fund’s investments in the affiliated Master Portfolios are valued at $6,085,589. Each affiliated Master Portfolio does not have a redemption period notice, can be redeemed daily and does not have any unfunded commitments. |
| | | | | | | | | | | | | | | | |
| | | | |
| Dynamic Target 2055 Fund | | Quoted prices
(Level 1) | | | Other significant
observable inputs
(Level 2) | | | Significant
unobservable inputs (Level 3) | | | Total | |
| | | | |
Assets | | | | | | | | | | | | | | | | |
Investments measured at net asset value* | | | | | | | | | | | | | | $ | 6,291,141 | |
| | | | |
Futures contracts | | $ | 21,299 | | | $ | 0 | | | $ | 0 | | | | 21,299 | |
| | | | |
Total assets | | $ | 21,299 | | | $ | 0 | | | $ | 0 | | | $ | 6,312,440 | |
| * | Investments that are measured at fair value using the net asset value per share (or its equivalent) as a practical expedient have not been categorized in the fair value hierarchy. The fair value amount presented in the table is intended to permit reconciliation of the fair value hierarchy to the amounts presented in the Statements of Assets and Liabilities. The Fund’s investments in the affiliated Master Portfolios are valued at $6,291,141. Each affiliated Master Portfolio does not have a redemption period notice, can be redeemed daily and does not have any unfunded commitments. |
| | | | | | | | | | | | | | | | |
| | | | |
| Dynamic Target 2060 Fund | | Quoted prices
(Level 1) | | | Other significant
observable inputs
(Level 2) | | | Significant
unobservable inputs (Level 3) | | | Total | |
| | | | |
Assets | | | | | | | | | | | | | | | | |
Investments measured at net asset value* | | | | | | | | | | | | | | $ | 5,811,391 | |
| | | | |
Futures contracts | | $ | 21,299 | | | $ | 0 | | | $ | 0 | | | | 21,299 | |
| | | | |
Total assets | | $ | 21,299 | | | $ | 0 | | | $ | 0 | | | $ | 5,832,690 | |
| * | Investments that are measured at fair value using the net asset value per share (or its equivalent) as a practical expedient have not been categorized in the fair value hierarchy. The fair value amount presented in the table is intended to permit reconciliation of the fair value hierarchy to the amounts presented in the Statements of Assets and Liabilities. The Fund’s investments in the affiliated Master Portfolios are valued at $5,811,391. Each affiliated Master Portfolio does not have a redemption period notice, can be redeemed daily and does not have any unfunded commitments. |
Futures contracts are reported at their cumulative unrealized gains (losses) at measurement date as reported in the table following each Portfolio of Investments. For futures contracts, the current day’s variation margin is reported on the Statements of Assets and Liabilities. All other assets and liabilities are reported at their market value at measurement date.
For the six months ended August 31, 2020, the Funds did not have any transfers into/out of Level 3.
Target Date Retirement Funds | 101
Notes to financial statements (unaudited)
The investment objective of each affiliated Master Portfolio is as follows:
| | |
| |
| Affiliated Master Portfolio | | Investment objective |
| |
Wells Fargo Bloomberg Barclays US Aggregate ex-Corporate Portfolio | | Seeks to replicate the total return of the Bloomberg Barclays U.S. Aggregate ex-Corporate Index, before fees and expenses |
| |
Wells Fargo Emerging Markets Bond Portfolio | | Seeks to replicate the total return of the JP Morgan EMBI Global Diversified Index, before fees and expenses |
| |
Wells Fargo Factor Enhanced Emerging Markets Equity Portfolio | | Seeks long-term capital appreciation |
| |
Wells Fargo Factor Enhanced International Equity Portfolio | | Seeks long-term capital appreciation |
| |
Wells Fargo Factor Enhanced U.S. Large Cap Equity Portfolio | | Seeks long-term capital appreciation |
| |
Wells Fargo Factor Enhanced U.S. Small Cap Equity Portfolio | | Seeks long-term capital appreciation |
| |
Wells Fargo High Yield Corporate Bond Portfolio | | Seeks to replicate the total return of the Wells Fargo U.S. High Yield Bond Index, before fees and expenses |
| |
Wells Fargo Investment Grade Corporate Bond Portfolio | | Seeks to replicate the total return of the Wells Fargo U.S. Investment Grade Corporate Bond Index, before fees and expenses |
| |
Wells Fargo Strategic Retirement Bond Portfolio | | Seeks to replicate the total return of a blended index that is weighted 50% to the Bloomberg Barclays U.S. Treasury Inflation Notes: 1-10 Year Index and 50% to the Bloomberg Barclays U.S. Government Intermediate Bond Index, before fees and expenses |
| |
Wells Fargo U.S. REIT Portfolio | | Seeks to replicate the total return of the Wells Fargo U.S. REIT Index, before fees and expenses |
4. TRANSACTIONS WITH AFFILIATES
Management fee
Funds Management, an indirect wholly owned subsidiary of Wells Fargo & Company (“Wells Fargo”), is the manager of each Fund and provides advisory and fund-level administrative services under an investment management agreement. Under the investment management agreement, Funds Management is responsible for, among other services, implementing the investment objectives and strategies of each Fund, supervising the subadviser and providing fund-level administrative services in connection with each Fund’s operations. As compensation for its services under the investment management agreement, Funds Management is entitled to receive a management fee at the following annual rate based on each Fund’s average daily net assets:
| | | | |
| |
| Average daily net assets | | Management fee | |
| |
First $5 billion | | | 0.15 | % |
| |
Next $5 billion | | | 0.14 | |
| |
Over $10 billion | | | 0.13 | |
For the six months ended August 31, 2020, the management fee was equivalent to an annual rate of 0.15% of each Fund’s average daily net assets.
Funds Management has retained the services of a subadviser to provide daily portfolio management to the Funds. The fee for subadvisory services is borne by Funds Management. Wells Capital Management Incorporated, an affiliate of Funds Management and an indirect wholly owned subsidiary of Wells Fargo, is the subadviser to each Fund and is entitled to receive a fee from Funds Management at an annual rate starting at 0.10% and declining to 0.06% as the average daily net assets of each Fund increase.
Funds Management also serves as the adviser to each affiliated Master Portfolio and is entitled to receive a fee from each affiliated Master Portfolio for those services.
102 | Target Date Retirement Funds
Notes to financial statements (unaudited)
Administration fees
Under a class-level administration agreement, Funds Management provides class-level administrative services to each Fund, which includes paying fees and expenses for services provided by the transfer agent, sub-transfer agents, omnibus account servicers and record-keepers. As compensation for its services under the class-level administration agreement, Funds Management receives an annual fee which is calculated based on the average daily net assets of each class as follows:
| | | | |
| |
| | | Class-level
administration fee | |
| |
Class A, Class C | | | 0.21 | % |
| |
Class R4 | | | 0.08 | |
| |
Class R6 | | | 0.03 | |
Waivers and/or expense reimbursements
Funds Management has contractually waived and/or reimbursed management and administration fees to the extent necessary to maintain certain net operating expense ratios for each Fund. When each class of a Fund has exceeded its expense cap, Funds Management has waived fees and/or reimbursed expenses from fund-level expenses on a proportionate basis and then from class specific expenses. When only certain classes exceed their expense caps, waivers and/or reimbursements are applied against class specific expenses before fund-level expenses. Net expenses from the affiliated Master Portfolios are included in the expense caps. Funds Management has committed through June 30, 2021 to waive fees and/or reimburse expenses to the extent necessary to cap each Fund’s expenses at 0.68% for Class A shares, 1.43% for Class C shares, 0.37% for Class R4 shares, and 0.22% for Class R6 shares. Prior to or after the commitment expiration date, the cap may be increased or the commitment to maintain the cap may be terminated only with the approval of the Board of Trustees.
Distribution fee
The Trust has adopted a Distribution Plan for Class C shares of each Fund pursuant to Rule 12b-1 under the 1940 Act. A distribution fee is charged to the Class C shares and paid to Wells Fargo Funds Distributor, LLC (“Funds Distributor”), the principal underwriter of each Fund, at an annual rate of 0.75% of the average daily net assets of Class C shares.
In addition, Funds Distributor is entitled to receive the front-end sales charge from the purchase of Class A shares and a contingent deferred sales charge on the redemption of certain Class A shares. Funds Distributor is also entitled to receive the contingent deferred sales charges from redemptions of Class C shares. For the six months ended August 31, 2020, Funds Distributor received front-end sales charges from the Funds as follows:
| | | | |
| | | Front-end sales charges | |
| |
| | | Class A | |
| |
Dynamic Target 2020 Fund | | $ | 5 | |
| |
Dynamic Target 2025 Fund | | | 3 | |
| |
Dynamic Target 2030 Fund | | | 1 | |
| |
Dynamic Target 2035 Fund | | | 31 | |
| |
Dynamic Target 2040 Fund | | | 9 | |
| |
Dynamic Target 2050 Fund | | | 13 | |
| |
Dynamic Target 2055 Fund | | | 5 | |
| |
Dynamic Target 2060 Fund | | | 48 | |
No contingent deferred sales charges were incurred by Class A shares and Class C shares for the six months ended August 31, 2020.
Shareholder servicing fees
The Trust has entered into contracts with one or more shareholder servicing agents, whereby Class A and Class C of each Fund are charged a fee at an annual rate of 0.25% of the average daily net assets of each respective class. Class R4 is charged a fee at an annual rate of 0.10% of its average daily net assets. A portion of these total shareholder servicing fees were paid to affiliates of Wells Fargo.
Target Date Retirement Funds | 103
Notes to financial statements (unaudited)
Other transactions
On August 14, 2020, Class C of each Fund received a payment from Funds Management in connection with resolving certain fee reimbursements.
| | | | |
| |
| | | Reimbursement
amount | |
| |
Dynamic Target Today Fund | | $ | 1,648 | |
| |
Dynamic Target 2015 Fund | | | 1,699 | |
| |
Dynamic Target 2020 Fund | | | 1,768 | |
| |
Dynamic Target 2025 Fund | | | 1,794 | |
| |
Dynamic Target 2030 Fund | | | 1,378 | |
| |
Dynamic Target 2035 Fund | | | 1,801 | |
| |
Dynamic Target 2040 Fund | | | 1,690 | |
| |
Dynamic Target 2045 Fund | | | 1,821 | |
| |
Dynamic Target 2050 Fund | | | 1,735 | |
| |
Dynamic Target 2055 Fund | | | 1,693 | |
| |
Dynamic Target 2060 Fund | | | 1,632 | |
5. INVESTMENT PORTFOLIO TRANSACTIONS
The Funds seek to achieve their investment objectives by investing substantially all of their investable assets in affiliated Master Portfolios. Purchases and sales related to these investments have been calculated by aggregating the results of multiplying each Fund’s ownership percentage in the respective affiliated Master Portfolio by the corresponding affiliated Master Portfolio’s purchases and sales. Purchases and sales of investments, excluding short-term securities, for the six months ended August 31, 2020 were as follows:
| | | | | | | | | | | | | | | | |
| | | Purchases at cost | | | Sales proceeds | |
| | | | |
| | | U.S.
government | | | Non-U.S.
government | | | U.S.
government | | | Non-U.S.
government | |
| | | | |
Dynamic Target Today Fund | | $ | 989,321 | | | $ | 1,869,404 | | | $ | 1,329,720 | | | $ | 2,149,334 | |
| | | | |
Dynamic Target 2015 Fund | | | 696,097 | | | | 1,753,297 | | | | 934,494 | | | | 1,995,735 | |
| | | | |
Dynamic Target 2020 Fund | | | 690,104 | | | | 2,309,122 | | | | 920,638 | | | | 2,616,089 | |
| | | | |
Dynamic Target 2025 Fund | | | 794,702 | | | | 3,870,147 | | | | 1,022,922 | | | | 4,370,481 | |
| | | | |
Dynamic Target 2030 Fund | | | 517,925 | | | | 3,825,066 | | | | 645,501 | | | | 4,289,532 | |
| | | | |
Dynamic Target 2035 Fund | | | 394,905 | | | | 3,860,632 | | | | 484,986 | | | | 4,320,184 | |
| | | | |
Dynamic Target 2040 Fund | | | 271,327 | | | | 3,850,406 | | | | 333,219 | | | | 4,263,762 | |
| | | | |
Dynamic Target 2045 Fund | | | 143,557 | | | | 3,272,453 | | | | 176,303 | | | | 3,638,191 | |
| | | | |
Dynamic Target 2050 Fund | | | 69,805 | | | | 2,967,353 | | | | 85,728 | | | | 3,293,618 | |
| | | | |
Dynamic Target 2055 Fund | | | 72,272 | | | | 3,061,109 | | | | 88,758 | | | | 3,397,844 | |
| | | | |
Dynamic Target 2060 Fund | | | 66,845 | | | | 2,838,347 | | | | 82,093 | | | | 3,150,445 | |
6. DERIVATIVE TRANSACTIONS
During the six months ended August 31, 2020, the Funds entered into futures contracts to gain market exposure to certain asset classes consistent with an active asset allocation strategy.
104 | Target Date Retirement Funds
Notes to financial statements (unaudited)
During the six months ended August 31, 2020, the Funds had average notional amounts in futures contracts outstanding as follows:
| | | | | | | | |
| | | Average notional balance | |
| | |
| | | Long futures | | | Short futures | |
| | |
Dynamic Target Today Fund | | $ | 52,454 | | | $ | 389,773 | |
| | |
Dynamic Target 2015 Fund | | | 220,913 | | | | 538,804 | |
| | |
Dynamic Target 2020 Fund | | | 272,095 | | | | 675,837 | |
| | |
Dynamic Target 2025 Fund | | | 528,911 | | | | 1,178,847 | |
| | |
Dynamic Target 2030 Fund | | | 514,102 | | | | 1,081,288 | |
| | |
Dynamic Target 2035 Fund | | | 514,102 | | | | 1,105,784 | |
| | |
Dynamic Target 2040 Fund | | | 428,115 | | | | 1,096,480 | |
| | |
Dynamic Target 2045 Fund | | | 376,811 | | | | 844,017 | |
| | |
Dynamic Target 2050 Fund | | | 341,136 | | | | 769,962 | |
| | |
Dynamic Target 2055 Fund | | | 348,108 | | | | 779,525 | |
| | |
Dynamic Target 2060 Fund | | | 337,529 | | | | 745,799 | |
The cumulative unrealized gains (losses) reported in the table following each Portfolio of Investments represents the fair value of futures contracts at the end of the period. Only the current day’s variation margin as of August 31, 2020 is reported separately on the Statements of Assets and Liabilities.
The effect of derivative instruments on the Statements of Operations for the six months ended August 31, 2020 were as follows for the Funds:
| | | | | | | | | | | | | | | | |
| | | Amount of realized gains
(losses) on derivatives | | | Change in unrealized gains
(losses) on derivatives | |
| | | Equity
contracts | | | Foreign currency
contracts | | | Total | | | Equity contracts | |
| | | | |
Dynamic Target Today Fund | | $ | 125,656 | | | $ | (35,941 | ) | | $ | 89,715 | | | $ | (5,559 | ) |
| | | | |
Dynamic Target 2015 Fund | | | 82,849 | | | | (25,104 | ) | | | 57,745 | | | | (5,559 | ) |
| | | | |
Dynamic Target 2020 Fund | | | 127,855 | | | | (31,145 | ) | | | 96,710 | | | | (7,667 | ) |
| | | | |
Dynamic Target 2025 Fund | | | 295,199 | | | | (46,095 | ) | | | 249,104 | | | | (27,621 | ) |
| | | | |
Dynamic Target 2030 Fund | | | 269,602 | | | | (35,941 | ) | | | 233,661 | | | | (23,122 | ) |
| | | | |
Dynamic Target 2035 Fund | | | 296,952 | | | | (35,941 | ) | | | 261,011 | | | | (21,067 | ) |
| | | | |
Dynamic Target 2040 Fund | | | 210,547 | | | | (35,941 | ) | | | 174,606 | | | | (23,122 | ) |
| | | | |
Dynamic Target 2045 Fund | | | 212,588 | | | | (31,145 | ) | | | 181,443 | | | | (5,464 | ) |
| | | | |
Dynamic Target 2050 Fund | | | 165,584 | | | | (25,104 | ) | | | 140,480 | | | | 7,173 | |
| | | | |
Dynamic Target 2055 Fund | | | 189,766 | | | | (25,104 | ) | | | 164,662 | | | | 7,173 | |
| | | | |
Dynamic Target 2060 Fund | | | 159,994 | | | | (25,104 | ) | | | 134,890 | | | | 7,173 | |
7. BANK BORROWINGS
The Trust (excluding the money market funds), Wells Fargo Master Trust and Wells Fargo Variable Trust are parties to a $350,000,000 revolving credit agreement whereby the Fund is permitted to use bank borrowings for temporary or emergency purposes, such as to fund shareholder redemption requests. Interest under the credit agreement is charged to the Fund based on a borrowing rate equal to the higher of the Federal Funds rate in effect on that day plus 1.25% or the overnight LIBOR rate in effect on that day plus 1.25%. In addition, an annual commitment fee equal to 0.25% of the unused balance is allocated to each participating fund.
For the six months ended August 31, 2020, there were no borrowings by the Funds under the agreement.
Target Date Retirement Funds | 105
Notes to financial statements (unaudited)
8. CONCENTRATION RISK
As of August 31, 2020, the Funds were primarily owned by Wells Fargo. Investment by and/or voting activities of Wells Fargo with respect to its holdings in each Fund could have a material impact on the Fund. At August 31, 2020, Wells Fargo’s ownership of each Fund was as follows:
| | | | |
| |
| | | % of ownership | |
| |
Dynamic Target Today Fund | | | 79.44 | % |
| |
Dynamic Target 2015 Fund | | | 93.83 | |
| |
Dynamic Target 2020 Fund | | | 79.43 | |
| |
Dynamic Target 2025 Fund | | | 55.26 | |
| |
Dynamic Target 2030 Fund | | | 59.27 | |
| |
Dynamic Target 2035 Fund | | | 64.06 | |
| |
Dynamic Target 2040 Fund | | | 63.91 | |
| |
Dynamic Target 2045 Fund | | | 81.05 | |
| |
Dynamic Target 2050 Fund | | | 91.44 | |
| |
Dynamic Target 2055 Fund | | | 88.71 | |
| |
Dynamic Target 2060 Fund | | | 96.39 | |
9. INDEMNIFICATION
Under the Funds’ organizational documents, the officers and Trustees have been granted certain indemnification rights against certain liabilities that may arise out of performance of their duties to each Fund. Each Fund has entered into a separate agreement with each Trustee that converts indemnification rights currently existing under the Fund’s organizational documents into contractual rights that cannot be changed in the future without the consent of the Trustee. Additionally, in the normal course of business, each Fund may enter into contracts with service providers that contain a variety of indemnification clauses. Each Fund’s maximum exposure under these arrangements is dependent on future claims that may be made against the Fund and, therefore, cannot be estimated.
10. NEW ACCOUNTING PRONOUNCEMENT
In August 2018, FASB issued Accounting Standards Update (“ASU”) No. 2018-13, Fair Value Measurement (Topic 820) Disclosure Framework—Changes to the Disclosure Requirements for Fair Value Measurement. ASU 2018-13 updates the disclosure requirements on fair value measurements in Topic 820, Fair Value Measurements. The amendments are effective for fiscal years, and interim periods within those fiscal years, beginning after December 15, 2019. Management has adopted this guidance which did not have a material impact on the financial statements.
11. CORONAVIRUS (COVID-19) PANDEMIC
On March 11, 2020, the World Health Organization announced that it had made the assessment that coronavirus disease 2019 (“COVID-19”) is a pandemic. The impacts of COVID-19 are adversely affecting the entire global economy, individual companies and investment products, and the market in general. There is significant uncertainty around the extent and duration of business disruptions related to COVID-19 and the impacts may be short term or may last for an extended period of time. The risk of further spreading of COVID-19 has led to significant uncertainty and volatility in the financial markets.
106 | Target Date Retirement Funds
Other information (unaudited)
PROXY VOTING INFORMATION
A description of the policies and procedures used to determine how to vote proxies relating to portfolio securities is available without charge, upon request, by calling 1-800-222-8222, visiting our website at wfam.com, or visiting the SEC website at sec.gov. Information regarding how the proxies related to portfolio securities were voted during the most recent 12-month period ended June 30 is available on the website at wfam.com or by visiting the SEC website at sec.gov.
QUARTERLY PORTFOLIO HOLDINGS INFORMATION
The Funds file their complete schedule of portfolio holdings with the SEC for the first and third quarters of each fiscal year as an exhibit to their reports on Form N-PORT. Shareholders may view the filed Form N-PORT by visiting the SEC website at sec.gov.
Target Date Retirement Funds | 107
Other information (unaudited)
BOARD OF TRUSTEES AND OFFICERS
Each of the Trustees and Officers1 listed in the table below acts in identical capacities for each fund in the Wells Fargo family of funds, which consists of 142 mutual funds comprising the Wells Fargo Funds Trust, Wells Fargo Variable Trust, Wells Fargo Master Trust and four closed-end funds (collectively the “Fund Complex”). This table should be read in conjunction with the Prospectus and the Statement of Additional Information2. The mailing address of each Trustee and Officer is 525 Market Street, 12th Floor, San Francisco, CA 94105. Each Trustee and Officer serves an indefinite term, however, each Trustee serves such term until reaching the mandatory retirement age established by the Trustees.
Independent Trustees
| | | | | | |
Name and year of birth | | Position held and
length of service* | | Principal occupations during past five years or longer | | Current other
public company or
investment
company
directorships |
| | | |
| William R. Ebsworth (Born 1957) | | Trustee,
since 2015 | | Retired. From 1984 to 2013, equities analyst, portfolio manager, research director and chief investment officer at Fidelity Management and Research Company in Boston, Tokyo, and Hong Kong, and retired in 2013 as Chief Investment Officer of Fidelity Strategic Advisers, Inc. where he led a team of investment professionals managing client assets. Prior thereto, Board member of Hong Kong Securities Clearing Co., Hong Kong Options Clearing Corp., the Thailand International Fund, Ltd., Fidelity Investments Life Insurance Company, and Empire Fidelity Investments Life Insurance Company. Audit Committee Chair and Investment Committee Chair of the Vincent Memorial Hospital Endowment (non-profit organization). Mr. Ebsworth is a CFA® charterholder. | | N/A |
| | | |
| Jane A. Freeman (Born 1953) | | Trustee,
since 2015;
Chair Liaison,
since 2018 | | Retired. From 2012 to 2014 and 1999 to 2008, Chief Financial Officer of Scientific Learning Corporation. From 2008 to 2012, Ms. Freeman provided consulting services related to strategic business projects. Prior to 1999, Portfolio Manager at Rockefeller & Co. and Scudder, Stevens & Clark. Board member of the Harding Loevner Funds from 1996 to 2014, serving as both Lead Independent Director and chair of the Audit Committee. Board member of the Russell Exchange Traded Funds Trust from 2011 to 2012 and the chair of the Audit Committee. Ms. Freeman is also an inactive Chartered Financial Analyst. | | N/A |
| | | |
| Isaiah Harris, Jr. (Born 1952) | | Trustee,
since 2009;
Audit Committee Chairman,
since 2019 | | Retired. Chairman of the Board of CIGNA Corporation since 2009, and Director since 2005. From 2003 to 2011, Director of Deluxe Corporation. Prior thereto, President and CEO of BellSouth Advertising and Publishing Corp. from 2005 to 2007, President and CEO of BellSouth Enterprises from 2004 to 2005 and President of BellSouth Consumer Services from 2000 to 2003. Emeritus member of the Iowa State University Foundation Board of Governors. Emeritus Member of the Advisory Board of Iowa State University School of Business. Advisory Board Member, Palm Harbor Academy (private school). Mr. Harris is a certified public accountant (inactive status). | | CIGNA Corporation |
| | | |
| Judith M. Johnson (Born 1949) | | Trustee,
since 2008 | | Retired. Prior thereto, Chief Executive Officer and Chief Investment Officer of Minneapolis Employees Retirement Fund from 1996 to 2008. Ms. Johnson is an attorney, certified public accountant and a certified managerial accountant. | | N/A |
108 | Target Date Retirement Funds
Other information (unaudited)
| | | | | | |
Name and year of birth | | Position held and
length of service* | | Principal occupations during past five years or longer | | Current other
public company or
investment
company
directorships |
| | | |
| David F. Larcker (Born 1950) | | Trustee,
since 2009 | | James Irvin Miller Professor of Accounting at the Graduate School of Business (Emeritus), Stanford University, Director of the Corporate Governance Research Initiative and Senior Faculty of The Rock Center for Corporate Governance since 2006. From 2005 to 2008, Professor of Accounting at the Graduate School of Business, Stanford University. Prior thereto, Ernst & Young Professor of Accounting at The Wharton School, University of Pennsylvania from 1985 to 2005. | | N/A |
| | | |
| Olivia S. Mitchell (Born 1953) | | Trustee,
since 2006; Nominating and Governance Committee Chair, since 2018 | | International Foundation of Employee Benefit Plans Professor, Wharton School of the University of Pennsylvania since 1993. Director of Wharton’s Pension Research Council and Boettner Center on Pensions & Retirement Research, and Research Associate at the National Bureau of Economic Research. Previously, Cornell University Professor from 1978 to 1993. | | N/A |
| | | |
| Timothy J. Penny (Born 1951) | | Trustee,
since 1996; Chairman,
since 2018 | | President and Chief Executive Officer of Southern Minnesota Initiative Foundation, a non-profit organization, since 2007. Member of the Board of Trustees of NorthStar Education Finance, Inc., a non-profit organization,
since 2007. | | N/A |
| | | |
| James G. Polisson (Born 1959) | | Trustee,
since 2018 | | Retired. Chief Marketing Officer, Source (ETF) UK Services, Ltd, from 2015 to 2017. From 2012 to 2015, Principal of The Polisson Group, LLC, a management consulting, corporate advisory and principal investing company. Chief Executive Officer and Managing Director at Russell Investments, Global Exchange Traded Funds from 2010 to 2012. Managing Director of Barclays Global Investors from 1998 to 2010 and Global Chief Marketing Officer for iShares and Barclays Global Investors from 2000 to 2010. Trustee of the San Francisco Mechanics’ Institute, a non-profit organization, from 2013 to 2015. Board member of the Russell Exchange Traded Fund Trust from 2011 to 2012. Director of Barclays Global Investors Holdings Deutschland GmbH from 2006 to 2009. Mr. Polisson is an attorney and has a retired status with the Massachusetts and District of Columbia Bar Associations. | | N/A |
| | | |
| Pamela Wheelock (Born 1959) | | Trustee,
since January 2020; previously Trustee from January 2018 to July 2019 | | Board member of the Destination Medical Center Economic Development Agency, Rochester, Minnesota since 2019. Interim President of the McKnight Foundation from January to September 2020. Acting Commissioner, Minnesota Department of Human Services, July 2019 through September 2019. Human Services Manager (part-time), Minnesota Department of Human Services, October 2019 through December 2019. Chief Operating Officer, Twin Cities Habitat for Humanity from 2017 to 2019. Vice President of University Services, University of Minnesota from 2012 to 2016. Prior thereto, on the Board of Directors, Governance Committee and Finance Committee for the Minnesota Philanthropy Partners (Saint Paul Foundation) from 2012 to 2018, Interim Chief Executive Officer of Blue Cross Blue Shield of Minnesota from 2011 to 2012, Chairman of the Board from 2009 to 2012 and Board Director from 2003 to 2015. Vice President, Leadership and Community Engagement, Bush Foundation, Saint Paul, Minnesota (a private foundation) from 2009 to 2011. Executive Vice President and Chief Financial Officer, Minnesota Sports and Entertainment from 2004 to 2009 and Senior Vice President from 2002 to 2004. Executive Vice President of the Minnesota Wild Foundation from 2004 to 2008. Commissioner of Finance, State of Minnesota, from 1999 to 2002. Currently Board Chair of the Minnesota Wild Foundation since 2010. | | N/A |
| * | Length of service dates reflect the Trustee’s commencement of service with the Trust’s predecessor entities, where applicable. |
Target Date Retirement Funds | 109
Other information (unaudited)
Officers
| | | | |
Name and year of birth | | Position held and
length of service | | Principal occupations during past five years or longer |
| | |
Andrew Owen
(Born 1960) | | President,
since 2017 | | Executive Vice President of Wells Fargo & Company and Head of Affiliated Managers, Wells Fargo Asset Management, since 2014. In addition, Mr. Owen is currently President, Chief Executive Officer and Director of Wells Fargo Funds Management, LLC since 2017. Prior thereto, Executive Vice President responsible for marketing, investments and product development for Wells Fargo Funds Management, LLC, from 2009 to 2014. |
| | |
| Jeremy DePalma1 (Born 1974) | | Treasurer,
since 2012 | | Senior Vice President of Wells Fargo Funds Management, LLC since 2009. Senior Vice President of Evergreen Investment Management Company, LLC from 2008 to 2010 and head of the Fund Reporting and Control Team within Fund Administration from 2005 to 2010. |
| | |
Michelle Rhee
(Born 1966) | | Chief Legal Officer,
since 2019 | | Secretary of Wells Fargo Funds Management, LLC, Chief Legal Counsel of Wells Fargo Asset Management and Assistant General Counsel of Wells Fargo Bank, N.A. since 2018. Associate General Counsel and Managing Director of Bank of America Corporation from 2004 to 2018. |
| | |
| Catherine Kennedy (Born 1969) | | Secretary,
since 2019 | | Vice President of Wells Fargo Funds Management, LLC and Senior Counsel of the Wells Fargo Legal Department since 2010. Vice President and Senior Counsel of Evergreen Investment Management Company, LLC from 1998 to 2010. |
| | |
| Michael H. Whitaker (Born 1967) | | Chief Compliance Officer,
since 2016 | | Chief Compliance Officer of Wells Fargo Asset Management since 2016. Senior Vice President and Chief Compliance Officer for Fidelity Investments from 2007 to 2016. |
| | |
David Berardi
(Born 1975) | | Assistant Treasurer,
since 2009 | | Vice President of Wells Fargo Funds Management, LLC since 2009. Vice President of Evergreen Investment Management Company, LLC from 2008 to 2010. Manager of Fund Reporting and Control for Evergreen Investment Management Company, LLC from 2004 to 2010. |
| 1 | Jeremy DePalma acts as Treasurer of 77 funds and Assistant Treasurer of 65 funds in the Fund Complex. |
| 2 | The Statement of Additional Information includes additional information about the Trustees and is available, without charge, upon request, by calling 1-800-222-8222 or by visiting the website at wfam.com. |
110 | Target Date Retirement Funds
Other information (unaudited)
BOARD CONSIDERATION OF INVESTMENT MANAGEMENT AND SUB-ADVISORY AGREEMENTS:
Wells Fargo Dynamic Target Today Fund, Wells Fargo Dynamic Target 2015 Fund, Wells Fargo Dynamic Target 2020 Fund, Wells Fargo Dynamic Target 2025 Fund, Wells Fargo Dynamic Target 2030 Fund, Wells Fargo Dynamic Target 2035 Fund, Wells Fargo Dynamic Target 2040 Fund, Wells Fargo Dynamic Target 2045 Fund, Wells Fargo Dynamic Target 2050 Fund, Wells Fargo Dynamic Target 2055 Fund and Wells Fargo Dynamic Target 2060 Fund
Under the Investment Company Act of 1940 (the “1940 Act”), the Board of Trustees (the “Board”) of Wells Fargo Funds Trust (the “Trust”) must determine annually whether to approve the continuation of the Trust’s investment management and sub-advisory agreements. In this regard, at a Board meeting held on May 26, 2020 and May 28, 2020 (together, the “Meeting”), the Board, all the members of which have no direct or indirect interest in the investment management and sub-advisory agreements and are not “interested persons” of the Trust, as defined in the 1940 Act (the “Independent Trustees”), reviewed and approved for each of the funds of the Trust identified above (each, a “Fund” and collectively, the “Funds”): (i) an investment management agreement (the “Management Agreement”) with Wells Fargo Funds Management, LLC (“Funds Management”); and (ii) an investment sub-advisory agreement (the “Sub-Advisory Agreement”) with Wells Capital Management Incorporated (the “Sub-Adviser”), an affiliate of Funds Management. The Management Agreement and the Sub-Advisory Agreement are collectively referred to as the “Advisory Agreements.” The Board noted that each Fund commenced operations in 2015.
At the Meeting, the Board considered the factors and reached the conclusions described below relating to the selection of Funds Management and the Sub-Adviser and the approval of the Advisory Agreements. Prior to the Meeting, including at a Board meeting held in April 2020, the Trustees conferred extensively among themselves and with representatives of Funds Management about these matters. Also, the Board has adopted a team-based approach, with each team consisting of a sub-set of Trustees, to assist the full Board in the discharge of its duties in reviewing investment performance and other matters throughout the year. The Independent Trustees were assisted in their evaluation of the Advisory Agreements by independent legal counsel, from whom they received separate legal advice and with whom they met separately.
In providing information to the Board, Funds Management and the Sub-Adviser were guided by a detailed set of requests for information submitted to them by independent legal counsel on behalf of the Independent Trustees at the start of the Board’s annual contract renewal process earlier in 2020. In considering and approving the Advisory Agreements, the Trustees considered the information they believed relevant, including but not limited to the information discussed below. The Board considered not only the specific information presented in connection with the Meeting, but also the knowledge gained over time through interaction with Funds Management and the Sub-Adviser about various topics. In this regard, the Board reviewed reports of Funds Management at each of its quarterly meetings, which included, among other things, portfolio reviews and investment performance reports. In addition, the Board and the teams mentioned above confer with portfolio managers at various times throughout the year. The Board did not identify any particular information or consideration that was all-important or controlling, and each individual Trustee may have attributed different weights to various factors.
After its deliberations, the Board unanimously approved the continuation of the Advisory Agreements for a one-year term and determined that the compensation payable to Funds Management and the Sub-Adviser under each of the Advisory Agreements was reasonable. The Board considered the approval of the Advisory Agreements for the Funds as part of its consideration of agreements for funds across the complex, but its approvals were made on a fund-by-fund basis. The following summarizes a number of important, but not necessarily all, factors considered by the Board in support of its approvals.
Nature, extent and quality of services
The Board received and considered various information regarding the nature, extent and quality of services provided to the Funds by Funds Management and the Sub-Adviser under the Advisory Agreements. This information included a description of the investment advisory services and Fund-level administrative services covered by the Management Agreement, as well as, among other things, a summary of the background and experience of senior management of Wells Fargo Asset Management (“WFAM”), of which Funds Management and the Sub-Adviser are a part, and a summary of investments made in the business of WFAM. The Board also received a description of Funds Management’s and the Sub-Adviser’s business continuity plans and of their approaches to data privacy and cybersecurity, and related testing. The Board also received and reviewed information about Funds Management’s role as administrator of the Funds’ liquidity risk management program, Funds Management’s approach to risk management, and Funds Management’s intermediary and vendor oversight program.
The Board also considered the qualifications, background, tenure and responsibilities of each of the portfolio managers primarily responsible for the day-to-day portfolio management of the Funds. The Board evaluated the ability of Funds Management and the Sub-Adviser to attract and retain qualified investment professionals, including research, advisory and
Target Date Retirement Funds | 111
Other information (unaudited)
supervisory personnel. The Board further considered the compliance programs and compliance records of Funds Management and the Sub-Adviser. In addition, the Board took into account the full range of services provided to the Funds by Funds Management and its affiliates.
Fund investment performance and expenses
The Board considered the investment performance results for each of the Funds over various time periods ended December 31, 2019. The Board also considered more current results for various time periods ended March 31, 2020. The Board considered these results in comparison to the investment performance of funds in a universe that was determined by Broadridge Inc. (“Broadridge”) to be similar to the respective Funds (each, a “Universe”), and in comparison to each Fund’s benchmark index and to other comparative data. Broadridge is an independent provider of investment company data. The Board received a description of the methodology used by Broadridge to select the mutual funds in each performance Universe.
The Board noted that the investment performance of each Fund (Class R6) relative to its respective Universe was as follows: (i) the investment performance of each of the Wells Fargo Dynamic Target Today Fund, the Wells Fargo Dynamic Target 2015 Fund, the Wells Fargo Dynamic Target 2020 Fund, the Wells Fargo Dynamic Target 2025 Fund and the Wells Fargo Dynamic Target 2030 Fund was higher than the average investment performance of each Fund’s respective Universe for the one- and three-year periods ended December 31, 2019; and (ii) the investment performance of each of the Wells Fargo Dynamic Target 2035 Fund, the Wells Fargo Dynamic Target 2040 Fund, the Wells Fargo Dynamic Target 2045 Fund, the Wells Fargo Dynamic Target 2050 Fund, the Wells Fargo Dynamic Target 2055 Fund and the Wells Fargo Dynamic Target 2060 Fund was higher than the average investment performance of each Fund’s respective Universe for the three-year period ended December 31, 2019, and was lower than the average investment performance of each Fund’s respective Universe for the one-year period ended December 31, 2019. The Board also noted that the investment performance of each Fund (Class R6) relative to its respective Universe was higher than the average investment performance of the Fund’s Universe for the one- and three-year periods ended March 31, 2020.
The Board also noted that the investment performance of each Fund (Class R6) relative to its respective benchmark index was as follows: (i) the investment performance of each of the Wells Fargo Dynamic Target Today Fund, the Wells Fargo Dynamic Target 2015 Fund, the Wells Fargo Dynamic Target 2020 Fund, the Wells Fargo Dynamic Target 2025 Fund and the Wells Fargo Dynamic Target 2030 Fund was higher than the average investment performance of each Fund’s respective benchmark index for the one- and three-year periods ended December 31, 2019; and (ii) the investment performance of each of the Wells Fargo Dynamic Target 2035 Fund, the Wells Fargo Dynamic Target 2040 Fund, the Wells Fargo Dynamic Target 2045 Fund, the Wells Fargo Dynamic Target 2050 Fund, the Wells Fargo Dynamic Target 2055 Fund and the Wells Fargo Dynamic Target 2060 Fund was higher than the average investment performance of each Fund’s respective benchmark index for the three-year period ended December 31, 2019, and was lower than the average investment performance of each Fund’s respective benchmark index for the one-year period ended December 31, 2019. The Board noted further that the investment performance of each Fund (Class R6) relative to its respective benchmark index was higher than the average investment performance of the Fund’s benchmark index for the one- and three-year periods ended March 31, 2020.
The Board received information concerning, and discussed factors contributing to, the underperformance of the longer-dated Funds (the Wells Fargo Dynamic Target 2035 Fund, the Wells Fargo Dynamic Target 2040 Fund, the Wells Fargo Dynamic Target 2045 Fund, the Wells Fargo Dynamic Target 2050 Fund, the Wells Fargo Dynamic Target 2055 Fund and the Wells Fargo Dynamic Target 2060 Fund) for the periods identified above. The Board took note of the explanations for the performance results of each underperforming Fund relative to each such Fund’s Universe for the periods identified above, including with respect to investment decisions and market factors that affected each such Fund’s investment performance. The Board also took note of the changes to certain Funds’ investment strategies that were implemented in February 2020 to improve the Funds’ performance.
The Board also received and considered information regarding each Fund’s net operating expense ratios and their various components, including actual management fees, custodian and other non-management fees, and Rule 12b-1 and non-Rule 12b-1 shareholder service fees. The Board considered these ratios in comparison to the median ratios of funds in class-specific expense groups that were determined by Broadridge to be similar to each Fund (the “Groups”). The Board received a description of the methodology used by Broadridge to select the mutual funds in the expense Groups and an explanation of how funds comprising expense groups and their expense ratios may vary from year-to-year. Based on the Broadridge reports, the Board noted that the net operating expense ratios of each Fund were lower than the median net operating expense ratios of its expense Groups for all share classes.
The Board took into account each Fund’s investment performance and expense information provided to it among the factors considered in deciding to re-approve the Advisory Agreements.
112 | Target Date Retirement Funds
Other information (unaudited)
Investment management and sub-advisory fee rates
The Board reviewed and considered the contractual fee rates payable by each Fund to Funds Management under the Management Agreement, as well as the contractual fee rates payable by each Fund to Funds Management for class-level administrative services under a Class-Level Administration Agreement, which include, among other things, class-level transfer agency and sub-transfer agency costs (collectively, the “Management Rates”). The Board also reviewed and considered the contractual investment sub-advisory fee rates that are payable by Funds Management to the Sub-Adviser for investment sub-advisory services.
Among other information reviewed by the Board was a comparison of each Fund’s Management Rates with the average contractual investment management fee rates of funds in the expense Groups at a common asset level, as well as transfer agency costs of the funds in the expense Groups. The Board noted that the Management Rates of each Fund were lower than, equal to or in range of the sum of these average rates for the Fund’s expense Groups for all share classes.
The Board also received and considered information about the portion of the total management fee that was retained by Funds Management after payment of the fee to the Sub-Adviser for sub-advisory services. In assessing the reasonableness of this amount, the Board received and evaluated information about the nature and extent of responsibilities retained and risks assumed by Funds Management and not delegated to or assumed by the Sub-Adviser, and about Funds Management’s on-going oversight services. Given the affiliation between Funds Management and the Sub-Adviser, the Board ascribed limited relevance to the allocation of fees between them.
Based on its consideration of the factors and information it deemed relevant, including those described here, the Board determined that the compensation payable to Funds Management under the Management Agreement and to the Sub-Adviser under the Sub-Advisory Agreement was reasonable.
Profitability
The Board received and considered information concerning the profitability of Funds Management, as well as the profitability of both WFAM and Wells Fargo & Co. (“Wells Fargo”) from providing services to the fund family as a whole. The Board noted that the Sub-Adviser’s profitability information with respect to providing services to the Funds and other funds in the family was subsumed in the WFAM and Wells Fargo profitability analysis.
Funds Management reported on the methodologies and estimates used in calculating profitability, including a description of the methodology used to allocate certain expenses. Among other things, the Board noted that the levels of profitability reported on a fund-by-fund basis varied widely, depending on factors such as the size, type and age of fund.
Based on its review, the Board did not deem the profits reported by Funds Management, WFAM or Wells Fargo from services provided to the Funds to be at a level that would prevent it from approving the continuation of the Advisory Agreements.
Economies of scale
The Board received and considered information about the potential for Funds Management to experience economies of scale in the provision of management services to the Funds, the difficulties of calculating economies of scale at an individual fund level, and the extent to which potential scale benefits are shared with shareholders. The Board noted the existence of breakpoints in each Fund’s management fee structure, which operate generally to reduce the Fund’s expense ratios as the Fund grows in size, and the size of the Fund in relation to such breakpoints. The Board considered that in addition to management fee breakpoints, Funds Management shares potential economies of scale from its management business in a variety of ways, including through fee waiver and expense reimbursement arrangements, services that benefit shareholders, competitive management fee rates set at the outset without regard to breakpoints, and investments in the business intended to enhance services available to shareholders.
The Board concluded that Funds Management’s arrangements with respect to the Funds, including contractual breakpoints, constituted a reasonable approach to sharing potential economies of scale with the Funds and their shareholders.
Other benefits to Funds Management and the Sub-Adviser
The Board received and considered information regarding potential “fall-out” or ancillary benefits received by Funds Management and its affiliates, including the Sub-Adviser, as a result of their relationships with the Funds. Ancillary benefits could include, among others, benefits directly attributable to other relationships with the Funds and benefits potentially derived from an increase in Funds Management’s and the Sub-Adviser’s business as a result of their relationships with the Funds. The Board noted that various affiliates of Funds Management may receive distribution-related fees, shareholder servicing payments and sub-transfer agency fees in respect of shares sold or held through them and services provided.
Target Date Retirement Funds | 113
Other information (unaudited)
The Board also reviewed information about soft dollar credits earned and utilized by the Sub-Adviser, fees earned by Funds Management and the Sub-Adviser from managing a private investment vehicle for the fund family’s securities lending collateral, and commissions earned by an affiliated broker from portfolio transactions.
Based on its consideration of the factors and information it deemed relevant, including those described here, the Board did not find that any ancillary benefits received by Funds Management and its affiliates, including the Sub-Adviser, were unreasonable.
Conclusion
At the Meeting, after considering the above-described factors and based on its deliberations and its evaluation of the information described above, the Board unanimously approved the continuation of the Advisory Agreements for a one-year term and determined that the compensation payable to Funds Management and the Sub-Adviser under each of the Advisory Agreements was reasonable.
114 | Target Date Retirement Funds
Other information (unaudited)
LIQUIDITY RISK MANAGEMENT PROGRAM
In accordance with Rule 22e-4 under the Investment Company Act of 1940, as amended (the “Liquidity Rule”), Wells Fargo Funds Trust (the “Trust”) has adopted and implemented a liquidity risk management program (the “Program”) on behalf of each of its series, including each Fund, which is reasonably designed to assess and manage the Fund’s liquidity risk. “Liquidity risk” is defined as the risk that a Fund is unable to meet redemption requests without significantly diluting remaining investors’ interests in the Fund. The Trust’s Board of Trustees (the “Board”) previously approved the designation of Wells Fargo Funds Management, LLC (“Funds Management”), each Fund’s investment manager, as the administrator of the Program, and Funds Management has established a Liquidity Risk Management Council composed of personnel from multiple departments within Funds Management and its affiliates to assist Funds Management in the implementation and on-going administration of the Program.
The Program is comprised of various components designed to support the assessment and/or management of liquidity risk, including: (1) the periodic assessment (no less frequently than annually) of certain factors that influence a Fund’s liquidity risk; (2) the periodic classification (no less frequently than monthly) of a Fund’s investments into one of four liquidity categories that reflect an estimate of their liquidity under current market conditions; (3) a 15% limit on the acquisition of “illiquid investments” (as defined under the Liquidity Rule); (4) to the extent a Fund does not invest primarily in “highly liquid investments” (as defined under the Liquidity Rule), the determination of a minimum percentage of the Fund’s assets that generally will be invested in highly liquid investments (an “HLIM”); (5) if a Fund has established an HLIM, the periodic review (no less frequently than annually) of the HLIM and the adoption of policies and procedures for responding to a shortfall of the Fund’s “highly liquid investments” below its HLIM; and (6) periodic reporting to the Board.
At a meeting of the Board held on May 26 and 28, 2020, the Board received a written report (the “Report”) from Funds Management that addressed the operation of the Program and assessed its adequacy and effectiveness of implementation. The Report covered the initial period from December 1, 2018 through December 31, 2019 (the “Reporting Period”). No significant liquidity events impacting any Fund were noted in the Report. There were no material changes to the Program during the Reporting Period. The Report concluded that the Program is operating effectively to assess and manage each Fund’s liquidity risk, and that the Program has been and continues to be adequately and effectively implemented to monitor and, as applicable, respond to the Fund’s liquidity developments.
There can be no assurance that the Program will achieve its objectives under all circumstances in the future. Please refer to a Fund’s prospectus for more information regarding the Fund’s exposure to liquidity risk and other risks to which an investment in the Fund may be subject.
Target Date Retirement Funds | 115
Appendix I (unaudited)
On August 31, 2020, the Wells Fargo Dynamic Target Blended Indexes were composed of the following indexes:
| | | | | | | | | | | | |
| | | |
| | | Wells Fargo
Dynamic
Target
Today
Blended
Index | | | Wells Fargo
Dynamic
Target
2015
Blended
Index | | | Wells Fargo
Dynamic
Target
2020
Blended
Index | |
| | | |
Bloomberg Barclays U.S. Aggregate ex-Corporate Index | | | 29.57 | % | | | 25.14 | % | | | 21.49 | % |
| | | |
Bloomberg Barclays U.S. Government Intermediate Bond Index | | | 5.00 | % | | | 4.25 | % | | | 3.34 | % |
| | | |
Bloomberg Barclays U.S. Treasury Inflation Notes: 1-10 Year Index | | | 5.00 | % | | | 4.25 | % | | | 3.34 | % |
| | | |
JP Morgan EMBI Global Diversified Index | | | 2.52 | % | | | 2.14 | % | | | 1.83 | % |
| | | |
MSCI EM Index (Net) | | | 2.96 | % | | | 3.62 | % | | | 4.28 | % |
| | | |
MSCI World ex USA Index (Net) | | | 9.88 | % | | | 12.10 | % | | | 14.29 | % |
| | | |
Russell 1000® Index | | | 19.07 | % | | | 23.37 | % | | | 27.30 | % |
| | | |
Russell 2000® Index | | | 4.76 | % | | | 5.83 | % | | | 6.82 | % |
| | | |
Wells Fargo U.S. High Yield Bond Index | | | 2.52 | % | | | 2.14 | % | | | 1.83 | % |
| | | |
Wells Fargo U.S. Investment Grade Corporate Bond Index | | | 15.39 | % | | | 13.08 | % | | | 11.18 | % |
| | | |
Wells Fargo U.S. REIT Index | | | 3.33 | % | | | 4.08 | % | | | 4.30 | % |
Average annual total returns (%) as of August 31, 2020
| | | | | | | | | | | | |
| | | |
| | | 1 year | | | 5 year | | | 10 year | |
| | | |
Bloomberg Barclays U.S. Aggregate ex-Corporate Index1* | | | 5.92 | | | | – | | | | – | |
| | | |
Bloomberg Barclays U.S. Government Intermediate Bond Index2 | | | 5.44 | | | | 2.90 | | | | 2.34 | |
| | | |
Bloomberg Barclays U.S. Treasury Inflation Notes: 1-10 Year Index3 | | | 7.24 | | | | 3.68 | | | | 2.86 | |
| | | |
JP Morgan EMBI Global Diversified Index4 | | | 2.73 | | | | 6.27 | | | | 5.80 | |
| | | |
MSCI EM Index (Net)5 | | | 14.49 | | | | 8.66 | | | | 3.76 | |
| | | |
MSCI World ex USA Index (Net)6 | | | 5.96 | | | | 4.83 | | | | 5.63 | |
| | | |
Russell 1000® Index7 | | | 22.50 | | | | 14.31 | | | | 15.19 | |
| | | |
Russell 2000® Index8 | | | 6.02 | | | | 7.65 | | | | 11.53 | |
| | | |
Wells Fargo U.S. High Yield Bond Index9** | | | 4.82 | | | | – | | | | – | |
| | | |
Wells Fargo U.S. Investment Grade Corporate Bond Index10** | | | 7.24 | | | | – | | | | – | |
| | | |
Wells Fargo U.S. REIT Index11*** | | | (14.77 | ) | | | – | | | | – | |
| * | The inception date of the index is December 2015. |
| ** | The inception date of the index is April 2017. |
| *** | The inception date is March 2017. |
| 1 | The Bloomberg Barclays U.S. Aggregate ex-Corporate Index is a broad-based benchmark that includes Treasuries, government-related securities, mortgage-backed securities (agency fixed-rate and hybrid adjustable-rate mortgage pass-throughs), asset-backed securities and commercial mortgage-backed securities (agency and non-agency). You cannot invest directly in an index. |
| 2 | The Bloomberg Barclays U.S. Government Intermediate Bond Index is an unmanaged index composed of U.S. government securities with maturities in the 1- to 10-year range, including securities issued by the U.S. Treasury and U.S. government agencies. You cannot invest directly in an index. |
| 3 | Bloomberg Barclays U.S. Treasury Inflation Notes: 1-10 Year Index measures the performance of the U.S. Treasury Inflation Protected Securities (TIPS) market with maturities more than 1 year and less than 10 years. Federal Reserve holdings of U.S. TIPS are not index eligible and are excluded from the face amount outstanding of each bond in the index. You cannot invest directly in an index. |
| 4 | The J.P. Morgan Emerging Markets Bond Index (“EMBI”) Global Diversified Index is a composite index representing an unleveraged investment in emerging market bonds that is broadly based across the spectrum of emerging market bonds and includes reinvestment of income (to represent real assets). You cannot invest directly in an index. |
116 | Target Date Retirement Funds
Appendix I (unaudited)
| | | | | | | | | | | | | | | | | | | | | | | | | | | | | | | | | | | | | | |
Wells Fargo
Dynamic
Target
2025
Blended
Index | | Wells Fargo
Dynamic
Target
2030
Blended
Index | | Wells Fargo
Dynamic
Target
2035
Blended
Index | | Wells Fargo
Dynamic
Target
2040
Blended
Index | | Wells Fargo
Dynamic
Target
2045
Blended
Index | | Wells Fargo
Dynamic
Target
2050
Blended
Index | | Wells Fargo
Dynamic
Target
2055
Blended
Index | | Wells Fargo
Dynamic
Target
2060
Blended
Index |
| | | | | | | |
| | | 17.81% | | | | | 13.81 | % | | | | 11.25 | % | | | | 8.29 | % | | | | 5.33 | % | | | | 2.96 | % | | | | 2.96 | % | | | | 2.96 | % |
| | | | | | | |
| | | 1.47% | | | | | 0.34 | % | | | | 0.00 | % | | | | 0.00 | % | | | | 0.00 | % | | | | 0.00 | % | | | | 0.00 | % | | | | 0.00 | % |
| | | | | | | |
| | | 1.47% | | | | | 0.34 | % | | | | 0.00 | % | | | | 0.00 | % | | | | 0.00 | % | | | | 0.00 | % | | | | 0.00 | % | | | | 0.00 | % |
| | | | | | | |
| | | 1.50% | | | | | 1.16 | % | | | | 0.95 | % | | | | 0.70 | % | | | | 0.45 | % | | | | 0.25 | % | | | | 0.25 | % | | | | 0.25 | % |
| | | | | | | |
| | | 5.37% | | | | | 6.43 | % | | | | 7.10 | % | | | | 7.76 | % | | | | 8.30 | % | | | | 8.74 | % | | | | 8.74 | % | | | | 8.74 | % |
| | | | | | | |
| | | 17.88% | | | | | 21.50 | % | | | | 23.86 | % | | | | 25.87 | % | | | | 27.74 | % | | | | 29.26 | % | | | | 29.26 | % | | | | 29.26 | % |
| | | | | | | |
| | | 32.71% | | | | | 37.67 | % | | | | 40.03 | % | | | | 41.90 | % | | | | 43.97 | % | | | | 45.60 | % | | | | 45.60 | % | | | | 45.60 | % |
| | | | | | | |
| | | 8.20% | | | | | 9.42 | % | | | | 10.01 | % | | | | 10.47 | % | | | | 10.99 | % | | | | 11.40 | % | | | | 11.40 | % | | | | 11.40 | % |
| | | | | | | |
| | | 1.50% | | | | | 1.16 | % | | | | 0.95 | % | | | | 0.70 | % | | | | 0.45 | % | | | | 0.25 | % | | | | 0.25 | % | | | | 0.25 | % |
| | | | | | | |
| | | 9.26% | | | | | 7.19 | % | | | | 5.85 | % | | | | 4.31 | % | | | | 2.77 | % | | | | 1.54 | % | | | | 1.54 | % | | | | 1.54 | % |
| | | | | | | |
| | | 2.83% | | | | | 0.98 | % | | | | 0.00 | % | | | | 0.00 | % | | | | 0.00 | % | | | | 0.00 | % | | | | 0.00 | % | | | | 0.00 | % |
| 5 | The Morgan Stanley Capital International (MSCI) Emerging Markets (EM) Index (Net) is a free-float-adjusted market-capitalization-weighted index that is designed to measure the equity market performance of emerging markets. You cannot invest directly in an index. |
| 6 | The MSCI World ex USA Index (Net) is a free-float-adjusted market-capitalization-weighted index that is designed to measure the equity market performance of developed and emerging markets, excluding the United States. You cannot invest directly in an index. |
| 7 | The Russell 1000® Index measures the performance of the 1,000 largest companies in the Russell 3000® Index, which represents approximately 92% of the total market capitalization of the Russell 3000® Index. You cannot invest directly in an index. |
| 8 | The Russell 2000® Index measures the performance of the 2,000 smallest companies in the Russell 3000® Index, which represents approximately 8% of the total market capitalization of the Russell 3000® Index. You cannot invest directly in an index. |
| 9 | The Wells Fargo U.S. High Yield Bond Index is a rules-based index designed to measure the performance of U.S. dollar denominated below investment-grade corporate debt issued by U.S. or foreign issuers that have a remaining maturity of at least one year, regardless of optionality; it is constructed to provide increased diversification and liquidity versus traditional passive high yield bond indexes. You cannot invest directly in an index. |
| 10 | The Wells Fargo U.S. Investment Grade Corporate Bond Index is a rules-based index designed to measure the performance of publicly issued U.S. dollar denominated investment grade, fixed-rate corporate bonds issued by U.S. or foreign issuers that have a remaining maturity of at least one year, regardless of optionality; it is constructed to provide increased diversification and liquidity versus traditional passive corporate credit indexes. You cannot invest directly in an index. |
| 11 | The Wells Fargo U.S. REIT Index is a float-adjusted, capitalization-weighted index of all applicable NYSE MKT or NASDAQ-listed classes of REIT stock that satisfy specified market capitalization and other eligibility requirements. You cannot invest directly in an index. |
Target Date Retirement Funds | 117
Appendix II (unaudited)
Effective June 1, 2020, shareholders purchasing Fund shares through an Oppenheimer & Co. Inc. (“Oppenheimer”) platform or account are eligible only for the following load waivers (front-end sales charge waivers and contingent deferred or back-end, sales charge waivers) and discounts, which may differ from those disclosed in the Fund’s Prospectus or SAI.
|
| Front-end sales load waivers on Class A shares available at Oppenheimer |
|
| Employer-sponsored retirement, deferred compensation and employee benefit plans (including health savings accounts) and trusts used to fund those plans, provided that the shares are not held in a commission-based brokerage account and shares are held for the benefit of the plan. |
|
| Shares purchased by or through a 529 Plan. |
|
| Shares purchased through an Oppenheimer affiliated investment advisory program. |
|
| Shares purchased through reinvestment of capital gains distributions and dividend reinvestment when purchasing shares of the same fund (but not any other fund within the fund family). |
|
| Shares purchased from the proceeds of redemptions within the same fund family, provided (1) the repurchase occurs within 90 days following the redemption, (2) the redemption and purchase occur in the same account, and (3) redeemed shares were subject to a front-end or deferred sales load (known as Rights of Restatement). |
|
| A shareholder in the Fund’s Class C shares will have their shares exchanged at net asset value to Class A shares (or the appropriate share class) of the Fund if the shares are no longer subject to a CDSC and the exchange is in line with the policies and procedures of Oppenheimer. |
|
| Employees and registered representatives of Oppenheimer or its affiliates and their family members. |
|
| Directors or Trustees of the Fund, and employees of the Fund’s investment adviser or any of its affiliates, as described in the Prospectus. |
| CDSC waivers on A and C shares available at Oppenheimer |
|
| Death or disability of the shareholder. |
|
| Shares sold as part of a systematic withdrawal plan as described in the Prospectus. |
|
| Return of excess contributions from an IRA Account. |
|
| Shares sold as part of a required minimum distribution for IRA and retirement accounts due to the shareholder reaching the qualified age based on applicable IRS regulations as described in the Prospectus. |
|
| Shares sold to pay Oppenheimer fees but only if the transaction is initiated by Oppenheimer. |
|
| Shares acquired through a right of reinstatement. |
| Front-end load discounts available at Oppenheimer: breakpoints, rights of accumulation & letters of intent |
|
| Breakpoints as described in the Prospectus. |
|
| Rights of Accumulation (ROA), which entitle shareholders to breakpoint discounts, will be automatically calculated based on the aggregated holding of fund family assets held by accounts within the purchaser’s household at Oppenheimer. Eligible fund family assets not held at Oppenheimer may be included in the ROA calculation only if the shareholder notifies his or her financial advisor about such assets. |
118 | Target Date Retirement Funds
Appendix III (unaudited)
Effective June 15, 2020, shareholders purchasing fund shares through a Robert W. Baird & Co. (“Baird”) platform or account will only be eligible for the following sales charge waivers (front-end sales charge waivers and CDSC waivers) and discounts, which may differ from those disclosed elsewhere in the Fund’s Prospectus or the SAI.
|
| Front-end sales Load waivers on Class A shares available at Baird |
|
| Shares purchased through reinvestment of capital gains distributions and dividend reinvestment when purchasing share of the same fund. |
|
| Share purchase by employees and registers representatives of Baird or its affiliate and their family members as designated by Baird. |
|
| Shares purchase from the proceeds of redemptions within the same fund family, provided (1) the repurchase occurs within 90 days following the redemption, (2) the redemption and purchase occur in the same accounts, and (3) redeemed shares were subject to a front-end or deferred sales charge (known as rights of reinstatement). |
|
| A shareholder in the Funds Investor C Shares will have their share exchanged at net asset value to Investor A shares of the fund if the shares are no longer subject to CDSC and the exchange is in line with the policies and procedures of Baird. |
|
| Employer-sponsored retirement plans or charitable accounts in a transactional brokerage account at Baird, including 401(k)plans, 457 plans, employer-sponsored 403(b) plans, profit sharing and money purchase pension plans and defined benefit plans. For purposes of this provision, employer-sponsored retirement plans do not include SEP IRAs, Simple IRAs or SAR-SEPs. |
| CDSC waivers on A and C shares available at Baird |
|
| Shares sold due to death or disability of the shareholder. |
|
| Shares sold as part of a systematic withdrawal plan as described in the Fund’s Prospectus. |
|
| Shares bought due to returns of excess contributions from an IRA Account. |
|
| Shares sold as part of a required minimum distribution for IRA and retirement accounts due to the shareholder reaching age 72as described in the Fund’s Prospectus. |
|
| Shares sold to pay Baird fees but only if the transaction is initiated by Baird. |
|
| Shares acquired through a right of reinstatement. |
| Front-end load discounts available at Baird: breakpoint and/or rights of accumulation |
|
| Breakpoints as described in the Prospectus. |
|
| Rights of accumulations which entitles shareholders to breakpoint discounts will be automatically calculated based on the aggregated holding of fund family assets held by accounts within the purchaser’s household at Baird. Eligible fund family assets not held at Baird may be included in the rights of accumulations calculation only if the shareholder notifies his or her financial advisor about such assets. |
|
| Letters of Intent (LOI) allow for breakpoint discounts based on anticipated purchases within a fund family through Baird, over a13-month period of time. |
Target Date Retirement Funds | 119
This page is intentionally left blank.

For more information
More information about Wells Fargo Funds is available free upon request. To obtain literature, please write, visit the Funds’ website, or call:
Wells Fargo Funds
P.O. Box 219967
Kansas City, MO 64121-9967
Website: wfam.com
Individual investors: 1-800-222-8222
Retail investment professionals: 1-888-877-9275
Institutional investment professionals: 1-866-765-0778

This report and the financial statements contained herein are submitted for the general information of the shareholders of Wells Fargo Funds. If this report is used for promotional purposes, distribution of the report must be accompanied or preceded by a current prospectus. Before investing, please consider the investment objectives, risks, charges, and expenses of the investment. For a current prospectus and, if available, a summary prospectus, containing this information, call 1-800-222-8222 or visit the Funds’ website at wfam.com. Read the prospectus carefully before you invest or send money.
Wells Fargo Asset Management (WFAM) is the trade name for certain investment advisory/management firms owned by Wells Fargo & Company. These firms include but are not limited to Wells Capital Management Incorporated and Wells Fargo Funds Management, LLC. Certain products managed by WFAM entities are distributed by Wells Fargo Funds Distributor, LLC (a broker-dealer and Member FINRA).
This material is for general informational and educational purposes only and is NOT intended to provide investment advice or a recommendation of any kind—including a recommendation for any specific investment, strategy, or plan.
INVESTMENT PRODUCTS: NOT FDIC INSURED ◾ NO BANK GUARANTEE ◾ MAY LOSE VALUE
© 2020 Wells Fargo & Company. All rights reserved
PAR-0920-00418 10-20
SDTD/SAR104 08-20
ITEM 2. CODE OF ETHICS
Not applicable.
ITEM 3. AUDIT COMMITTEE FINANCIAL EXPERT
Not applicable.
ITEM 4. PRINCIPAL ACCOUNTANT FEES AND SERVICES
Not applicable.
ITEM 5. AUDIT COMMITTEE OF LISTED REGISTRANTS
Not applicable.
ITEM 6. INVESTMENTS
A Portfolio of Investments for each series of Wells Fargo Funds Trust is included as part of the report to shareholders filed under Item 1 of this Form.
ITEM 7. DISCLOSURE OF PROXY VOTING POLICIES AND PROCEDURES FOR CLOSED-END MANAGEMENT INVESTMENT COMPANIES
Not applicable.
ITEM 8. PORTFOLIO MANAGERS OF CLOSED-END MANAGEMENT INVESTMENT COMPANIES
Not applicable.
ITEM 9. PURCHASES OF EQUITY SECURITIES BY CLOSED-END MANAGEMENT INVESTMENT COMPANY AND AFFILIATED PURCHASERS
Not applicable.
ITEM 10. SUBMISSION OF MATTERS TO A VOTE OF SECURITY HOLDERS
There have been no material changes to the procedures by which shareholders may recommend nominees to the registrant’s Board of Trustees that have been implemented since the registrant’s last provided disclosure in response to the requirements of this Item.
ITEM 11. CONTROLS AND PROCEDURES
(a) The President and Treasurer have concluded that the Wells Fargo Funds Trust disclosure controls and procedures (as defined in Rule 30a-3(c) under the Investment Company Act of 1940) provide reasonable assurances that material information relating to the registrant is made known to them by the appropriate persons, based on their evaluation of these controls and procedures as of a date within 90 days of the filing of this report.
(b) There were no significant changes in the registrant’s internal controls over financial reporting (as defined in Rule 30a-3(d) under the Investment Company Act of 1940) that occurred during the most recent fiscal half-year of the period covered by this report that materially affected, or is reasonably likely to materially affect, the registrant’s internal control over financial reporting.
ITEM 12. DISCLOSURES OF SECURITIES LENDING ACTIVITES FOR CLOSED-END MANAGEMENT INVESTMENT COMPANIES
Not applicable.
ITEM 13. EXHIBITS
SIGNATURES
Pursuant to the requirements of the Securities Exchange Act of 1934 and the Investment Company Act of 1940, the registrant has duly caused this report to be signed on its behalf by the undersigned, thereunto duly authorized.
| | |
| Wells Fargo Funds Trust |
| |
| By: | | /s/ Andrew Owen |
| | Andrew Owen |
| | President |
| |
| Date: | | October 28, 2020 |
Pursuant to the requirements of the Securities Exchange Act of 1934 and the Investment Company Act of 1940, this report has been signed below by the following persons on behalf of the registrant and in the capacities and on the date indicated.
| | |
| Wells Fargo Funds Trust |
| |
| By: | | /s/ Andrew Owen |
| | Andrew Owen |
| | President |
| |
| Date: | | October 28, 2020 |
| |
| By: | | /s/ Jeremy DePalma |
| | Jeremy DePalma |
| | Treasurer |
| |
| Date: | | October 28, 2020 |