
UNITED STATES
SECURITIES AND EXCHANGE COMMISSION
Washington, D.C. 20549
FORMN-CSRS
CERTIFIED SHAREHOLDER REPORT OF REGISTERED
MANAGEMENT INVESTMENT COMPANIES
Investment Company Act file number:811-09253
Wells Fargo Funds Trust
(Exact name of registrant as specified in charter)
525 Market St., San Francisco, CA 94105
(Address of principal executive offices) (Zip code)
Catherine Kennedy
Wells Fargo Funds Management, LLC
525 Market St., San Francisco, CA 94105
(Name and address of agent for service)
Registrant’s telephone number, including area code:800-222-8222
Date of fiscal year end: October 31
Registrant is making a filing for 7 of its series:
Wells Fargo Diversified International Fund, Wells Fargo Emerging Markets Equity Fund, Wells Fargo Emerging Markets Equity Income Fund, Wells Fargo Global Small Cap Fund, Wells Fargo International Equity Fund, Wells Fargo Intrinsic World Equity Fund, and Wells Fargo Special International Small Cap Fund.
Date of reporting period: April 30, 2020
| ITEM 1. | REPORT TO STOCKHOLDERS |
================================
Semi-Annual Report
April 30, 2020
Wells Fargo
Diversified International Fund
Beginning on January 1, 2021, as permitted by new regulations adopted by the Securities and Exchange Commission, paper copies of the Wells Fargo Funds’ annual and semi-annual shareholder reports issued after this date will no longer be sent by mail, unless you specifically request paper copies of the reports. Instead, the reports will be made available on the Funds’ website, and you will be notified by mail each time a report is posted and provided with a website address to access the report.
If you already elected to receive shareholder reports electronically, you will not be affected by this change and you need not take any action. You may elect to receive shareholder reports and other communications from the Fund electronically at any time by contacting your financial intermediary (such as a broker-dealer or bank) or, if you are a direct investor, by calling1-800-222-8222 or by enrolling at wellsfargo.com/advantagedelivery.
You may elect to receive all future reports in paper free of charge. If you invest through a financial intermediary, you can contact your financial intermediary to request that you continue to receive paper copies of your shareholder reports; if you invest directly with the Fund, you can call 1-800-222-8222. Your election to receive reports in paper will apply to all Wells Fargo Funds held in your account with your financial intermediary or, if you are a direct investor, to all Wells Fargo Funds that you hold.
|
|
|
Reduce clutter. Save trees. |
Sign up for electronic
delivery of prospectuses and
shareholder reports atwellsfargo.com/
advantagedelivery |
The views expressed and any forward-looking statements are as of April 30, 2020, unless otherwise noted, and are those of the Fund managers and/or Wells Fargo Asset Management. Discussions of individual securities, or the markets generally, or any Wells Fargo Fund are not intended as individual recommendations. Future events or results may vary significantly from those expressed in any forward-looking statements. The views expressed are subject to change at any time in response to changing circumstances in the market. Wells Fargo Asset Management and the Fund disclaim any obligation to publicly update or revise any views expressed or forward-looking statements.
INVESTMENT PRODUCTS: NOT FDIC INSURED ◾ NO BANK GUARANTEE ◾ MAY LOSE VALUE
Wells Fargo Diversified International Fund | 1
Letter to shareholders (unaudited)

Andrew Owen
President
Wells Fargo Funds
“The period began with a tailwind created by central bank support.”
Dear Shareholder:
We are pleased to offer you this semi-annual report for theWells Fargo Diversified International Fund for the six-month period that ended April 30, 2020. Global stock markets saw earlier gains erased in February and March as governments took unprecedented measures to stop the spread of the coronavirus at the expense of short-term economic output. Markets rebounded in April to lessen the losses as central banks attempted to bolster capital markets and confidence. Fixed-income markets performed better, with the exception of high-yield bonds, as U.S. bonds overall achieved modest gains.
For the six-month period, U.S. stocks, based on the S&P 500 Index,1 returned -3.16% and international stocks, as measured by the MSCI ACWI ex USA Index (Net),2 fell 13.22%. The MSCI Emerging Markets Index (Net)3 lost 10.50%. For bond investors, the Bloomberg Barclays U.S. Aggregate Bond Index4 added 4.86%, the Bloomberg Barclays Global Aggregate ex-USD Index5 returned -0.97%, the Bloomberg Barclays Municipal Bond Index6 returned -1.33%, and the ICE BofA U.S. High Yield Index7 lost 7.68%.
The period began with a tailwind created by central bank support.
The period began with a tailwind that had been created by U.S. Federal Reserve (Fed) rate cuts in the summer and early fall. Equity markets rallied in November despite ongoing geopolitical risks. Hopes for a U.S.-China trade deal buoyed investor confidence. U.S. business sentiment edged up, and manufacturing and services activity rose. With that positive backdrop, developed market equities outpaced those in emerging markets, and U.S. stocks outperformed non-U.S. stocks overall. While consumer confidence and purchasing manager activity rose in the eurozone, China reported weakening manufacturing and consumer data. Bond yields rose marginally, leading to slightly negative returns for global government and investment-grade corporate bonds.
Financial markets ended 2019 with a boost from the U.S. and China accord on a Phase One trade deal. That, along with the landslide win by the pro-Brexit U.K. Conservative Party in a national election and ongoing central bank support, gave investors greater confidence. U.S. economic indicators were positive overall, with the exception of manufacturing activity and business confidence. Consumer confidence was resilient, fed by a robust labor market, tame inflation, and lower interest rates, which boosted housing affordability and stimulated homebuyer activity. The impeachment of U.S. President Donald Trump had little impact on markets. Meanwhile, slowing Chinese economic activity, partly attributable to the trade war, led to further government stimulus at year-end through lower reserve ratios, allowing banks to lend more money.
The year-end rally continued in early January 2020. However, capital market volatility spiked in late January on concerns over the potential impact of the coronavirus on the global economy and stock markets. With sentiment somewhat souring, perceived safe
| 1 | The S&P 500 Index consists of 500 stocks chosen for market size, liquidity, and industry group representation. It is a market-value-weighted index with each stock’s weight in the index proportionate to its market value. You cannot invest directly in an index. |
| 2 | The Morgan Stanley Capital International (MSCI) All Country World Index (ACWI) ex USA Index (Net) is a free-float-adjusted market-capitalization-weighted index that is designed to measure the equity market performance of developed markets, excluding the United States. Source: MSCI. MSCI makes no express or implied warranties or representations and shall have no liability whatsoever with respect to any MSCI data contained herein. The MSCI data may not be further redistributed or used as a basis for other indices or any securities or financial products. This report is not approved, reviewed, or produced by MSCI. You cannot invest directly in an index. |
| 3 | The MSCI Emerging Markets (EM) Index (Net) is a free-float-adjusted market-capitalization-weighted index that is designed to measure equity market performance of emerging markets. You cannot invest directly in an index. |
| 4 | The Bloomberg Barclays U.S. Aggregate Bond Index is a broad-based benchmark that measures the investment-grade, U.S. dollar-denominated, fixed-rate taxable bond market, including Treasuries, government-related and corporate securities, mortgage-backed securities (agency fixed-rate and hybrid adjustable-rate mortgage pass-throughs), asset-backed securities, and commercial mortgage-backed securities. You cannot invest directly in an index. |
| 5 | The Bloomberg Barclays Global Aggregate ex-USD Index is an unmanaged index that provides a broad-based measure of the global investment-grade fixed-income markets excluding the U.S. dollar-denominated debt market. You cannot invest directly in an index. |
| 6 | The Bloomberg Barclays Municipal Bond Index is an unmanaged index composed of long-term tax-exempt bonds with a minimum credit rating of Baa. You cannot invest directly in an index. |
| 7 | The ICE BofA U.S. High Yield Index is a market-capitalization-weighted index of domestic and Yankee high-yield bonds. The index tracks the performance of high-yield securities traded in the U.S. bond market. You cannot invest directly in an index. Copyright 2020. ICE Data Indices, LLC. All rights reserved. |
2 | Wells Fargo Diversified International Fund
Letter to shareholders (unaudited)
havens did well in January. The U.S. dollar and Japanese yen both rose, and government bonds outperformed equities. While the S&P 500 Index held its ground, emerging market equities tumbled, including those in Asia.
In February, the coronavirus became the major market focus. Fears of the virus’s impact on global growth led to expectations of increased global central bank monetary policy support. That led the 10-year U.S. Treasury yield to fall to an all-time low of 1.1% by the end of the month. Although equity markets initially shrugged off concerns about the outbreak, focusing instead on strong fourth-quarter earnings and improving business confidence in January, market sentiment turned sharply lower toward month-end. Oil prices tumbled as Russia and the Organization of the Petroleum Exporting Countries compounded a major decline in oil demand with a brutal price war, causing the price of West Texas Intermediate crude oil to fall 13% in February alone.
The global spread of the coronavirus led many countries to clamp down on social and business-related activity in order to contain the virus from causing even greater devastation and overwhelming the health care system. This abrupt stoppage of economic activity led to the sharp deceleration of global output, sending economies into a deep contraction. Central bank responses were swift, as they slashed interest rates and expanded quantitative easing programs to restore liquidity and confidence to the markets. In the U.S., the Fed launched several lending programs, funding investment-grade bonds, money market mutual funds, and commercial paper while purchasing Treasuries, mortgage-backed securities, and overnight repurchase agreements. Meanwhile, stock markets tumbled quickly into a bear market, ending the longest bull stock market in U.S. history.
Markets rebounded strongly in April after the extreme volatility of the previous two months, with the S&P 500 Index gaining 12.8% for the month and the MSCI ACWI ex USA Index (Net) returning 7.6%. The rebound was fueled by unprecedented stimulus measures taken by governments and central banks to buffer the economic damage created by mass shutdowns to try to contain the virus’s spread. The U.S. economy contracted by an annualized 4.8% pace in the first quarter, with 30 million new unemployment insurance claims in six weeks. In the eurozone, first-quarter real gross domestic product (GDP) shrank 3.8%, with the composite April Flash Purchasing Managers’ Index, a monthly survey of purchasing managers, falling to an all-time low of 13.5. The European Central Bank expanded its quantitative easing to include the purchase of additional government bonds of countries with the greatest virus-related need, including Italy and Spain. China’s first-quarter GDP fell by 6.8% year over year. However, retail sales, production, and investment showed signs of recovery. Extreme oil price volatility continued as global supply far exceeded demand.
Don’t let short-term uncertainty derail long-term investment goals.
Periods of investment uncertainty can present challenges, but experience has taught us that maintaining long-term investment goals can be an effective way to plan for the future. To help you create a sound strategy based on your personal goals and risk tolerance, Wells Fargo Funds offers more than 100 mutual funds spanning a wide range of asset classes and investment styles. Although diversification cannot guarantee an investment profit or prevent losses, we believe it can be an effective way to manage investment risk and potentially smooth out overall portfolio performance. We encourage investors to know their investments and to understand that appropriate levels of risk-taking may unlock opportunities.
Thank you for choosing to invest with Wells Fargo Funds. We appreciate your confidence in us and remain committed to helping you meet your financial needs.
Sincerely,

Andrew Owen
President
Wells Fargo Funds
“The global spread of the coronavirus led many countries to clamp down on social and business-related activity in order to contain the virus from causing even greater devastation and overwhelming the health care system.”
|
|
|
For further information about your Fund, contact your investment professional, visit our website at wfam.com, or call us directly at1-800-222-8222. |
Wells Fargo Diversified International Fund | 3
Performance highlights (unaudited)
Investment objective
The Fund seeks long-term capital appreciation.
Manager
Wells Fargo Funds Management, LLC
Subadvisers
Artisan Partners Limited Partnership
LSV Asset Management
Wells Capital Management Incorporated
Portfolio managers
Josef Lakonishok, Ph.D.
Venkateshwar (Venk) Lal
Puneet Mansharamani, CFA®‡
Menno Vermeulen, CFA®‡
Dale A. Winner, CFA®‡
Mark L. Yockey, CFA®‡
Average annual total returns (%) as of April 30, 2020
| | | | | | | | | | | | | | | | | | | | | | | | | | | | | | | | | | |
| | | | |
| | | | | Including sales charge | | | Excluding sales charge | | | Expense ratios1 (%) | |
| | | | | | | | | |
| | | Inception date | | 1 year | | | 5 year | | | 10 year | | | 1 year | | | 5 year | | | 10 year | | | Gross | | | Net2 | |
| | | | | | | | | | |
| Class A (SILAX) | | 9-24-1997 | | | -19.44 | | | | -2.92 | | | | 2.61 | | | | -14.51 | | | | -1.78 | | | | 3.22 | | | | 1.77 | | | | 1.35 | |
| | | | | | | | | | |
| Class C (WFECX) | | 4-1-1998 | | | -16.09 | | | | -2.50 | | | | 2.45 | | | | -15.09 | | | | -2.50 | | | | 2.45 | | | | 2.52 | | | | 2.10 | |
| | | | | | | | | | |
| Class R6 (WDIRX)3 | | 9-30-2015 | | | – | | | | – | | | | – | | | | -14.11 | | | | -1.36 | | | | 3.53 | | | | 1.34 | | | | 0.89 | |
| | | | | | | | | | |
| Administrator Class (WFIEX) | | 11-8-1999 | | | – | | | | – | | | | – | | | | -14.41 | | | | -1.68 | | | | 3.36 | | | | 1.69 | | | | 1.25 | |
| | | | | | | | | | |
| Institutional Class (WFISX) | | 8-31-2006 | | | – | | | | – | | | | – | | | | -14.20 | | | | -1.41 | | | | 3.59 | | | | 1.44 | | | | 0.99 | |
| | | | | | | | | | |
| MSCI EAFE Index (Net)4 | | – | | | – | | | | – | | | | – | | | | -11.34 | | | | -0.17 | | | | 3.55 | | | | – | | | | – | |
Figures quoted represent past performance, which is no guarantee of future results, and do not reflect taxes that a shareholder may pay on an investment in a fund. Investment return and principal value of an investment will fluctuate so that an investor’s shares, when redeemed, may be worth more or less than their original cost. Performance shown without sales charges would be lower if sales charges were reflected. Current performance may be lower or higher than the performance data quoted, which assumes the reinvestment of dividends and capital gains. Currentmonth-end performance is available on the Fund’s website,wfam.com.
Index returns do not include transaction costs associated with buying and selling securities, any mutual fund fees or expenses, or any taxes. It is not possible to invest directly in an index.
For Class A shares, the maximumfront-end sales charge is 5.75%. For Class C shares, the maximum contingent deferred sales charge is 1.00%. Performance including a contingent deferred sales charge assumes the sales charge for the corresponding time period. Class R6, Administrator Class, and Institutional Class shares are sold without afront-end sales charge or contingent deferred sales charge.
Stock values fluctuate in response to the activities of individual companies and general market and economic conditions. Foreign investments are especially volatile and can rise or fall dramatically due to differences in the political and economic conditions of the host country. These risks are generally intensified in emerging markets. The use of derivatives may reduce returns and/or increase volatility. Certain investment strategies tend to increase the total risk of an investment (relative to the broader market). The Fund is exposed to smaller-company securities risk. Consult the Fund’s prospectus for additional information on these and other risks.
Please see footnotes on page 5.
4 | Wells Fargo Diversified International Fund
Performance highlights (unaudited)
| | | | |
|
| Ten largest holdings (%) as of April 30, 20205 | |
| | |
Deutsche Boerse AG | | | 2.20 | |
| | |
Sanofi SA | | | 2.03 | |
| | |
Linde plc | | | 2.02 | |
| | |
Roche Holding AG | | | 1.98 | |
| | |
Novartis AG | | | 1.61 | |
| | |
Muenchener Rueckversicherungs Gesellschaft AG | | | 1.45 | |
| | |
Check Point Software Technologies Limited | | | 1.45 | |
| | |
Air Liquide SA | | | 1.42 | |
| | |
Nestle SA | | | 1.41 | |
| | |
Takeda Pharmaceutical Company Limited | | | 1.37 | |
| | |
|
| Sector allocation as of April 30, 20206 |
|
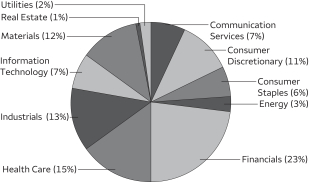 |
| | |
|
| Country allocation as of April 30, 20206 |
|
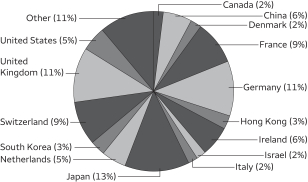 |
| ‡ | CFA® and Chartered Financial Analyst®are trademarks owned by CFA Institute. |
| 1 | Reflects the expense ratios as stated in the most recent prospectuses. The expense ratios shown are subject to change and may differ from the annualized expense ratios shown in the financial highlights of this report. |
| 2 | The manager has contractually committed through February 28, 2021, to waive fees and/or reimburse expenses to the extent necessary to cap total annual fund operating expenses after fee waivers at 1.35% for Class A, 2.10% for Class C, 0.89% for Class R6, 1.25% for Administrator Class, and 0.99% for Institutional Class. Brokerage commissions, stamp duty fees, interest, taxes, acquired fund fees and expenses (if any), and extraordinary expenses are excluded from the expense cap. Prior to or after the commitment expiration date, the cap may be increased or the commitment to maintain the cap may be terminated only with the approval of the Board of Trustees. Without this cap, the Fund’s returns would have been lower. The expense ratio paid by an investor is the net expense ratio (the total annual fund operating expenses after fee waivers) as stated in the prospectuses. |
| 3 | Historical performance shown for Class R6 shares prior to their inception reflects the performance of the Administrator Class shares, and includes the higher expenses applicable to the Administrator Class shares. If these expenses had not been included, returns for the Class R6 shares would be higher. |
| 4 | The Morgan Stanley Capital International (MSCI) Europe, Australasia, Far East (EAFE) Index (Net) is a free-float-adjusted market capitalization-weighted index that is designed to measure the equity market performance of developed markets, excluding the United States and Canada. Source: MSCI. MSCI makes no express or implied warranties or representations and shall have no liability whatsoever with respect to any MSCI data contained herein. The MSCI data may not be further redistributed or used as a basis for other indexes or any securities or financial products. This report is not approved, reviewed, or produced by MSCI. You cannot invest directly in an index. |
| 5 | The ten largest holdings, excluding cash, cash equivalents and any money market funds, are calculated based on the value of the investments divided by total net assets of the Fund. Holdings are subject to change and may have changed since the date specified. |
| 6 | Amounts are calculated based on the total long-term investments of the Fund. These amounts are subject to change and may have changed since the date specified. |
Wells Fargo Diversified International Fund | 5
Fund expenses (unaudited)
As a shareholder of the Fund, you incur two types of costs: (1) transaction costs, including sales charges (loads) on purchase payments and contingent deferred sales charges (if any) on redemptions and (2) ongoing costs, including management fees, distribution(12b-1) and/or shareholder servicing fees, and other Fund expenses. This example is intended to help you understand your ongoing costs (in dollars) of investing in the Fund and to compare these costs with the ongoing costs of investing in other mutual funds.
The example is based on an investment of $1,000 invested at the beginning of thesix-month period and held for the entire period from November 1, 2019 to April 30, 2020.
Actual expenses
The “Actual” line of the table below provides information about actual account values and actual expenses. You may use the information in this line, together with the amount you invested, to estimate the expenses that you paid over the period. Simply divide your account value by $1,000 (for example, an $8,600 account value divided by $1,000 = 8.6), then multiply the result by the number in the “Actual” line under the heading entitled “Expenses paid during period” for your applicable class of shares to estimate the expenses you paid on your account during this period.
Hypothetical example for comparison purposes
The “Hypothetical” line of the table below provides information about hypothetical account values and hypothetical expenses based on the Fund’s actual expense ratio and an assumed rate of return of 5% per year before expenses, which is not the Fund’s actual return. The hypothetical account values and expenses may not be used to estimate the actual ending account balance or expenses you paid for the period. You may use this information to compare the ongoing costs of investing in the Fund and other funds. To do so, compare this 5% hypothetical example with the 5% hypothetical examples that appear in the shareholder reports of the other funds.
Please note that the expenses shown in the table are meant to highlight your ongoing costs only and do not reflect any transactional costs, such as sales charges (loads) and contingent deferred sales charges. Therefore, the “Hypothetical” line of the table is useful in comparing ongoing costs only and will not help you determine the relative total costs of owning different funds. In addition, if these transactional costs were included, your costs would have been higher.
| | | | | | | | | | | | | | | | |
| | | Beginning
account value
11-1-2019 | | | Ending
account value
4-30-2020 | | | Expenses
paid during
the period¹ | | | Annualized net
expense ratio | |
| | | | | |
Class A | | | | | | | | | | | | | | | | |
| | | | |
Actual | | $ | 1,000.00 | | | $ | 831.09 | | | $ | 5.96 | | | | 1.31 | % |
| | | | |
Hypothetical (5% return before expenses) | | $ | 1,000.00 | | | $ | 1,018.35 | | | $ | 6.57 | | | | 1.31 | % |
| | | | | |
Class C | | | | | | | | | | | | | | | | |
| | | | |
Actual | | $ | 1,000.00 | | | $ | 828.39 | | | $ | 9.55 | | | | 2.10 | % |
| | | | |
Hypothetical (5% return before expenses) | | $ | 1,000.00 | | | $ | 1,014.42 | | | $ | 10.52 | | | | 2.10 | % |
| | | | | |
Class R6 | | | | | | | | | | | | | | | | |
| | | | |
Actual | | $ | 1,000.00 | | | $ | 832.40 | | | $ | 4.05 | | | | 0.89 | % |
| | | | |
Hypothetical (5% return before expenses) | | $ | 1,000.00 | | | $ | 1,020.44 | | | $ | 4.47 | | | | 0.89 | % |
| | | | | |
Administrator Class | | | | | | | | | | | | | | | | |
| | | | |
Actual | | $ | 1,000.00 | | | $ | 831.26 | | | $ | 5.69 | | | | 1.25 | % |
| | | | |
Hypothetical (5% return before expenses) | | $ | 1,000.00 | | | $ | 1,018.65 | | | $ | 6.27 | | | | 1.25 | % |
| | | | | |
Institutional Class | | | | | | | | | | | | | | | | |
| | | | |
Actual | | $ | 1,000.00 | | | $ | 832.19 | | | $ | 4.51 | | | | 0.99 | % |
| | | | |
Hypothetical (5% return before expenses) | | $ | 1,000.00 | | | $ | 1,019.94 | | | $ | 4.97 | | | | 0.99 | % |
| 1 | Expenses paid is equal to the annualized net expense ratio of each class multiplied by the average account value over the period, multiplied by the number of days in the most recent fiscal half-year divided by the number of days in the fiscal year (to reflect theone-half-year period). |
6 | Wells Fargo Diversified International Fund
Portfolio of investments—April 30, 2020 (unaudited)
| | | | | | | | | | | | | | | | |
| | | | | | | | | Shares | | | Value | |
| Common Stocks: 94.56% | |
|
| Australia: 1.29% | |
AGL Energy Limited (Utilities, Multi-Utilities) | | | | | | | | | | | 8,500 | | | $ | 93,288 | |
Beach Petroleum Limited (Energy, Oil, Gas & Consumable Fuels) | | | | | | | | | | | 85,000 | | | | 82,854 | |
Fortescue Metals Group Limited (Materials, Metals & Mining) | | | | | | | | | | | 21,200 | | | | 162,016 | |
Harvey Norman Holdings Limited (Consumer Discretionary, Multiline Retail) | | | | | | | | | | | 34,882 | | | | 62,586 | |
Lendlease Corporation Limited (Real Estate, Real Estate Management & Development) | | | | | | | | | | | 6,000 | | | | 47,795 | |
Metcash Limited (Consumer Staples, Food & Staples Retailing) | | | | | | | | | | | 28,500 | | | | 45,969 | |
Mineral Resources Limited (Materials, Metals & Mining) | | | | | | | | | | | 2,800 | | | | 30,178 | |
Qantas Airways Limited (Industrials, Airlines) | | | | | | | | | | | 160,412 | | | | 398,409 | |
Rio Tinto Limited (Materials, Metals & Mining) | | | | | | | | | | | 1,800 | | | | 101,450 | |
| | | | |
| | | | | | | | | | | | | | | 1,024,545 | |
| | | | | | | | | | | | | | | | |
|
| Austria: 0.20% | |
OMV AG (Energy, Oil, Gas & Consumable Fuels) | | | | | | | | | | | 4,800 | | | | 156,729 | |
| | | | | | | | | | | | | | | | |
|
| Brazil: 0.23% | |
Banco de Brasil SA (Financials, Banks) | | | | | | | | | | | 10,900 | | | | 57,127 | |
Companhia de Saneamento de Minas Gerais SA (Utilities, Water Utilities) | | | | | | | | | | | 5,300 | | | | 46,783 | |
JBS SA (Consumer Staples, Food Products) | | | | | | | | | | | 18,600 | | | | 81,543 | |
| | | | |
| | | | | | | | | | | | | | | 185,453 | |
| | | | | | | | | | | | | | | | |
|
| Canada: 2.15% | |
GFL Environmental Incorporated (Industrials, Commercial Services & Supplies) | | | | | | | | | | | 5,257 | | | | 90,946 | |
Home Capital Group Incorporated (Financials, Thrifts & Mortgage Finance) † | | | | | | | | | | | 18,300 | | | | 244,929 | |
Loblaw Companies Limited (Consumer Staples, Food & Staples Retailing) | | | | | | | | | | | 3,800 | | | | 187,004 | |
Lundin Mining Corporation (Materials, Metals & Mining) | | | | | | | | | | | 122,708 | | | | 601,220 | |
Magna International Incorporated (Consumer Discretionary, Auto Components) | | | | | | | | | | | 7,300 | | | | 284,458 | |
TMX Group Limited (Financials, Capital Markets) | | | | | | | | | | | 3,500 | | | | 303,219 | |
| | | | |
| | | | | | | | | | | | | | | 1,711,776 | |
| | | | | | | | | | | | | | | | |
|
| China: 5.41% | |
Alibaba Group Holding Limited ADR (Consumer Discretionary, Internet & Direct Marketing Retail) † | | | | | | | | | | | 5,385 | | | | 1,091,378 | |
China Mobile Limited (Communication Services, Wireless Telecommunication Services) | | | | | | | | | | | 68,000 | | | | 546,656 | |
China Petroleum & Chemical Corporation H Shares (Energy, Oil, Gas & Consumable Fuels) | | | | | | | | | | | 218,000 | | | | 108,654 | |
China Railway Construction Corporation Limited H Shares (Industrials, Construction & Engineering) | | | | | | | | | | | 117,500 | | | | 129,016 | |
China Resources Cement Holdings Limited (Materials, Construction Materials) | | | | | | | | | | | 168,000 | | | | 228,598 | |
China Telecom Corporation Limited H Shares (Communication Services, Diversified Telecommunication Services) | | | | | | | | | | | 238,000 | | | | 82,205 | |
Dongfeng Motor Group Company Limited H Shares (Consumer Discretionary, Automobiles) | | | | | | | | | | | 106,000 | | | | 70,306 | |
Midea Group Company Limited Class A (Consumer Discretionary, Household Durables) | | | | | | | | | | | 106,300 | | | | 796,551 | |
PICC Property & Casualty Company Limited H Shares (Financials, Insurance) | | | | | | | | | | | 103,500 | | | | 99,044 | |
Shanghai Pharmaceuticals Holding Company Limited H Shares (Health Care, Health Care Providers & Services) | | | | | | | | | | | 221,200 | | | | 389,357 | |
Tencent Holdings Limited (Communication Services, Interactive Media & Services) | | | | | | | | | | | 8,400 | | | | 441,583 | |
WH Group Limited (Consumer Staples, Food Products) 144A | | | | | | | | | | | 135,500 | | | | 129,233 | |
Wynn Macau Limited (Consumer Discretionary, Hotels, Restaurants & Leisure) | | | | | | | | | | | 92,000 | | | | 158,872 | |
Yantai Changyu Pioneer Wine Company Limited Class B (Consumer Staples, Beverages) | | | | | | | | | | | 23,400 | | | | 40,992 | |
| | | | |
| | | | | | | | | | | | | | | 4,312,445 | |
| | | | | | | | | | | | | | | | |
|
| Denmark: 1.62% | |
Ascendis Pharma AS ADR (Health Care, Biotechnology) † | | | | | | | | | | | 480 | | | | 65,150 | |
Danske Bank AS (Financials, Banks) † | | | | | | | | | | | 9,300 | | | | 110,420 | |
DSV Panalpina AS (Industrials, Air Freight & Logistics) | | | | | | | | | | | 490 | | | | 50,911 | |
Genmab AS (Health Care, Biotechnology) † | | | | | | | | | | | 3,172 | | | | 762,500 | |
The accompanying notes are an integral part of these financial statements.
Wells Fargo Diversified International Fund | 7
Portfolio of investments—April 30, 2020 (unaudited)
| | | | | | | | | | | | | | | | |
| | | | | | | | | Shares | | | Value | |
|
| Denmark (continued) | |
Novo Nordisk AS Class B (Health Care, Pharmaceuticals) | | | | | | | | | | | 3,676 | | | $ | 234,492 | |
Sydbank AS (Financials, Banks) † | | | | | | | | | | | 4,000 | | | | 66,093 | |
| | | | |
| | | | | | | | | | | | | | | 1,289,566 | |
| | | | | | | | | | | | | | | | |
|
| Finland: 0.12% | |
Nordea Bank AB (Financials, Banks) † | | | | | | | | | | | 15,000 | | | | 96,209 | |
| | | | | | | | | | | | | | | | |
|
| France: 8.29% | |
Air Liquide SA (Materials, Chemicals) | | | | | | | | | | | 8,927 | | | | 1,134,213 | |
Amundi SA (Financials, Capital Markets) 144A | | | | | | | | | | | 5,068 | | | | 336,384 | |
Arkema SA (Materials, Chemicals) | | | | | | | | | | | 910 | | | | 75,742 | |
AXA SA (Financials, Insurance) | | | | | | | | | | | 9,200 | | | | 163,544 | |
BNP Paribas SA (Financials, Banks) | | | | | | | | | | | 4,400 | | | | 138,232 | |
Compagnie de Saint-Gobain SA (Industrials, Building Products) | | | | | | | | | | | 16,705 | | | | 444,485 | |
Compagnie Generale des Etablissements Michelin SA (Consumer Discretionary, Auto Components) | | | | | | | | | | | 2,200 | | | | 212,566 | |
Credit Agricole SA (Financials, Banks) | | | | | | | | | | | 13,900 | | | | 111,804 | |
Eiffage SA (Industrials, Construction & Engineering) | | | | | | | | | | | 3,564 | | | | 291,256 | |
Engie SA (Utilities, Multi-Utilities) | | | | | | | | | | | 13,300 | | | | 144,299 | |
Natixis SA (Financials, Capital Markets) | | | | | | | | | | | 27,500 | | | | 64,921 | |
Orange SA (Communication Services, Diversified Telecommunication Services) | | | | | | | | | | | 76,277 | | | | 926,692 | |
Renault SA (Consumer Discretionary, Automobiles) | | | | | | | | | | | 3,100 | | | | 61,084 | |
Safran SA (Industrials, Aerospace & Defense) | | | | | | | | | | | 1,748 | | | | 162,513 | |
Sanofi SA (Health Care, Pharmaceuticals) | | | | | | | | | | | 16,535 | | | | 1,615,035 | |
Societe Generale SA (Financials, Banks) | | | | | | | | | | | 3,700 | | | | 58,049 | |
Total SA (Energy, Oil, Gas & Consumable Fuels) | | | | | | | | | | | 9,700 | | | | 344,276 | |
Vinci SA (Industrials, Construction & Engineering) | | | | | | | | | | | 3,896 | | | | 319,168 | |
| | | | |
| | | | | | | | | | | | | | | 6,604,263 | |
| | | | | | | | | | | | | | | | |
|
| Germany: 10.37% | |
Allianz AG (Financials, Insurance) | | | | | | | | | | | 5,501 | | | | 1,012,356 | |
Aurubis AG (Materials, Metals & Mining) | | | | | | | | | | | 1,600 | | | | 82,945 | |
Bayer AG (Health Care, Pharmaceuticals) | | | | | | | | | | | 1,900 | | | | 124,962 | |
Bayerische Motoren Werke AG (Consumer Discretionary, Automobiles) | | | | | | | | | | | 2,200 | | | | 129,415 | |
Covestro AG (Materials, Chemicals) 144A | | | | | | | | | | | 2,700 | | | | 90,696 | |
Daimler AG (Consumer Discretionary, Automobiles) | | | | | | | | | | | 5,300 | | | | 181,276 | |
Deutsche Boerse AG (Financials, Capital Markets) | | | | | | | | | | | 11,289 | | | | 1,750,229 | |
Deutsche Post AG (Industrials, Air Freight & Logistics) | | | | | | | | | | | 25,452 | | | | 756,108 | |
Deutsche Telekom AG (Communication Services, Diversified Telecommunication Services) † | | | | | | | | | | | 34,405 | | | | 502,988 | |
E.ON SE (Utilities, Multi-Utilities) | | | | | | | | | | | 17,739 | | | | 177,696 | |
Metro AG (Consumer Staples, Food & Staples Retailing) | | | | | | | | | | | 19,352 | | | | 169,084 | |
Muenchener Rueckversicherungs Gesellschaft AG (Financials, Insurance) | | | | | | | | | | | 5,263 | | | | 1,152,724 | |
Rheinmetall AG (Industrials, Industrial Conglomerates) | | | | | | | | | | | 1,624 | | | | 109,911 | |
SAP SE (Information Technology, Software) | | | | | | | | | | | 4,910 | | | | 584,816 | |
Siemens AG (Industrials, Industrial Conglomerates) | | | | | | | | | | | 4,770 | | | | 440,190 | |
Symrise AG (Materials, Chemicals) | | | | | | | | | | | 2,310 | | | | 234,025 | |
Volkswagen AG (Consumer Discretionary, Automobiles) | | | | | | | | | | | 1,600 | | | | 236,550 | |
Wirecard AG (Information Technology, IT Services) | | | | | | | | | | | 5,369 | | | | 531,303 | |
| | | | |
| | | | | | | | | | | | | | | 8,267,274 | |
| | | | | | | | | | | | | | | | |
|
| Hong Kong: 3.24% | |
AIA Group Limited (Financials, Insurance) | | | | | | | | | | | 108,800 | | | | 998,541 | |
CK Hutchison Holdings Limited (Industrials, Industrial Conglomerates) | | | | | | | | | | | 22,300 | | | | 165,291 | |
Kingboard Laminates Holdings Limited (Information Technology, Electronic Equipment, Instruments & Components) | | | | | | | | | | | 129,500 | | | | 125,330 | |
Nine Dragons Paper Holdings Limited (Materials, Paper & Forest Products) | | | | | | | | | | | 104,000 | | | | 99,499 | |
Sinotruk Hong Kong Limited (Industrials, Machinery) | | | | | | | | | | | 59,500 | | | | 120,639 | |
The accompanying notes are an integral part of these financial statements.
8 | Wells Fargo Diversified International Fund
Portfolio of investments—April 30, 2020 (unaudited)
| | | | | | | | | | | | | | | | |
| | | | | | | | | Shares | | | Value | |
|
| Hong Kong (continued) | |
Skyworth Digital Holdings Limited (Consumer Discretionary, Household Durables) | | | | | | | | | | | 320,000 | | | $ | 73,505 | |
Xinyi Glass Holdings Limited (Consumer Discretionary, Auto Components) | | | | | | | | | | | 802,000 | | | | 928,841 | |
Yue Yuen Industrial Holdings Limited (Consumer Discretionary, Textiles, Apparel & Luxury Goods) | | | | | | | | | | | 42,000 | | | | 66,997 | |
| | | | |
| | | | | | | | | | | | | | | 2,578,643 | |
| | | | | | | | | | | | | | | | |
|
| Hungary: 0.09% | |
Richter Gedeon (Health Care, Pharmaceuticals) | | | | | | | | | | | 3,500 | | | | 74,791 | |
| | | | | | | | | | | | | | | | |
|
| India: 0.54% | |
Housing Development Finance Corporation Limited (Financials, Thrifts & Mortgage Finance) | | | | | | | | | | | 17,032 | | | | 430,821 | |
| | | | | | | | | | | | | | | | |
|
| Ireland: 5.83% | |
Aon plc (Financials, Insurance) | | | | | | | | | | | 5,447 | | | | 940,533 | |
C&C Group plc (Consumer Staples, Beverages) | | | | | | | | | | | 12,300 | | | | 30,209 | |
Greencore Group plc (Consumer Staples, Food Products) | | | | | | | | | | | 303,427 | | | | 694,929 | |
Linde plc (Materials, Chemicals) | | | | | | | | | | | 8,739 | | | | 1,611,501 | |
Medtronic plc (Health Care, Health Care Equipment & Supplies) | | | | | | | | | | | 7,098 | | | | 692,978 | |
Smurfit Kappa Group plc (Materials, Containers & Packaging) | | | | | | | | | | | 4,300 | | | | 134,703 | |
Willis Towers Watson plc (Financials, Insurance) | | | | | | | | | | | 3,056 | | | | 544,854 | |
| | | | |
| | | | | | | | | | | | | | | 4,649,707 | |
| | | | | | | | | | | | | | | | |
|
| Israel: 1.93% | |
Check Point Software Technologies Limited (Information Technology, Software) † | | | | | | | | | | | 10,901 | | | | 1,152,672 | |
Nice Systems Limited ADR (Information Technology, Software) † | | | | | | | | | | | 2,351 | | | | 386,269 | |
| | | | |
| | | | | | | | | | | | | | | 1,538,941 | |
| | | | | | | | | | | | | | | | |
|
| Italy: 2.35% | |
A2A SpA (Utilities, Multi-Utilities) | | | | | | | | | | | 104,600 | | | | 142,591 | |
Assicurazioni Generali SpA (Financials, Insurance) | | | | | | | | | | | 26,218 | | | | 374,043 | |
Enel SpA (Utilities, Electric Utilities) | | | | | | | | | | | 59,200 | | | | 404,362 | |
Intesa Sanpaolo SpA (Financials, Banks) | | | | | | | | | | | 33,748 | | | | 52,698 | |
Leonardo SpA (Industrials, Aerospace & Defense) | | | | | | | | | | | 9,300 | | | | 64,227 | |
Mediobanca SpA (Financials, Banks) | | | | | | | | | | | 23,400 | | | | 136,036 | |
Prysmian SpA (Industrials, Electrical Equipment) | | | | | | | | | | | 34,538 | | | | 651,663 | |
UniCredit SpA (Financials, Banks) | | | | | | | | | | | 6,030 | | | | 46,568 | |
| | | | |
| | | | | | | | | | | | | | | 1,872,188 | |
| | | | | | | | | | | | | | | | |
|
| Japan: 12.73% | |
Adeka Corporation (Materials, Chemicals) | | | | | | | | | | | 13,000 | | | | 163,243 | |
Alps Electric Company Limited (Information Technology, Electronic Equipment, Instruments & Components) | | | | | | | | | | | 25,600 | | | | 264,047 | |
Asahi Glass Company Limited (Industrials, Building Products) | | | | | | | | | | | 4,900 | | | | 120,835 | |
Astellas Pharma Incorporated (Health Care, Pharmaceuticals) | | | | | | | | | | | 14,200 | | | | 234,856 | |
Daiwa House Industry Company Limited (Real Estate, Real Estate Management & Development) | | | | | | | | | | | 3,900 | | | | 98,827 | |
Daiwa Securities Group Incorporated (Financials, Capital Markets) | | | | | | | | | | | 155,500 | | | | 646,636 | |
Denka Company Limited (Materials, Chemicals) | | | | | | | | | | | 6,300 | | | | 152,207 | |
DIC Incorporated (Materials, Chemicals) | | | | | | | | | | | 5,300 | | | | 123,079 | |
Hitachi Limited (Information Technology, Electronic Equipment, Instruments & Components) | | | | | | | | | | | 22,000 | | | | 652,947 | |
Honda Motor Company Limited (Consumer Discretionary, Automobiles) | | | | | | | | | | | 5,400 | | | | 131,134 | |
Isuzu Motors Limited (Consumer Discretionary, Automobiles) | | | | | | | | | | | 16,500 | | | | 125,393 | |
Itochu Corporation (Industrials, Trading Companies & Distributors) | | | | | | | | | | | 14,600 | | | | 286,235 | |
Japan Airlines Company Limited (Industrials, Airlines) | | | | | | | | | | | 6,300 | | | | 112,378 | |
Kaken Pharmaceutical Company Limited (Health Care, Pharmaceuticals) | | | | | | | | | | | 700 | | | | 38,529 | |
KDDI Corporation (Communication Services, Wireless Telecommunication Services) | | | | | | | | | | | 20,000 | | | | 579,285 | |
Komatsu Limited (Industrials, Machinery) | | | | | | | | | | | 9,600 | | | | 181,641 | |
Marubeni Corporation (Industrials, Trading Companies & Distributors) | | | | | | | | | | | 30,300 | | | | 145,920 | |
The accompanying notes are an integral part of these financial statements.
Wells Fargo Diversified International Fund | 9
Portfolio of investments—April 30, 2020 (unaudited)
| | | | | | | | | | | | | | | | |
| | | | | | | | | Shares | | | Value | |
|
| Japan (continued) | |
Mazda Motor Corporation (Consumer Discretionary, Automobiles) | | | | | | | | | | | 12,000 | | | $ | 67,840 | |
Mitsubishi Gas Chemical Company Incorporated (Materials, Chemicals) | | | | | | | | | | | 6,100 | | | | 74,730 | |
Mitsubishi UFJ Financial Group Incorporated (Financials, Banks) | | | | | | | | | | | 197,100 | | | | 796,284 | |
Mitsubishi UFJ Lease & Finance Company Limited (Financials, Diversified Financial Services) | | | | | | | | | | | 37,300 | | | | 178,109 | |
Mitsui Chemicals Incorporated (Materials, Chemicals) | | | | | | | | | | | 9,500 | | | | 186,514 | |
Mizuho Financial Group Incorporated (Financials, Banks) | | | | | | | | | | | 171,600 | | | | 199,814 | |
Nippon Shinyaku Company Limited (Health Care, Pharmaceuticals) | | | | | | | | | | | 7,600 | | | | 533,700 | |
Nippon Telegraph & Telephone Corporation (Communication Services, Diversified Telecommunication Services) | | | | | | | | | | | 25,000 | | | | 569,341 | |
Nomura Holdings Incorporated (Financials, Capital Markets) | | | | | | | | | | | 31,200 | | | | 129,468 | |
ORIX Corporation (Financials, Diversified Financial Services) | | | | | | | | | | | 16,500 | | | | 194,164 | |
Resona Holdings Incorporated (Financials, Banks) | | | | | | | | | | | 62,600 | | | | 195,502 | |
Sawai Pharmaceutical Company Limited (Health Care, Pharmaceuticals) | | | | | | | | | | | 2,100 | | | | 114,669 | |
Sojitz Corporation (Industrials, Trading Companies & Distributors) | | | | | | | | | | | 77,400 | | | | 179,130 | |
Sompo Holdings Incorporated NKSJ Holdings Incorporated (Financials, Insurance) | | | | | | | | | | | 3,200 | | | | 103,794 | |
Sony Corporation (Consumer Discretionary, Household Durables) | | | | | | | | | | | 3,800 | | | | 244,545 | |
Sumitomo Corporation (Industrials, Trading Companies & Distributors) | | | | | | | | | | | 9,400 | | | | 106,335 | |
Sumitomo Heavy Industries Limited (Industrials, Machinery) | | | | | | | | | | | 6,000 | | | | 126,445 | |
Sumitomo Mitsui Financial Group Incorporated (Financials, Banks) | | | | | | | | | | | 8,000 | | | | 210,378 | |
Taiyo Nippon Sanso Corporation (Materials, Chemicals) | | | | | | | | | | | 20,900 | | | | 324,174 | |
Takeda Pharmaceutical Company Limited (Health Care, Pharmaceuticals) | | | | | | | | | | | 30,300 | | | | 1,092,662 | |
Teijin Limited (Materials, Chemicals) | | | | | | | | | | | 5,700 | | | | 90,902 | |
The Yokohama Rubber Company Limited (Consumer Discretionary, Auto Components) | | | | | | | | | | | 7,600 | | | | 96,664 | |
Toyo Ink SC Holding Company Limited (Materials, Chemicals) | | | | | | | | | | | 7,360 | | | | 139,990 | |
UBE Industries Limited (Materials, Chemicals) | | | | | | | | | | | 7,900 | | | | 132,478 | |
| | | | |
| | | | | | | | | | | | | | | 10,144,824 | |
| | | | | | | | | | | | | | | | |
|
| Malaysia: 0.08% | |
CIMB Group Holdings Bhd (Financials, Banks) | | | | | | | | | | | 82,753 | | | | 66,168 | |
| | | | | | | | | | | | | | | | |
|
| Netherlands: 4.72% | |
Aegon NV (Financials, Insurance) | | | | | | | | | | | 23,200 | | | | 60,010 | |
Airbus SE (Industrials, Aerospace & Defense) | | | | | | | | | | | 8,855 | | | | 560,685 | |
ING Groep NV (Financials, Banks) | | | | | | | | | | | 24,351 | | | | 136,433 | |
Koninklijke Ahold Delhaize NV (Consumer Staples, Food & Staples Retailing) | | | | | | | | | | | 14,600 | | | | 354,493 | |
Koninklijke DSM NV (Materials, Chemicals) | | | | | | | | | | | 3,629 | | | | 444,777 | |
Koninklijke Philips NV (Health Care, Health Care Equipment & Supplies) | | | | | | | | | | | 21,494 | | | | 936,977 | |
NN Group NV (Financials, Insurance) | | | | | | | | | | | 28,591 | | | | 827,068 | |
OCI NV (Materials, Chemicals) † | | | | | | | | | | | 36,906 | | | | 445,655 | |
| | | | |
| | | | | | | | | | | | | | | 3,766,098 | |
| | | | | | | | | | | | | | | | |
|
| Norway: 0.93% | |
Den Norske Bank ASA (Financials, Banks) | | | | | | | | | | | 61,255 | | | | 741,670 | |
| | | | | | | | | | | | | | | | |
|
| Portugal: 0.28% | |
Energias de Portugal SA (Utilities, Electric Utilities) | | | | | | | | | | | 53,339 | | | | 224,764 | |
| | | | | | | | | | | | | | | | |
|
| Russia: 1.16% | |
Gazprom Neft ADR (Energy, Oil, Gas & Consumable Fuels) | | | | | | | | | | | 5,900 | | | | 131,759 | |
LUKOIL PJSC ADR (Energy, Oil, Gas & Consumable Fuels) | | | | | | | | | | | 4,200 | | | | 271,194 | |
Mobile TeleSystems PJSC ADR (Communication Services, Wireless Telecommunication Services) | | | | | | | | | | | 61,278 | | | | 525,152 | |
| | | | |
| | | | | | | | | | | | | | | 928,105 | |
| | | | | | | | | | | | | | | | |
|
| Singapore: 1.10% | |
DBS Group Holdings Limited (Financials, Banks) | | | | | | | | | | | 6,400 | | | | 90,106 | |
Keppel Corporation Limited (Industrials, Industrial Conglomerates) | | | | | | | | | | | 150,100 | | | | 633,681 | |
The accompanying notes are an integral part of these financial statements.
10 | Wells Fargo Diversified International Fund
Portfolio of investments—April 30, 2020 (unaudited)
| | | | | | | | | | | | | | | | |
| | | | | | | | | Shares | | | Value | |
|
| Singapore (continued) | |
United Overseas Bank Limited (Financials, Banks) | | | | | | | | | | | 10,700 | | | $ | 152,893 | |
| | | | |
| | | | | | | | | | | | | | | 876,680 | |
| | | | | | | | | | | | | | | | |
|
| South Africa: 0.14% | |
Absa Group Limited (Financials, Banks) | | | | | | | | | | | 12,600 | | | | 62,183 | |
Imperial Holdings Limited (Consumer Discretionary, Distributors) | | | | | | | | | | | 5,500 | | | | 9,672 | |
Motus Holdings Limited (Consumer Discretionary, Specialty Retail) | | | | | | | | | | | 5,500 | | | | 8,958 | |
Old Mutual Limited (Financials, Insurance) | | | | | | | | | | | 48,591 | | | | 34,608 | |
| | | | |
| | | | | | | | | | | | | | | 115,421 | |
| | | | | | | | | | | | | | | | |
|
| South Korea: 3.26% | |
BNK Financial Group Incorporated (Financials, Banks) | | | | | | | | | | | 1,018 | | | | 4,234 | |
Hana Financial Group Incorporated (Financials, Banks) | | | | | | | | | | | 18,752 | | | | 428,071 | |
Hyundai Greenfood Company Limited (Consumer Staples, Food & Staples Retailing) | | | | | | | | | | | 14,600 | | | | 97,897 | |
Industrial Bank of Korea (Financials, Banks) | | | | | | | | | | | 16,600 | | | | 108,139 | |
JB Financial Group Company Limited (Financials, Banks) | | | | | | | | | | | 1,964 | | | | 7,823 | |
KT&G Corporation (Consumer Staples, Tobacco) | | | | | | | | | | | 2,300 | | | | 153,565 | |
LG Uplus Corporation (Communication Services, Diversified Telecommunication Services) | | | | | | | | | | | 9,600 | | | | 105,418 | |
Samsung Electronics Company Limited GDR (Information Technology, Technology Hardware, Storage & Peripherals) 144A | | | | | | | | | | | 666 | | | | 692,062 | |
SK Telecom Company Limited (Communication Services, Wireless Telecommunication Services) | | | | | | | | | | | 5,379 | | | | 934,890 | |
Woori Financial Group Incorporated (Financials, Banks) | | | | | | | | | | | 9,800 | | | | 67,869 | |
| | | | |
| | | | | | | | | | | | | | | 2,599,968 | |
| | | | | | | | | | | | | | | | |
|
| Spain: 0.59% | |
Banco Santander Central Hispano SA (Financials, Banks) | | | | | | | | | | | 29,500 | | | | 65,914 | |
Enagás SA (Utilities, Gas Utilities) | | | | | | | | | | | 1,900 | | | | 44,349 | |
Faes Farma SA (Health Care, Pharmaceuticals) | | | | | | | | | | | 25,800 | | | | 112,810 | |
Grifols SA ADR (Health Care, Biotechnology) | | | | | | | | | | | 2,621 | | | | 53,206 | |
International Consolidated Airlines Group SA (Industrials, Airlines) | | | | | | | | | | | 17,900 | | | | 49,930 | |
Repsol YPF SA (Energy, Oil, Gas & Consumable Fuels) | | | | | | | | | | | 16,200 | | | | 147,045 | |
| | | | |
| | | | | | | | | | | | | | | 473,254 | |
| | | | | | | | | | | | | | | | |
|
| Sweden: 0.67% | |
Boliden AB (Materials, Metals & Mining) | | | | | | | | | | | 6,700 | | | | 135,055 | |
Ericsson LM Class B (Information Technology, Communications Equipment) | | | | | | | | | | | 10,994 | | | | 93,923 | |
Volvo AB Class B (Industrials, Machinery) † | | | | | | | | | | | 23,600 | | | | 302,424 | |
| | | | |
| | | | | | | | | | | | | | | 531,402 | |
| | | | | | | | | | | | | | | | |
|
| Switzerland: 9.03% | |
Baloise Holding AG (Financials, Insurance) | | | | | | | | | | | 1,400 | | | | 209,464 | |
Idorsia Limited (Health Care, Biotechnology) † | | | | | | | | | | | 7,623 | | | | 220,860 | |
LafargeHolcim Limited (Materials, Construction Materials) | | | | | | | | | | | 15,025 | | | | 624,033 | |
Lonza Group AG (Health Care, Life Sciences Tools & Services) | | | | | | | | | | | 1,005 | | | | 438,849 | |
Medacta Group SA (Health Care, Health Care Equipment & Supplies) 144A† | | | | | | | | | | | 1,901 | | | | 132,313 | |
Nestle SA (Consumer Staples, Food Products) | | | | | | | | | | | 10,637 | | | | 1,126,565 | |
Novartis AG (Health Care, Pharmaceuticals) | | | | | | | | | | | 15,074 | | | | 1,286,392 | |
Roche Holding AG (Health Care, Pharmaceuticals) | | | | | | | | | | | 4,566 | | | | 1,581,194 | |
Swiss Life Holding AG (Financials, Insurance) | | | | | | | | | | | 700 | | | | 248,236 | |
Swiss Reinsurance AG (Financials, Insurance) | | | | | | | | | | | 2,400 | | | | 174,399 | |
Temenos AG (Information Technology, Software) | | | | | | | | | | | 1,429 | | | | 185,172 | |
UBS Group AG (Financials, Capital Markets) | | | | | | | | | | | 64,272 | | | | 688,192 | |
Valiant Holding AG (Financials, Banks) | | | | | | | | | | | 600 | | | | 57,957 | |
Zurich Insurance Group AG (Financials, Insurance) | | | | | | | | | | | 700 | | | | 221,938 | |
| | | | |
| | | | | | | | | | | | | | | 7,195,564 | |
| | | | | | | | | | | | | | | | |
The accompanying notes are an integral part of these financial statements.
Wells Fargo Diversified International Fund | 11
Portfolio of investments—April 30, 2020 (unaudited)
| | | | | | | | | | | | | | | | |
| | | | | | | | | Shares | | | Value | |
| Taiwan: 0.52% | |
Powertech Technology Incorporated (Information Technology, Semiconductors & Semiconductor Equipment) | | | | | | | | | | | 51,000 | | | $ | 170,547 | |
Tripod Technology Corporation (Information Technology, Electronic Equipment, Instruments & Components) | | | | | | | | | | | 27,000 | | | | 95,402 | |
Zhen Ding Technology Holding (Information Technology, Electronic Equipment, Instruments & Components) | | | | | | | | | | | 42,000 | | | | 150,709 | |
| | | | |
| | | | | | | | | | | | | | | 416,658 | |
| | | | | | | | | | | | | | | | |
|
| Turkey: 0.13% | |
Coca-Cola Icecek Uretim AS (Consumer Staples, Beverages) | | | | | | | | | | | 19,900 | | | | 105,276 | |
| | | | | | | | | | | | | | | | |
| | | | |
| United Kingdom: 10.54% | | | | | | | | | | | | |
3i Group plc (Financials, Capital Markets) | | | | | | | | | | | 21,200 | | | | 208,266 | |
Amarin Corporation plc ADR (Health Care, Biotechnology) † | | | | | | | | | | | 20,749 | | | | 157,900 | |
Anglo American plc (Materials, Metals & Mining) | | | | | | | | | | | 11,100 | | | | 197,414 | |
AVEVA Group plc (Information Technology, Software) | | | | | | | | | | | 6,135 | | | | 275,353 | |
Aviva plc (Financials, Insurance) | | | | | | | | | | | 22,000 | | | | 66,531 | |
Babcock International Group plc (Industrials, Commercial Services & Supplies) | | | | | | | | | | | 2,100 | | | | 11,123 | |
BAE Systems plc (Industrials, Aerospace & Defense) | | | | | | | | | | | 56,500 | | | | 360,381 | |
Barratt Developments plc (Consumer Discretionary, Household Durables) | | | | | | | | | | | 23,400 | | | | 152,553 | |
Bellway plc (Consumer Discretionary, Household Durables) | | | | | | | | | | | 4,200 | | | | 140,538 | |
Bovis Homes Group plc (Consumer Discretionary, Household Durables) | | | | | | | | | | | 8,928 | | | | 90,669 | |
BP plc (Energy, Oil, Gas & Consumable Fuels) | | | | | | | | | | | 53,700 | | | | 211,600 | |
British American Tobacco plc (Consumer Staples, Tobacco) | | | | | | | | | | | 5,700 | | | | 219,702 | |
BT Group plc (Communication Services, Diversified Telecommunication Services) | | | | | | | | | | | 33,500 | | | | 48,827 | |
Centrica plc (Utilities, Multi-Utilities) | | | | | | | | | | | 68,900 | | | | 34,461 | |
Coca-Cola European Partners plc (Consumer Staples, Beverages) | | | | | | | | | | | 5,410 | | | | 214,451 | |
Crest Nicholson Holdings plc (Consumer Discretionary, Household Durables) | | | | | | | | | | | 20,500 | | | | 66,055 | |
Diageo plc (Consumer Staples, Beverages) | | | | | | | | | | | 15,351 | | | | 528,533 | |
Fresnillo plc (Materials, Metals & Mining) | | | | | | | | | | | 58,071 | | | | 515,857 | |
GlaxoSmithKline plc (Health Care, Pharmaceuticals) | | | | | | | | | | | 23,900 | | | | 498,616 | |
Imperial Tobacco Group plc (Consumer Staples, Tobacco) | | | | | | | | | | | 7,800 | | | | 164,100 | |
Inchcape plc (Consumer Discretionary, Distributors) | | | | | | | | | | | 15,100 | | | | 95,116 | |
J Sainsbury plc (Consumer Staples, Food & Staples Retailing) | | | | | | | | | | | 37,300 | | | | 92,832 | |
John Wood Group plc (Energy, Energy Equipment & Services) | | | | | | | | | | | 167,675 | | | | 424,567 | |
Kingfisher plc (Consumer Discretionary, Specialty Retail) | | | | | | | | | | | 213,742 | | | | 424,019 | |
Legal & General Group plc (Financials, Insurance) | | | | | | | | | | | 48,900 | | | | 125,722 | |
Lloyds Banking Group plc (Financials, Banks) | | | | | | | | | | | 134,900 | | | | 54,582 | |
Man Group plc (Financials, Capital Markets) | | | | | | | | | | | 176,869 | | | | 296,328 | |
Marks & Spencer Group plc (Consumer Discretionary, Multiline Retail) | | | | | | | | | | | 44,100 | | | | 51,379 | |
Melrose Industries plc (Industrials, Electrical Equipment) | | | | | | | | | | | 306,576 | | | | 383,190 | |
QinetiQ Group plc (Industrials, Aerospace & Defense) | | | | | | | | | | | 31,800 | | | | 121,608 | |
Redrow plc (Consumer Discretionary, Household Durables) | | | | | | | | | | | 23,047 | | | | 133,910 | |
RELX plc (Industrials, Professional Services) | | | | | | | | | | | 9,500 | | | | 214,337 | |
Royal Dutch Shell plc Class B (Energy, Oil, Gas & Consumable Fuels) | | | | | | | | | | | 21,300 | | | | 340,984 | |
Royal Mail plc (Industrials, Air Freight & Logistics) | | | | | | | | | | | 20,900 | | | | 43,615 | |
Sensata Technologies Holding plc (Industrials, Electrical Equipment) † | | | | | | | | | | | 5,278 | | | | 192,014 | |
Smiths Group plc (Industrials, Industrial Conglomerates) | | | | | | | | | | | 59,462 | | | | 925,848 | |
Tate & Lyle plc (Consumer Staples, Food Products) | | | | | | | | | | | 15,700 | | | | 140,678 | |
Tesco plc (Consumer Staples, Food & Staples Retailing) | | | | | | | | | | | 60,000 | | | | 177,469 | |
| | | | |
| | | | | | | | | | | | | | | 8,401,128 | |
| | | | | | | | | | | | | | | | |
|
| United States: 4.64% | |
Advance Auto Parts Incorporated (Consumer Discretionary, Specialty Retail) | | | | | | | | | | | 2,214 | | | | 267,695 | |
Alphabet Incorporated Class A (Communication Services, Interactive Media & Services) † | | | | | | | | | | | 301 | | | | 405,357 | |
Alphabet Incorporated Class C (Communication Services, Interactive Media & Services) † | | | | | | | | | | | 121 | | | | 163,188 | |
The accompanying notes are an integral part of these financial statements.
12 | Wells Fargo Diversified International Fund
Portfolio of investments—April 30, 2020 (unaudited)
| | | | | | | | | | | | | | | | |
| | | | | | | | | Shares | | | Value | |
|
| United States (continued) | |
Amazon.com Incorporated (Consumer Discretionary, Internet & Direct Marketing Retail) † | | | | | | | | | | | 328 | | | $ | 811,472 | |
Berry Global Group Incorporated (Materials, Containers & Packaging) † | | | | | | | | | | | 21,457 | | | | 853,774 | |
Gentex Corporation (Consumer Discretionary, Auto Components) | | | | | | | | | | | 31,450 | | | | 762,348 | |
Intercontinental Exchange Incorporated (Financials, Capital Markets) | | | | | | | | | | | 4,830 | | | | 432,044 | |
| | | | |
| | | | | | | | | | | | | | | 3,695,878 | |
| | | | | | | | | | | | | | | | |
|
| Virgin Islands (British): 0.38% | |
HollySys Automation Technologies Limited (Information Technology, Electronic Equipment, Instruments & Components) | | | | | | | | | | | 20,976 | | | | 300,796 | |
| | | | | | | | | | | | | | | | |
| |
Total Common Stocks (Cost $77,473,147) | | | | 75,377,005 | |
| | | | | |
| | | | |
| | | | | | | | | | | | | | | | |
| | | | | | Expiration
date | | | | | | | |
| Participation Notes: 0.66% | | | | | | | | | | | | |
| | | | |
| Ireland: 0.66% | | | | | | | | | | | | |
HSBC Bank plc (Ryanair Holdings plc) (Industrials, Airlines) †(a) | | | | | | | 10-29-2020 | | | | 46,087 | | | | 525,054 | |
| | | | | | | | | | | | | | | | |
| | | | |
Total Participation Notes (Cost $600,993) | | | | | | | | | | | | | | | 525,054 | |
| | | | | | | | | | | | | | | | |
| | | | |
| | | | | | | | | | | | | | | | |
| | | Dividend yield | | | | | | | | | | |
| Preferred Stocks: 0.42% | | | | | | | | | | | | |
| | | | |
| Brazil: 0.42% | | | | | | | | | | | | |
Petroleo Brasileiro SA (Energy, Oil, Gas & Consumable Fuels) | | | 3.30 | % | | | | | | | 100,417 | | | | 333,314 | |
| | | | | | | | | | | | | | | | |
| | | | |
Total Preferred Stocks (Cost $593,050) | | | | | | | | | | | | | | | 333,314 | |
| | | | | | | | | | | | | | | | |
| | | | |
Rights: 0.00% | | | | | | | | | | | | | | | | |
| | | | |
| South Africa: 0.00% | | | | | | | | | | | | |
Omnia Holdings Limited (Materials, Chemicals) †(a) | | | | | | | 5-5-2020 | | | | 11,006 | | | | 0 | |
| | | | | | | | | | | | | | | | |
| | | | |
Total Rights (Cost $24,508) | | | | | | | | | | | | | | | 0 | |
| | | | | | | | | | | | | | | | |
| | | | |
| | | | | | | | | | | | | | | | |
| | | Yield | | | | | | | | | | |
| Short-Term Investments: 4.07% | | | | | | | | | | | | |
| | | | |
Investment Companies: 4.07% | | | | | | | | | | | | | | | | |
Wells Fargo Government Money Market Fund Select Class (l)(u) | | | 0.19 | | | | | | | | 3,244,163 | | | | 3,244,163 | |
| | | | | | | | | | | | | | | | |
| | | | |
Total Short-Term Investments (Cost $3,244,163) | | | | | | | | | | | | | | | 3,244,163 | |
| | | | | | | | | | | | | |
| | | | | | | | |
| Total investments in securities (Cost $81,935,861) | | | 99.71 | % | | | 79,479,536 | |
| | |
Other assets and liabilities, net | | | 0.29 | | | | 227,593 | |
| | | | | | | | |
| Total net assets | | | 100.00 | % | | $ | 79,707,129 | |
| | | | | | | | |
| † | Non-income-earning security |
| 144A | The security may be resold in transactions exempt from registration, normally to qualified institutional buyers, pursuant to Rule 144A under the Securities Act of 1933. |
| (a) | The security is fair valued in accordance with procedures approved by the Board of Trustees. |
| (l) | The issuer of the security is an affiliated person of the Fund as defined in the Investment Company Act of 1940. |
| (u) | The rate represents the7-day annualized yield at period end. |
Abbreviations:
| ADR | American depositary receipt |
| GDR | Global depositary receipt |
The accompanying notes are an integral part of these financial statements.
Wells Fargo Diversified International Fund | 13
Portfolio of investments—April 30, 2020 (unaudited)
Forward Foreign Currency Contracts
| | | | | | | | | | | | | | |
Currency to be
received | | Currency to be
delivered | | Counterparty | | Settlement
date | | Unrealized
gains | | | Unrealized
losses | |
| | | | | |
| 16,744,014 JPY | | 157,026 USD | | State Street Bank | | 5-7-2020 | | $ | 0 | | | $ | (999 | ) |
| | | | | |
| 11,048,113 JPY | | 103,610 USD | | State Street Bank | | 5-7-2020 | | | 0 | | | | (659 | ) |
| | | | | |
| 1,390,221 USD | | 1,237,600 EUR | | Credit Suisse | | 6-9-2020 | | | 33,075 | | | | 0 | |
| | | | | | | | | | | | | | |
| | | | | |
| | | | | | | | $ | 33,075 | | | $ | (1,658 | ) |
| | | | | | | | | | | | | | |
Investments in Affiliates
An affiliated investment is an investment in which the Fund owns at least 5% of the outstanding voting shares of the issuer or as a result of other relationships, such as the Fund and the issuer having the same investment manager. Transactions with issuers that were either affiliated persons of the Fund at the beginning of the period or the end of the period were as follows:
| | | | | | | | | | | | | | | | | | | | | | | | | | | | | | | | | | | | |
| | | Shares,
beginning of
period | | | Shares
purchased | | | Shares
sold | | | Shares,
end of
period | | | Net
realized
gains
(losses) | | | Net
change in
unrealized
gains
(losses) | | | Income
from
affiliated
securities | | | Value,
end of
period | | | % of
net
assets | |
| | | | | | | | | |
| Short-Term Investments | | | | | | | | | | | | | | | | | | | | | | | | | | | |
Investment Companies | | | | | | | | | | | | | | | | | | | | | | | | | | | | | | | | | | | | |
Securities Lending Cash Investments LLC * | | | 1,463,510 | | | | 5,867,839 | | | | (7,331,349 | ) | | | 0 | | | $ | 142 | | | $ | 1 | | | $ | 12,564 | # | | $ | 0 | | | | | |
Wells Fargo Government Money Market Fund Select Class | | | 1,895,943 | | | | 15,950,718 | | | | (14,602,498 | ) | | | 3,244,163 | | | | 0 | | | | 0 | | | | 14,830 | | | | 3,244,163 | | | | | |
| | | | | | | | | | | | | | | | | | | | | | | | | | | | | | | | | | | | |
| | | | | | | | | | | | | | | | | | $ | 142 | | | $ | 1 | | | $ | 27,394 | | | $ | 3,244,163 | | | | 4.07 | % |
| | | | | | | | | | | | | | | | | | | | | | | | | | | | | | | | | | | | |
| * | No longer held at end of period |
| # | Amount shown represents income before fees and rebates. |
The accompanying notes are an integral part of these financial statements.
14 | Wells Fargo Diversified International Fund
Statement of assets and liabilities—April 30, 2020 (unaudited)
| | | | |
| | | | |
| |
Assets | | | | |
Investments in unaffiliated securities, at value (cost $78,691,698) | | $ | 76,235,373 | |
Investments in affiliated securities, at value (cost $3,244,163) | | | 3,244,163 | |
Foreign currency, at value (cost $418,339) | | | 416,181 | |
Receivable for investments sold | | | 371,606 | |
Receivable for Fund shares sold | | | 16,411 | |
Receivable for dividends | | | 561,526 | |
Receivable for securities lending income, net | | | 528 | |
Unrealized gains on forward foreign currency contracts | | | 33,075 | |
Prepaid expenses and other assets | | | 6,755 | |
| | | | |
Total assets | | | 80,885,618 | |
| | | | |
| |
Liabilities | | | | |
Payable for investments purchased | | | 623,114 | |
Payable for Fund shares redeemed | | | 184,970 | |
Overdraft due to custodian bank | | | 71,199 | |
Unrealized losses on forward foreign currency contracts | | | 1,658 | |
Management fee payable | | | 18,439 | |
Administration fees payable | | | 9,245 | |
Distribution fee payable | | | 560 | |
Custody and accounting fees payable | | | 145,944 | |
Trustees’ fees and expenses payable | | | 8,804 | |
Accrued expenses and other liabilities | | | 114,556 | |
| | | | |
Total liabilities | | | 1,178,489 | |
| | | | |
Total net assets | | $ | 79,707,129 | |
| | | | |
| |
Net assets consist of | | | | |
Paid-in capital | | $ | 91,371,864 | |
Total distributable loss | | | (11,664,735 | ) |
| | | | |
Total net assets | | $ | 79,707,129 | |
| | | | |
| |
Computation of net asset value and offering price per share | | | | |
Net assets – Class A | | $ | 42,529,324 | |
Shares outstanding – Class A1 | | | 4,031,206 | |
Net asset value per share – Class A | | | $10.55 | |
Maximum offering price per share – Class A2 | | | $11.19 | |
Net assets – Class C | | $ | 945,364 | |
Shares outstanding – Class C1 | | | 97,092 | |
Net asset value per share – Class C | | | $9.74 | |
Net assets – Class R6 | | $ | 21,293,115 | |
Shares outstanding – Class R61 | | | 1,971,169 | |
Net asset value per share – Class R6 | | | $10.80 | |
Net assets – Administrator Class | | $ | 10,704,292 | |
Shares outstanding – Administrator Class1 | | | 995,642 | |
Net asset value per share – Administrator Class | | | $10.75 | |
Net assets – Institutional Class | | $ | 4,235,034 | |
Shares outstanding – Institutional Class1 | | | 424,188 | |
Net asset value per share – Institutional Class | | | $9.98 | |
| 1 | The Fund has an unlimited number of authorized shares. |
| 2 | Maximum offering price is computed as 100/94.25 of net asset value. On investments of $50,000 or more, the offering price is reduced. |
The accompanying notes are an integral part of these financial statements.
Wells Fargo Diversified International Fund | 15
Statement of operations—six months ended April 30, 2020 (unaudited)
| | | | |
| | | | |
| |
Investment income | | | | |
Dividends (net of foreign withholding taxes of $91,427) | | $ | 849,031 | |
Income from affiliated securities | | | 25,243 | |
| | | | |
Total investment income | | | 874,274 | |
| | | | |
| |
Expenses | | | | |
Management fee | | | 391,720 | |
Administration fees | |
Class A | | | 52,663 | |
Class C | | | 1,174 | |
Class R6 | | | 3,611 | |
Administrator Class | | | 8,035 | |
Institutional Class | | | 2,898 | |
Shareholder servicing fees | |
Class A | | | 62,694 | |
Class C | | | 1,398 | |
Administrator Class | | | 15,452 | |
Distribution fee | |
Class C | | | 4,184 | |
Custody and accounting fees | | | 94,795 | |
Professional fees | | | 21,967 | |
Registration fees | | | 34,787 | |
Shareholder report expenses | | | 25,531 | |
Trustees’ fees and expenses | | | 10,969 | |
Other fees and expenses | | | 35,381 | |
| | | | |
Total expenses | | | 767,259 | |
Less: Fee waivers and/or expense reimbursements | |
Fund-level | | | (204,851 | ) |
Class A | | | (10,002 | ) |
Class R6 | | | (3,611 | ) |
Administrator Class | | | (1,286 | ) |
Institutional Class | | | (819 | ) |
| | | | |
Net expenses | | | 546,690 | |
| | | | |
Net investment income | | | 327,584 | |
| | | | |
| |
Realized and unrealized gains (losses) on investments | | | | |
Net realized gains (losses) on | |
Unaffiliated securities | | | (1,616,227 | ) |
Affiliated securities | | | 142 | |
Forward foreign currency contracts | | | (168,369 | ) |
| | | | |
Net realized losses on investments | | | (1,784,454 | ) |
| | | | |
|
Net change in unrealized gains (losses) on | |
Unaffiliated securities | | | (14,651,200 | ) |
Affiliated securities | | | 1 | |
Forward foreign currency contracts | | | 143,789 | |
| | | | |
Net change in unrealized gains (losses) on investments | | | (14,507,410 | ) |
| | | | |
Net realized and unrealized gains (losses) on investments | | | (16,291,864 | ) |
| | | | |
Net decrease in net assets resulting from operations | | $ | (15,964,280 | ) |
| | | | |
The accompanying notes are an integral part of these financial statements.
16 | Wells Fargo Diversified International Fund
Statement of changes in net assets
| | | | | | | | | | | | | | | | |
| | | Six months ended
April 30, 2020
(unaudited) | | | Year ended
October 31, 2019 | |
| |
Operations | | | | | |
Net investment income | | | | | | $ | 327,584 | | | | | | | $ | 2,013,938 | |
Net realized gains (losses) on investments | | | | | | | (1,784,454 | ) | | | | | | | 431,264 | |
Net change in unrealized gains (losses) on investments | | | | | | | (14,507,410 | ) | | | | | | | 6,134,831 | |
| | | | |
Net increase (decrease) in net assets resulting from operations | | | | | | | (15,964,280 | ) | | | | | | | 8,580,033 | |
| | | | |
| | | | |
Distributions to shareholders from net investment income and net realized gains | | | | | | | | | | | | | | | | |
Class A | | | | | | | (1,068,698 | ) | | | | | | | (1,117,631 | ) |
Class C | | | | | | | (13,100 | ) | | | | | | | (23,783 | ) |
Class R6 | | | | | | | (618,683 | ) | | | | | | | (716,722 | ) |
Administrator Class | | | | | | | (270,064 | ) | | | | | | | (270,088 | ) |
Institutional Class | | | | | | | (111,059 | ) | | | | | | | (126,725 | ) |
| | | | |
Total distributions to shareholders | | | | | | | (2,081,604 | ) | | | | | | | (2,254,949 | ) |
| | | | |
| | | | |
Capital share transactions | | | Shares | | | | | | | | Shares | | | | | |
Proceeds from shares sold | |
Class A | | | 55,107 | | | | 645,535 | | | | 111,229 | | | | 1,356,596 | |
Class C | | | 10,119 | | | | 108,907 | | | | 6,717 | | | | 72,885 | |
Class R6 | | | 54,710 | | | | 544,500 | | | | 57,338 | | | | 686,446 | |
Administrator Class | | | 118,966 | | | | 1,400,981 | | | | 158,327 | | | | 1,962,086 | |
Institutional Class | | | 155,534 | | | | 1,533,664 | | | | 76,896 | | | | 887,473 | |
| | | | |
| | | | | | | 4,233,587 | | | | | | | | 4,965,486 | |
| | | | |
Reinvestment of distributions | |
Class A | | | 78,823 | | | | 1,053,071 | | | | 99,537 | | | | 1,100,884 | |
Class C | | | 927 | | | | 11,455 | | | | 2,096 | | | | 21,423 | |
Class R6 | | | 7,562 | | | | 103,306 | | | | 17,878 | | | | 202,018 | |
Administrator Class | | | 19,811 | | | | 269,633 | | | | 23,957 | | | | 269,756 | |
Institutional Class | | | 8,697 | | | | 109,848 | | | | 11,996 | | | | 125,479 | |
| | | | |
| | | | | | | 1,547,313 | | | | | | | | 1,719,560 | |
| | | | |
Payment for shares redeemed | |
Class A | | | (287,106 | ) | | | (3,450,030 | ) | | | (500,862 | ) | | | (6,110,610 | ) |
Class C | | | (20,943 | ) | | | (242,605 | ) | | | (112,305 | ) | | | (1,263,134 | ) |
Class R6 | | | (13,761 | ) | | | (150,571 | ) | | | (372,557 | ) | | | (4,728,700 | ) |
Administrator Class | | | (138,233 | ) | | | (1,644,635 | ) | | | (201,419 | ) | | | (2,495,504 | ) |
Institutional Class | | | (107,105 | ) | | | (1,115,193 | ) | | | (119,836 | ) | | | (1,388,392 | ) |
| | | | |
| | | | | | | (6,603,034 | ) | | | | | | | (15,986,340 | ) |
| | | | |
Net decrease in net assets resulting from capital share transactions | | | | | | | (822,134 | ) | | | | | | | (9,301,294 | ) |
| | | | |
Total decrease in net assets | | | | | | | (18,868,018 | ) | | | | | | | (2,976,210 | ) |
| | | | |
| | |
Net assets | | | | | | | | |
Beginning of period | | | | | | | 98,575,147 | | | | | | | | 101,551,357 | |
| | | | |
End of period | | | | | | $ | 79,707,129 | | | | | | | $ | 98,575,147 | |
| | | | |
The accompanying notes are an integral part of these financial statements.
Wells Fargo Diversified International Fund | 17
Financial highlights
(For a share outstanding throughout each period)
| | | | | | | | | | | | | | | | | | | | | | | | |
| | | Six months ended
April 30, 2020
(unaudited) | | | Year ended October 31 | |
| CLASS A | | 2019 | | | 2018 | | | 2017 | | | 2016 | | | 2015 | |
Net asset value, beginning of period | | | $12.94 | | | | $12.15 | | | | $13.39 | | | | $11.08 | | | | $11.65 | | | | $12.01 | |
Net investment income | | | 0.03 | | | | 0.23 | | | | 0.21 | | | | 0.19 | | | | 0.17 | | | | 0.13 | 1 |
Net realized and unrealized gains (losses) on investments | | | (2.16 | ) | | | 0.81 | | | | (1.12 | ) | | | 2.34 | | | | (0.63 | ) | | | (0.21 | ) |
| | | | | | | | | | | | | | | | | | | | | | | | |
Total from investment operations | | | (2.13 | ) | | | 1.04 | | | | (0.91 | ) | | | 2.53 | | | | (0.46 | ) | | | (0.08 | ) |
Distributions to shareholders from | | | | | | | | | | | | | | | | | | | | | | | | |
Net investment income | | | (0.26 | ) | | | (0.25 | ) | | | (0.33 | ) | | | (0.22 | ) | | | (0.11 | ) | | | (0.28 | ) |
Net asset value, end of period | | | $10.55 | | | | $12.94 | | | | $12.15 | | | | $13.39 | | | | $11.08 | | | | $11.65 | |
Total return2 | | | (16.89 | )% | | | 8.94 | % | | | (7.00 | )% | | | 23.27 | % | | | (3.96 | )% | | | (0.66 | )% |
Ratios to average net assets (annualized) | | | | | | | | | | | | | | | | | | | | | | | | |
Gross expenses | | | 1.79 | % | | | 1.77 | % | | | 1.71 | % | | | 1.80 | % | | | 1.79 | % | | | 1.85 | % |
Net expenses | | | 1.31 | % | | | 1.35 | % | | | 1.35 | % | | | 1.35 | % | | | 1.35 | % | | | 1.40 | % |
Net investment income | | | 0.53 | % | | | 1.91 | % | | | 1.61 | % | | | 1.64 | % | | | 1.67 | % | | | 1.07 | % |
Supplemental data | | | | | | | | | | | | | | | | | | | | | | | | |
Portfolio turnover rate | | | 23 | % | | | 28 | % | | | 39 | % | | | 42 | % | | | 50 | % | | | 31 | % |
Net assets, end of period (000s omitted) | | | $42,529 | | | | $54,146 | | | | $54,358 | | | | $64,347 | | | | $61,031 | | | | $73,891 | |
| 1 | Calculated based upon average shares outstanding |
| 2 | Total return calculations do not include any sales charges. Returns for periods of less than one year are not annualized. |
The accompanying notes are an integral part of these financial statements.
18 | Wells Fargo Diversified International Fund
Financial highlights
(For a share outstanding throughout each period)
| | | | | | | | | | | | | | | | | | | | | | | | |
| | | Six months ended
April 30, 2020
(unaudited) | | | Year ended October 31 | |
| CLASS C | | 2019 | | | 2018 | | | 2017 | | | 2016 | | | 2015 | |
Net asset value, beginning of period | | | $11.88 | | | | $11.12 | | | | $12.27 | | | | $10.16 | | | | $10.74 | | | | $11.08 | |
Net investment income (loss) | | | (0.08 | ) | | | 0.12 | 1 | | | 0.10 | 1 | | | 0.10 | 1 | | | 0.10 | 1 | | | 0.04 | 1 |
Net realized and unrealized gains (losses) on investments | | | (1.93 | ) | | | 0.76 | | | | (1.02 | ) | | | 2.15 | | | | (0.60 | ) | | | (0.20 | ) |
| | | | | | | | | | | | | | | | | | | | | | | | |
Total from investment operations | | | (2.01 | ) | | | 0.88 | | | | (0.92 | ) | | | 2.25 | | | | (0.50 | ) | | | (0.16 | ) |
Distributions to shareholders from | | | | | | | | | | | | | | | | | | | | | | | | |
Net investment income | | | (0.13 | ) | | | (0.12 | ) | | | (0.23 | ) | | | (0.14 | ) | | | (0.08 | ) | | | (0.18 | ) |
Net asset value, end of period | | | $9.74 | | | | $11.88 | | | | $11.12 | | | | $12.27 | | | | $10.16 | | | | $10.74 | |
Total return2 | | | (17.16 | )% | | | 8.09 | % | | | (7.76 | )% | | | 22.51 | % | | | (4.72 | )% | | | (1.44 | )% |
Ratios to average net assets (annualized) | | | | | | | | | | | | | | | | | | | | | | | | |
Gross expenses | | | 2.54 | % | | | 2.51 | % | | | 2.46 | % | | | 2.55 | % | | | 2.54 | % | | | 2.60 | % |
Net expenses | | | 2.10 | % | | | 2.10 | % | | | 2.10 | % | | | 2.10 | % | | | 2.10 | % | | | 2.15 | % |
Net investment income (loss) | | | (0.22 | )% | | | 1.08 | % | | | 0.81 | % | | | 0.92 | % | | | 1.01 | % | | | 0.33 | % |
Supplemental data | | | | | | | | | | | | | | | | | | | | | | | | |
Portfolio turnover rate | | | 23 | % | | | 28 | % | | | 39 | % | | | 42 | % | | | 50 | % | | | 31 | % |
Net assets, end of period (000s omitted) | | | $945 | | | | $1,271 | | | | $2,340 | | | | $4,066 | | | | $4,351 | | | | $3,573 | |
| 1 | Calculated based upon average shares outstanding |
| 2 | Total return calculations do not include any sales charges. Returns for periods of less than one year are not annualized. |
The accompanying notes are an integral part of these financial statements.
Wells Fargo Diversified International Fund | 19
Financial highlights
(For a share outstanding throughout each period)
| | | | | | | | | | | | | | | | | | | | | | | | |
| | | Six months ended
April 30, 2020
(unaudited) | | | Year ended October 31 | |
| CLASS R6 | | 2019 | | | 2018 | | | 2017 | | | 2016 | | | 20151 | |
Net asset value, beginning of period | | | $13.28 | | | | $12.47 | | | | $13.71 | | | | $11.33 | | | | $11.87 | | | | $11.13 | |
Net investment income | | | 0.06 | | | | 0.31 | | | | 0.31 | | | | 0.30 | 2 | | | 0.26 | 2 | | | 0.00 | 3 |
Net realized and unrealized gains (losses) on investments | | | (2.22 | ) | | | 0.82 | | | | (1.18 | ) | | | 2.34 | | | | (0.68 | ) | | | 0.74 | |
| | | | | | | | | | | | | | | | | | | | | | | | |
Total from investment operations | | | (2.16 | ) | | | 1.13 | | | | (0.87 | ) | | | 2.64 | | | | (0.42 | ) | | | 0.74 | |
Distributions to shareholders from | | | | | | | | | | | | | | | | | | | | | | | | |
Net investment income | | | (0.32 | ) | | | (0.32 | ) | | | (0.37 | ) | | | (0.26 | ) | | | (0.12 | ) | | | 0.00 | |
Net asset value, end of period | | | $10.80 | | | | $13.28 | | | | $12.47 | | | | $13.71 | | | | $11.33 | | | | $11.87 | |
Total return4 | | | (16.76 | )% | | | 9.52 | % | | | (6.61 | )% | | | 23.88 | % | | | (3.55 | )% | | | 6.65 | % |
Ratios to average net assets (annualized) | | | | | | | | | | | | | | | | | | | | | | | | |
Gross expenses | | | 1.37 | % | | | 1.34 | % | | | 1.28 | % | | | 1.34 | % | | | 1.36 | % | | | 1.46 | % |
Net expenses | | | 0.89 | % | | | 0.89 | % | | | 0.89 | % | | | 0.89 | % | | | 0.89 | % | | | 0.89 | % |
Net investment income | | | 1.02 | % | | | 2.37 | % | | | 2.11 | % | | | 2.37 | % | | | 2.30 | % | | | 0.05 | % |
Supplemental data | | | | | | | | | | | | | | | | | | | | | | | | |
Portfolio turnover rate | | | 23 | % | | | 28 | % | | | 39 | % | | | 42 | % | | | 50 | % | | | 31 | % |
Net assets, end of period (000s omitted) | | | $21,293 | | | | $25,525 | | | | $27,692 | | | | $33,698 | | | | $5,523 | | | | $27 | |
| 1 | For the period from September 30, 2015 (commencement of class operations) to October 31, 2015 |
| 2 | Calculated based upon average shares outstanding |
| 3 | Amount is less than $0.005. |
| 4 | Returns for periods of less than one year are not annualized. |
The accompanying notes are an integral part of these financial statements.
20 | Wells Fargo Diversified International Fund
Financial highlights
(For a share outstanding throughout each period)
| | | | | | | | | | | | | | | | | | | | | | | | |
| | | Six months ended
April 30, 2020
(unaudited) | | | Year ended October 31 | |
| ADMINISTRATOR CLASS | | 2019 | | | 2018 | | | 2017 | | | 2016 | | | 2015 | |
Net asset value, beginning of period | | | $13.19 | | | | $12.38 | | | | $13.64 | | | | $11.28 | | | | $11.87 | | | | $12.23 | |
Net investment income | | | 0.04 | | | | 0.25 | 1 | | | 0.23 | 1 | | | 0.22 | 1 | | | 0.20 | 1 | | | 0.16 | 1 |
Net realized and unrealized gains (losses) on investments | | | (2.21 | ) | | | 0.83 | | | | (1.15 | ) | | | 2.37 | | | | (0.66 | ) | | | (0.22 | ) |
| | | | | | | | | | | | | | | | | | | | | | | | |
Total from investment operations | | | (2.17 | ) | | | 1.08 | | | | (0.92 | ) | | | 2.59 | | | | (0.46 | ) | | | (0.06 | ) |
Distributions to shareholders from | | | | | | | | | | | | | | | | | | | | | | | | |
Net investment income | | | (0.27 | ) | | | (0.27 | ) | | | (0.34 | ) | | | (0.23 | ) | | | (0.13 | ) | | | (0.30 | ) |
Net asset value, end of period | | | $10.75 | | | | $13.19 | | | | $12.38 | | | | $13.64 | | | | $11.28 | | | | $11.87 | |
Total return2 | | | (16.87 | )% | | | 9.07 | % | | | (6.94 | )% | | | 23.46 | % | | | (3.90 | )% | | | (0.46 | )% |
Ratios to average net assets (annualized) | | | | | | | | | | | | | | | | | | | | | | | | |
Gross expenses | | | 1.71 | % | | | 1.69 | % | | | 1.63 | % | | | 1.72 | % | | | 1.71 | % | | | 1.72 | % |
Net expenses | | | 1.25 | % | | | 1.25 | % | | | 1.25 | % | | | 1.25 | % | | | 1.25 | % | | | 1.25 | % |
Net investment income | | | 0.65 | % | | | 2.01 | % | | | 1.73 | % | | | 1.79 | % | | | 1.83 | % | | | 1.31 | % |
Supplemental data | | | | | | | | | | | | | | | | | | | | | | | | |
Portfolio turnover rate | | | 23 | % | | | 28 | % | | | 39 | % | | | 42 | % | | | 50 | % | | | 31 | % |
Net assets, end of period (000s omitted) | | | $10,704 | | | | $13,125 | | | | $12,557 | | | | $13,714 | | | | $12,334 | | | | $10,540 | |
| 1 | Calculated based upon average shares outstanding |
| 2 | Returns for periods of less than one year are not annualized. |
The accompanying notes are an integral part of these financial statements.
Wells Fargo Diversified International Fund | 21
Financial highlights
(For a share outstanding throughout each period)
| | | | | | | | | | | | | | | | | | | | | | | | |
| | | Six months ended
April 30, 2020
(unaudited) | | | Year ended October 31 | |
| INSTITUTIONAL CLASS | | 2019 | | | 2018 | | | 2017 | | | 2016 | | | 2015 | |
Net asset value, beginning of period | | | $12.28 | | | | $11.57 | | | | $12.84 | | | | $10.61 | | | | $11.14 | | | | $11.50 | |
Net investment income | | | 0.06 | 1 | | | 0.26 | 1 | | | 0.25 | 1 | | | 0.23 | 1 | | | 0.23 | 1 | | | 0.17 | 1 |
Net realized and unrealized gains (losses) on investments | | | (2.06 | ) | | | 0.76 | | | | (1.07 | ) | | | 2.25 | | | | (0.63 | ) | | | (0.20 | ) |
| | | | | | | | | | | | | | | | | | | | | | | | |
Total from investment operations | | | (2.00 | ) | | | 1.02 | | | | (0.82 | ) | | | 2.48 | | | | (0.40 | ) | | | (0.03 | ) |
Distributions to shareholders from | | | | | | | | | | | | | | | | | | | | | | | | |
Net investment income | | | (0.30 | ) | | | (0.31 | ) | | | (0.45 | ) | | | (0.25 | ) | | | (0.13 | ) | | | (0.33 | ) |
Net asset value, end of period | | | $9.98 | | | | $12.28 | | | | $11.57 | | | | $12.84 | | | | $10.61 | | | | $11.14 | |
Total return2 | | | (16.78 | )% | | | 9.30 | % | | | (6.68 | )% | | | 23.91 | % | | | (3.63 | )% | | | (0.23 | )% |
Ratios to average net assets (annualized) | | | | | | | | | | | | | | | | | | | | | | | | |
Gross expenses | | | 1.47 | % | | | 1.44 | % | | | 1.38 | % | | | 1.49 | % | | | 1.46 | % | | | 1.47 | % |
Net expenses | | | 0.99 | % | | | 0.99 | % | | | 0.99 | % | | | 0.99 | % | | | 0.99 | % | | | 0.99 | % |
Net investment income | | | 0.98 | % | | | 2.22 | % | | | 1.97 | % | | | 2.02 | % | | | 2.16 | % | | | 1.45 | % |
Supplemental data | | | | | | | | | | | | | | | | | | | | | | | | |
Portfolio turnover rate | | | 23 | % | | | 28 | % | | | 39 | % | | | 42 | % | | | 50 | % | | | 31 | % |
Net assets, end of period (000s omitted) | | | $4,235 | | | | $4,508 | | | | $4,604 | | | | $8,146 | | | | $24,328 | | | | $7,106 | |
| 1 | Calculated based upon average shares outstanding |
| 2 | Returns for periods of less than one year are not annualized. |
The accompanying notes are an integral part of these financial statements.
22 | Wells Fargo Diversified International Fund
Notes to financial statements (unaudited)
1. ORGANIZATION
Wells Fargo Funds Trust (the “Trust”), a Delaware statutory trust organized on March 10, 1999, is anopen-end management investment company registered under the Investment Company Act of 1940, as amended (the “1940 Act”). As an investment company, the Trust follows the accounting and reporting guidance in Financial Accounting Standards Board (“FASB”)Accounting Standards Codification Topic 946, Financial Services – Investment Companies. These financial statements report on the Wells Fargo Diversified International Fund (the “Fund”) which is a diversified series of the Trust.
2. SIGNIFICANT ACCOUNTING POLICIES
The following significant accounting policies, which are consistently followed in the preparation of the financial statements of the Fund, are in conformity with U.S. generally accepted accounting principles which require management to make estimates and assumptions that affect the reported amounts of assets and liabilities, disclosure of contingent assets and liabilities at the date of the financial statements, and the reported amounts of revenues and expenses during the reporting period. Actual results could differ from those estimates.
Securities valuation
All investments are valued each business day as of the close of regular trading on the New York Stock Exchange (generally 4 p.m. Eastern Time), although the Fund may deviate from this calculation time under unusual or unexpected circumstances.
Equity securities that are listed on a foreign or domestic exchange or market are valued at the official closing price or, if none, the last sales price. If no sale occurs on the principal exchange or market that day, a fair value price will be determined in accordance with the Fund’s Valuation Procedures.
Forward foreign currency contracts are recorded at the forward rate provided by an independent foreign currency pricing source at a time each business day specified by the Wells Fargo Asset Management Pricing Committee at Wells Fargo Funds Management, LLC (“Funds Management”).
The values of securities denominated in foreign currencies are translated into U.S. dollars at rates provided by an independent foreign currency pricing source at a time each business day specified by the Wells Fargo Asset Management Pricing Committee.
Many securities markets and exchanges outside the U.S. close prior to the close of the New York Stock Exchange and therefore may not fully reflect trading or events that occur after the close of the principal exchange in which the foreign securities are traded, but before the close of the New York Stock Exchange. If such trading or events are expected to materially affect the value of such securities, then fair value pricing procedures approved by the Board of Trustees of the Fund are applied. These procedures take into account multiple factors including movements in U.S. securities markets after foreign exchanges close. Foreign securities that are fair valued under these procedures are categorized as Level 2 and the application of these procedures may result in transfers between Level 1 and Level 2. Depending on market activity, such fair valuations may be frequent. Such fair value pricing may result in net asset values that are higher or lower than net asset values based on the last reported sales price or latest quoted bid price. On April 30, 2020, such fair value pricing was used in pricing certain foreign securities.
Investments in registeredopen-end investment companies are valued at net asset value. Interests innon-registered investment companies that are redeemable at net asset value are fair valued normally at net asset value.
Investments which are not valued using any of the methods discussed above are valued at their fair value, as determined in good faith by the Board of Trustees. The Board of Trustees has established a Valuation Committee comprised of the Trustees and has delegated to it the authority to take any actions regarding the valuation of portfolio securities that the Valuation Committee deems necessary or appropriate, including determining the fair value of portfolio securities, unless the determination has been delegated to the Wells Fargo Asset Management Pricing Committee. The Board of Trustees retains the authority to make or ratify any valuation decisions or approve any changes to the Valuation Procedures as it deems appropriate. On a quarterly basis, the Board of Trustees receives reports on any valuation actions taken by the Valuation Committee or the Wells Fargo Asset Management Pricing Committee which may include items for ratification.
Foreign currency translation
The accounting records of the Fund are maintained in U.S. dollars. The values of other assets and liabilities denominated in foreign currencies are translated into U.S. dollars at rates provided by an independent foreign currency pricing source at a time each business day specified by the Wells Fargo Asset Management Pricing Committee. Purchases and sales of securities, and income and expenses are converted at the rate of exchange on the respective dates of such transactions. Net realized foreign exchange gains or losses arise from sales of foreign currencies, currency gains or losses realized between the trade and settlement dates on securities transactions, and the difference between the amounts of dividends, interest and foreign withholding taxes recorded and the U.S. dollar equivalent of the amounts actually paid or received. Net unrealized foreign
Wells Fargo Diversified International Fund | 23
Notes to financial statements (unaudited)
exchange gains and losses arise from changes in the fair value of assets and liabilities other than investments in securities resulting from changes in exchange rates. The changes in net assets arising from changes in exchange rates of securities and the changes in net assets resulting from changes in market prices of securities are not separately presented. Such changes are included in net realized and unrealized gains or losses from investments.
Participation notes
The Fund may invest in participation notes to gain exposure to securities in certain foreign markets. Participation notes are issued by banks or broker-dealers and are designed to offer a return linked to a particular underlying foreign security. Participation notes involve transaction costs, which may be higher than those applicable to the underlying foreign security. The holder of the participation note is entitled to receive from the bank or broker-dealer, an amount equal to the dividend paid by the issuer of the underlying foreign security; however, the holder is not entitled to the same rights (i.e. voting rights) as an owner of the underlying foreign security. Investments in participation notes involve risks beyond those normally associated with a direct investment in an underlying security. The Fund has no rights against the issuer of the underlying foreign security and participation notes expose the Fund to counterparty risk in the event the counterparty does not perform. There is also no assurance there will be a secondary trading market for the participation note or that the trading price of the participation note will equal the underlying value of the foreign security that it seeks to replicate.
Forward foreign currency contracts
A forward foreign currency contract is an agreement between two parties to purchase or sell a specific currency for an agreed-upon price at a future date. The Fund enters into forward foreign currency contracts to facilitate transactions in foreign-denominated securities and to attempt to minimize the risk to the Fund from adverse changes in the relationship between currencies. Forward foreign currency contracts are recorded at the forward rate andmarked-to-market daily. When the contracts are closed, realized gains and losses arising from such transactions are recorded as realized gains or losses on forward foreign currency contracts. The Fund is subject to foreign currency risk and may be exposed to risks if the counterparties to the contracts are unable to meet the terms of their contracts or if the value of the foreign currency changes unfavorably. The Fund’s maximum risk of loss from counterparty credit risk is the unrealized gains on the contracts. This risk may be mitigated if there is a master netting arrangement between the Fund and the counterparty.
Securities lending
The Fund may lend its securities from time to time in order to earn additional income in the form of fees or interest on securities received as collateral or the investment of any cash received as collateral. When securities are on loan, the Fund receives interest or dividends on those securities. Cash collateral received in connection with its securities lending transactions is invested in Securities Lending Cash Investments, LLC (the “Securities Lending Fund”). Investments in Securities Lending Fund are valued at the evaluated bid price provided by an independent pricing service. Income earned from investment in the Securities Lending Fund (net of fees and rebates), if any, is included in income from affiliated securities on the Statement of Operations.
In a securities lending transaction, the net asset value of the Fund is affected by an increase or decrease in the value of the securities loaned and by an increase or decrease in the value of the instrument in which collateral is invested. The amount of securities lending activity undertaken by the Fund fluctuates from time to time. The Fund has the right under the lending agreement to recover the securities from the borrower on demand. In the event of default or bankruptcy by the borrower, the Fund may be prevented from recovering the loaned securities or gaining access to the collateral or may experience delays or costs in doing so. In such an event, the terms of the agreement allows the unaffiliated securities lending agent to use the collateral to purchase replacement securities on behalf of the Fund or pay the Fund the market value of the loaned securities. The Fund bears the risk of loss with respect to depreciation of its investment of the cash collateral.
Security transactions and income recognition
Securities transactions are recorded on a trade date basis. Realized gains or losses are recorded on the basis of identified cost.
Dividend income is recognized on theex-dividend date, except for certain dividends from foreign securities, which are recorded as soon as the custodian verifies theex-dividend date. Dividend income from foreign securities is recorded net of foreign taxes withheld where recovery of such taxes is not assured.
Distributions to shareholders
Distributions to shareholders from net investment income and any net realized gains are recorded on theex-dividend date and paid at least annually. Such distributions are determined in accordance with income tax regulations and may differ from U.S. generally accepted accounting principles. Dividend sources are estimated at the time of declaration. The tax character of distributions is determined as of the Fund’s fiscal year end. Therefore, a portion of the Fund’s distributions made prior to the
Fund’s fiscal year end may be categorized as a tax return of capital at year end.
24 | Wells Fargo Diversified International Fund
Notes to financial statements (unaudited)
Federal and other taxes
The Fund intends to continue to qualify as a regulated investment company by distributing substantially all of its investment company taxable income and any net realized capital gains (after reduction for capital loss carryforwards) sufficient to relieve it from all, or substantially all, federal income taxes. Accordingly, no provision for federal income taxes was required.
The Fund’s income and federal excise tax returns and all financial records supporting those returns for the prior three fiscal years are subject to examination by the federal and Delaware revenue authorities. Management has analyzed the Fund’s tax positions taken on federal, state, and foreign tax returns for all open tax years and does not believe that there are any uncertain tax positions that require recognition of a tax liability.
As of April 30, 2020, the aggregate cost of all investments for federal income tax purposes was $81,403,107 and the unrealized gains (losses) consisted of:
| | | | |
| |
Gross unrealized gains | | $ | 9,460,706 | |
| |
Gross unrealized losses | | | (11,352,860 | ) |
| |
Net unrealized losses | | $ | (1,892,154 | ) |
As of October 31, 2019, the Fund had capital loss carryforwards which consisted of $7,024,446 in short-term capital losses.
Class allocations
The separate classes of shares offered by the Fund differ principally in applicable sales charges, distribution, shareholder servicing, and administration fees. Class specific expenses are charged directly to that share class. Investment income, common fund-level expenses, and realized and unrealized gains (losses) on investments are allocated daily to each class of shares based on the relative proportion of net assets of each class.
3. FAIR VALUATION MEASUREMENTS
Fair value measurements of investments are determined within a framework that has established a fair value hierarchy based upon the various data inputs utilized in determining the value of the Fund’s investments. The three-level hierarchy gives the highest priority to unadjusted quoted prices in active markets for identical assets or liabilities (Level 1) and the lowest priority to unobservable inputs (Level 3). The Fund’s investments are classified within the fair value hierarchy based on the lowest level of input that is significant to the fair value measurement. The inputs are summarized into three broad levels as follows:
| ∎ | | Level 1 – quoted prices in active markets for identical securities |
| ∎ | | Level 2 – other significant observable inputs (including quoted prices for similar securities, interest rates, prepayment speeds, credit risk, etc.) |
| ∎ | | Level 3 – significant unobservable inputs (including the Fund’s own assumptions in determining the fair value of investments) |
The inputs or methodologies used for valuing investments in securities are not necessarily an indication of the risk associated with investing in those securities.
Wells Fargo Diversified International Fund | 25
Notes to financial statements (unaudited)
The following is a summary of the inputs used in valuing the Fund’s assets and liabilities as of April 30, 2020:
| | | | | | | | | | | | | | | | |
| | | | |
| | | Quoted prices
(Level 1) | | | Other significant
observable inputs
(Level 2) | | | Significant
unobservable inputs (Level 3) | | | Total | |
| | | | |
Assets | | | | | | | | | | | | | | | | |
Investments in: | | | | | | | | | | | | | | | | |
| | | | |
Common stocks | | | | | | | | | | | | | | | | |
| | | | |
Australia | | $ | 0 | | | $ | 1,024,545 | | | $ | 0 | | | $ | 1,024,545 | |
| | | | |
Austria | | | 0 | | | | 156,729 | | | | 0 | | | | 156,729 | |
| | | | |
Brazil | | | 185,453 | | | | 0 | | | | 0 | | | | 185,453 | |
| | | | |
Canada | | | 1,711,776 | | | | 0 | | | | 0 | | | | 1,711,776 | |
| | | | |
China | | | 1,392,174 | | | | 3,221,067 | | | | 0 | | | | 4,613,241 | |
| | | | |
Denmark | | | 65,150 | | | | 1,224,416 | | | | 0 | | | | 1,289,566 | |
| | | | |
Finland | | | 0 | | | | 96,209 | | | | 0 | | | | 96,209 | |
| | | | |
France | | | 0 | | | | 6,604,263 | | | | 0 | | | | 6,604,263 | |
| | | | |
Germany | | | 0 | | | | 8,267,274 | | | | 0 | | | | 8,267,274 | |
| | | | |
Hong Kong | | | 0 | | | | 2,578,643 | | | | 0 | | | | 2,578,643 | |
| | | | |
Hungary | | | 0 | | | | 74,791 | | | | 0 | | | | 74,791 | |
| | | | |
India | | | 0 | | | | 430,821 | | | | 0 | | | | 430,821 | |
| | | | |
Ireland | | | 2,208,574 | | | | 2,441,133 | | | | 0 | | | | 4,649,707 | |
| | | | |
Israel | | | 1,538,941 | | | | 0 | | | | 0 | | | | 1,538,941 | |
| | | | |
Italy | | | 0 | | | | 1,872,188 | | | | 0 | | | | 1,872,188 | |
| | | | |
Japan | | | 0 | | | | 10,144,824 | | | | 0 | | | | 10,144,824 | |
| | | | |
Malaysia | | | 0 | | | | 66,168 | | | | 0 | | | | 66,168 | |
| | | | |
Mexico | | | 0 | | | | 515,857 | | | | 0 | | | | 515,857 | |
| | | | |
Netherlands | | | 0 | | | | 3,766,098 | | | | 0 | | | | 3,766,098 | |
| | | | |
Norway | | | 0 | | | | 741,670 | | | | 0 | | | | 741,670 | |
| | | | |
Portugal | | | 0 | | | | 224,764 | | | | 0 | | | | 224,764 | |
| | | | |
Russia | | | 796,346 | | | | 131,759 | | | | 0 | | | | 928,105 | |
| | | | |
Singapore | | | 0 | | | | 876,680 | | | | 0 | | | | 876,680 | |
| | | | |
South Africa | | | 0 | | | | 115,421 | | | | 0 | | | | 115,421 | |
| | | | |
South Korea | | | 0 | | | | 2,599,968 | | | | 0 | | | | 2,599,968 | |
| | | | |
Spain | | | 53,206 | | | | 420,048 | | | | 0 | | | | 473,254 | |
| | | | |
Sweden | | | 0 | | | | 531,402 | | | | 0 | | | | 531,402 | |
| | | | |
Switzerland | | | 0 | | | | 7,195,564 | | | | 0 | | | | 7,195,564 | |
| | | | |
Taiwan | | | 0 | | | | 416,658 | | | | 0 | | | | 416,658 | |
| | | | |
Turkey | | | 0 | | | | 105,276 | | | | 0 | | | | 105,276 | |
| | | | |
United Kingdom | | | 564,365 | | | | 7,320,906 | | | | 0 | | | | 7,885,271 | |
| | | | |
United States | | | 3,695,878 | | | | 0 | | | | 0 | | | | 3,695,878 | |
| | | | |
Participation notes | | | | | | | | | | | | | | | | |
| | | | |
Ireland | | | 0 | | | | 525,054 | | | | 0 | | | | 525,054 | |
| | | | |
Preferred stocks | | | | | | | | | | | | | | | | |
| | | | |
Brazil | | | 333,314 | | | | 0 | | | | 0 | | | | 333,314 | |
| | | | |
Rights | | | | | | | | | | | | | | | | |
| | | | |
South Africa | | | 0 | | | | 0 | | | | 0 | | | | 0 | |
| | | | |
Short-term investments | | | | | | | | | | | | | | | | |
| | | | |
Investment companies | | | 3,244,163 | | | | 0 | | | | 0 | | | | 3,244,163 | |
| | | | |
| | | 15,789,340 | | | | 63,690,196 | | | | 0 | | | | 79,479,536 | |
| | | | |
Forward foreign currency contracts | | | 0 | | | | 33,075 | | | | 0 | | | | 33,075 | |
| | | | |
Total assets | | $ | 15,789,340 | | | $ | 63,723,271 | | | $ | 0 | | | $ | 79,512,611 | |
| | | | |
Liabilities | | | | | | | | | | | | | | | | |
| | | | |
Forward foreign currency contracts | | $ | 0 | | | $ | 1,658 | | | $ | 0 | | | $ | 1,658 | |
| | | | |
Total liabilities | | $ | 0 | | | $ | 1,658 | | | $ | 0 | | | $ | 1,658 | |
26 | Wells Fargo Diversified International Fund
Notes to financial statements (unaudited)
Additional sector, industry or geographic detail is included in the Portfolio of Investments.
Forward foreign currency contracts are reported at their cumulative unrealized gains (losses) at measurement date as reported in the table following the Portfolio of Investments. All other assets and liabilities are reported at their market value at measurement date.
For the six months ended April 30, 2020, the Fund did not have any transfers into/out of Level 3.
4. TRANSACTIONS WITH AFFILIATES AND OTHER EXPENSES
Management fee
Funds Management, an indirect wholly owned subsidiary of Wells Fargo & Company (“Wells Fargo”), is the manager of the Fund and provides advisory and fund-level administrative services under an investment management agreement. Under the investment management agreement, Funds Management is responsible for, among other services, implementing the investment objectives and strategies of the Fund, supervising the subadvisers and providing fund-level administrative services in connection with the Fund’s operations. As compensation for its services under the investment management agreement, Funds Management is entitled to receive a management fee at the following annual rate based on the Fund’s average daily net assets:
| | | | |
| |
| Average daily net assets | | Management fee | |
| |
First $500 million | | | 0.850 | % |
| |
Next $500 million | | | 0.800 | |
| |
Next $1 billion | | | 0.750 | |
| |
Next $2 billion | | | 0.725 | |
| |
Next $1 billion | | | 0.700 | |
| |
Next $5 billion | | | 0.690 | |
| |
Over $10 billion | | | 0.680 | |
For the six months ended April 30, 2020, the management fee was equivalent to an annual rate of 0.85% of the Fund’s average daily net assets.
Funds Management has retained the services of certain subadvisers to provide daily portfolio management to the Fund. The fee for subadvisory services is borne by Funds Management. Artisan Partners Limited Partnership, LSV Asset Management, and Wells Capital Management incorporated (“WellsCap”), an affiliate of Funds Management and an indirect wholly owned subsidiary of Wells Fargo, are the subadvisers to the Fund and are each entitled to receive a fee from Funds Management which is calculated based on the average daily net assets of the Fund. Artisan Partners Limited Partnership and LSV Asset Management are not affiliates of Funds Management.
| | | | | | | | |
| | | Annual subadvisory fee | |
| | |
| | | starting at | | | Declining to | |
| | |
Artisan Partners Limited Partnership | | | 0.80 | % | | | 0.50 | % |
| | |
LSV Asset Management | | | 0.35 | | | | 0.30 | |
| | |
WellsCap | | | 0.45 | | | | 0.40 | |
Administration fees
Under a class-level administration agreement, Funds Management provides class-level administrative services to the Fund, which includes paying fees and expenses for services provided by the transfer agent,sub-transfer agents, omnibus account servicers and record-keepers. As compensation for its services under the class-level administration agreement, Funds Management receives an annual fee which is calculated based on the average daily net assets of each class as follows:
| | | | |
| |
| | | Class-level
administration fee | |
| |
Class A, Class C | | | 0.21 | % |
| |
Class R6 | | | 0.03 | |
| |
Administrator Class, Institutional Class | | | 0.13 | |
Wells Fargo Diversified International Fund | 27
Notes to financial statements (unaudited)
Waivers and/or expense reimbursements
Funds Management has contractually waived and/or reimbursed management and administration fees to the extent necessary to maintain certain net operating expense ratios for the Fund. When each class of the Fund has exceeded its expense cap, Funds Management has waived fees and/or reimbursed expenses from fund-level expenses on a proportionate basis and then from class specific expenses. When only certain classes exceed their expense caps, waivers and/or reimbursements are applied against class specific expenses before fund-level expenses. Funds Management has committed through February 28, 2021 to waive fees and/or reimburse expenses to the extent necessary to cap the Fund’s expenses at 1.35% for Class A shares, 2.10% for Class C shares, 0.89% for Class R6 shares, 1.25% for Administrator Class shares, and 0.99% for Institutional Class shares. Prior to or after the commitment expiration date, the cap may be increased or the commitment to maintain the cap may be terminated only with the approval of the Board of Trustees.
Distribution fee
The Trust has adopted a distribution plan for Class C shares of the Fund pursuant to Rule12b-1 under the 1940 Act. A distribution fee is charged to Class C shares and paid to Wells Fargo Funds Distributor, LLC (“Funds Distributor”), the principal underwriter, at an annual rate of 0.75% of the average daily net assets of Class C shares.
In addition, Funds Distributor is entitled to receive thefront-end sales charge from the purchase of Class A shares and a contingent deferred sales charge on the redemption of certain Class A shares. Funds Distributor is also entitled to receive the contingent deferred sales charges from redemptions of Class C shares. For the six months ended April 30, 2020, Funds Distributor received $209 from the sale of Class A shares. No contingent deferred sales charges were incurred by Class A and Class C shares for the six months ended April 30, 2020.
Shareholder servicing fees
The Trust has entered into contracts with one or more shareholder servicing agents, whereby Class A, Class C, and Administrator Class of the Fund are charged a fee at an annual rate of 0.25% of the average daily net assets of each respective class. A portion of these total shareholder servicing fees were paid to affiliates of Wells Fargo.
Interfund transactions
The Fund may purchase or sell portfolio investment securities to certain other Wells Fargo affiliates pursuant to Rule17a-7 under the 1940 Act and under procedures adopted by the Board of Trustees. The procedures have been designed to ensure that these interfund transactions, which do not incur broker commissions, are effected at current market prices.
5. INVESTMENT PORTFOLIO TRANSACTIONS
Purchases and sales of investments, excluding U.S. government obligations (if any) and short-term securities, for the six months ended April 30, 2020 were $ 20,795,549 and $ 24,506,208, respectively.
6. SECURITIES LENDING TRANSACTIONS
The Fund lends its securities through an unaffiliated securities lending agent and receives collateral in the form of cash or securities with a value at least equal to the value of the securities on loan. The value of the loaned securities is determined at the close of each business day and any increases or decreases in the required collateral are exchanged between the Fund and the counterparty on the next business day. Cash collateral received is invested in the Securities Lending Fund which seeks to provide a positive return compared to the daily Fed Funds Open Rate by investing in high-quality, U.S. dollar-denominated short-term money market instruments and is exempt from registration under Section 3(c)(7) of the 1940 Act. Securities Lending Fund is managed by Funds Management and is subadvised by WellsCap. Funds Management receives an advisory fee starting at 0.05% and declining to 0.01% as the average daily net assets of the Securities Lending Fund increase. All of the fees received by Funds Management are paid to WellsCap for its services as subadviser.
In the event of counterparty default or the failure of a borrower to return a loaned security, the Fund has the right to use the collateral to offset any losses incurred. As of April 30, 2020, the Fund did not have any securities on loan.
7. DERIVATIVE TRANSACTIONS
During the six months ended April 30, 2020, the Fund entered into forward foreign currency contracts for economic hedging purposes. The Fund had average contract amounts of $959,120 and $2,586,396 in forward foreign currency contracts to buy and forward foreign currency contracts to sell, respectively, during the six months ended April 30, 2020.
The fair value, realized gains or losses and change in unrealized gains or losses, if any, on derivative instruments are reflected in the corresponding financial statement captions.
28 | Wells Fargo Diversified International Fund
Notes to financial statements (unaudited)
For certain types of derivative transactions, the Fund has entered into International Swaps and Derivatives Association, Inc. master agreements (“ISDA Master Agreements”) or similar agreements with approved counterparties. The ISDA Master Agreements or similar agreements may have requirements to deliver/deposit securities or cash to/with an exchange or broker-dealer as collateral and allows the Fund to offset, with each counterparty, certain derivative financial instrument’s assets and/or liabilities with collateral held or pledged. Collateral requirements differ by type of derivative. Collateral or margin requirements are set by the broker or exchange clearinghouse for exchange traded derivatives while collateral terms are contract specific forover-the-counter traded derivatives. Cash collateral that has been pledged to cover obligations of the Fund under ISDA Master Agreements or similar agreements, if any, are reported separately in the Statement of Assets and Liabilities. Securities pledged as collateral, if any, are noted in the Portfolio of Investments. With respect to balance sheet offsetting, absent an event of default by the counterparty or a termination of the agreement, the reported amounts of financial assets and financial liabilities in the Statement of Assets and Liabilities are not offset across transactions between the Fund and the applicable counterparty. A reconciliation of the gross amounts on the Statement of Assets and Liabilities to the net amounts by counterparty, including any collateral exposure, for OTC derivatives is as follows:
| | | | | | | | | | | | |
| | | | |
| Counterparty | | Gross amounts
of assets in the
Statement of
Assets and
Liabilities | | Amounts
subject to
netting
agreements | | Collateral
pledged | | | Net amount
of assets | |
| | | | |
Credit Suisse | | $33,075
| | $0 | | $ | 0 | | | $ | 33,075 | |
| | | | |
| Counterparty | | Gross amounts
of liabilities in
the Statement
of Assets and
Liabilities | | Amounts
subject to
netting
agreements | | Collateral
pledged | | | Net amount
of liabilities | |
| | | | |
State Street Bank | | 1,658 | | $0 | | $ | 0 | | | | 1,658 | |
8. BANK BORROWINGS
The Trust (excluding the money market funds), Wells Fargo Master Trust and Wells Fargo Variable Trust are parties to a $280,000,000 revolving credit agreement whereby the Fund is permitted to use bank borrowings for temporary or emergency purposes, such as to fund shareholder redemption requests. Interest under the credit agreement is charged to the Fund based on a borrowing rate equal to the higher of the Federal Funds rate in effect on that day plus 1.25% or the overnight LIBOR rate in effect on that day plus 1.25%. In addition, an annual commitment fee equal to 0.25% of the unused balance is allocated to each participating fund.
For the six months ended April 30, 2020, there were no borrowings by the Fund under the agreement.
9. INDEMNIFICATION
Under the Fund’s organizational documents, the officers and Trustees have been granted certain indemnification rights against certain liabilities that may arise out of performance of their duties to the Fund. The Fund has entered into a separate agreement with each Trustee that converts indemnification rights currently existing under the Fund’s organizational documents into contractual rights that cannot be changed in the future without the consent of the Trustee. Additionally, in the normal course of business, the Fund may enter into contracts with service providers that contain a variety of indemnification clauses. The Fund’s maximum exposure under these arrangements is dependent on future claims that may be made against the Fund and, therefore, cannot be estimated.
10. NEW ACCOUNTING PRONOUNCEMENT
In August 2018, FASB issued Accounting Standards Update (“ASU”)No. 2018-13, Fair Value Measurement (Topic 820)Disclosure Framework—Changes to the Disclosure Requirements for Fair Value Measurement. ASU2018-13 updates the disclosure requirements for fair value measurements by modifying or removing certain disclosures and adding certain new disclosures. The amendments are effective for fiscal years, and interim periods within those fiscal years, beginning after December 15, 2019. Early adoption is permitted. Management has adopted the removal and modification of disclosures early, as permitted, and will adopt the additional new disclosures at the effective date.
Wells Fargo Diversified International Fund | 29
Notes to financial statements (unaudited)
11. CORONAVIRUS(COVID-19) PANDEMIC
On March 11, 2020, the World Health Organization announced that it had made the assessment that coronavirus disease 2019(“COVID-19”) is a pandemic. The impacts ofCOVID-19 are adversely affecting the entire global economy, individual companies and investment products, and the market in general. There is significant uncertainty around the extent and duration of business disruptions related toCOVID-19 and the impacts may be short term or may last for an extended period of time. The risk of further spreading ofCOVID-19 has led to significant uncertainty and volatility in the financial markets. The value of the Fund and the securities in which the Fund invests have generally been adversely affected by impacts caused byCOVID-19.
30 | Wells Fargo Diversified International Fund
Other information (unaudited)
TAX INFORMATION
Pursuant to Section 853 of the Internal Revenue Code, the following amounts have been designated as foreign taxes paid for the fiscal year ended October 31, 2019. These amounts may be less than the actual foreign taxes paid for financial statement purposes. Foreign taxes paid or withheld should be included in taxable income with an offsetting deduction from gross income or as a credit for taxes paid to foreign governments. None of the income was derived from ineligible foreign sources as defined under Section 901(j) of the Internal Revenue Code.
| | | | |
Creditable foreign taxes paid | | Per share amount | | Foreign income as % of ordinary income distributions |
| | |
| $257,618 | | $0.0340 | | 95.56% |
PROXY VOTING INFORMATION
A description of the policies and procedures used to determine how to vote proxies relating to portfolio securities is available, upon request, by calling1-800-222-8222, visiting our website atwfam.com, or visiting the SEC website at sec.gov. Information regarding how the proxies related to portfolio securities were voted during the most recent12-month period ended June 30 is available on the website atwfam.comor by visiting the SEC website at sec.gov.
QUARTERLY PORTFOLIO HOLDINGS INFORMATION
The Fund files its complete schedule of portfolio holdings with the SEC for the first and third quarters of each fiscal year as an exhibit to its reports on FormN-PORT. Shareholders may view the filed FormN-PORT by visiting the SEC website at sec.gov.
Wells Fargo Diversified International Fund | 31
Other information (unaudited)
BOARD OF TRUSTEES AND OFFICERS
Each of the Trustees and Officers1 listed in the table below acts in identical capacities for each fund in the Wells Fargo family of funds, which consists of 147 mutual funds comprising the Wells Fargo Funds Trust, Wells Fargo Variable Trust, Wells Fargo Master Trust and fourclosed-end funds (collectively the “Fund Complex”). This table should be read in conjunction with the Prospectus and the Statement of Additional Information2. The mailing address of each Trustee and Officer is 525 Market Street, 12th Floor, San Francisco, CA 94105. Each Trustee and Officer serves an indefinite term, however, each Trustee serves such term until reaching the mandatory retirement age established by the Trustees.
Independent Trustees
| | | | | | |
Name and year of birth | | Position held and
length of service* | | Principal occupations during past five years or longer | | Current other
public company or
investment
company
directorships |
| | | |
William R. Ebsworth (Born 1957) | | Trustee, since 2015 | | Retired. From 1984 to 2013, equities analyst, portfolio manager, research director and chief investment officer at Fidelity Management and Research Company in Boston, Tokyo, and Hong Kong, and retired in 2013 as Chief Investment Officer of Fidelity Strategic Advisers, Inc. where he led a team of investment professionals managing client assets. Prior thereto, Board member of Hong Kong Securities Clearing Co., Hong Kong Options Clearing Corp., the Thailand International Fund, Ltd., Fidelity Investments Life Insurance Company, and Empire Fidelity Investments Life Insurance Company. Audit Committee Chair and Investment Committee Chair of the Vincent Memorial Hospital Endowment(non-profit organization). Mr. Ebsworth is a CFA® charterholder. | | N/A |
| | | |
Jane A. Freeman (Born 1953) | | Trustee, since 2015; Chair Liaison, since 2018 | | Retired. From 2012 to 2014 and 1999 to 2008, Chief Financial Officer of Scientific Learning Corporation. From 2008 to 2012, Ms. Freeman provided consulting services related to strategic business projects. Prior to 1999, Portfolio Manager at Rockefeller & Co. and Scudder, Stevens & Clark. Board member of the Harding Loevner Funds from 1996 to 2014, serving as both Lead Independent Director and chair of the Audit Committee. Board member of the Russell Exchange Traded Funds Trust from 2011 to 2012 and the chair of the Audit Committee. Ms. Freeman is also an inactive Chartered Financial Analyst. | | N/A |
| | | |
Isaiah Harris, Jr. (Born 1952) | | Trustee, since 2009; Audit Committee Chairman, since 2019 | | Retired. Chairman of the Board of CIGNA Corporation since 2009, and Director since 2005. From 2003 to 2011, Director of Deluxe Corporation. Prior thereto, President and CEO of BellSouth Advertising and Publishing Corp. from 2005 to 2007, President and CEO of BellSouth Enterprises from 2004 to 2005 and President of BellSouth Consumer Services from 2000 to 2003. Emeritus member of the Iowa State University Foundation Board of Governors. Emeritus Member of the Advisory Board of Iowa State University School of Business. Advisory Board Member, Palm Harbor Academy (private school). Advisory Board Member, Child Evangelism Fellowship(non-profit). Mr. Harris is a certified public accountant (inactive status). | | CIGNA Corporation |
| | | |
Judith M. Johnson (Born 1949) | | Trustee, since 2008; Audit Committee Chairman, from 2009 to 2018 | | Retired. Prior thereto, Chief Executive Officer and Chief Investment Officer of Minneapolis Employees Retirement Fund from 1996 to 2008. Ms. Johnson is an attorney, certified public accountant and a certified managerial accountant. | | N/A |
32 | Wells Fargo Diversified International Fund
Other information (unaudited)
| | | | | | |
Name and year of birth | | Position held and
length of service* | | Principal occupations during past five years or longer | | Current other
public company or
investment
company
directorships |
| | | |
David F. Larcker (Born 1950) | | Trustee, since 2009 | | James Irvin Miller Professor of Accounting at the Graduate School of Business, Stanford University, Director of the Corporate Governance Research Initiative and Senior Faculty of The Rock Center for Corporate Governance since 2006. From 2005 to 2008, Professor of Accounting at the Graduate School of Business, Stanford University. Prior thereto, Ernst & Young Professor of Accounting at The Wharton School, University of Pennsylvania from 1985 to 2005. | | N/A |
| | | |
Olivia S. Mitchell (Born 1953) | | Trustee, since 2006; Nominating and Governance Committee Chair, since 2018 | | International Foundation of Employee Benefit Plans Professor, Wharton School of the University of Pennsylvania since 1993. Director of Wharton’s Pension Research Council and Boettner Center on Pensions & Retirement Research, and Research Associate at the National Bureau of Economic Research. Previously, Cornell University Professor from 1978 to 1993. | | N/A |
| | | |
Timothy J. Penny (Born 1951) | | Trustee, since 1996; Chairman, since 2018 | | President and Chief Executive Officer of Southern Minnesota Initiative Foundation, anon-profit organization, since 2007. Member of the Board of Trustees of NorthStar Education Finance, Inc., anon-profit organization, since 2007. | | N/A |
| | | |
James G. Polisson (Born 1959) | | Trustee, since 2018 | | Retired. Chief Marketing Officer, Source (ETF) UK Services, Ltd, from 2015 to 2017. From 2012 to 2015, Principal of The Polisson Group, LLC, a management consulting, corporate advisory and principal investing company. Chief Executive Officer and Managing Director at Russell Investments, Global Exchange Traded Funds from 2010 to 2012. Managing Director of Barclays Global Investors from 1998 to 2010 and Global Chief Marketing Officer for iShares and Barclays Global Investors from 2000 to 2010. Trustee of the San Francisco Mechanics’ Institute, anon-profit organization, from 2013 to 2015. Board member of the Russell Exchange Traded Fund Trust from 2011 to 2012. Director of Barclays Global Investors Holdings Deutschland GmbH from 2006 to 2009. Mr. Polisson is an attorney and has a retired status with the Massachusetts and District of Columbia Bar Associations. | | N/A |
| | | |
Pamela Wheelock (Born 1959) | | Trustee, since January 2020; previously Trustee from January 2018 to July 2019 | | Board member of the Destination Medical Center Economic Development Agency, Rochester, Minnesota since 2019 and Interim President of the McKnight Foundation since 2020. Acting Commissioner, Minnesota Department of Human Services, July 2019 through September 2019. Human Services Manager (part-time), Minnesota Department of Human Services, October 2019 through December 2019. Chief Operating Officer, Twin Cities Habitat for Humanity from 2017 to 2019. Vice President of University Services, University of Minnesota from 2012 to 2016. Prior thereto, on the Board of Directors, Governance Committee and Finance Committee for the Minnesota Philanthropy Partners (Saint Paul Foundation) from 2012 to 2018, Interim Chief Executive Officer of Blue Cross Blue Shield of Minnesota from 2011 to 2012, Chairman of the Board from 2009 to 2012 and Board Director from 2003 to 2015. Vice President, Leadership and Community Engagement, Bush Foundation, Saint Paul, Minnesota (a private foundation) from 2009 to 2011. Executive Vice President and Chief Financial Officer, Minnesota Sports and Entertainment from 2004 to 2009 and Senior Vice President from 2002 to 2004. Executive Vice President of the Minnesota Wild Foundation from 2004 to 2008. Commissioner of Finance, State of Minnesota, from 1999 to 2002. Currently Board Chair of the Minnesota Wild Foundation since 2010. | | N/A |
| * | Length of service dates reflect the Trustee’s commencement of service with the Trust’s predecessor entities, where applicable. |
Wells Fargo Diversified International Fund | 33
Other information (unaudited)
Officers
| | | | |
Name and year of birth | | Position held and
length of service | | Principal occupations during past five years or longer |
| | |
Andrew Owen (Born 1960) | | President, since 2017 | | Executive Vice President of Wells Fargo & Company and Head of Affiliated Managers, Wells Fargo Asset Management, since 2014. In addition, Mr. Owen is currently President, Chief Executive Officer and Director of Wells Fargo Funds Management, LLC since 2017. Prior thereto, Executive Vice President responsible for marketing, investments and product development for Wells Fargo Funds Management, LLC, from 2009 to 2014. |
| | |
Jeremy DePalma1 (Born 1974) | | Treasurer, since 2012 | | Senior Vice President of Wells Fargo Funds Management, LLC since 2009. Senior Vice President of Evergreen Investment Management Company, LLC from 2008 to 2010 and head of the Fund Reporting and Control Team within Fund Administration from 2005 to 2010. |
| | |
Michelle Rhee (Born 1966) | | Chief Legal Officer, since 2019 | | Secretary of Wells Fargo Funds Management, LLC, Chief Legal Counsel of Wells Fargo Asset Management and Assistant General Counsel of Wells Fargo Bank, N.A. since 2018. Associate General Counsel and Managing Director of Bank of America Corporation from 2004 to 2018. |
| | |
Catherine Kennedy (Born 1969) | | Secretary, since 2019 | | Vice President of Wells Fargo Funds Management, LLC and Senior Counsel of the Wells Fargo Legal Department since 2010. Vice President and Senior Counsel of Evergreen Investment Management Company, LLC from 1998 to 2010. |
| | |
Michael H. Whitaker (Born 1967) | | Chief Compliance Officer, since 2016 | | Chief Compliance Officer of Wells Fargo Asset Management since 2016. Senior Vice President and Chief Compliance Officer for Fidelity Investments from 2007 to 2016. |
| | |
David Berardi (Born 1975) | | Assistant Treasurer, since 2009 | | Vice President of Wells Fargo Funds Management, LLC since 2009. Vice President of Evergreen Investment Management Company, LLC from 2008 to 2010. Manager of Fund Reporting and Control for Evergreen Investment Management Company, LLC from 2004 to 2010. |
| 1 | Jeremy DePalma acts as Treasurer of 82 funds and Assistant Treasurer of 65 funds in the Fund Complex. |
| 2 | The Statement of Additional Information includes additional information about the Trustees and is available, without charge, upon request, by calling1-800-222-8222 or by visiting the website atwfam.com. |
34 | Wells Fargo Diversified International Fund
Appendix I (unaudited)
Effective on or about May 1, 2020, if you purchase Fund shares through a Janney Montgomery Scott LLC (“Janney”) brokerage account, you will be eligible for the following load waivers (front-end sales charge waivers and contingent deferred sales charge (“CDSC”), or back-end sales charge, waivers) and discounts, which may differ from those disclosed elsewhere in the Fund’s Prospectus or SAI.
|
| Front-end sales charge* waivers on Class A shares available at Janney |
|
| Shares purchased through reinvestment of capital gains distributions and dividend reinvestment when purchasing shares of the same fund (but not any other fund within the fund family). |
|
| Shares purchased by employees and registered representatives of Janney or its affiliates and their family members as designated by Janney. |
|
| Shares purchased from the proceeds of redemptions within the same fund family, provided (1) the repurchase occurs within ninety (90) days following the redemption, (2) the redemption and purchase occur in the same account, and (3) redeemed shares were subject to a front-end or deferred sales load (i.e., right of reinstatement). |
|
| Employer-sponsored retirement plans (e.g., 401(k) plans, 457 plans, employer-sponsored 403(b) plans, profit sharing and money purchase pension plans and defined benefit plans). For purposes of this provision, employer-sponsored retirement plans do not include SEP IRAs, Simple IRAs, SAR-SEPs or Keogh plans. |
|
| Shares acquired through a right of reinstatement. |
|
| Class C shares that are no longer subject to a contingent deferred sales charge and are converted to Class A shares of the same fund pursuant to Janney’s policies and procedures. |
| CDSC waivers on Class A and Class C shares available at Janney |
|
| Shares sold upon the death or disability of the shareholder. |
|
| Shares sold as part of a systematic withdrawal plan as described in the Fund’s Prospectus. |
|
| Shares purchased in connection with a return of excess contributions from an IRA account. |
|
| Shares sold as part of a required minimum distribution for IRA and retirement accounts if the redemption is taken in or after the year the shareholder reaches qualified age based on applicable IRS regulations. |
|
| Shares sold to pay Janney fees but only if the transaction is initiated by Janney. |
|
| Shares acquired through a right of reinstatement. |
|
| Shares exchanged into the same share class of a different fund. |
| Front-end sales charge* discounts available at Janney; breakpoints, rights of accumulation and/or letters of intent |
|
| Breakpoints as described in the Fund’s Prospectus. |
|
| Rights of accumulation (“ROA”), which entitle shareholders to breakpoint discounts, will be automatically calculated based on the aggregated holding of fund family assets held by accounts within the purchaser’s household at Janney. Eligible fund family assets not held at Janney may be included in the ROA calculation only if the shareholder notifies his or her financial advisor about such assets. |
|
| Letters of intent which allow for breakpoint discounts based on anticipated purchases within a fund family, over a 13-month time period. Eligible fund family assets not held at Janney Montgomery Scott may be included in the calculation of letters of intent only if the shareholder notifies his or her financial advisor about such assets. |
| * | Also referred to as an “initial sales charge.” |
Wells Fargo Diversified International Fund | 35
Appendix II (unaudited)
Effective on or after May 1, 2020, clients of Edward Jones (also referred to as “shareholders”) purchasing Fund shares on the Edward Jones commission and fee-based platforms are eligible only for the following sales charge discounts (also referred to as “breakpoints”) and waivers, which can differ from breakpoints and waivers described elsewhere in the Fund’s Prospectus or SAI or through another broker-dealer. In all instances, it is the shareholder’s responsibility to inform Edward Jones at the time of purchase of any relationship, holdings of Wells Fargo Funds or other facts qualifying the purchaser for breakpoints or waivers. Edward Jones can ask for documentation of such circumstance.
|
| Breakpoints available at Edward Jones |
|
| Rights of Accumulation (ROA) |
|
The applicable sales charge on a purchase of Class A shares is determined by taking into account all share classes (except any money market funds and retirement plan share classes) of Wells Fargo Funds held by the shareholder or in an account grouped by Edward Jones with other accounts for the purpose of providing certain pricing considerations (“pricing groups”). This includes all share classes held on the Edward Jones platform and/or held on another platform. The inclusion of eligible fund family assets in the rights of accumulation calculation is dependent on the shareholder notifying his or her financial advisor of such assets at the time of calculation. |
|
ROA is determined by calculating the higher of cost or market value (current shares x NAV). |
|
| Letter of Intent (LOI) |
|
Through a LOI, shareholders can receive the sales charge and breakpoint discounts for purchases shareholders intend to makeover a 13-month period from the date Edward Jones receives the LOI. The LOI is determined by calculating the higher of cost or market value of qualifying holdings at LOI initiation in combination with the value that the shareholder intends to buy over a 13-month period to calculate the front-end sales charge and any breakpoint discounts. Each purchase the shareholder makes during that 13-month period will receive the sales charge and breakpoint discount that applies to the total amount. The inclusion of eligible fund family assets in the LOI calculation is dependent on the shareholder notifying his or her financial advisor of such assets at the time of calculation. Purchases made before the LOI is received by Edward Jones are not covered under the LOI and will not reduce the sales charge previously paid. Sales charges will be adjusted if LOI is not met. |
| Sales charges are waived for the following shareholders and in the following situations at Edward Jones: |
● Associates of Edward Jones and its affiliates and their family members who are in the same pricing group (as determined by Edward Jones under its policies and procedures) as the associate. This waiver will continue for the remainder of the associate’s life if the associate retires from Edward Jones in good-standing. |
● Shares purchased in an Edward Jones fee-based program. |
● Shares purchased through reinvestment of capital gains distributions and dividend reinvestment. |
● Shares purchased from the proceeds of redeemed shares of the same fund family so long as the following conditions are met: 1)the proceeds are from the sale of shares within 60 days of the purchase, and 2) the sale and purchase are made in the same share class and the same account or the purchase is made in an individual retirement account with proceeds from liquidations in anon-retirement account. |
● Shares exchanged into Class A shares from another share class so long as the exchange is into the same fund and was initiated at the discretion of Edward Jones. Edward Jones is responsible for any remaining CDSC due to the fund company, if applicable. Any future purchases are subject to the applicable sales charge as disclosed in the prospectus. |
● Exchanges from Class C shares to Class A shares of the same fund, generally, in the 84th month following the anniversary of the purchase date or earlier at the discretion of Edward Jones. |
If the shareholder purchases shares that are subject to a CDSC and those shares are redeemed before the CDSC is expired, the shareholder
is responsible to pay the CDSC except in the following conditions available at Edward Jones: |
● The death or disability of the shareholder. |
● Systematic withdrawals with up to 10% per year of the account value. |
● Return of excess contributions from an Individual Retirement Account (IRA). |
● Shares sold as part of a required minimum distribution for IRA and retirement accounts if the redemption is taken in or after the year the shareholder reaches qualified age based on applicable IRS regulation. |
● Shares sold to pay Edward Jones fees or costs in such cases where the transaction is initiated by Edward Jones. |
● Shares exchanged in an Edward Jones fee-based program. |
● Shares acquired through NAV reinstatement. |
36 | Wells Fargo Diversified International Fund
Appendix II (unaudited)
|
| Other Important Information for accounts at Edward Jones: |
| Minimum Purchase Amounts |
● $250 initial purchase minimum |
● $50 subsequent purchase minimum |
|
| Minimum Balances |
| Edward Jones has the right to redeem at its discretion fund holdings with a balance of $250 or less. The following are examples of accounts that are not included in this policy: |
● A fee-based account held on an Edward Jones platform |
● A 529 account held on an Edward Jones platform |
● An account with an active systematic investment plan or letter of intent (LOI) |
|
| Changing Share Classes |
| At any time it deems necessary, Edward Jones has the authority to exchange at NAV a shareholder’s holdings in a fund to Class A shares. |
Wells Fargo Diversified International Fund | 37
Appendix III (unaudited)
Effective June 1, 2020, shareholders purchasing Fund shares through an Oppenheimer & Co. Inc. (“Oppenheimer”) platform or account are eligible only for the following load waivers (front-end sales charge waivers and contingent deferred or back-end, sales charge waivers) and discounts, which may differ from those disclosed in the Fund’s Prospectus or SAI.
|
| Front-end Sales Load Waivers on Class A Shares available at Oppenheimer |
|
| Employer-sponsored retirement, deferred compensation and employee benefit plans (including health savings accounts) and trusts used to fund those plans, provided that the shares are not held in a commission-based brokerage account and shares are held for the benefit of the plan. |
|
| Shares purchased by or through a 529 Plan. |
|
| Shares purchased through an Oppenheimer affiliated investment advisory program. |
|
| Shares purchased through reinvestment of capital gains distributions and dividend reinvestment when purchasing shares of the same fund (but not any other fund within the fund family). |
|
| Shares purchased from the proceeds of redemptions within the same fund family, provided (1) the repurchase occurs within 90 days following the redemption, (2) the redemption and purchase occur in the same account, and (3) redeemed shares were subject to a front-end or deferred sales load (known as Rights of Restatement). |
|
| A shareholder in the Fund’s Class C shares will have their shares exchanged at net asset value to Class A shares (or the appropriate share class) of the Fund if the shares are no longer subject to a CDSC and the exchange is in line with the policies and procedures of Oppenheimer. |
|
| Employees and registered representatives of Oppenheimer or its affiliates and their family members. |
|
| Directors or Trustees of the Fund, and employees of the Fund’s investment adviser or any of its affiliates, as described in the Prospectus. |
| CDSC Waivers on A and C Shares available at Oppenheimer |
|
| Death or disability of the shareholder. |
|
| Shares sold as part of a systematic withdrawal plan as described in the Prospectus. |
|
| Return of excess contributions from an IRA Account. |
|
| Shares sold as part of a required minimum distribution for IRA and retirement accounts due to the shareholder reaching the qualified age based on applicable IRS regulations as described in the Prospectus. |
|
| Shares sold to pay Oppenheimer fees but only if the transaction is initiated by Oppenheimer. |
|
| Shares acquired through a right of reinstatement. |
| Front-end load Discounts Available at Oppenheimer: Breakpoints, Rights of Accumulation & Letters of Intent |
|
| Breakpoints as described in the Prospectus. |
|
| Rights of Accumulation (ROA), which entitle shareholders to breakpoint discounts, will be automatically calculated based on the aggregated holding of fund family assets held by accounts within the purchaser’s household at Oppenheimer. Eligible fund family assets not held at Oppenheimer may be included in the ROA calculation only if the shareholder notifies his or her financial advisor about such assets. |
38 | Wells Fargo Diversified International Fund
Appendix IV (unaudited)
Effective June 15, 2020, shareholders purchasing fund shares through a Robert W. Baird & Co. (“Baird”) platform or account will only be eligible for the following sales charge waivers (front-end sales charge waivers and CDSC waivers) and discounts, which may differ from those disclosed elsewhere in the Fund’s Prospectus or the SAI.
|
| Front-end Sales Load Waivers on Class A Shares available at Baird |
|
| Shares purchased through reinvestment of capital gains distributions and dividend reinvestment when purchasing share of the same fund. |
|
| Share purchase by employees and registers representatives of Baird or its affiliate and their family members as designated by Baird. |
|
| Shares purchase from the proceeds of redemptions within the same fund family, provided (1) the repurchase occurs within 90 days following the redemption, (2) the redemption and purchase occur in the same accounts, and (3) redeemed shares were subject to a front-end or deferred sales charge (known as rights of reinstatement). |
|
| A shareholder in the Funds Investor C Shares will have their share exchanged at net asset value to Investor A shares of the fund if the shares are no longer subject to CDSC and the exchange is in line with the policies and procedures of Baird. |
|
| Employer-sponsored retirement plans or charitable accounts in a transactional brokerage account at Baird, including 401(k)plans, 457 plans, employer-sponsored 403(b) plans, profit sharing and money purchase pension plans and defined benefit plans. For purposes of this provision, employer-sponsored retirement plans do not include SEP IRAs, Simple IRAs or SAR-SEPs. |
| CDSC Waivers on A and C Shares available at Baird |
|
| Shares sold due to death or disability of the shareholder. |
|
| Shares sold as part of a systematic withdrawal plan as described in the Fund’s Prospectus. |
|
| Shares bought due to returns of excess contributions from an IRA Account. |
|
| Shares sold as part of a required minimum distribution for IRA and retirement accounts due to the shareholder reaching age 72 as described in the Fund’s Prospectus. |
|
| Shares sold to pay Baird fees but only if the transaction is initiated by Baird. |
|
| Shares acquired through a right of reinstatement. |
| Front-end load Discounts Available at Baird: Breakpoint and/or Rights of Accumulation |
|
| Breakpoints as described in the Prospectus. |
|
| Rights of accumulations which entitles shareholders to breakpoint discounts will be automatically calculated based on the aggregated holding of fund family assets held by accounts within the purchaser’s household at Baird. Eligible fund family assets not held at Baird may be included in the rights of accumulations calculation only if the shareholder notifies his or her financial advisor about such assets. |
|
| Letters of Intent (LOI) allow for breakpoint discounts based on anticipated purchases within a fund family through Baird, over a 13-month period of time. |
Wells Fargo Diversified International Fund | 39
This page is intentionally left blank.

For more information
More information about Wells Fargo Funds is available free upon request. To obtain literature, please write, visit the Fund’s website, or call:
Wells Fargo Funds
P.O. Box 219967
Kansas City, MO 64121-9967
Website:wfam.com
Individual investors:1-800-222-8222
Retail investment professionals:1-888-877-9275
Institutional investment professionals:1-866-765-0778

This report and the financial statements contained herein are submitted for the general information of the shareholders of the Fund. If this report is used for promotional purposes, distribution of the report must be accompanied or preceded by a current prospectus. Before investing, please consider the investment objectives, risks, charges, and expenses of the investment. For a current prospectus and, if available, a summary prospectus, containing this information, call1-800-222-8222 or visit the Fund’s website atwfam.com. Read the prospectus carefully before you invest or send money.
Wells Fargo Asset Management (WFAM) is the trade name for certain investment advisory/management firms owned by Wells Fargo & Company. These firms include but are not limited to Wells Capital Management Incorporated and Wells Fargo Funds Management, LLC. Certain products managed by WFAM entities are distributed by Wells Fargo Funds Distributor, LLC (a broker-dealer and Member FINRA).
This material is for general informational and educational purposes only and is NOT intended to provide investment advice or a recommendation of any kind—including a recommendation for any specific investment, strategy, or plan.
INVESTMENT PRODUCTS: NOT FDIC INSURED ◾ NO BANK GUARANTEE ◾ MAY LOSE VALUE
© 2019 Wells Fargo & Company. All rights reserved.
PAR-0520-00402 06-20
SA237/SAR237 04-20
Semi-Annual Report
April 30, 2020
Wells Fargo
International Equity Fund
Beginning on January 1, 2021, as permitted by new regulations adopted by the Securities and Exchange Commission, paper copies of the Wells Fargo Funds’ annual and semi-annual shareholder reports issued after this date will no longer be sent by mail, unless you specifically request paper copies of the reports. Instead, the reports will be made available on the Funds’ website, and you will be notified by mail each time a report is posted and provided with a website address to access the report.
If you already elected to receive shareholder reports electronically, you will not be affected by this change and you need not take any action. You may elect to receive shareholder reports and other communications from the Fund electronically at any time by contacting your financial intermediary (such as a broker-dealer or bank) or, if you are a direct investor, by calling1-800-222-8222 or by enrolling at wellsfargo.com/advantagedelivery.
You may elect to receive all future reports in paper free of charge. If you invest through a financial intermediary, you can contact your financial intermediary to request that you continue to receive paper copies of your shareholder reports; if you invest directly with the Fund, you can call 1-800-222-8222. Your election to receive reports in paper will apply to all Wells Fargo Funds held in your account with your financial intermediary or, if you are a direct investor, to all Wells Fargo Funds that you hold.
|
|
|
Reduce clutter. Save trees. |
Sign up for electronic
delivery of prospectuses and
shareholder reports atwellsfargo.com/
advantagedelivery |
The views expressed and any forward-looking statements are as of April 30, 2020, unless otherwise noted, and are those of the Fund managers and/or Wells Fargo Asset Management. Discussions of individual securities, or the markets generally, or any Wells Fargo Fund are not intended as individual recommendations. Future events or results may vary significantly from those expressed in any forward-looking statements. The views expressed are subject to change at any time in response to changing circumstances in the market. Wells Fargo Asset Management and the Fund disclaim any obligation to publicly update or revise any views expressed or forward-looking statements.
INVESTMENT PRODUCTS: NOT FDIC INSURED ◾ NO BANK GUARANTEE ◾ MAY LOSE VALUE
Wells Fargo International Equity Fund | 1
Letter to shareholders (unaudited)

Andrew Owen
President
Wells Fargo Funds
“The period began with a tailwind created by central bank support.”
Dear Shareholder:
We are pleased to offer you this semi-annual report for the Wells Fargo International Equity Fund for the six-month period that ended April 30, 2020. Global stock markets saw earlier gains erased in February and March as governments took unprecedented measures to stop the spread of the coronavirus at the expense of short-term economic output. Markets rebounded in April to lessen the losses as central banks attempted to bolster capital markets and confidence. Fixed-income markets performed better, with the exception of high-yield bonds, as U.S. bonds overall achieved modest gains.
For the six-month period, U.S. stocks, based on the S&P 500 Index,1 returned -3.16% and international stocks, as measured by the MSCI ACWI ex USA Index (Net),2 fell 13.22%. The MSCI Emerging Markets Index (Net)3 lost 10.50%. For bond investors, the Bloomberg Barclays U.S. Aggregate Bond Index4 added 4.86%, the Bloomberg Barclays Global Aggregate ex-USD Index5 returned -0.97%, the Bloomberg Barclays Municipal Bond Index6 returned -1.33%, and the ICE BofA U.S. High Yield Index7 lost 7.68%.
The period began with a tailwind created by central bank support.
The period began with a tailwind that had been created by U.S. Federal Reserve (Fed) rate cuts in the summer and early fall. Equity markets rallied in November despite ongoing geopolitical risks. Hopes for a U.S.-China trade deal buoyed investor confidence. U.S. business sentiment edged up, and manufacturing and services activity rose. With that positive backdrop, developed market equities outpaced those in emerging markets, and U.S. stocks outperformed non-U.S. stocks overall. While consumer confidence and purchasing manager activity rose in the eurozone, China reported weakening manufacturing and consumer data. Bond yields rose marginally, leading to slightly negative returns for global government and investment-grade corporate bonds.
Financial markets ended 2019 with a boost from the U.S. and China accord on a Phase One trade deal. That, along with the landslide win by the pro-Brexit U.K. Conservative Party in a national election and ongoing central bank support, gave investors greater confidence. U.S. economic indicators were positive overall, with the exception of manufacturing activity and business confidence. Consumer confidence was resilient, fed by a robust labor market, tame inflation, and lower interest rates, which boosted housing affordability and stimulated homebuyer activity. The impeachment of U.S. President Donald Trump had little impact on markets. Meanwhile, slowing Chinese economic activity, partly attributable to the trade war, led to further government stimulus at year-end through lower reserve ratios, allowing banks to lend more money.
The year-end rally continued in early January 2020. However, capital market volatility spiked in late January on concerns over the potential impact of the coronavirus on the global economy and stock markets. With sentiment somewhat souring, perceived safe
| 1 | The S&P 500 Index consists of 500 stocks chosen for market size, liquidity, and industry group representation. It is a market-value-weighted index with each stock’s weight in the index proportionate to its market value. You cannot invest directly in an index. |
| 2 | The Morgan Stanley Capital International (MSCI) All Country World Index (ACWI) ex USA Index (Net) is a free-float-adjusted market-capitalization-weighted index that is designed to measure the equity market performance of developed markets, excluding the United States. Source: MSCI. MSCI makes no express or implied warranties or representations and shall have no liability whatsoever with respect to any MSCI data contained herein. The MSCI data may not be further redistributed or used as a basis for other indices or any securities or financial products. This report is not approved, reviewed, or produced by MSCI. You cannot invest directly in an index. |
| 3 | The MSCI Emerging Markets (EM) Index (Net) is a free-float-adjusted market-capitalization-weighted index that is designed to measure equity market performance of emerging markets. You cannot invest directly in an index. |
| 4 | The Bloomberg Barclays U.S. Aggregate Bond Index is a broad-based benchmark that measures the investment-grade, U.S. dollar-denominated, fixed-rate taxable bond market, including Treasuries, government-related and corporate securities, mortgage-backed securities (agency fixed-rate and hybrid adjustable-rate mortgage pass-throughs), asset-backed securities, and commercial mortgage-backed securities. You cannot invest directly in an index. |
| 5 | The Bloomberg Barclays Global Aggregate ex-USD Index is an unmanaged index that provides a broad-based measure of the global investment-grade fixed-income markets excluding the U.S. dollar-denominated debt market. You cannot invest directly in an index. |
| 6 | The Bloomberg Barclays Municipal Bond Index is an unmanaged index composed of long-term tax-exempt bonds with a minimum credit rating of Baa. You cannot invest directly in an index. |
| 7 | The ICE BofA U.S. High Yield Index is a market-capitalization-weighted index of domestic and Yankee high-yield bonds. The index tracks the performance of high-yield securities traded in the U.S. bond market. You cannot invest directly in an index. Copyright 2020. ICE Data Indices, LLC. All rights reserved. |
2 | Wells Fargo International Equity Fund
Letter to shareholders (unaudited)
havens did well in January. The U.S. dollar and Japanese yen both rose, and government bonds outperformed equities. While the S&P 500 Index held its ground, emerging market equities tumbled, including those in Asia.
In February, the coronavirus became the major market focus. Fears of the virus’s impact on global growth led to expectations of increased global central bank monetary policy support. That led the 10-year U.S. Treasury yield to fall to an all-time low of 1.1% by the end of the month. Although equity markets initially shrugged off concerns about the outbreak, focusing instead on strong fourth-quarter earnings and improving business confidence in January, market sentiment turned sharply lower toward month-end. Oil prices tumbled as Russia and the Organization of the Petroleum Exporting Countries compounded a major decline in oil demand with a brutal price war, causing the price of West Texas Intermediate crude oil to fall 13% in February alone.
The global spread of the coronavirus led many countries to clamp down on social and business-related activity in order to contain the virus from causing even greater devastation and overwhelming the health care system. This abrupt stoppage of economic activity led to the sharp deceleration of global output, sending economies into a deep contraction. Central bank responses were swift, as they slashed interest rates and expanded quantitative easing programs to restore liquidity and confidence to the markets. In the U.S., the Fed launched several lending programs, funding investment-grade bonds, money market mutual funds, and commercial paper while purchasing Treasuries, mortgage-backed securities, and overnight repurchase agreements . Meanwhile, stock markets tumbled quickly into a bear market, ending the longest bull stock market in U.S. history.
Markets rebounded strongly in April after the extreme volatility of the previous two months, with the S&P 500 Index gaining 12.8% for the month and the MSCI ACWI ex USA Index (Net) returning 7.6%. The rebound was fueled by unprecedented stimulus measures taken by governments and central banks to buffer the economic damage created by mass shutdowns to try to contain the virus’s spread. The U.S. economy contracted by an annualized 4.8% pace in the first quarter, with 30 million new unemployment insurance claims in six weeks. In the eurozone, first-quarter real gross domestic product (GDP) shrank 3.8%, with the composite April Flash Purchasing Managers’ Index, a monthly survey of purchasing managers, falling to an all-time low of 13.5. The European Central Bank expanded its quantitative easing to include the purchase of additional government bonds of countries with the greatest virus-related need, including Italy and Spain. China’s first-quarter GDP fell by 6.8% year over year. However, retail sales, production, and investment showed signs of recovery. Extreme oil price volatility continued as global supply far exceeded demand.
Don’t let short-term uncertainty derail long-term investment goals.
Periods of investment uncertainty can present challenges, but experience has taught us that maintaining long-term investment goals can be an effective way to plan for the future. To help you create a sound strategy based on your personal goals and risk tolerance, Wells Fargo Funds offers more than 100 mutual funds spanning a wide range of asset classes and investment styles. Although diversification cannot guarantee an investment profit or prevent losses, we believe it can be an effective way to manage investment risk and potentially smooth out overall portfolio performance. We encourage investors to know their investments and to understand that appropriate levels of risk-taking may unlock opportunities.
Thank you for choosing to invest with Wells Fargo Funds. We appreciate your confidence in us and remain committed to helping you meet your financial needs.
Sincerely,

Andrew Owen
President
Wells Fargo Funds
“The global spread of the coronavirus led many countries to clamp down on social and business-related activity in order to contain the virus from causing even greater devastation and overwhelming the health care system.”
|
|
|
For further information about your Fund, contact your investment professional, visit our website at wfam.com, or call us directly at1-800-222-8222. |
Wells Fargo International Equity Fund | 3
Performance highlights (unaudited)
Investment objective
The Fund seeks long-term capital appreciation.
Manager
Wells Fargo Funds Management, LLC
Subadviser
Wells Capital Management Incorporated
Portfolio managers
Venkateshwar (Venk) Lal
Dale A. Winner, CFA®‡
Average annual total returns (%) as of April 30, 20201
| | | | | | | | | | | | | | | | | | | | | | | | | | | | | | | | | | |
| | | | |
| | | | | Including sales charge | | | Excluding sales charge | | | Expense ratios2 (%) | |
| | | | | | | | | |
| | | Inception date | | 1 year | | | 5 year | | | 10 year | | | 1 year | | | 5 year | | | 10 year | | | Gross | | | Net3 | |
| | | | | | | | | | |
| Class A (WFEAX) | | 1-20-1998 | | | -25.44 | | | | -4.62 | | | | 1.35 | | | | -20.89 | | | | -3.48 | | | | 1.95 | | | | 1.45 | | | | 1.15 | |
| | | | | | | | | | |
| Class C (WFEFX) | | 3-6-1998 | | | -22.50 | | | | -4.21 | | | | 1.19 | | | | -21.50 | | | | -4.21 | | | | 1.19 | | | | 2.20 | | | | 1.90 | |
| | | | | | | | | | |
| Class R (WFERX) | | 10-10-2003 | | | – | | | | – | | | | – | | | | -21.06 | | | | -3.72 | | | | 1.70 | | | | 1.70 | | | | 1.40 | |
| | | | | | | | | | |
| Class R6 (WFEHX)4 | | 9-30-2015 | | | – | | | | – | | | | – | | | | -20.55 | | | | -3.18 | | | | 2.21 | | | | 1.02 | | | | 0.80 | |
| | | | | | | | | | |
| Administrator Class (WFEDX)5 | | 7-16-2010 | | | – | | | | – | | | | – | | | | -20.82 | | | | -3.46 | | | | 1.97 | | | | 1.37 | | | | 1.15 | |
| | | | | | | | | | |
| Institutional Class (WFENX) | | 3-9-1998 | | | – | | | | – | | | | – | | | | -20.62 | | | | -3.21 | | | | 2.22 | | | | 1.12 | | | | 0.85 | |
| | | | | | | | | | |
| MSCI ACWI ex USA Index (Net)6 | | – | | | – | | | | – | | | | – | | | | -11.51 | | | | -0.17 | | | | 2.89 | | | | – | | | | – | |
| | | | | | | | | | |
| MSCI ACWI ex USA Value Index (Net)7 | | – | | | – | | | | – | | | | – | | | | -20.51 | | | | -3.39 | | | | 0.83 | | | | – | | | | – | |
Figures quoted represent past performance, which is no guarantee of future results, and do not reflect taxes that a shareholder may pay on an investment in a fund. Investment return and principal value of an investment will fluctuate so that an investor’s shares, when redeemed, may be worth more or less than their original cost. Performance shown without sales charges would be lower if sales charges were reflected. Current performance may be lower or higher than the performance data quoted, which assumes the reinvestment of dividends and capital gains. Currentmonth-end performance is available on the Fund’swebsite, wfam.com.
Index returns do not include transaction costs associated with buying and selling securities, any mutual fund fees or expenses, or any taxes. It is not possible to invest directly in an index.
For Class A shares, the maximumfront-end sales charge is 5.75%. For Class C shares, the maximum contingent deferred sales charge is 1.00%. Performance including a contingent deferred sales charge assumes the sales charge for the corresponding time period. Class R, Class R6, Administrator Class, and Institutional Class shares are sold without afront-end sales charge or contingent deferred sales charge.
Stock values fluctuate in response to the activities of individual companies and general market and economic conditions. Foreign investments are especially volatile and can rise or fall dramatically due to differences in the political and economic conditions of the host country. These risks are generally intensified in emerging markets. The use of derivatives may reduce returns and/or increase volatility. Certain investment strategies tend to increase the total risk of an investment (relative to the broader market). The Fund is exposed to smaller-company securities risk. Consult the Fund’s prospectus for additional information on these and other risks.
Please see footnotes on page 5.
4 | Wells Fargo International Equity Fund
Performance highlights (unaudited)
| | | | |
| |
| Ten largest holdings (%) as of April 30, 20208 | | | |
| | |
Check Point Software Technologies Limited | | | 3.51 | |
| | |
Sanofi SA | | | 3.36 | |
| | |
Takeda Pharmaceutical Company Limited | | | 3.35 | |
| | |
SK Telecom Company Limited | | | 3.19 | |
| | |
Midea Group Company Limited Class A | | | 3.15 | |
| | |
Orange SA | | | 3.10 | |
| | |
China Mobile Limited | | | 3.01 | |
| | |
Koninklijke Philips NV | | | 2.98 | |
| | |
NN Group NV | | | 2.84 | |
| | |
Muenchener Rueckversicherungs Gesellschaft AG | | | 2.75 | |
|
|
| Sector allocation as of April 30, 20209 |
|
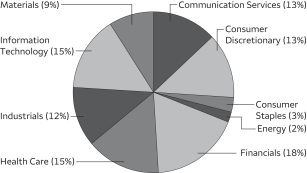 |
|
|
| Country allocation as of April 30, 20209 |
|
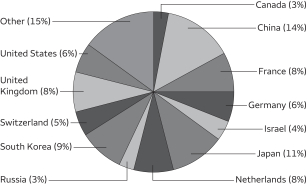 |
| ‡ | CFA® and Chartered Financial Analyst®are trademarks owned by CFA Institute. |
| 1 | Historical performance prior to July 19, 2010 is based on the performance of the Fund’s predecessor, Evergreen International Equity Fund. |
| 2 | Reflects the expense ratios as stated in the most recent prospectuses, which include the impact of 0.01% in acquired fund fees and expenses. The expense ratios shown are subject to change and may differ from the annualized expense ratios shown in the financial highlights of this report, which do not include acquired fund fees and expenses. |
| 3 | The manager has contractually committed through February 28, 2021, to waive fees and/or reimburse expenses to the extent necessary to cap total annual fund operating expenses after fee waivers at 1.14% for Class A, 1.89% for Class C, 1.39% for Class R, 0.79% for Class R6, 1.14% for Administrator Class, and 0.84% for Institutional Class. Brokerage commissions, stamp duty fees, interest, taxes, acquired fund fees and expenses (if any), and extraordinary expenses are excluded from the expense cap. Prior to or after the commitment expiration date, the cap may be increased or the commitment to maintain the cap may be terminated only with the approval of the Board of Trustees. Without this cap, the Fund’s returns would have been lower. The expense ratio paid by an investor is the net expense ratio (the total annual fund operating expenses after fee waivers) as stated in the prospectuses. |
| 4 | Historical performance shown for the Class R6 shares prior to their inception reflects the performance of the Institutional Class shares and includes the higher expenses applicable to the Institutional Class shares. If these expenses had not been included, returns for the Class R6 shares would be higher. |
| 5 | Historical performance shown for the Administrator Class shares prior to their inception reflects the performance of the Institutional Class shares and has been adjusted to reflect the higher expenses applicable to the Administrator Class shares. |
| 6 | The Morgan Stanley Capital International (MSCI) All Country World Index (ACWI) ex USA Index (Net) is a free-float-adjusted market-capitalization-weighted index that is designed to measure the equity market performance of developed and emerging markets, excluding the United States. Source: MSCI. MSCI makes no express or implied warranties or representations and shall have no liability whatsoever with respect to any MSCI data contained herein. The MSCI data may not be further redistributed or used as a basis for other indexes or any securities or financial products. This report is not approved, reviewed, or produced by MSCI. You cannot invest directly in an index. |
| 7 | The MSCI ACWI ex USA Value Index (Net) captures large andmid-cap securities exhibiting overall value style characteristics across developed and emerging markets countries excluding the United States. The value investment style characteristics for index construction are defined using three variables: book value to price,12-month forward earnings to price, and dividend yield. You cannot invest directly in an index. |
| 8 | The ten largest holdings, excluding cash, cash equivalents and any money market funds, are calculated based on the value of the investments divided by total net assets of the Fund. Holdings are subject to change and may have changed since the date specified. |
| 9 | Amounts are calculated based on the total long-term investments of the Fund. These amounts are subject to change and may have changed since the date specified. |
Wells Fargo International Equity Fund | 5
Fund expenses (unaudited)
As a shareholder of the Fund, you incur two types of costs: (1) transaction costs, including sales charges (loads) on purchase payments and contingent deferred sales charges (if any) on redemptions and (2) ongoing costs, including management fees, distribution(12b-1) and/or shareholder servicing fees, and other Fund expenses. This example is intended to help you understand your ongoing costs (in dollars) of investing in the Fund and to compare these costs with the ongoing costs of investing in other mutual funds.
The example is based on an investment of $1,000 invested at the beginning of thesix-month period and held for the entire period from November 1, 2019 to April 30, 2020.
Actual expenses
The “Actual” line of the table below provides information about actual account values and actual expenses. You may use the information in this line, together with the amount you invested, to estimate the expenses that you paid over the period. Simply divide your account value by $1,000 (for example, an $8,600 account value divided by $1,000 = 8.6), then multiply the result by the number in the “Actual” line under the heading entitled “Expenses paid during period” for your applicable class of shares to estimate the expenses you paid on your account during this period.
Hypothetical example for comparison purposes
The “Hypothetical” line of the table below provides information about hypothetical account values and hypothetical expenses based on the Fund’s actual expense ratio and an assumed rate of return of 5% per year before expenses, which is not the Fund’s actual return. The hypothetical account values and expenses may not be used to estimate the actual ending account balance or expenses you paid for the period. You may use this information to compare the ongoing costs of investing in the Fund and other funds. To do so, compare this 5% hypothetical example with the 5% hypothetical examples that appear in the shareholder reports of the other funds.
Please note that the expenses shown in the table are meant to highlight your ongoing costs only and do not reflect any transactional costs, such as sales charges (loads) and contingent deferred sales charges. Therefore, the “Hypothetical” line of the table is useful in comparing ongoing costs only and will not help you determine the relative total costs of owning different funds. In addition, if these transactional costs were included, your costs would have been higher.
| | | | | | | | | | | | | | | | |
| | | Beginning
account value
11-1-2019 | | | Ending
account value
4-30-2020 | | | Expenses
paid during
the period¹ | | | Annualized net
expense ratio | |
| | | | | |
Class A | | | | | | | | | | | | | | | | |
| | | | |
Actual | | $ | 1,000.00 | | | $ | 816.92 | | | $ | 5.10 | | | | 1.13 | % |
| | | | |
Hypothetical (5% return before expenses) | | $ | 1,000.00 | | | $ | 1,019.24 | | | $ | 5.67 | | | | 1.13 | % |
| | | | | |
Class C | | | | | | | | | | | | | | | | |
| | | | |
Actual | | $ | 1,000.00 | | | $ | 813.60 | | | $ | 8.52 | | | | 1.89 | % |
| | | | |
Hypothetical (5% return before expenses) | | $ | 1,000.00 | | | $ | 1,015.47 | | | $ | 9.47 | | | | 1.89 | % |
| | | | | |
Class R | | | | | | | | | | | | | | | | |
| | | | |
Actual | | $ | 1,000.00 | | | $ | 815.12 | | | $ | 6.27 | | | | 1.39 | % |
| | | | |
Hypothetical (5% return before expenses) | | $ | 1,000.00 | | | $ | 1,017.95 | | | $ | 6.97 | | | | 1.39 | % |
| | | | | |
Class R6 | | | | | | | | | | | | | | | | |
| | | | |
Actual | | $ | 1,000.00 | | | $ | 818.78 | | | $ | 3.57 | | | | 0.79 | % |
| | | | |
Hypothetical (5% return before expenses) | | $ | 1,000.00 | | | $ | 1,020.93 | | | $ | 3.97 | | | | 0.79 | % |
| | | | | |
Administrator Class | | | | | | | | | | | | | | | | |
| | | | |
Actual | | $ | 1,000.00 | | | $ | 816.97 | | | $ | 5.10 | | | | 1.13 | % |
| | | | |
Hypothetical (5% return before expenses) | | $ | 1,000.00 | | | $ | 1,019.24 | | | $ | 5.67 | | | | 1.13 | % |
| | | | | |
Institutional Class | | | | | | | | | | | | | | | | |
| | | | |
Actual | | $ | 1,000.00 | | | $ | 818.42 | | | $ | 3.80 | | | | 0.84 | % |
| | | | |
Hypothetical (5% return before expenses) | | $ | 1,000.00 | | | $ | 1,020.69 | | | $ | 4.22 | | | | 0.84 | % |
| 1 | Expenses paid is equal to the annualized net expense ratio of each class multiplied by the average account value over the period, multiplied by the number of days in the most recent fiscal half-year divided by the number of days in the fiscal year (to reflect theone-half-year period). |
6 | Wells Fargo International Equity Fund
Portfolio of investments—April 30, 2020 (unaudited)
| | | | | | | | | | | | | | | | |
| | | | | | | | | Shares | | | Value | |
| Common Stocks: 95.77% | |
|
| Australia: 0.79% | |
Qantas Airways Limited (Industrials, Airlines) | | | | | | | | | | | 603,742 | | | $ | 1,499,488 | |
| | | | | | | | | | | | | | | | |
|
| Canada: 2.74% | |
Home Capital Group Incorporated (Financials, Thrifts & Mortgage Finance) † | | | | | | | | | | | 104,500 | | | | 1,398,639 | |
Lundin Mining Corporation (Materials, Metals & Mining) | | | | | | | | | | | 775,645 | | | | 3,800,351 | |
| | | | |
| | | | | | | | | | | | | | | 5,198,990 | |
| | | | | | | | | | | | | | | | |
|
| China: 13.18% | |
Alibaba Group Holding Limited ADR (Consumer Discretionary, Internet & Direct Marketing Retail) † | | | | | | | | | | | 21,627 | | | | 4,383,144 | |
China Mobile Limited (Communication Services, Wireless Telecommunication Services) | | | | | | | | | | | 711,000 | | | | 5,715,769 | |
HollySys Automation Technologies Limited (Information Technology, Electronic Equipment, Instruments & Components) | | | | | | | | | | | 263,124 | | | | 3,773,198 | |
Midea Group Company Limited Class A (Consumer Discretionary, Household Durables) | | | | | | | | | | | 797,251 | | | | 5,974,139 | |
OPPEIN Home Group Incorporated Class A (Consumer Discretionary, Household Durables) | | | | | | | | | | | 98,096 | | | | 1,461,258 | |
Shanghai Pharmaceuticals Holding Company Limited H Shares (Health Care, Health Care Providers & Services) | | | | | | | | | | | 2,108,300 | | | | 3,711,039 | |
| | | | |
| | | | | | | | | | | | | | | 25,018,547 | |
| | | | | | | | | | | | | | | | |
|
| France: 8.04% | |
Compagnie de Saint-Gobain SA (Industrials, Building Products) | | | | | | | | | | | 113,395 | | | | 3,017,204 | |
Orange SA (Communication Services, Diversified Telecommunication Services) | | | | | | | | | | | 483,601 | | | | 5,875,285 | |
Sanofi SA (Health Care, Pharmaceuticals) | | | | | | | | | | | 65,236 | | | | 6,371,843 | |
| | | | |
| | | | | | | | | | | | | | | 15,264,332 | |
| | | | | | | | | | | | | | | | |
|
| Germany: 6.15% | |
Metro AG (Consumer Staples, Food & Staples Retailing) | | | | | | | | | | | 110,563 | | | | 966,020 | |
Muenchener Rueckversicherungs Gesellschaft AG (Financials, Insurance) | | | | | | | | | | | 23,862 | | | | 5,226,357 | |
Rheinmetall AG (Industrials, Industrial Conglomerates) | | | | | | | | | | | 4,029 | | | | 272,679 | |
SAP SE (Information Technology, Software) | | | | | | | | | | | 29,749 | | | | 3,543,319 | |
Siemens AG (Industrials, Industrial Conglomerates) | | | | | | | | | | | 17,947 | | | | 1,656,205 | |
| | | | |
| | | | | | | | | | | | | | | 11,664,580 | |
| | | | | | | | | | | | | | | | |
|
| Hong Kong: 2.38% | |
Xinyi Glass Holdings Limited (Consumer Discretionary, Auto Components) | | | | | | | | | | | 3,892,000 | | | | 4,507,545 | |
| | | | | | | | | | | | | | | | |
|
| India: 1.80% | |
Tech Mahindra Limited (Information Technology, IT Services) | | | | | | | | | | | 475,669 | | | | 3,421,050 | |
| | | | | | | | | | | | | | | | |
|
| Ireland: 2.13% | |
Greencore Group plc (Consumer Staples, Food Products) | | | | | | | | | | | 1,760,162 | | | | 4,031,241 | |
| | | | | | | | | | | | | | | | |
|
| Israel: 3.51% | |
Check Point Software Technologies Limited (Information Technology, Software) † | | | | | | | | | | | 63,024 | | | | 6,664,158 | |
| | | | | | | | | | | | | | | | |
|
| Italy: 1.99% | |
Prysmian SpA (Industrials, Electrical Equipment) | | | | | | | | | | | 200,440 | | | | 3,781,900 | |
| | | | | | | | | | | | | | | | |
|
| Japan: 10.57% | |
Alps Electric Company Limited (Information Technology, Electronic Equipment, Instruments & Components) | | | | | | | | | | | 153,400 | | | | 1,582,217 | |
Daiwa Securities Group Incorporated (Financials, Capital Markets) | | | | | | | | | | | 1,036,300 | | | | 4,309,382 | |
Hitachi Limited (Information Technology, Electronic Equipment, Instruments & Components) | | | | | | | | | | | 134,700 | | | | 3,997,818 | |
The accompanying notes are an integral part of these financial statements.
Wells Fargo International Equity Fund | 7
Portfolio of investments—April 30, 2020 (unaudited)
| | | | | | | | | | | | | | | | |
| | | | | | | | | Shares | | | Value | |
|
| Japan (continued) | |
Mitsubishi UFJ Financial Group Incorporated (Financials, Banks) | | | | | | | | | | | 943,700 | | | $ | 3,812,548 | |
Takeda Pharmaceutical Company Limited (Health Care, Pharmaceuticals) | | | | | | | | | | | 176,400 | | | | 6,361,238 | |
| | | | |
| | | | | | | | | | | | | | | 20,063,203 | |
| | | | | | | | | | | | | | | | |
|
| Malaysia: 0.40% | |
CIMB Group Holdings Bhd (Financials, Banks) | | | | | | | | | | | 936,125 | | | | 748,507 | |
| | | | | | | | | | | | | | | | |
|
| Mexico: 1.01% | |
Fresnillo plc (Materials, Metals & Mining) | | | | | | | | | | | 216,055 | | | | 1,919,263 | |
| | | | | | | | | | | | | | | | |
|
| Netherlands: 7.21% | |
Koninklijke Philips NV (Health Care, Health Care Equipment & Supplies) | | | | | | | | | | | 129,811 | | | | 5,658,783 | |
NN Group NV (Financials, Insurance) | | | | | | | | | | | 186,115 | | | | 5,383,852 | |
OCI NV (Materials, Chemicals) † | | | | | | | | | | | 218,820 | | | | 2,642,342 | |
| | | | |
| | | | | | | | | | | | | | | 13,684,977 | |
| | | | | | | | | | | | | | | | |
|
| Norway: 1.97% | |
DnB ASA (Financials, Banks) | | | | | | | | | | | 308,218 | | | | 3,731,875 | |
| | | | | | | | | | | | | | | | |
|
| Russia: 2.72% | |
Mobile TeleSystems PJSC ADR (Communication Services, Wireless Telecommunication Services) | | | | | | | | | | | 602,295 | | | | 5,161,668 | |
| | | | | | | | | | | | | | | | |
|
| Singapore: 2.07% | |
Keppel Corporation Limited (Industrials, Industrial Conglomerates) | | | | | | | | | | | 928,900 | | | | 3,921,559 | |
| | | | | | | | | | | | | | | | |
|
| South Korea: 8.54% | |
Hana Financial Group Incorporated (Financials, Banks) | | | | | | | | | | | 223,349 | | | | 5,098,612 | |
Samsung Electronics Company Limited GDR (Information Technology, Technology Hardware, Storage & Peripherals) 144A | | | | | | | | | | | 4,877 | | | | 5,067,844 | |
SK Telecom Company Limited (Communication Services, Wireless Telecommunication Services) | | | | | | | | | | | 34,795 | | | | 6,047,500 | |
| | | | |
| | | | | | | | | | | | | | | 16,213,956 | |
| | | | | | | | | | | | | | | | |
|
| Switzerland: 4.67% | |
LafargeHolcim Limited (Materials, Construction Materials) | | | | | | | | | | | 89,161 | | | | 3,703,120 | |
Novartis AG (Health Care, Pharmaceuticals) | | | | | | | | | | | 60,466 | | | | 5,160,075 | |
| | | | |
| | | | | | | | | | | | | | | 8,863,195 | |
| | | | | | | | | | | | | | | | |
|
| Thailand: 0.60% | |
Siam Commercial Bank plc (Financials, Banks) | | | | | | | | | | | 527,700 | | | | 1,140,980 | |
| | | | | | | | | | | | | | | | |
|
| United Kingdom: 7.30% | |
John Wood Group plc (Energy, Energy Equipment & Services) | | | | | | | | | | | 1,061,867 | | | | 2,688,737 | |
Kingfisher plc (Consumer Discretionary, Specialty Retail) | | | | | | | | | | | 781,863 | | | | 1,551,053 | |
Man Group plc (Financials, Capital Markets) | | | | | | | | | | | 667,806 | | | | 1,118,847 | |
Melrose Industries plc (Industrials, Electrical Equipment) | | | | | | | | | | | 1,779,050 | | | | 2,223,639 | |
Sensata Technologies Holding plc (Industrials, Electrical Equipment) † | | | | | | | | | | | 30,619 | | | | 1,113,919 | |
Smiths Group plc (Industrials, Industrial Conglomerates) | | | | | | | | | | | 330,933 | | | | 5,152,763 | |
| | | | |
| | | | | | | | | | | | | | | 13,848,958 | |
| | | | | | | | | | | | | | | | |
|
| United States: 6.00% | |
Advance Auto Parts Incorporated (Consumer Discretionary, Specialty Retail) | | | | | | | | | | | 13,183 | | | | 1,593,957 | |
Berry Global Group Incorporated (Materials, Containers & Packaging) † | | | | | | | | | | | 127,541 | | | | 5,074,856 | |
Gentex Corporation (Consumer Discretionary, Auto Components) | | | | | | | | | | | 194,587 | | | | 4,716,789 | |
| | | | |
| | | | | | | | | | | | | | | 11,385,602 | |
| | | | | | | | | | | | | | | | |
| |
Total Common Stocks (Cost $189,635,320) | | | | 181,735,574 | |
| | | | | |
The accompanying notes are an integral part of these financial statements.
8 | Wells Fargo International Equity Fund
Portfolio of investments—April 30, 2020 (unaudited)
| | | | | | | | | | | | | | | | |
| | | Yield | | | | | | Shares | | | Value | |
| Short-Term Investments: 4.54% | | | | | | | | | | | | |
| | | | |
Investment Companies: 4.54% | | | | | | | | | | | | | | | | |
Wells Fargo Government Money Market Fund Select Class (l)(u) | | | 0.19 | % | | | | | | | 8,622,008 | | | $ | 8,622,008 | |
| | | | | | | | | | | | | | | | |
| | | | |
Total Short-Term Investments (Cost $8,622,008) | | | | | | | | | | | | | | | 8,622,008 | |
| | | | | |
| | | | | | | | |
| Total investments in securities (Cost $198,257,328) | | | 100.31 | % | | | 190,357,582 | |
| | |
Other assets and liabilities, net | | | (0.31 | ) | | | (588,714 | ) |
| | | | | | | | |
| Total net assets | | | 100.00 | % | | $ | 189,768,868 | |
| | | | | | | | |
| † | Non-income-earning security |
| 144A | The security may be resold in transactions exempt from registration, normally to qualified institutional buyers, pursuant to Rule 144A under the Securities Act of 1933. |
| (l) | The issuer of the security is an affiliated person of the Fund as defined in the Investment Company Act of 1940. |
| (u) | The rate represents the7-day annualized yield at period end. |
Abbreviations:
| ADR | American depositary receipt |
| GDR | Global depositary receipt |
Forward Foreign Currency Contracts
| | | | | | | | | | | | | | |
Currency to be
received | | Currency to be
delivered | | Counterparty | | Settlement
date | | Unrealized
gains | | | Unrealized
losses | |
| | | | | |
| 73,474,453 JPY | | 689,046 USD | | State Street Bank | | 5-7-2020 | | $ | 0 | | | $ | (4,384 | ) |
| | | | | |
| 111,378,381 JPY | | 1,044,510 USD | | State Street Bank | | 5-7-2020 | | | 0 | | | | (6,646 | ) |
| | | | | |
| 11,078,182 USD | | 9,862,000 EUR | | Credit Suisse | | 6-9-2020 | | | 263,562 | | | | 0 | |
| | | | | | | | | | | | | | |
| | | | | |
| | | | | | | | $ | 263,562 | | | $ | (11,030 | ) |
| | | | | | | | | | | | | | |
Investments in Affiliates
An affiliated investment is an investment in which the Fund owns at least 5% of the outstanding voting shares of the issuer or as a result of other relationships, such as the Fund and the issuer having the same investment manager. Transactions with issuers that were either affiliated persons of the Fund at the beginning of the period or the end of the period were as follows:
| | | | | | | | | | | | | | | | | | | | | | | | | | | | | | | | | | | | |
| | | Shares,
beginning of
period | | | Shares
purchased | | | Shares
sold | | | Shares,
end of
period | | | Net
realized
gains
(losses) | | | Net
change in
unrealized
gains
(losses) | | | Income
from
affiliated
securities | | | Value,
end of
period | | | % of
net
assets | |
| | | | | | | | | |
| Short-Term Investments | | | | | | | | | | | | | | | | | | | | | | | | | | | |
Investment Companies | | | | | | | | | | | | | | | | | | | | | | | | | | | | | | | | | | | | |
Securities Lending Cash Investments LLC * | | | 0 | | | | 8,994,485 | | | | (8,994,485 | ) | | | 0 | | | $ | 306 | | | $ | 0 | | | $ | 6,224 | # | | $ | 0 | | | | | |
Wells Fargo Government Money Market Fund Select Class | | | 2,779,280 | | | | 76,125,724 | | | | (70,282,996 | ) | | | 8,622,008 | | | | 0 | | | | 0 | | | | 35,710 | | | | 8,622,008 | | | | | |
| | | | | | | | | | | | | | | | | | | | | | | | | | | | | | | | | | | | |
| | | | | | | | | | | | | | | | | | $ | 306 | | | $ | 0 | | | $ | 41,934 | | | $ | 8,622,008 | | | | 4.54 | % |
| | | | | | | | | | | | | | | | | | | | | | | | | | | | | | | | | | | | |
| * | No longer held at the end of the period |
| # | Amount shown represents income before fees and rebates. |
The accompanying notes are an integral part of these financial statements.
Wells Fargo International Equity Fund | 9
Statement of assets and liabilities—April 30, 2020 (unaudited)
| | | | |
| | | | |
| |
Assets | | | | |
Investments in unaffiliated securities, at value (cost $189,635,320) | | $ | 181,735,574 | |
Investments in affiliated securities, at value (cost $8,622,008) | | | 8,622,008 | |
Cash | | | 36,890 | |
Foreign currency, at value (cost $279,028) | | | 254,542 | |
Receivable for investments sold | | | 2,436,935 | |
Receivable for Fund shares sold | | | 68,842 | |
Receivable for dividends | | | 1,538,531 | |
Unrealized gains on forward foreign currency contracts | | | 263,562 | |
| | | | |
Total assets | | | 194,956,884 | |
| | | | |
| |
Liabilities | | | | |
Payable for investments purchased | | | 3,967,383 | |
Payable for Fund shares redeemed | | | 528,534 | |
Cash collateral due to broker | | | 320,000 | |
Unrealized losses on forward foreign currency contracts | | | 11,030 | |
Management fee payable | | | 71,128 | |
Administration fees payable | | | 21,364 | |
Distribution fees payable | | | 4,095 | |
Trustees’ fees and expenses payable | | | 8,545 | |
Accrued expenses and other liabilities | | | 255,937 | |
| | | | |
Total liabilities | | | 5,188,016 | |
| | | | |
Total net assets | | $ | 189,768,868 | |
| | | | |
| |
Net assets consist of | | | | |
Paid-in capital | | $ | 236,031,403 | |
Total distributable loss | | | (46,262,535 | ) |
| | | | |
Total net assets | | $ | 189,768,868 | |
| | | | |
| |
Computation of net asset value and offering price per share | | | | |
Net assets – Class A | | $ | 60,699,917 | |
Shares outstanding – Class A1 | | | 6,562,806 | |
Net asset value per share – Class A | | | $9.25 | |
Maximum offering price per share – Class A2 | | | $9.81 | |
Net assets – Class C | | $ | 6,778,314 | |
Shares outstanding – Class C1 | | | 741,543 | |
Net asset value per share – Class C | | | $9.14 | |
Net assets – Class R | | $ | 377,304 | |
Shares outstanding – Class R1 | | | 40,041 | |
Net asset value per share – Class R | | | $9.42 | |
Net assets – Class R6 | | $ | 29,920,084 | |
Shares outstanding – Class R61 | | | 3,250,168 | |
Net asset value per share – Class R6 | | | $9.21 | |
Net assets – Administrator Class | | $ | 640,004 | |
Shares outstanding – Administrator Class1 | | | 70,214 | |
Net asset value per share – Administrator Class | | | $9.12 | |
Net assets – Institutional Class | | $ | 91,353,245 | |
Shares outstanding – Institutional Class1 | | | 9,944,390 | |
Net asset value per share – Institutional Class | | | $9.19 | |
| 1 | The Fund has an unlimited number of authorized shares. |
| 2 | Maximum offering price is computed as 100/94.25 of net asset value. On investments of $50,000 or more, the offering price is reduced. |
The accompanying notes are an integral part of these financial statements.
10 | Wells Fargo International Equity Fund
Statement of operations—six months ended April 30, 2020 (unaudited)
| | | | |
| | | | |
| |
Investment income | | | | |
Dividends (net of foreign withholding taxes of $239,179) | | $ | 2,047,348 | |
Income from affiliated securities | | | 42,764 | |
| | | | |
Total investment income | | | 2,090,112 | |
| | | | |
| |
Expenses | | | | |
Management fee | | | 1,060,409 | |
Administration fees | |
Class A | | | 77,572 | |
Class C | | | 9,617 | |
Class R | | | 639 | |
Class R6 | | | 5,166 | |
Administrator Class | | | 651 | |
Institutional Class | | | 84,775 | |
Shareholder servicing fees | |
Class A | | | 92,318 | |
Class C | | | 11,444 | |
Class R | | | 716 | |
Administrator Class | | | 1,250 | |
Distribution fees | |
Class C | | | 34,248 | |
Class R | | | 674 | |
Custody and accounting fees | | | 72,354 | |
Professional fees | | | 32,152 | |
Registration fees | | | 44,850 | |
Shareholder report expenses | | | 35,428 | |
Trustees’ fees and expenses | | | 10,969 | |
Other fees and expenses | | | 14,758 | |
| | | | |
Total expenses | | | 1,589,990 | |
Less: Fee waivers and/or expense reimbursements | |
Fund-level | | | (322,695 | ) |
Class A | | | (32,785 | ) |
Class C | | | (3,636 | ) |
Class R | | | (109 | ) |
Institutional Class | | | (31,764 | ) |
| | | | |
Net expenses | | | 1,199,001 | |
| | | | |
Net investment income | | | 891,111 | |
| | | | |
| |
Realized and unrealized gains (losses) on investments | | | | |
Net realized gains (losses) on | |
Unaffiliated securities | | | (22,210,637 | ) |
Affiliated securities | | | 306 | |
Forward foreign currency contracts | | | (1,575,229 | ) |
| | | | |
Net realized losses on investments | | | (23,785,560 | ) |
| | | | |
|
Net change in unrealized gains (losses) on | |
Unaffiliated securities | | | (26,279,858 | ) |
Forward foreign currency contracts | | | 1,291,716 | |
| | | | |
Net change in unrealized gains (losses) on investments | | | (24,988,142 | ) |
| | | | |
Net realized and unrealized gains (losses) on investments | | | (48,773,702 | ) |
| | | | |
Net decrease in net assets resulting from operations | | $ | (47,882,591 | ) |
| | | | |
The accompanying notes are an integral part of these financial statements.
Wells Fargo International Equity Fund | 11
Statement of changes in net assets
| | | | | | | | | | | | | | | | |
| | | Six months ended
April 30, 2020 (unaudited) | | | Year ended
October 31, 2019 | |
| |
Operations | | | | | |
Net investment income | | | | | | $ | 891,111 | | | | | | | $ | 7,158,795 | |
Net realized losses on investments | | | | | | | (23,785,560 | ) | | | | | | | (8,056,815 | ) |
Net change in unrealized gains (losses) on investments | | | | | | | (24,988,142 | ) | | | | | | | (662,309 | ) |
| | | | |
Net decrease in net assets resulting from operations | | | | | | | (47,882,591 | ) | | | | | | | (1,560,329 | ) |
| | | | |
| | | | |
Distributions to shareholders from net investment income and net realized gains | | | | | | | | | | | | | | | | |
Class A | | | | | | | (423,778 | ) | | | | | | | (3,814,733 | ) |
Class C | | | | | | | (43,116 | ) | | | | | | | (465,349 | ) |
Class R | | | | | | | (3,818 | ) | | | | | | | (49,381 | ) |
Class R6 | | | | | | | (211,627 | ) | | | | | | | (1,911,254 | ) |
Administrator Class | | | | | | | (5,794 | ) | | | | | | | (181,829 | ) |
Institutional Class | | | | | | | (828,362 | ) | | | | | | | (9,669,266 | ) |
| | | | |
Total distributions to shareholders | | | | | | | (1,516,495 | ) | | | | | | | (16,091,812 | ) |
| | | | |
| | | | |
Capital share transactions | | | Shares | | | | | | | | Shares | | | | | |
Proceeds from shares sold | |
Class A | | | 235,586 | | | | 2,488,994 | | | | 1,147,071 | | | | 13,224,286 | |
Class C | | | 16,236 | | | | 188,639 | | | | 86,880 | | | | 957,728 | |
Class R | | | 8,029 | | | | 82,913 | | | | 25,185 | | | | 292,558 | |
Class R6 | | | 20,184 | | | | 206,311 | | | | 21,094 | | | | 236,894 | |
Administrator Class | | | 1,315 | | | | 15,362 | | | | 120,528 | | | | 1,364,756 | |
Institutional Class | | | 849,510 | | | | 9,108,553 | | | | 3,668,728 | | | | 41,620,881 | |
| | | | |
| | | | | | | 12,090,772 | | | | | | | | 57,697,103 | |
| | | | |
Reinvestment of distributions | |
Class A | | | 33,005 | | | | 397,705 | | | | 321,829 | | | | 3,507,776 | |
Class C | | | 3,189 | | | | 38,076 | | | | 39,404 | | | | 419,685 | |
Class R | | | 128 | | | | 1,574 | | | | 1,096 | | | | 12,180 | |
Class R6 | | | 8,409 | | | | 100,742 | | | | 83,623 | | | | 906,082 | |
Administrator Class | | | 466 | | | | 5,533 | | | | 16,761 | | | | 179,650 | |
Institutional Class | | | 60,766 | | | | 726,155 | | | | 718,102 | | | | 7,759,106 | |
| | | | |
| | | | | | | 1,269,785 | | | | | | | | 12,784,479 | |
| | | | |
Payment for shares redeemed | |
Class A | | | (832,147 | ) | | | (8,641,554 | ) | | | (2,065,116 | ) | | | (23,490,494 | ) |
Class C | | | (226,409 | ) | | | (2,339,259 | ) | | | (1,162,599 | ) | | | (13,124,506 | ) |
Class R | | | (36,555 | ) | | | (407,007 | ) | | | (74,982 | ) | | | (874,682 | ) |
Class R6 | | | (4,985 | ) | | | (54,577 | ) | | | (2,255,062 | ) | | | (24,783,491 | ) |
Administrator Class | | | (37,591 | ) | | | (355,725 | ) | | | (474,737 | ) | | | (5,303,913 | ) |
Institutional Class | | | (4,314,505 | ) | | | (43,442,815 | ) | | | (11,722,793 | ) | | | (131,578,072 | ) |
| | | | |
| | | | | | | (55,240,937 | ) | | | | | | | (199,155,158 | ) |
| | | | |
Net decrease in net assets resulting from capital share transactions | | | | | | | (41,880,380 | ) | | | | | | | (128,673,576 | ) |
| | | | |
Total decrease in net assets | | | | | | | (91,279,466 | ) | | | | | | | (146,325,717 | ) |
| | | | |
| | |
Net assets | | | | | | | | |
Beginning of period | | | | | | | 281,048,334 | | | | | | | | 427,374,051 | |
| | | | |
End of period | | | | | | $ | 189,768,868 | | | | | | | $ | 281,048,334 | |
| | | | |
The accompanying notes are an integral part of these financial statements.
12 | Wells Fargo International Equity Fund
Financial highlights
(For a share outstanding throughout each period)
| | | | | | | | | | | | | | | | | | | | | | | | |
| | | Six months ended
April 30, 2020
(unaudited) | | | Year ended October 31 | |
| CLASS A | | 2019 | | | 2018 | | | 2017 | | | 2016 | | | 2015 | |
Net asset value, beginning of period | | | $11.38 | | | | $11.81 | | | | $13.43 | | | | $11.07 | | | | $11.53 | | | | $11.28 | |
Net investment income | | | 0.03 | | | | 0.24 | 1 | | | 0.27 | | | | 0.22 | | | | 0.22 | | | | 0.18 | 1 |
Net realized and unrealized gains (losses) on investments | | | (2.10 | ) | | | (0.16 | ) | | | (1.40 | ) | | | 2.47 | | | | (0.54 | ) | | | 0.57 | |
| | | | | | | | | | | | | | | | | | | | | | | | |
Total from investment operations | | | (2.07 | ) | | | 0.08 | | | | (1.13 | ) | | | 2.69 | | | | (0.32 | ) | | | 0.75 | |
Distributions to shareholders from | | | | | | | | | | | | | | | | | | | | | | | | |
Net investment income | | | (0.06 | ) | | | (0.51 | ) | | | (0.49 | ) | | | (0.33 | ) | | | (0.14 | ) | | | (0.50 | ) |
Net asset value, end of period | | | $9.25 | | | | $11.38 | | | | $11.81 | | | | $13.43 | | | | $11.07 | | | | $11.53 | |
Total return2 | | | (18.31 | )% | | | 0.93 | % | | | (8.81 | )% | | | 24.91 | % | | | (2.76 | )% | | | 6.85 | % |
Ratios to average net assets (annualized) | | | | | | | | | | | | | | | | | | | | | | | | |
Gross expenses | | | 1.48 | % | | | 1.45 | % | | | 1.39 | % | | | 1.47 | % | | | 1.47 | % | | | 1.53 | % |
Net expenses | | | 1.13 | % | | | 1.14 | % | | | 1.14 | % | | | 1.14 | % | | | 1.12 | % | | | 1.09 | % |
Net investment income | | | 0.57 | % | | | 2.13 | % | | | 1.97 | % | | | 1.82 | % | | | 2.04 | % | | | 1.50 | % |
Supplemental data | | | | | | | | | | | | | | | | | | | | | | | | |
Portfolio turnover rate | | | 38 | % | | | 49 | % | | | 62 | % | | | 59 | % | | | 65 | % | | | 27 | % |
Net assets, end of period (000s omitted) | | | $60,700 | | | | $81,110 | | | | $91,206 | | | | $109,655 | | | | $122,248 | | | | $145,654 | |
| 1 | Calculated based upon average shares outstanding |
| 2 | Total return calculations do not include any sales charges. Returns for periods of less than one year are not annualized. |
The accompanying notes are an integral part of these financial statements.
Wells Fargo International Equity Fund | 13
Financial highlights
(For a share outstanding throughout each period)
| | | | | | | | | | | | | | | | | | | | | | | | |
| | | Six months ended
April 30, 2020
(unaudited) | | | Year ended October 31 | |
| CLASS C | | 2019 | | | 2018 | | | 2017 | | | 2016 | | | 2015 | |
Net asset value, beginning of period | | | $11.28 | | | | $11.57 | | | | $13.13 | | | | $10.82 | | | | $11.30 | | | | $11.06 | |
Net investment income (loss) | | | (0.01 | )1 | | | 0.12 | 1 | | | 0.15 | | | | 0.14 | | | | 0.14 | | | | 0.08 | 1 |
Net realized and unrealized gains (losses) on investments | | | (2.08 | ) | | | (0.12 | ) | | | (1.35 | ) | | | 2.40 | | | | (0.53 | ) | | | 0.57 | |
| | | | | | | | | | | | | | | | | | | | | | | | |
Total from investment operations | | | (2.09 | ) | | | (0.00 | ) | | | (1.20 | ) | | | 2.54 | | | | (0.39 | ) | | | 0.65 | |
Distributions to shareholders from | | | | | | | | | | | | | | | | | | | | | | | | |
Net investment income | | | (0.05 | ) | | | (0.29 | ) | | | (0.36 | ) | | | (0.23 | ) | | | (0.09 | ) | | | (0.41 | ) |
Net asset value, end of period | | | $9.14 | | | | $11.28 | | | | $11.57 | | | | $13.13 | | | | $10.82 | | | | $11.30 | |
Total return2 | | | (18.64 | )% | | | 0.16 | % | | | (9.47 | )% | | | 23.91 | % | | | (3.43 | )% | | | 6.03 | % |
Ratios to average net assets (annualized) | | | | | | | | | | | | | | | | | | | | | | | | |
Gross expenses | | | 2.22 | % | | | 2.19 | % | | | 2.14 | % | | | 2.22 | % | | | 2.22 | % | | | 2.28 | % |
Net expenses | | | 1.89 | % | | | 1.89 | % | | | 1.89 | % | | | 1.89 | % | | | 1.87 | % | | | 1.84 | % |
Net investment income (loss) | | | (0.22 | )% | | | 1.07 | % | | | 1.22 | % | | | 1.26 | % | | | 1.33 | % | | | 0.72 | % |
Supplemental data | | | | | | | | | | | | | | | | | | | | | | | | |
Portfolio turnover rate | | | 38 | % | | | 49 | % | | | 62 | % | | | 59 | % | | | 65 | % | | | 27 | % |
Net assets, end of period (000s omitted) | | | $6,778 | | | | $10,700 | | | | $22,963 | | | | $28,919 | | | | $27,508 | | | | $29,080 | |
| 1 | Calculated based upon average shares outstanding |
| 2 | Total return calculations do not include any sales charges. Returns for periods of less than one year are not annualized. |
The accompanying notes are an integral part of these financial statements.
14 | Wells Fargo International Equity Fund
Financial highlights
(For a share outstanding throughout each period)
| | | | | | | | | | | | | | | | | | | | | | | | |
| | | Six months ended
April 30, 2020
(unaudited) | | | Year ended October 31 | |
| CLASS R | | 2019 | | | 2018 | | | 2017 | | | 2016 | | | 2015 | |
Net asset value, beginning of period | | | $11.61 | | | | $11.98 | | | | $13.58 | | | | $11.20 | | | | $11.66 | | | | $11.40 | |
Net investment income | | | 0.01 | 1 | | | 0.22 | 1 | | | 0.23 | 1 | | | 0.20 | 1 | | | 0.19 | 1 | | | 0.15 | 1 |
Net realized and unrealized gains (losses) on investments | | | (2.14 | ) | | | (0.15 | ) | | | (1.41 | ) | | | 2.48 | | | | (0.53 | ) | | | 0.57 | |
| | | | | | | | | | | | | | | | | | | | | | | | |
Total from investment operations | | | (2.13 | ) | | | 0.07 | | | | (1.18 | ) | | | 2.68 | | | | (0.34 | ) | | | 0.72 | |
Distributions to shareholders from | | | | | | | | | | | | | | | | | | | | | | | | |
Net investment income | | | (0.06 | ) | | | (0.44 | ) | | | (0.42 | ) | | | (0.30 | ) | | | (0.12 | ) | | | (0.46 | ) |
Net asset value, end of period | | | $9.42 | | | | $11.61 | | | | $11.98 | | | | $13.58 | | | | $11.20 | | | | $11.66 | |
Total return2 | | | (18.49 | )% | | | 0.79 | % | | | (9.03 | )% | | | 24.47 | % | | | (2.94 | )% | | | 6.53 | % |
Ratios to average net assets (annualized) | | | | | | | | | | | | | | | | | | | | | | | | |
Gross expenses | | | 1.68 | % | | | 1.64 | % | | | 1.64 | % | | | 1.72 | % | | | 1.72 | % | | | 1.78 | % |
Net expenses | | | 1.39 | % | | | 1.37 | % | | | 1.39 | % | | | 1.39 | % | | | 1.37 | % | | | 1.34 | % |
Net investment income | | | 0.17 | % | | | 1.88 | % | | | 1.72 | % | | | 1.66 | % | | | 1.77 | % | | | 1.23 | % |
Supplemental data | | | | | | | | | | | | | | | | | | | | | | | | |
Portfolio turnover rate | | | 38 | % | | | 49 | % | | | 62 | % | | | 59 | % | | | 65 | % | | | 27 | % |
Net assets, end of period (000s omitted) | | | $377 | | | | $794 | | | | $1,404 | | | | $1,996 | | | | $2,029 | | | | $2,147 | |
| 1 | Calculated based upon average shares outstanding |
| 2 | Returns for periods of less than one year are not annualized. |
The accompanying notes are an integral part of these financial statements.
Wells Fargo International Equity Fund | 15
Financial highlights
(For a share outstanding throughout each period)
| | | | | | | | | | | | | | | | | | | | | | | | |
| | | Six months ended
April 30, 2020
(unaudited) | | | Year ended October 31 | |
| CLASS R6 | | 2019 | | | 2018 | | | 2017 | | | 2016 | | | 20151 | |
Net asset value, beginning of period | | | $11.31 | | | | $11.79 | | | | $13.44 | | | | $11.06 | | | | $11.49 | | | | $10.89 | |
Net investment income | | | 0.05 | | | | 0.35 | | | | 0.31 | | | | 0.45 | 2 | | | 0.24 | | | | 0.00 | 3 |
Net realized and unrealized gains (losses) on investments | | | (2.08 | ) | | | (0.23 | ) | | | (1.40 | ) | | | 2.27 | | | | (0.52 | ) | | | 0.60 | |
| | | | | | | | | | | | | | | | | | | | | | | | |
Total from investment operations | | | (2.03 | ) | | | 0.12 | | | | (1.09 | ) | | | 2.72 | | | | (0.28 | ) | | | 0.60 | |
Distributions to shareholders from | | | | | | | | | | | | | | | | | | | | | | | | |
Net investment income | | | (0.07 | ) | | | (0.60 | ) | | | (0.56 | ) | | | (0.34 | ) | | | (0.15 | ) | | | 0.00 | |
Net asset value, end of period | | | $9.21 | | | | $11.31 | | | | $11.79 | | | | $13.44 | | | | $11.06 | | | | $11.49 | |
Total return4 | | | (18.12 | )% | | | 1.27 | % | | | (8.57 | )% | | | 25.30 | % | | | (2.46 | )% | | | 5.51 | % |
Ratios to average net assets (annualized) | | | | | | | | | | | | | | | | | | | | | | | | |
Gross expenses | | | 1.05 | % | | | 1.01 | % | | | 0.96 | % | | | 1.03 | % | | | 1.04 | % | | | 1.05 | % |
Net expenses | | | 0.79 | % | | | 0.81 | % | | | 0.84 | % | | | 0.84 | % | | | 0.85 | % | | | 0.88 | % |
Net investment income | | | 0.94 | % | | | 2.23 | % | | | 2.23 | % | | | 3.55 | % | | | 2.31 | % | | | 0.23 | % |
Supplemental data | | | | | | | | | | | | | | | | | | | | | | | | |
Portfolio turnover rate | | | 38 | % | | | 49 | % | | | 62 | % | | | 59 | % | | | 65 | % | | | 27 | % |
Net assets, end of period (000s omitted) | | | $29,920 | | | | $36,505 | | | | $63,414 | | | | $74,405 | | | | $26 | | | | $26 | |
| 1 | For the period from September 30, 2015 (commencement of class operations) to October 31, 2015 |
| 2 | Calculated based upon average shares outstanding |
| 3 | Amount is less than $0.005. |
| 4 | Returns for periods of less than one year are not annualized. |
The accompanying notes are an integral part of these financial statements.
16 | Wells Fargo International Equity Fund
Financial highlights
(For a share outstanding throughout each period)
| | | | | | | | | | | | | | | | | | | | | | | | |
| | | Six months ended
April 30, 2020
(unaudited) | | | Year ended October 31 | |
| ADMINISTRATOR CLASS | | 2019 | | | 2018 | | | 2017 | | | 2016 | | | 2015 | |
Net asset value, beginning of period | | | $11.22 | | | | $11.62 | | | | $13.20 | | | | $10.88 | | | | $11.33 | | | | $11.09 | |
Net investment income | | | 0.03 | 1 | | | 0.23 | 1 | | | 0.20 | 1 | | | 0.21 | 1 | | | 0.22 | | | | 0.17 | 1 |
Net realized and unrealized gains (losses) on investments | | | (2.07 | ) | | | (0.14 | ) | | | (1.31 | ) | | | 2.43 | | | | (0.53 | ) | | | 0.57 | |
| | | | | | | | | | | | | | | | | | | | | | | | |
Total from investment operations | | | (2.04 | ) | | | 0.09 | | | | (1.11 | ) | | | 2.64 | | | | (0.31 | ) | | | 0.74 | |
Distributions to shareholders from | | | | | | | | | | | | | | | | | | | | | | | | |
Net investment income | | | (0.06 | ) | | | (0.49 | ) | | | (0.47 | ) | | | (0.32 | ) | | | (0.14 | ) | | | (0.50 | ) |
Net asset value, end of period | | | $9.12 | | | | $11.22 | | | | $11.62 | | | | $13.20 | | | | $10.88 | | | | $11.33 | |
Total return2 | | | (18.30 | )% | | | 0.98 | % | | | (8.79 | )% | | | 24.84 | % | | | (2.71 | )% | | | 6.89 | % |
Ratios to average net assets (annualized) | | | | | | | | | | | | | | | | | | | | | | | | |
Gross expenses | | | 1.39 | % | | | 1.36 | % | | | 1.31 | % | | | 1.39 | % | | | 1.38 | % | | | 1.40 | % |
Net expenses | | | 1.13 | % | | | 1.14 | % | | | 1.14 | % | | | 1.14 | % | | | 1.12 | % | | | 1.09 | % |
Net investment income | | | 0.49 | % | | | 2.00 | % | | | 1.53 | % | | | 1.79 | % | | | 1.93 | % | | | 1.44 | % |
Supplemental data | | | | | | | | | | | | | | | | | | | | | | | | |
Portfolio turnover rate | | | 38 | % | | | 49 | % | | | 62 | % | | | 59 | % | | | 65 | % | | | 27 | % |
Net assets, end of period (000s omitted) | | | $640 | | | | $1,189 | | | | $5,152 | | | | $18,174 | | | | $36,032 | | | | $52,469 | |
| 1 | Calculated based upon average shares outstanding |
| 2 | Returns for periods of less than one year are not annualized. |
The accompanying notes are an integral part of these financial statements.
Wells Fargo International Equity Fund | 17
Financial highlights
(For a share outstanding throughout each period)
| | | | | | | | | | | | | | | | | | | | | | | | |
| | | Six months ended
April 30, 2020
(unaudited) | | | Year ended October 31 | |
| INSTITUTIONAL CLASS | | 2019 | | | 2018 | | | 2017 | | | 2016 | | | 2015 | |
Net asset value, beginning of period | | | $11.29 | | | | $11.76 | | | | $13.40 | | | | $11.05 | | | | $11.49 | | | | $11.25 | |
Net investment income | | | 0.04 | 1 | | | 0.33 | | | | 0.30 | 1 | | | 0.28 | 1 | | | 0.23 | | | | 0.19 | 1 |
Net realized and unrealized gains (losses) on investments | | | (2.07 | ) | | | (0.22 | ) | | | (1.39 | ) | | | 2.43 | | | | (0.52 | ) | | | 0.58 | |
| | | | | | | | | | | | | | | | | | | | | | | | |
Total from investment operations | | | (2.03 | ) | | | 0.11 | | | | (1.09 | ) | | | 2.71 | | | | (0.29 | ) | | | 0.77 | |
Distributions to shareholders from | | | | | | | | | | | | | | | | | | | | | | | | |
Net investment income | | | (0.07 | ) | | | (0.58 | ) | | | (0.55 | ) | | | (0.36 | ) | | | (0.15 | ) | | | (0.53 | ) |
Net asset value, end of period | | | $9.19 | | | | $11.29 | | | | $11.76 | | | | $13.40 | | | | $11.05 | | | | $11.49 | |
Total return2 | | | (18.16 | )% | | | 1.19 | % | | | (8.56 | )% | | | 25.21 | % | | | (2.48 | )% | | | 7.07 | % |
Ratios to average net assets (annualized) | | | | | | | | | | | | | | | | | | | | | | | | |
Gross expenses | | | 1.15 | % | | | 1.11 | % | | | 1.06 | % | | | 1.14 | % | | | 1.14 | % | | | 1.15 | % |
Net expenses | | | 0.84 | % | | | 0.86 | % | | | 0.89 | % | | | 0.89 | % | | | 0.87 | % | | | 0.84 | % |
Net investment income | | | 0.81 | % | | | 2.27 | % | | | 2.31 | % | | | 2.28 | % | | | 2.27 | % | | | 1.67 | % |
Supplemental data | | | | | | | | | | | | | | | | | | | | | | | | |
Portfolio turnover rate | | | 38 | % | | | 49 | % | | | 62 | % | | | 59 | % | | | 65 | % | | | 27 | % |
Net assets, end of period (000s omitted) | | | $91,353 | | | | $150,749 | | | | $243,235 | | | | $236,946 | | | | $182,639 | | | | $192,799 | |
| 1 | Calculated based upon average shares outstanding |
| 2 | Returns for periods of less than one year are not annualized. |
The accompanying notes are an integral part of these financial statements.
18 | Wells Fargo International Equity Fund
Notes to financial statements (unaudited)
1. ORGANIZATION
Wells Fargo Funds Trust (the “Trust”), a Delaware statutory trust organized on March 10, 1999, is anopen-end management investment company registered under the Investment Company Act of 1940, as amended (the “1940 Act”). As an investment company, the Trust follows the accounting and reporting guidance in Financial Accounting Standards Board (“FASB”)Accounting Standards Codification Topic 946, Financial Services – Investment Companies. These financial statements report on the Wells Fargo International Equity Fund (the “Fund”) which is a diversified series of the Trust.
2. SIGNIFICANT ACCOUNTING POLICIES
The following significant accounting policies, which are consistently followed in the preparation of the financial statements of the Fund, are in conformity with U.S. generally accepted accounting principles which require management to make estimates and assumptions that affect the reported amounts of assets and liabilities, disclosure of contingent assets and liabilities at the date of the financial statements, and the reported amounts of revenues and expenses during the reporting period. Actual results could differ from those estimates.
Securities valuation
All investments are valued each business day as of the close of regular trading on the New York Stock Exchange (generally 4 p.m. Eastern Time), although the Fund may deviate from this calculation time under unusual or unexpected circumstances.
Equity securities that are listed on a foreign or domestic exchange or market are valued at the official closing price or, if none, the last sales price. If no sale occurs on the principal exchange or market that day, a fair value price will be determined in accordance with the Fund’s Valuation Procedures.
Forward foreign currency contracts are recorded at the forward rate provided by an independent foreign currency pricing source at a time each business day specified by the Wells Fargo Asset Management Pricing Committee at Wells Fargo Funds Management, LLC (“Funds Management”).
The values of securities denominated in foreign currencies are translated into U.S. dollars at rates provided by an independent foreign currency pricing source at a time each business day specified by the Wells Fargo Asset Management Pricing Committee.
Many securities markets and exchanges outside the U.S. close prior to the close of the New York Stock Exchange and therefore may not fully reflect trading or events that occur after the close of the principal exchange in which the foreign securities are traded, but before the close of the New York Stock Exchange. If such trading or events are expected to materially affect the value of such securities, then fair value pricing procedures approved by the Board of Trustees of the Fund are applied. These procedures take into account multiple factors including movements in U.S. securities markets after foreign exchanges close. Foreign securities that are fair valued under these procedures are categorized as Level 2 and the application of these procedures may result in transfers between Level 1 and Level 2. Depending on market activity, such fair valuations may be frequent. Such fair value pricing may result in net asset values that are higher or lower than net asset values based on the last reported sales price or latest quoted bid price. On April 30, 2020, such fair value pricing was used in pricing certain foreign securities.
Investments in registeredopen-end investment companies are valued at net asset value. Interests innon-registered investment companies that are redeemable at net asset value are fair valued normally at net asset value.
Investments which are not valued using any of the methods discussed above are valued at their fair value, as determined in good faith by the Board of Trustees. The Board of Trustees has established a Valuation Committee comprised of the Trustees and has delegated to it the authority to take any actions regarding the valuation of portfolio securities that the Valuation Committee deems necessary or appropriate, including determining the fair value of portfolio securities, unless the determination has been delegated to the Wells Fargo Asset Management Pricing Committee.The Board of Trustees retains the authority to make or ratify any valuation decisions or approve any changes to the Valuation Procedures as it deems appropriate. On a quarterly basis, the Board of Trustees receives reports on any valuation actions taken by the Valuation Committee or the Wells Fargo Asset Management Pricing Committee which may include items for ratification.
Foreign currency translation
The accounting records of the Fund are maintained in U.S. dollars. The values of other assets and liabilities denominated in foreign currencies are translated into U.S. dollars at rates provided by an independent foreign currency pricing source at a time each business day specified by the Wells Fargo Asset Management Pricing Committee. Purchases and sales of securities, and income and expenses are converted at the rate of exchange on the respective dates of such transactions. Net realized foreign exchange gains or losses arise from sales of foreign currencies, currency gains or losses realized between the trade and settlement dates on securities transactions, and the difference between the amounts of dividends, interest and foreign withholding taxes recorded and the U.S. dollar equivalent of the amounts actually paid or received. Net unrealized foreign exchange gains and losses arise from changes in the fair value of assets and liabilities other than investments in securities resulting from changes in exchange rates. The changes in net assets arising from changes in exchange rates of securities and the changes in net assets resulting from changes in market prices of securities are not separately presented. Such changes are included in net realized and unrealized gains or losses from investments.
Wells Fargo International Equity Fund | 19
Notes to financial statements (unaudited)
Forward foreign currency contracts
A forward foreign currency contract is an agreement between two parties to purchase or sell a specific currency for an agreed-upon price at a future date. The Fund enters into forward foreign currency contracts to facilitate transactions in foreign-denominated securities and to attempt to minimize the risk to the Fund from adverse changes in the relationship between currencies. Forward foreign currency contracts are recorded at the forward rate andmarked-to-market daily. When the contracts are closed, realized gains and losses arising from such transactions are recorded as realized gains or losses on forward foreign currency contracts. The Fund is subject to foreign currency risk and may be exposed to risks if the counterparties to the contracts are unable to meet the terms of their contracts or if the value of the foreign currency changes unfavorably. The Fund’s maximum risk of loss from counterparty credit risk is the unrealized gains on the contracts. This risk may be mitigated if there is a master netting arrangement between the Fund and the counterparty.
Securities lending
The Fund may lend its securities from time to time in order to earn additional income in the form of fees or interest on securities received as collateral or the investment of any cash received as collateral. When securities are on loan, the Fund receives interest or dividends on those securities. Cash collateral received in connection with its securities lending transactions is invested in Securities Lending Cash Investments, LLC (the “Securities Lending Fund”). Investments in Securities Lending Fund are valued at the evaluated bid price provided by an independent pricing service. Income earned from investment in the Securities Lending Fund (net of fees and rebates), if any, is included in income from affiliated securities on the Statement of Operations.
In a securities lending transaction, the net asset value of the Fund is affected by an increase or decrease in the value of the securities loaned and by an increase or decrease in the value of the instrument in which collateral is invested. The amount of securities lending activity undertaken by the Fund fluctuates from time to time. The Fund has the right under the lending agreement to recover the securities from the borrower on demand. In the event of default or bankruptcy by the borrower, the Fund may be prevented from recovering the loaned securities or gaining access to the collateral or may experience delays or costs in doing so. In such an event, the terms of the agreement allows the unaffiliated securities lending agent to use the collateral to purchase replacement securities on behalf of the Fund or pay the Fund the market value of the loaned securities. The Fund bears the risk of loss with respect to depreciation of its investment of the cash collateral.
Security transactions and income recognition
Securities transactions are recorded on a trade date basis. Realized gains or losses are recorded on the basis of identified cost.
Dividend income is recognized on theex-dividend date, except for certain dividends from foreign securities, which are recorded as soon as the custodian verifies theex-dividend date. Dividend income from foreign securities is recorded net of foreign taxes withheld where recovery of such taxes is not assured.
Distributions to shareholders
Distributions to shareholders are recorded on theex-dividend date and paid from net investment income quarterly and any net realized gains are paid at least annually. Such distributions are determined in accordance with income tax regulations and may differ from U.S. generally accepted accounting principles. Dividend sources are estimated at the time of declaration. The tax character of distributions is determined as of the Fund’s fiscal year end. Therefore, a portion of the Fund’s distributions made prior to the Fund’s fiscal year end may be categorized as a tax return of capital at year end.
Federal and other taxes
The Fund intends to continue to qualify as a regulated investment company by distributing substantially all of its investment company taxable income and any net realized capital gains (after reduction for capital loss carryforwards) sufficient to relieve it from all, or substantially all, federal income taxes. Accordingly, no provision for federal income taxes was required.
The Fund’s income and federal excise tax returns and all financial records supporting those returns for the prior three fiscal years are subject to examination by the federal and Delaware revenue authorities. Management has analyzed the Fund’s tax positions taken on federal, state, and foreign tax returns for all open tax years and does not believe that there are any uncertain tax positions that require recognition of a tax liability.
20 | Wells Fargo International Equity Fund
Notes to financial statements (unaudited)
As of April 30, 2020, the aggregate cost of all investments for federal income tax purposes was $193,989,450 and the unrealized gains (losses) consisted of:
| | | | |
| |
Gross unrealized gains | | $ | 15,859,494 | |
| |
Gross unrealized losses | | | (19,238,830 | ) |
| |
Net unrealized losses | | $ | (3,379,336 | ) |
As of October 31, 2019, the Fund had capital loss carryforwards which consisted of $11,301,468 in short-term capital losses and $3,067,307 in long-term capital losses.
Class allocations
The separate classes of shares offered by the Fund differ principally in applicable sales charges, distribution, shareholder servicing, and administration fees. Class specific expenses are charged directly to that share class. Investment income, common fund-level expenses, and realized and unrealized gains (losses) on investments are allocated daily to each class of shares based on the relative proportion of net assets of each class.
3. FAIR VALUATION MEASUREMENTS
Fair value measurements of investments are determined within a framework that has established a fair value hierarchy based upon the various data inputs utilized in determining the value of the Fund’s investments. The three-level hierarchy gives the highest priority to unadjusted quoted prices in active markets for identical assets or liabilities (Level 1) and the lowest priority to unobservable inputs (Level 3). The Fund’s investments are classified within the fair value hierarchy based on the lowest level of input that is significant to the fair value measurement. The inputs are summarized into three broad levels as follows:
| ∎ | | Level 1 – quoted prices in active markets for identical securities |
| ∎ | | Level 2 – other significant observable inputs (including quoted prices for similar securities, interest rates, prepayment speeds, credit risk, etc.) |
| ∎ | | Level 3 – significant unobservable inputs (including the Fund’s own assumptions in determining the fair value of investments) |
The inputs or methodologies used for valuing investments in securities are not necessarily an indication of the risk associated with investing in those securities.
Wells Fargo International Equity Fund | 21
Notes to financial statements (unaudited)
The following is a summary of the inputs used in valuing the Fund’s assets and liabilities as of April 30, 2020:
| | | | | | | | | | | | | | | | |
| | | | |
| | | Quoted prices
(Level 1) | | | Other significant
observable inputs
(Level 2) | | | Significant
unobservable inputs (Level 3) | | | Total | |
| | | | |
Assets | | | | | | | | | | | | | | | | |
Investments in: | | | | | | | | | | | | | | | | |
| | | | |
Common stocks | | | | | | | | | | | | | | | | |
| | | | |
Australia | | $ | 0 | | | $ | 1,499,488 | | | $ | 0 | | | $ | 1,499,488 | |
| | | | |
Canada | | | 5,198,990 | | | | 0 | | | | 0 | | | | 5,198,990 | |
| | | | |
China | | | 8,156,342 | | | | 16,862,205 | | | | 0 | | | | 25,018,547 | |
| | | | |
France | | | 0 | | | | 15,264,332 | | | | 0 | | | | 15,264,332 | |
| | | | |
Germany | | | 0 | | | | 11,664,580 | | | | 0 | | | | 11,664,580 | |
| | | | |
Hong Kong | | | 0 | | | | 4,507,545 | | | | 0 | | | | 4,507,545 | |
| | | | |
India | | | 0 | | | | 3,421,050 | | | | 0 | | | | 3,421,050 | |
| | | | |
Ireland | | | 0 | | | | 4,031,241 | | | | 0 | | | | 4,031,241 | |
| | | | |
Israel | | | 6,664,158 | | | | 0 | | | | 0 | | | | 6,664,158 | |
| | | | |
Italy | | | 0 | | | | 3,781,900 | | | | 0 | | | | 3,781,900 | |
| | | | |
Japan | | | 0 | | | | 20,063,203 | | | | 0 | | | | 20,063,203 | |
| | | | |
Malaysia | | | 0 | | | | 748,507 | | | | 0 | | | | 748,507 | |
| | | | |
Mexico | | | 0 | | | | 1,919,263 | | | | 0 | | | | 1,919,263 | |
| | | | |
Netherlands | | | 0 | | | | 13,684,977 | | | | 0 | | | | 13,684,977 | |
| | | | |
Norway | | | 0 | | | | 3,731,875 | | | | 0 | | | | 3,731,875 | |
| | | | |
Russia | | | 5,161,668 | | | | 0 | | | | 0 | | | | 5,161,668 | |
| | | | |
Singapore | | | 0 | | | | 3,921,559 | | | | 0 | | | | 3,921,559 | |
| | | | |
South Korea | | | 0 | | | | 16,213,956 | | | | 0 | | | | 16,213,956 | |
| | | | |
Switzerland | | | 0 | | | | 8,863,195 | | | | 0 | | | | 8,863,195 | |
| | | | |
Thailand | | | 0 | | | | 1,140,980 | | | | 0 | | | | 1,140,980 | |
| | | | |
United Kingdom | | | 1,113,919 | | | | 12,735,039 | | | | 0 | | | | 13,848,958 | |
| | | | |
United States | | | 11,385,602 | | | | 0 | | | | 0 | | | | 11,385,602 | |
| | | | |
Short-term investments | | | | | | | | | | | | | | | | |
| | | | |
Investment companies | | | 8,622,008 | | | | 0 | | | | 0 | | | | 8,622,008 | |
| | | | |
| | | 46,302,687 | | | | 144,054,895 | | | | 0 | | | | 190,357,582 | |
| | | | |
Forward foreign currency contracts | | | 0 | | | | 263,562 | | | | 0 | | | | 263,562 | |
| | | | |
Total assets | | $ | 46,302,687 | | | $ | 144,318,457 | | | $ | 0 | | | $ | 190,621,144 | |
| | | | |
Liabilities | | | | | | | | | | | | | | | | |
| | | | |
Forward foreign currency contracts | | $ | 0 | | | $ | 11,030 | | | $ | 0 | | | $ | 11,030 | |
| | | | |
Total liabilities | | $ | 0 | | | $ | 11,030 | | | $ | 0 | | | $ | 11,030 | |
Additional sector, industry or geographic detail is included in the Portfolio of Investments.
Forward foreign currency contracts are reported at their cumulative unrealized gains (losses) at measurement date as reported in the table following the Portfolio of Investments. All other assets and liabilities are reported at their market value at measurement date.
For the six months ended April 30, 2020, the Fund did not have any transfers into/out of Level 3.
4. TRANSACTIONS WITH AFFILIATES
Management fee
Funds Management, an indirect wholly owned subsidiary of Wells Fargo & Company (“Wells Fargo”), is the manager of the Fund and provides advisory and fund-level administrative services under an investment management agreement. Under the investment management agreement, Funds Management is responsible for, among other services, implementing the investment objectives and strategies of the Fund, supervising the subadviser and providing fund-level administrative services in
22 | Wells Fargo International Equity Fund
Notes to financial statements (unaudited)
connection with the Fund’s operations. As compensation for its services under the investment management agreement, Funds Management is entitled to receive a management fee at the following annual rate based on the Fund’s average daily net assets:
| | | | |
| |
| Average daily net assets | | Management fee | |
| |
First $500 million | | | 0.850 | % |
| |
Next $500 million | | | 0.800 | |
| |
Next $1 billion | | | 0.750 | |
| |
Next $2 billion | | | 0.725 | |
| |
Next $1 billion | | | 0.700 | |
| |
Next $5 billion | | | 0.690 | |
| |
Over $10 billion | | | 0.680 | |
For the six months ended April 30, 2020, the management fee was equivalent to an annual rate of 0.85% of the Fund’s average daily net assets.
Funds Management has retained the services of a subadviser to provide daily portfolio management to the Fund. The fee for subadvisory services is borne by Funds Management. Wells Capital Management Incorporated (“WellsCap”), an affiliate of Funds Management and an indirect wholly owned subsidiary of Wells Fargo, is the subadviser to the Fund and is entitled to receive a fee from Funds Management at an annual rate starting at 0.45% and declining to 0.40% as the average daily net assets of the Fund increase.
Administration fees
Under a class-level administration agreement, Funds Management provides class-level administrative services to the Fund, which includes paying fees and expenses for services provided by the transfer agent,sub-transfer agents, omnibus account servicers and record-keepers. As compensation for its services under the class-level administration agreement, Funds Management receives an annual fee which is calculated based on the average daily net assets of each class as follows:
| | | | |
| |
| | | Class-level
administration fee | |
| |
Class A, Class C, Class R | | | 0.21 | % |
| |
Class R6 | | | 0.03 | |
| |
Administrator Class, Institutional Class | | | 0.13 | |
Waivers and/or expense reimbursements
Funds Management has contractually waived and/or reimbursed management and administration fees to the extent necessary to maintain certain net operating expense ratios for the Fund. When each class of the Fund has exceeded its expense cap, Funds Management has waived fees and/or reimbursed expenses from fund-level expenses on a proportionate basis and then from class specific expenses. When only certain classes exceed their expense caps, waivers and/or reimbursements are applied against class specific expenses before fund-level expenses. Funds Management has committed through February 28, 2021 to waive fees and/or reimburse expenses to the extent necessary to cap the Fund’s expenses at 1.14% for Class A shares, 1.89% for Class C shares, 1.39% for Class R shares, 0.79% for Class R6 shares, 1.14% for Administrator Class shares, and 0.84% for Institutional Class shares. Prior to or after the commitment expiration date, the cap may be increased or the commitment to maintain the cap may be terminated only with the approval of the Board of Trustees.
Distribution fees
The Trust has adopted a distribution plan for Class C and Class R shares of the Fund pursuant to Rule12b-1 under the 1940 Act. Distribution fees are charged to Class C and Class R shares and paid to Wells Fargo Funds Distributor, LLC (“Funds Distributor”), the principal underwriter, at an annual rate of 0.75% of the average daily net assets of Class C shares and 0.25% of the average daily net assets of Class R shares.
In addition, Funds Distributor is entitled to receive thefront-end sales charge from the purchase of Class A shares and a contingent deferred sales charge on the redemption of certain Class A shares. Funds Distributor is also entitled to receive the contingent deferred sales charges from redemptions of Class C shares. For the six months ended April 30, 2020, Funds Distributor received $439 from the sale of Class A shares. No contingent deferred sales charges were incurred by Class A and Class C shares for the six months ended April 30, 2020.
Wells Fargo International Equity Fund | 23
Notes to financial statements (unaudited)
Shareholder servicing fees
The Trust has entered into contracts with one or more shareholder servicing agents, whereby Class A, Class C, Class R, and Administrator Class of the Fund are charged a fee at an annual rate of 0.25% of the average daily net assets of each respective class. A portion of these total shareholder servicing fees were paid to affiliates of Wells Fargo.
Interfund transactions
The Fund may purchase or sell portfolio investment securities to certain other Wells Fargo affiliates pursuant to Rule17a-7 under the 1940 Act and under procedures adopted by the Board of Trustees. The procedures have been designed to ensure that these interfund transactions, which do not incur broker commissions, are effected at current market prices.
5. INVESTMENT PORTFOLIO TRANSACTIONS
Purchases and sales of investments, excluding U.S. government obligations (if any) and short-term securities, for the six months ended April 30, 2020 were $90,058,080 and $134,254,837, respectively.
6. SECURITIES LENDING TRANSACTIONS
The Fund lends its securities through an unaffiliated securities lending agent and receives collateral in the form of cash or securities with a value at least equal to the value of the securities on loan. The value of the loaned securities is determined at the close of each business day and any increases or decreases in the required collateral are exchanged between the Fund and the counterparty on the next business day. Cash collateral received is invested in the Securities Lending Fund which seeks to provide a positive return compared to the daily Fed Funds Open Rate by investing in high-quality, U.S. dollar-denominated short-term money market instruments and is exempt from registration under Section 3(c)(7) of the 1940 Act. Securities Lending Fund is managed by Funds Management and is subadvised by WellsCap. Funds Management receives an advisory fee starting at 0.05% and declining to 0.01% as the average daily net assets of the Securities Lending Fund increase. All of the fees received by Funds Management are paid to WellsCap for its services as subadviser.
In the event of counterparty default or the failure of a borrower to return a loaned security, the Fund has the right to use the collateral to offset any losses incurred. As of April 30, 2020, the Fund did not have any securities on loan.
7. DERIVATIVE TRANSACTIONS
During the six months ended April 30, 2020, the Fund entered into forward foreign currency contracts for economic hedging purposes. The Fund had average contract amounts of $8,973,445 and $22,429,870 in forward foreign currency contracts to buy and forward foreign currency contracts to sell, respectively, during the six months ended April 30, 2020.
The fair value, realized gains or losses and change in unrealized gains or losses, if any, on derivative instruments are reflected in the corresponding financial statement captions.
For certain types of derivative transactions, the Fund has entered into International Swaps and Derivatives Association, Inc. master agreements (“ISDA Master Agreements”) or similar agreements with approved counterparties. The ISDA Master Agreements or similar agreements may have requirements to deliver/deposit securities or cash to/with an exchange or broker-dealer as collateral and allows the Fund to offset, with each counterparty, certain derivative financial instrument’s assets and/or liabilities with collateral held or pledged. Collateral requirements differ by type of derivative. Collateral or margin requirements are set by the broker or exchange clearinghouse for exchange traded derivatives while collateral terms are contract specific forover-the-counter traded derivatives. Cash collateral that has been pledged to cover obligations of the Fund under ISDA Master Agreements or similar agreements, if any, are reported separately in the Statement of Assets and Liabilities. Securities pledged as collateral, if any, are noted in the Portfolio of Investments. With respect to balance sheet offsetting, absent an event of default by the counterparty or a termination of the agreement, the reported amounts of financial assets and financial liabilities in the Statement of Assets and Liabilities are not offset across transactions between the Fund and the applicable counterparty. A reconciliation of the gross amounts on the Statement of Assets and Liabilities to the net amounts by counterparty, including any collateral exposure, for OTC derivatives is as follows:
24 | Wells Fargo International Equity Fund
Notes to financial statements (unaudited)
| | | | | | | | | | | | |
| | | | |
| Counterparty | | Gross amounts
of assets in the
Statement of
Assets and
Liabilities | | Amounts
subject to
netting
agreements | | Collateral
received | | | Net
amount of
assets | |
| | | | |
Credit Suisse | | $263,562 | | $0 | | $ | 0 | | | $ | 263,562 | |
| | | | |
| Counterparty | | Gross amounts
of liabilities in the
Statement of
Assets and
Liabilities | | Amounts
subject to
netting
agreements | | Collateral
pledged | | | Net
amount
of liabilities | |
| | | | |
State Street Bank | | $11,030 | | $0 | | $ | 0 | | | $ | 11,030 | |
8. BANK BORROWINGS
The Trust (excluding the money market funds), Wells Fargo Master Trust and Wells Fargo Variable Trust are parties to a $280,000,000 revolving credit agreement whereby the Fund is permitted to use bank borrowings for temporary or emergency purposes, such as to fund shareholder redemption requests. Interest under the credit agreement is charged to the Fund based on a borrowing rate equal to the higher of the Federal Funds rate in effect on that day plus 1.25% or the overnight LIBOR rate in effect on that day plus 1.25%. In addition, an annual commitment fee equal to 0.25% of the unused balance is allocated to each participating fund.
For the six months ended April 30, 2020, there were no borrowings by the Fund under the agreement.
9. INDEMNIFICATION
Under the Fund’s organizational documents, the officers and Trustees have been granted certain indemnification rights against certain liabilities that may arise out of performance of their duties to the Fund. The Fund has entered into a separate agreement with each Trustee that converts indemnification rights currently existing under the Fund’s organizational documents into contractual rights that cannot be changed in the future without the consent of the Trustee. Additionally, in the normal course of business, the Fund may enter into contracts with service providers that contain a variety of indemnification clauses. The Fund’s maximum exposure under these arrangements is dependent on future claims that may be made against the Fund and, therefore, cannot be estimated.
10. NEW ACCOUNTING PRONOUNCEMENT
In August 2018, FASB issued Accounting Standards Update (“ASU”)No. 2018-13, Fair Value Measurement (Topic 820)Disclosure Framework—Changes to the Disclosure Requirements for Fair Value Measurement. ASU2018-13 updates the disclosure requirements for fair value measurements by modifying or removing certain disclosures and adding certain new disclosures. The amendments are effective for fiscal years, and interim periods within those fiscal years, beginning after December 15, 2019. Early adoption is permitted. Management has adopted the removal and modification of disclosures early, as permitted, and will adopt the additional new disclosures at the effective date.
11. CORONAVIRUS(COVID-19) PANDEMIC
On March 11, 2020, the World Health Organization announced that it had made the assessment that coronavirus disease 2019(“COVID-19”) is a pandemic. The impacts ofCOVID-19 are adversely affecting the entire global economy, individual companies and investment products, and the market in general. There is significant uncertainty around the extent and duration of business disruptions related toCOVID-19 and the impacts may be short term or may last for an extended period of time. The risk of further spreading ofCOVID-19 has led to significant uncertainty and volatility in the financial markets. The value of the Fund and the securities in which the Fund invests have generally been adversely affected by impacts caused byCOVID-19.
Wells Fargo International Equity Fund | 25
Other information (unaudited)
TAX INFORMATION
Pursuant to Section 853 of the Internal Revenue Code, the following amounts have been designated as foreign taxes paid for the fiscal year ended October 31, 2019. These amounts may be less than the actual foreign taxes paid for financial statement purposes. Foreign taxes paid or withheld should be included in taxable income with an offsetting deduction from gross income or as a credit for taxes paid to foreign governments. None of the income was derived from ineligible foreign sources as defined under Section 901(j) of the Internal Revenue Code.
| | | | |
Creditable foreign taxes paid | | Per share amount | | Foreign income as % of ordinary income distributions |
| | |
| $699,534 | | $0.0282 | | 96.84% |
PROXY VOTING INFORMATION
A description of the policies and procedures used to determine how to vote proxies relating to portfolio securities is available, upon request, by calling1-800-222-8222, visiting our website atwfam.com, or visiting the SEC website at sec.gov. Information regarding how the proxies related to portfolio securities were voted during the most recent12-month period ended June 30 is available on the website atwfam.comor by visiting the SEC website at sec.gov.
QUARTERLY PORTFOLIO HOLDINGS INFORMATION
The Fund files its complete schedule of portfolio holdings with the SEC for the first and third quarters of each fiscal year as an exhibit to its reports on FormN-PORT. Shareholders may view the filed FormN-PORT by visiting the SEC website at sec.gov.
26 | Wells Fargo International Equity Fund
Other information (unaudited)
BOARD OF TRUSTEES AND OFFICERS
Each of the Trustees and Officers1 listed in the table below acts in identical capacities for each fund in the Wells Fargo family of funds, which consists of 147 mutual funds comprising the Wells Fargo Funds Trust, Wells Fargo Variable Trust, Wells Fargo Master Trust and fourclosed-end funds (collectively the “Fund Complex”). This table should be read in conjunction with the Prospectus and the Statement of Additional Information2. The mailing address of each Trustee and Officer is 525 Market Street, 12th Floor, San Francisco, CA 94105. Each Trustee and Officer serves an indefinite term, however, each Trustee serves such term until reaching the mandatory retirement age established by the Trustees.
Independent Trustees
| | | | | | |
Name and year of birth | | Position held and
length of service* | | Principal occupations during past five years or longer | | Current other
public company or
investment
company
directorships |
| | | |
William R. Ebsworth (Born 1957) | | Trustee, since 2015 | | Retired. From 1984 to 2013, equities analyst, portfolio manager, research director and chief investment officer at Fidelity Management and Research Company in Boston, Tokyo, and Hong Kong, and retired in 2013 as Chief Investment Officer of Fidelity Strategic Advisers, Inc. where he led a team of investment professionals managing client assets. Prior thereto, Board member of Hong Kong Securities Clearing Co., Hong Kong Options Clearing Corp., the Thailand International Fund, Ltd., Fidelity Investments Life Insurance Company, and Empire Fidelity Investments Life Insurance Company. Audit Committee Chair and Investment Committee Chair of the Vincent Memorial Hospital Endowment(non-profit organization). Mr. Ebsworth is a CFA® charterholder. | | N/A |
| | | |
Jane A. Freeman (Born 1953) | | Trustee, since 2015; Chair Liaison, since 2018 | | Retired. From 2012 to 2014 and 1999 to 2008, Chief Financial Officer of Scientific Learning Corporation. From 2008 to 2012, Ms. Freeman provided consulting services related to strategic business projects. Prior to 1999, Portfolio Manager at Rockefeller & Co. and Scudder, Stevens & Clark. Board member of the Harding Loevner Funds from 1996 to 2014, serving as both Lead Independent Director and chair of the Audit Committee. Board member of the Russell Exchange Traded Funds Trust from 2011 to 2012 and the chair of the Audit Committee. Ms. Freeman is also an inactive Chartered Financial Analyst. | | N/A |
| | | |
Isaiah Harris, Jr. (Born 1952) | | Trustee, since 2009; Audit Committee Chairman, since 2019 | | Retired. Chairman of the Board of CIGNA Corporation since 2009, and Director since 2005. From 2003 to 2011, Director of Deluxe Corporation. Prior thereto, President and CEO of BellSouth Advertising and Publishing Corp. from 2005 to 2007, President and CEO of BellSouth Enterprises from 2004 to 2005 and President of BellSouth Consumer Services from 2000 to 2003. Emeritus member of the Iowa State University Foundation Board of Governors. Emeritus Member of the Advisory Board of Iowa State University School of Business. Advisory Board Member, Palm Harbor Academy (private school). Advisory Board Member, Child Evangelism Fellowship(non-profit). Mr. Harris is a certified public accountant (inactive status). | | CIGNA Corporation |
| | | |
Judith M. Johnson (Born 1949) | | Trustee, since 2008; Audit Committee Chairman, from 2009 to 2018 | | Retired. Prior thereto, Chief Executive Officer and Chief Investment Officer of Minneapolis Employees Retirement Fund from 1996 to 2008. Ms. Johnson is an attorney, certified public accountant and a certified managerial accountant. | | N/A |
Wells Fargo International Equity Fund | 27
Other information (unaudited)
| | | | | | |
Name and year of birth | | Position held and
length of service* | | Principal occupations during past five years or longer | | Current other
public company or
investment
company
directorships |
| | | |
David F. Larcker (Born 1950) | | Trustee, since 2009 | | James Irvin Miller Professor of Accounting at the Graduate School of Business, Stanford University, Director of the Corporate Governance Research Initiative and Senior Faculty of The Rock Center for Corporate Governance since 2006. From 2005 to 2008, Professor of Accounting at the Graduate School of Business, Stanford University. Prior thereto, Ernst & Young Professor of Accounting at The Wharton School, University of Pennsylvania from 1985 to 2005. | | N/A |
| | | |
Olivia S. Mitchell (Born 1953) | | Trustee, since 2006; Nominating and Governance Committee Chair, since 2018 | | International Foundation of Employee Benefit Plans Professor, Wharton School of the University of Pennsylvania since 1993. Director of Wharton’s Pension Research Council and Boettner Center on Pensions & Retirement Research, and Research Associate at the National Bureau of Economic Research. Previously, Cornell University Professor from 1978 to 1993. | | N/A |
| | | |
Timothy J. Penny (Born 1951) | | Trustee, since 1996; Chairman, since 2018 | | President and Chief Executive Officer of Southern Minnesota Initiative Foundation, anon-profit organization, since 2007. Member of the Board of Trustees of NorthStar Education Finance, Inc., anon-profit organization, since 2007. | | N/A |
| | | |
James G. Polisson (Born 1959) | | Trustee, since 2018 | | Retired. Chief Marketing Officer, Source (ETF) UK Services, Ltd, from 2015 to 2017. From 2012 to 2015, Principal of The Polisson Group, LLC, a management consulting, corporate advisory and principal investing company. Chief Executive Officer and Managing Director at Russell Investments, Global Exchange Traded Funds from 2010 to 2012. Managing Director of Barclays Global Investors from 1998 to 2010 and Global Chief Marketing Officer for iShares and Barclays Global Investors from 2000 to 2010. Trustee of the San Francisco Mechanics’ Institute, anon-profit organization, from 2013 to 2015. Board member of the Russell Exchange Traded Fund Trust from 2011 to 2012. Director of Barclays Global Investors Holdings Deutschland GmbH from 2006 to 2009. Mr. Polisson is an attorney and has a retired status with the Massachusetts and District of Columbia Bar Associations. | | N/A |
| | | |
Pamela Wheelock (Born 1959) | | Trustee, since January 2020; previously Trustee from January 2018 to July 2019 | | Board member of the Destination Medical Center Economic Development Agency, Rochester, Minnesota since 2019 and Interim President of the McKnight Foundation since 2020. Acting Commissioner, Minnesota Department of Human Services, July 2019 through September 2019. Human Services Manager (part-time), Minnesota Department of Human Services, October 2019 through December 2019. Chief Operating Officer, Twin Cities Habitat for Humanity from 2017 to 2019. Vice President of University Services, University of Minnesota from 2012 to 2016. Prior thereto, on the Board of Directors, Governance Committee and Finance Committee for the Minnesota Philanthropy Partners (Saint Paul Foundation) from 2012 to 2018, Interim Chief Executive Officer of Blue Cross Blue Shield of Minnesota from 2011 to 2012, Chairman of the Board from 2009 to 2012 and Board Director from 2003 to 2015. Vice President, Leadership and Community Engagement, Bush Foundation, Saint Paul, Minnesota (a private foundation) from 2009 to 2011. Executive Vice President and Chief Financial Officer, Minnesota Sports and Entertainment from 2004 to 2009 and Senior Vice President from 2002 to 2004. Executive Vice President of the Minnesota Wild Foundation from 2004 to 2008. Commissioner of Finance, State of Minnesota, from 1999 to 2002. Currently Board Chair of the Minnesota Wild Foundation since 2010. | | N/A |
| * | Length of service dates reflect the Trustee’s commencement of service with the Trust’s predecessor entities, where applicable. |
28 | Wells Fargo International Equity Fund
Other information (unaudited)
Officers
| | | | |
Name and year of birth | | Position held and
length of service | | Principal occupations during past five years or longer |
| | |
Andrew Owen (Born 1960) | | President, since 2017 | | Executive Vice President of Wells Fargo & Company and Head of Affiliated Managers, Wells Fargo Asset Management, since 2014. In addition, Mr. Owen is currently President, Chief Executive Officer and Director of Wells Fargo Funds Management, LLC since 2017. Prior thereto, Executive Vice President responsible for marketing, investments and product development for Wells Fargo Funds Management, LLC, from 2009 to 2014. |
| | |
Jeremy DePalma1 (Born 1974) | | Treasurer, since 2012 | | Senior Vice President of Wells Fargo Funds Management, LLC since 2009. Senior Vice President of Evergreen Investment Management Company, LLC from 2008 to 2010 and head of the Fund Reporting and Control Team within Fund Administration from 2005 to 2010. |
| | |
Michelle Rhee (Born 1966) | | Chief Legal Officer, since 2019 | | Secretary of Wells Fargo Funds Management, LLC, Chief Legal Counsel of Wells Fargo Asset Management and Assistant General Counsel of Wells Fargo Bank, N.A. since 2018. Associate General Counsel and Managing Director of Bank of America Corporation from 2004 to 2018. |
| | |
Catherine Kennedy (Born 1969) | | Secretary, since 2019 | | Vice President of Wells Fargo Funds Management, LLC and Senior Counsel of the Wells Fargo Legal Department since 2010. Vice President and Senior Counsel of Evergreen Investment Management Company, LLC from 1998 to 2010. |
| | |
Michael H. Whitaker (Born 1967) | | Chief Compliance Officer, since 2016 | | Chief Compliance Officer of Wells Fargo Asset Management since 2016. Senior Vice President and Chief Compliance Officer for Fidelity Investments from 2007 to 2016. |
| | |
David Berardi (Born 1975) | | Assistant Treasurer, since 2009 | | Vice President of Wells Fargo Funds Management, LLC since 2009. Vice President of Evergreen Investment Management Company, LLC from 2008 to 2010. Manager of Fund Reporting and Control for Evergreen Investment Management Company, LLC from 2004 to 2010. |
| 1 | Jeremy DePalma acts as Treasurer of 82 funds and Assistant Treasurer of 65 funds in the Fund Complex. |
| 2 | The Statement of Additional Information includes additional information about the Trustees and is available, without charge, upon request, by calling1-800-222-8222 or by visiting the website atwfam.com. |
Wells Fargo International Equity Fund | 29
Appendix I (unaudited)
Effective on or about May 1, 2020, if you purchase Fund shares through a Janney Montgomery Scott LLC (“Janney”) brokerage account, you will be eligible for the following load waivers (front-end sales charge waivers and contingent deferred sales charge (“CDSC”), or back-end sales charge, waivers) and discounts, which may differ from those disclosed elsewhere in the Fund’s Prospectus or SAI.
|
| Front-end sales charge* waivers on Class A shares available at Janney |
|
| Shares purchased through reinvestment of capital gains distributions and dividend reinvestment when purchasing shares of the same fund (but not any other fund within the fund family). |
|
| Shares purchased by employees and registered representatives of Janney or its affiliates and their family members as designated by Janney. |
|
| Shares purchased from the proceeds of redemptions within the same fund family, provided (1) the repurchase occurs within ninety (90) days following the redemption, (2) the redemption and purchase occur in the same account, and (3) redeemed shares were subject to a front-end or deferred sales load (i.e., right of reinstatement). |
|
| Employer-sponsored retirement plans (e.g., 401(k) plans, 457 plans, employer-sponsored 403(b) plans, profit sharing and money purchase pension plans and defined benefit plans). For purposes of this provision, employer-sponsored retirement plans do not include SEP IRAs, Simple IRAs, SAR-SEPs or Keogh plans. |
|
| Shares acquired through a right of reinstatement. |
|
| Class C shares that are no longer subject to a contingent deferred sales charge and are converted to Class A shares of the same fund pursuant to Janney’s policies and procedures. |
| CDSC waivers on Class A and Class C shares available at Janney |
|
| Shares sold upon the death or disability of the shareholder. |
|
| Shares sold as part of a systematic withdrawal plan as described in the Fund’s Prospectus. |
|
| Shares purchased in connection with a return of excess contributions from an IRA account. |
|
| Shares sold as part of a required minimum distribution for IRA and retirement accounts if the redemption is taken in or after the year the shareholder reaches qualified age based on applicable IRS regulations. |
|
| Shares sold to pay Janney fees but only if the transaction is initiated by Janney. |
|
| Shares acquired through a right of reinstatement. |
|
| Shares exchanged into the same share class of a different fund. |
| Front-end sales charge* discounts available at Janney; breakpoints, rights of accumulation and/or letters of intent |
|
| Breakpoints as described in the Fund’s Prospectus. |
|
| Rights of accumulation (“ROA”), which entitle shareholders to breakpoint discounts, will be automatically calculated based on the aggregated holding of fund family assets held by accounts within the purchaser’s household at Janney. Eligible fund family assets not held at Janney may be included in the ROA calculation only if the shareholder notifies his or her financial advisor about such assets. |
|
| Letters of intent which allow for breakpoint discounts based on anticipated purchases within a fund family, over a 13-month time period. Eligible fund family assets not held at Janney Montgomery Scott may be included in the calculation of letters of intent only if the shareholder notifies his or her financial advisor about such assets. |
| * | Also referred to as an “initial sales charge.” |
30 | Wells Fargo International Equity Fund
Appendix II (unaudited)
Effective on or after May 1, 2020, clients of Edward Jones (also referred to as “shareholders”) purchasing Fund shares on the Edward Jones commission and fee-based platforms are eligible only for the following sales charge discounts (also referred to as “breakpoints”) and waivers, which can differ from breakpoints and waivers described elsewhere in the Fund’s Prospectus or SAI or through another broker-dealer. In all instances, it is the shareholder’s responsibility to inform Edward Jones at the time of purchase of any relationship, holdings of Wells Fargo Funds or other facts qualifying the purchaser for breakpoints or waivers. Edward Jones can ask for documentation of such circumstance.
|
| Breakpoints available at Edward Jones |
|
| Rights of Accumulation (ROA) |
|
The applicable sales charge on a purchase of Class A shares is determined by taking into account all share classes (except any money market funds and retirement plan share classes) of Wells Fargo Funds held by the shareholder or in an account grouped by Edward Jones with other accounts for the purpose of providing certain pricing considerations (“pricing groups”). This includes all share classes held on the Edward Jones platform and/or held on another platform. The inclusion of eligible fund family assets in the rights of accumulation calculation is dependent on the shareholder notifying his or her financial advisor of such assets at the time of calculation. |
|
ROA is determined by calculating the higher of cost or market value (current shares x NAV). |
|
| Letter of Intent (LOI) |
|
Through a LOI, shareholders can receive the sales charge and breakpoint discounts for purchases shareholders intend to makeover a 13-month period from the date Edward Jones receives the LOI. The LOI is determined by calculating the higher of cost or market value of qualifying holdings at LOI initiation in combination with the value that the shareholder intends to buy over a 13-month period to calculate the front-end sales charge and any breakpoint discounts. Each purchase the shareholder makes during that 13-month period will receive the sales charge and breakpoint discount that applies to the total amount. The inclusion of eligible fund family assets in the LOI calculation is dependent on the shareholder notifying his or her financial advisor of such assets at the time of calculation. Purchases made before the LOI is received by Edward Jones are not covered under the LOI and will not reduce the sales charge previously paid. Sales charges will be adjusted if LOI is not met. |
| Sales charges are waived for the following shareholders and in the following situations at Edward Jones: |
● Associates of Edward Jones and its affiliates and their family members who are in the same pricing group (as determined by Edward Jones under its policies and procedures) as the associate. This waiver will continue for the remainder of the associate’s life if the associate retires from Edward Jones in good-standing. |
● Shares purchased in an Edward Jones fee-based program. |
● Shares purchased through reinvestment of capital gains distributions and dividend reinvestment. |
● Shares purchased from the proceeds of redeemed shares of the same fund family so long as the following conditions are met: 1)the proceeds are from the sale of shares within 60 days of the purchase, and 2) the sale and purchase are made in the same share class and the same account or the purchase is made in an individual retirement account with proceeds from liquidations in anon-retirement account. |
● Shares exchanged into Class A shares from another share class so long as the exchange is into the same fund and was initiated at the discretion of Edward Jones. Edward Jones is responsible for any remaining CDSC due to the fund company, if applicable. Any future purchases are subject to the applicable sales charge as disclosed in the prospectus. |
● Exchanges from Class C shares to Class A shares of the same fund, generally, in the 84th month following the anniversary of the purchase date or earlier at the discretion of Edward Jones. |
If the shareholder purchases shares that are subject to a CDSC and those shares are redeemed before the CDSC is expired, the shareholder
is responsible to pay the CDSC except in the following conditions available at Edward Jones: |
● The death or disability of the shareholder. |
● Systematic withdrawals with up to 10% per year of the account value. |
● Return of excess contributions from an Individual Retirement Account (IRA). |
● Shares sold as part of a required minimum distribution for IRA and retirement accounts if the redemption is taken in or after the year the shareholder reaches qualified age based on applicable IRS regulation. |
● Shares sold to pay Edward Jones fees or costs in such cases where the transaction is initiated by Edward Jones. |
● Shares exchanged in an Edward Jones fee-based program. |
● Shares acquired through NAV reinstatement. |
Wells Fargo International Equity Fund | 31
Appendix II (unaudited)
|
| Other Important Information for accounts at Edward Jones: |
| Minimum Purchase Amounts |
● $250 initial purchase minimum |
● $50 subsequent purchase minimum |
|
| Minimum Balances |
| Edward Jones has the right to redeem at its discretion fund holdings with a balance of $250 or less. The following are examples of accounts that are not included in this policy: |
● A fee-based account held on an Edward Jones platform |
● A 529 account held on an Edward Jones platform |
● An account with an active systematic investment plan or letter of intent (LOI) |
|
| Changing Share Classes |
| At any time it deems necessary, Edward Jones has the authority to exchange at NAV a shareholder’s holdings in a fund to Class A shares. |
32 | Wells Fargo International Equity Fund
Appendix III (unaudited)
Effective June 1, 2020, shareholders purchasing Fund shares through an Oppenheimer & Co. Inc. (“Oppenheimer”) platform or account are eligible only for the following load waivers (front-end sales charge waivers and contingent deferred or back-end, sales charge waivers) and discounts, which may differ from those disclosed in the Fund’s Prospectus or SAI.
|
| Front-end Sales Load Waivers on Class A Shares available at Oppenheimer |
|
| Employer-sponsored retirement, deferred compensation and employee benefit plans (including health savings accounts) and trusts used to fund those plans, provided that the shares are not held in a commission-based brokerage account and shares are held for the benefit of the plan. |
|
| Shares purchased by or through a 529 Plan. |
|
| Shares purchased through an Oppenheimer affiliated investment advisory program. |
|
| Shares purchased through reinvestment of capital gains distributions and dividend reinvestment when purchasing shares of the same fund (but not any other fund within the fund family). |
|
| Shares purchased from the proceeds of redemptions within the same fund family, provided (1) the repurchase occurs within 90 days following the redemption, (2) the redemption and purchase occur in the same account, and (3) redeemed shares were subject to a front-end or deferred sales load (known as Rights of Restatement). |
|
| A shareholder in the Fund’s Class C shares will have their shares exchanged at net asset value to Class A shares (or the appropriate share class) of the Fund if the shares are no longer subject to a CDSC and the exchange is in line with the policies and procedures of Oppenheimer. |
|
| Employees and registered representatives of Oppenheimer or its affiliates and their family members. |
|
| Directors or Trustees of the Fund, and employees of the Fund’s investment adviser or any of its affiliates, as described in the Prospectus. |
| CDSC Waivers on A and C Shares available at Oppenheimer |
|
| Death or disability of the shareholder. |
|
| Shares sold as part of a systematic withdrawal plan as described in the Prospectus. |
|
| Return of excess contributions from an IRA Account. |
|
| Shares sold as part of a required minimum distribution for IRA and retirement accounts due to the shareholder reaching the qualified age based on applicable IRS regulations as described in the Prospectus. |
|
| Shares sold to pay Oppenheimer fees but only if the transaction is initiated by Oppenheimer. |
|
| Shares acquired through a right of reinstatement. |
| Front-end load Discounts Available at Oppenheimer: Breakpoints, Rights of Accumulation & Letters of Intent |
|
| Breakpoints as described in the Prospectus. |
|
| Rights of Accumulation (ROA), which entitle shareholders to breakpoint discounts, will be automatically calculated based on the aggregated holding of fund family assets held by accounts within the purchaser’s household at Oppenheimer. Eligible fund family assets not held at Oppenheimer may be included in the ROA calculation only if the shareholder notifies his or her financial advisor about such assets. |
Wells Fargo International Equity Fund | 33
Appendix IV (unaudited)
Effective June 15, 2020, shareholders purchasing fund shares through a Robert W. Baird & Co. (“Baird”) platform or account will only be eligible for the following sales charge waivers (front-end sales charge waivers and CDSC waivers) and discounts, which may differ from those disclosed elsewhere in the Fund’s Prospectus or the SAI.
|
| Front-end Sales Load Waivers on Class A Shares available at Baird |
|
| Shares purchased through reinvestment of capital gains distributions and dividend reinvestment when purchasing share of the same fund. |
|
| Share purchase by employees and registers representatives of Baird or its affiliate and their family members as designated by Baird. |
|
| Shares purchase from the proceeds of redemptions within the same fund family, provided (1) the repurchase occurs within 90 days following the redemption, (2) the redemption and purchase occur in the same accounts, and (3) redeemed shares were subject to a front-end or deferred sales charge (known as rights of reinstatement). |
|
| A shareholder in the Funds Investor C Shares will have their share exchanged at net asset value to Investor A shares of the fund if the shares are no longer subject to CDSC and the exchange is in line with the policies and procedures of Baird. |
|
| Employer-sponsored retirement plans or charitable accounts in a transactional brokerage account at Baird, including 401(k)plans, 457 plans, employer-sponsored 403(b) plans, profit sharing and money purchase pension plans and defined benefit plans. For purposes of this provision, employer-sponsored retirement plans do not include SEP IRAs, Simple IRAs or SAR-SEPs. |
| CDSC Waivers on A and C Shares available at Baird |
|
| Shares sold due to death or disability of the shareholder. |
|
| Shares sold as part of a systematic withdrawal plan as described in the Fund’s Prospectus. |
|
| Shares bought due to returns of excess contributions from an IRA Account. |
|
| Shares sold as part of a required minimum distribution for IRA and retirement accounts due to the shareholder reaching age 72 as described in the Fund’s Prospectus. |
|
| Shares sold to pay Baird fees but only if the transaction is initiated by Baird. |
|
| Shares acquired through a right of reinstatement. |
| Front-end load Discounts Available at Baird: Breakpoint and/or Rights of Accumulation |
|
| Breakpoints as described in the Prospectus. |
|
| Rights of accumulations which entitles shareholders to breakpoint discounts will be automatically calculated based on the aggregated holding of fund family assets held by accounts within the purchaser’s household at Baird. Eligible fund family assets not held at Baird may be included in the rights of accumulations calculation only if the shareholder notifies his or her financial advisor about such assets. |
|
| Letters of Intent (LOI) allow for breakpoint discounts based on anticipated purchases within a fund family through Baird, over a 13-month period of time. |
34 | Wells Fargo International Equity Fund
This page is intentionally left blank.
This page is intentionally left blank.

For more information
More information about Wells Fargo Funds is available free upon request. To obtain literature, please write, visit the Fund’s website, or call:
Wells Fargo Funds
P.O. Box 219967
Kansas City, MO 64121-9967
Website:wfam.com
Individual investors:1-800-222-8222
Retail investment professionals:1-888-877-9275
Institutional investment professionals:1-866-765-0778

This report and the financial statements contained herein are submitted for the general information of the shareholders of the Fund. If this report is used for promotional purposes, distribution of the report must be accompanied or preceded by a current prospectus. Before investing, please consider the investment objectives, risks, charges, and expenses of the investment. For a current prospectus and, if available, a summary prospectus, containing this information, call1-800-222-8222 or visit the Fund’s website atwfam.com. Read the prospectus carefully before you invest or send money.
Wells Fargo Asset Management (WFAM) is the trade name for certain investment advisory/management firms owned by Wells Fargo & Company. These firms include but are not limited to Wells Capital Management Incorporated and Wells Fargo Funds Management, LLC. Certain products managed by WFAM entities are distributed by Wells Fargo Funds Distributor, LLC (a broker-dealer and Member FINRA).
This material is for general informational and educational purposes only and is NOT intended to provide investment advice or a recommendation of any kind—including a recommendation for any specific investment, strategy, or plan.
INVESTMENT PRODUCTS: NOT FDIC INSURED ◾ NO BANK GUARANTEE ◾ MAY LOSE VALUE
© 2019 Wells Fargo & Company. All rights reserved.
PAR-0520-00420 06-20
SA240/SAR240 04-20
Semi-Annual Report
April 30, 2020
Wells Fargo
Emerging Markets Equity Fund
Beginning on January 1, 2021, as permitted by new regulations adopted by the Securities and Exchange Commission, paper copies of the Wells Fargo Funds’ annual and semi-annual shareholder reports issued after this date will no longer be sent by mail, unless you specifically request paper copies of the reports. Instead, the reports will be made available on the Funds’ website, and you will be notified by mail each time a report is posted and provided with a website address to access the report.
If you already elected to receive shareholder reports electronically, you will not be affected by this change and you need not take any action. You may elect to receive shareholder reports and other communications from the Fund electronically at any time by contacting your financial intermediary (such as a broker-dealer or bank) or, if you are a direct investor, by calling1-800-222-8222 or by enrolling at wellsfargo.com/advantagedelivery.
You may elect to receive all future reports in paper free of charge. If you invest through a financial intermediary, you can contact your financial intermediary to request that you continue to receive paper copies of your shareholder reports; if you invest directly with the Fund, you can call 1-800-222-8222. Your election to receive reports in paper will apply to all Wells Fargo Funds held in your account with your financial intermediary or, if you are a direct investor, to all Wells Fargo Funds that you hold.
|
|
|
Reduce clutter. Save trees. |
Sign up for electronic
delivery of prospectuses and
shareholder reports atwellsfargo.com/
advantagedelivery |
The views expressed and any forward-looking statements are as of April 30, 2020, unless otherwise noted, and are those of the Fund managers and/or Wells Fargo Asset Management. Discussions of individual securities, or the markets generally, or any Wells Fargo Fund are not intended as individual recommendations. Future events or results may vary significantly from those expressed in any forward-looking statements. The views expressed are subject to change at any time in response to changing circumstances in the market. Wells Fargo Asset Management and the Fund disclaim any obligation to publicly update or revise any views expressed or forward-looking statements.
INVESTMENT PRODUCTS: NOT FDIC INSURED ◾ NO BANK GUARANTEE ◾ MAY LOSE VALUE
Wells Fargo Emerging Markets Equity Fund | 1
Letter to shareholders (unaudited)

Andrew Owen
President
Wells Fargo Funds
“The period began with a tailwind created by central bank support.”
Dear Shareholder:
We are pleased to offer you this semi-annual report for the Wells Fargo Emerging Markets Equity Fund for the six-month period that ended April 30, 2020. Global stock markets saw earlier gains erased in February and March as governments took unprecedented measures to stop the spread of the coronavirus at the expense of short-term economic output. Markets rebounded in April to lessen the losses as central banks attempted to bolster capital markets and confidence. Fixed-income markets performed better, with the exception of high-yield bonds, as U.S. bonds overall achieved modest gains.
For the six-month period, U.S. stocks, based on the S&P 500 Index,1 returned -3.16% and international stocks, as measured by the MSCI ACWI ex USA Index (Net),2 fell 13.22%. The MSCI Emerging Markets Index (Net)3 lost 10.50%. For bond investors, the Bloomberg Barclays U.S. Aggregate Bond Index4 added 4.86%, the Bloomberg Barclays Global Aggregate ex-USD Index5 returned -0.97%, the Bloomberg Barclays Municipal Bond Index6 returned -1.33%, and the ICE BofA U.S. High Yield Index7 lost 7.68%.
The period began with a tailwind created by central bank support.
The period began with a tailwind that had been created by U.S. Federal Reserve (Fed) rate cuts in the summer and early fall. Equity markets rallied in November despite ongoing geopolitical risks. Hopes for a U.S.-China trade deal buoyed investor confidence. U.S. business sentiment edged up, and manufacturing and services activity rose. With that positive backdrop, developed market equities outpaced those in emerging markets, and U.S. stocks outperformed non-U.S. stocks overall. While consumer confidence and purchasing manager activity rose in the eurozone, China reported weakening manufacturing and consumer data. Bond yields rose marginally, leading to slightly negative returns for global government and investment-grade corporate bonds.
Financial markets ended 2019 with a boost from the U.S. and China accord on a Phase One trade deal. That, along with the landslide win by the pro-Brexit U.K. Conservative Party in a national election and ongoing central bank support, gave investors greater confidence. U.S. economic indicators were positive overall, with the exception of manufacturing activity and business confidence. Consumer confidence was resilient, fed by a robust labor market, tame inflation, and lower interest rates, which boosted housing affordability and stimulated homebuyer activity. The impeachment of U.S. President Donald Trump had little impact on markets. Meanwhile, slowing Chinese economic activity, partly attributable to the trade war, led to further government stimulus at year-end through lower reserve ratios, allowing banks to lend more money.
The year-end rally continued in early January 2020. However, capital market volatility spiked in late January on concerns over the potential impact of the coronavirus on the global economy and stock markets. With sentiment somewhat souring, perceived safe
| 1 | The S&P 500 Index consists of 500 stocks chosen for market size, liquidity, and industry group representation. It is a market-value-weighted index with each stock’s weight in the index proportionate to its market value. You cannot invest directly in an index. |
| 2 | The Morgan Stanley Capital International (MSCI) All Country World Index (ACWI) ex USA Index (Net) is a free-float-adjusted market-capitalization-weighted index that is designed to measure the equity market performance of developed markets, excluding the United States. Source: MSCI. MSCI makes no express or implied warranties or representations and shall have no liability whatsoever with respect to any MSCI data contained herein. The MSCI data may not be further redistributed or used as a basis for other indices or any securities or financial products. This report is not approved, reviewed, or produced by MSCI. You cannot invest directly in an index. |
| 3 | The MSCI Emerging Markets (EM) Index (Net) is a free-float-adjusted market-capitalization-weighted index that is designed to measure equity market performance of emerging markets. You cannot invest directly in an index. |
| 4 | The Bloomberg Barclays U.S. Aggregate Bond Index is a broad-based benchmark that measures the investment-grade, U.S. dollar-denominated, fixed-rate taxable bond market, including Treasuries, government-related and corporate securities, mortgage-backed securities (agency fixed-rate and hybrid adjustable-rate mortgage pass-throughs), asset-backed securities, and commercial mortgage-backed securities. You cannot invest directly in an index. |
| 5 | The Bloomberg Barclays Global Aggregate ex-USD Index is an unmanaged index that provides a broad-based measure of the global investment-grade fixed-income markets excluding the U.S. dollar-denominated debt market. You cannot invest directly in an index. |
| 6 | The Bloomberg Barclays Municipal Bond Index is an unmanaged index composed of long-term tax-exempt bonds with a minimum credit rating of Baa. You cannot invest directly in an index. |
| 7 | The ICE BofA U.S. High Yield Index is a market-capitalization-weighted index of domestic and Yankee high-yield bonds. The index tracks the performance of high-yield securities traded in the U.S. bond market. You cannot invest directly in an index. Copyright 2020. ICE Data Indices, LLC. All rights reserved. |
2 | Wells Fargo Emerging Markets Equity Fund
Letter to shareholders (unaudited)
havens did well in January. The U.S. dollar and Japanese yen both rose, and government bonds outperformed equities. While the S&P 500 Index held its ground, emerging market equities tumbled, including those in Asia.
In February, the coronavirus became the major market focus. Fears of the virus’s impact on global growth led to expectations of increased global central bank monetary policy support. That led the 10-year U.S. Treasury yield to fall to an all-time low of 1.1% by the end of the month. Although equity markets initially shrugged off concerns about the outbreak, focusing instead on strong fourth-quarter earnings and improving business confidence in January, market sentiment turned sharply lower toward month-end. Oil prices tumbled as Russia and the Organization of the Petroleum Exporting Countries compounded a major decline in oil demand with a brutal price war, causing the price of West Texas Intermediate crude oil to fall 13% in February alone.
The global spread of the coronavirus led many countries to clamp down on social and business-related activity in order to contain the virus from causing even greater devastation and overwhelming the health care system. This abrupt stoppage of economic activity led to the sharp deceleration of global output, sending economies into a deep contraction. Central bank responses were swift, as they slashed interest rates and expanded quantitative easing programs to restore liquidity and confidence to the markets. In the U.S., the Fed launched several lending programs, funding investment-grade bonds, money market mutual funds, and commercial paper while purchasing Treasuries, mortgage-backed securities, and overnight repurchase agreements . Meanwhile, stock markets tumbled quickly into a bear market, ending the longest bull stock market in U.S. history.
Markets rebounded strongly in April after the extreme volatility of the previous two months, with the S&P 500 Index gaining 12.8% for the month and the MSCI ACWI ex USA Index (Net) returning 7.6%. The rebound was fueled by unprecedented stimulus measures taken by governments and central banks to buffer the economic damage created by mass shutdowns to try to contain the virus’s spread. The U.S. economy contracted by an annualized 4.8% pace in the first quarter, with 30 million new unemployment insurance claims in six weeks. In the eurozone, first-quarter real gross domestic product (GDP) shrank 3.8%, with the composite April Flash Purchasing Managers’ Index, a monthly survey of purchasing managers, falling to an all-time low of 13.5. The European Central Bank expanded its quantitative easing to include the purchase of additional government bonds of countries with the greatest virus-related need, including Italy and Spain. China’s first-quarter GDP fell by 6.8% year over year. However, retail sales, production, and investment showed signs of recovery. Extreme oil price volatility continued as global supply far exceeded demand.
Don’t let short-term uncertainty derail long-term investment goals.
Periods of investment uncertainty can present challenges, but experience has taught us that maintaining long-term investment goals can be an effective way to plan for the future. To help you create a sound strategy based on your personal goals and risk tolerance, Wells Fargo Funds offers more than 100 mutual funds spanning a wide range of asset classes and investment styles. Although diversification cannot guarantee an investment profit or prevent losses, we believe it can be an effective way to manage investment risk and potentially smooth out overall portfolio performance. We encourage investors to know their investments and to understand that appropriate levels of risk-taking may unlock opportunities.
Thank you for choosing to invest with Wells Fargo Funds. We appreciate your confidence in us and remain committed to helping you meet your financial needs.
Sincerely,

Andrew Owen
President
Wells Fargo Funds
“The global spread of the coronavirus led many countries to clamp down on social and business-related activity in order to contain the virus from causing even greater devastation and overwhelming the health care system.”
|
|
|
For further information about your Fund, contact your investment professional, visit our website at wfam.com, or call us directly at1-800-222-8222. |
Wells Fargo Emerging Markets Equity Fund | 3
Performance highlights (unaudited)
Investment objective
The Fund seeks long-term capital appreciation.
Manager
Wells Fargo Funds Management, LLC
Subadviser
Wells Capital Management Incorporated
Portfolio managers
Derrick Irwin, CFA®‡
Richard Peck, CFA®‡
Yi (Jerry) Zhang, Ph.D., CFA®‡
Average annual total returns (%) as of April 30, 20201
| | | | | | | | | | | | | | | | | | | | | | | | | | | | | | | | | | |
| | | | |
| | | | | Including sales charge | | | Excluding sales charge | | | Expense ratios2 (%) | |
| | | | | | | | | |
| | | Inception date | | 1 year | | | 5 year | | | 10 year | | | 1 year | | | 5 year | | | 10 year | | | Gross | | | Net3 | |
| | | | | | | | | | |
| Class A (EMGAX) | | 9-6-1994 | | | -13.72 | | | | 0.69 | | | | 1.54 | | | | -8.45 | | | | 1.89 | | | | 2.14 | | | | 1.59 | | | | 1.56 | |
| | | | | | | | | | |
| Class C (EMGCX) | | 9-6-1994 | | | -10.18 | | | | 1.12 | | | | 1.37 | | | | -9.18 | | | | 1.12 | | | | 1.37 | | | | 2.34 | | | | 2.31 | |
| | | | | | | | | | |
| Class R6 (EMGDX)4 | | 6-28-2013 | | | – | | | | – | | | | – | | | | -8.04 | | | | 2.33 | | | | 2.60 | | | | 1.16 | | | | 1.14 | |
| | | | | | | | | | |
| Administrator Class (EMGYX) | | 9-6-1994 | | | – | | | | – | | | | – | | | | -8.35 | | | | 2.00 | | | | 2.29 | | | | 1.51 | | | | 1.43 | |
| | | | | | | | | | |
| Institutional Class (EMGNX)5 | | 7-30-2010 | | | – | | | | – | | | | – | | | | -8.15 | | | | 2.27 | | | | 2.56 | | | | 1.26 | | | | 1.18 | |
| | | | | | | | | | |
| MSCI EM Index (Net)6 | | – | | | – | | | | – | | | | – | | | | -12.00 | | | | -0.10 | | | | 1.45 | | | | – | | | | – | |
Figures quoted represent past performance, which is no guarantee of future results, and do not reflect taxes that a shareholder may pay on an investment in a fund. Investment return and principal value of an investment will fluctuate so that an investor’s shares, when redeemed, may be worth more or less than their original cost. Performance shown without sales charges would be lower if sales charges were reflected. Current performance may be lower or higher than the performance data quoted, which assumes the reinvestment of dividends and capital gains. Current month-end performance is available on the Fund’s website,wfam.com.
Index returns do not include transaction costs associated with buying and selling securities, any mutual fund fees or expenses, or any taxes. It is not possible to invest directly in an index.
For Class A shares, the maximum front-end sales charge is 5.75%. For Class C shares, the maximum contingent deferred sales charge is 1.00%. Performance including a contingent deferred sales charge assumes the sales charge for the corresponding time period. Class R6, Administrator Class, and Institutional Class shares are sold without a front-end sales charge or contingent deferred sales charge.
Stock values fluctuate in response to the activities of individual companies and general market and economic conditions. Foreign investments are especially volatile and can rise or fall dramatically due to differences in the political and economic conditions of the host country. These risks are generally intensified in emerging markets. The use of derivatives may reduce returns and/or increase volatility. Certain investment strategies tend to increase the total risk of an investment (relative to the broader market). The Fund is exposed to smaller-company securities risk. Consult the Fund’s prospectus for additional information on these and other risks.
Please see footnotes on page 5.
4 | Wells Fargo Emerging Markets Equity Fund
Performance highlights (unaudited)
| | | | |
|
| Ten largest holdings (%) as of April 30, 20207 | |
| | |
Samsung Electronics Company Limited | | | 5.14 | |
| | |
Tencent Holdings Limited | | | 4.86 | |
| | |
Taiwan Semiconductor Manufacturing Company Limited ADR | | | 3.27 | |
| | |
China Mobile Limited | | | 3.26 | |
| | |
Alibaba Group Holding Limited ADR | | | 3.23 | |
| | |
Vipshop Holdings Limited ADR | | | 2.74 | |
| | |
Reliance Industries Limited GDR | | | 2.50 | |
| | |
Li Ning Company Limited | | | 2.44 | |
| | |
AIA Group Limited | | | 2.37 | |
| | |
WH Group Limited | | | 2.29 | |
|
|
| Sector allocation as of April 30, 20208 |
|
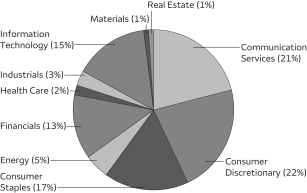 |
|
|
| Country allocation as of April 30, 20208 |
|
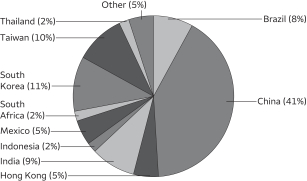 |
| ‡ | CFA® and Chartered Financial Analyst® are trademarks owned by CFA Institute. |
| 1 | Historical performance prior to July 19, 2010, is based on the performance of the same class of the Fund’s predecessor, Evergreen Emerging Markets Growth Fund. |
| 2 | Reflects the expense ratios as stated in the most recent prospectuses, which include the impact of 0.01% in acquired fund fees and expenses. The expense ratios shown are subject to change and may differ from the annualized expense ratios shown in the financial highlights of this report, which do not include acquired fund fees and expenses. |
| 3 | The manager has contractually committed through February 28, 2021, to waive fees and/or reimburse expenses to the extent necessary to cap total annual fund operating expenses after fee waivers at 1.55% for Class A, 2.30% for Class C, 1.13% for Class R6, 1.42% for Administrator Class, and 1.17% for Institutional Class. Brokerage commissions, stamp duty fees, interest, taxes, acquired fund fees and expenses (if any), and extraordinary expenses are excluded from the expense cap. Prior to or after the commitment expiration date, the cap may be increased or the commitment to maintain the cap may be terminated only with the approval of the Board of Trustees. Without this cap, the Fund’s returns would have been lower. The expense ratio paid by an investor is the net expense ratio (the total annual fund operating expenses after fee waivers) as stated in the prospectuses. |
| 4 | Historical performance shown for the Class R6 shares prior to their inception reflects the performance of the Institutional Class shares and includes the higher expenses applicable to the Institutional Class shares. If these expenses had not been included, returns for the Class R6 shares would have been higher. |
| 5 | Historical performance shown for Institutional Class shares prior to their inception reflects the performance of Administrator Class shares and includes the higher expenses applicable to Administrator Class shares. If these expenses had not been included, returns for Institutional Class shares would be higher. |
| 6 | The Morgan Stanley Capital International (MSCI) Emerging Markets (EM) Index (Net) is a free-float-adjusted market-capitalization-weighted index that is designed to measure the equity market performance of emerging markets. You cannot invest directly in an index. |
| 7 | The ten largest holdings, excluding cash, cash equivalents and any money market funds, are calculated based on the value of the investments divided by total net assets of the Fund. Holdings are subject to change and may have changed since the date specified. |
| 8 | Amounts are calculated based on the total long-term investments of the Fund. These amounts are subject to change and may have changed since the date specified. |
Wells Fargo Emerging Markets Equity Fund | 5
Fund expenses (unaudited)
As a shareholder of the Fund, you incur two types of costs: (1) transaction costs, including sales charges (loads) on purchase payments and contingent deferred sales charges (if any) on redemptions and (2) ongoing costs, including management fees, distribution (12b-1) and/or shareholder servicing fees, and other Fund expenses. This example is intended to help you understand your ongoing costs (in dollars) of investing in the Fund and to compare these costs with the ongoing costs of investing in other mutual funds.
The example is based on an investment of $1,000 invested at the beginning of the six-month period and held for the entire period from November 1, 2019 to April 30, 2020.
Actual expenses
The “Actual” line of the table below provides information about actual account values and actual expenses. You may use the information in this line, together with the amount you invested, to estimate the expenses that you paid over the period. Simply divide your account value by $1,000 (for example, an $8,600 account value divided by $1,000 = 8.6), then multiply the result by the number in the “Actual” line under the heading entitled “Expenses paid during period” for your applicable class of shares to estimate the expenses you paid on your account during this period.
Hypothetical example for comparison purposes
The “Hypothetical” line of the table below provides information about hypothetical account values and hypothetical expenses based on the Fund’s actual expense ratio and an assumed rate of return of 5% per year before expenses, which is not the Fund’s actual return. The hypothetical account values and expenses may not be used to estimate the actual ending account balance or expenses you paid for the period. You may use this information to compare the ongoing costs of investing in the Fund and other funds. To do so, compare this 5% hypothetical example with the 5% hypothetical examples that appear in the shareholder reports of the other funds.
Please note that the expenses shown in the table are meant to highlight your ongoing costs only and do not reflect any transactional costs, such as sales charges (loads) and contingent deferred sales charges. Therefore, the “Hypothetical” line of the table is useful in comparing ongoing costs only and will not help you determine the relative total costs of owning different funds. In addition, if these transactional costs were included, your costs would have been higher.
| | | | | | | | | | | | | | | | |
| | | Beginning account value 11-1-2019 | | | Ending account value 4-30-2020 | | | Expenses paid during the period¹ | | | Annualized net expense ratio | |
| | | | | |
Class A | | | | | | | | | | | | | | | | |
| | | | |
Actual | | $ | 1,000.00 | | | $ | 894.86 | | | $ | 7.30 | | | | 1.55 | % |
| | | | |
Hypothetical (5% return before expenses) | | $ | 1,000.00 | | | $ | 1,017.16 | | | $ | 7.77 | | | | 1.55 | % |
| | | | | |
Class C | | | | | | | | | | | | | | | | |
| | | | |
Actual | | $ | 1,000.00 | | | $ | 891.42 | | | $ | 10.86 | | | | 2.31 | % |
| | | | |
Hypothetical (5% return before expenses) | | $ | 1,000.00 | | | $ | 1,013.38 | | | $ | 11.56 | | | | 2.31 | % |
| | | | | |
Class R6 | | | | | | | | | | | | | | | | |
| | | | |
Actual | | $ | 1,000.00 | | | $ | 896.92 | | | $ | 5.33 | | | | 1.13 | % |
| | | | |
Hypothetical (5% return before expenses) | | $ | 1,000.00 | | | $ | 1,019.24 | | | $ | 5.67 | | | | 1.13 | % |
| | | | | |
Administrator Class | | | | | | | | | | | | | | | | |
| | | | |
Actual | | $ | 1,000.00 | | | $ | 895.38 | | | $ | 6.83 | | | | 1.45 | % |
| | | | |
Hypothetical (5% return before expenses) | | $ | 1,000.00 | | | $ | 1,017.65 | | | $ | 7.27 | | | | 1.45 | % |
| | | | | |
Institutional Class | | | | | | | | | | | | | | | | |
| | | | |
Actual | | $ | 1,000.00 | | | $ | 896.56 | | | $ | 5.56 | | | | 1.18 | % |
| | | | |
Hypothetical (5% return before expenses) | | $ | 1,000.00 | | | $ | 1,019.00 | | | $ | 5.92 | | | | 1.18 | % |
| 1 | Expenses paid is equal to the annualized net expense ratio of each class multiplied by the average account value over the period, multiplied by the number of days in the most recent fiscal half-year divided by the number of days in the fiscal year (to reflect the one-half-year period). |
6 | Wells Fargo Emerging Markets Equity Fund
Portfolio of investments—April 30, 2020 (unaudited)
| | | | | | | | | | | | | | | | |
| | | | | | | | | Shares | | | Value | |
| Common Stocks: 96.73% | |
| | | | |
| Argentina: 0.28% | | | | | | | | | | | | |
MercadoLibre Incorporated (Consumer Discretionary, Internet & Direct Marketing Retail) † | | | | | | | | | | | 17,216 | | | $ | 10,045,708 | |
| | | | | | | | | | | | | | | | |
| | | | |
| Brazil: 6.09% | | | | | | | | | | | | |
Ambev SA ADR (Consumer Staples, Beverages) | | | | | | | | | | | 3,764,500 | | | | 8,093,675 | |
Atacadao Distribuicao Comercio e Industria Limitada (Consumer Staples, Food & Staples Retailing) | | | | | | | | | | | 5,370,000 | | | | 19,750,271 | |
B2W Companhia Digital (Consumer Discretionary, Internet & Direct Marketing Retail) † | | | | | | | | | | | 3,931,697 | | | | 52,961,034 | |
B3 Brasil Bolsa Balcao SA (Financials, Capital Markets) | | | | | | | | | | | 4,623,005 | | | | 32,662,582 | |
Banco Bradesco SA ADR (Financials, Banks) | | | | | | | | | | | 4,548,163 | | | | 16,009,534 | |
BK Brasil Operacao e Assessoria a Restaurantes SA (Consumer Discretionary, Hotels, Restaurants & Leisure) | | | | | | | | | | | 2,735,794 | | | | 4,759,303 | |
BRF Brazil Foods SA ADR (Consumer Staples, Food Products) † | | | | | | | | | | | 7,143,392 | | | | 25,573,343 | |
Cogna Educacao (Consumer Discretionary, Diversified Consumer Services) | | | | | | | | | | | 3,346,000 | | | | 3,408,823 | |
Hapvida Participacoes e Investimentos SA (Health Care, Health Care Providers & Services) 144A | | | | | | | | | | | 1,994,507 | | | | 19,233,886 | |
Lojas Renner SA (Consumer Discretionary, Multiline Retail) | | | | | | | | | | | 2,920,175 | | | | 20,615,590 | |
Multiplan Empreendimentos Imobiliarios SA (Real Estate, Real Estate Management & Development) | | | | | | | | | | | 1,636,906 | | | | 6,288,267 | |
Raia Drogasil SA (Consumer Staples, Food & Staples Retailing) | | | | | | | | | | | 423,600 | | | | 8,162,123 | |
| |
| | | | 217,518,431 | |
| | | | | | | | | | | | | | | | |
| | | | |
| Chile: 1.20% | | | | | | | | | | �� | | |
Banco Santander Chile SA ADR (Financials, Banks) | | | | | | | | | | | 1,080,492 | | | | 18,173,875 | |
S.A.C.I. Falabella (Consumer Discretionary, Multiline Retail) | | | | | | | | | | | 9,060,549 | | | | 24,743,145 | |
| |
| | | | 42,917,020 | |
| | | | | | | | | | | | | | | | |
| | | | |
| China: 40.11% | | | | | | | | | | | | |
51job Incorporated ADR (Industrials, Professional Services) † | | | | | | | | | | | 517,541 | | | | 31,021,408 | |
Alibaba Group Holding Limited ADR (Consumer Discretionary, Internet & Direct Marketing Retail) † | | | | | | | | | | | 568,837 | | | | 115,286,195 | |
Best Incorporated ADR (Industrials, Air Freight & Logistics) † | | | | | | | | | | | 3,997,927 | | | | 21,468,868 | |
Bilibili Incorporated ADR (Communication Services, Entertainment) † | | | | | | | | | | | 2,499,345 | | | | 68,457,060 | |
China Distance Education ADR (Consumer Discretionary, Diversified Consumer Services) | | | | | | | | | | | 966,510 | | | | 7,500,118 | |
China Life Insurance Company H Shares (Financials, Insurance) | | | | | | | | | | | 25,443,190 | | | | 54,262,659 | |
China Literature Limited (Communication Services, Media) 144A† | | | | | | | | | | | 2,714,968 | | | | 12,119,326 | |
China MeiDong Auto Holdings Limited (Consumer Discretionary, Specialty Retail) | | | | | | | | | | | 17,513,400 | | | | 31,513,785 | |
China Mobile Limited (Communication Services, Wireless Telecommunication Services) | | | | | | | | | | | 14,495,865 | | | | 116,533,084 | |
FinVolution Group ADR (Financials, Consumer Finance) | | | | | | | | | | | 4,401,985 | | | | 8,451,811 | |
Greentree Hospitality Group Limited (Consumer Discretionary, Hotels, Restaurants & Leisure) | | | | | | | | | | | 1,215,741 | | | | 15,123,818 | |
Hua Medicine Limited (Health Care, Pharmaceuticals) 144A† | | | | | | | | | | | 8,733,136 | | | | 3,379,479 | |
Huami Corporation ADR (Information Technology, Electronic Equipment, Instruments & Components) † | | | | | | | | | | | 2,099,291 | | | | 26,493,052 | |
IQIYI Incorporated ADR (Communication Services, Entertainment) † | | | | | | | | | | | 925,339 | | | | 15,703,003 | |
Jianpu Technology Incorporated ADR (Financials, Consumer Finance) † | | | | | | | | | | | 3,070,490 | | | | 3,009,080 | |
Koolearn Technology Holding Limited (Consumer Discretionary, Diversified Consumer Services) 144A† | | | | | | | | | | | 7,233,215 | | | | 34,717,754 | |
Li Ning Company Limited (Consumer Discretionary, Textiles, Apparel & Luxury Goods) | | | | | | | | | | | 27,597,707 | | | | 87,139,027 | |
Meituan Dianping (Consumer Discretionary, Internet & Direct Marketing Retail) † | | | | | | | | | | | 4,395,100 | | | | 58,846,354 | |
New Oriental Education & Technology Group Incorporated ADR (Consumer Discretionary, Diversified Consumer Services) † | | | | | | | | | | | 565,289 | | | | 72,164,794 | |
Pinduoduo Incorporated ADR (Consumer Discretionary, Internet & Direct Marketing Retail) † | | | | | | | | | | | 221,441 | | | | 10,505,161 | |
Shandong Weigao Group Medical Polymer Company Limited H Shares (Health Care, Health Care Equipment & Supplies) | | | | | | | | | | | 17,890,600 | | | | 27,178,398 | |
Shanghai Junshi Bioscience H Shares (Health Care, Biotechnology) 144A† | | | | | | | | | | | 1,533,169 | | | | 7,383,972 | |
SINA Corporation (Communication Services, Interactive Media & Services) † | | | | | | | | | | | 879,207 | | | | 29,690,820 | |
Tencent Holdings Limited (Communication Services, Interactive Media & Services) | | | | | | | | | | | 3,303,400 | | | | 173,657,863 | |
Trip.com Group Limited ADR (Consumer Discretionary, Internet & Direct Marketing Retail) † | | | | | | | | | | | 1,538,013 | | | | 39,619,215 | |
Tsingtao Brewery Company Limited H Shares (Consumer Staples, Beverages) | | | | | | | | | | | 6,554,500 | | | | 39,818,109 | |
The accompanying notes are an integral part of these financial statements.
Wells Fargo Emerging Markets Equity Fund | 7
Portfolio of investments—April 30, 2020 (unaudited)
| | | | | | | | | | | | | | | | |
| | | | | | | | | Shares | | | Value | |
| | | | |
| China (continued) | | | | | | | | | | | | |
Uxin Limited ADR (Consumer Discretionary, Internet & Direct Marketing Retail) † | | | | | | | | | | | 3,950,000 | | | $ | 6,359,500 | |
Vipshop Holdings Limited ADR (Consumer Discretionary, Internet & Direct Marketing Retail) † | | | | | | | | | | | 6,156,538 | | | | 98,073,650 | |
Want Want China Holdings Limited (Consumer Staples, Food Products) | | | | | | | | | | | 50,725,800 | | | | 36,154,380 | |
Weibo Corporation ADR (Communication Services, Interactive Media & Services) † | | | | | | | | | | | 1,200,640 | | | | 45,060,019 | |
WH Group Limited (Consumer Staples, Food Products) 144A | | | | | | | | | | | 85,815,700 | | | | 81,846,925 | |
Wise Talent Information Technology Company Limited (Communication Services, Interactive Media & Services) † | | | | | | | | | | | 1,636,260 | | | | 3,524,739 | |
Xiaomi Corporation Class B (Information Technology, Technology Hardware, Storage & Peripherals) 144A† | | | | | | | | | | | 28,477,100 | | | | 37,350,403 | |
Zhou Hei Ya International Holding Company Limited (Consumer Staples, Food Products) 144A | | | | | | | | | | | 25,612,726 | | | | 14,398,627 | |
| |
| | | | 1,433,812,456 | |
| | | | | | | | | | | | | | | | |
| | | | |
| Colombia: 0.32% | | | | | | | | | | | | |
Bancolombia SA ADR (Financials, Banks) | | | | | | | | | | | 439,100 | | | | 11,460,510 | |
| | | | | | | | | | | | | | | | |
| | | | |
| Cyprus: 0.16% | | | | | | | | | | | | |
Headhunter Group plc ADR (Industrials, Professional Services) | | | | | | | | | | | 350,160 | | | | 5,777,640 | |
| | | | | | | | | | | | | | | | |
| | | | |
| Hong Kong: 4.76% | | | | | | | | | | | | |
AIA Group Limited (Financials, Insurance) | | | | | | | | | | | 9,237,500 | | | | 84,779,618 | |
CNOOC Limited (Energy, Oil, Gas & Consumable Fuels) | | | | | | | | | | | 28,759,600 | | | | 31,797,233 | |
Johnson Electric Holdings Limited (Industrials, Electrical Equipment) | | | | | | | | | | | 4,183,050 | | | | 7,023,779 | |
Sun Art Retail Group Limited (Consumer Staples, Food & Staples Retailing) | | | | | | | | | | | 27,923,400 | | | | 46,489,088 | |
| |
| | | | 170,089,718 | |
| | | | | | | | | | | | | | | | |
| | | | |
| India: 8.58% | | | | | | | | | | | | |
AU Small Finance Bank Limited (Financials, Banks) 144A | | | | | | | | | | | 451,041 | | | | 3,234,391 | |
Axis Bank Limited (Financials, Banks) | | | | | | | | | | | 2,670,819 | | | | 15,604,135 | |
Bajaj Finance Limited (Financials, Consumer Finance) | | | | | | | | | | | 420,281 | | | | 12,850,389 | |
Bandhan Bank Limited (Financials, Banks) 144A | | | | | | | | | | | 1,416,131 | | | | 4,859,692 | |
Bharti Airtel Limited (Communication Services, Wireless Telecommunication Services) † | | | | | | | | | | | 3,909,052 | | | | 26,621,117 | |
Bharti Infratel Limited (Communication Services, Diversified Telecommunication Services) | | | | | | | | | | | 3,073,851 | | | | 7,111,716 | |
Dalmia Bharat Limited (Materials, Construction Materials) | | | | | | | | | | | 624,658 | | | | 4,307,558 | |
Fortis Healthcare Limited (Health Care, Health Care Providers & Services) † | | | | | | | | | | | 5,634,970 | | | | 9,423,402 | |
HDFC Bank Limited ADR (Financials, Banks) | | | | | | | | | | | 318,752 | | | | 13,817,899 | |
Housing Development Finance Corporation Limited (Financials, Thrifts & Mortgage Finance) | | | | | | | | | | | 1,115,700 | | | | 28,221,406 | |
Indusind Bank Limited (Financials, Banks) | | | | | | | | | | | 802,217 | | | | 4,894,305 | |
ITC Limited (Consumer Staples, Tobacco) | | | | | | | | | | | 12,883,960 | | | | 31,039,920 | |
Kotak Mahindra Bank Limited (Financials, Banks) | | | | | | | | | | | 1,057,262 | | | | 18,986,999 | |
Max Financial Services Limited (Financials, Insurance) † | | | | | | | | | | | 925,389 | | | | 5,750,376 | |
Oberoi Realty Limited (Real Estate, Real Estate Management & Development) | | | | | | | | | | | 1,064,750 | | | | 4,817,587 | |
Reliance Industries Limited GDR (Energy, Oil, Gas & Consumable Fuels) 144A | | | | | | | | | | | 2,355,274 | | | | 89,374,551 | |
SBI Life Insurance Company Limited (Financials, Insurance) 144A† | | | | | | | | | | | 914,273 | | | | 8,788,299 | |
SH Kelkar & Company Limited (Materials, Chemicals) | | | | | | | | | | | 1,244,001 | | | | 1,075,189 | |
Spandana Sphoorty Financial (Financials, Consumer Finance) † | | | | | | | | | | | 440,254 | | | | 2,626,696 | |
Ultra Tech Cement Limited (Materials, Construction Materials) | | | | | | | | | | | 286,000 | | | | 13,313,305 | |
| |
| | | | 306,718,932 | |
| | | | | | | | | | | | | | | | |
| | | | |
| Indonesia: 1.51% | | | | | | | | | | | | |
PT Astra International Tbk (Consumer Discretionary, Automobiles) | | | | | | | | | | | 19,151,000 | | | | 4,898,181 | |
PT Bank Central Asia Tbk (Financials, Banks) | | | | | | | | | | | 11,349,500 | | | | 19,659,488 | |
PT Blue Bird Tbk (Industrials, Road & Rail) | | | | | | | | | | | 13,605,309 | | | | 887,203 | |
PT Link Net Tbk (Communication Services, Diversified Telecommunication Services) | | | | | | | | | | | 38,278,161 | | | | 7,153,834 | |
PT Telekomunikasi Indonesia Persero Tbk ADR (Communication Services, Diversified Telecommunication Services) | | | | | | | | | | | 990,354 | | | | 21,480,778 | |
| |
| | | | 54,079,484 | |
| | | | | | | | | | | | | | | | |
The accompanying notes are an integral part of these financial statements.
8 | Wells Fargo Emerging Markets Equity Fund
Portfolio of investments—April 30, 2020 (unaudited)
| | | | | | | | | | | | | | | | |
| | | | | | | | | Shares | | | Value | |
| Malaysia: 0.20% | | | | | | | | | | | | |
Genting Bhd (Consumer Discretionary, Hotels, Restaurants & Leisure) | | | | | | | | | | | 3,280,900 | | | $ | 3,173,023 | |
Genting Malaysia Bhd (Consumer Discretionary, Hotels, Restaurants & Leisure) | | | | | | | | | | | 7,196,300 | | | | 3,955,560 | |
| |
| | | | 7,128,583 | |
| | | | | | | | | | | | | | | | |
|
| Mexico: 4.81% | |
America Movil SAB de CV ADR (Communication Services, Wireless Telecommunication Services) | | | | | | | | | | | 1,605,920 | | | | 19,335,277 | |
Banco Santander Mexico ADR (Financials, Banks) | | | | | | | | | | | 2,879,336 | | | | 7,975,761 | |
Banco Santander Mexico SA (Financials, Banks) | | | | | | | | | | | 2,977,800 | | | | 1,648,224 | |
Becle SAB de CV ADR (Consumer Staples, Beverages) | | | | | | | | | | | 12,967,225 | | | | 19,783,613 | |
Cemex SAB de CV ADR (Materials, Construction Materials) | | | | | | | | | | | 4,011,948 | | | | 8,505,330 | |
Fibra Uno Administracion SAB de CV (Real Estate, Equity REITs) | | | | | | | | | | | 38,957,464 | | | | 32,344,668 | |
Fomento Economico Mexicano SAB de CV ADR (Consumer Staples, Beverages) | | | | | | | | | | | 920,420 | | | | 59,210,619 | |
Grupo Financiero Banorte SAB de CV (Financials, Banks) | | | | | | | | | | | 3,350,488 | | | | 9,172,449 | |
Wal-Mart de Mexico SAB de CV (Consumer Staples, Food & Staples Retailing) | | | | | | | | | | | 5,842,900 | | | | 14,102,381 | |
| |
| | | | 172,078,322 | |
| | | | | | | | | | | | | | | | |
| | | | |
| Peru: 0.21% | | | | | | | | | | | | |
Compania de Minas Buenaventura SA ADR (Materials, Metals & Mining) | | | | | | | | | | | 1,006,695 | | | | 7,540,146 | |
| | | | | | | | | | | | | | | | |
| | | | |
| Philippines: 0.75% | | | | | | | | | | | | |
Ayala Corporation (Industrials, Industrial Conglomerates) | | | | | | | | | | | 787,624 | | | | 8,959,305 | |
San Miguel Food & Beverage Incorporated (Consumer Staples, Food Products) | | | | | | | | | | | 3,495,810 | | | | 4,106,411 | |
SM Investments Corporation (Industrials, Industrial Conglomerates) | | | | | | | | | | | 812,873 | | | | 13,548,645 | |
| |
| | | | 26,614,361 | |
| | | | | | | | | | | | | | | | |
| | | | |
| Russia: 2.66% | | | | | | | | | | | | |
LUKOIL PJSC ADR (Energy, Oil, Gas & Consumable Fuels) | | | | | | | | | | | 422,149 | | | | 27,540,046 | |
Magnit PJSC (Consumer Staples, Food & Staples Retailing) | | | | | | | | | | | 150,816 | | | | 7,463,423 | |
Sberbank PJSC ADR (Financials, Banks) | | | | | | | | | | | 1,450,395 | | | | 15,398,030 | |
Yandex NV Class A (Communication Services, Interactive Media & Services) † | | | | | | | | | | | 1,184,406 | | | | 44,746,859 | |
| |
| | | | 95,148,358 | |
| | | | | | | | | | | | | | | | |
| | | | |
| South Africa: 1.72% | | | | | | | | | | | | |
AngloGold Ashanti Limited ADR (Materials, Metals & Mining) | | | | | | | | | | | 418,308 | | | | 10,202,532 | |
MTN Group Limited (Communication Services, Wireless Telecommunication Services) | | | | | | | | | | | 3,278,543 | | | | 8,615,548 | |
Oceana Group Limited (Consumer Staples, Food Products) | | | | | | | | | | | 360,849 | | | | 1,187,548 | |
Shoprite Holdings Limited (Consumer Staples, Food & Staples Retailing) | | | | | | | | | | | 2,901,500 | | | | 16,769,858 | |
Standard Bank Group Limited (Financials, Banks) | | | | | | | | | | | 1,757,090 | | | | 9,681,509 | |
Tiger Brands Limited (Consumer Staples, Food Products) | | | | | | | | | | | 1,531,933 | | | | 14,917,261 | |
| |
| | | | 61,374,256 | |
| | | | | | | | | | | | | | | | |
| | | | |
| South Korea: 10.69% | | | | | | | | | | | | |
KT Corporation ADR (Communication Services, Diversified Telecommunication Services) | | | | | | | | | | | 4,204,713 | | | | 41,248,235 | |
KT&G Corporation (Consumer Staples, Tobacco) | | | | | | | | | | | 281,091 | | | | 18,767,727 | |
Naver Corporation (Communication Services, Interactive Media & Services) | | | | | | | | | | | 487,500 | | | | 79,038,653 | |
Samsung Electronics Company Limited (Information Technology, Technology Hardware, Storage & Peripherals) | | | | | | | | | | | 4,465,800 | | | | 183,622,649 | |
Samsung Life Insurance Company Limited (Financials, Insurance) | | | | | | | | | | | 623,337 | | | | 25,279,256 | |
SK Hynix Incorporated (Information Technology, Semiconductors & Semiconductor Equipment) | | | | | | | | | | | 495,500 | | | | 34,099,096 | |
| |
| | | | 382,055,616 | |
| | | | | | | | | | | | | | | | |
| | | | |
| Taiwan: 10.23% | | | | | | | | | | | | |
104 Corporation (Industrials, Professional Services) | | | | | | | | | | | 1,655,000 | | | | 8,427,271 | |
Mediatek Incorporated (Information Technology, Semiconductors & Semiconductor Equipment) | | | | | | | | | | | 4,324,881 | | | | 59,719,802 | |
President Chain Store Corporation (Consumer Staples, Food & Staples Retailing) | | | | | | | | | | | 2,450,000 | | | | 25,334,782 | |
The accompanying notes are an integral part of these financial statements.
Wells Fargo Emerging Markets Equity Fund | 9
Portfolio of investments—April 30, 2020 (unaudited)
| | | | | | | | | | | | | | | | |
| | | | | | | | | Shares | | | Value | |
| | | | |
| Taiwan (continued) | | | | | | | | | | | | |
Taiwan Semiconductor Manufacturing Company Limited (Information Technology, Semiconductors & Semiconductor Equipment) | | | | | | | | | | | 7,635,224 | | | $ | 77,022,580 | |
Taiwan Semiconductor Manufacturing Company Limited ADR (Information Technology, Semiconductors & Semiconductor Equipment) | | | | | | | | 2,197,552 | | | | 116,755,938 | |
Uni-President Enterprises Corporation (Consumer Staples, Food Products) | | | | | | | | 33,712,368 | | | | 78,495,410 | |
| | | | |
| | | | | | | | | | | | | | | 365,755,783 | |
| | | | | | | | | | | | | | | | |
| | | | |
| Thailand: 1.92% | | | | | | | | | | | | |
PTT Exploration & Production plc (Energy, Oil, Gas & Consumable Fuels) | | | | | | | | | | | 2,533,139 | | | | 7,767,275 | |
PTT plc (Energy, Oil, Gas & Consumable Fuels) | | | | | | | | | | | 14,459,000 | | | | 15,786,499 | |
Siam Commercial Bank plc (Financials, Banks) | | | | | | | | | | | 8,105,100 | | | | 17,524,652 | |
Thai Beverage plc (Consumer Staples, Beverages) | | | | | | | | | | | 56,927,000 | | | | 27,709,439 | |
| | | | |
| | | | | | | | | | | | | | | 68,787,865 | |
| | | | | | | | | | | | | | | | |
| | | | |
| Turkey: 0.10% | | | | | | | | | | | | |
Avivasa Emeklilik Ve Hayat AS (Financials, Insurance) | | | | | | | | | | | 1,901,979 | | | | 3,642,273 | |
| | | | | | | | | | | | | | | | |
| | | | |
| United Arab Emirates: 0.04% | | | | | | | | | | | | |
Emaar Malls Group (Real Estate, Real Estate Management & Development) | | | | | | | | 3,773,147 | | | | 1,314,871 | |
| | | | | | | | | | | | | | | | |
| | | | |
| United Kingdom: 0.39% | | | | | | | | | | | | |
Standard Chartered plc (Financials, Banks) | | | | | | | | | | | 2,714,444 | | | | 13,869,950 | |
| | | | | | | | | | | | | | | | |
| | | | |
Total Common Stocks (Cost $2,960,874,311) | | | | | | | | | | | | | | | 3,457,730,283 | |
| | | | | | | | | | | | | | | | |
| | | | |
| | | | | | | | | | | | | | | | |
| | | Interest rate | | | Maturity date | | | Principal | | | | |
| Convertible Debentures: 0.00% | | | | | | | | | | | | |
| | | | |
| Brazil: 0.00% | | | | | | | | | | | | |
Lupatech SA (Energy, Energy Equipment & Services) †(a) | | | 6.50 | % | | | 4-15-2021 | | | $ | 303,000 | | | | 0 | |
| | | | | | | | | | | | | | | | |
| | | | |
Total Convertible Debentures (Cost $160,691) | | | | | | | | | | | | | | | 0 | |
| | | | | | | | | | | | | | | | |
| | | | |
| | | | | | | | | | | | | | | | |
| | | Dividend yield | | | | | | Shares | | | | |
| Preferred Stocks: 1.34% | | | | | | | | | | | | |
| | | | |
| Brazil: 1.34% | | | | | | | | | | | | |
Lojas Americanas SA (Consumer Discretionary, Multiline Retail) | | | 0.82 | | | | | | | | 10,454,418 | | | | 47,832,053 | |
| | | | | | | | | | | | | | | | |
| | | | |
Total Preferred Stocks (Cost $40,402,936) | | | | | | | | | | | | | | | 47,832,053 | |
| | | | | | | | | | | | | | | | |
| | | | |
| | | | | | | | | | | | | | | | |
| | | Yield | | | | | | | | | | |
| Short-Term Investments: 1.39% | | | | | | | | | | | | |
| | | | |
| Investment Companies: 1.39% | | | | | | | | | | | | |
Securities Lending Cash Investments LLC (l)(u) | | | 0.00 | | | | | | | | 1,000 | | | | 1,000 | |
Wells Fargo Government Money Market Fund Select Class (l)(u) | | | 0.19 | | | | | | | | 49,731,498 | | | | 49,731,498 | |
| | | | |
Total Short-Term Investments (Cost $49,732,498) | | | | | | | | | | | | | | | 49,732,498 | �� |
| | | | | | | | | | | | | | | | |
| | | | | | | | |
| Total investments in securities (Cost $3,051,170,436) | | | 99.46 | % | | | 3,555,294,834 | |
| | |
Other assets and liabilities, net | | | 0.54 | | | | 19,161,015 | |
| | | | | | | | |
| Total net assets | | | 100.00 | % | | $ | 3,574,455,849 | |
| | | | | | | | |
The accompanying notes are an integral part of these financial statements.
10 | Wells Fargo Emerging Markets Equity Fund
Portfolio of investments—April 30, 2020 (unaudited)
| † | Non-income-earning security |
| 144A | The security may be resold in transactions exempt from registration, normally to qualified institutional buyers, pursuant to Rule 144A under the Securities Act of 1933. |
| (a) | The security is fair valued in accordance with procedures approved by the Board of Trustees. |
| (l) | The issuer of the security is an affiliated person of the Fund as defined in the Investment Company Act of 1940. |
| (u) | The rate represents the 7-day annualized yield at period end. |
Abbreviations:
| ADR | American depositary receipt |
| GDR | Global depositary receipt |
| REIT | Real estate investment trust |
Investments in Affiliates
An affiliated investment is an investment in which the Fund owns at least 5% of the outstanding voting shares of the issuer or as a result of other relationships, such as the Fund and the issuer having the same investment manager. Transactions with issuers that were either affiliated persons of the Fund at the beginning of the period or the end of the period were as follows:
| | | | | | | | | | | | | | | | | | | | | | | | | | | | | | | | | | | | |
| | | Shares,
beginning of
period | | | Shares
purchased | | | Shares sold | | | Shares, end of period | | | Net realized gains (losses) | | | Net change in unrealized gains
(losses) | | | Income from affiliated securities | | | Value, end of period | | | % of net assets | |
| | | | | | | | | |
| Short-Term Investments | | | | | | | | | | | | | | | | | | | | | | | | | | | |
Investment Companies | | | | | | | | | | | | | | | | | | | | | | | | | | | | | | | | | | | | |
Securities Lending Cash Investments LLC | | | 150,280,602 | | | | 289,125,813 | | | | (439,405,415 | ) | | | 1,000 | | | $ | 11,521 | | | $ | 21 | | | $ | 795,584 | # | | $ | 1,000 | | | | | |
Wells Fargo Government Money Market Fund Select Class | | | 158,178,165 | | | | 178,278,779 | | | | (286,725,446 | ) | | | 49,731,498 | | | | 0 | | | | 0 | | | | 581,513 | | | | 49,731,498 | | | | | |
| | | | | | | | | | | | | | | | | | | | | | | | | | | | | | | | | | | | |
| | | | | | | | | | | | | | | | | | $ | 11,521 | | | $ | 21 | | | $ | 1,377,097 | | | $ | 49,732,498 | | | | 1.39 | % |
| | | | | | | | | | | | | | | | | | | | | | | | | | | | | | | | | | | | |
| # | Amount shown represents income before fees and rebates. |
The accompanying notes are an integral part of these financial statements.
Wells Fargo Emerging Markets Equity Fund | 11
Statement of assets and liabilities—April 30, 2020 (unaudited)
| | | | |
| | | | |
| |
Assets | | | | |
Investments in unaffiliated securities, at value (cost $3,001,437,938) | | $ | 3,505,562,336 | |
Investments in affiliated securities, at value (cost $49,732,498) | | | 49,732,498 | |
Foreign currency, at value (cost $7,484,257) | | | 6,485,007 | |
Receivable for investments sold | | | 4,110,071 | |
Receivable for Fund shares sold | | | 16,934,618 | |
Receivable for dividends | | | 2,511,601 | |
Receivable for securities lending income, net | | | 15,238 | |
Prepaid expenses and other assets | | | 19,565 | |
| | | | |
Total assets | | | 3,585,370,934 | |
| | | | |
| |
Liabilities | | | | |
Payable for Fund shares redeemed | | | 4,772,121 | |
Management fee payable | | | 4,386,311 | |
Administration fees payable | | | 357,290 | |
Distribution fee payable | | | 12,867 | |
Shareholder report expenses payable | | | 325,367 | |
Custody and accounting fees payable | | | 955,841 | |
Trustees’ fees and expenses payable | | | 8,822 | |
Accrued expenses and other liabilities | | | 96,466 | |
| | | | |
Total liabilities | | | 10,915,085 | |
| | | | |
Total net assets | | $ | 3,574,455,849 | |
| | | | |
| |
Net assets consist of | | | | |
Paid-in capital | | $ | 3,249,789,746 | |
Total distributable earnings | | | 324,666,103 | |
| | | | |
Total net assets | | $ | 3,574,455,849 | |
| | | | |
| |
Computation of net asset value and offering price per share | | | | |
Net assets – Class A | | $ | 182,611,322 | |
Shares outstanding – Class A1 | | | 8,122,371 | |
Net asset value per share – Class A | | | $22.48 | |
Maximum offering price per share – Class A2 | | | $23.85 | |
Net assets – Class C | | $ | 21,349,369 | |
Shares outstanding – Class C1 | | | 1,135,338 | |
Net asset value per share – Class C | | | $18.80 | |
Net assets – Class R6 | | $ | 268,035,865 | |
Shares outstanding – Class R61 | | | 11,445,618 | |
Net asset value per share – Class R6 | | | $23.42 | |
Net assets – Administrator Class | | $ | 69,502,822 | |
Shares outstanding – Administrator Class1 | | | 2,949,830 | |
Net asset value per share – Administrator Class | | | $23.56 | |
Net assets – Institutional Class | | $ | 3,032,956,471 | |
Shares outstanding – Institutional Class1 | | | 129,531,257 | |
Net asset value per share – Institutional Class | | | $23.41 | |
| 1 | The Fund has an unlimited number of authorized shares. |
| 2 | Maximum offering price is computed as 100/94.25 of net asset value. On investments of $50,000 or more, the offering price is reduced. |
The accompanying notes are an integral part of these financial statements.
12 | Wells Fargo Emerging Markets Equity Fund
Statement of operations—six months ended April 30, 2020 (unaudited)
| | | | |
| | | | |
| |
Investment income | | | | |
Dividends (net of foreign withholding taxes of $3,966,561) | | $ | 25,135,962 | |
Income from affiliated securities | | | 1,402,863 | |
Interest (net of foreign withholding taxes of $25,097) | | | 142,399 | |
| | | | |
Total investment income | | | 26,681,224 | |
| | | | |
| |
Expenses | | | | |
Management fee | | | 20,329,457 | |
Administration fees | | | | |
Class A | | | 225,451 | |
Class C | | | 27,883 | |
Class R6 | | | 45,191 | |
Administrator Class | | | 57,836 | |
Institutional Class | | | 2,187,148 | |
Shareholder servicing fees | | | | |
Class A | | | 268,390 | |
Class C | | | 33,193 | |
Administrator Class | | | 110,572 | |
Distribution fee | | | | |
Class C | | | 99,357 | |
Custody and accounting fees | | | 1,309,767 | |
Professional fees | | | 30,692 | |
Registration fees | | | 69,173 | |
Shareholder report expenses | | | 349,256 | |
Trustees’ fees and expenses | | | 10,969 | |
Interest expense | | | 495 | |
Other fees and expenses | | | 59,490 | |
| | | | |
Total expenses | | | 25,214,320 | |
Less: Fee waivers and/or expense reimbursements | | | | |
Fund-level | | | (317,603 | ) |
Class A | | | (5,365 | ) |
Administrator Class | | | (9,663 | ) |
Institutional Class | | | (644,135 | ) |
| | | | |
Net expenses | | | 24,237,554 | |
| | | | |
Net investment income | | | 2,443,670 | |
| | | | |
| |
Realized and unrealized gains (losses) on investments | | | | |
Net realized gains on | | | | |
Unaffiliated securities | | | 20,134,058 | |
Affiliated securities | | | 11,521 | |
Forward foreign currency contracts | | | 205 | |
| | | | |
Net realized gains on investments | | | 20,145,784 | |
| | | | |
| |
Net change in unrealized gains (losses) on | | | | |
Unaffiliated securities | | | (427,823,600 | ) |
Affiliated securities | | | 21 | |
| | | | |
Net change in unrealized gains (losses) on investments | | | (427,823,579 | ) |
| | | | |
Net realized and unrealized gains (losses) on investments | | | (407,677,795 | ) |
| | | | |
Net decrease in net assets resulting from operations | | $ | (405,234,125 | ) |
| | | | |
The accompanying notes are an integral part of these financial statements.
Wells Fargo Emerging Markets Equity Fund | 13
Statement of changes in net assets
| | | | | | | | | | | | | | | | |
| | | Six months ended
April 30, 2020 (unaudited) | | | Year ended
October 31, 2019 | |
| | | | |
Operations | | | | | | | | | | | | | | | | |
Net investment income | | | | | | $ | 2,443,670 | | | | | | | $ | 29,835,911 | |
Net realized gains on investments | | | | | | | 20,145,784 | | | | | | | | 58,804,224 | |
Net change in unrealized gains (losses) on investments | | | | | | | (427,823,579 | ) | | | | | | | 621,646,983 | |
| | | | |
Net increase (decrease) in net assets resulting from operations | | | | | | | (405,234,125 | ) | | | | | | | 710,287,118 | |
| | | | |
| | | | |
Distributions to shareholders from net investment income and net realized gains | | | | | | | | | | | | | | | | |
Class A | | | | | | | (1,592,205 | ) | | | | | | | (710,399 | ) |
Class R6 | | | | | | | (3,433,286 | ) | | | | | | | (2,908,247 | ) |
Administrator Class | | | | | | | (690,072 | ) | | | | | | | (528,015 | ) |
Institutional Class | | | | | | | (37,764,049 | ) | | | | | | | (24,412,544 | ) |
| | | | |
Total distributions to shareholders | | | | | | | (43,479,612 | ) | | | | | | | (28,559,205 | ) |
| | | | |
| | | | |
Capital share transactions | | | Shares | | | | | | | | Shares | | | | | |
Proceeds from shares sold | | | | | | | | | | | | | | | | |
Class A | | | 495,757 | | | | 12,288,179 | | | | 1,832,949 | | | | 42,913,694 | |
Class C | | | 36,673 | | | | 758,073 | | | | 155,464 | | | | 2,968,853 | |
Class R6 | | | 2,556,703 | | | | 61,258,967 | | | | 4,297,288 | | | | 100,909,236 | |
Administrator Class | | | 326,127 | | | | 8,241,931 | | | | 582,444 | | | | 14,129,059 | |
Institutional Class | | | 17,070,053 | | | | 416,131,927 | | | | 34,734,070 | | | | 844,578,848 | |
| | | | |
| | | | | | | 498,679,077 | | | | | | | | 1,005,499,690 | |
| | | | |
Reinvestment of distributions | | | | | | | | | | | | | | | | |
Class A | | | 54,378 | | | | 1,460,585 | | | | 30,235 | | | | 636,746 | |
Class R6 | | | 89,034 | | | | 2,487,612 | | | | 88,834 | | | | 1,945,455 | |
Administrator Class | | | 23,753 | | | | 668,417 | | | | 23,214 | | | | 511,866 | |
Institutional Class | | | 1,335,293 | | | | 37,308,081 | | | | 1,100,826 | | | | 24,108,081 | |
| | | | |
| | | | | | | 41,924,695 | | | | | | | | 27,202,148 | |
| | | | |
Payment for shares redeemed | | | | | | | | | | | | | | | | |
Class A | | | (1,437,111 | ) | | | (34,685,938 | ) | | | (2,378,845 | ) | | | (55,211,980 | ) |
Class C | | | (299,468 | ) | | | (6,047,467 | ) | | | (1,529,459 | ) | | | (30,114,110 | ) |
Class R6 | | | (4,533,818 | ) | | | (113,012,996 | ) | | | (5,807,534 | ) | | | (144,080,345 | ) |
Administrator Class | | | (1,357,775 | ) | | | (35,717,631 | ) | | | (1,325,414 | ) | | | (32,354,466 | ) |
Institutional Class | | | (20,610,788 | ) | | | (517,276,083 | ) | | | (30,356,079 | ) | | | (733,923,145 | ) |
| | | | |
| | | | | | | (706,740,115 | ) | | | | | | | (995,684,046 | ) |
| | | | |
Net increase (decrease) in net assets resulting from capital share transactions | | | | | | | (166,136,343 | ) | | | | | | | 37,017,792 | |
| | | | |
Total increase (decrease) in net assets | | | | | | | (614,850,080 | ) | | | | | | | 718,745,705 | |
| | | | |
| | | | |
Net assets | | | | | | | | | | | | | | | | |
Beginning of period | | | | | | | 4,189,305,929 | | | | | | | | 3,470,560,224 | |
| | | | |
End of period | | | | | | $ | 3,574,455,849 | | | | | | | $ | 4,189,305,929 | |
| | | | |
The accompanying notes are an integral part of these financial statements.
14 | Wells Fargo Emerging Markets Equity Fund
Financial highlights
(For a share outstanding throughout each period)
| | | | | | | | | | | | | | | | | | | | | | | | |
| | | Six months ended
April 30, 2020
(unaudited) | | | Year ended October 31 | |
| CLASS A | | 2019 | | | 2018 | | | 2017 | | | 2016 | | | 2015 | |
Net asset value, beginning of period | | | $25.29 | | | | $21.16 | | | | $24.83 | | | | $20.49 | | | | $18.09 | | | | $21.44 | |
Net investment income (loss) | | | (0.05 | ) | | | 0.10 | | | | 0.07 | | | | (0.03 | )1 | | | 0.12 | | | | 0.08 | |
Net realized and unrealized gains (losses) on investments | | | (2.58 | ) | | | 4.11 | | | | (3.70 | ) | | | 4.50 | | | | 2.38 | | | | (3.29 | ) |
| | | | | | | | | | | | | | | | | | | | | | | | |
Total from investment operations | | | (2.63 | ) | | | 4.21 | | | | (3.63 | ) | | | 4.47 | | | | 2.50 | | | | (3.21 | ) |
Distributions to shareholders from | | | | | | | | | | | | | | | | | | | | | | | | |
Net investment income | | | (0.18 | ) | | | (0.08 | ) | | | (0.04 | ) | | | (0.13 | ) | | | (0.10 | ) | | | (0.14 | ) |
Net asset value, end of period | | | $22.48 | | | | $25.29 | | | | $21.16 | | | | $24.83 | | | | $20.49 | | | | $18.09 | |
Total return2 | | | (10.51 | )% | | | 19.95 | % | | | (14.65 | )% | | | 21.99 | % | | | 13.93 | % | | | (15.02 | )% |
Ratios to average net assets (annualized) | | | | | | | | | | | | | | | | | | | | | | | | |
Gross expenses | | | 1.57 | % | | | 1.57 | % | | | 1.58 | % | | | 1.58 | % | | | 1.64 | % | | | 1.64 | % |
Net expenses | | | 1.55 | % | | | 1.57 | % | | | 1.57 | % | | | 1.58 | % | | | 1.60 | % | | | 1.64 | % |
Net investment income (loss) | | | (0.22 | )% | | | 0.43 | % | | | 0.38 | % | | | (0.13 | )% | | | 0.64 | % | | | 0.37 | % |
Supplemental data | | | | | | | | | | | | | | | | | | | | | | | | |
Portfolio turnover rate | | | 2 | % | | | 8 | % | | | 11 | % | | | 13 | % | | | 8 | % | | | 8 | % |
Net assets, end of period (000s omitted) | | | $182,611 | | | | $227,811 | | | | $201,515 | | | | $268,384 | | | | $874,625 | | | | $873,992 | |
| 1 | Calculated based upon average shares outstanding |
| 2 | Total return calculations do not include any sales charges. Returns for periods of less than one year are not annualized. |
The accompanying notes are an integral part of these financial statements.
Wells Fargo Emerging Markets Equity Fund | 15
Financial highlights
(For a share outstanding throughout each period)
| | | | | | | | | | | | | | | | | | | | | | | | |
| | | Six months ended
April 30, 2020
(unaudited) | | | Year ended October 31 | |
| CLASS C | | 2019 | | | 2018 | | | 2017 | | | 2016 | | | 2015 | |
Net asset value, beginning of period | | | $21.09 | | | | $17.71 | | | | $20.92 | | | | $17.28 | | | | $15.28 | | | | $18.11 | |
Net investment loss | | | (0.10 | )1 | | | (0.07 | )1 | | | (0.08 | )1 | | | (0.08 | ) | | | (0.02 | )1 | | | (0.06 | )1 |
Net realized and unrealized gains (losses) on investments | | | (2.19 | ) | | | 3.45 | | | | (3.13 | ) | | | 3.72 | | | | 2.02 | | | | (2.77 | ) |
| | | | | | | | | | | | | | | | | | | | | | | | |
Total from investment operations | | | (2.29 | ) | | | 3.38 | | | | (3.21 | ) | | | 3.64 | | | | 2.00 | | | | (2.83 | ) |
Net asset value, end of period | | | $18.80 | | | | $21.09 | | | | $17.71 | | | | $20.92 | | | | $17.28 | | | | $15.28 | |
Total return2 | | | (10.86 | )% | | | 19.09 | % | | | (15.34 | )% | | | 21.06 | % | | | 13.09 | % | | | (15.63 | )% |
Ratios to average net assets (annualized) | | | | | | | | | | | | | | | | | | | | | | | | |
Gross expenses | | | 2.32 | % | | | 2.32 | % | | | 2.33 | % | | | 2.31 | % | | | 2.39 | % | | | 2.39 | % |
Net expenses | | | 2.31 | % | | | 2.32 | % | | | 2.32 | % | | | 2.31 | % | | | 2.35 | % | | | 2.39 | % |
Net investment loss | | | (0.99 | )% | | | (0.37 | )% | | | (0.38 | )% | | | (0.43 | )% | | | (0.12 | )% | | | (0.39 | )% |
Supplemental data | | | | | | | | | | | | | | | | | | | | | | | | |
Portfolio turnover rate | | | 2 | % | | | 8 | % | | | 11 | % | | | 13 | % | | | 8 | % | | | 8 | % |
Net assets, end of period (000s omitted) | | | $21,349 | | | | $29,484 | | | | $49,103 | | | | $69,845 | | | | $71,900 | | | | $84,004 | |
| 1 | Calculated based upon average shares outstanding |
| 2 | Total return calculations do not include any sales charges. Returns for periods of less than one year are not annualized. |
The accompanying notes are an integral part of these financial statements.
16 | Wells Fargo Emerging Markets Equity Fund
Financial highlights
(For a share outstanding throughout each period)
| | | | | | | | | | | | | | | | | | | | | | | | |
| | | Six months ended
April 30, 2020
(unaudited) | | | Year ended October 31 | |
| CLASS R6 | | 2019 | | | 2018 | | | 2017 | | | 2016 | | | 2015 | |
Net asset value, beginning of period | | | $26.39 | | | | $22.10 | | | | $26.00 | | | | $21.46 | | | | $19.00 | | | | $22.53 | |
Net investment income | | | 0.05 | | | | 0.22 | 1 | | | 0.23 | 1 | | | 0.17 | 1 | | | 0.23 | 1 | | | 0.19 | |
Net realized and unrealized gains (losses) on investments | | | (2.72 | ) | | | 4.27 | | | | (3.92 | ) | | | 4.59 | | | | 2.46 | | | | (3.46 | ) |
| | | | | | | | | | | | | | | | | | | | | | | | |
Total from investment operations | | | (2.67 | ) | | | 4.49 | | | | (3.69 | ) | | | 4.76 | | | | 2.69 | | | | (3.27 | ) |
Distributions to shareholders from | | | | | | | | | | | | | | | | | | | | | | | | |
Net investment income | | | (0.30 | ) | | | (0.20 | ) | | | (0.21 | ) | | | (0.22 | ) | | | (0.23 | ) | | | (0.26 | ) |
Net asset value, end of period | | | $23.42 | | | | $26.39 | | | | $22.10 | | | | $26.00 | | | | $21.46 | | | | $19.00 | |
Total return2 | | | (10.31 | )% | | | 20.50 | % | | | (14.33 | )% | | | 22.53 | % | | | 14.43 | % | | | (14.61 | )% |
Ratios to average net assets (annualized) | | | | | | | | | | | | | | | | | | | | | | | | |
Gross expenses | | | 1.14 | % | | | 1.14 | % | | | 1.16 | % | | | 1.14 | % | | | 1.20 | % | | | 1.19 | % |
Net expenses | | | 1.13 | % | | | 1.14 | % | | | 1.15 | % | | | 1.14 | % | | | 1.17 | % | | | 1.18 | % |
Net investment income | | | 0.19 | % | | | 0.88 | % | | | 0.90 | % | | | 0.76 | % | | | 1.16 | % | | | 0.84 | % |
Supplemental data | | | | | | | | | | | | | | | | | | | | | | | | |
Portfolio turnover rate | | | 2 | % | | | 8 | % | | | 11 | % | | | 13 | % | | | 8 | % | | | 8 | % |
Net assets, end of period (000s omitted) | | | $268,036 | | | | $351,829 | | | | $326,131 | | | | $192,929 | | | | $191,250 | | | | $95,190 | |
| 1 | Calculated based upon average shares outstanding |
| 2 | Returns for periods of less than one year are not annualized. |
The accompanying notes are an integral part of these financial statements.
Wells Fargo Emerging Markets Equity Fund | 17
Financial highlights
(For a share outstanding throughout each period)
| | | | | | | | | | | | | | | | | | | | | | | | |
| | | Six months ended
April 30, 2020
(unaudited) | | | Year ended October 31 | |
| ADMINISTRATOR CLASS | | 2019 | | | 2018 | | | 2017 | | | 2016 | | | 2015 | |
Net asset value, beginning of period | | | $26.50 | | | | $22.18 | | | | $26.08 | | | | $21.53 | | | | $18.99 | | | | $22.44 | |
Net investment income (loss) | | | (0.02 | )1 | | | 0.13 | 1 | | | 0.12 | 1 | | | 0.10 | 1 | | | 0.15 | 1 | | | 0.12 | 1 |
Net realized and unrealized gains (losses) on investments | | | (2.72 | ) | | | 4.30 | | | | (3.90 | ) | | | 4.61 | | | | 2.50 | | | | (3.46 | ) |
| | | | | | | | | | | | | | | | | | | | | | | | |
Total from investment operations | | | (2.74 | ) | | | 4.43 | | | | (3.78 | ) | | | 4.71 | | | | 2.65 | | | | (3.34 | ) |
Distributions to shareholders from | | | | | | | | | | | | | | | | | | | | | | | | |
Net investment income | | | (0.20 | ) | | | (0.11 | ) | | | (0.12 | ) | | | (0.16 | ) | | | (0.11 | ) | | | (0.11 | ) |
Net asset value, end of period | | | $23.56 | | | | $26.50 | | | | $22.18 | | | | $26.08 | | | | $21.53 | | | | $18.99 | |
Total return2 | | | (10.46 | )% | | | 20.09 | % | | | (14.57 | )% | | | 22.10 | % | | | 14.07 | % | | | (14.91 | )% |
Ratios to average net assets (annualized) | | | | | | | | | | | | | | | | | | | | | | | | |
Gross expenses | | | 1.48 | % | | | 1.49 | % | | | 1.50 | % | | | 1.48 | % | | | 1.56 | % | | | 1.49 | % |
Net expenses | | | 1.45 | % | | | 1.46 | % | | | 1.46 | % | | | 1.46 | % | | | 1.49 | % | | | 1.48 | % |
Net investment income (loss) | | | (0.14 | )% | | | 0.54 | % | | | 0.48 | % | | | 0.42 | % | | | 0.76 | % | | | 0.58 | % |
Supplemental data | | | | | | | | | | | | | | | | | | | | | | | | |
Portfolio turnover rate | | | 2 | % | | | 8 | % | | | 11 | % | | | 13 | % | | | 8 | % | | | 8 | % |
Net assets, end of period (000s omitted) | | | $69,503 | | | | $104,869 | | | | $103,740 | | | | $144,421 | | | | $160,657 | | | | $181,224 | |
| 1 | Calculated based upon average shares outstanding |
| 2 | Returns for periods of less than one year are not annualized. |
The accompanying notes are an integral part of these financial statements.
18 | Wells Fargo Emerging Markets Equity Fund
Financial highlights
(For a share outstanding throughout each period)
| | | | | | | | | | | | | | | | | | | | | | | | |
| | | Six months ended
April 30, 2020
(unaudited) | | | Year ended October 31 | |
| INSTITUTIONAL CLASS | | 2019 | | | 2018 | | | 2017 | | | 2016 | | | 2015 | |
Net asset value, beginning of period | | | $26.38 | | | | $22.10 | | | | $25.99 | | | | $21.46 | | | | $18.99 | | | | $22.52 | |
Net investment income | | | 0.02 | | | | 0.19 | | | | 0.19 | | | | 0.19 | 1 | | | 0.20 | 1 | | | 0.17 | |
Net realized and unrealized gains (losses) on investments | | | (2.70 | ) | | | 4.28 | | | | (3.89 | ) | | | 4.55 | | | | 2.49 | | | | (3.45 | ) |
| | | | | | | | | | | | | | | | | | | | | | | | |
Total from investment operations | | | (2.68 | ) | | | 4.47 | | | | (3.70 | ) | | | 4.74 | | | | 2.69 | | | | (3.28 | ) |
Distributions to shareholders from | | | | | | | | | | | | | | | | | | | | | | | | |
Net investment income | | | (0.29 | ) | | | (0.19 | ) | | | (0.19 | ) | | | (0.21 | ) | | | (0.22 | ) | | | (0.25 | ) |
Net asset value, end of period | | | $23.41 | | | | $26.38 | | | | $22.10 | | | | $25.99 | | | | $21.46 | | | | $18.99 | |
Total return2 | | | (10.34 | )% | | | 20.40 | % | | | (14.35 | )% | | | 22.42 | % | | | 14.40 | % | | | (14.66 | )% |
Ratios to average net assets (annualized) | | | | | | | | | | | | | | | | | | | | | | | | |
Gross expenses | | | 1.24 | % | | | 1.25 | % | | | 1.25 | % | | | 1.23 | % | | | 1.31 | % | | | 1.24 | % |
Net expenses | | | 1.18 | % | | | 1.19 | % | | | 1.19 | % | | | 1.20 | % | | | 1.22 | % | | | 1.22 | % |
Net investment income | | | 0.15 | % | | | 0.81 | % | | | 0.75 | % | | | 0.82 | % | | | 1.04 | % | | | 0.82 | % |
Supplemental data | | | | | | | | | | | | | | | | | | | | | | | | |
Portfolio turnover rate | | | 2 | % | | | 8 | % | | | 11 | % | | | 13 | % | | | 8 | % | | | 8 | % |
Net assets, end of period (000s omitted) | | | $3,032,956 | | | | $3,475,314 | | | | $2,790,071 | | | | $3,423,366 | | | | $1,826,097 | | | | $2,146,675 | |
| 1 | Calculated based upon average shares outstanding |
| 2 | Returns for periods of less than one year are not annualized. |
The accompanying notes are an integral part of these financial statements.
Wells Fargo Emerging Markets Equity Fund | 19
Notes to financial statements (unaudited)
1. ORGANIZATION
Wells Fargo Funds Trust (the “Trust”), a Delaware statutory trust organized on March 10, 1999, is an open-end management investment company registered under the Investment Company Act of 1940, as amended (the “1940 Act”). As an investment company, the Trust follows the accounting and reporting guidance in Financial Accounting Standards Board (“FASB”) Accounting Standards Codification Topic 946, Financial Services – Investment Companies. These financial statements report on the Wells Fargo Emerging Markets Equity Fund (the “Fund”) which is a diversified series of the Trust.
2. SIGNIFICANT ACCOUNTING POLICIES
The following significant accounting policies, which are consistently followed in the preparation of the financial statements of the Fund, are in conformity with U.S. generally accepted accounting principles which require management to make estimates and assumptions that affect the reported amounts of assets and liabilities, disclosure of contingent assets and liabilities at the date of the financial statements, and the reported amounts of revenues and expenses during the reporting period. Actual results could differ from those estimates.
Securities valuation
All investments are valued each business day as of the close of regular trading on the New York Stock Exchange (generally 4 p.m. Eastern Time), although the Fund may deviate from this calculation time under unusual or unexpected circumstances.
Equity securities that are listed on a foreign or domestic exchange or market are valued at the official closing price or, if none, the last sales price. If no sale occurs on the principal exchange or market that day, a fair value price will be determined in accordance with the Fund’s Valuation Procedures.
Forward foreign currency contracts are recorded at the forward rate provided by an independent foreign currency pricing source at a time each business day specified by the Wells Fargo Asset Management Pricing Committee at Wells Fargo Funds Management, LLC (“Funds Management”).
The values of securities denominated in foreign currencies are translated into U.S. dollars at rates provided by an independent foreign currency pricing source at a time each business day specified by the Wells Fargo Asset Management Pricing Committee.
Many securities markets and exchanges outside the U.S. close prior to the close of the New York Stock Exchange and therefore may not fully reflect trading or events that occur after the close of the principal exchange in which the foreign securities are traded, but before the close of the New York Stock Exchange. If such trading or events are expected to materially affect the value of such securities, then fair value pricing procedures approved by the Board of Trustees of the Fund are applied. These procedures take into account multiple factors including movements in U.S. securities markets after foreign exchanges close. Foreign securities that are fair valued under these procedures are categorized as Level 2 and the application of these procedures may result in transfers between Level 1 and Level 2. Depending on market activity, such fair valuations may be frequent. Such fair value pricing may result in net asset values that are higher or lower than net asset values based on the last reported sales price or latest quoted bid price. On April 30, 2020, such fair value pricing was used in pricing certain foreign securities.
Debt securities are valued at the evaluated bid price provided by an independent pricing service (e.g. taking into account various factors, including yields, maturities, or credit ratings) or, if a reliable price is not available, the quoted bid price from an independent broker-dealer.
Investments in registered open-end investment companies are valued at net asset value. Interests in non-registered investment companies that are redeemable at net asset value are fair valued normally at net asset value.
Investments which are not valued using the methods discussed above are valued at their fair value, as determined in good faith by the Board of Trustees. The Board of Trustees has established a Valuation Committee comprised of the Trustees and has delegated to it the authority to take any actions regarding the valuation of portfolio securities that the Valuation Committee deems necessary or appropriate, including determining the fair value of portfolio securities, unless the determination has been delegated to the Wells Fargo Asset Management Pricing Committee. The Board of Trustees retains the authority to make or ratify any valuation decisions or approve any changes to the Valuation Procedures as it deems appropriate. On a quarterly basis, the Board of Trustees receives reports on any valuation actions taken by the Valuation Committee or the Wells Fargo Asset Management Pricing Committee which may include items for ratification.
Foreign currency translation
The accounting records of the Fund are maintained in U.S. dollars. The values of other assets and liabilities denominated in foreign currencies are translated into U.S. dollars at rates provided by an independent foreign currency pricing source at a time each business day specified by the Wells Fargo Asset Management Pricing Committee. Purchases and sales of securities, and income and expenses are converted at the rate of exchange on the respective dates of such transactions. Net realized foreign
20 | Wells Fargo Emerging Markets Equity Fund
Notes to financial statements (unaudited)
exchange gains or losses arise from sales of foreign currencies, currency gains or losses realized between the trade and settlement dates on securities transactions, and the difference between the amounts of dividends, interest and foreign withholding taxes recorded and the U.S. dollar equivalent of the amounts actually paid or received. Net unrealized foreign exchange gains and losses arise from changes in the fair value of assets and liabilities other than investments in securities resulting from changes in exchange rates. The changes in net assets arising from changes in exchange rates of securities and the changes in net assets resulting from changes in market prices of securities are not separately presented. Such changes are included in net realized and unrealized gains or losses from investments.
Forward foreign currency contracts
A forward foreign currency contract is an agreement between two parties to purchase or sell a specific currency for an agreed-upon price at a future date. The Fund enters into forward foreign currency contracts to facilitate transactions in foreign-denominated securities and to attempt to minimize the risk to the Fund from adverse changes in the relationship between currencies. Forward foreign currency contracts are recorded at the forward rate and marked-to-market daily. When the contracts are closed, realized gains and losses arising from such transactions are recorded as realized gains or losses on forward foreign currency contracts. The Fund is subject to foreign currency risk and may be exposed to risks if the counterparties to the contracts are unable to meet the terms of their contracts or if the value of the foreign currency changes unfavorably. The Fund’s maximum risk of loss from counterparty credit risk is the unrealized gains on the contracts. This risk may be mitigated if there is a master netting arrangement between the Fund and the counterparty.
Securities lending
The Fund may lend its securities from time to time in order to earn additional income in the form of fees or interest on securities received as collateral or the investment of any cash received as collateral. When securities are on loan, the Fund receives interest or dividends on those securities. Cash collateral received in connection with its securities lending transactions is invested in Securities Lending Cash Investments, LLC (the “Securities Lending Fund”). Investments in Securities Lending Fund are valued at the evaluated bid price provided by an independent pricing service. Income earned from investment in the Securities Lending Fund (net of fees and rebates), if any, is included in income from affiliated securities on the Statement of Operations.
In a securities lending transaction, the net asset value of the Fund is affected by an increase or decrease in the value of the securities loaned and by an increase or decrease in the value of the instrument in which collateral is invested. The amount of securities lending activity undertaken by the Fund fluctuates from time to time. The Fund has the right under the lending agreement to recover the securities from the borrower on demand. In the event of default or bankruptcy by the borrower, the Fund may be prevented from recovering the loaned securities or gaining access to the collateral or may experience delays or costs in doing so. In such an event, the terms of the agreement allows the unaffiliated securities lending agent to use the collateral to purchase replacement securities on behalf of the Fund or pay the Fund the market value of the loaned securities. The Fund bears the risk of loss with respect to depreciation of its investment of the cash collateral.
Security transactions and income recognition
Securities transactions are recorded on a trade date basis. Realized gains or losses are recorded on the basis of identified cost.
Dividend income is recognized on the ex-dividend date, except for certain dividends from foreign securities, which are recorded as soon as the custodian verifies the ex-dividend date.
Interest income is accrued daily and bond discounts are accreted and premiums are amortized daily. To the extent debt obligations are placed on non-accrual status, any related interest income may be reduced by writing off interest receivables when the collection of all or a portion of interest has been determined to be doubtful based on consistently applied procedures and the fair value has decreased. If the issuer subsequently resumes interest payments or when the collectability of interest is reasonably assured, the debt obligation is removed from non-accrual status.
Income from foreign securities is recorded net of foreign taxes withheld where recovery of such taxes is not assured.
Distributions to shareholders
Distributions to shareholders from net investment income and any net realized gains are recorded on the ex-dividend date and paid at least annually. Such distributions are determined in accordance with income tax regulations and may differ from U.S. generally accepted accounting principles. Dividend sources are estimated at the time of declaration. The tax character of distributions is determined as of the Fund’s fiscal year end. Therefore, a portion of the Fund’s distributions made prior to the Fund’s fiscal year end may be categorized as a tax return of capital at year end.
Wells Fargo Emerging Markets Equity Fund | 21
Notes to financial statements (unaudited)
Federal and other taxes
The Fund intends to continue to qualify as a regulated investment company by distributing substantially all of its investment company taxable income and any net realized capital gains (after reduction for capital loss carryforwards) sufficient to relieve it from all, or substantially all, federal income taxes. Accordingly, no provision for federal income taxes was required.
The Fund’s income and federal excise tax returns and all financial records supporting those returns for the prior three fiscal years are subject to examination by the federal and Delaware revenue authorities. Management has analyzed the Fund’s tax positions taken on federal, state, and foreign tax returns for all open tax years and does not believe that there are any uncertain tax positions that require recognition of a tax liability.
As of April 30, 2020, the aggregate cost of all investments for federal income tax purposes was $3,086,399,439 and the unrealized gains (losses) consisted of:
| | | | |
| |
Gross unrealized gains | | $ | 1,271,094,888 | |
| |
Gross unrealized losses | | | (802,199,493 | ) |
| |
Net unrealized gains | | $ | 468,895,395 | |
As of October 31, 2019, the Fund had capital loss carryforwards which consisted of $164,103,731 in long-term capital losses.
Class allocations
The separate classes of shares offered by the Fund differ principally in applicable sales charges, distribution, shareholder servicing, and administration fees. Class specific expenses are charged directly to that share class. Investment income, common fund-level expenses, and realized and unrealized gains (losses) on investments are allocated daily to each class of shares based on the relative proportion of net assets of each class.
3. FAIR VALUATION MEASUREMENTS
Fair value measurements of investments are determined within a framework that has established a fair value hierarchy based upon the various data inputs utilized in determining the value of the Fund’s investments. The three-level hierarchy gives the highest priority to unadjusted quoted prices in active markets for identical assets or liabilities (Level 1) and the lowest priority to unobservable inputs (Level 3). The Fund’s investments are classified within the fair value hierarchy based on the lowest level of input that is significant to the fair value measurement. The inputs are summarized into three broad levels as follows:
| ∎ | | Level 1 – quoted prices in active markets for identical securities |
| ∎ | | Level 2 – other significant observable inputs (including quoted prices for similar securities, interest rates, prepayment speeds, credit risk, etc.) |
| ∎ | | Level 3 – significant unobservable inputs (including the Fund’s own assumptions in determining the fair value of investments) |
The inputs or methodologies used for valuing investments in securities are not necessarily an indication of the risk associated with investing in those securities.
22 | Wells Fargo Emerging Markets Equity Fund
Notes to financial statements (unaudited)
The following is a summary of the inputs used in valuing the Fund’s assets and liabilities as of April 30, 2020:
| | | | | | | | | | | | | | | | |
| | | | |
| | | Quoted prices (Level 1) | | | Other significant observable inputs (Level 2) | | | Significant unobservable inputs (Level 3) | | | Total | |
| | | | |
Assets | | | | | | | | | | | | | | | | |
Investments in: | | | | | | | | | | | | | | | | |
| | | | |
Common stocks | | | | | | | | | | | | | | | | |
| | | | |
Argentina | | $ | 10,045,708 | | | $ | 0 | | | $ | 0 | | | $ | 10,045,708 | |
| | | | |
Brazil | | | 217,518,431 | | | | 0 | | | | 0 | | | | 217,518,431 | |
| | | | |
Chile | | | 42,917,020 | | | | 0 | | | | 0 | | | | 42,917,020 | |
| | | | |
China | | | 620,891,790 | | | | 812,920,666 | | | | 0 | | | | 1,433,812,456 | |
| | | | |
Colombia | | | 11,460,510 | | | | 0 | | | | 0 | | | | 11,460,510 | |
| | | | |
Cyprus | | | 5,777,640 | | | | 0 | | | | 0 | | | | 5,777,640 | |
| | | | |
Hong Kong | | | 0 | | | | 170,089,718 | | | | 0 | | | | 170,089,718 | |
| | | | |
India | | | 13,817,899 | | | | 292,901,033 | | | | 0 | | | | 306,718,932 | |
| | | | |
Indonesia | | | 29,521,815 | | | | 24,557,669 | | | | 0 | | | | 54,079,484 | |
| | | | |
Malaysia | | | 0 | | | | 7,128,583 | | | | 0 | | | | 7,128,583 | |
| | | | |
Mexico | | | 172,078,322 | | | | 0 | | | | 0 | | | | 172,078,322 | |
| | | | |
Peru | | | 7,540,146 | | | | 0 | | | | 0 | | | | 7,540,146 | |
| | | | |
Philippines | | | 0 | | | | 26,614,361 | | | | 0 | | | | 26,614,361 | |
| | | | |
Russia | | | 44,746,859 | | | | 50,401,499 | | | | 0 | | | | 95,148,358 | |
| | | | |
South Africa | | | 37,841,447 | | | | 23,532,809 | | | | 0 | | | | 61,374,256 | |
| | | | |
South Korea | | | 41,248,235 | | | | 340,807,381 | | | | 0 | | | | 382,055,616 | |
| | | | |
Taiwan | | | 116,755,938 | | | | 248,999,845 | | | | 0 | | | | 365,755,783 | |
| | | | |
Thailand | | | 0 | | | | 68,787,865 | | | | 0 | | | | 68,787,865 | |
| | | | |
Turkey | | | 0 | | | | 3,642,273 | | | | 0 | | | | 3,642,273 | |
| | | | |
United Arab Emirates | | | 0 | | | | 1,314,871 | | | | 0 | | | | 1,314,871 | |
| | | | |
United Kingdom | | | 0 | | | | 13,869,950 | | | | 0 | | | | 13,869,950 | |
| | | | |
Convertible debentures | | | 0 | | | | 0 | | | | 0 | | | | 0 | |
| | | | |
Preferred stocks | | | | | | | | | | | | | | | | |
| | | | |
Brazil | | | 47,832,053 | | | | 0 | | | | 0 | | | | 47,832,053 | |
| | | | |
Short-term investments | | | | | | | | | | | | | | | | |
| | | | |
Investment companies | | | 49,732,498 | | | | 0 | | | | 0 | | | | 49,732,498 | |
| | | | |
Total assets | | $ | 1,469,726,311 | | | $ | 2,085,568,523 | | | $ | 0 | | | $ | 3,555,294,834 | |
Additional sector, industry or geographic detail is included in the Portfolio of Investments.
For the six months ended April 30, 2020, the Fund did not have any transfers into/out of Level 3.
Wells Fargo Emerging Markets Equity Fund | 23
Notes to financial statements (unaudited)
4. TRANSACTIONS WITH AFFILIATES
Management fee
Funds Management, an indirect wholly owned subsidiary of Wells Fargo & Company (“Wells Fargo”), is the manager of the Fund and provides advisory and fund-level administrative services under an investment management agreement. Under the investment management agreement, Funds Management is responsible for, among other services, implementing the investment objectives and strategies of the Fund, supervising the subadviser and providing fund-level administrative services in connection with the Fund’s operations. As compensation for its services under the investment management agreement, Funds Management is entitled to receive a management fee at the following annual rate based on the Fund’s average daily net assets:
| | | | |
| |
| Average daily net assets | | Management fee | |
| |
First $1 billion | | | 1.050 | % |
| |
Next $1 billion | | | 1.025 | |
| |
Next $2 billion | | | 1.000 | |
| |
Next $1 billion | | | 0.975 | |
| |
Next $3 billion | | | 0.965 | |
| |
Next $2 billion | | | 0.955 | |
| |
Over $10 billion | | | 0.945 | |
For the six months ended April 30, 2020, the management fee was equivalent to an annual rate of 1.02% of the Fund’s average daily net assets.
Funds Management has retained the services of a subadviser to provide daily portfolio management to the Fund. The fee for subadvisory services is borne by Funds Management. Wells Capital Management Incorporated (“WellsCap”), an affiliate of Funds Management and an indirect wholly owned subsidiary of Wells Fargo, is the subadviser to the Fund and is entitled to receive a fee from Funds Management at an annual rate starting at 0.65% and declining to 0.45% as the average daily net assets of the Fund increase.
Administration fees
Under a class-level administration agreement, Funds Management provides class-level administrative services to the Fund, which includes paying fees and expenses for services provided by the transfer agent, sub-transfer agents, omnibus account servicers and record-keepers. As compensation for its services under the class-level administration agreement, Funds Management receives an annual fee which is calculated based on the average daily net assets of each class as follows:
| | | | |
| |
| | | Class-level administration fee | |
| |
Class A, Class C | | | 0.21 | % |
| |
Class R6 | | | 0.03 | |
| |
Administrator Class, Institutional Class | | | 0.13 | |
Waivers and/or expense reimbursements
Funds Management has contractually waived and/or reimbursed management and administration fees to the extent necessary to maintain certain net operating expense ratios for the Fund. When each class of the Fund has exceeded its expense cap, Funds Management has waived fees and/or reimbursed expenses from fund-level expenses on a proportionate basis and then from class specific expenses. When only certain classes exceed their expense caps, waivers and/or reimbursements are applied against class specific expenses before fund-level expenses. Funds Management has committed through February 28, 2021 to waive fees and/or reimburse expenses to the extent necessary to cap the Fund’s expenses at 1.55% for Class A shares, 2.30% for Class C shares, 1.13% for Class R6 shares, 1.42% for Administrator Class shares, and 1.17% for Institutional Class shares. Prior to or after the commitment expiration date, the cap may be increased or the commitment to maintain the cap may be terminated only with the approval of the Board of Trustees. Prior to March 1, 2020, the Fund’s expenses were capped at 1.58% for Class A shares, 2.33% for Class C shares, 1.15% for Class R6 shares, 1.46% for Administrator Class shares, and 1.19% for Institutional Class shares.
24 | Wells Fargo Emerging Markets Equity Fund
Notes to financial statements (unaudited)
Distribution fee
The Trust has adopted a distribution plan for Class C shares of the Fund pursuant to Rule 12b-1 under the 1940 Act. A distribution fee is charged to Class C shares and paid to Wells Fargo Funds Distributor, LLC (“Funds Distributor”), the principal underwriter, at an annual rate of 0.75% of the average daily net assets of Class C shares.
In addition, Funds Distributor is entitled to receive the front-end sales charge from the purchase of Class A shares and a contingent deferred sales charge on the redemption of certain Class A shares. Funds Distributor is also entitled to receive the contingent deferred sales charges from redemptions of Class C shares. For the six months ended April 30, 2020, Funds Distributor received $5,134 from the sale of Class A shares. No contingent deferred sales charges were incurred by Class A and Class C shares for the six months ended April 30, 2020.
Shareholder servicing fees
The Trust has entered into contracts with one or more shareholder servicing agents, whereby Class A, Class C, and Administrator Class of the Fund are charged a fee at an annual rate of 0.25% of the average daily net assets of each respective class. A portion of these total shareholder servicing fees were paid to affiliates of Wells Fargo.
Interfund transactions
The Fund may purchase or sell portfolio investment securities to certain other Wells Fargo affiliates pursuant to Rule 17a-7 under the 1940 Act and under procedures adopted by the Board of Trustees. The procedures have been designed to ensure that these interfund transactions, which do not incur broker commissions, are effected at current market prices.
5. INVESTMENT PORTFOLIO TRANSACTIONS
Purchases and sales of investments, excluding U.S. government obligations (if any) and short-term securities, for the six months ended April 30, 2020 were $91,339,432 and $198,499,996, respectively.
6. SECURITIES LENDING TRANSACTIONS
The Fund lends its securities through an unaffiliated securities lending agent and receives collateral in the form of cash or securities with a value at least equal to the value of the securities on loan. The value of the loaned securities is determined at the close of each business day and any increases or decreases in the required collateral are exchanged between the Fund and the counterparty on the next business day. Cash collateral received is invested in the Securities Lending Fund which seeks to provide a positive return compared to the daily Fed Funds Open Rate by investing in high-quality, U.S. dollar-denominated short-term money market instruments and is exempt from registration under Section 3(c)(7) of the 1940 Act. Securities Lending Fund is managed by Funds Management and is subadvised by WellsCap. Funds Management receives an advisory fee starting at 0.05% and declining to 0.01% as the average daily net assets of the Securities Lending Fund increase. All of the fees received by Funds Management are paid to WellsCap for its services as subadviser.
In the event of counterparty default or the failure of a borrower to return a loaned security, the Fund has the right to use the collateral to offset any losses incurred. As of April 30, 2020, the Fund did not have any securities on loan.
6. DERIVATIVE TRANSACTIONS
During the six months ended April 30, 2020, the Fund entered into forward foreign currency contracts for hedging purposes. The Fund had average contract amounts of $15,241 in forward foreign currency contracts to sell, respectively, during the six months ended April 30, 2020.
The fair value, realized gains or losses and change in unrealized gains or losses, if any, on derivative instruments are reflected in the corresponding financial statement captions.
7. BANK BORROWINGS
The Trust (excluding the money market funds), Wells Fargo Master Trust and Wells Fargo Variable Trust are parties to a $280,000,000 revolving credit agreement whereby the Fund is permitted to use bank borrowings for temporary or emergency purposes, such as to fund shareholder redemption requests. Interest under the credit agreement is charged to the Fund based on a borrowing rate equal to the higher of the Federal Funds rate in effect on that day plus 1.25% or the overnight LIBOR rate in effect on that day plus 1.25%. In addition, an annual commitment fee equal to 0.25% of the unused balance is allocated to each participating fund.
During the six months ended April 30, 2020, the Fund had average borrowings outstanding of $34,859 (on an annualized basis) at an average rate of 1.42% and paid interest in the amount of $495.
Wells Fargo Emerging Markets Equity Fund | 25
Notes to financial statements (unaudited)
8. CONCENTRATION RISK
Concentration risk results from exposure to a limited number of geographic regions. As of the end of the period, the Fund invested a concentration of its portfolio in China. A fund that invests a substantial portion of its assets in any geographic region may be more affected by changes in that geographic region than would be a fund whose investments are not heavily weighted in any geographic region.
9. INDEMNIFICATION
Under the Fund’s organizational documents, the officers and Trustees have been granted certain indemnification rights against certain liabilities that may arise out of performance of their duties to the Fund. The Fund has entered into a separate agreement with each Trustee that converts indemnification rights currently existing under the Fund’s organizational documents into contractual rights that cannot be changed in the future without the consent of the Trustee. Additionally, in the normal course of business, the Fund may enter into contracts with service providers that contain a variety of indemnification clauses. The Fund’s maximum exposure under these arrangements is dependent on future claims that may be made against the Fund and, therefore, cannot be estimated.
10. NEW ACCOUNTING PRONOUNCEMENT
In August 2018, FASB issued Accounting Standards Update (“ASU”) No. 2018-13, Fair Value Measurement (Topic 820)Disclosure Framework—Changes to the Disclosure Requirements for Fair Value Measurement. ASU 2018-13 updates the disclosure requirements for fair value measurements by modifying or removing certain disclosures and adding certain new disclosures. The amendments are effective for fiscal years, and interim periods within those fiscal years, beginning after December 15, 2019. Early adoption is permitted. Management has adopted the removal and modification of disclosures early, as permitted, and will adopt the additional new disclosures at the effective date.
11. CORONAVIRUS (COVID-19) PANDEMIC
On March 11, 2020, the World Health Organization announced that it had made the assessment that coronavirus disease 2019 (“COVID-19”) is a pandemic. The impacts of COVID-19 are adversely affecting the entire global economy, individual companies and investment products, and the market in general. There is significant uncertainty around the extent and duration of business disruptions related to COVID-19 and the impacts may be short term or may last for an extended period of time. The risk of further spreading of COVID-19 has led to significant uncertainty and volatility in the financial markets. The value of the Fund and the securities in which the Fund invests have generally been adversely affected by impacts caused by COVID-19.
26 | Wells Fargo Emerging Markets Equity Fund
Other information (unaudited)
TAX INFORMATION
Pursuant to Section 853 of the Internal Revenue Code, the following amounts have been designated as foreign taxes paid for the fiscal year ended October 31, 2019. These amounts may be less than the actual foreign taxes paid for financial statement purposes. Foreign taxes paid or withheld should be included in taxable income with an offsetting deduction from gross income or as a credit for taxes paid to foreign governments. None of the income was derived from ineligible foreign sources as defined under Section 901(j) of the Internal Revenue Code.
| | | | |
Creditable foreign taxes paid | | Per share amount | | Foreign income as % of ordinary income distributions |
| | |
| $6,641,324 | | $0.0417 | | 80.92% |
PROXY VOTING INFORMATION
A description of the policies and procedures used to determine how to vote proxies relating to portfolio securities is available, upon request, by calling1-800-222-8222, visiting our website at wfam.com, or visiting the SEC website at sec.gov. Information regarding how the proxies related to portfolio securities were voted during the most recent 12-month period ended June 30 is available on the website atwfam.comor by visiting the SEC website at sec.gov.
QUARTERLY PORTFOLIO HOLDINGS INFORMATION
The Fund files its complete schedule of portfolio holdings with the SEC for the first and third quarters of each fiscal year as an exhibit to its reports on Form N-PORT. Shareholders may view the filed Form N-PORT by visiting the SEC website at sec.gov.
Wells Fargo Emerging Markets Equity Fund | 27
Other information (unaudited)
BOARD OF TRUSTEES AND OFFICERS
Each of the Trustees and Officers1 listed in the table below acts in identical capacities for each fund in the Wells Fargo family of funds, which consists of 147 mutual funds comprising the Wells Fargo Funds Trust, Wells Fargo Variable Trust, Wells Fargo Master Trust and four closed-end funds (collectively the “Fund Complex”). This table should be read in conjunction with the Prospectus and the Statement of Additional Information2. The mailing address of each Trustee and Officer is 525 Market Street, 12th Floor, San Francisco, CA 94105. Each Trustee and Officer serves an indefinite term, however, each Trustee serves such term until reaching the mandatory retirement age established by the Trustees.
Independent Trustees
| | | | | | |
Name and year of birth | | Position held and length of service* | | Principal occupations during past five years or longer | | Current other public company or investment company directorships |
| | | |
William R. Ebsworth (Born 1957) | | Trustee, since 2015 | | Retired. From 1984 to 2013, equities analyst, portfolio manager, research director and chief investment officer at Fidelity Management and Research Company in Boston, Tokyo, and Hong Kong, and retired in 2013 as Chief Investment Officer of Fidelity Strategic Advisers, Inc. where he led a team of investment professionals managing client assets. Prior thereto, Board member of Hong Kong Securities Clearing Co., Hong Kong Options Clearing Corp., the Thailand International Fund, Ltd., Fidelity Investments Life Insurance Company, and Empire Fidelity Investments Life Insurance Company. Audit Committee Chair and Investment Committee Chair of the Vincent Memorial Hospital Endowment (non-profit organization). Mr. Ebsworth is a CFA® charterholder. | | N/A |
| | | |
Jane A. Freeman (Born 1953) | | Trustee, since 2015; Chair Liaison, since 2018 | | Retired. From 2012 to 2014 and 1999 to 2008, Chief Financial Officer of Scientific Learning Corporation. From 2008 to 2012, Ms. Freeman provided consulting services related to strategic business projects. Prior to 1999, Portfolio Manager at Rockefeller & Co. and Scudder, Stevens & Clark. Board member of the Harding Loevner Funds from 1996 to 2014, serving as both Lead Independent Director and chair of the Audit Committee. Board member of the Russell Exchange Traded Funds Trust from 2011 to 2012 and the chair of the Audit Committee. Ms. Freeman is also an inactive Chartered Financial Analyst. | | N/A |
| | | |
Isaiah Harris, Jr. (Born 1952) | | Trustee, since 2009; Audit Committee Chairman, since 2019 | | Retired. Chairman of the Board of CIGNA Corporation since 2009, and Director since 2005. From 2003 to 2011, Director of Deluxe Corporation. Prior thereto, President and CEO of BellSouth Advertising and Publishing Corp. from 2005 to 2007, President and CEO of BellSouth Enterprises from 2004 to 2005 and President of BellSouth Consumer Services from 2000 to 2003. Emeritus member of the Iowa State University Foundation Board of Governors. Emeritus Member of the Advisory Board of Iowa State University School of Business. Advisory Board Member, Palm Harbor Academy (private school). Advisory Board Member, Child Evangelism Fellowship (non-profit). Mr. Harris is a certified public accountant (inactive status). | | CIGNA Corporation |
| | | |
Judith M. Johnson (Born 1949) | | Trustee, since 2008; Audit Committee Chairman, from 2009 to 2018 | | Retired. Prior thereto, Chief Executive Officer and Chief Investment Officer of Minneapolis Employees Retirement Fund from 1996 to 2008. Ms. Johnson is an attorney, certified public accountant and a certified managerial accountant. | | N/A |
28 | Wells Fargo Emerging Markets Equity Fund
Other information (unaudited)
| | | | | | |
Name and year of birth | | Position held and length of service* | | Principal occupations during past five years or longer | | Current other public company or investment company directorships |
| | | |
David F. Larcker (Born 1950) | | Trustee, since 2009 | | James Irvin Miller Professor of Accounting at the Graduate School of Business, Stanford University, Director of the Corporate Governance Research Initiative and Senior Faculty of The Rock Center for Corporate Governance since 2006. From 2005 to 2008, Professor of Accounting at the Graduate School of Business, Stanford University. Prior thereto, Ernst & Young Professor of Accounting at The Wharton School, University of Pennsylvania from 1985 to 2005. | | N/A |
| | | |
Olivia S. Mitchell (Born 1953) | | Trustee, since 2006; Nominating and Governance Committee Chair, since 2018 | | International Foundation of Employee Benefit Plans Professor, Wharton School of the University of Pennsylvania since 1993. Director of Wharton’s Pension Research Council and Boettner Center on Pensions & Retirement Research, and Research Associate at the National Bureau of Economic Research. Previously, Cornell University Professor from 1978 to 1993. | | N/A |
| | | |
Timothy J. Penny (Born 1951) | | Trustee, since 1996; Chairman, since 2018 | | President and Chief Executive Officer of Southern Minnesota Initiative Foundation, a non-profit organization, since 2007. Member of the Board of Trustees of NorthStar Education Finance, Inc., a non-profit organization, since 2007. | | N/A |
| | | |
James G. Polisson (Born 1959) | | Trustee, since 2018 | | Retired. Chief Marketing Officer, Source (ETF) UK Services, Ltd, from 2015 to 2017. From 2012 to 2015, Principal of The Polisson Group, LLC, a management consulting, corporate advisory and principal investing company. Chief Executive Officer and Managing Director at Russell Investments, Global Exchange Traded Funds from 2010 to 2012. Managing Director of Barclays Global Investors from 1998 to 2010 and Global Chief Marketing Officer for iShares and Barclays Global Investors from 2000 to 2010. Trustee of the San Francisco Mechanics’ Institute, a non-profit organization, from 2013 to 2015. Board member of the Russell Exchange Traded Fund Trust from 2011 to 2012. Director of Barclays Global Investors Holdings Deutschland GmbH from 2006 to 2009. Mr. Polisson is an attorney and has a retired status with the Massachusetts and District of Columbia Bar Associations. | | N/A |
| | | |
Pamela Wheelock (Born 1959) | | Trustee, since January 2020; previously Trustee from January 2018 to July 2019 | | Board member of the Destination Medical Center Economic Development Agency, Rochester, Minnesota since 2019 and Interim President of the McKnight Foundation since 2020. Acting Commissioner, Minnesota Department of Human Services, July 2019 through September 2019. Human Services Manager (part-time), Minnesota Department of Human Services, October 2019 through December 2019. Chief Operating Officer, Twin Cities Habitat for Humanity from 2017 to 2019. Vice President of University Services, University of Minnesota from 2012 to 2016. Prior thereto, on the Board of Directors, Governance Committee and Finance Committee for the Minnesota Philanthropy Partners (Saint Paul Foundation) from 2012 to 2018, Interim Chief Executive Officer of Blue Cross Blue Shield of Minnesota from 2011 to 2012, Chairman of the Board from 2009 to 2012 and Board Director from 2003 to 2015. Vice President, Leadership and Community Engagement, Bush Foundation, Saint Paul, Minnesota (a private foundation) from 2009 to 2011. Executive Vice President and Chief Financial Officer, Minnesota Sports and Entertainment from 2004 to 2009 and Senior Vice President from 2002 to 2004. Executive Vice President of the Minnesota Wild Foundation from 2004 to 2008. Commissioner of Finance, State of Minnesota, from 1999 to 2002. Currently Board Chair of the Minnesota Wild Foundation since 2010. | | N/A |
| * | Length of service dates reflect the Trustee’s commencement of service with the Trust’s predecessor entities, where applicable. |
Wells Fargo Emerging Markets Equity Fund | 29
Other information (unaudited)
Officers
| | | | |
Name and year of birth | | Position held and length of service | | Principal occupations during past five years or longer |
| | |
Andrew Owen (Born 1960) | | President, since 2017 | | Executive Vice President of Wells Fargo & Company and Head of Affiliated Managers, Wells Fargo Asset Management, since 2014. In addition, Mr. Owen is currently President, Chief Executive Officer and Director of Wells Fargo Funds Management, LLC since 2017. Prior thereto, Executive Vice President responsible for marketing, investments and product development for Wells Fargo Funds Management, LLC, from 2009 to 2014. |
| | |
Jeremy DePalma1 (Born 1974) | | Treasurer, since 2012 | | Senior Vice President of Wells Fargo Funds Management, LLC since 2009. Senior Vice President of Evergreen Investment Management Company, LLC from 2008 to 2010 and head of the Fund Reporting and Control Team within Fund Administration from 2005 to 2010. |
| | |
Michelle Rhee (Born 1966) | | Chief Legal Officer, since 2019 | | Secretary of Wells Fargo Funds Management, LLC, Chief Legal Counsel of Wells Fargo Asset Management and Assistant General Counsel of Wells Fargo Bank, N.A. since 2018. Associate General Counsel and Managing Director of Bank of America Corporation from 2004 to 2018. |
| | |
Catherine Kennedy (Born 1969) | | Secretary, since 2019 | | Vice President of Wells Fargo Funds Management, LLC and Senior Counsel of the Wells Fargo Legal Department since 2010. Vice President and Senior Counsel of Evergreen Investment Management Company, LLC from 1998 to 2010. |
| | |
Michael H. Whitaker (Born 1967) | | Chief Compliance Officer, since 2016 | | Chief Compliance Officer of Wells Fargo Asset Management since 2016. Senior Vice President and Chief Compliance Officer for Fidelity Investments from 2007 to 2016. |
| | |
David Berardi (Born 1975) | | Assistant Treasurer, since 2009 | | Vice President of Wells Fargo Funds Management, LLC since 2009. Vice President of Evergreen Investment Management Company, LLC from 2008 to 2010. Manager of Fund Reporting and Control for Evergreen Investment Management Company, LLC from 2004 to 2010. |
| 1 | Jeremy DePalma acts as Treasurer of 82 funds and Assistant Treasurer of 65 funds in the Fund Complex. |
| 2 | The Statement of Additional Information includes additional information about the Trustees and is available, without charge, upon request, by calling1-800-222-8222 or by visiting the website atwfam.com. |
30 | Wells Fargo Emerging Markets Equity Fund
Appendix I (unaudited)
Effective on or about May 1, 2020, if you purchase Fund shares through a Janney Montgomery Scott LLC (“Janney”) brokerage account, you will be eligible for the following load waivers (front-end sales charge waivers and contingent deferred sales charge (“CDSC”), or back-end sales charge, waivers) and discounts, which may differ from those disclosed elsewhere in the Fund’s Prospectus or SAI.
|
| Front-end sales charge* waivers on Class A shares available at Janney |
|
| Shares purchased through reinvestment of capital gains distributions and dividend reinvestment when purchasing shares of the same fund (but not any other fund within the fund family). |
|
| Shares purchased by employees and registered representatives of Janney or its affiliates and their family members as designated by Janney. |
|
| Shares purchased from the proceeds of redemptions within the same fund family, provided (1) the repurchase occurs within ninety (90) days following the redemption, (2) the redemption and purchase occur in the same account, and (3) redeemed shares were subject to a front-end or deferred sales load (i.e., right of reinstatement). |
|
| Employer-sponsored retirement plans (e.g., 401(k) plans, 457 plans, employer-sponsored 403(b) plans, profit sharing and money purchase pension plans and defined benefit plans). For purposes of this provision, employer-sponsored retirement plans do not include SEP IRAs, Simple IRAs, SAR-SEPs or Keogh plans. |
|
| Shares acquired through a right of reinstatement. |
|
| Class C shares that are no longer subject to a contingent deferred sales charge and are converted to Class A shares of the same fund pursuant to Janney’s policies and procedures. |
| CDSC waivers on Class A and Class C shares available at Janney |
|
| Shares sold upon the death or disability of the shareholder. |
|
| Shares sold as part of a systematic withdrawal plan as described in the Fund’s Prospectus. |
|
| Shares purchased in connection with a return of excess contributions from an IRA account. |
|
| Shares sold as part of a required minimum distribution for IRA and retirement accounts if the redemption is taken in or after the year the shareholder reaches qualified age based on applicable IRS regulations. |
|
| Shares sold to pay Janney fees but only if the transaction is initiated by Janney. |
|
| Shares acquired through a right of reinstatement. |
|
| Shares exchanged into the same share class of a different fund. |
| Front-end sales charge* discounts available at Janney; breakpoints, rights of accumulation and/or letters of intent |
|
| Breakpoints as described in the Fund’s Prospectus. |
|
| Rights of accumulation (“ROA”), which entitle shareholders to breakpoint discounts, will be automatically calculated based on the aggregated holding of fund family assets held by accounts within the purchaser’s household at Janney. Eligible fund family assets not held at Janney may be included in the ROA calculation only if the shareholder notifies his or her financial advisor about such assets. |
|
| Letters of intent which allow for breakpoint discounts based on anticipated purchases within a fund family, over a 13-month time period. Eligible fund family assets not held at Janney Montgomery Scott may be included in the calculation of letters of intent only if the shareholder notifies his or her financial advisor about such assets. |
| * | Also referred to as an “initial sales charge.” |
Wells Fargo Emerging Markets Equity Fund | 31
Appendix II (unaudited)
Effective on or after May 1, 2020, clients of Edward Jones (also referred to as “shareholders”) purchasing Fund shares on the Edward Jones commission and fee-based platforms are eligible only for the following sales charge discounts (also referred to as “breakpoints”) and waivers, which can differ from breakpoints and waivers described elsewhere in the Fund’s Prospectus or SAI or through another broker-dealer. In all instances, it is the shareholder’s responsibility to inform Edward Jones at the time of purchase of any relationship, holdings of Wells Fargo Funds or other facts qualifying the purchaser for breakpoints or waivers. Edward Jones can ask for documentation of such circumstance.
|
| Breakpoints available at Edward Jones |
|
| Rights of Accumulation (ROA) |
|
The applicable sales charge on a purchase of Class A shares is determined by taking into account all share classes (except any money market funds and retirement plan share classes) of Wells Fargo Funds held by the shareholder or in an account grouped by Edward Jones with other accounts for the purpose of providing certain pricing considerations (“pricing groups”). This includes all share classes held on the Edward Jones platform and/or held on another platform. The inclusion of eligible fund family assets in the rights of accumulation calculation is dependent on the shareholder notifying his or her financial advisor of such assets at the time of calculation. |
|
ROA is determined by calculating the higher of cost or market value (current shares x NAV). |
|
| Letter of Intent (LOI) |
|
Through a LOI, shareholders can receive the sales charge and breakpoint discounts for purchases shareholders intend to makeover a 13-month period from the date Edward Jones receives the LOI. The LOI is determined by calculating the higher of cost or market value of qualifying holdings at LOI initiation in combination with the value that the shareholder intends to buy over a 13-month period to calculate the front-end sales charge and any breakpoint discounts. Each purchase the shareholder makes during that13-month period will receive the sales charge and breakpoint discount that applies to the total amount. The inclusion of eligible fund family assets in the LOI calculation is dependent on the shareholder notifying his or her financial advisor of such assets at the time of calculation. Purchases made before the LOI is received by Edward Jones are not covered under the LOI and will not reduce the sales charge previously paid. Sales charges will be adjusted if LOI is not met. |
| Sales charges are waived for the following shareholders and in the following situations at Edward Jones: |
● Associates of Edward Jones and its affiliates and their family members who are in the same pricing group (as determined by Edward Jones under its policies and procedures) as the associate. This waiver will continue for the remainder of the associate’s life if the associate retires from Edward Jones in good-standing. |
● Shares purchased in an Edward Jones fee-based program. |
● Shares purchased through reinvestment of capital gains distributions and dividend reinvestment. |
● Shares purchased from the proceeds of redeemed shares of the same fund family so long as the following conditions are met: 1) the proceeds are from the sale of shares within 60 days of the purchase, and 2) the sale and purchase are made in the same share class and the same account or the purchase is made in an individual retirement account with proceeds from liquidations in anon-retirement account. |
● Shares exchanged into Class A shares from another share class so long as the exchange is into the same fund and was initiated at the discretion of Edward Jones. Edward Jones is responsible for any remaining CDSC due to the fund company, if applicable. Any future purchases are subject to the applicable sales charge as disclosed in the prospectus. |
● Exchanges from Class C shares to Class A shares of the same fund, generally, in the 84th month following the anniversary of the purchase date or earlier at the discretion of Edward Jones. |
If the shareholder purchases shares that are subject to a CDSC and those shares are redeemed before the CDSC is expired, the shareholder
is responsible to pay the CDSC except in the following conditions available at Edward Jones: |
● The death or disability of the shareholder. |
● Systematic withdrawals with up to 10% per year of the account value. |
● Return of excess contributions from an Individual Retirement Account (IRA). |
● Shares sold as part of a required minimum distribution for IRA and retirement accounts if the redemption is taken in or after the year the shareholder reaches qualified age based on applicable IRS regulation. |
● Shares sold to pay Edward Jones fees or costs in such cases where the transaction is initiated by Edward Jones. |
● Shares exchanged in an Edward Jones fee-based program. |
● Shares acquired through NAV reinstatement. |
32 | Wells Fargo Emerging Markets Equity Fund
Appendix II (unaudited)
|
| Other Important Information for accounts at Edward Jones: |
| Minimum Purchase Amounts |
● $250 initial purchase minimum |
● $50 subsequent purchase minimum |
|
| Minimum Balances |
| Edward Jones has the right to redeem at its discretion fund holdings with a balance of $250 or less. The following are examples of accounts that are not included in this policy: |
● A fee-based account held on an Edward Jones platform |
● A 529 account held on an Edward Jones platform |
● An account with an active systematic investment plan or letter of intent (LOI) |
|
| Changing Share Classes |
| At any time it deems necessary, Edward Jones has the authority to exchange at NAV a shareholder’s holdings in a fund to Class A shares. |
Wells Fargo Emerging Markets Equity Fund | 33
Appendix III (unaudited)
Effective June 1, 2020, shareholders purchasing Fund shares through an Oppenheimer & Co. Inc. (“Oppenheimer”) platform or account are eligible only for the following load waivers (front-end sales charge waivers and contingent deferred or back-end, sales charge waivers) and discounts, which may differ from those disclosed in the Fund’s Prospectus or SAI.
|
| Front-end Sales Load Waivers on Class A Shares available at Oppenheimer |
|
| Employer-sponsored retirement, deferred compensation and employee benefit plans (including health savings accounts) and trusts used to fund those plans, provided that the shares are not held in a commission-based brokerage account and shares are held for the benefit of the plan. |
|
| Shares purchased by or through a 529 Plan. |
|
| Shares purchased through an Oppenheimer affiliated investment advisory program. |
|
| Shares purchased through reinvestment of capital gains distributions and dividend reinvestment when purchasing shares of the same fund (but not any other fund within the fund family). |
|
| Shares purchased from the proceeds of redemptions within the same fund family, provided (1) the repurchase occurs within 90 days following the redemption, (2) the redemption and purchase occur in the same account, and (3) redeemed shares were subject to a front-end or deferred sales load (known as Rights of Restatement). |
|
| A shareholder in the Fund’s Class C shares will have their shares exchanged at net asset value to Class A shares (or the appropriate share class) of the Fund if the shares are no longer subject to a CDSC and the exchange is in line with the policies and procedures of Oppenheimer. |
|
| Employees and registered representatives of Oppenheimer or its affiliates and their family members. |
|
| Directors or Trustees of the Fund, and employees of the Fund’s investment adviser or any of its affiliates, as described in the Prospectus. |
| CDSC Waivers on A and C Shares available at Oppenheimer |
|
| Death or disability of the shareholder. |
|
| Shares sold as part of a systematic withdrawal plan as described in the Prospectus. |
|
| Return of excess contributions from an IRA Account. |
|
| Shares sold as part of a required minimum distribution for IRA and retirement accounts due to the shareholder reaching the qualified age based on applicable IRS regulations as described in the Prospectus. |
|
| Shares sold to pay Oppenheimer fees but only if the transaction is initiated by Oppenheimer. |
|
| Shares acquired through a right of reinstatement. |
| Front-end load Discounts Available at Oppenheimer: Breakpoints, Rights of Accumulation & Letters of Intent |
|
| Breakpoints as described in the Prospectus. |
|
| Rights of Accumulation (ROA), which entitle shareholders to breakpoint discounts, will be automatically calculated based on the aggregated holding of fund family assets held by accounts within the purchaser’s household at Oppenheimer. Eligible fund family assets not held at Oppenheimer may be included in the ROA calculation only if the shareholder notifies his or her financial advisor about such assets. |
34 | Wells Fargo Emerging Markets Equity Fund
Appendix IV (unaudited)
Effective June 15, 2020, shareholders purchasing fund shares through a Robert W. Baird & Co. (“Baird”) platform or account will only be eligible for the following sales charge waivers (front-end sales charge waivers and CDSC waivers) and discounts, which may differ from those disclosed elsewhere in the Fund’s Prospectus or the SAI.
|
| Front-end Sales Load Waivers on Class A Shares available at Baird |
|
| Shares purchased through reinvestment of capital gains distributions and dividend reinvestment when purchasing share of the same fund. |
|
| Share purchase by employees and registers representatives of Baird or its affiliate and their family members as designated by Baird. |
|
| Shares purchase from the proceeds of redemptions within the same fund family, provided (1) the repurchase occurs within 90 days following the redemption, (2) the redemption and purchase occur in the same accounts, and (3) redeemed shares were subject to a front-end or deferred sales charge (known as rights of reinstatement). |
|
| A shareholder in the Funds Investor C Shares will have their share exchanged at net asset value to Investor A shares of the fund if the shares are no longer subject to CDSC and the exchange is in line with the policies and procedures of Baird. |
|
| Employer-sponsored retirement plans or charitable accounts in a transactional brokerage account at Baird, including 401(k)plans, 457 plans, employer-sponsored 403(b) plans, profit sharing and money purchase pension plans and defined benefit plans. For purposes of this provision, employer-sponsored retirement plans do not include SEP IRAs, Simple IRAs or SAR-SEPs. |
| CDSC Waivers on A and C Shares available at Baird |
|
| Shares sold due to death or disability of the shareholder. |
|
| Shares sold as part of a systematic withdrawal plan as described in the Fund’s Prospectus. |
|
| Shares bought due to returns of excess contributions from an IRA Account. |
|
| Shares sold as part of a required minimum distribution for IRA and retirement accounts due to the shareholder reaching age 72 as described in the Fund’s Prospectus. |
|
| Shares sold to pay Baird fees but only if the transaction is initiated by Baird. |
|
| Shares acquired through a right of reinstatement. |
| Front-end load Discounts Available at Baird: Breakpoint and/or Rights of Accumulation |
|
| Breakpoints as described in the Prospectus. |
|
| Rights of accumulations which entitles shareholders to breakpoint discounts will be automatically calculated based on the aggregated holding of fund family assets held by accounts within the purchaser’s household at Baird. Eligible fund family assets not held at Baird may be included in the rights of accumulations calculation only if the shareholder notifies his or her financial advisor about such assets. |
|
| Letters of Intent (LOI) allow for breakpoint discounts based on anticipated purchases within a fund family through Baird, over a 13-month period of time. |
Wells Fargo Emerging Markets Equity Fund | 35
This page is intentionally left blank.

For more information
More information about Wells Fargo Funds is available free upon request. To obtain literature, please write, visit the Fund’s website, or call:
Wells Fargo Funds
P.O. Box 219967
Kansas City, MO 64121-9967
Website:wfam.com
Individual investors:1-800-222-8222
Retail investment professionals:1-888-877-9275
Institutional investment professionals:1-866-765-0778

This report and the financial statements contained herein are submitted for the general information of the shareholders of the Fund. If this report is used for promotional purposes, distribution of the report must be accompanied or preceded by a current prospectus. Before investing, please consider the investment objectives, risks, charges, and expenses of the investment. For a current prospectus and, if available, a summary prospectus, containing this information, call1-800-222-8222 or visit the Fund’s website atwfam.com. Read the prospectus carefully before you invest or send money.
Wells Fargo Asset Management (WFAM) is the trade name for certain investment advisory/management firms owned by Wells Fargo & Company. These firms include but are not limited to Wells Capital Management Incorporated and Wells Fargo Funds Management, LLC. Certain products managed by WFAM entities are distributed by Wells Fargo Funds Distributor, LLC (a broker-dealer and Member FINRA).
This material is for general informational and educational purposes only and is NOT intended to provide investment advice or a recommendation of any kind—including a recommendation for any specific investment, strategy, or plan.
INVESTMENT PRODUCTS: NOT FDIC INSURED ◾ NO BANK GUARANTEE ◾ MAY LOSE VALUE
© 2019 Wells Fargo & Company. All rights reserved.
PAR-0520-00406 06-20
SA238/SAR238 04-20
Semi-Annual Report
April 30, 2020
Wells Fargo Global Small Cap Fund
Beginning on January 1, 2021, as permitted by new regulations adopted by the Securities and Exchange Commission, paper copies of the Wells Fargo Funds’ annual and semi-annual shareholder reports issued after this date will no longer be sent by mail, unless you specifically request paper copies of the reports. Instead, the reports will be made available on the Funds’ website, and you will be notified by mail each time a report is posted and provided with a website address to access the report.
If you already elected to receive shareholder reports electronically, you will not be affected by this change and you need not take any action. You may elect to receive shareholder reports and other communications from the Fund electronically at any time by contacting your financial intermediary (such as a broker-dealer or bank) or, if you are a direct investor, by calling1-800-222-8222 or by enrolling at wellsfargo.com/advantagedelivery.
You may elect to receive all future reports in paper free of charge. If you invest through a financial intermediary, you can contact your financial intermediary to request that you continue to receive paper copies of your shareholder reports; if you invest directly with the Fund, you can call 1-800-222-8222. Your election to receive reports in paper will apply to all Wells Fargo Funds held in your account with your financial intermediary or, if you are a direct investor, to all Wells Fargo Funds that you hold.
|
|
|
Reduce clutter. Save trees. |
Sign up for electronic
delivery of prospectuses and
shareholder reports atwellsfargo.com/
advantagedelivery |
The views expressed and any forward-looking statements are as of April 30, 2020, unless otherwise noted, and are those of the Fund managers and/or Wells Fargo Asset Management. Discussions of individual securities, or the markets generally, or any Wells Fargo Fund are not intended as individual recommendations. Future events or results may vary significantly from those expressed in any forward-looking statements. The views expressed are subject to change at any time in response to changing circumstances in the market. Wells Fargo Asset Management and the Fund disclaim any obligation to publicly update or revise any views expressed or forward-looking statements.
INVESTMENT PRODUCTS: NOT FDIC INSURED ◾ NO BANK GUARANTEE ◾ MAY LOSE VALUE
Wells Fargo Global Small Cap Fund | 1
Letter to shareholders (unaudited)

Andrew Owen
President
Wells Fargo Funds
“The period began with a tailwind created by central bank support.”
Dear Shareholder:
We are pleased to offer you this semi-annual report for the Wells Fargo Global Small Cap Fund for the six-month period that ended April 30, 2020. Global stock markets saw earlier gains erased in February and March as governments took unprecedented measures to stop the spread of the coronavirus at the expense of short-term economic output. Markets rebounded in April to lessen the losses as central banks attempted to bolster capital markets and confidence. Fixed-income markets performed better, with the exception of high-yield bonds, as U.S. bonds overall achieved modest gains.
For the six-month period, U.S. stocks, based on the S&P 500 Index,1 returned -3.16% and international stocks, as measured by the MSCI ACWI ex USA Index (Net),2 fell 13.22%. The MSCI Emerging Markets Index (Net)3 lost 10.50%. For bond investors, the Bloomberg Barclays U.S. Aggregate Bond Index4 added 4.86%, the Bloomberg Barclays Global Aggregate ex-USD Index5 returned -0.97%, the Bloomberg Barclays Municipal Bond Index6 returned-1.33%, and the ICE BofA U.S. High Yield Index7 lost 7.68%.
The period began with a tailwind created by central bank support.
The period began with a tailwind that had been created by U.S. Federal Reserve (Fed) rate cuts in the summer and early fall. Equity markets rallied in November despite ongoing geopolitical risks. Hopes for a U.S.-China trade deal buoyed investor confidence. U.S. business sentiment edged up, and manufacturing and services activity rose. With that positive backdrop, developed market equities outpaced those in emerging markets, and U.S. stocks outperformed non-U.S. stocks overall. While consumer confidence and purchasing manager activity rose in the eurozone, China reported weakening manufacturing and consumer data. Bond yields rose marginally, leading to slightly negative returns for global government and investment-grade corporate bonds.
Financial markets ended 2019 with a boost from the U.S. and China accord on a Phase One trade deal. That, along with the landslide win by the pro-Brexit U.K. Conservative Party in a national election and ongoing central bank support, gave investors greater confidence. U.S. economic indicators were positive overall, with the exception of manufacturing activity and business confidence. Consumer confidence was resilient, fed by a robust labor market, tame inflation, and lower interest rates, which boosted housing affordability and stimulated homebuyer activity. The impeachment of U.S. President Donald Trump had little impact on markets. Meanwhile, slowing Chinese economic activity, partly attributable to the trade war, led to further government stimulus at year-end through lower reserve ratios, allowing banks to lend more money.
The year-end rally continued in early January 2020. However, capital market volatility spiked in late January on concerns over the potential impact of the coronavirus on the global economy and stock markets. With sentiment somewhat souring, perceived safe
| 1 | The S&P 500 Index consists of 500 stocks chosen for market size, liquidity, and industry group representation. It is a market-value-weighted index with each stock’s weight in the index proportionate to its market value. You cannot invest directly in an index. |
| 2 | The Morgan Stanley Capital International (MSCI) All Country World Index (ACWI) ex USA Index (Net) is a free-float-adjusted market-capitalization-weighted index that is designed to measure the equity market performance of developed markets, excluding the United States. Source: MSCI. MSCI makes no express or implied warranties or representations and shall have no liability whatsoever with respect to any MSCI data contained herein. The MSCI data may not be further redistributed or used as a basis for other indices or any securities or financial products. This report is not approved, reviewed, or produced by MSCI. You cannot invest directly in an index. |
| 3 | The MSCI Emerging Markets (EM) Index (Net) is a free-float-adjusted market-capitalization-weighted index that is designed to measure equity market performance of emerging markets. You cannot invest directly in an index. |
| 4 | The Bloomberg Barclays U.S. Aggregate Bond Index is a broad-based benchmark that measures the investment-grade, U.S. dollar-denominated, fixed-rate taxable bond market, including Treasuries, government-related and corporate securities, mortgage-backed securities (agency fixed-rate and hybrid adjustable-rate mortgage pass-throughs), asset-backed securities, and commercial mortgage-backed securities. You cannot invest directly in an index. |
| 5 | The Bloomberg Barclays Global Aggregate ex-USD Index is an unmanaged index that provides a broad-based measure of the global investment-grade fixed-income markets excluding the U.S. dollar-denominated debt market. You cannot invest directly in an index. |
| 6 | The Bloomberg Barclays Municipal Bond Index is an unmanaged index composed of long-term tax-exempt bonds with a minimum credit rating of Baa. You cannot invest directly in an index. |
| 7 | The ICE BofA U.S. High Yield Index is a market-capitalization-weighted index of domestic and Yankee high-yield bonds. The index tracks the performance of high-yield securities traded in the U.S. bond market. You cannot invest directly in an index. Copyright 2020. ICE Data Indices, LLC. All rights reserved. |
2 | Wells Fargo Global Small Cap Fund
Letter to shareholders (unaudited)
havens did well in January. The U.S. dollar and Japanese yen both rose, and government bonds outperformed equities. While the S&P 500 Index held its ground, emerging market equities tumbled, including those in Asia.
In February, the coronavirus became the major market focus. Fears of the virus’s impact on global growth led to expectations of increased global central bank monetary policy support. That led the 10-year U.S. Treasury yield to fall to an all-time low of 1.1% by the end of the month. Although equity markets initially shrugged off concerns about the outbreak, focusing instead on strong fourth-quarter earnings and improving business confidence in January, market sentiment turned sharply lower toward month-end. Oil prices tumbled as Russia and the Organization of the Petroleum Exporting Countries compounded a major decline in oil demand with a brutal price war, causing the price of West Texas Intermediate crude oil to fall 13% in February alone.
The global spread of the coronavirus led many countries to clamp down on social and business-related activity in order to contain the virus from causing even greater devastation and overwhelming the health care system. This abrupt stoppage of economic activity led to the sharp deceleration of global output, sending economies into a deep contraction. Central bank responses were swift, as they slashed interest rates and expanded quantitative easing programs to restore liquidity and confidence to the markets. In the U.S., the Fed launched several lending programs, funding investment-grade bonds, money market mutual funds, and commercial paper while purchasing Treasuries, mortgage-backed securities, and overnight repurchase agreements. Meanwhile, stock markets tumbled quickly into a bear market, ending the longest bull stock market in U.S. history.
Markets rebounded strongly in April after the extreme volatility of the previous two months, with the S&P 500 Index gaining 12.8% for the month and the MSCI ACWI ex USA Index (Net) returning 7.6%. The rebound was fueled by unprecedented stimulus measures taken by governments and central banks to buffer the economic damage created by mass shutdowns to try to contain the virus’s spread. The U.S. economy contracted by an annualized 4.8% pace in the first quarter, with 30 million new unemployment insurance claims in six weeks. In the eurozone, first-quarter real gross domestic product (GDP) shrank 3.8%, with the composite April Flash Purchasing Managers’ Index, a monthly survey of purchasing managers, falling to an all-time low of 13.5. The European Central Bank expanded its quantitative easing to include the purchase of additional government bonds of countries with the greatest virus-related need, including Italy and Spain. China’s first-quarter GDP fell by 6.8% year over year. However, retail sales, production, and investment showed signs of recovery. Extreme oil price volatility continued as global supply far exceeded demand.
Don’t let short-term uncertainty derail long-term investment goals.
Periods of investment uncertainty can present challenges, but experience has taught us that maintaining long-term investment goals can be an effective way to plan for the future. To help you create a sound strategy based on your personal goals and risk tolerance, Wells Fargo Funds offers more than 100 mutual funds spanning a wide range of asset classes and investment styles. Although diversification cannot guarantee an investment profit or prevent losses, we believe it can be an effective way to manage investment risk and potentially smooth out overall portfolio performance. We encourage investors to know their investments and to understand that appropriate levels of risk-taking may unlock opportunities.
Thank you for choosing to invest with Wells Fargo Funds. We appreciate your confidence in us and remain committed to helping you meet your financial needs.
Sincerely,

Andrew Owen
President
Wells Fargo Funds
“The global spread of the coronavirus led many countries to clamp down on social and business-related activity in order to contain the virus from causing even greater devastation and overwhelming the health care system.”
|
|
|
For further information about your Fund, contact your investment professional, visit our website at wfam.com, or call us directly at1-800-222-8222. |
Wells Fargo Global Small Cap Fund | 3
Performance highlights (unaudited)
Investment objective
The Fund seeks long-term capital appreciation.
Manager
Wells Fargo Funds Management, LLC
Subadviser
Wells Capital Management Incorporated
Portfolio managers
Stephen Giggie, CFA®‡*
Oleg Makhorine
Brian Martin, CFA®‡*
James M. Tringas, CFA®‡
Bryant VanCronkhite, CFA®‡, CPA
Average annual total returns (%) as of April 30, 20201
| | | | | | | | | | | | | | | | | | | | | | | | | | | | | | | | | | |
| | | | |
| | | | | Including sales charge | | | Excluding sales charge | | | Expense ratios2 (%) | |
| | | | | | | | | |
| | | Inception date | | 1 year | | | 5 year | | | 10 year | | | 1 year | | | 5 year | | | 10 year | | | Gross | | | Net3 | |
| | | | | | | | | | |
| Class A (EKGAX) | | 3-16-1988 | | | -17.91 | | | | 3.06 | | | | 6.13 | | | | -12.90 | | | | 4.29 | | | | 6.76 | | | | 1.54 | | | | 1.54 | |
| | | | | | | | | | |
| Class C (EKGCX) | | 2-1-1993 | | | -14.56 | | | | 3.50 | | | | 5.96 | | | | -13.56 | | | | 3.50 | | | | 5.96 | | | | 2.29 | | | | 2.29 | |
| | | | | | | | | | |
| Administrator Class (EKGYX) | | 1-13-1997 | | | – | | | | – | | | | – | | | | -12.78 | | | | 4.43 | | | | 6.93 | | | | 1.46 | | | | 1.41 | |
| | | | | | | | | | |
| Institutional Class (EKGIX)4 | | 7-30-2010 | | | – | | | | – | | | | – | | | | -12.57 | | | | 4.69 | | | | 7.19 | | | | 1.21 | | | | 1.16 | |
| | | | | | | | | | |
| S&P Developed SmallCap Index5 | | – | | | – | | | | – | | | | – | | | | -14.43 | | | | 2.44 | | | | 7.05 | | | | – | | | | – | |
Figures quoted represent past performance, which is no guarantee of future results, and do not reflect taxes that a shareholder may pay on an investment in a fund. Investment return and principal value of an investment will fluctuate so that an investor’s shares, when redeemed, may be worth more or less than their original cost. Performance shown without sales charges would be lower if sales charges were reflected. Current performance may be lower or higher than the performance data quoted, which assumes the reinvestment of dividends and capital gains. Currentmonth-end performance is available on the Fund’s website, wfam.com.
Index returns do not include transaction costs associated with buying and selling securities, any mutual fund fees or expenses, or any taxes. It is not possible to invest directly in an index.
For Class A shares, the maximumfront-end sales charge is 5.75%. For Class C shares, the maximum contingent deferred sales charge is 1.00%. Performance including a contingent deferred sales charge assumes the sales charge for the corresponding time period. Administrator Class and Institutional Class shares are sold without afront-end sales charge or contingent deferred sales charge.
Stock values fluctuate in response to the activities of individual companies and general market and economic conditions. Foreign investments are especially volatile and can rise or fall dramatically due to differences in the political and economic conditions of the host country. These risks are generally intensified in emerging markets. The use of derivatives may reduce returns and/or increase volatility. Certain investment strategies tend to increase the total risk of an investment (relative to the broader market). The Fund is exposed to geographic risk and smaller-company securities risk. Consult the Fund’s prospectus for additional information on these and other risks.
Please see footnotes on page 5.
4 | Wells Fargo Global Small Cap Fund
Performance highlights (unaudited)
| | | | |
|
| Ten largest holdings (%) as of April 30, 20206 | |
| | |
Nomad Foods Limited | | | 2.75 | |
| | |
CBIZ Incorporated | | | 2.52 | |
| | |
Innospec Incorporated | | | 2.44 | |
| | |
CSW Industrials Incorporated | | | 2.36 | |
| | |
Novanta Incorporated | | | 2.34 | |
| | |
Stepan Company | | | 2.32 | |
| | |
MGE Energy Incorporated | | | 2.31 | |
| | |
Central Garden & Pet Company Class A | | | 2.22 | |
| | |
Hostess Brands Incorporated | | | 2.18 | |
| | |
ACI Worldwide Incorporated | | | 2.08 | |
|
|
| Sector distribution as of April 30, 20207 |
|
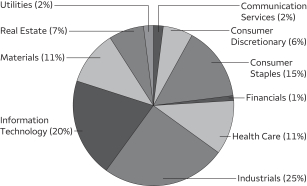 |
|
|
| Country allocation as of April 30, 20207 |
|
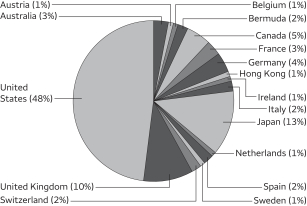 |
| ‡ | CFA® and Chartered Financial Analyst® are trademarks owned by CFA Institute. |
| * | Mr. Giggie and Mr. Martin became portfolio managers of the Fund on April 15, 2020. |
| 1 | Historical performance prior to July 19, 2010, is based on the performance of the Fund’s predecessor, Evergreen Global Opportunities Fund. |
| 2 | Reflects the expense ratios as stated in the most recent prospectuses, which include the impact of 0.01% in acquired fund fees and expenses. The expense ratios shown are subject to change and may differ from the annualized expense ratios shown in the financial highlights of this report, which do not include acquired fund fees and expenses. |
| 3 | The manager has contractually committed through February 28, 2021, to waive fees and/or reimburse expenses to the extent necessary to cap total annual fund operating expenses after fee waivers at 1.55% for Class A, 2.30% for Class C, 1.40% for Administrator Class, and 1.15% for Institutional Class. Brokerage commissions, stamp duty fees, interest, taxes, acquired fund fees and expenses (if any), and extraordinary expenses are excluded from the expense cap. Prior to or after the commitment expiration date, the cap may be increased or the commitment to maintain the cap may be terminated only with the approval of the Board of Trustees. Without this cap, the Fund’s returns would have been lower. The expense ratio paid by an investor is the net expense ratio (the total annual fund operating expenses after fee waivers) as stated in the prospectuses. |
| 4 | Historical performance shown for the Institutional Class shares prior to their inception reflects the performance of the Administrator Class shares, and includes the higher expenses applicable to the Administrator Class shares. If these expenses had not been included, returns for the Institutional Class shares would be higher. |
| 5 | The S&P Developed SmallCap Index is a free-float-adjusted market-capitalization-weighted index designed to measure the equity market performance of small-capitalization companies located in developed markets. The index is composed of companies within the bottom 15% of the cumulative market capitalization in developed markets. The index covers all publicly listed equities with float-adjusted market values of U.S. $100 million or more and annual dollar value traded of at least U.S. $50 million in all included countries. You cannot invest directly in an index. |
| 6 | The ten largest holdings, excluding cash, cash equivalents and any money market funds, are calculated based on the value of the investments divided by total net assets of the Fund. Holdings are subject to change and may have changed since the date specified. |
| 7 | Amounts are calculated based on the total long-term investments of the Fund. These amounts are subject to change and may have changed since the date specified. |
Wells Fargo Global Small Cap Fund | 5
Fund expenses (unaudited)
As a shareholder of the Fund, you incur two types of costs: (1) transaction costs, including sales charges (loads) on purchase payments and contingent deferred sales charges (if any) on redemptions and (2) ongoing costs, including management fees, distribution(12b-1) and/or shareholder servicing fees, and other Fund expenses. This example is intended to help you understand your ongoing costs (in dollars) of investing in the Fund and to compare these costs with the ongoing costs of investing in other mutual funds.
The example is based on an investment of $1,000 invested at the beginning of thesix-month period and held for the entire period from November 1, 2019 to April 30, 2020.
Actual expenses
The “Actual” line of the table below provides information about actual account values and actual expenses. You may use the information in this line, together with the amount you invested, to estimate the expenses that you paid over the period. Simply divide your account value by $1,000 (for example, an $8,600 account value divided by $1,000 = 8.6), then multiply the result by the number in the “Actual” line under the heading entitled “Expenses paid during period” for your applicable class of shares to estimate the expenses you paid on your account during this period.
Hypothetical example for comparison purposes
The “Hypothetical” line of the table below provides information about hypothetical account values and hypothetical expenses based on the Fund’s actual expense ratio and an assumed rate of return of 5% per year before expenses, which is not the Fund’s actual return. The hypothetical account values and expenses may not be used to estimate the actual ending account balance or expenses you paid for the period. You may use this information to compare the ongoing costs of investing in the Fund and other funds. To do so, compare this 5% hypothetical example with the 5% hypothetical examples that appear in the shareholder reports of the other funds.
Please note that the expenses shown in the table are meant to highlight your ongoing costs only and do not reflect any transactional costs, such as sales charges (loads) and contingent deferred sales charges. Therefore, the “Hypothetical” line of the table is useful in comparing ongoing costs only and will not help you determine the relative total costs of owning different funds. In addition, if these transactional costs were included, your costs would have been higher.
| | | | | | | | | | | | | | | | |
| | | Beginning
account value
11-1-2019 | | | Ending
account value
4-30-2020 | | | Expenses
paid during
the period¹ | | | Annualized net
expense ratio | |
| | | | | |
Class A | | | | | | | | | | | | | | | | |
| | | | |
Actual | | $ | 1,000.00 | | | $ | 864.03 | | | $ | 7.14 | | | | 1.54 | % |
| | | | |
Hypothetical (5% return before expenses) | | $ | 1,000.00 | | | $ | 1,017.21 | | | $ | 7.72 | | | | 1.54 | % |
| | | | | |
Class C | | | | | | | | | | | | | | | | |
| | | | |
Actual | | $ | 1,000.00 | | | $ | 860.79 | | | $ | 10.59 | | | | 2.29 | % |
| | | | |
Hypothetical (5% return before expenses) | | $ | 1,000.00 | | | $ | 1,013.48 | | | $ | 11.46 | | | | 2.29 | % |
| | | | | |
Administrator Class | | | | | | | | | | | | | | | | |
| | | | |
Actual | | $ | 1,000.00 | | | $ | 864.53 | | | $ | 6.49 | | | | 1.40 | % |
| | | | |
Hypothetical (5% return before expenses) | | $ | 1,000.00 | | | $ | 1,017.90 | | | $ | 7.02 | | | | 1.40 | % |
| | | | | |
Institutional Class | | | | | | | | | | | | | | | | |
| | | | |
Actual | | $ | 1,000.00 | | | $ | 865.57 | | | $ | 5.33 | | | | 1.15 | % |
| | | | |
Hypothetical (5% return before expenses) | | $ | 1,000.00 | | | $ | 1,019.14 | | | $ | 5.77 | | | | 1.15 | % |
| 1 | Expenses paid is equal to the annualized net expense ratio of each class multiplied by the average account value over the period, multiplied by the number of days in the most recent fiscal half-year divided by the number of days in the fiscal year (to reflect theone-half-year period). |
6 | Wells Fargo Global Small Cap Fund
Portfolio of investments—April 30, 2020 (unaudited)
| | | | | | | | | | | | | | | | |
| | | | | | | | | Shares | | | Value | |
| Common Stocks: 99.23% | |
|
| Australia: 3.01% | |
Ansell Limited (Health Care, Health Care Equipment & Supplies) | | | | | | | | | | | 189,308 | | | $ | 3,491,254 | |
Domino’s Pizza Enterprises Limited (Consumer Discretionary, Hotels, Restaurants & Leisure) | | | | | | | | | | | 80,908 | | | | 3,027,373 | |
| |
| | | | 6,518,627 | |
| | | | | |
|
| Austria: 0.65% | |
Mayr-Melnhof Karton AG (Materials, Containers & Packaging) | | | | | | | | | | | 10,200 | | | | 1,401,253 | |
| | | | | | | | | | | | | | | | |
|
| Belgium: 1.11% | |
Barco NV (Information Technology, Electronic Equipment, Instruments & Components) | | | | | | | | | | | 14,982 | | | | 2,389,986 | |
| | | | | | | | | | | | | | | | |
|
| Bermuda: 1.49% | |
Lancashire Holdings Limited (Financials, Insurance) | | | | | | | | | | | 103,019 | | | | 794,085 | |
White Mountains Insurance Group Limited (Financials, Insurance) | | | | | | | | | | | 2,500 | | | | 2,432,500 | |
| |
| | | | 3,226,585 | |
| | | | | |
|
| Canada: 5.00% | |
BlackBerry Limited NYSE (Information Technology, Software) † | | | | | | | | | | | 307,627 | | | | 1,316,643 | |
BlackBerry Limited TSX (Information Technology, Software) † | | | | | | | | | | | 144,600 | | | | 617,065 | |
Novanta Incorporated (Information Technology, Electronic Equipment, Instruments & Components) † | | | | | | | | | | | 58,219 | | | | 5,058,649 | |
Parex Resources Incorporated (Energy, Oil, Gas & Consumable Fuels) † | | | | | | | | | | | 52,800 | | | | 578,848 | |
Primo Water Corporation (Consumer Staples, Beverages) | | | | | | | | | | | 176,935 | | | | 1,811,361 | |
Stantec Incorporated (Industrials, Professional Services) | | | | | | | | | | | 48,700 | | | | 1,435,512 | |
| |
| | | | 10,818,078 | |
| | | | | |
|
| Denmark: 0.28% | |
Scandinavian Tobacco Group (Consumer Staples, Tobacco) 144A | | | | | | | | | | | 53,208 | | | | 611,459 | |
| | | | | | | | | | | | | | | | |
|
| France: 3.15% | |
Alten SA (Information Technology, IT Services) | | | | | | | | | | | 46,959 | | | | 3,380,946 | |
M6 Métropole Télévision SA (Communication Services, Media) | | | | | | | | | | | 217,922 | | | | 2,425,654 | |
Mersen SA (Industrials, Electrical Equipment) | | | | | | | | | | | 45,092 | | | | 994,996 | |
| |
| | | | 6,801,596 | |
| | | | | |
|
| Germany: 4.02% | |
Cancom SE (Information Technology, IT Services) | | | | | | | | | | | 19,383 | | | | 986,805 | |
Gerresheimer AG (Health Care, Life Sciences Tools & Services) | | | | | | | | | | | 41,447 | | | | 3,296,250 | |
Krones AG (Industrials, Machinery) | | | | | | | | | | | 22,802 | | | | 1,373,915 | |
TAG Immobilien AG (Real Estate, Real Estate Management & Development) | | | | | | | | | | | 138,519 | | | | 3,034,075 | |
| |
| | | | 8,691,045 | |
| | | | | |
|
| Hong Kong: 1.16% | |
Sunlight REIT (Real Estate, Equity REITs) | | | | | | | | | | | 4,888,000 | | | | 2,518,122 | |
| | | | | | | | | | | | | | | | |
|
| Ireland: 0.80% | |
Irish Residential Properties REIT plc (Real Estate, Equity REITs) | | | | | | | | | | | 1,222,375 | | | | 1,725,326 | |
| | | | | | | | | | | | | | | | |
|
| Italy: 1.75% | |
De’Longhi SpA (Consumer Discretionary, Household Durables) | | | | | | | | | | | 105,834 | | | | 1,912,868 | |
Interpump Group SpA (Industrials, Machinery) | | | | | | | | | | | 64,268 | | | | 1,875,231 | |
| |
| | | | 3,788,099 | |
| | | | | |
|
| Japan: 12.60% | |
Aeon Delight Company Limited (Industrials, Commercial Services & Supplies) | | | | | | | | | | | 97,100 | | | | 2,780,959 | |
Daiseki Company Limited (Industrials, Commercial Services & Supplies) | | | | | | | | | | | 103,300 | | | | 2,282,156 | |
The accompanying notes are an integral part of these financial statements.
Wells Fargo Global Small Cap Fund | 7
Portfolio of investments—April 30, 2020 (unaudited)
| | | | | | | | | | | | | | | | |
| | | | | | | | | Shares | | | Value | |
|
| Japan (continued) | |
DTS Corporation (Information Technology, IT Services) | | | | | | | | | | | 138,300 | | | $ | 2,650,639 | |
Fuji Seal International Incorporated (Materials, Containers & Packaging) | | | | | | | | | | | 103,500 | | | | 1,796,651 | |
Horiba Limited (Information Technology, Electronic Equipment, Instruments & Components) | | | | | | | | | | | 28,600 | | | | 1,513,325 | |
Kyushu Railway Company (Industrials, Road & Rail) | | | | | | | | | | | 40,700 | | | | 1,094,957 | |
Meitec Corporation (Industrials, Professional Services) | | | | | | | | | | | 62,700 | | | | 2,768,469 | |
Nihon Parkerizing Company Limited (Materials, Chemicals) | | | | | | | | | | | 276,200 | | | | 2,826,466 | |
ORIX JREIT Incorporated (Real Estate, Equity REITs) | | | | | | | | | | | 2,273 | | | | 2,717,350 | |
Paramount Bed Holdings Company Limited (Health Care, Health Care Equipment & Supplies) | | | | | | | | | | | 43,200 | | | | 1,782,163 | |
San-A Company Limited (Consumer Staples, Food & Staples Retailing) | | | | | | | | | | | 33,100 | | | | 1,333,474 | |
Sumitomo Warehouse Company Limited (Industrials, Transportation Infrastructure) | | | | | | | | | | | 196,600 | | | | 2,244,141 | |
Taikisha Limited (Industrials, Construction & Engineering) | | | | | | | | | | | 49,900 | | | | 1,453,253 | |
| |
| | | | 27,244,003 | |
| | | | | |
|
| Luxembourg: 0.15% | |
Stabilus SA (Industrials, Machinery) | | | | | | | | | | | 7,496 | | | | 320,858 | |
| | | | | | | | | | | | | | | | |
|
| Netherlands: 1.03% | |
Brunel International NV (Industrials, Professional Services) | | | | | | | | | | | 101,593 | | | | 641,265 | |
IMCD Group NV (Industrials, Trading Companies & Distributors) | | | | | | | | | | | 12,581 | | | | 1,110,953 | |
TKH Group NV (Industrials, Electrical Equipment) | | | | | | | | | | | 13,514 | | | | 474,119 | |
| |
| | | | 2,226,337 | |
| | | | | |
|
| Norway: 0.34% | |
Atea ASA (Information Technology, IT Services) | | | | | | | | | | | 84,287 | | | | 737,873 | |
| | | | | | | | | | | | | | | | |
|
| Singapore: 0.36% | |
CapitaLand Commercial Trust Limited (Real Estate, Equity REITs) | | | | | | | | | | | 685,100 | | | | 778,510 | |
| | | | | | | | | | | | | | | | |
|
| Spain: 2.18% | |
Vidrala SA (Materials, Containers & Packaging) | | | | | | | | | | | 14,716 | | | | 1,318,268 | |
Viscofan SA (Consumer Staples, Food Products) | | | | | | | | | | | 53,042 | | | | 3,399,367 | |
| |
| | | | 4,717,635 | |
| | | | | |
|
| Sweden: 0.97% | |
AAK AB (Consumer Staples, Food Products) | | | | | | | | | | | 72,580 | | | | 1,185,511 | |
Hexpol AB (Materials, Chemicals) | | | | | | | | | | | 127,715 | | | | 917,535 | |
| |
| | | | 2,103,046 | |
| | | | | |
|
| Switzerland: 2.02% | |
Bossard Holding AG (Industrials, Trading Companies & Distributors) | | | | | | | | | | | 13,402 | | | | 1,671,534 | |
Bucher Industries AG (Industrials, Machinery) | | | | | | | | | | | 4,847 | | | | 1,367,024 | |
OC Oerlikon Corporation AG (Industrials, Machinery) | | | | | | | | | | | 176,181 | | | | 1,323,126 | |
| |
| | | | 4,361,684 | |
| | | | | |
|
| United Kingdom: 9.51% | |
Britvic plc (Consumer Staples, Beverages) | | | | | | | | | | | 304,286 | | | | 2,800,867 | |
Domino’s Pizza Group plc (Consumer Discretionary, Hotels, Restaurants & Leisure) | | | | | | | | | | | 679,433 | | | | 2,944,245 | |
Elementis plc (Materials, Chemicals) | | | | | | | | | | | 709,883 | | | | 625,868 | |
Mears Group plc (Industrials, Commercial Services & Supplies) | | | | | | | | | | | 169,951 | | | | 351,929 | |
Morgan Advanced Materials plc (Industrials, Machinery) | | | | | | | | | | | 323,416 | | | | 892,149 | |
NCC Group plc (Information Technology, IT Services) | | | | | | | | | | | 425,005 | | | | 877,990 | |
Nomad Foods Limited (Consumer Staples, Food Products) † | | | | | | | | | | | 288,872 | | | | 5,953,652 | |
S4 Capital plc (Communication Services, Media) † | | | | | | | | | | | 613,241 | | | | 1,398,002 | |
Spectris plc (Information Technology, Electronic Equipment, Instruments & Components) | | | | | | | | | | | 101,635 | | | | 3,427,202 | |
Tate & Lyle plc (Consumer Staples, Food Products) | | | | | | | | | | | 143,851 | | | | 1,288,957 | |
| |
| | | | 20,560,861 | |
| | | | | |
The accompanying notes are an integral part of these financial statements.
8 | Wells Fargo Global Small Cap Fund
Portfolio of investments—April 30, 2020 (unaudited)
| | | | | | | | | | | | | | | | |
| | | | | | | | | Shares | | | Value | |
| United States: 47.65% | |
ACI Worldwide Incorporated (Information Technology, Software) † | | | | | | | | | | | 164,300 | | | $ | 4,501,820 | |
Agree Realty Corporation (Real Estate, Equity REITs) | | | | | | | | | | | 19,700 | | | | 1,282,667 | |
Balchem Corporation (Materials, Chemicals) | | | | | | | | | | | 32,700 | | | | 2,918,148 | |
Blackbaud Incorporated (Information Technology, Software) | | | | | | | | | | | 35,100 | | | | 1,939,626 | |
BMC Stock Holdings Incorporated (Industrials, Trading Companies & Distributors) † | | | | | | | | | | | 25,200 | | | | 535,500 | |
Bottomline Technologies (DE) Incorporated (Information Technology, Software) † | | | | | | | | | | | 52,700 | | | | 2,193,901 | |
CBIZ Incorporated (Industrials, Professional Services) † | | | | | | | | | | | 229,539 | | | | 5,451,551 | |
Central Garden & Pet Company Class A (Consumer Staples, Household Products) † | | | | | | | | | | | 157,946 | | | | 4,803,138 | |
CorVel Corporation (Health Care, Health Care Providers & Services) † | | | | | | | | | | | 63,300 | | | | 3,335,277 | |
CSW Industrials Incorporated (Industrials, Building Products) | | | | | | | | | | | 77,062 | | | | 5,104,587 | |
CyberArk Software Limited (Information Technology, Software) † | | | | | | | | | | | 43,000 | | | | 4,246,680 | |
Denny’s Corporation (Consumer Discretionary, Hotels, Restaurants & Leisure) † | | | | | | | | | | | 399,037 | | | | 4,497,147 | |
Euronet Worldwide Incorporated (Information Technology, IT Services) † | | | | | | | | | | | 15,300 | | | | 1,403,928 | |
Forward Air Corporation (Industrials, Air Freight & Logistics) | | | | | | | | | | | 36,500 | | | | 1,883,400 | |
Gibraltar Industries Incorporated (Industrials, Building Products) † | | | | | | | | | | | 86,800 | | | | 4,018,840 | |
Globus Medical Incorporated Class A (Health Care, Health Care Equipment & Supplies) † | | | | | | | | | | | 36,000 | | | | 1,708,560 | |
Healthcare Services Group Incorporated (Industrials, Commercial Services & Supplies) | | | | | | | | | | | 157,300 | | | | 4,009,577 | |
HMS Holdings Corporation (Health Care, Health Care Technology) † | | | | | | | | | | | 47,800 | | | | 1,370,665 | |
Hostess Brands Incorporated (Consumer Staples, Food Products) † | | | | | | | | | | | 391,600 | | | | 4,707,032 | |
ICU Medical Incorporated (Health Care, Health Care Equipment & Supplies) † | | | | | | | | | | | 13,600 | | | | 2,982,616 | |
Ingevity Corporation (Materials, Chemicals) † | | | | | | | | | | | 26,900 | | | | 1,396,648 | |
Innospec Incorporated (Materials, Chemicals) | | | | | | | | | | | 72,671 | | | | 5,270,101 | |
Mayville Engineering Company Incorporated (Industrials, Machinery) † | | | | | | | | | | | 461,000 | | | | 2,406,420 | |
MGE Energy Incorporated (Utilities, Electric Utilities) | | | | | | | | | | | 77,292 | | | | 4,997,701 | |
Movado Group Incorporated (Consumer Discretionary, Textiles, Apparel & Luxury Goods) | | | | | | | | | | | 37,659 | | | | 388,264 | |
Natus Medical Incorporated (Health Care, Health Care Equipment & Supplies) † | | | | | | | | | | | 172,300 | | | | 4,305,777 | |
Neogen Corporation (Health Care, Health Care Equipment & Supplies) † | | | | | | | | | | | 36,200 | | | | 2,265,758 | |
Progress Software Corporation (Information Technology, Software) | | | | | | | | | | | 36,600 | | | | 1,497,306 | |
Retail Value Incorporated (Real Estate, Equity REITs) | | | | | | | | | | | 133,059 | | | | 1,925,364 | |
Standex International Corporation (Industrials, Machinery) | | | | | | | | | | | 33,251 | | | | 1,657,230 | |
Stepan Company (Materials, Chemicals) | | | | | | | | | | | 52,500 | | | | 5,008,500 | |
The Brink’s Company (Industrials, Commercial Services & Supplies) | | | | | | | | | | | 22,300 | | | | 1,139,976 | |
Virtusa Corporation (Information Technology, IT Services) † | | | | | | | | | | | 110,419 | | | | 3,643,827 | |
WD-40 Company (Consumer Staples, Household Products) | | | | | | | | | | | 24,400 | | | | 4,252,432 | |
| |
| | | | 103,049,964 | |
| | | | | |
| |
Total Common Stocks (Cost $214,785,555) | | | | 214,590,947 | |
| | | | | |
| | | | |
| | | | | | | | | | | | | | | | |
| | | Yield | | | | | | | | | | |
| Short-Term Investments: 1.31% | |
|
| Investment Companies: 1.31% | |
Wells Fargo Government Money Market Fund Select Class (l)(u) | | | 0.19 | % | | | | | | | 2,836,011 | | | | 2,836,011 | |
| | | | | | | | | | | | | | | | |
| |
Total Short-Term Investments (Cost $2,836,011) | | | | 2,836,011 | |
| | | | | |
| | | | | | | | |
| Total investments in securities (Cost $217,621,566) | | | 100.54 | % | | | 217,426,958 | |
| | |
Other assets and liabilities, net | | | (0.54 | ) | | | (1,176,318 | ) |
| | | | | | | | |
| Total net assets | | | 100.00 | % | | $ | 216,250,640 | |
| | | | | | | | |
| † | Non-income-earning security |
| 144A | The security may be resold in transactions exempt from registration, normally to qualified institutional buyers, pursuant to Rule 144A under the Securities Act of 1933. |
| (l) | The issuer of the security is an affiliated person of the Fund as defined in the Investment Company Act of 1940. |
| (u) | The rate represents the7-day annualized yield at period end. |
The accompanying notes are an integral part of these financial statements.
Wells Fargo Global Small Cap Fund | 9
Portfolio of investments—April 30, 2020 (unaudited)
Abbreviations:
| REIT | Real estate investment trust |
Investments in Affiliates
An affiliated investment is an investment in which the Fund owns at least 5% of the outstanding voting shares of the issuer or as a result of other relationships, such as the Fund and the issuer having the same investment manager. Transactions with issuers that were either affiliated persons of the Fund at the beginning of the period or the end of the period were as follows:
| | | | | | | | | | | | | | | | | | | | | | | | | | | | | | | | | | | | |
| | | Shares,
beginning of
period | | | Shares
purchased | | | Shares
sold | | | Shares,
end of
period | | | Net
realized
gains
(losses) | | | Net
change in
unrealized
gains
(losses) | | | Income
from
affiliated
securities | | | Value,
end of
period | | | % of
net
assets | |
| | | | | | | | | |
| Short-Term Invesstments | | | | | | | | | | | | | | | | | | | | | | | | | | | |
Investment Companies | | | | | | | | | | | | | | | | | | | | | | | | | | | | | | | | | | | | |
Securities Lending Cash Investments LLC * | | | 9,479,729 | | | | 38,788,081 | | | | (48,267,810 | ) | | | 0 | | | $ | (277 | ) | | $ | 155 | | | $ | 52,095 | # | | $ | 0 | | | | | |
Wells Fargo Government Money Market Fund Select Class | | | 14,798,744 | | | | 46,962,630 | | | | (58,925,363 | ) | | | 2,836,011 | | | | 0 | | | | 0 | | | | 71,050 | | | | 2,836,011 | | | | | |
| | | | | | | | | | | | | | | | | | | | | | | | | | | | | | | | | | | | |
| | | | | | | | | | | | | | | | | | $ | (277 | ) | | $ | 155 | | | $ | 123,145 | | | $ | 2,836,011 | | | | 1.31 | % |
| | | | | | | | | | | | | | | | | | | | | | | | | | | | | | | | | | | | |
| * | No longer held at the end of the period |
| # | Amount shown represents income before fees and rebates. |
The accompanying notes are an integral part of these financial statements.
10 | Wells Fargo Global Small Cap Fund
Statement of assets and liabilities—April 30, 2020 (unaudited)
| | | | |
| | | | |
| |
Assets | | | | |
Investments in unaffiliated securities, at value (cost $214,785,555) | | $ | 214,590,947 | |
Investments in affiliated securities, at value (cost $2,836,011) | | | 2,836,011 | |
Foreign currency, at value (cost $86,180) | | | 87,144 | |
Receivable for investments sold | | | 2,064,411 | |
Receivable for Fund shares sold | | | 111,552 | |
Receivable for dividends | | | 548,504 | |
Receivable for securities lending income, net | | | 45 | |
Prepaid expenses and other assets | | | 10,705 | |
| | | | |
Total assets | | | 220,249,319 | |
| | | | |
| |
Liabilities | | | | |
Payable for investments purchased | | | 3,363,171 | |
Payable for Fund shares redeemed | | | 269,009 | |
Management fee payable | | | 148,691 | |
Administration fees payable | | | 29,050 | |
Trustees’ fees and expenses payable | | | 8,794 | |
Distribution fee payable | | | 3,503 | |
Accrued expenses and other liabilities | | | 176,461 | |
| | | | |
Total liabilities | | | 3,998,679 | |
| | | | |
Total net assets | | $ | 216,250,640 | |
| | | | |
| |
Net assets consist of | | | | |
Paid-in capital | | $ | 227,986,948 | |
Total distributable loss | | | (11,736,308 | ) |
| | | | |
Total net assets | | $ | 216,250,640 | |
| | | | |
| |
Computation of net asset value and offering price per share | | | | |
Net assets – Class A | | $ | 110,353,958 | |
Shares outstanding – Class A1 | | | 3,332,396 | |
Net asset value per share – Class A | | | $33.12 | |
Maximum offering price per share – Class A2 | | | $35.14 | |
Net assets – Class C | | $ | 6,032,415 | |
Shares outstanding – Class C1 | | | 274,330 | |
Net asset value per share – Class C | | | $21.99 | |
Net assets – Administrator Class | | $ | 20,328,041 | |
Shares outstanding – Administrator Class1 | | | 582,658 | |
Net asset value per share – Administrator Class | | | $34.89 | |
Net assets – Institutional Class | | $ | 79,536,226 | |
Shares outstanding – Institutional Class1 | | | 2,290,612 | |
Net asset value per share – Institutional Class | | | $34.72 | |
| 1 | The Fund has an unlimited number of authorized shares. |
| 2 | Maximum offering price is computed as 100/94.25 of net asset value. On investments of $50,000 or more, the offering price is reduced. |
The accompanying notes are an integral part of these financial statements.
Wells Fargo Global Small Cap Fund | 11
Statement of operations—six months ended April 30, 2020 (unaudited)
| | | | |
| | | | |
| |
Investment income | | | | |
Dividends (net of foreign withholding taxes of $148,328) | | $ | 1,855,161 | |
Income from affiliated securities | | | 94,740 | |
| | | | |
Total investment income | | | 1,949,901 | |
| | | | |
| |
Expenses | | | | |
Management fee | | | 1,224,356 | |
Administration fees | |
Class A | | | 137,492 | |
Class C | | | 7,295 | |
Administrator Class | | | 15,150 | |
Institutional Class | | | 62,764 | |
Shareholder servicing fees | |
Class A | | | 163,675 | |
Class C | | | 8,684 | |
Administrator Class | | | 29,112 | |
Distribution fee | |
Class C | | | 26,006 | |
Custody and accounting fees | | | 55,148 | |
Professional fees | | | 25,971 | |
Registration fees | | | 43,169 | |
Shareholder report expenses | | | 27,378 | |
Trustees’ fees and expenses | | | 10,969 | |
Other fees and expenses | | | 12,403 | |
| | | | |
Total expenses | | | 1,849,572 | |
Less: Fee waivers and/or expense reimbursements | |
Fund-level | | | (17,591 | ) |
Administrator Class | | | (6,054 | ) |
Institutional Class | | | (22,864 | ) |
| | | | |
Net expenses | | | 1,803,063 | |
| | | | |
Net investment income | | | 146,838 | |
| | | | |
| |
Realized and unrealized gains (losses) on investments | | | | |
Net realized losses on | |
Unaffiliated securities | | | (7,572,626 | ) |
Affiliated securities | | | (277 | ) |
| | | | |
Net realized losses on investments | | | (7,572,903 | ) |
| | | | |
|
Net change in unrealized gains (losses) on | |
Unaffiliated securities | | | (28,957,678 | ) |
Affiliated securities | | | 155 | |
| | | | |
Net change in unrealized gains on investments | | | (28,957,523 | ) |
| | | | |
Net realized and unrealized gains (losses) on investments | | | (36,530,426 | ) |
| | | | |
Net decrease in net assets resulting from operations | | $ | (36,383,588 | ) |
| | | | |
The accompanying notes are an integral part of these financial statements.
12 | Wells Fargo Global Small Cap Fund
Statement of changes in net assets
| | | | | | | | | | | | | | | | |
| | | Six months ended
April 30, 2020 (unaudited) | | | Year ended
October 31, 2019 | |
| | | | |
Operations | | | | | | | | | | | | | | | | |
Net investment income | | | | | | $ | 146,838 | | | | | | | $ | 1,734,804 | |
Net realized gains (losses) on investments | | | | | | | (7,572,903 | ) | | | | | | | 8,227,354 | |
Net change in unrealized gains (losses) on investments | | | | | | | (28,957,523 | ) | | | | | | | 16,847,695 | |
| | | | |
Net increase (decrease) in net assets resulting from operations | | | | | | | (36,383,588 | ) | | | | | | | 26,809,853 | |
| | | | |
| | | | |
Distributions to shareholders from net investment income and net realized gains | | | | | | | | | | | | | | | | |
Class A | | | | | | | (6,017,486 | ) | | | | | | | (11,274,268 | ) |
Class C | | | | | | | (322,666 | ) | | | | | | | (3,147,113 | ) |
Administrator Class | | | | | | | (1,051,538 | ) | | | | | | | (2,341,670 | ) |
Institutional Class | | | | | | | (4,699,341 | ) | | | | | | | (9,652,016 | ) |
| | | | |
Total distributions to shareholders | | | | | | | (12,091,031 | ) | | | | | | | (26,415,067 | ) |
| | | | |
| | | | |
Capital share transactions | | | Shares | | | | | | | | Shares | | | | | |
Proceeds from shares sold | | | | | | | | | | | | | | | | |
Class A | | | 61,902 | | | | 2,283,902 | | | | 576,819 | | | | 21,721,631 | |
Class C | | | 31,364 | | | | 823,406 | | | | 51,591 | | | | 1,282,247 | |
Administrator Class | | | 48,668 | | | | 1,837,131 | | | | 84,145 | | | | 3,339,231 | |
Institutional Class | | | 213,487 | | | | 8,092,635 | | | | 582,827 | | | | 22,915,443 | |
| | | | |
| | | | | | | 13,037,074 | | | | | | | | 49,258,552 | |
| | | | |
Reinvestment of distributions | | | | | | | | | | | | | | | | |
Class A | | | 138,110 | | | | 5,585,707 | | | | 292,824 | | | | 10,332,358 | |
Class C | | | 11,409 | | | | 301,552 | | | | 129,340 | | | | 3,066,652 | |
Administrator Class | | | 24,314 | | | | 1,036,689 | | | | 62,335 | | | | 2,314,119 | |
Institutional Class | | | 107,830 | | | | 4,582,469 | | | | 244,000 | | | | 9,022,788 | |
| | | | |
| | | | | | | 11,506,417 | | | | | | | | 24,735,917 | |
| | | | |
Payment for shares redeemed | | | | | | | | | | | | | | | | |
Class A | | | (405,304 | ) | | | (14,545,652 | ) | | | (657,034 | ) | | | (25,025,424 | ) |
Class C | | | (52,060 | ) | | | (1,313,577 | ) | | | (831,182 | ) | | | (20,927,562 | ) |
Administrator Class | | | (78,745 | ) | | | (3,012,976 | ) | | | (225,448 | ) | | | (9,166,433 | ) |
Institutional Class | | | (511,923 | ) | | | (18,658,460 | ) | | | (1,183,246 | ) | | | (47,220,970 | ) |
| | | | |
| | | | | | | (37,530,665 | ) | | | | | | | (102,340,389 | ) |
| | | | |
Net decrease in net assets resulting from capital share transactions | | | | | | | (12,987,174 | ) | | | | | | | (28,345,920 | ) |
| | | | |
Total decrease in net assets | | | | | | | (61,461,793 | ) | | | | | | | (27,951,134 | ) |
| | | | |
| | | | |
Net assets | | | | | | | | | | | | | | | | |
Beginning of period | | | | | | | 277,712,433 | | | | | | | | 305,663,567 | |
| | | | |
End of period | | | | | | $ | 216,250,640 | | | | | | | $ | 277,712,433 | |
| | | | |
The accompanying notes are an integral part of these financial statements.
Wells Fargo Global Small Cap Fund | 13
Financial highlights
(For a share outstanding throughout each period)
| | | | | | | | | | | | | | | | | | | | | | | | |
| | | Six months ended
April 30, 2020
(unaudited) | | | Year ended October 31 | |
| CLASS A | | 2019 | | | 2018 | | | 2017 | | | 2016 | | | 2015 | |
Net asset value, beginning of period | | | $39.97 | | | | $39.97 | | | | $45.81 | | | | $38.61 | | | | $37.23 | | | | $43.26 | |
Net investment income (loss) | | | (0.00 | )1,2 | | | 0.18 | 1 | | | 0.10 | | | | 0.21 | 1 | | | 0.26 | 1 | | | 0.10 | 1 |
Net realized and unrealized gains (losses) on investments | | | (5.14 | ) | | | 3.26 | | | | (0.72 | ) | | | 9.68 | | | | 2.92 | | | | 0.64 | |
| | | | | | | | | | | | | | | | | | | | | | | | |
Total from investment operations | | | (5.14 | ) | | | 3.44 | | | | (0.62 | ) | | | 9.89 | | | | 3.18 | | | | 0.74 | |
Distributions to shareholders from | | | | | | | | | | | | | | | | | | | | | | | | |
Net investment income | | | (0.54 | ) | | | (0.03 | ) | | | (0.22 | ) | | | (0.34 | ) | | | (0.21 | ) | | | (0.03 | ) |
Net realized gains | | | (1.17 | ) | | | (3.41 | ) | | | (5.00 | ) | | | (2.35 | ) | | | (1.59 | ) | | | (6.74 | ) |
| | | | | | | | | | | | | | | | | | | | | | | | |
Total distributions to shareholders | | | (1.71 | ) | | | (3.44 | ) | | | (5.22 | ) | | | (2.69 | ) | | | (1.80 | ) | | | (6.77 | ) |
Net asset value, end of period | | | $33.12 | | | | $39.97 | | | | $39.97 | | | | $45.81 | | | | $38.61 | | | | $37.23 | |
Total return3 | | | (13.60 | )% | | | 9.75 | % | | | (1.82 | )% | | | 26.90 | % | | | 9.12 | % | | | 2.12 | % |
Ratios to average net assets (annualized) | | | | | | | | | | | | | | | | | | | | | | | | |
Gross expenses | | | 1.55 | % | | | 1.53 | % | | | 1.54 | % | | | 1.54 | % | | | 1.55 | % | | | 1.57 | % |
Net expenses | | | 1.54 | % | | | 1.53 | % | | | 1.54 | % | | | 1.54 | % | | | 1.55 | % | | | 1.55 | % |
Net investment income (loss) | | | (0.02 | )% | | | 0.47 | % | | | 0.16 | % | | | 0.52 | % | | | 0.73 | % | | | 0.27 | % |
Supplemental data | | | | | | | | | | | | | | | | | | | | | | | | |
Portfolio turnover rate | | | 32 | % | | | 62 | % | | | 51 | % | | | 70 | % | | | 70 | % | | | 42 | % |
Net assets, end of period (000s omitted) | | | $110,354 | | | | $141,388 | | | | $132,906 | | | | $155,828 | | | | $138,805 | | | | $151,740 | |
| 1 | Calculated based upon average shares outstanding |
| 2 | Amount is less than $0.005. |
| 3 | Total return calculations do not include any sales charges. Returns for periods of less than one year are not annualized. |
The accompanying notes are an integral part of these financial statements.
14 | Wells Fargo Global Small Cap Fund
Financial highlights
(For a share outstanding throughout each period)
| | | | | | | | | | | | | | | | | | | | | | | | |
| | | Six months ended
April 30, 2020
(unaudited) | | | Year ended October 31 | |
| CLASS C | | 2019 | | | 2018 | | | 2017 | | | 2016 | | | 2015 | |
Net asset value, beginning of period | | | $26.68 | | | | $28.02 | | | | $33.65 | | | | $28.98 | | | | $28.39 | | | | $34.80 | |
Net investment loss | | | (0.09 | )1 | | | (0.07 | )1 | | | (0.20 | ) | | | (0.06 | )1 | | | (0.01 | )1 | | | (0.14 | )1 |
Net realized and unrealized gains (losses) on investments | | | (3.43 | ) | | | 2.14 | | | | (0.43 | ) | | | 7.15 | | | | 2.19 | | | | 0.47 | |
| | | | | | | | | | | | | | | | | | | | | | | | |
Total from investment operations | | | (3.52 | ) | | | 2.07 | | | | (0.63 | ) | | | 7.09 | | | | 2.18 | | | | 0.33 | |
Distributions to shareholders from | | | | | | | | | | | | | | | | | | | | | | | | |
Net investment income | | | 0.00 | | | | 0.00 | | | | 0.00 | | | | (0.07 | ) | | | 0.00 | | | | 0.00 | |
Net realized gains | | | (1.17 | ) | | | (3.41 | ) | | | (5.00 | ) | | | (2.35 | ) | | | (1.59 | ) | | | (6.74 | ) |
| | | | | | | | | | | | | | | | | | | | | | | | |
Total distributions to shareholders | | | (1.17 | ) | | | (3.41 | ) | | | (5.00 | ) | | | (2.42 | ) | | | (1.59 | ) | | | (6.74 | ) |
Net asset value, end of period | | | $21.99 | | | | $26.68 | | | | $28.02 | | | | $33.65 | | | | $28.98 | | | | $28.39 | |
Total return2 | | | (13.92 | )% | | | 8.90 | % | | | (2.56 | )% | | | 25.95 | % | | | 8.31 | % | | | 1.34 | % |
Ratios to average net assets (annualized) | | | | | | | | | | | | | | | | | | | | | | | | |
Gross expenses | | | 2.30 | % | | | 2.28 | % | | | 2.29 | % | | | 2.29 | % | | | 2.30 | % | | | 2.32 | % |
Net expenses | | | 2.29 | % | | | 2.28 | % | | | 2.29 | % | | | 2.29 | % | | | 2.30 | % | | | 2.30 | % |
Net investment loss | | | (0.75 | )% | | | (0.26 | )% | | | (0.59 | )% | | | (0.20 | )% | | | (0.02 | )% | | | (0.48 | )% |
Supplemental data | | | | | | | | | | | | | | | | | | | | | | | | |
Portfolio turnover rate | | | 32 | % | | | 62 | % | | | 51 | % | | | 70 | % | | | 70 | % | | | 42 | % |
Net assets, end of period (000s omitted) | | | $6,032 | | | | $7,567 | | | | $26,167 | | | | $31,487 | | | | $32,863 | | | | $36,215 | |
| 1 | Calculated based upon average shares outstanding |
| 2 | Total return calculations do not include any sales charges. Returns for periods of less than one year are not annualized. |
The accompanying notes are an integral part of these financial statements.
Wells Fargo Global Small Cap Fund | 15
Financial highlights
(For a share outstanding throughout each period)
| | | | | | | | | | | | | | | | | | | | | | | | |
| | | Six months ended
April 30, 2020
(unaudited) | | | Year ended October 31 | |
| ADMINISTRATOR CLASS | | 2019 | | | 2018 | | | 2017 | | | 2016 | | | 2015 | |
Net asset value, beginning of period | | | $42.06 | | | | $41.90 | | | | $47.78 | | | | $40.15 | | | | $38.65 | | | | $44.60 | |
Net investment income | | | 0.03 | | | | 0.25 | 1 | | | 0.14 | 1 | | | 0.29 | 1 | | | 0.41 | | | | 0.16 | 1 |
Net realized and unrealized gains (losses) on investments | | | (5.42 | ) | | | 3.42 | | | | (0.73 | ) | | | 10.07 | | | | 2.95 | | | | 0.66 | |
| | | | | | | | | | | | | | | | | | | | | | | | |
Total from investment operations | | | (5.39 | ) | | | 3.67 | | | | (0.59 | ) | | | 10.36 | | | | 3.36 | | | | 0.82 | |
Distributions to shareholders from | | | | | | | | | | | | | | | | | | | | | | | | |
Net investment income | | | (0.61 | ) | | | (0.10 | ) | | | (0.29 | ) | | | (0.38 | ) | | | (0.27 | ) | | | (0.03 | ) |
Net realized gains | | | (1.17 | ) | | | (3.41 | ) | | | (5.00 | ) | | | (2.35 | ) | | | (1.59 | ) | | | (6.74 | ) |
| | | | | | | | | | | | | | | | | | | | | | | | |
Total distributions to shareholders | | | (1.78 | ) | | | (3.51 | ) | | | (5.29 | ) | | | (2.73 | ) | | | (1.86 | ) | | | (6.77 | ) |
Net asset value, end of period | | | $34.89 | | | | $42.06 | | | | $41.90 | | | | $47.78 | | | | $40.15 | | | | $38.65 | |
Total return2 | | | (13.55 | )% | | | 9.90 | % | | | (1.68 | )% | | | 27.04 | % | | | 9.30 | % | | | 2.27 | % |
Ratios to average net assets (annualized) | | | | | | | | | | | | | | | | | | | | | | | | |
Gross expenses | | | 1.47 | % | | | 1.45 | % | | | 1.46 | % | | | 1.46 | % | | | 1.47 | % | | | 1.43 | % |
Net expenses | | | 1.40 | % | | | 1.40 | % | | | 1.40 | % | | | 1.40 | % | | | 1.40 | % | | | 1.40 | % |
Net investment income | | | 0.12 | % | | | 0.63 | % | | | 0.30 | % | | | 0.68 | % | | | 0.90 | % | | | 0.41 | % |
Supplemental data | | | | | | | | | | | | | | | | | | | | | | | | |
Portfolio turnover rate | | | 32 | % | | | 62 | % | | | 51 | % | | | 70 | % | | | 70 | % | | | 42 | % |
Net assets, end of period (000s omitted) | | | $20,328 | | | | $24,746 | | | | $27,965 | | | | $30,327 | | | | $30,832 | | | | $31,765 | |
| 1 | Calculated based upon average shares outstanding |
| 2 | Returns for periods of less than one year are not annualized. |
The accompanying notes are an integral part of these financial statements.
16 | Wells Fargo Global Small Cap Fund
Financial highlights
(For a share outstanding throughout each period)
| | | | | | | | | | | | | | | | | | | | | | | | |
| | | Six months ended
April 30, 2020
(unaudited) | | | Year ended October 31 | |
| INSTITUTIONAL CLASS | | 2019 | | | 2018 | | | 2017 | | | 2016 | | | 2015 | |
Net asset value, beginning of period | | | $41.92 | | | | $41.80 | | | | $47.68 | | | | $40.08 | | | | $38.63 | | | | $44.67 | |
Net investment income | | | 0.06 | | | | 0.36 | | | | 0.25 | | | | 0.38 | | | | 0.45 | | | | 0.20 | |
Net realized and unrealized gains (losses) on investments | | | (5.37 | ) | | | 3.39 | | | | (0.74 | ) | | | 10.06 | | | | 3.00 | | | | 0.72 | |
| | | | | | | | | | | | | | | | | | | | | | | | |
Total from investment operations | | | (5.31 | ) | | | 3.75 | | | | (0.49 | ) | | | 10.44 | | | | 3.45 | | | | 0.92 | |
Distributions to shareholders from | | | | | | | | | | | | | | | | | | | | | | | | |
Net investment income | | | (0.72 | ) | | | (0.22 | ) | | | (0.39 | ) | | | (0.49 | ) | | | (0.41 | ) | | | (0.22 | ) |
Net realized gains | | | (1.17 | ) | | | (3.41 | ) | | | (5.00 | ) | | | (2.35 | ) | | | (1.59 | ) | | | (6.74 | ) |
| | | | | | | | | | | | | | | | | | | | | | | | |
Total distributions to shareholders | | | (1.89 | ) | | | (3.63 | ) | | | (5.39 | ) | | | (2.84 | ) | | | (2.00 | ) | | | (6.96 | ) |
Net asset value, end of period | | | $34.72 | | | | $41.92 | | | | $41.80 | | | | $47.68 | | | | $40.08 | | | | $38.63 | |
Total return1 | | | (13.44 | )% | | | 10.17 | % | | | (1.45 | )% | | | 27.38 | % | | | 9.56 | % | | | 2.53 | % |
Ratios to average net assets (annualized) | | | | | | | | | | | | | | | | | | | | | | | | |
Gross expenses | | | 1.22 | % | | | 1.20 | % | | | 1.21 | % | | | 1.21 | % | | | 1.22 | % | | | 1.18 | % |
Net expenses | | | 1.15 | % | | | 1.15 | % | | | 1.15 | % | | | 1.15 | % | | | 1.15 | % | | | 1.15 | % |
Net investment income | | | 0.36 | % | | | 0.86 | % | | | 0.54 | % | | | 1.01 | % | | | 1.20 | % | | | 0.66 | % |
Supplemental data | | | | | | | | | | | | | | | | | | | | | | | | |
Portfolio turnover rate | | | 32 | % | | | 62 | % | | | 51 | % | | | 70 | % | | | 70 | % | | | 42 | % |
Net assets, end of period (000s omitted) | | | $79,536 | | | | $104,011 | | | | $118,625 | | | | $41,087 | | | | $12,531 | | | | $10,369 | |
| 1 | Returns for periods of less than one year are not annualized. |
The accompanying notes are an integral part of these financial statements.
Wells Fargo Global Small Cap Fund | 17
Notes to financial statements (unaudited)
1. ORGANIZATION
Wells Fargo Funds Trust (the “Trust”), a Delaware statutory trust organized on March 10, 1999, is anopen-end management investment company registered under the Investment Company Act of 1940, as amended (the “1940 Act”). As an investment company, the Trust follows the accounting and reporting guidance in Financial Accounting Standards Board (“FASB”)Accounting Standards Codification Topic 946, Financial Services – Investment Companies. These financial statements report on the Wells Fargo Global Small Cap Fund (the “Fund”) which is a diversified series of the Trust.
2. SIGNIFICANT ACCOUNTING POLICIES
The following significant accounting policies, which are consistently followed in the preparation of the financial statements of the Fund, are in conformity with U.S. generally accepted accounting principles which require management to make estimates and assumptions that affect the reported amounts of assets and liabilities, disclosure of contingent assets and liabilities at the date of the financial statements, and the reported amounts of revenues and expenses during the reporting period. Actual results could differ from those estimates.
Securities valuation
All investments are valued each business day as of the close of regular trading on the New York Stock Exchange (generally 4 p.m. Eastern Time), although the Fund may deviate from this calculation time under unusual or unexpected circumstances.
Equity securities that are listed on a foreign or domestic exchange or market are valued at the official closing price or, if none, the last sales price. If no sale occurs on the principal exchange or market that day, a fair value price will be determined in accordance with the Fund’s Valuation Procedures.
The values of securities denominated in foreign currencies are translated into U.S. dollars at rates provided by an independent foreign currency pricing source at a time each business day specified by the Wells Fargo Asset Management Pricing Committee at Wells Fargo Funds Management, LLC (“Funds Management”).
Many securities markets and exchanges outside the U.S. close prior to the close of the New York Stock Exchange and therefore may not fully reflect trading or events that occur after the close of the principal exchange in which the foreign securities are traded, but before the close of the New York Stock Exchange. If such trading or events are expected to materially affect the value of such securities, then fair value pricing procedures approved by the Board of Trustees of the Fund are applied. These procedures take into account multiple factors including movements in U.S. securities markets after foreign exchanges close. Foreign securities that are fair valued under these procedures are categorized as Level 2 and the application of these procedures may result in transfers between Level 1 and Level 2. Depending on market activity, such fair valuations may be frequent. Such fair value pricing may result in net asset values that are higher or lower than net asset values based on the last reported sales price or latest quoted bid price. On April 30, 2020, such fair value pricing was used in pricing certain foreign securities.
Investments in registeredopen-end investment companies are valued at net asset value. Interests innon-registered investment companies that are redeemable at net asset value are fair valued normally at net asset value.
Investments which are not valued using any of the methods discussed above are valued at their fair value, as determined in good faith by the Board of Trustees. The Board of Trustees has established a Valuation Committee comprised of the Trustees and has delegated to it the authority to take any actions regarding the valuation of portfolio securities that the Valuation Committee deems necessary or appropriate, including determining the fair value of portfolio securities, unless the determination has been delegated to the Wells Fargo Asset Management Pricing Committee. The Board of Trustees retains the authority to make or ratify any valuation decisions or approve any changes to the Valuation Procedures as it deems appropriate. On a quarterly basis, the Board of Trustees receives reports on any valuation actions taken by the Valuation Committee or the Wells Fargo Asset Management Pricing Committee which may include items for ratification.
Foreign currency translation
The accounting records of the Fund are maintained in U.S. dollars. The values of other assets and liabilities denominated in foreign currencies are translated into U.S. dollars at rates provided by an independent foreign currency pricing source at a time each business day specified by the Wells Fargo Asset Management Pricing Committee. Purchases and sales of securities, and income and expenses are converted at the rate of exchange on the respective dates of such transactions. Net realized foreign exchange gains or losses arise from sales of foreign currencies, currency gains or losses realized between the trade and settlement dates on securities transactions, and the difference between the amounts of dividends, interest and foreign withholding taxes recorded and the U.S. dollar equivalent of the amounts actually paid or received. Net unrealized foreign exchange gains and losses arise from changes in the fair value of assets and liabilities other than investments in securities resulting from changes in exchange rates. The changes in net assets arising from changes in exchange rates of securities and the changes in net assets resulting from changes in market prices of securities are not separately presented. Such changes are included in net realized and unrealized gains or losses from investments.
18 | Wells Fargo Global Small Cap Fund
Notes to financial statements (unaudited)
Securities lending
The Fund may lend its securities from time to time in order to earn additional income in the form of fees or interest on securities received as collateral or the investment of any cash received as collateral. When securities are on loan, the Fund receives interest or dividends on those securities. Cash collateral received in connection with its securities lending transactions is invested in Securities Lending Cash Investments, LLC (the “Securities Lending Fund”). Investments in Securities Lending Fund are valued at the evaluated bid price provided by an independent pricing service. Income earned from investment in the Securities Lending Fund (net of fees and rebates), if any, is included in income from affiliated securities on the Statement of Operations.
In a securities lending transaction, the net asset value of the Fund is affected by an increase or decrease in the value of the securities loaned and by an increase or decrease in the value of the instrument in which collateral is invested. The amount of securities lending activity undertaken by the Fund fluctuates from time to time. The Fund has the right under the lending agreement to recover the securities from the borrower on demand. In the event of default or bankruptcy by the borrower, the Fund may be prevented from recovering the loaned securities or gaining access to the collateral or may experience delays or costs in doing so. In such an event, the terms of the agreement allows the unaffiliated securities lending agent to use the collateral to purchase replacement securities on behalf of the Fund or pay the Fund the market value of the loaned securities. The Fund bears the risk of loss with respect to depreciation of its investment of the cash collateral.
Security transactions and income recognition
Securities transactions are recorded on a trade date basis. Realized gains or losses are recorded on the basis of identified cost.
Dividend income is recognized on theex-dividend date, except for certain dividends from foreign securities, which are recorded as soon as the custodian verifies theex-dividend date. Dividend income from foreign securities is recorded net of foreign taxes withheld where recovery of such taxes is not assured.
Distributions to shareholders
Distributions to shareholders from net investment income and any net realized gains are recorded on theex-dividend date and paid at least annually. Such distributions are determined in accordance with income tax regulations and may differ from U.S. generally accepted accounting principles. Dividend sources are estimated at the time of declaration. The tax character of distributions is determined as of the Fund’s fiscal year end. Therefore, a portion of the Fund’s distributions made prior to the Fund’s fiscal year end may be categorized as a tax return of capital at year end.
Federal and other taxes
The Fund intends to continue to qualify as a regulated investment company by distributing substantially all of its investment company taxable income and any net realized capital gains (after reduction for capital loss carryforwards) sufficient to relieve it from all, or substantially all, federal income taxes. Accordingly, no provision for federal income taxes was required.
The Fund’s income and federal excise tax returns and all financial records supporting those returns for the prior three fiscal years are subject to examination by the federal and Delaware revenue authorities. Management has analyzed the Fund’s tax positions taken on federal, state, and foreign tax returns for all open tax years and does not believe that there are any uncertain tax positions that require recognition of a tax liability.
As of April 30, 2020, the aggregate cost of all investments for federal income tax purposes was $220,413,785 and the unrealized gains (losses) consisted of:
| | | | |
| |
Gross unrealized gains | | $ | 26,919,068 | |
| |
Gross unrealized losses | | | (29,905,895 | ) |
| |
Net unrealized losses | | $ | (2,986,827 | ) |
Class allocations
The separate classes of shares offered by the Fund differ principally in applicable sales charges, distribution, shareholder servicing, and administration fees. Class specific expenses are charged directly to that share class. Investment income, common fund-level expenses, and realized and unrealized gains (losses) on investments are allocated daily to each class of shares based on the relative proportion of net assets of each class.
Wells Fargo Global Small Cap Fund | 19
Notes to financial statements (unaudited)
3. FAIR VALUATION MEASUREMENTS
Fair value measurements of investments are determined within a framework that has established a fair value hierarchy based upon the various data inputs utilized in determining the value of the Fund’s investments. The three-level hierarchy gives the highest priority to unadjusted quoted prices in active markets for identical assets or liabilities (Level 1) and the lowest priority to unobservable inputs (Level 3). The Fund’s investments are classified within the fair value hierarchy based on the lowest level of input that is significant to the fair value measurement. The inputs are summarized into three broad levels as follows:
| ∎ | | Level 1 – quoted prices in active markets for identical securities |
| ∎ | | Level 2 – other significant observable inputs (including quoted prices for similar securities, interest rates, prepayment speeds, credit risk, etc.) |
| ∎ | | Level 3 – significant unobservable inputs (including the Fund’s own assumptions in determining the fair value of investments) |
The inputs or methodologies used for valuing investments in securities are not necessarily an indication of the risk associated with investing in those securities.
The following is a summary of the inputs used in valuing the Fund’s assets and liabilities as of April 30, 2020:
| | | | | | | | | | | | | | | | |
| | | | |
| | | Quoted prices
(Level 1) | | | Other significant
observable inputs
(Level 2) | | | Significant
unobservable inputs (Level 3) | | | Total | |
| | | | |
Assets | | | | | | | | | | | | | | | | |
Investments in: | | | | | | | | | | | | | | | | |
| | | | |
Common stocks | | | | | | | | | | | | | | | | |
| | | | |
Australia | | $ | 0 | | | $ | 6,518,627 | | | $ | 0 | | | $ | 6,518,627 | |
| | | | |
Austria | | | 0 | | | | 1,401,253 | | | | 0 | | | | 1,401,253 | |
| | | | |
Belgium | | | 0 | | | | 2,389,986 | | | | 0 | | | | 2,389,986 | |
| | | | |
Bermuda | | | 3,226,585 | | | | 0 | | | | 0 | | | | 3,226,585 | |
| | | | |
Canada | | | 10,818,078 | | | | 0 | | | | 0 | | | | 10,818,078 | |
| | | | |
Denmark | | | 0 | | | | 611,459 | | | | 0 | | | | 611,459 | |
| | | | |
France | | | 0 | | | | 6,801,596 | | | | 0 | | | | 6,801,596 | |
| | | | |
Germany | | | 0 | | | | 8,691,045 | | | | 0 | | | | 8,691,045 | |
| | | | |
Hong Kong | | | 0 | | | | 2,518,122 | | | | 0 | | | | 2,518,122 | |
| | | | |
Ireland | | | 1,725,326 | | | | 0 | | | | 0 | | | | 1,725,326 | |
| | | | |
Italy | | | 0 | | | | 3,788,099 | | | | 0 | | | | 3,788,099 | |
| | | | |
Japan | | | 0 | | | | 27,244,003 | | | | 0 | | | | 27,244,003 | |
| | | | |
Luxembourg | | | 320,858 | | | | 0 | | | | 0 | | | | 320,858 | |
| | | | |
Netherlands | | | 641,265 | | | | 1,585,072 | | | | 0 | | | | 2,226,337 | |
| | | | |
Norway | | | 0 | | | | 737,873 | | | | 0 | | | | 737,873 | |
| | | | |
Singapore | | | 0 | | | | 778,510 | | | | 0 | | | | 778,510 | |
| | | | |
Spain | | | 0 | | | | 4,717,635 | | | | 0 | | | | 4,717,635 | |
| | | | |
Sweden | | | 0 | | | | 2,103,046 | | | | 0 | | | | 2,103,046 | |
| | | | |
Switzerland | | | 0 | | | | 4,361,684 | | | | 0 | | | | 4,361,684 | |
| | | | |
United Kingdom | | | 7,977,522 | | | | 12,583,339 | | | | 0 | | | | 20,560,861 | |
| | | | |
United States | | | 103,049,964 | | | | 0 | | | | 0 | | | | 103,049,964 | |
| | | | |
Short-term investments | | | | | | | | | | | | | | | | |
| | | | |
Investment companies | | | 2,836,011 | | | | 0 | | | | 0 | | | | 2,836,011 | |
| | | | |
Total assets | | $ | 130,595,609 | | | $ | 86,831,349 | | | $ | 0 | | | $ | 217,426,958 | |
Additional sector, industry or geographic detail is included in the Portfolio of Investments.
For the six months ended April 30, 2020, the Fund did not have any transfers into/out of Level 3.
4. TRANSACTIONS WITH AFFILIATES
Management fee
Funds Management, an indirect wholly owned subsidiary of Wells Fargo & Company (“Wells Fargo”), is the manager of the Fund and provides advisory and fund-level administrative services under an investment management agreement. Under the investment management agreement, Funds Management is responsible for, among other services, implementing the
20 | Wells Fargo Global Small Cap Fund
Notes to financial statements (unaudited)
investment objectives and strategies of the Fund, supervising the subadviser and providing fund-level administrative services in connection with the Fund’s operations. As compensation for its services under the investment management agreement, Funds Management is entitled to receive a management fee at the following annual rate based on the Fund’s average daily net assets:
| | | | |
| |
| Average daily net assets | | Management fee | |
| |
First $500 million | | | 0.950 | % |
| |
Next $500 million | | | 0.925 | |
| |
Next $1 billion | | | 0.900 | |
| |
Next $2 billion | | | 0.875 | |
| |
Next $1 billion | | | 0.850 | |
| |
Next $5 billion | | | 0.840 | |
| |
Over $10 billion | | | 0.830 | |
For the six months ended April 30, 2020, the management fee was equivalent to an annual rate of 0.95% of the Fund’s average daily net assets.
Funds Management has retained the services of a subadviser to provide daily portfolio management to the Fund. The fee for subadvisory services is borne by Funds Management. Wells Capital Management Incorporated (“WellsCap”), an affiliate of Funds Management and an indirect wholly owned subsidiary of Wells Fargo, is the subadviser to the Fund and is entitled to receive a fee from Funds Management at an annual rate starting at 0.55% and declining to 0.40% as the average daily net assets of the Fund increase.
Administration fees
Under a class-level administration agreement, Funds Management provides class-level administrative services to the Fund, which includes paying fees and expenses for services provided by the transfer agent,sub-transfer agents, omnibus account servicers and record-keepers. As compensation for its services under the class-level administration agreement, Funds Management receives an annual fee which is calculated based on the average daily net assets of each class as follows:
| | | | |
| |
| | | Class-level administration fee | |
| |
Class A, Class C | | | 0.21 | % |
| |
Administrator Class, Institutional Class | | | 0.13 | |
Waivers and/or expense reimbursements
Funds Management has contractually waived and/or reimbursed management and administration fees to the extent necessary to maintain certain net operating expense ratios for the Fund. When each class of the Fund has exceeded its expense cap, Funds Management has waived fees and/or reimbursed expenses from fund-level expenses on a proportionate basis and then from class specific expenses. When only certain classes exceed their expense caps, waivers and/or reimbursements are applied against class specific expenses before fund-level expenses. Funds Management has committed through February 28, 2021 to waive fees and/or reimburse expenses to the extent necessary to cap the Fund’s expenses at 1.55% for Class A shares, 2.30% for Class C shares, 1.40% for Administrator Class shares, and 1.15% for Institutional Class shares. Prior to or after the commitment expiration date, the cap may be increased or the commitment to maintain the cap may be terminated only with the approval of the Board of Trustees.
Distribution fee
The Trust has adopted a distribution plan for Class C shares of the Fund pursuant to Rule12b-1 under the 1940 Act. A distribution fee is charged to Class C shares and paid to Wells Fargo Funds Distributor, LLC (“Funds Distributor”), the principal underwriter, at an annual rate of 0.75% of the average daily net assets of Class C shares.
In addition, Funds Distributor is entitled to receive thefront-end sales charge from the purchase of Class A shares and a contingent deferred sales charge on the redemption of certain Class A shares. Funds Distributor is also entitled to receive the contingent deferred sales charges from redemptions of Class C shares. For the six months ended April 30, 2020, Funds Distributor received $1,371 from the sale of Class A shares. No contingent deferred sales charges were incurred by Class A and Class C shares for the six months ended April 30, 2020.
Wells Fargo Global Small Cap Fund | 21
Notes to financial statements (unaudited)
Shareholder servicing fees
The Trust has entered into contracts with one or more shareholder servicing agents, whereby Class A, Class C, and Administrator Class of the Fund are charged a fee at an annual rate of 0.25% of the average daily net assets of each respective class. A portion of these total shareholder servicing fees were paid to affiliates of Wells Fargo.
Interfund transactions
The Fund may purchase or sell portfolio investment securities to certain other Wells Fargo affiliates pursuant to Rule17a-7 under the 1940 Act and under procedures adopted by the Board of Trustees. The procedures have been designed to ensure that these interfund transactions, which do not incur broker commissions, are effected at current market prices.
5. INVESTMENT PORTFOLIO TRANSACTIONS
Purchases and sales of investments, excluding U.S. government obligations (if any) and short-term securities, for the six months ended April 30, 2020 were $80,155,776 and $90,901,033, respectively.
6. SECURITIES LENDING TRANSACTIONS
The Fund lends its securities through an unaffiliated securities lending agent and receives collateral in the form of cash or securities with a value at least equal to the value of the securities on loan. The value of the loaned securities is determined at the close of each business day and any increases or decreases in the required collateral are exchanged between the Fund and the counterparty on the next business day. Cash collateral received is invested in the Securities Lending Fund which seeks to provide a positive return compared to the daily Fed Funds Open Rate by investing in high-quality, U.S. dollar-denominated short-term money market instruments and is exempt from registration under Section 3(c)(7) of the 1940 Act. Securities Lending Fund is managed by Funds Management and is subadvised by WellsCap. Funds Management receives an advisory fee starting at 0.05% and declining to 0.01% as the average daily net assets of the Securities Lending Fund increase. All of the fees received by Funds Management are paid to WellsCap for its services as subadviser.
In the event of counterparty default or the failure of a borrower to return a loaned security, the Fund has the right to use the collateral to offset any losses incurred. As of April 30, 2020, the Fund did not have any securities on loan.
7. BANK BORROWINGS
The Trust (excluding the money market funds), Wells Fargo Master Trust and Wells Fargo Variable Trust are parties to a $280,000,000 revolving credit agreement whereby the Fund is permitted to use bank borrowings for temporary or emergency purposes, such as to fund shareholder redemption requests. Interest under the credit agreement is charged to the Fund based on a borrowing rate equal to the higher of the Federal Funds rate in effect on that day plus 1.25% or the overnight LIBOR rate in effect on that day plus 1.25%. In addition, an annual commitment fee equal to 0.25% of the unused balance is allocated to each participating fund.
For the six months ended April 30, 2020, there were no borrowings by the Fund under the agreement.
8. CONCENTRATION RISKS
Concentration risks result from exposure to a limited number of sectors. As of the end of the period, the Fund invests a concentration of its portfolio in the industrials sector. A fund that invests a substantial portion of its assets in any sector may be more affected by changes in that sector than would be a fund whose investments are not heavily weighted in any sector.
9. INDEMNIFICATION
Under the Fund’s organizational documents, the officers and Trustees have been granted certain indemnification rights against certain liabilities that may arise out of performance of their duties to the Fund. The Fund has entered into a separate agreement with each Trustee that converts indemnification rights currently existing under the Fund’s organizational documents into contractual rights that cannot be changed in the future without the consent of the Trustee. Additionally, in the normal course of business, the Fund may enter into contracts with service providers that contain a variety of indemnification clauses. The Fund’s maximum exposure under these arrangements is dependent on future claims that may be made against the Fund and, therefore, cannot be estimated.
10. NEW ACCOUNTING PRONOUNCEMENT
In August 2018, FASB issued Accounting Standards Update (“ASU”)No. 2018-13, Fair Value Measurement (Topic 820)Disclosure Framework—Changes to the Disclosure Requirements for Fair Value Measurement. ASU2018-13 updates the disclosure
22 | Wells Fargo Global Small Cap Fund
Notes to financial statements (unaudited)
requirements for fair value measurements by modifying or removing certain disclosures and adding certain new disclosures. The amendments are effective for fiscal years, and interim periods within those fiscal years, beginning after December 15, 2019. Early adoption is permitted. Management has adopted the removal and modification of disclosures early, as permitted, and will adopt the additional new disclosures at the effective date.
11. CORONAVIRUS(COVID-19) PANDEMIC
On March 11, 2020, the World Health Organization announced that it had made the assessment that coronavirus disease 2019(“COVID-19”) is a pandemic. The impacts ofCOVID-19 are adversely affecting the entire global economy, individual companies and investment products, and the market in general. There is significant uncertainty around the extent and duration of business disruptions related toCOVID-19 and the impacts may be short term or may last for an extended period of time. The risk of further spreading ofCOVID-19 has led to significant uncertainty and volatility in the financial markets. The value of the Fund and the securities in which the Fund invests have generally been adversely affected by impacts caused byCOVID-19.
Wells Fargo Global Small Cap Fund | 23
Other information (unaudited)
PROXY VOTING INFORMATION
A description of the policies and procedures used to determine how to vote proxies relating to portfolio securities is available, upon request, by calling1-800-222-8222, visiting our website atwfam.com, or visiting the SEC website at sec.gov. Information regarding how the proxies related to portfolio securities were voted during the most recent12-month period ended June 30 is available on the website atwfam.comor by visiting the SEC website at sec.gov.
QUARTERLY PORTFOLIO HOLDINGS INFORMATION
The Fund files its complete schedule of portfolio holdings with the SEC for the first and third quarters of each fiscal year as an exhibit to its reports on FormN-PORT. Shareholders may view the filed FormN-PORT by visiting the SEC website at sec.gov.
24 | Wells Fargo Global Small Cap Fund
Other information (unaudited)
BOARD OF TRUSTEES AND OFFICERS
Each of the Trustees and Officers1 listed in the table below acts in identical capacities for each fund in the Wells Fargo family of funds, which consists of 147 mutual funds comprising the Wells Fargo Funds Trust, Wells Fargo Variable Trust, Wells Fargo Master Trust and fourclosed-end funds (collectively the “Fund Complex”). This table should be read in conjunction with the Prospectus and the Statement of Additional Information2. The mailing address of each Trustee and Officer is 525 Market Street, 12th Floor, San Francisco, CA 94105. Each Trustee and Officer serves an indefinite term, however, each Trustee serves such term until reaching the mandatory retirement age established by the Trustees.
Independent Trustees
| | | | | | |
Name and year of birth | | Position held and
length of service* | | Principal occupations during past five years or longer | | Current other
public company or
investment
company
directorships |
| | | |
William R. Ebsworth (Born 1957) | | Trustee, since 2015 | | Retired. From 1984 to 2013, equities analyst, portfolio manager, research director and chief investment officer at Fidelity Management and Research Company in Boston, Tokyo, and Hong Kong, and retired in 2013 as Chief Investment Officer of Fidelity Strategic Advisers, Inc. where he led a team of investment professionals managing client assets. Prior thereto, Board member of Hong Kong Securities Clearing Co., Hong Kong Options Clearing Corp., the Thailand International Fund, Ltd., Fidelity Investments Life Insurance Company, and Empire Fidelity Investments Life Insurance Company. Audit Committee Chair and Investment Committee Chair of the Vincent Memorial Hospital Endowment(non-profit organization). Mr. Ebsworth is a CFA® charterholder. | | N/A |
| | | |
Jane A. Freeman (Born 1953) | | Trustee, since 2015; Chair Liaison, since 2018 | | Retired. From 2012 to 2014 and 1999 to 2008, Chief Financial Officer of Scientific Learning Corporation. From 2008 to 2012, Ms. Freeman provided consulting services related to strategic business projects. Prior to 1999, Portfolio Manager at Rockefeller & Co. and Scudder, Stevens & Clark. Board member of the Harding Loevner Funds from 1996 to 2014, serving as both Lead Independent Director and chair of the Audit Committee. Board member of the Russell Exchange Traded Funds Trust from 2011 to 2012 and the chair of the Audit Committee. Ms. Freeman is also an inactive Chartered Financial Analyst. | | N/A |
| | | |
Isaiah Harris, Jr. (Born 1952) | | Trustee, since 2009; Audit Committee Chairman, since 2019 | | Retired. Chairman of the Board of CIGNA Corporation since 2009, and Director since 2005. From 2003 to 2011, Director of Deluxe Corporation. Prior thereto, President and CEO of BellSouth Advertising and Publishing Corp. from 2005 to 2007, President and CEO of BellSouth Enterprises from 2004 to 2005 and President of BellSouth Consumer Services from 2000 to 2003. Emeritus member of the Iowa State University Foundation Board of Governors. Emeritus Member of the Advisory Board of Iowa State University School of Business. Advisory Board Member, Palm Harbor Academy (private school). Advisory Board Member, Child Evangelism Fellowship(non-profit). Mr. Harris is a certified public accountant (inactive status). | | CIGNA Corporation |
| | | |
Judith M. Johnson (Born 1949) | | Trustee, since 2008; Audit Committee Chairman, from 2009 to 2018 | | Retired. Prior thereto, Chief Executive Officer and Chief Investment Officer of Minneapolis Employees Retirement Fund from 1996 to 2008. Ms. Johnson is an attorney, certified public accountant and a certified managerial accountant. | | N/A |
Wells Fargo Global Small Cap Fund | 25
Other information (unaudited)
| | | | | | |
Name and year of birth | | Position held and
length of service* | | Principal occupations during past five years or longer | | Current other
public company or
investment
company
directorships |
| | | |
David F. Larcker (Born 1950) | | Trustee, since 2009 | | James Irvin Miller Professor of Accounting at the Graduate School of Business, Stanford University, Director of the Corporate Governance Research Initiative and Senior Faculty of The Rock Center for Corporate Governance since 2006. From 2005 to 2008, Professor of Accounting at the Graduate School of Business, Stanford University. Prior thereto, Ernst & Young Professor of Accounting at The Wharton School, University of Pennsylvania from 1985 to 2005. | | N/A |
| | | |
Olivia S. Mitchell (Born 1953) | | Trustee, since 2006; Nominating and Governance Committee Chair, since 2018 | | International Foundation of Employee Benefit Plans Professor, Wharton School of the University of Pennsylvania since 1993. Director of Wharton’s Pension Research Council and Boettner Center on Pensions & Retirement Research, and Research Associate at the National Bureau of Economic Research. Previously, Cornell University Professor from 1978 to 1993. | | N/A |
| | | |
Timothy J. Penny (Born 1951) | | Trustee, since 1996; Chairman, since 2018 | | President and Chief Executive Officer of Southern Minnesota Initiative Foundation, anon-profit organization, since 2007. Member of the Board of Trustees of NorthStar Education Finance, Inc., anon-profit organization, since 2007. | | N/A |
| | | |
James G. Polisson (Born 1959) | | Trustee, since 2018 | | Retired. Chief Marketing Officer, Source (ETF) UK Services, Ltd, from 2015 to 2017. From 2012 to 2015, Principal of The Polisson Group, LLC, a management consulting, corporate advisory and principal investing company. Chief Executive Officer and Managing Director at Russell Investments, Global Exchange Traded Funds from 2010 to 2012. Managing Director of Barclays Global Investors from 1998 to 2010 and Global Chief Marketing Officer for iShares and Barclays Global Investors from 2000 to 2010. Trustee of the San Francisco Mechanics’ Institute, anon-profit organization, from 2013 to 2015. Board member of the Russell Exchange Traded Fund Trust from 2011 to 2012. Director of Barclays Global Investors Holdings Deutschland GmbH from 2006 to 2009. Mr. Polisson is an attorney and has a retired status with the Massachusetts and District of Columbia Bar Associations. | | N/A |
| | | |
Pamela Wheelock (Born 1959) | | Trustee, since January 2020; previously Trustee from January 2018 to July 2019 | | Board member of the Destination Medical Center Economic Development Agency, Rochester, Minnesota since 2019 and Interim President of the McKnight Foundation since 2020. Acting Commissioner, Minnesota Department of Human Services, July 2019 through September 2019. Human Services Manager (part-time), Minnesota Department of Human Services, October 2019 through December 2019. Chief Operating Officer, Twin Cities Habitat for Humanity from 2017 to 2019. Vice President of University Services, University of Minnesota from 2012 to 2016. Prior thereto, on the Board of Directors, Governance Committee and Finance Committee for the Minnesota Philanthropy Partners (Saint Paul Foundation) from 2012 to 2018, Interim Chief Executive Officer of Blue Cross Blue Shield of Minnesota from 2011 to 2012, Chairman of the Board from 2009 to 2012 and Board Director from 2003 to 2015. Vice President, Leadership and Community Engagement, Bush Foundation, Saint Paul, Minnesota (a private foundation) from 2009 to 2011. Executive Vice President and Chief Financial Officer, Minnesota Sports and Entertainment from 2004 to 2009 and Senior Vice President from 2002 to 2004. Executive Vice President of the Minnesota Wild Foundation from 2004 to 2008. Commissioner of Finance, State of Minnesota, from 1999 to 2002. Currently Board Chair of the Minnesota Wild Foundation since 2010. | | N/A |
| * | Length of service dates reflect the Trustee’s commencement of service with the Trust’s predecessor entities, where applicable. |
26 | Wells Fargo Global Small Cap Fund
Other information (unaudited)
Officers
| | | | |
Name and year of birth | | Position held and
length of service | | Principal occupations during past five years or longer |
| | |
Andrew Owen (Born 1960) | | President, since 2017 | | Executive Vice President of Wells Fargo & Company and Head of Affiliated Managers, Wells Fargo Asset Management, since 2014. In addition, Mr. Owen is currently President, Chief Executive Officer and Director of Wells Fargo Funds Management, LLC since 2017. Prior thereto, Executive Vice President responsible for marketing, investments and product development for Wells Fargo Funds Management, LLC, from 2009 to 2014. |
| | |
Jeremy DePalma1 (Born 1974) | | Treasurer, since 2012 | | Senior Vice President of Wells Fargo Funds Management, LLC since 2009. Senior Vice President of Evergreen Investment Management Company, LLC from 2008 to 2010 and head of the Fund Reporting and Control Team within Fund Administration from 2005 to 2010. |
| | |
Michelle Rhee (Born 1966) | | Chief Legal Officer, since 2019 | | Secretary of Wells Fargo Funds Management, LLC, Chief Legal Counsel of Wells Fargo Asset Management and Assistant General Counsel of Wells Fargo Bank, N.A. since 2018. Associate General Counsel and Managing Director of Bank of America Corporation from 2004 to 2018. |
| | |
Catherine Kennedy (Born 1969) | | Secretary, since 2019 | | Vice President of Wells Fargo Funds Management, LLC and Senior Counsel of the Wells Fargo Legal Department since 2010. Vice President and Senior Counsel of Evergreen Investment Management Company, LLC from 1998 to 2010. |
| | |
Michael H. Whitaker (Born 1967) | | Chief Compliance Officer, since 2016 | | Chief Compliance Officer of Wells Fargo Asset Management since 2016. Senior Vice President and Chief Compliance Officer for Fidelity Investments from 2007 to 2016. |
| | |
David Berardi (Born 1975) | | Assistant Treasurer, since 2009 | | Vice President of Wells Fargo Funds Management, LLC since 2009. Vice President of Evergreen Investment Management Company, LLC from 2008 to 2010. Manager of Fund Reporting and Control for Evergreen Investment Management Company, LLC from 2004 to 2010. |
| 1 | Jeremy DePalma acts as Treasurer of 82 funds and Assistant Treasurer of 65 funds in the Fund Complex. |
| 2 | The Statement of Additional Information includes additional information about the Trustees and is available, without charge, upon request, by calling1-800-222-8222 or by visiting the website atwfam.com. |
Wells Fargo Global Small Cap Fund | 27
Appendix I (unaudited)
Effective on or about May 1, 2020, if you purchase Fund shares through a Janney Montgomery Scott LLC (“Janney”) brokerage account, you will be eligible for the following load waivers (front-end sales charge waivers and contingent deferred sales charge (“CDSC”), or back-end sales charge, waivers) and discounts, which may differ from those disclosed elsewhere in the Fund’s Prospectus or SAI.
|
| Front-end sales charge* waivers on Class A shares available at Janney |
|
| Shares purchased through reinvestment of capital gains distributions and dividend reinvestment when purchasing shares of the same fund (but not any other fund within the fund family). |
|
| Shares purchased by employees and registered representatives of Janney or its affiliates and their family members as designated by Janney. |
|
| Shares purchased from the proceeds of redemptions within the same fund family, provided (1) the repurchase occurs within ninety (90) days following the redemption, (2) the redemption and purchase occur in the same account, and (3) redeemed shares were subject to a front-end or deferred sales load (i.e., right of reinstatement). |
|
| Employer-sponsored retirement plans (e.g., 401(k) plans, 457 plans, employer-sponsored 403(b) plans, profit sharing and money purchase pension plans and defined benefit plans). For purposes of this provision, employer-sponsored retirement plans do not include SEP IRAs, Simple IRAs, SAR-SEPs or Keogh plans. |
|
| Shares acquired through a right of reinstatement. |
|
| Class C shares that are no longer subject to a contingent deferred sales charge and are converted to Class A shares of the same fund pursuant to Janney’s policies and procedures. |
| CDSC waivers on Class A and Class C shares available at Janney |
|
| Shares sold upon the death or disability of the shareholder. |
|
| Shares sold as part of a systematic withdrawal plan as described in the Fund’s Prospectus. |
|
| Shares purchased in connection with a return of excess contributions from an IRA account. |
|
| Shares sold as part of a required minimum distribution for IRA and retirement accounts if the redemption is taken in or after the year the shareholder reaches qualified age based on applicable IRS regulations. |
|
| Shares sold to pay Janney fees but only if the transaction is initiated by Janney. |
|
| Shares acquired through a right of reinstatement. |
|
| Shares exchanged into the same share class of a different fund. |
| Front-end sales charge* discounts available at Janney; breakpoints, rights of accumulation and/or letters of intent |
|
| Breakpoints as described in the Fund’s Prospectus. |
|
| Rights of accumulation (“ROA”), which entitle shareholders to breakpoint discounts, will be automatically calculated based on the aggregated holding of fund family assets held by accounts within the purchaser’s household at Janney. Eligible fund family assets not held at Janney may be included in the ROA calculation only if the shareholder notifies his or her financial advisor about such assets. |
|
| Letters of intent which allow for breakpoint discounts based on anticipated purchases within a fund family, over a 13-month time period. Eligible fund family assets not held at Janney Montgomery Scott may be included in the calculation of letters of intent only if the shareholder notifies his or her financial advisor about such assets. |
| * | Also referred to as an “initial sales charge.” |
28 | Wells Fargo Global Small Cap Fund
Appendix II (unaudited)
Effective on or after May 1, 2020, clients of Edward Jones (also referred to as “shareholders”) purchasing Fund shares on the Edward Jones commission and fee-based platforms are eligible only for the following sales charge discounts (also referred to as “breakpoints”) and waivers, which can differ from breakpoints and waivers described elsewhere in the Fund’s Prospectus or SAI or through another broker-dealer. In all instances, it is the shareholder’s responsibility to inform Edward Jones at the time of purchase of any relationship, holdings of Wells Fargo Funds or other facts qualifying the purchaser for breakpoints or waivers. Edward Jones can ask for documentation of such circumstance.
|
| Breakpoints available at Edward Jones |
|
| Rights of Accumulation (ROA) |
|
The applicable sales charge on a purchase of Class A shares is determined by taking into account all share classes (except any money market funds and retirement plan share classes) of Wells Fargo Funds held by the shareholder or in an account grouped by Edward Jones with other accounts for the purpose of providing certain pricing considerations (“pricing groups”). This includes all share classes held on the Edward Jones platform and/or held on another platform. The inclusion of eligible fund family assets in the rights of accumulation calculation is dependent on the shareholder notifying his or her financial advisor of such assets at the time of calculation. |
|
ROA is determined by calculating the higher of cost or market value (current shares x NAV). |
|
| Letter of Intent (LOI) |
|
Through a LOI, shareholders can receive the sales charge and breakpoint discounts for purchases shareholders intend to makeover a 13-month period from the date Edward Jones receives the LOI. The LOI is determined by calculating the higher of cost or market value of qualifying holdings at LOI initiation in combination with the value that the shareholder intends to buy over a 13-month period to calculate the front-end sales charge and any breakpoint discounts. Each purchase the shareholder makes during that 13-month period will receive the sales charge and breakpoint discount that applies to the total amount. The inclusion of eligible fund family assets in the LOI calculation is dependent on the shareholder notifying his or her financial advisor of such assets at the time of calculation. Purchases made before the LOI is received by Edward Jones are not covered under the LOI and will not reduce the sales charge previously paid. Sales charges will be adjusted if LOI is not met. |
| Sales charges are waived for the following shareholders and in the following situations at Edward Jones: |
● Associates of Edward Jones and its affiliates and their family members who are in the same pricing group (as determined by Edward Jones under its policies and procedures) as the associate. This waiver will continue for the remainder of the associate’s life if the associate retires from Edward Jones in good-standing. |
● Shares purchased in an Edward Jones fee-based program. |
● Shares purchased through reinvestment of capital gains distributions and dividend reinvestment. |
● Shares purchased from the proceeds of redeemed shares of the same fund family so long as the following conditions are met: 1)the proceeds are from the sale of shares within 60 days of the purchase, and 2) the sale and purchase are made in the same share class and the same account or the purchase is made in an individual retirement account with proceeds from liquidations in anon-retirement account. |
● Shares exchanged into Class A shares from another share class so long as the exchange is into the same fund and was initiated at the discretion of Edward Jones. Edward Jones is responsible for any remaining CDSC due to the fund company, if applicable. Any future purchases are subject to the applicable sales charge as disclosed in the prospectus. |
● Exchanges from Class C shares to Class A shares of the same fund, generally, in the 84th month following the anniversary of the purchase date or earlier at the discretion of Edward Jones. |
If the shareholder purchases shares that are subject to a CDSC and those shares are redeemed before the CDSC is expired, the shareholder
is responsible to pay the CDSC except in the following conditions available at Edward Jones: |
● The death or disability of the shareholder. |
● Systematic withdrawals with up to 10% per year of the account value. |
● Return of excess contributions from an Individual Retirement Account (IRA). |
● Shares sold as part of a required minimum distribution for IRA and retirement accounts if the redemption is taken in or after the year the shareholder reaches qualified age based on applicable IRS regulation. |
● Shares sold to pay Edward Jones fees or costs in such cases where the transaction is initiated by Edward Jones. |
● Shares exchanged in an Edward Jones fee-based program. |
● Shares acquired through NAV reinstatement. |
Wells Fargo Global Small Cap Fund | 29
Appendix II (unaudited)
|
| Other Important Information for accounts at Edward Jones: |
| Minimum Purchase Amounts |
● $250 initial purchase minimum |
● $50 subsequent purchase minimum |
|
| Minimum Balances |
| Edward Jones has the right to redeem at its discretion fund holdings with a balance of $250 or less. The following are examples of accounts that are not included in this policy: |
● A fee-based account held on an Edward Jones platform |
● A 529 account held on an Edward Jones platform |
● An account with an active systematic investment plan or letter of intent (LOI) |
|
| Changing Share Classes |
| At any time it deems necessary, Edward Jones has the authority to exchange at NAV a shareholder’s holdings in a fund to Class A shares. |
30 | Wells Fargo Global Small Cap Fund
Appendix III (unaudited)
Effective June 1, 2020, shareholders purchasing Fund shares through an Oppenheimer & Co. Inc. (“Oppenheimer”) platform or account are eligible only for the following load waivers (front-end sales charge waivers and contingent deferred or back-end, sales charge waivers) and discounts, which may differ from those disclosed in the Fund’s Prospectus or SAI.
|
| Front-end Sales Load Waivers on Class A Shares available at Oppenheimer |
|
| Employer-sponsored retirement, deferred compensation and employee benefit plans (including health savings accounts) and trusts used to fund those plans, provided that the shares are not held in a commission-based brokerage account and shares are held for the benefit of the plan. |
|
| Shares purchased by or through a 529 Plan. |
|
| Shares purchased through an Oppenheimer affiliated investment advisory program. |
|
| Shares purchased through reinvestment of capital gains distributions and dividend reinvestment when purchasing shares of the same fund (but not any other fund within the fund family). |
|
| Shares purchased from the proceeds of redemptions within the same fund family, provided (1) the repurchase occurs within 90 days following the redemption, (2) the redemption and purchase occur in the same account, and (3) redeemed shares were subject to a front-end or deferred sales load (known as Rights of Restatement). |
|
| A shareholder in the Fund’s Class C shares will have their shares exchanged at net asset value to Class A shares (or the appropriate share class) of the Fund if the shares are no longer subject to a CDSC and the exchange is in line with the policies and procedures of Oppenheimer. |
|
| Employees and registered representatives of Oppenheimer or its affiliates and their family members. |
|
| Directors or Trustees of the Fund, and employees of the Fund’s investment adviser or any of its affiliates, as described in the Prospectus. |
| CDSC Waivers on A and C Shares available at Oppenheimer |
|
| Death or disability of the shareholder. |
|
| Shares sold as part of a systematic withdrawal plan as described in the Prospectus. |
|
| Return of excess contributions from an IRA Account. |
|
| Shares sold as part of a required minimum distribution for IRA and retirement accounts due to the shareholder reaching the qualified age based on applicable IRS regulations as described in the Prospectus. |
|
| Shares sold to pay Oppenheimer fees but only if the transaction is initiated by Oppenheimer. |
|
| Shares acquired through a right of reinstatement. |
| Front-end load Discounts Available at Oppenheimer: Breakpoints, Rights of Accumulation & Letters of Intent |
|
| Breakpoints as described in the Prospectus. |
|
| Rights of Accumulation (ROA), which entitle shareholders to breakpoint discounts, will be automatically calculated based on the aggregated holding of fund family assets held by accounts within the purchaser’s household at Oppenheimer. Eligible fund family assets not held at Oppenheimer may be included in the ROA calculation only if the shareholder notifies his or her financial advisor about such assets. |
Wells Fargo Global Small Cap Fund | 31
Appendix IV (unaudited)
Effective June 15, 2020, shareholders purchasing fund shares through a Robert W. Baird & Co. (“Baird”) platform or account will only be eligible for the following sales charge waivers (front-end sales charge waivers and CDSC waivers) and discounts, which may differ from those disclosed elsewhere in the Fund’s Prospectus or the SAI.
|
| Front-end Sales Load Waivers on Class A Shares available at Baird |
|
| Shares purchased through reinvestment of capital gains distributions and dividend reinvestment when purchasing share of the same fund. |
|
| Share purchase by employees and registers representatives of Baird or its affiliate and their family members as designated by Baird. |
|
| Shares purchase from the proceeds of redemptions within the same fund family, provided (1) the repurchase occurs within 90 days following the redemption, (2) the redemption and purchase occur in the same accounts, and (3) redeemed shares were subject to a front-end or deferred sales charge (known as rights of reinstatement). |
|
| A shareholder in the Funds Investor C Shares will have their share exchanged at net asset value to Investor A shares of the fund if the shares are no longer subject to CDSC and the exchange is in line with the policies and procedures of Baird. |
|
| Employer-sponsored retirement plans or charitable accounts in a transactional brokerage account at Baird, including 401(k)plans, 457 plans, employer-sponsored 403(b) plans, profit sharing and money purchase pension plans and defined benefit plans. For purposes of this provision, employer-sponsored retirement plans do not include SEP IRAs, Simple IRAs or SAR-SEPs. |
| CDSC Waivers on A and C Shares available at Baird |
|
| Shares sold due to death or disability of the shareholder. |
|
| Shares sold as part of a systematic withdrawal plan as described in the Fund’s Prospectus. |
|
| Shares bought due to returns of excess contributions from an IRA Account. |
|
| Shares sold as part of a required minimum distribution for IRA and retirement accounts due to the shareholder reaching age 72 as described in the Fund’s Prospectus. |
|
| Shares sold to pay Baird fees but only if the transaction is initiated by Baird. |
|
| Shares acquired through a right of reinstatement. |
| Front-end load Discounts Available at Baird: Breakpoint and/or Rights of Accumulation |
|
| Breakpoints as described in the Prospectus. |
|
| Rights of accumulations which entitles shareholders to breakpoint discounts will be automatically calculated based on the aggregated holding of fund family assets held by accounts within the purchaser’s household at Baird. Eligible fund family assets not held at Baird may be included in the rights of accumulations calculation only if the shareholder notifies his or her financial advisor about such assets. |
|
| Letters of Intent (LOI) allow for breakpoint discounts based on anticipated purchases within a fund family through Baird, over a 13-month period of time. |
32 | Wells Fargo Global Small Cap Fund

For more information
More information about Wells Fargo Funds is available free upon request. To obtain literature, please write, visit the Fund’s website, or call:
Wells Fargo Funds
P.O. Box 219967
Kansas City, MO 64121-9967
Website:wfam.com
Individual investors:1-800-222-8222
Retail investment professionals:1-888-877-9275
Institutional investment professionals:1-866-765-0778

This report and the financial statements contained herein are submitted for the general information of the shareholders of the Fund. If this report is used for promotional purposes, distribution of the report must be accompanied or preceded by a current prospectus. Before investing, please consider the investment objectives, risks, charges, and expenses of the investment. For a current prospectus and, if available, a summary prospectus, containing this information, call1-800-222-8222 or visit the Fund’s website atwfam.com. Read the prospectus carefully before you invest or send money.
Wells Fargo Asset Management (WFAM) is the trade name for certain investment advisory/management firms owned by Wells Fargo & Company. These firms include but are not limited to Wells Capital Management Incorporated and Wells Fargo Funds Management, LLC. Certain products managed by WFAM entities are distributed by Wells Fargo Funds Distributor, LLC (a broker-dealer and Member FINRA).
This material is for general informational and educational purposes only and is NOT intended to provide investment advice or a recommendation of any kind—including a recommendation for any specific investment, strategy, or plan.
INVESTMENT PRODUCTS: NOT FDIC INSURED ◾ NO BANK GUARANTEE ◾ MAY LOSE VALUE
© 2019 Wells Fargo & Company. All rights reserved.
PAR-0520-00416 06-20
SA239/SAR239 04-20
Semi-Annual Report
April 30, 2020
Wells Fargo
Intrinsic World Equity Fund
Beginning on January 1, 2021, as permitted by new regulations adopted by the Securities and Exchange Commission, paper copies of the Wells Fargo Funds’ annual and semi-annual shareholder reports issued after this date will no longer be sent by mail, unless you specifically request paper copies of the reports. Instead, the reports will be made available on the Funds’ website, and you will be notified by mail each time a report is posted and provided with a website address to access the report.
If you already elected to receive shareholder reports electronically, you will not be affected by this change and you need not take any action. You may elect to receive shareholder reports and other communications from the Fund electronically at any time by contacting your financial intermediary (such as a broker-dealer or bank) or, if you are a direct investor, by calling1-800-222-8222 or by enrolling at wellsfargo.com/advantagedelivery.
You may elect to receive all future reports in paper free of charge. If you invest through a financial intermediary, you can contact your financial intermediary to request that you continue to receive paper copies of your shareholder reports; if you invest directly with the Fund, you can call 1-800-222-8222. Your election to receive reports in paper will apply to all Wells Fargo Funds held in your account with your financial intermediary or, if you are a direct investor, to all Wells Fargo Funds that you hold.
|
|
|
Reduce clutter. Save trees. |
Sign up for electronic
delivery of prospectuses and
shareholder reports atwellsfargo.com/
advantagedelivery |
The views expressed and any forward-looking statements are as of April 30, 2020, unless otherwise noted, and are those of the Fund managers and/or Wells Fargo Asset Management. Discussions of individual securities, or the markets generally, or any Wells Fargo Fund are not intended as individual recommendations. Future events or results may vary significantly from those expressed in any forward-looking statements. The views expressed are subject to change at any time in response to changing circumstances in the market. Wells Fargo Asset Management and the Fund disclaim any obligation to publicly update or revise any views expressed or forward-looking statements.
INVESTMENT PRODUCTS: NOT FDIC INSURED ◾ NO BANK GUARANTEE ◾ MAY LOSE VALUE
Wells Fargo Intrinsic World Equity Fund | 1
Letter to shareholders (unaudited)

Andrew Owen
President
Wells Fargo Funds
“The period began with a tailwind created by central bank support.”
Dear Shareholder:
We are pleased to offer you this semi-annual report for the Wells Fargo Intrinsic World Equity Fund for the six-month period that ended April 30, 2020. Global stock markets saw earlier gains erased in February and March as governments took unprecedented measures to stop the spread of the coronavirus at the expense of short-term economic output. Markets rebounded in April to lessen the losses as central banks attempted to bolster capital markets and confidence. Fixed-income markets performed better, with the exception of high-yield bonds, as U.S. bonds overall achieved modest gains.
For the six-month period, U.S. stocks, based on the S&P 500 Index,1 returned -3.16% and international stocks, as measured by the MSCI ACWI ex USA Index (Net),2 fell 13.22%. The MSCI Emerging Markets Index (Net)3 lost 10.50%. For bond investors, the Bloomberg Barclays U.S. Aggregate Bond Index4 added 4.86%, the Bloomberg Barclays Global Aggregate ex-USD Index5 returned -0.97%, the Bloomberg Barclays Municipal Bond Index6 returned -1.33%, and the ICE BofA U.S. High Yield Index7 lost 7.68%.
The period began with a tailwind created by central bank support.
The period began with a tailwind that had been created by U.S. Federal Reserve (Fed) rate cuts in the summer and early fall. Equity markets rallied in November despite ongoing geopolitical risks. Hopes for a U.S.-China trade deal buoyed investor confidence. U.S. business sentiment edged up, and manufacturing and services activity rose. With that positive backdrop, developed market equities outpaced those in emerging markets, and U.S. stocks outperformed non-U.S. stocks overall. While consumer confidence and purchasing manager activity rose in the eurozone, China reported weakening manufacturing and consumer data. Bond yields rose marginally, leading to slightly negative returns for global government and investment-grade corporate bonds.
Financial markets ended 2019 with a boost from the U.S. and China accord on a Phase One trade deal. That, along with the landslide win by the pro-Brexit U.K. Conservative Party in a national election and ongoing central bank support, gave investors greater confidence. U.S. economic indicators were positive overall, with the exception of manufacturing activity and business confidence. Consumer confidence was resilient, fed by a robust labor market, tame inflation, and lower interest rates, which boosted housing affordability and stimulated homebuyer activity. The impeachment of U.S. President Donald Trump had little impact on markets. Meanwhile, slowing Chinese economic activity, partly attributable to the trade war, led to further government stimulus at year-end through lower reserve ratios, allowing banks to lend more money.
The year-end rally continued in early January 2020. However, capital market volatility spiked in late January on concerns over the potential impact of the coronavirus on the global economy and stock markets. With sentiment somewhat souring, perceived safe
| 1 | The S&P 500 Index consists of 500 stocks chosen for market size, liquidity, and industry group representation. It is a market-value-weighted index with each stock’s weight in the index proportionate to its market value. You cannot invest directly in an index. |
| 2 | The Morgan Stanley Capital International (MSCI) All Country World Index (ACWI) ex USA Index (Net) is a free-float-adjusted market-capitalization-weighted index that is designed to measure the equity market performance of developed markets, excluding the United States. Source: MSCI. MSCI makes no express or implied warranties or representations and shall have no liability whatsoever with respect to any MSCI data contained herein. The MSCI data may not be further redistributed or used as a basis for other indices or any securities or financial products. This report is not approved, reviewed, or produced by MSCI. You cannot invest directly in an index. |
| 3 | The MSCI Emerging Markets (EM) Index (Net) is a free-float-adjusted market-capitalization-weighted index that is designed to measure equity market performance of emerging markets. You cannot invest directly in an index. |
| 4 | The Bloomberg Barclays U.S. Aggregate Bond Index is a broad-based benchmark that measures the investment-grade, U.S. dollar-denominated, fixed-rate taxable bond market, including Treasuries, government-related and corporate securities, mortgage-backed securities (agency fixed-rate and hybrid adjustable-rate mortgage pass-throughs), asset-backed securities, and commercial mortgage-backed securities. You cannot invest directly in an index. |
| 5 | The Bloomberg Barclays Global Aggregate ex-USD Index is an unmanaged index that provides a broad-based measure of the global investment-grade fixed-income markets excluding the U.S. dollar-denominated debt market. You cannot invest directly in an index. |
| 6 | The Bloomberg Barclays Municipal Bond Index is an unmanaged index composed of long-term tax-exempt bonds with a minimum credit rating of Baa. You cannot invest directly in an index. |
| 7 | The ICE BofA U.S. High Yield Index is a market-capitalization-weighted index of domestic and Yankee high-yield bonds. The index tracks the performance of high-yield securities traded in the U.S. bond market. You cannot invest directly in an index. Copyright 2020. ICE Data Indices, LLC. All rights reserved. |
2 | Wells Fargo Intrinsic World Equity Fund
Letter to shareholders (unaudited)
havens did well in January. The U.S. dollar and Japanese yen both rose, and government bonds outperformed equities. While the S&P 500 Index held its ground, emerging market equities tumbled, including those in Asia.
In February, the coronavirus became the major market focus. Fears of the virus’s impact on global growth led to expectations of increased global central bank monetary policy support. That led the 10-year U.S. Treasury yield to fall to an all-time low of 1.1% by the end of the month. Although equity markets initially shrugged off concerns about the outbreak, focusing instead on strong fourth-quarter earnings and improving business confidence in January, market sentiment turned sharply lower toward month-end. Oil prices tumbled as Russia and the Organization of the Petroleum Exporting Countries compounded a major decline in oil demand with a brutal price war, causing the price of West Texas Intermediate crude oil to fall 13% in February alone.
The global spread of the coronavirus led many countries to clamp down on social and business-related activity in order to contain the virus from causing even greater devastation and overwhelming the health care system. This abrupt stoppage of economic activity led to the sharp deceleration of global output, sending economies into a deep contraction. Central bank responses were swift, as they slashed interest rates and expanded quantitative easing programs to restore liquidity and confidence to the markets. In the U.S., the Fed launched several lending programs, funding investment-grade bonds, money market mutual funds, and commercial paper while purchasing Treasuries, mortgage-backed securities, and overnight repurchase agreements. Meanwhile, stock markets tumbled quickly into a bear market, ending the longest bull stock market in U.S. history.
Markets rebounded strongly in April after the extreme volatility of the previous two months, with the S&P 500 Index gaining 12.8% for the month and the MSCI ACWI ex USA Index (Net) returning 7.6%. The rebound was fueled by unprecedented stimulus measures taken by governments and central banks to buffer the economic damage created by mass shutdowns to try to contain the virus’s spread. The U.S. economy contracted by an annualized 4.8% pace in the first quarter, with 30 million new unemployment insurance claims in six weeks. In the eurozone, first-quarter real gross domestic product (GDP) shrank 3.8%, with the composite April Flash Purchasing Managers’ Index, a monthly survey of purchasing managers, falling to an all-time low of 13.5. The European Central Bank expanded its quantitative easing to include the purchase of additional government bonds of countries with the greatest virus-related need, including Italy and Spain. China’s first-quarter GDP fell by 6.8% year over year. However, retail sales, production, and investment showed signs of recovery. Extreme oil price volatility continued as global supply far exceeded demand.
Don’t let short-term uncertainty derail long-term investment goals.
Periods of investment uncertainty can present challenges, but experience has taught us that maintaining long-term investment goals can be an effective way to plan for the future. To help you create a sound strategy based on your personal goals and risk tolerance, Wells Fargo Funds offers more than 100 mutual funds spanning a wide range of asset classes and investment styles. Although diversification cannot guarantee an investment profit or prevent losses, we believe it can be an effective way to manage investment risk and potentially smooth out overall portfolio performance. We encourage investors to know their investments and to understand that appropriate levels of risk-taking may unlock opportunities.
Thank you for choosing to invest with Wells Fargo Funds. We appreciate your confidence in us and remain committed to helping you meet your financial needs.
Sincerely,

Andrew Owen
President
Wells Fargo Funds
“The global spread of the coronavirus led many countries to clamp down on social and business-related activity in order to contain the virus from causing even greater devastation and overwhelming the health care system.”
|
|
|
For further information about your Fund, contact your investment professional, visit our website at wfam.com, or call us directly at1-800-222-8222. |
Wells Fargo Intrinsic World Equity Fund | 3
Performance highlights (unaudited)
Investment objective
The Fund seeks long-term capital appreciation.
Manager
Wells Fargo Funds Management, LLC
Subadviser
Wells Capital Management Incorporated
Portfolio managers
Miguel E. Giaconi, CFA®‡
Amit Kumar
Jean-Baptiste Nadal, CFA®‡
Average annual total returns (%) as of April 30, 20201
| | | | | | | | | | | | | | | | | | | | | | | | | | | | | | | | | | |
| | | | |
| | | | | Including sales charge | | | Excluding sales charge | | | Expense ratios2 (%) | |
| | | | | | | | | |
| | | Inception date | | 1 year | | | 5 year | | | 10 year | | | 1 year | | | 5 year | | | 10 year | | | Gross | | | Net3 | |
| | | | | | | | | | |
| Class A (EWEAX) | | 4-30-1996 | | | -16.14 | | | | 1.80 | | | | 6.65 | | | | -11.01 | | | | 3.01 | | | | 7.28 | | | | 1.47 | | | | 1.35 | |
| | | | | | | | | | |
| Class C (EWECX) | | 5-18-2007 | | | -12.63 | | | | 2.25 | | | | 6.49 | | | | -11.63 | | | | 2.25 | | | | 6.49 | | | | 2.22 | | | | 2.10 | |
| | | | | | | | | | |
| Administrator Class (EWEIX) | | 5-18-2007 | | | – | | | | – | | | | – | | | | -10.87 | | | | 3.14 | | | | 7.49 | | | | 1.39 | | | | 1.25 | |
| | | | | | | | | | |
| Institutional Class (EWENX)4 | | 7-30-2010 | | | – | | | | – | | | | – | | | | -10.62 | | | | 3.43 | | | | 7.74 | | | | 1.14 | | | | 0.95 | |
| | | | | | | | | | |
| MSCI World Index (Net)5 | | – | | | – | | | | – | | | | – | | | | -4.00 | | | | 4.92 | | | | 7.68 | | | | – | | | | – | |
Figures quoted represent past performance, which is no guarantee of future results, and do not reflect taxes that a shareholder may pay on an investment in a fund. Investment return and principal value of an investment will fluctuate so that an investor’s shares, when redeemed, may be worth more or less than their original cost. Performance shown without sales charges would be lower if sales charges were reflected. Current performance may be lower or higher than the performance data quoted, which assumes the reinvestment of dividends and capital gains. Currentmonth-end performance is available on the Fund’s website,wfam.com.
Index returns do not include transaction costs associated with buying and selling securities, any mutual fund fees or expenses, or any taxes. It is not possible to invest directly in an index.
For Class A shares, the maximumfront-end sales charge is 5.75%. For Class C shares, the maximum contingent deferred sales charge is 1.00%. Performance including a contingent deferred sales charge assumes the sales charge for the corresponding time period. Administrator Class and Institutional Class shares are sold without afront-end sales charge or contingent deferred sales charge.
Stock values fluctuate in response to the activities of individual companies and general market and economic conditions. Foreign investments are especially volatile and can rise or fall dramatically due to differences in the political and economic conditions of the host country. These risks are generally intensified in emerging markets. The use of derivatives may reduce returns and/or increase volatility. Certain investment strategies tend to increase the total risk of an investment (relative to the broader market). The Fund is exposed to focused portfolio risk, geographic risk, and smaller company securities risk. Consult the Fund’s prospectus for additional information on these and other risks.
Please see footnotes on page 5.
4 | Wells Fargo Intrinsic World Equity Fund
Performance highlights (unaudited)
| | | | |
| |
| Ten largest holdings (%) as of April 30, 20206 | | | |
| | |
Microsoft Corporation | | | 5.02 | |
| | |
Alphabet Incorporated Class C | | | 3.89 | |
| | |
Visa Incorporated Class A | | | 3.85 | |
| | |
Amazon.com Incorporated | | | 3.56 | |
| | |
Cigna Corporation | | | 2.99 | |
| | |
Motorola Solutions Incorporated | | | 2.76 | |
| | |
Medtronic plc | | | 2.69 | |
| | |
Merck & Company Incorporated | | | 2.67 | |
| | |
Northrop Grumman Corporation | | | 2.54 | |
| | |
Intercontinental Exchange Incorporated | | | 2.51 | |
|
|
| Sector allocation as of April 30, 20207 |
|
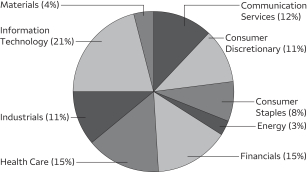 |
|
|
| Country allocation as of April 30, 20207 |
|
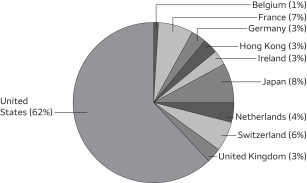 |
| ‡ | CFA® and Chartered Financial Analyst®are trademarks owned by CFA Institute. |
| 1 | Historical performance prior to July 19, 2010, is based on the performance of the Fund’s predecessor, Evergreen Intrinsic World Equity Fund. |
| 2 | Reflects the expense ratios as stated in the most recent prospectuses. The expense ratios shown are subject to change and may differ from the annualized expense ratios shown in the financial highlights of this report. |
| 3 | The manager has contractually committed through February 28, 2021, to waive fees and/or reimburse expenses to the extent necessary to cap total annual fund operating expenses after fee waivers at 1.35% for Class A, 2.10% for Class C, 1.25% for Administrator Class, and 0.95% for Institutional Class. Brokerage commissions, stamp duty fees, interest, taxes, acquired fund fees and expenses (if any), and extraordinary expenses are excluded from the expense cap. Prior to or after the commitment expiration date, the cap may be increased or the commitment to maintain the cap may be terminated only with the approval of the Board of Trustees. Without this cap, the Fund’s returns would have been lower. The expense ratio paid by an investor is the net expense ratio (the total annual fund operating expenses after fee waivers) as stated in the prospectuses. |
| 4 | Historical performance shown for the Institutional Class shares prior to their inception reflects the performance of the Administrator Class shares, and includes the higher expenses applicable to the Administrator Class shares. If these expenses had not been included, returns for the Institutional Class shares would be higher. |
| 5 | The Morgan Stanley Capital International (MSCI) World Index (Net) is a free-float-adjusted market-capitalization-weighted index that is designed to measure the equity market performance of developed markets. Source: MSCI. MSCI makes no express or implied warranties or representations and shall have no liability whatsoever with respect to any MSCI data contained herein. The MSCI data may not be further redistributed or used as a basis for other indices or any securities or financial products. This report is not approved, reviewed, or produced by MSCI. You cannot invest directly in an index. |
| 6 | The ten largest holdings, excluding cash, cash equivalents and any money market funds, are calculated based on the value of the investments divided by total net assets of the Fund. Holdings are subject to change and may have changed since the date specified. |
| 7 | Amounts are calculated based on the total long-term investments of the Fund. These amounts are subject to change and may have changed since the date specified. |
Wells Fargo Intrinsic World Equity Fund | 5
Fund expenses (unaudited)
As a shareholder of the Fund, you incur two types of costs: (1) transaction costs, including sales charges (loads) on purchase payments and contingent deferred sales charges (if any) on redemptions and (2) ongoing costs, including management fees, distribution(12b-1) and/or shareholder servicing fees, and other Fund expenses. This example is intended to help you understand your ongoing costs (in dollars) of investing in the Fund and to compare these costs with the ongoing costs of investing in other mutual funds.
The example is based on an investment of $1,000 invested at the beginning of thesix-month period and held for the entire period from November 1, 2019 to April 30, 2020.
Actual expenses
The “Actual” line of the table below provides information about actual account values and actual expenses. You may use the information in this line, together with the amount you invested, to estimate the expenses that you paid over the period. Simply divide your account value by $1,000 (for example, an $8,600 account value divided by $1,000 = 8.6), then multiply the result by the number in the “Actual” line under the heading entitled “Expenses paid during period” for your applicable class of shares to estimate the expenses you paid on your account during this period.
Hypothetical example for comparison purposes
The “Hypothetical” line of the table below provides information about hypothetical account values and hypothetical expenses based on the Fund’s actual expense ratio and an assumed rate of return of 5% per year before expenses, which is not the Fund’s actual return. The hypothetical account values and expenses may not be used to estimate the actual ending account balance or expenses you paid for the period. You may use this information to compare the ongoing costs of investing in the Fund and other funds. To do so, compare this 5% hypothetical example with the 5% hypothetical examples that appear in the shareholder reports of the other funds.
Please note that the expenses shown in the table are meant to highlight your ongoing costs only and do not reflect any transactional costs, such as sales charges (loads) and contingent deferred sales charges. Therefore, the “Hypothetical” line of the table is useful in comparing ongoing costs only and will not help you determine the relative total costs of owning different funds. In addition, if these transactional costs were included, your costs would have been higher.
| | | | | | | | | | | | | | | | |
| | | Beginning account value
11-1-2019 | | | Ending account value 4-30-2020 | | | Expenses paid during the period¹ | | | Annualized net expense ratio | |
| | | | | |
Class A | | | | | | | | | | | | | | | | |
| | | | |
Actual | | $ | 1,000.00 | | | $ | 856.89 | | | $ | 6.19 | | | | 1.34 | % |
| | | | |
Hypothetical (5% return before expenses) | | $ | 1,000.00 | | | $ | 1,018.20 | | | $ | 6.72 | | | | 1.34 | % |
| | | | | |
Class C | | | | | | | | | | | | | | | | |
| | | | |
Actual | | $ | 1,000.00 | | | $ | 854.01 | | | $ | 9.68 | | | | 2.10 | % |
| | | | |
Hypothetical (5% return before expenses) | | $ | 1,000.00 | | | $ | 1,014.42 | | | $ | 10.52 | | | | 2.10 | % |
| | | | | |
Administrator Class | | | | | | | | | | | | | | | | |
| | | | |
Actual | | $ | 1,000.00 | | | $ | 857.28 | | | $ | 5.63 | | | | 1.22 | % |
| | | | |
Hypothetical (5% return before expenses) | | $ | 1,000.00 | | | $ | 1,018.80 | | | $ | 6.12 | | | | 1.22 | % |
| | | | | |
Institutional Class | | | | | | | | | | | | | | | | |
| | | | |
Actual | | $ | 1,000.00 | | | $ | 858.55 | | | $ | 4.39 | | | | 0.95 | % |
| | | | |
Hypothetical (5% return before expenses) | | $ | 1,000.00 | | | $ | 1,020.14 | | | $ | 4.77 | | | | 0.95 | % |
| 1 | Expenses paid is equal to the annualized net expense ratio of each class multiplied by the average account value over the period, multiplied by the number of days in the most recent fiscal half-year divided by the number of days in the fiscal year (to reflect theone-half-year period). |
6 | Wells Fargo Intrinsic World Equity Fund
Portfolio of investments—April 30, 2020 (unaudited)
| | | | | | | | | | | | | | | | |
| | | | | | | | | Shares | | | Value | |
| Common Stocks: 99.60% | |
|
| Belgium: 1.12% | |
Anheuser-Busch InBev NV ADR (Consumer Staples, Beverages) | | | | | | | | | | | 29,600 | | | $ | 1,376,992 | |
| | | | | | | | | | | | | | | | |
|
| France: 6.38% | |
Air Liquide SA (Materials, Chemicals) | | | | | | | | | | | 20,300 | | | | 2,579,201 | |
AXA SA (Financials, Insurance) | | | | | | | | | | | 89,400 | | | | 1,589,218 | |
Capgemini SA (Information Technology, IT Services) | | | | | | | | | | | 28,400 | | | | 2,669,906 | |
Societe Generale SA (Financials, Banks) | | | | | | | | | | | 65,300 | | | | 1,024,493 | |
| | | | |
| | | | | | | | | | | | | | | 7,862,818 | |
| | | | | | | | | | | | | | | | |
|
| Germany: 3.03% | |
Deutsche Telekom AG (Communication Services, Diversified Telecommunication Services) † | | | | | | | | | | | 160,700 | | | | 2,349,372 | |
SAP SE (Information Technology, Software) | | | | | | | | | | | 11,600 | | | | 1,381,643 | |
| | | | |
| | | | | | | | | | | | | | | 3,731,015 | |
| | | | | | | | | | | | | | | | |
|
| Hong Kong: 3.07% | |
AIA Group Limited (Financials, Insurance) | | | | | | | | | | | 304,000 | | | | 2,790,041 | |
Samsonite International SA (Consumer Discretionary, Textiles, Apparel & Luxury Goods) 144A | | | | | | | | | | | 1,170,090 | | | | 995,307 | |
| | | | |
| | | | | | | | | | | | | | | 3,785,348 | |
| | | | | | | | | | | | | | | | |
|
| Ireland: 2.69% | |
Medtronic plc (Health Care, Health Care Equipment & Supplies) | | | | | | | | | | | 33,900 | | | | 3,309,657 | |
| | | | | | | | | | | | | | | | |
|
| Japan: 8.18% | |
Nidec Corporation (Industrials, Electrical Equipment) | | | | | | | | | | | 51,800 | | | | 3,015,488 | |
ORIX Corporation (Financials, Diversified Financial Services) | | | | | | | | | | | 157,900 | | | | 1,858,087 | |
Renesas Electronics Corporation (Information Technology, Semiconductors & Semiconductor Equipment) † | | | | | | | | | | | 400,700 | | | | 2,115,866 | |
Sony Corporation (Consumer Discretionary, Household Durables) | | | | | | | | | | | 47,840 | | | | 3,078,699 | |
| | | | |
| | | | | | | | | | | | | | | 10,068,140 | |
| | | | | | | | | | | | | | | | |
|
| Netherlands: 4.29% | |
AerCap Holdings NV (Industrials, Trading Companies & Distributors) † | | | | | | | | | | | 52,700 | | | | 1,481,924 | |
Airbus SE (Industrials, Aerospace & Defense) | | | | | | | | | | | 19,900 | | | | 1,260,038 | |
Unilever NV (Consumer Staples, Personal Products) | | | | | | | | | | | 51,300 | | | | 2,535,246 | |
| | | | |
| | | | | | | | | | | | | | | 5,277,208 | |
| | | | | | | | | | | | | | | | |
|
| Switzerland: 6.23% | |
Nestle SA (Consumer Staples, Food Products) | | | | | | | | | | | 28,400 | | | | 3,007,845 | |
Novartis AG ADR (Health Care, Pharmaceuticals) | | | | | | | | | | | 28,100 | | | | 2,380,913 | |
Roche Holding AG (Health Care, Pharmaceuticals) | | | | | | | | | | | 6,600 | | | | 2,285,562 | |
| | | | |
| | | | | | | | | | | | | | | 7,674,320 | |
| | | | | | | | | | | | | | | | |
|
| United Kingdom: 2.53% | |
Royal Dutch Shell plc Class A (Energy, Oil, Gas & Consumable Fuels) | | | | | | | | | | | 53,700 | | | | 897,565 | |
Vodafone Group plc (Communication Services, Wireless Telecommunication Services) | | | | | | | | | | | 1,568,000 | | | | 2,211,936 | |
| | | | |
| | | | | | | | | | | | | | | 3,109,501 | |
| | | | | | | | | | | | | | | | |
|
| United States: 62.08% | |
Advance Auto Parts Incorporated (Consumer Discretionary, Specialty Retail) | | | | | | | | | | | 18,200 | | | | 2,200,562 | |
Alphabet Incorporated Class C (Communication Services, Interactive Media & Services) † | | | | | | | | | | | 3,550 | | | | 4,787,743 | |
Amazon.com Incorporated (Consumer Discretionary, Internet & Direct Marketing Retail) † | | | | | | | | | | | 1,774 | | | | 4,388,876 | |
American International Group Incorporated (Financials, Insurance) | | | | | | | | | | | 71,800 | | | | 1,825,874 | |
Apple Incorporated (Information Technology, Technology Hardware, Storage & Peripherals) | | | | | | | | | | | 6,500 | | | | 1,909,700 | |
The accompanying notes are an integral part of these financial statements.
Wells Fargo Intrinsic World Equity Fund | 7
Portfolio of investments—April 30, 2020 (unaudited)
| | | | | | | | | | | | | | | | |
| | | | | | | | | Shares | | | Value | |
|
| United States (continued) | |
Bank of America Corporation (Financials, Banks) | | | | | | | | | | | 98,300 | | | $ | 2,364,115 | |
Chevron Corporation (Energy, Oil, Gas & Consumable Fuels) | | | | | | | | | | | 20,800 | | | | 1,913,600 | |
Cigna Corporation (Health Care, Health Care Providers & Services) | | | | | | | | | | | 18,800 | | | | 3,680,664 | |
Comcast Corporation Class A (Communication Services, Media) | | | | | | | | | | | 79,800 | | | | 3,002,874 | |
Dollar Tree Incorporated (Consumer Discretionary, Multiline Retail) † | | | | | | | | | | | 26,200 | | | | 2,087,354 | |
Eli Lilly & Company (Health Care, Pharmaceuticals) | | | | | | | | | | | 10,200 | | | | 1,577,328 | |
EOG Resources Incorporated (Energy, Oil, Gas & Consumable Fuels) | | | | | | | | | | | 20,950 | | | | 995,335 | |
Honeywell International Incorporated (Industrials, Industrial Conglomerates) | | | | | | | | | | | 18,400 | | | | 2,610,960 | |
Intercontinental Exchange Incorporated (Financials, Capital Markets) | | | | | | | | | | | 34,500 | | | | 3,086,025 | |
Marsh & McLennan Companies Incorporated (Financials, Insurance) | | | | | | | | | | | 23,200 | | | | 2,258,056 | |
Merck & Company Incorporated (Health Care, Pharmaceuticals) | | | | | | | | | | | 41,500 | | | | 3,292,610 | |
Microsoft Corporation (Information Technology, Software) | | | | | | | | | | | 34,500 | | | | 6,182,743 | |
Mondelez International Incorporated Class A (Consumer Staples, Food Products) | | | | | | | | | | | 56,400 | | | | 2,901,216 | |
Motorola Solutions Incorporated (Information Technology, Communications Equipment) | | | | | | | | | | | 23,600 | | | | 3,393,916 | |
Northrop Grumman Corporation (Industrials, Aerospace & Defense) | | | | | | | | | | | 9,450 | | | | 3,124,832 | |
ON Semiconductor Corporation (Information Technology, Semiconductors & Semiconductor Equipment) † | | | | | | | | | | | 178,700 | | | | 2,867,242 | |
Stryker Corporation (Health Care, Health Care Equipment & Supplies) | | | | | | | | | | | 12,400 | | | | 2,311,732 | |
The Walt Disney Company (Communication Services, Entertainment) | | | | | | | | | | | 25,900 | | | | 2,801,085 | |
Truist Financial Corporation (Financials, Banks) | | | | | | | | | | | 52,500 | | | | 1,959,300 | |
United Parcel Service Incorporated Class B (Industrials, Air Freight & Logistics) | | | | | | | | | | | 11,800 | | | | 1,116,988 | |
Visa Incorporated Class A (Information Technology, IT Services) | | | | | | | | | | | 26,500 | | | | 4,736,080 | |
Vulcan Materials Company (Materials, Construction Materials) | | | | | | | | | | | 16,600 | | | | 1,875,302 | |
Waste Management Incorporated (Industrials, Commercial Services & Supplies) | | | | | | | | | | | 12,000 | | | | 1,200,240 | |
| | | | |
| | | | | | | | | | | | | | | 76,452,352 | |
| | | | | | | | | | | | | | | | |
| | | | |
Total Common Stocks (Cost $104,447,545) | | | | | | | | | | | | | | | 122,647,351 | |
| | | | | | | | | | | | | | | | |
| | | | |
| | | | | | | | | | | | | | | | |
| | | Yield | | | | | | | | | | |
| Short-Term Investments: 0.10% | | | | | | | | | | | | |
| | | | |
| Investment Companies: 0.10% | | | | | | | | | | | | |
Wells Fargo Government Money Market Fund Select Class (l)(u) | | | 0.19 | % | | | | | | | 126,480 | | | | 126,480 | |
| | | | | | | | | | | | | | | | |
| | | | |
Total Short-Term Investments (Cost $126,480) | | | | | | | | | | | | | | | 126,480 | |
| | | | | | | | | | | | | | | | |
| | | | | | | | |
| Total investments in securities (Cost $104,574,025) | | | 99.70 | % | | | 122,773,831 | |
| | |
Other assets and liabilities, net | | | 0.30 | | | | 373,566 | |
| | | | | | | | |
| Total net assets | | | 100.00 | % | | $ | 123,147,397 | |
| | | | | | | | |
| † | Non-income-earning security |
| 144A | The security may be resold in transactions exempt from registration, normally to qualified institutional buyers, pursuant to Rule 144A under the Securities Act of 1933. |
| (l) | The issuer of the security is an affiliated person of the Fund as defined in the Investment Company Act of 1940. |
| (u) | The rate represents the7-day annualized yield at period end. |
Abbreviations:
| ADR | American depositary receipt |
The accompanying notes are an integral part of these financial statements.
8 | Wells Fargo Intrinsic World Equity Fund
Portfolio of investments—April 30, 2020 (unaudited)
Investments in Affiliates
An affiliated investment is an investment in which the Fund owns at least 5% of the outstanding voting shares of the issuer or as a result of other relationships, such as the Fund and the issuer having the same investment manager. Transactions with issuers that were either affiliated persons of the Fund at the beginning of the period or the end of the period were as follows:
| | | | | | | | | | | | | | | | | | | | | | | | | | | | | | | | | | | | |
| | | Shares,
beginning of
period | | | Shares
purchased | | | Shares
sold | | | Shares,
end of
period | | | Net
realized
gains
(losses) | | | Net
change in
unrealized
gains
(losses) | | | Income
from
affiliated
securities | | | Value,
end of
period | | | % of
net
assets | |
| | | | | | | | | |
| Short-Term Investments | | | | | | | | | | | | | | | | | | | | | | | | | | | |
Investment Companies | | | | | | | | | | | | | | | | | | | | | | | | | | | | | | | | | | | | |
Securities Lending Cash Investments LLC * | | | 1,698,009 | | | | 15,782,754 | | | | (17,480,763 | ) | | | 0 | | | $ | (156 | ) | | $ | 0 | | | $ | 16,392 | # | | $ | 0 | | | | | |
Wells Fargo Government Money Market Fund Select Class | | | 1,542,025 | | | | 12,140,923 | | | | (13,556,468 | ) | | | 126,480 | | | | 0 | | | | 0 | | | | 4,267 | | | | 126,480 | | | | | |
| | | | | | | | | | | | | | | | | | | | | | | | | | | | | | | | | | | | |
| | | | | | | | | | | | | | | | | | $ | (156 | ) | | $ | 0 | | | $ | 20,659 | | | $ | 126,480 | | | | 0.10 | % |
| | | | | | | | | | | | | | | | | | | | | | | | | | | | | | | | | | | | |
| * | No longer held at the end of the period |
| # | Amount shown represents income before fees and rebates. |
The accompanying notes are an integral part of these financial statements.
Wells Fargo Intrinsic World Equity Fund | 9
Statement of assets and liabilities—April 30, 2020 (unaudited)
| | | | |
| | | | |
| |
Assets | | | | |
Investments in unaffiliated securities, at value (cost $104,447,545) | | $ | 122,647,351 | |
Investments in affiliated securities, at value (cost $126,480) | | | 126,480 | |
Foreign currency, at value (cost $51,227) | | | 51,714 | |
Receivable for investments sold | | | 354,943 | |
Receivable for Fund shares sold | | | 17,024 | |
Receivable for dividends | | | 281,000 | |
Receivable for securities lending income, net | | | 99 | |
| | | | |
Total assets | | | 123,478,611 | |
| | | | |
| |
Liabilities | | | | |
Payable for Fund shares redeemed | | | 114,952 | |
Management fee payable | | | 65,902 | |
Administration fees payable | | | 19,591 | |
Distribution fee payable | | | 436 | |
Shareholder report expenses payable | | | 22,275 | |
Custody and accounting fees payable | | | 41,639 | |
Shareholder servicing fees payable | | | 22,387 | |
Professional fees payable | | | 23,884 | |
Trustees’ fees and expenses payable | | | 8,826 | |
Accrued expenses and other liabilities | | | 11,322 | |
| | | | |
Total liabilities | | | 331,214 | |
| | | | |
Total net assets | | $ | 123,147,397 | |
| | | | |
| |
Net assets consist of | | | | |
Paid-in capital | | $ | 103,878,758 | |
Total distributable earnings | | | 19,268,639 | |
| | | | |
Total net assets | | $ | 123,147,397 | |
| | | | |
| |
Computation of net asset value and offering price per share | | | | |
Net assets – Class A | | $ | 112,916,142 | |
Shares outstanding – Class A1 | | | 6,142,781 | |
Net asset value per share – Class A | | | $18.38 | |
Maximum offering price per share – Class A2 | | | $19.50 | |
Net assets – Class C | | $ | 763,703 | |
Shares outstanding – Class C1 | | | 43,525 | |
Net asset value per share – Class C | | | $17.55 | |
Net assets – Administrator Class | | $ | 1,263,588 | |
Shares outstanding – Administrator Class1 | | | 69,086 | |
Net asset value per share – Administrator Class | | | $18.29 | |
Net assets – Institutional Class | | $ | 8,203,964 | |
Shares outstanding – Institutional Class1 | | | 447,503 | |
Net asset value per share – Institutional Class | | | $18.33 | |
| 1 | The Fund has an unlimited number of authorized shares. |
| 2 | Maximum offering price is computed as 100/94.25 of net asset value. On investments of $50,000 or more, the offering price is reduced. |
The accompanying notes are an integral part of these financial statements.
10 | Wells Fargo Intrinsic World Equity Fund
Statement of operations—six months ended April 30, 2020 (unaudited)
| | | | |
| | | | |
| |
Investment income | | | | |
Dividends (net of foreign withholding taxes of $76,467) | | $ | 1,227,226 | |
Income from affiliated securities | | | 10,644 | |
| | | | |
Total investment income | | | 1,237,870 | |
| | | | |
| |
Expenses | | | | |
Management fee | | | 602,032 | |
Administration fees | | | | |
Class A | | | 136,166 | |
Class C | | | 1,062 | |
Administrator Class | | | 971 | |
Institutional Class | | | 6,154 | |
Shareholder servicing fees | |
Class A | | | 162,101 | |
Class C | | | 1,261 | |
Administrator Class | | | 1,849 | |
Distribution fee | |
Class C | | | 3,777 | |
Custody and accounting fees | | | 19,651 | |
Professional fees | | | 24,304 | |
Registration fees | | | 33,734 | |
Shareholder report expenses | | | 18,402 | |
Trustees’ fees and expenses | | | 10,969 | |
Other fees and expenses | | | 9,540 | |
| | | | |
Total expenses | | | 1,031,973 | |
Less: Fee waivers and/or expense reimbursements | | | | |
Fund-level | | | (97,050 | ) |
| | | | |
Net expenses | | | 934,923 | |
| | | | |
Net investment income | | | 302,947 | |
| | | | |
| |
Realized and unrealized gains (losses) on investments | | | | |
Net realized gains (losses) on | |
Unaffiliated securities | | | 1,916,077 | |
Affiliated securities | | | (156 | ) |
| | | | |
Net realized gains on investments | | | 1,915,921 | |
Net change in unrealized gains (losses) on investments | | | (23,380,100 | ) |
| | | | |
Net realized and unrealized gains (losses) on investments | | | (21,464,179 | ) |
| | | | |
Net decrease in net assets resulting from operations | | $ | (21,161,232 | ) |
| | | | |
The accompanying notes are an integral part of these financial statements.
Wells Fargo Intrinsic World Equity Fund | 11
Statement of changes in net assets
| | | | | | | | | | | | | | | | |
| | | Six months ended
April 30, 2020 (unaudited) | | | Year ended
October 31, 2019 | |
| | | | |
Operations | | | | | | | | | | | | | | | | |
Net investment income | | | | | | $ | 302,947 | | | | | | | $ | 1,199,906 | |
Net realized gains (losses) on investments | | | | | | | 1,915,921 | | | | | | | | (425,308 | ) |
Net change in unrealized gains (losses) on investments | | | | | | | (23,380,100 | ) | | | | | | | 15,848,146 | |
| | | | |
Net increase (decrease) in net assets resulting from operations | | | | | | | (21,161,232 | ) | | | | | | | 16,622,744 | |
| | | | |
| | | | |
Distributions to shareholders from net investment income and net realized gains | | | | | | | | | | | | | | | | |
Class A | | | | | | | (796,359 | ) | | | | | | | (14,576,126 | ) |
Class C | | | | | | | 0 | | | | | | | | (592,441 | ) |
Administrator Class | | | | | | | (11,384 | ) | | | | | | | (175,917 | ) |
Institutional Class | | | | | | | (97,694 | ) | | | | | | | (858,807 | ) |
| | | | |
Total distributions to shareholders | | | | | | | (905,437 | ) | | | | | | | (16,203,291 | ) |
| | | | |
| | | | |
Capital share transactions | | | Shares | | | | | | | | Shares | | | | | |
Proceeds from shares sold | | | | | | | | | | | | | | | | |
Class A | | | 74,979 | | | | 1,524,636 | | | | 290,011 | | | | 5,707,019 | |
Class C | | | 2,489 | | | | 46,339 | | | | 13,297 | | | | 265,090 | |
Administrator Class | | | 3,569 | | | | 77,486 | | | | 1,768 | | | | 36,870 | |
Institutional Class | | | 54,512 | | | | 1,111,851 | | | | 191,017 | | | | 3,930,471 | |
| | | | |
| | | | | | | 2,760,312 | | | | | | | | 9,939,450 | |
| | | | |
Reinvestment of distributions | | | | | | | | | | | | | | | | |
Class A | | | 34,668 | | | | 776,904 | | | | 748,086 | | | | 14,204,308 | |
Class C | | | 0 | | | | 0 | | | | 30,481 | | | | 552,615 | |
Administrator Class | | | 486 | | | | 10,839 | | | | 8,882 | | | | 167,765 | |
Institutional Class | | | 2,761 | | | | 61,615 | | | | 33,977 | | | | 643,675 | |
| | | | |
| | | | | | | 849,358 | | | | | | | | 15,568,363 | |
| | | | |
Payment for shares redeemed | | | | | | | | | | | | | | | | |
Class A | | | (400,697 | ) | | | (8,037,834 | ) | | | (696,508 | ) | | | (14,099,229 | ) |
Class C | | | (18,849 | ) | | | (354,526 | ) | | | (251,793 | ) | | | (4,719,953 | ) |
Administrator Class | | | (6,874 | ) | | | (124,627 | ) | | | (14,119 | ) | | | (284,467 | ) |
Institutional Class | | | (60,670 | ) | | | (1,155,704 | ) | | | (117,795 | ) | | | (2,393,973 | ) |
| | | | |
| | | | | | | (9,672,691 | ) | | | | | | | (21,497,622 | ) |
| | | | |
Net increase (decrease) in net assets resulting from capital share transactions | | | | | | | (6,063,021 | ) | | | | | | | 4,010,191 | |
| | | | |
Total increase (decrease) in net assets | | | | | | | (28,129,690 | ) | | | | | | | 4,429,644 | |
| | | | |
| | | | |
Net assets | | | | | | | | | | | | | | | | |
Beginning of period | | | | | | | 151,277,087 | | | | | | | | 146,847,443 | |
| | | | |
End of period | | | | | | $ | 123,147,397 | | | | | | | $ | 151,277,087 | |
| | | | |
The accompanying notes are an integral part of these financial statements.
12 | Wells Fargo Intrinsic World Equity Fund
Financial highlights
(For a share outstanding throughout each period)
| | | | | | | | | | | | | | | | | | | | | | | | |
| | | Six months ended
April 30, 2020
(unaudited) | | | Year ended October 31 | |
| CLASS A | | 2019 | | | 2018 | | | 2017 | | | 2016 | | | 2015 | |
Net asset value, beginning of period | | | $21.57 | | | | $21.70 | | | | $23.08 | | | | $19.53 | | | | $22.82 | | | | $22.39 | |
Net investment income | | | 0.04 | | | | 0.17 | 1 | | | 0.16 | | | | 0.19 | | | | 0.20 | | | | 0.19 | |
Net realized and unrealized gains (losses) on investments | | | (3.10 | ) | | | 2.09 | | | | 0.35 | | | | 4.54 | | | | (0.83 | ) | | | 0.73 | |
| | | | | | | | | | | | | | | | | | | | | | | | |
Total from investment operations | | | (3.06 | ) | | | 2.26 | | | | 0.51 | | | | 4.73 | | | | (0.63 | ) | | | 0.92 | |
Distributions to shareholders from | | | | | | | | | | | | | | | | | | | | | | | | |
Net investment income | | | (0.13 | ) | | | (0.18 | ) | | | (0.20 | ) | | | (0.23 | ) | | | (0.20 | ) | | | (0.12 | ) |
Net realized gains | | | 0.00 | | | | (2.21 | ) | | | (1.69 | ) | | | (0.95 | ) | | | (2.46 | ) | | | (0.37 | ) |
| | | | | | | | | | | | | | | | | | | | | | | | |
Total distributions to shareholders | | | (0.13 | ) | | | (2.39 | ) | | | (1.89 | ) | | | (1.18 | ) | | | (2.66 | ) | | | (0.49 | ) |
Net asset value, end of period | | | $18.38 | | | | $21.57 | | | | $21.70 | | | | $23.08 | | | | $19.53 | | | | $22.82 | |
Total return2 | | | (14.31 | )% | | | 12.02 | % | | | 2.10 | % | | | 25.44 | % | | | (2.54 | )% | | | 4.23 | % |
Ratios to average net assets (annualized) | | | | | | | | | | | | | | | | | | | | | | | | |
Gross expenses | | | 1.47 | % | | | 1.47 | % | | | 1.47 | % | | | 1.47 | % | | | 1.46 | % | | | 1.48 | % |
Net expenses | | | 1.34 | % | | | 1.35 | % | | | 1.35 | % | | | 1.35 | % | | | 1.37 | % | | | 1.40 | % |
Net investment income | | | 0.41 | % | | | 0.81 | % | | | 0.73 | % | | | 0.88 | % | | | 1.09 | % | | | 0.79 | % |
Supplemental data | | | | | | | | | | | | | | | | | | | | | | | | |
Portfolio turnover rate | | | 23 | % | | | 13 | % | | | 20 | % | | | 21 | % | | | 23 | % | | | 32 | % |
Net assets, end of period (000s omitted) | | | $112,916 | | | | $138,784 | | | | $132,207 | | | | $141,831 | | | | $127,428 | | | | $149,492 | |
| 1 | Calculated based upon average shares outstanding |
| 2 | Total return calculations do not include any sales charges. Returns for periods of less than one year are not annualized. |
The accompanying notes are an integral part of these financial statements.
Wells Fargo Intrinsic World Equity Fund | 13
Financial highlights
(For a share outstanding throughout each period)
| | | | | | | | | | | | | | | | | | | | | | | | |
| | | Six months ended
April 30, 2020
(unaudited) | | | Year ended October 31 | |
| CLASS C | | 2019 | | | 2018 | | | 2017 | | | 2016 | | | 2015 | |
Net asset value, beginning of period | | | $20.55 | | | | $20.74 | | | | $22.15 | | | | $18.77 | | | | $21.99 | | | | $21.64 | |
Net investment income (loss) | | | (0.03 | )1 | | | (0.04 | )1 | | | (0.00 | )1,2 | | | 0.03 | 1 | | | 0.05 | | | | 0.01 | 1 |
Net realized and unrealized gains (losses) on investments | | | (2.97 | ) | | | 2.06 | | | | 0.33 | | | | 4.38 | | | | (0.80 | ) | | | 0.71 | |
| | | | | | | | | | | | | | | | | | | | | | | | |
Total from investment operations | | | (3.00 | ) | | | 2.02 | | | | 0.33 | | | | 4.41 | | | | (0.75 | ) | | | 0.72 | |
Distributions to shareholders from | | | | | | | | | | | | | | | | | | | | | | | | |
Net investment income | | | 0.00 | | | | (0.00 | )3 | | | (0.05 | ) | | | (0.08 | ) | | | (0.01 | ) | | | 0.00 | |
Net realized gains | | | 0.00 | | | | (2.21 | ) | | | (1.69 | ) | | | (0.95 | ) | | | (2.46 | ) | | | (0.37 | ) |
| | | | | | | | | | | | | | | | | | | | | | | | |
Total distributions to shareholders | | | 0.00 | | | | (2.21 | ) | | | (1.74 | ) | | | (1.03 | ) | | | (2.47 | ) | | | (0.37 | ) |
Net asset value, end of period | | | $17.55 | | | | $20.55 | | | | $20.74 | | | | $22.15 | | | | $18.77 | | | | $21.99 | |
Total return4 | | | (14.60 | )% | | | 11.19 | % | | | 1.33 | % | | | 24.54 | % | | | (3.26 | )% | | | 3.41 | % |
Ratios to average net assets (annualized) | | | | | | | | | | | | | | | | | | | | | | | | |
Gross expenses | | | 2.22 | % | | | 2.22 | % | | | 2.22 | % | | | 2.22 | % | | | 2.21 | % | | | 2.23 | % |
Net expenses | | | 2.10 | % | | | 2.10 | % | | | 2.10 | % | | | 2.10 | % | | | 2.12 | % | | | 2.15 | % |
Net investment income (loss) | | | (0.35 | )% | | | (0.18 | )% | | | (0.01 | )% | | | 0.13 | % | | | 0.32 | % | | | 0.05 | % |
Supplemental data | | | | | | | | | | | | | | | | | | | | | | | | |
Portfolio turnover rate | | | 23 | % | | | 13 | % | | | 20 | % | | | 21 | % | | | 23 | % | | | 32 | % |
Net assets, end of period (000s omitted) | | | $764 | | | | $1,231 | | | | $5,556 | | | | $7,015 | | | | $7,252 | | | | $8,958 | |
| 1 | Calculated based upon average shares outstanding |
| 2 | Amount is more than $(0.005). |
| 3 | Amount is less than $0.005. |
| 4 | Total return calculations do not include any sales charges. Returns for periods of less than one year are not annualized. |
The accompanying notes are an integral part of these financial statements.
14 | Wells Fargo Intrinsic World Equity Fund
Financial highlights
(For a share outstanding throughout each period)
| | | | | | | | | | | | | | | | | | | | | | | | |
| | | Six months ended
April 30, 2020
(unaudited) | | | Year ended October 31 | |
| ADMINISTRATOR CLASS | | 2019 | | | 2018 | | | 2017 | | | 2016 | | | 2015 | |
Net asset value, beginning of period | | | $21.48 | | | | $21.60 | | | | $22.98 | | | | $19.43 | | | | $22.76 | | | | $22.33 | |
Net investment income | | | 0.05 | 1 | | | 0.19 | 1 | | | 0.15 | 1 | | | 0.20 | 1 | | | 0.24 | 1 | | | 0.23 | 1 |
Net realized and unrealized gains (losses) on investments | | | (3.09 | ) | | | 2.08 | | | | 0.39 | | | | 4.54 | | | | (0.84 | ) | | | 0.75 | |
| | | | | | | | | | | | | | | | | | | | | | | | |
Total from investment operations | | | (3.04 | ) | | | 2.27 | | | | 0.54 | | | | 4.74 | | | | (0.60 | ) | | | 0.98 | |
Distributions to shareholders from | | | | | | | | | | | | | | | | | | | | | | | | |
Net investment income | | | (0.15 | ) | | | (0.18 | ) | | | (0.23 | ) | | | (0.24 | ) | | | (0.27 | ) | | | (0.18 | ) |
Net realized gains | | | 0.00 | | | | (2.21 | ) | | | (1.69 | ) | | | (0.95 | ) | | | (2.46 | ) | | | (0.37 | ) |
| | | | | | | | | | | | | | | | | | | | | | | | |
Total distributions to shareholders | | | (0.15 | ) | | | (2.39 | ) | | | (1.92 | ) | | | (1.19 | ) | | | (2.73 | ) | | | (0.55 | ) |
Net asset value, end of period | | | $18.29 | | | | $21.48 | | | | $21.60 | | | | $22.98 | | | | $19.43 | | | | $22.76 | |
Total return2 | | | (14.27 | )% | | | 12.13 | % | | | 2.22 | % | | | 25.60 | % | | | (2.43 | )% | | | 4.51 | % |
Ratios to average net assets (annualized) | | | | | | | | | | | | | | | | | | | | | | | | |
Gross expenses | | | 1.39 | % | | | 1.39 | % | | | 1.38 | % | | | 1.38 | % | | | 1.37 | % | | | 1.34 | % |
Net expenses | | | 1.22 | % | | | 1.25 | % | | | 1.25 | % | | | 1.25 | % | | | 1.22 | % | | | 1.15 | % |
Net investment income | | | 0.53 | % | | | 0.92 | % | | | 0.65 | % | | | 0.95 | % | | | 1.27 | % | | | 1.01 | % |
Supplemental data | | | | | | | | | | | | | | | | | | | | | | | | |
Portfolio turnover rate | | | 23 | % | | | 13 | % | | | 20 | % | | | 21 | % | | | 23 | % | | | 32 | % |
Net assets, end of period (000s omitted) | | | $1,264 | | | | $1,544 | | | | $1,628 | | | | $4,727 | | | | $4,735 | | | | $6,239 | |
| 1 | Calculated based upon average shares outstanding |
| 2 | Returns for periods of less than one year are not annualized. |
The accompanying notes are an integral part of these financial statements.
Wells Fargo Intrinsic World Equity Fund | 15
Financial highlights
(For a share outstanding throughout each period)
| | | | | | | | | | | | | | | | | | | | | | | | |
| | | Six months ended
April 30, 2020
(unaudited) | | | Year ended October 31 | |
| INSTITUTIONAL CLASS | | 2019 | | | 2018 | | | 2017 | | | 2016 | | | 2015 | |
Net asset value, beginning of period | | | $21.55 | | | | $21.69 | | | | $23.05 | | | | $19.51 | | | | $22.83 | | | | $22.40 | |
Net investment income | | | 0.08 | | | | 0.27 | | | | 0.25 | 1 | | | 0.27 | | | | 0.26 | | | | 0.28 | |
Net realized and unrealized gains (losses) on investments | | | (3.09 | ) | | | 2.06 | | | | 0.35 | | | | 4.53 | | | | (0.80 | ) | | | 0.75 | |
| | | | | | | | | | | | | | | | | | | | | | | | |
Total from investment operations | | | (3.01 | ) | | | 2.33 | | | | 0.60 | | | | 4.80 | | | | (0.54 | ) | | | 1.03 | |
Distributions to shareholders from | | | | | | | | | | | | | | | | | | | | | | | | |
Net investment income | | | (0.21 | ) | | | (0.26 | ) | | | (0.27 | ) | | | (0.31 | ) | | | (0.32 | ) | | | (0.23 | ) |
Net realized gains | | | 0.00 | | | | (2.21 | ) | | | (1.69 | ) | | | (0.95 | ) | | | (2.46 | ) | | | (0.37 | ) |
| | | | | | | | | | | | | | | | | | | | | | | | |
Total distributions to shareholders | | | (0.21 | ) | | | (2.47 | ) | | | (1.96 | ) | | | (1.26 | ) | | | (2.78 | ) | | | (0.60 | ) |
Net asset value, end of period | | | $18.33 | | | | $21.55 | | | | $21.69 | | | | $23.05 | | | | $19.51 | | | | $22.83 | |
Total return2 | | | (14.14 | )% | | | 12.49 | % | | | 2.52 | % | | | 25.92 | % | | | (2.13 | )% | | | 4.72 | % |
Ratios to average net assets (annualized) | | | | | | | | | | | | | | | | | | | | | | | | |
Gross expenses | | | 1.15 | % | | | 1.14 | % | | | 1.14 | % | | | 1.14 | % | | | 1.13 | % | | | 1.09 | % |
Net expenses | | | 0.95 | % | | | 0.95 | % | | | 0.95 | % | | | 0.95 | % | | | 0.95 | % | | | 0.95 | % |
Net investment income | | | 0.80 | % | | | 1.21 | % | | | 1.10 | % | | | 1.28 | % | | | 1.47 | % | | | 1.23 | % |
Supplemental data | | | | | | | | | | | | | | | | | | | | | | | | |
Portfolio turnover rate | | | 23 | % | | | 13 | % | | | 20 | % | | | 21 | % | | | 23 | % | | | 32 | % |
Net assets, end of period (000s omitted) | | | $8,204 | | | | $9,718 | | | | $7,456 | | | | $6,681 | | | | $4,357 | | | | $5,058 | |
| 1 | Calculated based upon average shares outstanding |
| 2 | Returns for periods of less than one year are not annualized. |
The accompanying notes are an integral part of these financial statements.
16 | Wells Fargo Intrinsic World Equity Fund
Notes to financial statements (unaudited)
1. ORGANIZATION
Wells Fargo Funds Trust (the “Trust”), a Delaware statutory trust organized on March 10, 1999, is anopen-end management investment company registered under the Investment Company Act of 1940, as amended (the “1940 Act”). As an investment company, the Trust follows the accounting and reporting guidance in Financial Accounting Standards Board (“FASB”)Accounting Standards Codification Topic 946, Financial Services – Investment Companies. These financial statements report on the Wells Fargo Intrinsic World Equity Fund (the “Fund”) which is a diversified series of the Trust.
2. SIGNIFICANT ACCOUNTING POLICIES
The following significant accounting policies, which are consistently followed in the preparation of the financial statements of the Fund, are in conformity with U.S. generally accepted accounting principles which require management to make estimates and assumptions that affect the reported amounts of assets and liabilities, disclosure of contingent assets and liabilities at the date of the financial statements, and the reported amounts of revenues and expenses during the reporting period. Actual results could differ from those estimates.
Securities valuation
All investments are valued each business day as of the close of regular trading on the New York Stock Exchange (generally 4 p.m. Eastern Time), although the Fund may deviate from this calculation time under unusual or unexpected circumstances.
Equity securities that are listed on a foreign or domestic exchange or market are valued at the official closing price or, if none, the last sales price. If no sale occurs on the principal exchange or market that day, a fair value price will be determined in accordance with the Fund’s Valuation Procedures.
The values of securities denominated in foreign currencies are translated into U.S. dollars at rates provided by an independent foreign currency pricing source at a time each business day specified by the Wells Fargo Asset Management Pricing Committee at Wells Fargo Funds Management, LLC (“Funds Management”).
Many securities markets and exchanges outside the U.S. close prior to the close of the New York Stock Exchange and therefore may not fully reflect trading or events that occur after the close of the principal exchange in which the foreign securities are traded, but before the close of the New York Stock Exchange. If such trading or events are expected to materially affect the value of such securities, then fair value pricing procedures approved by the Board of Trustees of the Fund are applied. These procedures take into account multiple factors including movements in U.S. securities markets after foreign exchanges close. Foreign securities that are fair valued under these procedures are categorized as Level 2 and the application of these procedures may result in transfers between Level 1 and Level 2. Depending on market activity, such fair valuations may be frequent. Such fair value pricing may result in net asset values that are higher or lower than net asset values based on the last reported sales price or latest quoted bid price. On April 30, 2020, such fair value pricing was used in pricing certain foreign securities.
Investments in registeredopen-end investment companies are valued at net asset value. Interests innon-registered investment companies that are redeemable at net asset value are fair valued normally at net asset value.
Investments which are not valued using any of the methods discussed above are valued at their fair value, as determined in good faith by the Board of Trustees. The Board of Trustees has established a Valuation Committee comprised of the Trustees and has delegated to it the authority to take any actions regarding the valuation of portfolio securities that the Valuation Committee deems necessary or appropriate, including determining the fair value of portfolio securities, unless the determination has been delegated to the Wells Fargo Asset Management Pricing Committee.The Board of Trustees retains the authority to make or ratify any valuation decisions or approve any changes to the Valuation Procedures as it deems appropriate. On a quarterly basis, the Board of Trustees receives reports on any valuation actions taken by the Valuation Committee or the Wells Fargo Asset Management Pricing Committee which may include items for ratification.
Foreign currency translation
The accounting records of the Fund are maintained in U.S. dollars. The values of other assets and liabilities denominated in foreign currencies are translated into U.S. dollars at rates provided by an independent foreign currency pricing source at a time each business day specified by the Wells Fargo Asset Management Pricing Committee. Purchases and sales of securities, and income and expenses are converted at the rate of exchange on the respective dates of such transactions. Net realized foreign exchange gains or losses arise from sales of foreign currencies, currency gains or losses realized between the trade and settlement dates on securities transactions, and the difference between the amounts of dividends, interest and foreign withholding taxes recorded and the U.S. dollar equivalent of the amounts actually paid or received. Net unrealized foreign exchange gains and losses arise from changes in the fair value of assets and liabilities other than investments in securities resulting from changes in exchange rates. The changes in net assets arising from changes in exchange rates of securities and the
Wells Fargo Intrinsic World Equity Fund | 17
Notes to financial statements (unaudited)
changes in net assets resulting from changes in market prices of securities are not separately presented. Such changes are included in net realized and unrealized gains or losses from investments.
Securities lending
The Fund may lend its securities from time to time in order to earn additional income in the form of fees or interest on securities received as collateral or the investment of any cash received as collateral. When securities are on loan, the Fund receives interest or dividends on those securities. Cash collateral received in connection with its securities lending transactions is invested in Securities Lending Cash Investments, LLC (the “Securities Lending Fund”). Investments in Securities Lending Fund are valued at the evaluated bid price provided by an independent pricing service. Income earned from investment in the Securities Lending Fund (net of fees and rebates), if any, is included in income from affiliated securities on the Statement of Operations.
In a securities lending transaction, the net asset value of the Fund is affected by an increase or decrease in the value of the securities loaned and by an increase or decrease in the value of the instrument in which collateral is invested. The amount of securities lending activity undertaken by the Fund fluctuates from time to time. The Fund has the right under the lending agreement to recover the securities from the borrower on demand. In the event of default or bankruptcy by the borrower, the Fund may be prevented from recovering the loaned securities or gaining access to the collateral or may experience delays or costs in doing so. In such an event, the terms of the agreement allows the unaffiliated securities lending agent to use the collateral to purchase replacement securities on behalf of the Fund or pay the Fund the market value of the loaned securities. The Fund bears the risk of loss with respect to depreciation of its investment of the cash collateral.
Security transactions and income recognition
Securities transactions are recorded on a trade date basis. Realized gains or losses are recorded on the basis of identified cost.
Dividend income is recognized on theex-dividend date, except for certain dividends from foreign securities, which are recorded as soon as the custodian verifies theex-dividend date. Dividend income from foreign securities is recorded net of foreign taxes withheld where recovery of such taxes is not assured.
Distributions to shareholders
Distributions to shareholders from net investment income and any net realized gains are recorded on theex-dividend date and paid at least annually. Such distributions are determined in accordance with income tax regulations and may differ from U.S. generally accepted accounting principles. Dividend sources are estimated at the time of declaration. The tax character of distributions is determined as of the Fund’s fiscal year end. Therefore, a portion of the Fund’s distributions made prior to the Fund’s fiscal year end may be categorized as a tax return of capital at year end.
Federal and other taxes
The Fund intends to continue to qualify as a regulated investment company by distributing substantially all of its investment company taxable income and any net realized capital gains (after reduction for capital loss carryforwards) sufficient to relieve it from all, or substantially all, federal income taxes. Accordingly, no provision for federal income taxes was required.
The Fund’s income and federal excise tax returns and all financial records supporting those returns for the prior three fiscal years are subject to examination by the federal and Delaware revenue authorities. Management has analyzed the Fund’s tax positions taken on federal, state, and foreign tax returns for all open tax years and does not believe that there are any uncertain tax positions that require recognition of a tax liability.
As of April 30, 2020, the aggregate cost of all investments for federal income tax purposes was $105,210,831 and the unrealized gains (losses) consisted of:
| | | | |
| |
Gross unrealized gains | | $ | 31,884,457 | |
| |
Gross unrealized losses | | | (14,321,457 | ) |
| |
Net unrealized gains | | | 17,563,000 | |
As of October 31, 2019, the Fund had capital loss carryforward which consisted of $440,984 in long-term capital losses.
Class allocations
The separate classes of shares offered by the Fund differ principally in applicable sales charges, distribution, shareholder servicing, and administration fees. Class specific expenses are charged directly to that share class. Investment income, common fund-level expenses, and realized and unrealized gains (losses) on investments are allocated daily to each class of shares based on the relative proportion of net assets of each class.
18 | Wells Fargo Intrinsic World Equity Fund
Notes to financial statements (unaudited)
3. FAIR VALUATION MEASUREMENTS
Fair value measurements of investments are determined within a framework that has established a fair value hierarchy based upon the various data inputs utilized in determining the value of the Fund’s investments. The three-level hierarchy gives the highest priority to unadjusted quoted prices in active markets for identical assets or liabilities (Level 1) and the lowest priority to unobservable inputs (Level 3). The Fund’s investments are classified within the fair value hierarchy based on the lowest level of input that is significant to the fair value measurement. The inputs are summarized into three broad levels as follows:
| ∎ | | Level 1 – quoted prices in active markets for identical securities |
| ∎ | | Level 2 – other significant observable inputs (including quoted prices for similar securities, interest rates, prepayment speeds, credit risk, etc.) |
| ∎ | | Level 3 – significant unobservable inputs (including the Fund’s own assumptions in determining the fair value of investments) |
The inputs or methodologies used for valuing investments in securities are not necessarily an indication of the risk associated with investing in those securities.
The following is a summary of the inputs used in valuing the Fund’s assets and liabilities as of April 30, 2020:
| | | | | | | | | | | | | | | | |
| | | | |
| | | Quoted prices (Level 1) | | | Other significant observable inputs (Level 2) | | | Significant unobservable inputs (Level 3) | | | Total | |
| | | | |
Assets | | | | | | | | | | | | | | | | |
Investments in: | | | | | | | | | | | | | | | | |
| | | | |
Common stocks | | | | | | | | | | | | | | | | |
| | | | |
Belgium | | $ | 1,376,992 | | | $ | 0 | | | $ | 0 | | | $ | 1,376,992 | |
| | | | |
France | | | 0 | | | | 7,862,818 | | | | 0 | | | | 7,862,818 | |
| | | | |
Germany | | | 0 | | | | 3,731,015 | | | | 0 | | | | 3,731,015 | |
| | | | |
Hong Kong | | | 0 | | | | 3,785,348 | | | | 0 | | | | 3,785,348 | |
| | | | |
Ireland | | | 3,309,657 | | | | 0 | | | | 0 | | | | 3,309,657 | |
| | | | |
Japan | | | 0 | | | | 10,068,140 | | | | 0 | | | | 10,068,140 | |
| | | | |
Netherlands | | | 4,017,170 | | | | 1,260,038 | | | | 0 | | | | 5,277,208 | |
| | | | |
Switzerland | | | 2,380,913 | | | | 5,293,407 | | | | 0 | | | | 7,674,320 | |
| | | | |
United Kingdom | | | 0 | | | | 3,109,501 | | | | 0 | | | | 3,109,501 | |
| | | | |
United States | | | 76,452,352 | | | | 0 | | | | 0 | | | | 76,452,352 | |
| | | | |
Short-term investments | | | | | | | | | | | | | | | | |
| | | | |
Investment companies | | | 126,480 | | | | 0 | | | | 0 | | | | 126,480 | |
| | | | |
Total assets | | $ | 87,663,564 | | | $ | 35,110,267 | | | $ | 0 | | | $ | 122,773,831 | |
Additional sector, industry or geographic detail is included in the Portfolio of Investments.
For the six months ended April 30, 2020, the Fund did not have any transfers into/out of Level 3.
Wells Fargo Intrinsic World Equity Fund | 19
Notes to financial statements (unaudited)
4. TRANSACTIONS WITH AFFILIATES
Management fee
Funds Management, an indirect wholly owned subsidiary of Wells Fargo & Company (“Wells Fargo”), is the manager of the Fund and provides advisory and fund-level administrative services under an investment management agreement. Under the investment management agreement, Funds Management is responsible for, among other services, implementing the investment objectives and strategies of the Fund, supervising the subadviser and providing fund-level administrative services in connection with the Fund’s operations. As compensation for its services under the investment management agreement, Funds Management is entitled to receive a management fee at the following annual rate based on the Fund’s average daily net assets:
| | | | |
| |
| Average daily net assets | | Management fee | |
| |
First $500 million | | | 0.850 | % |
| |
Next $500 million | | | 0.800 | |
| |
Next $1 billion | | | 0.750 | |
| |
Next $2 billion | | | 0.725 | |
| |
Next $1 billion | | | 0.700 | |
| |
Next $5 billion | | | 0.690 | |
| |
Over $10 billion | | | 0.680 | |
For the six months ended April 30, 2020, the management fee was equivalent to an annual rate of 0.85% of the Fund’s average daily net assets.
Funds Management has retained the services of a subadviser to provide daily portfolio management to the Fund. The fee for subadvisory services is borne by Funds Management. Wells Capital Management Incorporated (“WellsCap”), an affiliate of Funds Management and an indirect wholly owned subsidiary of Wells Fargo, is the subadviser to the Fund and is entitled to receive a fee from Funds Management at an annual rate starting at 0.35% and declining to 0.20% as the average daily net assets of the Fund increase.
Administration fees
Under a class-level administration agreement, Funds Management provides class-level administrative services to the Fund, which includes paying fees and expenses for services provided by the transfer agent,sub-transfer agents, omnibus account servicers and record-keepers. As compensation for its services under the class-level administration agreement, Funds Management receives an annual fee which is calculated based on the average daily net assets of each class as follows:
| | | | |
| |
| | | Class-level administration fee | |
| |
Class A, Class C | | | 0.21 | % |
| |
Administrator Class, Institutional Class | | | 0.13 | |
Waivers and/or expense reimbursements
Funds Management has contractually waived and/or reimbursed management and administration fees to the extent necessary to maintain certain net operating expense ratios for the Fund. When each class of the Fund has exceeded its expense cap, Funds Management has waived fees and/or reimbursed expenses from fund-level expenses on a proportionate basis and then from class specific expenses. When only certain classes exceed their expense caps, waivers and/or reimbursements are applied against class specific expenses before fund-level expenses. Funds Management has committed through February 28, 2021 to waive fees and/or reimburse expenses to the extent necessary to cap the Fund’s expenses at 1.35% for Class A shares, 2.10% for Class C shares, 1.25% for Administrator Class shares, and 0.95% for Institutional Class shares. Prior to or after the commitment expiration date, the cap may be increased or the commitment to maintain the cap may be terminated only with the approval of the Board of Trustees.
Distribution fee
The Trust has adopted a distribution plan for Class C shares of the Fund pursuant to Rule12b-1 under the 1940 Act. A distribution fee is charged to Class C shares and paid to Wells Fargo Funds Distributor, LLC (“Funds Distributor”), the principal underwriter, at an annual rate of 0.75% of the average daily net assets of Class C shares.
20 | Wells Fargo Intrinsic World Equity Fund
Notes to financial statements (unaudited)
In addition, Funds Distributor is entitled to receive thefront-end sales charge from the purchase of Class A shares and a contingent deferred sales charge on the redemption of certain Class A shares. Funds Distributor is also entitled to receive the contingent deferred sales charges from redemptions of Class C shares. For the six months ended April 30, 2020, Funds Distributor received $1,085 from the sale of Class A shares. No contingent deferred sales charges were incurred by Class A and Class C shares for the six months ended April 30, 2020.
Shareholder servicing fees
The Trust has entered into contracts with one or more shareholder servicing agents, whereby Class A, Class C, and Administrator Class of the Fund are charged a fee at an annual rate of 0.25% of the average daily net assets of each respective class. A portion of these total shareholder servicing fees were paid to affiliates of Wells Fargo.
Interfund transactions
The Fund may purchase or sell portfolio investment securities to certain other Wells Fargo affiliates pursuant to Rule17a-7 under the 1940 Act and under procedures adopted by the Board of Trustees. The procedures have been designed to ensure that these interfund transactions, which do not incur broker commissions, are effected at current market prices.
5. INVESTMENT PORTFOLIO TRANSACTIONS
Purchases and sales of investments, excluding U.S. government obligations (if any) and short-term securities, for the six months ended April 30, 2020 were $32,532,592 and $38,121,242, respectively.
6. SECURITIES LENDING TRANSACTIONS
The Fund lends its securities through an unaffiliated securities lending agent and receives collateral in the form of cash or securities with a value at least equal to the value of the securities on loan. The value of the loaned securities is determined at the close of each business day and any increases or decreases in the required collateral are exchanged between the Fund and the counterparty on the next business day. Cash collateral received is invested in the Securities Lending Fund which seeks to provide a positive return compared to the daily Fed Funds Open Rate by investing in high-quality, U.S. dollar-denominated short-term money market instruments and is exempt from registration under Section 3(c)(7) of the 1940 Act. Securities Lending Fund is managed by Funds Management and is subadvised by WellsCap. Funds Management receives an advisory fee starting at 0.05% and declining to 0.01% as the average daily net assets of the Securities Lending Fund increase. All of the fees received by Funds Management are paid to WellsCap for its services as subadviser.
In the event of counterparty default or the failure of a borrower to return a loaned security, the Fund has the right to use the collateral to offset any losses incurred. As of April 30, 2020, the Fund did not have any securities on loan.
7. BANK BORROWINGS
The Trust (excluding the money market funds), Wells Fargo Master Trust and Wells Fargo Variable Trust are parties to a $280,000,000 revolving credit agreement whereby the Fund is permitted to use bank borrowings for temporary or emergency purposes, such as to fund shareholder redemption requests. Interest under the credit agreement is charged to the Fund based on a borrowing rate equal to the higher of the Federal Funds rate in effect on that day plus 1.25% or the overnight LIBOR rate in effect on that day plus 1.25%. In addition, an annual commitment fee equal to 0.25% of the unused balance is allocated to each participating fund.
For the six months ended April 30, 2020, there were no borrowings by the Fund under the agreement.
8. INDEMNIFICATION
Under the Fund’s organizational documents, the officers and Trustees have been granted certain indemnification rights against certain liabilities that may arise out of performance of their duties to the Fund. The Fund has entered into a separate agreement with each Trustee that converts indemnification rights currently existing under the Fund’s organizational documents into contractual rights that cannot be changed in the future without the consent of the Trustee. Additionally, in the normal course of business, the Fund may enter into contracts with service providers that contain a variety of indemnification clauses. The Fund’s maximum exposure under these arrangements is dependent on future claims that may be made against the Fund and, therefore, cannot be estimated.
9. NEW ACCOUNTING PRONOUNCEMENT
In August 2018, FASB issued Accounting Standards Update (“ASU”)No. 2018-13, Fair Value Measurement (Topic 820)Disclosure Framework—Changes to the Disclosure Requirements for Fair Value Measurement. ASU2018-13 updates the disclosure requirements for fair value measurements by modifying or removing certain disclosures and adding certain new disclosures. The amendments are effective for fiscal years, and interim periods within those fiscal years, beginning after December 15, 2019.
Wells Fargo Intrinsic World Equity Fund | 21
Notes to financial statements (unaudited)
Early adoption is permitted. Management has adopted the removal and modification of disclosures early, as permitted, and will adopt the additional new disclosures at the effective date.
10. CORONAVIRUS (COVID-19) PANDEMIC
On March 11, 2020, the World Health Organization announced that it had made the assessment that coronavirus disease 2019(“COVID-19”) is a pandemic. The impacts ofCOVID-19 are adversely affecting the entire global economy, individual companies and investment products, and the market in general. There is significant uncertainty around the extent and duration of business disruptions related toCOVID-19 and the impacts may be short term or may last for an extended period of time. The risk of further spreading ofCOVID-19 has led to significant uncertainty and volatility in the financial markets. The value of the Fund and the securities in which the Fund invests have generally been adversely affected by impacts caused byCOVID-19.
22 | Wells Fargo Intrinsic World Equity Fund
Other information (unaudited)
PROXY VOTING INFORMATION
A description of the policies and procedures used to determine how to vote proxies relating to portfolio securities is available, upon request, by calling1-800-222-8222, visiting our website atwfam.com, or visiting the SEC website at sec.gov. Information regarding how the proxies related to portfolio securities were voted during the most recent12-month period ended June 30 is available on the website atwfam.comor by visiting the SEC website at sec.gov.
QUARTERLY PORTFOLIO HOLDINGS INFORMATION
The Fund files its complete schedule of portfolio holdings with the SEC for the first and third quarters of each fiscal year as an exhibit to its reports on FormN-PORT. Shareholders may view the filed FormN-PORT by visiting the SEC website at sec.gov.
Wells Fargo Intrinsic World Equity Fund | 23
Other information (unaudited)
BOARD OF TRUSTEES AND OFFICERS
Each of the Trustees and Officers1 listed in the table below acts in identical capacities for each fund in the Wells Fargo family of funds, which consists of 147 mutual funds comprising the Wells Fargo Funds Trust, Wells Fargo Variable Trust, Wells Fargo Master Trust and four closed-end funds (collectively the “Fund Complex”). This table should be read in conjunction with the Prospectus and the Statement of Additional Information2. The mailing address of each Trustee and Officer is 525 Market Street, 12th Floor, San Francisco, CA 94105. Each Trustee and Officer serves an indefinite term, however, each Trustee serves such term until reaching the mandatory retirement age established by the Trustees.
Independent Trustees
| | | | | | |
Name and year of birth | | Position held and length of service* | | Principal occupations during past five years or longer | | Current other public company or investment company directorships |
| | | |
William R. Ebsworth (Born 1957) | | Trustee, since 2015 | | Retired. From 1984 to 2013, equities analyst, portfolio manager, research director and chief investment officer at Fidelity Management and Research Company in Boston, Tokyo, and Hong Kong, and retired in 2013 as Chief Investment Officer of Fidelity Strategic Advisers, Inc. where he led a team of investment professionals managing client assets. Prior thereto, Board member of Hong Kong Securities Clearing Co., Hong Kong Options Clearing Corp., the Thailand International Fund, Ltd., Fidelity Investments Life Insurance Company, and Empire Fidelity Investments Life Insurance Company. Audit Committee Chair and Investment Committee Chair of the Vincent Memorial Hospital Endowment (non-profit organization). Mr. Ebsworth is a CFA® charterholder. | | N/A |
| | | |
Jane A. Freeman (Born 1953) | | Trustee, since 2015; Chair Liaison, since 2018 | | Retired. From 2012 to 2014 and 1999 to 2008, Chief Financial Officer of Scientific Learning Corporation. From 2008 to 2012, Ms. Freeman provided consulting services related to strategic business projects. Prior to 1999, Portfolio Manager at Rockefeller & Co. and Scudder, Stevens & Clark. Board member of the Harding Loevner Funds from 1996 to 2014, serving as both Lead Independent Director and chair of the Audit Committee. Board member of the Russell Exchange Traded Funds Trust from 2011 to 2012 and the chair of the Audit Committee. Ms. Freeman is also an inactive Chartered Financial Analyst. | | N/A |
| | | |
Isaiah Harris, Jr. (Born 1952) | | Trustee, since 2009; Audit Committee Chairman, since 2019 | | Retired. Chairman of the Board of CIGNA Corporation since 2009, and Director since 2005. From 2003 to 2011, Director of Deluxe Corporation. Prior thereto, President and CEO of BellSouth Advertising and Publishing Corp. from 2005 to 2007, President and CEO of BellSouth Enterprises from 2004 to 2005 and President of BellSouth Consumer Services from 2000 to 2003. Emeritus member of the Iowa State University Foundation Board of Governors. Emeritus Member of the Advisory Board of Iowa State University School of Business. Advisory Board Member, Palm Harbor Academy (private school). Advisory Board Member, Child Evangelism Fellowship (non-profit). Mr. Harris is a certified public accountant (inactive status). | | CIGNA Corporation |
| | | |
Judith M. Johnson (Born 1949) | | Trustee, since 2008; Audit Committee Chairman, from 2009 to 2018 | | Retired. Prior thereto, Chief Executive Officer and Chief Investment Officer of Minneapolis Employees Retirement Fund from 1996 to 2008. Ms. Johnson is an attorney, certified public accountant and a certified managerial accountant. | | N/A |
24 | Wells Fargo Intrinsic World Equity Fund
Other information (unaudited)
| | | | | | |
Name and year of birth | | Position held and length of service* | | Principal occupations during past five years or longer | | Current other public company or investment company directorships |
| | | |
David F. Larcker (Born 1950) | | Trustee, since 2009 | | James Irvin Miller Professor of Accounting at the Graduate School of Business, Stanford University, Director of the Corporate Governance Research Initiative and Senior Faculty of The Rock Center for Corporate Governance since 2006. From 2005 to 2008, Professor of Accounting at the Graduate School of Business, Stanford University. Prior thereto, Ernst & Young Professor of Accounting at The Wharton School, University of Pennsylvania from 1985 to 2005. | | N/A |
| | | |
Olivia S. Mitchell (Born 1953) | | Trustee, since 2006; Nominating and Governance Committee Chair, since 2018 | | International Foundation of Employee Benefit Plans Professor, Wharton School of the University of Pennsylvania since 1993. Director of Wharton’s Pension Research Council and Boettner Center on Pensions & Retirement Research, and Research Associate at the National Bureau of Economic Research. Previously, Cornell University Professor from 1978 to 1993. | | N/A |
| | | |
Timothy J. Penny (Born 1951) | | Trustee, since 1996; Chairman, since 2018 | | President and Chief Executive Officer of Southern Minnesota Initiative Foundation, a non-profit organization, since 2007. Member of the Board of Trustees of NorthStar Education Finance, Inc., a non-profit organization, since 2007. | | N/A |
| | | |
James G. Polisson (Born 1959) | | Trustee, since 2018 | | Retired. Chief Marketing Officer, Source (ETF) UK Services, Ltd, from 2015 to 2017. From 2012 to 2015, Principal of The Polisson Group, LLC, a management consulting, corporate advisory and principal investing company. Chief Executive Officer and Managing Director at Russell Investments, Global Exchange Traded Funds from 2010 to 2012. Managing Director of Barclays Global Investors from 1998 to 2010 and Global Chief Marketing Officer for iShares and Barclays Global Investors from 2000 to 2010. Trustee of the San Francisco Mechanics’ Institute, a non-profit organization, from 2013 to 2015. Board member of the Russell Exchange Traded Fund Trust from 2011 to 2012. Director of Barclays Global Investors Holdings Deutschland GmbH from 2006 to 2009. Mr. Polisson is an attorney and has a retired status with the Massachusetts and District of Columbia Bar Associations. | | N/A |
| | | |
Pamela Wheelock (Born 1959) | | Trustee, since January 2020; previously Trustee from January 2018 to July 2019 | | Board member of the Destination Medical Center Economic Development Agency, Rochester, Minnesota since 2019 and Interim President of the McKnight Foundation since 2020. Acting Commissioner, Minnesota Department of Human Services, July 2019 through September 2019. Human Services Manager (part-time), Minnesota Department of Human Services, October 2019 through December 2019. Chief Operating Officer, Twin Cities Habitat for Humanity from 2017 to 2019. Vice President of University Services, University of Minnesota from 2012 to 2016. Prior thereto, on the Board of Directors, Governance Committee and Finance Committee for the Minnesota Philanthropy Partners (Saint Paul Foundation) from 2012 to 2018, Interim Chief Executive Officer of Blue Cross Blue Shield of Minnesota from 2011 to 2012, Chairman of the Board from 2009 to 2012 and Board Director from 2003 to 2015. Vice President, Leadership and Community Engagement, Bush Foundation, Saint Paul, Minnesota (a private foundation) from 2009 to 2011. Executive Vice President and Chief Financial Officer, Minnesota Sports and Entertainment from 2004 to 2009 and Senior Vice President from 2002 to 2004. Executive Vice President of the Minnesota Wild Foundation from 2004 to 2008. Commissioner of Finance, State of Minnesota, from 1999 to 2002. Currently Board Chair of the Minnesota Wild Foundation since 2010. | | N/A |
| * | Length of service dates reflect the Trustee’s commencement of service with the Trust’s predecessor entities, where applicable. |
Wells Fargo Intrinsic World Equity Fund | 25
Other information (unaudited)
Officers
| | | | |
Name and year of birth | | Position held and length of service | | Principal occupations during past five years or longer |
| | |
Andrew Owen (Born 1960) | | President, since 2017 | | Executive Vice President of Wells Fargo & Company and Head of Affiliated Managers, Wells Fargo Asset Management, since 2014. In addition, Mr. Owen is currently President, Chief Executive Officer and Director of Wells Fargo Funds Management, LLC since 2017. Prior thereto, Executive Vice President responsible for marketing, investments and product development for Wells Fargo Funds Management, LLC, from 2009 to 2014. |
| | |
Jeremy DePalma1 (Born 1974) | | Treasurer, since 2012 | | Senior Vice President of Wells Fargo Funds Management, LLC since 2009. Senior Vice President of Evergreen Investment Management Company, LLC from 2008 to 2010 and head of the Fund Reporting and Control Team within Fund Administration from 2005 to 2010. |
| | |
Michelle Rhee (Born 1966) | | Chief Legal Officer, since 2019 | | Secretary of Wells Fargo Funds Management, LLC, Chief Legal Counsel of Wells Fargo Asset Management and Assistant General Counsel of Wells Fargo Bank, N.A. since 2018. Associate General Counsel and Managing Director of Bank of America Corporation from 2004 to 2018. |
| | |
Catherine Kennedy (Born 1969) | | Secretary, since 2019 | | Vice President of Wells Fargo Funds Management, LLC and Senior Counsel of the Wells Fargo Legal Department since 2010. Vice President and Senior Counsel of Evergreen Investment Management Company, LLC from 1998 to 2010. |
| | |
Michael H. Whitaker (Born 1967) | | Chief Compliance Officer, since 2016 | | Chief Compliance Officer of Wells Fargo Asset Management since 2016. Senior Vice President and Chief Compliance Officer for Fidelity Investments from 2007 to 2016. |
| | |
David Berardi (Born 1975) | | Assistant Treasurer, since 2009 | | Vice President of Wells Fargo Funds Management, LLC since 2009. Vice President of Evergreen Investment Management Company, LLC from 2008 to 2010. Manager of Fund Reporting and Control for Evergreen Investment Management Company, LLC from 2004 to 2010. |
| 1 | Jeremy DePalma acts as Treasurer of 82 funds and Assistant Treasurer of 65 funds in the Fund Complex. |
| 2 | The Statement of Additional Information includes additional information about the Trustees and is available, without charge, upon request, by calling1-800-222-8222 or by visiting the website atwfam.com. |
26 | Wells Fargo Intrinsic World Equity Fund
Appendix I (unaudited)
Effective on or about May 1, 2020, if you purchase Fund shares through a Janney Montgomery Scott LLC (“Janney”) brokerage account, you will be eligible for the following load waivers (front-end sales charge waivers and contingent deferred sales charge (“CDSC”), or back-end sales charge, waivers) and discounts, which may differ from those disclosed elsewhere in the Fund’s Prospectus or SAI.
|
| Front-end sales charge* waivers on Class A shares available at Janney |
|
| Shares purchased through reinvestment of capital gains distributions and dividend reinvestment when purchasing shares of the same fund (but not any other fund within the fund family). |
|
| Shares purchased by employees and registered representatives of Janney or its affiliates and their family members as designated by Janney. |
|
| Shares purchased from the proceeds of redemptions within the same fund family, provided (1) the repurchase occurs within ninety (90) days following the redemption, (2) the redemption and purchase occur in the same account, and (3) redeemed shares were subject to a front-end or deferred sales load (i.e., right of reinstatement). |
|
| Employer-sponsored retirement plans (e.g., 401(k) plans, 457 plans, employer-sponsored 403(b) plans, profit sharing and money purchase pension plans and defined benefit plans). For purposes of this provision, employer-sponsored retirement plans do not include SEP IRAs, Simple IRAs, SAR-SEPs or Keogh plans. |
|
| Shares acquired through a right of reinstatement. |
|
| Class C shares that are no longer subject to a contingent deferred sales charge and are converted to Class A shares of the same fund pursuant to Janney’s policies and procedures. |
| CDSC waivers on Class A and Class C shares available at Janney |
|
| Shares sold upon the death or disability of the shareholder. |
|
| Shares sold as part of a systematic withdrawal plan as described in the Fund’s Prospectus. |
|
| Shares purchased in connection with a return of excess contributions from an IRA account. |
|
| Shares sold as part of a required minimum distribution for IRA and retirement accounts if the redemption is taken in or after the year the shareholder reaches qualified age based on applicable IRS regulations. |
|
| Shares sold to pay Janney fees but only if the transaction is initiated by Janney. |
|
| Shares acquired through a right of reinstatement. |
|
| Shares exchanged into the same share class of a different fund. |
| Front-end sales charge* discounts available at Janney; breakpoints, rights of accumulation and/or letters of intent |
|
| Breakpoints as described in the Fund’s Prospectus. |
|
| Rights of accumulation (“ROA”), which entitle shareholders to breakpoint discounts, will be automatically calculated based on the aggregated holding of fund family assets held by accounts within the purchaser’s household at Janney. Eligible fund family assets not held at Janney may be included in the ROA calculation only if the shareholder notifies his or her financial advisor about such assets. |
|
| Letters of intent which allow for breakpoint discounts based on anticipated purchases within a fund family, over a 13-month time period. Eligible fund family assets not held at Janney Montgomery Scott may be included in the calculation of letters of intent only if the shareholder notifies his or her financial advisor about such assets. |
| * | Also referred to as an “initial sales charge.” |
Wells Fargo Intrinsic World Equity Fund | 27
Appendix II (unaudited)
Effective on or after May 1, 2020, clients of Edward Jones (also referred to as “shareholders”) purchasing Fund shares on the Edward Jones commission and fee-based platforms are eligible only for the following sales charge discounts (also referred to as “breakpoints”) and waivers, which can differ from breakpoints and waivers described elsewhere in the Fund’s Prospectus or SAI or through another broker-dealer. In all instances, it is the shareholder’s responsibility to inform Edward Jones at the time of purchase of any relationship, holdings of Wells Fargo Funds or other facts qualifying the purchaser for breakpoints or waivers. Edward Jones can ask for documentation of such circumstance.
|
| Breakpoints available at Edward Jones |
|
| Rights of Accumulation (ROA) |
|
The applicable sales charge on a purchase of Class A shares is determined by taking into account all share classes (except any money market funds and retirement plan share classes) of Wells Fargo Funds held by the shareholder or in an account grouped by Edward Jones with other accounts for the purpose of providing certain pricing considerations (“pricing groups”). This includes all share classes held on the Edward Jones platform and/or held on another platform. The inclusion of eligible fund family assets in the rights of accumulation calculation is dependent on the shareholder notifying his or her financial advisor of such assets at the time of calculation. |
|
ROA is determined by calculating the higher of cost or market value (current shares x NAV). |
|
| Letter of Intent (LOI) |
|
Through a LOI, shareholders can receive the sales charge and breakpoint discounts for purchases shareholders intend to makeover a 13-month period from the date Edward Jones receives the LOI. The LOI is determined by calculating the higher of cost or market value of qualifying holdings at LOI initiation in combination with the value that the shareholder intends to buy over a 13-month period to calculate the front-end sales charge and any breakpoint discounts. Each purchase the shareholder makes during that13-month period will receive the sales charge and breakpoint discount that applies to the total amount. The inclusion of eligible fund family assets in the LOI calculation is dependent on the shareholder notifying his or her financial advisor of such assets at the time of calculation. Purchases made before the LOI is received by Edward Jones are not covered under the LOI and will not reduce the sales charge previously paid. Sales charges will be adjusted if LOI is not met. |
| Sales charges are waived for the following shareholders and in the following situations at Edward Jones: |
● Associates of Edward Jones and its affiliates and their family members who are in the same pricing group (as determined by Edward Jones under its policies and procedures) as the associate. This waiver will continue for the remainder of the associate’s life if the associate retires from Edward Jones in good-standing. |
● Shares purchased in an Edward Jones fee-based program. |
● Shares purchased through reinvestment of capital gains distributions and dividend reinvestment. |
● Shares purchased from the proceeds of redeemed shares of the same fund family so long as the following conditions are met: 1) the proceeds are from the sale of shares within 60 days of the purchase, and 2) the sale and purchase are made in the same share class and the same account or the purchase is made in an individual retirement account with proceeds from liquidations in anon-retirement account. |
● Shares exchanged into Class A shares from another share class so long as the exchange is into the same fund and was initiated at the discretion of Edward Jones. Edward Jones is responsible for any remaining CDSC due to the fund company, if applicable. Any future purchases are subject to the applicable sales charge as disclosed in the prospectus. |
● Exchanges from Class C shares to Class A shares of the same fund, generally, in the 84th month following the anniversary of the purchase date or earlier at the discretion of Edward Jones. |
If the shareholder purchases shares that are subject to a CDSC and those shares are redeemed before the CDSC is expired, the shareholder
is responsible to pay the CDSC except in the following conditions available at Edward Jones: |
● The death or disability of the shareholder. |
● Systematic withdrawals with up to 10% per year of the account value. |
● Return of excess contributions from an Individual Retirement Account (IRA). |
● Shares sold as part of a required minimum distribution for IRA and retirement accounts if the redemption is taken in or after the year the shareholder reaches qualified age based on applicable IRS regulation. |
● Shares sold to pay Edward Jones fees or costs in such cases where the transaction is initiated by Edward Jones. |
● Shares exchanged in an Edward Jones fee-based program. |
● Shares acquired through NAV reinstatement. |
28 | Wells Fargo Intrinsic World Equity Fund
Appendix II (unaudited)
|
| Other Important Information for accounts at Edward Jones: |
| Minimum Purchase Amounts |
● $250 initial purchase minimum |
● $50 subsequent purchase minimum |
|
| Minimum Balances |
| Edward Jones has the right to redeem at its discretion fund holdings with a balance of $250 or less. The following are examples of accounts that are not included in this policy: |
● A fee-based account held on an Edward Jones platform |
● A 529 account held on an Edward Jones platform |
● An account with an active systematic investment plan or letter of intent (LOI) |
|
| Changing Share Classes |
| At any time it deems necessary, Edward Jones has the authority to exchange at NAV a shareholder’s holdings in a fund to Class A shares. |
Wells Fargo Intrinsic World Equity Fund | 29
Appendix III (unaudited)
Effective June 1, 2020, shareholders purchasing Fund shares through an Oppenheimer & Co. Inc. (“Oppenheimer”) platform or account are eligible only for the following load waivers (front-end sales charge waivers and contingent deferred or back-end, sales charge waivers) and discounts, which may differ from those disclosed in the Fund’s Prospectus or SAI.
|
| Front-end Sales Load Waivers on Class A Shares available at Oppenheimer |
|
| Employer-sponsored retirement, deferred compensation and employee benefit plans (including health savings accounts) and trusts used to fund those plans, provided that the shares are not held in a commission-based brokerage account and shares are held for the benefit of the plan. |
|
| Shares purchased by or through a 529 Plan. |
|
| Shares purchased through an Oppenheimer affiliated investment advisory program. |
|
| Shares purchased through reinvestment of capital gains distributions and dividend reinvestment when purchasing shares of the same fund (but not any other fund within the fund family). |
|
| Shares purchased from the proceeds of redemptions within the same fund family, provided (1) the repurchase occurs within 90 days following the redemption, (2) the redemption and purchase occur in the same account, and (3) redeemed shares were subject to a front-end or deferred sales load (known as Rights of Restatement). |
|
| A shareholder in the Fund’s Class C shares will have their shares exchanged at net asset value to Class A shares (or the appropriate share class) of the Fund if the shares are no longer subject to a CDSC and the exchange is in line with the policies and procedures of Oppenheimer. |
|
| Employees and registered representatives of Oppenheimer or its affiliates and their family members. |
|
| Directors or Trustees of the Fund, and employees of the Fund’s investment adviser or any of its affiliates, as described in the Prospectus. |
| CDSC Waivers on A and C Shares available at Oppenheimer |
|
| Death or disability of the shareholder. |
|
| Shares sold as part of a systematic withdrawal plan as described in the Prospectus. |
|
| Return of excess contributions from an IRA Account. |
|
| Shares sold as part of a required minimum distribution for IRA and retirement accounts due to the shareholder reaching the qualified age based on applicable IRS regulations as described in the Prospectus. |
|
| Shares sold to pay Oppenheimer fees but only if the transaction is initiated by Oppenheimer. |
|
| Shares acquired through a right of reinstatement. |
| Front-end load Discounts Available at Oppenheimer: Breakpoints, Rights of Accumulation & Letters of Intent |
|
| Breakpoints as described in the Prospectus. |
|
| Rights of Accumulation (ROA), which entitle shareholders to breakpoint discounts, will be automatically calculated based on the aggregated holding of fund family assets held by accounts within the purchaser’s household at Oppenheimer. Eligible fund family assets not held at Oppenheimer may be included in the ROA calculation only if the shareholder notifies his or her financial advisor about such assets. |
30 | Wells Fargo Intrinsic World Equity Fund
Appendix IV (unaudited)
Effective June 15, 2020, shareholders purchasing fund shares through a Robert W. Baird & Co. (“Baird”) platform or account will only be eligible for the following sales charge waivers (front-end sales charge waivers and CDSC waivers) and discounts, which may differ from those disclosed elsewhere in the Fund’s Prospectus or the SAI.
|
| Front-end Sales Load Waivers on Class A Shares available at Baird |
|
| Shares purchased through reinvestment of capital gains distributions and dividend reinvestment when purchasing share of the same fund. |
|
| Share purchase by employees and registers representatives of Baird or its affiliate and their family members as designated by Baird. |
|
| Shares purchase from the proceeds of redemptions within the same fund family, provided (1) the repurchase occurs within 90 days following the redemption, (2) the redemption and purchase occur in the same accounts, and (3) redeemed shares were subject to a front-end or deferred sales charge (known as rights of reinstatement). |
|
| A shareholder in the Funds Investor C Shares will have their share exchanged at net asset value to Investor A shares of the fund if the shares are no longer subject to CDSC and the exchange is in line with the policies and procedures of Baird. |
|
| Employer-sponsored retirement plans or charitable accounts in a transactional brokerage account at Baird, including 401(k)plans, 457 plans, employer-sponsored 403(b) plans, profit sharing and money purchase pension plans and defined benefit plans. For purposes of this provision, employer-sponsored retirement plans do not include SEP IRAs, Simple IRAs or SAR-SEPs. |
| CDSC Waivers on A and C Shares available at Baird |
|
| Shares sold due to death or disability of the shareholder. |
|
| Shares sold as part of a systematic withdrawal plan as described in the Fund’s Prospectus. |
|
| Shares bought due to returns of excess contributions from an IRA Account. |
|
| Shares sold as part of a required minimum distribution for IRA and retirement accounts due to the shareholder reaching age 72 as described in the Fund’s Prospectus. |
|
| Shares sold to pay Baird fees but only if the transaction is initiated by Baird. |
|
| Shares acquired through a right of reinstatement. |
| Front-end load Discounts Available at Baird: Breakpoint and/or Rights of Accumulation |
|
| Breakpoints as described in the Prospectus. |
|
| Rights of accumulations which entitles shareholders to breakpoint discounts will be automatically calculated based on the aggregated holding of fund family assets held by accounts within the purchaser’s household at Baird. Eligible fund family assets not held at Baird may be included in the rights of accumulations calculation only if the shareholder notifies his or her financial advisor about such assets. |
|
| Letters of Intent (LOI) allow for breakpoint discounts based on anticipated purchases within a fund family through Baird, over a 13-month period of time. |
Wells Fargo Intrinsic World Equity Fund | 31
This page is intentionally left blank.

For more information
More information about Wells Fargo Funds is available free upon request. To obtain literature, please write, visit the Fund’s website, or call:
Wells Fargo Funds
P.O. Box 219967
Kansas City, MO 64121-9967
Website:wfam.com
Individual investors:1-800-222-8222
Retail investment professionals:1-888-877-9275
Institutional investment professionals:1-866-765-0778

This report and the financial statements contained herein are submitted for the general information of the shareholders of the Fund. If this report is used for promotional purposes, distribution of the report must be accompanied or preceded by a current prospectus. Before investing, please consider the investment objectives, risks, charges, and expenses of the investment. For a current prospectus and, if available, a summary prospectus, containing this information, call1-800-222-8222 or visit the Fund’s website atwfam.com. Read the prospectus carefully before you invest or send money.
Wells Fargo Asset Management (WFAM) is the trade name for certain investment advisory/management firms owned by Wells Fargo & Company. These firms include but are not limited to Wells Capital Management Incorporated and Wells Fargo Funds Management, LLC. Certain products managed by WFAM entities are distributed by Wells Fargo Funds Distributor, LLC (a broker-dealer and Member FINRA).
This material is for general informational and educational purposes only and is NOT intended to provide investment advice or a recommendation of any kind—including a recommendation for any specific investment, strategy, or plan.
INVESTMENT PRODUCTS: NOT FDIC INSURED ◾ NO BANK GUARANTEE ◾ MAY LOSE VALUE
© 2019 Wells Fargo & Company. All rights reserved.
PAR-0520-00421 06-20
SA241/SAR241 04-20
Semi-Annual Report
April 30, 2020
Wells Fargo
Emerging Markets Equity Income Fund
Beginning on January 1, 2021, as permitted by new regulations adopted by the Securities and Exchange Commission, paper copies of the Wells Fargo Funds’ annual and semi-annual shareholder reports issued after this date will no longer be sent by mail, unless you specifically request paper copies of the reports. Instead, the reports will be made available on the Funds’ website, and you will be notified by mail each time a report is posted and provided with a website address to access the report.
If you already elected to receive shareholder reports electronically, you will not be affected by this change and you need not take any action. You may elect to receive shareholder reports and other communications from the Fund electronically at any time by contacting your financial intermediary (such as a broker-dealer or bank) or, if you are a direct investor, by calling1-800-222-8222 or by enrolling at wellsfargo.com/advantagedelivery.
You may elect to receive all future reports in paper free of charge. If you invest through a financial intermediary, you can contact your financial intermediary to request that you continue to receive paper copies of your shareholder reports; if you invest directly with the Fund, you can call 1-800-222-8222. Your election to receive reports in paper will apply to all Wells Fargo Funds held in your account with your financial intermediary or, if you are a direct investor, to all Wells Fargo Funds that you hold.
|
|
|
Reduce clutter. Save trees. |
Sign up for electronic
delivery of prospectuses and
shareholder reports atwellsfargo.com/
advantagedelivery |
The views expressed and any forward-looking statements are as of April 30, 2020, unless otherwise noted, and are those of the Fund managers and/or Wells Fargo Asset Management. Discussions of individual securities, or the markets generally, or any Wells Fargo Fund are not intended as individual recommendations. Future events or results may vary significantly from those expressed in any forward-looking statements. The views expressed are subject to change at any time in response to changing circumstances in the market. Wells Fargo Asset Management and the Fund disclaim any obligation to publicly update or revise any views expressed or forward-looking statements.
INVESTMENT PRODUCTS: NOT FDIC INSURED ◾ NO BANK GUARANTEE ◾ MAY LOSE VALUE
Wells Fargo Emerging Markets Equity Income Fund | 1
Letter to shareholders (unaudited)

Andrew Owen
President
Wells Fargo Funds
“The period began with a tailwind created by central bank support.”
Dear Shareholder:
We are pleased to offer you this semi-annual report for the Wells Fargo Emerging Markets Equity Income Fund for the six-month period that ended April 30, 2020. Global stock markets saw earlier gains erased in February and March as governments took unprecedented measures to stop the spread of the coronavirus at the expense of short-term economic output. Markets rebounded in April to lessen the losses as central banks attempted to bolster capital markets and confidence. Fixed-income markets performed better, with the exception of high-yield bonds, as U.S. bonds overall achieved modest gains.
For the six-month period, U.S. stocks, based on the S&P 500 Index,1 returned -3.16% and international stocks, as measured by the MSCI ACWI ex USA Index (Net),2 fell 13.22%. The MSCI Emerging Markets Index (Net)3 lost 10.50%. For bond investors, the Bloomberg Barclays U.S. Aggregate Bond Index4 added 4.86%, the Bloomberg Barclays Global Aggregate ex-USD Index5 returned -0.97%, the Bloomberg Barclays Municipal Bond Index6 returned -1.33%, and the ICE BofA U.S. High Yield Index7 lost 7.68%.
The period began with a tailwind created by central bank support.
The period began with a tailwind that had been created by U.S. Federal Reserve (Fed) rate cuts in the summer and early fall. Equity markets rallied in November despite ongoing geopolitical risks. Hopes for a U.S.-China trade deal buoyed investor confidence. U.S. business sentiment edged up, and manufacturing and services activity rose. With that positive backdrop, developed market equities outpaced those in emerging markets, and U.S. stocks outperformed non-U.S. stocks overall. While consumer confidence and purchasing manager activity rose in the eurozone, China reported weakening manufacturing and consumer data. Bond yields rose marginally, leading to slightly negative returns for global government and investment-grade corporate bonds.
Financial markets ended 2019 with a boost from the U.S. and China accord on a Phase One trade deal. That, along with the landslide win by the pro-Brexit U.K. Conservative Party in a national election and ongoing central bank support, gave investors greater confidence. U.S. economic indicators were positive overall, with the exception of manufacturing activity and business confidence. Consumer confidence was resilient, fed by a robust labor market, tame inflation, and lower interest rates, which boosted housing affordability and stimulated homebuyer activity. The impeachment of U.S. President Donald Trump had little impact on markets. Meanwhile, slowing Chinese economic activity, partly attributable to the trade war, led to further government stimulus at year-end through lower reserve ratios, allowing banks to lend more money.
The year-end rally continued in early January 2020. However, capital market volatility spiked in late January on concerns over the potential impact of the coronavirus on the global economy and stock markets. With sentiment somewhat souring, perceived safe
| 1 | The S&P 500 Index consists of 500 stocks chosen for market size, liquidity, and industry group representation. It is a market-value-weighted index with each stock’s weight in the index proportionate to its market value. You cannot invest directly in an index. |
| 2 | The Morgan Stanley Capital International (MSCI) All Country World Index (ACWI) ex USA Index (Net) is a free-float-adjusted market-capitalization-weighted index that is designed to measure the equity market performance of developed markets, excluding the United States. Source: MSCI. MSCI makes no express or implied warranties or representations and shall have no liability whatsoever with respect to any MSCI data contained herein. The MSCI data may not be further redistributed or used as a basis for other indices or any securities or financial products. This report is not approved, reviewed, or produced by MSCI. You cannot invest directly in an index. |
| 3 | The MSCI Emerging Markets (EM) Index (Net) is a free-float-adjusted market-capitalization-weighted index that is designed to measure equity market performance of emerging markets. You cannot invest directly in an index. |
| 4 | The Bloomberg Barclays U.S. Aggregate Bond Index is a broad-based benchmark that measures the investment-grade, U.S. dollar-denominated, fixed-rate taxable bond market, including Treasuries, government-related and corporate securities, mortgage-backed securities (agency fixed-rate and hybrid adjustable-rate mortgage pass-throughs), asset-backed securities, and commercial mortgage-backed securities. You cannot invest directly in an index. |
| 5 | The Bloomberg Barclays Global Aggregate ex-USD Index is an unmanaged index that provides a broad-based measure of the global investment-grade fixed-income markets excluding the U.S. dollar-denominated debt market. You cannot invest directly in an index. |
| 6 | The Bloomberg Barclays Municipal Bond Index is an unmanaged index composed of long-term tax-exempt bonds with a minimum credit rating of Baa. You cannot invest directly in an index. |
| 7 | The ICE BofA U.S. High Yield Index is a market-capitalization-weighted index of domestic and Yankee high-yield bonds. The index tracks the performance of high-yield securities traded in the U.S. bond market. You cannot invest directly in an index. Copyright 2020. ICE Data Indices, LLC. All rights reserved. |
2 | Wells Fargo Emerging Markets Equity Income Fund
Letter to shareholders (unaudited)
havens did well in January. The U.S. dollar and Japanese yen both rose, and government bonds outperformed equities. While the S&P 500 Index held its ground, emerging market equities tumbled, including those in Asia.
In February, the coronavirus became the major market focus. Fears of the virus’s impact on global growth led to expectations of increased global central bank monetary policy support. That led the 10-year U.S. Treasury yield to fall to an all-time low of 1.1% by the end of the month. Although equity markets initially shrugged off concerns about the outbreak, focusing instead on strong fourth-quarter earnings and improving business confidence in January, market sentiment turned sharply lower toward month-end. Oil prices tumbled as Russia and the Organization of the Petroleum Exporting Countries compounded a major decline in oil demand with a brutal price war, causing the price of West Texas Intermediate crude oil to fall 13% in February alone.
The global spread of the coronavirus led many countries to clamp down on social and business-related activity in order to contain the virus from causing even greater devastation and overwhelming the health care system. This abrupt stoppage of economic activity led to the sharp deceleration of global output, sending economies into a deep contraction. Central bank responses were swift, as they slashed interest rates and expanded quantitative easing programs to restore liquidity and confidence to the markets. In the U.S., the Fed launched several lending programs, funding investment-grade bonds, money market mutual funds, and commercial paper while purchasing Treasuries, mortgage-backed securities, and overnight repurchase agreements . Meanwhile, stock markets tumbled quickly into a bear market, ending the longest bull stock market in U.S. history.
Markets rebounded strongly in April after the extreme volatility of the previous two months, with the S&P 500 Index gaining 12.8% for the month and the MSCI ACWI ex USA Index (Net) returning 7.6%. The rebound was fueled by unprecedented stimulus measures taken by governments and central banks to buffer the economic damage created by mass shutdowns to try to contain the virus’s spread. The U.S. economy contracted by an annualized 4.8% pace in the first quarter, with 30 million new unemployment insurance claims in six weeks. In the eurozone, first-quarter real gross domestic product (GDP) shrank 3.8%, with the composite April Flash Purchasing Managers’ Index, a monthly survey of purchasing managers, falling to an all-time low of 13.5. The European Central Bank expanded its quantitative easing to include the purchase of additional government bonds of countries with the greatest virus-related need, including Italy and Spain. China’s first-quarter GDP fell by 6.8% year over year. However, retail sales, production, and investment showed signs of recovery. Extreme oil price volatility continued as global supply far exceeded demand.
Don’t let short-term uncertainty derail long-term investment goals.
Periods of investment uncertainty can present challenges, but experience has taught us that maintaining long-term investment goals can be an effective way to plan for the future. To help you create a sound strategy based on your personal goals and risk tolerance, Wells Fargo Funds offers more than 100 mutual funds spanning a wide range of asset classes and investment styles. Although diversification cannot guarantee an investment profit or prevent losses, we believe it can be an effective way to manage investment risk and potentially smooth out overall portfolio performance. We encourage investors to know their investments and to understand that appropriate levels of risk-taking may unlock opportunities.
Thank you for choosing to invest with Wells Fargo Funds. We appreciate your confidence in us and remain committed to helping you meet your financial needs.
Sincerely,

Andrew Owen
President
Wells Fargo Funds
“The global spread of the coronavirus led many countries to clamp down on social and business-related activity in order to contain the virus from causing even greater devastation and overwhelming the health care system.”
|
|
|
For further information about your Fund, contact your investment professional, visit our website at wfam.com, or call us directly at1-800-222-8222. |
Wells Fargo Emerging Markets Equity Income Fund | 3
Performance highlights (unaudited)
Investment objective
The Fund seeks to achieve long-term capital appreciation and current income.
Manager
Wells Fargo Funds Management, LLC
Subadviser
Wells Capital Management Incorporated
Portfolio managers
Alison Shimada
Elaine Tse
Average annual total returns (%) as of April 30, 2020
| | | | | | | | | | | | | | | | | | | | | | | | | | | | | | | | | | |
| | | | |
| | | | | Including sales charge | | | Excluding sales charge | | | Expense ratios1 (%) | |
| | | | | | | | | |
| | | Inception date | | 1 year | | | 5 year | | | Since
inception | | | 1 year | | | 5 year | | | Since
inception | | | Gross | | | Net2 | |
| | | | | | | | | | |
| Class A (EQIAX) | | 5-31-2012 | | | -21.03 | | | | -3.70 | | | | 1.19 | | | | -16.21 | | | | -2.55 | | | | 1.95 | | | | 1.70 | | | | 1.56 | |
| | | | | | | | | | |
| Class C (EQICX) | | 5-31-2012 | | | -17.90 | | | | -3.30 | | | | 1.18 | | | | -16.90 | | | | -3.30 | | | | 1.18 | | | | 2.45 | | | | 2.31 | |
| | | | | | | | | | |
| Class R (EQIHX)3 | | 9-30-2015 | | | – | | | | – | | | | – | | | | -16.45 | | | | -2.80 | | | | 1.70 | | | | 1.95 | | | | 1.81 | |
| | | | | | | | | | |
| Class R6 (EQIRX)4 | | 9-30-2015 | | | – | | | | – | | | | – | | | | -15.90 | | | | -2.12 | | | | 2.38 | | | | 1.27 | | | | 1.18 | |
| | | | | | | | | | |
| Administrator Class (EQIDX) | | 5-31-2012 | | | – | | | | – | | | | – | | | | -16.20 | | | | -2.38 | | | | 2.14 | | | | 1.62 | | | | 1.46 | |
| | | | | | | | | | |
| Institutional Class (EQIIX) | | 5-31-2012 | | | – | | | | – | | | | – | | | | -15.96 | | | | -2.17 | | | | 2.35 | | | | 1.37 | | | | 1.23 | |
| | | | | | | | | | |
| MSCI EM Index (Net)5 | | – | | | – | | | | – | | | | – | | | | -12.00 | | | | -0.10 | | | | 2.68 | * | | | – | | | | – | |
| * | | Return based on the inception date of Fund’s oldest class. |
Figures quoted represent past performance, which is no guarantee of future results, and do not reflect taxes that a shareholder may pay on an investment in a fund. Investment return and principal value of an investment will fluctuate so that an investor’s shares, when redeemed, may be worth more or less than their original cost. Performance shown without sales charges would be lower if sales charges were reflected. Current performance may be lower or higher than the performance data quoted, which assumes the reinvestment of dividends and capital gains. Currentmonth-end performance is available on the Fund’s website,wfam.com.
Index returns do not include transaction costs associated with buying and selling securities, any mutual fund fees or expenses, or any taxes. It is not possible to invest directly in an index.
For Class A shares, the maximumfront-end sales charge is 5.75%. For Class C shares, the maximum contingent deferred sales charge is 1.00%. Performance including a contingent deferred sales charge assumes the sales charge for the corresponding time period. Class R, Class R6, Administrator Class, and Institutional Class shares are sold without afront-end sales charge or contingent deferred sales charge.
Stock values fluctuate in response to the activities of individual companies and general market and economic conditions. Foreign investments are especially volatile and can rise or fall dramatically due to differences in the political and economic conditions of the host country. These risks are generally intensified in emerging markets. The use of derivatives may reduce returns and/or increase volatility. Certain investment strategies tend to increase the total risk of investment (relative to the broader market). The Fund is exposed to smaller-company securities risk. Consult the Fund’s prospectus for additional information on these and other risks.
Please see footnotes on page 5.
4 | Wells Fargo Emerging Markets Equity Income Fund
Performance highlights (unaudited)
| | | | |
|
| Ten largest holdings (%) as of April 30, 20206 | |
| | |
Taiwan Semiconductor Manufacturing Company Limited | | | 5.82 | |
| | |
Samsung Electronics Company Limited | | | 5.37 | |
| | |
China Construction Bank H Shares | | | 2.77 | |
| | |
China Mobile Limited | | | 2.52 | |
| | |
Industrial & Commercial Bank of China Limited H Shares | | | 2.41 | |
| | |
Ping An Insurance Group Company H Shares | | | 2.28 | |
| | |
Naspers Limited | | | 1.70 | |
| | |
Infosys Limited | | | 1.63 | |
| | |
Samsung Electronics Company Limited | | | 1.49 | |
| | |
SK Hynix Incorporated | | | 1.46 | |
|
|
| Sector allocation as of April 30, 20207 |
|
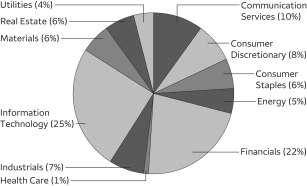 |
|
|
| Country allocation as of April 30, 20207 |
|
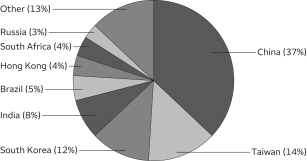 |
| 1 | Reflects the expense ratios as stated in the most recent prospectuses, which include the impact of 0.01% in acquired fund fees and expenses. The expense ratios shown are subject to change and may differ from the annualized expense ratios shown in the financial highlights of this report, which do not include acquired fund fees and expenses. |
| 2 | The manager has contractually committed through February 28, 2021, to waive fees and/or reimburse expenses to the extent necessary to cap total annual fund operating expenses after fee waivers at 1.55% for Class A, 2.30% for Class C, 1.80% for Class R, 1.17% for Class R6, 1.45% for Administrator Class, and 1.22% for Institutional Class. Brokerage commissions, stamp duty fees, interest, taxes, acquired fund fees and expenses (if any), and extraordinary expenses are excluded from the expense cap. Prior to or after the commitment expiration date, the cap may be increased or the commitment to maintain the cap may be terminated only with the approval of the Board of Trustees. Without this cap, the Fund’s returns would have been lower. The expense ratio paid by an investor is the net expense ratio (the total annual fund operating expenses after fee waivers) as stated in the prospectuses. |
| 3 | Historical performance shown for the Class R shares prior to their inception reflects the performance of the Administrator Class shares, adjusted to reflect the higher expenses applicable to the Class R shares. |
| 4 | Historical performance shown for the Class R6 shares prior to their inception reflects the performance of the Institutional Class shares, and includes the higher expenses applicable to the Institutional Class shares. If these expenses had not been included, returns for the Class R6 shares would be higher. |
| 5 | The Morgan Stanley Capital International (MSCI) Emerging Markets (EM) Index (Net) is a free-float-adjusted market-capitalization-weighted index that is designed to measure the equity market performance of emerging markets. You cannot invest directly in an index. |
| 6 | The ten largest holdings, excluding cash, cash equivalents and any money market funds, are calculated based on the value of the investments divided by total net assets of the Fund. Holdings are subject to change and may have changed since the date specified. |
| 7 | Amounts are calculated based on the total long-term investments of the Fund. These amounts are subject to change and may have changed since the date specified. |
Wells Fargo Emerging Markets Equity Income Fund | 5
Fund expenses (unaudited)
As a shareholder of the Fund, you incur two types of costs: (1) transaction costs, including sales charges (loads) on purchase payments and contingent deferred sales charges (if any) on redemptions and (2) ongoing costs, including management fees, distribution(12b-1) and/or shareholder servicing fees, and other Fund expenses. This example is intended to help you understand your ongoing costs (in dollars) of investing in the Fund and to compare these costs with the ongoing costs of investing in other mutual funds.
The example is based on an investment of $1,000 invested at the beginning of thesix-month period and held for the entire period from November 1, 2019 to April 30, 2020.
Actual expenses
The “Actual” line of the table below provides information about actual account values and actual expenses. You may use the information in this line, together with the amount you invested, to estimate the expenses that you paid over the period. Simply divide your account value by $1,000 (for example, an $8,600 account value divided by $1,000 = 8.6), then multiply the result by the number in the “Actual” line under the heading entitled “Expenses paid during period” for your applicable class of shares to estimate the expenses you paid on your account during this period.
Hypothetical example for comparison purposes
The “Hypothetical” line of the table below provides information about hypothetical account values and hypothetical expenses based on the Fund’s actual expense ratio and an assumed rate of return of 5% per year before expenses, which is not the Fund’s actual return. The hypothetical account values and expenses may not be used to estimate the actual ending account balance or expenses you paid for the period. You may use this information to compare the ongoing costs of investing in the Fund and other funds. To do so, compare this 5% hypothetical example with the 5% hypothetical examples that appear in the shareholder reports of the other funds.
Please note that the expenses shown in the table are meant to highlight your ongoing costs only and do not reflect any transactional costs, such as sales charges (loads) and contingent deferred sales charges. Therefore, the “Hypothetical” line of the table is useful in comparing ongoing costs only and will not help you determine the relative total costs of owning different funds. In addition, if these transactional costs were included, your costs would have been higher.
| | | | | | | | | | | | | | | | |
| | | Beginning
account value
11-1-2019 | | | Ending
account value
4-30-2020 | | | Expenses
paid during
the period¹ | | | Annualized net
expense ratio | |
| | | | | |
Class A | | | | | | | | | | | | | | | | |
| | | | |
Actual | | $ | 1,000.00 | | | $ | 831.87 | | | $ | 6.92 | | | | 1.52 | % |
| | | | |
Hypothetical (5% return before expenses) | | $ | 1,000.00 | | | $ | 1,017.30 | | | $ | 7.62 | | | | 1.52 | % |
| | | | | |
Class C | | | | | | | | | | | | | | | | |
| | | | |
Actual | | $ | 1,000.00 | | | $ | 828.19 | | | $ | 10.50 | | | | 2.31 | % |
| | | | |
Hypothetical (5% return before expenses) | | $ | 1,000.00 | | | $ | 1,013.38 | | | $ | 11.56 | | | | 2.31 | % |
| | | | | |
Class R | | | | | | | | | | | | | | | | |
| | | | |
Actual | | $ | 1,000.00 | | | $ | 830.49 | | | $ | 8.24 | | | | 1.81 | % |
| | | | |
Hypothetical (5% return before expenses) | | $ | 1,000.00 | | | $ | 1,015.86 | | | $ | 9.07 | | | | 1.81 | % |
| | | | | |
Class R6 | | | | | | | | | | | | | | | | |
| | | | |
Actual | | $ | 1,000.00 | | | $ | 833.17 | | | $ | 5.33 | | | | 1.17 | % |
| | | | |
Hypothetical (5% return before expenses) | | $ | 1,000.00 | | | $ | 1,019.05 | | | $ | 5.87 | | | | 1.17 | % |
| | | | | |
Administrator Class | | | | | | | | | | | | | | | | |
| | | | |
Actual | | $ | 1,000.00 | | | $ | 831.68 | | | $ | 6.60 | | | | 1.45 | % |
| | | | |
Hypothetical (5% return before expenses) | | $ | 1,000.00 | | | $ | 1,017.65 | | | $ | 7.27 | | | | 1.45 | % |
| | | | | |
Institutional Class | | | | | | | | | | | | | | | | |
| | | | |
Actual | | $ | 1,000.00 | | | $ | 833.04 | | | $ | 5.56 | | | | 1.22 | % |
| | | | |
Hypothetical (5% return before expenses) | | $ | 1,000.00 | | | $ | 1,018.80 | | | $ | 6.12 | | | | 1.22 | % |
| 1 | Expenses paid is equal to the annualized net expense ratio of each class multiplied by the average account value over the period, multiplied by the number of days in the most recent fiscal half-year divided by the number of days in the fiscal year (to reflect theone-half-year period). |
6 | Wells Fargo Emerging Markets Equity Income Fund
Portfolio of investments—April 30, 2020 (unaudited)
| | | | | | | | | | | | | | | | |
| | | | | | | | | Shares | | | Value | |
| Common Stocks: 92.74% | |
|
| Brazil: 2.93% | |
B3 Brasil Bolsa Balcao SA (Financials, Capital Markets) | | | | | | | | | | | 531,100 | | | $ | 3,752,342 | |
Banco BTG Pactual SA (Financials, Capital Markets) | | | | | | | | | | | 441,300 | | | | 3,432,757 | |
Petrobras Distribuidora SA (Consumer Discretionary, Specialty Retail) | | | | | | | | | | | 885,200 | | | | 3,179,160 | |
Vale SA (Materials, Metals & Mining) | | | | | | | | | | | 609,674 | | | | 5,029,511 | |
| | | | |
| | | | | | | | | | | | | | | 15,393,770 | |
| | | | | | | | | | | | | | | | |
|
| Chile: 0.51% | |
Sociedad Quimica Minera de Chile (Materials, Chemicals) | | | | | | | | | | | 116,616 | | | | 2,658,845 | |
| | | | | | | | | | | | | | | | |
|
| China: 36.65% | |
Beijing Enterprises Water Group Limited (Utilities, Water Utilities) | | | | | | | | | | | 6,640,000 | | | | 2,576,663 | |
China Communications Services Corporation Limited H Shares (Industrials, Construction & Engineering) | | | | | | | | | | | 7,858,000 | | | | 5,601,280 | |
China Construction Bank H Shares (Financials, Banks) | | | | | | | | | | | 18,126,000 | | | | 14,549,072 | |
China Life Insurance Company H Shares (Financials, Insurance) | | | | | | | | | | | 1,937,000 | | | | 4,131,037 | |
China Merchants Bank Company Limited H Shares (Financials, Banks) | | | | | | | | | | | 997,500 | | | | 4,720,478 | |
China Merchants Shekou Industrial Zone Holdings Company Limited Class A (Real Estate, Real Estate Management & Development) | | | | | | | | | | | 1,274,280 | | | | 3,054,646 | |
China Mobile Limited (Communication Services, Wireless Telecommunication Services) | | | | | | | | | | | 1,647,000 | | | | 13,240,327 | |
China Overseas Land & Investment Limited (Real Estate, Real Estate Management & Development) | | | | | | | | | | | 1,540,000 | | | | 5,688,676 | |
China Resources Land Limited (Real Estate, Real Estate Management & Development) | | | | | | | | | | | 1,520,000 | | | | 6,280,949 | |
China State Construction Engineering Corporation Limited Class A (Industrials, Construction & Engineering) | | | | | | | | | | | 5,048,300 | | | | 3,710,597 | |
China State Construction International Holdings (Industrials, Construction & Engineering) | | | | | | | | | | | 5,722,000 | | | | 4,436,301 | |
China Vanke Company Limited Class A (Real Estate, Real Estate Management & Development) | | | | | | | | | | | 1,298,064 | | | | 4,870,967 | |
China Yongda Automobile Service Holding Company (Consumer Discretionary, Specialty Retail) | | | | | | | | | | | 3,413,500 | | | | 3,441,273 | |
ENN Energy Holdings Limited (Utilities, Gas Utilities) | | | | | | | | | | | 381,700 | | | | 4,302,699 | |
Geely Automobile Holdings Limited (Consumer Discretionary, Automobiles) | | | | | | | | | | | 1,786,000 | | | | 2,778,162 | |
Haier Smart Home Company Limited Class A (Consumer Discretionary, Household Durables) | | | | | | | | | | | 2,210,621 | | | | 4,771,433 | |
Hangzhou Robam Appliances Company Limited Class A (Consumer Discretionary, Household Durables) | | | | | | | | | | | 753,285 | | | | 3,360,900 | |
Hengan International Group Company Limited (Consumer Staples, Personal Products) | | | | | | | | | | | 784,500 | | | | 6,976,515 | |
Industrial & Commercial Bank of China Limited H Shares (Financials, Banks) | | | | | | | | | | | 18,829,000 | | | | 12,625,016 | |
Kunlun Energy Company Limited (Utilities, Gas Utilities) | | | | | | | | | | | 3,946,000 | | | | 2,570,800 | |
Lenovo Group Limited (Information Technology, Technology Hardware, Storage & Peripherals) | | | | | | | | | | | 5,946,000 | | | | 3,212,011 | |
Midea Group Company Limited Class A (Consumer Discretionary, Household Durables) | | | | | | | | | | | 772,160 | | | | 5,786,121 | |
Nari Technology Company Limited Class A (Industrials, Electrical Equipment) | | | | | | | | | | | 1,604,968 | | | | 4,529,994 | |
NetEase Incorporated ADR (Communication Services, Entertainment) | | | | | | | | | | | 13,921 | | | | 4,802,188 | |
PetroChina Company Limited H Shares (Energy, Oil, Gas & Consumable Fuels) | | | | | | | | | | | 6,986,000 | | | | 2,509,312 | |
PICC Property & Casualty Company Limited H Shares (Financials, Insurance) | | | | | | | | | | | 3,314,000 | | | | 3,171,318 | |
Ping An Insurance Group Company H Shares (Financials, Insurance) | | | | | | | | | | | 1,175,000 | | | | 11,957,104 | |
Sands China Limited (Consumer Discretionary, Hotels, Restaurants & Leisure) | | | | | | | | | | | 642,000 | | | | 2,599,134 | |
Shimao Property Holding Limited (Real Estate, Real Estate Management & Development) | | | | | | | | | | | 939,500 | | | | 3,818,949 | |
Sinopharm Group Company Limited H Shares (Health Care, Health Care Providers & Services) | | | | | | | | | | | 1,779,200 | | | | 4,797,363 | |
Suzhou Gold Mantis Construction Decoration Company Limited Class A (Consumer Discretionary, Household Durables) | | | | | | | | | | | 4,888,800 | | | | 5,527,643 | |
Tingyi Holding Corporation (Consumer Staples, Food Products) | | | | | | | | | | | 2,912,000 | | | | 5,169,091 | |
Topsports International Holdings Limited (Consumer Discretionary, Textiles, Apparel & Luxury Goods) | | | | | | | | | | | 2,487,000 | | | | 3,143,971 | |
Uni-President China Holdings Limited (Consumer Staples, Food Products) | | | | | | | | | | | 2,539,000 | | | | 2,548,999 | |
Wanhua Chemical Group Company Limited Class A (Materials, Chemicals) | | | | | | | | | | | 477,500 | | | | 3,007,500 | |
Weichai Power Company Limited H Shares (Industrials, Machinery) | | | | | | | | | | | 2,280,000 | | | | 4,005,980 | |
WH Group Limited (Consumer Staples, Food Products) 144A | | | | | | | | | | | 4,027,500 | | | | 3,841,238 | |
Zhengzhou Yutong Bus Company Limited Class A (Industrials, Machinery) | | | | | | | | | | | 2,303,211 | | | | 4,237,543 | |
| | | | |
| | | | | | | | | | | | | | | 192,353,250 | |
| | | | | | | | | | | | | | | | |
The accompanying notes are an integral part of these financial statements.
Wells Fargo Emerging Markets Equity Income Fund | 7
Portfolio of investments—April 30, 2020 (unaudited)
| | | | | | | | | | | | | | | | |
| | | | | | | | | Shares | | | Value | |
| Greece: 0.83% | |
Hellenic Telecommunications Organization SA (Communication Services, Diversified Telecommunication Services) | | | | | | | | | | | 328,104 | | | $ | 4,334,742 | |
| | | | | | | | | | | | | | | | |
|
| Hong Kong: 2.65% | |
ASM Pacific Technology (Information Technology, Semiconductors & Semiconductor Equipment) | | | | | | | | | | | 372,700 | | | | 3,766,024 | |
China Merchants Port Holdings Company Limited (Industrials, Transportation Infrastructure) | | | | | | | | | | | 3,878,000 | | | | 4,991,232 | |
CNOOC Limited (Energy, Oil, Gas & Consumable Fuels) | | | | | | | | | | | 2,232,000 | | | | 2,467,747 | |
Man Wah Holdings Limited (Consumer Discretionary, Household Durables) | | | | | | | | | | | 4,675,200 | | | | 2,684,874 | |
| | | | |
| | | | | | | | | | | | | | | 13,909,877 | |
| | | | | | | | | | | | | | | | |
|
| India: 7.95% | |
Bharat Petroleum Corporation Limited (Energy, Oil, Gas & Consumable Fuels) | | | | | | | | | | | 1,481,945 | | | | 7,250,145 | |
Embassy Office Parks REIT (Real Estate, Equity REITs) | | | | | | | | | | | 841,000 | | | | 4,127,846 | |
Gail India Limited (Utilities, Gas Utilities) | | | | | | | | | | | 2,985,069 | | | | 3,777,109 | |
Hero Motorcorp Limited (Consumer Discretionary, Automobiles) | | | | | | | | | | | 138,710 | | | | 3,956,481 | |
Hindustan Petroleum Corporation Limited (Energy, Oil, Gas & Consumable Fuels) | | | | | | | | | | | 1,743,982 | | | | 5,089,787 | |
Infosys Limited (Information Technology, IT Services) | | | | | | | | | | | 916,802 | | | | 8,569,467 | |
Mahanagar Gas Limited (Utilities, Gas Utilities) | | | | | | | | | | | 297,291 | | | | 3,831,477 | |
Tech Mahindra Limited (Information Technology, IT Services) | | | | | | | | | | | 711,389 | | | | 5,116,368 | |
| | | | |
| | | | | | | | | | | | | | | 41,718,680 | |
| | | | | | | | | | | | | | | | |
|
| Indonesia: 1.77% | |
PT Bank Rakyat Indonesia Tbk (Financials, Banks) | | | | | | | | | | | 15,714,500 | | | | 2,858,269 | |
PT Telekomunikasi Indonesia Persero Tbk (Communication Services, Diversified Telecommunication Services) | | | | | | | | | | | 27,932,300 | | | | 6,423,088 | |
| | | | |
| | | | | | | | | | | | | | | 9,281,357 | |
| | | | | | | | | | | | | | | | |
|
| Malaysia: 0.90% | |
CIMB Group Holdings Bhd (Financials, Banks) | | | | | | | | | | | 2,670,961 | | | | 2,135,647 | |
RHB Bank Bhd (Financials, Banks) | | | | | | | | | | | 2,370,200 | | | | 2,608,391 | |
| | | | |
| | | | | | | | | | | | | | | 4,744,038 | |
| | | | | | | | | | | | | | | | |
|
| Mexico: 1.91% | |
Infraestructura Energetica Nova SAB de CV (Utilities, Gas Utilities) | | | | | | | | | | | 1,166,100 | | | | 3,869,743 | |
Kimberly-Clark de Mexico SAB de CV Class A (Consumer Staples, Household Products) | | | | | | | | | | | 1,721,225 | | | | 2,431,754 | |
Walmart de Mexico SAB de CV (Consumer Staples, Food & Staples Retailing) | | | | | | | | | | | 1,542,191 | | | | 3,722,221 | |
| | | | |
| | | | | | | | | | | | | | | 10,023,718 | |
| | | | | | | | | | | | | | | | |
|
| Netherlands: 0.79% | |
X5 Retail Group NV GDR (Consumer Staples, Food & Staples Retailing) | | | | | | | | | | | 140,064 | | | | 4,133,734 | |
| | | | | | | | | | | | | | | | |
|
| Peru: 0.43% | |
Credicorp Limited (Financials, Banks) | | | | | | | | | | | 15,178 | | | | 2,261,826 | |
| | | | | | | | | | | | | | | | |
|
| Philippines: 0.43% | |
Bank of the Philippine Islands (Financials, Banks) | | | | | | | | | | | 1,982,560 | | | | 2,277,071 | |
| | | | | | | | | | | | | | | | |
|
| Qatar: 0.45% | |
Qatar National Bank (Financials, Banks) | | | | | | | | | | | 497,916 | | | | 2,348,489 | |
| | | | | | | | | | | | | | | | |
|
| Russia: 2.65% | |
LUKOIL PJSC ADR (Energy, Oil, Gas & Consumable Fuels) | | | | | | | | | | | 43,179 | | | | 2,816,900 | |
Magnitogorsk Iron & Steel Works PJSC (Materials, Metals & Mining) | | | | | | | | | | | 5,326,100 | | | | 2,874,709 | |
Mobile TeleSystems PJSC ADR (Communication Services, Wireless Telecommunication Services) | | | | | | | | | | | 377,085 | | | | 3,231,618 | |
NovaTek OAO GDR (Energy, Oil, Gas & Consumable Fuels) | | | | | | | | | | | 15,075 | | | | 2,113,997 | |
Sberbank PJSC ADR (Financials, Banks) | | | | | | | | | | | 269,889 | | | | 2,865,260 | |
| | | | |
| | | | | | | | | | | | | | | 13,902,484 | |
| | | | | | | | | | | | | | | | |
The accompanying notes are an integral part of these financial statements.
8 | Wells Fargo Emerging Markets Equity Income Fund
Portfolio of investments—April 30, 2020 (unaudited)
| | | | | | | | | | | | | | | | |
| | | | | | | | | Shares | | | Value | |
| Saudi Arabia: 0.89% | |
National Commercial Bank (Financials, Banks) | | | | | | | | | | | 471,843 | | | $ | 4,656,781 | |
| | | | | | | | | | | | | | | | |
|
| South Africa: 3.62% | |
Gold Fields Limited ADR (Materials, Metals & Mining) | | | | | | | | | | | 583,371 | | | | 4,281,943 | |
Naspers Limited (Consumer Discretionary, Internet & Direct Marketing Retail) | | | | | �� | | | | | | 57,413 | | | | 8,936,241 | |
Standard Bank Group Limited (Financials, Banks) | | | | | | | | | | | 475,723 | | | | 2,621,218 | |
The Bidvest Group Limited (Industrials, Industrial Conglomerates) | | | | | | | | | | | 392,250 | | | | 3,185,434 | |
| | | | |
| | | | | | | | | | | | | | | 19,024,836 | |
| | | | | | | | | | | | | | | | |
|
| South Korea: 10.36% | |
Coway Company Limited (Consumer Discretionary, Household Durables) | | | | | | | | | | | 45,632 | | | | 2,312,712 | |
KB Financial Group Incorporated (Financials, Banks) | | | | | | | | | | | 158,016 | | | | 4,521,044 | |
NH Investment & Securities Company Limited (Financials, Capital Markets) | | | | | | | | | | | 455,189 | | | | 3,622,285 | |
Samsung Electronics Company Limited (Information Technology, Technology Hardware, Storage & Peripherals) | | | | | | | | | | | 686,059 | | | | 28,209,049 | |
Samsung Fire & Marine Insurance (Financials, Insurance) | | | | | | | | | | | 16,890 | | | | 2,648,897 | |
SK Hynix Incorporated (Information Technology, Semiconductors & Semiconductor Equipment) | | | | | | | | | | | 111,489 | | | | 7,672,400 | |
SK Telecom Company Limited (Communication Services, Wireless Telecommunication Services) | | | | | | | | | | | 31,137 | | | | 5,411,726 | |
| | | | |
| | | | | | | | | | | | | | | 54,398,113 | |
| | | | | | | | | | | | | | | | |
|
| Taiwan: 13.13% | |
Accton Technology Corporation (Information Technology, Communications Equipment) | | | | | | | | | | | 525,000 | | | | 3,805,760 | |
ASE Technology Holding Company Limited (Information Technology, Semiconductors & Semiconductor Equipment) | | | | | | | | | | | 1,350,350 | | | | 3,008,190 | |
CTBC Financial Holding Company Limited (Financials, Banks) | | | | | | | | | | | 8,016,000 | | | | 5,341,802 | |
Delta Electronics Incorporated (Information Technology, Electronic Equipment, Instruments & Components) | | | | | | | | | | | 861,000 | | | | 4,015,881 | |
Hon Hai Precision Industry Company Limited (Information Technology, Electronic Equipment, Instruments & Components) | | | | | | | | | | | 1,526,704 | | | | 3,923,578 | |
Largan Precision Company Limited (Information Technology, Electronic Equipment, Instruments & Components) | | | | | | | | | | | 17,800 | | | | 2,426,381 | |
Mediatek Incorporated (Information Technology, Semiconductors & Semiconductor Equipment) | | | | | | | | | | | 313,000 | | | | 4,322,038 | |
Quanta Computer Incorporated (Information Technology, Technology Hardware, Storage & Peripherals) | | | | | | | | | | | 2,559,000 | | | | 5,529,147 | |
Taiwan Semiconductor Manufacturing Company Limited (Information Technology, Semiconductors & Semiconductor Equipment) | | | | | | | | | | | 3,028,000 | | | | 30,545,846 | |
Uni-President Enterprises Corporation (Consumer Staples, Food Products) | | | | | | | | | | | 1,189,000 | | | | 2,768,451 | |
Wiwynn Corporation (Information Technology, Technology Hardware, Storage & Peripherals) | | | | | | | | | | | 125,500 | | | | 3,220,219 | |
| | | | |
| | | | | | | | | | | | | | | 68,907,293 | |
| | | | | | | | | | | | | | | | |
|
| Thailand: 1.25% | |
Advanced Info Service PCL (Communication Services, Wireless Telecommunication Services) | | | | | | | | | | | 619,100 | | | | 3,764,623 | |
Bangkok Commercial Asset Management Public Company Limited (Financials, Capital Markets) | | | | | | | | | | | 3,806,000 | | | | 2,823,180 | |
| | | | |
| | | | | | | | | | | | | | | 6,587,803 | |
| | | | | | | | | | | | | | | | |
|
| United Arab Emirates: 0.46% | |
First Abu Dhabi Bank PJSC (Financials, Banks) | | | | | | | | | | | 779,546 | | | | 2,430,877 | |
| | | | | | | | | | | | | | | | |
|
| United Kingdom: 1.40% | |
Polymetal International plc (Materials, Metals & Mining) | | | | | | | | | | | 358,007 | | | | 7,331,591 | |
| | | | | | | | | | | | | | | | |
|
| United States: 0.78% | |
Southern Copper Corporation (Materials, Metals & Mining) | | | | | | | | | | | 126,456 | | | | 4,102,233 | |
| | | | | | | | | | | | | | | | |
| |
Total Common Stocks (Cost $493,346,301) | | | | 486,781,408 | |
| | | | | |
The accompanying notes are an integral part of these financial statements.
Wells Fargo Emerging Markets Equity Income Fund | 9
Portfolio of investments—April 30, 2020 (unaudited)
| | | | | | | | | | | | | | | | |
| | | Dividend yield | | | | | | Shares | | | Value | |
| Preferred Stocks: 3.28% | |
|
| Brazil: 1.79% | |
Banco Bradesco SA (Financials, Banks) | | | 2.81 | % | | | | | | | 940,218 | | | $ | 3,311,053 | |
Itaúsa Investimentos Itaú SA (Financials, Banks) | | | 5.44 | | | | | | | | 2,032,119 | | | | 3,363,260 | |
Petroleo Brasil SP ADR (Energy, Oil, Gas & Consumable Fuels) | | | 3.30 | | | | | | | | 407,383 | | | | 2,717,245 | |
| | | | |
| | | | | | | | | | | | 9,391,558 | |
| | | | | | | | | | | | | | | | |
|
| South Korea: 1.49% | |
Samsung Electronics Company Limited (Information Technology, Technology Hardware, Storage & Peripherals) | | | 1.79 | | | | | | | | 225,149 | | | | 7,804,925 | |
| | | | | | | | | | | | | | | | |
| |
| Total Preferred Stocks (Cost $18,603,445) | | | 17,196,483 | |
| | | | | |
| | | | |
| | | | | | | | | | | | | | | | |
| | | Yield | | | | | | | | | | |
| Short-Term Investments: 3.70% | |
|
| Investment Companies: 3.70% | |
Wells Fargo Government Money Market Fund Select Class (l)(u) | | | 0.19 | | | | | | | | 19,443,373 | | | | 19,443,373 | |
| | | | | | | | | | | | | | | | |
| |
Total Short-Term Investments (Cost $19,443,373) | | | | 19,443,373 | |
| | | | | |
| | | | | | | | |
| Total investments in securities (Cost $531,393,119) | | | 99.72 | % | | | 523,421,264 | |
| | |
Other assets and liabilities, net | | | 0.28 | | | | 1,459,447 | |
| | | | | | | | |
| Total net assets | | | 100.00 | % | | $ | 524,880,711 | |
| | | | | | | | |
| 144A | The security may be resold in transactions exempt from registration, normally to qualified institutional buyers, pursuant to Rule 144A under the Securities Act of 1933. |
| (l) | The issuer of the security is an affiliated person of the Fund as defined in the Investment Company Act of 1940. |
| (u) | The rate represents the7-day annualized yield at period end. |
Abbreviations:
| ADR | American depositary receipt |
| GDR | Global depositary receipt |
| REIT | Real estate investment trust |
Investments in Affiliates
An affiliated investment is an investment in which the Fund owns at least 5% of the outstanding voting shares of the issuer or as a result of other relationships, such as the Fund and the issuer having the same investment manager. Transactions with issuers that were either affiliated persons of the Fund at the beginning of the period or the end of the period were as follows:
| | | | | | | | | | | | | | | | | | | | | | | | | | | | | | | | | | | | |
| | | Shares,
beginning of
period | | | Shares
purchased | | | Shares
sold | | | Shares,
end of
period | | | Net
realized
gains
(losses) | | | Net
change in
unrealized
gains
(losses) | | | Income
from
affiliated
securities | | | Value,
end of
period | | | % of
net
assets | |
| | | | | | | | | |
| Short-Term Investments | | | | | | | | | | | | | | | | | | | | | | | | | | | |
Investment Companies | | | | | | | | | | | | | | | | | | | | | | | | | | | | | | | | | | | | |
Wells Fargo Government Money Market Fund Select Class | | | 11,617,435 | | | | 220,772,785 | | | | (212,946,847 | ) | | | 19,443,373 | | | $ | 0 | | | $ | 0 | | | $ | 115,559 | | | $ | 19,443,373 | | | | 3.70 | % |
The accompanying notes are an integral part of these financial statements.
10 | Wells Fargo Emerging Markets Equity Income Fund
Statement of assets and liabilities—April 30, 2020 (unaudited)
| | | | |
| | | | |
| |
Assets | | | | |
Investments in unaffiliated securities, at value (cost $511,949,746) | | $ | 503,977,891 | |
Investments in affiliated securities, at value (cost $19,443,373) | | | 19,443,373 | |
Cash | | | 207,346 | |
Foreign currency, at value (cost $2,143,202) | | | 2,170,566 | |
Receivable for investments sold | | | 940,828 | |
Receivable for Fund shares sold | | | 750,064 | |
Receivable for dividends | | | 672,173 | |
| | | | |
Total assets | | | 528,162,241 | |
| | | | |
| |
Liabilities | | | | |
Payable for investments purchased | | | 1,000,986 | |
Payable for Fund shares redeemed | | | 941,771 | |
Management fee payable | | | 365,579 | |
Administration fees payable | | | 54,202 | |
Distribution fees payable | | | 5,678 | |
Custody and accounting fees payable | | | 716,022 | |
Trustees’ fees and expenses payable | | | 8,979 | |
Accrued expenses and other liabilities | | | 188,313 | |
| | | | |
Total liabilities | | | 3,281,530 | |
| | | | |
Total net assets | | $ | 524,880,711 | |
| | | | |
| |
Net assets consist of | | | | |
Paid-in capital | | $ | 606,243,384 | |
Total distributable loss | | | (81,362,673 | ) |
| | | | |
Total net assets | | $ | 524,880,711 | |
| | | | |
| |
Computation of net asset value and offering price per share | | | | |
Net assets – Class A | | $ | 82,251,609 | |
Shares outstanding – Class A1 | | | 8,860,296 | |
Net asset value per share – Class A | | | $9.28 | |
Maximum offering price per share – Class A2 | | | $9.85 | |
Net assets – Class C | | $ | 9,336,177 | |
Shares outstanding – Class C1 | | | 1,013,440 | |
Net asset value per share – Class C | | | $9.21 | |
Net assets – Class R | | $ | 83,884 | |
Shares outstanding – Class R1 | | | 9,035 | |
Net asset value per share – Class R | | | $9.28 | |
Net assets – Class R6 | | $ | 70,763,423 | |
Shares outstanding – Class R61 | | | 7,609,762 | |
Net asset value per share – Class R6 | | | $9.30 | |
Net assets – Administrator Class | | $ | 3,803,568 | |
Shares outstanding – Administrator Class1 | | | 406,244 | |
Net asset value per share – Administrator Class | | | $9.36 | |
Net assets – Institutional Class | | $ | 358,642,050 | |
Shares outstanding – Institutional Class1 | | | 38,517,056 | |
Net asset value per share – Institutional Class | | | $9.31 | |
| 1 | The Fund has an unlimited number of authorized shares. |
| 2 | Maximum offering price is computed as 100/94.25 of net asset value. On investments of $50,000 or more, the offering price is reduced. |
The accompanying notes are an integral part of these financial statements.
Wells Fargo Emerging Markets Equity Income Fund | 11
Statement of operations—six months ended April 30, 2020 (unaudited)
| | | | |
| | | | |
| |
Investment income | | | | |
Dividends (net of foreign withholding taxes of $888,093) | | $ | 6,883,681 | |
Income from affiliated securities | | | 115,559 | |
| | | | |
Total investment income | | | 6,999,240 | |
| | | | |
| |
Expenses | | | | |
Management fee | | | 3,232,504 | |
Administration fees | |
Class A | | | 85,853 | |
Class C | | | 12,032 | |
Class R | | | 96 | |
Class R6 | | | 11,726 | |
Administrator Class | | | 3,025 | |
Institutional Class | | | 285,724 | |
Shareholder servicing fees | |
Class A | | | 102,206 | |
Class C | | | 14,323 | |
Class R | | | 114 | |
Administrator Class | | | 5,504 | |
Distribution fees | |
Class C | | | 42,927 | |
Class R | | | 95 | |
Custody and accounting fees | | | 382,242 | |
Professional fees | | | 23,334 | |
Registration fees | | | 51,950 | |
Shareholder report expenses | | | 49,249 | |
Trustees’ fees and expenses | | | 10,969 | |
Other fees and expenses | | | 23,003 | |
| | | | |
Total expenses | | | 4,336,876 | |
Less: Fee waivers and/or expense reimbursements | |
Fund-level | | | (256,652 | ) |
Class A | | | (34,461 | ) |
Class C | | | (2,188 | ) |
Class R6 | | | (1,716 | ) |
Administrator Class | | | (1,356 | ) |
Institutional Class | | | (115,296 | ) |
| | | | |
Net expenses | | | 3,925,207 | |
| | | | |
Net investment income | | | 3,074,033 | |
| | | | |
| |
Realized and unrealized gains (losses) on investments | | | | |
Net realized gains (losses) on | |
Unaffiliated securities | | | (47,782,114 | ) |
Forward foreign currency contracts | | | 17,645 | |
| | | | |
Net realized losses on investments | | | (47,764,469 | ) |
Net change in unrealized gains (losses) on investments | | | (64,180,308 | ) |
| | | | |
Net realized and unrealized gains (losses) on investments | | | (111,944,777 | ) |
| | | | |
Net decrease in net assets resulting from operations | | $ | (108,870,744 | ) |
| | | | |
The accompanying notes are an integral part of these financial statements.
12 | Wells Fargo Emerging Markets Equity Income Fund
Statement of changes in net assets
| | | | | | | | | | | | | | | | |
| | | Six months ended
April 30, 2020 (unaudited) | | | Year ended
October 31, 2019 | |
| | | | |
Operations | | | | | | | | | | | | | | | | |
Net investment income | | | | | | $ | 3,074,033 | | | | | | | $ | 14,642,116 | |
Net realized losses on investments | | | | | | | (47,764,469 | ) | | | | | | | (17,671,623 | ) |
Net change in unrealized gains (losses) on investments | | | | | | | (64,180,308 | ) | | | | | | | 62,604,509 | |
| | | | |
Net increase (decrease) in net assets resulting from operations | | | | | | | (108,870,744 | ) | | | | | | | 59,575,002 | |
| | | | |
| | | | |
Distributions to shareholders from net investment income and net realized gains | | | | | | | | | | | | | | | | |
Class A | | | | | | | (244,445 | ) | | | | | | | (418,262 | ) |
Class C | | | | | | | (30,648 | ) | | | | | | | (162,480 | ) |
Class R | | | | | | | (377 | ) | | | | | | | (2,026 | ) |
Class R6 | | | | | | | (500,281 | ) | | | | | | | (1,924,372 | ) |
Administrator Class | | | | | | | (23,940 | ) | | | | | | | (96,365 | ) |
Institutional Class | | | | | | | (2,694,498 | ) | | | | | | | (11,264,878 | ) |
| | | | |
Total distributions to shareholders | | | | | | | (3,494,189 | ) | | | | | | | (13,868,383 | ) |
| | | | |
| | | | |
Capital share transactions | | | Shares | | | | | | | | Shares | | | | | |
Proceeds from shares sold | | | | | | | | | | | | | | | | |
Class A | | | 639,279 | | | | 6,616,581 | | | | 890,759 | | | | 9,653,613 | |
Class C | | | 41,711 | | | | 444,051 | | | | 187,678 | | | | 2,023,175 | |
Class R | | | 1,289 | | | | 12,822 | | | | 2,473 | | | | 27,033 | |
Class R6 | | | 446,267 | | | | 4,110,630 | | | | 4,899,992 | | | | 51,938,484 | |
Administrator Class | | | 16,024 | | | | 167,693 | | | | 64,933 | | | | 717,682 | |
Institutional Class | | | 8,270,113 | | | | 79,969,560 | | | | 12,066,746 | | | | 132,238,601 | |
| | | | |
| | | | | | | 91,321,337 | | | | | | | | 196,598,588 | |
| | | | |
Reinvestment of distributions | | | | | | | | | | | | | | | | |
Class A | | | 20,718 | | | | 234,461 | | | | 36,560 | | | | 397,529 | |
Class C | | | 2,440 | | | | 27,031 | | | | 13,107 | | | | 141,943 | |
Class R | | | 23 | | | | 257 | | | | 136 | | | | 1,481 | |
Class R6 | | | 37,766 | | | | 424,020 | | | | 148,340 | | | | 1,620,864 | |
Administrator Class | | | 2,042 | | | | 23,093 | | | | 8,471 | | | | 92,927 | |
Institutional Class | | | 223,725 | | | | 2,516,314 | | | | 961,076 | | | | 10,479,060 | |
| | | | |
| | | | | | | 3,225,176 | | | | | | | | 12,733,804 | |
| | | | |
Payment for shares redeemed | | | | | | | | | | | | | | | | |
Class A | | | (1,761,010 | ) | | | (18,219,379 | ) | | | (1,047,749 | ) | | | (11,379,904 | ) |
Class C | | | (197,508 | ) | | | (2,014,730 | ) | | | (481,016 | ) | | | (5,160,401 | ) |
Class R | | | (775 | ) | | | (8,156 | ) | | | (3,032 | ) | | | (33,352 | ) |
Class R6 | | | (307,728 | ) | | | (3,352,316 | ) | | | (1,153,400 | ) | | | (12,803,248 | ) |
Administrator Class | | | (94,101 | ) | | | (965,417 | ) | | | (116,130 | ) | | | (1,269,026 | ) |
Institutional Class | | | (13,608,549 | ) | | | (136,277,289 | ) | | | (14,855,796 | ) | | | (160,766,339 | ) |
| | | | |
| | | | | | | (160,837,287 | ) | | | | | | | (191,412,270 | ) |
| | | | |
Net asset value of shares issued in acquisition | | | | | | | | | | | | | | | | |
Class A | | | 8,175,872 | | | | 91,018,144 | | | | 0 | | | | 0 | |
Class C | | | 94,417 | | | | 1,044,435 | | | | 0 | | | | 0 | |
Administrator Class | | | 67,995 | | | | 763,172 | | | | 0 | | | | 0 | |
Institutional Class | | | 1,739,066 | | | | 19,405,947 | | | | 0 | | | | 0 | |
| | | | |
| | | | | | | 112,231,698 | | | | | | | | 0 | |
| | | | |
Net increase in net assets resulting from capital share transactions | | | | | | | 45,940,924 | | | | | | | | 17,920,122 | |
| | | | |
Total increase (decrease) in net assets | | | | | | | (66,424,009 | ) | | | | | | | 63,626,741 | |
| | | | |
| | | | |
Net assets | | | | | | | | | | | | | | | | |
Beginning of period | | | | | | | 591,304,720 | | | | | | | | 527,677,979 | |
| | | | |
End of period | | | | | | $ | 524,880,711 | | | | | | | $ | 591,304,720 | |
| | | | |
The accompanying notes are an integral part of these financial statements.
Wells Fargo Emerging Markets Equity Income Fund | 13
Financial highlights
(For a share outstanding throughout each period)
| | | | | | | | | | | | | | | | | | | | | | | | |
| | | Six months ended
April 30, 2020
(unaudited) | | | Year ended October 31 | |
| CLASS A | | 2019 | | | 2018 | | | 2017 | | | 2016 | | | 2015 | |
Net asset value, beginning of period | | | $11.21 | | | | $10.33 | | | | $11.68 | | | | $10.27 | | | | $9.97 | | | | $11.33 | |
Net investment income | | | 0.04 | | | | 0.24 | | | | 0.27 | | | | 0.18 | 1 | | | 0.23 | 1 | | | 0.20 | |
Net realized and unrealized gains (losses) on investments | | | (1.92 | ) | | | 0.86 | | | | (1.36 | ) | | | 1.43 | | | | 0.29 | | | | (1.36 | ) |
| | | | | | | | | | | | | | | | | | | | | | | | |
Total from investment operations | | | (1.88 | ) | | | 1.10 | | | | (1.09 | ) | | | 1.61 | | | | 0.52 | | | | (1.16 | ) |
Distributions to shareholders from | | | | | | | | | | | | | | | | | | | | | | | | |
Net investment income | | | (0.05 | ) | | | (0.22 | ) | | | (0.26 | ) | | | (0.20 | ) | | | (0.22 | ) | | | (0.20 | ) |
Net asset value, end of period | | | $9.28 | | | | $11.21 | | | | $10.33 | | | | $11.68 | | | | $10.27 | | | | $9.97 | |
Total return2 | | | (16.81 | )% | | | 10.78 | % | | | (9.47 | )% | | | 15.79 | % | | | 5.29 | % | | | (10.34 | )% |
Ratios to average net assets (annualized) | | | | | | | | | | | | | | | | | | | | | | | | |
Gross expenses | | | 1.68 | % | | | 1.69 | % | | | 1.67 | % | | | 1.68 | % | | | 1.79 | % | | | 1.89 | % |
Net expenses | | | 1.52 | % | | | 1.62 | % | | | 1.62 | % | | | 1.63 | % | | | 1.65 | % | | | 1.65 | % |
Net investment income | | | 1.02 | % | | | 2.12 | % | | | 2.30 | % | | | 1.72 | % | | | 2.34 | % | | | 2.22 | % |
Supplemental data | | | | | | | | | | | | | | | | | | | | | | | | |
Portfolio turnover rate | | | 49 | % | | | 73 | % | | | 69 | % | | | 80 | % | | | 64 | % | | | 84 | % |
Net assets, end of period (000s omitted) | | | $82,252 | | | | $20,017 | | | | $19,684 | | | | $22,774 | | | | $26,459 | | | | $22,866 | |
| 1 | Calculated based upon average shares outstanding |
| 2 | Total return calculations do not include any sales charges. Returns for periods of less than one year are not annualized. |
The accompanying notes are an integral part of these financial statements.
14 | Wells Fargo Emerging Markets Equity Income Fund
Financial highlights
(For a share outstanding throughout each period)
| | | | | | | | | | | | | | | | | | | | | | | | |
| | | Six months ended
April 30, 2020
(unaudited) | | | Year ended October 31 | |
| CLASS C | | 2019 | | | 2018 | | | 2017 | | | 2016 | | | 2015 | |
Net asset value, beginning of period | | | $11.15 | | | | $10.27 | | | | $11.63 | | | | $10.23 | | | | $9.94 | | | | $11.32 | |
Net investment income (loss) | | | (0.00 | )1,2 | | | 0.15 | | | | 0.18 | | | | 0.13 | | | | 0.16 | 1 | | | 0.14 | |
Net realized and unrealized gains (losses) on investments | | | (1.91 | ) | | | 0.87 | | | | (1.35 | ) | | | 1.39 | | | | 0.28 | | | | (1.38 | ) |
| | | | | | | | | | | | | | | | | | | | | | | | |
Total from investment operations | | | (1.91 | ) | | | 1.02 | | | | (1.17 | ) | | | 1.52 | | | | 0.44 | | | | (1.24 | ) |
Distributions to shareholders from | | | | | | | | | | | | | | | | | | | | | | | | |
Net investment income | | | (0.03 | ) | | | (0.14 | ) | | | (0.19 | ) | | | (0.12 | ) | | | (0.15 | ) | | | (0.14 | ) |
Net asset value, end of period | | | $9.21 | | | | $11.15 | | | | $10.27 | | | | $11.63 | | | | $10.23 | | | | $9.94 | |
Total return3 | | | (17.18 | )% | | | 10.01 | % | | | (10.20 | )% | | | 14.91 | % | | | 4.53 | % | | | (10.95 | )% |
Ratios to average net assets (annualized) | | | | | | | | | | | | | | | | | | | | | | | | |
Gross expenses | | | 2.44 | % | | | 2.44 | % | | | 2.42 | % | | | 2.42 | % | | | 2.54 | % | | | 2.64 | % |
Net expenses | | | 2.31 | % | | | 2.37 | % | | | 2.37 | % | | | 2.38 | % | | | 2.40 | % | | | 2.40 | % |
Net investment income (loss) | | | (0.07 | )% | | | 1.30 | % | | | 1.53 | % | | | 1.18 | % | | | 1.62 | % | | | 1.45 | % |
Supplemental data | | | | | | | | | | | | | | | | | | | | | | | | |
Portfolio turnover rate | | | 49 | % | | | 73 | % | | | 69 | % | | | 80 | % | | | 64 | % | | | 84 | % |
Net assets, end of period (000s omitted) | | | $9,336 | | | | $11,958 | | | | $13,896 | | | | $16,898 | | | | $13,327 | | | | $10,190 | |
| 1 | Calculated based upon average shares outstanding |
| 2 | Amount is more than $(0.005). |
| 3 | Total return calculations do not include any sales charges. Returns for periods of less than one year are not annualized. |
The accompanying notes are an integral part of these financial statements.
Wells Fargo Emerging Markets Equity Income Fund | 15
Financial highlights
(For a share outstanding throughout each period)
| | | | | | | | | | | | | | | | | | | | | | | | |
| | | Six months ended
April 30, 2020
(unaudited) | | | Year ended October 31 | |
| CLASS R | | 2019 | | | 2018 | | | 2017 | | | 2016 | | | 20151 | |
Net asset value, beginning of period | | | $11.22 | | | | $10.34 | | | | $11.71 | | | | $10.30 | | | | $9.99 | | | | $9.44 | |
Net investment income (loss) | | | 0.02 | 2 | | | 0.20 | | | | 0.24 | | | | 0.18 | | | | 0.20 | 2 | | | (0.01 | )2 |
Net realized and unrealized gains (losses) on investments | | | (1.92 | ) | | | 0.88 | | | | (1.37 | ) | | | 1.40 | | | | 0.30 | | | | 0.56 | |
| | | | | | | | | | | | | | | | | | | | | | | | |
Total from investment operations | | | (1.90 | ) | | | 1.08 | | | | (1.13 | ) | | | 1.58 | | | | 0.50 | | | | 0.55 | |
Distributions to shareholders from | | | | | | | | | | | | | | | | | | | | | | | | |
Net investment income | | | (0.04 | ) | | | (0.20 | ) | | | (0.24 | ) | | | (0.17 | ) | | | (0.19 | ) | | | (0.00 | )3 |
Net asset value, end of period | | | $9.28 | | | | $11.22 | | | | $10.34 | | | | $11.71 | | | | $10.30 | | | | $9.99 | |
Total return4 | | | (16.95 | )% | | | 10.61 | % | | | (9.70 | )% | | | 15.39 | % | | | 5.13 | % | | | 5.87 | % |
Ratios to average net assets (annualized) | | | | | | | | | | | | | | | | | | | | | | | | |
Gross expenses | | | 1.89 | % | | | 1.93 | % | | | 1.94 | % | | | 1.91 | % | | | 2.04 | % | | | 2.10 | % |
Net expenses | | | 1.81 | % | | | 1.87 | % | | | 1.87 | % | | | 1.87 | % | | | 1.90 | % | | | 1.90 | % |
Net investment income (loss) | | | 0.42 | % | | | 1.97 | % | | | 2.64 | % | | | 1.69 | % | | | 2.08 | % | | | (0.90 | )% |
Supplemental data | | | | | | | | | | | | | | | | | | | | | | | | |
Portfolio turnover rate | | | 49 | % | | | 73 | % | | | 69 | % | | | 80 | % | | | 64 | % | | | 84 | % |
Net assets, end of period (000s omitted) | | | $84 | | | | $95 | | | | $92 | | | | $32 | | | | $28 | | | | $26 | |
| 1 | For the period from September 30, 2015 (commencement of class operations) to October 31, 2015 |
| 2 | Calculated based upon average shares outstanding |
| 3 | Amount is less than $0.005. |
| 4 | Returns for periods of less than one year are not annualized. |
The accompanying notes are an integral part of these financial statements.
16 | Wells Fargo Emerging Markets Equity Income Fund
Financial highlights
(For a share outstanding throughout each period)
| | | | | | | | | | | | | | | | | | | | | | | | |
| | | Six months ended
April 30, 2020
(unaudited) | | | Year ended October 31 | |
| CLASS R6 | | 2019 | | | 2018 | | | 2017 | | | 2016 | | | 20151 | |
Net asset value, beginning of period | | | $11.23 | | | | $10.34 | | | | $11.69 | | | | $10.29 | | | | $9.97 | | | | $9.42 | |
Net investment income (loss) | | | 0.06 | | | | 0.31 | 2 | | | 0.32 | | | | 0.33 | 2 | | | 0.30 | 2 | | | (0.00 | )2,3 |
Net realized and unrealized gains (losses) on investments | | | (1.92 | ) | | | 0.85 | | | | (1.35 | ) | | | 1.32 | | | | 0.27 | | | | 0.56 | |
| | | | | | | | | | | | | | | | | | | | | | | | |
Total from investment operations | | | (1.86 | ) | | | 1.16 | | | | (1.03 | ) | | | 1.65 | | | | 0.57 | | | | 0.56 | |
Distributions to shareholders from | | | | | | | | | | | | | | | | | | | | | | | | |
Net investment income | | | (0.07 | ) | | | (0.27 | ) | | | (0.32 | ) | | | (0.25 | ) | | | (0.25 | ) | | | (0.01 | ) |
Net asset value, end of period | | | $9.30 | | | | $11.23 | | | | $10.34 | | | | $11.69 | | | | $10.29 | | | | $9.97 | |
Total return4 | | | (16.68 | )% | | | 11.34 | % | | | (9.05 | )% | | | 16.25 | % | | | 5.90 | % | | | 5.91 | % |
Ratios to average net assets (annualized) | | | | | | | | | | | | | | | | | | | | | | | | |
Gross expenses | | | 1.26 | % | | | 1.26 | % | | | 1.24 | % | | | 1.20 | % | | | 1.36 | % | | | 1.40 | % |
Net expenses | | | 1.17 | % | | | 1.17 | % | | | 1.17 | % | | | 1.17 | % | | | 1.20 | % | | | 1.20 | % |
Net investment income (loss) | | | 1.06 | % | | | 2.81 | % | | | 2.58 | % | | | 2.96 | % | | | 3.03 | % | | | (0.19 | )% |
Supplemental data | | | | | | | | | | | | | | | | | | | | | | | | |
Portfolio turnover rate | | | 49 | % | | | 73 | % | | | 69 | % | | | 80 | % | | | 64 | % | | | 84 | % |
Net assets, end of period (000s omitted) | | | $70,763 | | | | $83,481 | | | | $36,597 | | | | $57,765 | | | | $2,592 | | | | $26 | |
| 1 | For the period from September 30, 2015 (commencement of class operations) to October 31, 2015 |
| 2 | Calculated based upon average shares outstanding |
| 3 | Amount is more than $(0.005). |
| 4 | Returns for periods of less than one year are not annualized. |
The accompanying notes are an integral part of these financial statements.
Wells Fargo Emerging Markets Equity Income Fund | 17
Financial highlights
(For a share outstanding throughout each period)
| | | | | | | | | | | | | | | | | | | | | | | | |
| | | Six months ended
April 30, 2020
(unaudited) | | | Year ended October 31 | |
| ADMINISTRATOR CLASS | | 2019 | | | 2018 | | | 2017 | | | 2016 | | | 2015 | |
Net asset value, beginning of period | | | $11.31 | | | | $10.41 | | | | $11.76 | | | | $10.32 | | | | $10.00 | | | | $11.35 | |
Net investment income | | | 0.04 | 1 | | | 0.25 | 1 | | | 0.22 | 1 | | | 0.18 | 1 | | | 0.25 | 1 | | | 0.23 | |
Net realized and unrealized gains (losses) on investments | | | (1.93 | ) | | | 0.89 | | | | (1.29 | ) | | | 1.46 | | | | 0.29 | | | | (1.37 | ) |
| | | | | | | | | | | | | | | | | | | | | | | | |
Total from investment operations | | | (1.89 | ) | | | 1.14 | | | | (1.07 | ) | | | 1.64 | | | | 0.54 | | | | (1.14 | ) |
Distributions to shareholders from | | | | | | | | | | | | | | | | | | | | | | | | |
Net investment income | | | (0.06 | ) | | | (0.24 | ) | | | (0.28 | ) | | | (0.20 | ) | | | (0.22 | ) | | | (0.21 | ) |
Net asset value, end of period | | | $9.36 | | | | $11.31 | | | | $10.41 | | | | $11.76 | | | | $10.32 | | | | $10.00 | |
Total return2 | | | (16.83 | )% | | | 11.01 | % | | | (9.29 | )% | | | 15.99 | % | | | 5.56 | % | | | (10.12 | )% |
Ratios to average net assets (annualized) | | | | | | | | | | | | | | | | | | | | | | | | |
Gross expenses | | | 1.59 | % | | | 1.61 | % | | | 1.57 | % | | | 1.58 | % | | | 1.71 | % | | | 1.76 | % |
Net expenses | | | 1.45 | % | | | 1.45 | % | | | 1.45 | % | | | 1.45 | % | | | 1.45 | % | | | 1.45 | % |
Net investment income | | | 0.81 | % | | | 2.24 | % | | | 1.86 | % | | | 1.73 | % | | | 2.54 | % | | | 2.38 | % |
Supplemental data | | | | | | | | | | | | | | | | | | | | | | | | |
Portfolio turnover rate | | | 49 | % | | | 73 | % | | | 69 | % | | | 80 | % | | | 64 | % | | | 84 | % |
Net assets, end of period (000s omitted) | | | $3,804 | | | | $4,686 | | | | $4,758 | | | | $13,940 | | | | $50,970 | | | | $43,928 | |
| 1 | Calculated based upon average shares outstanding |
| 2 | Returns for periods of less than one year are not annualized. |
The accompanying notes are an integral part of these financial statements.
18 | Wells Fargo Emerging Markets Equity Income Fund
Financial highlights
(For a share outstanding throughout each period)
| | | | | | | | | | | | | | | | | | | | | | | | |
| | | Six months ended
April 30, 2020
(unaudited) | | | Year ended October 31 | |
| INSTITUTIONAL CLASS | | 2019 | | | 2018 | | | 2017 | | | 2016 | | | 2015 | |
Net asset value, beginning of period | | | $11.24 | | | | $10.35 | | | | $11.70 | | | | $10.30 | | | | $9.98 | | | | $11.34 | |
Net investment income | | | 0.05 | 1 | | | 0.28 | | | | 0.32 | | | | 0.25 | | | | 0.27 | 1 | | | 0.25 | 1 |
Net realized and unrealized gains (losses) on investments | | | (1.92 | ) | | | 0.87 | | | | (1.36 | ) | | | 1.39 | | | | 0.30 | | | | (1.36 | ) |
| | | | | | | | | | | | | | | | | | | | | | | | |
Total from investment operations | | | (1.87 | ) | | | 1.15 | | | | (1.04 | ) | | | 1.64 | | | | 0.57 | | | | (1.11 | ) |
Distributions to shareholders from | | | | | | | | | | | | | | | | | | | | | | | | |
Net investment income | | | (0.06 | ) | | | (0.26 | ) | | | (0.31 | ) | | | (0.24 | ) | | | (0.25 | ) | | | (0.25 | ) |
Net asset value, end of period | | | $9.31 | | | | $11.24 | | | | $10.35 | | | | $11.70 | | | | $10.30 | | | | $9.98 | |
Total return2 | | | (16.70 | )% | | | 11.24 | % | | | (9.11 | )% | | | 16.11 | % | | | 5.84 | % | | | (9.95 | )% |
Ratios to average net assets (annualized) | | | | | | | | | | | | | | | | | | | | | | | | |
Gross expenses | | | 1.36 | % | | | 1.36 | % | | | 1.34 | % | | | 1.33 | % | | | 1.45 | % | | | 1.51 | % |
Net expenses | | | 1.22 | % | | | 1.22 | % | | | 1.22 | % | | | 1.23 | % | | | 1.25 | % | | | 1.25 | % |
Net investment income | | | 1.01 | % | | | 2.54 | % | | | 2.73 | % | | | 2.32 | % | | | 2.75 | % | | | 2.41 | % |
Supplemental data | | | | | | | | | | | | | | | | | | | | | | | | |
Portfolio turnover rate | | | 49 | % | | | 73 | % | | | 69 | % | | | 80 | % | | | 64 | % | | | 84 | % |
Net assets, end of period (000s omitted) | | | $358,642 | | | | $471,068 | | | | $452,650 | | | | $514,624 | | | | $426,801 | | | | $132,918 | |
| 1 | Calculated based upon average shares outstanding |
| 2 | Returns for periods of less than one year are not annualized. |
The accompanying notes are an integral part of these financial statements.
Wells Fargo Emerging Markets Equity Income Fund | 19
Notes to financial statements (unaudited)
1. ORGANIZATION
Wells Fargo Funds Trust (the “Trust”), a Delaware statutory trust organized on March 10, 1999, is anopen-end management investment company registered under the Investment Company Act of 1940, as amended (the “1940 Act”). As an investment company, the Trust follows the accounting and reporting guidance in Financial Accounting Standards Board (“FASB”)Accounting Standards Codification Topic 946, Financial Services – Investment Companies. These financial statements report on the Wells Fargo Emerging Markets Equity Income Fund (the “Fund”) which is a diversified series of the Trust.
2. SIGNIFICANT ACCOUNTING POLICIES
The following significant accounting policies, which are consistently followed in the preparation of the financial statements of the Fund, are in conformity with U.S. generally accepted accounting principles which require management to make estimates and assumptions that affect the reported amounts of assets and liabilities, disclosure of contingent assets and liabilities at the date of the financial statements, and the reported amounts of revenues and expenses during the reporting period. Actual results could differ from those estimates.
Securities valuation
All investments are valued each business day as of the close of regular trading on the New York Stock Exchange (generally 4 p.m. Eastern Time), although the Fund may deviate from this calculation time under unusual or unexpected circumstances.
Equity securities that are listed on a foreign or domestic exchange or market are valued at the official closing price or, if none, the last sales price. If no sale occurs on the principal exchange or market that day, a fair value price will be determined in accordance with the Fund’s Valuation Procedures.
Forward foreign currency contracts are recorded at the forward rate provided by an independent foreign currency pricing source at a time each business day specified by the Wells Fargo Asset Management Pricing Committee at Wells Fargo Funds Management, LLC (“Funds Management”).
The values of securities denominated in foreign currencies are translated into U.S. dollars at rates provided by an independent foreign currency pricing source at a time each business day specified by the Wells Fargo Asset Management Pricing Committee.
Many securities markets and exchanges outside the U.S. close prior to the close of the New York Stock Exchange and therefore may not fully reflect trading or events that occur after the close of the principal exchange in which the foreign securities are traded, but before the close of the New York Stock Exchange. If such trading or events are expected to materially affect the value of such securities, then fair value pricing procedures approved by the Board of Trustees of the Fund are applied. These procedures take into account multiple factors including movements in U.S. securities markets after foreign exchanges close. Foreign securities that are fair valued under these procedures are categorized as Level 2 and the application of these procedures may result in transfers between Level 1 and Level 2. Depending on market activity, such fair valuations may be frequent. Such fair value pricing may result in net asset values that are higher or lower than net asset values based on the last reported sales price or latest quoted bid price. On April 30, 2020, such fair value pricing was used in pricing certain foreign securities.
Investments in registeredopen-end investment companies are valued at net asset value.
Investments which are not valued using any of the methods discussed above are valued at their fair value, as determined in good faith by the Board of Trustees. The Board of Trustees has established a Valuation Committee comprised of the Trustees and has delegated to it the authority to take any actions regarding the valuation of portfolio securities that the Valuation Committee deems necessary or appropriate, including determining the fair value of portfolio securities, unless the determination has been delegated to the Wells Fargo Asset Management Pricing Committee. The Board of Trustees retains the authority to make or ratify any valuation decisions or approve any changes to the Valuation Procedures as it deems appropriate. On a quarterly basis, the Board of Trustees receives reports on any valuation actions taken by the Valuation Committee or the Wells Fargo Asset Management Pricing Committee which may include items for ratification.
Foreign currency translation
The accounting records of the Fund are maintained in U.S. dollars. The values of other assets and liabilities denominated in foreign currencies are translated into U.S. dollars at rates provided by an independent foreign currency pricing source at a time each business day specified by the Wells Fargo Asset Management Pricing Committee. Purchases and sales of securities, and income and expenses are converted at the rate of exchange on the respective dates of such transactions. Net realized foreign exchange gains or losses arise from sales of foreign currencies, currency gains or losses realized between the trade and settlement dates on securities transactions, and the difference between the amounts of dividends, interest and foreign withholding taxes recorded and the U.S. dollar equivalent of the amounts actually paid or received. Net unrealized foreign exchange gains and losses arise from changes in the fair value of assets and liabilities other than investments in securities resulting from changes in exchange rates. The changes in net assets arising from changes in exchange rates of securities and the
20 | Wells Fargo Emerging Markets Equity Income Fund
Notes to financial statements (unaudited)
changes in net assets resulting from changes in market prices of securities are not separately presented. Such changes are included in net realized and unrealized gains or losses from investments.
Participation notes
The Fund may invest in participation notes to gain exposure to securities in certain foreign markets. Participation notes are issued by banks or broker-dealers and are designed to offer a return linked to a particular underlying foreign security. Participation notes involve transaction costs, which may be higher than those applicable to the underlying foreign security. The holder of the participation note is entitled to receive from the bank or broker-dealer, an amount equal to the dividend paid by the issuer of the underlying foreign security; however, the holder is not entitled to the same rights (i.e. voting rights) as an owner of the underlying foreign security. Investments in participation notes involve risks beyond those normally associated with a direct investment in an underlying security. The Fund has no rights against the issuer of the underlying foreign security and participation notes expose the Fund to counterparty risk in the event the counterparty does not perform. There is also no assurance there will be a secondary trading market for the participation note or that the trading price of the participation note will equal the underlying value of the foreign security that it seeks to replicate.
Forward foreign currency contracts
A forward foreign currency contract is an agreement between two parties to purchase or sell a specific currency for an agreed-upon price at a future date. The Fund enters into forward foreign currency contracts to facilitate transactions in foreign-denominated securities and to attempt to minimize the risk to the Fund from adverse changes in the relationship between currencies. Forward foreign currency contracts are recorded at the forward rate andmarked-to-market daily. When the contracts are closed, realized gains and losses arising from such transactions are recorded as realized gains or losses on forward foreign currency contracts. The Fund is subject to foreign currency risk and may be exposed to risks if the counterparties to the contracts are unable to meet the terms of their contracts or if the value of the foreign currency changes unfavorably. The Fund’s maximum risk of loss from counterparty credit risk is the unrealized gains on the contracts. This risk may be mitigated if there is a master netting arrangement between the Fund and the counterparty.
Security transactions and income recognition
Securities transactions are recorded on a trade date basis. Realized gains or losses are recorded on the basis of identified cost.
Dividend income is recognized on theex-dividend date, except for certain dividends from foreign securities, which are recorded as soon as the custodian verifies theex-dividend date. Dividend income from foreign securities is recorded net of foreign taxes withheld where recovery of such taxes is not assured.
Distributions to shareholders
Distributions to shareholders are recorded on theex-dividend date and paid from net investment income monthly and any net realized gains are paid at least annually. Such distributions are determined in accordance with income tax regulations and may differ from U.S. generally accepted accounting principles. Dividend sources are estimated at the time of declaration. The tax character of distributions is determined as of the Fund’s fiscal year end. Therefore, a portion of the Fund’s distributions made prior to the Fund’s fiscal year end may be categorized as a tax return of capital at year end.
Federal and other taxes
The Fund intends to continue to qualify as a regulated investment company by distributing substantially all of its investment company taxable income and any net realized capital gains (after reduction for capital loss carryforwards) sufficient to relieve it from all, or substantially all, federal income taxes. Accordingly, no provision for federal income taxes was required.
The Fund’s income and federal excise tax returns and all financial records supporting those returns for the prior three fiscal years are subject to examination by the federal and Delaware revenue authorities. Management has analyzed the Fund’s tax positions taken on federal, state, and foreign tax returns for all open tax years and does not believe that there are any uncertain tax positions that require recognition of a tax liability.
As of April 30, 2020, the aggregate cost of all investments for federal income tax purposes was $529,220,930 and the unrealized gains (losses) consisted of:
| | | | |
| |
Gross unrealized gains | | $ | 43,167,889 | |
| |
Gross unrealized losses | | | (48,967,555 | ) |
| |
Net unrealized losses | | $ | (5,799,666 | ) |
As of October 31, 2019, the Fund had capital loss carryforwards which consisted of $13,252,661 in short-term capital losses and $12,173,464 in long-term capital losses.
Wells Fargo Emerging Markets Equity Income Fund | 21
Notes to financial statements (unaudited)
Class allocations
The separate classes of shares offered by the Fund differ principally in applicable sales charges, distribution, shareholder servicing, and administration fees. Class specific expenses are charged directly to that share class. Investment income, common fund-level expenses, and realized and unrealized gains (losses) on investments are allocated daily to each class of shares based on the relative proportion of net assets of each class.
3. FAIR VALUATION MEASUREMENTS
Fair value measurements of investments are determined within a framework that has established a fair value hierarchy based upon the various data inputs utilized in determining the value of the Fund’s investments. The three-level hierarchy gives the highest priority to unadjusted quoted prices in active markets for identical assets or liabilities (Level 1) and the lowest priority to unobservable inputs (Level 3). The Fund’s investments are classified within the fair value hierarchy based on the lowest level of input that is significant to the fair value measurement. The inputs are summarized into three broad levels as follows:
| ∎ | | Level 1 – quoted prices in active markets for identical securities |
| ∎ | | Level 2 – other significant observable inputs (including quoted prices for similar securities, interest rates, prepayment speeds, credit risk, etc.) |
| ∎ | | Level 3 – significant unobservable inputs (including the Fund’s own assumptions in determining the fair value of investments) |
The inputs or methodologies used for valuing investments in securities are not necessarily an indication of the risk associated with investing in those securities.
The following is a summary of the inputs used in valuing the Fund’s assets and liabilities as of April 30, 2020:
| | | | | | | | | | | | | | | | |
| | | | |
| | | Quoted prices
(Level 1) | | | Other significant
observable inputs
(Level 2) | | | Significant
unobservable inputs
(Level 3) | | | Total | |
| | | | |
Assets | | | | | | | | | | | | | | | | |
Investments in: | | | | | | | | | | | | | | | | |
| | | | |
Common stocks | | | | | | | | | | | | | | | | |
| | | | |
Brazil | | $ | 15,393,770 | | | $ | 0 | | | $ | 0 | | | $ | 15,393,770 | |
| | | | |
Chile | | | 2,658,845 | | | | 0 | | | | 0 | | | | 2,658,845 | |
| | | | |
China | | | 4,802,188 | | | | 187,551,062 | | | | 0 | | | | 192,353,250 | |
| | | | |
Greece | | | 0 | | | | 4,334,742 | | | | 0 | | | | 4,334,742 | |
| | | | |
Hong Kong | | | 0 | | | | 13,909,877 | | | | 0 | | | | 13,909,877 | |
| | | | |
India | | | 0 | | | | 41,718,680 | | | | 0 | | | | 41,718,680 | |
| | | | |
Indonesia | | | 0 | | | | 9,281,357 | | | | 0 | | | | 9,281,357 | |
| | | | |
Malaysia | | | 0 | | | | 4,744,038 | | | | 0 | | | | 4,744,038 | |
| | | | |
Mexico | | | 10,023,718 | | | | 0 | | | | 0 | | | | 10,023,718 | |
| | | | |
Netherlands | | | 0 | | | | 4,133,734 | | | | 0 | | | | 4,133,734 | |
| | | | |
Peru | | | 2,261,826 | | | | 0 | | | | 0 | | | | 2,261,826 | |
| | | | |
Philippines | | | 0 | | | | 2,277,071 | | | | 0 | | | | 2,277,071 | |
| | | | |
Qatar | | | 0 | | | | 2,348,489 | | | | 0 | | | | 2,348,489 | |
| | | | |
Russia | | | 3,231,618 | | | | 10,670,866 | | | | 0 | | | | 13,902,484 | |
| | | | |
Saudi Arabia | | | 0 | | | | 4,656,781 | | | | 0 | | | | 4,656,781 | |
| | | | |
South Africa | | | 6,903,161 | | | | 12,121,675 | | | | 0 | | | | 19,024,836 | |
| | | | |
South Korea | | | 0 | | | | 54,398,113 | | | | 0 | | | | 54,398,113 | |
| | | | |
Taiwan | | | 0 | | | | 68,907,293 | | | | 0 | | | | 68,907,293 | |
| | | | |
Thailand | | | 2,823,180 | | | | 3,764,623 | | | | 0 | | | | 6,587,803 | |
| | | | |
United Arab Emirates | | | 0 | | | | 2,430,877 | | | | 0 | | | | 2,430,877 | |
| | | | |
United Kingdom | | | 0 | | | | 7,331,591 | | | | 0 | | | | 7,331,591 | |
| | | | |
United States | | | 4,102,233 | | | | 0 | | | | 0 | | | | 4,102,233 | |
| | | | |
Preferred stocks | | | | | | | | | | | | | | | | |
| | | | |
Brazil | | | 9,391,558 | | | | 0 | | | | 0 | | | | 9,391,558 | |
| | | | |
South Korea | | | 0 | | | | 7,804,925 | | | | 0 | | | | 7,804,925 | |
| | | | |
Short-term investments | | | | | | | | | | | | | | | | |
| | | | |
Investment companies | | | 19,443,373 | | | | 0 | | | | 0 | | | | 19,443,373 | |
| | | | |
Total assets | | $ | 81,035,470 | | | $ | 442,385,794 | | | $ | 0 | | | $ | 523,421,264 | |
22 | Wells Fargo Emerging Markets Equity Income Fund
Notes to financial statements (unaudited)
Additional sector, industry or geographic detail is included in the Portfolio of Investments.
For the six months ended April 30, 2020, the Fund did not have any transfers into/out of Level 3.
4. TRANSACTIONS WITH AFFILIATES
Management fee
Funds Management, an indirect wholly owned subsidiary of Wells Fargo & Company (“Wells Fargo”), is the manager of the Fund and provides advisory and fund-level administrative services under an investment management agreement. Under the investment management agreement, Funds Management is responsible for, among other services, implementing the investment objectives and strategies of the Fund, supervising the subadviser and providing fund-level administrative services in connection with the Fund’s operations. As compensation for its services under the investment management agreement, Funds Management is entitled to receive a management fee at the following annual rate based on the Fund’s average daily net assets:
| | | | |
| |
| Average daily net assets | | Management fee | |
| |
First $1 billion | | | 1.050 | % |
| |
Next $1 billion | | | 1.025 | |
| |
Next $2 billion | | | 1.000 | |
| |
Next $1 billion | | | 0.975 | |
| |
Next $3 billion | | | 0.965 | |
| |
Next $2 billion | | | 0.955 | |
| |
Over $10 billion | | | 0.945 | |
For the six months ended April 30, 2020, the management fee was equivalent to an annual rate of 1.05% of the Fund’s average daily net assets.
Funds Management has retained the services of a subadviser to provide daily portfolio management to the Fund. The fee for subadvisory services is borne by Funds Management. Wells Capital Management Incorporated, an affiliate of Funds Management and an indirect wholly owned subsidiary of Wells Fargo, is the subadviser to the Fund and is entitled to receive a fee from Funds Management at an annual rate starting at 0.65% and declining to 0.45% as the average daily net assets of the Fund increase.
Administration fees
Under a class-level administration agreement, Funds Management provides class-level administrative services to the Fund, which includes paying fees and expenses for services provided by the transfer agent,sub-transfer agents, omnibus account servicers and record-keepers. As compensation for its services under the class-level administration agreement, Funds Management receives an annual fee which is calculated based on the average daily net assets of each class as follows:
| | | | |
| |
| | | Class-level administration fee | |
| |
Class A, Class C, Class R | | | 0.21 | % |
| |
Class R6 | | | 0.03 | |
| |
Administrator Class, Institutional Class | | | 0.13 | |
Waivers and/or expense reimbursements
Funds Management has contractually waived and/or reimbursed management and administration fees to the extent necessary to maintain certain net operating expense ratios for the Fund. When each class of the Fund has exceeded its expense cap, Funds Management has waived fees and/or reimbursed expenses from fund-level expenses on a proportionate basis and then from class specific expenses. When only certain classes exceed their expense caps, waivers and/or reimbursements are applied against class specific expenses before fund-level expenses. Funds Management has committed through February 28, 2021 to waive fees and/or reimburse expenses to the extent necessary to cap the Fund’s expenses at 1.55% for Class A shares, 2.30% for Class C shares, 1.80% for Class R shares, 1.17% for Class R6 shares, 1.45% for Administrator Class shares, and 1.22% for Institutional Class shares. Prior to or after the commitment expiration date, the cap may be increased or the commitment to maintain the cap may be terminated only with the approval of the Board of Trustees.Prior to December 7, 2019, the Fund’s expenses were capped at 1.62% for Class A shares, 2.37% for Class C shares, and 1.87% for Class R shares.
Wells Fargo Emerging Markets Equity Income Fund | 23
Notes to financial statements (unaudited)
Distribution fees
The Trust has adopted a distribution plan for Class C and Class R shares of the Fund pursuant to Rule12b-1 under the 1940 Act. Distribution fees are charged to Class C and Class R shares and paid to Wells Fargo Funds Distributor, LLC (“Funds Distributor”), the principal underwriter, at an annual rate of 0.75% of the average daily net assets of Class C shares and 0.25% of the average daily net assets of Class R shares.
In addition, Funds Distributor is entitled to receive thefront-end sales charge from the purchase of Class A shares and a contingent deferred sales charge on the redemption of certain Class A shares. Funds Distributor is also entitled to receive the contingent deferred sales charges from redemptions of Class C shares. For the six months ended April 30, 2020, Funds Distributor received $1,605 from the sale of Class A shares. No contingent deferred sales charges were incurred by Class A and Class C shares for the six months ended April 30, 2020.
Shareholder servicing fees
The Trust has entered into contracts with one or more shareholder servicing agents, whereby Class A, Class C, Class R, and Administrator Class of the Fund are charged a fee at an annual rate of 0.25% of the average daily net assets of each respective class. A portion of these total shareholder servicing fees were paid to affiliates of Wells Fargo.
Interfund transactions
The Fund may purchase or sell portfolio investment securities to certain other Wells Fargo affiliates pursuant to Rule17a-7 under the 1940 Act and under procedures adopted by the Board of Trustees. The procedures have been designed to ensure that these interfund transactions, which do not incur broker commissions, are effected at current market prices.
5. INVESTMENT PORTFOLIO TRANSACTIONS
Purchases and sales of investments, excluding U.S. government obligations (if any) and short-term securities, for the six months ended April 30, 2020 were $296,285,045 and $287,851,270, respectively.
6. DERIVATIVE TRANSACTIONS
During the six months ended April 30, 2020, the Fund entered into forward foreign currency contracts for hedging purposes. The Fund had average contract amounts of $147,855 and $276,384 in forward foreign currency contracts to buy and forward foreign currency contracts to sell, respectively, during the six months ended April 30, 2020.
The fair value, realized gains or losses and change in unrealized gains or losses, if any, on derivative instruments are reflected in the corresponding financial statement captions.
7. ACQUISITION
After the close of business on December 6, 2019, the Fund acquired the net assets of Wells Fargo Asia Pacific Fund. The purpose of the transaction was to combine two funds with similar investment objectives and strategies. Shareholders holding Class A, Class C, Administrator Class, and Institutional Class shares of Wells Fargo Asia Pacific Fund received Class A, Class C, Administrator Class, and Institutional Class shares, respectively, of the Fund in the reorganization. The acquisition was accomplished by atax-free exchange of all of the shares of Wells Fargo Asia Pacific Fund for 10,077,350 shares of the Fund valued at $112,231,698 at an exchange ratio of 1.01, 0.96, 0.99, and 0.98 for Class A, Class C, Administrator Class, and Institutional Class shares, respectively. The investment portfolio of Wells Fargo Asia Pacific Fund with a fair value of $30,620,761, identified cost of $29,928,769 and unrealized gains of $691,992 at December 6, 2019 were the principal assets acquired by the Fund. The aggregate net assets of Wells Fargo Asia Pacific Fund and the Fund immediately prior to the acquisition were $112,231,698 and $583,919,847, respectively. The aggregate net assets of the Fund immediately after the acquisition were $696,151,545. For financial reporting purposes, assets received and shares issued by the Fund were recorded at fair value; however, the cost basis of the investments received from Wells Fargo Asia Pacific Fund was carried forward to align with ongoing reporting of the Fund’s realized and unrealized gains and losses with amounts distributable to shareholders for tax purposes.
Assuming the acquisition had been completed November 1, 2019, the beginning of the annual reporting period for the Fund, the pro forma results of operations for the six months ended April 30, 2020 would have been as follows:
| | | | |
| |
Net investment income | | $ | 3,125,454 | |
| |
Net realized and unrealized losses on investments | | | (95,311,225 | ) |
| |
Net decrease in net assets resulting from operations | | $ | (92,185,771 | ) |
24 | Wells Fargo Emerging Markets Equity Income Fund
Notes to financial statements (unaudited)
Because the combined investment portfolios have been managed as a single integrated portfolio since the acquisition was completed, it is not practicable to separate the amounts of revenue and earnings of Wells Fargo Asia Pacific Fund that have been included in the Fund’s Statement of Operations since December 7, 2019.
8. BANK BORROWINGS
The Trust (excluding the money market funds), Wells Fargo Master Trust and Wells Fargo Variable Trust are parties to a $280,000,000 revolving credit agreement whereby the Fund is permitted to use bank borrowings for temporary or emergency purposes, such as to fund shareholder redemption requests. Interest under the credit agreement is charged to the Fund based on a borrowing rate equal to the higher of the Federal Funds rate in effect on that day plus 1.25% or the overnight LIBOR rate in effect on that day plus 1.25%. In addition, an annual commitment fee equal to 0.25% of the unused balance is allocated to each participating fund.
For the six months ended April 30, 2020, there were no borrowings by the Fund under the agreement.
9. CONCENTRATION RISKS
Concentration risks result from exposure to a limited number of sectors or geographic regions. As of the end of the period, the Fund invests a concentration of its portfolio in the information technology sector and in China. A fund that invests a substantial portion of its assets in any sector or geographic region may be more affected by changes in that sector or geographic region than would be a fund whose investments are not heavily weighted in any sector or geographic region.
10. INDEMNIFICATION
Under the Fund’s organizational documents, the officers and Trustees have been granted certain indemnification rights against certain liabilities that may arise out of performance of their duties to the Fund. The Fund has entered into a separate agreement with each Trustee that converts indemnification rights currently existing under the Fund’s organizational documents into contractual rights that cannot be changed in the future without the consent of the Trustee. Additionally, in the normal course of business, the Fund may enter into contracts with service providers that contain a variety of indemnification clauses. The Fund’s maximum exposure under these arrangements is dependent on future claims that may be made against the Fund and, therefore, cannot be estimated.
11. NEW ACCOUNTING PRONOUNCEMENT
In August 2018, FASB issued Accounting Standards Update (“ASU”)No. 2018-13, Fair Value Measurement (Topic 820)Disclosure Framework—Changes to the Disclosure Requirements for Fair Value Measurement.ASU2018-13 updates the disclosure requirements for fair value measurements by modifying or removing certain disclosures and adding certain new disclosures. The amendments are effective for fiscal years, and interim periods within those fiscal years, beginning after December 15, 2019. Early adoption is permitted. Management has adopted the removal and modification of disclosures early, as permitted, and will adopt the additional new disclosures at the effective date.
12. CORONAVIRUS (COVID-19) PANDEMIC
On March 11, 2020, the World Health Organization announced that it had made the assessment that coronavirus disease 2019(“COVID-19”) is a pandemic. The impacts ofCOVID-19 are adversely affecting the entire global economy, individual companies and investment products, and the market in general. There is significant uncertainty around the extent and duration of business disruptions related toCOVID-19 and the impacts may be short term or may last for an extended period of time. The risk of further spreading ofCOVID-19 has led to significant uncertainty and volatility in the financial markets. The value of the Fund and the securities in which the Fund invests have generally been adversely affected by impacts caused byCOVID-19.
Wells Fargo Emerging Markets Equity Income Fund | 25
Other information (unaudited)
TAX INFORMATION
Pursuant to Section 853 of the Internal Revenue Code, the following amounts have been designated as foreign taxes paid for the fiscal year ended October 31, 2019. These amounts may be less than the actual foreign taxes paid for financial statement purposes. Foreign taxes paid or withheld should be included in taxable income with an offsetting deduction from gross income or as a credit for taxes paid to foreign governments. None of the income was derived from ineligible foreign sources as defined under Section 901(j) of the Internal Revenue Code.
| | | | |
Creditable foreign taxes paid | | Per share amount | | Foreign income as % of ordinary income distributions |
| | |
| $2,034,893 | | $0.0387 | | 93.79% |
PROXY VOTING INFORMATION
A description of the policies and procedures used to determine how to vote proxies relating to portfolio securities is available, upon request, by calling1-800-222-8222, visiting our website atwfam.com, or visiting the SEC website at sec.gov. Information regarding how the proxies related to portfolio securities were voted during the most recent12-month period ended June 30 is available on the website atwfam.comor by visiting the SEC website at sec.gov.
QUARTERLY PORTFOLIO HOLDINGS INFORMATION
The Fund files its complete schedule of portfolio holdings with the SEC for the first and third quarters of each fiscal year as an exhibit to its reports on FormN-PORT. Shareholders may view the filed FormN-PORT by visiting the SEC website at sec.gov.
26 | Wells Fargo Emerging Markets Equity Income Fund
Other information (unaudited)
BOARD OF TRUSTEES AND OFFICERS
Each of the Trustees and Officers1 listed in the table below acts in identical capacities for each fund in the Wells Fargo family of funds, which consists of 147 mutual funds comprising the Wells Fargo Funds Trust, Wells Fargo Variable Trust, Wells Fargo Master Trust and fourclosed-end funds (collectively the “Fund Complex”). This table should be read in conjunction with the Prospectus and the Statement of Additional Information2. The mailing address of each Trustee and Officer is 525 Market Street, 12th Floor, San Francisco, CA 94105. Each Trustee and Officer serves an indefinite term, however, each Trustee serves such term until reaching the mandatory retirement age established by the Trustees.
Independent Trustees
| | | | | | |
Name and year of birth | | Position held and length of service* | | Principal occupations during past five years or longer | | Current other public company or investment company directorships |
| | | |
William R. Ebsworth (Born 1957) | | Trustee, since 2015 | | Retired. From 1984 to 2013, equities analyst, portfolio manager, research director and chief investment officer at Fidelity Management and Research Company in Boston, Tokyo, and Hong Kong, and retired in 2013 as Chief Investment Officer of Fidelity Strategic Advisers, Inc. where he led a team of investment professionals managing client assets. Prior thereto, Board member of Hong Kong Securities Clearing Co., Hong Kong Options Clearing Corp., the Thailand International Fund, Ltd., Fidelity Investments Life Insurance Company, and Empire Fidelity Investments Life Insurance Company. Audit Committee Chair and Investment Committee Chair of the Vincent Memorial Hospital Endowment(non-profit organization). Mr. Ebsworth is a CFA® charterholder. | | N/A |
| | | |
Jane A. Freeman (Born 1953) | | Trustee, since 2015; Chair Liaison, since 2018 | | Retired. From 2012 to 2014 and 1999 to 2008, Chief Financial Officer of Scientific Learning Corporation. From 2008 to 2012, Ms. Freeman provided consulting services related to strategic business projects. Prior to 1999, Portfolio Manager at Rockefeller & Co. and Scudder, Stevens & Clark. Board member of the Harding Loevner Funds from 1996 to 2014, serving as both Lead Independent Director and chair of the Audit Committee. Board member of the Russell Exchange Traded Funds Trust from 2011 to 2012 and the chair of the Audit Committee. Ms. Freeman is also an inactive Chartered Financial Analyst. | | N/A |
| | | |
Isaiah Harris, Jr. (Born 1952) | | Trustee, since 2009; Audit Committee Chairman, since 2019 | | Retired. Chairman of the Board of CIGNA Corporation since 2009, and Director since 2005. From 2003 to 2011, Director of Deluxe Corporation. Prior thereto, President and CEO of BellSouth Advertising and Publishing Corp. from 2005 to 2007, President and CEO of BellSouth Enterprises from 2004 to 2005 and President of BellSouth Consumer Services from 2000 to 2003. Emeritus member of the Iowa State University Foundation Board of Governors. Emeritus Member of the Advisory Board of Iowa State University School of Business. Advisory Board Member, Palm Harbor Academy (private school). Advisory Board Member, Child Evangelism Fellowship(non-profit). Mr. Harris is a certified public accountant (inactive status). | | CIGNA Corporation |
| | | |
Judith M. Johnson (Born 1949) | | Trustee, since 2008; Audit Committee Chairman, from 2009 to 2018 | | Retired. Prior thereto, Chief Executive Officer and Chief Investment Officer of Minneapolis Employees Retirement Fund from 1996 to 2008. Ms. Johnson is an attorney, certified public accountant and a certified managerial accountant. | | N/A |
Wells Fargo Emerging Markets Equity Income Fund | 27
Other information (unaudited)
| | | | | | |
Name and year of birth | | Position held and length of service* | | Principal occupations during past five years or longer | | Current other public company or investment company directorships |
| | | |
David F. Larcker (Born 1950) | | Trustee, since 2009 | | James Irvin Miller Professor of Accounting at the Graduate School of Business, Stanford University, Director of the Corporate Governance Research Initiative and Senior Faculty of The Rock Center for Corporate Governance since 2006. From 2005 to 2008, Professor of Accounting at the Graduate School of Business, Stanford University. Prior thereto, Ernst & Young Professor of Accounting at The Wharton School, University of Pennsylvania from 1985 to 2005. | | N/A |
| | | |
Olivia S. Mitchell (Born 1953) | | Trustee, since 2006; Nominating and Governance Committee Chair, since 2018 | | International Foundation of Employee Benefit Plans Professor, Wharton School of the University of Pennsylvania since 1993. Director of Wharton’s Pension Research Council and Boettner Center on Pensions & Retirement Research, and Research Associate at the National Bureau of Economic Research. Previously, Cornell University Professor from 1978 to 1993. | | N/A |
| | | |
Timothy J. Penny (Born 1951) | | Trustee, since 1996; Chairman, since 2018 | | President and Chief Executive Officer of Southern Minnesota Initiative Foundation, anon-profit organization, since 2007. Member of the Board of Trustees of NorthStar Education Finance, Inc., anon-profit organization, since 2007. | | N/A |
| | | |
James G. Polisson (Born 1959) | | Trustee, since 2018 | | Retired. Chief Marketing Officer, Source (ETF) UK Services, Ltd, from 2015 to 2017. From 2012 to 2015, Principal of The Polisson Group, LLC, a management consulting, corporate advisory and principal investing company. Chief Executive Officer and Managing Director at Russell Investments, Global Exchange Traded Funds from 2010 to 2012. Managing Director of Barclays Global Investors from 1998 to 2010 and Global Chief Marketing Officer for iShares and Barclays Global Investors from 2000 to 2010. Trustee of the San Francisco Mechanics’ Institute, anon-profit organization, from 2013 to 2015. Board member of the Russell Exchange Traded Fund Trust from 2011 to 2012. Director of Barclays Global Investors Holdings Deutschland GmbH from 2006 to 2009. Mr. Polisson is an attorney and has a retired status with the Massachusetts and District of Columbia Bar Associations. | | N/A |
| | | |
Pamela Wheelock (Born 1959) | | Trustee, since January 2020; previously Trustee from January 2018 to July 2019 | | Board member of the Destination Medical Center Economic Development Agency, Rochester, Minnesota since 2019 and Interim President of the McKnight Foundation since 2020. Acting Commissioner, Minnesota Department of Human Services, July 2019 through September 2019. Human Services Manager (part-time), Minnesota Department of Human Services, October 2019 through December 2019. Chief Operating Officer, Twin Cities Habitat for Humanity from 2017 to 2019. Vice President of University Services, University of Minnesota from 2012 to 2016. Prior thereto, on the Board of Directors, Governance Committee and Finance Committee for the Minnesota Philanthropy Partners (Saint Paul Foundation) from 2012 to 2018, Interim Chief Executive Officer of Blue Cross Blue Shield of Minnesota from 2011 to 2012, Chairman of the Board from 2009 to 2012 and Board Director from 2003 to 2015. Vice President, Leadership and Community Engagement, Bush Foundation, Saint Paul, Minnesota (a private foundation) from 2009 to 2011. Executive Vice President and Chief Financial Officer, Minnesota Sports and Entertainment from 2004 to 2009 and Senior Vice President from 2002 to 2004. Executive Vice President of the Minnesota Wild Foundation from 2004 to 2008. Commissioner of Finance, State of Minnesota, from 1999 to 2002. Currently Board Chair of the Minnesota Wild Foundation since 2010. | | N/A |
| * | Length of service dates reflect the Trustee’s commencement of service with the Trust’s predecessor entities, where applicable. |
28 | Wells Fargo Emerging Markets Equity Income Fund
Other information (unaudited)
Officers
| | | | |
Name and year of birth | | Position held and length of service | | Principal occupations during past five years or longer |
| | |
Andrew Owen (Born 1960) | | President, since 2017 | | Executive Vice President of Wells Fargo & Company and Head of Affiliated Managers, Wells Fargo Asset Management, since 2014. In addition, Mr. Owen is currently President, Chief Executive Officer and Director of Wells Fargo Funds Management, LLC since 2017. Prior thereto, Executive Vice President responsible for marketing, investments and product development for Wells Fargo Funds Management, LLC, from 2009 to 2014. |
| | |
Jeremy DePalma1 (Born 1974) | | Treasurer, since 2012 | | Senior Vice President of Wells Fargo Funds Management, LLC since 2009. Senior Vice President of Evergreen Investment Management Company, LLC from 2008 to 2010 and head of the Fund Reporting and Control Team within Fund Administration from 2005 to 2010. |
| | |
Michelle Rhee (Born 1966) | | Chief Legal Officer, since 2019 | | Secretary of Wells Fargo Funds Management, LLC, Chief Legal Counsel of Wells Fargo Asset Management and Assistant General Counsel of Wells Fargo Bank, N.A. since 2018. Associate General Counsel and Managing Director of Bank of America Corporation from 2004 to 2018. |
| | |
Catherine Kennedy (Born 1969) | | Secretary, since 2019 | | Vice President of Wells Fargo Funds Management, LLC and Senior Counsel of the Wells Fargo Legal Department since 2010. Vice President and Senior Counsel of Evergreen Investment Management Company, LLC from 1998 to 2010. |
| | |
Michael H. Whitaker (Born 1967) | | Chief Compliance Officer, since 2016 | | Chief Compliance Officer of Wells Fargo Asset Management since 2016. Senior Vice President and Chief Compliance Officer for Fidelity Investments from 2007 to 2016. |
| | |
David Berardi (Born 1975) | | Assistant Treasurer, since 2009 | | Vice President of Wells Fargo Funds Management, LLC since 2009. Vice President of Evergreen Investment Management Company, LLC from 2008 to 2010. Manager of Fund Reporting and Control for Evergreen Investment Management Company, LLC from 2004 to 2010. |
| 1 | Jeremy DePalma acts as Treasurer of 82 funds and Assistant Treasurer of 65 funds in the Fund Complex. |
| 2 | The Statement of Additional Information includes additional information about the Trustees and is available, without charge, upon request, by calling1-800-222-8222 or by visiting the website atwfam.com. |
Wells Fargo Emerging Markets Equity Income Fund | 29
Appendix I (unaudited)
Effective on or about May 1, 2020, if you purchase Fund shares through a Janney Montgomery Scott LLC (“Janney”) brokerage account, you will be eligible for the following load waivers (front-end sales charge waivers and contingent deferred sales charge (“CDSC”), or back-end sales charge, waivers) and discounts, which may differ from those disclosed elsewhere in the Fund’s Prospectus or SAI.
|
| Front-end sales charge* waivers on Class A shares available at Janney |
|
| Shares purchased through reinvestment of capital gains distributions and dividend reinvestment when purchasing shares of the same fund (but not any other fund within the fund family). |
|
| Shares purchased by employees and registered representatives of Janney or its affiliates and their family members as designated by Janney. |
|
| Shares purchased from the proceeds of redemptions within the same fund family, provided (1) the repurchase occurs within ninety (90) days following the redemption, (2) the redemption and purchase occur in the same account, and (3) redeemed shares were subject to a front-end or deferred sales load (i.e., right of reinstatement). |
|
| Employer-sponsored retirement plans (e.g., 401(k) plans, 457 plans, employer-sponsored 403(b) plans, profit sharing and money purchase pension plans and defined benefit plans). For purposes of this provision, employer-sponsored retirement plans do not include SEP IRAs, Simple IRAs, SAR-SEPs or Keogh plans. |
|
| Shares acquired through a right of reinstatement. |
|
| Class C shares that are no longer subject to a contingent deferred sales charge and are converted to Class A shares of the same fund pursuant to Janney’s policies and procedures. |
| CDSC waivers on Class A and Class C shares available at Janney |
|
| Shares sold upon the death or disability of the shareholder. |
|
| Shares sold as part of a systematic withdrawal plan as described in the Fund’s Prospectus. |
|
| Shares purchased in connection with a return of excess contributions from an IRA account. |
|
| Shares sold as part of a required minimum distribution for IRA and retirement accounts if the redemption is taken in or after the year the shareholder reaches qualified age based on applicable IRS regulations. |
|
| Shares sold to pay Janney fees but only if the transaction is initiated by Janney. |
|
| Shares acquired through a right of reinstatement. |
|
| Shares exchanged into the same share class of a different fund. |
| Front-end sales charge* discounts available at Janney; breakpoints, rights of accumulation and/or letters of intent |
|
| Breakpoints as described in the Fund’s Prospectus. |
|
| Rights of accumulation (“ROA”), which entitle shareholders to breakpoint discounts, will be automatically calculated based on the aggregated holding of fund family assets held by accounts within the purchaser’s household at Janney. Eligible fund family assets not held at Janney may be included in the ROA calculation only if the shareholder notifies his or her financial advisor about such assets. |
|
| Letters of intent which allow for breakpoint discounts based on anticipated purchases within a fund family, over a 13-month time period. Eligible fund family assets not held at Janney Montgomery Scott may be included in the calculation of letters of intent only if the shareholder notifies his or her financial advisor about such assets. |
| * | Also referred to as an “initial sales charge.” |
30 | Wells Fargo Emerging Markets Equity Income Fund
Appendix II (unaudited)
Effective on or after May 1, 2020, clients of Edward Jones (also referred to as “shareholders”) purchasing Fund shares on the Edward Jones commission and fee-based platforms are eligible only for the following sales charge discounts (also referred to as “breakpoints”) and waivers, which can differ from breakpoints and waivers described elsewhere in the Fund’s Prospectus or SAI or through another broker-dealer. In all instances, it is the shareholder’s responsibility to inform Edward Jones at the time of purchase of any relationship, holdings of Wells Fargo Funds or other facts qualifying the purchaser for breakpoints or waivers. Edward Jones can ask for documentation of such circumstance.
|
| Breakpoints available at Edward Jones |
|
| Rights of Accumulation (ROA) |
|
The applicable sales charge on a purchase of Class A shares is determined by taking into account all share classes (except any money market funds and retirement plan share classes) of Wells Fargo Funds held by the shareholder or in an account grouped by Edward Jones with other accounts for the purpose of providing certain pricing considerations (“pricing groups”). This includes all share classes held on the Edward Jones platform and/or held on another platform. The inclusion of eligible fund family assets in the rights of accumulation calculation is dependent on the shareholder notifying his or her financial advisor of such assets at the time of calculation. |
|
ROA is determined by calculating the higher of cost or market value (current shares x NAV). |
|
| Letter of Intent (LOI) |
|
Through a LOI, shareholders can receive the sales charge and breakpoint discounts for purchases shareholders intend to makeover a 13-month period from the date Edward Jones receives the LOI. The LOI is determined by calculating the higher of cost or market value of qualifying holdings at LOI initiation in combination with the value that the shareholder intends to buy over a 13-month period to calculate the front-end sales charge and any breakpoint discounts. Each purchase the shareholder makes during that 13-month period will receive the sales charge and breakpoint discount that applies to the total amount. The inclusion of eligible fund family assets in the LOI calculation is dependent on the shareholder notifying his or her financial advisor of such assets at the time of calculation. Purchases made before the LOI is received by Edward Jones are not covered under the LOI and will not reduce the sales charge previously paid. Sales charges will be adjusted if LOI is not met. |
| Sales charges are waived for the following shareholders and in the following situations at Edward Jones: |
● Associates of Edward Jones and its affiliates and their family members who are in the same pricing group (as determined by Edward Jones under its policies and procedures) as the associate. This waiver will continue for the remainder of the associate’s life if the associate retires from Edward Jones in good-standing. |
● Shares purchased in an Edward Jones fee-based program. |
● Shares purchased through reinvestment of capital gains distributions and dividend reinvestment. |
● Shares purchased from the proceeds of redeemed shares of the same fund family so long as the following conditions are met: 1)the proceeds are from the sale of shares within 60 days of the purchase, and 2) the sale and purchase are made in the same share class and the same account or the purchase is made in an individual retirement account with proceeds from liquidations in anon-retirement account. |
● Shares exchanged into Class A shares from another share class so long as the exchange is into the same fund and was initiated at the discretion of Edward Jones. Edward Jones is responsible for any remaining CDSC due to the fund company, if applicable. Any future purchases are subject to the applicable sales charge as disclosed in the prospectus. |
● Exchanges from Class C shares to Class A shares of the same fund, generally, in the 84th month following the anniversary of the purchase date or earlier at the discretion of Edward Jones. |
If the shareholder purchases shares that are subject to a CDSC and those shares are redeemed before the CDSC is expired, the shareholder
is responsible to pay the CDSC except in the following conditions available at Edward Jones: |
● The death or disability of the shareholder. |
● Systematic withdrawals with up to 10% per year of the account value. |
● Return of excess contributions from an Individual Retirement Account (IRA). |
● Shares sold as part of a required minimum distribution for IRA and retirement accounts if the redemption is taken in or after the year the shareholder reaches qualified age based on applicable IRS regulation. |
● Shares sold to pay Edward Jones fees or costs in such cases where the transaction is initiated by Edward Jones. |
● Shares exchanged in an Edward Jones fee-based program. |
● Shares acquired through NAV reinstatement. |
Wells Fargo Emerging Markets Equity Income Fund | 31
Appendix II (unaudited)
|
| Other Important Information for accounts at Edward Jones: |
| Minimum Purchase Amounts |
● $250 initial purchase minimum |
● $50 subsequent purchase minimum |
|
| Minimum Balances |
| Edward Jones has the right to redeem at its discretion fund holdings with a balance of $250 or less. The following are examples of accounts that are not included in this policy: |
● A fee-based account held on an Edward Jones platform |
● A 529 account held on an Edward Jones platform |
● An account with an active systematic investment plan or letter of intent (LOI) |
|
| Changing Share Classes |
| At any time it deems necessary, Edward Jones has the authority to exchange at NAV a shareholder’s holdings in a fund to Class A shares. |
32 | Wells Fargo Emerging Markets Equity Income Fund
Appendix III (unaudited)
Effective June 1, 2020, shareholders purchasing Fund shares through an Oppenheimer & Co. Inc. (“Oppenheimer”) platform or account are eligible only for the following load waivers (front-end sales charge waivers and contingent deferred or back-end, sales charge waivers) and discounts, which may differ from those disclosed in the Fund’s Prospectus or SAI.
|
| Front-end Sales Load Waivers on Class A Shares available at Oppenheimer |
|
| Employer-sponsored retirement, deferred compensation and employee benefit plans (including health savings accounts) and trusts used to fund those plans, provided that the shares are not held in a commission-based brokerage account and shares are held for the benefit of the plan. |
|
| Shares purchased by or through a 529 Plan. |
|
| Shares purchased through an Oppenheimer affiliated investment advisory program. |
|
| Shares purchased through reinvestment of capital gains distributions and dividend reinvestment when purchasing shares of the same fund (but not any other fund within the fund family). |
|
| Shares purchased from the proceeds of redemptions within the same fund family, provided (1) the repurchase occurs within 90 days following the redemption, (2) the redemption and purchase occur in the same account, and (3) redeemed shares were subject to a front-end or deferred sales load (known as Rights of Restatement). |
|
| A shareholder in the Fund’s Class C shares will have their shares exchanged at net asset value to Class A shares (or the appropriate share class) of the Fund if the shares are no longer subject to a CDSC and the exchange is in line with the policies and procedures of Oppenheimer. |
|
| Employees and registered representatives of Oppenheimer or its affiliates and their family members. |
|
| Directors or Trustees of the Fund, and employees of the Fund’s investment adviser or any of its affiliates, as described in the Prospectus. |
| CDSC Waivers on A and C Shares available at Oppenheimer |
|
| Death or disability of the shareholder. |
|
| Shares sold as part of a systematic withdrawal plan as described in the Prospectus. |
|
| Return of excess contributions from an IRA Account. |
|
| Shares sold as part of a required minimum distribution for IRA and retirement accounts due to the shareholder reaching the qualified age based on applicable IRS regulations as described in the Prospectus. |
|
| Shares sold to pay Oppenheimer fees but only if the transaction is initiated by Oppenheimer. |
|
| Shares acquired through a right of reinstatement. |
| Front-end load Discounts Available at Oppenheimer: Breakpoints, Rights of Accumulation & Letters of Intent |
|
| Breakpoints as described in the Prospectus. |
|
| Rights of Accumulation (ROA), which entitle shareholders to breakpoint discounts, will be automatically calculated based on the aggregated holding of fund family assets held by accounts within the purchaser’s household at Oppenheimer. Eligible fund family assets not held at Oppenheimer may be included in the ROA calculation only if the shareholder notifies his or her financial advisor about such assets. |
Wells Fargo Emerging Markets Equity Income Fund | 33
Appendix IV (unaudited)
Effective June 15, 2020, shareholders purchasing fund shares through a Robert W. Baird & Co. (“Baird”) platform or account will only be eligible for the following sales charge waivers (front-end sales charge waivers and CDSC waivers) and discounts, which may differ from those disclosed elsewhere in the Fund’s Prospectus or the SAI.
|
| Front-end Sales Load Waivers on Class A Shares available at Baird |
|
| Shares purchased through reinvestment of capital gains distributions and dividend reinvestment when purchasing share of the same fund. |
|
| Share purchase by employees and registers representatives of Baird or its affiliate and their family members as designated by Baird. |
|
| Shares purchase from the proceeds of redemptions within the same fund family, provided (1) the repurchase occurs within 90 days following the redemption, (2) the redemption and purchase occur in the same accounts, and (3) redeemed shares were subject to a front-end or deferred sales charge (known as rights of reinstatement). |
|
| A shareholder in the Funds Investor C Shares will have their share exchanged at net asset value to Investor A shares of the fund if the shares are no longer subject to CDSC and the exchange is in line with the policies and procedures of Baird. |
|
| Employer-sponsored retirement plans or charitable accounts in a transactional brokerage account at Baird, including 401(k)plans, 457 plans, employer-sponsored 403(b) plans, profit sharing and money purchase pension plans and defined benefit plans. For purposes of this provision, employer-sponsored retirement plans do not include SEP IRAs, Simple IRAs or SAR-SEPs. |
| CDSC Waivers on A and C Shares available at Baird |
|
| Shares sold due to death or disability of the shareholder. |
|
| Shares sold as part of a systematic withdrawal plan as described in the Fund’s Prospectus. |
|
| Shares bought due to returns of excess contributions from an IRA Account. |
|
| Shares sold as part of a required minimum distribution for IRA and retirement accounts due to the shareholder reaching age 72 as described in the Fund’s Prospectus. |
|
| Shares sold to pay Baird fees but only if the transaction is initiated by Baird. |
|
| Shares acquired through a right of reinstatement. |
| Front-end load Discounts Available at Baird: Breakpoint and/or Rights of Accumulation |
|
| Breakpoints as described in the Prospectus. |
|
| Rights of accumulations which entitles shareholders to breakpoint discounts will be automatically calculated based on the aggregated holding of fund family assets held by accounts within the purchaser’s household at Baird. Eligible fund family assets not held at Baird may be included in the rights of accumulations calculation only if the shareholder notifies his or her financial advisor about such assets. |
|
| Letters of Intent (LOI) allow for breakpoint discounts based on anticipated purchases within a fund family through Baird, over a 13-month period of time. |
34 | Wells Fargo Emerging Markets Equity Income Fund
This page is intentionally left blank.
This page is intentionally left blank.

For more information
More information about Wells Fargo Funds is available free upon request. To obtain literature, please write, visit the Fund’s website, or call:
Wells Fargo Funds
P.O. Box 219967
Kansas City, MO 64121-9967
Website:wfam.com
Individual investors:1-800-222-8222
Retail investment professionals:1-888-877-9275
Institutional investment professionals:1-866-765-0778

This report and the financial statements contained herein are submitted for the general information of the shareholders of the Fund. If this report is used for promotional purposes, distribution of the report must be accompanied or preceded by a current prospectus. Before investing, please consider the investment objectives, risks, charges, and expenses of the investment. For a current prospectus and, if available, a summary prospectus, containing this information, call1-800-222-8222 or visit the Fund’s website atwfam.com. Read the prospectus carefully before you invest or send money.
Wells Fargo Asset Management (WFAM) is the trade name for certain investment advisory/management firms owned by Wells Fargo & Company. These firms include but are not limited to Wells Capital Management Incorporated and Wells Fargo Funds Management, LLC. Certain products managed by WFAM entities are distributed by Wells Fargo Funds Distributor, LLC (a broker-dealer and Member FINRA).
This material is for general informational and educational purposes only and is NOT intended to provide investment advice or a recommendation of any kind—including a recommendation for any specific investment, strategy, or plan.
INVESTMENT PRODUCTS: NOT FDIC INSURED ◾ NO BANK GUARANTEE ◾ MAY LOSE VALUE
© 2019 Wells Fargo & Company. All rights reserved.
PAR-0520-00409 06-20
SA262/SAR262 04-20
Semi-Annual Report
April 30, 2020
Wells Fargo
Special International Small Cap Fund
Beginning on January 1, 2021, as permitted by new regulations adopted by the Securities and Exchange Commission, paper copies of the Wells Fargo Funds’ annual and semi-annual shareholder reports issued after this date will no longer be sent by mail, unless you specifically request paper copies of the reports. Instead, the reports will be made available on the Funds’ website, and you will be notified by mail each time a report is posted and provided with a website address to access the report.
If you already elected to receive shareholder reports electronically, you will not be affected by this change and you need not take any action. You may elect to receive shareholder reports and other communications from the Fund electronically at any time by contacting your financial intermediary (such as a broker-dealer or bank) or, if you are a direct investor, by calling1-800-222-8222 or by enrolling at wellsfargo.com/advantagedelivery.
You may elect to receive all future reports in paper free of charge. If you invest through a financial intermediary, you can contact your financial intermediary to request that you continue to receive paper copies of your shareholder reports; if you invest directly with the Fund, you can call 1-800-222-8222. Your election to receive reports in paper will apply to all Wells Fargo Funds held in your account with your financial intermediary or, if you are a direct investor, to all Wells Fargo Funds that you hold.
|
|
|
Reduce clutter. Save trees. |
Sign up for electronic
delivery of prospectuses and
shareholder reports atwellsfargo.com/
advantagedelivery |
The views expressed and any forward-looking statements are as of April 30, 2020, unless otherwise noted, and are those of the Fund managers and/or Wells Fargo Asset Management. Discussions of individual securities, or the markets generally, or any Wells Fargo Fund are not intended as individual recommendations. Future events or results may vary significantly from those expressed in any forward-looking statements. The views expressed are subject to change at any time in response to changing circumstances in the market. Wells Fargo Asset Management and the Fund disclaim any obligation to publicly update or revise any views expressed or forward-looking statements.
INVESTMENT PRODUCTS: NOT FDIC INSURED ◾ NO BANK GUARANTEE ◾ MAY LOSE VALUE
Wells Fargo Special International Small Cap Fund | 1
Letter to shareholders (unaudited)

Andrew Owen
President
Wells Fargo Funds
“The period began with a tailwind created by central bank support.”
Dear Shareholder:
We are pleased to offer you this semi-annual report for the Wells Fargo Special International Small Cap Fund for the six-month period that ended April 30, 2020. Global stock markets saw earlier gains erased in February and March as governments took unprecedented measures to stop the spread of the coronavirus at the expense of short-term economic output. Markets rebounded in April to lessen the losses as central banks attempted to bolster capital markets and confidence. Fixed-income markets performed better, with the exception of high-yield bonds, as U.S. bonds overall achieved modest gains.
For the six-month period, U.S. stocks, based on the S&P 500 Index,1 returned -3.16% and international stocks, as measured by the MSCI ACWI ex USA Index (Net),2 fell 13.22%. The MSCI Emerging Markets Index (Net)3 lost 10.50%. For bond investors, the Bloomberg Barclays U.S. Aggregate Bond Index4 added 4.86%, the Bloomberg Barclays Global Aggregate ex-USD Index5 returned -0.97%, the Bloomberg Barclays Municipal Bond Index6 returned -1.33%, and the ICE BofA U.S. High Yield Index7 lost 7.68%.
The period began with a tailwind created by central bank support.
The period began with a tailwind that had been created by U.S. Federal Reserve (Fed) rate cuts in the summer and early fall. Equity markets rallied in November despite ongoing geopolitical risks. Hopes for a U.S.-China trade deal buoyed investor confidence. U.S. business sentiment edged up, and manufacturing and services activity rose. With that positive backdrop, developed market equities outpaced those in emerging markets, and U.S. stocks outperformed non-U.S. stocks overall. While consumer confidence and purchasing manager activity rose in the eurozone, China reported weakening manufacturing and consumer data. Bond yields rose marginally, leading to slightly negative returns for global government and investment-grade corporate bonds.
Financial markets ended 2019 with a boost from the U.S. and China accord on a Phase One trade deal. That, along with the landslide win by the pro-Brexit U.K. Conservative Party in a national election and ongoing central bank support, gave investors greater confidence. U.S. economic indicators were positive overall, with the exception of manufacturing activity and business confidence. Consumer confidence was resilient, fed by a robust labor market, tame inflation, and lower interest rates, which boosted housing affordability and stimulated homebuyer activity. The impeachment of U.S. President Donald Trump had little impact on markets. Meanwhile, slowing Chinese economic activity, partly attributable to the trade war, led to further government stimulus at year-end through lower reserve ratios, allowing banks to lend more money.
The year-end rally continued in early January 2020. However, capital market volatility spiked in late January on concerns over the potential impact of the coronavirus on the global economy and stock markets. With sentiment somewhat souring, perceived safe
| 1 | The S&P 500 Index consists of 500 stocks chosen for market size, liquidity, and industry group representation. It is a market-value-weighted index with each stock’s weight in the index proportionate to its market value. You cannot invest directly in an index. |
| 2 | The Morgan Stanley Capital International (MSCI) All Country World Index (ACWI) ex USA Index (Net) is a free-float-adjusted market-capitalization-weighted index that is designed to measure the equity market performance of developed markets, excluding the United States. Source: MSCI. MSCI makes no express or implied warranties or representations and shall have no liability whatsoever with respect to any MSCI data contained herein. The MSCI data may not be further redistributed or used as a basis for other indices or any securities or financial products. This report is not approved, reviewed, or produced by MSCI. You cannot invest directly in an index. |
| 3 | The MSCI Emerging Markets (EM) Index (Net) is a free-float-adjusted market-capitalization-weighted index that is designed to measure equity market performance of emerging markets. You cannot invest directly in an index. |
| 4 | The Bloomberg Barclays U.S. Aggregate Bond Index is a broad-based benchmark that measures the investment-grade, U.S. dollar-denominated, fixed-rate taxable bond market, including Treasuries, government-related and corporate securities, mortgage-backed securities (agency fixed-rate and hybrid adjustable-rate mortgage pass-throughs), asset-backed securities, and commercial mortgage-backed securities. You cannot invest directly in an index. |
| 5 | The Bloomberg Barclays Global Aggregate ex-USD Index is an unmanaged index that provides a broad-based measure of the global investment-grade fixed-income markets excluding the U.S. dollar-denominated debt market. You cannot invest directly in an index. |
| 6 | The Bloomberg Barclays Municipal Bond Index is an unmanaged index composed of long-term tax-exempt bonds with a minimum credit rating of Baa. You cannot invest directly in an index. |
| 7 | The ICE BofA U.S. High Yield Index is a market-capitalization-weighted index of domestic and Yankee high-yield bonds. The index tracks the performance of high-yield securities traded in the U.S. bond market. You cannot invest directly in an index. Copyright 2020. ICE Data Indices, LLC. All rights reserved. |
2 | Wells Fargo Special International Small Cap Fund
Letter to shareholders (unaudited)
havens did well in January. The U.S. dollar and Japanese yen both rose, and government bonds outperformed equities. While the S&P 500 Index held its ground, emerging market equities tumbled, including those in Asia.
In February, the coronavirus became the major market focus. Fears of the virus’s impact on global growth led to expectations of increased global central bank monetary policy support. That led the 10-year U.S. Treasury yield to fall to an all-time low of 1.1% by the end of the month. Although equity markets initially shrugged off concerns about the outbreak, focusing instead on strong fourth-quarter earnings and improving business confidence in January, market sentiment turned sharply lower toward month-end. Oil prices tumbled as Russia and the Organization of the Petroleum Exporting Countries compounded a major decline in oil demand with a brutal price war, causing the price of West Texas Intermediate crude oil to fall 13% in February alone.
The global spread of the coronavirus led many countries to clamp down on social and business-related activity in order to contain the virus from causing even greater devastation and overwhelming the health care system. This abrupt stoppage of economic activity led to the sharp deceleration of global output, sending economies into a deep contraction. Central bank responses were swift, as they slashed interest rates and expanded quantitative easing programs to restore liquidity and confidence to the markets. In the U.S., the Fed launched several lending programs, funding investment-grade bonds, money market mutual funds, and commercial paper while purchasing Treasuries, mortgage-backed securities, and overnight repurchase agreements . Meanwhile, stock markets tumbled quickly into a bear market, ending the longest bull stock market in U.S. history.
Markets rebounded strongly in April after the extreme volatility of the previous two months, with the S&P 500 Index gaining 12.8% for the month and the MSCI ACWI ex USA Index (Net) returning 7.6%. The rebound was fueled by unprecedented stimulus measures taken by governments and central banks to buffer the economic damage created by mass shutdowns to try to contain the virus’s spread. The U.S. economy contracted by an annualized 4.8% pace in the first quarter, with 30 million new unemployment insurance claims in six weeks. In the eurozone, first-quarter real gross domestic product (GDP) shrank 3.8%, with the composite April Flash Purchasing Managers’ Index, a monthly survey of purchasing managers, falling to an all-time low of 13.5. The European Central Bank expanded its quantitative easing to include the purchase of additional government bonds of countries with the greatest virus-related need, including Italy and Spain. China’s first-quarter GDP fell by 6.8% year over year. However, retail sales, production, and investment showed signs of recovery. Extreme oil price volatility continued as global supply far exceeded demand.
Don’t let short-term uncertainty derail long-term investment goals.
Periods of investment uncertainty can present challenges, but experience has taught us that maintaining long-term investment goals can be an effective way to plan for the future. To help you create a sound strategy based on your personal goals and risk tolerance, Wells Fargo Funds offers more than 100 mutual funds spanning a wide range of asset classes and investment styles. Although diversification cannot guarantee an investment profit or prevent losses, we believe it can be an effective way to manage investment risk and potentially smooth out overall portfolio performance. We encourage investors to know their investments and to understand that appropriate levels of risk-taking may unlock opportunities.
Thank you for choosing to invest with Wells Fargo Funds. We appreciate your confidence in us and remain committed to helping you meet your financial needs.
Sincerely,

Andrew Owen
President
Wells Fargo Funds
“The global spread of the coronavirus led many countries to clamp down on social and business-related activity in order to contain the virus from causing even greater devastation and overwhelming the health care system.”
|
|
|
For further information about your Fund, contact your investment professional, visit our website at wfam.com, or call us directly at1-800-222-8222. |
Wells Fargo Special International Small Cap Fund | 3
Performance highlights (unaudited)
Investment objective
The Fund seeks long-term capital appreciation.
Manager
Wells Fargo Funds Management, LLC
Subadviser
Wells Capital Management Incorporated
Portfolio managers
Stephen Giggie, CFA®‡*
Oleg Makhorine
James M. Tringas, CFA®‡
Bryant VanCronkhite, CFA®‡, CPA
Average annual total returns (%) as of April 30, 2020
| | | | | | | | | | | | | | |
| | | |
| | | | | | | | Expense ratios1 (%) | |
| | | | |
| | | Inception date | | Since inception | | | Gross | | | Net2 | |
| | | | | |
| Class R6 (WICRX) | | 5-31-2019 | | | -7.26 | | | | 7.81 | | | | 0.95 | |
| | | | | |
| Institutional Class (WICIX) | | 5-31-2019 | | | -7.32 | | | | 7.91 | | | | 1.05 | |
| | | | | |
| MSCI World ex USA Small Cap Index (Net)3 | | – | | | -7.09 | * | | | – | | | | – | |
| * | | Return is based on the oldest Fund class. |
Figures quoted represent past performance, which is no guarantee of future results, and do not reflect taxes that a shareholder may pay on an investment in a fund. Investment return and principal value of an investment will fluctuate so that an investor’s shares, when redeemed, may be worth more or less than their original cost. Performance shown without sales charges would be lower if sales charges were reflected. Current performance may be lower or higher than the performance data quoted, which assumes the reinvestment of dividends and capital gains. Currentmonth-end performance is available on the Fund’s website,wfam.com.
Index returns do not include transaction costs associated with buying and selling securities, any mutual fund fees or expenses, or any taxes. It is not possible to invest directly in an index.
Class R6 and Institutional Class shares are sold without afront-end sales charge or contingent deferred sales charge.
Stock values fluctuate in response to the activities of individual companies and general market and economic conditions. Foreign investments are especially volatile and can rise or fall dramatically due to differences in the political and economic conditions of the host country. These risks are generally intensified in emerging markets. The use of derivatives may reduce returns and/or increase volatility. Certain investment strategies tend to increase the total risk of an investment (relative to the broader market). The Fund is exposed to geographic risk and smaller-company securities risk. Consult the Fund’s prospectus for additional information on these and other risks.
Please see footnotes on page 5.
4 | Wells Fargo Special International Small Cap Fund
Performance highlights (unaudited)
| | | | |
|
| Ten largest holdings (%) as of April 30, 20204 | |
| | |
Ansell Limited | | | 3.40 | |
| | |
Viscofan SA | | | 3.39 | |
| | |
Spectris plc | | | 3.30 | |
| | |
Gerresheimer AG | | | 3.15 | |
| | |
Alten SA | | | 3.14 | |
| | |
TAG Immobilien AG | | | 2.97 | |
| | |
Nomad Foods Limited | | | 2.95 | |
| | |
Domino’s Pizza Enterprises Limited | | | 2.93 | |
| | |
Domino’s Pizza Group plc | | | 2.84 | |
| | |
Britvic plc | | | 2.74 | |
|
|
| Sector allocation as of April 30, 20205 |
|
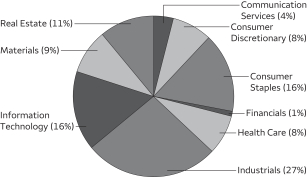 |
|
|
| Country allocation as of April 30, 20205 |
|
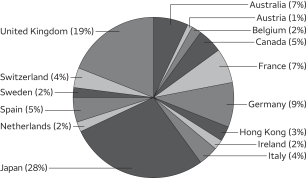 |
| * | Mr. Giggie became a portfolio manager of the Fund on April 15, 2020. |
| ‡ | CFA® and Chartered Financial Analyst®are trademarks owned by CFA Institute. |
| 1 | Reflects the expense ratios as stated in the most recent prospectuses. The expense ratios shown are subject to change and may differ from the annualized expense ratios shown in the financial highlights of this report. |
| 2 | The manager has contractually committed through February 28, 2021, to waive fees and/or reimburse expenses to the extent necessary to cap total annual fund operating expenses after fee waivers at 0.95% for Class R6 and 1.05% for Institutional Class. Brokerage commissions, stamp duty fees, interest, taxes, acquired fund fees and expenses (if any), and extraordinary expenses are excluded from the expense cap. Prior to or after the commitment expiration date, the cap may be increased or the commitment to maintain the cap may be terminated only with the approval of the Board of Trustees. Without this cap, the Fund’s returns would have been lower. The expense ratio paid by an investor is the net expense ratio (the total annual fund operating expenses after fee waivers) as stated in the prospectuses. |
| 3 | The Morgan Stanley Capital International (MSCI) World ex USA Small Cap Index (Net) is a free-float-adjusted market-capitalization-weighted index that is designed to measure the equity market performance of developed markets excluding the United States. You cannot invest directly in an index. |
| 4 | The ten largest holdings, excluding cash, cash equivalents and any money market funds, are calculated based on the value of the investments divided by total net assets of the Fund. Holdings are subject to change and may have changed since the date specified. |
| 5 | Amounts are calculated based on the total long-term investments of the Fund. These amounts are subject to change and may have changed since the date specified. |
Wells Fargo Special International Small Cap Fund | 5
Fund expenses (unaudited)
As a shareholder of the Fund, you incur ongoing costs, including management fees and other Fund expenses. This example is intended to help you understand your ongoing costs (in dollars) of investing in the Fund and to compare these costs with the ongoing costs of investing in other mutual funds.
The example is based on an investment of $1,000 invested at the beginning of thesix-month period and held for the entire period from November 1, 2019 to April 30, 2020.
Actual expenses
The “Actual” line of the table below provides information about actual account values and actual expenses. You may use the information in this line, together with the amount you invested, to estimate the expenses that you paid over the period. Simply divide your account value by $1,000 (for example, an $8,600 account value divided by $1,000 = 8.6), then multiply the result by the number in the “Actual” line under the heading entitled “Expenses paid during period” for your applicable class of shares to estimate the expenses you paid on your account during this period.
Hypothetical example for comparison purposes
The “Hypothetical” line of the table below provides information about hypothetical account values and hypothetical expenses based on the Fund’s actual expense ratio and an assumed rate of return of 5% per year before expenses, which is not the Fund’s actual return. The hypothetical account values and expenses may not be used to estimate the actual ending account balance or expenses you paid for the period. You may use this information to compare the ongoing costs of investing in the Fund and other funds. To do so, compare this 5% hypothetical example with the 5% hypothetical examples that appear in the shareholder reports of the other funds.
Please note that the expenses shown in the table are meant to highlight your ongoing costs only. Therefore, the “Hypothetical” line of the table is useful in comparing ongoing costs only and will not help you determine the relative total costs of owning different funds.
| | | | | | | | | | | | | | | | |
| | | Beginning account value 11-1-2019 | | | Ending account value 4-30-2020 | | | Expenses paid during the period¹ | | | Annualized net expense ratio | |
| | | | | |
Class R6 | | | | | | | | | | | | | | | | |
| | | | |
Actual | | $ | 1,000.00 | | | $ | 876.52 | | | $ | 4.43 | | | | 0.95 | % |
| | | | |
Hypothetical (5% return before expenses) | | $ | 1,000.00 | | | $ | 1,020.14 | | | $ | 4.77 | | | | 0.95 | % |
| | | | | |
Institutional Class | | | | | | | | | | | | | | | | |
| | | | |
Actual | | $ | 1,000.00 | | | $ | 876.85 | | | $ | 4.90 | | | | 1.05 | % |
| | | | |
Hypothetical (5% return before expenses) | | $ | 1,000.00 | | | $ | 1,019.64 | | | $ | 5.27 | | | | 1.05 | % |
| 1 | Expenses paid is equal to the annualized net expense ratio of each class multiplied by the average account value over the period, multiplied by the number of days in the most recent fiscal half-year divided by the number of days in the fiscal year (to reflect theone-half-year period). |
6 | Wells Fargo Special International Small Cap Fund
Portfolio of investments—April 30, 2020 (unaudited)
| | | | | | | | | | | | | | | | |
| | | | | | | | | Shares | | | Value | |
| Common Stocks: 97.24% | | | | | | | | | | | | | | | | |
| | | | |
Australia: 6.33% | | | | | | | | | | | | | | | | |
Ansell Limited (Health Care, Health Care Equipment & Supplies) | | | | | | | | | | | 8,379 | | | $ | 154,527 | |
Domino’s Pizza Enterprises Limited (Consumer Discretionary, Hotels, Restaurants & Leisure) | | | | | | | | | | | 3,555 | | | | 133,019 | |
| | | | |
| | | | | | | | | | | | | | | 287,546 | |
| | | | | | | | | | | | | | | | |
| | | | |
| Austria: 1.37% | | | | | | | | | | | | |
Mayr-Melnhof Karton AG (Materials, Containers & Packaging) | | | | | | | | | | | 452 | | | | 62,095 | |
| | | | | | | | | | | | | | | | |
| | | | |
| Belgium: 2.33% | | | | | | | | | | | | |
Barco NV (Information Technology, Electronic Equipment, Instruments & Components) | | | | | | | | | | | 662 | | | | 105,605 | |
| | | | | | | | | | | | | | | | |
| | | | |
| Canada: 4.38% | | | | | | | | | | | | |
Blackberry Limited TSX (Information Technology, Software) † | | | | | | | | | | | 6,500 | | | | 27,738 | |
Parex Resources Incorporated (Energy, Oil, Gas & Consumable Fuels) † | | | | | | | | | | | 2,400 | | | | 26,311 | |
Primo Water Corporation (Consumer Staples, Beverages) | | | | | | | | | | | 7,800 | | | | 79,852 | |
Stantec Incorporated (Industrials, Professional Services) | | | | | | | | | | | 2,200 | | | | 64,849 | |
| | | | |
| | | | | | | | | | | | | | | 198,750 | |
| | | | | | | | | | | | | | | | |
| | | | |
| Denmark: 0.62% | | | | | | | | | | | | |
Scandinavian Tobacco Group (Consumer Staples, Tobacco) 144A | | | | | | | | | | | 2,459 | | | | 28,259 | |
| | | | | | | | | | | | | | | | |
| | | | |
| France: 6.36% | | | | | | | | | | | | |
Alten SA (Information Technology, IT Services) | | | | | | | | | | | 1,978 | | | | 142,412 | |
M6 Métropole Télévision SA (Communication Services, Media) | | | | | | | | | | | 9,181 | | | | 102,192 | |
Mersen SA (Industrials, Electrical Equipment) | | | | | | | | | | | 2,002 | | | | 44,176 | |
| | | | |
| | | | | | | | | | | | | | | 288,780 | |
| | | | | | | | | | | | | | | | |
| | | | |
| Germany: 8.42% | | | | | | | | | | | | |
Cancom SE (Information Technology, IT Services) | | | | | | | | | | | 861 | | | | 43,834 | |
Gerresheimer AG (Health Care, Life Sciences Tools & Services) | | | | | | | | | | | 1,796 | | | | 142,835 | |
Krones AG (Industrials, Machinery) | | | | | | | | | | | 1,009 | | | | 60,796 | |
TAG Immobilien AG (Real Estate, Real Estate Management & Development) | | | | | | | | | | | 6,153 | | | | 134,773 | |
| | | | |
| | | | | | | | | | | | | | | 382,238 | |
| | | | | | | | | | | | | | | | |
| | | | |
| Hong Kong: 2.45% | | | | | | | | | | | | |
Sunlight REIT (Real Estate, Equity REITs) | | | | | | | | | | | 216,000 | | | | 111,275 | |
| | | | | | | | | | | | | | | | |
| | | | |
| Ireland: 1.69% | | | | | | | | | | | | |
Irish Residential Properties REIT plc (Real Estate, Equity REITs) | | | | | | | | | | | 54,301 | | | | 76,643 | |
| | | | | | | | | | | | | | | | |
| | | | |
| Italy: 3.67% | | | | | | | | | | | | |
De’Longhi SpA (Consumer Discretionary, Household Durables) | | | | | | | | | | | 4,625 | | | | 83,593 | |
Interpump Group SpA (Industrials, Machinery) | | | | | | | | | | | 2,844 | | | | 82,983 | |
| | | | |
| | | | | | | | | | | | | | | 166,576 | |
| | | | | | | | | | | | | | | | |
| | | | |
| Japan: 26.80% | | | | | | | | | | | | |
Aeon Delight Company Limited (Industrials, Commercial Services & Supplies) | | | | | | | | | | | 4,300 | | | | 123,153 | |
Daiseki Company Limited (Industrials, Commercial Services & Supplies) | | | | | | | | | | | 4,700 | | | | 103,835 | |
DTS Corporation (Information Technology, IT Services) | | | | | | | | | | | 6,100 | | | | 116,912 | |
Fuji Seal International Incorporated (Materials, Containers & Packaging) | | | | | | | | | | | 4,600 | | | | 79,851 | |
Horiba Limited (Information Technology, Electronic Equipment, Instruments & Components) | | | | | | | | | | | 1,300 | | | | 68,788 | |
Kyushu Railway Company (Industrials, Road & Rail) | | | | | | | | | | | 1,800 | | | | 48,426 | |
Meitec Corporation (Industrials, Professional Services) | | | | | | | | | | | 2,800 | | | | 123,632 | |
Nihon Parkerizing Company Limited (Materials, Chemicals) | | | | | | | | | | | 12,100 | | | | 123,824 | |
ORIX JREIT Incorporated (Real Estate, Equity REITs) | | | | | | | | | | | 101 | | | | 120,745 | |
The accompanying notes are an integral part of these financial statements.
Wells Fargo Special International Small Cap Fund | 7
Portfolio of investments—April 30, 2020 (unaudited)
| | | | | | | | | | | | | | | | |
| | | | | | | | | Shares | | | Value | |
| | | | |
| Japan (continued) | | | | | | | | | | | | |
Paramount Bed Holdings Company Limited (Health Care, Health Care Equipment & Supplies) | | | | | | | | | | | 1,900 | | | $ | 78,382 | |
San-A Company Limited (Consumer Staples, Food & Staples Retailing) | | | | | | | | | | | 1,600 | | | | 64,458 | |
Sumitomo Warehouse Company Limited (Industrials, Transportation Infrastructure) | | | | | | | | | | | 8,600 | | | | 98,167 | |
Taikisha Limited (Industrials, Construction & Engineering) | | | | | | | | | | | 2,300 | | | | 66,984 | |
| | | | |
| | | | | | | | | | | | | | | 1,217,157 | |
| | | | | | | | | | | | | | | | |
| | | | |
| Luxembourg: 0.33% | | | | | | | | | | | | |
Stabilus SA (Industrials, Machinery) | | | | | | | | | | | 346 | | | | 14,988 | |
| | | | | | | | | | | | | | | | |
| | | | |
| Netherlands: 2.14% | | | | | | | | | | | | |
Brunel International NV (Industrials, Professional Services) | | | | | | | | | | | 4,152 | | | | 26,208 | |
IMCD Group NV (Industrials, Trading Companies & Distributors) | | | | | | | | | | | 568 | | | | 50,157 | |
TKH Group NV (Industrials, Electrical Equipment) | | | | | | | | | | | 597 | | | | 20,945 | |
| | | | |
| | | | | | | | | | | | | | | 97,310 | |
| | | | | | | | | | | | | | | | |
| | | | |
| Norway: 0.73% | | | | | | | | | | | | |
Atea ASA (Information Technology, IT Services) | | | | | | | | | | | 3,804 | | | | 33,301 | |
| | | | | | | | | | | | | | | | |
| | | | |
| Singapore: 0.77% | | | | | | | | | | | | |
CapitaLand Commercial Trust Limited (Real Estate, Equity REITs) | | | | | | | | | | | 30,800 | | | | 34,999 | |
| | | | | | | | | | | | | | | | |
| | | | |
| Spain: 4.68% | | | | | | | | | | | | |
Vidrala SA (Materials, Containers & Packaging) | | | | | | | | | | | 653 | | | | 58,496 | |
Viscofan SA (Consumer Staples, Food Products) | | | | | | | | | | | 2,402 | | | | 153,940 | |
| | | | |
| | | | | | | | | | | | | | | 212,436 | |
| | | | | | | | | | | | | | | | |
| | | | |
| Sweden: 2.04% | | | | | | | | | | | | |
AAK AB (Consumer Staples, Food Products) | | | | | | | | | | | 3,178 | | | | 51,909 | |
Hexpol AB (Materials, Chemicals) | | | | | | | | | | | 5,673 | | | | 40,756 | |
| | | | |
| | | | | | | | | | | | | | | 92,665 | |
| | | | | | | | | | | | | | | | |
| | | | |
| Switzerland: 4.29% | | | | | | | | | | | | |
Bossard Holding AG (Industrials, Trading Companies & Distributors) | | | | | | | | | | | 595 | | | | 74,210 | |
Bucher Industries AG (Industrials, Machinery) | | | | | | | | | | | 218 | | | | 61,484 | |
OC Oerlikon Corporation AG (Industrials, Machinery) | | | | | | | | | | | 7,869 | | | | 59,096 | |
| | | | |
| | | | | | | | | | | | | | | 194,790 | |
| | | | | | | | | | | | | | | | |
| | | | |
| United Kingdom: 17.84% | | | | | | | | | | | | |
Britvic plc (Consumer Staples, Beverages) | | | | | | | | | | | 13,517 | | | | 124,420 | |
Domino’s Pizza Group plc (Consumer Discretionary, Hotels, Restaurants & Leisure) | | | | | | | | | | | 29,814 | | | | 129,196 | |
Elementis plc (Materials, Chemicals) | | | | | | | | | | | 29,809 | | | | 26,281 | |
Lancashire Holdings Limited (Financials, Insurance) | | | | | | | | | | | 4,601 | | | | 35,465 | |
Mears Group plc (Industrials, Commercial Services & Supplies) | | | | | | | | | | | 7,369 | | | | 15,259 | |
Morgan Advanced Materials plc (Industrials, Machinery) | | | | | | | | | | | 14,060 | | | | 38,785 | |
NCC Group plc (Information Technology, IT Services) | | | | | | | | | | | 18,517 | | | | 38,253 | |
Nomad Foods Limited (Consumer Staples, Food Products) † | | | | | | | | | | | 6,504 | | | | 134,047 | |
S4 Capital plc (Communication Services, Media) † | | | | | | | | | | | 26,855 | | | | 61,221 | |
Spectris plc (Information Technology, Electronic Equipment, Instruments & Components) | | | | | | | | | | | 4,450 | | | | 150,057 | |
Tate & Lyle plc (Consumer Staples, Food Products) | | | | | | | | | | | 6,394 | | | | 57,293 | |
| | | | |
| | | | | | | | | | | | | | | 810,277 | |
| | | | | | | | | | | | | | | | |
| | | | |
Total Common Stocks (Cost $4,801,361) | | | | | | | | | | | | | | | 4,415,690 | |
| | | | | | | | | | | | | | | | |
The accompanying notes are an integral part of these financial statements.
8 | Wells Fargo Special International Small Cap Fund
Portfolio of investments—April 30, 2020 (unaudited)
| | | | | | | | | | | | | | | | |
| | | Yield | | | | | | Shares | | | Value | |
| Short-Term Investments: 3.28% | | | | | | | | | | | | | | | | |
| | | | |
| Investment Companies: 3.28% | | | | | | | | | | | | |
Wells Fargo Government Money Market Fund Select Class (l)(u) | | | 0.19 | % | | | | | | | 149,154 | | | $ | 149,154 | |
| | | | | | | | | | | | | | | | |
| | | |
Total Short-Term Investments (Cost $149,154) | | | | | | | | | | | | 149,154 | |
| | | | | | | | | | | | | |
| | | | | | | | |
| Total investments in securities (Cost $4,950,515) | | | 100.52 | % | | | 4,564,844 | |
| | |
Other assets and liabilities, net | | | (0.52 | ) | | | (23,648 | ) |
| | | | | | | | |
| Total net assets | | | 100.00 | % | | $ | 4,541,196 | |
| | | | | | | | |
| † | Non-income-earning security |
| 144A | The security may be resold in transactions exempt from registration, normally to qualified institutional buyers, pursuant to Rule 144A under the Securities Act of 1933. |
| (l) | The issuer of the security is an affiliated person of the Fund as defined in the Investment Company Act of 1940. |
| (u) | The rate represents the7-day annualized yield at period end. |
Abbreviations:
| REIT | Real estate investment trust |
Investments in Affiliates
An affiliated investment is an investment in which the Fund owns at least 5% of the outstanding voting shares of the issuer or as a result of other relationships, such as the Fund and the issuer having the same investment manager. Transactions with issuers that were either affiliated persons of the Fund at the beginning of the period or the end of the period were as follows:
| | | | | | | | | | | | | | | | | | | | | | | | | | | | | | | | | | | | |
| | | Shares,
beginning of
period | | | Shares
purchased | | | Shares
sold | | | Shares,
end of
period | | | Net
realized
gains
(losses) | | | Net
change in
unrealized
gains
(losses) | | | Income
from
affiliated
securities | | | Value,
end of
period | | | % of
net
assets | |
| | | | | | | | | |
| Short-Term Investments | | | | | | | | | | | | | | | | | | | | | | | | | | | |
Investment Companies | | | | | | | | | | | | | | | | | | | | | | | | | | | | | | | | | | | | |
Wells Fargo Government Money Market Fund Select Class | | | 263,637 | | | | 574,552 | | | | (689,035 | ) | | | 149,154 | | | $ | 0 | | | $ | 0 | | | $ | 1,222 | | | $ | 149,154 | | | | 3.28 | % |
The accompanying notes are an integral part of these financial statements.
Wells Fargo Special International Small Cap Fund | 9
Statement of assets and liabilities—April 30, 2020 (unaudited)
| | | | |
| | | | |
| |
Assets | | | | |
Investments in unaffiliated securities, at value (cost $4,801,361) | | $ | 4,415,690 | |
Investments in affiliated securities, at value (cost $149,154) | | | 149,154 | |
Foreign currency, at value (cost $68,345) | | | 69,290 | |
Receivable for investments sold | | | 5,618 | |
Receivable for Fund shares sold | | | 5,352 | |
Receivable for dividends | | | 19,941 | |
Receivable from manager | | | 5,400 | |
| | | | |
Total assets | | | 4,670,445 | |
| | | | |
| |
Liabilities | | | | |
Payable for investments purchased | | | 14,958 | |
Administration fees payable | | | 112 | |
Shareholder report expenses payable | | | 41,415 | |
Professional fees payable | | | 41,703 | |
Custody and accounting fees payable | | | 5,078 | |
Trustees’ fees and expenses payable | | | 5,361 | |
Accrued expenses and other liabilities | | | 20,622 | |
| | | | |
Total liabilities | | | 129,249 | |
| | | | |
Total net assets | | $ | 4,541,196 | |
| | | | |
| |
Net assets consist of | | | | |
Paid-in capital | | $ | 5,011,233 | |
Total distributable loss | | | (470,037 | ) |
| | | | |
Total net assets | | $ | 4,541,196 | |
| | | | |
| |
Computation of net asset value | | | | |
Net assets – Class R6 | | $ | 4,440,341 | |
Shares outstanding – Class R61 | | | 490,000 | |
Net asset value per share – Class R6 | | | $9.06 | |
Net assets – Institutional Class | | $ | 100,855 | |
Shares outstanding – Institutional Class1 | | | 11,121 | |
Net asset value per share – Institutional Class | | | $9.07 | |
| 1 | The Fund has an unlimited number of authorized shares. |
The accompanying notes are an integral part of these financial statements.
10 | Wells Fargo Special International Small Cap Fund
Statement of operations—six months ended April 30, 2020 (unaudited)
| | | | |
| | | | |
| |
Investment income | | | | |
Dividends (net of foreign withholding taxes of $6,391) | | $ | 47,642 | |
Income from affiliated securities | | | 1,222 | |
| | | | |
Total investment income | | | 48,864 | |
| | | | |
| |
Expenses | | | | |
Management fee | | | 23,735 | |
Administration fees | |
Class R6 | | | 734 | |
Institutional Class | | | 68 | |
Custody and accounting fees | | | 19,945 | |
Professional fees | | | 49,115 | |
Registration fees | | | 31,513 | |
Shareholder report expenses | | | 47,582 | |
Trustees’ fees and expenses | | | 10,470 | |
Other fees and expenses | | | 14,959 | |
| | | | |
Total expenses | | | 198,121 | |
Less: Fee waivers and/or expense reimbursements | |
Fund-level | | | (173,532 | ) |
Class R6 | | | (734 | ) |
Institutional Class | | | (68 | ) |
| | | | |
Net expenses | | | 23,787 | |
| | | | |
Net investment income | | | 25,077 | |
| | | | |
| |
Realized and unrealized gains (losses) on investments | | | | |
Net realized losses on investments | | | (67,875 | ) |
Net change in unrealized gains (losses) on investments | | | (587,045 | ) |
| | | | |
Net realized and unrealized gains (losses) on investments | | | (654,920 | ) |
| | | | |
Net decrease in net assets resulting from operations | | $ | (629,843 | ) |
| | | | |
The accompanying notes are an integral part of these financial statements.
Wells Fargo Special International Small Cap Fund | 11
Statement of changes in net assets
| | | | | | | | | | | | | | | | |
| | | Six months ended
April 30, 2020
(unaudited) | | | Year ended
October 31, 20191 | |
| | | | |
Operations | | | | | | | | | | | | | | | | |
Net investment income | | | | | | $ | 25,077 | | | | | | | $ | 26,127 | |
Net realized gains (losses) on investments | | | | | | | (67,875 | ) | | | | | | | 59,852 | |
Net change in unrealized gains (losses) on investments | | | | | | | (587,045 | ) | | | | | | | 202,492 | |
| | | | |
Net increase (decrease) in net assets resulting from operations | | | | | | | (629,843 | ) | | | | | | | 288,471 | |
| | | | |
| | | | |
Distributions to shareholders from net investment income and net realized gains | | | | | | | | | | | | | | | | |
Class R6 | | | | | | | (126,151 | ) | | | | | | | 0 | |
Institutional Class | | | | | | | (2,514 | ) | | | | | | | 0 | |
| | | | |
Total distributions to shareholders | | | | | | | (128,665 | ) | | | | | | | 0 | |
| | | | |
| | | | |
Capital share transactions | | | Shares | | | | | | | | Shares | | | | | |
Proceeds from shares sold | | | | | | | | | | | | | | | | |
Class R6 | | | 0 | | | | 0 | | | | 490,000 | | | | 4,900,000 | |
Institutional Class | | | 1,121 | | | | 11,233 | | | | 10,000 | | | | 100,000 | |
| | | | |
| | | | | | | 11,233 | | | | | | | | 5,000,000 | |
| | | | |
Reinvestment of distributions | | | | | | | | | | | | | | | | |
Institutional Class | | | 12 | | | | 128 | | | | 0 | | | | 0 | |
| | | | |
| | | | | | | 128 | | | | | | | | 0 | |
| | | | |
Payment for shares redeemed | | | | | | | | | | | | | | | | |
Institutional Class | | | (12 | ) | | | (128 | ) | | | 0 | | | | 0 | |
| | | | |
| | | | | | | (128 | ) | | | | | | | 0 | |
| | | | |
Net increase in net assets resulting from capital share transactions | | | | | | | 11,233 | | | | | | | | 5,000,000 | |
| | | | |
Total increase (decrease) in net assets | | | | | | | (747,275 | ) | | | | | | | 5,288,471 | |
| | | | |
| | | | |
Net assets | | | | | | | | | | | | | | | | |
Beginning of period | | | | | | | 5,288,471 | | | | | | | | 0 | |
| | | | |
End of period | | | | | | $ | 4,541,196 | | | | | | | $ | 5,288,471 | |
| | | | |
| 1 | For the period from May 31, 2019 (commencement of operations) to October 31, 2019 |
The accompanying notes are an integral part of these financial statements.
12 | Wells Fargo Special International Small Cap Fund
Financial highlights
(For a share outstanding throughout each period)
| | | | | | | | |
| CLASS R6 | | Six months ended
April 30, 2020
(unaudited) | | | Year ended October 31 20191 | |
Net asset value, beginning of period | | | $10.58 | | | | $10.00 | |
Net investment income | | | 0.05 | | | | 0.05 | |
Net realized and unrealized gains (losses) on investments | | | (1.31 | ) | | | 0.53 | |
| | | | | | | | |
Total from investment operations | | | (1.26 | ) | | | 0.58 | |
Distributions to shareholders from | | | | | | | | |
Net investment income | | | (0.15 | ) | | | 0.00 | |
Net realized gains | | | (0.11 | ) | | | 0.00 | |
| | | | | | | | |
Total distributions to shareholders | | | (0.26 | ) | | | 0.00 | |
Net asset value, end of period | | | $9.06 | | | | $10.58 | |
Total return2 | | | (12.35 | )% | | | 5.80 | % |
Ratios to average net assets (annualized) | | | | | | | | |
Gross expenses | | | 7.93 | % | | | 7.81 | % |
Net expenses | | | 0.95 | % | | | 0.95 | % |
Net investment income | | | 1.01 | % | | | 1.24 | % |
Supplemental data | | | | | | | | |
Portfolio turnover rate | | | 24 | % | | | 14 | % |
Net assets, end of period (000s omitted) | | | $4,440 | | | | $5,183 | |
| 1 | For the period from May 31, 2019 (commencement of class operations) to October 31, 2019 |
| 2 | Returns for periods of less than one year are not annualized. |
The accompanying notes are an integral part of these financial statements.
Wells Fargo Special International Small Cap Fund | 13
Financial highlights
(For a share outstanding throughout each period)
| | | | | | | | |
| INSTITUTIONAL CLASS | | Six months ended
April 30, 2020
(unaudited) | | | Year ended
October 31, 20191 | |
Net asset value, beginning of period | | | $10.57 | | | | $10.00 | |
Net investment income | | | 0.04 | | | | 0.05 | |
Net realized and unrealized gains (losses) on investments | | | (1.30 | ) | | | 0.52 | |
| | | | | | | | |
Total from investment operations | | | (1.26 | ) | | | 0.57 | |
Distributions to shareholders from | | | | | | | | |
Net investment income | | | (0.13 | ) | | | 0.00 | |
Net realized gains | | | (0.11 | ) | | | 0.00 | |
| | | | | | | | |
Total distributions to shareholders | | | (0.24 | ) | | | 0.00 | |
Net asset value, end of period | | | $9.07 | | | | $10.57 | |
Total return2 | | | (12.32 | )% | | | 5.70 | % |
Ratios to average net assets (annualized) | | | | | | | | |
Gross expenses | | | 8.04 | % | | | 7.91 | % |
Net expenses | | | 1.05 | % | | | 1.05 | % |
Net investment income | | | 0.92 | % | | | 1.14 | % |
Supplemental data | | | | | | | | |
Portfolio turnover rate | | | 24 | % | | | 14 | % |
Net assets, end of period (000s omitted) | | | $101 | | | | $106 | |
| 1 | For the period from May 31, 2019 (commencement of class operations) to October 31, 2019 |
| 2 | Returns for periods of less than one year are not annualized. |
The accompanying notes are an integral part of these financial statements.
14 | Wells Fargo Special International Small Cap Fund
Notes to financial statements (unaudited)
1. ORGANIZATION
Wells Fargo Fund Trust (the “Trust”), a Delaware statutory trust organized on March 10, 1999, is anopen-end management investment company registered under the Investment Company Act of 1940, as amended (the “1940 Act”). As an investment company, the Trust follows the accounting and reporting guidance in Financial Accounting Standards Board (“FASB”)Accounting Standards Codification Topic 946, Financial Services – Investment Companies. These financial statements report on the Wells Fargo Special International Small Cap Fund (the “Fund”) which is a diversified series of the Trust.
2. SIGNIFICANT ACCOUNTING POLICIES
The following significant accounting policies, which are consistently followed in the preparation of the financial statements of the Fund, are in conformity with U.S. generally accepted accounting principles which require management to make estimates and assumptions that affect the reported amounts of assets and liabilities, disclosure of contingent assets and liabilities at the date of the financial statements, and the reported amounts of revenues and expenses during the reporting period. Actual results could differ from those estimates.
Securities valuation
All investments are valued each business day as of the close of regular trading on the New York Stock Exchange (generally 4 p.m. Eastern Time), although the Fund may deviate from this calculation time under unusual or unexpected circumstances.
Equity securities that are listed on a foreign or domestic exchange or market are valued at the official closing price or, if none, the last sales price. If no sale occurs on the principal exchange or market that day, a fair value price will be determined in accordance with the Fund’s Valuation Procedures.
The values of securities denominated in foreign currencies are translated into U.S. dollars at rates provided by an independent foreign currency pricing source at a time each business day specified by the Wells Fargo Asset Management Pricing Committee at Wells Fargo Funds Management, LLC (“Funds Management”).
Many securities markets and exchanges outside the U.S. close prior to the close of the New York Stock Exchange and therefore may not fully reflect trading or events that occur after the close of the principal exchange in which the foreign securities are traded, but before the close of the New York Stock Exchange. If such trading or events are expected to materially affect the value of such securities, then fair value pricing procedures approved by the Board of Trustees of the Fund are applied. These procedures take into account multiple factors including movements in U.S. securities markets after foreign exchanges close. Foreign securities that are fair valued under these procedures are categorized as Level 2 and the application of these procedures may result in transfers between Level 1 and Level 2. Depending on market activity, such fair valuations may be frequent. Such fair value pricing may result in net asset values that are higher or lower than net asset values based on the last reported sales price or latest quoted bid price. On April 30, 2020, such fair value pricing was used in pricing certain foreign securities.
Investments in registeredopen-end investment companies are valued at net asset value.
Investments which are not valued using any of the methods discussed above are valued at their fair value, as determined in good faith by the Board of Trustees. The Board of Trustees has established a Valuation Committee comprised of the Trustees and has delegated to it the authority to take any actions regarding the valuation of portfolio securities that the Valuation Committee deems necessary or appropriate, including determining the fair value of portfolio securities, unless the determination has been delegated to the Wells Fargo Asset Management Pricing Committee.The Board of Trustees retains the authority to make or ratify any valuation decisions or approve any changes to the Valuation Procedures as it deems appropriate. On a quarterly basis, the Board of Trustees receives reports on any valuation actions taken by the Valuation Committee or the Wells Fargo Asset Management Pricing Committee which may include items for ratification.
Foreign currency translation
The accounting records of the Fund are maintained in U.S. dollars. The values of other assets and liabilities denominated in foreign currencies are translated into U.S. dollars at rates provided by an independent foreign currency pricing source at a time each business day specified by the Wells Fargo Asset Management Pricing Committee. Purchases and sales of securities, and income and expenses are converted at the rate of exchange on the respective dates of such transactions. Net realized foreign exchange gains or losses arise from sales of foreign currencies, currency gains or losses realized between the trade and settlement dates on securities transactions, and the difference between the amounts of dividends, interest and foreign withholding taxes recorded and the U.S. dollar equivalent of the amounts actually paid or received. Net unrealized foreign exchange gains and losses arise from changes in the fair value of assets and liabilities other than investments in securities resulting from changes in exchange rates. The changes in net assets arising from changes in exchange rates of securities and the changes in net assets resulting from changes in market prices of securities are not separately presented. Such changes are included in net realized and unrealized gains or losses from investments.
Wells Fargo Special International Small Cap Fund | 15
Notes to financial statements (unaudited)
Security transactions and income recognition
Securities transactions are recorded on a trade date basis. Realized gains or losses are recorded on the basis of identified cost.
Dividend income is recognized on theex-dividend date, except for certain dividends from foreign securities, which are recorded as soon as the custodian verifies theex-dividend date. Dividend income from foreign securities is recorded net of foreign taxes withheld where recovery of such taxes is not assured.
Distributions to shareholders
Distributions to shareholders from net investment income and any net realized gains are recorded on theex-dividend date and paid at least annually. Such distributions are determined in accordance with income tax regulations and may differ from U.S. generally accepted accounting principles. Dividend sources are estimated at the time of declaration. The tax character of distributions is determined as of the Fund’s fiscal year end. Therefore, a portion of the Fund’s distributions made prior to the Fund’s fiscal year end may be categorized as a tax return of capital at year end.
Federal and other taxes
The Fund intends to continue to qualify as a regulated investment company by distributing substantially all of its investment company taxable income and any net realized capital gains (after reduction for capital loss carryforwards) sufficient to relieve it from all, or substantially all, federal income taxes. Accordingly, no provision for federal income taxes was required.
The Fund’s income and federal excise tax returns and all financial records supporting those returns for the fiscal year since commencement of operations will be subject to examination by the federal and Delaware revenue authorities. Management has analyzed the Fund’s tax positions taken on federal, state, and foreign tax returns for all open tax years and does not believe that there are any uncertain tax positions that require recognition of a tax liability.
As of April 30, 2020, the aggregate cost of all investments for federal income tax purposes was $4,981,829 and the unrealized gains (losses) consisted of:
| | | | |
| |
Gross unrealized gains | | $ | 210,495 | |
| |
Gross unrealized losses | | | (627,480 | ) |
| |
Net unrealized losses | | $ | (416,985 | ) |
Class allocations
The separate classes of shares offered by the Fund differ principally in administration fees. Class specific expenses are charged directly to that share class. Investment income, common fund-level expenses, and realized and unrealized gains (losses) on investments are allocated daily to each class of shares based on the relative proportion of net assets of each class.
3. FAIR VALUATION MEASUREMENTS
Fair value measurements of investments are determined within a framework that has established a fair value hierarchy based upon the various data inputs utilized in determining the value of the Fund’s investments. The three-level hierarchy gives the highest priority to unadjusted quoted prices in active markets for identical assets or liabilities (Level 1) and the lowest priority to unobservable inputs (Level 3). The Fund’s investments are classified within the fair value hierarchy based on the lowest level of input that is significant to the fair value measurement. The inputs are summarized into three broad levels as follows:
| ∎ | | Level 1 – quoted prices in active markets for identical securities |
| ∎ | | Level 2 – other significant observable inputs (including quoted prices for similar securities, interest rates, prepayment speeds, credit risk, etc.) |
| ∎ | | Level 3 – significant unobservable inputs (including the Fund’s own assumptions in determining the fair value of investments) |
The inputs or methodologies used for valuing investments in securities are not necessarily an indication of the risk associated with investing in those securities.
16 | Wells Fargo Special International Small Cap Fund
Notes to financial statements (unaudited)
The following is a summary of the inputs used in valuing the Fund’s assets and liabilities as of April 30, 2020:
| | | | | | | | | | | | | | | | |
| | | | |
| | | Quoted prices
(Level 1) | | | Other significant
observable inputs
(Level 2) | | | Significant
unobservable inputs (Level 3) | | | Total | |
| | | | |
Assets | | | | | | | | | | | | | | | | |
Investments in: | | | | | | | | | | | | | | | | |
| | | | |
Common stocks | | | | | | | | | | | | | | | | |
| | | | |
Australia | | $ | 0 | | | $ | 287,546 | | | $ | 0 | | | $ | 287,546 | |
| | | | |
Austria | | | 0 | | | | 62,095 | | | | 0 | | | | 62,095 | |
| | | | |
Belgium | | | 0 | | | | 105,605 | | | | 0 | | | | 105,605 | |
| | | | |
Canada | | | 198,750 | | | | 0 | | | | 0 | | | | 198,750 | |
| | | | |
Denmark | | | 0 | | | | 28,259 | | | | 0 | | | | 28,259 | |
| | | | |
France | | | 0 | | | | 288,780 | | | | 0 | | | | 288,780 | |
| | | | |
Germany | | | 0 | | | | 382,238 | | | | 0 | | | | 382,238 | |
| | | | |
Hong Kong | | | 0 | | | | 111,275 | | | | 0 | | | | 111,275 | |
| | | | |
Ireland | | | 76,643 | | | | 0 | | | | 0 | | | | 76,643 | |
| | | | |
Italy | | | 0 | | | | 166,576 | | | | 0 | | | | 166,576 | |
| | | | |
Japan | | | 0 | | | | 1,217,157 | | | | 0 | | | | 1,217,157 | |
| | | | |
Luxembourg | | | 14,988 | | | | 0 | | | | 0 | | | | 14,988 | |
| | | | |
Netherlands | | | 26,208 | | | | 71,102 | | | | 0 | | | | 97,310 | |
| | | | |
Norway | | | 0 | | | | 33,301 | | | | 0 | | | | 33,301 | |
| | | | |
Singapore | | | 0 | | | | 34,999 | | | | 0 | | | | 34,999 | |
| | | | |
Spain | | | 0 | | | | 212,436 | | | | 0 | | | | 212,436 | |
| | | | |
Sweden | | | 0 | | | | 92,665 | | | | 0 | | | | 92,665 | |
| | | | |
Switzerland | | | 0 | | | | 194,790 | | | | 0 | | | | 194,790 | |
| | | | |
United Kingdom | | | 257,014 | | | | 553,263 | | | | 0 | | | | 810,277 | |
| | | | |
Short-term investments | | | | | | | | | | | | | | | | |
| | | | |
Investment companies | | | 149,154 | | | | 0 | | | | 0 | | | | 149,154 | |
| | | | |
Total assets | | $ | 722,757 | | | $ | 3,842,087 | | | $ | 0 | | | $ | 4,564,844 | |
Additional sector, industry or geographic detail is included in the Portfolio of Investments.
For the six months ended April 30, 2020, the Fund did not have any transfers into/out of Level 3.
4. TRANSACTIONS WITH AFFILIATES
Management fee
Funds Management, an indirect wholly owned subsidiary of Wells Fargo & Company (“Wells Fargo”), is the manager of the Fund and provides advisory and fund-level administrative services under an investment management agreement. Under the investment management agreement, Funds Management is responsible for, among other services, implementing the investment objectives and strategies of the Fund, supervising the subadviser and providing fund-level administrative services in connection with the Fund’s operations. As compensation for its services under the investment management agreement, Funds Management is entitled to receive a management fee at the following annual rate based on the Fund’s average daily net assets:
| | | | |
| |
| Average daily net assets | | Management fee | |
| |
First $500 million | | | 0.950 | % |
| |
Next $500 million | | | 0.925 | |
| |
Next $1 billion | | | 0.900 | |
| |
Next $2 billion | | | 0.875 | |
| |
Next $1 billion | | | 0.850 | |
| |
Next $5 billion | | | 0.840 | |
| |
Over $10 billion | | | 0.830 | |
Wells Fargo Special International Small Cap Fund | 17
Notes to financial statements (unaudited)
For the six months ended April 30, 2020, the management fee was equivalent to an annual rate of 0.95% of the Fund’s average daily net assets.
Funds Management has retained the services of a subadviser to provide daily portfolio management to the Fund. The fee for subadvisory services is borne by Funds Management. Wells Capital Management Incorporated, an affiliate of Funds Management and an indirect wholly owned subsidiary of Wells Fargo, is the subadviser to the Fund and is entitled to receive a fee from Funds Management at an annual rate starting at 0.55% and declining to 0.40% as the average daily net assets of the Fund increase.
Administration fees
Under a class-level administration agreement, Funds Management provides class-level administrative services to the Fund, which includes paying fees and expenses for services provided by the transfer agent,sub-transfer agents, omnibus account servicers and record-keepers. As compensation for its services under the class-level administration agreement, Funds Management receives an annual fee which is calculated based on the average daily net assets of each class as follows:
| | | | |
| |
| | | Class-level
administration fee | |
| |
Class R6 | | | 0.03 | % |
| |
Institutional Class | | | 0.13 | |
Waivers and/or expense reimbursements
Funds Management has contractually waived and/or reimbursed management and administration fees to the extent necessary to maintain certain net operating expense ratios for the Fund. When each class of the Fund has exceeded its expense cap, Funds Management has waived fees and/or reimbursed expenses from fund-level expenses on a proportionate basis and then from class specific expenses. When only certain classes exceed their expense caps, waivers and/or reimbursements are applied against class specific expenses before fund-level expenses. Funds Management has committed through February 28, 2021 to waive fees and/or reimburse expenses to the extent necessary to cap the Fund’s expenses at 0.95% for Class R6 shares and 1.05% for Institutional Class shares. Prior to or after the commitment expiration date, the cap may be increased or the commitment to maintain the cap may be terminated only with the approval of the Board of Trustees.
Interfund transactions
The Fund may purchase or sell portfolio investment securities to certain other Wells Fargo affiliates pursuant to Rule17a-7 under the 1940 Act and under procedures adopted by the Board of Trustees. The procedures have been designed to ensure that these interfund transactions, which do not incur broker commissions, are effected at current market prices.
5. INVESTMENT PORTFOLIO TRANSACTIONS
Purchases and sales of investments, excluding U.S. government obligations (if any) and short-term securities, for the six months ended April 30, 2020 were $1,189,237 and $1,168,356, respectively.
6. BANK BORROWINGS
The Trust (excluding the money market funds), Wells Fargo Master Trust and Wells Fargo Variable Trust are parties to a $280,000,000 revolving credit agreement whereby the Fund is permitted to use bank borrowings for temporary or emergency purposes, such as to fund shareholder redemption requests. Interest under the credit agreement is charged to the Fund based on a borrowing rate equal to the higher of the Federal Funds rate in effect on that day plus 1.25% or the overnight LIBOR rate in effect on that day plus 1.25%. In addition, an annual commitment fee equal to 0.25% of the unused balance is allocated to each participating fund.
For the six months ended April 30, 2020, there were no borrowings by the Fund under the agreement.
7. CONCENTRATION RISKS
Concentration risks result from exposure to a limited number of sectors or geographic regions. As of the end of the period, the Fund invests a concentration of its portfolio in the industrials sector and in Japan. A fund that invests a substantial portion of its assets in any sector or geographic region may be more affected by changes in that sector or geographic region than would be a fund whose investments are not heavily weighted in any sector or geographic region.
18 | Wells Fargo Special International Small Cap Fund
Notes to financial statements (unaudited)
8. INDEMNIFICATION
Under the Fund’s organizational documents, the officers and Trustees have been granted certain indemnification rights against certain liabilities that may arise out of performance of their duties to the Fund. The Fund has entered into a separate agreement with each Trustee that converts indemnification rights currently existing under the Fund’s organizational documents into contractual rights that cannot be changed in the future without the consent of the Trustee. Additionally, in the normal course of business, the Fund may enter into contracts with service providers that contain a variety of indemnification clauses. The Fund’s maximum exposure under these arrangements is dependent on future claims that may be made against the Fund and, therefore, cannot be estimated.
9. NEW ACCOUNTING PRONOUNCEMENT
In August 2018, FASB issued Accounting Standards Update (“ASU”)No. 2018-13, Fair Value Measurement (Topic 820)Disclosure Framework—Changes to the Disclosure Requirements for Fair Value Measurement. ASU2018-13 updates the disclosure requirements for fair value easurements by modifying or removing certain disclosures and adding certain new disclosures. The amendments are effective for fiscal years, and interim periods within those fiscal years, beginning after December 15, 2019. Early adoption is permitted. Management has adopted the removal and modification of disclosures early, as permitted, and will adopt the additional new disclosures at the effective date.
10. CORONAVIRUS(COVID-19) PANDEMIC
On March 11, 2020, the World Health Organization announced that it had made the assessment that coronavirus disease 2019(“COVID-19”) is a pandemic. The impacts ofCOVID-19 are adversely affecting the entire global economy, individual companies and investment products, and the market in general. There is significant uncertainty around the extent and duration of business disruptions related toCOVID-19 and the impacts may be short term or may last for an extended period of time. The risk of further spreading ofCOVID-19 has led to significant uncertainty and volatility in the financial markets. The value of the Fund and the securities in which the Fund invests have generally been adversely affected by impacts caused byCOVID-19.
Wells Fargo Special International Small Cap Fund | 19
Other information (unaudited)
PROXY VOTING INFORMATION
A description of the policies and procedures used to determine how to vote proxies relating to portfolio securities is available, upon request, by calling1-800-222-8222, visiting our website atwfam.com, or visiting the SEC website at sec.gov. Information regarding how the proxies related to portfolio securities were voted during the most recent12-month period ended June 30 is available on the website atwfam.comor by visiting the SEC website at sec.gov.
QUARTERLY PORTFOLIO HOLDINGS INFORMATION
The Fund files its complete schedule of portfolio holdings with the SEC for the first and third quarters of each fiscal year as an exhibit to its reports on FormN-PORT. Shareholders may view the filed FormN-PORT by visiting the SEC website at sec.gov.
20 | Wells Fargo Special International Small Cap Fund
Other information (unaudited)
BOARD OF TRUSTEES AND OFFICERS
Each of the Trustees and Officers1 listed in the table below acts in identical capacities for each fund in the Wells Fargo family of funds, which consists of 147 mutual funds comprising the Wells Fargo Funds Trust, Wells Fargo Variable Trust, Wells Fargo Master Trust and fourclosed-end funds (collectively the “Fund Complex”). This table should be read in conjunction with the Prospectus and the Statement of Additional Information2. The mailing address of each Trustee and Officer is 525 Market Street, 12th Floor, San Francisco, CA 94105. Each Trustee and Officer serves an indefinite term, however, each Trustee serves such term until reaching the mandatory retirement age established by the Trustees.
Independent Trustees
| | | | | | |
Name and year of birth | | Position held and
length of service* | | Principal occupations during past five years or longer | | Current other
public company or
investment
company
directorships |
| | | |
| William R. Ebsworth (Born 1957) | | Trustee,
since 2015 | | Retired. From 1984 to 2013, equities analyst, portfolio manager, research director and chief investment officer at Fidelity Management and Research Company in Boston, Tokyo, and Hong Kong, and retired in 2013 as Chief Investment Officer of Fidelity Strategic Advisers, Inc. where he led a team of investment professionals managing client assets. Prior thereto, Board member of Hong Kong Securities Clearing Co., Hong Kong Options Clearing Corp., the Thailand International Fund, Ltd., Fidelity Investments Life Insurance Company, and Empire Fidelity Investments Life Insurance Company. Audit Committee Chair and Investment Committee Chair of the Vincent Memorial Hospital Endowment(non-profit organization). Mr. Ebsworth is a CFA® charterholder. | | N/A |
| | | |
| Jane A. Freeman (Born 1953) | | Trustee, since 2015; Chair Liaison, since 2018 | | Retired. From 2012 to 2014 and 1999 to 2008, Chief Financial Officer of Scientific Learning Corporation. From 2008 to 2012, Ms. Freeman provided consulting services related to strategic business projects. Prior to 1999, Portfolio Manager at Rockefeller & Co. and Scudder, Stevens & Clark. Board member of the Harding Loevner Funds from 1996 to 2014, serving as both Lead Independent Director and chair of the Audit Committee. Board member of the Russell Exchange Traded Funds Trust from 2011 to 2012 and the chair of the Audit Committee. Ms. Freeman is also an inactive Chartered Financial Analyst. | | N/A |
| | | |
| Isaiah Harris, Jr. (Born 1952) | | Trustee, since 2009; Audit Committee Chairman, since 2019 | | Retired. Chairman of the Board of CIGNA Corporation since 2009, and Director since 2005. From 2003 to 2011, Director of Deluxe Corporation. Prior thereto, President and CEO of BellSouth Advertising and Publishing Corp. from 2005 to 2007, President and CEO of BellSouth Enterprises from 2004 to 2005 and President of BellSouth Consumer Services from 2000 to 2003. Emeritus member of the Iowa State University Foundation Board of Governors. Emeritus Member of the Advisory Board of Iowa State University School of Business. Advisory Board Member, Palm Harbor Academy (private school). Advisory Board Member, Child Evangelism Fellowship(non-profit). Mr. Harris is a certified public accountant (inactive status). | | CIGNA Corporation |
| | | |
| Judith M. Johnson (Born 1949) | | Trustee, since 2008; Audit Committee Chairman, from 2009 to 2018 | | Retired. Prior thereto, Chief Executive Officer and Chief Investment Officer of Minneapolis Employees Retirement Fund from 1996 to 2008. Ms. Johnson is an attorney, certified public accountant and a certified managerial accountant. | | N/A |
Wells Fargo Special International Small Cap Fund | 21
Other information (unaudited)
| | | | | | |
Name and year of birth | | Position held and
length of service* | | Principal occupations during past five years or longer | | Current other
public company or
investment
company
directorships |
| | | |
| David F. Larcker (Born 1950) | | Trustee, since 2009 | | James Irvin Miller Professor of Accounting at the Graduate School of Business, Stanford University, Director of the Corporate Governance Research Initiative and Senior Faculty of The Rock Center for Corporate Governance since 2006. From 2005 to 2008, Professor of Accounting at the Graduate School of Business, Stanford University. Prior thereto, Ernst & Young Professor of Accounting at The Wharton School, University of Pennsylvania from 1985 to 2005. | | N/A |
| | | |
| Olivia S. Mitchell (Born 1953) | | Trustee, since 2006; Nominating and Governance Committee Chair, since 2018 | | International Foundation of Employee Benefit Plans Professor, Wharton School of the University of Pennsylvania since 1993. Director of Wharton’s Pension Research Council and Boettner Center on Pensions & Retirement Research, and Research Associate at the National Bureau of Economic Research. Previously, Cornell University Professor from 1978 to 1993. | | N/A |
| | | |
| Timothy J. Penny (Born 1951) | | Trustee, since 1996; Chairman, since 2018 | | President and Chief Executive Officer of Southern Minnesota Initiative Foundation, anon-profit organization, since 2007. Member of the Board of Trustees of NorthStar Education Finance, Inc., anon-profit organization, since 2007. | | N/A |
| | | |
| James G. Polisson (Born 1959) | | Trustee, since 2018 | | Retired. Chief Marketing Officer, Source (ETF) UK Services, Ltd, from 2015 to 2017. From 2012 to 2015, Principal of The Polisson Group, LLC, a management consulting, corporate advisory and principal investing company. Chief Executive Officer and Managing Director at Russell Investments, Global Exchange Traded Funds from 2010 to 2012. Managing Director of Barclays Global Investors from 1998 to 2010 and Global Chief Marketing Officer for iShares and Barclays Global Investors from 2000 to 2010. Trustee of the San Francisco Mechanics’ Institute, anon-profit organization, from 2013 to 2015. Board member of the Russell Exchange Traded Fund Trust from 2011 to 2012. Director of Barclays Global Investors Holdings Deutschland GmbH from 2006 to 2009. Mr. Polisson is an attorney and has a retired status with the Massachusetts and District of Columbia Bar Associations. | | N/A |
| | | |
| Pamela Wheelock (Born 1959) | | Trustee, since January 2020; previously Trustee from January 2018 to July 2019 | | Board member of the Destination Medical Center Economic Development Agency, Rochester, Minnesota since 2019 and Interim President of the McKnight Foundation since 2020. Acting Commissioner, Minnesota Department of Human Services, July 2019 through September 2019. Human Services Manager (part-time), Minnesota Department of Human Services, October 2019 through December 2019. Chief Operating Officer, Twin Cities Habitat for Humanity from 2017 to 2019. Vice President of University Services, University of Minnesota from 2012 to 2016. Prior thereto, on the Board of Directors, Governance Committee and Finance Committee for the Minnesota Philanthropy Partners (Saint Paul Foundation) from 2012 to 2018, Interim Chief Executive Officer of Blue Cross Blue Shield of Minnesota from 2011 to 2012, Chairman of the Board from 2009 to 2012 and Board Director from 2003 to 2015. Vice President, Leadership and Community Engagement, Bush Foundation, Saint Paul, Minnesota (a private foundation) from 2009 to 2011. Executive Vice President and Chief Financial Officer, Minnesota Sports and Entertainment from 2004 to 2009 and Senior Vice President from 2002 to 2004. Executive Vice President of the Minnesota Wild Foundation from 2004 to 2008. Commissioner of Finance, State of Minnesota, from 1999 to 2002. Currently Board Chair of the Minnesota Wild Foundation since 2010. | | N/A |
| * | Length of service dates reflect the Trustee’s commencement of service with the Trust’s predecessor entities, where applicable. |
22 | Wells Fargo Special International Small Cap Fund
Other information (unaudited)
Officers
| | | | |
Name and year of birth | | Position held and
length of service | | Principal occupations during past five years or longer |
| | |
| Andrew Owen (Born 1960) | | President, since 2017 | | Executive Vice President of Wells Fargo & Company and Head of Affiliated Managers, Wells Fargo Asset Management, since 2014. In addition, Mr. Owen is currently President, Chief Executive Officer and Director of Wells Fargo Funds Management, LLC since 2017. Prior thereto, Executive Vice President responsible for marketing, investments and product development for Wells Fargo Funds Management, LLC, from 2009 to 2014. |
| | |
| Jeremy DePalma1 (Born 1974) | | Treasurer, since 2012 | | Senior Vice President of Wells Fargo Funds Management, LLC since 2009. Senior Vice President of Evergreen Investment Management Company, LLC from 2008 to 2010 and head of the Fund Reporting and Control Team within Fund Administration from 2005 to 2010. |
| | |
| Michelle Rhee (Born 1966) | | Chief Legal Officer, since 2019 | | Secretary of Wells Fargo Funds Management, LLC, Chief Legal Counsel of Wells Fargo Asset Management and Assistant General Counsel of Wells Fargo Bank, N.A. since 2018. Associate General Counsel and Managing Director of Bank of America Corporation from 2004 to 2018. |
| | |
| Catherine Kennedy (Born 1969) | | Secretary, since 2019 | | Vice President of Wells Fargo Funds Management, LLC and Senior Counsel of the Wells Fargo Legal Department since 2010. Vice President and Senior Counsel of Evergreen Investment Management Company, LLC from 1998 to 2010. |
| | |
| Michael H. Whitaker(Born 1967) | | Chief Compliance Officer, since 2016 | | Chief Compliance Officer of Wells Fargo Asset Management since 2016. Senior Vice President and Chief Compliance Officer for Fidelity Investments from 2007 to 2016. |
| | |
| David Berardi (Born 1975) | | Assistant Treasurer, since 2009 | | Vice President of Wells Fargo Funds Management, LLC since 2009. Vice President of Evergreen Investment Management Company, LLC from 2008 to 2010. Manager of Fund Reporting and Control for Evergreen Investment Management Company, LLC from 2004 to 2010. |
| 1 | Jeremy DePalma acts as Treasurer of 82 funds and Assistant Treasurer of 65 funds in the Fund Complex. |
| 2 | The Statement of Additional Information includes additional information about the Trustees and is available, without charge, upon request, by calling1-800-222-8222 or by visiting the website atwfam.com. |
Wells Fargo Special International Small Cap Fund | 23
Appendix I (unaudited)
Effective on or about May 1, 2020, if you purchase Fund shares through a Janney Montgomery Scott LLC (“Janney”) brokerage account, you will be eligible for the following load waivers(front-end sales charge waivers and contingent deferred sales charge (“CDSC”), orback-end sales charge, waivers) and discounts, which may differ from those disclosed elsewhere in the Fund’s Prospectus or SAI.
|
| Front-end sales charge* waivers on Class A shares available at Janney |
|
| Shares purchased through reinvestment of capital gains distributions and dividend reinvestment when purchasing shares of the same fund (but not any other fund within the fund family). |
|
| Shares purchased by employees and registered representatives of Janney or its affiliates and their family members as designated by Janney. |
|
| Shares purchased from the proceeds of redemptions within the same fund family, provided (1) the repurchase occurs within ninety (90) days following the redemption, (2) the redemption and purchase occur in the same account, and (3) redeemed shares were subject to afront-end or deferred sales load (i.e., right of reinstatement). |
|
| Employer-sponsored retirement plans (e.g., 401(k) plans, 457 plans, employer-sponsored 403(b) plans, profit sharing and money purchase pension plans and defined benefit plans). For purposes of this provision, employer-sponsored retirement plans do not include SEP IRAs, Simple IRAs,SAR-SEPs or Keogh plans. |
|
| Shares acquired through a right of reinstatement. |
|
| Class C shares that are no longer subject to a contingent deferred sales charge and are converted to Class A shares of the same fund pursuant to Janney’s policies and procedures. |
| CDSC waivers on Class A and Class C shares available at Janney |
|
| Shares sold upon the death or disability of the shareholder. |
|
| Shares sold as part of a systematic withdrawal plan as described in the Fund’s Prospectus. |
|
| Shares purchased in connection with a return of excess contributions from an IRA account. |
|
| Shares sold as part of a required minimum distribution for IRA and retirement accounts if the redemption is taken in or after the year the shareholder reaches qualified age based on applicable IRS regulations. |
|
| Shares sold to pay Janney fees but only if the transaction is initiated by Janney. |
|
| Shares acquired through a right of reinstatement. |
|
| Shares exchanged into the same share class of a different fund. |
| Front-end sales charge* discounts available at Janney; breakpoints, rights of accumulation and/or letters of intent |
|
| Breakpoints as described in the Fund’s Prospectus. |
|
| Rights of accumulation (“ROA”), which entitle shareholders to breakpoint discounts, will be automatically calculated based on the aggregated holding of fund family assets held by accounts within the purchaser’s household at Janney. Eligible fund family assets not held at Janney may be included in the ROA calculation only if the shareholder notifies his or her financial advisor about such assets. |
|
Letters of intent which allow for breakpoint discounts based on anticipated purchases within a fund family, over a13-month time period. Eligible fund family assets not held at Janney Montgomery Scott may be included in the calculation of letters of intent only if the shareholder notifies his or her financial advisor about such assets. |
| * | Also referred to as an “initial sales charge.” |
24 | Wells Fargo Special International Small Cap Fund
Appendix II (unaudited)
Effective on or after May 1, 2020, clients of Edward Jones (also referred to as “shareholders”) purchasing Fund shares on the Edward Jones commission andfee-based platforms are eligible only for the following sales charge discounts (also referred to as “breakpoints”) and waivers, which can differ from breakpoints and waivers described elsewhere in the Fund’s Prospectus or SAI or through another broker-dealer. In all instances, it is the shareholder’s responsibility to inform Edward Jones at the time of purchase of any relationship, holdings of Wells Fargo Funds or other facts qualifying the purchaser for breakpoints or waivers. Edward Jones can ask for documentation of such circumstance.
|
| Breakpoints available at Edward Jones |
|
| Rights of Accumulation (ROA) |
|
The applicable sales charge on a purchase of Class A shares is determined by taking into account all share classes (except any money market funds and retirement plan share classes) of Wells Fargo Funds held by the shareholder or in an account grouped by Edward Jones with other accounts for the purpose of providing certain pricing considerations (“pricing groups”). This includes all share classes held on the Edward Jones platform and/or held on another platform. The inclusion of eligible fund family assets in the rights of accumulation calculation is dependent on the shareholder notifying his or her financial advisor of such assets at the time of calculation. |
|
ROA is determined by calculating the higher of cost or market value (current shares x NAV). |
|
| Letter of Intent (LOI) |
|
Through a LOI, shareholders can receive the sales charge and breakpoint discounts for purchases shareholders intend to makeover a13-month period from the date Edward Jones receives the LOI. The LOI is determined by calculating the higher of cost or market value of qualifying holdings at LOI initiation in combination with the value that the shareholder intends to buy over a13-month period to calculate thefront-end sales charge and any breakpoint discounts. Each purchase the shareholder makes during that13-month period will receive the sales charge and breakpoint discount that applies to the total amount. The inclusion of eligible fund family assets in the LOI calculation is dependent on the shareholder notifying his or her financial advisor of such assets at the time of calculation. Purchases made before the LOI is received by Edward Jones are not covered under the LOI and will not reduce the sales charge previously paid. Sales charges will be adjusted if LOI is not met. |
| Sales charges are waived for the following shareholders and in the following situations at Edward Jones: |
● Associates of Edward Jones and its affiliates and their family members who are in the same pricing group (as determined by Edward Jones under its policies and procedures) as the associate. This waiver will continue for the remainder of the associate’s life if the associate retires from Edward Jones in good-standing. |
● Shares purchased in an Edward Jonesfee-based program. |
● Shares purchased through reinvestment of capital gains distributions and dividend reinvestment. |
● Shares purchased from the proceeds of redeemed shares of the same fund family so long as the following conditions are met: 1)the proceeds are from the sale of shares within 60 days of the purchase, and 2) the sale and purchase are made in the same share class and the same account or the purchase is made in an individual retirement account with proceeds from liquidations in anon-retirement account. |
● Shares exchanged into Class A shares from another share class so long as the exchange is into the same fund and was initiated at the discretion of Edward Jones. Edward Jones is responsible for any remaining CDSC due to the fund company, if applicable. Any future purchases are subject to the applicable sales charge as disclosed in the prospectus. |
● Exchanges from Class C shares to Class A shares of the same fund, generally, in the 84th month following the anniversary of the purchase date or earlier at the discretion of Edward Jones. |
If the shareholder purchases shares that are subject to a CDSC and those shares are redeemed before the CDSC is expired, the shareholder
is responsible to pay the CDSC except in the following conditions available at Edward Jones: |
● The death or disability of the shareholder. |
● Systematic withdrawals with up to 10% per year of the account value. |
● Return of excess contributions from an Individual Retirement Account (IRA). |
● Shares sold as part of a required minimum distribution for IRA and retirement accounts if the redemption is taken in or after the year the shareholder reaches qualified age based on applicable IRS regulation. |
● Shares sold to pay Edward Jones fees or costs in such cases where the transaction is initiated by Edward Jones. |
● Shares exchanged in an Edward Jonesfee-based program. |
● Shares acquired through NAV reinstatement. |
Wells Fargo Special International Small Cap Fund | 25
Appendix II (unaudited)
|
| Other Important Information for accounts at Edward Jones: |
| Minimum Purchase Amounts |
● $250 initial purchase minimum ● $50 subsequent purchase minimum |
|
| Minimum Balances |
| Edward Jones has the right to redeem at its discretion fund holdings with a balance of $250 or less. The following are examples of accounts that are not included in this policy: |
● Afee-based account held on an Edward Jones platform ● A 529 account held on an Edward Jones platform ● An account with an active systematic investment plan or letter of intent (LOI) |
|
| Changing Share Classes |
| At any time it deems necessary, Edward Jones has the authority to exchange at NAV a shareholder’s holdings in a fund to Class A shares. |
26 | Wells Fargo Special International Small Cap Fund
Appendix III (unaudited)
Effective June 1, 2020, shareholders purchasing Fund shares through an Oppenheimer & Co. Inc. (“Oppenheimer”) platform or account are eligible only for the following load waivers(front-end sales charge waivers and contingent deferred orback-end, sales charge waivers) and discounts, which may differ from those disclosed in the Fund’s Prospectus or SAI.
|
| Front-end Sales Load Waivers on Class A Shares available at Oppenheimer |
|
| Employer-sponsored retirement, deferred compensation and employee benefit plans (including health savings accounts) and trusts used to fund those plans, provided that the shares are not held in a commission-based brokerage account and shares are held for the benefit of the plan. |
|
| Shares purchased by or through a 529 Plan. |
|
| Shares purchased through an Oppenheimer affiliated investment advisory program. |
|
| Shares purchased through reinvestment of capital gains distributions and dividend reinvestment when purchasing shares of the same fund (but not any other fund within the fund family). |
|
| Shares purchased from the proceeds of redemptions within the same fund family, provided (1) the repurchase occurs within 90 days following the redemption, (2) the redemption and purchase occur in the same account, and (3) redeemed shares were subject to afront-end or deferred sales load (known as Rights of Restatement). |
|
| A shareholder in the Fund’s Class C shares will have their shares exchanged at net asset value to Class A shares (or the appropriate share class) of the Fund if the shares are no longer subject to a CDSC and the exchange is in line with the policies and procedures of Oppenheimer. |
|
| Employees and registered representatives of Oppenheimer or its affiliates and their family members. |
|
| Directors or Trustees of the Fund, and employees of the Fund’s investment adviser or any of its affiliates, as described in the Prospectus. |
| CDSC Waivers on A and C Shares available at Oppenheimer |
|
| Death or disability of the shareholder. |
|
| Shares sold as part of a systematic withdrawal plan as described in the Prospectus. |
|
| Return of excess contributions from an IRA Account. |
|
| Shares sold as part of a required minimum distribution for IRA and retirement accounts due to the shareholder reaching the qualified age based on applicable IRS regulations as described in the Prospectus. |
|
| Shares sold to pay Oppenheimer fees but only if the transaction is initiated by Oppenheimer. |
|
| Shares acquired through a right of reinstatement. |
| Front-end load Discounts Available at Oppenheimer: Breakpoints, Rights of Accumulation & Letters of Intent |
|
| Breakpoints as described in the Prospectus. |
|
| Rights of Accumulation (ROA), which entitle shareholders to breakpoint discounts, will be automatically calculated based on the aggregated holding of fund family assets held by accounts within the purchaser’s household at Oppenheimer. Eligible fund family assets not held at Oppenheimer may be included in the ROA calculation only if the shareholder notifies his or her financial advisor about such assets. |
Wells Fargo Special International Small Cap Fund | 27
Appendix IV (unaudited)
Effective June 15, 2020, shareholders purchasing fund shares through a Robert W. Baird & Co. (“Baird”) platform or account will only be eligible for the following sales charge waivers(front-end sales charge waivers and CDSC waivers) and discounts, which may differ from those disclosed elsewhere in the Fund’s Prospectus or the SAI.
|
| Front-end Sales Load Waivers on Class A Shares available at Baird |
|
| Shares purchased through reinvestment of capital gains distributions and dividend reinvestment when purchasing share of the same fund. |
|
| Share purchase by employees and registers representatives of Baird or its affiliate and their family members as designated by Baird. |
|
| Shares purchase from the proceeds of redemptions within the same fund family, provided (1) the repurchase occurs within 90 days following the redemption, (2) the redemption and purchase occur in the same accounts, and (3) redeemed shares were subject to afront-end or deferred sales charge (known as rights of reinstatement). |
|
| A shareholder in the Funds Investor C Shares will have their share exchanged at net asset value to Investor A shares of the fund if the shares are no longer subject to CDSC and the exchange is in line with the policies and procedures of Baird. |
|
| Employer-sponsored retirement plans or charitable accounts in a transactional brokerage account at Baird, including 401(k)plans, 457 plans, employer-sponsored 403(b) plans, profit sharing and money purchase pension plans and defined benefit plans. For purposes of this provision, employer-sponsored retirement plans do not include SEP IRAs, Simple IRAs orSAR-SEPs. |
| CDSC Waivers on A and C Shares available at Baird |
|
| Shares sold due to death or disability of the shareholder. |
|
| Shares sold as part of a systematic withdrawal plan as described in the Fund’s Prospectus. |
|
| Shares bought due to returns of excess contributions from an IRA Account. |
|
| Shares sold as part of a required minimum distribution for IRA and retirement accounts due to the shareholder reaching age 72 as described in the Fund’s Prospectus. |
|
| Shares sold to pay Baird fees but only if the transaction is initiated by Baird. |
|
| Shares acquired through a right of reinstatement. |
| Front-end load Discounts Available at Baird: Breakpoint and/or Rights of Accumulation |
|
| Breakpoints as described in the Prospectus. |
|
| Rights of accumulations which entitles shareholders to breakpoint discounts will be automatically calculated based on the aggregated holding of fund family assets held by accounts within the purchaser’s household at Baird. Eligible fund family assets not held at Baird may be included in the rights of accumulations calculation only if the shareholder notifies his or her financial advisor about such assets. |
|
| Letters of Intent (LOI) allow for breakpoint discounts based on anticipated purchases within a fund family through Baird, overa13-month period of time. |
28 | Wells Fargo Special International Small Cap Fund

For more information
More information about Wells Fargo Funds is available free upon request. To obtain literature, please write, visit the Fund’s website, or call:
Wells Fargo Funds
P.O. Box 219967
Kansas City, MO 64121-9967
Website:wfam.com
Individual investors:1-800-222-8222
Retail investment professionals:1-888-877-9275
Institutional investment professionals:1-866-765-0778

This report and the financial statements contained herein are submitted for the general information of the shareholders of the Fund. If this report is used for promotional purposes, distribution of the report must be accompanied or preceded by a current prospectus. Before investing, please consider the investment objectives, risks, charges, and expenses of the investment. For a current prospectus and, if available, a summary prospectus, containing this information, call1-800-222-8222 or visit the Fund’s website atwfam.com. Read the prospectus carefully before you invest or send money.
Wells Fargo Asset Management (WFAM) is the trade name for certain investment advisory/management firms owned by Wells Fargo & Company. These firms include but are not limited to Wells Capital Management Incorporated and Wells Fargo Funds Management, LLC. Certain products managed by WFAM entities are distributed by Wells Fargo Funds Distributor, LLC (a broker-dealer and Member FINRA).
This material is for general informational and educational purposes only and is NOT intended to provide investment advice or a recommendation of any kind—including a recommendation for any specific investment, strategy, or plan.
INVESTMENT PRODUCTS: NOT FDIC INSURED ◾ NO BANK GUARANTEE ◾ MAY LOSE VALUE
© 2019 Wells Fargo & Company. All rights reserved.
PAR-0520-00387 06-20
SA296/SAR296 04-20
ITEM 2. CODE OF ETHICS
=======================
Not applicable.
ITEM 3. AUDIT COMMITTEE FINANCIAL EXPERT
=========================================
Not applicable.
ITEM 4. PRINCIPAL ACCOUNTANT FEES AND SERVICES
===============================================
Not applicable.
ITEM 5. AUDIT COMMITTEE OF LISTED REGISTRANTS
==============================================
Not applicable.
ITEM 6. INVESTMENTS
====================
A Portfolio of Investments for each series of Wells Fargo Funds Trust is included as part of the report to shareholders filed under Item 1 of this Form.
| ITEM 7. | DISCLOSURE OF PROXY VOTING POLICIES AND PROCEDURES FORCLOSED-END MANAGEMENT INVESTMENT COMPANIES |
==============================================================================================
Not applicable.
ITEM 8. PORTFOLIO MANAGERS OFCLOSED-END MANAGEMENT INVESTMENT COMPANIES
==============================================================================
Not applicable.
| ITEM 9. | PURCHASES OF EQUITY SECURITIES BYCLOSED-END MANAGEMEENT INVESTMENT COMPANY AND AFFILIATED PURCHASERS |
================================================================================================
Not applicable.
| ITEM 10. | SUBMISSION OF MATTERS TO A VOTE OF SECURITY HOLDERS |
============================================================
There have been no material changes to the procedures by which shareholders may recommend nominees to the registrant’s Board of Trustees that have been implemented since the registrant’s last provided disclosure in response to the requirements of this Item.
| ITEM 11. | CONTROLS AND PROCEDURES |
==================================
(a) The President and Treasurer have concluded that the Wells Fargo Funds Trust disclosure controls and procedures (as defined inRule 30a-3(c) under the Investment Company Act of 1940) provide reasonable assurances that material information relating to the registrant is made known to them by the appropriate persons, based on their evaluation of these controls and procedures as of a date within 90 days of the filing of this report.
(b) There were no significant changes in the registrant’s internal controls over financial reporting (as defined in Rule30a-3(d) under the Investment Company Act of 1940) that occurred during the most recent fiscal half-year of the period covered by this report that materially affected, or is reasonably likely to materially affect, the registrant’s internal control over financial reporting.
| ITEM 12. | DISCLOSURES OF SECURITIES LENDING ACTIVITES FORCLOSED-END MANAGEMENT INVESTMENT COMPANIES |
===================================================================================================
Not applicable.
ITEM 13. EXHIBITS
=================

SIGNATURES
Pursuant to the requirements of the Securities Exchange Act of 1934 and the Investment Company Act of 1940, the registrant has duly caused this report to be signed on its behalf by the undersigned, thereunto duly authorized.
| | |
| Wells Fargo Funds Trust |
| |
| By: | | |
| |
| | /s/ Andrew Owen |
| |
| | Andrew Owen |
| | President |
| |
| Date: | | June 26, 2020 |
Pursuant to the requirements of the Securities Exchange Act of 1934 and the Investment Company Act of 1940, this report has been signed below by the following persons on behalf of the registrant and in the capacities and on the date indicated.
| | |
| Wells Fargo Funds Trust |
| |
| By: | | |
| |
| | /s/ Andrew Owen |
| |
| | Andrew Owen |
| | President |
| |
| Date: | | June 26, 2020 |
| |
| By: | | |
| |
| | /s/ Jeremy DePalma |
| |
| | Jeremy DePalma |
| | Treasurer |
| |
| Date: | | June 26, 2020 |